The molecular landscape of pediatric acute myeloid leukemia reveals recurrent 1 structural alterations and age-specific mutational interactions 2 Hamid Bolouri 1#* , Jason E Farrar 2# , Timothy Triche Jr 3#• , Rhonda E Ries 4# , Emilia L Lim 5 ; Todd A Alonzo 6,7 ; 3 Yussanne Ma 5 ; Richard Moore 5 ; Andrew J Mungall 5 ; Marco A Marra 5 ; Jinghui Zhang 8 ; Xiaotu Ma 8 ; Yu Liu 8 ; 4 Yanling Liu 8 ; Jaime M Guidry Auvil 9 ; Tanja M Davidsen 9 ; Patee Gesuwan 9 ; Leandro C Hermida 9 ; Bodour 5 Salhia 10 ; Stephen Capone 3 ; Giridharan Ramsingh 3 ; Christian Michel Zwaan 11 ; Sanne Noort 11 ; Stephen R 6 Piccolo 12,13 ; E Anders Kolb 14 ; Alan S Gamis 15 ; Malcolm A Smith 16 ; Daniela S Gerhard 9 ; and Soheil 7 Meshinchi 4* 8 1 Division of Human Biology, Fred Hutchinson Cancer Research Center, Seattle, WA; 2 Winthrop P 9 Rockefeller Cancer Institute, University of Arkansas for Medical Sciences and Arkansas Children’s 10 Research Institute, Little Rock, AR; 3 Jane Anne Nohl Division of Hematology, USC/Norris Comprehensive 11 Cancer Center, Los Angeles, CA; 4 Clinical Research Division, Fred Hutchinson Cancer Research Center, 12 Seattle, WA; 5 Canada’s Michael Smith Genome Sciences Centre, British Columbia Cancer Agency, 13 Vancouver, BC, Canada; 6 Keck School of Medicine, University of Southern California, Los Angeles, CA; 14 7 Children's Oncology Group, Monrovia, CA; 8 Division of Computational Biology, St Jude Children’s 15 Research Hospital, Memphis, TN; 9 Office of Cancer Genomics, National Cancer Institute, Bethesda, MD; 16 10 Department of Translational Genomics, Keck School of Medicine, University of Southern California, Los 17 Angeles, CA; 11 Dept of Pediatric Oncology, Erasmus MC-Sophia Children’s Hospital, Rotterdam, 18 12 Department of Biology, Brigham Young University, Provo, UT; 13 Department of Biomedical Informatics, 19 University of Utah, Salt Lake City, UT; 14 Nemours Center for Cancer and Blood Disorders, Alfred I. DuPont 20 Hospital for Children, Wilmington, DE; 15 Division of Hematology/Oncology/Bone Marrow 21 Transplantation, Children's Mercy Hospitals and Clinics, Kansas City, MO; 16 Cancer Therapy Evaluation 22 Program, National Cancer Institute, Bethesda, MD 23 # Equal contribution 24 * corresponding author 25 • Current address: Van Andel Research Institute 26 333 Bostwick Avenue NE 27 Grand Rapids, MI, 49503 28

Welcome message from author
This document is posted to help you gain knowledge. Please leave a comment to let me know what you think about it! Share it to your friends and learn new things together.
Transcript

The molecular landscape of pediatric acute myeloid leukemia reveals recurrent 1 structural alterations and age-specific mutational interactions 2
Hamid Bolouri1#*, Jason E Farrar2#, Timothy Triche Jr3#•, Rhonda E Ries4#, Emilia L Lim5; Todd A Alonzo6,7; 3 Yussanne Ma5; Richard Moore5; Andrew J Mungall5; Marco A Marra5; Jinghui Zhang8; Xiaotu Ma8; Yu Liu8; 4 Yanling Liu8; Jaime M Guidry Auvil9; Tanja M Davidsen9; Patee Gesuwan9; Leandro C Hermida9; Bodour 5 Salhia10; Stephen Capone3; Giridharan Ramsingh3; Christian Michel Zwaan11; Sanne Noort11; Stephen R 6 Piccolo12,13; E Anders Kolb14; Alan S Gamis15; Malcolm A Smith16; Daniela S Gerhard9; and Soheil 7 Meshinchi4* 8
1Division of Human Biology, Fred Hutchinson Cancer Research Center, Seattle, WA; 2Winthrop P 9 Rockefeller Cancer Institute, University of Arkansas for Medical Sciences and Arkansas Children’s 10 Research Institute, Little Rock, AR; 3Jane Anne Nohl Division of Hematology, USC/Norris Comprehensive 11 Cancer Center, Los Angeles, CA; 4Clinical Research Division, Fred Hutchinson Cancer Research Center, 12 Seattle, WA; 5Canada’s Michael Smith Genome Sciences Centre, British Columbia Cancer Agency, 13 Vancouver, BC, Canada; 6Keck School of Medicine, University of Southern California, Los Angeles, CA; 14 7Children's Oncology Group, Monrovia, CA; 8Division of Computational Biology, St Jude Children’s 15 Research Hospital, Memphis, TN; 9Office of Cancer Genomics, National Cancer Institute, Bethesda, MD; 16 10Department of Translational Genomics, Keck School of Medicine, University of Southern California, Los 17 Angeles, CA; 11Dept of Pediatric Oncology, Erasmus MC-Sophia Children’s Hospital, Rotterdam, 18 12Department of Biology, Brigham Young University, Provo, UT; 13Department of Biomedical Informatics, 19 University of Utah, Salt Lake City, UT; 14Nemours Center for Cancer and Blood Disorders, Alfred I. DuPont 20 Hospital for Children, Wilmington, DE; 15Division of Hematology/Oncology/Bone Marrow 21 Transplantation, Children's Mercy Hospitals and Clinics, Kansas City, MO; 16Cancer Therapy Evaluation 22 Program, National Cancer Institute, Bethesda, MD 23
# Equal contribution 24 * corresponding author 25
• Current address: Van Andel Research Institute 26 333 Bostwick Avenue NE 27 Grand Rapids, MI, 49503 28

Abstract 29
We present the molecular landscape of pediatric acute myeloid leukemia (AML), characterizing nearly 30 1,000 participants in Children’s Oncology Group (COG) AML trials. The COG/NCI TARGET AML initiative 31 assessed cases by whole-genome, targeted DNA, mRNA, miRNA sequencing and CpG methylation 32 profiling. Validated DNA variants revealed diverse, infrequent mutations with fewer than 40 genes 33 mutated in >2% of cases. In contrast, somatic structural variants, including novel gene fusions and 34 focal MBNL1, ZEB2, and ELF1 deletions, were disproportionately prevalent in young as compared to 35 adult patients. Conversely, DNMT3A and TP53 mutations, common in adults, are conspicuously absent 36 from virtually all pediatric cases. Novel GATA2, FLT3, and CBL mutations, recurrent MYC-ITD, NRAS, 37 KRAS, and WT1 mutations are frequent in pediatric AML. Deletions, mutations, and promoter DNA 38 hypermethylation convergently impact Wnt signaling, Polycomb repression, innate immune cell 39 interactions, and a cluster of zinc finger genes associated with KMT2A rearrangements. These results 40 highlight the need for, and facilitate the development of age-tailored targeted therapies for the 41 treatment of pediatric AML. 42
43 Acute leukemia is the most common form of childhood cancer1, and its incidence is increasing. Despite 44 constituting only 20% of pediatric acute leukemia, acute myeloid leukemia (AML) is overtaking acute 45 lymphoblastic leukemia (ALL) as the leading cause of childhood leukemic mortality, in part because 46 current prognostic schemas classify many children who will ultimately succumb to their disease as low- 47 or intermediate-risk. Additionally, aside from investigational tyrosine kinase inhibitors for FLT3-activated 48 AML, targeted therapies are not used in pediatric AML. Both problems stem from an inadequate 49 understanding of the biology of childhood AML. 50
AML is a molecularly heterogeneous group of diseases affecting patients of all ages2. Recent genome-51 scale studies have revealed novel, potentially targetable mutations prevalent in adult de novo AML3-5. 52 However, the relevance of these findings to childhood AML remains unclear, since several of the most 53 common adult mutations appear far less prevalent in pediatric AML6,7. 54
To date, no comprehensive characterization of pediatric AML has been described. Here, we report the 55 initial results of the TARGET (Therapeutically Applicable Research to Generate Effective Treatments) 56 AML initiative, a collaborative COG/NCI project to comprehensively characterize the mutational, 57 transcriptional, and epigenetic landscapes of a large, well-annotated cohort of pediatric AML. 58 Comparing AML molecular profiles across age groups, we show that stark differences in mutations,d 59 structural variants and DNA methylation distinguish AML in infants, children, adolescents, and adults. 60 Results 61
Overview of cohort characteristics 62
A total of 1023 children enrolled in COG studies are included in the TARGET AML dataset. 63 Comprehensive clinical data, including clinical outcomes and test results for common sequence 64 aberrations (outlined in Table S1), are available for 993 patients. Of these, 815 subjects were profiled for 65 somatic mutations at presentation: 197 by whole-genome sequencing (WGS), and 800 by targeted 66 capture sequencing (TCS), at read depths averaging 500x, for validation of mutations identified by WGS. 67
The WGS discovery cohort of diagnostic and remission (germline comparison) specimens were selected 68 from patients treated on recent COG studies who achieved an initial remission to induction 69 chemotherapy. These trials randomized type or timing of induction therapy (CCG-2961)8 and the 70 addition of gemtuzumab ozogamicin in a single arm pilot (AAML03P1)9 or randomized fashion 71 (AAML0531)10. Specimens for TCS validation were obtained from 800 patients, including 182 from the 72 WGS discovery cohort (153 with matched remission samples). A complete listing of cases and their 73 characterization is available in the TARGET sample matrix 74 (https://ocg.cancer.gov/programs/target/data-matrix). The age at presentation of TARGET AML 75 participants ranged from 8 days to 29 years (median 10 years, Fig. 1a). Infants (<3 years old), children 76 (age 3-14) and adolescents/young adults (AYA; age 15-39) differ broadly by cytogenetic and clinical risk-77 group classifications (Fig. 1a, multivariate Chi-squared p<10-22), consistent with observed differences in 78 clinically-evaluated structural abnormalities and mutations (summarized in Fig. 1b). Notably, among 79 these clinically detected abnormalities, only 5 mutations and 5 structural aberrations occur in more than 80 5% of patients (mutations in FLT3, NPM1, WT1, CEBPA, and KIT; fusions involving RUNX1, CBFB and 81 KMT2A; trisomy 8 and loss of the Y chromosome.) 82
We validated each class of somatic DNA sequence alteration discovered by WGS through secondary 83 assays (Figs. 1c and S1). Single nucleotide variants (SNVs) and short insertions and deletions (indels) 84 were confirmed by TCS of the coding sequences of the genes identified as recurrently altered in the 85 WGS studies. WGS-detected copy number alterations were confirmed by GISTIC2.0 scores from SNP 86 arrays; WGS-detected structural changes (such as translocations and inversions) were confirmed by 87 RNA-seq and clinical leukemia karyotyping data. Across variant types, we find >70% concordance 88 between at least two assays. These variants are referred to as verified variants hereon. An overview of 89 the multiplatform-verified somatic DNA variants in 684 patients is presented in Fig. 2a. Roughly a 90 quarter of patients possess normal karyotype, yet nearly all revealed at least one recurrent verified 91 somatic DNA alteration, and at least 12 common cancer-associated cellular processes are recurrently 92 impacted (Fig. S2, Tables S2a, b). 93
We carried out analyses of microRNA, mRNA, and/or DNA methylation in 412 subjects. A summary of 94 the assays performed and case-assay overlap is presented in Fig. S3. We compared our verified variants 95 to those of 177 adult AML cases from The Cancer Genome Atlas (TCGA) project3, stratified by the age 96 groupings outlined in Fig. 1a. The TARGET and TCGA discovery cohorts both contained numerous AYA 97 patients (Table S3). Importantly, our conclusions regarding the molecular characteristics of this age 98 group are identical when analyzing either or both cohorts (Fig. S4). 99
Somatic gene mutations in pediatric AML 100
Like adult AML, pediatric AML has one of the lowest rates of mutation among molecularly well-101 characterized cancers (Fig. S5), with < 1 somatic, protein-coding change per megabase in most cases. 102 However, the landscape of somatic variants in pediatric AML is markedly different from that reported in 103 adults3,4 (Figs. 2b, S6-S7, Table S4). RAS, KIT, and FLT3 alterations, including novel, pediatric-specific 104 FLT3 mutations (FLT3.N), are more common in children. Mutational burden increases with age, yet older 105 patients have relatively fewer recurrent cytogenetic alterations. Indeed, the number of coding SNVs, 106 within and across cohorts, is best predicted by age (Fig. 2c, p<10-15) and by cytogenetic subgroup. In 107 contradistinction to the higher prevalence of small sequence variants in older patients, recurrent 108 structural alterations, fusions, and focal copy number aberrations are more common in younger patients 109 (Figs. 2d-e, p<10-3, see below). Patients with CBFA2T3-GLIS2, KMT2A, or NUP98 fusions tend to have 110

fewer mutations (p<10-9), with subgroups demonstrating inferior clinical outcome (Fig. S8). Patients with 111 core binding factor rearrangements tend to have more mutations than expected for their age (p<10-15), 112 yet more favorable outcomes. The mutational spectrum of coding SNVs (Fig. S5) accumulates C→T 113 transitions with age (p<10-3), with additional C→A transversions in t(8;21) (p<10-2) and aberrant 114 karyotype (p<10-2) patients. 115
After adjustment for cytogenetics and multiple comparisons, NRAS (p<10-3) and WT1 (p<10-3) are 116 mutated significantly more often in younger patients, while DNMT3A (p<10-23), IDH1/2 (p<10-4), RUNX1 117 (p<10-4), TP53 (p<10-4), and NPM1 (p<0.03) are mutated significantly more frequently in older patients. 118 KRAS, CBL, GATA2, SETD2, and PTPN11 mutations appear to be more common in younger patients 119 (0.05<p<0.1, adjusted, Figs. S7 and S9). We identified a prominent hotspot of MYC alterations11 and 120 previously unreported internal tandem duplications appearing exclusively in children (Fig. S7). These 121 observations are replicated in an independent ECOG cohort (Fig. S10a) of 384 adult AML patients5. Since 122 gene fusions have characteristic cooperating mutations12, we devised a weighted resampling scheme to 123 compare mutation frequencies in 584 TARGET and 131 TCGA AML cases while controlling for karyotypic 124 associations. The results (Fig. S10b) confirm the generality of the pediatric-adult differences identified 125 above. 126
For genes such as CBL, GATA2, WT1, MYC and FLT3, both the frequency and the sites of mutation often 127 differ between children and adults (Figs. 3a and S7), with multiple –frequently recurrent- alterations 128 distinct from those identified in adult AML. RAS-related mutations (mutant KRAS, NRAS, PTPN11, or NF1) 129 are common, particularly with KMT2A fusions (Fig. S11, Tables S4-S6). In addition to being more 130 common and varied, WT1 mutations appear more likely to be of clonal origin in younger patients (Fig. 131 3b) despite the majority of pediatric patients presenting with multiple detectable sub-clones (Fig. S12). 132
These differences are clinically significant: we have previously shown that novel FLT3 mutations are 133 functional, and yield poor responses to standard therapy13. The established adverse impact of FLT3-ITDs 134 on survival is significantly modulated by co-occurring variants, including WT1 and NPM1 mutations and 135 NUP98 translocations. As shown in Figs. 3c and S13-S14, three independent, large-scale studies 136 demonstrate that FLT3-ITD accompanied by NPM1 mutations is associated with relatively favorable 137 outcomes in pediatric patients, while FLT3-ITD with WT1 mutations and/or NUP98-NSD1 fusions yields 138 poorer outcomes than FLT3-ITD alone. 139
We found no coding mutations in DNMT3A in pediatric AML, despite its high frequency in adults. 140 Spontaneous deamination of 5-methylcytosine is strongly associated with aging, and DNMT3A contains 141 a CpG dinucleotide yielding hotspot R882 mutations by C-to-T deamination14. DNMT3A also directly 142 interacts with TP5315, itself impacted far more frequently in adults. Mutations of DNMT3A or TP53 drive 143 clonal hematopoiesis in many apparently healthy adults16 but are rare in children, as are the IDH1 and 144 IDH2 mutations with which they often co-occur. 145
The spectrum of somatic structural DNA changes in pediatric AML 146
Many pediatric AML cases harbor chromosomal copy number changes distinct from those reported in 147 adults (Fig. 4a). Among the 197 cases assayed by WGS, we identified 14 novel focal deletions involving 148 MBNL1, a splicing regulator, or ZEB2, a key regulator of normal17 and leukemic18 hematopoiesis (Fig. 149 S15). Despite occurring on separate chromosomes, in regions devoid of other deletions, MBNL1:ZEB2 150 co-deletions occur far more often than expected (p<10-13). Half of these accompany KMT2A-MLLT3 151

fusions (p=0.035, Fig. S11, Tables S5-S6). Samples with MBNL1:ZEB2 co-deletions carry a larger number 152 of recurrent mutations (p=0.015), and KMT2A-fusion samples with del(MBNL1) or del(ZEB2) have a 153 larger number of additional cytogenetic abnormalities (p<0.0005). Another 15 novel, validated focal 154 deletions specifically impact ELF1, an ETS-family transcriptional regulator of MEIS119. A statistically 155 significant difference in ELF1 mRNA expression exists between ELF1-deleted and intact samples 156 (p<0.01), with 63 genes differentially expressed between the two groups (p<0.01, Fig. S16). Among 157 other novel recurrent copy losses, we note five heterozygous deletions of a region containing the IL9R 158 gene (Table S5) co-occurring with KIT mutations and t(8;21). 159
Consistent with our previous findings regarding NUP98-NSD1 fusions20, an expansive catalog of gene 160 fusions, many observed primarily or exclusively in pediatric cases, underscores the disproportionate 161 impact of structural variants in younger patients (Figs. 4b and S17-S18). But patterns of exclusion and 162 cooperation are not limited to patients with recurrent structural alteration: mutant GATA2 is frequently 163 seen in children with normal karyotype (NK) AML, and both GATA2 (p<10-9) and CSF3R (p<10-6, Fig. S19) 164 mutations co-occur with mutations of CEBPA21. GATA2 and CEBPA are key regulators of 165 hematopoiesis22,23, both interacting with RUNX1 in normal hematopoiesis and leukemogenesis24. As with 166 FLT3/NUP98-NSD1/WT1 interactions, these findings show prognostic interactions in pediatric AML 167 outcome (Fig. S19b). RUNX1 mutations and RUNX1-RUNX1T1 gene fusions are significantly exclusive of 168 GATA2 and CEBPA mutations (p=0.006, Fig. S20, Table S7). All four are significantly exclusive of KMT2A 169 rearrangements (p<10-15), CBFB-MYH11 gene fusions (p<10-11), and ETV6 aberrations (p=0.01). 170
DNA methylation subtypes in pediatric AML 171
As summarized in Fig. 4c, aberrations affecting epigenetic regulators are widespread and rarely overlap 172 in AML, but their origin (structural vs. mutational) and frequency differs between children and adults. 173 Combining DNA methylation and mRNA expression results in 456 TARGET and TCGA AML cases, we 174 identified dozens of genes with recurrent transcriptional silencing via promoter hypermethylation across 175 TARGET and TCGA AML patients (Figs. 5a and 5c, Tables S8-S9, details in Figs. S21-S22). A number of 176 samples exhibited widespread silencing of genes by aberrant promoter hypermethylation, and this 177 group is enriched for younger patients with WT1 mutations (p=0.0012, Fig. 5a, hyper-silenced group). 178 Aberrant Wnt/β-catenin signaling is required for the development of leukemic stem cells25, and one or 179 more of the Wnt pathway regulators DKK1, SMAD1, SMAD5, SFRP4, SFRP5, AXIN2, WIF1, FZD3, HES1, or 180 TLE1 is deleted or aberrantly methylated in most AML cases26. Repression of activating NK cell ligands 181 (particularly ULBP1/2/3) appears to be common in pediatric patients, which may represent a therapeutic 182 target27. In KMT2A-rearranged patients, a cluster of poorly characterized zinc finger genes on 183 chromosome 19 is recurrently silenced. 184
We applied non-negative matrix factorization (NMF) to CpG methylation data from 284 TARGET and 185 TCGA AML patients with DNA methylation data. By cross-validation, we identified 31 signatures (Table 186 S10) that best captured DNA methylation differences across samples, after controlling via in silico 187 purification for differences in cellularity. Unsupervised clustering of the resulting DNA methylation 188 signatures largely separated patients by age and karyotypic subtypes (Figs. 5b and S23), but also 189 revealed a signature which did not associate strongly with age or established prognostic factors 190 (Signature 13, Fig. 5b). Two signatures (signatures 2 and 13) predicted significantly (p < 0.05) poorer 191 event-free survival in both pediatric and adult patients with above-median scores, after stratifying by 192 cohort and adjusting for TP53 mutation status and white blood cell count (Fig. S24). Larger sample sizes 193 are needed to evaluate the clinical significance of these findings. 194
The pediatric AML transcriptome is shaped by diverse miRNAs 195
We performed miRNA sequencing of 152 cases to characterize miRNA expression patterns in pediatric 196 AML. Unsupervised clustering of the data revealed 4 discrete subgroups that were correlated with 197 specific genomic alterations (Figs. 6a and S25), including high miR-10a expression in samples with NPM1 198 mutations, consistent with previous reports28. Further, Cox proportional hazards analyses identified 199 multiple miRNAs associated with clinical outcome (Figs. S26-S28, Table S11), including miR-155, which 200 we previously reported to predict poor survival29. 201
Differential expression analyses using Wilcoxon tests revealed miRNAs that are differentially expressed 202 between pediatric and adult AML (Fig. 6b). Of note, miR-330 was the most over-expressed in pediatric 203 samples, and has previously been shown to have oncogenic potential in AML30. 204
Several age-associated miRNAs harbor binding sites within, and have expression levels anti-correlated 205 with, putative target genes that may be involved in RNA and protein processing suggesting that miRNAs 206 could contribute to leukemogenesis through the dysregulation of transcripts and proteins31. Of note, 207 let-7b, which is a potential regulator of protein synthesis via EIF2S3 (Fig. 6c), is typically less abundantly 208 expressed in pediatric AML (Fig. 6d). However, high let-7b expression in pediatric AML is associated with 209 shorter time to relapse (log-rank p<0.05, Fig. 6e). 210
211 Discussion 212
Using a large cohort of patients, this study establishes the prevalence of, and coincident relationships 213 among, recurrent somatic genetic and epigenetic abnormalities in pediatric AML. We observe several 214 features in common between pediatric and adult AML: a low overall mutation rate in comparison to 215 other cancers, a long tail of infrequently affected genes, and overlap among recurrently impacted genes. 216 However, pediatric AML exhibits distinctive and critically important characteristics. We and others have 217 previously reported on the presence and clinical impact of novel fusion genes in pediatric AML20,32. As 218 this study illustrates, the impact of fusion transcripts in AML is both broad and age-dependent. 219 Recognition and comprehensive testing for these alterations are key first steps in the development of 220 new and potentially novel modes of targeted therapy33. 221
Recurrent focal deletions represent a unique aspect of pediatric AML. Regional (e.g. chromosomal arm- 222 and band-level) copy loss differs substantially by age, but surprisingly, focal areas of copy loss are also 223 more common in children, specifically impacting ZEB2, MBNL1, and ELF1. MBNL1 is upregulated by the 224 KMT2A-AF9 fusion protein34, and genes involved in post-transcriptional processing (SETD2, U2AF1, 225 DICER1) harbor the sole recurrent mutation in several KMT2A-rearranged cases, suggesting a functional 226 role for altered splicing in pediatric leukemogenesis. Alterations in ZEB2 have been identified as 227 cooperating events in murine CALM-AF10 leukemia models35 while ZEB2 knockout mice develop 228 myelofibrosis36, suggesting a fundamental role for this gene in the pathogenesis of AML. 229
Many of the genes characteristically mutated in AML are altered at widely variable frequencies across 230 age groups; several (including FLT3 and WT1) are impacted by pediatric specific variants and hotspots. 231 Clinical tests for a handful of genomic alterations are widely used to risk-stratify patients and determine 232 treatment regimens. However, the current practice of considering the effect of each somatic alteration 233

in isolation is inadequate. As we illustrate for FLT3-ITD, interactions among sequence variants can have 234 dramatic clinical consequences. Moreover, some interactions appear to be age-specific. In pediatric 235 AML, FLT3-ITD and NPM1 mutations co-occur in the absence of DNMT3A mutations in a group of 236 patients with superior outcomes (Figs. 3c, S13 and S14), in contrast to inferior outcomes reported in 237 adults where FLT3-ITD and NPM1 mutations frequently co-occur with mutations in DNMT3A4. In the 238 TCGA adult AML cohort, over half the subjects with somatic FLT3 and NPM1 mutations also possessed 239 somatic DNMT3A mutations3. Subsequent studies established the generality of this result4, and revealed 240 that DNMT3A mutations are early clonal events37, which often co-operate with later NPM1 and FLT3 241 mutations to promote chemoresistance, mutagenesis,38 and inferior outcomes39. Similarly, the co-242 occurrence of FLT3-ITD with WT1 mutations or NUP98-NSD1 fusions accompanies frequent induction 243 failure and dismal outcomes in children with AML (multivariate p<10-4, Figs. 3c, S13 and S14). 244
In TARGET, TCGA, and ECOG AML cases, WT1 mutations were mutually exclusive with those of ASXL1 245 and EZH2 (p < 10-3). WT1 recruits EZH2 to specific targets40, and WT1 mutations have been linked to 246 promoter DNA hypermethylation of EZH2 target genes41. Mutant ASXL1 abolishes EZH2-mediated 247 silencing of HOX genes42. EZH2 resides on a recurrently deleted region of chromosome 7, and decreased 248 EZH2 activity is associated with treatment resistant AML43. In pediatric AML, mutant WT1 and EZH2 249 appear to be of exclusively clonal or near-clonal origin, with nearly a quarter of TARGET cases harboring 250 mutations affecting one or the other. Aberrant WT1, EZH2, or ASXL1 predicted induction failure in 251 TARGET AML cases (multivariate p<0.05, adjusted for interactions with FLT3 alterations, NUP98-NSD1, 252 and KMT2A fusions) and were largely mutually exclusive with KMT2A rearrangements (p < 10-5). Many of 253 these patients present without apparent chromosomal abnormalities at diagnosis, yet less than 20% 254 achieve long-term remission with standard treatment, highlighting the importance of molecular 255 stratification to achieve better outcomes. It is possible that early events such as WT1 mutations and 256 NUP98-NSD1 fusions in children may play a similar role to that observed for DNMT3A mutations14 in 257 adults, with significant implications for risk stratification in AML across age groups. 258
Our data also demonstrate that DNA-methylation and miRNA expression profiles both accompany and 259 complement DNA alterations, and can stratify pediatric AML patients in terms of both overall and 260 progression-free survival. These findings suggest a need to update pediatric AML clinical risk categories 261 beyond current classifications, with important implications for clinical practice. 262
Despite incremental improvements with increasingly intensified regimens, modern outcomes in 263 pediatric AML have plateaued, with only ~60% of patients achieving long term survival. As many as 10% 264 of children will die from direct complications of treatment. Survivors suffer unacceptably high rates of 265 long-term morbidities resulting from anthracycline exposure or sequelae of hematopoietic stem cell 266 transplantation. As illustrated herein, pediatric AML is a collection of molecularly diverse diseases with 267 similar phenotypes. No single treatment strategy is likely to be effective for all pediatric AML subtypes, 268 which may explain repeated failures of randomized clinical trials to improve outcomes in recent years. In 269 keeping with the shift towards comprehensive, molecularly based classification schemas in AML4, the 270 time has come to develop targeted therapies that address specific vulnerabilities of pediatric subtypes. 271 The TARGET AML dataset will serve as a foundation for development of pediatric-specific classification 272 schemas and the development of personalized treatment strategies. 273

Acknowledgements 274
Dedicated to the memory of our colleague, mentor and friend, Dr. Robert Arceci, whose vision and 275 perseverance set this effort in motion: “I may not have gone where I intended to go, but I think I have 276 ended up where I needed to be.” (Douglas Adams, The Long Dark Tea-Time of the Soul) 277
The results published here are based upon data generated by the Therapeutically Applicable Research to 278 Generate Effective Treatments (TARGET) initiative and The Cancer Genome Atlas. Data used for this 279 analysis are available under dbGaP accession numbers phs000465 and phs000178. The TARGET initiative 280 is supported by NCI Grant U10CA98543. Work performed under contracts from the National Cancer 281 Institute, US National Institutes of Health within HHSN261200800001E includes specimen processing 282 (the Children’s Oncology Group Biopathology Center), whole genomic sequencing (Complete Genomics) 283 and RNA and targeted capture sequencing (British Columbia Cancer Agency). The content of this 284 publication does not necessarily reflect the views or policies of the Department of Health and Human 285 Services, nor does mention of trade names, commercial products, or organizations imply endorsement 286 by the U.S. Government. Computation for the work described in this paper was supported in part by 287 Fred Hutchinson Scientific Computing, the University of Southern California's Center for High-288 Performance Computing, and NSF award ACI-1341935. This work was additionally supported by COG 289 Chairs U10CA180886 and U10CA98543; COG Statistics and Data Center U10CA098413 and 290 U10CA180899; COG Specimen Banking U24CA114766; R01CA114563 (SM); St. Baldrick’s Foundation 291 (JEF, TT, SM); Alex’s Lemonade Stand (SM), Target Pediatric AML (TpAML), P20GM121293 (JEF); 292 Arkansas Biosciences Institute (JEF), and the Jane Anne Nohl Hematology Research Fund (TT). 293 Author Contributions 294 HB, JEF, TT and RER contributed equally to this work. MAS, DSG, SM and RA (see Acknowledgements) 295 conceived and led the project. RER, MAM, JMGA, TMD, PG, LCH, DSG and SM managed the project. HB, 296 JEF, TT, RER, ELL, TAA, YM, RM, AJM, MAM, JZ, XM, YuL, YaL, TMD, ACH, BS, and SRP generated, 297 processed, and analyzed the data. SC, GR, CMZ, SN, EAK and ASG shared critical data and reagents. HB, 298 JEF, TT, RER, ELL and SM drafted the manuscript. All authors edited and approved the manuscript. 299 Competing Financial Interests 300 The authors declare that they have no competing financial interests. 301
Figure Legends 302
Figure 1. An overview of the TARGET AML study. (a) The distribution of subjects by clinical risk category 303 and cytogenetic classification is shown adjacent to each age group analyzed (Infant, <3 years; Child, 3 to 304 <15 years; Adolescent/Young Adult (AYA), 15 to <40 years). (b) A summary of the clinically established 305 molecular aberrations in the cohort (n=993) is illustrated. FLT3.ITD, FLT3 internal tandem duplications, 306 FLT3.PM, FLT3 D835 point mutations. (c) Overview of the genomic variant discovery, verification, and 307 validation process. We characterized diagnostic and remission (taken as germline) samples from 197 308 patients using whole genome sequencing (WGS) and verified 153 diagnostic/remission case pairs by 309 targeted capture sequencing (TCS) of genes recurrently impacted in the WGS samples (an additional 29 310 WGS cases were verified by TCS of diagnostic cases only, see Fig. S1). 72% of WGS SNVs, and 76% of 311 WGS indels were confirmed by TCS (red & green text in figures). For focal copy number (CN) alterations 312 spanning fewer than 7 genes, 75% of recurrent WGS deletion/loss and 85% gain/amplification calls 313 matched recurrent alterations discovered by SNP6 arrays in 96 matching samples. For chromosomal 314 junctions, we integrated WGS, clinical karyotyping and RNA-seq data by majority vote, confirming 89% 315 of WGS junction calls. 316
Figure 2. Age-related differences in mutational and structural alterations in AML. (a) Distribution of 317 variants per sample. At least one variant impacting a gene recurrently altered in pediatric AML was 318 identified by multi-platform validated variants in 684 patients. Junction, protein fusions (see methods); 319 chromCNV, chromosomal arm/band level copy variant; focalCNV, gene level copy variant; indel, small 320 insertion/deletion; SNV, single nucleotide variant. (b) Age-dependent differences in the prevalence of 321 mutations. FLT3 mutations are plotted in 3 categories: internal tandem duplication (ITD; FLT3.ITD), 322 activation loop domain (FLT3.C), and novel, childhood-specific changes (FLT3.N). (b, inset) A pattern of 323 waxing or waning mutation rates across age groups is evident in selected genes (KRAS and NPM1 324 illustrated). (c) Childhood AML, like adult AML, has a low somatic mutational burden (top and Fig. S5), 325 but is more frequently impacted by common cytogenetic alterations (lower section). For color key, see 326 legend at bottom-right. (d) The ratio of the burden of structural variation to SNVs/indels is high in 327 infancy and early childhood and declines with age. For color key, see legend at bottom-right. (e) Using a 328 sliding-window approach to account for uneven sampling by age, the incidence of common 329 translocations in AML is shown to follow age-specific patterns (multi-variate Chi-squared p < 10-30), and 330 to be greatest in infants compared to all other ages (Chi-squared p < 10-22). KMT2A fusions are most 331 common in infants (Chi-squared p < 10-20), while core binding factor fusions tend to affect older children 332 (Chi-squared p < 10-7). 333
Figure 3. Biological and prognostic interactions between alterations of WT1, NPM1, FLT3-ITD and 334 NUP98-NSD1. (a) WT1 mutations appear more frequently and impact novel sites in childhood AML 335 (TARGET, expanded above the representation of WT1: 18.4%, 150 alterations among 815 patients; 336 TCGA, expanded beneath WT1: 7.3%, 13 alterations among 177 patients; Fisher’s exact p = 0.0002). 337 Circles indicate sites of mutation with size proportional to the number of recurrently detected 338 alterations (Colors indicate type of mutation: red, frameshifting; blue, missense; yellow, nonsense; 339 purple, splice site; grey, in-frame deletions; and brown; in-frame insertions. (b) Inference of the clonal 340 origin of selected mutations in 197 TARGET AML (Infant, Child and AYA) cases with WGS and 177 TCGA 341 AML (Adult) cases. See Clonality Estimation section in the Online Methods for more details on how the 342 analysis was performed.. (c) The clinical impact of FLT3-ITD is modulated by other sequence aberrations. 343

963 TARGET patients had complete data for FLT3-ITD, NPM1 and WT1 mutation and NUP98-NSD1 344 fusions. Patients with FLT3-ITD plus WT1 and/or NUP98-NSD1 fusion (n=73) exhibit markedly inferior 345 event-free (multivariate p<0.001) and overall survival (see Fig. S13), while co-occurrence of NPM1 346 mutations with FLT3-ITD associates with improved survival. These findings are confirmed by two 347 separate studies from which TARGET cases were selected (AAML0531 and CCG-2961) as well as an 348 independent cohort of patients treated on European cooperative group trials (DCOG, see online 349 methods). 350
Figure 4. Chromosomal alterations in pediatric and adult AML patients. (a) Patterns of regional and 351 chromosomal gain (outward projection) and loss (inward projection) in the TARGET (blue) and TCGA 352 (red) AML cohorts. Losses of 5q, 7, and 17 predominate in adults, while gains of 4, 6, 19, and losses of 9, 353 X, and Y are more common in younger patients. Chromosome numbers are printed on the outside and 354 inside of the circle plot, and colored where there are large pediatric-adult differences. (b) Age-specific 355 distributions of validated gene fusions. The fraction of events within an age group for each fusion pair is 356 indicated by white-red shading, while the color of the fusion labels indicates the primary cytogenetic 357 group (colors same as in Fig. 1a, see also Figs. S17-S18). The number in each box indicates the number 358 of patients carrying the indicated translocation (labels at left). (c) Structural and mutational aberrations 359 affecting epigenetic regulators in TARGET (WGS) and TCGA AML cohorts. 360
Figure 5. Aberrant DNA methylation in adult and pediatric AML. (a) Integrative analysis of genes with 361 recurrent mutations, deletions, or transcriptional silencing by promoter DNA hypermethylation (rows) in 362 TARGET and TCGA AML cases (columns). Cluster associations are labeled at the top, including a 363 prominent group enriched for younger patients with WT1 mutations (p=0.0012) that shows extensive 364 transcriptional silencing across dozens of genes (blue boxed region, Hypersilenced). The cytogenetic 365 group, IDH1/2 mutation status (gray, mutated; white, wild-type or unknown) and TARGET/TCGA cohort 366 membership for each sample is indicated below the main figure. The top marginal histogram indicates 367 the total number of genes impacted for each patient. Gene/cytogenetic associations are shown to the 368 right of the main figure, where per gene-rate of involvement by cytogenetic class is indicated by color 369 and shading (unfilled = no involvement; full shading = maximum observed involvement of any gene 370 within patients of the indicated cytogenetic grouping). Wnt regulators and activating NK cell ligands (e.g. 371 DKK1, WIF1 and ULBP1, ULBP2, ULBP3, respectively) are silenced across cytogenetic subtypes (labeled at 372 far right). Distinct groups of silenced genes are also associated with IDH1 or IDH2 mutant patients and in 373 KMT2A-rearranged patients. A subset of genes (56 of 119) altered in >3 patients and of patients (n=310; 374 168 TARGET, 142 TCGA subjects) with one or more genes silenced by promoter methylation is illustrated 375 (see Figs. S21-S22 and Tables S8-S9 for enumeration of all 119 genes in all 456 evaluable subjects.). (b) A 376 subset (16 of 31) of DNA methylation signatures derived by non-negative matrix factorization (NMF) and 377 in silico purification, with samples ordered by hierarchical clustering of signatures (labeled at right). 378 Genomic associations are indicated to the left of the main panel. Signature 13 does not correspond 379 directly to known recurrent alterations, however, along with signature 2 displays potential prognostic 380 significance (see Fig. S24). The patient-specific score matrix and display of all 31 signatures are provided 381 in Table S10 and Fig. S23. (c) Examples of expression/promoter DNA methylation relationships for IL2RA 382 and SFRP5, 2 genes identified as recurrently silenced (panel a) which also contribute to NMF signatures 383 (panel b) are shown. Y-axis: transformed expression (asinh(TPM)), x-axis: promoter CpG methylation. 384 The vertical red line indicates the empirically established silencing threshold. 385

Figure 6. miRNAs differentially regulate distinct molecular and age sub-groups in AML (a) 386 Unsupervised clustering of miRNA expression patterns in 152 childhood AML cases identifies four 387 patient subgroups (colored bands at top) with correlation to somatic alterations as indicated (blue bars 388 on gray background), and subgroup-specific miRNA expression (miR-10 and miR-21 are highlighted as 389 examples). (b) Age-related differences in miRNA expression are evident between adult (n=162) and 390 pediatric AML (n=152). Volcano plot indicates differentially expressed miRNAs between adult and 391 pediatric cases. Red-green point shading indicates relative under- or over-expression in TARGET, 392 respectively. (Wilcoxon test, Benjamini-Hochberg adjusted P<0.05; Threshold indicated by dashed red 393 line). (c) A predicted miRNA:mRNA target relationship involving let-7b, which is (d) less abundant in 394 most pediatric cases than in adult cases. (e) High expression of let-7b occurs in a minority of pediatric 395 AML and is associated with shorter time to relapse. 396
References 397
1. Steliarova-Foucher, E., et al. International incidence of childhood cancer, 2001-10: a population-398 based registry study. Lancet Oncol 18, 719-731 (2017). 399
2. Li, S., et al. Distinct evolution and dynamics of epigenetic and genetic heterogeneity in acute 400 myeloid leukemia. Nat Med 22, 792-799 (2016). 401
3. Cancer Genome Atlas Research, N. Genomic and epigenomic landscapes of adult de novo acute 402 myeloid leukemia. N Engl J Med 368, 2059-2074 (2013). 403
4. Papaemmanuil, E., et al. Genomic Classification and Prognosis in Acute Myeloid Leukemia. N 404 Engl J Med 374, 2209-2221 (2016). 405
5. Patel, J.P., et al. Prognostic relevance of integrated genetic profiling in acute myeloid leukemia. 406 N Engl J Med 366, 1079-1089 (2012). 407
6. Ho, P.A., et al. Leukemic mutations in the methylation-associated genes DNMT3A and IDH2 are 408 rare events in pediatric AML: a report from the Children's Oncology Group. Pediatr Blood Cancer 409 57, 204-209 (2011). 410
7. Farrar, J.E., et al. Genomic Profiling of Pediatric Acute Myeloid Leukemia Reveals a Changing 411 Mutational Landscape from Disease Diagnosis to Relapse. Cancer Res 76, 2197-2205 (2016). 412
8. Lange, B.J., et al. Outcomes in CCG-2961, a children's oncology group phase 3 trial for untreated 413 pediatric acute myeloid leukemia: a report from the children's oncology group. Blood 111, 1044-414 1053 (2008). 415
9. Cooper, T.M., et al. AAML03P1, a pilot study of the safety of gemtuzumab ozogamicin in 416 combination with chemotherapy for newly diagnosed childhood acute myeloid leukemia: a 417 report from the Children's Oncology Group. Cancer 118, 761-769 (2012). 418
10. Gamis, A.S., et al. Gemtuzumab ozogamicin in children and adolescents with de novo acute 419 myeloid leukemia improves event-free survival by reducing relapse risk: results from the 420 randomized phase III Children's Oncology Group trial AAML0531. J Clin Oncol 32, 3021-3032 421 (2014). 422
11. Lavallee, V.P., et al. Identification of MYC mutations in acute myeloid leukemias with NUP98-423 NSD1 translocations. Leukemia 30, 1621-1624 (2016). 424
12. Faber, Z.J., et al. The genomic landscape of core-binding factor acute myeloid leukemias. Nat 425 Genet 48, 1551-1556 (2016). 426
13. Tarlock, K., et al. Discovery and Functional Validation of Novel Pediatric Specific FLT3 Activating 427 Mutations in Acute Myeloid Leukemia: Results from the COG/NCI Target Initiative. Blood 126, 428 87-87 (2015). 429
14. Ley, T.J., et al. DNMT3A mutations in acute myeloid leukemia. N Engl J Med 363, 2424-2433 430 (2010). 431
15. Wang, Y.A., et al. DNA methyltransferase-3a interacts with p53 and represses p53-mediated 432 gene expression. Cancer Biol Ther 4, 1138-1143 (2005). 433
16. Genovese, G., et al. Clonal hematopoiesis and blood-cancer risk inferred from blood DNA 434 sequence. N Engl J Med 371, 2477-2487 (2014). 435
17. Goossens, S., et al. The EMT regulator Zeb2/Sip1 is essential for murine embryonic 436 hematopoietic stem/progenitor cell differentiation and mobilization. Blood 117, 5620-5630 437 (2011). 438
18. Goossens, S., et al. ZEB2 drives immature T-cell lymphoblastic leukaemia development via 439 enhanced tumour-initiating potential and IL-7 receptor signalling. Nat Commun 6, 5794 (2015). 440
19. Xiang, P., et al. Identification of E74-like factor 1 (ELF1) as a transcriptional regulator of the Hox 441 cofactor MEIS1. Exp Hematol 38, 798-798, 808 e791-792 (2010). 442
20. Ostronoff, F., et al. NUP98/NSD1 and FLT3/ITD coexpression is more prevalent in younger AML 443 patients and leads to induction failure: a COG and SWOG report. Blood 124, 2400-2407 (2014). 444
21. Maxson, J.E., et al. CSF3R mutations have a high degree of overlap with CEBPA mutations in 445 pediatric AML. Blood 127, 3094-3098 (2016). 446
22. Quintana-Bustamante, O., et al. Overexpression of wild-type or mutants forms of CEBPA alter 447 normal human hematopoiesis. Leukemia 26, 1537-1546 (2012). 448
23. Vicente, C., Conchillo, A., Garcia-Sanchez, M.A. & Odero, M.D. The role of the GATA2 449 transcription factor in normal and malignant hematopoiesis. Crit Rev Oncol Hematol 82, 1-17 450 (2012). 451
24. Ng, K.P., et al. Runx1 deficiency permits granulocyte lineage commitment but impairs 452 subsequent maturation. Oncogenesis 2, e78 (2013). 453
25. Wang, Y., et al. The Wnt/beta-catenin pathway is required for the development of leukemia 454 stem cells in AML. Science 327, 1650-1653 (2010). 455
26. Valencia, A., et al. Wnt signaling pathway is epigenetically regulated by methylation of Wnt 456 antagonists in acute myeloid leukemia. Leukemia 23, 1658-1666 (2009). 457
27. Nanbakhsh, A., et al. c-Myc regulates expression of NKG2D ligands ULBP1/2/3 in AML and 458 modulates their susceptibility to NK-mediated lysis. Blood 123, 3585-3595 (2014). 459
28. Marcucci, G., et al. MicroRNA expression in cytogenetically normal acute myeloid leukemia. N 460 Engl J Med 358, 1919-1928 (2008). 461
29. Ramamurthy, R., et al. miR-155 expression and correlation with clinical outcome in pediatric 462 AML: A report from Children's Oncology Group. Pediatr Blood Cancer 63, 2096-2103 (2016). 463
30. Fooladinezhad, H., Khanahmad, H., Ganjalikhani-Hakemi, M. & Doosti, A. Negative regulation of 464 TIM-3 expression in AML cell line (HL-60) using miR-330-5p. Br J Biomed Sci 73, 129-133 (2016). 465
31. Lim, E.L., et al. Comprehensive Sequence Analysis of Relapse and Refractory Pediatric Acute 466 Myeloid Leukemia Identifies miRNA and mRNA Transcripts Associated with Treatment 467 Resistance - a Report from the COG/NCI-Target AML Initiative. Blood 126, 687-687 (2015). 468
32. Gruber, T.A., et al. An Inv(16)(p13.3q24.3)-encoded CBFA2T3-GLIS2 fusion protein defines an 469 aggressive subtype of pediatric acute megakaryoblastic leukemia. Cancer Cell 22, 683-697 470 (2012). 471
33. Liang, K., et al. Therapeutic Targeting of MLL Degradation Pathways in MLL-Rearranged 472 Leukemia. Cell 168, 59-72 e13 (2017). 473
34. Itskovich SS, C.J., Mulloy JC, Disney MD, Kumar AR. MBNL1 As a New Therapeutic Target in MLL-474 Fusion Gene Leukemia. in Americal Society of Hematology Annual Conference 462 (Orlando, Fl., 475 2015). 476
35. Caudell, D., et al. Retroviral insertional mutagenesis identifies Zeb2 activation as a novel 477 leukemogenic collaborating event in CALM-AF10 transgenic mice. Blood 115, 1194-1203 (2010). 478
36. Li, J., et al. The EMT transcription factor Zeb2 controls adult murine hematopoietic 479 differentiation by regulating cytokine signaling. Blood 129, 460-472 (2017). 480
37. Shlush, L.I., et al. Identification of pre-leukaemic haematopoietic stem cells in acute leukaemia. 481 Nature 506, 328-333 (2014). 482
38. Guryanova, O.A., et al. DNMT3A mutations promote anthracycline resistance in acute myeloid 483 leukemia via impaired nucleosome remodeling. Nat Med 22, 1488-1495 (2016). 484
39. Loghavi, S., et al. Clinical features of de novo acute myeloid leukemia with concurrent DNMT3A, 485 FLT3 and NPM1 mutations. J Hematol Oncol 7, 74 (2014). 486
40. Xu, B., et al. Tumor suppressor menin represses paired box gene 2 expression via Wilms tumor 487 suppressor protein-polycomb group complex. J Biol Chem 286, 13937-13944 (2011). 488
41. Sinha, S., et al. Mutant WT1 is associated with DNA hypermethylation of PRC2 targets in AML 489 and responds to EZH2 inhibition. Blood 125, 316-326 (2015). 490

42. Abdel-Wahab, O., et al. ASXL1 mutations promote myeloid transformation through loss of PRC2-491 mediated gene repression. Cancer Cell 22, 180-193 (2012). 492
43. Gollner, S., et al. Loss of the histone methyltransferase EZH2 induces resistance to multiple 493 drugs in acute myeloid leukemia. Nat Med 23, 69-78 (2017). 494
495
496

Online Methods 497
Sample Selection and Preparation. All patient samples were obtained by member COG institutions 498 after written consent from the parents/guardians of minors upon enrolling in the trial. The study was 499 overseen by the Institutional Review Board at Fred Hutchinson Cancer Research Center (Protocol 1642, 500 IR File #5236). Selected clinical (e.g., age, presenting hematological indices, cytogenetic classification) 501 and molecular features (e.g., KIT, RAS, NPM, WT1, CEBPA, IDH1 mutations, and FLT3/ITD allelic ratios) 502 were clinically available prior to genomic analyses and are included in the clinical data file available at 503 the TARGET data matrix. 177 cases from the adult de novo AML TCGA dataset3 were selected for 504 analysis after exclusion of those with FAB M3 morphology (n=20) or BCR-ABL1 gene fusion (n=3) since 505 these subtypes are not represented in the COG/TARGET-AML cohort. The age distributions for the 506 TARGET WGS discovery group and the TCGA cohort are outlined in Table S3. 507
DNA and RNA was extracted from ficoll-enriched, viably cryopreserved samples from the COG 508 biorepository using the AllPrep Extraction Kit (Qiagen). Nucleic acids were quantified by NanoDrop 509 (Thermo Scientific). RNA samples were tested for quality and integrity using the Agilent 2100 510 Bioanalyzer (Agilent Technologies). The integrity of DNA samples was confirmed by visualization on a 511 0.8% agarose gel. 512
Whole genome sequencing. Sequencing libraries were constructed for WGS cases from genomic DNA 513 and sequenced using combinatorial probe anchor ligation by Complete Genomics (CGI)44. Reads were 514 mapped to the GRCh37 reference human genome assembly by the CGI Cancer Sequencing service using 515 software version 2.1 of the CGI cancer analysis pipeline (http://www.completegenomics.com/customer-516 support/documentation/). 517
Somatic coding SNVs and indels were extracted from MAF files and filtered to remove 1) germline 518 variants; 2) low-confidence variants and 3) paralogs. For step 1, germline variants used for filtering 519 include those from NLHBI Exome Sequencing Project (http://evs.gs.washington.edu/EVS/), dbSNP 132 520 (https://www.ncbi.nlm.nih.gov/projects/SNP/), St Jude/Washington University Pediatric Cancer Genome 521 Project (PCGP), and CGI WGS from the TARGET project. For step 2, a mutation is considered of low-522 confidence if it does NOT meet one of the following criteria: a) mutant allele has ≥3 more read count in 523 tumor than in the normal sample; b) the mutant read count in tumor is significantly higher than that in 524 the matched normal (P<0.01 by Fisher exact test); and c) mutant allele fraction in normal is below 0.05. 525 For step 3, we ran BLAT search using a template sequence that includes the mutant allele and its 20-bp 526 flanking region to determining the uniqueness of mapping of the mutation. To avoid over-filtering, we 527 implemented a rescue pipeline which retains all “gold” variants that match known somatic mutation 528 hotspots based on our variant classification program Medal Ceremony45. 529
In addition to small variant calls (SNV, indel), the CGI cancer analysis pipeline delivered flat files of 530 potential novel DNA junctions and segmented copy number ratios derived from normalized read counts 531 from paired tumor/normal specimens. Circos summary plots of the unfiltered CGI data are available 532 through the data matrix. To reduce potentially spurious calls, final CNVs for analysis were trimmed after 533 empirical tuning to previously available Affymetrix SNP6 microarray calls in matched samples by 534 requiring a CGI average normalized coverage (avgNormCvg) in the region of ≥20 for putative non-535 homozygous deletions, the SD for lesser allele fraction ≤ 0.22, a CGI ploidyScore of <30 and trimming of 536 calls on ChrM, centromeric or telomeric regions, and merged for adjacent CNV, per called direction, 537 within 10 Kbp. With these filters, 75 and 85% (loss and gain, respectively) of filtered CNV calls matched 538
CNVs previously called by Affymetrix SNP6 microarray and 87% of chromosome-arm level calls matched 539 reported karyotype abnormalities reported in the clinical data. Putative copy variants underwent further 540 secondary confirmation using the nanoString nCounter assay (Nanostring Technologies). Novel DNA 541 junctions discovered by WGS were included in cases where at least one additional level of support was 542 available, either from cytogenetic analysis or from RNA sequencing studies. 543
Targeted Capture Sequencing. Candidate genes identified by WGS analysis were selected for 544 independent verification in 182 samples from the WGS discovery cohort and 618 additional subjects 545 treated on COG AAML0531. Capture baits were designed and ordered using Agilent's SureDesign 546 (https://earray.chem.agilent.com/suredesign/) for these selected genes along with target regions 547 identified in concurrent TARGET studies, targeting coding regions and UTRs with a 10 bp pad. This design 548 (TARGET AML + TARGET other) resulted in an overall target space of 2.376 Mbp with 98.7% of target 549 regions covered by a probe. Probe density was specified at 2x, with moderately stringent repeat 550 masking, and balanced boosting options selected. 551
Genomic DNA libraries from which gene regions of interest are captured were constructed according to 552 British Columbia Cancer Agency Genome Sciences Centre (BCGSC) plate-based and paired-end library 553 protocols on a Biomek FX liquid handling robot (Beckman-Coulter, USA). Briefly, 1µg of high molecular 554 weight genomic DNA was sonicated (Covaris E210) in a 60µL volume to 200-300bp. Sonicated DNA was 555 purified with magnetic beads (Agencourt, Ampure). The DNA fragments were end-repaired, 556 phosphorylated and bead purified in preparation for A-tailing. Illumina sequencing adapters were 557 ligated overnight at 20oC and adapter ligated products bead purified and enriched with 4 cycles of PCR 558 using primers containing a hexamer index that enables library pooling. 94ng from each of 19 to 24 559 different libraries were pooled prior to custom capture using Agilent SureSelect XT Custom 0.5-2.9Mb 560 probes. The pooled libraries were hybridized to the RNA probes at 65oC for 24 hours. Following 561 hybridization, streptavidin-coated magnetic beads (Dynal, MyOne) were used for custom capture. Post-562 capture material was purified on MinElute columns (Qiagen) followed by post-capture enrichment with 563 10 cycles of PCR using primers that maintain the library-specific indices. Paired-end 100 base reads were 564 sequenced per pool in a single lane of an Illumina HiSeq2500 instrument. Illumina paired-end 565 sequencing reads were aligned to the GRCh37-lite reference using BWA version 0.5.7. This reference 566 contains chromosomes 1-22, X, Y, MT, 20 unlocalized scaffolds and 39 unplaced scaffolds. Multiple lanes 567 of sequences were merged and duplicated reads were marked with Picard Tools. Small variants (SNV 568 and indel) from TCS data were identified by parallel methods, integrated, and subsequently filtered as 569 follows. Mpileup: SNVs were analyzed with SAMtools mpileup v.0.1.17 on paired libraries46. Each 570 chromosome was analyzed separately using the -C50-DSBuf parameters. The resulting vcf files were 571 merged and filtered to remove low quality variants by using samtools varFilter (with default parameters) 572 as well as to remove variants with a QUAL score of less than 20 (vcf column 6). Finally, variants were 573 annotated with gene annotations from ensembl v66 using snpEff47 and the dbSNP v137 db membership 574 assigned using snpSift48. Strelka: Samples were analyzed pair wise with the default settings of Strelka49 575 v0.4.7 with primary tumor samples against the matched remission sample. Somatic variants called by 576 either Mpileup or Strelka were combined and filtered by meeting any of the following criteria: <10 reads 577 in the remission sample, <10 reads in the tumor sample, tumor alt base = 0, adjusted tumor allele 578 frequency = 0, gmaf >0.009, or >60 patients had exact SNV. For patients established to be in 579 morphological remission, additional filters included removing variants with >0.10 allele fraction in the 580 remission sample and a FET score of >0.05. For refractory patients, variants were excluded with >0.35 581

allele fraction in the post-Diagnostic sample. These filtered variants could be “rescued” if a variant was a 582 known COSMIC mutation associated with hematological cancers. The filtering criteria for indel calls 583 were similar. Tandem duplications were identified with Pindel using default parameters50. In addition, 584 clinical molecular testing for specific genes (FLT3 ITD and FLT3 codons 835/836, CEBPA bzip and NTD 585 regions, KIT exons 8 and 17, CBL exons 8 and 9, and WT1 exon 7) were merged into the variant calls for 586 final analysis. 587
DNA variants from discovery and TCS studies were merged to construct the mutation profile for each 588 gene using the web-based program, ProteinPaint51. Genome-wide mutational burden was compared to 589 published data from, and using the method of, Lawrence et al52. 590
CBL Transcript Variant Screening by cDNA PCR. Total RNA isolated from patient leukemic cells using the 591 Qiagen AllPrep DNA/RNA Mini Kit (Qiagen, Germany) was reverse transcribed to cDNA with oligo DT 592 primer and additional reagents following the Maxima H Minus First Strand cDNA Synthesis Kit 593 instructions (Thermo Scientific, Grand Island, NY). 594
Synthesis of the second-strand cDNA and following PCR were performed using the following primers: 595 forward primer for genemap: (5’FAM-TTCCAAGCACTGATTGATGG), forward primer for sequencing (5’-596 TTCCAAGCACTGATTGATGG-3’), reverse primer: (5’-AACAGAATATGGCCGGTCTG). PCR was performed in 597 25uL volumes containing 12.5uL Failsafe Epicentre Buffer C (2x) (Epicentre Technologies, Madison, WI), 598 0.5uL (10uM) of each primer, 0.25uL Invitrogen Platinum Taq Polymerase (Thermo Scientific - Invitrogen, 599 Grand Island, NY), 1uL of cDNA, and 10.25uL of Nuclease-Free Water (USB Corporation, Cleveland, OH). 600 The Thermocycling program consisted of 5 min denaturation at 95 C, followed by 35 cycles at 95 C for 30 601 sec, 60°C for 30 sec and 72 C for 45 sec min and a final extension of 7 min at 72 C in a 96 well Biometra T 602 professional Thermocycler (Biometra, Germany) 603
PCR products were diluted in nuclease free water (USB Corporation, Cleveland, OH) and mixed with 604 deionized Formamide and GENESCAN-400HD (ROX) size markers (Applied Biosystems, Foster City, CA) 605 and submitted for electrophoresis on an ABI 3730 Genetic Analyzer (Applied Biosystems). After 606 electrophoresis the fluorescence signals were analyzed using GeneMapper 5.0 software (Applied 607 Biosystems). Genemapper screening revealed products of the expected WT normal size (685bp), and 608 additional products of various sizes: corresponding to complete deletion of Exon 8 (563bp), complete 609 deletion of Exon 9 (485bp), as well as deletion involving both CBL exon 8 and exon 9 (354bp). 610
Patients exhibiting deletions by Genemapper were then sent for sequence verification. PCR products 611 were treated with Exo-SAPit enzyme (USB Corporation, Cleveland, OH). Sequencing was done by 612 Eurofins MWG Operon LLC (Huntsville, AL) in accordance with their DNA sequencing process guidelines 613 and methods. 614
Generalized linear mixed model for coding mutation counts. In order to account for both fixed and 615 random effects which might be present with age and cytogenetic subgroups, we employed a generalized 616 linear mixed model (glmm, Knudson 2016, R package version 1.1.1, https://CRAN.R-617 project.org/package=glmm) to model the discrete counts of coding SNVs in each TARGET and TCGA WGS 618 patient with a Poisson error distribution (log link). Marginal likelihood ratio tests for age (as a continuous 619 predictor) and cytogenetic subgroup (as a categorical predictor) were uniformly and highly significant, as 620 reported in the text, while the per-cytogenetic-group random effects accounted for a small (< 0.003%) 621 fraction of the variance observed. The model converged in 208 steps; 10,000 MCMC iterations were 622

employed to estimate the mixed effects component of the model, fitted per-cytogenetic-group 623 assuming a random slopes model. 624
Generalized Dirichlet-multinomial regression for mutational spectra. To accommodate the possibility 625 of either negative or positive correlation between the counts of each type of mutation (C→T, C→A, 626 C→G, T→C, T→A, T→G) in each subject, we employed a generalized Dirichlet-multinomial model 627 (mglm53, R package version 0.0.7, https://CRAN.R-project.org/package=MGLM) with age and 628 cytogenetic group as predictors, mutational spectrum (a matrix of counts for each type of mutation) as 629 response. At convergence, the significant predictors of mutational spectrum differences were age (most 630 significant), t(8;21) status, and aberrant karyotype (mutually exclusive with t(8;21) and other common 631 recurrent chromosomal abnormalities). C→T transitions are known to increase with age, particularly for 632 methylated cytosines; however, an inflation of C→A transversions was particularly apparent in t(8;21) 633 and aberrant karyotype cases. (Both t(8;21) and inv(16) affect core binding factor subunits, and both are 634 associated with higher mutational burdens at a given age, but only t(8;21) cases show additional C→A 635 transversions beyond those expected from counts). 636
Weighted resampling scheme to compare TARGET and TCGA mutation frequencies. Common 637 chromosomal aberrations often co-occur with specific types of additional DNA sequence abnormalities. 638 To account for this observation when determining differences in mutation frequencies between TARGET 639 AML and TCGA AML, we first divided each cohort into the following categories: KMT2A fusions, t(8;21), 640 inv(16), del(7), +8, +21, -Y, and normal karyotype (NK). A total of 131 unique TCGA and 548 TARGET 641 samples fell into one of the above categories. We then sampled equal numbers of specimens from each 642 category and calculated the fraction of samples with mutations in a given gene. To account for sampling 643 variations, we repeated our sampling procedure 5000 times and calculated the mean and standard 644 deviation of the fraction of samples with mutations in each gene of interest. 645
Variant pairwise mutual exclusion and co-occurrence. Pairwise mutually exclusive sequence alterations 646 (Fig S20a) were identified using CoMEt54 with the “exhaustive” option 647 (http://compbio.cs.brown.edu/projects/comet/). Pairwise co-occurrence p-values (Fig S20b) were 648 calculated directly using a hypergeometric distribution (equivalent to Fisher’s exact test). Statistically 649 significant exclusion/co-occurrence patterns were visualized using Cytoscape55 (http://cytoscape.org/), 650 with edge thickness representing –log10(p-value). 651
Orthogonal evaluation of mutual exclusion and co-occurrence via penalized Ising model. A slightly 652 different approach to reconstructing a binary-valued undirected graph (a discrete Markov random field) 653 employs penalized logistic regression of all candidate nodes upon each possible target and selects the 654 most probable graph structure based on extensions of the Bayes information criterion (EBIC). This 655 approach is implemented by Epskamp (https://cran.r-project.org/package=IsingFit)56 and employs a 656 hyperparameter (γ) for the penalty weight which eventually determines the density of the estimated 657 network. Adjustment for multiple comparisons was applied to the marginal significance of each gene-658 gene Fisher exact test; this value is not unbiased due to post-selection inference and is only intended as 659 a guide. The resulting network of correlated and anticorrelated binary indicators (gene- and 660 chromosomal-level aberrant/wildtype, pediatric/adult) recovers known and CoMEt-detected 661 relationships, but also identifies several novel and marginally significant (by Fisher’s exact test, see 662 above) relationships, as summarized in Supplementary Table 6. 663

Hypothesis-testing. Except where described by the methods above, p-values are calculated by Fisher’s 664 exact test; where an exact binomial test is impractical, we approximate this with a Chi-squared p-value. 665
Regression fits for structural/sequence variant burden and age-associated recurrent abnormalities. To 666 fit the ratio of structural to sequence variant impact in each patient, we added 0.333 as a smoothing 667 factor to the counts of each clonal event of each type, using all recurrently mutated, fused, or silenced 668 genes, identified in either cohort, as candidates for “impact” by structural variants. The transparency of 669 each data point represents its observed over expected mutational burden, given the patient’s age, but 670 has no impact on the loess regression fit. The loess curve was fit by ggplot2 (http://ggplot2.org) on a 671 log10 scale. To estimate the relative contribution of each of the recurrent fusion neighborhoods across 672 ages (rather than age groups), we used the “zoo” time series package57 to fit a rolling median with 673 expanding time steps (1, 3, 5, 8, 17) across all subjects for whom we had data on fusions. The 674 (smoothed) contribution of each family of fusions to the total number of patients in a given age window 675 (expanding with advancing age) is plotted in Figure 2d. 676 677 Clonality estimation. Several packages (including MAFtools58 (https://github.com/PoisonAlien/maftools) 678 Gaussian mixture, SciClone’s59 beta mixture model, and a weighted penalized logistic mixture model) 679 were compared to validate the results obtained, in addition to manual review of all results. While 680 proportions of mutations assigned to various clones differed in some cases (especially with and without 681 read support weighting), the primary mutational clones were consistently identified by all methods, and 682 an overall tendency for childhood and AYA patients to present with greater diagnostic mutational 683 clonality, at the read depths available in the TARGET WGS and TCGA data, was confirmed by all 684 methods. Among AYA patients (where both TCGA and TARGET AML cohorts contain numerous patients), 685 no difference in estimated clonality or monoclonal/polyclonal balance was observed between cohorts 686 (p=0.7 and p=0.65 respectively by Fisher’s exact test), and although a trend towards decreased 687 mutational clonality with increasing age among AYA patients was observed, it was not statistically 688 significant (p=0.2). It is important to note that, owing to variable sequencing depths, we do not have the 689 statistical power to reliably detect clones present in less than 5% of the total sample material, though 690 inclusion of variant allele frequencies as low as 0.1% did not change our results or conclusions regarding 691 mutational clonality. Karyotypic clonality was assessed by parsing ISCN karyotypes of all TARGET and 692 TCGA AML patients and using stemline karyotype to identify the most likely ancestral aberrations for 693 patients with abnormal karyotype. Patients with normal karyotype were assigned a karyotypic clonality 694 of 1, as were patients with all metaphases bearing identical aberrations. 695
Aberrations predicting induction failure. A logistic model with terms for NUP98-NSD1 fusions, FLT3 696 mutations, interactions between the preceding, and (any one of) WT1, EZH2, or ASXL1 mutation 697 (mutually exclusive) or deletions of the latter (nearly mutually exclusive), or KMT2A rearrangements 698 (also mutually exclusive with the preceding) best fit the data for subjects where the first recorded event 699 was either induction failure (1) or any other outcome (0). All possible nested models with the same 700 terms, and all other models arrived at by penalized logistic regression (using an elastic net penalty with 701 the glmnet package60, with any observed recurrent lesion eligible for inclusion as an independent 702 predictor), yielded inferior fits both in terms of classification error and by Akaike information criterion 703 (AIC). We report the marginal p-value for WT1/ASXL1/EZH2 aberrations as predictors of induction 704 failure in the test based on this model fit. 705

mRNA Sequencing. Total RNA quality was verified on Agilent Bioanalyzer RNA nanochip or Caliper GX HT 706 RNA LabChip, with samples passing quality control arrayed into a 96-well plate. PolyA+ RNA was purified 707 using the 96-well MultiMACS mRNA isolation kit on the MultiMACS 96 separator (Miltenyi Biotec) from 708 2µg total RNA with on-column DNaseI-treatment as per the manufacturer's instructions. The eluted 709 PolyA+ RNA was ethanol precipitated and resuspended in 10µL of DEPC treated water with 1:20 710 SuperaseIN (Life Technologies). First-stranded cDNA was synthesized from the purified polyA+RNA using 711 the Superscript cDNA Synthesis kit (Life Technologies) and random hexamer primers at a concentration 712 of 5µM along with a final concentration of 1ug/uL Actinomycin D, followed by Ampure XP SPRI beads on 713 a Biomek FX robot (Beckman-Coulter). The second strand cDNA was synthesized following the 714 Superscript cDNA Synthesis protocol by replacing the dTTP with dUTP in dNTP mix, allowing second 715 strand to be digested using UNG (Uracil-N-Glycosylase, Life Technologies, USA) in the post-adapter 716 ligation reaction and thus achieving strand specificity. The cDNA was quantified by PicoGreen (Life 717 Technologies) and VICTOR3V Fluorimeter (PerkinElmer). The cDNA was fragmented by Covaris E210 718 sonication for 55 seconds at a “Duty cycle” of 20% and “Intensity” of 5. The paired-end sequencing 719 library was prepared following the BC Cancer Agency Genome Sciences Centre strand-specific, plate-720 based and paired-end library construction protocol on a Biomek FX robot (Beckman-Coulter, USA). 721 Briefly, the cDNA was purified in 96-well format using Ampure XP SPRI beads, and was subject to end-722 repair, and phosphorylation by T4 DNA polymerase, Klenow DNA Polymerase, and T4 polynucleotide 723 kinase respectively in a single reaction, followed by cleanup using Ampure XP SPRI beads and 3’ A-tailing 724 by Klenow fragment (3’ to 5’ exo minus). After purification using Ampure XP SPRI beads, picogreen 725 quantification was performed to determine the amount of Illumina PE adapters to be used in the next 726 step of adapter ligation reaction. The adapter-ligated products were purified using Ampure XP SPRI 727 beads, and digested with UNG (1U/µl) at 37oC for 30 min followed by deactivation at 95oC for 15 min. 728 The digested cDNA was purified using Ampure XP SPRI beads, and then PCR-amplified with Phusion DNA 729 Polymerase (Thermo Fisher) using Illumina’s PE primer set, with cycle condition 98˚C 30sec followed by 730 10-13 cycles of 98˚C 10 sec, 65˚C 30 sec and 72˚C 30 sec, and then 72˚C 5min. The PCR products were 731 purified using Ampure XP SPRI beads, and checked with Caliper LabChip GX for DNA samples using the 732 High Sensitivity Assay (PerkinElmer, Inc. USA). PCR product of the desired size range was purified using 733 8% PAGE, and the DNA quality was assessed and quantified using an Agilent DNA 1000 series II assay 734 and Quant-iT dsDNA HS Assay Kit using Qubit fluorometer (Invitrogen), then diluted to 8nM. The final 735 library concentration was double checked and determined by Quant-iT dsDNA HS Assay again for 736 Illumina Sequencing. 737
mRNA Quantification. Illumina paired-end RNA sequencing reads were aligned to GRCh37-lite genome-738 plus-junctions reference using BWA version 0.5.7. This reference combined genomic sequences in the 739 GRCh37-lite assembly and exon-exon junction sequences whose corresponding coordinates were 740 defined based on annotations of any transcripts in Ensembl (v69), Refseq and known genes from the 741 UCSC genome browser, which was downloaded on August 19 2010, August 8 2010, and August 19 2010, 742 respectively. Reads that mapped to junction regions were then repositioned back to the genome, and 743 were marked with 'ZJ:Z' tags. BWA is run using default parameters, except that the option (-s) is included 744 to disable Smith-Waterman alignment. Finally, reads failing the Illumina chastity filter are flagged with a 745 custom script, and duplicated reads were flagged with Picard Tools. Gene, isoform, and exon-level 746 quantification was performed as previously described61. 747

Fusion mRNA Transcript Detection. Transcriptomic data were de novo assembled using ABySS (v1.3.2) 748 and trans-ABySS (v1.4.6)62. For RNA-seq assembly alternate k-mers from k50-k96 were performed using 749 positive strand and ambiguous stand reads as well as negative strand and ambiguous strand reads. The 750 positive and negative strand assemblies were extended where possible, merged and then concatenated 751 together to produce a meta-assembly contig dataset. Large scale rearrangements and gene fusions from 752 RNA-seq libraries were identified from contigs that had high confidence GMAP (v2012-12-20) alignments 753 to two distinct genomic regions. Evidence for the alignments were provided from aligning reads back to 754 the contigs and from aligning reads to genomic coordinates. Events were then filtered on read 755 thresholds. Insertions and deletions were identified by gapped alignment of contigs to the human 756 reference using GMAP. The events were then screened against dbSNP and other variation databases to 757 identify putative novel events. 758
miRNA Sequencing. Small RNAs, containing microRNA (miRNA), in the flow-through material following 759 mRNA purification on a MultiMACS separator (Miltenyi Biotec) are recovered by ethanol precipitation. 760 miRNA-seq libraries are constructed using a 96-well plate-based protocol developed at the BC Cancer 761 Agency, Genome Sciences Centre. Briefly, an adenylated single-stranded DNA 3’ adapter is selectively 762 ligated to miRNAs using a truncated T4 RNA ligase2 (New England Biolabs). An RNA 5’ adapter is then 763 added, using a T4 RNA ligase (Ambion) and ATP. Next, first strand cDNA is synthesized using Superscript 764 II Reverse Transcriptase (Invitrogen), and serves as the template for PCR. Index sequences (6 765 nucleotides) are introduced at this PCR step to enable multiplexed pooling of miRNA libraries. PCR 766 products are pooled, then size-selected on an in-house developed 96-channel robot to enrich the miRNA 767 containing fraction and remove adapter contaminants. Each size-selected indexed pool is ethanol 768 precipitated and quality checked on an Agilent Bioanalyzer DNA 1000 chip and quantified using a Qubit 769 fluorometer (Invitrogen, cat. Q32854). Each pool is then diluted to a target concentration for cluster 770 generation and loaded into a single lane of a HiSeq 2000 flow cell for sequencing with a 31-bp main read 771 (for the insert) and a 7-bp read for the index. 772
Sequence data are separated into individual samples based on the index read sequences, and the reads 773 undergo an initial QC assessment. Adapter sequence is then trimmed off, and the trimmed reads for 774 each sample are aligned to the NCBI GRCh37-lite reference genome. 775
Routine QC assesses a subset of raw sequences from each pooled lane for the abundance of reads from 776 each indexed sample in the pool, the proportion of reads that possibly originate from adapter dimers 777 (i.e. a 5’ adapter joined to a 3’ adapter with no intervening biological sequence) and for the proportion 778 of reads that map to human miRNAs. Sequencing error is estimated by a method originally developed 779 for SAGE. 780
Libraries that pass this QC stage are preprocessed for alignment. While the size-selected miRNAs vary 781 somewhat in length, typically they are ~21 bp long, and so are shorter than the 31-bp read length. Given 782 this, each read sequence extends some distance into the 3' sequencing adapter. Because this non-783 biological sequence can interfere with aligning the read to the reference genome, 3’ adapter sequence is 784 identified and removed (trimmed) from a read. The adapter-trimming algorithm identifies as long an 785 adapter sequence as possible, allowing a number of mismatches that depends on the adapter length 786 found. A typical sequencing run yields several million reads; using only the first (5’) 15 bases of the 3’ 787 adapter in trimming makes processing efficient, while minimizing the chance that a miRNA read will 788 match the adapter sequence. 789

After each read has been processed, a summary report is generated containing the number of reads at 790 each read length. Any trimmed read that is shorter than 15bp is discarded; remaining reads are 791 submitted for alignment to the reference genome. BWA (Li and Durbin, 2009) alignment(s) for each read 792 are checked with a series of three filters. A read with more than 3 alignments is discarded as too 793 ambiguous. Only perfect alignments with no mismatches are used. Reads that fail the Illumina 794 basecalling chastity filter are retained, while reads that have soft-clipped CIGAR strings are discarded. 795
For reads retained after filtering, each coordinate for each read alignment is annotated using a 796 reference database, and requiring a minimum 3-bp overlap between the alignment and an annotation. If 797 a read has more than one alignment location, and the annotations for these are different, we use a 798 priority list to assign a single annotation to the read, as long as only one alignment is to a miRNA. When 799 there are multiple alignments to different miRNAs, the read is flagged as cross-mapped (de Hoon et al., 800 2010), and all of its miRNA annotations are preserved, while all of its non-miRNA annotations are 801 discarded. This ensures that all annotation information about ambiguously mapped miRNAs is retained, 802 and allows annotation ambiguity to be addressed in downstream analyses. Note that we consider 803 miRNAs to be cross-mapped only if they map to different miRNAs, not to functionally identical miRNAs 804 that are expressed from different locations in the genome. Such cases are indicated by miRNA miRBase 805 names, which can have up to 4 separate sections separated by "-", e.g. hsa-mir-26a-1. A difference in 806 the final (e.g. ‘-1’) section denotes functionally equivalent miRNAs expressed from different regions of 807 the genome, and we consider only the first 3 sections (e.g. ‘hsa-mir-26a’) when comparing names. As 808 long as a read maps to multiple miRNAs for which the first 3 sections of the name are identical (e.g. hsa-809 mir-26a-1 and hsa-mir-26a-2), it is treated as if it maps to only one miRNA, and is not flagged as cross-810 mapped. 811
The minimum depth of sequencing required to detect the miRNAs that are expressed in one sample is 812 1,000,000 reads per library mapped to miRBase (v21) annotations. Finally, for each sample, the reads 813 that correspond to particular miRNAs are summed and normalized to a million miRNA-aligned reads to 814 generate the quantification files. TARGET and TCGA miRNA quantifications were normalized with pSVA, 815 preserving known subtype-specific miRNA expression patterns, prior to comparison63. 816
Differentially expressed miRNAs and mRNA were determined by Wilcoxon tests, where significantly 817 differentially expressed miRNAs were those with Benjamini-Hochberg multiple test corrected p-values 818 <0.05. Correlation between miRNA and mRNA expression was determined using the Spearman 819 correlation. 820
DNA-methylation analysis. Bisulfite conversion of genomic DNA was performed with EZ DNA 821 methylation Kit (Zymo Research, Irvine, CA) following the manufacturer’s protocol with modifications for 822 the Infinium Methylation Assay. Briefly, one microgram of genomic DNA was mixed with 5 µl of Dilution 823 Buffer and incubated at 37oC for 15 minutes and then mixed with 100 µl of conversion reagent prepared 824 as instructed in the protocol. Mixtures were incubated in a thermocycler for 16 cycles at 95oC for 30 825 seconds and 50oC for 60 minutes. Bisulfite-converted DNA samples were loaded onto the provided 96-826 column plates for desulphonation, washing and elution. The concentration of bisulfite-converted, eluted 827 DNA was measured by UV-absorbance using a NanoDrop-1000 (Thermo Fisher Scientific, Waltham, MA). 828 Bisulfite-converted genomic DNA was analyzed using the Infinium Human Methylation27 Beadchip Kit 829 (Illumina, San Diego, CA, #WG-311-1202). DNA amplification, fragmentation, array hybridization, 830 extension and staining were performed with reagents provided in the kit according to the 831

manufacturer’s protocol (Illumina Infinium II Methylation Assay, #WG-901-2701). Briefly, 4 µl of 832 bisulfite-converted genomic DNA at a minimum concentration of 20 ng/µL) was added to 0.8 ml 96-well 833 storage plate (Thermo Fisher Scientific), denatured in 0.014N sodium hydroxide, neutralized and then 834 amplified for 20-24 hours at 37oC. Samples were fragmented at 37oC for 60 minutes and precipitated in 835 isopropanol. Re-suspended samples were denatured in a 96-well plate heat block at 95oC for 20 836 minutes. 15 µl of each sample was loaded onto a 12-sample BeadChip, assembled in the hybridization 837 chamber as instructed by the manufacturer and incubated at 48oC for 16-20 hours. Following 838 hybridization, the BeadChips were washed and assembled in a fluid flow-through station for primer-839 extension reaction and staining with reagents and buffers provided. Polymer-coated BeadChips were 840 scanned in an iScan scanner (Illumina) using Inf Methylation mode. For both HumanMethylation27 and 841 HumanMethylation450 arrays, methylated and unmethylated signal intensity and detection p-values 842 were extracted after background correction and (in the case of HumanMethylation450 arrays) dye-bias 843 equalization by normal-exponential convolution (noob64) as implemented in the minfi package65. Data 844 from HumanMethylation450 arrays were additionally normalized using functional normalization 845 (funnorm66) as implemented in the minfi package, then summarized as beta values [M /(M+U)]. Probes 846 with an annotated SNV within the CpG or single-base extension site are masked as NA across all 847 samples. Probes with non-detection probability > 0.01 are masked as NA for individual samples. 848
Transcriptional silencing evaluation and tabulation 849
Transcription is influenced by a large number of features, among which is methylation of genomic CpG 850 dinucleotides, which often leads to methyl-binding domain proteins excluding transcriptional activators 851 when it occurs near a transcription start site. Not all gene promoters are influenced by differences in 852 DNA methylation, and not all promoters which are thusly influenced are relevant in a given cell type. 853 Thus we sought to identify bundles of transcripts (genes) whose expression appears to be influenced by 854 promoter CpG methylation and whose expression potential is perturbed in a subset of AML cases. 855
To establish a uniform criteria for “calling” such events, we evaluated over 50,000 loci from the Illumina 856 HumanMethylation450 (“450k”) microarray near the transcription start sites of over 20,000 transcripts. 857 Where any variance in transcript abundance was explained by variation in DNA methylation levels at a 858 locus, we retained the locus and gene symbol for further evaluation. With this set of several thousand 859 potential marker pairs, we iteratively sought “silencing” cutoff points, such that the maximum 860 expression of a gene in any sample with methylation above the cutoff level was less than or equal to the 861 median expression of samples below the cutoff. The relative levels of DNA methylation and expression 862 appeared to differ systematically between TCGA AML and TARGET AML patients. Therefore we retained 863 the most conservative (highest) cut-point from among the two cohorts. A large number of TARGET AML 864 patients were previously assayed on the promoter-centric Illumina HumanMethylation27 (“27k”) 865 microarray; to maximize the sample size for silencing calls, we performed the same conservative 866 procedure as described above with 27k loci. Whenever a locus could be found with a suitable cut-point 867 on both 27k and 450k arrays, we used the two loci to cross-validate transcriptional silencing behavior 868 between the two (largely disjoint) sets of samples (TCGA AML patients were assayed on both 27k and 869 450k arrays, so we used the appropriate complementary assay to cross-validate each cutoff in TCGA). 870 The resulting set of “tag CpGs” (loci with satisfactory cutoff values for a given gene) on each platform, 871 along with the results of applying these cutoffs to dichotomize patient samples into “silenced” or not, 872 are provided in Table S9. Selected loci and genes affected across multiple patients are plotted in Fig. 5a, 873 annotated within each major cytogenetic group by the fraction of patients silenced. 874

Non-negative matrix factorization, DNA methylation signature derivation, and hierarchical clustering 875
Non-negative matrix factorization (NMF) decomposes a strictly positive data matrix X (with N rows and 876 M columns) into a lower-dimensional NxK weight matrix W and a corresponding KxM score matrix H67. 877 The crux of the decomposition is to find coefficients for W and H which, when multiplied, most closely 878 recover the original high-dimensional data matrix X, as there is no guarantee that a global optimum 879 exists in the absence of further constraints. This can be approached as an optimization problem: given 880 an estimate of the underlying rank K for the weight matrix W, what coefficients minimize the squared 881 reconstruction error (X–WH)2? When this is formulated as a non-negative least squares fit, alternating 882 between fits for W and H at each iteration, a fast sequential coordinate descent procedure implemented 883 by Eric Xihui Lin (https://cran.r-project.org/web/packages/NNLM/vignettes/Fast-And-Versatile-884 NMF.html) is useful for the large matrix we use for the input X. To decrease the size of X without 885 discarding information, the HumanMethylation450 data was further collapsed by aggregating signals at 886 adjacent CpG sites (up to 50bp separated) using the cpgCollapse function in the minfi package, yielding 887 221,406 discrete clustered methylation measurements, of which approximately half (118,586) showed 888 non-negligible variation across diagnostic tumor samples and/or matched remission samples. The 889 underlying identifiable rank K of the low-dimensional weight matrix W was estimated by 5-fold cross-890 validation, using random row x column knockouts (set to NA) in 20% of the matrix entries for each fold, 891 followed by minimization of reconstruction error and maximization of inferred rank. Based on this 892 procedure, the optimal rank K (with mean absolute error of 0.02793436) for W was estimated as 31. By 893 masking with W and H matrices derived from normal bone marrow populations (for which K was chosen 894 as 13, again based on reconstruction error as above), we subtracted “normal” hematopoietic cell signals 895 and simultaneously estimated the purity (cellularity) of each tumor sample, which allowed us to amplify 896 disease-specific signals, correcting in silico for estimated purity on a logit scale, and finally transforming 897 back to the original proportional 0-1 scale for presentation in Fig. 5b. The 31-row by 284-column patient 898 score matrix H, are provided in Table S10; selected signatures of particular interest are plotted in Fig. 899 5b. Ward’s method was employed to cluster columns (patients) in the figure panel by Manhattan 900 distance. 901
Survival analysis. 902
We tested an additional cohort of pediatric AML patients for outcome measures associated with 903 alterations of FLT3-ITD, NPM1 and WT1 mutations and NUP98-NSD1 translocations (Fig. 3C, lower right, 904 and Fig. S13, abbreviated “DCOG”). Patient data for this cohort was provided by the Dutch Childhood 905 Oncology group (DCOG), the AML ‘Berlin-Frankfurt-Münster’ Study Group (AML-BFM-SG), the Czech 906 Pediatric Hematology (CPH) group, the St Louis Hospital in Paris, France, the Medical Research Council 907 (MRC), and the Italian Association for Pediatric Hematology and Oncology (AIEOP). Patients were 908 treated by LAME 86, DCOG/AML-BFM 87, DCOG 92-94/AML-BFM 93, AML-BFM 98, AEIOP-2002/01, 909 ELAM02, AML-BFM 04 and MRC-12/15 protocols68-75. These protocols consisted of 4-5 blocks of 910 intensive chemotherapy, using a standard cytarabine and anthracycline backbone. All patients in this 911 cohort were previously published by Balgobind et al.76, and were extensively screened by RT-PCR or FISH 912 for recurrent aberrations, such as KMT2A-rearrangements, RUNX1-RUNX1T1, CBFB-MYH11, PML-RARA, 913 NUP98-rearrangements, FLT3-ITD, and mutations in NPM1, CEBPA, WT1, N/KRAS and c-KIT76-79, and 914 included 326 patients with data available on NUP98-NSD1, NPM1, FLT3-ITD and WT1 status. Complete 915 remission was obtained in 74.8% of the patients. A total of 114 patients (35.0%) received a HSCT, of 916

which 35 (10.7%) received an HSCT at first complete remission. The median follow up time of survivors 917 was 4.5 years (range 0.3-28 years) and the cohort-wide OS and EFS were 59.5% and 41.9%, respectively. 918
The Kaplan-Meier method was used to estimate overall survival (OS) and event free survival (EFS). OS is 919 defined as the time from study entry until death. EFS is defined as the time from study entry until death, 920 induction failure, or relapse. Patients lost to follow-up were censored at their date of last known 921 contact. Comparisons of OS and EFS were made using the log-rank test. 922
TARGET and TCGA subjects were combined in Cox proportional hazards fits for association of DNA 923 methylation signatures with survival outcome, and model parameters for well-established risk factors 924 (TP53 mutation, white blood cell count at diagnosis) were also estimated. Due to the nonlinear 925 association of age with survival in pediatric AML patients, and the difficulty of properly evaluating this 926 relationship, we instead stratified the Cox proportional hazards fits by cohort. 927
For miRNA associated survival analyses, the expression (RPM) cut point between high and low 928 expression groups for each miRNA was defined using the X-tile method80, where all separation points 929 between patients were considered and the selected cut point was the one that provided the optimal 930 (lowest) EFS log rank p-value. 931
Life Sciences Reporting Summary 932
For additional information on experimental design, methods and reagents, please see the associated “Life 933 Sciences Reporting Summary Report” file. 934
Data Availability 935
Complete details of sample preparation protocols, clinical annotations, and all primary data are available 936 through the TARGET Data Matrix (https://ocg.cancer.gov/programs/target/data-matrix). Sequence data 937 are also accessible through the National Cancer Institute Genomic Data Commons 938 ((https://portal.gdc.cancer.gov/legacy-archive/search/f) or the National Center for Biotechnology 939 Information’s dbGaP (https://www.ncbi.nlm.nih.gov/gap) under accession number phs000218. 940
941
Online Methods References 942
44. Drmanac, R., et al. Human genome sequencing using unchained base reads on self-assembling 943 DNA nanoarrays. Science 327, 78-81 (2010). 944
45. Zhang, J., et al. Germline Mutations in Predisposition Genes in Pediatric Cancer. N Engl J Med 945 373, 2336-2346 (2015). 946
46. Li, H., et al. The Sequence Alignment/Map format and SAMtools. Bioinformatics 25, 2078-2079 947 (2009). 948
47. Cingolani, P., et al. A program for annotating and predicting the effects of single nucleotide 949 polymorphisms, SnpEff: SNPs in the genome of Drosophila melanogaster strain w1118; iso-2; 950 iso-3. Fly (Austin) 6, 80-92 (2012). 951
48. Cingolani, P., et al. Using Drosophila melanogaster as a Model for Genotoxic Chemical 952 Mutational Studies with a New Program, SnpSift. Front Genet 3, 35 (2012). 953
49. Saunders, C.T., et al. Strelka: accurate somatic small-variant calling from sequenced tumor-954 normal sample pairs. Bioinformatics 28, 1811-1817 (2012). 955

50. Ye, K., Schulz, M.H., Long, Q., Apweiler, R. & Ning, Z. Pindel: a pattern growth approach to detect 956 break points of large deletions and medium sized insertions from paired-end short reads. 957 Bioinformatics 25, 2865-2871 (2009). 958
51. Zhou, X., et al. Exploring genomic alteration in pediatric cancer using ProteinPaint. Nat Genet 48, 959 4-6 (2016). 960
52. Lawrence, M.S., et al. Discovery and saturation analysis of cancer genes across 21 tumour types. 961 Nature 505, 495-501 (2014). 962
53. Zhang, Y., Zhou, H., Zhou, J. & Sun, W. Regression Models For Multivariate Count Data. J Comput 963 Graph Stat 26, 1-13 (2017). 964
54. Leiserson, M.D., Wu, H.-T., Vandin, F. & Raphael, B.J. CoMEt: a statistical approach to identify 965 combinations of mutually exclusive alterations in cancer. Genome Biology 16, 160 (2015). 966
55. Shannon, P., et al. Cytoscape: a software environment for integrated models of biomolecular 967 interaction networks. Genome Res 13, 2498-2504 (2003). 968
56. van Borkulo, C.D., et al. A new method for constructing networks from binary data. Sci Rep 4, 969 5918 (2014). 970
57. Zeileis, A. & Grothendieck, G. zoo: S3 Infrastructure for Regular and Irregular Time Series. 2005 971 14, 27 (2005). 972
58. Mayakonda, A. & Koeffler, H.P. Maftools: Efficient analysis, visualization and summarization of 973 MAF files from large-scale cohort based cancer studies. Preprint at https:// 974 www.biorxiv.org/content/early/2016/05/11/052662. 975
59. Miller, C.A., et al. SciClone: inferring clonal architecture and tracking the spatial and temporal 976 patterns of tumor evolution. PLoS Comput Biol 10, e1003665 (2014). 977
60. Friedman, J.H., Hastie, T. & Tibshirani, R. Regularization Paths for Generalized Linear Models via 978 Coordinate Descent. 2010 33, 22 (2010). 979
61. Chun, H.J., et al. Genome-Wide Profiles of Extra-cranial Malignant Rhabdoid Tumors Reveal 980 Heterogeneity and Dysregulated Developmental Pathways. Cancer Cell 29, 394-406 (2016). 981
62. Robertson, G., et al. De novo assembly and analysis of RNA-seq data. Nat Meth 7, 909-912 982 (2010). 983
63. Leek, J.T., Johnson, W.E., Parker, H.S., Jaffe, A.E. & Storey, J.D. The sva package for removing 984 batch effects and other unwanted variation in high-throughput experiments. Bioinformatics 28, 985 882-883 (2012). 986
64. Triche, T.J., Jr., Weisenberger, D.J., Van Den Berg, D., Laird, P.W. & Siegmund, K.D. Low-level 987 processing of Illumina Infinium DNA Methylation BeadArrays. Nucleic Acids Res 41, e90 (2013). 988
65. Aryee, M.J., et al. Minfi: a flexible and comprehensive Bioconductor package for the analysis of 989 Infinium DNA methylation microarrays. Bioinformatics 30, 1363-1369 (2014). 990
66. Fortin, J.P., et al. Functional normalization of 450k methylation array data improves replication 991 in large cancer studies. Genome Biol 15, 503 (2014). 992
67. Lee, D.D. & Seung, H.S. Learning the parts of objects by non-negative matrix factorization. 993 Nature 401, 788-791 (1999). 994
68. Abrahamsson, J., et al. Response-guided induction therapy in pediatric acute myeloid leukemia 995 with excellent remission rate. J Clin Oncol 29, 310-315 (2011). 996
69. Burnett, A.K., et al. Identification of patients with acute myeloblastic leukemia who benefit from 997 the addition of gemtuzumab ozogamicin: results of the MRC AML15 trial. J Clin Oncol 29, 369-998 377 (2011). 999
70. Creutzig, U., et al. Less toxicity by optimizing chemotherapy, but not by addition of granulocyte 1000 colony-stimulating factor in children and adolescents with acute myeloid leukemia: results of 1001 AML-BFM 98. J Clin Oncol 24, 4499-4506 (2006). 1002

71. Creutzig, U., et al. Treatment strategies and long-term results in paediatric patients treated in 1003 four consecutive AML-BFM trials. Leukemia 19, 2030-2042 (2005). 1004
72. Gibson, B.E., et al. Treatment strategy and long-term results in paediatric patients treated in 1005 consecutive UK AML trials. Leukemia 19, 2130-2138 (2005). 1006
73. Kardos, G., et al. Treatment strategy and results in children treated on three Dutch Childhood 1007 Oncology Group acute myeloid leukemia trials. Leukemia 19, 2063-2071 (2005). 1008
74. Perel, Y., et al. Impact of addition of maintenance therapy to intensive induction and 1009 consolidation chemotherapy for childhood acute myeloblastic leukemia: results of a prospective 1010 randomized trial, LAME 89/91. Leucamie Aique Myeloide Enfant. J Clin Oncol 20, 2774-2782 1011 (2002). 1012
75. Pession, A., et al. Results of the AIEOP AML 2002/01 multicenter prospective trial for the 1013 treatment of children with acute myeloid leukemia. Blood 122, 170-178 (2013). 1014
76. Balgobind, B.V., et al. Integrative analysis of type-I and type-II aberrations underscores the 1015 genetic heterogeneity of pediatric acute myeloid leukemia. Haematologica 96, 1478-1487 1016 (2011). 1017
77. Hollink, I.H., et al. NUP98/NSD1 characterizes a novel poor prognostic group in acute myeloid 1018 leukemia with a distinct HOX gene expression pattern. Blood 118, 3645-3656 (2011). 1019
78. Hollink, I.H., et al. Clinical relevance of Wilms tumor 1 gene mutations in childhood acute 1020 myeloid leukemia. Blood 113, 5951-5960 (2009). 1021
79. Hollink, I.H., et al. Favorable prognostic impact of NPM1 gene mutations in childhood acute 1022 myeloid leukemia, with emphasis on cytogenetically normal AML. Leukemia 23, 262-270 (2009). 1023
80. Camp, R.L., Dolled-Filhart, M. & Rimm, D.L. X-tile: a new bio-informatics tool for biomarker 1024 assessment and outcome-based cut-point optimization. Clin Cancer Res 10, 7252-7259 (2004). 1025
1026
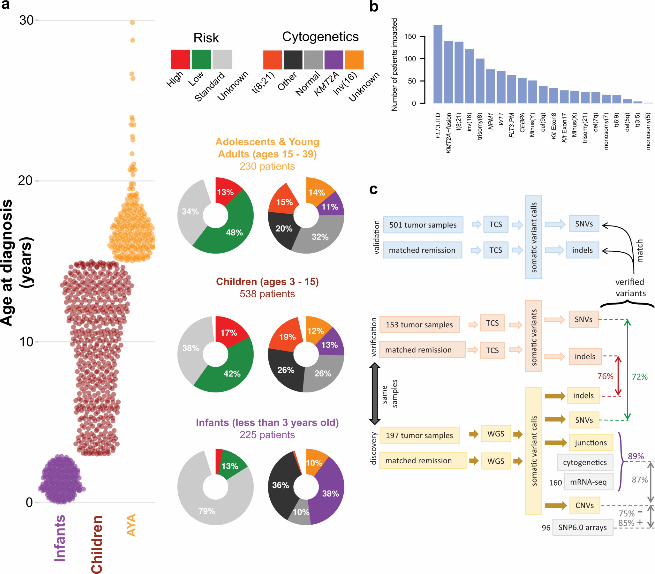

Fusi
on fr
eque
ncy
0%
10%
20%
30%
40%
Infan
ts
Childre
nAYA
Adults
Elderly
a
b
c
CytogeneticsNormalOtherinv(16)t(8;21)ETSNUPGLIS2KMT2A
d
eM
utat
ions
per m
egab
ase
0.1
1
10
100
Frac
tion
of
case
s
0%
100%
50%
75%
25%
Infants(<3)
Children(3-14)
AYA(15-40)
Adults(40+)
Rat
io o
f stru
ctur
al to
mut
atio
nal b
urde
n
1:100
1:3
1:10
1:1
100:1
3:1
10:1
Frac
tion
of s
ampl
es m
utat
ed
Pediatric Adult
KRAS NPM1
p
0.00
0.10
0.20
28/118
43/380
13/174 8/129
p
0.0
0.1
0.2
0.3
0.4
3/118
40/380
32/174
44/129
NR
AS
KIT
KR
AS
WT1
FLT3
.NC
BL
PTP
N11
GAT
A2
AS
XL2
CE
BPA
SE
TD2
MY
CC
SF3
RFL
T3.IT
DIK
ZF1
ETV
6E
ZH2
AS
XL1
FLT3
.CTE
T2TP
53R
UN
X1
IDH
2ID
H1
NP
M1
DN
MT3
A
Frac
tion
of s
ampl
es m
utat
ed
0.0
0.1
0.2
0.3
0.4PediatricAdult
28/1
18
43/3
80
13/1
74
8/12
9
3/11
8 40/3
80 32/1
74
44/1
29
infa
nt
child
AYA
adul
t
infa
nt
child
AYA
adul
t
Num
ber o
f gen
esim
pact
ed
684 tumors with validated variants
junctionchromCNVfocalCNVindelSNVsamples
05
1015
20

0
0.25
0.5
0.75
1
0 2 4 6 8 10
FLT3 ITD with NPM1 (n=27)
FLT3 ITD Negative (n=791)
FLT3 ITD alone (n=72)
FLT3 ITD with WT1 or NUP98-NSD (n=73)
p<0.0010
0.25
0.5
0.75
1
0 2 4 6 8 10
FLT3 ITD with NPM1 (n=28)
FLT3 ITD Negative (n=743)
FLT3 ITD alone (n=67)
FLT3 ITD with WT1 or NUP98-NSD (n=50)
p<0.001
0
0.25
0.5
0.75
1
0 2 4 6 8 10
FLT3 ITD with NPM1 (n=10)
FLT3 ITD Negative (n=505)
FLT3 ITD alone (n=17)
FLT3 ITD with WT1 or NUP98-NSD (n=24)p=0.0020
0.25
0.5
0.75
1
0 2 4 6 8 10
-FLT3 ITD with NPM1 (n=9)
FLT3 ITD Negative (n=255)
FLT3 ITD alone (n=28)
FLT3 ITD with WT1 or NUP98-NSD (n=22)
p<0.001
50 100 150 200 250 300 350 400 450
L18fsG70
A
3GGGGC88
-92GGGC
Y217fs
T231fs
TP231-2
32fs
2 P266fsPP265-2
66fs
D350Y
4 R352fsR35
2GR352*
8 R353fs
R353P
4 RV353-3
54fs
3V35
4fs
2 RVP353-3
55fs
P355fs
P359SAP35
8-359
fs
2 T360fsP35
9fsAPT358-3
60fs
2 L361fsTL36
0-361
I
2 V362I
LV36
1-362
fs
V362fs
5 R363fs5 R363G2 LV
R361-3
63fs
VR362-3
63fs
VAPTLVR35
7-363
fs
T360_
R363>
*
13 S364fs5 S36
4*3 RS363-3
64fs
3 TLVRS36
0-364
fs
LVRS36
1-364
fs
VRS362-3
64fs
5 RSA363-3
65fs
4 A365fsA36
5Vfs
VRSA362-3
65fs
SA364-3
65fs
SASET364-3
68S
SE369-3
70fs
F386fs
Q392fsL39
1fs
2 C406R
C411YF41
5CR41
7fs
2Q44
0*
5R44
1*
K442F
KK44
2fsR441fs
3 R445W2 R44
5LR445P
9 D447N
D447GD44
7EXRSD
3 H448RH44
8N
G458C
2 R481H
R370fs
V370fs
T377fs
3 A382fsS381fs
A381fs
Y402fs
G400_E7splice
G458_E9splice
R462W
H465Y
2G45
8_E9s
plice
G400_
E7splic
e
WT1
a
b c
DCOG
Even
t-Fre
e Su
rviv
al
Years From Study Entry
AAML0531
CCG-2961
TARGET(n=815)
TCGA(n=177)
CEBPADNMT3A
FLT3KRASNRAS
RUNX1TP53WT1
CEBPADNMT3A
FLT3KRASNRAS
RUNX1TP53WT1
CEBPADNMT3A
FLT3KRASNRAS
RUNX1TP53WT1
CEBPADNMT3A
FLT3KRASNRAS
RUNX1TP53WT1
0 20 40Number of patients
InfantC
hildAYA
Adult
clonal subclonal
TARGET

a
c
b
Fraction of
samples1.00.80.60.40.20
Infants Children AYA Adults

a
b
KMT2A
CytogeneticsNormalOtherinv(16)t(8;21)ETSNUPGLIS2KMT2A
NMFsignal
10.80.60.40.20
Statussilencedmutated
CohortTARGETTCGA
IL2RA SFRP5
Exp
ress
ion
asin
h(TP
M)
c
IDH1hypersilencedRUNX1-RUNX1T1 and CBFB-MYH11
Normalizedsilencing rateby group
tota
laf
fect
ed
% methylationcg27131821
% methylationcg17820890
Associations
signature 6signature 5signature 18signature 17signature 25signature 10signature 23signature 24signature16signature 12signature 2signature 28signature 11signature 21signature 7signature 13
FLT3NPM1DNMT3AIDH1/2cohort
Cytogeneticsinv(16)
CEBPAmut
RUNX1mut
complexKMT2A
t(8;21)
FLT3/NPM1
IDHmut
NUP/MECOM
?
Cytogeneticsmutant IDH1/2cohort
302010
0PDGFDPTPRB
CHFRJAG1
AXIN2HLF
THEM4ZNF334ZNF229PRKD1ZNF112
CBR1SMC1B
DLL3CDKN2B
RYR1CIITAHES1WIF1
SFRP5ULBP1
KLF4YAP1THRB
ULBP3DKK1
ULBP2GAS2L3
PCCAALDH2HOPX
IRF1IL2RA
MIR150ZNF254ZNF43SPRY1
ZNF256ZNF44
DNMT3AVAT1
PDGFRBLIF
TET1GPX3
SFRP4DAXXASB2
GSTM1
ZNF254ZNF43ZNF256ZNF44
ULBP3DKK1ULBP2
WIF1SFRP5ULBP1
CDKN2B
ZNF112

Related Documents


