The moderating effects of market orientation and launch proficiency on the product advantage–performance relationship Ming-Hung Hsieh a, ⁎ , Kuen-Hung Tsai b,1 , Jun-Ren Wang c,2 a Department of Business Administration, Shih Chien University, 70 Ta-chi St., Taipei 104, Taiwan b Department of Business Administration, National Taipei University, 151 University Rd., San Shia, Taipei 237, Taiwan c Department of Recreation and Leisure Industry Management, National College of Physical Education and Sports, 250, Wen Hua 1st Rd., Kueishan, Taoyuan County 333, Taiwan Received 17 August 2006; received in revised form 10 March 2007; accepted 14 March 2007 Available online 30 April 2007 Abstract The relationship between product advantage and new product performance has been identified in prior research and cannot be overlooked. However, the moderators between the two constructs have received little attention. This study examines how market orientation and launch proficiency exert contingent influences on the product advantage–performance relationship. Prior research indicates that new product performance is a multi-dimensional concept constituted by different types of performance, yet the way product advantage and its moderators influence certain types of product performance has not been investigated. This study examines the same issues under different dimensions of new product performance. A total of 112 Taiwanese biotechnology firms form the analytical sample. Two interesting findings are revealed. First, product advantage is significantly and positively related to market performance, but has no significant influence on financial performance. Second, market orientation and launch proficiency in tactics indeed moderate the relationship between product advantage and new product performance, either as a whole or in respect to different types of product performance. Obviously, these findings contribute detailed evidence to the theoretical nexus between product advantage and new product performance. © 2007 Elsevier Inc. All rights reserved. Keywords: Market orientation; Launch proficiency; Product advantage; New product performance 1. Introduction Studies in the last decades indicate that product advantage seems to be strongly related to product performance (Atuahene- Gima, 1995; Bonner & Walker, 2004; Henard & Szymanski, 2001; Hultink & Hart, 1998; Nakata, Im, Park, & Ha, 2006). However, the relationship between product advantage and pro- duct performance is not definite. Henard and Szymanski (2001) called for more information on the topic after they conducted a meta-analysis of thirty-five new product performance studies. They concluded that product advantage and other common new product performance predictors do not always conclusively guarantee a positive product introduction. Therefore, the ques- tion of precisely how product advantage influences product performance deserves further study. Following the suggestions of Henard and Szymanski (2001), this study discusses the existence of moderators between product advantage and product performance. The resource-based view (RBV) considers market orientation (Hult, Ketchen, & Slater, 2005) and launch proficiency (Hultink, Griffin, Hart, & Robben, 1997; Langerak, Hultink, & Robben, 2004) to be two important inimitable and unique capabilities which possibly moderate the link between product advantage and new product performance. As noted earlier, several scholars suggest that the market orien- tation of an organization likely influences its level of product advantage (Atuahene-Gima, 1995; Langerak et al., 2004). As a result, organizations in more market-oriented environments may Available online at www.sciencedirect.com Industrial Marketing Management 37 (2008) 580 – 592 ⁎ Corresponding author. Tel.: +886 2 25381111 8934; fax: +886 2 25333143. E-mail addresses: [email protected] (M.-H. Hsieh), [email protected] (K.-H. Tsai), [email protected] (J.-R. Wang). 1 Tel.: +886 2 8674 6568; fax: +886 2 27390615. 2 Tel.: +886 3 3283201x1122,1591; fax: +886 3 3288842. 0019-8501/$ - see front matter © 2007 Elsevier Inc. All rights reserved. doi:10.1016/j.indmarman.2007.03.003

Welcome message from author
This document is posted to help you gain knowledge. Please leave a comment to let me know what you think about it! Share it to your friends and learn new things together.
Transcript

Available online at www.sciencedirect.com
ent 37 (2008) 580–592
Industrial Marketing ManagemThe moderating effects of market orientation and launch proficiency on theproduct advantage–performance relationship
Ming-Hung Hsieh a,⁎, Kuen-Hung Tsai b,1, Jun-Ren Wang c,2
a Department of Business Administration, Shih Chien University, 70 Ta-chi St., Taipei 104, Taiwanb Department of Business Administration, National Taipei University, 151 University Rd., San Shia, Taipei 237, Taiwan
c Department of Recreation and Leisure Industry Management, National College of Physical Education and Sports,250, Wen Hua 1st Rd., Kueishan, Taoyuan County 333, Taiwan
Received 17 August 2006; received in revised form 10 March 2007; accepted 14 March 2007Available online 30 April 2007
Abstract
The relationship between product advantage and new product performance has been identified in prior research and cannot be overlooked.However, the moderators between the two constructs have received little attention. This study examines how market orientation and launchproficiency exert contingent influences on the product advantage–performance relationship. Prior research indicates that new product performanceis a multi-dimensional concept constituted by different types of performance, yet the way product advantage and its moderators influence certaintypes of product performance has not been investigated. This study examines the same issues under different dimensions of new productperformance. A total of 112 Taiwanese biotechnology firms form the analytical sample. Two interesting findings are revealed. First, productadvantage is significantly and positively related to market performance, but has no significant influence on financial performance. Second, marketorientation and launch proficiency in tactics indeed moderate the relationship between product advantage and new product performance, either as awhole or in respect to different types of product performance. Obviously, these findings contribute detailed evidence to the theoretical nexusbetween product advantage and new product performance.© 2007 Elsevier Inc. All rights reserved.
Keywords: Market orientation; Launch proficiency; Product advantage; New product performance
1. Introduction
Studies in the last decades indicate that product advantageseems to be strongly related to product performance (Atuahene-Gima, 1995; Bonner & Walker, 2004; Henard & Szymanski,2001; Hultink & Hart, 1998; Nakata, Im, Park, & Ha, 2006).However, the relationship between product advantage and pro-duct performance is not definite. Henard and Szymanski (2001)called for more information on the topic after they conducted ameta-analysis of thirty-five new product performance studies.
⁎ Corresponding author. Tel.: +886 2 25381111 8934; fax: +886 2 25333143.E-mail addresses: [email protected] (M.-H. Hsieh),
[email protected] (K.-H. Tsai), [email protected](J.-R. Wang).1 Tel.: +886 2 8674 6568; fax: +886 2 27390615.2 Tel.: +886 3 3283201x1122,1591; fax: +886 3 3288842.
0019-8501/$ - see front matter © 2007 Elsevier Inc. All rights reserved.doi:10.1016/j.indmarman.2007.03.003
They concluded that product advantage and other common newproduct performance predictors do not always conclusivelyguarantee a positive product introduction. Therefore, the ques-tion of precisely how product advantage influences productperformance deserves further study.
Following the suggestions of Henard and Szymanski (2001),this study discusses the existence of moderators between productadvantage and product performance. The resource-based view(RBV) considers market orientation (Hult, Ketchen, & Slater,2005) and launch proficiency (Hultink, Griffin, Hart, & Robben,1997; Langerak, Hultink, & Robben, 2004) to be two importantinimitable and unique capabilities which possibly moderate thelink between product advantage and new product performance.As noted earlier, several scholars suggest that the market orien-tation of an organization likely influences its level of productadvantage (Atuahene-Gima, 1995; Langerak et al., 2004). As aresult, organizations in more market-oriented environments may

581M.-H. Hsieh et al. / Industrial Marketing Management 37 (2008) 580–592
be expected to produce better products. This general argumentsuggests that the importance of product advantage vary accordingto market orientation.
This study acknowledges the antecedent role which marketorientation plays as confirmed by previous studies. Based onthese findings, the present study further proposes that the link-age between product advantage and new product performance isalso moderated by an organization's market orientation. Severalfactors lead to this opinion. First, not all firms developingadvantageous products are necessarily market-orientated. Forexample, many Taiwanese high-tech firms pursue an “innova-tive and product-advantage” strategy when launching their newproducts. These firms aim to introduce products with highinnovativeness and compete with rivals by providing above-average products (Hsieh, Tsai, & Hultink, 2006). Second, asstated and confirmed by prior literature, product advantage doesnot always promise new product performance. This study offersthat market orientation is a key to enhance the linkage betweenproduct advantage and new product performance. Third, asnoted by Baker and Sinkula (2005), market orientation is avalue-based strategic philosophy exhibiting itself in behaviorswhich help firms stay close to their consumers. According toresource-based views (RBV), firms equipped with strongmarket orientation have the potential resources of competitiveadvantage (Pelham & Wilson, 1996; Reed & DeFillippi, 1990).Product advantage, on the other hand, is a stock of capabilitiesneeded to actualize the output of a strong market orientation.Therefore, this study complements prior studies by proposingan ideology of fit between capabilities and resources which canenable firms to garner sustainable advantage and excellentproduct performance.
On the other hand, a superior product cannot reach its marketwithout organizational launching proficiencies such as throughplanning, product introduction tactics, market testing, andbudgeting (Gorchels, 2003: 144–149). This study presentsabove two moderating variables to clarify the product advant-age–performance relationship.
Measurements and analyses in previous new product perfor-mance studies have been ambiguous. Even though Griffin andPage (1993, 1996) provided a rich source of new product per-formance measures, prior studies have not clarified which perfor-mance dimensions are related to what types of market orientation.Atuahene-Gima (1995) stated that “scholars must guard againstthe use of highly aggregated new product performance measuresas they may mask the finer details of the influence of marketorientation and hinder the emergence of critical managerialinsights” (p. 287). Based on existing literature, this researchclaims that new product performance should not be considered anentire entity, but should be broken down into smaller, differenttypes of performance when examining the links betweenperformance and performance predictors.
The purpose of this article is twofold. First, the study ex-amines the moderating effects of market orientation and launchproficiency on product advantage and product performanceassociations. Second, this research breaks down new productperformance into more specific dimensions and studies pre-cisely how product advantage and its moderators influence each
aspect of new product performance. This will strengthenfindings from previous studies and compensate shortfalls inthe literature by examining market orientation and launch pro-ficiency. These important factors moderate the link betweenproduct advantage and new product performance in each per-formance dimension and performance overall.
The paper is structured as follows. Section 2 reviews pre-vious literature to summarize the basic ideas, characteristics andfine points of the variables. Section 3 describes the associationsamong the research model suggested, proposes several hypoth-eses to be tested, and explains the methodology utilized toanalyze the asserted suggestions. Section 4 presents statisticalresults and explains their analysis. Finally, Section 5 discussesthe implications of the findings, limitations of the study, andsuggestions for future research.
2. Literature review
2.1. Product advantage
Product advantage is one of the most cited predictors of newproduct performance (Bonner & Walker, 2004; Cooper, Easing-wood, Edgett, Kleinschmidt, & Storey, 1994; Kaleka, 2002;Langerak et al., 2004; Nakata et al., 2006; Song & Parry, 1994).The studies above provide a concrete foundation for the constructof product advantage in various dimensions. For example, Bastic(2004) discovers that product advantage is associated withpermitting customers to perform new tasks, meeting customerneeds, and providing unique features for the customer. Gatignonand Xuereb (1997) and Olson,Walker, and Ruekert (1995) defineproduct advantage as the superiority which certain products haveover competitors' products. Next, Calantone and DiBenedetto(1988) and Langerak et al. (2004) describe product advantage as acertain product's predominance in providing customers withbenefits superior to the benefits that customers get from a com-petitors' new product. Calantone, Chan, and Cui (2006) advocatedifferentiating between new product advantage and productinnovativeness. Their work also provides sound definitions ofthese two constructs after summarizing prior literature. They referto product advantage as “a product's superiority relative to otherproducts in themarketplace on dimensions such as quality, benefitand function (p.410).” Thus, this study defines product advantageas certain product's predominance providing customers' superiorthan competitors' benefits. These benefits are quality, features,technical performance and the capability to satisfy consumerneeds.
Several scholars have contributed to product literature byillustrating the significant relationship between product advan-tage and product performance in various industries (Langeraket al., 2004; Nakata et al., 2006; Robinson, 1990; Song & Parry,1994, 1996). For instance, strong conceptual and empiricalevidence shows that product advantage consistently appears asthe most important product characteristic in explaining theadoption and success of a new product (Montoya-Weiss &Calantone, 1994). Langerak et al. (2004)'s findings also supportthe notion that product advantage has a positive and significantrelationship with new product performance. Finally, Calantone

582 M.-H. Hsieh et al. / Industrial Marketing Management 37 (2008) 580–592
et al. (2006) propose that product advantage is positively relatedto product success. These studies not only prove externalvalidity on the link between product advantage and productperformance, but also support following product-related studies.
2.2. Market orientation
The concept of market orientation has been discussed byFelton (1959) and other scholars for more than 30 years, thoughearly definitions were incomplete (Jaworski & Kohli, 1993).The void was not filled until Narver and Slater (1990) proposedthat market orientation is the extent to which culture is devotedto meeting customer needs. Market orientation comprises threecomponents: customer orientation, competitor orientation, andinterfunctional coordination. The three components of marketorientation collectively form a unique strategic marketing re-source and are vital to the performance of the firms. Scholarswho share the resource-based viewpoint (Hult et al., 2005; Li &Calantone, 1998) confirm this.
Product strategy scholars are increasingly observing theimportance of market orientation and exploring the links be-tween this concept and product performance or success. Authorshave developed several key issues, including an attempt toestablish a holistic model of market orientation and productperformance (Atuahene-Gima, 1995; Calantone, Garcia, &Droge, 2003; Langerak et al., 2004; Voss & Voss, 2000) andwhether or not a proactive or responsive market orientation leadsto superior product performance (Narver, Slater, &MacLachlan,2004). Market orientation, a unique resource suggested by RBV,posits a key direction for new product development studies. Thisis a promising area because product cycle times have beenslashed sharply and firms are constantly in need of advancedmechanisms to develop new and market-accepted products.
2.3. Launch proficiency
Few studies have examined the notion of launch proficiency,and provide only vague descriptions. Atuahene-Gima (1995)'sexploratory study on the impact of market orientation on newproduct performance defines launch proficiency such as pre-launch market testing, formal sales training, front-line personnelundertaken for the launch, and post-launch evaluation. Using 14success factors proposed by Cooper and Kleinschmidt (1993) toobtain information needed to facilitate the development of newproducts, Bastic (2004) defines launch proficiency as market-related activities coupled with market research and pre-testproficiency. Gorchels (2003, 2006) takes a practical viewpointand describes launch proficiency as the combination of all factorsfacilitating the smooth introduction of new products to markets,including sales force training, channel installation, promotionthrough advertising and public relations, and communicationwithcustomers. Langerak et al. (2004) attempt to summarize theprevious study's ideas and define launch proficiency asmarketingcapabilities in four areas: market tests, launch budget, launchstrategy, and launch tactics. Taken together, launch proficiencycovers the full spectrum of launch activities. Since the four-dimensional approach of Langerak et al. (2004) grasps the
concept of launch proficiency most effectively, this study adoptsthe same approach in developing measurement tools.
Empirical evidence of the relationship between launch pro-ficiency, product advantage and performance is barely suffi-cient. In a study of relationships between market orientation,new product advantage, and the launch proficiency of newproducts in 126 Dutch firms, Langerak et al. (2004) prove thatlaunch proficiency plays a relevant role between product ad-vantage and new product performance. Atuahene-Gima (1995)explores the relationship between market orientation, new pro-duct development activities, and performance with a study of275 Australian firms. They show that launch proficiency isrelated to market performance where products are very new tocustomers. Given the lack of pragmatic proof regarding the linkbetween launch proficiency and product performance, the pre-sent study strives to address this gap by including this constructin the research model.
2.4. New product performance
Since this study also focuses on new product performance, aclear definition of terms is required. The notion of new productperformance or success has many dimensions and each may bemeasured in a number of ways. For instance, Cooper andKleinschmidt (1987a,b) identified three dimensions of newproduct performance: financial performance, opportunity win-dow, and market impact. Kleinschmidt and Cooper (1991) usedthe key measures of profitability and success rate to pinpointinvestment in product development. Griffin and Page (1993,1996) conducted a fundamental study on product developmentsuccess and failure measures and summarized five productperformance categories from over 75 published studies of newproduct development measures used by surveyed companies. Thefive categories of new product performance are financial, marketacceptance, timing, quality, and market dimensions. Followingthe notion of Griffin and Page (1993; 1996), Hultink et al. (1997),Hultink and Robben (1999) and Hultink, Hart, Robben, andGriffin (2000) carried out general literature searches and personalinterviews with managers who were responsible for launchingnew products. Their series of studies reveal that twomost adoptedmeasures of new product performance: market and financialoutcome. Since the two categories of new product performancehave been widely employed as measurements in following new-product studies (Atuahene-Gima, 1995; Hultink et al., 1997;Hultink & Hart, 1998; Hultink et al., 2000; Hultink & Robben,1999; Hultink & Langerak, 2002; Langerak et al., 2004), thisstudy uses this definition for later study.
3. Research method
3.1. Conceptual framework and hypotheses
Fig. 1 shows the conceptual framework investigated in thisstudy. This framework indicates that the degree of a newproduct's performance is affected by its product advantage. Theconceptual framework further proposes that product–perfor-mance relationships are moderated by a firm's level of market

Fig. 1. Conceptual framework.
583M.-H. Hsieh et al. / Industrial Marketing Management 37 (2008) 580–592
orientation and launch proficiency. The following sectionsdetail specific hypotheses concerning these relationships, to-gether with their underlying rationale.
3.2. Product advantage and new product performance
Conceptually, product advantage comprises the superiorfeatures, quality, and benefits which customers receive fromtheir products (Calantone & DiBenedetto, 1988; Li & Calantone,1998). As stated above, various studies have confirmed thatproduct advantage is significantly related to new product perfor-mance (Cooper & Kleinschmidt, 1987a; DeBrentani & Cooper,1992; Hultink & Hart, 1998; Langerak et al., 2004; Nakata et al.,2006). For example, Kreuzbauer and Malter (2005) confirm thatfirms which gradually introduce new product features with anincreasing number of present-product elements better facilitateconsumer acceptance of a new product line. Product features andaesthetics catch consumer attention, creating positive emotionalreactions leading to quality appearance (Bloch, 1995), and mostimportantly, increasing sales (Dumaine, 1911; Mitchell, 1999).The studies above show the impacts of feature-oriented productadvantage on product performance in customer acceptance, qual-ity, and even finance. On the other hand, new product quality hasbeen found to strongly influence the market success and prof-itability of a new product (Sethi, 2000). The findings of Tatikondaand Montoya-Weiss (2001) show that operational outcomesaiming at product quality, unit-cost and time-to-market enhancethe achievement of market outcomes. Cooper and Kleinschmidt(1987c) studied 203 new products and found that productsuperiority was the primary factor in new product success orfailure. Of all the items comprising product superiority, the mostimportant was unique customer benefits. Finally, though firmsadopt different measures of new product performance, overallsuccess is determined by financial performance such asprofitability (Kleinschmidt & Cooper, 1991) or rate of returns.In another words, striving to increase new product performancethrough market acceptance, and market share will advance thefinancial side of product performance. Therefore, the firsthypothesis is proposed:
H1. The higher the product advantage, the greater the newproduct performance in (1) market and (2) finance.
3.3. Moderating role of market orientation
The present study contributes to extant literature by pro-posing that market orientation, more than its antecedent rolesuggested in prior studies, is also a pivotal factor in the productadvantage–performance relationship. The underpinning phi-losophy of this theory is derived from resource-based views.As RBV scholars note, activities produce a sustainable com-petitive advantage only if the activities are unique, difficult toachieve and copy, and exhibit a causal ambiguity between theactivities and performance (Reed & Defillippi, 1990). Pelhamand Wilson (1996) further indicate that the cultural norms of afirm conjoining distinct market orientation—such as quickresponse to customer needs—may be difficult to cultivate.Many firms may not easily comprehend the causal relation-ships between performance and certain market-oriented behav-iors, such as interfunctional integration of market information.Hult et al. (2005) also confirm that marketing orientation canbe a unique resource “supporting” the value of comprehensivemarket intelligence and the essentiality of functionallycollaborative action directed at gaining a competitive advan-tage (Day & Wensley, 1988). Kohli and Jaworski (1990) andSlater and Narver (1995) both indicate that market orientationprovides the cultural groundwork for organizational learningthat aids product development knowledge. This consecutivelybecomes the basis for a product's competitive advantage.Therefore, prior studies imply that market orientation offersinsights into organizational culture, helps firms producequality and desirable products, and encourages exceptionalperformance.
From another point of view, advantageous products do notautomatically lead to excellent product performance. A weakrelationship exists between product quality (a key aspect ofproduct advantage) and profitability, as indicated by Pelhamand Wilson's (1996) empirical investigation. These authorssuggest that the quality–profitability relationship is significant-ly influenced by market orientation. The logic underlying thissuggestion is that firms attempting to create quality or advan-tageous products do not necessarily garner new product successunless they also focus on customer needs, align with theircompetitors, and permeate customer–competitor informationthrough product-team members.

584 M.-H. Hsieh et al. / Industrial Marketing Management 37 (2008) 580–592
Different market orientation aspects help superior productsachieve new product performance. For instance, customerorientation averts firms from being blindfolded by pursuingabsolute technical advantage in products (Bowman & Faulkner,1994; Higgins & Shanklin, 1992) and provides a betterunderstanding of its customers (Gatignon & Xuereb, 1997).This subsequently leads to greater customer acceptance andsatisfaction, market shares, and eventually financial perfor-mance. Sethi (2000) also suggested that product quality ispositively related to information integration within a team andcustomer influence in the product development process. Cus-tomer orientation and interfunctional integration both promotetechnical quality in product performance. Competitor orienta-tion helps firms align with their opponents in new productdirections, manufacturing techniques and quality requirements;this in turn refines the products offered and engenders suc-cessful product introduction and sales (Voss & Voss, 2000).Since existing literature proves the supporting or aiding role ofmarket orientation, this study proposes the second hypothesis:
H2. The stronger the market orientation, the greater the rela-tionship between product advantage and new product perfor-mance in (1) market and (2) finance.
3.4. Moderating role of launch proficiency
The third hypothesis predicts that launch proficiency mode-rates the links between product advantage and product perfor-mance. Launch proficiency is also based on the notion of RBV,and is an indispensable tool for introducing new productsto the market. Gorchels (2003) states that superior productscannot succeed in markets without the help of launch profi-ciency. Langerak et al. (2004) prove that product advantageand launch proficiency are positively associated with newproduct performance. As a corollary of the above assertions,well formulated planning and execution of launch activitiesaugment market acceptance, catch excellent timing of productintroduction, and achieve financial performance (Guitinan,1999; Hultink and Robben, 1999). Market testing of target
Table 1Mean, standard deviation, correlation, and square roots of average variances extract
Mean S.D. (1) (2) (3) (
(1) MP 7.86 1.64 0.93(2) FIN 7.55 1.77 0.69 0.83(3) PA 8.17 1.31 0.34 0.34 0.75(4) MOCUS 7.49 1.56 0.64 0.64 0.47(5) MOCOM 7.44 1.62 0.51 0.48 0.35(6) MOINT 8.16 1.35 0.42 0.46 0.42(7) LPBG 7.04 1.99 0.13 0.14 0.08(8)LPMT 7.75 1.63 0.07 0.14 0.10(9)LPLS 8.22 1.33 0.09 0.06 0.03 -(10)LPLT 8.16 1.26 0.53 0.54 0.61
⁎The notations are interpreted as the following and are used in the rest of this study: MMOCOM: market orientation concentrated in competitors; MOINT: market orientProduct advantage; MP: Market performance; FIN: Financial performance; LPBG: LaLaunch proficiency in launch strategies; LPLT: Launch proficiency in launch tactics⁎⁎All correlations above 0.08 are significant at the pb0.05 level. Square roots of A
market physical products and launch tactics ensures that allproducts meet technical specifications and standards, and alsocustomer requirements, which in turns ensures the product'smarket success. Launch budgeting for developing, executing,and monitoring launch strategy and tactics assures the finan-cial success of products (Langerak et al., 2004). Based on theabove considerations, this study proposes that:
H3. The higher the launch proficiency, the stronger the relation-ship between product advantage and new product performancein (1) market and (2) finance.
3.5. Measures
Measures were developed based on scales used in previousliterature relating to the constructs presented in the conceptualframework above. This study first measured the independentvariable, product advantage, using 8 items from the work ofAtuahene-Gima (1995) and Song and Parry (1997). Using ascale anchored from 1 = “most likely” to 10 = “most unlikely,”managers rated the competitive advantage of their products.The dependent variable, new product performance, is a second-order scale further divided into two subcategories: marketperformance and financial performance. The 3 market per-formance items reflect the degree to which customers acceptand are satisfied with new products, and also current marketposition and growth prospects, while the 3 financial perfor-mance items refer to a new product's profitability and returnsof investments. These two sub-measures were based on thestudies of Langerak et al. (2004), Griffin and Page (1993,1996), Hultink et al. (1997), Hultink and Robben (1999), andHultink et al. (2000). Managers rated the levels (1 = “very low”to 10 = “very high”) of various performance indicators relativeto those of the firm's relevant competitors (Hunt & Morgan,1995). The unavailability of objective measure necessitated theuse of subjective measures, and these subjective measures havebeen used in the new product research mentioned above. Togauge market orientation and launch proficiency moderators, thisstudy employed the scales developed by other previous studies.
ed
4) (5) (6) (7) (8) (9) (10)
0.740.52 0.810.56 0.50 0.860.03 0.03 0.14 0.880.14 0.07 0.29 0.50 0.760.00 -0.05 0.13 0.65 0.66 0.820.56 0.44 0.74 0.19 0.26 0.15 0.88
O: market orientation; MOCUS: market orientation concentrated in customers;ation concentrated in interfunctional integration; LP: Launch proficiency; PA:unch proficiency in Budgeting; LPMT: Launch proficiency in market test; LPLS:.verage variances extracted are bold on the diagonal.

3 Taiwan biotechnology industry 2004 was published by the TaiwanEconomic Institute sponsored by the Biotechnological and Pharmaceuticalindustry special task of Economy Bureau of Taiwan. The databook contains awide range of investigation of the subject industries overarching biology withpharmacy, agriculture, food, chemistry, and environmental protection plusservices, and hence provides a solid representation of biotechnological firms inTaiwan.
Table 2Regression of market orientation on the product advantage–total performance relationship
Variables Model 1 Model 2 Model 3 Model 4 Model 5
Intercept 6.07 (13.30)⁎⁎⁎ 3.19 (3.36)⁎⁎⁎ 3.12 (4.52)⁎⁎⁎ 3.60 (4.04)⁎⁎⁎ 3.18 (3.64)⁎⁎⁎
Company age −0.00 (−0.06) 0.00 (0.23) −0.00 (−0.61) −0.00 (−0.33) −0.00 (−0.52)Size 0.26 (2.45)⁎⁎ 0.26 (2.58)⁎⁎ 0.24 (3.25)⁎⁎⁎ 0.18 (1.89)⁎ 0.32 (3.37)⁎⁎⁎
Industry 0.36 (2.23)⁎⁎ 0.28 (1.79)⁎ 0.09 (0.78) 0.20 (1.38) 0.21 (1.43)PA 0.36 (3.41)⁎⁎⁎ 0.43 (5.54)⁎⁎⁎ 0.38 (3.84)⁎⁎⁎ 0.37 (3.77)⁎⁎⁎
PA×MOCUS 0.10 (9.43)⁎⁎⁎
PA×MOCOM 0.04 (4.02)⁎⁎⁎
PA×MOINT 0.06 (4.39)⁎⁎⁎
Adj. R2 0.10 0.19 0.57 0.29 0.31Incremental F-test – 11.63⁎⁎⁎ 88.86⁎⁎⁎ 16.13⁎⁎⁎ 19.26⁎⁎⁎
Note: t values are in parentheses. ⁎⁎pb0.1, ⁎⁎pb0.05, ⁎⁎⁎pb0.01 (two-tailed test). ⁎The notations are used in the rest of this study.
585M.-H. Hsieh et al. / Industrial Marketing Management 37 (2008) 580–592
Gatignon and Xuereb (1997), Lukas and Ferrell (2000), andNarver and Slater (1990) support the fundamental conceptualposition that market orientation is a second-order scale consistingof three subscales reflecting the behavioral components ofcustomer orientation, competitor orientation, and interfunctionalcoordination. Exactly 13 items measure market orientation, andsampled managers rated the status of their firm's market orien-tation practices by answering a 10-point Likert scale ascendingfrom 1 = “absolutely disagree” to 10 = “mostly agree.” Newproduct launch proficiency consists of four scales reflecting pro-ficiency in market testing, launch budgeting, launch strategy, andlaunch tactics. Another 19 items adapted from Langerak et al.(2004) and Gorchels (2006) measure these proficiencies. Firmmanagers rated the launch proficiency of the product teams usinga 10-point Likert scale ranging from “not at all” to “very much.”This study also utilized the following control variables to esti-mate the net effects of product advantage and moderators on newproduct performance: (1) company age, (2) size, and (3) industry(difference). Company age is the number of the years since thecompany was founded. This variable reflects the length of timeavailable to sampled companies to implement market orientationand to accumulate launch proficiency. The number of full-timeemployees gauges the size variable. This study includes size as aproxy of the resources available in the firm to produce superiorproducts and conduct launch campaigns. Industry differencesare controlled because the biotech industry crosses and overlapsseveral different types of businesses. Thus the differences amongindustries may pose an important factor affecting new productperformance.
3.6. Development of question items
A questionnaire was designed based on extensive literaturereview and interviews, and then pretested. In the first phase ofpreparation, different researchers translated and backtranslatedall the English questions. Second, an in-depth interview wasconducted with experts in the targeted industry to validate thecontent of the survey questions. Fourteen industry informants,including CEOs or marketing directors of biotech companies,and top researchers in government-sponsored organizationswere included in a list of interview subjects. Each interviewee
received the questionnaire items before their interview. Duringthe course of consultations, each survey question was dis-cussed and suggestions were solicited to better represent in-dustry norms and practices. The items and relevant previousstudies of each variable are provided in Appendix A.
3.7. Sampling and data collection
Following the suggestions of Atuahene-Gima (1995), thisstudy uses a specific product developed by the firm as the unitof analysis. The analytical sample consisted of Taiwan's bio-technology firms for two reasons. First, the very industry hasbeen such a promising business sector in Taiwan and aroundthe globe (Taiwan Biotech Industry, 2004) that it should not beoverlooked. Second, biotech products are closely related to thehealth of consumers and their environments; thus, consumersare particularly concerned with product quality and benefits.Biotech firms have to focus on producing superior products,but they are probably more interested in pursing market ori-entation to meet customers needs and exercising launch pro-ficiency to successfully introduce their products to consumers.The sample was drawn from 595 biotechnological firmsthrough a convenient sampling method using a sampling frameprovided by the Taiwan biotechnology industry 2004.3 Studysubjects were marketing managers and general managers listedin the databook. Subjects were contacted by telephone to veri-fy their validity status and to solicit survey cooperation. Afterthese phone contacts and removing samples with discontinuedoperations or with inaccurate mailing addresses or phonenumbers, the total study population was reduced to 496 com-panies. To prevent the same source bias or common methodvariance suggested by Podsakoff and Organ (1986) andGuthrie (2001), this study divided the questionnaires into

Table 3Regression of market orientation on the product advantage-market performance relationship
Variables Model 1 Model 2 Model 3 Model 4 Model 5
Intercept 6.24 (13.03)⁎⁎⁎ 3.50 (3.47)⁎⁎⁎ 3.43 (4.27)⁎⁎⁎ 3.88 (4.05)⁎⁎⁎ 3.49 (3.67)⁎⁎⁎
Company age 0.01 (0.43) 0.01 (0.71) 0.00 (0.14) 0.00 (0.23) 0.00 (0.11)Size 0.26 (2.30)⁎⁎ 0.26 (2.40)⁎⁎ 0.24 (2.76)⁎⁎⁎ 0.19 (1.76)⁎ 0.31 (3.00)⁎⁎⁎
Industry 0.32 (1.87)⁎ 0.24 (1.44) 0.06 (0.46) 0.17 (1.05) 0.17 (1.11)PA 0.35 (3.06)⁎⁎⁎ 0.41 (4.52)⁎⁎⁎ 0.36 (3.39)⁎⁎⁎ 0.35 (3.29)⁎⁎⁎
PA×MOCUS 0.09 (7.55)⁎⁎⁎
PA×MOCOM 0.04 (3.52)⁎⁎⁎
PA×MOINT 0.05 (3.60)⁎⁎⁎
Adj. R2 0.09 0.17 0.47 0.25 0.26Incremental F-test – 9.39⁎⁎⁎ 56.96⁎⁎⁎ 12.36⁎⁎⁎ 12.93⁎⁎⁎
586 M.-H. Hsieh et al. / Industrial Marketing Management 37 (2008) 580–592
two parts: the general manager section which focuses onoverall (product) project performance, and the sales managersection which centers on three other dimensions: productadvantage, launch proficiency and market orientation specif-ically related to the very project investigated. The twoquestionnaires4 were simultaneously distributed to the generalmanager of each sampling firm. The general manager filled outone product performance questionnaire regarding a specificproduct developed and launched within recent five years, andhe or she distributed the other questionnaire, containing threeother sections, to an appropriate sales manager responsible forthe identified product project. Only those firms which returnedboth surveys regarding the same product were deemed as validsamples. The survey was conducted in April 2005 and 112valid responses were obtained, achieving a final response rateof 23.99%. Responding general managers were also asked toindicate their age and total years of experience with theircompanies. The means were 42.73 and 8.92 years, respective-ly. This study also conducted an extra extrapolation process toassess non-response bias (Armstrong & Overton, 1977), andno significant differences were found between early and laterespondents.
4. Analyses
This study adopts several statistical techniques to identifythe relationships between market orientation, product advan-tage, launch proficiency, and product performance. This studyfirst employs LISREL to conduct confirmatory factor analysis(CFA) and assess scale reliability and validity. The secondanalytical procedure is hierarchical regression analysis for
4 Although this study distributed two survey questionnaires to each samplingcompany, the two questionnaires are actually two different parts of onequestionnaire. The two questionnaires were simultaneously distributed to thegeneral manager of each sampling firm. The general manager filled out oneproduct performance questionnaire regarding a specific product, and he or shedistributed the other questionnaire containing three other constructs—productadvantage, launch proficiency and market orientation specifically related to thevery same project identified by the general manager—to an appropriate salesmanager responsible for the product project. Only those firms which returnedboth questionnaires regarding the same product project were deemed as validsamples.
hypotheses testing. The hypotheses are examined by enteringcontrol variables in the first step and hypothesized variables infollowing steps. This provides multi-step models illustratingdifferent hypothesis confirmation results.
4.1. Reliability and validity
This study first computes reliability coefficients to exploreand purify the reliability of each scale. Confirmatory factoranalyses then assess the reliability and validity of each modelconstruct. The measurement model was tested by several con-firmatory factor analyses grouping closely related constructs.This study adopted this approach because all the variablemeasures could not be enclosed in a single model withoutcompromising the widely accepted five-to-one sample size toparameter ratio (Atuahene-Gima, Li, & DeLuca, 2006).Appendix A shows that each of the 46 indicators loadedsignificantly on its intended factor, and the average varianceextracted (AVE) from the indicators of each construct exceeded0.5, which supports convergent validity among the items ofeach scale (Bagozzi, Yi, & Phillips, 1991). Following theprocedure suggested by Fornell and Larcker (1981), theconstructs are proved reliable because the composite reliabilitiesexceed the recommended minimum of 0.70. The discriminantvalidity was assessed by comparing each potential pair of latentconstructs one another in a series of two-factor CFA modelanalyses: one constraining the correlation between the latentvariables to 1 and the other freeing the parameter. Since all thechi-square differences between the constraining model and thefree model of each construct dimension are above the criticalvalue of 3.84 (Bagozzi & Youjae, 1988), the discriminantvalidity of the scale presents.
Table 1 reports measurement analysis results, includingmeans, standard deviations and correlations. As revealed inTable 1, the square roots of the average variance extracted foreach construct are greater than the off-diagonal correlationcoefficients between two constructs, which presents anotherproof of discriminant validity (Hulland, 1999). Multicollinear-ity concerns arise due to high correlation coefficients betweenthe main effects explanatory variables (i.e., product advantage)and the product of moderators and main effects (i.e., customerorientation × product advantage) and the cross products orinteraction items (i.e., customer orientation). The “residual
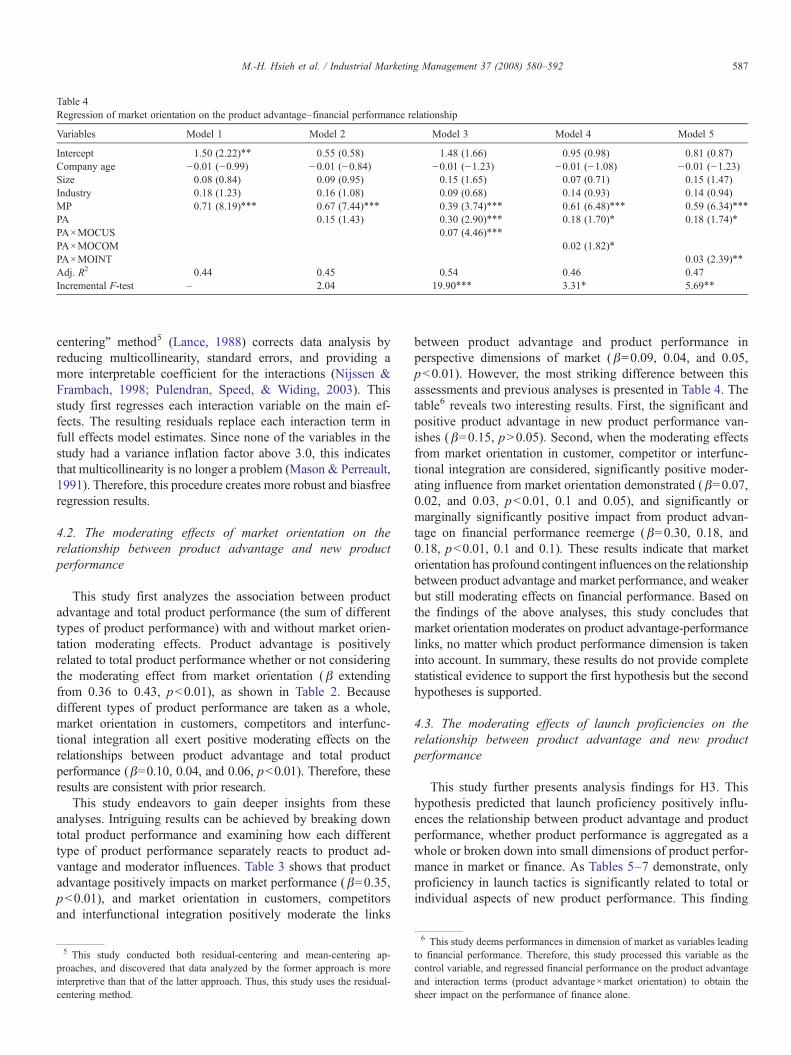
Table 4Regression of market orientation on the product advantage–financial performance relationship
Variables Model 1 Model 2 Model 3 Model 4 Model 5
Intercept 1.50 (2.22)⁎⁎ 0.55 (0.58) 1.48 (1.66) 0.95 (0.98) 0.81 (0.87)Company age −0.01 (−0.99) −0.01 (−0.84) −0.01 (−1.23) −0.01 (−1.08) −0.01 (−1.23)Size 0.08 (0.84) 0.09 (0.95) 0.15 (1.65) 0.07 (0.71) 0.15 (1.47)Industry 0.18 (1.23) 0.16 (1.08) 0.09 (0.68) 0.14 (0.93) 0.14 (0.94)MP 0.71 (8.19)⁎⁎⁎ 0.67 (7.44)⁎⁎⁎ 0.39 (3.74)⁎⁎⁎ 0.61 (6.48)⁎⁎⁎ 0.59 (6.34)⁎⁎⁎
PA 0.15 (1.43) 0.30 (2.90)⁎⁎⁎ 0.18 (1.70)⁎ 0.18 (1.74)⁎
PA×MOCUS 0.07 (4.46)⁎⁎⁎
PA×MOCOM 0.02 (1.82)⁎
PA×MOINT 0.03 (2.39)⁎⁎
Adj. R2 0.44 0.45 0.54 0.46 0.47Incremental F-test – 2.04 19.90⁎⁎⁎ 3.31⁎ 5.69⁎⁎
587M.-H. Hsieh et al. / Industrial Marketing Management 37 (2008) 580–592
centering” method5 (Lance, 1988) corrects data analysis byreducing multicollinearity, standard errors, and providing amore interpretable coefficient for the interactions (Nijssen &Frambach, 1998; Pulendran, Speed, & Widing, 2003). Thisstudy first regresses each interaction variable on the main ef-fects. The resulting residuals replace each interaction term infull effects model estimates. Since none of the variables in thestudy had a variance inflation factor above 3.0, this indicatesthat multicollinearity is no longer a problem (Mason & Perreault,1991). Therefore, this procedure creates more robust and biasfreeregression results.
4.2. The moderating effects of market orientation on therelationship between product advantage and new productperformance
This study first analyzes the association between productadvantage and total product performance (the sum of differenttypes of product performance) with and without market orien-tation moderating effects. Product advantage is positivelyrelated to total product performance whether or not consideringthe moderating effect from market orientation ( β extendingfrom 0.36 to 0.43, pb0.01), as shown in Table 2. Becausedifferent types of product performance are taken as a whole,market orientation in customers, competitors and interfunc-tional integration all exert positive moderating effects on therelationships between product advantage and total productperformance (β=0.10, 0.04, and 0.06, pb0.01). Therefore, theseresults are consistent with prior research.
This study endeavors to gain deeper insights from theseanalyses. Intriguing results can be achieved by breaking downtotal product performance and examining how each differenttype of product performance separately reacts to product ad-vantage and moderator influences. Table 3 shows that productadvantage positively impacts on market performance ( β=0.35,pb0.01), and market orientation in customers, competitorsand interfunctional integration positively moderate the links
5 This study conducted both residual-centering and mean-centering ap-proaches, and discovered that data analyzed by the former approach is moreinterpretive than that of the latter approach. Thus, this study uses the residual-centering method.
between product advantage and product performance inperspective dimensions of market ( β=0.09, 0.04, and 0.05,pb0.01). However, the most striking difference between thisassessments and previous analyses is presented in Table 4. Thetable6 reveals two interesting results. First, the significant andpositive product advantage in new product performance van-ishes ( β=0.15, pN0.05). Second, when the moderating effectsfrom market orientation in customer, competitor or interfunc-tional integration are considered, significantly positive moder-ating influence from market orientation demonstrated ( β=0.07,0.02, and 0.03, pb0.01, 0.1 and 0.05), and significantly ormarginally significantly positive impact from product advan-tage on financial performance reemerge ( β=0.30, 0.18, and0.18, pb0.01, 0.1 and 0.1). These results indicate that marketorientation has profound contingent influences on the relationshipbetween product advantage and market performance, and weakerbut still moderating effects on financial performance. Based onthe findings of the above analyses, this study concludes thatmarket orientation moderates on product advantage-performancelinks, no matter which product performance dimension is takeninto account. In summary, these results do not provide completestatistical evidence to support the first hypothesis but the secondhypotheses is supported.
4.3. The moderating effects of launch proficiencies on therelationship between product advantage and new productperformance
This study further presents analysis findings for H3. Thishypothesis predicted that launch proficiency positively influ-ences the relationship between product advantage and productperformance, whether product performance is aggregated as awhole or broken down into small dimensions of product perfor-mance in market or finance. As Tables 5–7 demonstrate, onlyproficiency in launch tactics is significantly related to total orindividual aspects of new product performance. This finding
6 This study deems performances in dimension of market as variables leadingto financial performance. Therefore, this study processed this variable as thecontrol variable, and regressed financial performance on the product advantageand interaction terms (product advantage×market orientation) to obtain thesheer impact on the performance of finance alone.

Table 5Regression of launch proficiency on the product advantage–total performance relationship
Variables Model 1 Model 2 Model 3 Model 4 Model 5 Model 6
Intercept 7.22 (13.52)⁎⁎⁎ 4.52 (4.43)⁎⁎⁎ 4.51 (4.40)⁎⁎⁎ 4.47 (4.35)⁎⁎⁎ 4.49 (4.40)⁎⁎⁎ 4.18 (4.60)⁎⁎⁎
Company age 0.02 (2.18)⁎⁎ 0.02 (2.06)⁎⁎ 0.02 (2.07)⁎⁎ 0.02 (2.02)⁎⁎ 0.02 (2.06)⁎⁎ 0.02 (2.03)⁎⁎
Size 0.05 (0.40) 0.04 (0.38) 0.04 (0.36) 0.05 (0.41) 0.05 (0.41) 0.04 (0.38)Industry −0.08 (−0.84) −0.12(−1.38) −0.12(−1.29) −0.12(−1.38) −0.12(−1.39) −0.10(−1.20)PA 0.36(3.06)⁎⁎⁎ 0.36(3.05)⁎⁎⁎ 0.36(3.08)⁎⁎⁎ 0.36(3.07)⁎⁎⁎ 0.40(3.82)⁎⁎⁎
PA×LPBG 0.01(0.61)PA×LPMT 0.01(0.58)PA×LPLS 0.01(0.78)PA × LPLT 0.09(4.83)⁎⁎⁎
Adj. R2 0.04 0.13 0.12 0.12 0.12 0.31Incremental F-test – 9.37⁎⁎⁎ 0.37 0.34 0.60 23.30⁎⁎⁎
588 M.-H. Hsieh et al. / Industrial Marketing Management 37 (2008) 580–592
echoes the results of Langerak et al. (2004). Much like themoderating effects of market orientation, proficiency in launchtactics positively moderates the links between product advan-tage and product performance in total (shown in Table 5,β=0.09, pb0.01), and in market dimensions (shown in Table 6,β=0.08, pb0.01). As Table 7 indicates, launch tactics pro-ficiency exerts a weak moderating effect ( β=0.04, pb0.1) onfinancial performance. Therefore, H3 is partially supportedbecause only launch tactics proficiency positively moderatesthe association between product advantage and new productperformance.
5. Conclusion
5.1. Summary and implications
This article presents a conceptual case and empirical evi-dence which support and advance the efforts of prior authors.Echoing previous findings, product advantage positively im-pacts new product performance in total. However, this studyfurther assesses the influence of product advantage on respec-tive dimensions of new product performance. Unlike previousarguments, this study finds that product advantage does notimpact each part of new product performance equally. Productadvantage has a positive impact on market performance but hasa slightly weaker influence on financial performance. On theother hand, market orientation and launch proficiency moderatethe relationship between product advantage and new productperformance as a whole and on various dimensions.
Table 6Regression of launch proficiency on the product advantage-market performance rela
Variables Model 1 Model 2 Model 3
Intercept 7.58(13.68)⁎⁎⁎ 4.99(4.68)⁎⁎⁎ 4.98(4.6Company Age 0.02(2.25)⁎⁎ 0.02(2.14)⁎⁎ 0.02(2.1Size 0.02 (0.13) 0.01 (0.10) 0.01 (0.Industry −0.09 (−0.97) −0.14 (−1.47) −0.13 (−PA 0.34 (2.81)⁎⁎⁎ 0.34 (2.PA×LPBG 0.01 (0.PA×LPMTPA×LPLSPA×LPLTAdj. R2 0.04 0.11 0.11Incremental F-test – 7.88⁎⁎⁎ 0.36
The first implication pertains to the contrast between thefindings of this study and prior literature. Extensive findingsinform the business community that product advantage is posi-tively related to new product performance, and managers shouldstrive to increase a new product's competitive advantage tomaximize its performance. Within this theoretical and empiricalperspective, however, some conflicting results emerge. Thiscalls for answers as several meta-studies show that the cor-relation coefficients between product advantage and productperformance have randomly changed from negative to positive(Henard & Szymanski, 2001; Montoya-Weiss & Calantone,1994). The findings of the present study complement existingliterature by showing that the above mentioned inconsistenciesmay result from not taking key moderators into account andinsufficiently analyzing variable details (i.e., new product per-formance). This study aims to include two frequently neglectedareas in future investigations to increase the explanatory powerof product advantage and performance studies.
From another perspective, the findings offer anothermanagerial insight. Market orientation has positive contingenteffects on the association between product advantage and newproduct performance. Thus firms with manufacturing capabilityand skill in producing superior products should particularlyemphasize the cultivation of firm-wide market orientation tostimulate product performance.
Especially in the biotech industry investigated in this study, theprimary challenge for firms requires tremendous investment in Rand D, great risks of development failure, and long cost recoveryperiods. According to Ernst & Young (2004), drug development
tionship
Model 4 Model 5 Model 6
5)⁎⁎⁎ 4.99(4.63)⁎⁎⁎ 4.96(4.65)⁎⁎⁎ 4.67(4.80)⁎⁎⁎
5)⁎⁎ 0.02(2.12)⁎⁎ 0.02(2.15)⁎⁎ 0.02(2.10)⁎⁎
08) 0.01 (0.10) 0.02 (0.14) 0.01 (0.07)1.38) −0.14 (−1.46) −0.14 (−1.48) −0.11 (−1.30)80)⁎⁎⁎ 0.34 (2.79)⁎⁎⁎ 0.35 (2.82)⁎⁎⁎ 0.38 (3.42)⁎⁎⁎
60)0.00 (0.03)
0.01 (0.90)0.08 (4.32)⁎⁎⁎
0.10 0.11 0.270.00 0.81 18.69⁎⁎⁎

Table 7Regression of launch proficiency on the product advantage–financial performance relationship
Variables Model 1 Model 2 Model 3 Model 4 Model 5 Model 6
Intercept 1.20 (1.48)⁎⁎⁎ 0.48 (0.47) 0.48 (0.47) 0.39 (0.38) 0.48 (0.47) 0.75 (0.74)Company age 0.00 (0.31)⁎⁎ 0.00 (0.31) 0.00 (0.32) 0.00 (0.25) 0.00 (0.30) 0.00 (0.40)Size 0.07 (0.66) 0.07 (0.65) 0.07 (0.64) 0.07 (0.73) 0.07 (0.64) 0.07 (0.65)Industry 0.01 (0.10) −0.01 (−0.14) −0.01 (−0.12) −0.01 (−0.14) −0.01 (−0.14) −0.01 (−0.14)MP 0.75 (8.42)⁎⁎⁎ 0.72 (7.73)⁎⁎⁎ 0.71 (7.66)⁎⁎⁎ 0.71 (7.76)⁎⁎⁎ 0.72 (7.66)⁎⁎⁎ 0.63 (6.28)⁎⁎⁎
PA 0.13 (1.17) 0.13 (1.17) 0.14 (1.26) 0.13 (1.16) 0.17 (1.58)PA×LPBG 0.00 (0.16)PA×LPMT 0.01 (1.25)PA×LPLS −0.00 (−0.06)PA×LPLT 0.04 (1.94)⁎
Adj. R2 0.46 0.46 0.46 0.47 0.46 0.48Incremental F−test – 1.37 0.03 1.56 0.00 3.76⁎
7 This study acknowledges comments provided by anonymous reviewersregarding this research limitation.
589M.-H. Hsieh et al. / Industrial Marketing Management 37 (2008) 580–592
times have increased from eleven years during the 1980's toapproximately fifteen years at present. R and D costs also in-creased from 230 million to 800 million. Only three tenths ofdrugs can justify the costs, time andR andD resources required fortheir development (Ernst & Young, 2004). Therefore, it iscommon for firms in this industry to endure long deficit periods.The findings of this study logically indicate thatmarket orientationinfluences the link between product advantage and marketperformance, as well as, product advantage and financial per-formance. In particular, market orientation helps shape firm's newproduct strategy and transforms market-accepted new products tofinancially successful ones. For instance, through the help ofcustomer orientation, firms differentiate “what customers reallyneed” and “what customers like to have”, and thus may gainprofits by trimming costly and unnecessary product developmentand investment. This implication cautions managers not only topursue the technical advantage of their products, but also to adoptmarket orientation as a vital catalyst for omni-dimensional productperformance. For enterprises that have relatively scarce resourcesand rely on few new products to survive cannot afford investmentsconcentrating on unsuitable technical strategies focusing only onproduct advantage which never achieves the product performance(i.e. financial growth) that firms desperately need.
However, according to empirical findings of market orien-tation in the studies of the 1990s, observers have also detectedsome possible negative effects of being market orientated(Narver et al., 2004). According to Christensen and Bower(1996), firms lose their position of industry leadership becausethey listen too carefully to their customers. This is especially truein the biotech business, where customers usually do not knowwhat they want, and responding to customers' wishes too closelymay jeopardize a firm's innovativeness and opportunities tograsp new technology. Therefore, Narver et al. (2004) suggestthat a “proactive” market orientation is necessary, in which abusiness attempts to discover the latent needs of its customers.
A third implication of this study is that proficiency in launchtactics is a positive booster in the relationship between productadvantage and product performance in total, and individualdimensions. Although not empirically supported in this study,launch strategies, market testing, and budgeting are all crucialcompetencies (Hsieh et al., 2006; Hultink et al., 2000; Langeraket al., 2004) contributing to product success. They should never
be overlooked by mangers pursing a product's market accep-tance and financial success.
5.2. Research limitations and future study
The results of this study should be viewed in the context of itslimitations and could also be developed in future research. First,this study chose a Taiwanese industry with heavy investment costsand an inability to prove its financial product performance, whereeven market orientation can positively impact other aspects ofproduct performance (i.e., market share and acceptance). Verifyingthe study results with more product varieties or different industriesfrom multiple countries is a valuable opportunity for futureresearch and a potential increase in external validity. Second, thisstudy models moderators and their effects on the relationshipbetween product advantage and new product performance withcross-sectional data; nevertheless, more variables can be taken intoaccount. For example, potential moderators, such as organizationalfactors and functional power (Atuahene-Gima, Slater, & Olson,2005), potential predictors like market place, strategy, and productcharacteristics (Henard & Szymanski, 2001), and contextualturbulence and competition on new product success (Narver &Slater, 1990) should be studied. Third7, the study employssubjective measures in gauging market and financial performance.These measures only catch the current performance of a firm andnot so much the future performance, and hence lack a forward-looking view. To address this specific limitation, this study sug-gests that adding longitudinal data of forward looking indicatorssuch as growth perspective, along with consistent time-seriesanalysis, will strengthen the model proposed in the present study.Also, the data this study analyzed was collectively gathered frombiotech firm personnel. Since new product performance measure-ment involves market acceptance, it may require the input ofcustomers. Due to difficulties in approaching customers directly,this study indirectly acquired customer data by samplingmarketing managers. This creates a fourth limitation in this inves-tigation. Future studies should gather information by establishingdirect contact with product customers. Lastly, this study has

Appendix A (continued )
Construct and source Operational measuresof construct
Factoranalysisloading
t-value
590 M.-H. Hsieh et al. / Industrial Marketing Management 37 (2008) 580–592
completed its mission of pinpointing significant positive mod-erators on the link between product advantage and product perfor-mance. These moderators include market orientation and launchproficiency. However, which factors exercise totally negativecontingent influence is not known. This poses an intriguing ques-tion awaiting future exploration.
Appendix A. Confirmatory factor analysis results
Construct and source
Operational measuresof constructFactoranalysisloading
t-value
Product advantagea
(Atuahene-Gima, 1995;Langerak et al., 2004;Song & Parry, 1997)α=0.92, CR=0.92,AVE=0.57
Model fit indices: χ2=31.46;df=16; RMSEA=0.08;GFI=0.98; NNFI=0.96;CFI=0.98 Please use thefollowing scale to indicateyour extent of agreementabout how well each ofthe following statementsis an accurate descriptionof the new product that yourfirm most recently introducedin the market place.
•The new product offeredunique benefits for customers.0.68
8.10•The new product providedhigher quality thancompeting products.
0.82
10.53•The new product solvedproblems for customers.
0.89
11.55•The new product washighly innovative.
0.62
7.20•The new product replacedinferior products.
0.90
11.72•The new product wasradically different fromcompetitor products.
0.81
10.24•The new product wassuperior to competingproducts.
0.70
8.44•The new product offeredsolutions not possiblewith existing products.
0.70
8.41Market orientationa
(Narver & Slater, 1990;Langerak et al., 2004;Li & Calantone, 1998)
Model fit indices: χ2=80.23;df=58;RMSEA=0.058;GFI=0.90; NNFI=0.97;CFI=0.97
Please use the following scaleto indicate your extent ofagreement about how welleach of the followingstatements is an accuratedescription of your firm.Customer orientationα=0.87, CR=0.86AVE=0.55
•Our firm gathers informationabout customers' needs.
0.71
8.01•Our firm has insight intothe buying processof customers.
0.63
6.89•Our firm consultscustomers to improvethe quality of service.
0.69
7.65(continued on next page)
•Our firm involvescustomers in decisionsthat affect the relationship.
0.82
9.84Customer orientationα=0.87, CR=0.86AVE=0.55
•Our firm looks for waysto offer customers more value
0.84
10.09Competitor orientationα=0.90, CR=0.91AVE=0.65
•Our firm knows whethercompetitors are opento complaints by customers.
0.76
9.22•Our firm knows whycustomers continue buyingfrom competitors.
0.88
11.48•Our firm knows whethercustomers buying fromcompetitors are satisfied.
0.79
9.61•Our firm knows howcompetitors maintainrelationships with customers.
0.90
11.92•Our firm monitors customersbuying from competitors.
0.68
7.78Interfunctionalcoordinationα=81, CR=0.86AVE=0.73
•Our firm's departmentsare collectively awareof the importance of therelationship with customers.
0.99
8.85•Our firm's departmentsjointly satisfy customers'needs.
0.61
5.92•Our firm's departmentscoordinate their activitiesaimed at customers.
0.92
7.77Launch proficiencyb
Model fit indices: χ2=129.04;df=112; RMSEA=0.027;GFI=0.90; NNFI=0.99;CFI=0.99(Gorchels, 2003, 2006;Langerak et al., 2004)
The following activities arefrequently part of a newproduct development process.During the development ofthe new product that youselected, how well was eachof the following activitiesundertaken?
Market testα=0.91, CR=0.87AVE=0.57
•Selecting customers fortesting market acceptance.
0.73
8.91•Submitting the product tocustomers for in-use testing.
0.69
8.25•Submitting the product toemployees for in-use testing.
0.84
9.76•Submitting the marketingprogram to customersfor testing.
0.93
12.60•Interpreting results frommarket testing program.
0.87
11.10Launch budgetingα=0.93, CR=0.91AVE=0.78
•Determining advertisingexpenditures.
0.88
10.87•Determining distributionexpenditures.
0.86
10.67•Determining launch budget.
0.95 12.14 Launch strategyα=0.93, CR=0.93AVE=0.68•Segmenting the market.
0.78 9.69 •Selecting target customergroups.0.78
10.14•Selecting the new product'spositioning
0.81
10.18•Determining launchobjectives.
0.83
10.60
Construct and source Operational measuresof construct
Factoranalysisloading
t-value
Appendix A (continued )
591M.-H. Hsieh et al. / Industrial Marketing Management 37 (2008) 580–592
Launch strategyα=0.93, CR=0.93AVE=0.68
•Formulating thegrowth strategy.
0.87
11.41•Establishing standards tojudge new product'sperformance and marketacceptance
0.84
11.10Launch tacticsα=0.89, CR=0.90AVE=0.78
•Selecting channels ofdistribution.
0.75
9.03•Determining the newproduct's price.
0.80
10.09•Designing marketingcommunication mix.
0.89
11.79•Designing product mix.
0.85 10.82 •Determining the role ofsales force in launch.0.69
8.58Product performancec
(Griffin and Page, 1993,1996; Langerak et al.,2004)
Model fit indices: χ2=2.96;df=7; RMSEA=0.02;GFI=0.99; NNFI=0.99;CFI=0.95
Please use the following scaleto indicate your extent ofagreement about how wellthe new product you selectedhas performed on each of theperformance indicatorsmentioned below.Market α=0.89, CR=0.95AVE=0.86
•Met unit volume goals
0.90 12.18 •Met market share goals 0.95 13.37 •Met sales growth goals. 0.94 13.05Finance α=0.88, CR=0.87AVE=0.69
•ROI or IRR
0.91 12.11 •Met profitability goals 0.72 8.57 •Met contribution margingoals0.86
11.03Scale of product advantage, market orientation, and launch proficienciesquestions are filled out by sales managers; the product performance scalequestions are filled out by general managers.Scale Format:a1 = strongly disagree, 10 = strongly agree.b1 = done very poorly or mistakenly omitted altogether, 10 = done excellently,and numbers between 1 and 10 indicate various degrees of proficiency.c1 = very poor and 10 = very good.
References
Armstrong, J. S., & Overton, T. S. (1977). Estimating nonresponse bias in mailsurveys. Journal of Marketing Research, 14(3), 396−402.
Atuahene-Gima, K. (1995). An exploratory analysis of the impact of marketorientation on new product performance: A contingency approach. Journalof Product Innovation Management, 12(4), 275−295.
Atuahene-Gima, K., Slater, S. F., & Olson, E. M. (2005). The contingent valueof responsive and proactive market orientations for new product programperformance. Journal of Product Innovation Management, 22(6), 464−482.
Atuahene-Gima, K., Li, H., & De Luca, L. M. (2006). The contingent valueof marketing strategy innovativeness for product development performance inChinese new technology ventures. Industrial Marketing Management, 35(3),359−372.
Bagozzi, R. P., Yi, Y., & Phillips, L. W. (1991). Assessing construct validity inorganizational research. Administrative Science Quarterly, 36(3), 421−458.
Bagozzi, R. P., & Youjae, Y. (1988). On the evaluation of structural equationmodels. Journal of Academy of Marketing Science, 16(1), 74−94.
Baker, W. E., & Sinkula, J. M. (2005). Market orientation and the new productparadox. Journal of Product Innovation Management, 22(6), 483−502.
Bastic, M. (2004). Success factors in transition countries. European Journal ofInnovation Management, 7(1), 65−79.
Bloch, P. H. (1995). Seeking the ideal form: Product design and consumerresponse. Journal of Marketing, 59(3), 16−30.
Bonner, J. M., & Walker, O. C. J. (2004). Selecting influential business-to-business customers in new product development: Relational embeddednessand knowledge heterogeneity considerations. Journal of Product InnovationManagement, 21(3), 155−169.
Bowman, C., & Faulkner, D. (1994). Measuring product advantage usingcompetitive benchmarking and customer perceptions. Long Range Plan-ning, 27(1), 119−134.
Calantone, R. J., Chan, K., & Cui, A. S. (2006). Decomposing productinnovativeness and its effects on new product success. Journal of ProductInnovation Management, 23(5), 408−421.
Calantone, R. J., & DiBenedetto, C. A. (1988). An integrative model of the newproduct development process: An empirical validation. Journal of ProductInnovation Management, 5(3), 201−215.
Calantone, R., Garcia, R., & Droge, C. (2003). The effects of environmentalturbulence on new product development strategy planning. Journal ofProduct Innovation Management, 20(2), 90−103.
Christensen, C. M., & Bower, J. L. (1996). Customer power, strategicinvestment, and the failure of leading firms. Strategic Management Journal,17(3), 197−219.
Cooper, R. G., & Kleinschmidt, E. J. (1987). Success factors in productinnovation. Industrial Marketing Management, 16(3), 215−225.
Cooper, R. G., & Kleinschmidt, E. J. (1987). What makes a new product a winner:Success factors at the project level. R & D Management, 17(3), 175−191.
Cooper, R. G., & Kleinschmidt, E. J. (1987). New products: What separateswinners from losers? Journal of Product Innovation Management, 4(3),169−184.
Cooper, R. G., & Kleinschmidt, E. J. (1993). Major new products: Whatdistinguishes the winners in the chemical industry? Journal of ProductInnovation Management, 10(2), 90−111.
Cooper, R. G., Easingwood, C. J., Edgett, S., Kleinschmidt, E. J., & Storey, C.(1994). What distinguishes the top performing new products in financialservices? Journal of Product Innovation Management, 11(4), 281−299.
Day, G. S., & Wensley, R. (1988). Assessing advantage: A framework fordiagnosing competitive superiority. Journal of Marketing, 52(2), 1−22.
DeBrentani, U., & Cooper, R. G. (1992). Developing successful new financialservices for businesses. Industrial Marketing Management, 21(3), 231−243.
Dumaine, B. (1911, March 11). Design that sells and sells and ... Fortune,86−94.
Ernst & Young (2004). Beyond borders biotechnology report 2004: Ernst &Young Inc.
Felton, A. P. (1959). Making the marketing concept work. Harvard BusinessReview, 37(4), 55−65.
Fornell, C., & Larcker, D. F. (1981). Evaluating structural equation models withunobservable variables and measurement error. Journal of MarketingResearch, 18(1), 39−50.
Gatignon, H., & Xuereb, J. -M. (1997). Strategic orientation of the firm newproduct performance. Journal of Marketing Research, 34(1), 77−92.
Gorchels, L. (2003). The product manager's field guide: Practical tools,exercise, and resources for improved product management. New York:McGraw-Hill.
Gorchels, L. (2006). The product manager's handbook. New York: McGraw-Hill.Griffin, A., & Page, A. L. (1993). An interim report on measuring product
development success and failure. Journal of Product Innovation Manage-ment, 10(4), 291−310.
Griffin, A., & Page, A. L. (1996). PDMA success measurement project:Recommended measures for product development success and failure.Journal of Product Innovation Management, 13(6), 478−498.
Guitinan, J. P. (1999). Launch strategy, launch tactics, and demand outcomes.Journal of Product Innovation Management, 16(6), 509−529.
Guthrie, J. P. (2001). High-involvement work practices, turnover, andproductivity: Evidence from New Zealand. Academy of ManagementJournal, 44(1), 180−192.

592 M.-H. Hsieh et al. / Industrial Marketing Management 37 (2008) 580–592
Henard, D. H., & Szymanski, D. M. (2001). Why some new products are moresuccessful than others. Journal of Marketing Research, 38(3), 362−377.
Higgins, S. H., & Shanklin, W. L. (1992). Seeking mass market acceptance forhigh-technology consumer. Journal of Consumer Marketing, 9(1), 5−14.
Hsieh, M. H., Tsai, K. H., & Hultink, E. J. (2006). The relationships betweenresource configurations and launch strategies in Taiwan's IC designindustry: An exploratory study. Journal of Product Innovation Management,23(3), 259−273.
Hult, G. T. M., Ketchen, D. J., & Slater, S. F. (2005). Market orientation andperformance: An integration of disparate approaches. Strategic ManagementJournal, 26(12), 1173−1181.
Hultink, E. J., Griffin, A., Hart, S., & Robben, S. J. H. (1997). Industrial newproduct launch strategies and product development performance. Journal ofProduct Innovation Management, 14(4), 243−254.
Hultink, E. J., & Hart, S. (1998). The world's path to the better mousetrap: Mythor reality? An empirical investigation into the launch strategies of high andlow advantage new products. European Journal of Innovation Management,1(3), 106−122.
Hultink, E. J., Hart, S., Robben, S. J.H.,&Griffin, A. (2000). Launch decisions andnew product success: An empirical comparison of consumer and industrialproducts. Journal of Product Innovation Management, 17(1), 5−23.
Hultink, E. J., & Langerak, F. (2002). Launch decisions and competitivereactions: An exploratory market signaling study. Journal of ProductInnovation Management, 19(3), 199−212.
Hultink, E. J., & Robben, S. J. H. (1999). Launch strategy and new productperformance: An empirical examination in The Netherlands. Journal ofProduct Innovation Management, 16(6), 545−556.
Jaworski, B. J., & Kohli, A. K. (1993). Market orientation: Antecedents andconsequences. Journal of Marketing, 57(3), 53−70.
Hulland, J. (1999). Use of partial least squares (PLS) in strategic managementresearch: A review of four recent studies. Strategic Management Journal,20(2), 195−202.
Hunt, S. D., & Morgan, R. M. (1995). The comparative advantage theory ofcompetition. Journal of Marketing, Vol. 59 2( pp. 1–15). Morgan.
Kaleka, A. (2002). Resources and capabilities driving competitive advantage inexport markets: Guidelines for industrial exporters. Industrial MarketingManagement, 31(3), 273−283.
Kleinschmidt, E. J., & Cooper, R. G. (1991). The impact of product innovativenesson performance. Journal of Product Innovation Management, 8(4), 240−251.
Kohli, A. K., & Jaworski, B. J. (1990). Market orientation: The construct,research propositions, and managerial implications. Journal of Marketing,54(2), 1−20.
Kreuzbauer, R., & Malter, A. J. (2005). Embodied cognition and new productdesign: Changing product form to influence brand categorization. Journal ofProduct Innovation Management, 22(2), 165−176.
Lance, C. E. (1988). Residual centering, exploratory and confirmatorymoderator analysis, and decomposition of effects path models containinginteractions. Applied Psychological Measurement, 12(2), 163−175.
Langerak, F., Hultink, E. J., & Robben, H. S. J. (2004). The impact of marketorientation, product advantage, and launch proficiency on new productperformance and organizational performance. Journal of Product InnovationManagement, 21(2), 79−94.
Li, T., & Calantone, R. J. (1998). The impact of market knowledge competenceon new product advantage: Conceptualization and empirical examination.Journal of Marketing, 62(4), 13−31.
Lukas, B. A., & Ferrell, O. C. (2000). The effect of market orientation on productinnovation. Journal of Academy of Marketing Science, 28(2), 239−248.
Mason, C. H., & Perreault, W. D. J. (1991). Collinearity, power, andinterpretation of multiple regression analysis. Journal of MarketingResearch, 28(3), 268−280.
Mitchell, R. (1999, January 18). Maximizing iMac. U. S. News and World( pp. 43−45).
Montoya-Weiss, M. M., & Calantone, R. (1994). Determinants of new productperformance: A review and meta-analysis. Journal of Product InnovationManagement, 11(5), 397−419.
Nakata, C., Im, S., Park, H., & Ha, Y. (2006). Antecedents and consequence ofKorean and Japanese new product advantage. Journal of Business Research,59(1), 28−36.
Narver, J. C., & Slater, S. F. (1990). The effect of a market orientation onbusiness profitability. Journal of Marketing, 54(4), 20−37.
Narver, J. C., Slater, S. F., & MacLachlan, D. L. (2004). Responsive andproactive market orientation and new product success. Journal of ProductInnovation Management, 21(5), 334−347.
Nijssen, E. J.,&Frambach,R. T. (1998).Market research companies and newproductdevelopment tools. Journal of Product and Brand Management, 7(4), 305−318.
Olson, E. M., Walker, O. C. J., & Ruekert, R.W. (1995). Organizing for effectivenew product development: The moderating role of product innovativeness.Journal of Marketing, 59(1), 48−64.
Pelham, A. M., & Wilson, D. T. (1996). A longitudinal study of the impact ofmarket structure, firm structure, strategy, and market orientation culture ondimensions of small-firm performance. Journal of Academy of MarketingScience, 24(1), 27−45.
Podsakoff, P. M., & Organ, D. W. (1986). Self-reports in organizationalresearch: Problems and prospects. Journal of Management, 12(4), 531−545.
Pulendran, S., Speed, R., & Widing, R. E. (2003). Marketing planning, marketorientation and business performance.European Journal of Marketing, 37(3/4),476−497.
Reed, R., & DeFillippi, R. J. (1990). Casual ambiguity, barriers to imitation, andsustainable competitive advantage. Academy of Management Review, 15(1),88−102.
Robinson, W. T. (1990). Product innovation and start-up business market shareperformance. Management Science, 36(10), 1279−1291.
Sethi, R. (2000). New product quality and product development teams. Journalof Marketing, 64(2), 1−14.
Slater, S. F., & Narver, J. C. (1995). Market orientation and the learningorganization. Journal of Marketing, 59(3), 63−76.
Song, X. M., & Parry, M. E. (1994). The dimensions of industrial new productsuccess and failure in state enterprises in the People's Republic of China.Journal of Product Innovation Management, 11(2), 105−120.
Song, X.M., & Parry,M. E. (1996).What separates Japanese new product winnersfrom losers. Journal of Product Innovation Management, 13(5), 422−441.
Song, X. M., & Parry, M. E. (1997). The determinants of Japanese new productsuccesses. Journal of Marketing Research, 34(1), 64−78.
Taiwan Biotech Industry. (2004). Taiwan Economic Institute sponsored by theBiotechnological and Pharmaceutical industry special task of EconomyBureau of Taiwan.
Tatikonda, M. V., & Montoya-Weiss, M. M. (2001). Integrating operations andmarketing perspectives of product innovation: The influence of organiza-tional process factors and capabilities on development performance. Re-cherche et Applications en Marketing, 16(4), 112−135.
Voss, G. B., & Voss, Z. G. (2000). Strategic orientation and firm performance inan artistic environment. Journal of Marketing, 64(1), 67−85.
Ming-Hung Hsieh is an associate professor of graduate school and departmentof business administration of Shih Chien University in Taipei, Taiwan. Hereceived his Ph.D. degree from National Taipei University in Taiwan. Hisresearch interests include new product development and marketing, smallbusiness management and e-commerce.
Kuen-Hung Tsai received the B.S. and M.S. degrees in management fromNational Chengchi University in Taiwan and the Ph.D. degree in managementfrom National Taipei University in Taiwan. He has engaged in economic-projects at Chung-Hua Institution for Economic Research and his research-interests include technology policy and industrial economics.
Jun-RenWang is an associate professor of graduate school and department ofrecreation and leisure industry management of National College of PhysicalEducation and Sports at Taoyuan, Taiwan. He received his Ph. D. degree fromNational Taipei University in Taiwan. His research interests include newproduct development, entrepreneurship, marketing, service management, lei-sure and e-commerce.
Related Documents