The copyright © of this thesis belongs to its rightful author and/or other copyright owner. Copies can be accessed and downloaded for non-commercial or learning purposes without any charge and permission. The thesis cannot be reproduced or quoted as a whole without the permission from its rightful owner. No alteration or changes in format is allowed without permission from its rightful owner.

Welcome message from author
This document is posted to help you gain knowledge. Please leave a comment to let me know what you think about it! Share it to your friends and learn new things together.
Transcript

The copyright © of this thesis belongs to its rightful author and/or other copyright
owner. Copies can be accessed and downloaded for non-commercial or learning
purposes without any charge and permission. The thesis cannot be reproduced or
quoted as a whole without the permission from its rightful owner. No alteration or
changes in format is allowed without permission from its rightful owner.
THE MODERATING EFFECT OF SPIRITUALITY ON
THE RELATIONSHIP BETWEEN INTENTION AND
SUSTAINABLE BEHAVIOUR AMONG UNIVERSITY
STUDENTS
NORHASLIZA BINTI HASSAN
DOCTOR OF PHILOSOPHY
UNIVERSITI UTARA MALAYSIA
September 2019

THE MODERATING EFFECT OF SPIRITUALITY ON THE RELATIONSHIP
BETWEEN INTENTION AND SUSTAINABLE BEHAVIOUR AMONG
UNIVERSITY STUDENTS
By
NORHASLIZA BINTI HASSAN
Thesis Submitted to
School of Technology Management and Logistics,
Universiti Utara Malaysia,
in Fulfillment of the Requirement for the Degree of Doctor of Philosophy

ii
iii
iv
PERMISSION TO USE
In presenting this thesis in fulfillment of the requirements for a Post Graduate
degree from the Universiti Utara Malaysia (UUM), I agree that the Library of this
university may make it freely available for inspection. I further agree that
permission for copying this thesis in any manner, in whole or in part, for scholarly
purposes may be granted by my supervisors or in their absence, by the Dean of
School of Technology Management and Logistics College of Business where I did
my thesis. It is understood that any copying or publication or use of this thesis or
parts of it for financial gain shall not be allowed without my written permission. It
is also understood that due recognition shall be given to me and to the Universiti
Utara Malaysia (UUM) in any scholarly use which may be made of any material in
my thesis.
Request for permission to copy or to make other use of materials in this thesis in
whole or in part should be addressed to:
Dean of School of Technology Management and Logistics
College of Business
Universiti Utara Malaysia
06010 UUM Sintok
Kedah Darul Aman

v
ABSTRACT
University students are the determinants of Malaysia's future. They will be the
leaders of tomorrow and it is important for public universities to determine what
their perceptions, attitudes and behaviour are towards sustainability. This research
focused on the improvement of sustainable behaviour among university students
based on the issues and problems related to it. In this regard, the study explored the
effect of knowledge, attitude, subjective norm and perceived behavioural control as
predictors of sustainable behaviour regarding effectiveness and efficiency. The
notion of spirituality has received a somewhat little concentration in tertiary
education sustainability studies. Therefore this study proposed and analysed the
moderating effect of spirituality through which university students can improve
their sustainable behaviour. In addition to that, the mediating effect of intention was
also examined on the relationships between the predictors and sustainable
behaviour. The research used the quantitative method through a survey instrument
and 956 usable questionnaires were collected from the students of 7 public
universities in Malaysia based on the UI Green Metric World University Ranking.
The Partial Least Squares (PLS-SEM) was employed to analyse the data. The
findings indicate that subjective norm and perceived behavioural control are
significantly related to sustainable behaviour. However, knowledge and attitude are
insignificantly related to sustainable behaviour. The results also reveal that
intention significantly mediates the relationships between the predictors and
sustainable behaviour. In addition, the findings show that spirituality moderates the
relationship between intention and sustainable behaviour. These results provide
valuable insights to both practitioners and the academia to further understand the
effects of the predictors, intention and spirituality on sustainable behaviour. Finally,
the research limitations are discussed and suggestions for extended areas of research
are recommended for future researchers.
Keywords: university students, sustainable behaviour, knowledge, attitude,
subjective norm, perceived behavioural control, intention, spirituality

vi
ABSTRAK
Pelajar universiti adalah penentu kepada masa hadapan Malaysia. Hal ini kerana
mereka akan menjadi pemimpin pada hari esok dan penting bagi universiti awam
untuk menentukan persepsi, sikap dan tingkah laku mereka terhadap kelestarian.
Kajian ini memberi tumpuan kepada peningkatan tingkah laku yang lestari dalam
kalangan pelajar universiti berdasarkan isu dan masalah yang berkaitan dengannya.
Oleh itu, kajian ini menyelidik kesan pengetahuan, sikap, norma subjektif dan
kawalan kelakuan ditanggap, sebagai peramal tingkah laku lestari dalam aspek
keberkesanan dan kecekapan. Tanggapan kerohanian didapati kurang mendapat
perhatian dalam kajian-kajian tentang kelestarian dalam pendidikan tinggi. Justeru,
kajian ini mencadangkan dan menganalisis kesan penyederhanaan kerohanian yang
boleh dilaksanakan oleh pelajar universiti untuk meningkatkan tingkah laku lestari.
Selain itu, kesan pengantaraan niat dalam hubungan antara peramal dengan
kelakuan lestari juga diteliti. Penyelidikan ini menggunakan kaedah kuantitatif
melalui instrumen tinjauan dan sebanyak 956 borang soal selidik yang boleh diguna
pakai dikumpulkan daripada pelajar dari tujuh buah universiti awam di Malaysia
berdasarkan UI Green Metric World University Ranking. Manakala kuasa dua
terkecil separa (PLS-SEM) pula digunakan untuk menganalisis data. Hasil kajian
menunjukkan bahawa norma subjektif dan kawalan tingkah laku mempunyai
hubungan yang signifikan dengan kelakuan lestari. Walau bagaimanapun,
pengetahuan dan sikap didapati tidak mempunyai hubungan yang signifikan dengan
tingkah laku lestari. Dapatan kajian juga mendedahkan bahawa niat mengantarakan
hubungan di antara peramal dengan tingkah laku lestari secara signifikan. Selain
itu, penemuan kajian menunjukkan bahawa kerohanian dapat menyederhanakan
hubungan di antara niat dan tingkah laku lestari. Hasil kajian ini memberikan
pandangan yang berharga kepada kedua-dua pihak iaitu pengamal dan ahli
akademik untuk memahami lebih lanjut tentang kesan peramal, niat dan kesan
kerohanian ke atas tingkah laku lestari. Akhirnya, batasan kajian telah dibincangkan
dan cadangan untuk bidang penyelidikan lanjut disyorkan untuk penyelidik masa
hadapan.
Kata kunci: pelajar universiti, tingkah laku lestari, pengetahuan, sikap, norma
subjektif, kawalan kelakuan ditanggap, niat, kerohanian

vii
ACKNOWLEDGEMENT
In the Name of Allah, the Most Gracious and the Most Merciful, may His peace
and pleasant blessings be upon our sacred prophet, our model; Nabi Muhammad
s.a.w., the last and the leader of all the spiritual teachers sent to Earth. Alhamdulillah
without Allah’s grace, my dreams would have turned to illusions. Thank you Allah,
The Al-Mighty as it is only by His grace, blessing and guidance I can reach to the
end of this memorable journey.
I wish to express my heartfelt gratitude and appreciation to many people whom I
am indebted to for being instrumental to the successful completion of my PhD
study. I would like to acknowledge the intellectual sharing of many great
individuals. My very special thanks go to my formidable team of supervisors;
Assoc. Prof. Dr. Siti Norezam Othman and Dr. Noorulsadiqin Azbiya Yaacob, for
devoting much of their expertise and precious time in guiding to reach the finish
line of this research. This thesis would not have been complete without support,
encouragement, continuous motivation and advice from them, given to me
throughout my time as their student. I also have been extremely lucky to have
supervisors who cared so much about my work. Thank you, for all that you did. I
would like to express my deepest thanks to Prof. Dr. Haim Hilman Abdullah, Assoc.
Prof. Dr. Mohd Najib Salleh, Dr. Rahimi Abidin, Assoc. Prof. Dr. Hashimah Mohd
Yunus, and Assoc. Prof. Dr. Abdul Aziz Othman for their ideas, comments, advice
and support in the process of preparing and completing my thesis. May Allah bless
all of you and reward your kindness.
Undoubtedly, this thesis would almost be impossible to complete without the
assistance and support of my family. I wish to express my special gratitude and love
for my husband, Muhammad Hasbi Ibrahim and to my lovely son, Ahmad Haseef
Muhammad Hasbi. I am fortunate to have wonderful mother, Senik Awang, father
and mother in law, Ibrahim Dollah and Hamidah Abdullah, my siblings, Surya
Herdawati Hassan, Nurul Shahirah Hassan and Hafiz Asri Hassan, then my sisters
in law, Nur Maizan Ibrahim and Marini Ibrahim and also family members for their
patience, understanding and supports. Their affection, encouragement, and prayers
made me calm and confident.
I would like to address my thanks to Dr. Gusman Nawanir and Dr. Siti
Norhasmaedayu Mohd Zamani, my gurus in PLS-SEM data analysis, who had
guided me a lot in performing quantitative data analysis and Dr. Othman Talib
always give me a spirit to do a research. May Allah bless all of you and reward your
kindness.
I would like to express my gratitude to the Othman Yeop Abdullah Graduate School
of Business, School of Technology Management and Logistics, Universiti Utara
Malaysia, and staff for the facilities, resources Ministry of Higher Education (My
Brain 15 research incentive/grant), and commitment provided during the entire

viii
process. Without exception, they have treated me professionally and supportively.
My gratitude goes to a number of people who, in one way or the other, played a part
in this history-making journey, especially my colleagues, Dr. Nabilah Mohd Fisol,
Dr. Farah Mastura Noor Azman, Maizatul Wahidar Mohd Roslan, Sukma Pea, Dr.
Rabiha Asnan, Zuraida Hani, and Dr. Nurazwa Ahmad. Their valuable sharing and
discussions have enriched the development of my research.
Finally, my appreciation is also addressed to my friends, Rohaizah Jantan, Dr.
Murizah Mohd Zain, Siti Nafisah Tajuddin, Siti Rahmah Rahmat, Zaihasra Jusoh,
Mazlina Manaf, Adiyati Mohd Nor, Nor Fatimi Ibrahim, Nor Syakira Kasim, Siti
Atiqah Abd Wahab, Siti Aishah Hamid, Siti Fatimah Omar, Siti Zaharah Dollah,
Norhamimah Ibrahim, Nur Fauziana Abu Bakar, Dr. Noor Tahirah Abd Karim,
Hasifah Zainuddin, Dr. Noraisyatul Azni Mohd Saufian, Nusaibah Yahaya, and
Noorahawida Ibrahim, who inspired me a lot, as well as a host of others, all of
whom I cannot possibly mention. May Allah bless all of you.
Last but not least, this acknowledgement is also dedicated to any individuals and
organisations, for the valuable contribution for the completion of this thesis, both
directly and indirectly.
ALHAMDULILLAH.

ix
PUBLICATIONS DERIVED FROM THIS THESIS
1. Hassan, N., Yaacob, N. A., & Othman, S. N. (2018). The Impact of
Spirituality in Enhancing Sustainable Behaviour among Students of
Public Universities in Malaysia. International Journal of Business
Quantitative Economics and Applied Management Research
(IJBEMR). 4(9), 6-14.
2. Hassan, N., Othman, S. N., & Yaacob, N. A. (2018). Determinants of Theory
of Planned Behaviour (TPB) Model in Measuring Sustainable
Behaviour among Students of Public Universities in Malaysia.
Journal of Information System and Technology Management (JISTM).
3(7), 1-12.
3. Hassan, N., Othman, S. N., & Yaacob, N. A. (2018). The Effect of
Spirituality in Influencing Predictors Sustainable Behaviour among
Students in Public Universities in Malaysia. Journal of Technology
and Operation Management (JTOM).
x
TABLE OF CONTENTS
TITLE PAGE
CERTIFICATION OF THESIS WORK
PERMISSION TO USE
ABSTRACT
ABSTRAK
ACKNOWLEDGEMENT
PUBLICATIONS DERIVED FROM THIS THESIS
TABLE OF CONTENTS
LIST OF TABLES
LIST OF FIGURES
LIST OF ABBREVIATIONS
LIST OF APPENDICES
i
ii
iv
v
vi
vii
ix
x
xv
xvii
xviii
xx
CHAPTER ONE INTRODUCTION 1.1 Introduction
1.2 Background of the Study
1.3 Problem Statement
1.4 Research Questions
1.5 Research Objectives
1.6 Scope of the Study
1.7 Significance of the Study
1.8 Definition of Key Terms
1.9 Organisation of the Thesis
1
1
9
17
18
19
21
22
24
CHAPTER TWO LITERATURE REVIEW
2.1 Introduction
2.2 An Overview on Sustainability
2.3 Sustainability Development
2.3.1 Sustainability Development in Malaysia
2.3.2 Sustainability Studies in Malaysia
2.4 UI GreenMetric World University Ranking
2.5 Universities Effort on Sustainability
2.5.1 Universiti Putra Malaysia (UPM)
2.5.2 Universiti Utara Malaysia (UUM)
2.5.3 Universiti Malaya (UM)
2.5.4 Universiti Kebangsaan Malaysia (UKM)
2.5.5 Universiti Teknologi Malaysia (UTM)
2.5.6 Universiti Malaysia Sabah (UMS)
2.5.7 Universiti Sains Islam Malaysia (USIM)
2.6 Sustainable Behaviour
2.6.1 Predictors of Sustainable Behaviour
2.7 Knowledge
2.7.1 Relationship between Knowledge and Sustainable
26
26
27
31
34
36
40
40
43
45
47
48
50
50
51
55
58
59
xi
Behaviour
2.8 Attitude
2.8.1 Relationship between Attitude and Sustainable Behaviour
2.9 Subjective Norm
2.9.1 Relationship between Subjective Norm and Sustainable
Behaviour
2.10 Perceived Behavioural Control
2.10.1 Relationship between Perceived Behavioural Control and
Sustainable Behaviour
2.11 Spirituality
2.11.1 Relationship between Perceived Behavioural Control and
Sustainable Behaviour
2.12 Intention
2.12.1 Relationship between Intention and Sustainable Behavior
2.12.1.1 Relationship between Knowledge and Intention
2.12.1.2 Relationship between Attitude, Subjective Norm
and Perceived Behavioural Control with
Intention
2.12.1.3 Relationship between Spiritual and Intention
2.13 Mediating Effect of Intention
2.14 Moderating Effect of Spirituality
2.15 Underpinning Theory
2.15.1 Theory of Planned Behaviour (TPB)
2.15.1.1 TPB Usage in Sustainable Behaviour Studies
2.15.2 Theory of Spiritual Leadership
2.16 Summary
61
62
64
65
67
68
70
71
73
74
74
76
80
82
83
84
85
87
88
90
CHAPTER THREE RESEARCH METHODOLOGY
3.1 Introduction
3.2 Research Design
3.3 Research Framework
3.4 Hypotheses Development
3.5 Hypotheses Formulation
3.6 Operational Definition
3.7 Instruments and Measurements
3.8 Questionnaire Design
3.8.1 Dependent Variable: Sustainable Behaviour
3.8.2 Independent Variables
3.8.2.1 Knowledge
3.8.2.2 Attitude
3.8.2.3 Subjective Norm
3.8.2.4 Perceived Behavioural Control
3.8.3 Mediating Variable
3.8.4 Moderating Variable
3.9 Validity and Reliability
3.9.1 Validity
91
91
94
96
96
96
98
100
100
102
102
102
103
104
105
105
107
107

xii
3.9.2 Reliability
3.9.3 Pre Test
3.9.4 Pilot Test
3.10 Population and Sample
3.10.1 Sample Size
3.10.2 Sampling Technique
3.11 Data Collection
3.12 Data Analysis
3.12.1 Descriptive Analysis
3.12.2 Partial Least Squares-Structural Equation Modelling (PLS-
SEM) Technique
3.12.3 Confirmatory Factor Analysis
3.12.4 Structural Equation Modelling
3.13 Summary
109
110
111
112
113
114
115
116
117
117
119
119
121
CHAPTER FOUR DATA ANALYSIS AND RESULTS
4.1 Introduction
4.2 Response Rate
4.3 Test for Non-Response Bias
4.4 Data Coding
4.5 Preliminary Analysis
4.5.1 Data Screening
4.5.2 Missing Value Analysis
4.5.3 Outlier Detection and Treatment
4.6 Fundamental Statistical Assumptions
4.6.1 Multicollinearity Test
4.6.2 Data Normality Test
4.7 Demographic Profile of the Respondents
4.8 Descriptive Statistics of the Study Variables
4.9 Results of Confirmatory Factor Analysis (CFA)
4.10 Models Evaluations
4.10.1 Measurement Model
4.10.1.1 Construct Validity
4.10.1.2 Goodness-of-Fit (GoF)
4.10.1.3 Assessment of Predictive Relevance
4.10.2 Structural Model
4.10.2.1 Main Relationship Effect
4.10.2.1.1 Assessment of Variance Explained
in the Endogenous Latent Variable
4.10.2.2 The Mediation Effects
4.10.2.2.1 The Direct and Indirect Effects
4.10.2.2.2 Mediation Results
4.10.2.3 The Moderation Effects
4.10.2.3.1 Determining the Strength of the
Moderating Effect
4.10.2.3.2 Testing for Interaction Effects
122
122
124
127
127
128
128
129
130
131
132
134
137
138
141
141
142
149
150
151
153
154
155
157
159
160
161
163

xiii
4.10.2.3.3 The Interpretation of the Interaction
Result
4.11 Summary of Hypotheses Testing
4.12 Summary
163
165
166
CHAPTER FIVE DISCUSSION, CONCLUSION AND
RECOMMENDATIONS
5.1 Introduction
5.2 Recapitulation of the Research Findings
5.3 Discussions
5.3.1 Direct / Main Effects
5.3.1.1 Relationship between Knowledge and Sustainable
Behaviour
5.3.1.2 Relationship between Attitude and Sustainable
Behaviour
5.3.1.3 Relationship between Subjective Norm and
Sustainable Behaviour
5.3.1.4 Relationship between Perceived Behaviour Control
and Sustainable Behaviour
5.3.2 Mediation Effect of Intention
5.3.2.1 The Mediation Effect of Intention on the
Relationship between Knowledge and Sustainable
Behaviour
5.3.2.2 The Mediation Effect of Intention on
the Relationship between Attitude and Sustainable
Behaviour
5.3.2.3 The Mediation Effect of Intention on the
Relationship between Subjective Norm and
Sustainable Behaviour
5.3.2.4 The Mediation Effect of Intention on the
Relationship between Perceived Behaviour
Control and Sustainable Behaviour
5.3.3 Moderating Effect of Spirituality
5.4 Contributions of Study
5.4.1 Practical Contribution
5.4.2 Theoretical Contribution
5.4.3 Methodological Contribution
5.5 Limitations of Study
5.6 Suggestions for Future Research
5.7 Conclusion
168
169
171
171
172
174
176
179
181
183
184
186
187
189
191
192
197
198
199
201
202
REFERENCES
APPENDICES
APPENDIX I: DATA COLLECTION LETTER
APPENDIX II: QUESTIONNAIRE
APPENDIX III: TESTS OF NORMALITY
204
226
226
227
238

xiv
APPENDIX IV: DESCRIPTIVE STATISTICS AND
SKEWNESS
240

xv
LIST OF TABLES
Table 1.1 Definition of Key Terms 23
Table 2.1 Categories Used in the Ranking and Their Weighting 39
Table 2.2 The Ranking Order of Public Universities in UI Greenmetric
Ranking
39
Table 2.3 Predictors of Sustainable Behaviour 56
Table 2.4 Previous Studies of the Relationship between Knowledge
and Sustainable Behaviour
60
Table 2.5 Summary of Previous Studies on the Relationship between
Attitude and Sustainable Behaviour
63
Table 2.6 Previous Studies on the Relationship between Subjective
Norm and Sustainable Behaviour
66
Table 2.7 Summary of Previous Studies on the Relationship between
Perceived Behavioural Control and Actual Behaviour
69
Table 2.8 Previous Studies of the Relationship between Spirituality
and Sustainable Behaviour
72
Table 2.9 Relationship between Knowledge and Intention 75
Table 2.10 Summary of Previous Studies on the Relationship between
Attitude, Subjective Norm (SN), Perceived Behavioral
Control (PBC) and Intention
78
Table 2.11 Relationship between Spirituality and Intention 81
Table 2.12 Underpinning Theories of Previous Studies in Sustainable
Behaviour Setting
87
Table 3.1 Research Hypotheses of Present Study 96
Table 3.2 Measurement Items of Sustainable Behaviour 101
Table 3.3 Measurement Items of Knowledge 102
Table 3.4 Measurement Items of Attitude 103
Table 3.5 Measurement Item of Subjective Norm 103
Table 3.6 Measurement Items of Perceived Behavioural Control 104
Table 3.7 Measurement Items of Intention 105
Table 3.8 Measurement items of Spirituality 106
Table 3.9 Variables, Sections and Source 107
Table 3.10 Reliability of the Constructs 112
Table 3.11 Sample Size for ±3%, ±5%, ±7%, and ±10% Precision
Levels where confident Level is 95 % and P= .5
113
Table 3.22 Sampling Frame and Stratification Process 115
Table 4.1 Questionnaire Distribution and Decision 123
Table 4.2 Results of independent-Samples T-test for Non-Response
Bias
125
Table 4.3 Variable Coding 127
Table 4.4 Missing Values 129
Table 4.5 Results of Multicollinearity Test 131
Table 4.6 Normality Test 134
Table 4.7 Demographic Characteristics of the Respondents 134

xvi
Table 4.8 Descriptive Statistics for Study Variables 137
Table 4.9 Constructs Indicators 138
Table 4.10 Factor Loadings and Cross Loadings 143
Table 4.11 Loadings, Composite Reliability and Average Variance
Extracted
146
Table 4.12 Discriminant Validity 148
Table 4.13 Construct Cross Validated Redundancy 151
Table 4.14 Results of Main Effects Hypotheses 153
Table 4.15 Variance Explained in the Endogenous Latent Variable 155
Table 4.16 Indirect Effects 159
Table 4.17 Results of Mediation Hypotheses 160
Table 4.18 Strength of the Moderating Effect Based on Cohen’s (1988)
and Henseler and Fassotts (2010) Guidelines
162
Table 4.19 Results of Moderation Hypothesis 163
Table 4.20 Summary of Hypotheses Testing 165
xvii
LIST OF FIGURES
Figure 2.1 Theory of Planned Behavior (TPB) by Ajzen (1991) 86
Figure 3.1 Research Framework 95
Figure 4.1 PLS Algorithm Graph 145
Figure 4.2 PLS Bootstrap Graph 152
Figure 4.3 The influences of KN, ATT, SN, PBC and SB 156
Figure 4.4 Plotting Graph Result 164

xviii
LIST OF ABBREVIATIONS
Abbreviation Descriptive of Abbreviation
SB Sustainable Behaviour
SN Subjective Norm
PBC Perceived Behavioural Control
DOE Department of Environment
HEIs Higher Education Institusions
NGO Non-Governmental Organization
MOSTI Ministry of Science Technology and
Environment
PERHILITAN Department of Wildlife and National Parks
WSSD World Summit on Sustainable Development
LA 21 Local Agenda 21
TPB Theory of Planned Behaviour
PEB Pro-environmental Behaviour
PLS Partial Least Squares
SEM Structural Equation Modeling
UPM Universiti Putra Malaysia
UUM Universiti Utara Malaysia
UM Universiti Malaya
UTM Universiti Teknologi Malaysia
UKM Universiti Kebangsaan Malaysia
UMS Universiti Malaysia Sabah
USIM Universiti Sains Islam Malaysia
DESD Decade of Education for Sustainable
Development
UNCED United Nations Conference on Environment and
Development
AASHE Association for Advancement of Sustainability
in Higher Education
NCCCS North Carolina Community College System
SuperCIP Super Curriculum Improvement Project
LESTARI Institute for Environment and Development
TRA Theory of Reasoned Action
SPSS Software package used for statistical analysis
CFA Confirmatory Factor Analysis
AVE Average Variance Extracted
GoF Goodness-of-fit
CR Composite Reliability
UK United Kingdom
USA The United State of America
IEA International Energy Agency
GDP Gross Domestic Product
IPCC Intergovernmental Panel on Climate Change

xix
UNEP United Nations Environment Programme
WMO World Meteorological Organization
KeTTHA Ministry of Energy, Green Technology and
Water
NRE Ministry of Natural resources and Environment
MESTECC Ministry of Energy, Science, Technology,
Environment & Climate Change
UiTM Universiti Teknologi MARA
IPQ Institute of Quality Management (Institut
Pengurusan Kualiti-in Malay)
PTJ Peringkat Pusat Tanggungjawab
JPP Jabatan Pembangunan dan Penyenggaraan
RIMC Research and Innovation Management Centre
(RIMC)
HEP Hal Ehwal Pelajar (HEP)
STML School of Technology Management and
Logistics
STHEM School of Tourism, Hospitality and Event
Management
SOG School of Government
PSB Perpustakaan Sultanah Bahiyah
UUMIT UUM Information Technology
JPPHB Department of Development & Estate
Maintenance
UTM SEMP UTM Sustainable Energy Management Program
OAD Office of Assets and Development
MGTC Malaysia Green Technology Corporation
OCS Office of Campus Sustainability
MIT-UTM Massachusetts Institute of Technology-Universiti
Teknologi Malaysia
MSCP Malaysia Sustainable Cities Program
USM Universiti Sains Malaysia
CETREE Centre for Education, Training and Research in
Renewable Energy and Energy Efficiency
MoU Memorandums of Understanding

xx
LIST OF APPENDICES
APPENDIX I Data Collection Letter 226
APPENDIX II Questionnaire 227
APPENDIX III Tests of Normality 238
APPENDIX IV Descriptive Ststistics And Skewness 240
1
CHAPTER ONE
INTRODUCTION
1.1 Introduction
Chapter one discusses issues surrounding sustainable behaviour among students of
public universities in Malaysia. It starts with the background of the study, problem
statement, research questions, research objectives, scope of the study, significance
of the study, definition of key terms and organization of the thesis. At the end of
this chapter, the contribution to knowledge and the outline of the chapter are covered
and organisation of thesis is provided.
1.2 Background of the Study
The evolution of environmental research started in the 1960s and mainly focused
on pollution and energy conservation, which is a source of competitive advantage
in business and politics over environmental issues (Straughan & Roberts, 1999).
This evolution has expanded the issues within the domain of environmental
responsibility. In fact, different approaches have been established to encourage
environmental behaviour in the past of 30 years (Osman, 2012).
The instability of the environment is currently obvious to level the most unexpected
observer. The global environment is shifting speedily and more intensely than ever
predictable. Climate has become impulsive with The United Kingdom (UK) and
The United State of America (USA) undergoing the coolest season in a hundred
2
years during their last winter season in 1997, and this has far reaching effects on
people across the world. Increased industrialisation, improper utilisation of
resources and population growth have damagingly impacted on the ecosystem. This
has affected the natural cycle of global resources and have destabilized
environmental sustainability (Andries, Plessis, & Al-shamaa, 2012).
Furthermore, the earlier periods have witnessed to the fast economic growth through
increasing customers’ consumption globally. This situation will cause
environmental problem through exploitation of natural resources and over-
consumption. Thus, the effects of degradation in environment are desertification,
acid rain, noise and light pollution, pollution of sea and rivers, reduction of
stratospheric ozone layer, and global warming (Chen & Chai, 2010).
Similarly in Malaysia, the quick development of Malaysia's economy has expanded
the urban population rapidly. This has created more job opportunities, education
and also increased the demand for a good quality of life. However, at the same time
it also increases the risk of degradation of environmental quality based on human
activities (Aini & Laily, 2010). As one of the developing countries progressing
within Southeast Asia, Malaysia has stated in her vision 2020 (Wan, Sirat, & Razak,
2015) to be a developed country and projected to be a fully industrialised country.
It should be noted that industrialisation is often associated with direct and indirect
threats posed by air, noise and water pollution, water shortages and contamination,
bad transport system and traffic jam, and waste management system. Therefore, as

3
an industrialised and developed nations, it will face those environmental challenges
(Cordano, Welcomer, Scherer, Pradenas, & Parada, 2010).
Malaysia has achieved many important milestones in environmental quality over
the past three decades. The environmental awareness has increased substantially
through formal and informal environmental education activities carried out by
Governmental and Non-Governmental Organization (NGOs). Since the Fifth
Malaysia Plan (1986 - 1990), greater emphasis has been placed on preventive rather
than curative measures. Furthermore, the environmental concerns cannot be
addressed in isolation from other vital issues in nation building but the social,
technological, economic, ecological and political factors should be considered
together holistically. In Malaysia, the accountability to manage the numerous
environmental-related laws rests with a number of local, state and federal
government agencies. MOSTI (Ministry of Science Technology and Environment)
has a general responsibility by virtue of the present cabinet functional set-up with
the support of at least three executing agencies namely Department of Wildlife and
National Parks (PERHILITAN), Department of Environment (DOE) and the
Secretariat to the Atomic Energy Licensing Board.
Government had assimilated environmental considerations into the design of
programs and projects since Sixth Malaysian Plan (1991-1995). Next, the Seventh
Malaysian Plan (1996-2000), Eight Malaysian Plan (2001-2005) and Ninth
Malaysian Plan (2006-2010) was further reinforced that implementations. Then, the
essential of environmental sustainability is recognised as measure of a wide-ranging
4
socio-economic growth strategy which is documented in the Tenth Malaysian Plan
(2011-2015). Besides, the process to impose the concerns of environmental
degradation, weather alteration and sustainable application of Malaysia’s natural
legacy was also presented in Tenth Plan Malaysian Plan. Lastly, green development
will be an important change in exactly how Malaysia realizes the function of the
environment and natural assets in its socio-economic improvement, keeping both
biodiversity and development gains growth improvements at the equal period was
recognised in the Eleventh Malaysian Plan (2016-2020) (Director General, 2015).
Constructing a socio-economic growth strategy that will enhance the resilience to
natural disasters and climate change remains critical. Therefore, the empowering
environment will be reinforced to pursue green growth (Director General, 2015).
Nowadays, there are many environmental problems in Malaysia which are
tremendous such as solid domestic waste, air pollution and water pollution. One of
the most serious problems in the Malaysia is solid domestic waste, especially in
urban areas. Solid waste was defined as the unused from products bought by the
general public for domestic usage, for example sludge, garbage trash, and other
rejected solid resources (Latif, Omar, Bidin, & Awang, 2013). For the Malaysian
government, solid waste is previously a substantial problem faced by them.
According to Ministry of Housing and Local Government (2008), every single day,
there are 1.5 kg solid waste have been produced by each resident in the Klang
Valley. For a better understanding, it shows that, at least 80 percent of the 230
available removal places will be occupied up within 2 years at this rate (Ministry of
Housing and Local Government, 2008). The estimated waste produced by one

5
person is 1.0 kg/day, and among 230 available landfills, 80 percent of them have
only two years of lifespan away (Said, Azura, & Fakhru’l-Razi, 2011). Regarding
to Zahari (2012), Malaysian produced waste at least 19,000 tons every day and
expected to rise to 30,000 tons by arriving 2020. Even though Malaysia has been
grown up well in economic and industrial development, unfortunately the level of
waste management in Malaysia is still left behind. Improved management system
and effective solutions are not enough, but this serious matter needs to be settled
from the root cause.
One of the most practical ways to solve this issue is sustainable behaviour (SB)
through recycling. If Malaysia could achieve higher recycling rate, this would
decrease the daily amount of waste generated. Besides that, this can reduce the
quantity of the needed landfills and it as well contributes to prolonging the lifecycle
of the landfill (Zahari, 2012). A recycling program, which is the method of one
initiative to solve waste management problem was launched by Ministry of Housing
and Local Government as early as 1993 (Zahari, 2012). Nevertheless, it can be
considered still in beginning stage and there are not many enhancements in
Malaysian recycling program currently. Besides, most of Malaysian society do not
even participate in the recycling practices specifically in the rural areas and also the
awareness of this practice is still low among Malaysian societies (Faiz, 2011).
Unfortunately, although recycling program has be launched, regarding to statistics
provided by the Housing and Local Government Ministry, there are only less than
5% of waste was being recycled by Malaysian, while almost 95% of waste

6
comprising bottle, paper and rubbish were directed to the landfills around the
country (Latif et al., 2013).
Furthermore, problems associated to air pollution in Malaysia also are getting very
complex and ambiguous. Humans, regardless of their awareness, have imposed
more difficulties by polluting the air through operating of motor vehicles, open
burning, industrial activities and others. It is expected that the environment will
experience more severe influences as this matter becomes more serious (Md Razak,
Ahmad, Bujang, Talib, & Ibrahim, 2013).
Besides, the other environmental problem in Malaysia is the water pollution and in
directly, it contributes an aggressive effect on the sustainability of water resources,
and there are not only effect on that water resources, nevertheless also affected
living organism and plants, the health of population, and the economy. The
observation of the quality of river water conducted by The Department of
Environment (DOE) continuously to define the level of water quality of the river
and to identify every fluctuations in water quality of the river. From the observation,
the status of water quality showed that 52% of the river were found to be clean, 39%
of the river water were slightly contaminated and 9% of remaining were fully
contaminated (Afroz, & Rahman, 2017).
Furthermore, natural disasters can happen anywhere at any time. A contributor of
global warming is energy production. Carbon emission released from the energy
production process produces millions tonnes of greenhouse gases a year. One of the
solutions to cutting global greenhouse emission is energy consumption reduction.
7
Global warming is, however, not the only reason for energy conservation. Other
energy related issues such as unstable energy price, uncertain future energy supply,
as well as increasing world population, will lead to higher energy demand and serve
as reasonable motivation for the world to conserve energy (Ting, Mohammed, &
Choong, 2012). For this reason, immediate and appropriate action is crucial to solve
such issues before the ecosystem is harmed. Initiatives that attempt to secure a
sustainable energy future should be a priority this century.
Malaysia has become one of the world's largest consumers of energy. According to
a report by International Energy Agency (IEA) 2013, energy consumption in the
country is expected to record a moderate growth in the next year. The increase in
Malaysia’s primary energy demand is due to increase in its population estimated to
be at an average annual rate of 1.2 percent and in gross domestic product (GDP) at
an average of 4 percent per annum. Electricity is the key component of our modern
technology. To produce electricity, the energy sources, most commonly used is
fossil fuels such as coal, oil and natural gas which are known as non-renewable
resources. These non-renewable resources take millions of years to be formed in the
crust of the earth by natural processes. Once burned to produce electricity, they are
gone forever (Alias, Hashim, Farzana, & Mariam, 2015). Since we rely on energy
for everything we do in single day, we must find ways to use energy wisely.
According to lack of energy awareness among the university community could
create difficulties for the energy conservation efforts and, subsequently, lead to
energy wastage (Ng, Shakur, & Choong, 2010). For this reason, raising energy

8
awareness is especially important for a university community that is still not well
aware of the current energy related challenges the world is facing.
Based on the above environmental problems that we discussed earlier, enhancement
of the SB is very essentials to solve these environmental problems. The elements of
SB include of waste reduction, energy conservation, water conservation and
transportation. While, the examples of actions that show of SB are such as turning
off electricity not in use and purchasing of energy saving appliances, turning off
taps not in use, and the use of designated recycle bins and some reuse activities
(Asmuni, Mhd. Khalili, & Mohd. Zain, 2012).
Furthermore, Higher Educational Institutions (HEIs) globally is beginning to
comprise SB ideas in their programs due to recent prevalent environmental poverty
and a lack of moral considerations where capitals are not equally dispersed in a
world. Besides, numerous efforts in education for SB may be outlined back several
decades (Najera, 2010). Presently, teaching and research on ethical, social and
environmental issues do not occur in business schools and universities (Cordano et
al., 2010). Therefore, business students seem to hold a weak pro-environmental
orientation.
Previous research has addressed SB of public and consumer (Kumar, 2012; Li-ming
& Wai, 2013; Onwezen, Antonides, & Bartels, 2013), while studies need to be
focusing on universities students. The prominence on universities students is
significant because they will raise and improve to become future leaders, which
have accountability for environmental sustainability, therefore, students need to

9
comprehend it so that they can become better stewards in the future (Sia Su, 2008).
Furthermore, the improvement of obligation, stance and capability to sustain and
protect the environment need to focuses at university student age (Said, Ahmadun,
Paim, & Masud, 2003). Therefore, future studies of SB need to be extended among
universities students (Alias, Hashim, Farzana, & Mariam, 2015; Syed Idros, 2014).
Interestingly, there are limited studies on SB particularly at Malaysia that focused
on students. With the realization that university students are viewed as critical, this
study highlight the need to look further.
1.3 Problem Statement
The motivations of examining SB predictors are multi-fold. Firstly, it is because
Malaysian still have moderate to low level of awareness of sustainability issues
(Ibrahim & Asmawi, 2010). Malaysia is suffering difficulties on solid domestic
waste problem, air pollution, and improper utilisation of resources. However,
Malaysian’s awareness and knowledge are still not reach to the state to consider
about future influence of these complication going on life and general economics
(Aziz, Sheikh, Yusof, Udin, & Yatim, 2012).
Currently, in improving and maintaining the quality of life in the present and future
generation, learning sustainable development is being emphasized at tertiary levels
of education to educate the awareness of sustainability. Consequently, public
university as a higher education provider, is the platform to develop and reform
students’ knowledge, attitudes and skills towards sustainability because students as

10
innovator and problem solvers, they will show a significant part in the growth of a
nation (Aziz et al., 2012).
Previous studies show that sustainable programs and practices are being
implemented on a number of college and university campuses and the students were
concerned about wasteful consumption and pollution. However, a large number of
students surveyed expressed concern for and willingness to participate in
sustainable practices, and there seems to be a “commitment gap” among students
(Emanuel & Adams, 2011). Besides, a study conducted by Asmuni, Mhd. Khalili,
and Mohd. Zain (2012) shows that majority of the students did not recycle regularly
and they never or rarely used public transportation or carpooled. They also did not
purchase environmentally friendly products. The study demonstrated a low
correlation between environmental attitudes and behaviours of university students.
On 24 July 2009, Government of Malaysia has launched the National Green
Technology Policy as part of its effort to enhance Malaysia environmental
sustainability. Several of programs and campaigns were done such as Earth Hour,
energy saving tips and recycling. Despite of effort taken, a study by Jannah, Halim,
Meerah, and Fairuz (2013) revealed that student behaviour contributes to large
amount of energy wastage.
The involvement of student in tertiary level of education in protection of the
environment and sustainable development is important because it affects their lives
today and has implications to the world and their future. During the youth period in
tertiary level, individuals are most open to socialization influences and their values

11
and worldviews undergo significant formation (Niaura, 2013). Thus, identities
formed during this time are likely to inform values, attitude, and behaviour
throughout life (Sahin, Ertepinar, & Teksoz, 2012). Therefore, further study need
to be taken. This is due to understand the reason that cause low energy conservation
behaviour.
In the past, behavioural science research was conducted on general environmental
awareness rather than more specific topics (Aminrad, Zarina, Sayed, Hadi, &
Sakari, 2013; Li-ming & Wai, 2013; Mahmud & Osman, 2010; Shephard, 2008;
Zahari, 2012). After reviewing previous articles that investigated factors relating to
environmental awareness, Li-ming and Wai (2013) recommended that
environmental awareness should be studied in terms of more specific environmental
issues. Awareness and concern about environmental issues do not necessarily be
reflected in environmental behaviour. Therefore, a few researchers conducted an
investigation that focused on people's beliefs and attitude concerning trade-offs with
other valued goals. Researchers also have examined values, beliefs, motivation and
attitude in order to understand the inconsistencies in findings in environmental
behaviour (Chen & Chai, 2010; de Leeuw, Valois, & Seixas, 2014; Osman,
Abdullah, & Manaf, 2014; Wray-Lake, Flanagan, & Osgood, 2010). Thus, attitude
could be a predictor of sustainable behaviour that have need to be considered as
important in this study.
The inconsistency between awareness and behaviour causes confusion among
researchers, environmental educators, marketers and others who are interested in

12
influencing SB. Most environmental education programmes have worked with the
assumption that increased knowledge would naturally bring about more responsible
choices (Aminrad et al., 2013). However, an increasing number of studies show
only a minimal correlation between attitude, knowledge and behaviour (Saleki &
Sayedsaleki, 2012) and the need for research into a wider set of variables becomes
more obvious. In fact, several studies conducted in western countries show that
knowledge and awareness of environmental problems do not lead to more
responsible environmental behaviour (Michalos, Creech, McDonald, & Kahlke,
2009; Syed Idros, 2014), thus it can be assumed that the present environmental
issues are caused by human behaviour.
The first reason of lacking of SB in Malaysia may be caused by the knowledge about
the environmental issues. In other words, knowledge could be a predictor of
sustainable behaviour. Previous studies show that the Malaysian environmental
awareness and environmental knowledge are low (Aminrad, Zarina, Sayed, Hadi,
& Sakari, 2013; Aziz et al., 2012; Derahim, Hashim, Ali, Abdul, & Aziz, 2012;
Said, Ahmadun, Laily & Jariah, 2003). Awareness is defined as having knowledge
or realizing something (Aminrad et al., 2013), thus, awareness have related to the
knowledge.
Besides, previous studies show that there is relationship among knowledge and SB
(Ahmad, Juhdi, & Awadz, 2010; Aminrad et al., 2013; Burmeister & Eilks, 2013;
Kibert, 2000; Said et al., 2003; Syed Idros, 2014). However, before such attitude
can be transformed into an actual behavior, the societies’ awareness of

13
environmental problems and knowledge should be strengthened. (Ahmad et al,
2010). To promote environmental action among societies may be a challenge to any
governments that are seeking to reach environmental targets by encouraging
individuals to participate in SB that will help to reduce negative impact to the
environment and the population at large. Such activities include energy saving,
waste reduction, energy conservation, recycling and green consumption. Based on
above statement, it is indicated that the main reason for this sustainable behaviour
in Malaysia has not been profoundly investigated in past studies. Hence, it leads to
the necessity of having more research to determine the predictors of SB in Malaysia.
Others reasons that may cause SB level could arise from spirituality that is not
deeply embedded in the human heart. Incorporation of spirituality in the higher
educational setting provides an additional way for students to construct knowledge,
make meaning of experiences, and move toward authenticity, all contributing to
transformation. For religious students, activities that contain spiritual components
allow students to connect to their established practices (Crowe, 2013a). However,
previous studies showed that the humans still do not have strong fundamental in
spiritual aspects in related on environmental issues (Crowe, 2013b; Csutora &
Zsóka, 2012; Kinsley, 1995; Rai, Srivastava, & Shukla, 2014). Previous research
has addressed several aspects of attitude influences SB (Abd-Ella, Somaa, & Ebad-
Allah, 2012; Tan, Nasreen-Khan, Hong, & Lam, 2015), subjective norm (SN)
(Alias et al., 2015; Han, 2015), perceived behavioural control (PBC) (Busse &
Menzel, 2014; de Leeuw, Valois, & Seixas, 2014) and knowledge (Haron, Paim, &
Yahaya, 2006; Syed Idros, 2014). However, spirituality encompasses several
14
unexplored dimensions that lately have attracted research attention in other
disciplines (Brant, 2010; Csutora & Zsóka, 2012; Rai et al., 2014). Some of these
unexplored spirituality appear to be important and worthy of investigation in the
context of sustainable behaviour. An investigation of these issues is important
because the spirituality can serve as the inspiration for students to critically examine
their existing environmental attitudes, question their assumption and beliefs, and
through reflection and discourse, transform their view of their place, responsibility,
and importance in the natural world (Crowe, 2013a). Furthermore, previous
empirical research has focused primarily on knowledge and elements of Theory of
Planned Behaviour (TPB) namely attitude, SN and PBC. Very little research has
been done on spirituality (Crowe, 2013a; Csutora & Zsóka, 2012; Rai et al., 2014)
toward SB among students in Malaysia.
The predictors of SB namely knowledge, attitude, SN and PBC should be reinforced
and strengthened for the benefit of the future. SB is important and essentials because
by performing in this way, we can help to ensure the survival of human beings, to
protect the natural environment, to retain our planet clean and to save water (Leeuw
et al., 2014). Although SB and pro-environmental behaviour (PEB) is synonymous,
but PEB is only emphasize effort to protect the natural environment, while, SB
stipulates action to protect both natural and human (social) environments,
additionally, SB is thoughtful (i.e., purposeful) and effective (i.e., problem-solving)
(Tapia-Fonllem, Corral-Verdugo, Fraijo-Sing, & Durón-Ramos, 2013). Thus, the
above statement can justified the reason of using the term SB in this study.

15
There are inconsistent findings in previous studies especially with respect to the
predictors and actual SB. For example, Matthies et al. (2012) and Han (2015) found
that SN had a positive and direct effect on actual behavior, while Whitmarsh and
O’Neill (2010) and Onwezen et al. (2013) found SN to have an insignificant effect
on actual behavior. While most previous studies found the relationship between
attitude and actual behavior is significant (Abd-Ella, Somaa, & Ebad-Allah, 2012;
Chen et al., 2011; Said et al., 2003; Tan, Nasreen-Khan, Hong, & Lam, 2015). Chen
et al. (2011) and Osman, Abdullah, and Manaf (2014) found it to be insignificant.
Inconsistent findings are also found in the relationship between PBC and actual
behavior. For example, de Leeuw, Valois, and Seixas (2014) and Han (2015) found
that PBC had a positive and direct effect on actual behavior, while Whitmarsh and
O’Neill (2010) and Onwezen et al. (2013) found PBC to have an insignificant effect
on actual behavior. In view of the inconsistent findings of previous studies, the
inconclusive status of SB research in general, and the lack of adequate evidence in
Malaysia, it is difficult for SB researchers to design appropriate interventions that
would enhance the diffusion of sustainability. Therefore, this study attempts to
investigate the possible predictors of SB.
Many of previous research have addressed several aspects of PEB (natural
environment) (Asmuni et al., 2012; Kumar, 2012; Niaura, 2013; Whitmarsh &
O’Neill, 2010), however very little research has been done on SB (natural and
human environment) (Latif et al., 2013; Leeuw et al., 2014). Therefore, studies on
SB need to be explored and extended. In this study, the reason of choosing SB is
because SB is deliberate (purposive) and effective (problem-solving). It is also

16
anticipatory (future oriented): consider of need of future generations with the
satisfaction of present needs.
The Theory of Planned Behaviour (TPB) provides a theoretical framework for
systematically investigating the factors which influenced behavioural choices. This
study uses TPB as the theoretical basis to identify the factors, which are the
antecedent of SB among students in public universities. Previous studies on the
application of the TPB were focusing on intention rather than actual behaviour. A
study by Ayed (2010) found that most of the studies on the TPB used intention as a
dependent variable. This was supported by other researchers that examined
intention rather on the actual behaviour (Armitage, 2008; Conner, Sandberg &
Norman, 2010; Truelove, 2010).
However, a few studies found that intention can either fully mediate attitude or
behaviour (Han, 2015), attitude and PBC and behaviour (de Leeuw et al., 2014),
and or does not mediate PBC and behaviour (Fielding et al., 2008; Busse & Menzel,
2014). Another study by Han (2015) showed that intention fully mediate attitude
and SN with actual behaviour and partially mediate PBC and actual behavior.
Therefore, this research will fill the gap in investigating the role of sustainable
behaviour intention in mediating knowledge, PBC, SN, attitude and SB among
students in public universities in Malaysia and the role of spirituality as moderating
effect between intention and SB among students.
Based on the discussion above, this study pursues to examine the relationship
between attitude, SN, PBC, knowledge, spirituality and intention, and SB. The

17
mediating role of intention and the moderating role of spirituality on relationship
between intention and SB is also investigated. In addition, this study intends to
investigate SB among university students in public universities using TPB by using
Partial Least Squares-Structural Equation Modeling (PLS-SEM).
1.4 Research Questions
Based on the above discussion of the existing issues, the following questions for
this research are indicated below:
1. Is there a significant relationship between knowledge and SB among students
in Malaysian Public Universities?
2. Is there a significant relationship between attitude and SB among students in
Malaysian Public Universities?
3. Is there a significant relationship between SN and SB among students in
Malaysian Public Universities?
4. Is there a significant relationship between PBC and SB among students in
Malaysian Public Universities?
5. Does intention mediate the relationship between knowledge and SB among
students in Malaysian Public Universities?
6. Does intention mediate the relationship between attitude and SB among
students in Malaysian Public Universities?
18
7. Does intention mediate the relationship between SN and SB among students
in Malaysian Public Universities?
8. Does intention mediate the relationship between PBC and SB among students
in Malaysian Public Universities?
9. Does spirituality moderate the relationship between intention and SB among
students in Malaysian Public Universities?
1.5 Research Objectives
This study aims to determine the main predictors of SB and investigate the validity
of the underpinning theory of TPB to explain SB among students in Malaysian
Public Universities. The specific objectives of this research are:
1. To determine the significant relationship between knowledge and SB among
students in Malaysian Public Universities
2. To determine the significant relationship between attitude and SB among
students in Malaysian Public Universities
3. To determine the significant relationship between SN and SB among students
in Malaysian Public Universities
4. To determine the significant relationship between PBC and SB among
students in Malaysian Public Universities
5. To examine the mediating effect of intention on the relationship between
knowledge and SB among students in Malaysian Public Universities

19
6. To examine the mediating effect of intention on the relationship between
attitude and SB among students in Malaysian Public Universities
7. To examine the mediating effect of intention on the relationship between SN
and SB among students in Malaysian Public Universities
8. To examine the mediating effect of intention on the relationship between PBC
and SB among students in Malaysian Public Universities
9. To examine the moderating effect of spirituality on the relationship between
intention and SB among students in Malaysian Public Universities
1.6 Scope of the Study
The scope of this study focuses on knowledge, attitude, SN, PBC as independent
variable, then, the mediating variable of intention, the moderating variable on
spirituality, and SB as dependent variable. These elements as derived from the
literatures. In order to test the research framework and hypotheses, samples were
selected from seven universities. The target population was students of seven
universities in Malaysia, namely Universiti Putra Malaysia (UPM), Universiti Utara
Malaysia (UUM), Universiti Malaya (UM), Universiti Teknologi Malaysia (UTM),
Universiti Kebangsaan Malaysia (UKM), Universiti Malaysia Sabah (UMS) and
Universiti Sains Islam Malaysia (USIM). These universities are chosen based on UI
GreenMetric World University Ranking. UI’s GreenMetric University
Sustainability Ranking (GreenMetric) is a world university ranking for universities
to assess and compare campus sustainability efforts. UI has taken the initiative to
create a world university ranking to measure campus sustainability efforts. The UI

20
GreenMetric World University Ranking was established in 2010 with the intention
of creating an online survey of the current conditions and policies intended to make
campuses ‘greener’ or more sustainable in universities around the world. It based
on the ranking broadly on the conceptual framework of environment, economy, and
equity. The ranking indicators and categories are intended to be relevant to all. It
designed the indicators and weightings to be as free of bias as possible. Only these
seven public universities in Malaysia that mentioned above are included in this UI
GreenMetric World University Ranking (UI GreenMetric, 2015).
Besides, the samples of undergraduate students were chosen. These groups of
undergraduate students were selected based on several reasons; 1) they have
completed business ethic courses/modules, 2) they have adapted themselves the
condition of the campus environment, 3) they have been exposed to management
rules and regulations related to recycling issues (Osman, 2012).
Furthermore, numerous approaches from authorities in education have been applied
to enhance sustainable awareness and sustainable behaviour practices among
students. Therefore the focus of this study would be the SB of university student as
pointed out by Busse and Menzel (2014) as an individual's environmentally
significant behaviour remains a borderline area in research. Universities educate
future decision makers and bridge the gap between research and society.
Universities also have the role of transmitting knowledge to societies (Mader,
2007). As a matter of necessity, the future graduates will require a clear
understanding of sustainability to successfully leading the nation.

21
University students are the future of Malaysia. They will be the leaders of tomorrow
and it is important for public universities to determine what their perceptions,
attitudes and behaviour in towards sustainability. A study could shed light on this
problem on any changes in their perceptions and behaviour so that public
universities could be inventive to modify or upgrading the curriculum to comprise
courses on SB to increase the awareness of utilising resources wisely (Andries et
al., 2012).
1.7 Significance of the Study
This study is expected to provide the research, practical and academic contributions.
The following are the significance of this study:
Firstly, from the practical contribution aspect, the findings would benefit the higher
education institutions. The findings will indicate the SB of universities students
towards environment although there is no formal environmental education in their
curricula except the green and environmental campaigns conducted in the
universities. It will also provide some indication as to whether the environmental
campaigns conducted in the university are successful. The findings will help
universities in implementing suitable and adequate environmental facilities in order
to achieve the Malaysian goal of a 22 percent recycling rate by the year 2020. This
study will provide a significant feedback to a university's top management and
academicians of the possibility of incorporating environmental education as a core
subject as directed in Malaysian National Policy on Environment and Agenda 21 of

22
United Nations. Besides, it will help policy makers to revise current policies and
strategies for an effective solid waste management and to encourage SB.
Secondly, as behaviour within a country to another country is different (Cordano et
al., 2010) and findings may not be valid in other countries, future researches could
demonstrate their applicability (Filzah, 2007). Therefore, this study will contribute
and increased the depth by adding Malaysia to the list of references.
While, from the academics contributions aspects, the findings will contribute to the
existing theories and body of knowledge. It will establish the relationships between
predictors of SB, next the mediating effects of intention which may influence the
SB and lastly examine the intention as the mediating role and the moderator effects
of spirituality which may influence the SB among students in Malaysian Public
Universities.
1.8 Definition of Key Terms
Sekaran (2003) states that operational definition is significant in defining a concept
to render that it is quantifiable, and is done by observing at the facets, behavioral
dimensions or properties represented by the concept. In accordance, this study
operates several key terms that are necessary to be understood clearly. The
definitions of key terms used in this study are described in Table 1.1. Additionally,
they are further elaborated in detail in the literature review section in Chapter 2.

23
Table 1.1
Definition of Key Terms
Key Term Operational Definition
1. Sustainable Behaviour The actions of students aimed at protecting the
socio-physical resources of this planet which
they focused on aimed at protecting both the
natural and the human (social) environments.
Their behavior is also proactive (future-
oriented) because it considers the needs of
future generations coincidently with the
satisfaction of present needs (Najera, 2010). It
refers to the practice of recycling, conserve the
energy and reduce environmental pollution to
protect the environment
2. Intention The motivational factors which will influence
the student to recycle, conserve the energy,
reduce environmental pollution to protect the
environment. The indication of intention is
how much effort the individual is planning to
exert in the performance of the behaviour
(Ajzen, 1991). It refers to the student intent to
recycle, conserve the energy, reduce
environmental pollution to protect the
environment
3. Knowledge Students’ ability to recognize environmental
problems, the cause and consequences of such
problems, including facts and concepts
necessary for explanation (Haron, Paim, &
Yahaya, 2006). It refers to the knowledge
about natural resources, environmental
pollution and environmental issues, recycling
and conserving energy.
4. Attitude Based on the student cognitive belief on the
important of recycling, conserve the energy
and reduce environmental pollution to protect
the environment (Ajzen, 2006). It refers to the
student belief on the important of purchase
eco-products, recycling, conserving energy,
and reducing pollution.
24
Table 1.1 (Continued)
Key Term Operational Definition
5. Subjective Norm The student belief that he or she received the
social pressure from his or her peer college
mate, parents, lecturers and societies in
performing recycling activities, conserving the
energy and reducing environmental pollution
to protect the environment (Ajzen & Fishbein,
1980).
6. Perceived Behavioural
Control
The belief about the amount of control a
student feels he or she has over performing or
participating recycling activities in the
university, conserving the energy and reducing
pollutions (Ajzen and Madden, 1986).
7. Spirituality The students’ awareness or consciousness,
which the dimensions for bottomless
consideration and consideration, and a deep
sense of what it means to part of the web of life
which means to be another living, alive,
sentimental being in Nature without the
hierarchies which are often verbalized by
religious forms of spirituality (Vaughan-Lee,
2013). Researcher is not referring to a
mysterious spirituality, but rather to a
spirituality which is integral to daily life,
which informs the decisions about the way we
live, and which is expressed through action. It
also refers to the practices that caused the
internal feelings of students based on religious
beliefs or moral.
1.9 Organisation of the Thesis
For the organisation of this thesis, it is divided into five chapter where the first is
this preliminary chapter that gives the general overview of the entire process. This
chapter elaborates on the background of the study, problem statement, research
questions, research objectives, significance of the study, scope of the study,
definition of key terms, and organisation of the thesis. Chapter 2 gives an overview

25
of sustainability and sustainability development in general context. It then includes
the sustainability development in Malaysia. The chapter also reviews the relevant
literature related to the variables used in the research framework, which focused on
the previous studies on SB among students of public universities in Malaysia.
Furthermore, the chapter also discusses the underpinning theory obtained from the
literature on TPB, and Theory of Spiritual Leadership. Chapter 3 presents the
research methodology, which explains how the research activities were conducted.
The topics include research design, theoretical framework development, research
hypotheses, operational definitions, data analysis, population sample, and data
collection. It also covers the methods used for data analysis. Chapter 4 presents the
analysis and findings. Data of the respondents, items, and constructs were analysed.
Chapter 5, the final chapter of this thesis, is devoted to the discussion and conclusion
of the study. This chapter presents the implications and contributions as well as the
limitations of this study. Finally, avenues for futures research were also suggested.

26
CHAPTER TWO
LITERATURE REVIEW
2.1 Introduction
This chapter presents the overview of sustainability development and the definition
of sustainable behaviour (SB). The predictors of SB are explained, (i) knowledge,
(ii) attitude, (iii) subjective norm (SN), and (iv) perceived behavioural control
(PBC). The mediating effect of intention and the moderating effect of spirituality
are also explained. Relationship among variables are also discussed. It also presents
an outlook on the relevant literature of all variables that have been investigated in
this study. Finally, the origin of the underpinning theory is reviewed.
2.2 An Overview on Sustainability
Sustainability describes how a system remains diverse and productive; this is the
potential for long-term maintenance of well-being having ecological, economic,
political, and cultural dimensions (Reza, 2016). The concept of sustainability has its
roots in the green movement of the United States and Europe since the late 1960’s.
During this period, western society has become more conscious of living in
harmony with nature, the limits to natural resources, and the worsening
environmental problems (Najera, 2010). The impact of humans on the environment
in terms of pollution, natural resource depletion, and potential climate change has
spurred the international community into large awareness campaign and policy

27
changes. Sustainability efforts ramped up after the World Commission on
Environment and Development published The Brundtland report, our common
future in 1987. The issue was brought into the psyche of the average American
consumer in 2006 by Al Gore in his documentary film, An Inconvenient Truth
(Hutcherson, 2013).
2.3 Sustainability Development
As early as the 1972 United Nations Conference of the Environment held in
Stockholm, environmental awareness has been a priority of the international
community who recognized that economic security and development is directly tied
to the health of the environment. As a result of directives from the Stockholm
Conference, the Declaration of the United Nations Conference of the Human
Environment was created, then, the Intergovernmental Conference on
Environmental Education was held in Tbilisi, Georgia in 1977 where the Tbilisi
Declaration was adopted. The critical objectives of the Tbilisi Declaration included
heightening people’s environmental awareness, sensitivity, attitude and concern for
the environment, skill and motivation to act for environmental improvement and
protection, and participation in solving environmental problems (Wynveen, 2013).
Movements such as the World Summit on Sustainable Development in
Johannesburg (2002) together with the United Nations declaration of The Decade
of Education for Sustainable Development (DESD), 2005-2014 saw the increasing
need for reorientation of the role of education within the sustainability agenda.
28
As the earth’s human population has increased, natural ecosystems have declined
and changes in the balance of natural cycles which lead to negative impact on both
humans and other living systems. For creating the integration balance, an initiative
called Local Agenda 21 (LA 21) was proposed at the United Nations Conference
on Environment and Development (UNCED) in 1992. LA 21 is an agenda that set
tasks and a vision in order to promote sustainable development at the local level and
shows the menu of actions (Ibrahim & Asmawi, 2010). There are significant
positive outcomes that should result from an effective LA 21 process (Najera,
2010), these include;
a. Stronger community and local government partnership,
b. Ongoing community involvement in the resolution of sustainable development
issues,
c. Integrated decision making which takes all foreseeable economic, social and
environmental considerations into account,
d. Development, implementation and periodic review of a long term, integrated
action plan which incorporates sustainable development principles, and
e. Changes which promote a continual improvement toward sustainable
development.
LA 21 calls for education in every chapter of UNCED, 1992. In Chapter 36 of LA
21, ‘Promoting Education, Public Awareness and Training’, it precisely recognized
four major thrusts (United Nations, 1992);
29
a. Improving the quality of and access to basic education,
b. Reorienting the existing education to address sustainable development,
c. Developing public understanding and awareness, and
d. Training programs for all sectors
Furthermore, many organizations, both businesses and institutions of higher
education, are taking responsibility by changing policies and practices to meet the
environmental challenges of the future (Rogers & Hudson, 2011). Many educational
institutions have made the move to more environmentally sustainable campuses
independently and under the guidance of organizations such as the Association for
Advancement of Sustainability in Higher Education (AASHE). These initiatives
have included the greening of campuses and curricula (Calder & Datremont-Smith,
2009).
In 2009, the North Carolina Community College System (NCCCS) created an
initiative called Code Green. Under this program, representative from all 58
community colleges were appointed to participate in a network and teleconference
calls were scheduled in which community colleges shared their best practices in
terms of sustainability initiatives. A Super Curriculum Improvement Project
(SuperCIP) soon followed in 2010 to reorganize applied technology programs,
reduce redundancy of courses, and integrate sustainability into all applied
technology programs. The SuperCIP reorganization is coming to a close and

30
campuses will begin implementation within the 2013-2014 year (Hutcherson,
2013).
Furthermore, The Intergovernmental Panel on Climate Change (IPCC) is the United
Nations body for assessing the science related to climate change. The IPCC was
created to provide policymakers with regular scientific assessments on climate
change, its implications and potential future risks, as well as to put forward
adaptation and mitigation options. Through its assessments, the IPCC determines
the state of knowledge on climate change. It identifies where there is agreement in
the scientific community on topics related to climate change, and where further
research is needed. The reports are drafted and reviewed in several stages, thus
guaranteeing objectivity and transparency.
The IPCC does not conduct its own research. IPCC reports are neutral, policy-
relevant but not policy-prescriptive. The assessment reports are key input into the
international negotiations to tackle climate change. Created by the United Nations
Environment Programme (UNEP) and the World Meteorological Organization
(WMO) in 1988, the IPCC has 195 Member countries. In the same year, the UN
General Assembly endorsed the action by WMO and UNEP in jointly establishing
the IPCC. The IPCC prepares comprehensive assessment reports about the state of
scientific, technical and socio-economic knowledge on climate change, its impacts
and future risks, and options for reducing the rate at which climate change is taking
place. It also produces special reports on topics agreed to by its member
31
governments, as well as methodology reports that provide guidelines for the
preparation of greenhouse gas inventories (Alley et al., 2007).
2.3.1 Sustainability Development in Malaysia
In Malaysia, the responsibility to administer the various environmental-related laws
rests with a number of federal, state and local government agencies. By virtue of
the present cabinet function set-up, MOSTI (Ministry of Science Technology and
Environment) has an overall responsibility with the support of at least three
implementing agencies, namely (Department of Environment (DOE), Department
of Wildlife and National Parks (PERHILITAN) and the Secretariat to the Atomic
Energy Licensing Board.
Furthermore, Education is essential for promoting sustainable development and
potential for improving the capacity of the people to address environment and
development issues. Malaysia has incorporated the principles of LA 21 as one of
the important sustainable development documents in its national planning process
(Ngah, Mustaffa, Zakaria, & Sawal, 2011). Furthermore, academic institutions have
taken many initiatives to incorporate the themes of LA 21 within their academic
syllabus as well as campus-based activities. In particular, Higher Education
Institutions (HEIs) have introduced sustainable development issues into their
curricula for teaching, learning, and research. Institutes and centers have been
established in different universities aiming to set the target to achieve sustainability.
However, evaluation of the effectiveness of these teaching-learning programs, and

32
their pedagogical approaches and endpoints has not been done adequately (Reza,
2016). Furthermore, many research projects of HEIs have aimed to identify the
potential barriers and probabilities for applying sustainable approaches to various
sectors.
In practical, Green Campus Initiative is one of the alternative that is in fact a better
approach to make the future generation aware of sustainability. In Malaysia, several
universities such as Universiti Kebangsaan Malaysia (UKM), Universiti Malaya
(UM), Universiti Teknologi Malaysia (UTM), and Universiti Putra Malaysia (UPM)
have a similar program. In UKM, a forum of Sustainable Campus (generally known
as Kampus Lestari, in the Malay language) works on building awareness and
promoting a culture to leave through sustainability and green livelihood. UTM also
has similar program. UKM’s another program on a sustainable river flow Flow or
Knowledge (known as Alor Ilmu, in the Malay language) also incorporated various
stakeholders to become aware of ecology and sustainability. Both these Kampus
Lestari and Alor Ilmu have been organized and managed by the Institute for
Environment and Development (LESTARI), which has been established for
promoting sustainability in the academia as to link with the practitioners and the
policy makers. The meaning of LESTARI is sustainability, which is a product of
LA 21 and the Malaysia’s global agreement of initiatives for sustainability (Reza,
2016). In practice, these programs may provide strong message to all related with
the institutions.

33
Green Technology is one of them which incorporates the development and
application of products, equipment, and systems used to conserve the natural
environment and resources, which minimizes and reduces the negative impact of
human activities. This definition of Green Technology was defined by Ministry of
Energy, Green Technology and Water (KeTTHA). Besides, Green Technology
refers to products, equipment or systems which satisfy the following criteria: (i) it
minimizes the degradation of the environment; (ii) it has zero or low green house
gas (GHG) emissioIt is safe for use and promotes healthy and improved
environment for all forms of life; (iii) it conserves the use of energy and natural
resources; and (iv) it promotes the use of renewable resources.
Four Pillars of Green Technology Policy; (i) energy - seek to attain energy
independence and promote efficient utilization; (ii) environment - conserve and
minimize the impact on the environment; (iii) economy - enhance the national
economic development through the use of technology; and (iv) social - improve the
quality of life for all.
In 2018, the entire component of the Ministry of Science, Technology and
Innovation (MOSTI), KeTTHA and related components of Climate Change and
Environment from the Ministry of Natural resources and Environment (NRE) has
been restructured and formed the Ministry of Energy, Science, Technology,
Environment & Climate Change (MESTECC). Its vision is focused on energy
sustainability, wealth creation through science and technology and environmental
sustainability.

34
Main focuses of MESTECC is Green and efficient energy sector, which play an
important roles to increase the percentage from 2% to 20% of renewable energy for
electricity generation, then, improve the national energy efficiency, lastly, improve
the efficiency and transparency of the energy market to ensure the best tariffs for
energy consumers. Besides, it also focuses on environmental pollution-free and
resistance to climate change by leading the country towards a free non-
biodegradable plastic, reducing pollution through education and enforcement and
preparing country to address climate change through adaptation and mitigation.
2.3.2 Sustainability Studies in Malaysia
As been highlighted earlier, the present environmental issues are caused by human
behaviour, therefore, many of previous studies have been done in Malaysia that
focus on the sustainable behaviour among students. Aminrad et al. (2013) conducted
research on the environmental awareness of Malaysian secondary school students
focusing on environmental knowledge and attitude that influencing behaviour
among students. This study found that respondents' environmental knowledge is
correlated positively with environmental attitude and behaviour. The study also
proposed a rigorous campaign on environmental education to encourage sustainable
behaviour.
In addition, research on environmental concern and knowledge of Malaysian
primary school students was conducted by Said et al. (2011) in the state of Hulu
Selangor. The focus of the study is on environmental knowledge and ecologically

35
conscious behaviour (ECB). The total sample size was 163 students aged 11 years
at two schools in Hulu Selangor district using a survey questionnaire. The
respondents were majority Malays and both genders were equally represented. The
results show that main sources of environmental knowledge were television (63%)
and newspaper (64%) while text books and teachers were rather unimportant. The
data also show that the students were highly concerned about the environment, had
commendable level of environmental knowledge but this has not been resonated
into sustainable behaviour. The results indicate knowledge was positively correlated
with ECB at p < 0.05.
Furthermore, research on recycling practice conducted by Zain et al. (2012) to
determine how many UKM students were aware of the existing of facilities and
university’s recycling programs. A total of 100 respondents responded to the
questionnaire. Based on the survey, it was found that 29% of the respondents were
aware of the Mobile Recycling Center program, while 54% were unaware of it and
17% were unsure. More than 50% of the respondents did not know about the
program because of the lack of publicity and because the location of the campaign
was unsuitable. The results from the analysis show that attitude and behavior are
the main causes of individuals not practicing recycling.
Asmuni et al. (2012) conducted research on conservation behaviour of university
students in Universiti Teknologi MARA (UiTM), Shah Alam. Data is gathered in
2010 from 248 full-time UiTM Shah Alam students of different field of study using
survey questionnaire. The results indicated that there were no significant differences

36
between male and female students and parents’ highest education level with
consumption behaviour. However, there is a significant difference between urban
rural strata (students’ background) and sustainable consumption behaviour of
university students. The study also indicated that significant differences exist
between faculties and their sustainable consumption behaviour. Applied science
students exhibited the highest level of sustainable consumption behaviour as
compared to other faculties such as Law, Hotel and Catering and Art and Design.
Therefore, from the analysis of the review of research done in Malaysia,
environmental awareness and knowledge are the predictor that determined the
enhancing of sustainable behaviour in Malaysia, thus, the further study need to be
focuses more on the knowledge and other predictors that increasing sustainable
behaviour among university students in Malaysia.
2.4 UI GreenMetric World University Ranking
UI’s GreenMetric University Sustainability Ranking (GreenMetric) is a world
university ranking for universities to assess and compare campus sustainability
efforts. UI has taken the initiative to create a world university ranking to measure
campus sustainability efforts. The UI GreenMetric World University Ranking was
established in 2010 with the intention of creating an online survey of the current
conditions and policies intended to make campuses ‘greener’ or more sustainable in
universities around the world.

37
The ranking has a number of primary objectives: (i) it is open to global participation;
(ii) it is accessible to HEIs in both the developed and developing world; (iii) it
should contribute to academic discourse on sustainability in education and the
greening of campuses; and (iv) it should encourage university-led social change
with regard to sustainability goals.
Universities which participate in GreenMetric by submitting their data to be
included in the ranking can expect to enjoy a number of benefits:
a. Internationalization and recognition
Participation in GreenMetric can help the university’s efforts at internationalization
and recognition by getting its sustainability efforts on the map. Participation in
GreenMetric is accompanied by increased hits to the university website, more
mentions of the institution connected with the issue of sustainability on web pages,
and an increase in correspondence with institutions which are interested in their
organization.
b. Awareness raising of sustainability issues
Participation can help to raise awareness in the university and beyond about the
importance of sustainability issues. The world faces unprecedented civilizational
challenges such as population trends, global warming, over exploitation of natural
resources, oil-dependent energy, water and food shortages and sustainability.
GreenMetric leverages the crucial role that HEIs can play in raising awareness by
38
helping assess and compare efforts at education for sustainable development,
sustainability research, campus greening, and social outreach.
c. Social change and action
GreenMetric is primarily about awareness raising, but in future it will be adapted to
encourage real change. Understanding needs to shift to action if we are to address
emerging global challenges.
UI Green Metric selected criteria that are generally thought to be of importance by
universities concerned with sustainability. These include the collection of a basic
profile of the size of the university and its zoning profile, whether urban, suburban,
and rural. The next category of information concerns electricity consumption
because of its link to carbon footprint. Then they want to know about transport,
water usage, and waste management and so on. Beyond these indicators, they want
to get a picture about how the university is responding to or dealing with the issue
of sustainability through policies, actions, and communication. In the first version
of the methodology, used in 2010, 23 indicators they used within the five categories
to calculate the ranking scores. In 2011, 34 indicators were used. Then in 2012 they
leave the indicator of smoke free and drug free campus environment and used 33
indicators to evaluate the green campus. In 2012, they also categorize the indicators
into 6 category including education criteria. One change being considered is the
formation of a new category for sustainability education and research.

39
Categories are shown in Table 2.1 along with the number of indicators in each
category and the weighting of points for each.
Table 2.1
Categories Used in the Ranking and Their Weighting
No Category Percentage
of Total
Points
1 Setting and Infrastructure (SI) 15
2 Energy and Climate Change (EC) 21
3 Waste (WS) 18
4 Water (WR) 10
5 Transportation (TR) 18
6 Education (ED) 18
TOTAL 100
The public universities that included in UI GreenMetric are Universiti Putra
Malaysia (UPM), Universiti Utara Malaysia (UUM), Universiti Malaya (UM),
Universiti Teknologi Malaysia (UTM), Universiti Kebangsaan Malaysia (UKM),
Universiti Malaysia Sabah (UMS) and Universiti Sains Islam Malaysia (USIM).
Table 2.2 summarize the ranking order of these public universities in UI
GreenMetric ranking.
Table 2.2
The Ranking Order of Public Universities in UI Greenmetric Ranking
No University UI GreenMetric
Ranking
1 Universiti Putra Malaysia (UPM) 17
2 Universiti Utara Malaysia (UUM) 44
3 Universiti Malaya (UM) 65
4 Universiti Kebangsaan Malaysia (UKM) 110
5 Universiti Teknologi Malaysia (UTM) 118
6 Universiti Malaysia Sabah (UMS) 173
7 Universiti Sains Islam Malaysia (USIM) 361
40
2.5 Universities Effort on Sustainability
As centres that focus on knowledge-sharing and creation, universities are bustling
hubs visited and inhabited by hundreds, if not thousands, of people daily. In the
midst of the core business of teaching and learning as well as conducting research,
university campuses are congested with traffic and busy with activities such as
events; daily churning out of print and paper; and the consumption of food and
utilities. To counter these challenges, many tertiary institutions are stepping up
initiatives to conserve the environment, thus, in the next sub topic, the effort of each
university that have been involved in UI GreenMetric was explained further.
2.5.1 Univesiti Putra Malaysia (UPM)
Universiti Putra Malaysia (UPM) already has a green mandate in place that aligns
campus activities with its sustainability efforts. Vice-chancellor Professor Datin
Paduka Datuk Dr Aini Ideris said UPM’s commitment to the preservation of the
environment is reflected in effective environmental management, coaching, and the
curriculum and quality management-based systems. As a research university, UPM
leverages on its capabilities to measure its impact, embed green input into its
teaching and plan solutions and strategies within our industry and community to
advocate the need to reduce impact on the environment locally and nationwide.
UPM endeavours to raise awareness on sustainable development; preservation of
biological diversity in natural and man-made environment in the university; and
41
reduction in the release of greenhouse gases, which contribute to climate change,
through the efficient use of energy to prevent wastage and the use of alternative
energy to lower dependence on nonrenewable energy.
The policy also stipulates to reduce the production of all types of residues from
campus activities through the 4R (reduce, reuse, repair, recycle) programme; reduce
the use of private motor vehicles by improving disabled-friendly public transport
on campus and between it and the public transport hub in its vicinity, and provide
safer lanes for cyclists and pedestrians; and adopt the concept of sustainable
development in the management and development planning of the campus.
With the policy as a guide, a number of innovations and best practices have been
put in place to make UPM a green campus, namely a consistent effort at
reforestation and tree planting; the establishment of a wastebank on campus; and
the green campus transportation blueprint as well as smart energy. Through the Joint
Research Project on Rehabilitation of Tropical Rainforest Ecosystem with
Mitsubishi Corporation since 1991, some 350,000 forest trees from 128 species
have been planted in Serdang main campus as well as Bintulu campus, covering 47
hectares. The project aims to assess the health of rehabilitated forest through
measuring indicators of forest health and sustainability of foreign resources. Every
year they do mega planting of more than 10,000 landscape plants on campus.

42
UPM has set up Serdang Biomass Town, a centre for the recycling of used cooking
oil into biodiesel oil for vehicles and machinery on campus, for the neighbouring
residential community of Sri Serdang. Those who donate get organic fertilisers in
exchange, a byproduct of the recycling process. This has proven to be hugely
popular and donations also come from outside Sri Serdang.
UPM Faculty of Environmental Studies houses Putra Wastebank which takes in
fabric for recycling into other products via third party cooperation. It takes note of
recyclable items credited in the Wastebank record book and “pay” sellers in the
form of bicycle rental hours at the end of a semester. UPM encourages students to
ride bicycles to reduce carbon on campus. They have dedicated bicycle lanes and
covered pedestrian lanes. The university community observes ‘no vehicle day’ on
Saturday. During registration week for the academic year, students get a rebate for
bicycle purchase. UPM collaborates with Toyota in the use of electric vehicles for
transport as well as research with the Faculty of Engineering.
They also welcome moves such as the ban on smoking at all eateries and the
impending ban on the use of plastic straws recently introduced by the government.
While UPM is a no-smoking campus since 2011, environmental friendly policies
from the Health Ministry and the Ministry of Energy, Science, Technology,
Environment and Climate Change (MESTECC) are creating avenues for their
researchers to come up with solutions that help environment conservation. A UPM

43
researcher has conducted research to produce straws that can degrade faster than
existing ones. Talks are underway with the industry to pave the way for production.
2.5.2 Universiti Utara Malaysia (UUM)
Universiti Utara Malaysia (UUM) once again proves its determination in the
international ranking rating when listed for the first time in the UI GreenMetric
World University Ranking. Based on the result announced on 22nd January 2016,
UUM has successfully placed itself at 44th in the world. UUM achieved encouraging
result in the education category ranked at 7th place in the world. The success of this
ranking hinges on the offered environmental courses in their academic programmes
and numbers of community programmes associated with the nature.
UUM also was ranked at the first place in the transportation and education
categories. This indicated that UUM is taking it seriously in the effort to educate the
campus members and others generally the importance of environmental care. This
evidences that UUM is taking the effort the active roles of UUM academicians
involved in researches and publications with regard to environment. Apart from
that, this also proves the active role of UUM academicians involves in researches
and publications related to the environment being recognised. This in turn will
inspire the Discovery UUM programme this year. Particularly, UI GreenMetric
indicators are Setting and Infrastructure (15%), Energy & Climate Change (21%),
Waste (18%), Water (10%), Transportation (18%) and Education (18%). Setting &
Infrastructure looks into the university’s involvement in providing green
44
environment and environmental care. While Energy & Climate Change refers to the
university’s effort in energy efficiency management, and at the same time takes
nature and energy resources into account. Waste refers to the programme and waste
treatment emphasised by the university, i.e. organic waste treatment, recycle
programme and policy to reduce the use of plastics and polystyrenes in campus.
Water also refers to the effort to reduce water wastage. Transportation refers to the
policy in the effort to reduce the use of motor vehicle in campus. Lastly, Education
looks at the university’s role in creating future generation that cares about the
environment.
Institute of Quality Management (Institut Pengurusan Kualiti-in Malay) (IPQ) as
the secretariat will keep driving and collaborate with all Peringkat Pusat
Tanggungjawab (PTJ) to ensure UUM’s world raking agenda is realised
successfully. Hence, members of UUM should start working together developing
strategies and initiatives to improve UUM ranking to a higher level in the UI
GreenMetric rating in the future. IPQ would like to extend our heartiest gratitude to
the UI GreenMetric working committee involves in the process of raking such as
Jabatan Pembangunan dan Penyenggaraan (JPP), Research and Innovation
Management Centre (RIMC), Hal Ehwal Pelajar (HEP), School of Technology
Management and Logistics (STML), School of Tourism, Hospitality and Event
Management (STHEM), School of Government (SOG), Webmaster, UUM Press,
Perpustakaan Sultanah Bahiyah (PSB), Registrar, UUM Information Technology
45
(UUMIT), Department of Security, Department of Treasurer and Unic Leisure
TransTour, bus company in UUM.
2.5.3 Universiti Malaya (UM)
Universiti Malaya (UM) excellently with 3 significant achievements as follows: (i)
Best Water Management in Malaysia (95%), (ii) Best Education & Research
(Sustainability) in Malaysia (87.5%), and (iii) Best Waste Management in Malaysia
(79.2%). UM achievements are made possible through collective contributions with
the aspiration of ‘Smart-Partnership’ by UM Living Labs Grant Programme,
Department of Development & Estate Maintenance (JPPHB) and various key-
stakeholders across institutes, faculties and centers. They play an important role as
an active agent-of-change in developing UM to be among the best Eco Campus
Model locally and globally.
Launched in 2015, the UM Eco Campus Blueprint guides the institution’s green
initiatives in eight core areas, namely Landscape and Biodiversity Management,
Waste Management, Water Management, Energy Management, Transportation
System Management, Green Procurement, Education Management-Environment
and Climate Change, and Change Management in Governance, Participation and
Communication. Short and long-term action plans are displayed to provide the
campus community opportunities to take proactive measures, in stages, as a show
of support in promoting UM as one of the prominent eco campus models at the
local, regional and international levels in tandem with its status as a leading

46
university in research and education. UM Eco Campus initiatives aim to develop a
novel campuswide sustainability framework with support from UM Living Labs.
These initiatives contribute towards minimising harmful environmental impact on
campus, especially by decreasing carbon emission, to drive UM to be one of the
prominent eco campuses in the nation and the world. The initiatives cover mainly,
but are not limited to, the grounds of UM’s main campus of 360 hectares.
UM Living Labs enable the integration of research and development, demonstration
and deployment of sustainability solutions on the ground, promotion of multi-inter-
and-transdisciplinary research and, most importantly, the labs befit the need of the
community for a better campus environment. UM Living Labs are in their fourth
cycle, where solutions are applied on a larger scale throughout the campus. They
have already shown more than a reduction of 6,590,000 kg carbon dioxide Green
House Gases emission, with direct and indirect monetary gains from these collective
initiatives amounting to more than RM1.2 million after one year.
Over the years, UM initiatives, namely Water Warriors (water management), UM
Zero Waste Campaign (waste management) and The RIMBA Project (landscape
and biodiversity management), have attracted numerous participants both local and
international. In putting forth sustainability into action, sharing of best practices,
within the community and without is another important learning curve that UM have
to scale continuously.

47
Best practices in UM Eco Campus initiatives are embedded in a series of guidelines
including: Guideline on Green Waste and Wood Waste Separate Collection and
Management for Institutional Area; Guideline on Energy Monitoring and
Management for Energy-Saving in UM; UM Campus Transport Guidelines; UM
Green Procurement Guidelines; and Eco-Surau Guidelines: Imarah Green Project
of Academy of Islamic Studies-Surau.
2.5.4 Universiti Kebangsaan Malaysia (UKM)
Universiti Kebangsaan Malaysia (UKM) has made efforts to apply the concept of
sustainability in the management of the campus with the formation of the Institute
for Environment and Development (LESTARI) in 1994. UKM’s commitment to
sustainability has been continued through the launch of the 2007, Sustainability
program and the Sustainable UKM Charter. The main purpose of the launch is the
effort of UKM to coordinate the sustainability management in the entire campus.
Furthermore, the principles of a sustainable development in UKM were developed
based on the 1992 Rio Principles, Agenda 21, the 2002, Johannesburg sustainability
implication plans, the framework developed in Malaysia such as Vision 2020, and
other principles. The six sustainability principles of UKM are as follows: (i) display
institutional practices that promote sustainability and give preference to university
suppliers who practice sustainability; (ii) improve community well-being and
productivity; (iii) improve the health of the campus ecosystems; (iv) promote
environmental research and development of institutions in the aspect of
sustainability; (v) develop planning tools to support responsible decision-making;
48
and (vi) utilize sustainability indicators to monitor, report, and improve
sustainability on an ongoing basis.
UKM has its own sustainable development objectives, namely to: (i) conserve and
manage the resources and water supply so that it is sufficient and of quality; (ii)
manage energy usage that is efficient and sustainable; (iii) implement an effective
solid waste management; (iv) establish the identity of UKM in civic building
designs; (v) create an identifiable landscape; (vi) improve the effectiveness and
accessibility of public transport; (vii) enhance the quality of life of the campus
community; and (viii) improve the awareness of the campus community about
sustainable living.
(Source: Principles and Objectives of sustainable UKM was retrieved from the Main
Physical Development Plans of UKM Bangi Campus, 2007-2020).
2.5.5 Universiti Teknologi Malaysia (UTM)
Universiti Teknologi Malaysia (UTM) Campus Sustainability initiatives grew
organically, concurrent with the campus society social learning process. It is a year
of experiencing on how sustainability govern and adopt into campus organizational
behaviour and practice. The effort was complement by the performance of UTM
Sustainable Energy Management Program (UTM SEMP) since 2009.
a. 2009: Campus Sustainability voluntary initiative start with saving paper
(reduce and reuse paper) campaign, recycling and saving energy.

49
b. 2010: UTM Campus Sustainability Policy developed. UTM Campus
Sustainability Organization established which consist of Sustainable Campus
Council and Technical Expert.
c. 2011: Unit of Sustainability as a secretariat for the UTM Campus Sustainability
Organization set up. The unit was placed under the Office of Assets and
Development (OAD). Then, UTM Energy Policy endorse by University
Management Committee 29 May. Launched ‘Monday is UTM Recycling Day’
and Green Office. The first organization awarded 1st EMGS AEMAS at
Malaysia Green Technology Corporation (MGTC) Seminar on Energy in 29
August.
d. 2012: Arked Meranti inaugurated as Sustainable Arcade as to provide
sustainable service to the campus community.
e. 2013: Office of Campus Sustainability (OCS) established to replace the Unit
of Sustainability. UTM Campus Sustainability Balance Scorecard developed.
First review of UTM Sustainable Energy Policy and lastly, UTM is the first
organization awarded 2nd STAR EMGS AEMAS at Energy Conference 29
January.
Besides, the Massachusetts Institute of Technology-Universiti Teknologi Malaysia
(MIT-UTM) and Malaysia Sustainable Cities Program (MSCP) is a five-year effort,
initiated and run by faculty at the Massachusetts Institute of Technology (MIT) and
the Universiti of Teknologi of Malaysia (UTM), with generous support by the
Ministry of Education Malaysia. The MSCP mission is to study and document

50
sustainable city development efforts in Malaysia. Research findings will be
developed into online instructional materials to enhance and extend the teaching of
sustainable city development across universities in the global South.
2.5.6 Universiti Malaysia Sabah (UMS)
Universiti Malaysia Sabah (UMS) continues to move forward when it jumped 72
notch to be at 173 in the world ranking of the UI GreenMetric World University
Ranking 2015. UMS would allow for an even better ranking based on the efforts
that were underway, especially in activities related to the sustainability of the
campus and environmental management. They have carried out various
environment-friendly activities such as the efficient use of energy and the
improvement of facilities including the use of bicycles within the campus area, in
addition to the conservation and preservation of environment through various
teaching and research. The establishment of a Recycling Centre in the campus that
will adopt the practice of Ecofarm could greatly strengthen the university to further
improve its ranking in UI GreenMetric.
2.5.7 Universiti Sains Islam Malaysia (USIM)
Realising the importance of environmental sustainability, Universiti Sains Islam
Malaysia (USIM) has launched an environmental awareness programme known as
USIMBIOSIS. With the theme ‘Living Together’, the campaign also witnessed 50
trees being planted around the campus, all sponsored by retailer hypermarket, Tesco

51
Stores (M) Sdn Bhd. The aim of USIMBIOSIS is to create a sustainable campus
and promote the importance of sustainability among students and staff. USIM was
ranked at 361th order in the UI Green Metric World University Ranking in 2018.
This shows that USIM is in making the right steps in improving the environment
including cleaning the campus lake and building jogging and cycling tracks around
the campus. New initiatives have also been implemented to create better
environmental sustainability such as reducing electricity consumption by up to 5%
per year, carrying out a study on environmental awareness among the university
community and reducing the use of polystyrene and plastic bags on the campus.
USIM also has launched the 4R campaign (Reduce, Reuse, Recycle and Restore)
through the use of transparent recycling bins around campus. In addition USIM is
committed to the use of alternative energy such as solar power in certain areas of
the campus such as bus stops.
2.6 Sustainable Behaviour
Sustainable behaviour (SB) can be defined as a set of effective, deliberate, and
anticipated actions aimed at accepting responsibility for conservation and
preservation of physical and cultural resources. These resources include integrity of
animal and plant species, as well as individual and social well-being, and safety of
present and future human (Najera, 2010).
The examples of environmentally SB in practice are waste separation, switching off
electronic devices when they are not in use, and using both sides of a sheet of paper

52
when writing, drawing or printing. While the examples of socially SB actions are
donating money, buying fair-trade products and not engaging in any cultural or
religious discrimination (de Leeuw et al., 2014).
Literally, SB refer to consumer, and in this context, it refers to student’s actions that
meet the needs of the present without compromising the ability of future consumer
generations to meet their own needs (Minton, Kahle, & Kim, 2015). The idea for
this study of SB arises from two viewpoints of environmental psychology, and
sustainability as a developing concept. Environmental psychology explores the
interaction between people and their physical setting, or in other terms, the
relationship between people (human well-being) and the broader environment
(socio-physical context) (Tapia-Fonllem et al., 2013). SB is a great challenge for all
mankind to guarantee a viable future and it can be defined as a development that
meets the needs of the present without compromising the ability of future
generations to meet their own needs, that integrated to the series of actions intended
at protecting both of the physical and the social environment (Leeuw et al., 2014).
Three main differences exist between this definition and that considered by Corral-
Verdugo and Pinheiro (2004):
1) This definition considers responsibility, that is, the capacity for responding or
acting instead of competing.
2) It addresses prevention and conservation, not only preservation.
3) It includes individual and societal material safety.
53
Nevertheless, in order to assure long-term sustainability, according to Gardner and
Stern (2002), the following must be accomplished:
1) Exponential human population growth must be hesitated.
2) Economic and material growth must be controlled, and such growth must be
oriented toward qualitative development rather than physical expansion, and toward
material sufficiency and security for all.
3) Profound changes must be made in core societal beliefs, values, and ethics
concerning population growth, material growth, wealth, and well-being, as well as
in basic conceptions of the relationship between humans and the rest of nature,
acknowledging the complexity of global systems and humanity’s inability to
manage these systems solely for own purposes (Najera, 2010).
SB has three main characteristics: i) it is an outcome or result; ii) it is effective, and
iii) it is complex. In this study, it is considered to be the set of effective and
deliberate actions directed toward conservation and/or preservation of physical and
cultural resources, integrity of animal and plant species, and individual and social
well-being and safety of present and future generations. In the aspect of this study,
the elements of SB include of waste reduction, energy conservation, water
conservation and transportation. Then, the examples of actions that show of SB are
such as turning off electricity not in use and purchasing of energy saving appliances,
turning off taps not in use, and the use of designated recycle bins and some reuse
activities. The word behaviour has three definitions: i) the manner of conducting
oneself, ii) anything that an organism does involving action and response to

54
stimulation, and iii) the response of an individual, group, or species to their
environment (Tapia-Fonllem et al., 2013).
According to Tapia-Fonllem et al. (2013), behaviourists maintain that SB, like any
behaviour, is under control of both external incentives and an individual’s
circumstances. Behaviour is activated shortly after a conditioned stimulus or after a
primary reward if no conditioned stimulus exists. The core implements of operant
conditioning are positive and negative reinforces. Positive reinforcement is a
consequence of a given behaviour which causes that behaviour to occur with greater
frequency. Negative reinforcement or punishment is a consequence of a behaviour
which causes that behaviour to occur with less frequency. A lack of any
consequence following a behaviour leads to the termination of that behaviour.
Whenever a behaviour is negligible, producing neither favourable nor unfavourable
consequences, it will occur with less frequency. When a previously reinforced
behaviour is no longer reinforced with either positive or negative reinforcement, it
leads to a decline in the response (Najera, 2010). For behaviourists, no internal
phenomenon significantly explains behaviour because internal phenomena are
intangible and subjective, therefore may not be scientifically studied. By contrast,
cognitive science indicates that internal or mental phenomena lead to behaviour
(Tapia-Fonllem et al., 2013).
One more group of psychological variables considers SB, the set of actions aimed
at protecting the socio-physical resources of this planet, therefore, SB is also defined
as a series of actions intended at protecting both the physical and the social
55
environments. Although sustainable behaviour and pro-environmental behaviour
(PEB) is synonymous, but PEB is only emphasize effort to protect the natural
environment, while, SB specifies action to protect both natural and human (social)
environments (Tapia-Fonllem et al., 2013). Although SB is, in practical terms,
synonymous with PEB the latter has been used to emphasize efforts to protect
the natural environment, while the former specifies actions aimed at protecting
both the natural and the human (social) environments. The reason why in this study,
we prefer the use of the SB term is for most researchers, SB is deliberate (i.e.,
purposeful) and effective (i.e., problem-solving). This behavior is also anticipatory,
that is it is future-oriented, by definition, because it considers the needs of
forthcoming generations coincidently with the satisfaction of present needs. Since
sustainable development claims for the active protection of natural resources while,
at the same time, meeting the needs of people, the conservation of human resources
(society, culture, people’s survival and wellbeing) is as important as the
conservation of ecosystems (all living beings and the inanimate substrate on which
they base their subsistence) (Tapia-Fonllem et al., 2013).
2.6.1 Predictors of Sustainable Behaviour
Table 2.3 shows the diversity of direct predictors of SB commonly investigated in
previous studies. Table 2.3 summarises the predictor factors of SB.
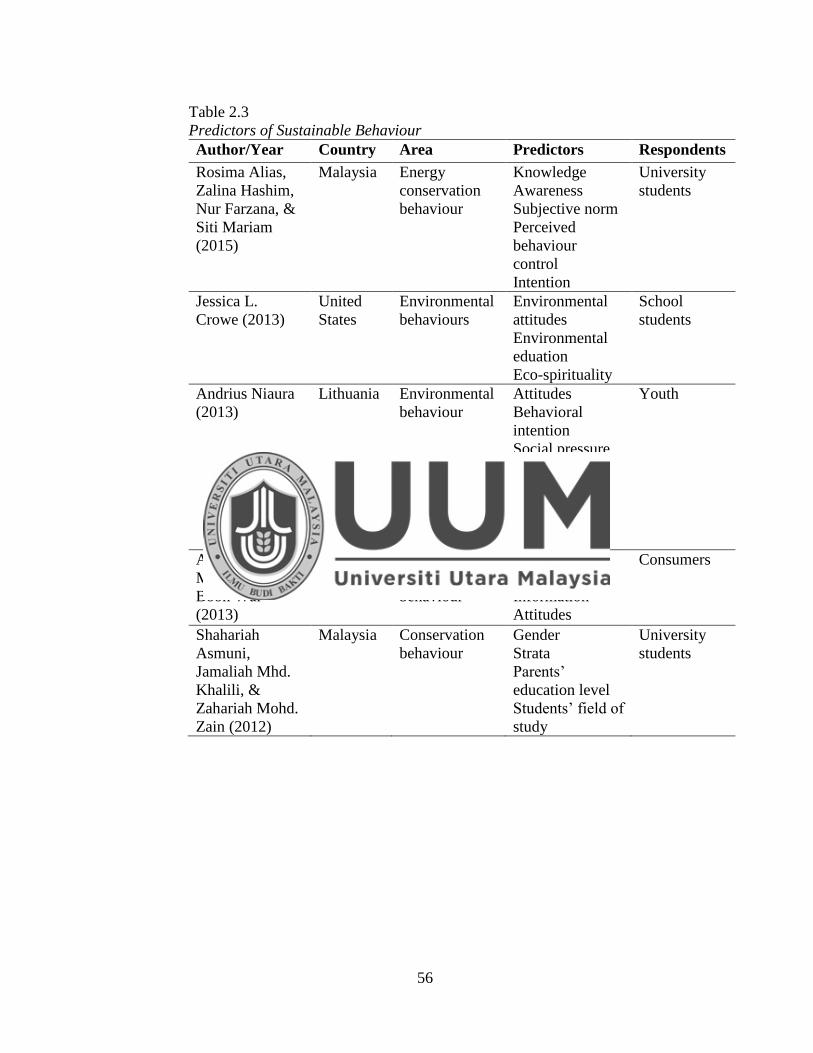
56
Table 2.3
Predictors of Sustainable Behaviour
Author/Year Country Area Predictors Respondents
Rosima Alias,
Zalina Hashim,
Nur Farzana, &
Siti Mariam
(2015)
Malaysia Energy
conservation
behaviour
Knowledge
Awareness
Subjective norm
Perceived
behaviour
control
Intention
University
students
Jessica L.
Crowe (2013)
United
States
Environmental
behaviours
Environmental
attitudes
Environmental
eduation
Eco-spirituality
School
students
Andrius Niaura
(2013)
Lithuania Environmental
behaviour
Attitudes
Behavioral
intention
Social pressure
Perceived
behavioral
control
Environmental
knowledge
Youth
Adeline Kok Li-
Ming & Teoh
Boon Wai
(2013)
Malaysia Green
purchase
behaviour
Usability
Trust
Information
Attitudes
Consumers
Shahariah
Asmuni,
Jamaliah Mhd.
Khalili, &
Zahariah Mohd.
Zain (2012)
Malaysia Conservation
behaviour
Gender
Strata
Parents’
education level
Students’ field of
study
University
students

57
Table 2.3 (Continued)
Author/Year Country Area Predictors Respondents
Ellen Matthies,
Sebastian
Selge,&
Christian A.
Klockner (2012)
Germany Recycling /
Re-use
behaviour
Subjective
norm
Personal
ecological
norm
Awareness of
need
Awareness of
consequences
Communicate
need
Communicate
consequences
Injuctive norms
Descriptive
norms
Pupils of
primary
schools
Alvarez Suarez,
Pedro,Vega
Marcote, &
Pedro (2010)
Spain Sustainable
environmental
behavior
Knowledge
Attitude
Intention
Secondary
education
students
Kelly S.
Fielding, Rachel
McDonald, &
Winnifred R.
Louis (2008)
Australia Environmental
activism
General
attitudes
Attitude
Subjective
norm
Perceived
behavioural
control
Self-identity
Group
membership
Intention
University
Students
Christopher
Bratt (1999)
Norway Recycling
behaviour
Experienced
social norm
Assumed
consequences
Personal norm
Residents
Based on Table 2.3, previous studies showed many predictors of SB / environmental
behaviour are focused on knowledge, attitude, intention, SN, PBC, awareness,
concern (Alias et al., 2015; Derahim et al., 2012; Kumar, 2012; Niaura, 2013; Pedro

58
& Pedro, 2010). However, little studies focused on spirituality that influencing SB
(Crowe, 2013b). Some of these unexplored spirituality appear to be vital and worthy
of investigation in the context of sustainable behaviour. An investigation of these
issues is important because the spirituality can serve as the inspiration for students
to critically examine their existing environmental attitudes, question their
assumption and beliefs, and through reflection and discourse, transform their view
of their place, responsibility, and importance in the natural world (Crowe, 2013a).
Previous studies have not empirically verified spirituality as a moderator of
sustainable behaviour in research model. However, there are studies in other area of
studies that modified spirituality as moderator (Adawiyah, 2011; Tombaugh,
Mayfield, & Durand, 2011). Therefore, this research will be focusing on spirituality
as moderating variable that will affect SB.
2.7 Knowledge
The term knowledge can refer to anything from general principles knowledge to
specific skill knowledge or all types of knowledge combined into one component
(Kibert, 2000). In Ajzen and Fishbein (1980) knowledge is referred as beliefs.
Knowledge is also referred to as a cognitive component. Regarding the relationship
of all of the components of the TRA, Ajzen and Fishbein (1980) remark that, on the
basis of different experiences, people may form different beliefs about the
consequences of performing a behaviour and different normative beliefs. The
beliefs, in turn determine attitudes and SN which then determine intention and the
corresponding behaviour. We can gain understanding of a behaviour by tracing its
59
determinants back to underlying beliefs, and we can influence the behaviour by
changing a sufficient number of these beliefs. Thus knowledge, or beliefs, have a
mediated connection through attitudes, subjective norms and intention prior to
behaviour.
Knowledge can be defined as one’s ability to recognize environmental problems,
the causes and consequences of such problems, including facts and concepts
necessary for explanation (Haron et al., 2006). The knowledge term encompasses
the level of environmental awareness amongst the individuals, linkages between
different aspects of environment and a sense of awareness to keep the environment
intact for future generations (Kumar, 2012). Therefore, from the definition derived
from previous studies, knowledge of various ecological problems, issues and
actions are important to prevent or solve these issues on sustainability, in directly,
increasing the sustainable behaviour among university students. The following
section will discuss the relationship between knowledge and sustainable behaviour.
2.7.1 Relationship between Knowledge and Sustainable Behaviour
A number of studies have empirically tested the effect of knowledge on SB (Haron
et al., 2006; Michalos et al., 2009; Aini Mat Said et al., 2003; Syed Idros, 2014).
Firstly, the research conducted by Haron et al. (2006) in area of sustainable
consumption behavior to investigate the relationship between knowledge and actual
behaviour. The result of the study shows that there is significant and positive
relationship between knowledge and sustainable consumption behaviour. Research

60
by Aini Mat Said et al. (2003) found that knowledge is positively and significantly
associated with sustainable development among Malaysian teachers.
While, finding by Michalos et al. (2009) indicated that the hierarchical regression
of environmental knowledge was insignificantly associated with SB among
students. Research by Syed Idros (2014) found that environmental knowledge has
insignificant relationship between SB among university students. Table 2.4
summarised the relationship between knowledge and SB in previous studies in
sustainability context.
Table 2.4
Previous Studies of the Relationship between Knowledge and Sustainable
Behaviour
Authors Country Area Respondents Finding
Syed Idros
(2014)
Malaysia Environmental
Behaviour
University
students
Insignificant
Michalos,
Creech,
McDonald
, & Kahlke
(2009)
Columbia Sustainable
behaviour
University
students
Insignificant
Haron,
Paim, &
Yahaya
(2006)
Malaysia Sustainable
Consumption
Behaviour
Householders Significant
Positive
Aini Mat
Said et al.
(2003)
Malaysia Sustainable
Development
Malaysian
teachers
Significant
Positive
61
As can be clearly seen from the above table, there is no repetitive pattern in the
findings of the relationship between knowledge and SB over the years, which
requires a necessity for more empirical research in the sustainability area.
2.8 Attitude
Attitude has been interpreted and define in various ways. Newhouse (1991) defines
an attitude as an enduring positive or negative feeling about a person, object or
issues. While, Eagly and Chaiken (1993) define an attitude as a psychological
tendency that is expressed by evaluating a particular entity with some degree of
favour or disfavour.
Attitudes towards a behaviour are assumed to be based on behavioural beliefs,
which are a person’s beliefs about the likely consequences of performing the
behaviour (Ajzen, 2006). According to Beck and Ajzen (1991), attitude towards
behaviour refers to the degree to which a person has a favourable or unfavourable
evaluation of the behaviour in question. Holmer and Kahle (1988) stated that
attitudes are based on values, which beliefs that transcend specific situations and
are used to resolve conflicts or make decision.
Therefore, from the definition of attitude that has been explained above, in this
study, attitude refers to the student belief on the important of purchase eco-products,
recycling, conserving energy, and reducing pollution. Thus, it is important to study
about attitude, which is the predictor that enhancing sustainable behaviour among

62
university students in Malaysia. The following section will discuss the relationship
between attitude and SB.
2.8.1 Relationship between Attitude and Sustainable Behaviour
Previous studies conducted in sustainability setting showed a significant and
insignificant influence of attitude on SB (Abd-Ella, Somaa, & Mohammed Ebad-
Allah, 2012; Chen et al., 2011; Graefe & Thapa, 2000; Osman, Abdullah, & Manaf,
2014; Poortinga, Steg, & Vlek, 2004; Aini Mat Said et al., 2003; Tan, Nasreen-
Khan, Hong, & Lam, 2015).
Finding by Abd-Ella Somaa, and Mohammed Ebad-Allah (2012) showed that the
hierarchical regression of attitude was significantly associated with environmental
behaviour among farmers. Then, research by Chen et al. (2011) found that
relationship between attitude and pro-environmental behaviour among nations was
significant. Study by Tan, Nasreen-Khan, Hong and Lam (2015) found that attitude
was significantly and positively associated with green purchase behaviour among
consumers. In addition, study conducted by Osman, Abdullah and Manaf (2014)
shows that relationship between attitude and recycling behaviour among
undegraduate business students was significant. This implicates that once the
respondents possessed a positive attitude towards recycling, the possibility to
recycle will be higher. The standard deviation for attitude toward recycling
behaviour is 1.00 and the mean score is 5.68 which are reflected that attitude
influenced recycling behaviour. The correlation result is 0.423 and conforms that

63
there is a significant association between attitudes and recycling. The result
demonstrated that multi-collinearity does not exist in this study because the
correlation coefficient (r) is less than 0.80. The result of regression analysis also
shows that attitude is significantly related to recycling behaviour (β = 0.251, p <
.01).
Table 2.5 provides a summary of previous studies regarding the relationship
between attitude and SB.
Table 2.5
Summary of Previous Studies on the Relationship between Attitude and
Sustainable Behaviour
Author Area Country Respondents Dependent
Variable
Finding
Tan,
Nasreen-
Khan,
Hong, &
Lam
(2015)
Green
Purchase
Behaviour
Malaysia Consumers Green
Purchase
Behaviour
Significant
Osman,
Abdullah,
& Manaf
(2014)
Recycling
Behaviour
Malaysia Undergraduat
e Business
Students
Recycling
Behaviour
Significant
Abd-Ella,
Somaa, &
Mohamme
d Ebad-
Allah
(2012)
Environm
ental
Behaviour
Egypt Farmers Environmen
tal
Behaviour
Significant
Chen et al.
(2011)
Pro-
environme
ntal
behaviour
China Nations Pro-
environmen
tal
Behaviour
Significant
Poortinga,
Steg, &
Vlek
(2004)
Environm
ental
Behaviour
Netherlan
ds
Householders Environmen
tal
Behaviour
Insignificant

64
Table 2.5 (Continued)
Author Area Country Respondents Dependent
Variable
Finding
Aini Mat
Said et al.
(2003)
Sustainability Malaysia Malaysian
teachers
Sustainable
Behaviour
Significant
Graefe &
Thapa
(2000)
Environment
al behaviour
Clinton Forest
Recreationist
Environmen
tal
behaviour
Insignifica
nt
As can be noticeably seen from the above table, there is no repetitive pattern, which
inconsistent in the findings of the relationship between attitude and SB over the
years, thus, it requires a stipulation for more empirical research in the sustainability
area.
2.9 Subjective Norm
Subjective norm (SN) is defined as a person's perception that others desire the
performance or non-performance of a specific behaviour, this perception may or
may not reflect its importance what others actually think he/she should do (Ajzen
& Fishbein, 1980). SN refer to an individual’s beliefs that the society such as family,
friends, and coursemates, believe that the individual should or should not engage in
a specific behaviour. Previous research show that people are influenced by the
behaviour of others. This influence can pressure an individual to conform to the
behaviour of a particular group, or may convey to either what most people do in a
given situation (i.e. descriptive norm) or behaviours that are associated with
approval or sanctions (i.e. injunctive norm) by others (Reno, Cialdini & Kallgren,
1993).

65
Therefore, since the environmental problems have a social dilemma, individual
environmental attitude and behaviour are influenced by the norm of social groups
such as friends and family (Reno, Cialdini & Kallgren, 1993; Taylor & Todd, 1995).
For example, the behaviour such as recycling, reuse of clothes and furniture, and
walking instead using the car for the sake of preserving the environment is subject
to a normative influence from friends and associates. Hence, it is important to study
about subjective norm, which is the predictor that enhancing sustainable behaviour
among university students in Malaysia. The following section will discuss the
relationship between subjective norm SN and SB.
2.9.1 Relationship between Subjective Norm and Sustainable Behaviour
Matthies et al. (2012) demonstrated that the SN had a direct and significant
influence on SB. It is worth noting that the few studies conducted in Malaysia have
not given enough attention to study the role of SN. Previous studies conducted in
sustainability setting showed a significant and insignificant influence of SN on SB
(Alias et al., 2015; Armitage & Conner, 2001; Han, 2015; Matthies et al., 2012;
Onwezen et al., 2013; Whitmarsh & O’Neill, 2010).
Finding by Matthies et.al (2012) shows that the hierarchical regression of subjective
norm was significantly associated with recycling and re-use behaviour among
pupils. Then, research by Han (2015) found that relationship between SN and pro-
environmental behaviour (PEB) among travelers was significant. Study by Alias et.

66
al (2015) found that SN was significantly associated with energy conservation
behaviour among university students.
While, finding by Whitmarsh and O’Neill (2010) shows that the hierarchical
regression of SN was insignificantly associated with PEB among residents.
Research by Onwezen et. al (2013) found that SN have insignificant relationship
between PEB among Netherlands nations.
Table 2.6 provides a summary of findings of the previous studies that investigated
the relationship between SN and SB.
Table 2.6
Previous Studies on the Relationship between Subjective Norm and Sustainable
Behaviour
Author Area Country Responde
nts
Dependent
variable
Finding
Alias et al.
(2015)
Energy
Conservati
on
Behaviour
Malaysia University
students
Energy
Conservatio
n Behaviour
Significant
Han (2015) Travelers'
pro-
environme
ntal
behavior
Korea
Travelers Pro-
environmen
tal actions
Significant
Onwezen et
al. (2013)
Pro-
environme
ntal
behaviour
Netherlan
ds
Nations Pro-
environmen
tal
behaviour
Insignificant
Matthies et
al. (2012)
Recycling
& Re-use
behaviour
Germany Pupils Re-use
behaviour
Recycling
behaviour
Significant

67
Table 2.6 (Continued)
Author Area Country Respondents Dependent
variable
Finding
Whitmarsh
& O’Neill
(2010)
Pro-
environme
ntal
behaviours
United
Kingdom
Residents Pro-
environmen
tal
behaviour
Insignifica
nt
Armitage &
Conner (
2001)
Environm
ental
Britain Publics Actual
behaviour
Insignifica
nt
Because the findings of the past research works are inconsistent and due to limited
number of studies that have tackled the between subjective norm and actual
behavior in Malaysia, thus, it requires a need for more empirical research in SB to
fill the gaps in a sustainability setting.
2.10 Perceived Behavioural Control
Perceived Behavioural Control (PBC), reflect the extent to which individuals
perceived the behaviour to be under volitional control (Mahmud & Osman, 2010).
Ajzen and Madden (1986) defined PBC in straightforward way as a person’s belief
as to how easy or difficult performance of the behaviour is likely to be. PBC consists
of two component which are ‘self-efficacy’ and ‘controllability’. Self-efficacy
component of PBC is dealing with easiness or difficulty of performing behaviour
while controllability involves people belief that they have control over the
behaviour (Ajzen & Fishbein, 2002).
Ajzen (1991) stated that if individuals perceive constraints on intended behaviours,
PBC could help explain discrepancies between intention and behaviour. Therefore,

68
the importance of attitudes, SN and PBC will vary across situations and behaviours.
Ajzen (1988) stated that PBC have practical constraints relating to situational
conditions whereas intention refers to an individual’s willingness to perform
behaviour. For example, if someone wants to use a solar water heater, but there are
no solar water heaters to purchase, or there are no materials or knowledge to make,
then it is not possible for the individuals to use it. Hence, it is important to study
about PBC, which is the predictor that enhancing sustainable behaviour among
university students in Malaysia.The following section will discuss the relationship
between PBC and SB.
2.10.1 Relationship between Perceived Behavioural Control and Sustainable
Behaviour
A number of studies carried previously found a significant relationship between
PBC and actual behavior (Alias et al., 2015; Busse & Menzel, 2014; de Leeuw et
al., 2014; Han, 2015; Kumar, 2012), while a few studies found an insignificant
relationship (Onwezen et al., 2013; Whitmarsh & O’Neill, 2010).
Finding by de Leeuw, Valois and Sexas (2014) shows that the hierarchical
regression of PBC is significantly associated with SB among high school students.
Then, research by Han (2015) found that relationship between PBC and PEB among
travelers is significant. Study by Alias et. al (2015) found that PBC is significantly
associated with energy conservation behaviour among university students. Research
by Kumar (2015) found that relationship between PBC and purchasing behaviour

69
for environmentally sustainable products among consumers is significant. Study
conducted by Busse and Menzel (2014) shows that the relationship between PBC
and PEB among student is significant.
While, finding by Whitmarsh and O’Neill (2010) shows that the hierarchical
regression of PBC is insignificantly associated with PBC among residents. Research
by Onwezen et. al (2013) found that PBC have insignificant relationship with PEB
among Netherlands nations. Table 2.7 below provides a summary of the results on
the influence of PBC upon actual behaviour in different industries.
Table 2.7
Summary of Previous Studies on the Relationship between Perceived Behavioural
Control and Actual Behaviour
Author Area Country Respondent Results
Han (2015)
Travelers'
pro-
environmen
tal behavior
Korea Travelers Significant
Alias et al. (2015) Energy
Conservatio
n Behaviour
Malaysia University
Students
Significant
de Leeuw, Valois,
& Seixas (2014)
Sustainable
Behaviour
Canada High School
Students
Significant
Busse & Menzel
(2014)
Pro-
environmen
tal
behaviour
Germany Students Significant
Onwezen et al.
(2013)
Pro-
environmen
tal
behaviour
Netherlands Nations Insignificant

70
Table 2.7 (Continued)
Author Area Country Respondent Results
Kumar (2012) Purchasing
Behaviour
for
Environmen
tally
Sustainable
Products
India Consumers Significant
Whitmarsh &
O’Neill (2010)
Pro-
environmen
tal
Behaviour
UK Residents Insignificant
As can be noticeably seen from the above table, there is no repetitive pattern, which
inconsistent in the findings of the relationship between PBC and SB over the years,
thus, it requires a stipulation for more empirical research in the sustainability area.
2.11 Spirituality
The human spirit can be defined as an amalgam of energies, both mental and
physical can recreate a sustainable world and reverse the path of development,
which is destructive and vicious (Vaughan-Lee, 2013). Sustainability depends upon
spiritual wakefulness and an attitude of conscientiousness. It has been recognised
by spirituality that the creation is blessed and this purity should be established by
behavior. In the wake of growing environmental problems like global warming,
extinction of species and overconsumption, human beings have to change our
underlying attitudes and beliefs about the earth, and the spirituality responsibilities
towards the planet (Macy, 2012).
71
Besides, human’s spiritual dimension is considered the distinctive feature from
other living things. We are pleased by thinking that we are different because we
respect spiritual laws, because we are conscious and have feeling to assess the world
of unspeaking life, where the strongest is the best. From this perspective, human
behavior is directed by different principles than the ones that reinforce the rest of
the living world. These principles are considered to be beyond the natural ones,
being superior since they lead to more than survival of the spiritual satisfaction.
Nevertheless, the overall behavior of human population is not different in ecologic
terms from the behavior of other species in similar conditions. Within the human
population, relations among individuals and the systems resulting from their
interaction are different (Bran, Radulescu, & Ioan, 2013).
Based on the previous studies, showed that the global environmental dilemma is a
consequence of a spiritual and moral predicament resulting from a lack of
connectedness to, or alienation from, ‘the other than human’ natural world,
therefore it is necessary to build the connection between spirituality and sustainable
behaviour (Berry, 2009; Kinsley, 1995; Maathai, 2010; Rockefeller & Elder, 1992;
Vaughan-Lee, 2013).
2.11.1 Relationship between Spirituality and Sustainable Behaviour
A number of studies have empirically tested the effect of spirituality on SB (Crowe,
2013b; Csutora & Zsóka, 2012; Mckenzie, 2005; Rai et al., 2014). The current
research aims to study how spirituality affects student’s intention to sustain

72
environments as well as the actual behavior directly and through its effect on
knowledge. The current research is targeting the Malaysia country, which remains
uncritically unexplored. Previous research about spirituality have been done in
India, United States, Hungary and Australia, however, very little research has been
done on spirituality toward SB among students in Malaysia. (Crowe, 2013a; Csutora
& Zsóka, 2012; Rai et al., 2014).
Based on previous studies, finding by Rai, Srivastava, and Shukla (2014) shows that
the hierarchical regression of spirituality is significantly and positively associated
with SB among students. Research by Crowe (2013) shows that relationship
between spirituality and environmental behaviour among students is significant.
While, study by Csutora and Zsoka (2012) found that the spirituality is
insignificantly associated with environmental behaviour among Hungarian adults.
Table 2.8 summarises the relationship between spirituality and SB in previous
studies in sustainability context.
Table 2.8
Previous Studies of the Relationship between Spirituality and Sustainable
Behaviour
Authors Country Area Respondents Finding
Rai,
Srivastava, &
Shukla (2014)
India Ecology
behaviour
Students Significant
Positive
Crowe (2013)
United States Environmental
behaviours
Students
Significant
Csutora &
Zsóka (2012)
Hungary Environmental
behaviour
Hungarian
adults
Insignificant
Mckenzie
(2005)
Australia Sustainability Publics
Insignificant

73
As can be noticeably seen from the above table, there is no repetitive pattern, which
inconsistent in the findings of the relationship between spirituality and SB over the
years, thus, it requires a need for more empirical research in the sustainability area.
2.12 Intention
TPB considers behavioural intention to be the most dominant predictor of behavior.
TPB also postulates that the most important determinant of an individual’s behavior
is behavioral intention. The individual’s intention to perform behavior, in turn, is a
arrangement of attitude towards the performance of the behaviour and SN.
Ajzen (1991) considers intention as the motivational factors that capture the quality
and quantity of effort a person is prepared to devote to performing a behavior. In
SB setting, intention is defined as the level of intensity of individual to perform the
behaviour (Alias et al., 2015). It also refered as an indication of a person's readiness
to perform a given behavior. As a general rule, the stronger the intention to engage
in behavior, the more likely should be its implementation (Han & Hansen, 2012).
Intention can be described as an indication of how hard people are willing to try, of
how much of an effort they are planning to exert, in order to perform the sustainable
behavior (Ajzen, 1991, p. 181). On the other hand, SB in the context of university
students is defined as student’s actions that meet the needs of the present without
compromising the ability of future student generations to meet their own needs
(Minton, Kahle, & Kim, 2015). In this study, SB refers to the practice of recycling,
conserve the energy and reduce environmental pollution to protect the environment.
74
2.12.1 Relationship between Intention and Sustainable Behavior
In the SB context, many studies found that the relationship between intention and
actual behavior is positive and significant. For example, Leeuw et al., (2014) found
that intention had a positive relationship with SB (β = .46, p < .01) among students.
In addition, intentions to use bike-sharing for holiday cycling that shows intention,
studied by Kaplan, Manca, Nielsen, and Prato (2015) found that the path between
intention and actual behaviour is significant. Previous study conducted by Mahmud
and Osman (2010) also shows the relationship between intention and actual
behaviour is significant in context of recycling behaviour. Therefore, from the
above results and findings, this shows that intention played an important role as
mediator and catalyst in the relationship between predictors and SB. Furthermore,
intention is the principal proximal determinant of behaviour, a stronger predictor
and shows effect on behavioural achievement.
2.12.1.1 Relationship between Knowledge and Intention
Knowledge can be defined as one’s ability to recognize environmental problems,
the causes and consequences of such problems, including facts and concepts
necessary for explanation (Haron et al., 2006). Michalos et al. (2009) argued that
knowledge primarily determines households’s intentions and actual behaviour. In a
similar vein, Pedro and Pedro (2010) pointed out that knowledge has strong ability
to predict intention in sustainability area. Previous studies conducted in
sustainability setting showed a significant of knowledge on intention (Ahmad et al.,

75
2010; Aminrad et al., 2013; Burmeister &Eilks, 2013; Kibert, 2000; Aini Mat Said
et al., 2003; Syed Idros, 2014).
Finding by Pedro and Pedro (2010) shows that the hierarchical regression of
knowledge was significantly associated with intention among secondary education
students. Then, research by Ahmad et. al (2010) found that relationship between
knowledge and intention among students was significant and positive. Study by
Aminrad et. al (2013) found that knowledge is significantly associated with
intention among secondary school students.
While, finding by Syed Idros (2014) shows that the hierarchical regression of
knowledge is insignificantly associated with intention among university students.
Research by Burmeister and Eilks (2013) in Germany found that knowledge has
insignificant relationship with intention among Netherlands nations. Table 2.9
summarises previous studies whereby inconsistent and contradictory findings are
shown.
Table 2.9
Relationship between Knowledge and Intention
Authors Country Area Respondents Finding
Syed Idros
(2014)
Malaysia Sustainable
development
University
students
Insignificant
Burmeister &
Eilks (2013)
Germany Sustainable
development
Teachers Insignificant
Aminrad et al.
(2013)
Malaysia Environmental
education
Secondary
school
students
Significant
Pedro & Pedro
(2010)
Granada Sustainable
environment
behaviour
Secondary
education
students
Significant

76
Table 2.9 (Continued)
Authors Country Area Respondents Finding
Ahmad et al.
(2010)
Malaysia Pro-
environmental
behaviour
Students Significant
Positive
Michalos et al.
(2009)
Canada Sustainable
development
Householders Significant
Aini Mad Said
et al. (2003)
Malaysia Environmental
behaviour
Teachers Significant
As can be clearly seen from the above table, there is the no repetitive pattern in the
findings of knowledge with intention over the years, which necessitates a need for
more empirical research in the mentioned area. Hence, the researcher aims to
investigate and establish the relationship between knowledge and intention within
the context of SB in Malaysia.
2.12.1.2 Relationship between Attitude, Subjective Norm and Perceived
Behavioural Control with Intention
Based on previous studies, finding by Han (2015) shows that the hierarchical
regression of attitude, SN and PBC is significantly associated with intention among
travelers. Findings indicated that attitude (attitude - intention = 0.275, p < 0.01), SN
(SN - intention = 0.201, p < 0.01), and (PBC - intention = 0.211, p < 0.01) have a
significant impact on intention.
Research by Leeuw et. al (2014) shows that relationship between attitude, SN, PBC
and intention among high school students are significant and positive. The results
shows that the students’ intention to adopt environmentally SB is a positive function

77
of their perceived control over the behaviour (β = 0.46, p < 0.01), their SB (β = 0.27,
p < 0.05) and their attitude towards these behaviours (β = 0.18, p < 0.05).
Finding by Mahmud and Osman (2010) shows that the hierarchical regression of
SN, and PBC are significantly associated with intention among malaysian school
students while attitude is insignificant and negative on intention. There is one path
coefficient which is not significant and have negative relationship direction
(Attitude - intention) (β = - 0.310, C.R = - 0.623, p > 0.05). Attitude have indirect
predictor relationship with intention (r = 0.812). The (SN - intention) path has a
significant standardized regression coefficient β = 0.59. The SN variable is the
second strongest predictor of intention. The regression path for the (PBC –
intention) is significant β = 0.687. Research by Alias et. al. (2015) shows that
relationship between attitude, SN, PBC and intention among university students are
significant.
While, research conducted by Busse and Menzel (2014) found that PBC has an
insignificant effect on intention. All the factor loadings as well as the fitted path
relationships showed two-tailed significance at the p = 0.01 level, except for the
insignificant relationship of PBC and intention.
Finding by Cordano, Welcomer, Scherer, Chile, Pradenas and Parada (2010) shows
that the hierarchical regressi on of SN was significantly associated with intention
among business students while attitude was insignificant on intention. The attitudes
variable (t = 1.33, p = 0.185) in the TRA model was not significant. For the SN
78
regression analysis, the norms (t = 13.57, p < .01) was significant on intention. Table
2.10 provides a summary of previous studies.
Table 2.10 presents a list of studies that investigated the relationship between
attitude, SN, PBC, and intention in SB setting. Attitude, SN, and PBC are shown to
have positive and significant effects on intention (Alias et al., 2015; Arbuthnott
Katherine, 2009; Busse & Menzel, 2014; Cordano et al., 2010; Cordano & Frieze,
2000; de Leeuw et al., 2014; Fielding et al., 2008; Han, 2015; Han & Hansen, 2012;
Mahmud & Osman, 2010; Matthies et al., 2012; Sahin et al., 2012; Vermeir &
Verbeke, 2008; Whitmarsh & O’Neill, 2010).
Table 2.10
Summary of Previous Studies on the Relationship between Attitude, Subjective
Norm (SN), Perceived Behavioral Control (PBC) and Intention
Author Country Area Respondent Finding
Han (2015) United
States
Pro-
environmental
behaviour
Travelers Attitude, SN and
PBC are
significant on
intention
Alias et al.
(2015)
Malaysia Energy
Conservation
Behaviour
University
students
Attitude, SN and
PBC are
significant on
intention
de Leeuw et al.
(2014)
Luxembou
rg
Sustainable
behaviour
High School
Students
Attitude, SN and
PBC are
significant and
positive on
intention
Busse & Menzel
(2014)
Germany Pro-
environmental
behavior
Students PBC has an
insignificant
effect

79
Table 2.10 (Continued)
Author Country Area Respondent Finding
Han & Hansen
(2012)
Europe Sustainable
food
consumption
Young adults
or students
Attitude, SN and
PBC are
significant on
intention
Sahin et al.
(2012)
Turkey Sustainability University
students
Attitude has
significant effect
on intention
Matthies et al.
(2012)
Germany
Environmental
norm
Pupils SN has
significant effect
on intention
Mahmud &
Osman (2010)
Malaysia Recycling
behaviour
Malaysian
school
students
SN and PBC are
significant on
intention while
attitude is
insignificant and
negative on
intention
Cordano,
Welcomer,
Scherer,
Pradenas, &
Parada (2010)
United
States and
Chile
Pro-
environmental
behavior
Business
students
SN is significant
while attitude
insignificant
Whitmarsh &
O’Neill (2010)
United
Kingdom
Pro-
environmental
behaviours
Residents Attitude is
significant while
SN and PBC
insignificant
Arbuthnott
Katherine D. (
2009)
Canada Sustainable
development
Students Attitude and
PBC have
significant effect
on intention
Fielding et al.
(2008)
Australia Environmental
activism
Tertiary
students
Attitude and SN
are significant
while PBC
insignificant
Vermeir &
Verbeke (2008)
Belgium Sustainable
food
consumption
Young adults Attitude & SN
have a
significant effect
80
Table 2.10 (Continued)
Author Country Area Respondent Finding
Cordano &
Frieze (2000)
United
States
Pollution
Reduction
Preferences
Managers Attitude, SN and
PBC are
significant on
intention
As can be clearly seen from the above table, there is the no repetitive pattern in the
findings of attitude, SN and PBC with intention over the years, which necessitates
a need for more empirical research in the mentioned area. Hence, the researcher
aims to investigate and establish the relationship between attitude, SN and PBC and
intention within the context of SB in Malaysia.
2.12.1.3 Relationship between Spiritual and Intention
Various empirical studies have indicated that the role of spirituality is significant in
explaining intention. Csutora and Zsóka (2012) highlighted that because of the
effect that spirituality on intention, it gives spirituality a significant role in SB. The
study shows that the relationship between spirituality and intention is significant.
Results are strengthened by an ANOVA analysis as well (F=5,358; p=0,000),
according to which in terms of the 10-value scale, which is the most spiritual people
have pursued as many sustainable behaviour intention.
In fact, several empirical studies have recognized the role of spirituality in
explaining intention. Crowe (2013) highlighted that spirituality have influencing
factor that affected intention. Eco-spiritual had the correlation with intention, with

81
an r = 0.257 (p = 0.004). This relationship was still weak. Squaring the r value
indicated that eco-spiritual and intention overlapped 6.6%.
Research by Sharma and Nitika (2018) shows that relationship between spirituality
and intention among consumers are significant and positive. The regression results
of relationship between spirituality and intention shows that slope coefficient 0.707
is positive and significant with standard error 0.159, p value of .0000, R2= 0.1477.
Table 2.11 presents a list of studies that investigated the relationship between
spirituality and intention in SB setting. Spirituality are shown to have significant
effects on intention (Csutora & Zsoka, 2012; Crowe, 2013; Sharma & Nitika, 2018).
Table 2.11
Relationship between Spirituality and Intention
Author Country Area Respondent Finding
Sharma &
Nitika (2018)
India Pro-
environmental
Behaviour
Consumers Significant and
positive
Crowe (2013)
United
States
Environmental
behaviour
Students
Significant
Csutora &
Zsóka (2012)
Hungary Pro-
environmental
Behaviour
Households Significant
As can be clearly seen from the above table, there is the repetitive pattern in the
findings of spirituality with intention over the years, which necessitates a need for
more empirical research in the mentioned area.
82
2.13 Mediating Effect of Intention
Mediator is a function of third variable and represents as the generative mechanism
through which the focal independent variable is able to influence the dependent
variable (Baron & Kenny, 1986). This variable interferes between the independent
variables and the dependent variable and at the end of the analysis will modify the
results of the findings. This study considered intention as a mediating variable
between knowledge, attitude, SN, PBC and SB.
Most of the research on TPB focused on the intention than the act (behaviour).
Ajzen (1985) stated that if we are interested in understanding human behaviour, not
merely predicting it, we must identify determinants of intention. In the PBC,
intention is a function of three basic determinants (attitude towards behaviour, SN
and PBC). However, few researchers who applied TPB were merely predicting
rather than understanding the behaviour. For example, a study by Taylor and Todd
(1995) stated that their study was examining intention to compost and recycle but
he did not include measurement of behaviour.
Other researchers such as Trumbo and O'Keefe (2001) study on intention to
conserve water, Truelove (2010) predicted of global warming related behavioural
intention, and Cordano (1988) examined the relationship between environmental
intention and environmental attitude of managers. This supported a research by
Ayed (2010) that many studies stopped at behaviour intention as an endogenous
variable (dependent variable), and this had triggered Ayed (2010) use intention as
mediating variable and actual behaviour as a dependent variable. Ajzen (1985)

83
stated that behavioural intention interpreted as an intention to try to perform certain
behaviour but it not necessarily to perform it (actual behaviour).
Therefore, from the above results and findings, this shows that intention played an
important role as mediator and catalyst in the relationship between predictors and
SB. Additionally, intention is the main proximal determinant of behaviour, a
stronger predictor and shows effect on behavioural attainment.
2.14 Moderating Effect of Spirituality
Previous studies have not empirically verified spirituality as a moderator of
sustainable behaviour in their research. However, there are studies in other area of
studies that modified spirituality as moderator (Adawiyah, 2011; Tombaugh,
Mayfield, & Durand, 2011) and amended spirituality as mediator (Brant, 2010;
Muller, Creed, & Francis, 2004). For examples, Muller, Creed, & Francis (2004)
mentioned the importance of spirituality and understanding its relationship between
spirituality, the latent and manifest benefits of employment and psychological well-
being in unemployed individuals. The rationale was to investigate whether
spirituality would provide access to the latent benefits of employment that previous
research suggested could only be gained from paid work, and whether spirituality
would have a positive effect on well-being. In their study was examining the
relationships between multidimensions of spirituality (connectedness, prayer
fulfillment, universality, attendance at worship, latent benefit) and psychological
distress. Furthermore, as the previous studies showed that relationship between
84
spirituality and sustainable behaviour were not consistent (significant and
insignificant results), in this research will verifying spirituality as moderating effect
on the relationship between intention and sustainable behaviour among university
students in Malaysia.
2.15 Underpinning Theory
This study uses Theory of Planned Behaviour (TPB) as the major theory to explain
SB among students in public universities. This research presents Theory of
Reasoned Action (TRA), as it is the original theory from which TPB is derived
from, its main points as well as its limitations. Then, TPB is discussed in detail.
Next, related studies are presented.
TRA (Fishbein & Ajzen, 1975) and TPB (Ajzen, 1985) are intention models which
have shown to be successful in predicting and explaining human behaviour across
a wide variety of domains. These two theories are designed in a general perspective
that explains virtually any human behaviour. They emphasize the understanding of
human behaviour which according to them is influenced by behavioural intention.
They also stress that a focal determinant of intention is the humans’ attitudes
towards the behaviour which according to them is influenced by behavioural
intention. They also strengthen that a focal determinant of intentions is the human’s
attitudes towards the behaviour. Besides, Theory of Spirituality Leadership also
discussed in this underpinning theory to explain about the variable of spirituality
85
that has been chosen as the moderating variable in this study. More details are
shown in the following sections.
2.15.1 Theory of Planned Behaviour (TPB)
Ajzen (1985) proposed TPB, which is an extension of TRA. The major similarity
between TPB and TRA is that both of them put their focus on the individual’s
intention to perform a given behaviour. But TPB tackles the issue of behaviour that
occur without a person’s volitional control. In fact, TPB adds the perceived
behavioural control (PBC) element which differentiates it substantially from TRA.
PBC is the components that accounts for situations where an individual has less than
complete control over the behaviour, which can differ according to various
situations and actions (Ajzen, 1991).
As specified in TRA, then the situation or behaviour provides the person full control
over behavioural performance, intention alone should be sufficient to predict
behaviour. Ajzen (1991) argues that in situations where intention account for only
a small amount of variance in behaviour, PBC should be autonomously foretelling
of behaviour. Both intention and PBC are important to predict behaviour, with some
preference to one on the other regarding the commonness of certain conditions.
Consequently, when incidents occur in which prediction of behaviour from
intention is expected to be hindered by actual (volitional) control, PBC should: (1)
smooth the progress of the implementation of intention into action, and (2) predict

86
behaviour directly (Armitage & Conner, 2001). As a result, both PBC and intention
can be used directly or indirectly to predict behaviour achievement.
Figure 2.1
Theory of Planned Behavior (TPB) by Ajzen (1991)
Figure 2.1 above clearly presents the main components of the TPB, which comprise
of attitude, SN, PBC, intention, and behaviour (Ajzen, 1991). TPB assumes that
individual behaviour is led and controlled by intention. In other words, intention are
a function of a person's attitude toward the behaviour, SN and PBC.
The theory assumes that people behave rationally, when they consider the
implications of their actions. The TPB hypothesizes that the immediate determinant
of behaviour is the individual’s intention to perform, or not to perform that
behaviour. Definition of intention is the immediate determinant of behaviour, and
when an appropriate measure of intention is obtained, it will provide the most
accurate prediction of behaviour (Ajzen & Fishbein, 1980). Intention is influenced
by three factors; i) Attitude, the individual’s favourable or unfavourable evaluation
87
of performing the behaviour, ii) SN, based on individual’s perception of whether
important people in their lives would want them to perform the behaviour, iii) PBC,
reflect the extent to which individuals perceived the behaviour to be under volitional
control (Ajzen & Fishbein, 1980).
2.15.1.1 TPB Usage in Sustainable Behaviour Studies
TPB was extended by Ajzen (1985) to explain the behaviour which is a direct
function of intention and PBC because of the limitations of the TRA (Ajzen, 1985).
TPB postulates that intention is a function of attitude and SN. However, an
additional construct, PBC is added to the TPB model to account for situations where
individuals lack complete control over their behaviour (Ajzen, 1985, 1991). TPB
has been successfully applied in sustainability studies setting in predicting the
actual behaviour. Table 2.12 summarise these previous studies and the following
section present more details of these studies.
Table 2.12
Underpinning Theories of Previous Studies in Sustainable Behaviour Setting
Author/Year Country Respondents Underpinning
Theory
Mohiuddin, Mamun,
Masud, & Su (2018)
Malaysia University students TPB
Kalsum & Isa (2016) Malaysia University students TPB
Rosima Alias et.al
(2015)
Malaysia University students TPB
Han (2015) Korea Travelers who stay
at hotel
TPB
Leeuw et.al (2015) Canada High school
students
TPB
Niaura (2013) Lithuania Youth TPB & TRA
88
Table 2.12 (Continued)
2.15.2 Theory of Spiritual Leadership
Fry (2003) defined spiritual leadership as comprising the values, attitude, and
behaviors necessary to intrinsically motive one’s self and others so that they have a
sense of spiritual survival through calling and membership. This entails: (i) creating
a vision wherein organization members experience a sense of calling in that their
life has meaning and makes a difference and (ii) establishing a social /
organizational culture based on altruistic love whereby leaders and followers have
genuine care, concern, and appreciation for both self and others, thereby producing
a sense of membership and feel understood and appreciated. (p. 695).
Theory of Spiritual Leadership is a causal theory for organizational transformation
designed to foster a motivated, learning organization. It comprises the values,
attitudes, and behaviors required to intrinsically motivate the individual and others
in order to have a sense of spiritual survival through calling and membership.
Spiritual leaders experience meaning in their lives, have a sense of making a
difference, and feel understood and appreciated (Fry, 2005b).
Author/Year Country Respondents Underpinning
Theory
Hutcherson (2013) United
States
Community
College students
TPB
Osman (2012) Malaysia University students TPB
Bipul Kumar (2012) India Consumer TPB
Matthies et.al (2012) German Children TPB
Siti Nur Diyana Mahmud
et.al ( 2010)
Malaysia School students TPB
Najera (2010) Mexico University students TPB
Fielding et.al (2008) Australia Students TPB
89
A causal theory of spiritual leadership is developed within an intrinsic motivation
model that incorporates vision, hope/faith, altruistic love and spiritual survival. The
purpose of spiritual leadership is to create vision and value congruence across the
strategic, empowered team and individual levels, then, ultimately, to foster higher
levels of organizational or individual commitment and productivity. It comprises
the values, attitudes, and behaviours required to instrinsically motivate one’s self
and others in order to have a sense of spiritual well-being (Fry, 2003).
Spiritual leadership should motivate followers through values, vision, and altruistic
love (Daft & Lengel, 1998; Fry, 2003). From this perspective, spiritual leadership
can be regarded as an intrinsically motivating force that makes individuals feel
energized, alive and connected in the surroundings. The individuals who are
intrinsically motivated by spiritual leadership would then feel that their spiritual
needs have been satisfied. As a result, they will generate more feelings of fun, care
and attraction for work so that they become more productive and committed
(Giacalone & Jurkiewicz, 2003).
Thus, from this underpinning theory of spiritual leadership, it shows the literature
in establishing how multiple aspects of demonstrating individual’s engagement and
the spirituality can influence engagement through the lens of work meaning (Latif
& Aziz, 2018). Specifically, tthe individuals (students) who display greater levels
of engagement try to protect the environment through sustainable behavior.
However, the buffering role of environmental awareness in the relationship between
spirituality and sustainable behaviour should be taken into account as well.

90
2.16 Summary
This chapter has presented a comprehensive description and critical overview of the
theoretical background of this thesis. In Chapter One it was made evident that there
is scarcity and deficiency of research on students’ attitude, SN and PBC towards,
and behaviour with, sustainability sites in various settings. It was also shown that
the SB literature is driven predominantly by western culture and that issues related
to students from other cultures.
This chapter, on the other hand, has discussed thoroughly the available literatures
relating to SB, as well as students’ sustainable behavior concept and practices. The
literature review advocates that a prerequisite for spirituality to become significant.

91
CHAPTER THREE
RESEARCH METHODOLOGY
3.1 Introduction
This chapter explains the methodology used to explore the mediating effect of
intention on the relationship between knowledge, attitude, subjective norm (SN) and
perceived behavioural control (PBC) and sustainable behaviour (SB), and the
moderating effect of spirituality on the relationship between intention and SB
among students in public universities in Malaysia. This chapter also elaborates the
different aspects of methodologies employed by the researcher to achieve the
objectives of this study. A detail of the research design, measurements of variables,
reliability and validity of variables, data collection procedure, sampling frame and
data analysis techniques also presented.
3.2 Research Design
This study is designed to investigate the relationship between independent variables
(knowledge, attitude, SN and PBC) to a dependent variable (SB), the mediating
variable, intention and the moderating variable, spirituality. The unit of analysis for
this study is students in 7 universities in Malaysia based on UI GreenMetric World
University Ranking. UI’s GreenMetric University Sustainability Ranking
(GreenMetric) is a world university ranking for universities to assess and compare
campus sustainability efforts. UI has taken the initiative to create a world university

92
ranking to measure campus sustainability efforts. The UI GreenMetric World
University Ranking was established in 2010 with the intention of creating an online
survey of the current conditions and policies intended to make campuses ‘greener’
or more sustainable in universities around the world.
It has been indicated in the literature that research design is the master map that is
structured by the researcher to lead his/her steps in the undertaking of the research
assignment through the data gathering and data evaluation stages (Zikmund, 2003).
From the research methodology viewpoint, there are various research designs that
can be utilized in conducting research. As mentioned by Zikmund (2003), there are
four researchs methods for causal and descriptive research. These methods are
experiments, observation, survey and secondary data study. Selecting a suitable
research design is essential to the success of a research (Bordens & Abbot, 2011).
However, there are no definitive means to determine and choose the best design
(Davis, 1996). The decision to choose the correct research design determines the
quality of the outcomes and recomendations drawn from the research results
(Bordens & Abbot, 2011).
As there is no absolute rule in choosing the excellent research design in determining
which research design to be followed in conducting research, is entirely reliant on
the research context and the research purpose (Zikmund, 2003). As qualitative data
gathering technique utilizes the words as the description of situations, circumstances
and people, quantitative data collection technique is the statistical description that
is accurately recorded (Zikmund, 2003; Cooper & Schindler, 2006). In other terms,

93
quantitative research is a method of accurately assessing variables through
operational definitions (Cooper & Schindler, 2006).
Business research is classified based on the functions and techniques such as
surveys, experiments and observational studies (Zikmund, 2003). For business
research, the most widely used method is the survey design which is appropriate
and in fact, the best approach for studying and describing large populations quickly
and at a comparatively low cost (Davis, 1996). In fact, surveys are very versatile
and can be adapted to almost any research area. According to Sonquist and
Dunkelberg (1977), most surveys have a central objective, a search for relationship
between variables. As such, surveys have been used successfully to test hypotheses,
describe populations, evaluate programmes, build models on human behaviour,
develop useful measurement scales, and make other methodological improvement
in business reseach (Davis, 1996).
According to Hair, Money, Page and Samouel (2007) survey questionnaire design
is excellent and most commonly used to collect the primary data pertaining to the
hypothesized relationship and therefore can be categorized as a field study with a
correlation research design or quantitative orientation (Kerlinger & Iee, 2000).
Through the survey method, not only different types of data can be gathered from a
large sample size, but it can give benefit in terms of time and cost reduction (Leedy
& Ormrod, 2005). In contrast to the interview method, the survey method does not
affect much with the respondents’ time on the job. Apart from that, survey method
also assures confidentiality on the respondents’ background. The characteristics of

94
the survey method allow researchers to collect data, perform statistical analysis,
reliability and validity test effectively on the instrument (Alreck & Settle, 2004).
According to Babbie (2008) survey methods have the benefits of 1) being feasible
to large samples, 2) have the flexibility of responding to many questions on topic,
3) and reliable. So to accomplish the objectives of this study; a quantitative survey
questionnaire research method was used through a self-administered questionnaire
to measure the variables under examination.
3.3 Research Framework
In this study the researcher proposes a research framework based on theory of
planned behavior (TPB), which is demonstrated in Figure 3.1. The framework
measures the effect of exogenous variables (independent variables), spirituality as
moderator, and intention as mediator, and sustainable behavior (dependent
variable). The exogenous variables are: (1) knowledge, (2) attitude, (3) subjective
norm, and (4) perceived behavioural control. The mediating variable is intention
and the moderating variable is spirituality, while the endogenous variable is
sustainable behavior. This research is mainly based on TPB in which attitude,
subjective norm, perceived behavioural control, intention, and actual behavior are
the main factors in TPB.
Knowledge and spirituality are two new additions to the TPB model, which are
considered as external variables. Past studies have indicated that knowledge is an
independent external variable (Ahmad et al., 2010; Aminrad et al., 2013; Pedro &

95
Pedro, 2010; Syed Idros, 2014). Thus, knowledge is included as a culture predictor
of intention and sustainable behavior. On the other hand, previous studies have
indicated that spirituality is an independent variable (Crowe, 2013b; Csutora &
Zsóka, 2012) and is a mediator factor in the other area of study (Osman-gani,
Hashim, & Ismail, 2007). Figure 3.1 represents the research framework.
Figure 3.1
Research Framework
Knowledge
Attitude
Subjective
Norm
Perceived
Behavioural Control
Intention
Sustainable
Behaviour
Spirituality
H1
H2
H3
H4
H5
H6
H7
H8
H9

96
3.4 Hypotheses Development
In reference to the design and framework of the study, this section discusses how
SB is related to its predictors i.e. knowledge, attitude, SN, and PBC, intention as
mediator and spirituality as moderator.
3.5 Hypotheses Formulation
Table 3.1 lists the research hypotheses developed for the present research
Table 3.1
Research Hypotheses of Present Study
H1 There is a positive relationship between knowledge and SB.
H2 There is a positive relationship between attitude and SB.
H3 There is a positive relationship between SN and SB.
H4 There is a positive relationship between PBC and SB.
H5 Intention mediates the relationship between knowledge and SB.
H6 Intention mediates the relationship between attitude and SB.
H7 Intention mediates the relationship between SN and SB.
H8 Intention mediates the relationship between PBC and SB.
H9 Spirituality moderates the relationship between intention and SB.
3.6 Operational Definition
a. Sustainable Behaviour – The actions of students aimed at protecting the socio-
physical resources of this planet which they focused on aimed at protecting both the
natural and the human (social) environments. It refers to the practice of recycling,
conserve the energy and reduce environmental pollution to protect the environment.
Thus, in this study, the action of SB are recycling, switching off lamp, saving water
usage, and reading about environmental issues.

97
b. Intention – The student intent to recycle, conserve the energy, reduce
environmental pollution to protect the environment, concern about environmental
issues and plan to be a member of environmental organization.
c. Attitude – Based on the student cognitive belief on the importance of recycling,
conserving the energy, reducing environmental pollution to protect the
environment, concerning about environmental issues, and concerning about the rate
of species extinction in the world.
d. Subjective norm – The student belief that he or she received the social pressure
from his or her peer college mate, parents, lecturers and societies in performing
recycling activities, conserving the energy, reducing environmental pollution to
protect the environment, and joining as a member of environmental organization.
e. Perceived behavioural control – The belief about the amount of control a student
feels he or she has over performing or participating recycling activities in the
university, conserving the energy, reducing pollutions and being a member of
environmental organization.
f. Knowledge – Environmental knowledge can be demonstrated through students’
ability to recognize environmental problems, the cause and consequences of such
problems, including facts and concepts necessary for explanation. Thus, this study
examine about student’s knowledge about living things, the essential of preserving
natural resources for future generation, the condition of environment can affect the
health, main cause of air pollution, solid waste problem and alternative energy as
electricity replacement.
98
g. Spirituality – The students’ awareness or consciousness, which the dimensions
for bottomless consideration and consideration, and a deep sense of what it means
to part of the web of life which means to be another living, alive, sentimental being
in nature without the hierarchies which are often verbalized by religious forms of
spirituality. Researcher is not referring to a mysterious spirituality, but rather to a
spirituality which is integral to daily life, which informs the decisions about the way
we live, and which is expressed through action. It also refers to the practices that
caused the internal feelings of students based on religious beliefs or moral. The
study highlighted about how students expressing their spiritual side, how spirituality
practices guide students to do recycle, conserve energy, and reduce pollution.
Besides, this study also impressed about the liability of student actions that affecting
the environment.
3.7 Instruments and Measurements
The objectives of this study are to investigate the relationship between predictors
(knowledge, attitude, SN and PBC) and SB, then to examine the mediating effect of
intention between predictors and SB and also the moderating effect of spirituality
on the relationship between intention and SB among students of public universities
in Malaysia.
There is no such thing as a definite mean to develop a flawless data collection
instrument (Davis, 1996). New advancements in the field and general guidelines
could be employed in the design of any instrument. To ensure that the instrument

99
shows the desired data, the design of the questionnaire has to be appropriate to the
research objectives (Davis, 1996), the instrument must be validated by pre-testing,
and also the methods by which the questionnaire are administered (Hair et al.,
2007). The instruments used in this study were adapted from existing research and
a pilot study was carried out to find out their validity and reliability. These
instruments were fit to measure at the individual level of unit of analysis.
For this study self-administered questionnaire was used, a close-ended question
format gives a uniform frame of reference for respondent’s views, and the semantic
- differential approach was used along a seven-point scale. Psychological research
indicates that respondents can perceive seven distinct reliability (Weisberg &
Bowen, 1977), so a seven-point likert scale is not too complex for capturing the
agreement or disagreement. Ahire, Golhar and Waller (1996) found that a seven-
point scale captures more variations than a five-point scale. Likert scale was utilized
because it is easy to construct, has intuitive appeal, adaptability and usually have
better reliability (Nunnally, 1978; Babbie, 1990). In a Likert scale, respondents have
to choose amongst the given options. Thus, the researcher is capable of seeking
answers about the given statement through a set of response keys.
Cooper and Schindler (2006) mentioned that the reliability of the measure enhances
when the number of scales increases. In addition, the number of scale chosen must
approximate the degree of complexity of the construct (Cooper & Schindler, 2006).
There is also a chance that choosing of the midpoint is also consequence of
satisfying (Krosnick, 1999). Furthermore, similarly, Matell and Jocoby (1971) also

100
found that there is no particular specification for validity and reliability using a
different number of alternatives. Therefore, the use of 7 point scale is suitable.
Surveys mostly employ a well-constructed or standardized questionnaire to collect
data from the pertinent unit of analysis under study (Davis, 1996), usually an
individual. For this research, self-administered questionnaire were used for data
gathering from respondents.
3.8 Questionnaire Design
According to Folz (1996), the characteristics of good questionnaire design are clear,
attractive and simple. Logic and clear questions with appropriate response choice
foster correct and consistent response (Kim, 2007). The sequence of questions
should be logical so that the respondents are able to observe immediately the
connection between the questions asked and the mentioned objective of the survey
(Casley & Kumar, 1988). Self-administered questionnaires need more
concentration on preparation and monitoring for having a rational response rate
(Fink & Kosecoff, 1985). In addition, a self-administered questionnaire is better
than interview-administered survey because respondent may not know about an
interviewer’s initiative (Fowler Jr., 1993).
3.8.1 Dependent Variable: Sustainable Behaviour
This study is designed to understand the behavioural tendencies based on
respondents' attitudinal reactions. In fact, action by an individual in a given situation

101
is often different from what he/she actually does. SB can be defined as “a set of
effective, deliberate, and anticipated actions aimed at accepting responsibility for
conservation and preservation of physical and cultural resources. These resources
include integrity of animal and plant species, as well as individual and social well-
being, and safety of present and future human (Najera, 2010).
All items are common/familiar to respondents and easily performed at respective
university campus and accommodation blocks. Total items were selected for further
analysis using seven scales. SB scale with ten items has been adapted from Corral-
Verdugo, Mireles-Acosta, Tapia-fonllem, and Fraijo-sing (2011) with Cronbach
alpha coefficient of reliability 0.70. This variable scale also adapted from Tapia-
Fonllem et al. (2013) with Cronbach alpha coefficient of reliability 0.97. The
measurement items for actual sustainable behaviour are shown in Table 3.2.
Table 3.2
Measurement Items of Sustainable Behaviour
No. Items
1 I collect and recycles used paper
2 I switch off lamp and fan when leaving place
3 I do not leave the water running while I brush my teeth
4 I read about environmental issues
5 I used both sides of the paper sheet when I write or print a document
6 I shower for less than 20 minutes
7 When I am outside, I avoid littering
8 I purchase products in reusable containers
9 I talk to friends about environmental problems
10 I look for ways to reuse things
Source: Adapted from Tapia-Fonllem et al. (2013) and Corral-Verdugo, Mireles-
Acosta, Tapia-fonllem, & Fraijo-sing (2011)
102
3.8.2 Independent Variables
3.8.2.1 Knowledge
This measurement was adapted from Rai et al. (2014) with Cronbach alpha
coefficient of reliability 0.78. Table 3.3 showed the measurement items for
knowledge.
Table 3.3
Measurement Items of Knowledge
No. Items
1 All living things mutually benefit each other
2 Natural resources should be preserved for future generation
3 The condition of our environment can affect our health
4 Main cause of air pollution in Malaysia is fumes (smoke) from vehicles
5 Most rivers in Malaysia are polluted
6 Our country is faced with serious solid waste (garbage) and landfill problems
7 Alternative energy (for example, solar energy) can be utilized to replace
electricity from fossil fuel
Source: Adapted from Rai et al. (2014)
3.8.2.2 Attitude
It referred to student behavioural information and cognitive belief on the important
of SB. Attitude is based on individual affective, cognitive and behavioural
information belief on recycle which are varies according to individual strength. The
measurement scale was adapted from Kibert (2000) with Cronbach alpha coefficient
of reliability 0.91 (Kibert, 2000). Table 3.4 displayed the measurement items of
attitude.
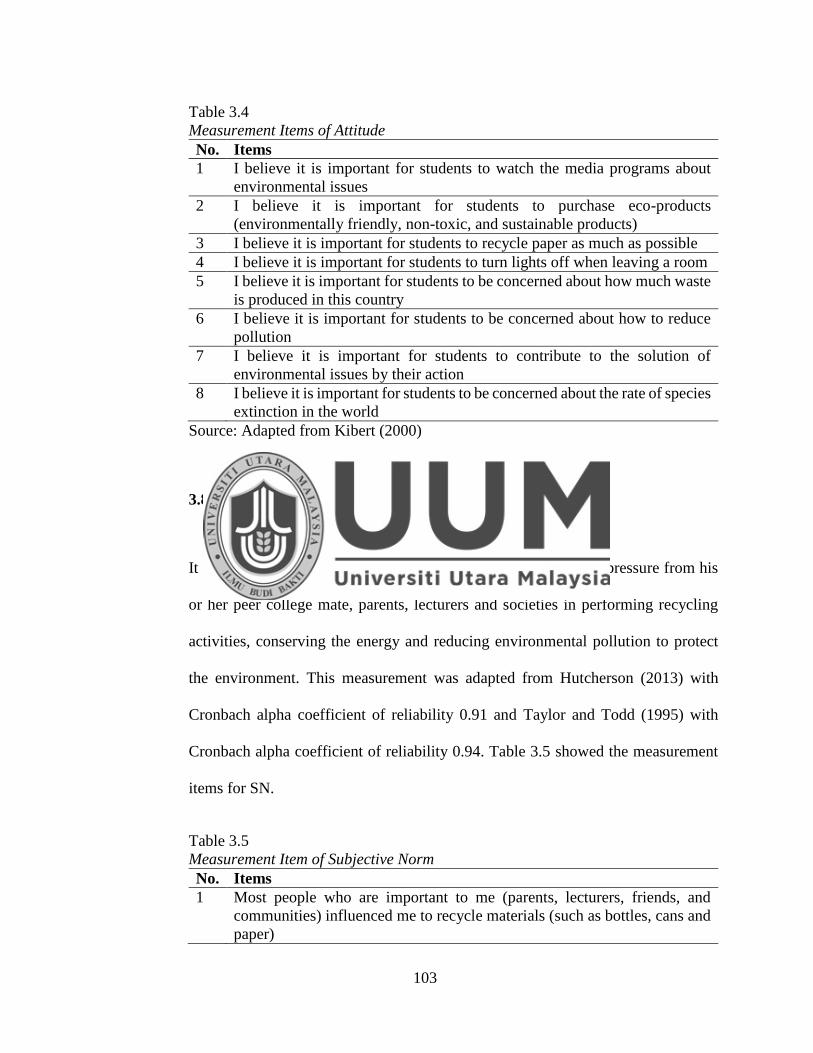
103
Table 3.4
Measurement Items of Attitude
No. Items
1 I believe it is important for students to watch the media programs about
environmental issues
2 I believe it is important for students to purchase eco-products
(environmentally friendly, non-toxic, and sustainable products)
3 I believe it is important for students to recycle paper as much as possible
4 I believe it is important for students to turn lights off when leaving a room
5 I believe it is important for students to be concerned about how much waste
is produced in this country
6 I believe it is important for students to be concerned about how to reduce
pollution
7 I believe it is important for students to contribute to the solution of
environmental issues by their action
8 I believe it is important for students to be concerned about the rate of species
extinction in the world
Source: Adapted from Kibert (2000)
3.8.2.3 Subjective Norm
It referred to the student belief that he or she received the social pressure from his
or her peer college mate, parents, lecturers and societies in performing recycling
activities, conserving the energy and reducing environmental pollution to protect
the environment. This measurement was adapted from Hutcherson (2013) with
Cronbach alpha coefficient of reliability 0.91 and Taylor and Todd (1995) with
Cronbach alpha coefficient of reliability 0.94. Table 3.5 showed the measurement
items for SN.
Table 3.5
Measurement Item of Subjective Norm
No. Items
1 Most people who are important to me (parents, lecturers, friends, and
communities) influenced me to recycle materials (such as bottles, cans and
paper)

104
Table 3.5 (Continued)
No. Items
2 Most people who are important to me (parents, lecturers, friends, and
communities) influenced me to be a member of an environmental
organization
3 Most people who are important to me (parents, lecturers, friends, and
communities) influenced me to turn lights off when I leave a room
4 Most people who are important to me (parents, lecturers, friends, and
communities) influenced me to buy sustainable (energy conserving)
products
5 Most people who are important to me (parents, lecturers, friends, and
communities) influenced me to turn off my computer when I am done using
it
6 Most people who are important to me (parents, lecturers, friends, and
communities) influenced me to be concerned more on environmental issues
7 Most people who are important to me (parents, lecturers, friends, and
communities) influenced me to conserve the environment by recycling
Source: Adapted from Hutcherson (2013) and Taylor and Todd (1995)
3.8.2.4 Perceived Behavioural Control
The belief about the amount of control a student feels he or she has over performing
or participating recycling activities in the university, conserving the energy and
reducing pollutions. This measurement was adapted from Taylor and Todd (1995)
with Cronbach alpha coefficient of reliability 0.94 and Hutcherson (2013) with
Cronbach alpha coefficient of reliability 0.79. Table 3.6 showed the measurement
items for PBC.
Table 3.6
Measurement Items of Perceived Behavioural Control
No. Items
1 Recycle materials (such as bottles, cans and paper) is easy for me
2 Be a member of an environmental organization is easy for me
3 Turn lights off when I leave a room is easy for me
4 Buy sustainable (energy conserving) products is easy for me
5 Turn off my computer when I am done using it is easy for me

105
Table 3.6 (Continued)
No. Items
6 Be concerned more on environmental issues it is easy for me
Source: Adapted from Taylor and Todd (1995) and Hutcherson (2013)
3.8.3 Mediating Variable
Intention referred to the student intent to recycle, conserve the energy, and reduce
environmental pollution to protect the environment. The measurement was adapted
from Taylor and Todd (1995) with some modification to suit to the area of research,
with Cronbach alpha coefficient of reliability 0.99. It also adapted from Hutcherson
(2013) with Cronbach alpha coefficient of reliability 0.89. Table 3.7, showed the
items used to measure intention.
Table 3.7
Measurement Items of Intention
No. Items
1 I intend to recycle materials (such as bottles, cans and paper)
2 I plan to be a member of an environmental organization
3 I intend to turn lights off when I leave a room
4 I intend to buy sustainable (energy conserving) products
5 I intend to turn off my computer when I am done using it
6 I intend to be concerned more on environmental issues
7 I intend to conserve the environment by recycling
Source: Adapted from Taylor and Todd (1995) and Hutcherson (2013)
3.8.4 Moderating Variable
Spirituality referred to the students’ awareness or consciousness, which the
dimensions for bottomless consideration, and a deep sense of what it means to part
of the web of life which means to be another living, alive, sentimental being in

106
nature without the hierarchies which are often verbalized by religious forms of
spirituality (Rai et al, 2014). Researcher is not referring to a mysterious spirituality,
but rather to a spirituality which is integral to daily life, which informs the decisions
about the way we live, and which is expressed through action. It also refers to the
practices that caused the internal feelings of students based on religious beliefs or
moral.
The measurement was adapted from Rai et al. (2014) with some modification to suit
to the area of research, with Cronbach alpha coefficient of reliability 0.86. It also
adapted from Tombaugh, Mayfield, and Durand (2011) with some modification to
suit to the area of research, with Cronbach alpha coefficient of reliability 0.77.
Finally, it adapted from Sabbir et al. (2015) with Cronbach alpha coefficient of
reliability 0.83. Table 3.8 showed the items used to measure spirituality.
Table 3.8
Measurement items of Spirituality
No. Items
1 I am comfortable expressing my spiritual practices at my institution
2 When doing recycling, conserving energy and reducing environmental
pollution, I am often guided by my spirituality practices
3 My interactions with others in natural world are often influenced by my
spirituality practices
4 When in my institution, I do not mind talking about my spirituality with
others
5 I am liable for all my actions that include affecting the environment
6 I am always living in harmony and being transparent with my friends in my
institution of study
Source: Adapted from Rai et al. (2014), Tombaugh, Mayfield, & Durand (2011) and
Sabbir et al. (2015)

107
The questionnaire was comprised of seven sections that supposed to depict the
variables associated with the respondents’ perception of SB, independent variables
(knowledge, attitude, SN and PBC), mediating variable (intention) and moderating
variable (spirituality). Table 3.9 shows the review of the survey items and source.
Table 3.9
Variables, Sections and Source
No. Variable Code Total
Items
Source
1 Sustainable
Behaviour
SB
10 (Tapia-Fonllem et al.,2013)
(Corral-verdugo, Mireles-Acosta,
Tapia-fonllem, & Fraijo-sing, 2011)
2 Knowledge KN 7 (Rai et al., 2014)
3 Attitude ATT 8 (Kibert, 2000)
4 Subjective Nom SN 7 (Hutcherson, 2013)
(Taylor & Todd, 1995)
5 Perceived
Behaviour Control
PBC 6 (Taylor & Todd, 1995)
(Hutcherson, 2013)
6 Intention INT 7 (Taylor & Todd, 1995)
(Hutcherson, 2013)
7 Spirituality SP 6 (Rai et al., 2014)
(Tombaugh, Mayfield, & Durand ,
2011)
(Sabbir et al., 2015)
3.9 Validity and Reliability
This section explains and discusses the validity and reliability in general and
particularly of the measures used in this research study.
108
3.9.1 Validity
The validity of a measure is the level to which it measures what it intends to measure
(Bordens & Abbot, 2011). It is also expressed as the extent to which the measure or
set of measures exactly illustrate the concept study – that is the degree to which it
is free from any systematic or non-random error. Validity is concerned with how
properly the concept is defined by the measure(s), whereas reliability relates to the
consistency of the measure(s) (Hair, Black, Babin & Anderson, 2010). For this
research, validity test was conducted to ensure that the instrument measure, what it
is intended to measure (Bordens & Abbot, 2011). Validity tests could be in internal
or external forms (Campbell & Stanley, 1966; Zikmund, 2003). Internal validity
shows whether the independent variable was the sole reason for the change in the
independent variable. External validity, on the other hand, shows the extent to which
the outcomes of the experiment applicable in the real world (Zikmund, 2003), in
other words, external validity is the quality of being able to generalize beyond the
data of the experiment to other subjects or other groups in the population under
investigation. Two most commonly accepted and used validity tests in business
research are face or content validity, and construct validity (Bordens & Abbot,
2011).
Content validity or face validity deals with subjective agreement among
professionals that a scale logically reflects exactly what it is contended to measure
and the content of the scale appears to be adequate (Zikmund, 2003). It explains
how well an instrument appears to measure what it was intended to measure

109
(Bordens & Abbot, 2011). According to Hair et al. (2007) content or face validity
subjectively evaluates the association between the individual items and the concept
through ratings by expert judges, pre-tested with multiple subpopulations or other
means (Churchill, 1979; Robinson, Shaver, & Wrightsman, 1991b).
Face validity is a weak form of validity in a sense that an instrument may lack face
validity and yet, by other criteria, measure what it proposed to measure (Bordens &
Abbot, 2011). However, having good face validity might be important in a way that
it gives certain assurance to the researchers and the study as a whole. If the
respondents did not see the instruments as valid, they might build a negative attitude
about its effectiveness (Cohen & Swerdlik, 2010). Another validity test is the
construct validity. Construct validity has to do with how sufficiently the content of
a test, samples the behaviour, skills or knowledge, that test is intended to measure
(Bordens & Abbot, 2011). Construct validity established during the statistical
analysis of the data. Construct validity involved two aspects of assessments, namely
theoretical and statistical (Raemah, 2010).
3.9.2 Reliability
The reliability of a measure concerns its capacity to create similar results when
repeated measurements were made under identical conditions (Bordens & Abbot,
2011). Reliability is also considered as the scale to which the observed variables
measures the ‘true’ value and is ‘error free’ (Hair et al., 2010). To determine the
reliability of the measurement used, internal consistency check was conducted

110
which applied to the consistency amongst the variables in a summated scale (Hair
et al., 2010). The reason for applying internal consistency is that the individual terms
or indicators of the scale should all be measuring the same construct and hence be
extremely intercorrelated (Churchill, 1979; Nunnally, 1978).
The two most common diagnostic measures of reliability were to look at the item-
to-total correlation (the correlation of the item to the summated scale score) and the
inter-item correlation (the correlation among items) (Hair et al., 2010). According
to Robinson, Shaver, and Wrightsman (1991a), rules of thumb recommended that
the item-to-total correlations must exceed 0.50 and that the inter-item correlations
must exceed 0.30.
This research adopted the second type of diagnostic measure, which is the reliability
coefficient that evaluates the consistency of the entire scale, with the most
commonly used Cronbach‘s alpha (Peter, 1979; Nunnally, 1978; Cronbach, 1951).
It is suitable for instruments that use a likert scale and dichotomous scales. An alpha
value of 0.6 is regarded as reliable. The closer the value to 1 means, that the
instrument is more reliable and shares a high internal consistency. The cronbach
alpha of the constructs used in this research ranged from 0.7 to 0.9 that indicates
good reliability.
3.9.3 Pre Test
The pre test was conducted to verify if respondents have any complexity in
understanding the questionnaire, or whether there exists any uncertainty or bias in
111
the questionnaire. Therefore, numerous parties were contacted for a discussion
session in order to make clear the contents of the questionnaire; they were 5 lecturers
in Universiti Utara Malaysia (UUM), and 10 students of UUM. They were asked to
critique and give suggestions in order to improve the questionnaire. During the
session, they were encouraged to give their input on the design of the questions,
wording of the questionnaire, and any improvement that they might think is
appropriate. The objective was to improve the content and the face validity of the
questionnaire.
3.9.4 Pilot Test
As a developed questionnaire is subject to validity and reliability test, a pilot test
was carried out. According to Neuman (1997), a pilot study is significant because it
improves the questionnaire. It is used to identify weaknesses in instrumentation and
design, and to give proxy data for the selection of a probability sample (Cooper &
Schindler, 2001). According to Emory and Cooper (1991), respondents of 25 to 100
are appropriate for a pilot study. The outcomes of the pilot study identify
misunderstandings, useless items and ambiguities (Wiersma, 1993). So, 100 sets of
questionnaires were distributed randomly to a few respondents, and all 100
responded. In enhancing the reliability, there have a little questions which
misunderstandings, useless items and ambiguities are discarded. Table 3.10 shows
the reliability of the constructs.

112
Table 3.10
Reliability of the Constructs
No. Construct No. of Items Cronbach’s Alpha
1 Sustainable Behaviour 10 0.819
2 Knowledge 7 0.748
3 Attitude 8 0.894
4 Subjective Norm 7 0.807
5 Perceived Behaviour Control 6 0.754
6 Intention 7 0.836
7 Spirituality 6 0.832
3.10 Population and Sample
This research studied the mediating effect of intention on the relationship between
knowledge, attitude, SN, PBC and SB, and the moderating effect of spirituality on
the relationship between intention and SB among students in public universities in
Malaysia. The target population was students of seven universities in Malaysia,
namely Universiti Putra Malaysia (UPM), Universiti Utara Malaysia (UUM),
Universiti Malaya (UM), Universiti Teknologi Malaysia (UTM), Universiti
Kebangsaan Malaysia (UKM), Universiti Malaysia Sabah (UMS) and Universiti
Sains Islam Malaysia (USIM). These universities are chosen based on UI
GreenMetric World University Ranking. UI’s GreenMetric University
Sustainability Ranking (GreenMetric) is a world university ranking for universities
to assess and compare campus sustainability efforts. Only these seven universities
in Malaysia that mentioned above are included in this UI GreenMetric World
University Ranking (UI GreenMetric, 2015).

113
3.10.1 Sample Size
The sampling method is vital for assuring the validity of the collected data as well
as illustration of the population in order to represent generalized results on the whole
population (Pedhazur & Schmelkin, 1991). The sample size formulas provide the
number of response that need to be obtained. The sample size also is often increased
by 30% to compensate for nonresponse. Thus, the number of mailed surveys can be
substantially larger than the number required for a desired level of confidence and
precision (Israel, 2013). Cohen, Manion, and Marrison (2001) proposed that in
determining the sample size, researcher has to consider the significant levels and
the sampling error. The researcher determined the sample size by taking into
consideration the significance level at p < 0.05 (at 95% confidence level) and this
statement was supported by Sekaran and Bougie (2010). Table 3.11 shows the
sample size, significance level and the sampling error.
Table 3.11
Sample Size for ±3%, ±5%, ±7%, and ±10% Precision Levels where confident Level
is 95 % and P= .5
Population Size
Sample Size (n) for Precision (e) of:
±3% ±5% ±7
%
±10
%
500 a 222 145 83
1,000 a 286 169 91
10,000 1,000 385 200 99
20,000 1,053 392 204 100
100,000 1,099 398 204 100
>100,000 1,111 400 204 100
Source: Israel, 2013

114
Thus, in this study, based on the formula table for size population of 102,151 (Data
statistics from Ministry of Higher Education, 2016), the sample size of precision of
± 3% = 1,111, therefore, total sample size is 1,111 has been obtained. However, the
sample size was often increased by 30% to compensate for non-response (Israel,
2013). Thus, the number of mailed surveys can be substantially larger than the
number required for a desired level of confidence and precision. Therefore, the total
of 1444 questionnaire will be distributed after the addition of 333 questionnaires to
compensate for non-response.
3.10.2 Sampling Technique
In quantitative research the needs to generalize the findings to the overall population
is expected. Therefore, it is necessary to obtain samples of sufficient size that are
selected randomly. The sample members were drawn by using a stratified random
sampling procedure. It is a modification of simple random sampling and is designed
to produce the more representative and accurate samples (Vaus, 2002). This
procedure was employed to ensure that identified subgroups in the population are
proportionally represented in the sample in the same proportion with the overall
population (Gay & Diehl, 1992). It guarantees that in the final sample, each stratum
is represented in its correct proportion.
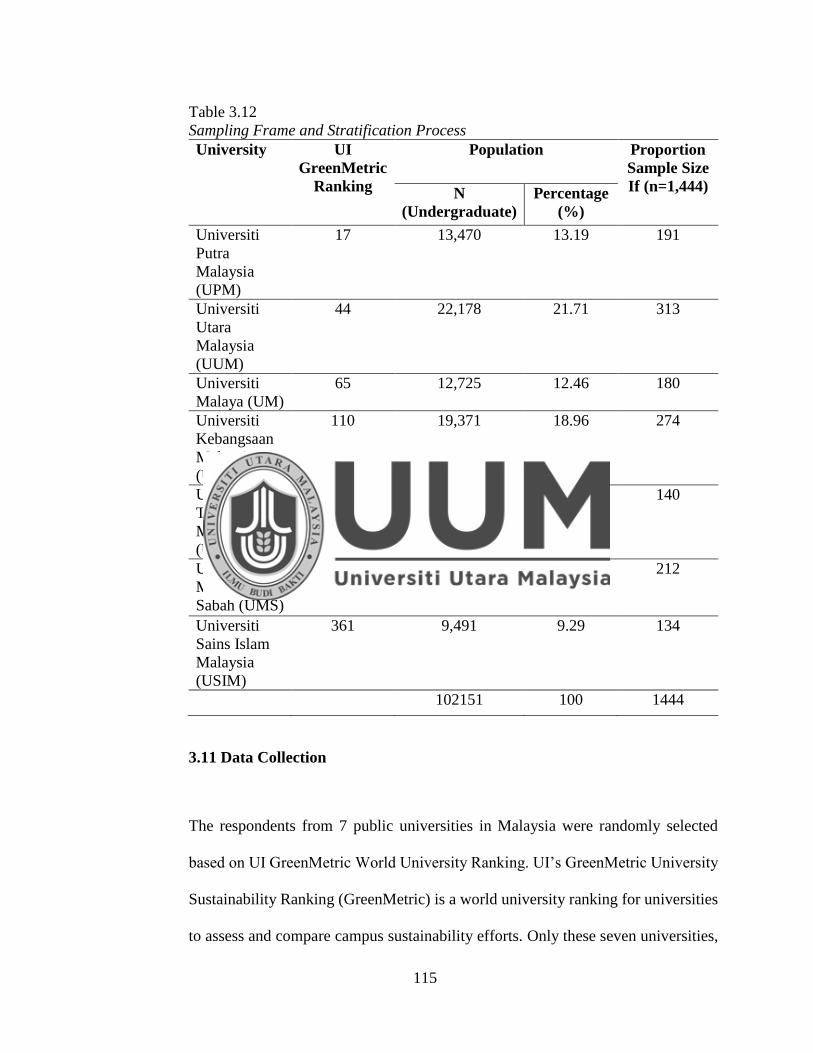
115
Table 3.12
Sampling Frame and Stratification Process
University UI
GreenMetric
Ranking
Population Proportion
Sample Size
If (n=1,444) N
(Undergraduate)
Percentage
(%)
Universiti
Putra
Malaysia
(UPM)
17 13,470 13.19 191
Universiti
Utara
Malaysia
(UUM)
44 22,178 21.71 313
Universiti
Malaya (UM)
65 12,725 12.46 180
Universiti
Kebangsaan
Malaysia
(UKM)
110 19,371 18.96 274
Universiti
Teknologi
Malaysia
(UTM)
118 9,954 9.7 140
Universiti
Malaysia
Sabah (UMS)
173 14,962 14.65 212
Universiti
Sains Islam
Malaysia
(USIM)
361 9,491 9.29 134
102151 100 1444
3.11 Data Collection
The respondents from 7 public universities in Malaysia were randomly selected
based on UI GreenMetric World University Ranking. UI’s GreenMetric University
Sustainability Ranking (GreenMetric) is a world university ranking for universities
to assess and compare campus sustainability efforts. Only these seven universities,
116
namely, UPM, UUM, UM, UTM, UKM, UMS and USIM were involved in this UI
GreenMetric World University Ranking (UI GreenMetric, 2015).
A total of 1444 questionnaires were distributed. Self-administered questionnaires
and online survey (google docs) had been used in data collection. The research
instruments were distributed by hand to the respondents in UUM, UPM and UKM,
while online survey (google docs) disseminated to the respondents in UM, UTM,
UMS and USIM. Thus, it can prevent the same person who answered both
questionnaires either distributed via online or by hand. The questionnaire package
consisted of a one-page cover letter and the questionnaire itself. The cover letter
showed the purpose of the research study, anonymity and confidentiality of the
questionnaire’s respondent, and agreement for the safety of human subjects to
enhance response rate (O’Sullivan & Rassel, 1995).
3.12 Data Analysis
Upon completion of data collection, combinations of both inferential and
descriptive statistics were used as techniques of data analysis. The PLS-SEM
approach was employed in the analysis of the collected data for this research.
Particularly, two major PLS-SEM software applications including PLS-Graph
(Chin, 2010) and Smart PLS (Ringle, Wende & Will, 2005) were employed in the
analysis and presentation of outcomes.

117
3.12.1 Descriptive Analysis
Descriptive analysis was used to demonstrate the characteristics of the samples such
as the demographic profile of the respondents (gender, age, education level, etc.).
Descriptive analysis is often used to explain phenomena of interest (Sekaran &
Bougie, 2010). In those investigations, descriptive information is analysed
statistically in terms of how frequent certain phenomenon of interest arises (i.e.,
frequency), the average score or central tendency (i.e., mean) and the extent of
variability (i.e., standard deviation). In this research, descriptive analysis was
employed primarily to identify the characteristics of the sample and all the
constructs used in this research. Results from the analyses performed were utilised
to rationalize and explain the research questions of the study.
3.12.2 Partial Least Squares-Structural Equation Modelling (PLS-SEM)
Technique
PLS-SEM method is called a second generation structural equation modelling. The
comparatively new technique works well with structural equation models that
include a series of cause-and-effect relationships and latent variables (Gustafsson &
Johnson, 2004). The PLS-SEM approach is a flexible and good tool for statistical
model building in addition for forecasting (Ringle et al., 2005). Particularly, the
PLS-SEM method was used for this research due to the following reasons. Firstly,
structural equation models have been illustrated to be advanced models that perform
estimations better than regressions for measuring mediation (Preacher & Hayes,

118
2004; Mattanah, Hancock, & Brand, 2004; Iacobucci, Saldanha, & Deng, 2007;
Brown, 1997). It has been documented that PLS-SEM accounts for measurement
error and gives a more precise estimation of mediating affects (Chin, 1998a).
Secondly, PLS-SEM path modeling becomes more suitable for actual world
applications and more beneficial to employ when models are difficult (Hulland,
1999; Fornell & Bookstein, 1982). The soft modelling assumptions of PLS-SEM
techniques (i.e., ability to flexibly develop and validate complex models) gives it
the benefit of estimating big complex models (Akter, D’Ambra, & Ray, 2011). That
is the main reason this study used PLS-SEM method for better prediction. Thirdly,
in most social science researches, data tend to have normality issue (Osborne, 2010)
and PLS-SEM path modelling does not necessarily need data to be normal (Chin,
1998a). In other words, PLS-SEM treats non-normal data comparatively well. PLS-
SEM path modeling technique was selected to avoid data normality problems for
this study. Fourthly, PLS-SEM proposes more valid and meaningful results, while
other techniques of analysis such as software package used for statistical analysis
(SPSS) often results in less clear outcomes and involve several separate analysis
(Bollen, 1989). Additionally, Tabachnick and Fidel (2007) stated that SEM is one
of the most powerful statistical tools in behavioral and social sciences that have the
capability of testing various relationships simultaneously.
Regarding this research, Smart PLS-SEM path modelling was used to create
measurement and structural models. Measurement model was used to clarifying or
evaluating constructs’ validity and reliability of the present study. The structural

119
model was also used to conduct bivariate correlation analyses and simultaneous
regression analyses to build relationship effects and correlations among constructs
under investigation. Additionally, by using the PLS-SEM mechanism of the
algorithm and bootstrapping, mediating and moderating affects were also analysed.
3.12.3 Confirmatory Factor Analysis
Confirmatory Factor Analysis (CFA) is used to reduce the measurement of
instrument error. Structural Equation Modelling (SEM) techniques are deployed to
perform the CFA. To be clear, SEM employs a set of measures to achieve the model
fit.
3.12.4 Structural Equation Modelling
Structural Equation Modeling (SEM) is a statistical methodology used by
behavioral, social, and educational scientists (Raykov & Marcoulides, 2006; Byrne,
2010). SEM is also a family of statistical models and multivariate technique, with
mixing characteristics of factor analysis and multiple regressions that enables the
researcher to test simultaneously a series of interrelated dependence relationships
among the measured variables and latent constructs (Hair et al., 2010). Many
researchers and statisticians (Bollen, 1989; Hair et al., 2010; Iacobucci, Saldanha,
& Deng, 2007) have revealed that SEM performed better than regression while
assessing the mediating role of a research variable. Hence, suggesting that SEM was
a superior statistical technique over the regression. According to Hair et al. (2010),

120
the standard errors in the SEM model are minimized due to the simultaneous
estimation of all parameters in the SEM model. Generally, structural equation
modeling consists of three major components:
a. Variables: SEM has two types of variables, which are; latent/unobserved
variables and observed/measured variables. Latent/unobserved construct is a
key variable, and can only be measured by the effect of observed variables.
However, with latent constructs, a different terminology is used. Exogenous
constructs are the latent, multi-item equal to independent variables. They are
determined by factors outside of the model (i.e., they are not explained by any
other construct/variable in the model), as a result, the term independent.
Endogenous constructs are the latent, multi-item similar to the dependent
variables. This construct is theoretically determined by factors within the model,
thus, its dependent on other constructs, and this represented visually by a path
to an endogenous construct from an exogenous construct (Byrne, 2010; Hair et
al., 2010).
b. Models: SEM is associated with two kinds of models, which are; measurement
and structural model (Hair et al., 2010). Measurement model specifies the role
of correspondence between latent and measured/observed variables, which deals
with the indicators/items/scales for each construct. In this model, through
confirmatory factor analysis (CFA), the researcher tests multidimensionality,
reliability, convergent validity, discriminate validity and criterion-related
validity. Once the measurement model is validated, the researcher conducts the

121
structural model. Structural model deals with a set of one or more dependent
relationships linking the hypothesized model’s constructs. The structural model
is most useful in representing the interrelationships of variables between
constructs (Hair et al., 2010).
c. Measurement error: Degree to which the data values do not truly measure the
characteristic being represented by the construct(s) of interest. There are quite a
number of sources of getting measurement error like simple data entry errors
that are not perfectly defined by any set of measured variables. For all practical
purposes, all constructs have some measurement error, even with best indicator
variables. However, the researcher’s aim was to minimize the amount of
measurement error in this study. SEM can handle measurement error and
provide the most accurate estimate of the relationship between constructs (Hair
et al., 2010).
3.13 Summary
This chapter discussed theoretical framework, hypotheses, and research
methodology for this study. It has outlined the sampling design, which is concerned
with methods and strategy of data collection and the rationale for the research
design. Specifically, this chapter has described the population of the study, sample
size and sampling technique, instruments used for this study, questionnaire design,
validity and reliability, pre and the pilot study conducted and their results, data
collection and data analysis techniques.

122
CHAPTER FOUR
DATA ANALYSIS AND RESULTS
4.1 Introduction
This chapter describes analysis undertaken and presents the empirical findings and
results to test the research hypotheses in accordance with the proposed method of
data analysis in Chapter 3. Data analysis and path modeling was done by using one
of the Partial least squares - Structural equation modeling (PLS-SEM) of Smart PLS
3.0 software. The organisation of this chapter is listed on several core sections, the
profile of the respondents presented is based on their demographic information,
descriptive analyses, preliminary analyses, and this is followed by the goodness of
measure part, in which the measurement model validity is established.
Subsequently, this is followed by validation of the structural model in which the
direct, mediation and moderation hypotheses were tested to confirm the final
outcome of this research. At the end of the chapter, a table summary of the results
of hypotheses findings is presented. Finally, a short summary of the chapter is
provided.
4.2 Response Rate
A total of 1171 respondents filled and returned the distributed questionnaire and a
survey package was sent through e-mail and the link of a web-based survey
questionnaire. However, as depicted in Table 4.1, a total of 956 questionnaires were

123
finally retained for analysis from a total of 1171 that were collected back from the
respondents. Specifically, after the data collection, a total of 215 responses were
excluded from the analysis because absolute skewness value of more than 1 means
that the data is extremely non-normal and must be remove before PLS-SEM was
applied (Hair et al., 2013). Babbie (1990) noted that 50% response rate was
considered as sufficient in social science surveys. Consistent with the
recommendation by Babbie (1990), this study is expected to achieve at least 722
responses from the survey. More importantly, the tool of analysis for the current
study, which is PLS, requires a minimum of only 30 responses (Chin, 1998a), thus
a total of 956 retained questionnaires for this study was greatly adequate for
analysis.
Table 4.1
Questionnaire Distribution and Decision
Item Frequency Percentage
(%)
Distributed Questionnaires 1444 100
Returned Questionnaires 1171 81
Rejected Questionnaires 215 18
Retained Questionnaires 956 66
Source: Researcher
The data collection took around four months (i.e. from March 2017 to July 2017).
Firstly, a set of conventional survey packet which consists of cover letter,
certification of study, approval letter of data collection, and survey booklets were
distributed by hand to respondents in UUM, UPM, UKM, UM and USIM, while the
set of surveys were distributed by post to respondents in UMS and UTM. Secondly,
to improve the response rate, a survey package was sent through e-mail and the link
of a web-based survey questionnaire (online Google-docs) was also provided to the

124
respondents to make them more convenient to respond, since the Internet and
mobile data services have been available everywhere recently. This method also
decreases the cost and very efficiently to avoid missing data per case. A total of 956
respondents constitute the sample for this study which gave an effective response
rate of 66 percent.
The collected data was keyed into Microsoft excel 2010 and SPSS version 22 for
analysis and later imported into Smart PLS 3.0 (Ringle et al., 2005) for further
analysis. SPSS was used for the test of non-response bias, preliminary data
screening, correlation analysis and multicollinearity tests. Validity and reliability,
measurement model and structural model and test of mediation and moderation
were undertaken in Smart PLS 3.0 (Ringle et al., 2005).
4.3 Test for Non-Response Bias
Non-response bias has been defined as the mistake a researcher expects to make
while estimating sample characteristic because some types of surveys respondent
are under-represented due to non-response (Berg, 2002). It is well explained in the
literature that there is no minimum response rate below which a survey estimate is
necessarily biased and conversely, no response rate above which it is never biassed
(Singer, 2006). However, no matter small the non-response, there is a possible bias
which must be investigated (Pearl & Fairley, 1985; Sheikh, 1981), thus there was a
need for conducting the non-response bias analysis for this study. As indicated in
Table 4.2, respondents were divided into two independent samples based on their

125
response to survey questionnaires regarding seven main survey variables
(knowledge, attitude, subjective norm, perceived behaviour control, intention,
spirituality and sustainable behaviour). One of the standard ways to test non-
response bias which is also used for this study is to compare the response of those
who responded to the questionnaire early before June 2017 and those who
responded to the questionnaire in July 2017. Therefore, those who responded to
questionnaires in July 2017 are, in fact, a sample of non-respondents to the first
distributed questionnaires and are assumed that they are representative of the non-
respondents group. Research has demonstrated that late respondents are often
similar to non-respondents (Oppenheim, 1996; Miller & Smith, 1983). However, it
was experienced that most of the questionnaires that were retrieved late were those
from the students in final year semester that busy with a tight schedules of class,
project paper and assignments. The confirmation of the explanation above could be
deduced from Table 4.2.
Table 4.2
Results of independent-Samples T-test for Non-Response Bias
Variables
Group
N
Mean
SD
Levene’s Test for
Equality of Variance
F Sig.
Knowledge Early
Response
Late
Response
716
6.433 0.459 2.578 0.109
240 6.395 0.506
Attitude Early
Response
716 6.055 0.749 0.592 0.442
Late
Response
240 6.092 0.759
Subjective
Norm
Early
Response
716 5.889 0.774 0.872 0.351
Late
Response
240 5.899 0.735
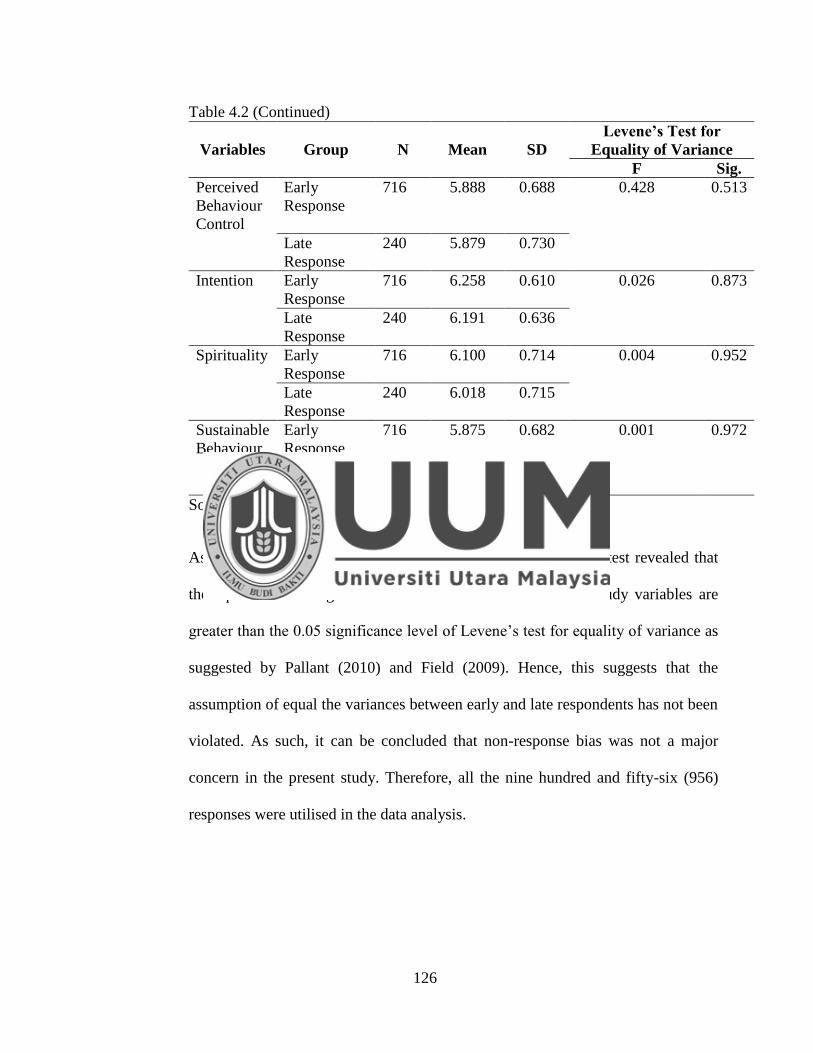
126
Table 4.2 (Continued)
Variables
Group
N
Mean
SD
Levene’s Test for
Equality of Variance
F Sig.
Perceived
Behaviour
Control
Early
Response
716 5.888
0.688 0.428 0.513
Late
Response
240 5.879 0.730
Intention Early
Response
716 6.258 0.610 0.026 0.873
Late
Response
240 6.191 0.636
Spirituality Early
Response
716 6.100 0.714 0.004 0.952
Late
Response
240 6.018 0.715
Sustainable
Behaviour
Early
Response
716 5.875 0.682 0.001 0.972
Late
Response
240 5.829 0.691
Source: Researcher
As presented in Table 4.2, the results of independent-samples t-test revealed that
the equal variance significance values for each of the seven study variables are
greater than the 0.05 significance level of Levene’s test for equality of variance as
suggested by Pallant (2010) and Field (2009). Hence, this suggests that the
assumption of equal the variances between early and late respondents has not been
violated. As such, it can be concluded that non-response bias was not a major
concern in the present study. Therefore, all the nine hundred and fifty-six (956)
responses were utilised in the data analysis.
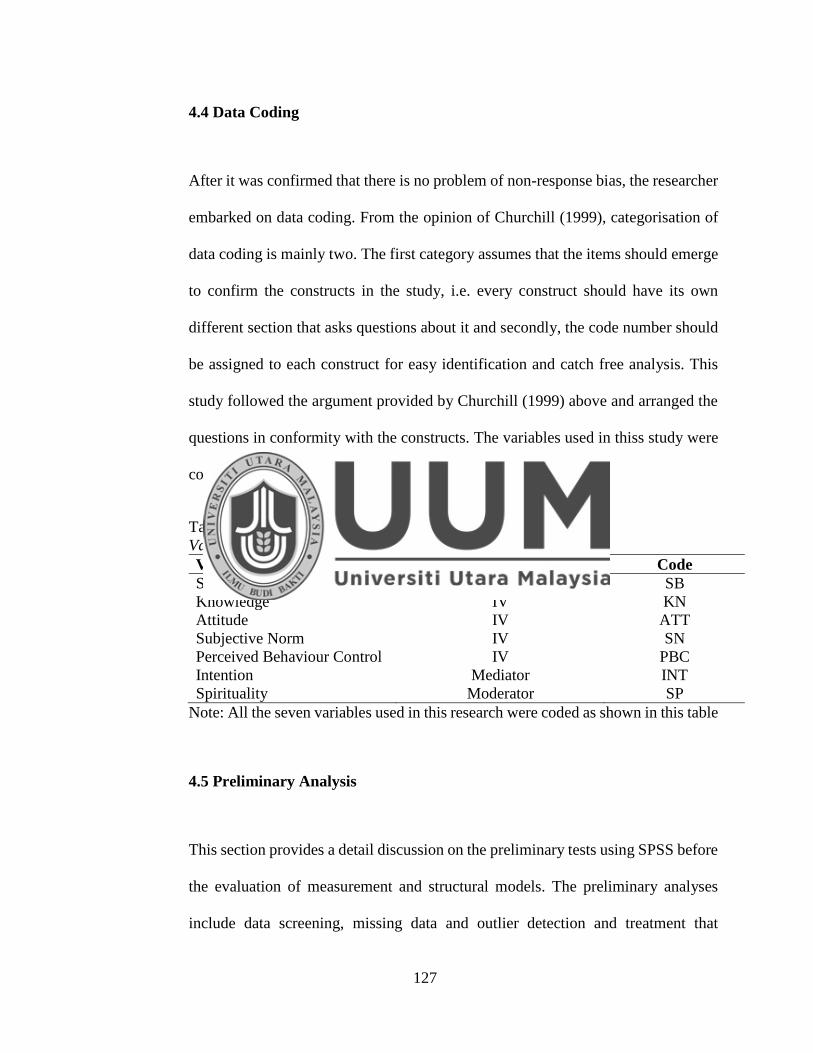
127
4.4 Data Coding
After it was confirmed that there is no problem of non-response bias, the researcher
embarked on data coding. From the opinion of Churchill (1999), categorisation of
data coding is mainly two. The first category assumes that the items should emerge
to confirm the constructs in the study, i.e. every construct should have its own
different section that asks questions about it and secondly, the code number should
be assigned to each construct for easy identification and catch free analysis. This
study followed the argument provided by Churchill (1999) above and arranged the
questions in conformity with the constructs. The variables used in thiss study were
code as shown in Table 4.3.
Table 4.3
Variable Coding
Variable Code
Sustainable Behaviour DV SB
Knowledge IV KN
Attitude IV ATT
Subjective Norm IV SN
Perceived Behaviour Control IV PBC
Intention Mediator INT
Spirituality Moderator SP
Note: All the seven variables used in this research were coded as shown in this table
4.5 Preliminary Analysis
This section provides a detail discussion on the preliminary tests using SPSS before
the evaluation of measurement and structural models. The preliminary analyses
include data screening, missing data and outlier detection and treatment that
128
followed the further fundamental statistical assumptions, which are linearity and
normality.
4.5.1 Data Screening
The importance of data screening in any form of data analysis especially
quantitative research cannot be underpinned because it provides a very solid ground
for the attainment of a significance result. The quality of the output and analysis in
spite of its enormous burden as pointed out by Hair et al. (2010) are dependent upon
the quality of preliminary data screening. Unnecessary to say here, that ignoring the
potentiality of data screening would always result to the poor quality of output and
analysis. Although Tabachnick and Fidell (2007) argued that data quality could be
ensured by mere proofreading, this approach may be very tasking when dealing with
a large set of data. This study began with the detection of missing data.
4.5.2 Missing Value Analysis
In this study, no missing values were found in the variable of SB, knowledge,
attitude, SN, PBC, intention and spiritualy. Researchers have suggested that mean
substitution is the easiest way of replacing missing values if the total percentage of
missing data is 5 percent or less (Little & Rubin, 1987; Raymond, 1986; Tabachnick
& Fidell, 2007). However, in this study, there are no missing value were found, thus
no action has been taken. Table 4.4 shows the total and percentage of randomly
missing values in the present study.

129
Table 4.4
Missing Values
Variable Number of Missing Values
Sustainable Behaviour 0
Knowledge 0
Attitude 0
Subjective Norm 0
Perceived Behaviour Control 0
Intention 0
Spirituality 0
4.5.3 Outlier Detection and Treatment
After checking the missing values, detecting and treating of outliers were also
undertaken in this study. As discussed in a series of statistical literature, outliers
symbolise observations that represent an unusual variation of values of two or more
variables. This is because outliers have values that have extreme similarity to one
another and in a similar condition (Byrne, 2010; Hampel, Ronchetti, Rousseeuw, &
Stahel, 1986; Hu, Smeryers-Verbeke, & Massart, 1990).
Outliers are defined by Barnett and Lewis (1994) as observations or subsets of
observations which come out to be inconsistent with the rest of the data. In a
regression-based analysis, the presence of outliers in the data set can seriously
distort the estimates of regression coefficients and lead to unreliable results (Verardi
& Croux, 2009). It is indeed very normal than in statistical analysis data at times
behave abnormal and present unusual values due to entry errors. Several outlier
detection techniques adopt a measure of Mahalanobis’ distance to calculate how
isolated an observation is from the centre of the data. In many studies it has been

130
established that there are many ways of using measure of distance in detecting
outliers, some use a modification of the Akaike’s information criterion (Ueda,
2009), others prefer robust scale and location estimators (Vendhan & Suresh, 2011)
and some uses order statistics such as the quartile or median (Liu, 2004). The reason
for using Mahalanobis’ distance as Gerrit, Martin, Gary, and Bernd (2010) and
Chambers (1986) pointed out, is because it has the capability of detecting
observations that are positioned away from the centre of the data, giving less
influence to variables that have highly interrelated variables. But as far as this
research is concerned outliers were deleted. The total of 215 cases was deleted due
to existence of outliers. The following section provides a discussion of fundamental
statistical assumptions.
4.6 Fundamental Statistical Assumptions
As supported by Hair et al. (2010), and Hair, Black, Babin, Andersen, and Tatham,
(2006), it is very vital to refer to some basic assumptions, which are
multicollinearity and normality regarding the variables to be able to confirm the
results and in order to effectively deal with the incidence of errors such as Type I or
Type II. For easy comprehension, these fundamental assumptions are highlighted in
the following paragraphs.

131
4.6.1 Multicollinearity Test
For a research to be able to check and deal with the occurrence of Type I and Type
II errors, the kind of association between dependent and independent variables in a
research should be linear. Experts such as Nunnally and Bernstein (1994) suggested
that to be able to reduce non-linearity, researchers may use items that have already
been used in an established theory or in a previous study where both reliability and
validity have been confirmed. As far as this study is concerned, however, the fear
of non-linearity has been relieved because all the items used for dependent and
independent variables were adapted from previous studies as discussed in detail in
chapter three. Nonetheless, an attempt was made to determine if there is
multicollinearity as shown in Table 4.5.
Table 4.5
Results of Multicollinearity Test
Latent Construct Collinearity Statistics
Tolerance VIF
Knowledge 0.708 1.411
Attitude 0.609 1.643
Subjective Norm 0.481 2.077
Perceived Behaviour Control 0.417 2.399
Source: Researcher
The Table 4.5 above indicated that knowledge has 0.708 as its value of tolerance
and 1.411 as VIF value; attitude has 0.609 value of tolerance and 1.643 value of
VIF; SN has 0.481 value of tolerance and 2.077 value of VIF and PBC has 0.417
value of tolerance and 2.399 value of VIF. Going by what was obtained as shown
in the table 4.5 above, it could be said that all the variables have their values of
132
tolerance greater than 0.2, VIF value less than 5, as suggested by Hair et al. (2011),
with that it could be said that there is no multicollinearity.
4.6.2 Data Normality Test
Normality is an important assumption for most statistical test. It is refers to “the
shape of the data distribution for an individual metric variable and its
correspondence to the normal distribution, the benchmark for statistical methods”
(Hair et al., 2007). Normality is a degree to which the distribution of the sample
data corresponds to a normal distribution. The term normal distribution is used to
describe a symmetrical and bell-shaped curve (Pallant, 2011), where the majority
score frequencies are distributed in the middle while the lesser score frequencies are
distributed toward the left and right. Assessment on normality is essential because
the most widely used method for estimating a model in SEM is maximum likelihood
under the assumption of normality (Byrne, 2010, Hair et al., 2010). The normality
assessment is made by assessing the measure if skewness and kurtosis exist for
every variable.
For further investigation on univariate normality, the shape of the graphical
distributions can be inspected through skewness and kurtosis (Hair et al., 2007;
Tabachnick & Fidell, 2007). Skewness value provides information about the
symmetry of the distribution, whereas kurtosis value provides information about the
peakedness or flatness of the distribution (Pallant, 2011). Therefore, the positive or
negative skewed value indicated the distribution of the histogram was not in the

133
center, whereas the positive or negative kurtosis value indicated the score is overly
peaked or flat (Tabachnick & Fidell, 2007; Field, 2009). The values of normal
distribution for skewness and kurtosis should be zero. If the skewness or kurtosis
values of variable higher than ± 2.58 indicated the violated normality exist on the
variable (Hair et al., 2007). Besides, Z-values calculated from skewness and kurtosis
scores exceeding a critical value of ±2.58 (0.01 significance level) indicate
deviation from normal distribution (Hair et al., 2007; Tabachnick & Fidell, 2007;
Field, 2009).
This study however achieves normality because all the variables as shown in the
Table 4.6 do not have the problem of normality. The violation of the assumption of
normality is common in the larger samples. In addition the multivariate normality
of the data used in the present study was also supported by the works of Haie et al.,
2007). In reference of their studies, data may approach multivariate normal
distribution if all the absolute values of univariate skewness are less than 2.0 while
the absolute values of kurtosis are less than 7.0. Based on the univariate and
multivariate normality assessment, the data used in this study are considered to
approach normal distribution. Thus, 956 samples were used for the subsequent data
analysis. In a conclusion, the normality test provides evidence that data are normally
distributed for all the variables in this study.
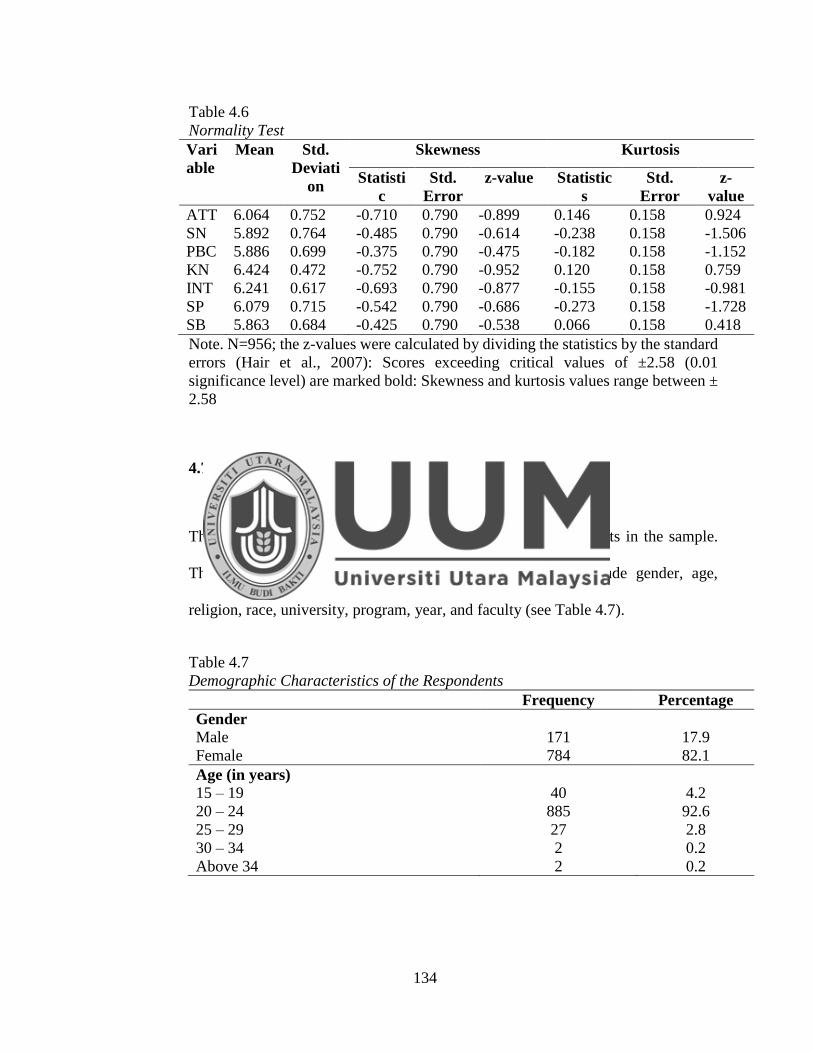
134
Table 4.6
Normality Test
Vari
able
Mean Std.
Deviati
on
Skewness Kurtosis
Statisti
c
Std.
Error
z-value Statistic
s
Std.
Error
z-
value
ATT 6.064 0.752 -0.710 0.790 -0.899 0.146 0.158 0.924
SN 5.892 0.764 -0.485 0.790 -0.614 -0.238 0.158 -1.506
PBC 5.886 0.699 -0.375 0.790 -0.475 -0.182 0.158 -1.152
KN 6.424 0.472 -0.752 0.790 -0.952 0.120 0.158 0.759
INT 6.241 0.617 -0.693 0.790 -0.877 -0.155 0.158 -0.981
SP 6.079 0.715 -0.542 0.790 -0.686 -0.273 0.158 -1.728
SB 5.863 0.684 -0.425 0.790 -0.538 0.066 0.158 0.418
Note. N=956; the z-values were calculated by dividing the statistics by the standard
errors (Hair et al., 2007): Scores exceeding critical values of ±2.58 (0.01
significance level) are marked bold: Skewness and kurtosis values range between ±
2.58
4.7 Demographic Profile of the Respondents
This section describes the demographic profile of the respondents in the sample.
The demographic characteristics examined in this study include gender, age,
religion, race, university, program, year, and faculty (see Table 4.7).
Table 4.7
Demographic Characteristics of the Respondents
Frequency Percentage
Gender
Male
Female
171
784
17.9
82.1
Age (in years)
15 – 19
20 – 24
25 – 29
30 – 34
Above 34
40
885
27
2
2
4.2
92.6
2.8
0.2
0.2

135
Table 4.7 (Continued)
Frequency Percentage
Religion
Islam
Buddhist
Christian
Others
895
21
23
17
93.6
2.2
2.4
1.8
Race
Malay
Chinese
Indian
Others
858
21
21
56
89.7
2.2
2.2
5.9
University
UPM
UUM
UM
UKM
UTM
UMS
USIM
137
213
128
196
99
125
58
14.3
22.3
13.4
20.5
10.4
13.1
6.1
Year
First year
Second year
Third Year
Fourth year
>Fourth year
440
235
209
71
1
46.0
24.6
21.9
7.4
0.1
Source: Researcher
As shown in Table 4.7, there is inequality in the respondents with regards to gender
in the sample that is 171 (17.9%) were males, while the remaining 784 representing
82.1 percent were females. Regarding the age group, 4.2 percent (40) of the
participants were in the age group of 15-19 years. This is followed by those in the
age group of 20-24 years with 885 respondents, which accounted for 92.6 percent
of the sample. In the age group of 25-29 years, there were 27 respondents,
representing 2.8 percent of the sample. Next is the age group of 30-34 years with 2
136
respondents, representing 0.2 percent, followed with only 2 respondents
demonstrating 0.2 percent of the respondents were in the age group above 34 years.
In terms of religion, Table 4.7 shows that 93.6 percent of the respondent which is
895 participants are Islam, followed by 2.2 percent of the respondents which is 21
are Buddhist, 23 representing 2.4 percent of the respondents are Christian and
remaining 1.8 percent of the respondents (17) are others religion. Additionally, in
terms of race of respondents, Table 4.7 shows that 858 representing 89.7 percent of
respondents are Malay, followed by 21 representing 2.2 percent of respondents are
Chinese, next, 2.2 percent of respondents (21) are Indian and remaining 56
representing 5.9 percent of respondents are others race.
In terms of university that respondents have enrolled in, 137 representing 14.3
percent of respondents were studying in UPM, followed by 213 representing 22.3
percent of respondents were studying in UUM; 13.4 percent (128) of participants
were studying in UM; 20.5 percent (196) of respondents were studying in UKM;
next, 99 representing 10.4 percent of participants were studying in UTM; 13.1
percent (125) of respondents were studying in UMS and remaining 58 representing
6.1 percent of respondents were studying in USIM. Table 4.7 also shows the year
of study that are respondents officially in currently; 440 representing 46.0 percent
of participants in first year, 24.6 percent (235) of respondents in second year,
followed by 21.9 percent (209) of respondents in third year, 71 representing 7.4
percent of participants in fourth year and remaining 0.1 percent (1) of respondents
currently above fourth year.
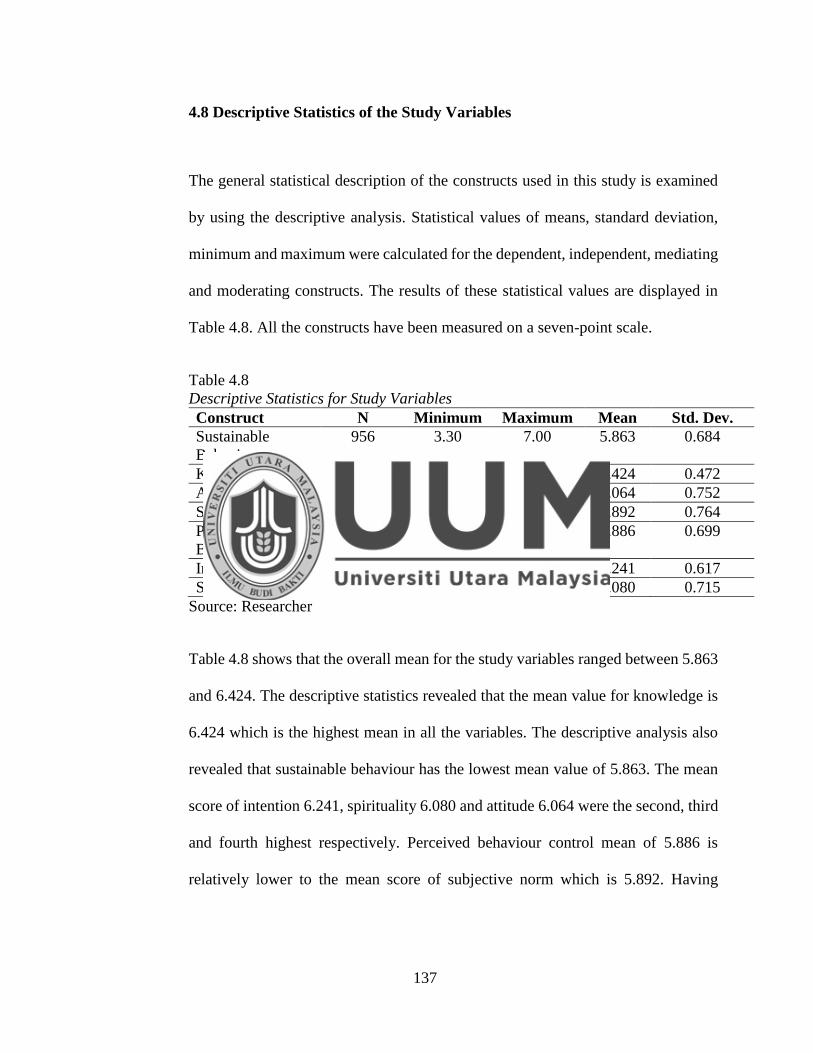
137
4.8 Descriptive Statistics of the Study Variables
The general statistical description of the constructs used in this study is examined
by using the descriptive analysis. Statistical values of means, standard deviation,
minimum and maximum were calculated for the dependent, independent, mediating
and moderating constructs. The results of these statistical values are displayed in
Table 4.8. All the constructs have been measured on a seven-point scale.
Table 4.8
Descriptive Statistics for Study Variables
Construct N Minimum Maximum Mean Std. Dev.
Sustainable
Behaviour
956 3.30 7.00 5.863 0.684
Knowledge 956 4.71 7.00 6.424 0.472
Attitude 956 2.88 7.00 6.064 0.752
Subjective Norm 956 3.00 7.00 5.892 0.764
Perceived
BehaviourControl
956 3.33 7.00 5.886 0.699
Intention 956 3.86 7.00 6.241 0.617
Spirituality 956 3.50 7.00 6.080 0.715
Source: Researcher
Table 4.8 shows that the overall mean for the study variables ranged between 5.863
and 6.424. The descriptive statistics revealed that the mean value for knowledge is
6.424 which is the highest mean in all the variables. The descriptive analysis also
revealed that sustainable behaviour has the lowest mean value of 5.863. The mean
score of intention 6.241, spirituality 6.080 and attitude 6.064 were the second, third
and fourth highest respectively. Perceived behaviour control mean of 5.886 is
relatively lower to the mean score of subjective norm which is 5.892. Having
138
presented the descriptive analysis of the respondents and the respective constructs,
next section presents results of PLS confirmatory factor analysis.
4.9 Results of Confirmatory Factor Analysis (CFA)
This section presents results of confirmatory factor analysis of this study using the
PLS principal component analysis (PCA). All the constructs’ measurements for the
current study were adopted and adapted from previous authors; hence, there is no
need for exploratory data analysis (Hair et al., 2010). PLS CFA using the PLS-
inbuilt principal component analysis is used to determine the structure of the
constructs. After the confirmatory factor analysis by using PLS principal component
analysis, out of total 51 items from the 7 constructs of this study, a total of 38 items
were retained for further analysis as indicated in Table 4.9. Items were deleted for
low cross loading. Removing items with low loading increased the total variance
explained. The composition of the retained items of constructs has been explained
individually in the following section for better understanding.
Table 4.9
Constructs Indicators
Indicator
No.
Indicator
Construct
SB1
SB4
SB8
SB9
SB10
I collect and recycles used paper
I read about environmental issues
I purchase products in reusable containers
I talk to friends about environmental problems
I look for ways to reuse things
Sustainable
Behaviour
(SB)

139
Table 4.9 (Continued)
Indicator
No.
Indicator
Construct
KN1
KN2
KN3
KN7
All living things mutually benefit each other
Natural resources should be preserved for future
generation
The condition of our environment can affect our
health
Alternative energy (for example, solar energy) can be
utilized to replace electricity
Knowledge
(KN)
ATT1
ATT2
ATT3
ATT5
ATT6
ATT7
ATT8
I believe it is important for students to watch or listen
to media programmes about environmental issues
I believe it is important for students to purchase eco-
products (environmentally friendly, non-toxic, and
sustainable product)
I believe it is important for students to recycle paper,
can and glass as much as possible
I believe it is important for students to be concerned
about how much waste is produced in this country
I believe it is important for students to be concerned
about how to reduce pollution
I believe it is important for students to contribute to
the solution of environmental issues by my action
I believe it is important for students to be concerned
about the rate of species extinction in the world
Attitude
(ATT)
SN1
SN2
SN4
SN6
SN7
Most people who are important to me (parents,
lecturers, friends, and communities) influenced me to
recycle materials (such as bottles, cans and paper)
Most people who are important to me (parents,
lecturers, friends, and communities) influenced me to
be a member of an environmental organization
Most people who are important to me (parents,
lecturers, friends, and communities) influenced me to
buy sustainable (energy conserving) products
Most people who are important to me (parents,
lecturers, friends, and communities) influenced me to
be concerned more on environmental issues
Most people who are important to me (parents,
lecturers, friends, and communities) influenced me to
conserve the environment by recycling
Subjective
Norm (SN)

140
Table 4.9 (Continued)
Indicator
No.
Indicator
Construct
PBC1
PBC2
PBC4
PBC6
Recycle materials (such as bottles, cans and paper) is
easy for me
Be a member of an environmental organization is
easy for me
Buy sustainable (energy conserving) products is easy
for me
Be concerned more on environmental issues it is easy
for me
Perceived
Behaviour
Control
(PBC)
INT1
INT2
INT3
INT4
INT5
INT6
INT7
I intend to recycle materials (such as bottles, cans and
paper)
I plan to be a member of an environmental
organization
I intend to turn lights off when I leave a room
I intend to buy sustainable (energy conserving)
products
I intend to turn off my computer when I am done using
it
I intend to be concerned more on environmental issues
I intend to conserve the environment by recycling
Intention
(INT)
SP1
SP2
SP3
SP4
SP5
SP6
I am comfortable expressing my spiritual side at my
institution
When doing recycling, conserving energy and
reducing environmental pollution, I am often guided
by my spirituality practices
My interactions with others in natural world are often
influenced by my spirituality practices
When in my institution, I do not mind talking about my
spirituality with others
I am liable for all my actions that include affecting the
environment
I am always living in harmony and being transparent
with my friends in my institution of study
Spirituality
(SP)
Source: Researcher
The main variable of this study was sustainable behaviour. This constructs was
originally measured by 10 items. After the PLS PCA 5 items SB1, SB4, SB8, SB9
and SB10 were retained. Firstly, knowledge, previously it was represented by 7

141
items but after PLS PCA 4 items including KN1, KN2, KN3 and KN7 were retained
for this study.
Secondly, attitude originally had 8 items but after deleting 1 item this construct now
dominated by 7 items including ATT1, ATT2, ATT3, ATT5, ATT6, ATT7 and
ATT8. Thirdly, subjective norm construct was actually measured by 7 items but
after deleting 5 items now this construct reflecting following items SN1, SN2, SN4,
SN6 and SN7. Fourthly, perceived behaviour control originally had 6 items but after
deleting 2 items this construct now dominated by 4 items including PBC1, PBC2,
PBC4 and PBC6. Next are mediator and moderator, for a mediator, intention was
represented by 7 items and no item were deleted, thus 7 items retained including
INT1, INT2, INT3, INT4, INT5, INT6 and INT7. For a moderator, the spirituality
was represented by 6 items and no item were deleted, therefore, 6 items including
SP1, SP2, SP3, SP4, SP5 and SP6 were retained for this study.
4.10 Models Evaluations
This segment treats both the measurement model and the structural model. In the
following section, an evaluation of the measurement model is discussed in detail.
4.10.1 Measurement Model
In this section, content validity, convergent validity and discriminant validity will
be discussed under the head of Construct’s validity.

142
4.10.1.1 Construct Validity
Construct validity assesses the extend results obtained from the use of a measure fit
the theories around which the test is designed (Sekaran & Bougie, 2010). In other
words, it is concerned with answering the question; does the instrument tap the
actual concept as theorised? To achieve the validity test, the measurement scales
were subjected to three types of validity tests that are: content validity, convergent
validity and discriminant validity (Tore, 2005).
Content validity assesses the level to which the indicators or scale items symbolizes
the area of the concepts under investigation. Five specialists from Universiti Utara
Malaysia (UUM) including Associate Professor and senior lecturer evaluated the
instrument for this research and have found it to be representative of the variable
under investigation. Usually, the picking of the measurement items relies on
commonly accepted recommendations and procedures designed to achieve content
validity (Straub, 1989; Cronbach, 1951). Thus, it is correct to say that the
measurement scale representing the key constructs of this research have fulfilled the
content validity criteria.
Convergent and discriminant validity are sub-categories of construct validity. It
seeks agreement between a specific measurement instrument and a theoretical
concept, and it particularly scans whether the measurement scales symbolise and
work like the attributes (Tore, 2005). In line with Hair et al.’s (2010) suggestion,
the factor loadings, composite reliability and average variance extracted are used to

143
assess convergent validity. Convergent validity is confirmed if all measures that
declare to reflect a particular variable and indeed related.
As a resolution, respective loadings and cross-loadings are first to be assessed for
detection of problems with any particular items as criteria for establishing
convergent validity. Table 4.10 presents the loadings and cross-loadings of
indicators in the respective constructs of this study. The validity of a particular
measurement scale is said to be convergent when indicators/items load highly (i.e.,
> 0.50) on their associated constructs (Hair et al., 2010) and that no item loads more
highly on another construct that the one it intends to measure (Barclay, Higgins, &
Thompson, 1995). As indicated in Table 4.10, all the indicators were loaded on their
respective constructs from a lower bound of 0.585 to an upper bound of 0.876.
Additionally, all the indicators loaded more highly on their respective constructs
than on any other constructs. Figure 4.1 below show the measurement model.
Table 4.10
Factor Loadings and Cross Loadings
Indicat
ors
ATT INT KN PBC SP SN SB
ATT1 0.694 0.335 0.285 0.278 0.319 0.326 0.309
ATT2 0.737 0.350 0.325 0.364 0.371 0.441 0.288
ATT3 0.771 0.367 0.304 0.376 0.327 0.466 0.304
ATT5 0.774 0.335 0.265 0.351 0.340 0.437 0.338
ATT6 0.810 0.422 0.370 0.383 0.420 0.432 0.349
ATT7 0.773 0.358 0.299 0.376 0.370 0.445 0.312
ATT8 0.768 0.374 0.273 0.414 0.346 0.436 0.380
INT1 0.422 0.762 0.361 0.525 0.514 0.486 0.507
INT2 0.290 0.585 0.136 0.515 0.390 0.421 0.492
INT3 0.246 0.609 0.493 0.250 0.383 0.179 0.175
INT4 0.356 0.757 0.365 0.532 0.505 0.450 0.499
INT5 0.222 0.632 0.400 0.283 0.395 0.219 0.264
INT6 0.396 0.840 0.458 0.495 0.542 0.391 0.431
INT7 0.406 0.849 0.464 0.508 0.538 0.410 0.439

144
Table 4.10 (Continued)
Indicat
ors
ATT INT KN PBC SP SN SB
KN1 0.303 0.401 0.782 0.249 0.380 0.217 0.175
KN2 0.321 0.414 0.853 0.248 0.338 0.214 0.178
KN3 0.317 0.402 0.822 0.247 0.361 0.218 0.198
KN7 0.304 0.389 0.671 0.279 0.346 0.253 0.282
PBC1 0.385 0.467 0.240 0.798 0.409 0.475 0.498
PBC2 0.352 0.417 0.159 0.742 0.345 0.477 0.431
PBC4 0.319 0.470 0.234 0.774 0.423 0.494 0.485
PBC6 0.421 0.606 0.380 0.774 0.508 0.484 0.505
SB1 0.298 0.417 0.156 0.512 0.438 0.437 0.706
SB10 0.375 0.462 0.239 0.465 0.444 0.450 0.802
SB4 0.345 0.484 0.231 0.494 0.425 0.431 0.764
SB8 0.260 0.413 0.202 0.430 0.432 0.392 0.709
SB9 0.332 0.391 0.180 0.430 0.403 0.399 0.781
SN1 0.398 0.379 0.189 0.456 0.381 0.801 0.445
SN2 0.432 0.322 0.100 0.498 0.303 0.700 0.417
SN4 0.450 0.425 0.225 0.495 0.391 0.791 0.444
SN6 0.480 0.475 0.336 0.516 0.456 0.820 0.450
SN7 0.477 0.483 0.279 0.537 0.460 0.876 0.490
SP1 0.346 0.501 0.398 0.387 0.749 0.355 0.396
SP2 0.375 0.518 0.354 0.434 0.804 0.413 0.444
SP3 0.391 0.525 0.332 0.413 0.810 0.426 0.455
SP4 0.329 0.455 0.306 0.411 0.756 0.375 0.441
SP5 0.418 0.553 0.434 0.424 0.781 0.366 0.435
SP6 0.308 0.460 0.294 0.449 0.722 0.383 0.460
Note: the items bolded belong to a construct on the same column and they possess
a high loading of > 0.50
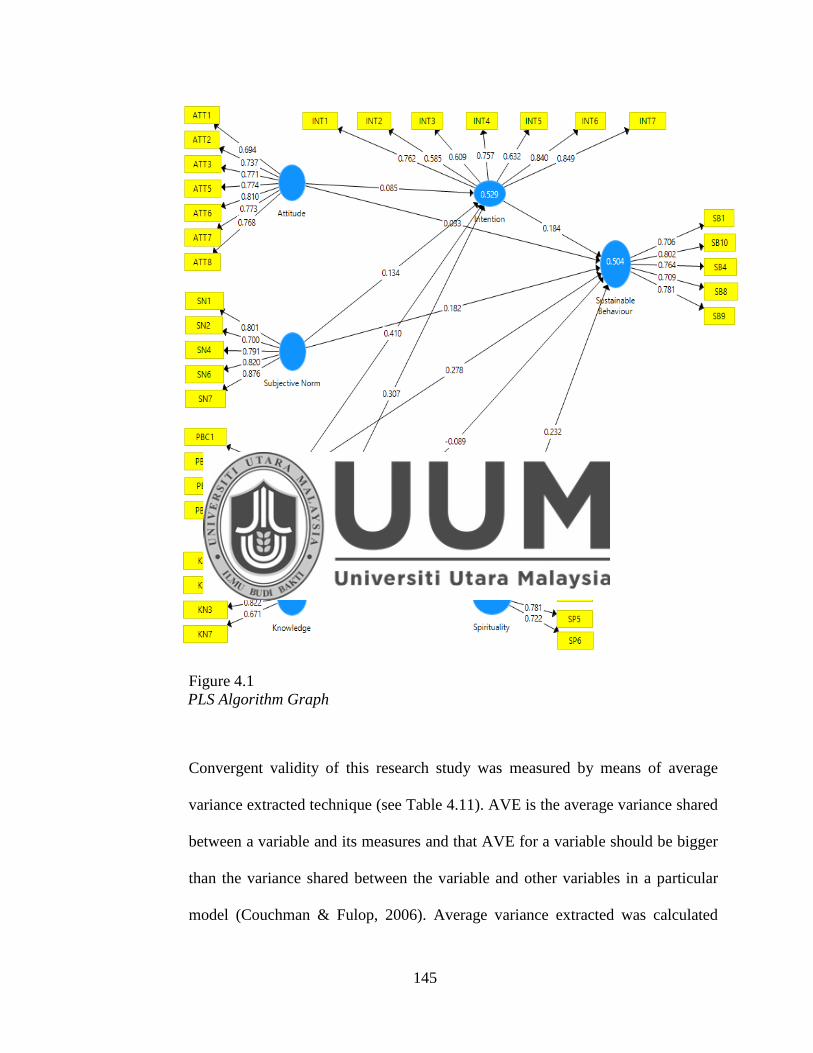
145
Figure 4.1
PLS Algorithm Graph
Convergent validity of this research study was measured by means of average
variance extracted technique (see Table 4.11). AVE is the average variance shared
between a variable and its measures and that AVE for a variable should be bigger
than the variance shared between the variable and other variables in a particular
model (Couchman & Fulop, 2006). Average variance extracted was calculated

146
using the following formula: (∑גyi2) / ((∑גyi2) + ∑Var (€i)). The rule of thumb is
that an AVE value of 0.50 or greater is considered satisfactory (Barclay et al., 1995).
Table 4.11
Loadings, Composite Reliability and Average Variance Extracted
Construct Item Loadings AVE CR
Attitude ATT1
ATT2
ATT3
ATT5
ATT6
ATT7
ATT8
0.694
0.737
0.771
0.774
0.810
0.773
0.768
0.580 0.906
Intention INT1
INT2
INT3
INT4
INT5
INT6
INT7
0.762
0.585
0.609
0.757
0.632
0.840
0.849
0.528 0.885
Knowledge KN1
KN2
KN3
KN7
0.782
0.853
0.822
0.671
0.616 0.864
Perceived Behaviour
Control
PBC1
PBC2
PBC4
PBC6
0.798
0.742
0.774
0.774
0.596 0.855
Sustainable Behaviour SB1
SB10
SB4
SB8
SB9
0.706
0.802
0.764
0.709
0.781
0.567 0.867
Subjective Norm SN1
SN2
SN4
SN6
SN7
0.801
0.700
0.791
0.820
0.876
0.640 0.898

147
Table 4.11 (Continued)
Construct Item Loadings AVE CR
Spirituality SP1
SP2
SP3
SP4
SP5
SP6
0.749
0.804
0.810
0.756
0.781
0.722
0.594 0.898
Source: Researcher
Table 4.11 provided results of AVE calculations with resultant coefficients that
ranged from 0.528 to 0.640, indicating that convergent validity has been established
for all the constructs. With the results of the convergent validity that demonstrated
satisfactory item loadings, satisfactory AVE coefficients and composite reliability
for the individual items, it was evidently enough to confirm that the items represent
distinct latent constructs, and hence establishing their convergent validity.
Discriminant validity, in contrast, relates to whether measures that should not be
related are in reality not related. In measuring the discriminant validity, the square
root of the AVE for each variable is utilised (Fornell & Larcker, 1981). The square
roots of AVE coefficients are then demonstrated in the correlation matrix along the
diagonal. The squared AVE should be greater than the squared correlation estimates
to provide good evidence of discriminant validity (Hair et al., 2006). More
specifically, in order to create satisfactory discriminant validity, the diagonal
elements or coefficients must be bigger than the off-diagonal elements or
coefficients in the corresponding columns and rows.
Table 4.12 shows the outcomes of the discriminant validity evaluation of the
variables used in this study. Along the diagonal, the table presents square roots of

148
AVE for all the constructs indicating higher square roots of AVE for SN (0.800),
and lower for INT (0.726). However, all the square roots of AVE for the constructs
are bigger than the off-diagonal elements or coefficients in the corresponding
columns and rows, hence, establishing an evidence of discriminant validity.
Table 4.12
Discriminant Validity
Construct ATT INT KN PBC SP SN SB
Attitude (ATT) 0.762
Intention (INT) 0.478 0.726
Knowledge
(KN)
0.399
0.514
0.785
Perceived
Behaviour
Control (PBC)
0.479
0.635
0.328
0.772
Spirituality (SP) 0.469 0.651 0.456 0.546 0.771
Subjective
Norm (SN)
0.560
0.526
0.289
0.625
0.502
0.800
Sustainable
Behaviour (SB)
0.429
0.578
0.269
0.622
0.570
0.562
0.753
Source: Researcher
Note: All the values that are bolded in diagonals represent the square root of the
AVE while those off the diagonals represent latent variable correlations
Generally, the results depicted in Table 4.10, 4.11 and 4.12 demonstrate that
measures for all the seven constructs are valid measures of their respective
constructs based on their statistical significance and parameter estimates (Chow &
Chan, 2008).
Having presented the results of the measurement model for this study which
indicated that the measures for all the constructs are reliable and valid, the next step

149
is to present results of the structural model. But before that an important PLS
indicator called goodness-of-fit (GOF) is to be checked first.
4.10.1.2 Goodness-of-Fit (GoF)
Before presenting the results of the structural model, where main, mediating and
moderating effects are presented, preliminary, preliminary analysis regarding
goodness-of-fit (GoF) is presented. Results from this analysis help the current
analyses by providing validating conclusions about the PLS structural model and
providing a positive signal for global application of the model.
Goodness-of-fit (GoF) measures for the PLS path modeling is defined as the
geometric mean of the average communality (outer measurement model) and the
average R-squared (R2) for the endogenous constructs (Tenenhaus, Amato & Vinzi,
2004). Hence, GoF becomes an index for validating the PLS model globally using
the performance of both measurement and structural models. More precisely, it is
used to assess the overall fit of the model (Tenenhaus, Vinzi, Chatelin & Lauro,
2005), thus, the closer the GoF index to 1, the better the fit of the model under
consideration. To support the validity of the current PLS model, GoF value has been
estimated according to the guidelines suggested Wetzels, Odekerken-Schroder, and
Van Open (2009). Specifically, GoF for the model was calculated using the
following formula:

150
GoF = √ R2 × Average of Communality (AVE)
GoF = √0.5165 × 0.588714286
GoF = 0.554
As a guide for ascertaining the adequacy of global PLS model validity accurately,
Wetzels et al. (2009) have provided baseline values as follows: (a) 0.1 equals to
small, (b) 0.25 equals to medium and finally (c) 0.36 equals to large. The calculated
GoF is 0.554, thus indicating the evidence of adequate GoF Pls model validity
(Wetzels et al., 2009).
4.10.1.3 Assessment of Predictive Relevance
The present study also applied Stone-Geisser test of the predictive relevance of the
research model using blindfolding methods (Stone, 1974; Geisser, 1974). The
Stone-Geisser test of predictive relevance is usually used as a supplementary
assessment of goodness-of-fit in partial least squares structural equation modelling
(Duarte & Raposo, 2010). Even though this study used blindfolding to ascertain the
predictive relevance of the research model, it is worth noting that according to
Sattler, Volckner, Riediger, and Ringle (2010) “blindfolding procedure is only
applied to endogenous latent variables that have a reflective measurement model
operationalization” (p. 320). Reflective measurement model specifies that a latent
or unobservable concept causes variation in a set of observable indicators
(McMillan & Conner, 2003). Hence, endogenous latent variable in the present study
151
was reflective in nature; a blindfolding procedure was applied mainly to the
endogenous latent variable.
A cross-validated redundancy measure (Q2) was applied to assess the predictive
relevance of the research model (Hair et al., 2013; Geisser, 1974; Ringle, Sarstedt,
& Straub, 2012; Stone, 1974; Chin, 2010). The Q2 is a criterion to measure how well
a model predicts the data of omitted cases (Chin, 1998b; Hair et al., 2013).
According to Hanseler, Ringle, and Sinkovics (2009), a research model with Q2
statistic (s) greater than zero is consider to have predictive relevance. Additionally,
a research model with greater positive Q2 values suggests more predictive
relevance. Table 4.13 shows the outcomes of the cross-validated redundancy Q2
test.
Table 4.13
Construct Cross Validated Redundancy
Total SSO SSE 1-SSE/SSO
Sustainable Behaviour 4780 3512.673 0.265
Intention 6692 4969.685 0.257
Source: Researcher
As shown in Table 4.13, the cross-validation redundancy measure Q2 for an
endogenous latent variable is above zero, suggesting the predictive relevance of the
model (Chin, 1998b; Henseler et al., 2009).
4.10.2 Structural Model
This section presents results of the structural model and tests of hypotheses for the
study. Specifically, the section is concerned with the testing of the hypotheses
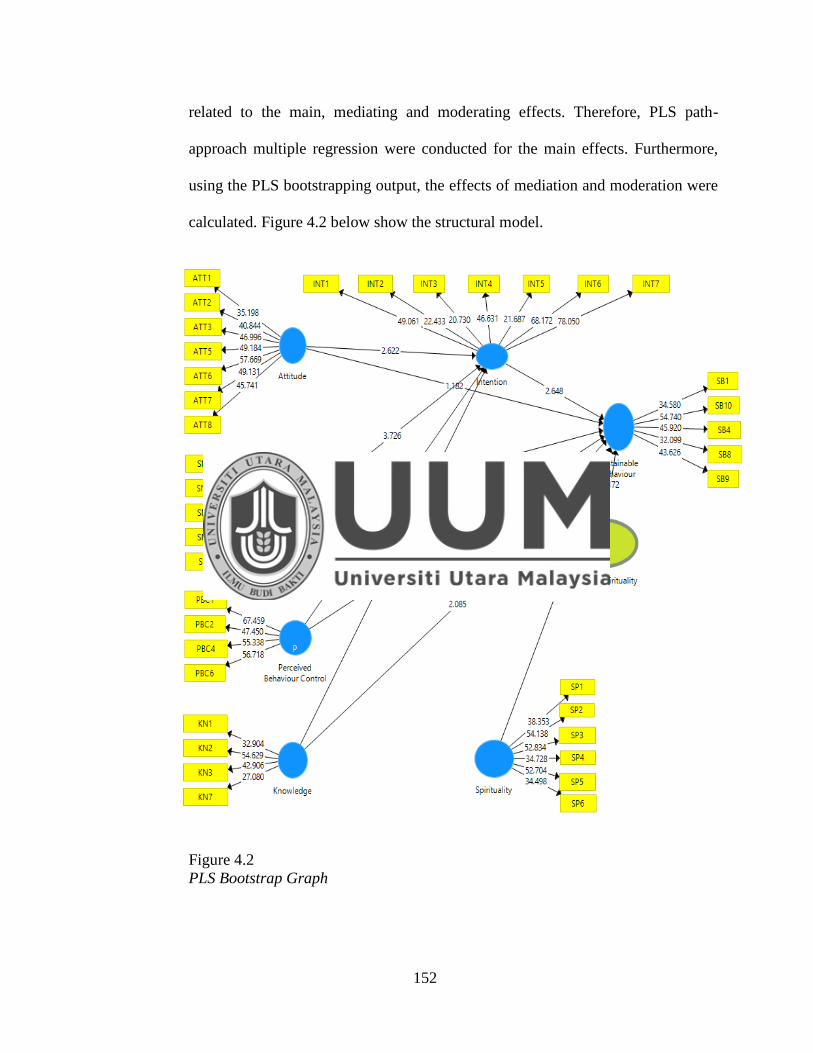
152
related to the main, mediating and moderating effects. Therefore, PLS path-
approach multiple regression were conducted for the main effects. Furthermore,
using the PLS bootstrapping output, the effects of mediation and moderation were
calculated. Figure 4.2 below show the structural model.
Figure 4.2
PLS Bootstrap Graph

153
4.10.2.1 Main Relationship Effect
To understand the main relationship effects within the constructs, SEM PLS
structural model analysis was conducted. The individual contribution of each
exogenous variable is represented by the standardised beta values within the PLS
structural model (Chin, 1998b). The present study also applied the standard
bootstrapping procedure with a number of 1000 bootstrap samples of 956 cases to
assess the significance of the path coefficients (Hair et al., 2013; Hair et al., 2011;
Hair, Sarstedt, Ringle, & Mena, 2012; Henseler et al., 2009). In testing the structural
model relationships, the choice of significance level was set at p < .05 and p < .01
(Hair et al., 2010). Table 4.14; therefore show the estimates of the full structural
model for main effects.
Table 4.14
Results of Main Effects Hypotheses
Hypotheses Relationshi
p
Std Beta Std
Dev
T-Value P-
Value
Decision
H1 KN → SB -0.089 0.028 3.210 0.001 Not
supported
H2 ATT → SB 0.033 0.035 0.940 0.174 Not
supported
H3 SN → SB 0.182 0.036 3.759** 0.000 Supported
H4 PBC → SB 0.278 0.040 6.910** 0.000 Supported
Source: Reseacher
**p< 0.01, *p< 0.05
Hypothesis 1 predicted a relationship effect of knowledge (KN) on the sustainable
behaviour (SB) of students in public universities. Results (Table 4.14) revealed a
not significant positive effect of knowledge on SB (β = -0.089, t = 3.210), thus not
supporting Hypothesis 1.

154
Hypothesis 2 predicted a relationship of attitude (ATT) on the SB of students in
public universities. Result (Table 4.14) indicated a not significant effect of ATT on
SB (β = 0.033, t = 0.940), thus not supporting Hypothesis 2.
Hypothesis 3 predicted a relationship of subjective norm (SN) on the SB of students
in public universities. Result (Table 4.14) indicated a significant effect of SN on SB
(β = 0.182, t = 3.759), thus supporting Hypothesis 3.
Similarly, Hypothesis 4 predicted a relationship of perceived behavioural control
(PBC) on the SB of students in public universities. Results concluded a significant
positive effect of PBC on the SB (β = 0.278, t = 6.910), again supports Hypothesis
4.
4.10.2.1.1 Assessment of Variance Explained in the Endogenous Latent
Variable
Another significant criterion for assessing the structural model in PLS-SEM is the
R-squared value, which is also known as the coefficient of determination (Henseler
et al., 2009; Hair et al., 2012; Hair et al., 2011). The R-squared value represents the
proportion of variation in the dependent variable (s) that can be explained by one or
more predictor variables (Hair et al., 2010; Elliott & Woodward, 2007; Hair et al.,
2006). Even though the acceptable level of R2 value depends on the research context
(Hair et al., 2010), Falk and Miller (1992) proposed an R-squared value of 0.10 as
a minimum acceptable value. Meanwhile, Chin (1998b) suggested that the R-
squared values of 0.67, 0.33 and 0.19 in PLS-SEM can be considered as substantial,
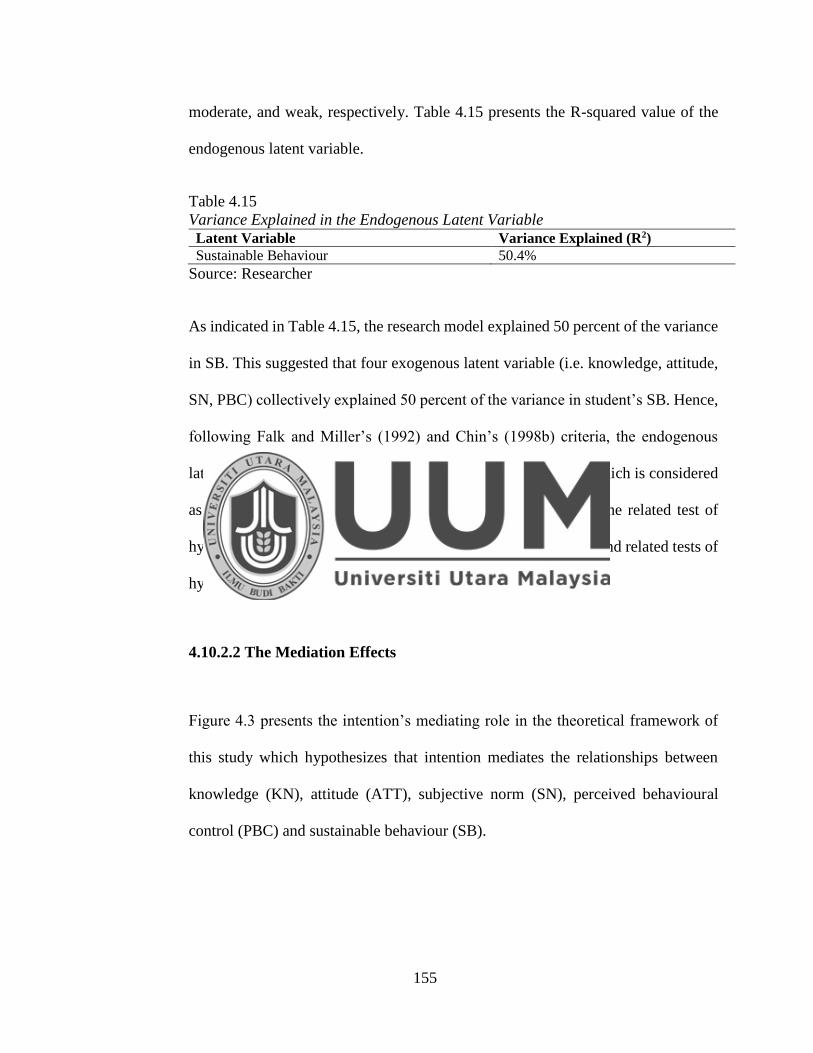
155
moderate, and weak, respectively. Table 4.15 presents the R-squared value of the
endogenous latent variable.
Table 4.15
Variance Explained in the Endogenous Latent Variable
Latent Variable Variance Explained (R2)
Sustainable Behaviour 50.4%
Source: Researcher
As indicated in Table 4.15, the research model explained 50 percent of the variance
in SB. This suggested that four exogenous latent variable (i.e. knowledge, attitude,
SN, PBC) collectively explained 50 percent of the variance in student’s SB. Hence,
following Falk and Miller’s (1992) and Chin’s (1998b) criteria, the endogenous
latent variable showed an acceptable level of R-squared value, which is considered
as moderate. Having presented results of the main effects and the related test of
hypotheses, the next part is presenting the analysis of mediation and related tests of
hypotheses.
4.10.2.2 The Mediation Effects
Figure 4.3 presents the intention’s mediating role in the theoretical framework of
this study which hypothesizes that intention mediates the relationships between
knowledge (KN), attitude (ATT), subjective norm (SN), perceived behavioural
control (PBC) and sustainable behaviour (SB).

156
Figure 4.3
The influences of KN, ATT, SN, PBC and SB
Mediation test is conducted to find if a mediator variable can significantly carry the
influence of an independent variable to a dependent variable (Ramayah, Lee, & In,
2011). In other words, mediation test assesses the indirect effect of the independent
variable on the dependent variable through a mediator variable. Hayes and Preacher
(2010) observed that mediation analysis is achieved through many techniques
including (1) simple techniques that consist of the causal steps approach (Baron &
Kenny, 1986) or the Sobel test (Sobel, 1982); (2) newer approaches that demand
just fewer unrealistic statistical assumptions. These include the distribution of the
product method (MacKinnon, Lockwood, & Williams, 2004), and (3) re-sampling
approaches such as bootstrapping (Bollen & Stine, 1990; MacKinnon et al., 2004;
Preacher & Hayes, 2004, 2008; Shrout & Bolger, 2002).
Importantly, the mediation test used for this study was based on the PLS approach,
and thus the hypotheses for the study were tested using the partial least squares
(PLS) structural equations modeling (SEM) technique. The PLS-SEM technique is
Independent Variables Mediating Variable Dependent Variable
-Knowledge
-Attitude
-Subjective
Norm
-Perceived
Behavioural
Control
Intention Sustainable
Behaviour

157
increasingly gaining prominence and acceptance by researchers (House, Spangler,
& Woycke, 1991; Howell & Avolio, 1993) because it is suitable for testing complex
multivariate main and indirect effects models like in the present study. Although
PLS is popularly associated with smaller sample size (Preacher & Hayes, 2004), the
techniques is also used to make inferences about parameters in studies involving
large sample size (Starkweather, 2011). Bootstrap is the PLS procedure used in this
study to evaluate the statistical significance of relevant path coefficients. In PLS
analysis, bootstrapping represents a more exact calculation of measures (Chin,
2010).
Although PLS uses path analysis and treats direct and indirect effects
simultaneously, like other mediation techniques (Baron, & Kenny, 1986), there is
yet not any mechanism for treating mediating model simultaneously. Specifically,
the PLS technique has no formal detailed guidelines for mediation tests (Bontis et
al., 2007). PLS method provides only guidelines for determining if mediation
among certain variable exists while other details regarding whether the mediation
is partial of full still remain unresolved. However, the PLS-SEM technique has been
reported to be a particularly well-suited technique for mediation study (Bontis et al.,
2007; Chin, 1998b; Hair et al., 2013; Hayes & Preacher, 2010; Iacobucci et al.,
2007).
4.10.2.2.1 The Direct and Indirect Effects
This section presents results regarding the PLS structural direct and indirect effects
before presenting the actual mediation effects for this study. Indirect effects are
158
defined as the summation of both direct and indirect effects between two particular
constructs (Albers, 2010). Additionally, Hayes and Preacher (2010) argued that
indirect effect is concerned with the influence of X on Y through an intervening
variable M. It is quantified as the product of paths ‘a’ and ‘b’ and is interpreted as
the quantity that Y is expected to change as X Changes as a result of X’s effect on
M which, in turn, influences Y (Hayes & Preacher,2010). In PLS model, before
actual mediation is determined, presenting the total effects is crucial because it gives
a comprehensive picture of the mediating constructs’ role, and as well provides
insights to practitioners about cause-effect relationships (Hair et al., 2013).
Similarly, Preacher and Hayes (2004) argued that mediating effects are first
determined by indirect effect of exogenous constructs on the endogenous constructs
through a proposed mediating constructs.
The results of the indirect analysis as displayed in Table 4.16 indicated an indirect
association between the constructs. The results indicate significant indirect
relationship between KN and SB (β = 0.057; t = 4.354), ATT and SB (β = 0.016; t
= 2.163), SN and SB (β = 0.025; t = 3.008), as well as PBC and SB (β = 0.076; t =
4.312).

159
Table 4.16
Indirect Effects
Path Original
Sample (O)
Sample
Mean
(M)
Standard
Dev
(STDEV)
T-statistics
(|O/STDEV|)
P-
Values
KN → SB 0.057 0.057 0.013 4.354 0.000
KN → INT
ATT → SB 0.016 0.016 0.007 2.163 0.031
ATT → INT
SN → SB 0.025 0.025 0.008 3.008 0.003
SN → INT
PBC → SB 0.076 0.076 0.018 4.312 0.000
PBC → INT
Source: Researcher
Based on the result, we can conclude that all four mediations are significant at t-
values > 1.96 and p-value < 0.05.
4.10.2.2.2 Mediation Results
The actual mediation effect in PLS model is determined by means of bootstrapping
(with 1000 re-samples) analysis together with formulated hypotheses (Hair et al.,
2013). Specifically, in the software of Smart PLS 3, the mediation effect can be
obtained directly from the output of analysis in Smart PLS 3. In testing the structural
model relationships for mediation, the choice of significance level was set at p < .05
and p < .01 (Hair et al., 2010). Next, we also need to calculate the 95% bootstrapped
confidence interval bias using the following formula:
Lower limit (LL) a*b – z (SE) (z value, for 0.05 level is 1.96)
Upper limit (UL) a*b + z (SE)
Table 4.17; therefore show the estimates of the hypothesis testing for mediation
effect. The bootstrapping analysis showed in table 4.17 that all the four indirect

160
effects, β = 0.057, β = 0.016, β = 0.025, β = 0.076, are significant with t-values of
4.354, 2.163, 3.008, and 4.312. The indirect effects 95% Boot CI Bias Corrected:
[LL = 0.033, UL = 0.083], [LL = 0.004, UL = 0.032], [LL = 0.010, UL = 0.042],
and [LL = 0.043, UL = 0.110], do not straddle a 0 in between indicating there is
mediation (Preacher and Hayes, 2004, 2008). Thus, we can conclude that the
mediation effects are statistically significant.
Table 4.17
Results of Mediation Hypotheses
No Relationship Std
Beta
Std
Dev
T-Value P-
Value
Confidence
Interval (BC)
Decision
LL UL
H5 KN→INT→
SB
0.057 0.013 4.354** 0.000 0.033 0.083 Supported
H6 ATT→INT
→SB
0.016 0.007 2.163* 0.031 0.004 0.032 Supported
H7 SN→INT→S
B
0.025 0.008 3.008** 0.003 0.010 0.042 Supported
H8 PBC→INT→
SB
0.076 0.018 4.312** 0.000 0.043 0.110 Supported
Source: Reseacher
Note: **p< 0.01, *p< 0.05, BC = Bias Corrected, UL = Upper Level, LL= Lower
Level
4.10.2.3 The Moderation Effects
This study applied a product indicator approach using Partial Least Squares
Structural Equation Modelling to detect and estimate the strength of the moderating
effect of spirituality on the relationship between intention and sustainable behaviour
of students in public universities. The product term approach is considered
appropriate in this study because the moderating variable is continuous (Rigdon,
Schumacker & Wothke, 1998). According to Henseler and Fassott (2010) “given
161
that the results of the product term approach are usually equal or superior to those
of the group comparison approach, we recommend always using the product term
approach” (p. 721).
To apply the product indicator approach in testing the moderating effects of
spirituality on the relationship between the indicators of the latent independent
variable and the indicators of the latent moderator variable need to be created,
hence, these product terms would be used as indicators of the interaction term in the
structural model (Kenny & Judd, 1984). Furthermore, to ascertain the strength of
the moderating effects, the present studied applied Cohen’s (1988) guidelines for
determining the effect size. Table 4.18, therefore, show the estimates after applying
a product indicator approach to examine the moderating effect of spirituality on the
relationships between exogenous and endogenous latent variable.
4.10.2.3.1 Determining the Strength of the Moderating Effect
In order to determine the strength of the moderating effect of the spirituality on the
relationships between intention and the sustainable behaviour among students in
public universities, Cohen’s (1988) effect size was calculated. Further, the strength
of the moderating effect can be assessed by comparing the coefficient of
determination (R-squared value) of the main effect model with the R-squared value
of the full model that incorporates both exogenous latent variables and moderating
variable (Henseler & Fassott, 2010; Wilden, Gudergan, Nielsen, & Lings, 2013).
Thus, the strength of the moderating effect could be expressed using the following
formula (Cohen, 1988; Henseler & Fassott, 2010):

162
Effect size (f2) = R2 (Model with moderator) – R2 (Model wihout moderator)
1 – R2 (Model with moderator)
Moderating effect size (f2) values of 0.02 can be considered as weak, effect size of
0.15 as moderate while the effect size above 0.35 may be regarded as strong (Cohen,
1988; Henseler & Fassott, 2010). However, according to Chin, Marcolin and
Newsted (2003), a low effect size does not necessarily mean that the underlying
moderating effect is insignificant. Even a small interaction effect can be meaningful
under extreme moderating conditions, if the resulting beta variations are
meaningful, then it is essential to take these conditions into account (Chin et al.,
2003). The result of the strength of the moderating effect of spirituality is presented
in Table 4.17.
Following Henseler and Fassott’s (2010) and Cohen’s (1988) rule of thumb for
determining the strength of the moderating effect, Table 4.18 showed that the effect
size for SB was 0.06, suggesting the moderating effect is weak.
Table 4.18
Strength of the Moderating Effect Based on Cohen’s (1988) and Henseler and
Fassotts (2010) Guidelines
Endogenous
Latent
Variable
R-squared
f - Squared
Effect Size Included Excluded
Sustainable
Behaviour
0.515 0.504 0.02268 Small
Source: Researcher

163
4.10.2.3.2 Testing for Interaction Effects
Table 4.19 showed that INT*SP → SB beta was 0.112. Just with the beta values it
is not possible to confirm whether the beta is significant or not. Thus, to test and see
whether of the interaction effect is significant, a bootstrapping procedure with (1000
re-samples) was run to get t-values. Moderation is established if ‘T’ value is equal
to or greater than 1.64 at 0.05 significance level or 2.33 at 0.01 significance level
using one-tail test, or 1.96 at 0.05 significance level or 2.58 at 0.01 significance
level using two-tail test (Hair et al., 2010).
The results shown in Table 4.19, indicated that the interaction terms representing
INT*SP →SB (β = 0.112, t = 4.241) was statistically significant. Hence, the
hypothesis H9 was supported.
Table 4.19
Results of Moderation Hypothesis
Hypo
thesis
Relationship Std
Beta
Std
Dev
T-Value P-
Value
Decision
H9 INT * SP → SB 0.112 0.026 4.241** 0.000 Supported
Source: Reseacher
**p< 0.01, *p< 0.05
4.10.2.3.3 The Interpretation of the Interaction Result
As can be seen in Table 4.19, the interaction between Intention*Spirituality is
positive but it is not entirely clear how it differs in terms of the groups (High
Spirituality vs Low spirituality). In other words, the size and precise nature of this
effect is not easy to define from examination of the coefficients alone, and it
becomes even more so when one or more of the coefficients are either positive or

164
negative, or when the standard deviations of X and Z are very different (Dawson,
2014). Thus, Dawson (2014) suggested that to follow up for the significant
interactions, an interaction plot can be drawn. Previously, in SPSS, drawing this
interaction plot would be quite tedious as we need to run the descriptive for the IV
and the Moderator to get a value to split the variable into High/Low before we can
plot. The graph plot shown in Figure 4.4 indicated the plotting graph result.
Figure 4.4
Plotting Graph Result
The interpretation of the interaction plots is to look at the gradient of the slopes and
the directions. As can be seen in Figure 4.4, the line labeled for low spirituality has
a steeper and negative gradient when compared to the high spirituality (less steep
and negative gradient) indicating that the negative relationship is indeed stronger
when spirituality is low and positive relationship. Thus, it is supported as what we
1
1.5
2
2.5
3
3.5
4
4.5
5
Low Intention High Intention
Su
stain
ab
le B
ehav
iou
r
Low
Spirituality
High
Spirituality
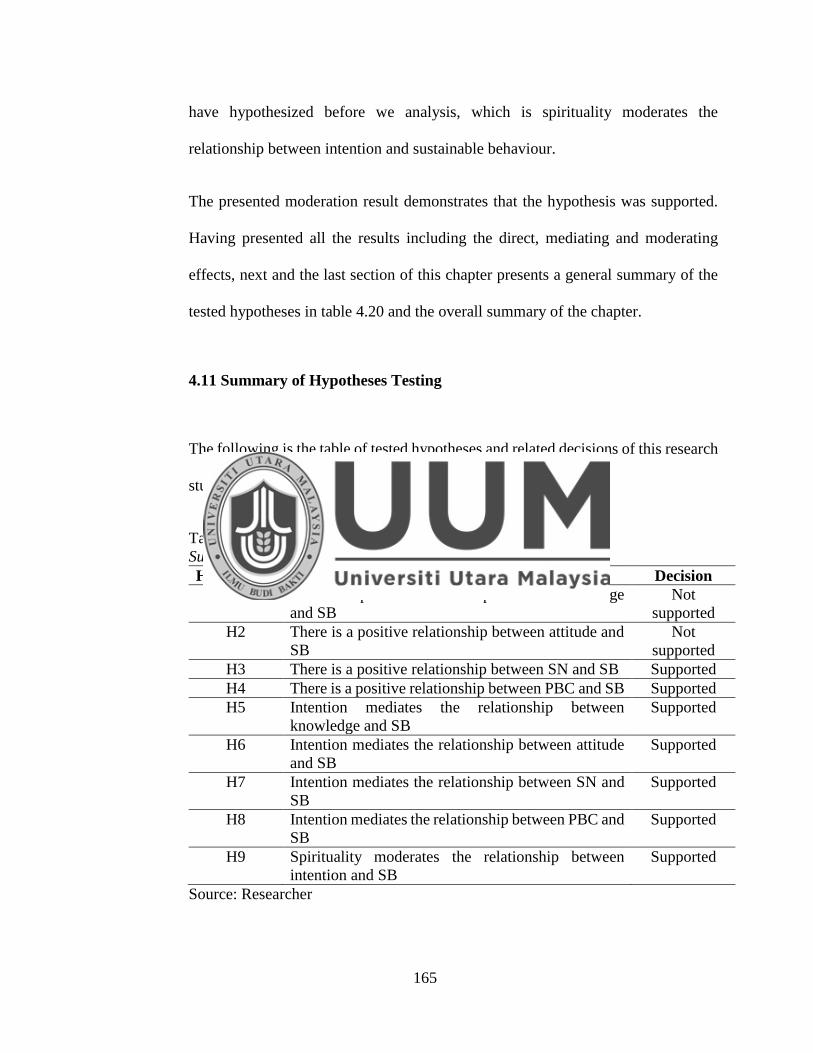
165
have hypothesized before we analysis, which is spirituality moderates the
relationship between intention and sustainable behaviour.
The presented moderation result demonstrates that the hypothesis was supported.
Having presented all the results including the direct, mediating and moderating
effects, next and the last section of this chapter presents a general summary of the
tested hypotheses in table 4.20 and the overall summary of the chapter.
4.11 Summary of Hypotheses Testing
The following is the table of tested hypotheses and related decisions of this research
study.
Table 4.20
Summary of Hypotheses Testing
Hypotheses Statement Decision
H1 There is a positive relationship between knowledge
and SB
Not
supported
H2 There is a positive relationship between attitude and
SB
Not
supported
H3 There is a positive relationship between SN and SB Supported
H4 There is a positive relationship between PBC and SB Supported
H5 Intention mediates the relationship between
knowledge and SB
Supported
H6 Intention mediates the relationship between attitude
and SB
Supported
H7 Intention mediates the relationship between SN and
SB
Supported
H8 Intention mediates the relationship between PBC and
SB
Supported
H9 Spirituality moderates the relationship between
intention and SB
Supported
Source: Researcher

166
4.12 Summary
Generally, the self-reporting technique has provided appreciable support in
assessing the relationship between knowledge, attitude, SN, PBC and SB of students
in the public universities through the mediating effect of intention and the
moderating effect of spirituality between intention and SB. With minor
modifications, the PLS confirmatory factor analysis (CFA) has confirmed the
structural composition of the seven constructs (knowledge, attitude, SN, PBC, SB,
intention and spirituality). Using the PLS technique, the multivariate analysis has
statistically provided evidence of predictive relevance and the importance of
intention as a good mechanism through which students enhance their sustainable
behaviour. Specifically, results from PLS analyses have provided support for most
of the hypotheses for this study.
Findings revealed significant main effects relationship between: (1) SN and SB of
students; and (2) PBC and SB of students. While, finding also revealed not
significant and not positive main effects relationships between (1) knowledge and
SB and (2) attitude and SB of students.
Regarding the mediating effect of intention on the relationships between
knowledge, attitude, subjective norm, perceived behaviour control and sustainable
behaviour of the students, the PLS bootstrap results demonstrated that all the
hypotheses were significant. These significant mediating relationships include: (1)
intention mediates the relationship between knowledge and SB of students; (2)
intention mediates the relationship between attitude and SB of students; (3)

167
intention mediates the relationship between SN and SB of students; and finally (4)
intention mediates the relationship between PBC and SB of students.
Concerning the moderating effect of spirituality on the relationships between the
intention and sustainable behaviour, PLS path coefficients revealed that the
formulated hypotheses was significant and was supported because of it sufficient t-
value. But as far as the strength of the moderating effect is concerned this study
showed a low effect size which can be meaningful under extreme moderating
conditions. The next chapter (Chapter 5) further discusses the findings in detail,
followed by contributions, limitations, suggestions for future research and
conclusions.
168
CHAPTER FIVE
DISCUSSION, CONCLUSION AND RECOMMENDATIONS
5.1 Introduction
This chapter provides the summary of the findings, discussion, suggestions and
conclusions of the study. The main objective of this research was to gain a better
understanding of the factors influencing sustainable behaviour among students of
public universities in Malaysia. In order to achieve the main objective, the research
measured the mediating effect of intention on the relationships between knowledge,
attitude, subjective norm (SN), perceived behavioural control (PBC) and sustainable
behaviour (SB) of students in public universities and also the moderating effect of
spirituality on the relationship between intention and SB. In the previous chapter,
the findings of this study were presented. This chapter starts with a recapitulation
of the study followed by a section on the summary of the results of this research.
Next is Section 5.3, which includes discussion on the finding of this study in the
light of the tested hypotheses and literature review. Subsequently, Section 5.4
presents the contribution of the study, which is divided into practical, theoretical
and methodological. Then, Section 5.5 covers the limitations of the study followed
by Section 5.6, which presents suggestions for future research. The conclusions
covered in Section 5.7, which summarises the whole research.

169
5.2 Recapitulation of the Research Findings
This research focuses the subject of sustainable behaviour among students in public
universities in Malaysia. Questionnaires were distributed to students of seven public
universities in Malaysia based on UI GreenMetric World University Ranking and
collected data were then analysed using the partial least squares (Smart PLS)
software. The analysis was carried out based on the research framework, which was
represented by SB as the dependent variable, independent variables that consisted
of knowledge, attitude, SN and PBC, while the mediating and moderating variables
were intention and spirituality respectively. Overall, this study has succeeded in
advancing the current understanding of the SB of students by providing answers to
the following research questions:
1. Is there a significant relationship between knowledge and SB among students
in Malaysian Public Universities?
2. Is there a significant relationship between attitude and SB among students in
Malaysian Public Universities?
3. Is there a significant relationship between SN and SB among students in
Malaysian Public Universities?
4. Is there a significant relationship between PBC and SB among students in
Malaysian Public Universities?

170
5. Does intention mediate the relationship between knowledge and SB among
students in Malaysian Public Universities?
6. Does intention mediate the relationship between attitude and actual SB among
students in Malaysian Public Universities?
7. Does intention mediate the relationship between SN and SB among students
in Malaysian Public Universities?
8. Does intention mediate the relationship between PBC and SB among students
in Malaysian Public Universities?
9. Does spirituality moderate the relationship between intention and SB among
students in Malaysian Public Universities?
Regarding the direct relationships between exogenous latent variables and
endogenous latent variable, the findings of this study indicated that 2 hypotheses
were supported while 2 hypotheses were not supported. The results of the PLS path
model showed that knowledge was not significantly and negatively related to SB.
Besides, attitude was found to be not significantly related to SB. Meanwhile, SN
was found to be significantly and positively related to the SB. Findings further
revealed that PBC was also found significantly and positively related to SB.
With respect to intention as a mediator on the relationships between exogenous
latent variables and endogenous latent variable, results provided empirical support
for all four hypotheses. Intention was found to mediate the relationship between
knowledge and SB. Similarly, intention was also found to mediate the relationship
171
between attitude and SB. The results also revealed that intention was found to
mediate the relationship between SN and SB. Lastly, the findings also showed that
intention was found to mediate the relationship between PBC and SB.
Results from PLS path coefficients, also revealed that moderating effect of
spirituality on the relationship between intention and sustainable behaviour was
supported. But as far as the strength of the moderating effect is concerned this study
showed a low effect size which can be meaningful under extreme moderating
conditions.
5.3 Discussions
This section discusses the study’s findings in the light of relevant theories and
findings of previous research.
5.3.1 Direct / Main effects
This section discusses results concerning all the four direct relationships between:
(1) knowledge as exogenous variable and SB of students as an endogenous variable;
(2) attitude as exogenous variable and SB of students as an endogenous variable;
(3) SN as exogenous variable and SB of students as an endogenous variable; and
(4) PBC as exogenous variable and SB of students as an endogenous variable.

172
5.3.1.1 Relationship between Knowledge and Sustainable Behaviour
As discussed previous in literature review section, the original assumption is that
knowledge supports the students to enhance their SB. Surprisingly, this relationship
is different to expectations. This study did not find a statistically positive and
significant between knowledge and SB as shown in Table 4.14 in Chapter Four.
Based on the results presented in Chapter Four, this hypothesis H1 is not statistically
supported and there is not enough statistical evidence to prove that knowledge
affects SB among students of public universities in Malaysia.
Hypothesis H1 of this study states that there is a not significant and not positive
relationship between knowledge and SB of students in public universities in
Malaysia. Results presented in previous chapter shows not support for the first
hypothesis at the 0.01 level of significance (β = -0.089, t = 3.210, p < 0.01). The
result means that knowledge was observed to be a not significant determinant of SB
among students in public universities in Malaysia.
Although, this result differs from some published studies (Aini & Laily, 2010;
Kumar, 2012; Pedro & Pedro, 2010), but it is broadly consistent with the studies of
Syed Idros (2014) and Michalos et al. (2009). This could be due to several reasons
for this hypothesis did not statistically supported, which includes geographical
location issues, dissimilar context of studies and unit analysis, and the respondents
might have no adequate awareness and sufficient knowledge to the issues of
environmental problems in Malaysia. It is proved that in Malaysia, the awareness
of the students on environmental issues is still low. This statement is in line with
173
the finding by Aini et al. (2003) that the environmental awareness among
respondent is still low although various strategies had been implemented to educate
and increase community environmental awareness in Malaysia. It is related that the
main reason why the lack and low of participation and support from students and
community in sustainability activities. It is because even though students in general,
have knowledge about the environment and realize that the environments need to
be taken care of, most of them are not oriented to translating their knowledge into
behaviour. This is in consistent with the research conducted by Mahmud & Osman
(2010) said that people might have a brief understanding of recycling, reducing
pollution and conserving energy, often they are unable to connect the benefit of
these actions and consequences of not recycling, reducing pollution and conserving
energy to the environment in a refined way (Prestin & Pearce, 2009).
The hypothesis is generated from studies in different context area and unit analysis,
which are respondents who are consumers, youth, and pre-school educator, which
means not in higher education sector, (Aini & Laily, 2010; Li-ming & Wai, 2013;
Niaura, 2013) from Denmark, Spain, and Columbia (Grønhøj & Thøgersen, 2012;
Michalos et al., 2009; Pedro & Pedro, 2010). The different result of knowledge
possessed by different unit analysis and different country may be part of the reason.
This may suggest that knowledge gained by student in Malaysia may not be similar
as unit analysis or countries referred. This is an important issue for future research.
Further researches and investigations on this subject matter are therefore
recommended.

174
5.3.1.2 Relationship between Attitude and Sustainable Behaviour
The relationship between attitude and SB also has the same results with the
relationship between knowledge and SB. As discussed earlier in literature review,
the original assumption is that attitude enables the students to enhance their SB.
Surprisingly, this relationship is contrary to expectations. This study did not find a
statistically significant between attitude and SB as shown in Table 4.14. Based on
the results presented in Chapter Four, this hypothesis H2 is not statistically
supported and there is not enough statistical evidence to prove that attitude affects
SB among students of public universities in Malaysia.
Hypothesis H2 of this study states that there is a not significant relationship between
attitude and SB of students in public universities in Malaysia. Results presented in
previous chapter shows not support for the second hypothesis (β = 0.033, t = 0.940,
p = 0.174). The result means that attitude was observed to be a not significant
determinant of SB among students in public universities in Malaysia.
Although, this result differs from some published studies (Abd-Ella et al., 2012;
Chen & Chai, 2010; Tan et al., 2015), but it is broadly consistent with the studies of
Poortinga et al. (2004) and Graefe et al. (2000). This could be due to several reasons
for this hypothesis not statistically supported, which includes geographical location
issues, dissimilar context of studies and unit analysis. Besides, the main reason of
the lack in participation and support from students and community in sustainability
activities because these activities are voluntary and depends on individual willing
to change and care for the environment for future generations. But if each individual
175
that involve in sustainability activities is awarded with monetary benefit, then it is
expected a majority of Malaysians would involve and aware with environmental
issues effectively. This is in consistent with the research conducted by Ajzen (1991)
that people will only comply when SB aligns with self-interest (Ajzen, 1991).
The hypothesis is generated from studies in different context area and unit analysis,
which are respondents who are farmers, nations, consumers, and traveler which
means not in higher education sector, but in other sectors namely agricultural sector,
banking sector, hoteling sector, marketing and purchasing (Abd-Ella et al., 2012;
Han, 2015; Kumar, 2012; Li-ming & Wai, 2013; Saleki & Seyedeh Maryam
Sayedsaleki, 2012; Shih & Fang, 2004; Tan & Lau, 2009; Zuraidah et al., 2012)
from Taiwan, Korea, Iran, Canada, and Egypt (Abd-Ella et al., 2012; de Leeuw et
al., 2014; Han, 2015; Saleki & Sayedsaleki, 2012; Shih & Fang, 2004). The different
result of attitude possessed by different unit analysis and different country may be
part of the reason. This may suggest that attitude embedded in student themselves
in Malaysia may not similar as unit analysis or countries referred. This is an
important issue for future research. Further researches and investigations on this
subject matter are therefore recommended.
The results are not consistent with Theory of Planned Behaviour (TPB) which
proposes a comprehensive causal structure that deals with the growth of attitude and
its consequence on the regulation of their behaviour. This very much no applies to
the students in universities because through the attitude, they are not able to show
the SB in the way to solve the environmental problem in our country. This study

176
contributes to the field of knowledge by further opening up and clarifying the
relationship that exists between attitude and SB of students in universities.
5.3.1.3 Relationship between Subjective Norm and Sustainable Behaviour
Matthies et al. (2012) supported the significance of SN in sustainability and pro-
environmental setting by saying that an individual decision was virtually influenced
by other people. SN are sturdy predictors and determinants of the level of SB that
person finally accomplish (Alias et al., 2015). Hypothesis H3 of this study states
that there is a significant relationship between SN and SB of students in public
universities in Malaysia.
Results presented in previous Chapter Four shows support for the third hypothesis
at the 0.01 level of significance (β = 0.182, t = 3.759, p < 0.01). The results mean
that SN was observed to be a significant determinant of SB of students in public
universities in Malaysia.
In this study, the results implies that SN is a significant determinant of SB among
students of public universities in Malaysia. For example, the results of the study
indicated that the mean value of descriptive statistics for SN is at a very high level,
around 5.892. Thus, this mean value confirms the assumption of the study that the
behaviour of students are influenced by norm of social groups, which can indirectly
increase their SB.
177
It has also been found that most of the students in the universities have been
influenced by college mates, friends, lecturers, parents and societies in behaviour
decision making and action regarding the sustainability aspects. These influences
stimulate them with high subjective norm and good surroundings to show the noble
behaviour among them. Research by Leeuw et al. (2015) demonstrates that what the
parents, the family in general, the friends, the lecturer, and to some extent celebrities
do to protect the environment is more important than what they say. For a norm-
based interference to be effective, therefore, it should focus on the behaviour of
important others, perhaps by encouraging parents and other family members to set
good examples. It was proved that SB among students can be enhanced by SN,
which are the role model of the students to make the decision to do the right things
and to engage with the sustainability aspect. Sawitri, Hadiyanto, and Hadi (2015)
proved that the influence of the surroundings drive to promote the good behaviour.
The finding is in line with previous studies. Fielding et al. (2008) confirmed that SN
is the best predictor that enhancing environmental activism among students. Thus,
individuals who had perceived greater normative support for this activity also had
greater potential to engage in the pro-environmental behaviour. Cordano et al.
(2010) noted that numerous researches have confirmed the significance of SN in
promoting SB. Since subjective norm has been generally linked to behaviour, it
should not be a surprise that it has been the focus of many researches. Besides,
numerous empirical researchers have found a positive link between recycling
behaviour and a general measure of SN (Matthies et al., 2012). Mahmud and Osman
(2010) deduced in a wide literature review on SN, which SN is a dominant predictor
178
of pro-environmental behaviour. Najera (2010) stated that assessment of the related
SN literature also validated the argument that student’s higher SN play a role
towards SB. It has been revealed that greater levels of SN direct to improved
purchasing behaviour for environmentally sustainable products among students in
India (Kumar, 2012). Niaura (2013) found in his research that those people with
higher levels of SN will certainly have good behaviour in environmental aspect
instead of those with lower SN. Bezbatchenko (2011) carried out an analysis which
examined the individual research outcomes related to the connection between SN,
and SB of the personnel. From the outcomes of the research, it was noticed that SN
theory can be implemented to SB aspect. Individuals with higher SN have the
information about the appropriateness of behaviour under consideration. Thus, the
exhibition of behaviour resulting in improvement of environment such as recycling,
conserving energy and reducing pollution was directly affected by the extent of the
social pressure or social norm and the directionality of such relationship was
positive in nature.
The results are consistent with Theory of Planned Behaviour (TPB) which proposes
a comprehensive causal structure that deals with the growth of SN and its effect on
the regulation of their behaviour. This very much applies to the students in
universities because through the SN, they are able to show the SB in the way to
solve the environmental problem in our country. This study contributes to the field
of knowledge by further opening up and clarifying the relationship that exists
between SN and SB of students in universities.
179
5.3.1.4 Relationship between Perceived Behaviour Control and Sustainable
Behaviour
PBC is conceptualised as the extent to which individuals perceive the behaviour to
be under their volitional control (“will power”) (Fielding et al., 2008). PBC
indicates the ability of a person to undertake the behaviour under consideration
under the assumption that individual behaves in a rational manner considering the
ramification of his or her actions (Ramayah, Lee & Lim, 2012). Besides, PBC
displays the difficulty and controllability to execute specific behaviour (Ajzen,
1985). Hypothesis H4 of this study states that there is a positive relationship
between PBC and SB among students of public universities in Malaysia.
Results presented in previous chapter found support for the fourth hypothesis at the
0.01 level of significance (β = 0.278, t = 6.910, p < 0.01). The result means that
PBC was observed to be a significant determinant of SB among students of
universities in Malaysia.
In this study, the results implies that PBC is a significant determinant of SB among
students of public universities in Malaysia. For example, the results of the study
indicated that the mean value of descriptive statistics for PBC is at a very high level,
around 5.886. Thus, this mean value confirms the assumption of the study that the
behaviour of students are influenced by person’s volitional control as to how easy
or difficult performance of the behaviour, which can indirectly increase their SB.

180
It has been observed that students felt they are easy to perform and were in complete
control whether they recycling, saving energy, and reducing pollution or not. It is
because PBC is a mix of traditionally the variables (easy and opportunity) and
facilitating / inhibiting factors such as inconvenient, knowledge of how, what and
where to recycle, and provision of recycling resources. Therefore, by the mixture of
variables and facilitating / inhibiting factors will enhancing or reducing the SB
among students in universities. It is totally depends on the internal control and
motivation that influence themselves. Mahmud and Osman (2010) reported the
same findings by saying that students that are bred with a PBC outlook give more
concentration on all above discussed points that does influence their SB positively.
It has also been observed in the culture of surrounding in the universities; it might
be due to the personal belief to motivate students in feeling easy and comfortable to
recycle, conserve energy and reduce pollution. These could be reasons that
universities students themselves are good at PBC and they also promote this culture
in their universities. This reason is also supported by Alias et al. (2015) who said
PBC is dealing with easiness or difficulty of performing behaviour while
controllability involves people belief that they have control over the behaviour. In
energy consumption viewpoint, PBC explains how energy user perceives his or her
ability to perform energy conservation behaviour which depends not only according
to their attitude and social constraints but also on personal belief. This will
contribute to environmental problem solving.

181
The finding is in line with previous studies. Hutcherson (2013) found the association
with behaviour, and it is the higher order; PBC that is recognized as leading good
behaviour. Prior researches revealed that PBC or personal belief affects the pro-
environmental behaviour in a green lodging context among travelers (Han, 2015).
Kumar (2012) on the other side also confirmed about PBC in his research that is
demonstrated an important positive affiliation with the purchasing behaviour for
environmentally sustainable products. Studies by de Leeuw et al. (2014) established
that the more the students will have a feeling of control over the adoption of SB, the
more likely they will show the efforts to perform the behaviour.
The results are also consistent with TPB (Ajzen, 1991) which proposes a complete
fundamental structure that deals with the development of PBC and its consequence
on the regulation of their behaviour. This very much applies to the university
students because through the PBC, the sustainable behaviour among university
students become increase. PBC in TPB was found to be antecedents of sustainable
behaviour, supporting the evidence established in previous studies.
Having discussed the direct effects of four predictors on the SB of university
students’, next section discusses the mediation effect of intention on the
relationships between the four predictors and SB.
5.3.2 Mediation Effect of Intention
Four hypotheses (H5, H6, H7, and H8) were formulated and tested regarding the
mediation effect of intention on the relationships between knowledge, attitude, SN

182
and PBC, and the SB among students. Result from the PLS analysis demonstrated
that all four hypotheses were found to be significant and positively and strongly
validated.
By definition, intention is the motivational factor that captures the quality and
quantity of effort a person is prepared to devote in performing behaviour. In SB
setting, intention is defined as the level of intensity of individual to perform the
behaviour (Alias et al., 2015; Leeuw et al., 2015; Passafaro et al., 2014). Hypotheses
examining the mediating effect of intention are as follows:
H5: Intention mediates the relationship between knowledge and SB
H6: Intention mediates the relationship between attitude and SB
H7: Intention mediates the relationship between SN and SB
H8: Intention mediates the relationship between PBC and SB
Result presented in previous chapter found support for the (H5, H6, H7, H8)
hypotheses at the 0.01 and 0.05 level of significance (β = 0.057, t = 4.354, p < 0.01),
(β = 0.016, t = 2.163, p < 0.05), (β = 0.025, t = 3.008, p < 0.01) and (β = 0.076, t =
4.312, p < 0.01) respectively. The results conclude that the mediation effect is
statistically significant on the relationship between knowledge, attitude, SN, PBC
and SB students. This means that the effect of the independent variables
(knowledge, attitude, SN and PBC) on the dependent variable (SB) analysts upon
the addition of the mediator (intention).

183
One thing that has been observed and worth mentioning is that understanding of
intention and its effects have secured significance because intention is the
motivational factors that control a person in performing the SB. As SB is determined
by the intention and readiness of students (Latif et al., 2013), Najera (2010) found
the same thing that the SB of students in higher education in Mexico influenced by
intention.
This section examines the results of four hypotheses concerning the mediation effect
of intention on the relationships between knowledge and SB, between attitude and
SB, between SN and SB, and between PBC and SB.
5.3.2.1 The Mediation Effect of Intention on the Relationship between
Knowledge and Sustainable Behaviour
First, the mediation effect of intention on the relationship between knowledge and
SB was hypothesized in hypothesis 5 - the results show significant mediation effect
of intention on this relationship. The results show high level of knowledge of
students directly affects the SB among students of public universities in Malaysia
and indirectly by enhancing the level of intention.
This result is supported by previous studies (Aman, Harun, & Hussein 2012; Kumar,
2012; Latif et al., 2013; Pan, Chou, Morrison, Huang, & Lin, 2018). One
explanation for this result is the vital role of intention in promoting the upright
behaviour in term of environmental behaviour. Hence, intention is considered as a

184
catalyst for virtuous behaviour formation among students and to prevent students
from going in the wrong direction.
These results indicate that the knowledge within the students in public universities
use intention as a mechanism to enhance SB. One reasonable explanation for this
finding is the educational efforts such as 4R (reduce, reuse, repair, recycle)
programme, UM EcoCampus Blueprint and LESTARI, UKM for enhancing the
knowledge towards issue related to environmental awareness have been effective in
encouraging disposition of behaviour that are considered good for the natural
environmental. As a consequence, the results support the study’s framework in that
the students should strengthen on intention and in doing so, reinforce SB.
5.3.2.2 The Mediation Effect of Intention on the Relationship between
Attitude and Sustainable Behaviour
The mediation effect of intention on the relationship between attitude and SB was
hypothesized in hypothesis 6 - the results show the significant mediation effect of
intention on this relationship. Based on the results presented in Chapter Four, it can
empirically be concluded the existence of mediating effect of intention in the
relationship between attitude and SB. The finding of this study contributed and
strengthened previous theories and conceptual models, especially in the content of
Malaysia’s higher educational institutions.
Prior researchers have revealed the important of intention as mediator and catalyst
in the relationship between attitude and SB (Kumar, 2012; Osman, 2012; Pan et al.,
185
2018). One explanation for this result is the vital role of intention in promoting the
upright behaviour in term of environmental behaviour. Hence, intention is reflected
as a promoter for virtuous behaviour formation among students and to prevent
students from going in the wrong direction.
These result implies that the attitude within the students in public universities use
intention as a mechanism to enhance SB. This finding supported a statement by Li-
ming and Wai (2013) that the positive attitude is based on the favourable evaluations
and willingness to consume it and response with the environmental behaviour, thus,
attitude served to guide people’s behaviour (Armitage & Christian, 2003). Kumar
(2012) indicated that the link between attitude and behaviour develops stronger as
the attitude become more accessible and in turn affects choices. Therefore, in this
study it shows that students are more willing to engage in sustainability activities
and believe these activities are practicable and indirectly by enhancing the level of
intention as catalyst.
Furthermore, the main goal of the Theory of Planned Behaviour (TPB) of attitude
by (Ajzen, 1985) was to determine the impact on the SB as mediated by intention.
Therefore, the result of this study implies that attitude influence SB through
mediating mechanism: intention. Therefore, this study contributes to the field of
knowledge by further opening up and clarifying the relationship that exists between
attitude and SB of students in universities through the mediating effect of intention.
186
5.3.2.3 The Mediation Effect of Intention on the Relationship between
Subjective Norm and Sustainable Behaviour
In this study, it is demonstrated that intention mediates the relationship between SN
and SB. The result implies that high level of subjective norm of students directly
affects the SB among students of public universities in Malaysia and indirectly by
enhancing the level of intention. Therefore, if students feel that their close friends
or college mate, parents, and lecturers influence their SB, it is determined by the
role of intention to enhance the practices of SB. Thus, intention regulates the
behaviour of the students due to the influence from the friends and others. This
finding supported a statement by Ajzen (1991) that SN can be comprehended as the
perceived social force to carry out a particular behaviour thus, SN served to guide
people’s behaviour, as SN also provides them information about the appropriateness
of behaviour under consideration (Biel & Thogersen, 2007). Kumar (2012)
indicated that the link between SN and behaviour develops stronger as the SN
become more manageable and in turn affects behaviour.
This result is supported by previous studies (Kumar, 2012; Latif et al., 2013; Pan et
al., 2018; Osman, 2012). One explanation for this result is the vital role of intention
in promoting the upright behaviour in term of environmental behaviour. Therefore,
it can prove that intention is play an important role as catalyst for upright behaviour
development among university students and to prevent students from going in the
wrong direction, thus, this result indicate that the subjective norm within the
students in public universities use intention as a mechanism to enhance SB.
187
Therefore, once people are influenced by the behaviour of others, it would pressure
an individual to follow to the behaviour most people and societies do. Since most
of the students live in the same campus, therefore their daily interaction with friends
may influence their SB with the mechanism of the intention as catalyst and support
their behaviour.
The results are also reliable with TPB which suggests a comprehensive fundamental
structure that deals with the development of SN and its effect on the regulation of
their behaviour. SN influence sustainable behaviour through mediating mechanism:
intention. This very much applies to the students in universities because through the
SN, they are able to show the SB in the way to solve the environmental problem in
our country. This study contributes to the field of knowledge by further opening up
and clarifying the relationship that exists between SN and SB of students in
universities through the mediating effect of intention.
5.3.2.4 The Mediation Effect of Intention on the Relationship between
Perceived Behaviour Control and Sustainable Behaviour
The mediation effect of intention on the relationship between PBC and SB was
hypothesized in hypothesis 8 - the results show mediation effect of intention on this
relationship. The results show high level of PBC of students directly affects the SB
among students of public universities in Malaysia and indirectly by enhancing the
level of intention.

188
This result is supported by previous studies (Kumar, 2012; Latif et al., 2013; Pan et
al., 2018). One clarification for this result is the vigorous role of intention in
promoting the upright behaviour in term of environmental behaviour. Therefore,
intention is reflected as a catalyst for upright behaviour formation among students
and to prevent students from going in the wrong direction. These results indicate
that the PBC within the students in public universities use intention as a mechanism
to increase SB.
These result implies that the perceived behaviour control within the students in
public universities use intention as a mechanism to enhance SB. This finding
supported a statement by Vermeir and Verbeke (2006) that an individual’s
confidence in his or her ability to control and thereby display the behaviour has
positive relationship with behaviour through the intention as catalyst. Therefore, in
this study it shows that PBC is the belief that the individuals have the ability to
manipulate the outcome in a positive manner as a result of their action in this regard.
As the conclusion, TPB supports the view of individual university student’s
behaviour and its impact on overall institutional behaviour. This study contributes
to field of knowledge by further opening up and clarifying the mediating effects of
intention that exist between knowledge, attitude, SN, PBC and SB of university
students, next section discusses the ninth hypothesis regarding moderating effects
of spirituality on the relationships between intention and SB.

189
5.3.3 Moderating Effect of Spirituality
One hypothesis (H9) was formulated and tested regarding the moderating effect of
spirituality on the relationship between intention and the SB of university students.
Results from the PLS analyses demonstrated that the hypothesis was found to be
significant. A hypothesis examining the moderating effect of spirituality is as
follows:
H9: Spirituality moderates the relationship between intention and
actual sustainable behaviour
Results presented in previous chapter found supported for the H9 hypothesis at the
0.01 level of significance, indicated that the interaction terms representing INT*SP
(β = 0.112, t = 4.241) was statistically significant. PLS path coefficients revealed
that the formulated hypothesis was significant and was supported because of the t-
values is greater than 1.645, however, the strength of the moderating effect in this
study showed a low effect size of 0.02, but, according to Chin et al. (2003), even a
small interaction effect can be meaningful under extreme moderating conditions.
Results regarding the moderating effects of the spirituality represent the
contribution for this study. Evidence about moderation was answered in the light of
past studies as well as literature review clarifications. Previous studies have not
empirically verified spirituality as a moderator of SB in research model. However,
there are studies in other area of studies that modified spirituality as moderator

190
(Adawiyah, 2011; Tombaugh et al., 2011) and amended spirituality as mediator
(Brant, 2010; Muller et al., 2004). As the previous studies showed that direct
relationship between spirituality and SB were not consistent (significant and
insignificant results) (Crowe, 2013b; Csutora & Zsóka, 2012; Mckenzie, 2005; Rai
et al., 2014). This research verify spirituality as moderator effect of SB in research
model. This is in line with the assertion of Baron and Kenny (1986) that a
moderating variable is usually incorporated when the relationship between a
predictor and criterion variable is reported expectedly inconsistent or weak. The
effectiveness of various control mechanisms could be contingent upon internal and
external contingency variables (Kohli & Jaworkski, 1990). Defining further, Barron
and Kenny (1986) have explained that moderator is a variable which affects the
direction and or strength of the relationship between independent (predictor) and
dependent (criterion) variable. A moderating variable is modeled as an interaction
between predictor and criterion variable(s) (Barron & Kenny, 1986).
Consistent with hypothesis 9, the results of the PLS path modeling reported that
spirituality moderates the relationship between intention and SB with small effect
size (f2=0.0226). These empirical findings have supported the claim that spirituality
has the potential moderating power over SB. This finding supported a statement by
Rai et al. (2014) that there have been an increase in the attempts affecting to the
influence of spirituality upon SB. Similarly, Crowe (2013b) described that
spirituality is a vital source of environmental behaviour in education aspects.
Therefore, in this study it shows that spirituality is central to daily life, which
informs the decisions about the way we live, and which is expressed through action.

191
It also refers to the practices that caused the internal feelings of students based on
religious beliefs or moral.
The results are also consistent with Theory of Spiritual Leadership (Fry, 2003),
which is developed within an intrinsic motivation model that incorporates vision,
hope/faith, and altruistic love, theories of spirituality, and spiritual survival. This
very much applies to the students in universities because through the moderating
effect of spirituality which is integral to daily life, which informs the decisions about
the way we live, and which is expressed through action and practices that caused
the internal feelings of students based on religious beliefs or moral. The study
highlighted about how students expressing their spiritual side, how spirituality
practices guide students to do recycle, conserve energy, and reduce pollution.
Besides, this study also impressed about the liability of student actions that affecting
the environment. This study contributes to the field of knowledge by further opening
up and clarifying the moderating effect of spirituality that exists between the
relationship of intention and SB of students in universities, but there is still a need
to further explore this variable and its moderating effect, next section discusses the
contribution of study.
5.4 Contributions of Study
This study extends the understanding of the mediating influence of intention on the
relationship between knowledge, attitude, SN, PBC and SB and also the moderating
effect of spirituality on the relationship between intention and SB of students in

192
Malaysia and in the overall education industry in general. As education sector is
increasingly becoming global, this study is an early attempt to analyse the factors
that influence the SB of students in universities in Malaysia. This state is a
developing country with a high growth of student population and significant
development power that will continue to develop drastically in the upcoming years.
This scenario demanded the examination of the variables under study in order to
have an insight regarding behaviour enforcement that can play a crucial part in
overall sustainable behaviour improvement of students in a well-planned manner.
5.4.1 Practical Contribution
This finding indicated all factors that have been discussed in this study are relevant
and important in predicting the SB of students. The practical contribution of this
study is discussed in two different perspectives; namely, government and university
management. Based on the above discussion, the government and university
management could create relevant strategies and policies in promoting sustainable
behaviour among the Malaysian community and university students. This study
offered significant values for practitioners since it had many behaviour implications.
The results of this study offer several suggestions to the government in
implementing suitable and adequate environmental facilities in order to achieve the
Malaysian goal of a 22 percent recycling rate by the year 2020. The finding of this
study revealed that attitude towards SB mediated by intention is the significant
predictor, thus it showed that the students had a positive attitude with the intention
193
as catalyst in their participation in sustainability activities. It is believed that by
providing formal or informal education, awareness and campaigns on the
environmental issues to the community, individual knowledge will be enhanced.
Thus, it indicates the SB of universities students towards environment although
there is no formal environmental education in their curricula except the green and
environmental campaigns conducted in the universities. It will also provide some
indication as to whether the environmental campaigns conducted in the university
are successful. As their knowledge increases the behaviour with the intention as
catalyst tend to increase their action (Aman, Harun, & Hussein, 2012; Kumar, 2012;
Latif et al., 2013).
In Universiti Sains Malaysia (USM), Centre for Education, Training and Research
in Renewable Energy and Energy Efficiency (CETREE) was established on the
government’s awareness of its role in increasing knowledge and awareness of the
role of renewable energy and energy efficiency for professionals, schools, tertiary
institutions, and also to the public in Malaysia. CETREE establishment agreement
is the result of the Malaysian government through the Ministry of Energy, Water
and Communications, now known as the Ministry of Energy, Green Technology
and Water (KeTTHA) and the Economic Planning Unit, Prime Minister together
with the Government of Dato Seri Najib Tun Abdul Razak. Revenue from core
developed by this KeTTHA in green technology agency established to coordinate
and implement effective programs and this technology, CETREE had played a role
as a channel in the dissemination of public awareness about green technology and

194
so on. To date CETREE has been making waves with the creation of green van and
bus technology using the resources of renewable energy.
Presently, the government conducts public campaigns through the mass media such
as newspapers and television as one of the effective methods to raise awareness of
the general public. This method is usually regarded as a one-way flow of message
to the public. Therefore, to increase public awareness of sustainability activities, the
government should encourage an active participation and feedback of readers and
viewers. This requires the media to establish a platform, such as the
website/twitter/facebook, for information exchange and discussion. Indeed, access
to the internet might encourage the public to participate more freely in discussions
on environmental issues.
Besides that, it is important for the university to progressively educate the students
on the benefits of SB and create practical knowledge and experience in organizing
a successful recycling, conserving energy and reducing pollution campaign in the
university. This is in line with the aspiration of the Ministry of Energy, Science,
Technology, Environment and Climate Change (MESTECC) in (i) enhancing
activities related to transfer of technology, scientific services and usage of
appropriate technology; (ii) shouldering the responsibility and coordinate all
international cooperation projects, technical assistance and other forms of
international cooperation in the areas of Science, Technology and Innovation; (iii)
coordinating and strengthening the existing bilateral cooperation programmes,
enhancing strategic relationships with the foreign countries and international growth
195
to improve the development in Science, Technology and Innovation; (iv) providing
continuous support to international cooperation programmes by Ministry and its
agencies; and (v) establishing ties with countries of mutual interests through
Memorandums of Understanding (MoU).
The result of this study showed that an individual’s who is close to students, namely
parents, lecturers, friends and societies, influences his or her behaviour in the
decision to recycle, conserve energy and reduce pollution. Therefore, a word-of-
mouth campaign, providing a recycling signage (billboard, streamer and banners),
a continuous recycling, reducing pollution and coserving energy campaign should
be conducted and involve all students and staff of the university. By implementing
it, all university members are aware of this campaign and each individual will advise
each other on the importance of recycling, reducing pollution and conserving
energy.
Next, facilities should be provided to ensure progressive environmental practices
into action by all members of a university. For example, in UKM, in the initial
stages, in April 2010, the Mobile Recycling Center (truck) operated on the Tuesday
of the first week of every month. There are two types of collection: one for recycled
paper from every office and one for recyclable items from the entire UKM campus,
collected by placing a recycling truck at the Dataran Panggung Seni UKM between
12 noon and 2 pm. There were 62 coordinators appointed, one for each paper
recycling box location, and they are responsible for collecting the recyclable paper
in their offices. Furthermore, to provide a better facility for all users, the Recycling

196
Center (PKS) was constructed and began operation on 5 April 2011. The PKS is
located at Dataran Panggung Seni UKM. Purchase operations (buy-back) for the
recyclable items are carried out by Alam Flora Sdn Bhd every Tuesday from 12
noon to 2 pm. However, drop-off operations are available any time by placing
recyclable items into the containers provided (paper, plastic, glass, cans / metals and
tetrapak).
Besides, the academic and student affairs department of the university should work
together in fostering sustainability cultures or habits in the university. Without the
support of one realm or the other, synergy is lost. Students as a whole are not
encouraged to separate their academic and socio-emotional requirements, so the
universities also cannot separate academic achievement from student affairs either.
Activities outside the classroom related to recycling and sustainabilty activities
must be linked to academic content. For example, USM has started to embrace
education for sustainable development (ESD) and “University as a Living Lab”
approach since the year 2000 through the concept of Kampus Sejahtera (Healthy
Campus) and University in a Garden. USM aims at promoting sustainability among
the community within and outside the campus through education and research
activities. In order to achieve APEX vision, USM has taken its initiative to establish
a centre which would be able to help USM to mainstream sustainability across all
levels within USM community. The Centre for Global Sustainability Studies has
been established to act as a conduit to help USM in the mainstreaming of
sustainability within the university.
197
5.4.2 Theoretical Contribution
Despite the extensive research work that has been carried out in the environmental
behaviour literature in the light of the TPB, in other words, the results call for further
research to resolve this inconsistency. Moreover, in view of the lack of empirical
studies investigating the influence of four determinants, which are knowledge,
attitude, SN and PBC on the university student’s SB and on its implication in the
presence of intention and spirituality, this study indeed offered an attempt to fill this
theoretical gap in the existing literature.
The past research revealed little empirical research work to study the relationships
between these four determinant factors and the SB of students in the context of the
higher education industry. In addition to that, most of the work related to this has
been far from empirical-based research work. Therefore, this study added towards
the scarce empirical research stream particularly in the context of one of the
developing countries like Malaysia. Second, the presence of spirituality is the first
attempt by this study to identify it is as moderator in the context of higher education
institutions in Malaysia, this variable are derived from Theory of Spiritual
Leadership (Fry, 2003). This very much applies to the students in universities
because through the moderating effect of spirituality which is integral to daily life,
which informs the decisions about the way we live, and which is expressed through
action and practices that caused the internal feelings of students based on religious
beliefs or moral enhancing the practices of SB. Thus, this study contributes to the
field of knowledge by further opening up and clarifying the moderating effect of
198
spirituality that exists between the relationship of intention and SB of students in
universities. Lastly, in addition to studying and analysing the four important
predictors of students’ SB.
5.4.3 Methodological Contribution
This study has explored a relatively new tool of analysis (i.e., PLS-SEM) to explain
the structural relationship between the constructs of this study. The PLS-SEM tool
is a general model that comprises principal components techniques, predictable
correlation, multiple regression, multivariate analysis of variance among others.
Hence, the present study’s use of this relatively new tool of analysis has some
important methodological contributions.
The use of PLS-SEM tool provides an opportunity for testing the robustness and
predictive power of the tool in a study that explores integrative relationships of
variables under study. The PLS-SEM tool provided a new framework for
comparison of results obtained from previous studies that used different tool of
analysis. Thus, the current study represented a unique methodological contribution
to studied variables found in the literature. The adopted scale was subject to
reliability and validity tests. Results of convergent and discriminant validity showed
acceptable results that went beyond the minimum thresholds. Finally, PLS-SEM
principal component analysis was used to refine and fit the data for this study, thus
provided new knowledge about the effects of PLS PCA on knowledge, attitude, SN,
PBC, intention, spirituality and SB constructs. The PLS-SEM confirmatory and
199
validation processes for the seven measurements of this study represented a
methodological contribution to the literature by providing additional validation
about the constructs in a new methodological perspective. It also provides future
researchers with an extended example of the method used for the testing mediator
and moderator with the utilisation of bootstrapping and confidence interval (CI). By
using the bootstrapping method as confirmation of the mediation effect, this study
allows the researcher to further investigate the quasi-paradoxical relationships
which otherwise overlooked in traditional mediation analyses.
5.5 Limitations of Study
Although this study has numerous contributions, the interpretation of outcomes and
the drawn conclusions should take into consideration the study’s limitations.
Several limitations are noted and are reported in this section. The main limitations
of this study can be categorized into four major types: generalization, causation,
research design and the scope of the study. Further details are provided in the
following paragraphs.
There are some factors that are beyond the control of the researcher and
consequently have led to some limitations in term of generalizability. First, the
study’s results and drawn conclusions are according to the data gathered form
universities students based on their perceptions of knowledge, attitude, SN, PBC
and SB at a single point of time. In other words, this study overlooks the ongoing
changes in the psychological human aspects that occur among students owing to

200
their developing experiences and the differences in environmental conditions over
time. This happens when data are gathered through a cross-sectional approach with
no follow-up data. On this basis, the study’s conclusions could be different if the
adapted research design had been longitudinal rather than cross-sectional.
Secondly, this study focused on only seven universities in Malaysia that only
included in UI GreenMetric World University Ranking, hence it may hinder the
generalization of results. Thirdly, this study did not include other stakeholders in
the education sector in Malaysia particularly the government as such, the views of
respondents from only one angle (the universities) were considered. Also, the scope
of this study is limited to academic institutions; the results might differ in case of
other service industries.
Fourthly, the researcher employed a survey questionnaire design with a cross-
sectional technique, where data were gathered at one single point of time. In a
survey design, information obtained only indicates the level of variables’
association and while the causal relationships are inferred on the basis of the results
obtained, it is difficult to accurately ascertain them.
As with other studies, this study’s limitation are also present in its methodological
aspects. Like other studies that employ the quantitative research design, this study’s
respondents were asked for their perceptions of statement provided in this
questionnaire, and such perceptions were gauged through a Likert Scale. The
respondents’ answers may be influenced by their biased perception of the
phenomenon (Bryman & Bell, 2011). As such, this study proposes that future
201
research that investigates the relationships of knowledge, attitude, SN, PBC with
SB look into employing mixed research design (quantitative and qualitative
research design) to complement each other.
5.6 Suggestions for Future Research
Throughout this study, several recommendations for future studies have been raised.
As discussed in the limitation part of this study; the cross-sectional design was used
for data collection. Such method collects data at a single point of time which limits
the observance of the interactive relationships between knowledge, attitude, SN and
PBC and their effects on SB. As such, a case study approach will allow a deeper
investigation into the complex relationship among the variables and thus, the results
may add new insights into different success factors.
Secondly, this study was only conducted on only seven universities in Malaysia that
only included in UI GreenMetric World University Ranking; future studies may
consider the applicability of similar studies in all public universities in Malaysia to
validate the findings and implementation of the research theoretical framework.
Thirdly, the identified limitations of study above formed the basis for future studies
based on the scope of this study. Since only the views of students of the universities
were considered in this study, future studies may considered involving participants
from the staffs, lecturers and leaders of universities to be able to strike a balance.
Also, this study did not aim at comparing the students with private universities in
Malaysia; it is recommended that future research should consider this.

202
The next recommendation pertains to the combined effect of knowledge, attitude,
SN and PBC on the effect of SB among students that could be extended through a
longitudinal method as this method could provide long-term insight into the
relationship. This approach could show the variables’ development and detect the
relationships clearly.
5.7 Conclusion
Taken together, the present study has provided additional evidence to the growing
body of knowledge concerning the mediating influence of intention on the
relationships between knowledge, attitude, SN and PBC and the sustainable
behaviour of universities students. Results from this study lend support to the key
theoretical propositions. Generally, the current study has successfully answered all
of the research questions and objectives despite some of its limitations. While there
have been many studies examining the predictors of university students’ SB,
however, the present study addressed the theoretical gap by incorporating intention
as a significant mediating variable. The study has also managed to evaluate the
moderating role of spirituality on the relationship between intention and SB. The
results of the findings pave the way for more future studies to be conducted in this
area. The present study made use of the PLS-SEM as a relatively new method in the
field of management sciences.
In addition to the theoretical contributions, the results of this study provide some
important practical implications to government, policymakers, and university

203
management. Furthermore, on limitations of the current study, several future
research directions were drawn. In conclusion, the present study has added valuable
theoretical, practical, and methodological ramifications to the growing body of
knowledge in the field of university on the aspect of sustainable behaviour
improvement among university students in Malaysia.
The study’s results show that the efforts of universities in Malaysia should be
according to accurate knowledge concerning students’ attitude and intention in
order to improve their SB. More importantly, it is pertinent for the higher education
sector to conduct surveys regularly to measure the potential requirement of UI
GreenMetric and obtain feedback on how to enhance the sustainability aspects. To
conclude, the higher education sector in Malaysia should directly focus on student
SB and ensure that their efforts and activities are aligned with the requirements of
the government needed, indirectly, this study might help the area study of
technology management in universities in Malaysia.

204
REFERENCES
Abd-Ella, M., Somaa, R., & Ebad-Allah, M. (2012). Causal Analysis of
Environmental Behavior of Egyptian Farmers. World Rural Observation,
4(3), 18–26.
Adawiyah, W. R. (2011). Workplace Spirituality as a Moderator in the Relationship
between Soft TQM and Organizational Commitment. 2(10), 93–100.
Afroz, R. & Rahman, A. (2017). Health impact of river water pollution in Malaysia.
International Journal of Advanced and Applied Sciences, 4(5), 78-85.
Ahire, S. L., Golhar, D. Y., & Waller, M. A. (1996). Development and validation
of TQM implementation constructs. Decision Science, 27(1), 23-56.
Ahmad, A. R., & Farley, A. (2014). Funding Reforms in Malaysian Public
Universities from the Perspective of Strategic Planning. Procedia - Social and
Behavioral Sciences, 105–110. https://doi.org/10.1016/j.sbspro.2014.03.654
Ahmad, S. N. B., Juhdi, N., & Awadz, A. S. (2010). Examination of Environmental
Knowledge and Perceived Pro- Environmental Behavior Among Students of
University Tun Abdul. International Journal of Multidisciplinary Thought,
1(1), 328–342.
Aini, M. S., & Laily, P. (2010). Preparedness of Malaysian Pre-school Educators
for Environmental Education. 18(2), 271–283.
Ajzen, I., & Fishbein, M. (1980). Understanding Attitudes and Predicting Social
Behaviour. Englewood Cliffs. NJ: Prentice-Hall.
Ajzen, I. (1985). From Intentions to Actions: A Theory of Planned Behaviour.
Action-Control: From cognition to Behaviour. Hedelberg: Springer.
Ajzen, I., & Madden, T. J. (1986). Prediction of Goal-Directed Behaviour:
Attitudes, Intentions, and Perceived Behavioural Control. Journal of
Experimental Social Psychology, 22,453-474.
Ajzen, I. (1991). The Theory of Planned Behavior. Organizational Behavior and
Human Decision Processes, 50, 179–211.
Ajzen, I., & Fishbein, M. (2002). Perceived Behaviour Control, Self-Efficacy,
Locus of Control and Theory of Planned Behaviour. Journal of Applied Social
Psychology, 32, 665-683.
Ajzen, I. (2006). Constructing a TPB Questionnaire: Conceptual and
Methodological Considerations. Retrieved from http://www.people.
umass.edulaizen pdfltpb.measurement.pdf.

205
Akter, S., D’Ambra, J., & Ray, P. (2011). An Evaluation of PLS Based Complex
Models: The Roles of Power Analysis, Predictive Relevance and GoF Index.
Proceedings of the Seventeenth Americas Conference on Information Systems.
Detroit, Michigan August 4th-7th.
Albers, S. (2010). PLS and Success Factor Studies in Marketing, In Esposito Vinzi,
V., Chin, W.W., Henseler, J., Wang, H. (Eds.), Handbook of Partial Least
Squares: Concepts, Methods and Applications (pp. 409-425). Springer
Handbooks of Computational Statistics Series, Vol. II.
Heidelberg/Dordrecht/London/New York: Springer.
Alias, R., Hashim, Z., Farzana, N., & Mariam, S. (2015). Energy Conservation
Behaviour among University Students. Global Journal of Business and Social
Science Review, 1(1), 271–279.
Alley, R. et al. (2007). Climate change 2007: The Physical Science Basis, Summary
for Policymakers. Energy & Environment.
Alreck, P. L., & Settle, R. B. (2004). The Survey Research Handbook (3rd ed.).
NewYork, NY: McGraw-Hill Irwin.
Aman, A. H. L., Harun, A., Hussein, Z., & Author, C. (2012). The Influence of
Environmental Knowledge and Concern on Green Purchase Intention the
Role of Attitude as a Mediating Variable. British Journal of Arts and Social
Sciences, 7(11), 2046–9578. https://doi.org/10.1108/07363769910297506
Aminrad, Z., Zarina, S., Sayed, B., Hadi, A. S., & Sakari, M. (2013). Relationship
Between Awareness, Knowledge and Attitudes Towards Environmental
Education Among Secondary School Students in Malaysia. World Applied
Sciences Journal, 22(9), 1326–1333.
https://doi.org/10.5829/idosi.wasj.2013.22.09.275
Andries, P. S. N., Plessis, J., & Al-shamaa, S. (2012). Exploring the Perceptions of
Tertiary Students’ Perceptions and Attitudes towards Environmental
Sustainability. International Journal of Advances in Management Science,
1(3), 91–100.
Arbuthnot, J. (1997). The Roles of Attitudinal and Personality Variables in the
Prediction of Environmental Behaviour and Knowledge. Environment and
Behavior, 9, 217–232.
Arbuthnott Katherine D. (2009). Education for Sustainable Development Beyond
Attitude Change. International Jounal of Sustainability in Higher Education,
10(2), 152–163.
Armitage, C. J., & Conner, M. (2001). Efficacy of the Theory of Planned
Behaviour : A meta-analytic review. British Journal of Social Psychology, 40,

206
471–499.
Asmuni, S., Mhd. Khalili, J., & Mohd. Zain, Z. (2012). Sustainable Consumption
Practices of University Students in Selangor, Malaysia. Journal of Asian
Behavioural Studies, 2(6).
Ayed, A.M. (2010). Antecedent and Mediator of Actual Visit Behavior Amongst
International Tourist in Jordan. PhD thesis. Universiti Utara Malaysia.
Aziz, A. A., Sheikh, S. N. S., Yusof, K. M., Udin, A., & Yatim, J. M. (2012).
Developing a Structural Model of Assessing Students’ Knowledge-Attitudes
towards Sustainability. Procedia - Social and Behavioral Sciences, 56, 513–
522. https://doi.org/10.1016/j.sbspro.2012.09.683
Babbie, E. R. (1990). Survey research methods (2nd ed.). Belmont, CA: Wadsworth
Publishing Company.
Babbie, E. R. (2008). The Basics of Social Research (6th ed.). Belmont,
CA:Thomson/Wadsworth.
Barclay, D., Higgins, C., & Thompson, R. (1995). The partial least squares (PLS)
approach to causal modelling. Technology Studies, 2, 285-323.
Barnett, V., & Lewis, T. (1994). Outliers in statistical data. New York: Wiley.
Baron, R. M., & Kenny, D. A. (1986). The Moderator-Mediator Variables
Distinction in Social Psychological Research: Conceptual, Strategic and
Statistical Consideration. Journal of Personality and Social Psychology, 51
(6), 1173-1182.
Beck, L., & Ajzen, 1. (1991). Predicting Dishonest Actions Using the Theory of
Planned Behaviour. Journal of Research in Personality, 25, 285-301.
Berg, N. (2002). Non-Response Bias. University of Texas at Dallas. Retrieved from
https://www.utdallas.edu/~nberg/Berg_ARTICLES/BergNonResponseBias
May 2002.pdf
Berry, P. (2009). Biodiversity in the Balance - Mitigation and Adoption Conflicts
and Synergies. Moscow: Pensoft Sofia.
Bezbatchenko, A. W. (2011). Where Meaning Lies: Student Attitudes and
Behaviors Related to Sustainability in College. New York University.
Biel, A., & Thøgersen, J. (2007). Activation of Social Norms in Social Dilemmas:
A review of The Evidence and Reflections on The Implications for
Environmental Behaviour. Journal of Economic Psychology, 28, 93-112.

207
Bollen, K. A. (1989). Structural Equation Modeling with Latent Variables (2nd ed.).
New York: Wiley.
Bollen, K. A., & Stine, R. (1990). Direct and Indirect Effects: Classical and
Bootstrap Estimates of Variability. Sociological Methodology, 20(1), 115-
140.
Bontis, N., Booker, L. D., & Serenko, A. (2007). The Mediating Effect of
Organizational Reputation on Customer Loyalty and Service
Recommendation in the Banking Industry. Management Decision, 45(9),
1426-1445.
Bordens, K. S., & Abbot, B. B. (2011). Research Design and Methods a Process
Approach (8th ed.). New York, NY: McGraw-Hill.
Bran, F., Radulescu, C. V., & Ioan, I. (2013). Values and Environmental Ethics –
Pillars of Changing Human Behaviour Toward Sustainable Development.
Brant, D. W. (2010). Spirituality as a Mediator in the Relationship Between Self-
care Practices and Perceived Stress Levels Among Lutheran Clergy.
Bratt, C. (1999). The Impact of Norms and Assumed Consequences on Recycling
Behaviour. Environment and Behavior, 31(5), 630–656.
Brown, R. L. (1997). Assessing Specific Mediational Effects in Complex
Theoretical Models. Structural Equation Modeling: A Multidisciplinary
Journal, 4(2), 142- 156.
Burmeister, M., & Eilks, I. (2013). An Understanding of Sustainability and
Education for Sustainable Development Among German Student Teachers
and Trainee Teachers of Chemistry. Science Education International, 24(2),
167–194.
Busse, M., & Menzel, S. (2014). The Role of Perceived Socio-Spatial Distance in
Adolescents’ Willingness to Engage in Pro-Environmental Behavior. Journal
of Environmental Psychology, 40, 412–420.
https://doi.org/10.1016/j.jenvp.2014.10.002
Bryman, A., & Bell, E. (2011). Business Research Methods (3rd ed). New York:
Oxford University Press.
Byrne, B. M. (2010). Structural Equation Modelling with AMOS: Basic Concepts,
Application, and Programming. New York, NY: Rouledge Taylor & Francis
Group.
Calder, W., & Dautremont-Smith, J. (2009). Higher education: More and More
Laboratories for Inventing a Sustainable Future. In J. Dernbach (Ed.), Agenda
for a Sustainable America (pp. 93-107).Washington, DC: Environmental Law
208
Institute.
Campbell, D. T., & Stanley, J. C. (1966). Experimental and Quasi-Experimental
Designs for Research. Chicago, IL: Rand McNally.
Casley, D. J., & Kumar, K. (1988). The Collection, Analysis, and Use of Monitoring
and Evaluation Data. Washington, DC: The World Bank Publication.
Chambers, R. L. (1986). Outlier Robust Finite Population Estimation. Journal of
American Statistical Association, 81, 1163-1169.
Chen, T. B., & Chai, L. T. (2010). Attitude towards the Environment and Green
Products: Consumers’ Perspective. Management Science and Engineering,
4(2), 27–39.
Chen, X., Peterson, M. N., Hull, V., Lu, C., Lee, G. D., Hong, D., & Liu, J. (2011).
Effects of Attitudinal and Sociodemographic Factors on Pro-Environmental
Behaviour in Urban China. Environmental Conservation, 38(1), 45–52.
https://doi.org/10.1017/S037689291000086X
Chin, W. W. (1998a). Issues and Opinion on Structural Equation Modeling. MIS
Quarterly, 22(1), VII-XVI.
Chin, W. W. (1998b). The Partial Least Squares Approach for Structural Equation
Modeling. In George A. Marcoulides (Ed.), Modern Methods for Business
Research (pp. 295-336). Mahwah, NJ: Lawrence Erlbaum Associates.
Chin, W. W., Marcolin, B. L., & Newsted, P. R. (2003). A Partial Least Squares
Latent Variable Modeling Approach for Measuring Interaction Effects:
Results from a Monte Carlo Simulation Study and an Electronic-Mail
Emotion/Adoption Study. Information Systems Research, 14(2), 189-217.
Chin, W. W. (2010). How to Write Up and Report PLS Analyses. In V. Esposito
Vinzi, W. W. Chin, J. Henseler & H. Wang (Eds.), Handbook of Partial Least
Squares (pp. 655-690). New York: Springer Berlin Heidelberg.
Chow, W. S., & Chan, L. S. (2008). Social Network and Shared Goals in
Organizational Knowledge Sharing. Information Management, 45(7), 24-30.
Churchill, G. A. (1979). A Paradigm for Developing Better Measures of Marketing
Constructs. Journal of Marketing Research, 16(2), 64-73.
Cohen, J. (1988). Statistical Power Analysis for the Behavioral Sciences. Hillsdale,
NJ: Lawrence Erlbaum Associates.
Cohen, L., Manion, L., & Morrison, K. (2001). Research Methods in Education (5th
ed.). London: Routledge Falmer.

209
Cohen, R. J., & Swerdlik, M. E. (2010). Psychological testing and assessment: an
introduction to tests and measures (7th ed.). Boston: McGraw-Hill.
Conner, M., Sandberg, T., & Norman, P. (2010). Using Action Planning to Promote
Exercise Behavior. Ann. Behav. Med., 40, 65-76.
Cooper, D. R., & Schindler, P. S. (2001). Business Research Methods. New York:
McGrew-Hill Companies.
Cooper, D. R., & Schindler, P. S. (2006). Business Research Methods (9th ed.). New
York, NY: McGraw-Hill.
Cordano, M., & Frieze, I. H. (2000). Pollution Reduction Preferences of U.S
Environmental Managers: Applying Ajzen’s Theory of Planned Behavior.
Academy of Management Journal, 43(4), 627–641.
Cordano, M., Welcomer, S., Scherer, R. F., Pradenas, L., & Parada, V. (2010). A
Cross-Cultural Assessment of Three Theories of Pro-Environmental
Behavior: A Comparison Between Business Students of Chile and the United
States. Environment and Behavior, 43(5), 634–657.
https://doi.org/10.1177/0013916510378528
Corral-verdugo, V., Mireles-Acosta, J., Tapia-fonllem, C., & Fraijo-sing, B. (2011).
Happiness as Correlate of Sustainable Behavior : A Study of Pro-Ecological,
Frugal, Equitable and Altruistic Actions That Promote Subjective Wellbeing.
Human Ecology Review, 18(2), 95–104.
Couchman, P. K., & Fulop, L. (2006). Building Trust in Cross-Sector R&D
Collaborations: The Role of Credible Commitments. In EGOS 2006: The
Organizing Society: Proceedings of the 22nd European Group for
Organizational Studies Colloquium, Bergen, Norway, 6-8 July. European
Group for Organizational Studies.
Cronbach, L. J. (1951). Coefficient Alpha and the Internal Structure of Tests.
Psychometrika. 16(3), 297-334.
Crowe, J. L. (2013a). Transforming Environmental Attitudes and Behaviours
through Eco-spirituality and Religion. 3(1), 75–88.
Crowe, J. L. (2013b). Transforming Environmental Attitudes and Behaviours
through Eco-spirituality and Religion. International Electronic Journal of
Environmental Education, 3(1), 75–88.
Csutora, M., & Zsóka, Á. (2012). Relation of Spirituality to Happiness, Life
Satisfaction and Sustainable Lifestyles. In Spirituality and Sustainability: A
New Path for Entrepreneurship, 1–33
Daft, R. L., & Lengel, R. H. (1998). Fusion Leadership: Unlocking the Subtle

210
Forces that Change People and Organizations. Oakland, CA: Berrett-Koehler.
Davis, D. (1996). Business Research for Decision Making (4th ed). Belmont,
CA:Duxbury Press.
Dawson, J. F. (2014). Moderation in Management Research: What, Why, When,
and How. Journal of Business and Pschology, 29(1), 1-19.
de Groot, J. I. M., & Steg, L. (2010). Relationships Between Value Orientations,
Self-Determined Motivational Types and Pro-Environmental Behavioural
Intentions. Journal of Environmental Psychology, 30(4), 368–378.
https://doi.org/10.1016/j.jenvp.2010.04.002
de Leeuw, A., Valois, P., & Seixas, R. (2014). Understanding High School
Students’ Attitude, Social Norm, Perceived Control and Beliefs to Develop
Educational Interventions on Sustainable Development. Procedia - Social
and Behavioral Sciences, 143, 1200–1209.
https://doi.org/10.1016/j.sbspro.2014.08.160
Derahim, N., Hashim, H. S., Ali, N., Abdul, S. A., & Aziz, G. (2012). UKM’s Staff
Perspective on Sustainability and Its Contribution Towards a Sustainable
University. Procedia - Social and Behavioral Sciences, 59, 376–381.
https://doi.org/10.1016/j.sbspro.2012.09.289
Director General, E. P. U. (Ed.). (2015). Eleventh Malaysia Plan 2016-2020
Anchoring Growth on People. Malaysia: Percetakan Nasional Malaysia
Berhad.
Duarte, P., & Raposo, M. (2010). A PLS Model to Study Brand Preference: An
Application to the mMobile Phone Market. In V. Esposito Vinzi, W. W. Chin,
J. Henseler & H. Wang (Eds.), Handbook of Partial Least Squares (pp. 449-
485). Springer Berlin Heidelberg.
Eagly, A., & Chaiken, S. (1993). The Psychology of Attitudes. Fort Worth: TX:
Harcourt, Brace, Jocanovich.
Elliott, A. C., & Woodward, W. A. (2007). Statistical Analysis: Quick Reference
Guidebook with SPSS Examples. Thousand Oaks, CA: Sage Publications.
Emanuel., R & Adams., J.N. (2011). College Students’ Perceptions of Campus
Sustainability. International Journal of Sustainability in Higher Education.
12(1), 79-92
Emory, C. W., & Cooper, D. R. (1991). Business research methods (4th ed.). Boston,
MA: Irvin.
Faiz, M.A. (2011). Kompaun tak urus sisa pepejal, Berita Harian, p.6.

211
Falk, R. F., & Miller, N. B. (1992). A Primer for Soft Modeling. Ohio: The
University of Akron Press.
Field, A. (2009). Discovering Statistics Using SPSS (3rd ed.). UK: Sage Publications
Ltd.
Fielding, K. S., McDonald, R., & Louis, W. R. (2008). Theory of Planned
Behaviour, Identity and Intentions to Engage in Environmental Activism.
Journal of Environmental Psychology, 28(4), 318–326.
https://doi.org/10.1016/j.jenvp.2008.03.003
Filzah Md Isa. (2007). Change Management Initiatives and Change Success Direct
Selling Industry: The Moderating Effect of Attitude Towards Change.
Universiti Sains Malaysia, Kuala Lumpur.
Fink, A., & Kosecoff, J. (1985). How to Conduct Surveys: A Step-By-Step Guide.
Beverly Hills, California: Sage Publications, Inc.
Fishbein, M., & Azjen, I. (1975). Belief, Intention, and Behaviour: An Introduction
to Theory and Research, Addison-Wesley, Reading, MA.
Folz, D. H. (1996). Survey Rresearch for Public Administration. Thousand Oaks,
CA: Sage Publications.
Fornell, C., & Larcker, D. F. (1981). Evaluating Structural Equation Models with
Unobservable Variables and Measurement Errors. Journal of Marketing
Research, 18(1), 39-50. doi:10.2307/3151312
Fornell, C., & Bookstein, F. L. (1982). Two Structural Equations Models: LISREL
and PLS Applied to Consumer Exit-Voice Theory. Journal of Marketing
Research, 19(4), 440-452.
Fowler J, F. (1993). Survey Research Methods (2nd ed.). Thousand Oaks, CA: Sage.
Fox,
Fry, L. W. (2003). Toward a Theory of Spiritual Leadership. The Leadership
Quarterly, 14(6), 693–727. https://doi.org/10.1016/j.leaqua.2003.09.001
Fry, L. W. (2005b). Toward a Theory of Ethical and Spiritual Well-Being and
Corporate Social Responsibility Through Spiritual Leadership. In R. A.
Giacalone & C. L. Jurkiewicz, (Eds.). Positive Psychology in Business Ethics
and Corporate Reasonability (pp. 47-84). Greenwich, CT: Information Age.
Gardner, O. T. & P. C. Stern. (2002). Environmental Problems and Human
Behavior. (2nd ed.). USA: Pearson Custom Publishing.
212
Gay, L.R. & Diehl, P.L. (1992). Research Methods for Business and Management.
New York: Macmillan.
Geisser, S. (1974). A Predictive Approach to the Random Effect Model.
Biometrika, 61(1), 101-107.
Gerrit, V. B., Martin, S., Gary, L., & Bernd, S. (2010). Prediction Markets as
Institutional Forecasting Support Systems. Decision Support Systems, 49(4),
404-416.
Giacalone, R. A., & Jurkiewicz, C. L. (2003). Handbook of Workplace Spirituality
and Organizational Performance. New York, NY: M. E. Shar.
Graefe, A. R., & Thapa, B. (2000). Environmental attitude-behavior
correspondence between different types of forest recreationists.
Grønhøj, A., & Thøgersen, J. (2012). Action Speaks Louder Than Words: The
Effect of Personal Attitudes and Family Norms on Adolescents’ Pro-
Environmental Behaviour. Journal of Economic Psychology, 33(1), 292–302.
https://doi.org/10.1016/j.joep.2011.10.001
Gustafsson, A., & Johnson, M. D. (2004). Determining Attribute Importance in a
Service Satisfaction Model. Journal of Service Research, 7(2), 124-141.
Hair, J. F., J., Black, W. C., Babin, B. J., Andersen, R. E., & Tatham, R. L. (2006).
Mutilvariate Data Analysis (6th ed.). Upper Saddle River, NJ: Pearson
Prentice Hall.
Hair, J. F., Money, A., Page, M., & Samouel, P. (2007). Research Methods for
Business. USA: John Wiley and Sons.
Hair, J. F., Black, W. C., Babin, B. J., & Anderson, R. E. (2010). Multivariate data
analysis: A global perspective (7th ed.). Upper Saddle River, NJ: Pearson-
Prentice Hall.
Hair, J.F., Christian, M. R., & Marko, S. (2011). PLS-SEM: Indeed a Silver Bullet.
Journal of Marketing Theory and Practice, 19(2), 139-152.
Hair, J. F., Sarstedt, M., Ringle, C. M., & Mena, J. A. (2012). An Assessment of
The Use of Partial Least Squares Structural Equation Modeling in Marketing
Research. Journal of the Academy of Marketing Science, 40(3), 414-433.
Hair Jr, J. F., Hult, G. T. M., Ringle, C., & Sarstedt, M. (2013). A Primer on Partial
Least Squares Structural Equation Modeling (PLS-SEM). Thousand Oaks:
Sage Publications.
Hampel, F. R., Ronchetti, E. M., Rousseeuw, P. J., & Stahel, W. A. (1986). Robust

213
Statistics. New York: J. Wiley & Sons.
Han, H. (2015). Travelers’ Pro-Environmental Behavior in a Green Lodging
Context: Converging Value-Belief-Norm Theory and the Theory of Planned
Behavior. Tourism Management, 47, 164–177.
https://doi.org/10.1016/j.tourman.2014.09.014
Han, Y., & Hansen, H. (2012). Determinants of Sustainable Food Consumption: A
Meta-Analysis Using a Traditional and a Structura Equation Modelling
Approach. International Journal of Psychological Studies.
https://doi.org/10.5539/ijps.v4n1p22
Haron, S. A., Paim, L., & Yahaya, N. (2006). Towards Sustainable Consumption :
an Examination of Environmental Knowledge Among Malaysians.
International Journal of Consumer Studies, 29(5), 426–436.
Hayes, A. F., & Preacher, K. J. (2010). Quantifying and Testing Indirect Effects in
Simple Mediation Models When the Constituent Paths are Nonlinear.
Multivariate Behavioral Research, 45(4), 627-660. doi:
10.1080/00273171.2010.498290.
Henseler, J., & Fassott, G. (2010). Testing Moderating Effects in PLS Path Models:
An Illustration of Available Procedures. In V. Esposito Vinzi, W. W. Chin, J.
Henseler & H. Wang (Eds.), Handbook of Partial Least Squares (pp.713-735).
Springer Berlin Heidelberg.
Henseler, J., Ringle, C. M., & Sinkovics, R. R. (2009). The Use of Partial Least
Squares Path Modeling in International Marketing. In R. R. Sinkovics & P.
N. Ghauri (Eds.). Advances in International Marketing, 20, 277-320. Bingley:
Emerald.
Holmer, P. M., & Kahle, L. R. (1988). A Structural Equation Test of The Value-
Attitude. Behaviour hierarchy. Journal of Personality and Social Psychology,
54, 638-646.
House, R. J. (1996). Path-Goal Theory of Leadership: Lessons, legacy, and a
Reformulated Theory. Leadership Quarterly, 7(3), 323-352.
House, R. J., & Baetz, M. L. (1979). Leadership: Some Empirical Generalizations
and New Research Directions. In B. M. Staw (Ed.), Research in
organizational behavior (Vol. 1, pp. 341-423). Greenwich, CT: JAI Press.
House, R. J., & Mitchell, T. R. (1974). Path-Goal Theory of Leadership. Journal of
Contemporary Business, 3(4), 81-97.
House, R. J., Hanges, P. J., Javidan, M., Dorfman, P. W., & Gupta, V. (Eds.).
(2004). Culture, Leadership, and Organizations: The GLOBE study of 62
societies. Thousand Oaks: Sage publications.

214
House, R. J., Spangler, W. D., & Woycke, J. (1991). Personality and Charisma in
the U.S. Presidency: A Psychological Theory of Leadership Effectiveness.
Administrative Science Quarterly, 36, 364-396.
Howell, J. M., & Avolio, B. J. (1993). Transformational Leadership, Transactional
Leadership, Locus of Control, and Support for Innovation: Key Predictors of
Consolidated-Business-Unit Performance. Journal of Applied Psychology,
78(6), 891-902.
Hu, Y., Smeryers-Verbeke, J., & Massart, D. L. (1990). Outlier Detection in
Calibration. Chemo Metrics and Intelligent Laboratory Systems, 9, 31-44.
Hulland, J. (1999). Use of Partial Least Squares (PLS) in Strategic Management
Research: A Review of Four Recent Studies. Strategic Management Journal,
20(2), 195-204.
Hutcherson, J. D. (2013). Community College Students’ Pro-Environmental
Behaviors and Their Relationship to Awareness of College Sustainability
Strategy Implementation. Western Carolina University.
Iacobucci, D., Saldanha, N., & Deng, X. (2007). Meditation on Mediation: Evidence
that Structural Equation Models Perform Better than Regressions. Journal of
Consumer Psychology, 17(2), 140-154.
Ibrahim, A. N., & Asmawi, M. Z. (2010). The Level of Awareness towards
Environmental Issues and Concern among Students in Tertiary Level . Case
Study of Universities Students in Kuala Lumpur and Klang Valley of
Malaysia .
Israel, G. D. (2013). Determining Sample Size. University of Florida IFAS
Extension, 1–5.
Jannah, M., Halim, L., Meerah, T. S. M., & Fairuz, M. (2013). Impact of
Environmental Education Kit on Students’ Environmental Literacy. Asian
Social Science, 9(12), 1–12. https://doi.org/10.5539/ass.v9n12p1
Kalsum, N., & Isa, M. (2016). Sustainable Campus and Academic Staffs Awareness
and Behaviour in Malaysia’s Institutions of HigherLearning : A Case Study
of UPSI, 6(6), 89–99.
Kaplan, S., Manca, F., Nielsen, T. A. S., & Prato, C. G. (2015). Intentions to Use
Bike-Sharing for Holiday Cycling: An Application of the Theory of Planned
Behavior. Tourism Management, 47, 34–46.
https://doi.org/10.1016/j.tourman.2014.08.017
Kenny, D. A., & Judd, C. M. (1984). Estimating the Nonlinear and Interactive
Effects of Latent Variables. Psychological Bulletin, 96(1), 201-210. doi:
10.1037/0033- 2909.96.1.201
215
Kerlinger, F. N., & Lee, H. B. (2000). Foundations of Behavioral Research (4th ed.).
Orlando, US: Harcourt College Publishers.
Kibert, N. C. (2000). An Analysis of The Correlations between the Attitude,
Behavior, and Knowledge Components of Environmental Literacy in
Undergraduate University Students. University of Florida.
Kim, Y. (2007). A Multidimensional Model of Public Entrepreneurship.
Unpublished doctoral dissertation. Rutgers, The State University of New
Jersey.
Kinsley, D. R. (1995). Ecology and Religion: Ecological Spirituality in Cross-
Cultural Perspective. Prentice Hall.
Kohli, A. K., & Jaworski, B. J. (1990). Market Orientation : The Construct,
Research Proposition, and Managerial Implications. Journal of Marketing,
54, 1–18.
Krosnick, J. A. (1999). Survey research. Annual Review of Psychology, 50(1), 537-
567.
Kumar, B. (2012). A Theory of Planned Behaviour Approach to Understand the
Purchasing Behaviour for Environmentally Sustainable Products. Indian
Institute of Management Ahmedabad. Indian Institute of Management
Ahmedabab.
Latif, S. A., Omar, M. S., Bidin, Y. H., & Awang, Z. (2013). Analyzing the Effect
of Situational Factor on Recycling Behaviour in Determining the Quality of
Life. Journal of Asian Behavioural Studies, 3(8).
Latif, A., & Aziz, S. (2018). Workplace Spirituality and Pro-Environmental
Behavior: The Role of Employee Engagement and Environmental Awareness.
18(5).
Lay, G. C., Ahmad, R., & Ming, B. H. (2013). The Barriers to Adoption of Green
Technology by Higher Education Institutions in Malaysia. Malaysian Online
Journal of Educational Management, 1, 23-34.
Leedy, P. D., & Ormrod, J. E. (2005). Practical Research Planning and Design (8th
ed.). Upper Saddle River, NJ: Prentice Hall.
Leeuw, A. de, Valois, P., Ajzen, I., & Schmidt, P. (2015). Using the Theory of
Planned Behavior to Identify Key Beliefs Underlying Pro-Environmental
Behavior in High-School Students: Implications for Educational
Interventions. Journal of Environmental Psychology.
https://doi.org/10.1016/j.jenvp.2015.03.005
Leeuw, A. de, Valois, P., & Seixas, R. (2014). Understanding High School

216
Students’ Attitude, Social Norm, Perceived Control and Beliefs to Develop
Educational Interventions on Sustainable Development. Procedia - Social and
Behavioral Sciences, 143, 1200–1209.
https://doi.org/10.1016/j.sbspro.2014.08.160
Li-ming, A. K., & Wai, T. B. (2013). Exploring Consumers’ Green Purchase
Behaviour Towards Online Green Advertising. The Macrotheme Review,
2(7), 60–81.
Little, R. J. A., & Rubin, D. B. (1987). Statistical Analysis with Missing Data. New
York: John Wiley & Sons, Inc.
Liu, C. L. (2012). An Investigation of Relationship Learning In Cross-Border Buyer
- Supplier Relationships: The Role of Trust. International Business Review,
21(3), 311-327.
Lockhart, H. (2011). Spirituality and Nature in the Transformation to a More
Sustainable World : Perspectives of South African Change Agents by
Spirituality and Nature in the Transformation to a More Sustainable World :
Perspectives of South African Change Agents.
Maathai, W. (2010). Replemishing the Earth: Spiritual Values for Healing
Ourselves and The World. New York: Doubleday.
MacKinnon, D. P., Lockwood, C. M., & Williams, J. (2004). Confidence Limits for
the Indirect Effect: Distribution of the Product and Resampling Methods.
Multivariate Behavioral Research, 39(1), 99-128.
Macy, Joanna &Johnstone, Chris.(2012). How to Face the Mess We're in Without
Going Crazy. New World Library, Novato, California.
Mader, C. M. (2007). Integration of Sustainability Into Universities - Good
Practices and Benchmarking for Integration. Norderstedt, Germany: Books on
Demand.
Mahmud, S. N. D., & Osman, K. (2010). The Determinants of Recycling Intention
Behavior Among the Malaysian School Students: An Application of theory
of Planned Behaviour. Procedia - Social and Behavioral Sciences, 9, 119–
124. https://doi.org/10.1016/j.sbspro.2010.12.123
Matell, M. S., & Jacoby, J. (1971). Is There An Optimal Number of Alternatives for
Likert Scale Items. Study of Reliability and Validity. Educational and
Psychological Measurement, 31(3), 657-674.
Mattanah, J. F., Hancock, G. R., & Brand, B. L. (2004). Parental Attachment,
Separation-Individuation, and College Student Adjustment: A Structural
Equation Analysis of Mediational Effects. Journal of Counseling Psychology,
51(2), 213.
217
Matthies, E., Selge, S., & Klöckner, C. (2012). The Role of Parental Behaviour for
the Development of Behaviour Specific Environmental Norms – The example
of Recycling and Re-Use Behaviour. Journal of Environmental Psychology,
32(3), 277–284. https://doi.org/10.1016/j.jenvp.2012.04.003
Mckenzie, S. (2005). Social Sustainability, Religious Belief and Global Ethics:
Outlines for Research. South Australia.
McMillan, B., & Conner, M. (2003). Using the Theory Of Planned Behaviour to
Understand Alcohol and Tobacco Use in Students. Psychology, Health &
Medicine, 8, 317-328. doi: 10.1080/1354850031000135759
Md Razak, M. I., Ahmad, I., Bujang, I., Talib, A. H., & Ibrahim, Z. (2013).
Economics of Air Pollution in Malaysia. International Journal of Humanities
and Social Science, 3(13), 173–177.
Michalos, A. C., Creech, H., McDonald, C., & Kahlke, P. M. H. (2009). Measuring
Knowledge, Attitudes and Behaviours towards Sustainable Development:
Two Exploratory Studies operating support from the Government of Attitudes
and Behaviours towards Sustainable Development. International Institute for
Sustainable Development.
Miller, K. L., & Smith, L. E. (1983). Handling Non-Response Issues. Journal of
Extension, 21(5), 45-50.
Ministry of Higher Education. (2007). The National Higher Education Action Plan
2007-2010. Triggering higher education transformation. Putrajaya, Malaysia:
Ministry of Higher Education.
Ministry of Housing and Local Government (2008). Why Recycle? Retrieved from
http://www.kpkt.gov.my/kitarsemula/Why.asp.
Minton, E. a., Kahle, L. R., & Kim, C.-H. (2015). Religion and Motives for
Sustainable Behaviors: A Cross-Cultural Comparison and Contrast. Journal
of Business Research, 1–8. https://doi.org/10.1016/j.jbusres.2015.01.003
Mohiuddin, M., Mamun, A. Al, Masud, M. M., & Su, Z. (n.d.). Environmental
Knowledge, Awareness, and Business School Students’ Intentions to
Purchase Green Vehicles in Emerging Countries.
https://doi.org/10.3390/su10051534
Montesarchio, C. (2009). Factors Influencing the Unethical Behavioural Intention
of College Students: Theory of Planned Behaviour. Lynn University, UMI
No. 3349139.
Muller, J., Creed, P., & Francis, L. (2004). Does Spirituality Mediate the
Relationship Between Environmental Stressors And Psychological Well-
Being in Distressed Unemployed People.
218
Murad, M.W., & Siwar, C. (2008). Factors Influencing Environmental Behaviour
of the Urban Poor Concerning Solid Waste Management. Journal
Environmental System, 31, 257-277.
Najera, M. (2010). Sustainability in Higher Education, An Explorative Approach
on Sustainable Behavior in Two Universities. Erasmus University Rotterdam.
Neuman, W. (1997). Social Research Methods: Qualitative and Quantitative
Approaches (3rd ed.). Needham Heights, MA: Allyn & Bacon.
Newhouse, N. (1990) Implications of Attitude and Behaviour Research for
Environmental Conservation. Journal of Environmental Education. 22, 26-32
Ng, S.Y., Shakur, E.S.A. and Choong, W.W. (2010), Energy Conservation
Opportunities in Malaysian Universities. Malaysian Journal of Real Estate,
5(1), 26-35.
Ngah, K., Mustaffa, J., Zakaria, Z., Noordin, N., & Sawal, M. (2011). Formulation
of Agenda 21 Process Indicators for Malaysia. Journal of Management and
Sustainability, 1, 82-89.
Niaura, A. (2013). Using the Theory of Planned Behavior to Investigate the
Determinants of Environmental Behavior among Youth. 1(63), 74–81.
Nunnally, J. C. (1978). Psychometric theory (2nd ed.). New York: McGraw-Hill.
Nunnally, J. C., & Bernstein, I. H. (1994). The Assessment of Reliability.
Psychometric Theory. 3, 248-292.
Onwezen, M. C., Antonides, G., & Bartels, J. (2013). The Norm Activation Model:
An exploration of the Functions of Anticipated Pride and Guilt in Pro-
Environmental Behaviour. Journal of Economic Psychology, 39, 141–153.
https://doi.org/10.1016/j.joep.2013.07.005
Oppenheim, A. N. (1966). Questionnaire Design and Attitude Measurement. New
York: Basic Books, Inc.
Osborne, J. W. (2010). Improving Your Data Transformations: Applying the Box-
Cox Transformation. Practical Assessment, Research & Evaluation, 15(12),
1-9.
Osman-gani, A. M., Hashim, J., & Ismail, Y. (2007). Effects of Religiosity,
Spirituality, and Personal Values on Employee Performance: A Conceptual
Analysis. 9th International Conference of the Academy of HRD (Asia
Chapter).
Osman, A. (2012). Environmental Behaviour Among University Students: The
Application of Theory of Planned Behaviour Model. Universiti Utara
219
Malaysia.
Osman, A., Abdullah, M. S., & Manaf, A. H. A. (2014). Examining the Effect of
Attitude Toward Recycling Behaviour Among Undergraduate Business
Students. Advances in Environmental Biology, 8(9), 450–454.
O’Sullivan, E., & Rassel, G. R. (1995). Research Methods for Public
Administrators. United States of America: Longman Publishers.
Pallant, J. (2010). SPSS Survival Manual: A Step by Step Guide to Data Analysis
Using SPSS for Windows (version 10 and 11). Philadelphia, PA, USA: Open
University Press.
Pan, S. L., Chou, J., Morrison, A. M., Huang, W. S., & Lin, M. C. (2018). Will the
Future Be Greener? The Environmental Behavioral Intentions of University
Tourism Students. Sustainability (Switzerland), 10(3), 1–17.
https://doi.org/10.3390/su10030634
Passafaro, P., Rimano, A., Piccini, M. P., Metastasio, R., Gambardella, V., Gullace,
G., & Lettieri, C. (2014). The Bicycle and the City: Desires and Emotions
Versus Attitudes, Habits and Norms. Journal of Environmental Psychology,
38, 76–83. https://doi.org/10.1016/j.jenvp.2013.12.011
Pearl, D. K., & Fairley, D. (1985). Testing for the Potential for Non-Response Bias
in Sample Surveys. Public Opinion Quarterly, 49(4), 553-560. doi:
10.1086/268950.
Pedhazur, E. J., & Schmelkin, L. P. (1991). Measurement, Design, and Analysis: an
Integrated Approach. Hillsdale, NJ: Erlbaum.
Pedro, Á. S., & Pedro, V. M. (2010). Developing Sustainable Environmental
Behavior in Secondary Education Students (12-16) Analysis of a Didactic
Strategy. Procedia - Social and Behavioral Sciences, 2(2), 3568–3574.
https://doi.org/10.1016/j.sbspro.2010.03.553
Peter, J. P. (1979). Reliability: A Review of Psychometric: Basics and Recent
Marketing Practices. Journal of Marketing Research, 16(2), 6-17.
Poortinga, W., Steg, L., & Vlek, C. (2004). Values, Environmental Concern, and
Environmental Behavior: A Study into Household Energy Use. Environment
& Behavior, 36(1), 70–93. https://doi.org/10.1177/0013916503251466
Preacher, K. J., & Hayes, A. F. (2004). SPSS and SAS Procedures for Estimating
Indirect Effects in Simple Mediation Models. Behavior Research Methods,
Instruments, & Computers, 36(4), 717-731.
Preacher, K. J., & Hayes, A. F. (2008). A Symptotic and Resampling Strategies for
Assessing and Comparing Indirect Effects in Multiple Mediator Models.
220
Behavior Research Methods, 40(3), 879-891.
Prestin, A. & Pearce, K.E. (2009). We Care a Lot: Formative Research for a Social
Marketing Campaign to Promote School-Based Recycling. Resources,
Conservation and Recycling, 35, 1-10.
Raemah, A. H. (2010). Perceived Leadership Styles and Commitment to Service
Quality among Academic Staff: The Mediating Influence of Job Satisfaction.
Doctoral dissertation, Universiti Utara Malaysia.
Rai, P., Srivastava, P. K., & Shukla, S. (2014). Developing a Connect between
Spiritual Ecology and Sustainability in the University Curriculum through an
Empirical Study, 1(2), 252–274.
Ramayah, T., Lee, J. W. C., & In, J. B. C. (2011). Network Collaboration and
Performance in the Tourism Sector. Service Business, 5(4), 411-428.
Raymond, M. R. (1986). Missing Data in Evaluation Research. Evaluation & the
Health Professions, 9, 395-420. doi: 10.1177/016327878600900401.
Reno, R.R., Cialdini, R.B., & Kallgren, C.A. (1993). The Trans-Situational
Influence of Social Norms. Journal of Personality and Social Psychology, 65,
104-112.
Reza, M. I. H. (2016). Sustainability in Higher Education: Perspectives of
Malaysian Higher Education System. SAGE Open, 6(3).
https://doi.org/10.1177/2158244016665890
Rigdon, E. E., Schumacker, R. E., & Wothke, W. (1998). A Comparative Review
of Interaction and Nonlinear Modeling. In R. E. Schumacker & G. A.
Marcoulides (Eds.), Interaction and nonlinear effects in structural equation
modeling (pp. 1- 16). Mahwah, NJ: Lawrence Erlbaum.
Ringle, C. M., Wende, S., & Will, A. (2005). SmartPLS 2.0. Software Download
from www.smartpls.de.
Ringle, C. M., Sarstedt, M., & Straub, D. W. (2012). Editor's comments: a Critical
Look at the Use of PLS-SEM in MIS quarterly. MIS Quarterly, 36(1), iii-xiv.
Robinson, J. P., Shaver, P. R., & Wrightsman, L. S. (1991a). Criteria for Scale
Selection and Evaluation. In J. P. Robinson, P. R. Shaver, & L. S. Wrightsman
(eds.), Measures of Personality and Social Psychological Attitudes (pp. 1-16).
San Diego, California: Academic Press.
Robinson, J. P., Shaver, P. R., & Wrightsman, L. S. (1991b). Measures of
Personality and Social Psychological Attitudes. San Diego, California:
Academic Press.

221
Rockefeller, S. C., & Elder, J. C. (1992). Spirit and Nature - Why the Environment
is a Religious Issue: An Interfaith Dialogue. Boston: Beacon Press.
Rogers, K., & Hudson, B. (2011). The Triple Bottom Line: The Synergies of
Transformative Perceptions and Practices For Sustainability. OD
Practitioner, 43, 3-9.
Sabbir, M., Aahad, R., Nuraihan, M. O., Daud, M., Hannan, A., Hassan, H., &
Learning, T. (2015). Trust and Workplace Spirituality on Knowledge Sharing
Behaviour Perspective from Non-Academic Staff of Higher Learning
Institutions. The Learning Organization, 22(6), 317–332.
Sahin, E., Ertepinar, H., & Teksoz, G. (2012). University Students’ Behaviors
Pertaining to Sustainability : A Structural Equation Model with
Sustainability-Related Attributes. International Journal of Environmental &
Science Education, 7(3), 459–478.
Said, A., Azura, N., & Fakhru’l-Razi. (2011). Impact of Environmental Education
on Concern, Knowledge and Sustainable Behavior of Primary School
Children. Health and the Environment Journal, 2(1), 50–53.
Said, A. M., Ahmadun, F. R., & Paim, L., & Masud, J. (2003). Environmental
Concerns, Knowledge and Practices Gap Among Malaysian Teachers.
International Journal of Sustainability in Higher Education, 4(4), 305–313.
Saleki, Z. S., & Sayedsaleki, S. M. (2012). The Main Factors Influencing Purchase
Behaviour of Organic Products in Malaysia. Interdisciplinary Journal of
Contemporary Research in Business, 4(1), 98–116.
Sattler, H., Völckner, F., Riediger, C., & Ringle, C. M. (2010). The Impact of Brand
Extension Success Factors on Brand Extension Price Premium. International
Journal of Research in Marketing, 27(4), 319-328.
Sawitri, D. R., Hadiyanto, H., & Hadi, S. P. (2015). Pro-Environmental Behavior
from a Social Cognitive Theory Perspective. Procedia Environmental
Sciences, 23, 27–33. https://doi.org/10.1016/j.proenv.2015.01.005
Sekaran, U. (2003). Research methods for business: A skill building approach (4th
ed.). New York, NY: John Willey & Sons.
Sekaran, U., & Bougie, R. (2010). Research Methods for business: A skill building
approach. (5th ed.). UK: John Wiley & Sons Ltd.
Sharma, N. (2018). Relationship between Consumers Spirituality and Green
Purchasing Intentions : The Mediation Effect of Perceived Consumer
Effectiveness Relationship between Consumers ’ Spirituality and Green
Purchasing Intentions : The Mediation Effect of Perceived Consumer
Effectiveness, (December 2016). https://doi.org/10.1177/2277975216665694

222
Sheikh, K. (1981). Investigating Non-Response Bias in Mail Surveys. Journal of
Epidemiology and Community Health, 35, 293-296.
Shephard, K. (2008). Higher Education for Sustainability: Seeking Affective
Learning Outcomes. International Journal of Sustainability in Higher
Education, 9(1), 87–98. https://doi.org/10.1108/14676370810842201
Shih, Y., & Fang, K. (2004). The Use of a Decomposed Theory of Planned Behavior
to Study Internet Banking in Taiwan. Internet Research, 14(3), 213–223.
https://doi.org/10.1108/10662240410542643
Shrout, P. E., & Bolger, N. (2002). Mediation in Experimental and
Nonexperimental Studies: New Procedures and Recommendations.
Psychological Methods, 7(4), 422-445.
Sia Su, G.L. (2008). Environmental Worldwide and Concern of College Students in
the Philippine. International Journal of Sustainability in Higher Education, 9
(1), 39-47.
Singer, E. (2006). Non-Response Bias in Household Surveys. Public Opinion
Quarterly, 70(5), 637-645.
Sobel, M. E. (1982). A Symptotic Confidence Intervals for Indirect Effects in
Structural Equation Models. Sociological Methodology, 13(1982), 290-312.
Sonquist, J. A., & Dunkelberg, W. C. (1977). Survey and Opinion Research.
Engelwood Cliffs, NJ: Prentice-Hall.
Starkweather, J. (2011). An Alternative Modeling Strategy: Partial Least Squares.
Retrieved May 15, 2015 from
www.unt.edu/rss/class/Jon/Benchmarks/PLS_JDS_ July2011.pdf.
Straub, D. W. (1989). Validating Instruments in MIS Research. MIS Quarterly,
13(2), 147-169.
Straughan, R. D., & Roberts, J. A. (1999). Environmental Segmentation
Alternatives : A Look At Green Consumer Behavior in the New Millennium.
Journal of Consumer Marketing, 16(6), 558–575.
Stone, M. (1974). Cross-Validatory Choice and Assessment of Statistical
Predictions. Journal of the Royal Statistical Society. Series B
(Methodological), 36, 111-147. doi: 10.2307/2984809
Syed Idros, S. N. (2014). Exploring Environmental Behaviours, Attitudes and
Knowledge Among University Students: Positioning the Concept of
Sustainable development within Malaysian Education. Journal of Science and
Mathematics Education in S.E. Asia, 29(1), 79–97.
223
Tabachnick, B. G., & Fidel, L. S. (2007). Using multivariate statistics (5th ed.).
Boston: Pearson Education Inc.
Tan, B.-C., & Lau, T.-C. (2009). Examining Sustainable Consumption Patterns of
Young Consumers: Is There A Cause for Concern? The Journal of
International Social Research, 2(9).
Tan, B.-C., Nasreen-Khan, Hong, Y.-H., & Lam, W.-H. (2015). The Influence of
Environmental Values on Green Purchase Behaviour: Direct, Indirect, or
Both? International Journal of Business and Management, 10(12), 234.
https://doi.org/10.5539/ijbm.v10n12p234
Tapia-Fonllem, C., Corral-Verdugo, V., Fraijo-Sing, B., & Durón-Ramos, M.
(2013). Assessing Sustainable Behavior and its Correlates: A Measure of Pro-
Ecological, Frugal, Altruistic and Equitable Actions. Sustainability, 5(2),
711–723. https://doi.org/10.3390/su5020711
Taylor, S., & Todd, P. (1995). An Integrated Model of Waste Management
Behaviour: a Test of Household Recycling and Compost Intentions.
Environmental Behaviour, 27(5), 603-630.
Tenenhaus, M., Amato, S., & Vinzi, V. E. (2004). A Global Goodness-of-Fit Index
for PLS Structural Equation Modelling. In Proceedings of the XLII SIS
scientific meeting, 1, 739-742. CLEUP, Padova.
Tenenhaus, M., Vinzi, V. E., Chatelin, Y. M., & Lauro, C. (2005). PLS Path
Modeling. Computational Statistics and Data Analysis, 48(1), 159-205.
Ting, L. S., Mohammed, A. H. Bin, & Choong, W. W. (2012). Proposed
Implementation Strategies for Energy Sustainability on a Malaysian
University Campus. Business Strategy Series, 13(5), 208–214.
https://doi.org/10.1108/17515631211264087
Tombaugh, J. R., Mayfield, C., & Durand, R. (2011). Spiritual Expression at Work:
Exploring The Active Voice of Workplace Spirituality. International Journal
of Organizational Analysis, 19(2), 146–170.
Tore, D. (2005). An Empirical Investigation of The Key Factors for Success In
Software Process Improvement. IEEE Transactions on Software Engineering,
31(5), 410- 424.
Truelove, H.B. (2010). An Investigation of the Psychology Of Global Warming:
Perceptions, Predictors of Behaviour and the Persuasiveness of Ecological
Footprint Calculators. Washington State University, UMI No. 3382201.
Trumbo, C. W., & O'Keefe, GJ. (2001). Intention to Conserve Water:
Environmental Value, Planned Behaviour and Information Effects. A
Comparison of Three Communities Sharing A Watershed. Society & Natural

224
Resources, 4, 889-899.
Ueda, T. (2009). A Simple Method for the Detection Of Outliers. Electronic Journal
of Applied Statistical Analysis, 2(1), 67-76. doi: 10.1285/i20705948v2n1p67
United Nations. (1992), Promoting Education, Public Awareness of Training,
Report of the UK Conference on Environment and Development. Retrieved
from http://www.gopher/gopher.undp.org:70/00/unconfs/UNCED/
English/a21_36.
Vaughan-Lee, L. (2013). Spritual Ecology: The Cry of The Earth. Retrieved from
http://www.workingwithoneness.org/articles/spiritual-ecology-solution.
Vaus, V.A. (2002). Research Design in Social Research. London: Sage
Publications, Inc.
Vendhan, G. S., & Suresh, K. K. (2011). Robust Estimators of Scale and Location
Parameter Using Matlab. Proceedings of International Symposium on
Computing, Communication and Control, 1, Singapore, IACSIT Press.
Verardi, V., & Croux, C. (2009). Robust Regression in Stata. The Stata Journal,
9(3), 439-453.
Vermeir, I., & Verbeke, W. (2008). Sustainable Food Consumption Among Young
Adults in Belgium: Theory of Planned Behaviour and The Role of Confidence
and Values. Ecological Economics, 64(3), 542–553.
https://doi.org/10.1016/j.ecolecon.2007.03.007
Wan, C. Da, Sirat, M., & Razak, D. A. (2015). The Idea of a University: Rethinking
the Malaysian Context, 266–282. https://doi.org/10.3390/h4030266
Weisberg, H. F., & Bowen, B. D. (1977). An Introduction to Survey Research and
Data Analysis. San Francisco, CA: WH Freeman and Company.
Wetzels, M., Odekerken-Schröder, G., & Van Oppen, C. (2009). Using PLS Path
Modeling for Assessing Hierarchical Construct Models: Guidelines and
Empirical Illustration. MIS Quarterly, 33(1), 177-195.
Whitmarsh, L., & O’Neill, S. (2010). Green Identity, Green Living. The Role of
Pro-Environmental Self-Identity in Determining Consistency Across Diverse
Pro-Environmental Behaviours. Journal of Environmental Psychology, 30(3),
305–314. https://doi.org/10.1016/j.jenvp.2010.01.003
Wiersma, W. (1993). Research Methods in Education: An Introduction (5th ed.).
Boston: Allyn & Bacon.
Wilden, R., Gudergan, S. P., Nielsen, B. B., & Lings, I. (2013). Dynamic
Capabilities and Performance: Strategy, Structure and Environment. Long

225
Range Planning. 46(1), 72-96.
Wray-Lake, L., Flanagan, C. A., & Osgood, D. W. (2010). Examining Trends in
Adolescent Environmental Attitudes, Beliefs, and Behaviors Across Three
Decades. Environment and Behavior, 42(1), 61–85.
Wynveen, B. J. (2013). Attaining Sustainable Behavior Among Non-
Environmentally-Motivated Individuals: A Formative Experiment. Clemson
University.
Zahari, N. (2012). Investigating the Determinants of Recycling Behaviour among
Secondary School Students in Penang.
Zain, S. M., Basri, N. E. A., Mahmood, N. A., Basri, H., Zakaria, N., Elfithri, R.,
… Shahudin, Z. (2012). Recycling Practice to Promote Sustainable Behavior
at University Campus. Asian Social Science, 8(16), 163–173.
https://doi.org/10.5539/ass.v8n16p163
Zikmund, W. G. (2003). Business Research Methods. Oklahoma: South-Western.
Zuraidah, R., Nor Hashima, H., Wan Yahya, K., & Mohamad, S. A. (2012).
Environmental Conscious Behaviour Among Male and Female Malaysian
Consumers. OIDA International Journal of Sustainable Development, 4(8).

226
APPENDICES
APPENDIX I: DATA COLLECTION LETTER

227
APPENDIX II: QUESTIONNAIRE
SURVEY QUESTIONNAIRE
Spirituality and Sustainability Practices among Students of Public Universities in
Malaysia
Dear respondents,
This study aims to examine the level of spirituality and sustainability among students of
public university in Malaysia. In this study, spirituality refers to practices that caused the
internal feelings of students based on religious beliefs or moral, while sustainability refers
to the practice of recycling, save energy and reduce pollution to protect the environment.
For the information of the respondents, this study is voluntary and it is expected to take
approximately 30 minutes. All information provided is confidential and will only be used for
purely academic purposes. It is hoped that the respondent can answer survey questions
honestly to ensure the accuracy of the findings that can contribute to improved policies and
strategies in the management of solid waste, recycling, saving energy and reducing
pollution, thus promoting the sustainable behaviour among university student of public
universities in Malaysia.
Should you have any enquiries regarding this study, please contact Norhasliza binti Hassan
in the e-mail address: [email protected] or contact number: 018-2414165. Your
participation is highly needed and appreciated.
Yours sincerely,
Hasliza
Norhasliza Hassan (93985) PhD’s Students Universiti Utara Malaysia
228
BORANG SOAL SELIDIK
Amalan Kerohanian dan Kelestarian di Kalangan Pelajar Universiti Awam di
Malaysia
Kepada responden,
Kajian ini dilakukan adalah untuk mengkaji tahap kerohanian dan kelestarian di kalangan
pelajar universiti awam di Malaysia. Dalam konteks kajian ini, kerohanian merujuk kepada
amalan yang disebabkan perasaan dalaman pelajar berdasarkan pegangan agama atau
moral, manakala kelestarian pula merujuk kepada amalan kitar semula, jimat tenaga dan
kurangkan pencemaran bagi melindungi alam sekitar.
Untuk makluman responden, kajian ini adalah secara sukarela dan ia dijangka akan
mengambil masa lebih kurang 30 minit. Semua maklumat yang diberikan adalah sulit dan
hanya akan digunakan untuk tujuan akademik semata-mata. Adalah diharapkan responden
dapat menjawab soalan kaji selidik ini dengan jujur bagi memastikan ketepatan dapatan
kajian yang dapat menyumbang kepada penambahbaikan polisi dan strategi dalam
pengurusan bahan buangan pejal, aktiviti kitar semula, penjimatan tenaga dan usaha
mengurangkan pencemaran seterusnya menggalakkan gelagat lestari di kalangan pelajar
universiti awam di Malaysia.
Sekiranya anda mempunyai sebarang pertanyaan mengenai kajian ini, sila hubungi
Norhasliza binti Hassan di alamat e-mail: [email protected] atau hubungi di nombor
telefon: 018-2414165. Kerjasama anda amatlah diharapkan dan didahului dengan ucapan
terima kasih.
Yang benar, Hasliza
Norhasliza Hassan (93985) Pelajar Doktor Falsafah (PhD) Universiti Utara Malaysia

229
Section A / Bahagian A: Respondent’s Profile / Profil Responden The following questions refer to the demographic profile of the respondents. Please provide the appropriate information by placing a (√) in the bracket provided to represent your answer / Soalan-soalan berikut merujuk kepada profil demografi responden. Sila berikan maklumat yang sesuai dengan meletakkan (√) pada petak yang disediakan untuk mewakili jawapan anda. 1. Gender / Jantina: Male / Lelaki Female / Perempuan
2. Age / Umur: _____________ years old / tahun
3. Religion / Agama:
Islam / Islam Christian / Kristian Buddhist / Buddha Others, please specify / Lain-lain, nyatakan: _______________
4. Race / Bangsa:
Malay / Melayu Indian / India Chinese / Cina Others, please specify / Lain-lain,nyatakan: ____________________
5. Which university that you have enrolled in / Universiti manakah yang anda duduki. Universiti Putra Malaysia (UPM) Universiti Utara Malaysia (UUM) Universiti Malaya (UM) Universiti Kebangsaan Malaysia (UKM) Universiti Teknologi Malaysia (UTM) Universiti Malaysia Sabah (UMS) Universiti Sains Islam Malaysia (USIM)
6. What year are you officially in currently? (e.g. first year, second year) / Tahun berapakah pengajian anda sekarang? (contoh: tahun pertama, kedua).
___________________________________________________________

230
Section B / Bahagian B: Attitude / Sikap Direction / Arahan: Tick for the survey questionnaire below. Please refer evaluation scale below / Tandakan pada soalan soal selidik di bawah ini. Sila rujuk skala penilaian di bawah ini:
1
2
3
4
5
6
7
Strongly Disagree (SD)
/ Sangat Tidak
Bersetuju (STB)
Strongly Agree (SA)
/ Sangat Bersetuju
(SB)
Each sentence below is begin with the statement “I believe it is important for student to...........” / Setiap ayat di bawah bermula dengan pernyataan “Saya yakin adalah penting bagi pelajar untuk............”
SD/STB
SA/SB
1. Watch or listen to media programmes about environmental issues. / Menonton atau mendengar program-program media tentang isu alam sekitar.
1
2 3 4 5 6 7
2. Purchase eco-products (environmentally friendly, non-toxic, and sustainable products). / Membeli eko-produk (produk mesra alam sekitar, tiada toksik dan lestari).
1
2 3 4 5 6 7
3. Recycle paper, can and glass as much as possible. / Mengitar semula kertas, tin dan kaca sebanyak mana yang mungkin.
1
2 3 4 5 6 7
4. Turn lights off when leaving a room. / Mematikan suis lampu apabila meninggalkan bilik.
1 2 3 4 5 6 7
5. Be concerned about how much waste is produced in this country. / Prihatin tentang berapa banyak bahan buangan dikeluarkan dalam negara ini.
1 2 3 4 5 6 7
6. Be concerned about how to reduce pollution. / Prihatin tentang cara untuk mengurangkan pencemaran.
1 2 3 4 5 6 7
7. Contribute to the solution of environmental issues by my actions. / Menyumbang kepada penyelesaian isu alam sekitar melalui tindakan saya sendiri.
1 2 3 4 5 6 7
8. Be concerned about the rate of species extinction in the world. / Mengambil berat tentang kadar kepupusan spesis di dalam dunia ini.
1 2 3 4 5 6 7

231
Section C / Bahagian C: Subjective Norm / Norma Subjektif Direction / Arahan: Tick for the survey questionnaire below. Please refer evaluation scale below: /Tandakan pada soalan soal selidik di bawah ini. Sila rujuk skala penilaian di bawah ini:
1
2
3
4
5
6
7
Strongly Disagree (SD)
/ Sangat Tidak
Bersetuju (STB)
Strongly Agree (SA)
/ Sangat Bersetuju
(SB)
Each sentence below is begin with the statement “Most people who are important to me (parents, lecturers, friends, families and communities) influenced me to ...........” / Setiap ayat di bawah bermula dengan pernyataan “Individu yang penting kepada saya (ibu bapa, pensyarah, rakan-rakan, keluarga dan masyarakat) mempengaruhi saya untuk ............”
SD/STB SA/SB
1. Recycle materials (such as bottles, cans and paper). / Mengitar semula bahan-bahan (seperti botol-botol, tin-tin dan kertas-kertas).
1
2 3 4 5 6 7
2. Be a member of an environmental organization. / Menjadi ahli dalam organisasi alam sekitar.
1
2 3 4 5 6 7
3. Turn lights off when I leave a room. / Mematikan suis lampu apabila meninggalkan bilik.
T
2 3 4 5 6 7
4. Buy sustainable (energy conserving) products. / Membeli produk lestari (jimat tenaga).
1 2 3 4 5 6 7
5. Turn off my computer when I am done using it. / Mematikan suis komputer sebaik selesai menggunakannya.
1 2 3 4 5 6 7
6. Be concerned more on environmental issues. / Prihatin terhadap isu alam sekitar.
1 2 3 4 5 6 7
7. Conserve the environment by recycling. / Memelihara alam sekitar dengan kitar semula.
1 2 3 4 5 6 7
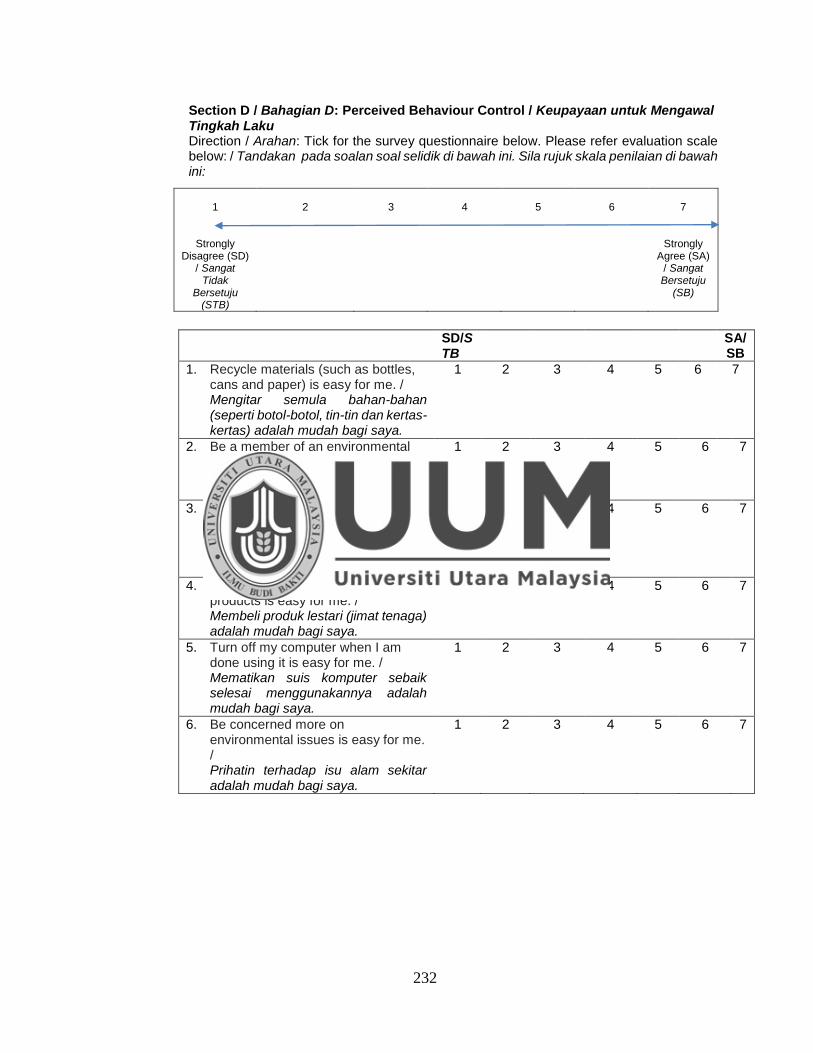
232
Section D / Bahagian D: Perceived Behaviour Control / Keupayaan untuk Mengawal Tingkah Laku Direction / Arahan: Tick for the survey questionnaire below. Please refer evaluation scale below: / Tandakan pada soalan soal selidik di bawah ini. Sila rujuk skala penilaian di bawah ini:
1
2
3
4
5
6
7
Strongly Disagree (SD)
/ Sangat Tidak
Bersetuju (STB)
Strongly Agree (SA)
/ Sangat Bersetuju
(SB)
SD/STB
SA/SB
1. Recycle materials (such as bottles, cans and paper) is easy for me. / Mengitar semula bahan-bahan (seperti botol-botol, tin-tin dan kertas-kertas) adalah mudah bagi saya.
1
2 3 4 5 6 7
2. Be a member of an environmental organization is easy for me. / Menjadi ahli dalam organisasi alam sekitar adalah mudah bagi saya.
1
2 3 4 5 6 7
3. Turn lights off when I leave a room is easy for me. / Mematikan suis lampu apabila meninggalkan bilik adalah mudah bagi saya.
T
2 3 4 5 6 7
4. Buy sustainable (energy conserving) products is easy for me. / Membeli produk lestari (jimat tenaga) adalah mudah bagi saya.
1 2 3 4 5 6 7
5. Turn off my computer when I am done using it is easy for me. / Mematikan suis komputer sebaik selesai menggunakannya adalah mudah bagi saya.
1 2 3 4 5 6 7
6. Be concerned more on environmental issues is easy for me. / Prihatin terhadap isu alam sekitar adalah mudah bagi saya.
1 2 3 4 5 6 7
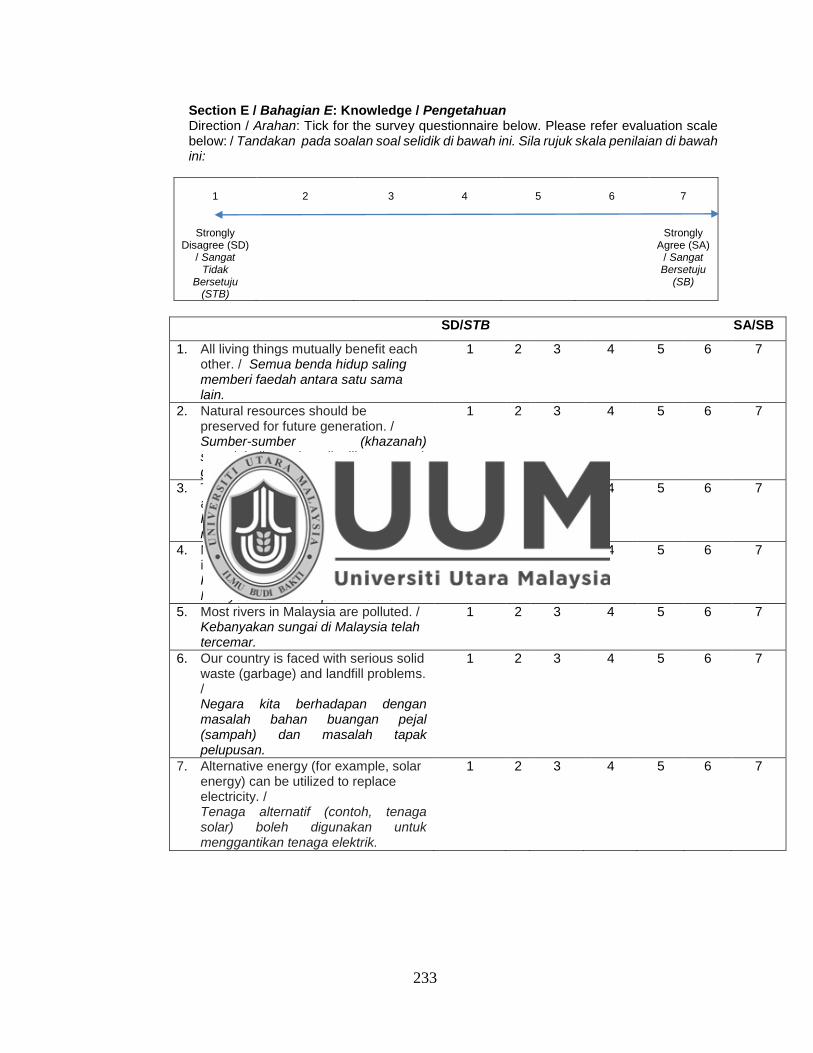
233
Section E / Bahagian E: Knowledge / Pengetahuan Direction / Arahan: Tick for the survey questionnaire below. Please refer evaluation scale below: / Tandakan pada soalan soal selidik di bawah ini. Sila rujuk skala penilaian di bawah ini:
1
2
3
4
5
6
7
Strongly Disagree (SD)
/ Sangat Tidak
Bersetuju (STB)
Strongly Agree (SA)
/ Sangat Bersetuju
(SB)
SD/STB SA/SB
1. All living things mutually benefit each other. / Semua benda hidup saling memberi faedah antara satu sama lain.
1
2 3 4 5 6 7
2. Natural resources should be preserved for future generation. / Sumber-sumber (khazanah) semulajadi perlu dipelihara untuk generasi akan datang.
1
2 3 4 5 6 7
3. The condition of our environment can affect our health. / Keadaan alam sekitar kita boleh memberi kesan kepada kesihatan kita.
T
2 3 4 5 6 7
4. Main cause of air pollution in Malaysia is fumes (smoke) from vehicles. / Punca utama pencemaran udara di Malaysia adalah asap dari kenderaan.
1 2 3 4 5 6 7
5. Most rivers in Malaysia are polluted. / Kebanyakan sungai di Malaysia telah tercemar.
1 2 3 4 5 6 7
6. Our country is faced with serious solid waste (garbage) and landfill problems. / Negara kita berhadapan dengan masalah bahan buangan pejal (sampah) dan masalah tapak pelupusan.
1 2 3 4 5 6 7
7. Alternative energy (for example, solar energy) can be utilized to replace electricity. / Tenaga alternatif (contoh, tenaga solar) boleh digunakan untuk menggantikan tenaga elektrik.
1 2 3 4 5 6 7
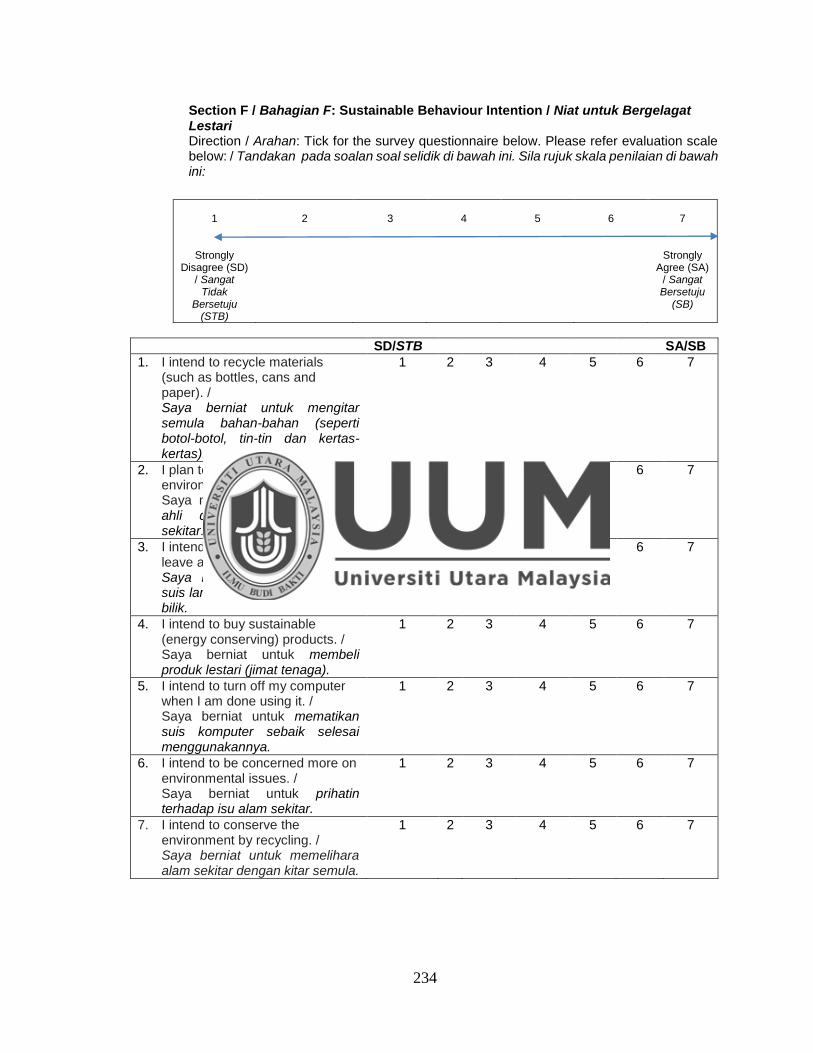
234
Section F / Bahagian F: Sustainable Behaviour Intention / Niat untuk Bergelagat Lestari Direction / Arahan: Tick for the survey questionnaire below. Please refer evaluation scale below: / Tandakan pada soalan soal selidik di bawah ini. Sila rujuk skala penilaian di bawah ini:
1
2
3
4
5
6
7
Strongly Disagree (SD)
/ Sangat Tidak
Bersetuju (STB)
Strongly Agree (SA)
/ Sangat Bersetuju
(SB)
SD/STB SA/SB
1. I intend to recycle materials (such as bottles, cans and paper). / Saya berniat untuk mengitar semula bahan-bahan (seperti botol-botol, tin-tin dan kertas-kertas).
1
2 3 4 5 6 7
2. I plan to be a member of an environmental organization. / Saya merancang untuk menjadi ahli dalam organisasi alam sekitar.
1
2 3 4 5 6 7
3. I intend to turn lights off when I leave a room. / Saya berniat untuk mematikan suis lampu apabila meninggalkan bilik.
T
2 3 4 5 6 7
4. I intend to buy sustainable (energy conserving) products. / Saya berniat untuk membeli produk lestari (jimat tenaga).
1 2 3 4 5 6 7
5. I intend to turn off my computer when I am done using it. / Saya berniat untuk mematikan suis komputer sebaik selesai menggunakannya.
1 2 3 4 5 6 7
6. I intend to be concerned more on environmental issues. / Saya berniat untuk prihatin terhadap isu alam sekitar.
1 2 3 4 5 6 7
7. I intend to conserve the environment by recycling. / Saya berniat untuk memelihara alam sekitar dengan kitar semula.
1 2 3 4 5 6 7

235
Section G / Bahagian G: Spirituality / Kerohanian Direction / Arahan: Tick for the survey questionnaire below. Please refer evaluation scale below: / Tandakan pada soalan soal selidik di bawah ini. Sila rujuk skala penilaian di bawah ini:
1
2
3
4
5
6
7
Strongly Disagree (SD)
/ Sangat Tidak
Bersetuju (STB)
Strongly Agree (SA)
/ Sangat Bersetuju
(SB)
SD/STB SA/SB
1. I am comfortable expressing my spiritual side at my institution. / Saya selesa mempraktikkan aspek kerohanian di institut pengajian saya.
1
2 3 4 5 6 7
2. When doing recycling, conserving energy and reducing environmental pollution, I am often guided by my spirituality practices. / Apabila melakukan aktiviti mengitar semula, menjimatkan tenaga dan mengurangkan pencemaran alam sekitar, saya biasanya didorong oleh amalan kerohanian saya.
1
2 3 4 5 6 7
3. My interactions with others in natural world are often influenced by my spirituality practices. / Hubungan saya dengan benda lain dalam alam semulajadi biasanya dipengaruhi oleh amalan kerohanian saya.
T
2 3 4 5 6 7
4. When in my institution, I do not mind talking about my spirituality with others. / Apabila berada di institut pengajian saya, saya tidak kisah untuk bercakap tentang aspek kerohanian dengan orang lain.
1 2 3 4 5 6 7
5. I am liable for all my actions that include affecting the environment. / Saya bertanggungjawab ke atas semua tindakan saya yang termasuk menjejaskan alam sekitar.
1 2 3 4 5 6 7
6. I am always living in harmony and being transparent with my friends in my institution of study. / Saya sentiasa hidup dalam keadaan harmoni dan jujur dengan kawan-kawan saya di institut pengajian saya.
1 2 3 4 5 6 7

236
Section H / Bahagian H: Sustainable Behaviour / Gelagat Lestari Direction / Arahan: Tick for the survey questionnaire below. Please refer evaluation scale below: / Tandakan pada soalan soal selidik di bawah ini. Sila rujuk skala penilaian di bawah ini.
1
2
3
4
5
6
7
Strongly Disagree (SD)
/ Sangat Tidak
Bersetuju (STB)
Strongly Agree (SA)
/ Sangat Bersetuju
(SB)
SD/STB SA/SB
1. I collect and recycles used paper. / Saya mengumpul dan mengitar semula kertas yang telah digunakan.
1
2 3 4 5 6 7
2. I switch off lamp and fan when leaving place. / Saya mematikan suis lampu dan kipas selepas meninggalkan sesuatu tempat.
1
2 3 4 5 6 7
3. I do not leave the water running while I brush my teeth. / Saya tidak membiarkan air mengalir keluar ketika saya menggosok gigi.
T
2 3 4 5 6 7
4. I read about environmental issues (such as environmental pollution problems). / Saya membaca tentang isu-isu alam sekitar (contohnya masalah pencemaran alam sekitar).
1 2 3 4 5 6 7
5. I use both sides of the paper sheet when I write or print a document. / Saya menggunakan kedua-dua belah lembaran kertas apabila saya menulis atau mencetak dokumen.
1 2 3 4 5 6 7
6. I shower for less than 20 minutes. / Saya mandi dalam masa kurang dari 20 minit.
1 2 3 4 5 6 7
7. When I am ouside, I avoid littering. / Apabila saya berada di luar, saya mengelakkan dari membuang sampah di merata tempat.
1 2 3 4 5 6 7
237
-Thank you for your support and cooperation / Terima kasih atas sokongan dan
kerjasama anda-
8. I purchase products in reusable containers. / Saya membeli produk-produk di dalam bekas yang boleh digunakan semula.
1 2 3 4 5 6 7
9. I talk to friends about environmental problems (such as environmental pollution problems). / Saya bercakap dengan kawan-kawan tentang masalah alam sekitar.(contohnya masalah pencemaran alam sekitar).
1 2 3 4 5 6 7
10. I look for ways to reuse things. / Saya mencari kaedah-kaedah untuk menggunakan semula barangan terpakai.
1 2 3 4 5 6 7

238
APPENDIX III: TESTS OF NORMALITY
Kolmogorov-Smirnova Shapiro-Wilk
Statistic df Sig. Statistic df Sig.
ATT1 .195 956 .000 .863 956 .000
ATT2 .234 956 .000 .840 956 .000
ATT3 .274 956 .000 .796 956 .000
ATT4 .448 956 .000 .581 956 .000
ATT5 .214 956 .000 .845 956 .000
ATT6 .308 956 .000 .764 956 .000
ATT7 .225 956 .000 .842 956 .000
ATT8 .245 956 .000 .826 956 .000
SN1 .194 956 .000 .869 956 .000
SN2 .150 956 .000 .935 956 .000
SN3 .410 956 .000 .632 956 .000
SN4 .192 956 .000 .865 956 .000
SN5 .349 956 .000 .723 956 .000
SN6 .237 956 .000 .833 956 .000
SN7 .232 956 .000 .838 956 .000
PBC1 .198 956 .000 .880 956 .000
PBC2 .167 956 .000 .933 956 .000
PBC3 .440 956 .000 .587 956 .000
PBC4 .175 956 .000 .892 956 .000
PBC5 .381 956 .000 .669 956 .000
PBC6 .238 956 .000 .835 956 .000
KN1 .419 956 .000 .631 956 .000
KN2 .477 956 .000 .521 956 .000
KN3 .486 956 .000 .499 956 .000
KN4 .209 956 .000 .842 956 .000
KN5 .254 956 .000 .813 956 .000
KN6 .312 956 .000 .764 956 .000
KN7 .361 956 .000 .713 956 .000
INT1 .262 956 .000 .803 956 .000
INT2 .176 956 .000 .905 956 .000
INT3 .458 956 .000 .555 956 .000
INT4 .281 956 .000 .799 956 .000
INT5 .431 956 .000 .608 956 .000
INT6 .349 956 .000 .733 956 .000
INT7 .350 956 .000 .732 956 .000
SP1 .288 956 .000 .791 956 .000

239
APPENDIX III (CONTINUED)
Kolmogorov-Smirnova Shapiro-Wilk
Statistic df Sig. Statistic df Sig.
SP2 .249 956 .000 .820 956 .000
SP3 .230 956 .000 .829 956 .000
SP4 .200 956 .000 .859 956 .000
SP5 .285 956 .000 .792 956 .000
SP6 .231 956 .000 .844 956 .000
SB1 .174 956 .000 .895 956 .000
SB2 .411 956 .000 .642 956 .000
SB3 .246 956 .000 .817 956 .000
SB4 .172 956 .000 .890 956 .000
SB5 .265 956 .000 .799 956 .000
SB6 .260 956 .000 .796 956 .000
SB7 .412 956 .000 .638 956 .000
SB8 .190 956 .000 .876 956 .000
SB9 .163 956 .000 .914 956 .000
SB10 .188 956 .000 .872 956 .000
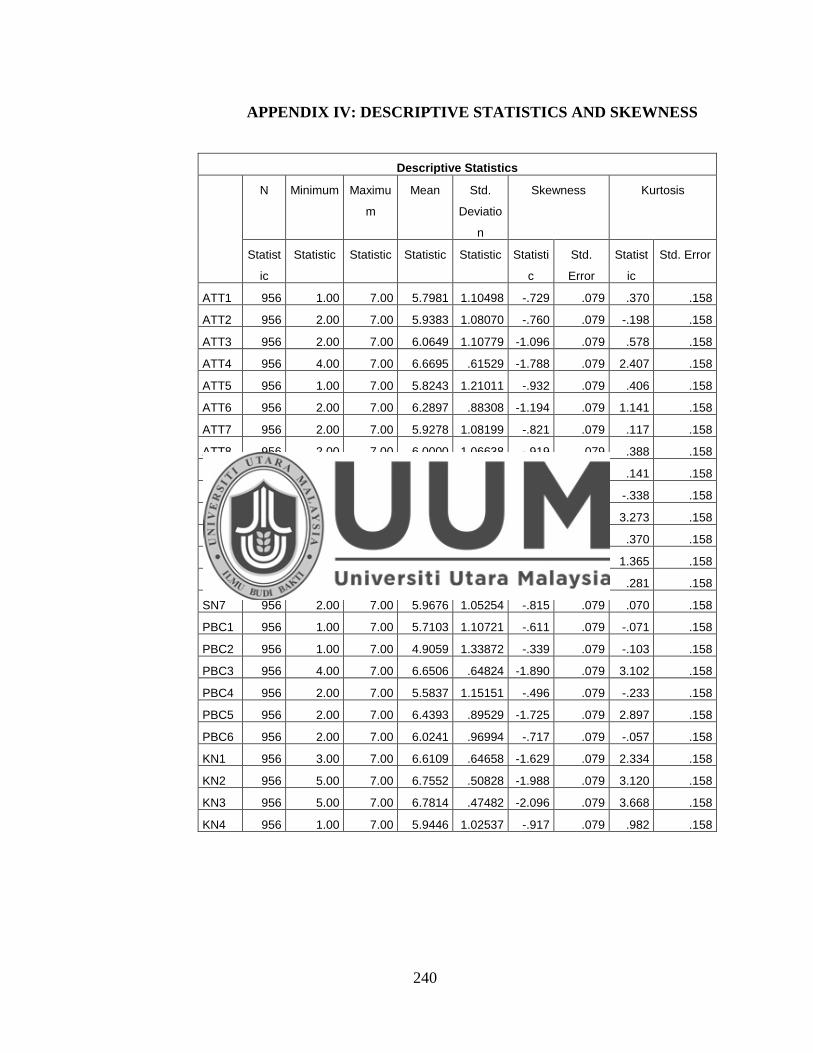
240
APPENDIX IV: DESCRIPTIVE STATISTICS AND SKEWNESS
Descriptive Statistics
N Minimum Maximu
m
Mean Std.
Deviatio
n
Skewness Kurtosis
Statist
ic
Statistic Statistic Statistic Statistic Statisti
c
Std.
Error
Statist
ic
Std. Error
ATT1 956 1.00 7.00 5.7981 1.10498 -.729 .079 .370 .158
ATT2 956 2.00 7.00 5.9383 1.08070 -.760 .079 -.198 .158
ATT3 956 2.00 7.00 6.0649 1.10779 -1.096 .079 .578 .158
ATT4 956 4.00 7.00 6.6695 .61529 -1.788 .079 2.407 .158
ATT5 956 1.00 7.00 5.8243 1.21011 -.932 .079 .406 .158
ATT6 956 2.00 7.00 6.2897 .88308 -1.194 .079 1.141 .158
ATT7 956 2.00 7.00 5.9278 1.08199 -.821 .079 .117 .158
ATT8 956 2.00 7.00 6.0000 1.06638 -.919 .079 .388 .158
SN1 956 1.00 7.00 5.7280 1.18864 -.756 .079 .141 .158
SN2 956 1.00 7.00 4.8096 1.49111 -.393 .079 -.338 .158
SN3 956 3.00 7.00 6.5889 .68906 -1.794 .079 3.273 .158
SN4 956 1.00 7.00 5.7835 1.10315 -.708 .079 .370 .158
SN5 956 2.00 7.00 6.3536 .90635 -1.356 .079 1.365 .158
SN6 956 1.00 7.00 6.0094 1.01760 -.843 .079 .281 .158
SN7 956 2.00 7.00 5.9676 1.05254 -.815 .079 .070 .158
PBC1 956 1.00 7.00 5.7103 1.10721 -.611 .079 -.071 .158
PBC2 956 1.00 7.00 4.9059 1.33872 -.339 .079 -.103 .158
PBC3 956 4.00 7.00 6.6506 .64824 -1.890 .079 3.102 .158
PBC4 956 2.00 7.00 5.5837 1.15151 -.496 .079 -.233 .158
PBC5 956 2.00 7.00 6.4393 .89529 -1.725 .079 2.897 .158
PBC6 956 2.00 7.00 6.0241 .96994 -.717 .079 -.057 .158
KN1 956 3.00 7.00 6.6109 .64658 -1.629 .079 2.334 .158
KN2 956 5.00 7.00 6.7552 .50828 -1.988 .079 3.120 .158
KN3 956 5.00 7.00 6.7814 .47482 -2.096 .079 3.668 .158
KN4 956 1.00 7.00 5.9446 1.02537 -.917 .079 .982 .158
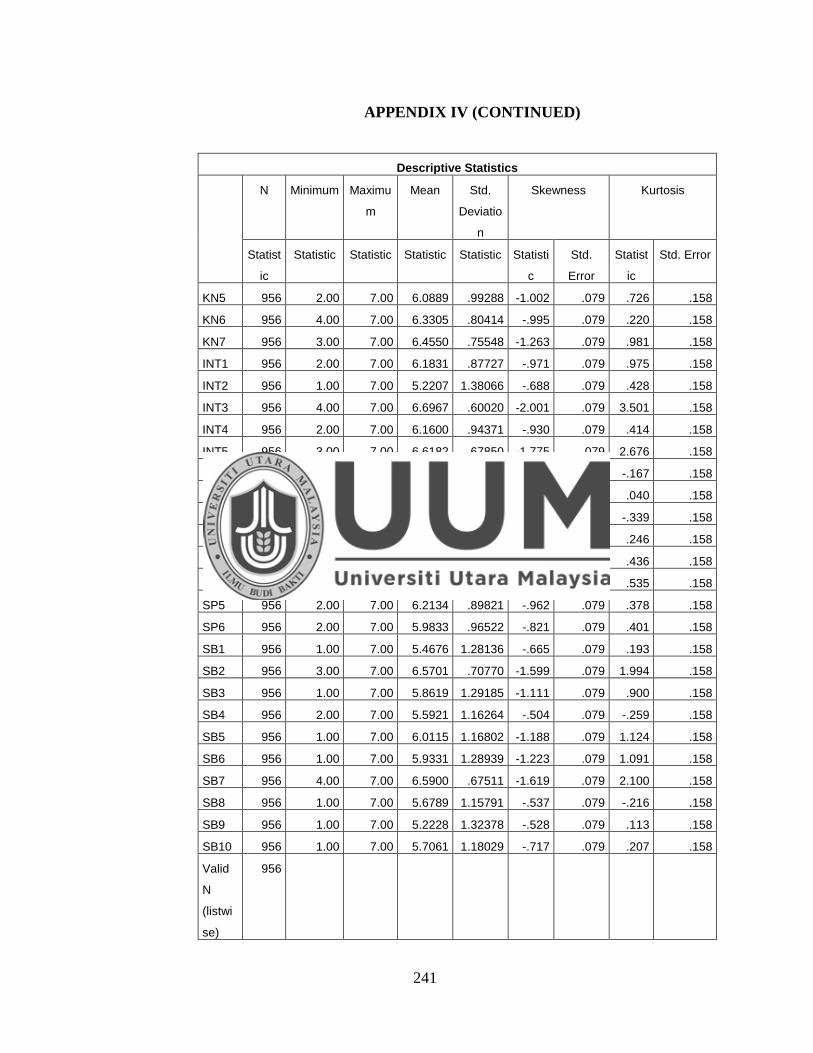
241
APPENDIX IV (CONTINUED)
Descriptive Statistics
N Minimum Maximu
m
Mean Std.
Deviatio
n
Skewness Kurtosis
Statist
ic
Statistic Statistic Statistic Statistic Statisti
c
Std.
Error
Statist
ic
Std. Error
KN5 956 2.00 7.00 6.0889 .99288 -1.002 .079 .726 .158
KN6 956 4.00 7.00 6.3305 .80414 -.995 .079 .220 .158
KN7 956 3.00 7.00 6.4550 .75548 -1.263 .079 .981 .158
INT1 956 2.00 7.00 6.1831 .87727 -.971 .079 .975 .158
INT2 956 1.00 7.00 5.2207 1.38066 -.688 .079 .428 .158
INT3 956 4.00 7.00 6.6967 .60020 -2.001 .079 3.501 .158
INT4 956 2.00 7.00 6.1600 .94371 -.930 .079 .414 .158
INT5 956 3.00 7.00 6.6182 .67850 -1.775 .079 2.676 .158
INT6 956 4.00 7.00 6.3996 .77619 -.975 .079 -.167 .158
INT7 956 4.00 7.00 6.4090 .77059 -1.028 .079 .040 .158
SP1 956 4.00 7.00 6.2416 .83709 -.779 .079 -.339 .158
SP2 956 2.00 7.00 6.1203 .90558 -.824 .079 .246 .158
SP3 956 2.00 7.00 6.0858 .89733 -.805 .079 .436 .158
SP4 956 1.00 7.00 5.8347 1.06731 -.739 .079 .535 .158
SP5 956 2.00 7.00 6.2134 .89821 -.962 .079 .378 .158
SP6 956 2.00 7.00 5.9833 .96522 -.821 .079 .401 .158
SB1 956 1.00 7.00 5.4676 1.28136 -.665 .079 .193 .158
SB2 956 3.00 7.00 6.5701 .70770 -1.599 .079 1.994 .158
SB3 956 1.00 7.00 5.8619 1.29185 -1.111 .079 .900 .158
SB4 956 2.00 7.00 5.5921 1.16264 -.504 .079 -.259 .158
SB5 956 1.00 7.00 6.0115 1.16802 -1.188 .079 1.124 .158
SB6 956 1.00 7.00 5.9331 1.28939 -1.223 .079 1.091 .158
SB7 956 4.00 7.00 6.5900 .67511 -1.619 .079 2.100 .158
SB8 956 1.00 7.00 5.6789 1.15791 -.537 .079 -.216 .158
SB9 956 1.00 7.00 5.2228 1.32378 -.528 .079 .113 .158
SB10 956 1.00 7.00 5.7061 1.18029 -.717 .079 .207 .158
Valid
N
(listwi
se)
956
Related Documents