ACARP Australian Coal Association Research Program The Modelling of Roadway Development to Support Longwall Mining Prepared by: Ernest Baafi, Geoff Gray, Ian Porter, Osvaldo Rojas Simulation Modelling Services Pty Ltd and School of Civil, Mining and Environmental Engineering University of Wollongong C17019 November 2009

Welcome message from author
This document is posted to help you gain knowledge. Please leave a comment to let me know what you think about it! Share it to your friends and learn new things together.
Transcript
ACARP
Australian Coal Association Research
Program
The Modelling of Roadway Development
to Support Longwall Mining
Prepared by:
Ernest Baafi, Geoff Gray, Ian Porter, Osvaldo Rojas
Simulation Modelling Services Pty Ltd and
School of Civil, Mining and Environmental Engineering University of Wollongong
C17019
November 2009

Disclaimer No person, corporation or other organisation (“person”) should rely on the contents of this report and each should obtain independent advice from a qualified person with respect to the information contained in this report. Australian Coal Research Limited, its directors, servants and agents (collectively “ACR”) is not responsible for the consequence of any action taken by any person in reliance upon the information set out in this report, for the accuracy or veracity of any information contained in this report or for any error or omission in this report. ACR expressly disclaims any and all liability and responsibility to any person in respect of anything done or omitted to be done in respect to information set out in this report, any inaccuracy in this report or the consequences of any action by any person in reliance, whether wholly or partly, upon the whole or any part of the contents of the report.
Table of Contents ABSTRACT..............................................................................................................................................1
ACKNOWLEDGEMENTS.......................................................................................................................2
EXECUTIVE SUMMARY ........................................................................................................................3
1.0 INTRODUCTION..............................................................................................................................7 1.1 Overview ................................................................................................................................7 1.2 Objectives ..............................................................................................................................8 1.3 Methodology...........................................................................................................................8 1.4 Project Stages........................................................................................................................8
1.4.1 Appreciation of the Roadway Development Process......................................................9 1.4.2 Collection of Operating Data.........................................................................................10 1.4.3 Development of the Modelling System .........................................................................10 1.4.4 Validation of the Modelling System................................................................................10
2.0 SIMULATION TECHNOLOGY ......................................................................................................11
3.0 THE MODELLING OF ROADWAY DEVELOPMENT OPERATIONS.........................................13 3.1 Roadway Development Process ..........................................................................................13
3.1.1 Miner Cycle ...................................................................................................................14 3.1.2 Shuttle Car Cycle ..........................................................................................................14 3.1.3 Interaction Between Miner and Car Cycles...................................................................14 3.1.4 Support Operations.......................................................................................................15 3.1.5 Face Operations............................................................................................................15 3.1.6 Boot End and Outbye Services.....................................................................................16 3.1.7 Panel Advance..............................................................................................................16 3.1.8 Equipment Availability and Shift Schedules..................................................................16
3.2 Data Requirements ..............................................................................................................16 3.3 Data Analysis .......................................................................................................................17 3.4 Issues with Data Collection ..................................................................................................18 3.5 Reporting and Selection of Key Performance Indicators .....................................................18
4.0 SYSTEM COMPONENTS.............................................................................................................20 4.1 Overall System Design.........................................................................................................20 4.2 Excel Interface .....................................................................................................................20 4.3 The Arena System ...............................................................................................................21 4.4 End User Interaction with the System ..................................................................................21
5.0 USING THE SYSTEM ...................................................................................................................22
6.0 CASE STUDIES.............................................................................................................................24 6.1 Overview ..............................................................................................................................24 6.2 Case Study Mine 1 ...............................................................................................................24
6.2.1 Overview .......................................................................................................................24 6.2.2 Roadway Development Data and Cycle Times.............................................................24 6.2.3 Historical Delay Data.....................................................................................................27 6.2.4 Historical Roadway Development Performance ...........................................................28 6.2.5 Simulation Results ........................................................................................................30
6.3 Case Study Mine 2 ...............................................................................................................34 6.3.1 Overview .......................................................................................................................34 6.3.2 Roadway Development Data and Cycle Times.............................................................35 6.3.3 Historical Delay Data.....................................................................................................37 6.3.4 Historical Roadway Development Performance ...........................................................38 6.3.5 Simulation Results ........................................................................................................40
7.0 DATA RELATED ISSUES .............................................................................................................45
8.0 TECHNOLOGY TRANSFER.........................................................................................................46
APPENDIX A .........................................................................................................................................47
APPENDIX B .........................................................................................................................................54
Page | 1
ABSTRACT The practice of longwall mining is potentially an efficient and cost effective means of extracting coal from underground seams, however, for production targets to be achieved not only must the longwall perform as expected but roadway development must be kept ahead of the longwall advance. The evaluation of development options is a challenging exercise due to the interactions between mining, tramming and clearance operations. In particular, the high levels of variability and uncertainty in operations make it difficult to assess how a particular configuration may perform. A modelling system, RoadSIM, based on the ARENA simulation tool has been produced to assist in the analysis of the roadway development process. The RoadSIM system provides a means for assessing the operational capacity of roadway development practices at a particular coal mine. The simulation model provides a ‘what if’ tool to allow a range of equipment, configuration and operating practices to be assessed in terms of achievable advance rates and equipment utilisation. Output from the simulation is in the form of a dynamic visualisation as well as summary reports and detailed logs of operations over time.
Page | 2
Simulation Modelling Services Pty Ltd School of Civil, Mining & Environmental Engineering, University of Wollongong
ACKNOWLEDGEMENTS The authors would like to thank Gary Gibson of Gary Gibson & Associates, Frank Hendricks of BHP Billiton - Illawarra Coal, Richard Porteous of Xstrata Coal and the following members of the ACARP Roadway Development Task Group for their valuable input during the model development and also making mine operational data available for RoadSIM model configuration and validation:
• Guy Mitchell, BMA • Bob Miller, Centennial Coal • Robert Gordon, BHP Billiton - Illawarra Coal • Jim Sandford, Xstrata Coal • Roger Wischusen, ACARP
Special thanks to Associate Professor Michael Boyd of the University of Wollongong for assisting with the statistical analysis of mine delay data.
Page | 3
Simulation Modelling Services Pty Ltd School of Civil, Mining & Environmental Engineering, University of Wollongong
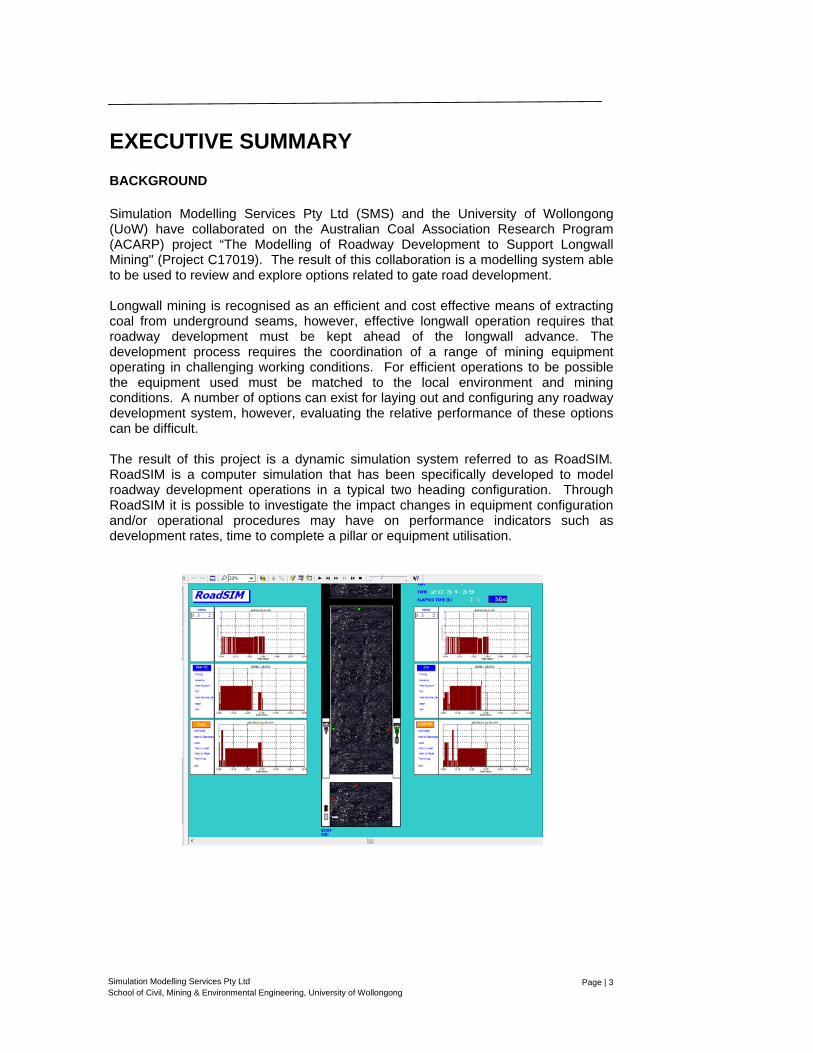
EXECUTIVE SUMMARY BACKGROUND Simulation Modelling Services Pty Ltd (SMS) and the University of Wollongong (UoW) have collaborated on the Australian Coal Association Research Program (ACARP) project “The Modelling of Roadway Development to Support Longwall Mining" (Project C17019). The result of this collaboration is a modelling system able to be used to review and explore options related to gate road development. Longwall mining is recognised as an efficient and cost effective means of extracting coal from underground seams, however, effective longwall operation requires that roadway development must be kept ahead of the longwall advance. The development process requires the coordination of a range of mining equipment operating in challenging working conditions. For efficient operations to be possible the equipment used must be matched to the local environment and mining conditions. A number of options can exist for laying out and configuring any roadway development system, however, evaluating the relative performance of these options can be difficult. The result of this project is a dynamic simulation system referred to as RoadSIM. RoadSIM is a computer simulation that has been specifically developed to model roadway development operations in a typical two heading configuration. Through RoadSIM it is possible to investigate the impact changes in equipment configuration and/or operational procedures may have on performance indicators such as development rates, time to complete a pillar or equipment utilisation.
Executive Summary
Page | 4
Simulation Modelling Services Pty Ltd School of Civil, Mining & Environmental Engineering, University of Wollongong
PROJECT OBJECTIVE The project objective was to provide the coal mining industry with a tool that could assist in improving the overall productivity of roadway development. In particular, the project was to develop a modelling system capable of being used to assess the impact on development rates of various roadway development options. The system was intended to allow professionals, that may have only a general knowledge of simulation, to be able to build, customise and use simulation models of a range of roadway development processes. These simulation models were to be capable of being used to analyse current roadway development operations as well as being able to assess the impact on performance of potential changes in procedures and/or equipment. TECHNOLOGY EMPLOYED To achieve the desired objectives a computer simulation modelling system has been developed that utilises the technique of animated discrete event simulation. Discrete event simulation provides a proven technique to study the interaction between components of a complex system. It is especially well suited to evaluate the performance of roadway development operations. In addition, the simulation technology has the ability to explicitly allow for the randomness/variability inherent in the mining operation. For example, modelling can consider variability in shuttle car tramming times, loading and discharging times, the time to complete support operations and process availability. The system has been developed using "industry standard" simulation software (Arena) so that it may be expanded in scope and detail if required. The computer models built using RoadSIM can be used to analyse current roadway development operations as well as assess the impact on performance of potential changes in procedures and/or equipment. PROJECT STAGES The development of the modelling system involved a number of stages. These included:
• appreciation of the roadway development process; • collection of operating data; • development of a modelling system; • validation of the modelling system; and • “what if” analysis.
During the course of the project SMS and UoW worked with industry personnel to gain an understanding of the development process in different environments. Two mine sites provided additional data to assist in both configuring the modelling system and to provide a means of validating model output against recent operations.
Executive Summary
Page | 5
Simulation Modelling Services Pty Ltd School of Civil, Mining & Environmental Engineering, University of Wollongong
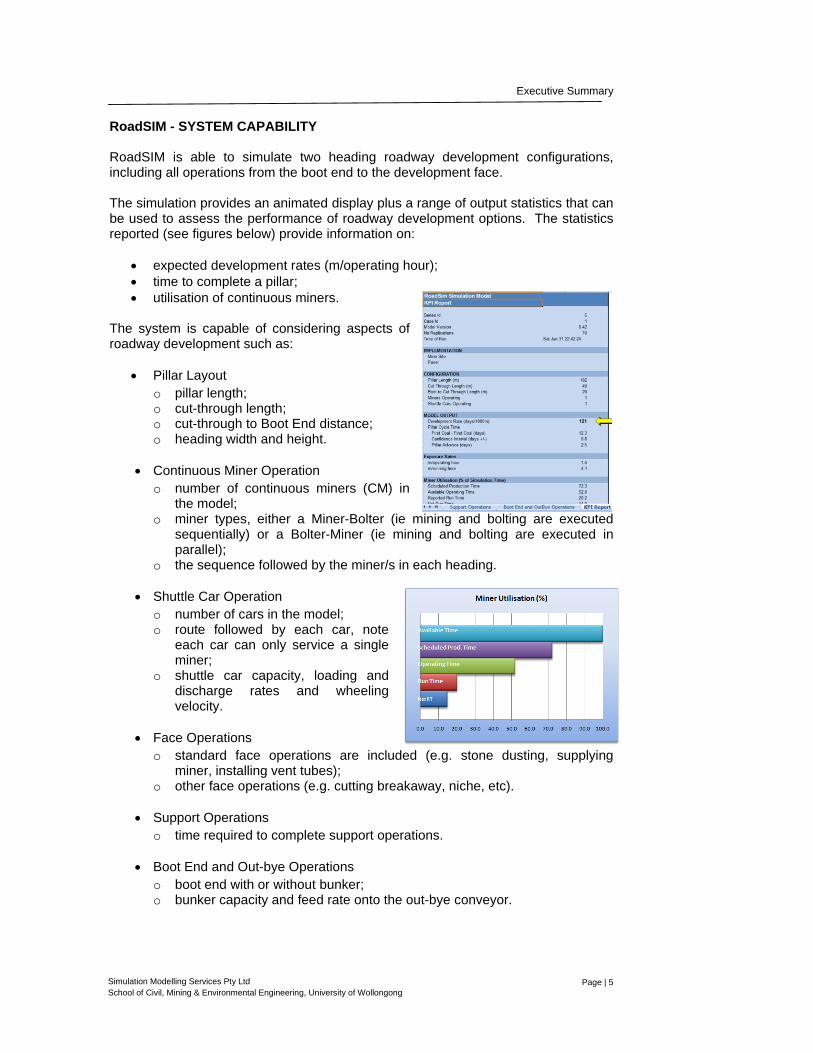
RoadSIM - SYSTEM CAPABILITY RoadSIM is able to simulate two heading roadway development configurations, including all operations from the boot end to the development face. The simulation provides an animated display plus a range of output statistics that can be used to assess the performance of roadway development options. The statistics reported (see figures below) provide information on:
• expected development rates (m/operating hour); • time to complete a pillar; • utilisation of continuous miners.
The system is capable of considering aspects of roadway development such as:
• Pillar Layout o pillar length; o cut-through length; o cut-through to Boot End distance; o heading width and height.
• Continuous Miner Operation
o number of continuous miners (CM) in the model;
o miner types, either a Miner-Bolter (ie mining and bolting are executed sequentially) or a Bolter-Miner (ie mining and bolting are executed in parallel);
o the sequence followed by the miner/s in each heading.
• Shuttle Car Operation o number of cars in the model; o route followed by each car, note
each car can only service a single miner;
o shuttle car capacity, loading and discharge rates and wheeling velocity.
• Face Operations
o standard face operations are included (e.g. stone dusting, supplying miner, installing vent tubes);
o other face operations (e.g. cutting breakaway, niche, etc).
• Support Operations o time required to complete support operations.
• Boot End and Out-bye Operations
o boot end with or without bunker; o bunker capacity and feed rate onto the out-bye conveyor.
Executive Summary
Page | 6
Simulation Modelling Services Pty Ltd School of Civil, Mining & Environmental Engineering, University of Wollongong
• Availability
o patterns of weekly operating shifts and planned maintenance; o unplanned delays including duration and mean time between failure.
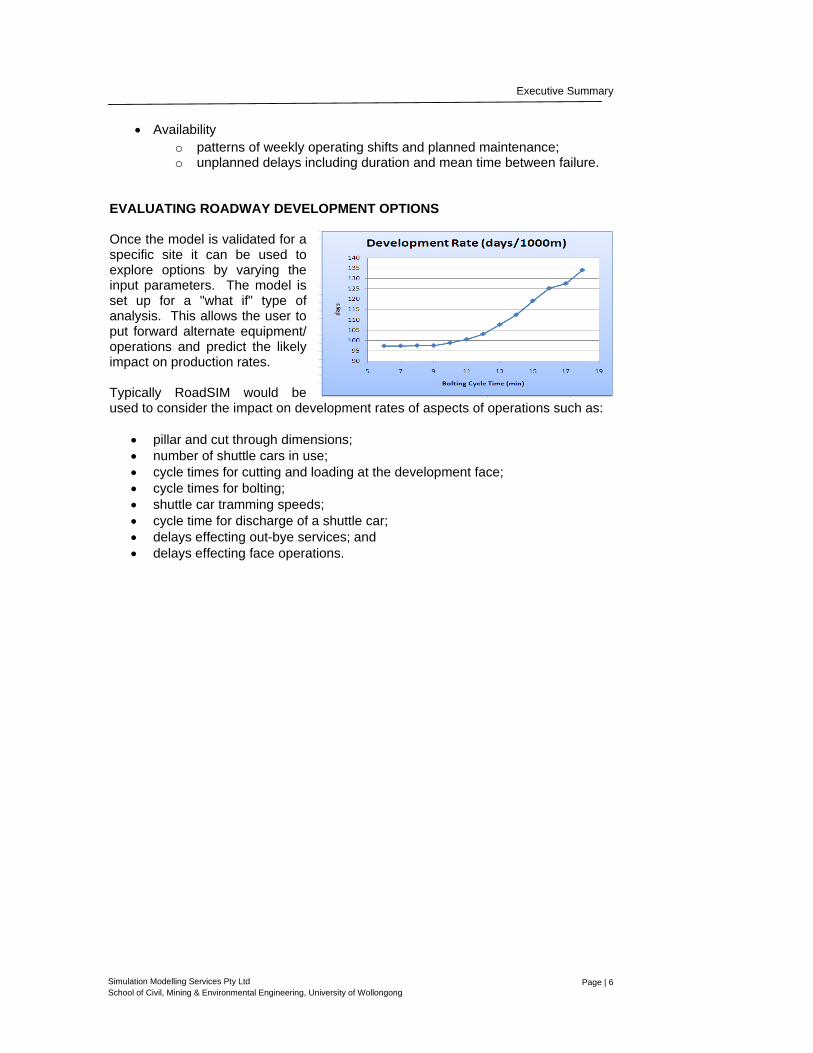
EVALUATING ROADWAY DEVELOPMENT OPTIONS Once the model is validated for a specific site it can be used to explore options by varying the input parameters. The model is set up for a "what if" type of analysis. This allows the user to put forward alternate equipment/ operations and predict the likely impact on production rates. Typically RoadSIM would be used to consider the impact on development rates of aspects of operations such as:
• pillar and cut through dimensions; • number of shuttle cars in use; • cycle times for cutting and loading at the development face; • cycle times for bolting; • shuttle car tramming speeds; • cycle time for discharge of a shuttle car; • delays effecting out-bye services; and • delays effecting face operations.
Page | 7
Simulation Modelling Services Pty Ltd School of Civil, Mining & Environmental Engineering, University of Wollongong
1.0 INTRODUCTION 1.1 Overview Longwall mining is an efficient and cost effective means of extracting coal from underground seams, however, effective longwall operation requires that roadway development must be kept ahead of the longwall advance. The development challenge is how best to achieve the required development rates in a cost effective manner. The development process requires the coordination of a range of mining equipment operating in difficult working conditions. For efficient operations to be possible the equipment used must be matched to the local environment and mining conditions. A number of options can exist for laying out and configuring any roadway development system, however, evaluating the likely relative performance of these options can be difficult. Dynamic system simulation provides a proven technique to study the interaction between components of a complex system. It is especially well suited to evaluate the performance of roadway development operations as dynamic system simulation is one of the few analysis techniques that has the ability to explicitly allow for the randomness/variability inherent in any mining system. Examples of this variability may include:
• shuttle car tramming time; • loading and discharging time; • time to complete support operations; and • availability of equipment.
Simulation Modelling Services Pty Ltd (SMS) and the University of Wollongong (UOW) have collaborated on the Australian Coal Association Research Program (ACARP) project “The modelling of roadway development to support longwall mining”. The result of this collaboration is a modelling system (RoadSIM) able to be used to review and explore options related to gate road development. The RoadSIM modelling system is a computer simulation system developed specifically to model roadway development operations in a typical two heading configuration. RoadSIM as an analysis tool provides a means of investigating the likely impact of changes in equipment configuration and/or operational procedures on performance indicators such as:
• development rates; • time to complete a pillar; and • equipment utilisation.
This document describes the modelling system developed, its validation against existing operations and its potential for use within the industry.
Introduction
Page | 8
Simulation Modelling Services Pty Ltd School of Civil, Mining & Environmental Engineering, University of Wollongong
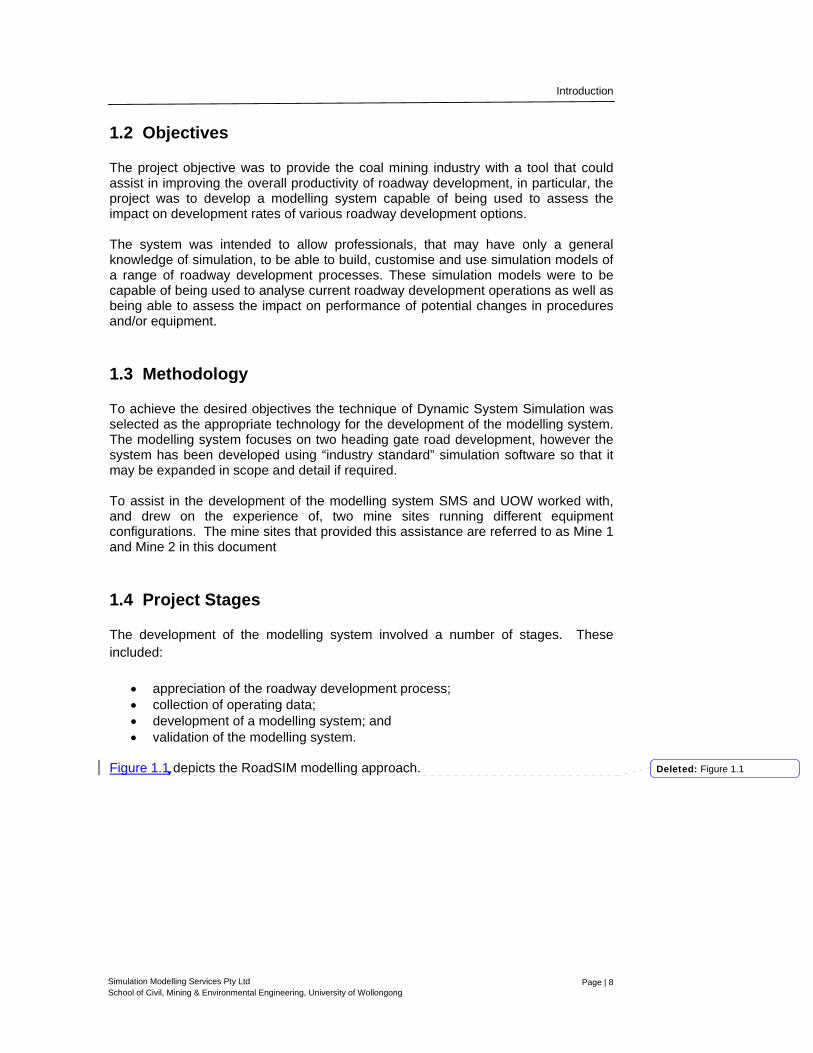
1.2 Objectives The project objective was to provide the coal mining industry with a tool that could assist in improving the overall productivity of roadway development, in particular, the project was to develop a modelling system capable of being used to assess the impact on development rates of various roadway development options. The system was intended to allow professionals, that may have only a general knowledge of simulation, to be able to build, customise and use simulation models of a range of roadway development processes. These simulation models were to be capable of being used to analyse current roadway development operations as well as being able to assess the impact on performance of potential changes in procedures and/or equipment. 1.3 Methodology To achieve the desired objectives the technique of Dynamic System Simulation was selected as the appropriate technology for the development of the modelling system. The modelling system focuses on two heading gate road development, however the system has been developed using “industry standard” simulation software so that it may be expanded in scope and detail if required. To assist in the development of the modelling system SMS and UOW worked with, and drew on the experience of, two mine sites running different equipment configurations. The mine sites that provided this assistance are referred to as Mine 1 and Mine 2 in this document 1.4 Project Stages The development of the modelling system involved a number of stages. These included:
• appreciation of the roadway development process; • collection of operating data; • development of a modelling system; and • validation of the modelling system.
Figure 1.1 depicts the RoadSIM modelling approach.
Deleted: Figure 1.1
Introduction
Page | 9
Simulation Modelling Services Pty Ltd School of Civil, Mining & Environmental Engineering, University of Wollongong
Collect and analyse
historical performance
Map Roadway
Development Process
Design & Build
Roadsim Tool Kit
Build Case Study
Models
Deliver Roadsim &
Present Results
Refine Tool kit
and Models
Collect Operating
data
Acceptable?
Validate Case Study
Models
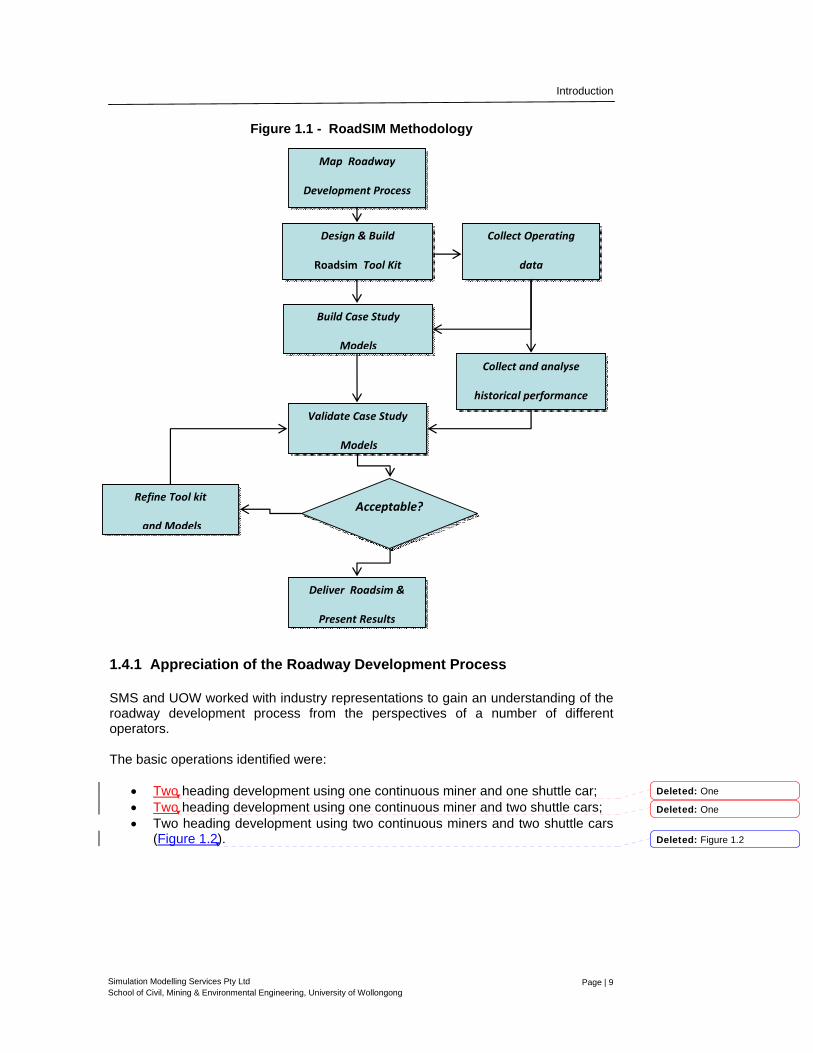
Figure 1.1 - RoadSIM Methodology
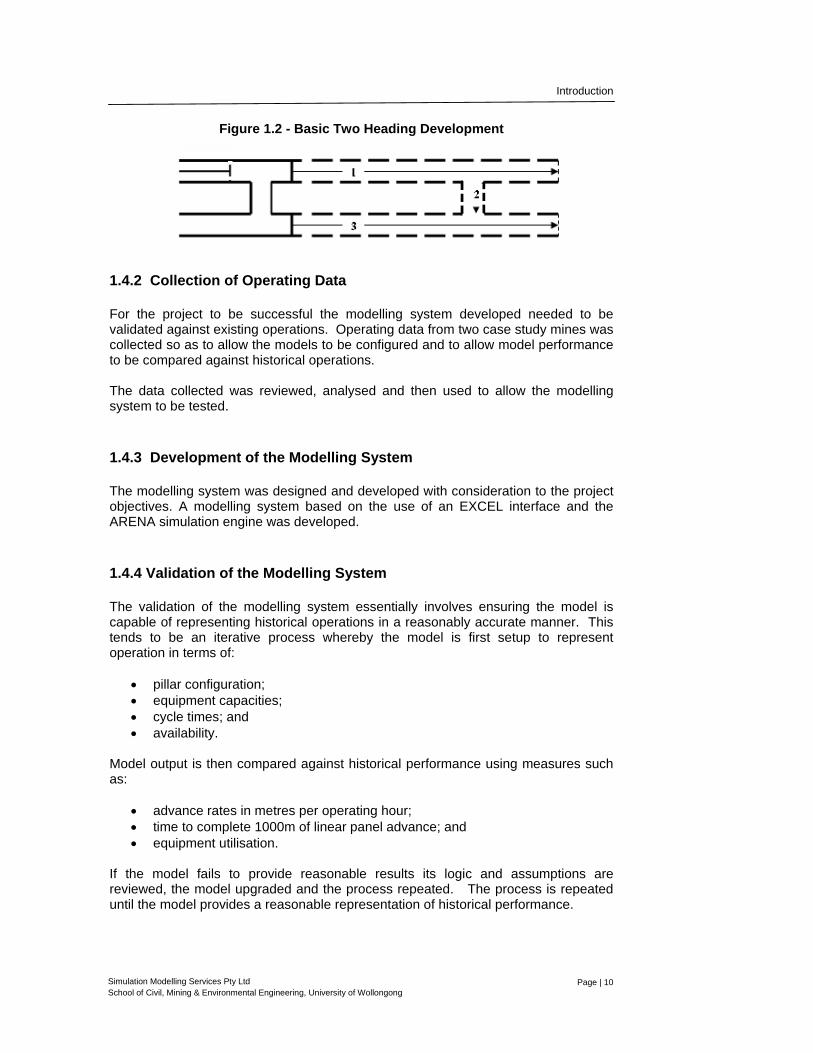
1.4.1 Appreciation of the Roadway Development Process SMS and UOW worked with industry representations to gain an understanding of the roadway development process from the perspectives of a number of different operators. The basic operations identified were:
• Two heading development using one continuous miner and one shuttle car; • Two heading development using one continuous miner and two shuttle cars; • Two heading development using two continuous miners and two shuttle cars
(Figure 1.2).
Deleted: One
Deleted: One
Deleted: Figure 1.2
Introduction
Page | 10
Simulation Modelling Services Pty Ltd School of Civil, Mining & Environmental Engineering, University of Wollongong
Figure 1.2 - Basic Two Heading Development
1.4.2 Collection of Operating Data For the project to be successful the modelling system developed needed to be validated against existing operations. Operating data from two case study mines was collected so as to allow the models to be configured and to allow model performance to be compared against historical operations. The data collected was reviewed, analysed and then used to allow the modelling system to be tested. 1.4.3 Development of the Modelling System The modelling system was designed and developed with consideration to the project objectives. A modelling system based on the use of an EXCEL interface and the ARENA simulation engine was developed. 1.4.4 Validation of the Modelling System The validation of the modelling system essentially involves ensuring the model is capable of representing historical operations in a reasonably accurate manner. This tends to be an iterative process whereby the model is first setup to represent operation in terms of:
• pillar configuration; • equipment capacities; • cycle times; and • availability.
Model output is then compared against historical performance using measures such as:
• advance rates in metres per operating hour; • time to complete 1000m of linear panel advance; and • equipment utilisation.
If the model fails to provide reasonable results its logic and assumptions are reviewed, the model upgraded and the process repeated. The process is repeated until the model provides a reasonable representation of historical performance.
Page | 11
Simulation Modelling Services Pty Ltd School of Civil, Mining & Environmental Engineering, University of Wollongong
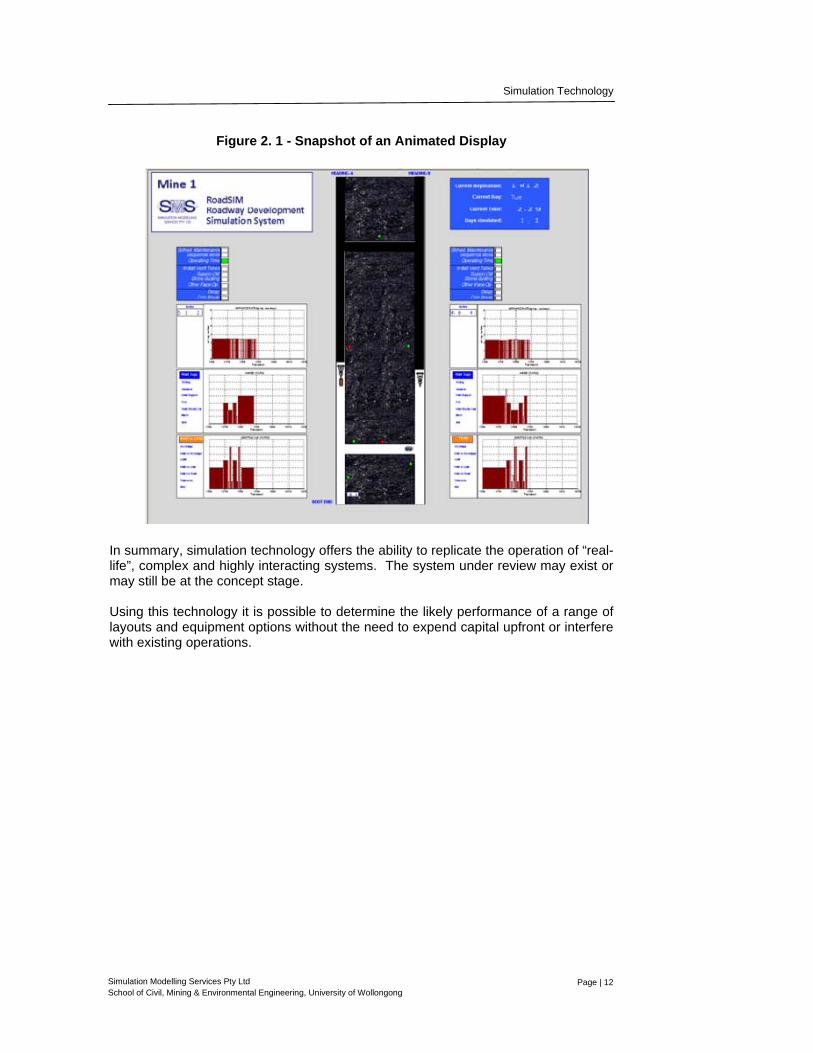
2.0 SIMULATION TECHNOLOGY The RoadSIM computer simulation system is based on the application of dynamic system simulation technology, also known as discrete event simulation, Monte Carlo simulation, simulation modelling or simply dynamic simulation, it is a well established analytical technique. The technology is based around a computer model which progressively updates the state of the system over time based on the logical rules and mathematical relations inbuilt in the system itself. Once developed the model can be used to simulate the operation of a system - either existing or proposed - over a time period of interest. The simulation model will respond to given inputs much as would be expected in the real world. The model can be used to "experiment", testing various ideas and options to get an understanding of how the real system may behave given changes to the system such as alternate layouts, different operating strategies and various other potential system modifications. Two characteristics differentiate simulation modelling from other types of modelling. The first is the inclusion of the time element. The model will pass through many different states during a period of simulated time, reflecting the changing state of the real-life system over time. As the passage of time is modelled explicitly, the model can be used to monitor the likely state of the system and be used to collect realistic performance statistics. The second characteristic is the inclusion of variability. A simulation model will include the randomness/variability which characterises any real-life system. Examples of this randomness include the time to load a shuttle car, time to discharge coal at the boot end, time to place supports, timing of breakdown and delays and the time to repair equipment. The impact of variability on the performance of a system can be quite significant, typically it will result in non-achievement of theoretical capacity. The option of realistic animation greatly aids the understanding of how the system will function. It allows the visualisation of the dynamics of the system, facilitating study of the interactions between system components in a manner which is simply not possible by manual analysis. It can also assist in the identification of potential problem areas which may not be immediately obvious from the summary statistics generated by the simulation model (Figure 2. 1). In addition, a realistic animation can assist in communicating to various stakeholders what the implications are of changing roadway development equipment and configurations.
Deleted: Figure 2. 1
Simulation Technology
Page | 12
Simulation Modelling Services Pty Ltd School of Civil, Mining & Environmental Engineering, University of Wollongong
Figure 2. 1 - Snapshot of an Animated Display
In summary, simulation technology offers the ability to replicate the operation of “real-life”, complex and highly interacting systems. The system under review may exist or may still be at the concept stage. Using this technology it is possible to determine the likely performance of a range of layouts and equipment options without the need to expend capital upfront or interfere with existing operations.
Page | 13
Simulation Modelling Services Pty Ltd School of Civil, Mining & Environmental Engineering, University of Wollongong
3.0 THE MODELLING OF ROADWAY DEVELOPMENT OPERATIONS RoadSIM has been developed to simulate the typical activities of a 2 heading gate road development operation from the face to the boot end. These activities include the operation of the continuous miner/s, shuttle car/s and outbye services and their interactions. One of the key advantages of RoadSIM is that it can be used as a “what if” analysis tool to assess the relative performance of possible changes to current roadway development operations and/or equipment. RoadSIM has the functionality to record a range of data and statistics on the status and conditions of each part of the system throughout the simulation process. This information is used to distil KPIs to assess the performance of the roadway development configuration being simulated. Using the data entry workbook the user can configure RoadSIM to operate with:
• 1 Continuous miner and 1 shuttle car; • 1 Continuous miner and 2 shuttle cars; or • 2 Continuous miners and 2 shuttle cars.
For each configuration RoadSIM can be used to look at a range of different equipment capacities and/or availabilities. 3.1 Roadway Development Process Initially, information on the roadway development process was collected through numerous discussions with industry experts as well as site visits to underground roadway development operations. The information was then synthesised into a process map for each of the two main activity cycles that take place during roadway development: the miner cycle and the shuttle car cycle. These process maps were then used to assist in developing the logic and rules that form the core of the simulation system. A description of the miner and car cycles is presented in the following sections.
The Modelling of Roadway Development Operations
Page | 14
Simulation Modelling Services Pty Ltd School of Civil, Mining & Environmental Engineering, University of Wollongong
3.1.1 Miner Cycle The Miner cycle comprises of a series of steps or activities that are completed in a predefined sequence. Differences in the Miner cycle were identified when the continuous miner operating is a bolter-miner or when it is a miner-bolter. Bolter-miners have the ability to cut coal in parallel to installing roof and rib bolts for support. Miner-bolters are constrained to complete the cutting and loading of coal before they can start support operations. The miner-bolter cycle considered in the model includes the following steps:
1. Miner waits for car to arrive at face; 2. Miner cuts coal and loads car; 3. Steps 1 and 2 can be repeated if more than one car is loaded for every miner
advance; 4. Miner initiates and completes support operations; 5. Miner advances and sets up to re-initiate cycle.
The bolter-miner cycle considered in the model includes the following steps:
1. Miner initiates supports operations; 2. Miner waits for car to arrive at face; 3. Miner cuts coal and loads car; 4. Steps 2 and 3 can be repeated if more than one car is loaded for every miner
advance; 5. Miner completes support operations; 6. Miner advances and sets up to re-initiate cycle.
3.1.2 Shuttle Car Cycle The shuttle car cycle considered in the model includes the following steps:
1. Car waits for miner to start cutting coal at face; 2. Car loads coal at the face; 3. Car trams to boot end; 4. Car discharges at boot end; 5. Car trams to face and re-initiates cycle.
Car tramming times are determined by car characteristics such as maximum speed, acceleration, deceleration and possible traffic interactions when more than one car is operating in the same area. 3.1.3 Interaction Between Miner and Car Cycles The miner and car cycles do not operate independently. They synchronise every time coal is cut and loaded on a car. The model assumes that a miner would not normally be able to start cutting coal unless a car is ready to be loaded at the face. This ignores the common practice of cutting small quantities of coal and dumping it
The Modelling of Roadway Development Operations
Page | 15
Simulation Modelling Services Pty Ltd School of Civil, Mining & Environmental Engineering, University of Wollongong
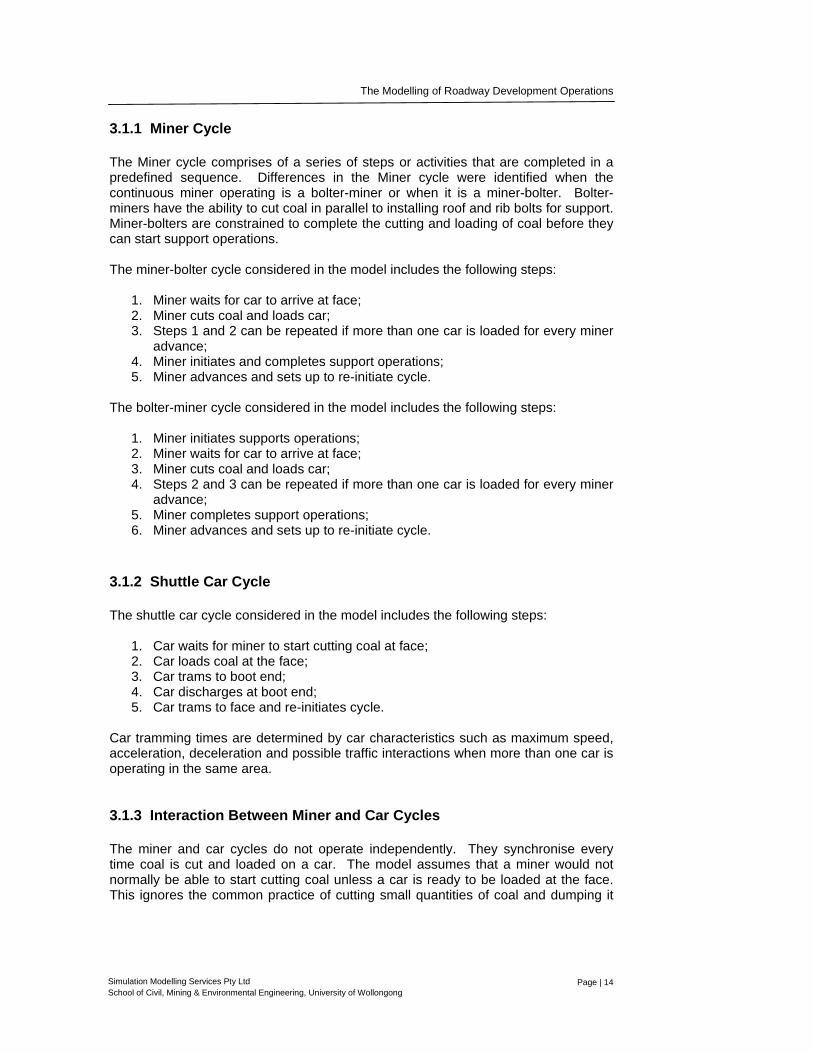
on the floor for deferred loading on a car. Similarly, a car that is positioned at the face cannot proceed with its activity cycle until the miner is ready to start cutting and loading the car. Figure 3.1 illustrates each cycle and how they interrelate.
Figure 3.1 - Car and Miner Activity Cycles
The interaction between the miner and car cycles can result in both cycles having an impact on the development rates achievable with a particular miner-car configuration. Typically, when the miner is close to the boot end the miner cycle time determines the development rate achievable. As the miner advances away from the boot end, the potential exists for the shuttle car cycle time to become the constraint on development. 3.1.4 Support Operations Support operations are modelled as a single activity that requires a predefined amount of time to complete. The duration of support operations depends on the roof and rib bolting density required for the particular area of roadway development being simulated. If the miner selected in the simulation is a bolter-miner then support operations are initiated at the beginning of the miner cycle and they are allowed to progress in parallel with the cutting of coal. If the miner selected in the simulation is a miner-bolter then support operations can only be performed after the cutting of coal is completed. 3.1.5 Face Operations Face operations are activities other than those included in the miner and car cycles that take place during roadway development and have an impact on roadway drivage rates. The model includes as standard face operations the following:
• installation of vent tubes; • supplying the miner with consumables; • stone dusting.
Face operations are modelled as delays (scheduled by time or distance cut, ie not random or unforseen) in the miner cycle.
The Modelling of Roadway Development Operations
Page | 16
Simulation Modelling Services Pty Ltd School of Civil, Mining & Environmental Engineering, University of Wollongong
The model has the flexibility to include a series of custom defined face operations to better reflect the activities of specific roadway development operations. These may include the cutting of cable niches, GEBs, breakaways, holing through, etc. 3.1.6 Boot End and Outbye Services Cars approaching the Boot End can discharge either into a bunker of given capacity or directly on the outbye conveyor. Both options are included in the model. When discharging into a bunker delays may occur whenever the bunker reaches its full capacity. 3.1.7 Panel Advance The model includes the time required to complete a panel advance or belt extension each time a pillar has been fully developed. During a panel advance no other roadway development activity takes place. 3.1.8 Equipment Availability and Shift Schedules Production and maintenance shift schedules are customisable. Roadway development activities take place only on production shifts. The model also takes into account equipment availability by generating a pattern of random breakdown events that create delays to the usual operations of the miner, shuttle cars and the boot end. Delay properties such as mean time between failure (MTBF) and mean time to repair (MTR) should be selected to reflect either historical performance of roadway development operations or best estimates of likely future operations. 3.2 Data Requirements An important aspect of configuring a simulation model able to adequately replicate a real roadway development operation is to provide the model with accurate data collected from the process. The type of data required to run RoadSIM can be summarised in three broad groups:
1. process parameters and cycle time data; 2. historical delay data; and 3. historical performance data (for model validation).
Process parameters and cycle time data include:
• pillar layout data (pillar length, cut-through length, heading width, etc.); • continuous miner and shuttle car configuration data (miner type, car loading
and discharge rates, car maximum speed, etc.);
The Modelling of Roadway Development Operations
Page | 17
Simulation Modelling Services Pty Ltd School of Civil, Mining & Environmental Engineering, University of Wollongong
• continuous miner sequence data (cutting sequence followed by the miner/s
along the pillar); • support operation data (time to complete support based on required bolting
density); • shift pattern data (including production, maintenance and scheduled
downtime). Historical delay data is used to extract key statistical indicators on the frequency and duration of delays so that they can be replicated in the simulation model using Arena’s random number generation capabilities. Historical performance data such as development rates, average time to complete a pillar and metres cut per shift are used to validate the results of the model. These data are not required for running the model, but are used to test that the model setup is capable of generating results which are a reasonable representation of past operations. In Section 6 two case studies are presented that illustrate the use of historical performance data for validation. 3.3 Data Analysis Equipment availability information is extracted from historical delay data. Most mining operations have a system in place to record planned and unplanned process delays. Once collected, historical delay data can be analysed to extract statistics including:
• Mean Time Between Failure (MTBF); • probability distribution for the recorded time between failure; • Mean Time To Repair (MTTR); • probability distribution for the recorded time to repair.
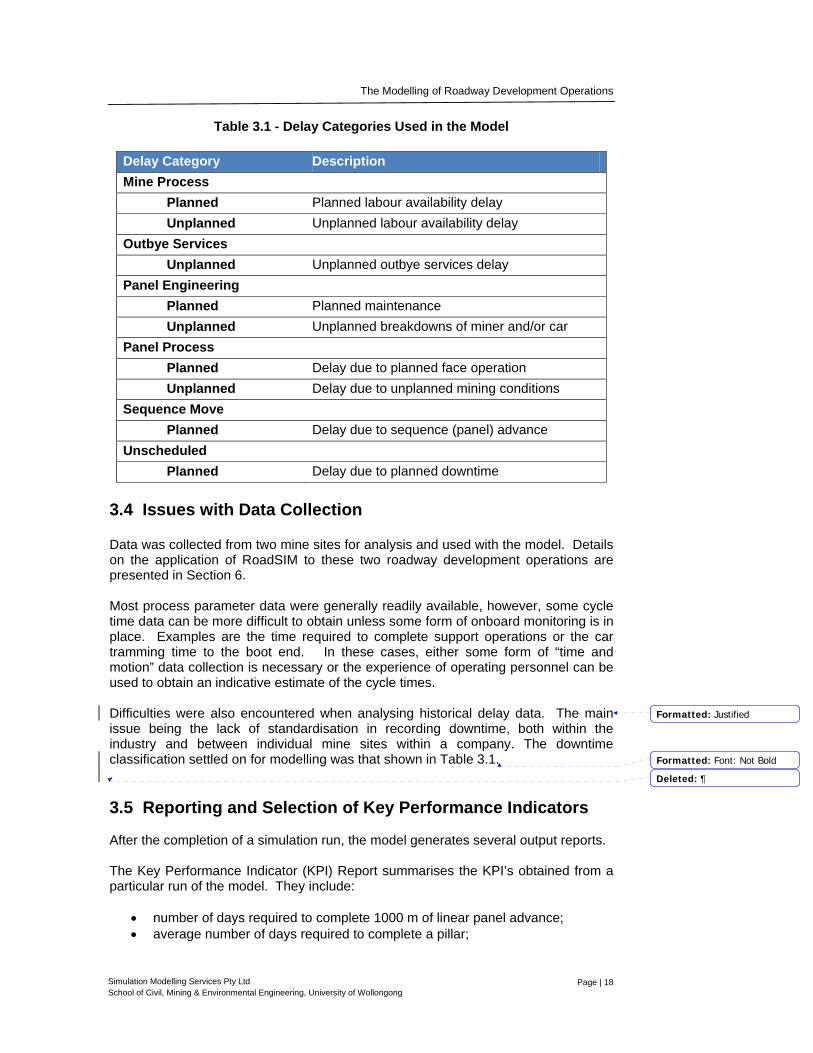
The above statistical information is then used in the model to replicate the random behaviour of unplanned delays. Each coal mine usually has a different way of categorising delay data, so in order to offer a level of standardisation of the reporting of delays in the model, a set of delay categories were defined. The delay categories used in RoadSIM including their definitions are listed in Table 3.1.
The Modelling of Roadway Development Operations
Page | 18
Simulation Modelling Services Pty Ltd School of Civil, Mining & Environmental Engineering, University of Wollongong
Table 3.1 - Delay Categories Used in the Model
Delay Category Description Mine Process
Planned Planned labour availability delay Unplanned Unplanned labour availability delay
Outbye Services Unplanned Unplanned outbye services delay
Panel Engineering Planned Planned maintenance Unplanned Unplanned breakdowns of miner and/or car
Panel Process Planned Delay due to planned face operation Unplanned Delay due to unplanned mining conditions
Sequence Move Planned Delay due to sequence (panel) advance
Unscheduled Planned Delay due to planned downtime
3.4 Issues with Data Collection Data was collected from two mine sites for analysis and used with the model. Details on the application of RoadSIM to these two roadway development operations are presented in Section 6. Most process parameter data were generally readily available, however, some cycle time data can be more difficult to obtain unless some form of onboard monitoring is in place. Examples are the time required to complete support operations or the car tramming time to the boot end. In these cases, either some form of “time and motion” data collection is necessary or the experience of operating personnel can be used to obtain an indicative estimate of the cycle times. Difficulties were also encountered when analysing historical delay data. The main issue being the lack of standardisation in recording downtime, both within the industry and between individual mine sites within a company. The downtime classification settled on for modelling was that shown in Table 3.1. . 3.5 Reporting and Selection of Key Performance Indicators After the completion of a simulation run, the model generates several output reports. The Key Performance Indicator (KPI) Report summarises the KPI’s obtained from a particular run of the model. They include:
• number of days required to complete 1000 m of linear panel advance; • average number of days required to complete a pillar;
Formatted: Justified
Formatted: Font: Not Bold
Deleted: 
The Modelling of Roadway Development Operations
Page | 19
Simulation Modelling Services Pty Ltd School of Civil, Mining & Environmental Engineering, University of Wollongong
• development rates (metres per operating hour or run hour).
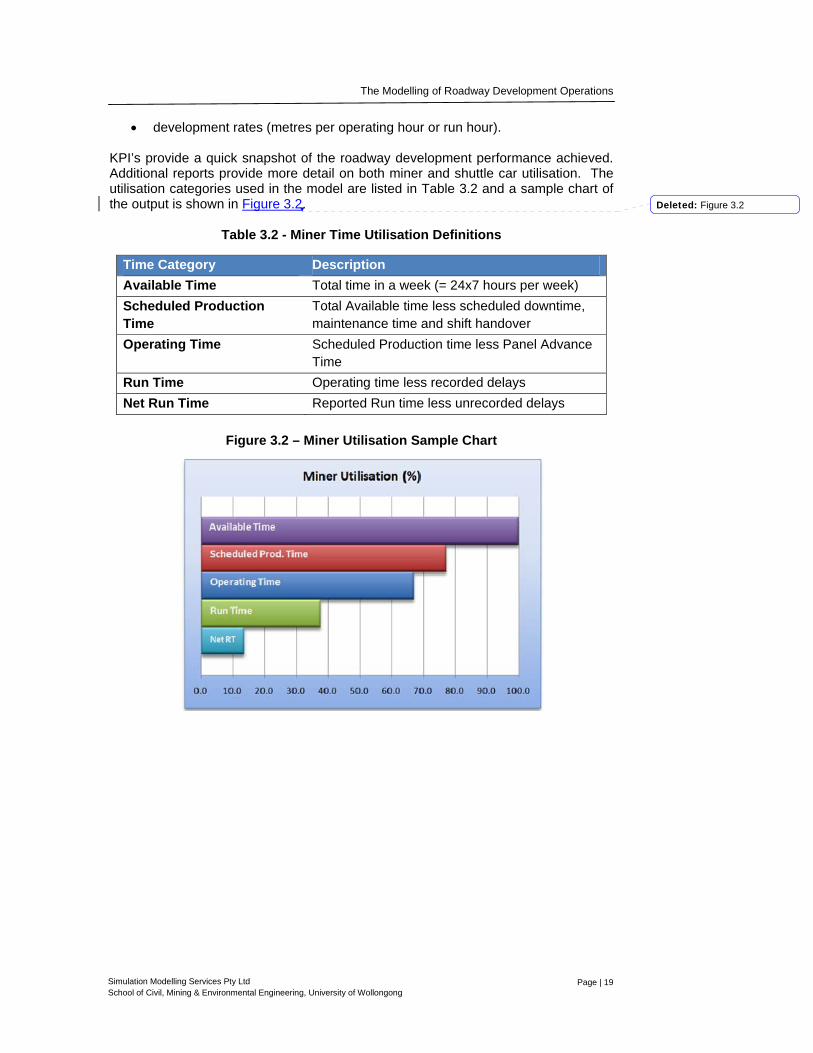
KPI’s provide a quick snapshot of the roadway development performance achieved. Additional reports provide more detail on both miner and shuttle car utilisation. The utilisation categories used in the model are listed in Table 3.2 and a sample chart of the output is shown in Figure 3.2.
Table 3.2 - Miner Time Utilisation Definitions
Time Category Description Available Time Total time in a week (= 24x7 hours per week) Scheduled Production Time
Total Available time less scheduled downtime, maintenance time and shift handover
Operating Time Scheduled Production time less Panel Advance Time
Run Time Operating time less recorded delays Net Run Time Reported Run time less unrecorded delays
Figure 3.2 – Miner Utilisation Sample Chart
Deleted: Figure 3.2
Page | 20
Simulation Modelling Services Pty Ltd School of Civil, Mining & Environmental Engineering, University of Wollongong
Other ModelInput
ARENA
Case Run Data
Model Reports and
Log Files
EXCEL
Input Sheets
Performance Report
Custom Reports
S1C1S1C1S1C1
Project Workbook RasAzZawrTrafficStudy
Logic
Animation
Model
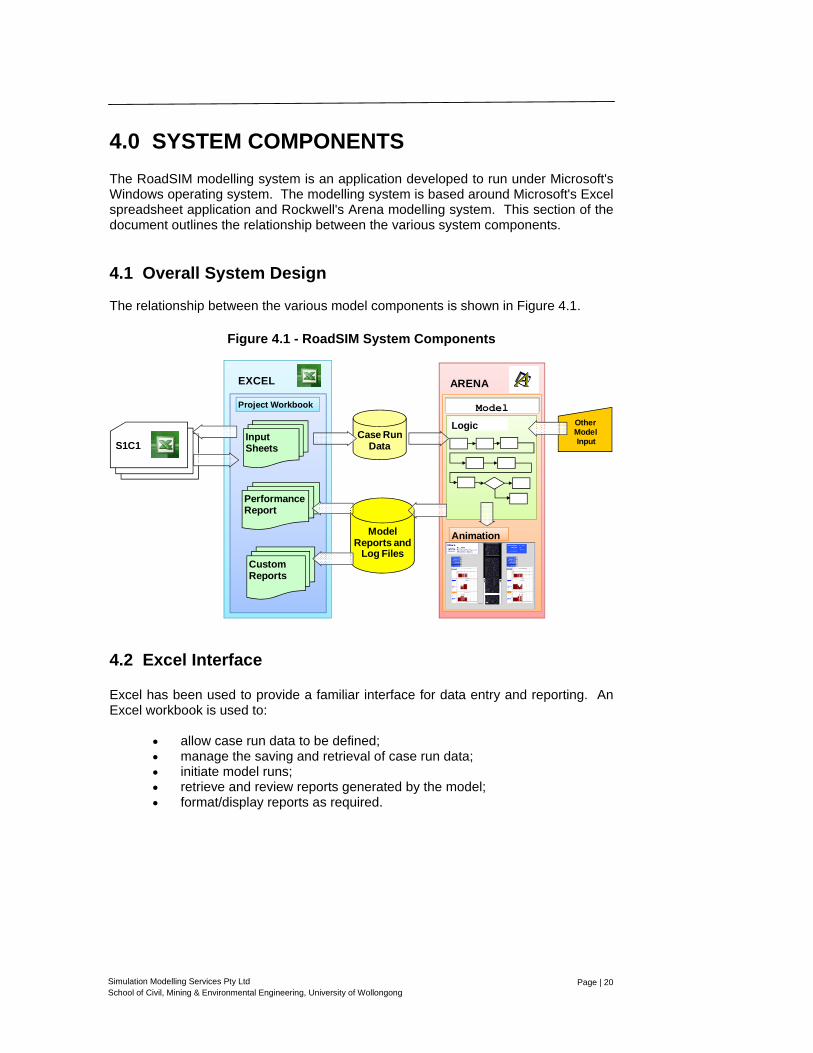
4.0 SYSTEM COMPONENTS The RoadSIM modelling system is an application developed to run under Microsoft's Windows operating system. The modelling system is based around Microsoft's Excel spreadsheet application and Rockwell's Arena modelling system. This section of the document outlines the relationship between the various system components. 4.1 Overall System Design The relationship between the various model components is shown in Figure 4.1.
Figure 4.1 - RoadSIM System Components 4.2 Excel Interface Excel has been used to provide a familiar interface for data entry and reporting. An Excel workbook is used to:
• allow case run data to be defined; • manage the saving and retrieval of case run data; • initiate model runs; • retrieve and review reports generated by the model; • format/display reports as required.
System Components
Page | 21
Simulation Modelling Services Pty Ltd School of Civil, Mining & Environmental Engineering, University of Wollongong
4.3 The Arena System The Arena model contains the detailed logic defining the roadway development operations. The Arena simulation system is used to:
• mimic operations over time; • add appropriate randomness; • provide an animated display of operations; • generate detailed reports defining performance indicators observed
during the running of the model.
4.4 End User Interaction with the System An Excel workbook is used to setup case runs for analysis and initiate the running of the RoadSIM Arena model (see Figure 4.1). Most process data and parameters are entered into the workbook and only limited interaction with the Arena system is required. Sample screenshots of the Excel workbook interface are provided in Appendix B.
Page | 22
Simulation Modelling Services Pty Ltd School of Civil, Mining & Environmental Engineering, University of Wollongong
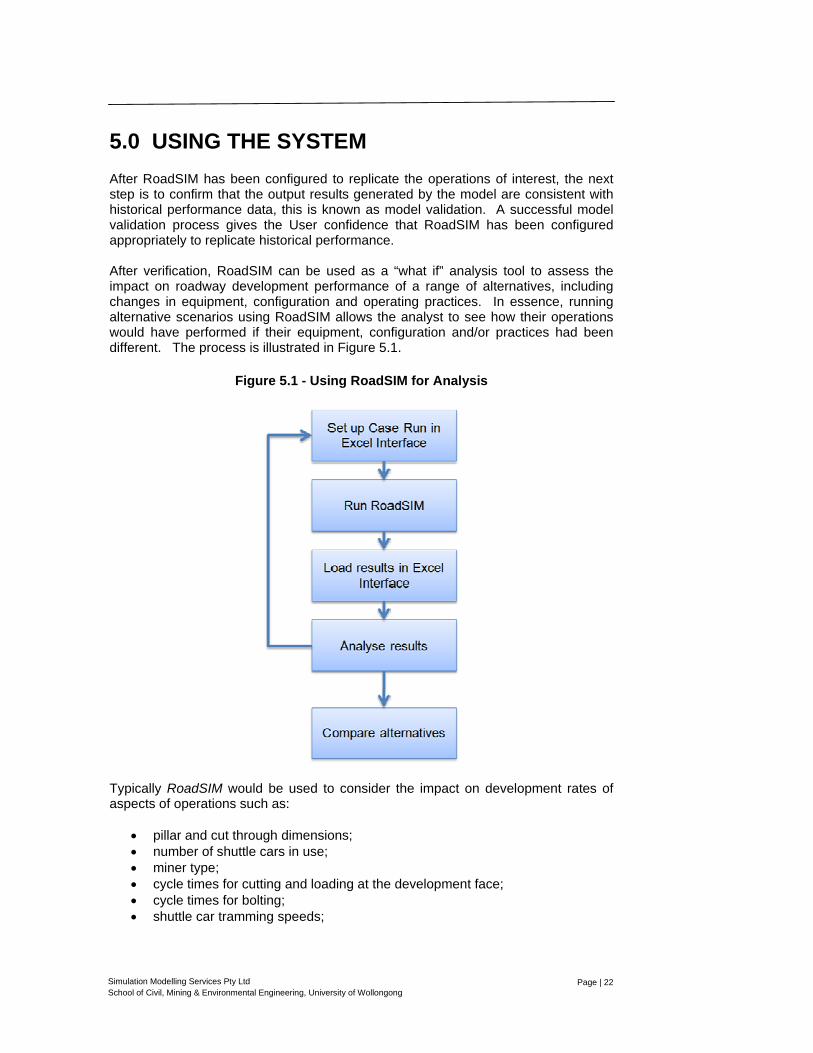
5.0 USING THE SYSTEM After RoadSIM has been configured to replicate the operations of interest, the next step is to confirm that the output results generated by the model are consistent with historical performance data, this is known as model validation. A successful model validation process gives the User confidence that RoadSIM has been configured appropriately to replicate historical performance. After verification, RoadSIM can be used as a “what if” analysis tool to assess the impact on roadway development performance of a range of alternatives, including changes in equipment, configuration and operating practices. In essence, running alternative scenarios using RoadSIM allows the analyst to see how their operations would have performed if their equipment, configuration and/or practices had been different. The process is illustrated in Figure 5.1.
Figure 5.1 - Using RoadSIM for Analysis
Typically RoadSIM would be used to consider the impact on development rates of aspects of operations such as:
• pillar and cut through dimensions; • number of shuttle cars in use; • miner type; • cycle times for cutting and loading at the development face; • cycle times for bolting; • shuttle car tramming speeds;
Using the System
Page | 23
Simulation Modelling Services Pty Ltd School of Civil, Mining & Environmental Engineering, University of Wollongong
• cycle time for discharge of a shuttle car; • delays effecting out bye services; and • delays effecting face operations.
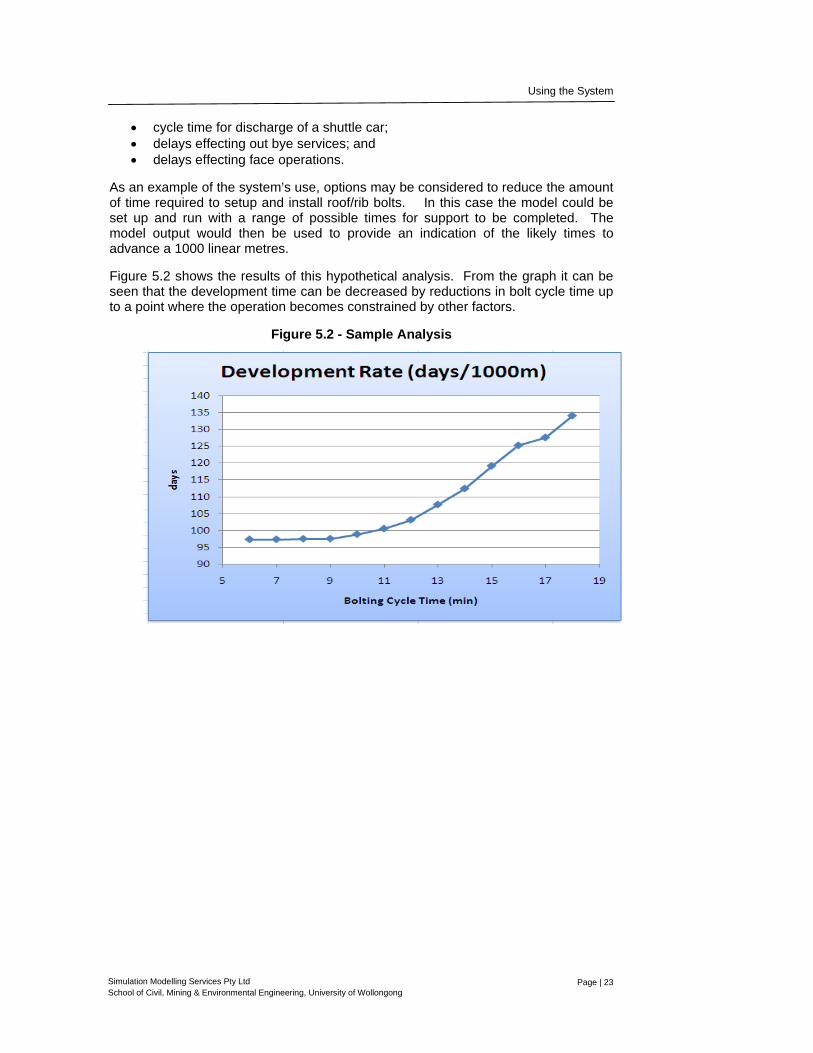
As an example of the system’s use, options may be considered to reduce the amount of time required to setup and install roof/rib bolts. In this case the model could be set up and run with a range of possible times for support to be completed. The model output would then be used to provide an indication of the likely times to advance a 1000 linear metres.
Figure 5.2 shows the results of this hypothetical analysis. From the graph it can be seen that the development time can be decreased by reductions in bolt cycle time up to a point where the operation becomes constrained by other factors.
Figure 5.2 - Sample Analysis

Page | 24
Simulation Modelling Services Pty Ltd School of Civil, Mining & Environmental Engineering, University of Wollongong
6.0 CASE STUDIES 6.1 Overview In the early stages of the project two mine sites were selected and used to benchmark model performance. The case study mines were used to ensure that the modelling system had sufficient functionality to replicate operations and that model output provided results inline with historical operations. Two separate companies made data available to assist in the development of RoadSIM. In this report the mine sites are referred to as MINE 1 and MINE 2. These mines provided data on:
• process parameters; • cycle times; • historical delay information; and • development rates achieved.
6.2 Case Study Mine 1 6.2.1 Overview Data from Mine 1 referred to a development period of operations between January and May 2008. Gate road development operations were based on a two heading configuration using one bolter-miner supported by one shuttle car. Pillars were 102 m long and 40 m wide, centre to centre. Roof and rib conditions required a bolting density of 6 roof bolts and 3 rib bolts on each rib with an average time to complete support operations of 12 minutes. Historical performance indicated an Operating Time of 62% of total calendar time and a Run Time of 24% of total calendar time (definitions are summarised in Table 3.2) with an average development rate of 4 metres per run hour. The average time to complete a pillar, which includes the time to complete a sequence move, was 11 days. 6.2.2 Roadway Development Data and Cycle Times Table 6.1 summarises the process parameters data and cycle times collected for Mine 1.
Case Studies
Page | 25
Simulation Modelling Services Pty Ltd School of Civil, Mining & Environmental Engineering, University of Wollongong
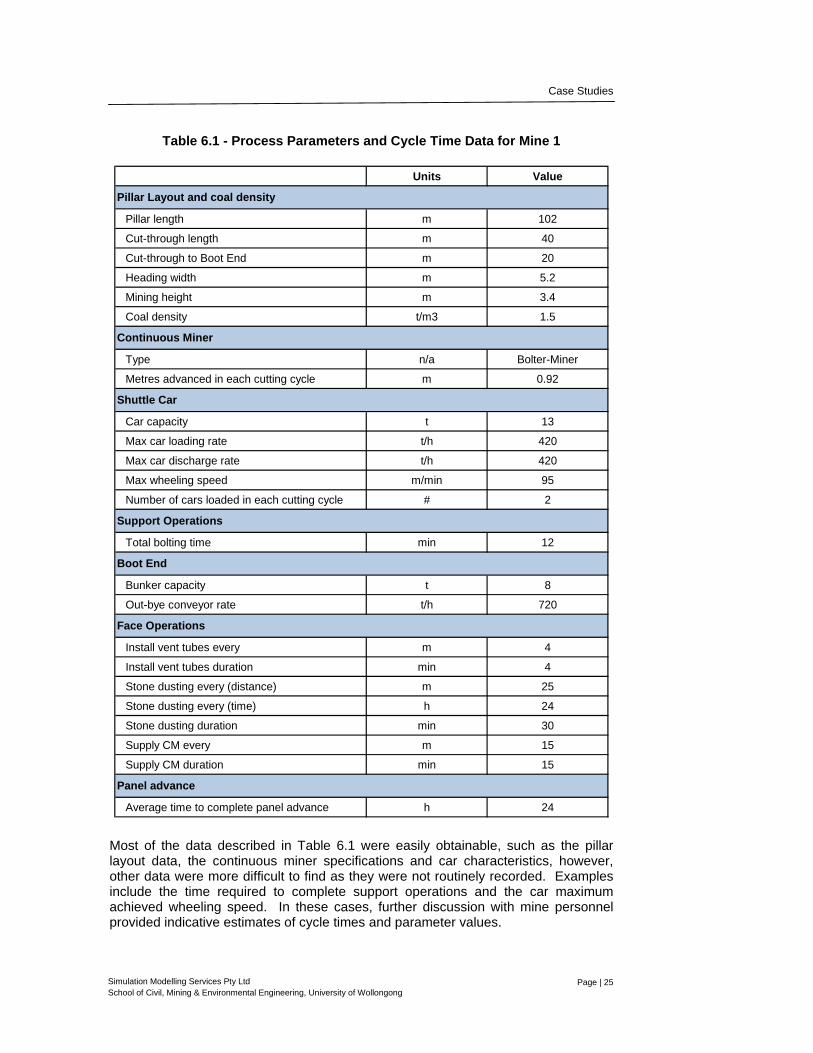
Table 6.1 - Process Parameters and Cycle Time Data for Mine 1
Units Value
Pillar length m 102
Cut-through length m 40
Cut-through to Boot End m 20
Heading width m 5.2
Mining height m 3.4
Coal density t/m3 1.5
Type n/a Bolter-Miner
Metres advanced in each cutting cycle m 0.92
Car capacity t 13
Max car loading rate t/h 420
Max car discharge rate t/h 420
Max wheeling speed m/min 95
Number of cars loaded in each cutting cycle # 2
Total bolting time min 12
Bunker capacity t 8
Out-bye conveyor rate t/h 720
Install vent tubes every m 4
Install vent tubes duration min 4
Stone dusting every (distance) m 25
Stone dusting every (time) h 24
Stone dusting duration min 30
Supply CM every m 15
Supply CM duration min 15
Average time to complete panel advance h 24
Panel advance
Pillar Layout and coal density
Continuous Miner
Shuttle Car
Support Operations
Boot End
Face Operations
Most of the data described in Table 6.1 were easily obtainable, such as the pillar layout data, the continuous miner specifications and car characteristics, however, other data were more difficult to find as they were not routinely recorded. Examples include the time required to complete support operations and the car maximum achieved wheeling speed. In these cases, further discussion with mine personnel provided indicative estimates of cycle times and parameter values.
Case Studies
Page | 26
Simulation Modelling Services Pty Ltd School of Civil, Mining & Environmental Engineering, University of Wollongong
Mine 1 operated on a shift schedule consisting of three 10 hour shifts per day Monday to Thursday. Two 12 hour shifts were scheduled for Fridays, while a single 12 hour shift was scheduled for Saturdays and Sundays. A total of 15 hours of planned maintenance was scheduled per week.
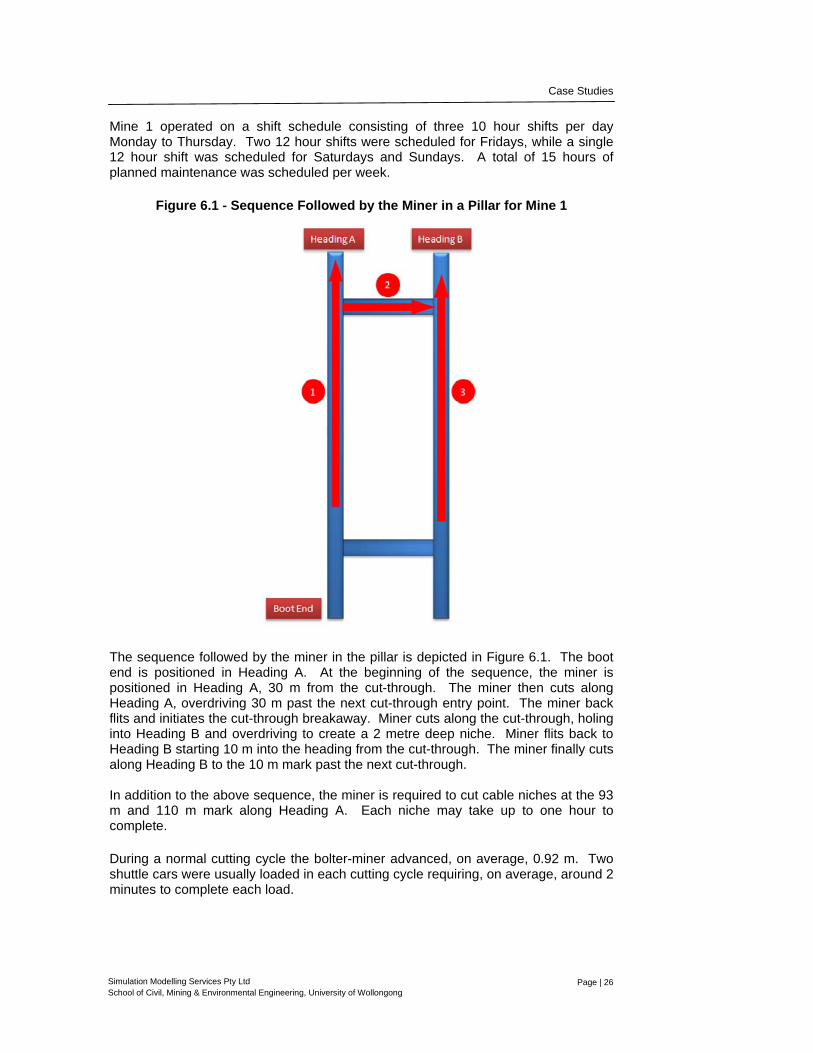
Figure 6.1 - Sequence Followed by the Miner in a Pillar for Mine 1
The sequence followed by the miner in the pillar is depicted in Figure 6.1. The boot end is positioned in Heading A. At the beginning of the sequence, the miner is positioned in Heading A, 30 m from the cut-through. The miner then cuts along Heading A, overdriving 30 m past the next cut-through entry point. The miner back flits and initiates the cut-through breakaway. Miner cuts along the cut-through, holing into Heading B and overdriving to create a 2 metre deep niche. Miner flits back to Heading B starting 10 m into the heading from the cut-through. The miner finally cuts along Heading B to the 10 m mark past the next cut-through. In addition to the above sequence, the miner is required to cut cable niches at the 93 m and 110 m mark along Heading A. Each niche may take up to one hour to complete. During a normal cutting cycle the bolter-miner advanced, on average, 0.92 m. Two shuttle cars were usually loaded in each cutting cycle requiring, on average, around 2 minutes to complete each load.
Case Studies
Page | 27
Simulation Modelling Services Pty Ltd School of Civil, Mining & Environmental Engineering, University of Wollongong
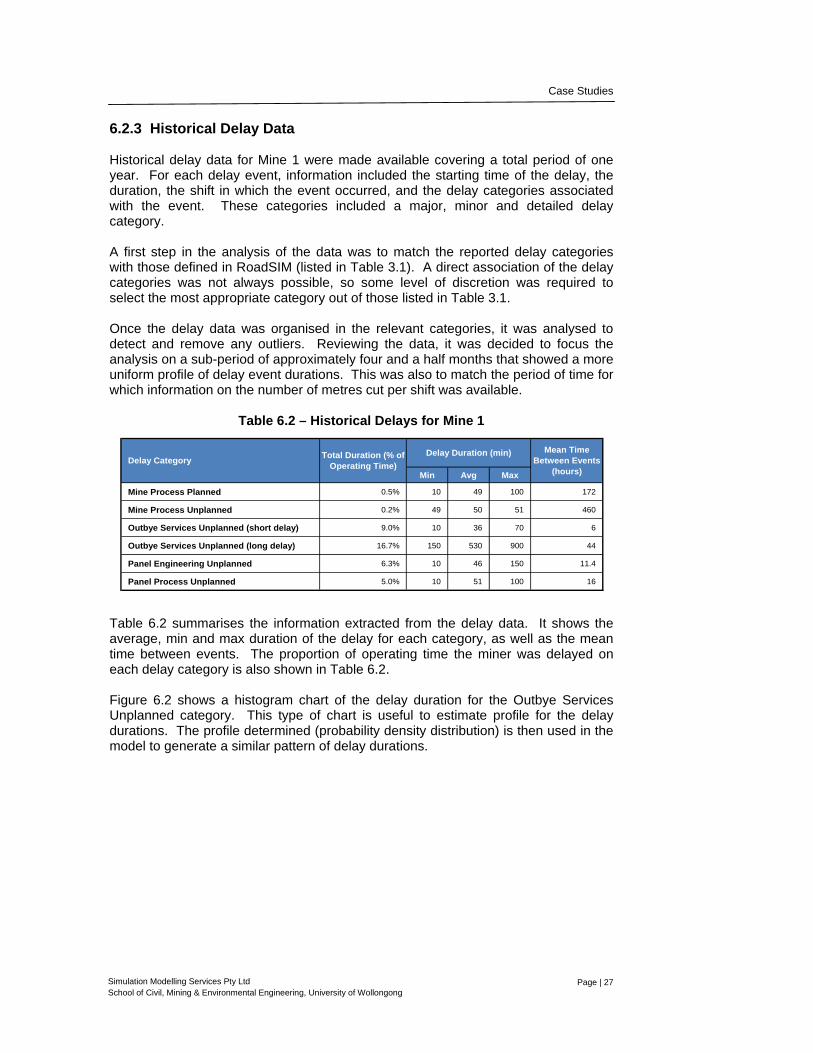
6.2.3 Historical Delay Data Historical delay data for Mine 1 were made available covering a total period of one year. For each delay event, information included the starting time of the delay, the duration, the shift in which the event occurred, and the delay categories associated with the event. These categories included a major, minor and detailed delay category. A first step in the analysis of the data was to match the reported delay categories with those defined in RoadSIM (listed in Table 3.1). A direct association of the delay categories was not always possible, so some level of discretion was required to select the most appropriate category out of those listed in Table 3.1. Once the delay data was organised in the relevant categories, it was analysed to detect and remove any outliers. Reviewing the data, it was decided to focus the analysis on a sub-period of approximately four and a half months that showed a more uniform profile of delay event durations. This was also to match the period of time for which information on the number of metres cut per shift was available.
Table 6.2 – Historical Delays for Mine 1
Min Avg Max
Mine Process Planned 0.5% 10 49 100 172
Mine Process Unplanned 0.2% 49 50 51 460
Outbye Services Unplanned (short delay) 9.0% 10 36 70 6
Outbye Services Unplanned (long delay) 16.7% 150 530 900 44
Panel Engineering Unplanned 6.3% 10 46 150 11.4
Panel Process Unplanned 5.0% 10 51 100 16
Delay Duration (min)Delay Category Total Duration (% of
Operating Time)
Mean Time Between Events
(hours)
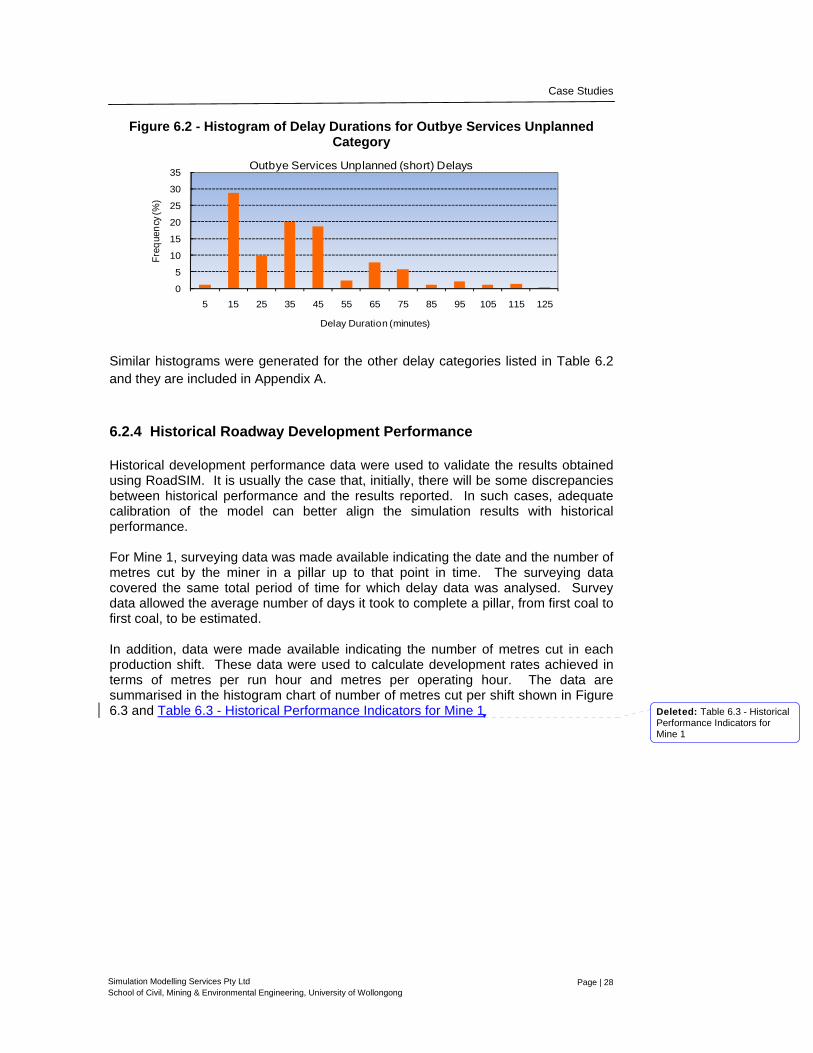
Table 6.2 summarises the information extracted from the delay data. It shows the average, min and max duration of the delay for each category, as well as the mean time between events. The proportion of operating time the miner was delayed on each delay category is also shown in Table 6.2. Figure 6.2 shows a histogram chart of the delay duration for the Outbye Services Unplanned category. This type of chart is useful to estimate profile for the delay durations. The profile determined (probability density distribution) is then used in the model to generate a similar pattern of delay durations.
Case Studies
Page | 28
Simulation Modelling Services Pty Ltd School of Civil, Mining & Environmental Engineering, University of Wollongong
Figure 6.2 - Histogram of Delay Durations for Outbye Services Unplanned
Category
0
5
10
15
20
25
30
35
5 15 25 35 45 55 65 75 85 95 105 115 125
Freq
uenc
y (%
)
Delay Duration (minutes)
Outbye Services Unplanned (short) Delays
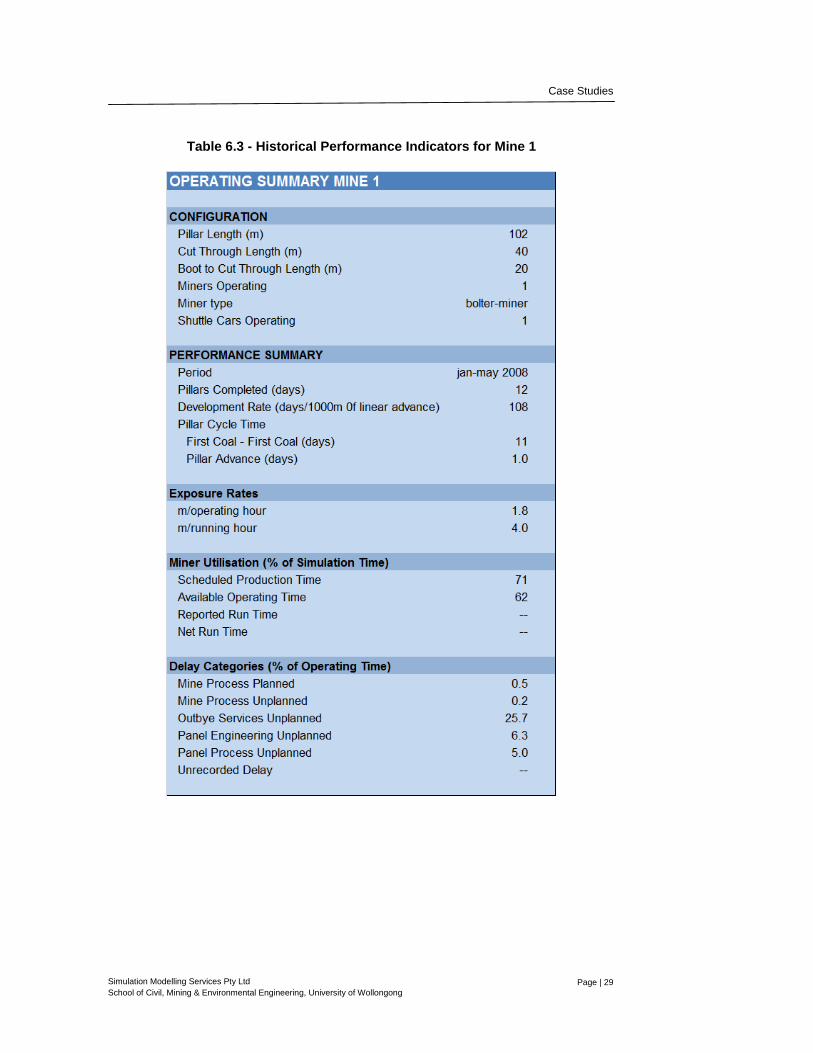
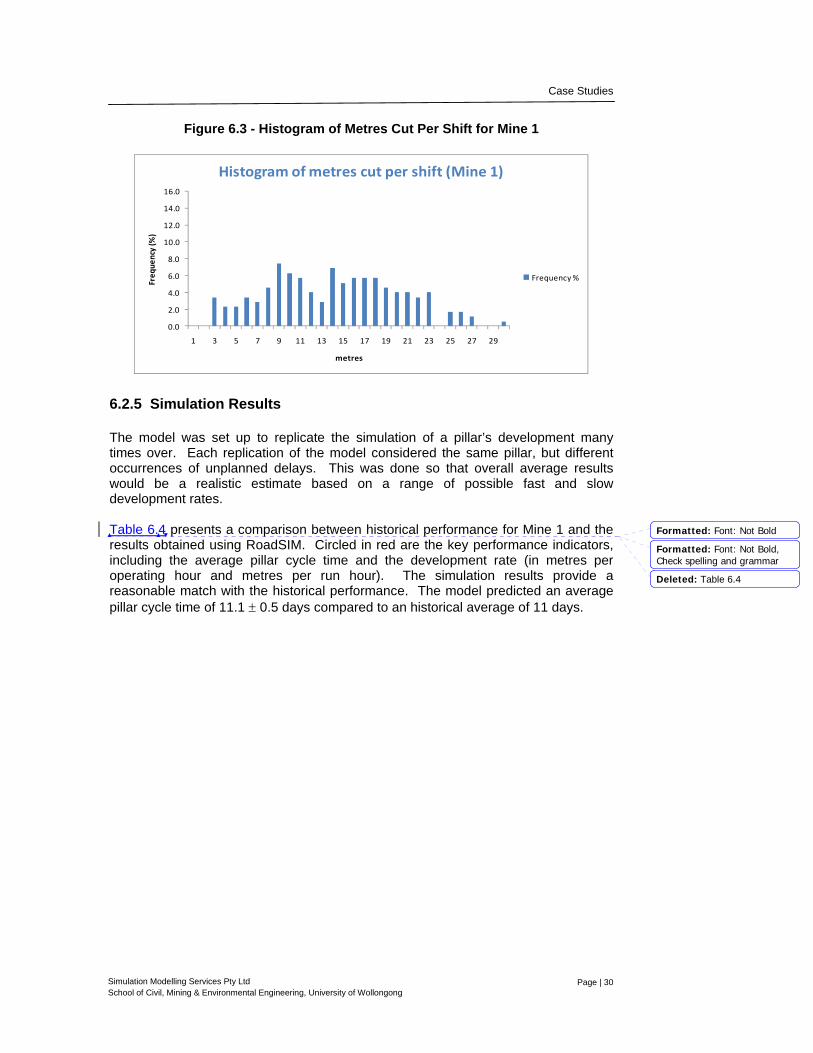
Similar histograms were generated for the other delay categories listed in Table 6.2 and they are included in Appendix A. 6.2.4 Historical Roadway Development Performance Historical development performance data were used to validate the results obtained using RoadSIM. It is usually the case that, initially, there will be some discrepancies between historical performance and the results reported. In such cases, adequate calibration of the model can better align the simulation results with historical performance. For Mine 1, surveying data was made available indicating the date and the number of metres cut by the miner in a pillar up to that point in time. The surveying data covered the same total period of time for which delay data was analysed. Survey data allowed the average number of days it took to complete a pillar, from first coal to first coal, to be estimated. In addition, data were made available indicating the number of metres cut in each production shift. These data were used to calculate development rates achieved in terms of metres per run hour and metres per operating hour. The data are summarised in the histogram chart of number of metres cut per shift shown in Figure 6.3 and Table 6.3 - Historical Performance Indicators for Mine 1
Deleted: Table 6.3 - Historical Performance Indicators for Mine 1
Case Studies
Page | 29
Simulation Modelling Services Pty Ltd School of Civil, Mining & Environmental Engineering, University of Wollongong
Table 6.3 - Historical Performance Indicators for Mine 1
Case Studies
Page | 30
Simulation Modelling Services Pty Ltd School of Civil, Mining & Environmental Engineering, University of Wollongong
Figure 6.3 - Histogram of Metres Cut Per Shift for Mine 1
0.0
2.0
4.0
6.0
8.0
10.0
12.0
14.0
16.0
1 3 5 7 9 11 13 15 17 19 21 23 25 27 29
Freq
uency (%
)
metres
Histogram of metres cut per shift (Mine 1)
Frequency %
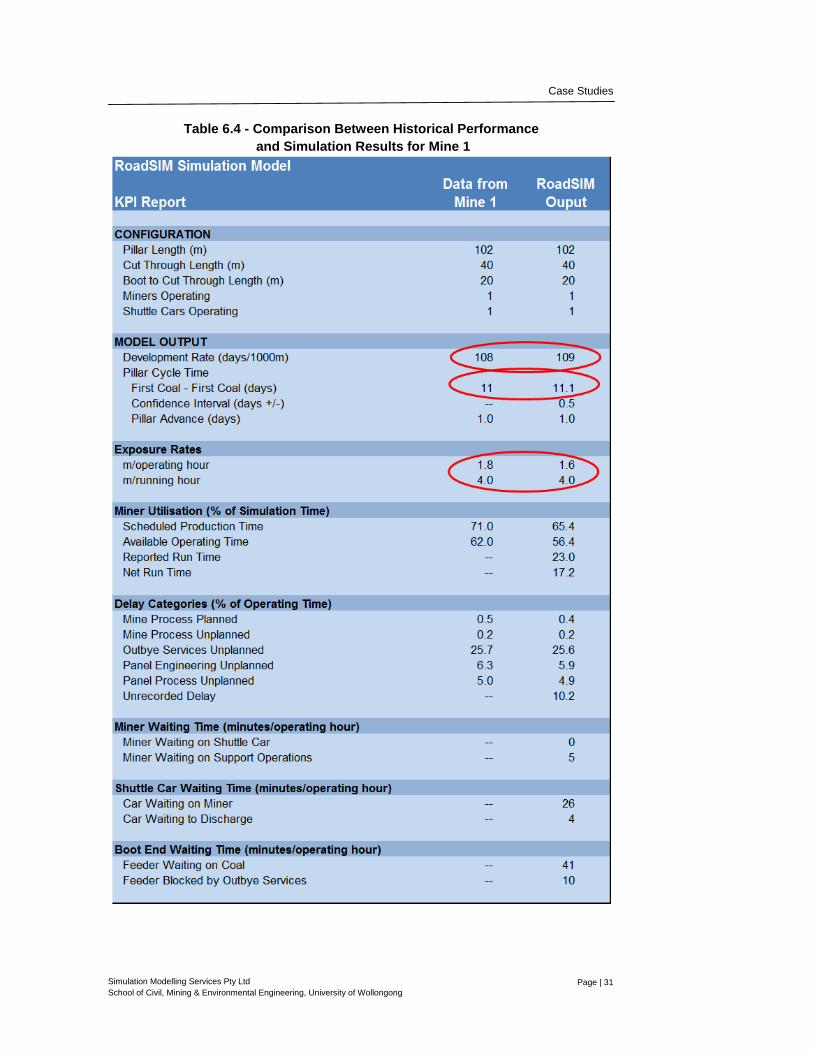
6.2.5 Simulation Results The model was set up to replicate the simulation of a pillar’s development many times over. Each replication of the model considered the same pillar, but different occurrences of unplanned delays. This was done so that overall average results would be a realistic estimate based on a range of possible fast and slow development rates. Table 6.4 presents a comparison between historical performance for Mine 1 and the results obtained using RoadSIM. Circled in red are the key performance indicators, including the average pillar cycle time and the development rate (in metres per operating hour and metres per run hour). The simulation results provide a reasonable match with the historical performance. The model predicted an average pillar cycle time of 11.1 ± 0.5 days compared to an historical average of 11 days.
Formatted: Font: Not Bold
Formatted: Font: Not Bold,Check spelling and grammar
Deleted: Table 6.4
Case Studies
Page | 31
Simulation Modelling Services Pty Ltd School of Civil, Mining & Environmental Engineering, University of Wollongong
Table 6.4 - Comparison Between Historical Performance
and Simulation Results for Mine 1
Case Studies
Page | 32
Simulation Modelling Services Pty Ltd School of Civil, Mining & Environmental Engineering, University of Wollongong
Reported development exposure rates also show a close correspondence to historical rates. The reported rate of metres per operating hour is close to, but slightly below, historical performance. However, the possibility exists that there may have been some error in estimating the historical rate as the calculation involved manually reviewing survey data and correlating it with delay records.
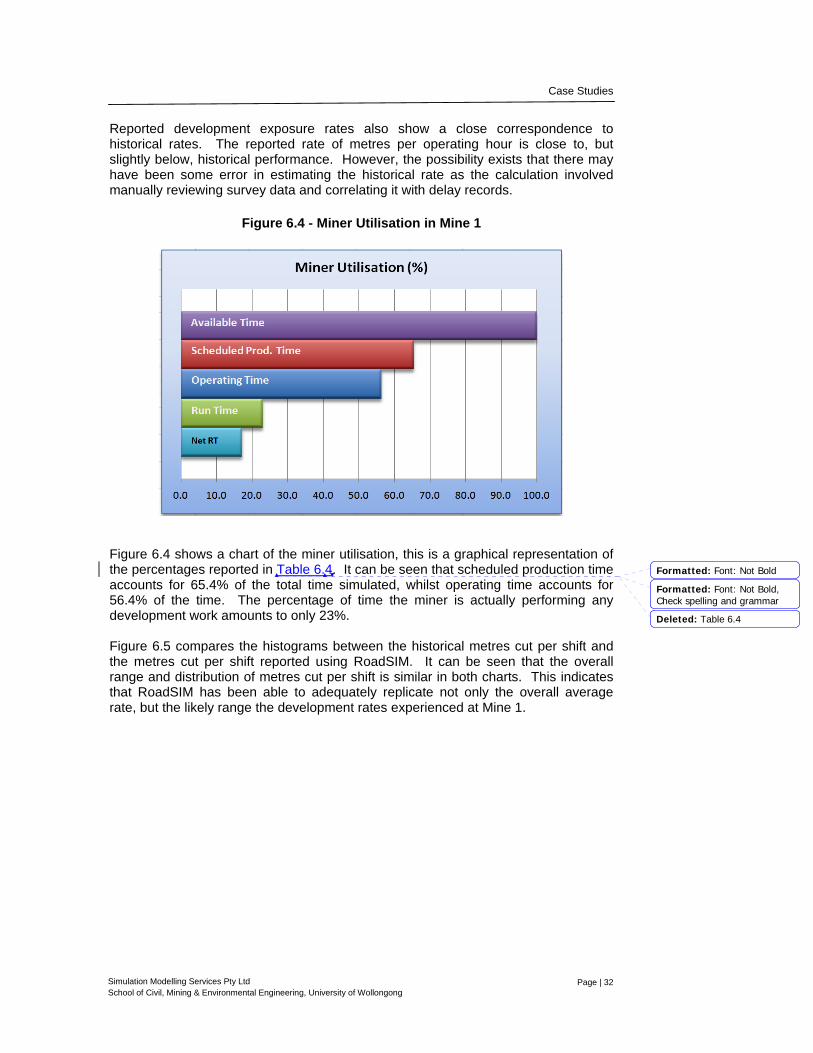
Figure 6.4 - Miner Utilisation in Mine 1
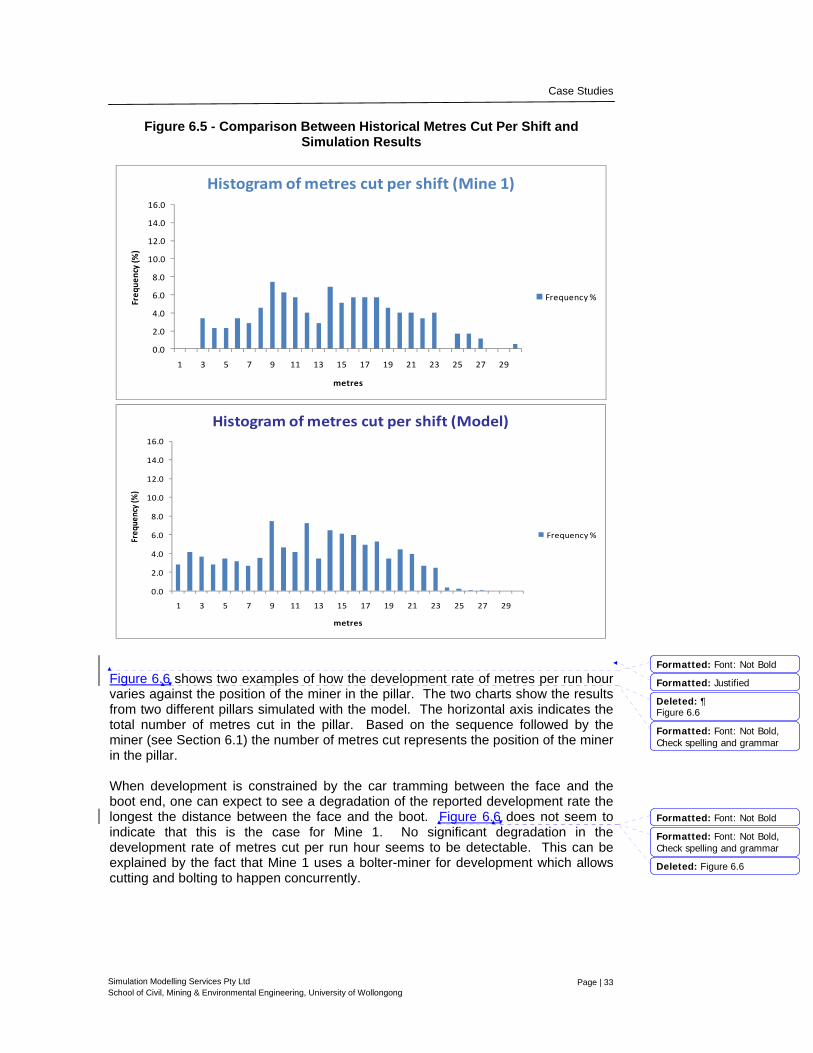
Figure 6.4 shows a chart of the miner utilisation, this is a graphical representation of the percentages reported in Table 6.4. It can be seen that scheduled production time accounts for 65.4% of the total time simulated, whilst operating time accounts for 56.4% of the time. The percentage of time the miner is actually performing any development work amounts to only 23%. Figure 6.5 compares the histograms between the historical metres cut per shift and the metres cut per shift reported using RoadSIM. It can be seen that the overall range and distribution of metres cut per shift is similar in both charts. This indicates that RoadSIM has been able to adequately replicate not only the overall average rate, but the likely range the development rates experienced at Mine 1.
Formatted: Font: Not Bold
Formatted: Font: Not Bold,Check spelling and grammar
Deleted: Table 6.4
Case Studies
Page | 33
Simulation Modelling Services Pty Ltd School of Civil, Mining & Environmental Engineering, University of Wollongong
Figure 6.5 - Comparison Between Historical Metres Cut Per Shift and
Simulation Results
0.0
2.0
4.0
6.0
8.0
10.0
12.0
14.0
16.0
1 3 5 7 9 11 13 15 17 19 21 23 25 27 29
Freq
uency (%
)
metres
Histogram of metres cut per shift (Mine 1)
Frequency %
0.0
2.0
4.0
6.0
8.0
10.0
12.0
14.0
16.0
1 3 5 7 9 11 13 15 17 19 21 23 25 27 29
Freq
uency (%
)
metres
Histogram of metres cut per shift (Model)
Frequency %
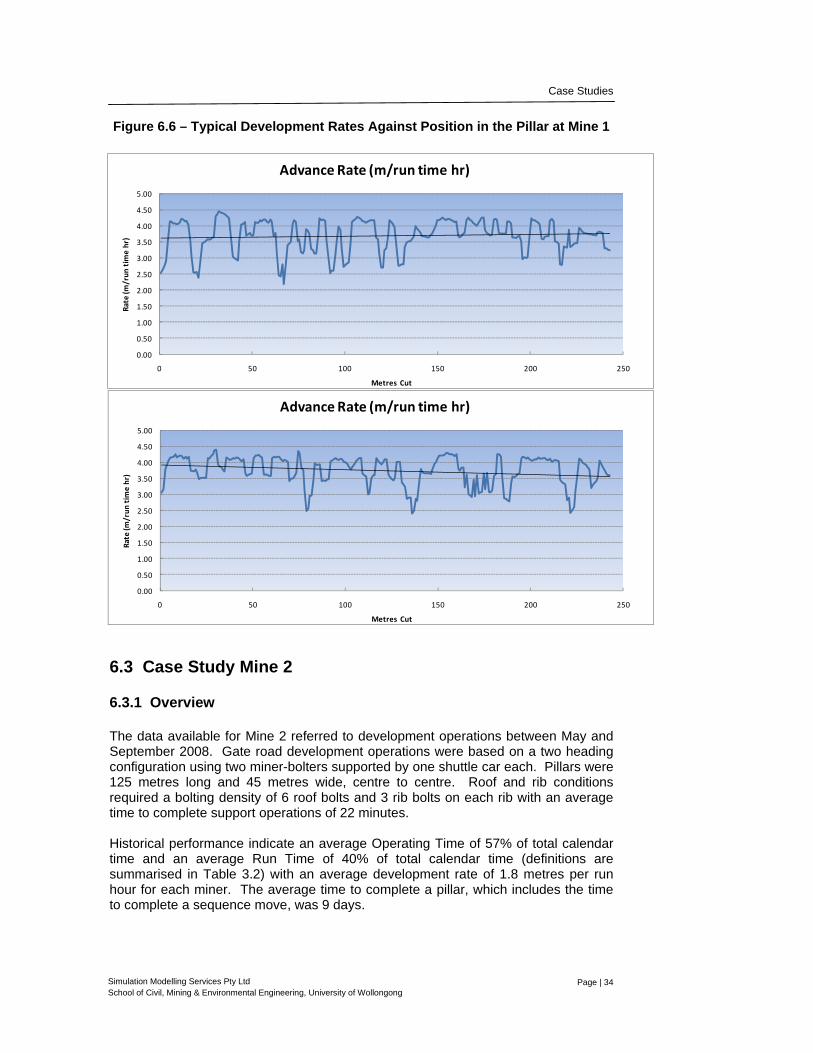
Figure 6.6 shows two examples of how the development rate of metres per run hour varies against the position of the miner in the pillar. The two charts show the results from two different pillars simulated with the model. The horizontal axis indicates the total number of metres cut in the pillar. Based on the sequence followed by the miner (see Section 6.1) the number of metres cut represents the position of the miner in the pillar. When development is constrained by the car tramming between the face and the boot end, one can expect to see a degradation of the reported development rate the longest the distance between the face and the boot. Figure 6.6 does not seem to indicate that this is the case for Mine 1. No significant degradation in the development rate of metres cut per run hour seems to be detectable. This can be explained by the fact that Mine 1 uses a bolter-miner for development which allows cutting and bolting to happen concurrently.
Formatted: Font: Not Bold
Formatted: Justified
Formatted: Font: Not Bold,Check spelling and grammar
Formatted: Font: Not Bold
Formatted: Font: Not Bold,Check spelling and grammar
Deleted: ¶Figure 6.6
Deleted: Figure 6.6
Case Studies
Page | 34
Simulation Modelling Services Pty Ltd School of Civil, Mining & Environmental Engineering, University of Wollongong
0.00
0.50
1.00
1.50
2.00
2.50
3.00
3.50
4.00
4.50
5.00
0 50 100 150 200 250
Rate (m
/run
tim
e hr)
Metres Cut
Advance Rate (m/run time hr)
0.00
0.50
1.00
1.50
2.00
2.50
3.00
3.50
4.00
4.50
5.00
0 50 100 150 200 250
Rate (m
/run
tim
e hr)
Metres Cut
Advance Rate (m/run time hr)
Figure 6.6 – Typical Development Rates Against Position in the Pillar at Mine 1
6.3 Case Study Mine 2 6.3.1 Overview The data available for Mine 2 referred to development operations between May and September 2008. Gate road development operations were based on a two heading configuration using two miner-bolters supported by one shuttle car each. Pillars were 125 metres long and 45 metres wide, centre to centre. Roof and rib conditions required a bolting density of 6 roof bolts and 3 rib bolts on each rib with an average time to complete support operations of 22 minutes. Historical performance indicate an average Operating Time of 57% of total calendar time and an average Run Time of 40% of total calendar time (definitions are summarised in Table 3.2) with an average development rate of 1.8 metres per run hour for each miner. The average time to complete a pillar, which includes the time to complete a sequence move, was 9 days.
Case Studies
Page | 35
Simulation Modelling Services Pty Ltd School of Civil, Mining & Environmental Engineering, University of Wollongong
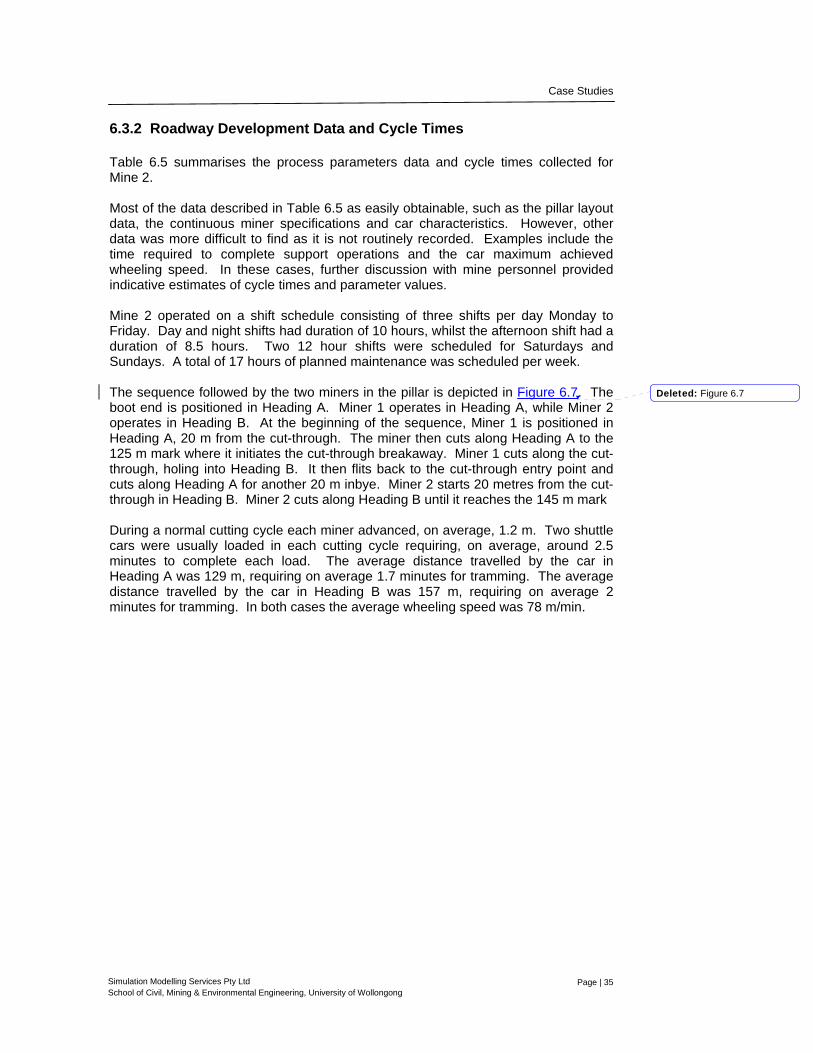
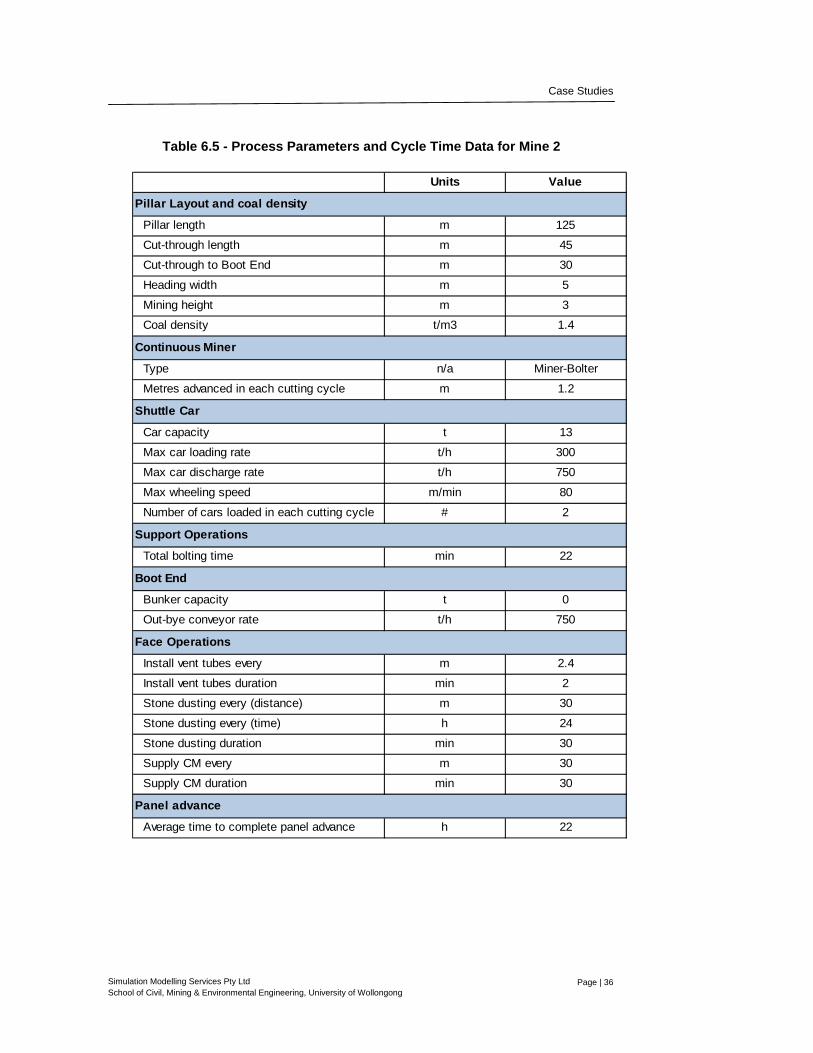
6.3.2 Roadway Development Data and Cycle Times Table 6.5 summarises the process parameters data and cycle times collected for Mine 2. Most of the data described in Table 6.5 as easily obtainable, such as the pillar layout data, the continuous miner specifications and car characteristics. However, other data was more difficult to find as it is not routinely recorded. Examples include the time required to complete support operations and the car maximum achieved wheeling speed. In these cases, further discussion with mine personnel provided indicative estimates of cycle times and parameter values. Mine 2 operated on a shift schedule consisting of three shifts per day Monday to Friday. Day and night shifts had duration of 10 hours, whilst the afternoon shift had a duration of 8.5 hours. Two 12 hour shifts were scheduled for Saturdays and Sundays. A total of 17 hours of planned maintenance was scheduled per week. The sequence followed by the two miners in the pillar is depicted in Figure 6.7. The boot end is positioned in Heading A. Miner 1 operates in Heading A, while Miner 2 operates in Heading B. At the beginning of the sequence, Miner 1 is positioned in Heading A, 20 m from the cut-through. The miner then cuts along Heading A to the 125 m mark where it initiates the cut-through breakaway. Miner 1 cuts along the cut-through, holing into Heading B. It then flits back to the cut-through entry point and cuts along Heading A for another 20 m inbye. Miner 2 starts 20 metres from the cut-through in Heading B. Miner 2 cuts along Heading B until it reaches the 145 m mark During a normal cutting cycle each miner advanced, on average, 1.2 m. Two shuttle cars were usually loaded in each cutting cycle requiring, on average, around 2.5 minutes to complete each load. The average distance travelled by the car in Heading A was 129 m, requiring on average 1.7 minutes for tramming. The average distance travelled by the car in Heading B was 157 m, requiring on average 2 minutes for tramming. In both cases the average wheeling speed was 78 m/min.
Deleted: Figure 6.7
Case Studies
Page | 36
Simulation Modelling Services Pty Ltd School of Civil, Mining & Environmental Engineering, University of Wollongong
Units Value
Pillar length m 125
Cut-through length m 45
Cut-through to Boot End m 30
Heading width m 5
Mining height m 3
Coal density t/m3 1.4
Type n/a Miner-Bolter
Metres advanced in each cutting cycle m 1.2
Car capacity t 13
Max car loading rate t/h 300
Max car discharge rate t/h 750
Max wheeling speed m/min 80
Number of cars loaded in each cutting cycle # 2
Total bolting time min 22
Bunker capacity t 0
Out-bye conveyor rate t/h 750
Install vent tubes every m 2.4
Install vent tubes duration min 2
Stone dusting every (distance) m 30
Stone dusting every (time) h 24
Stone dusting duration min 30
Supply CM every m 30
Supply CM duration min 30
Average time to complete panel advance h 22
Panel advance
Pillar Layout and coal density
Continuous Miner
Shuttle Car
Support Operations
Boot End
Face Operations
Table 6.5 - Process Parameters and Cycle Time Data for Mine 2
Case Studies
Page | 37
Simulation Modelling Services Pty Ltd School of Civil, Mining & Environmental Engineering, University of Wollongong
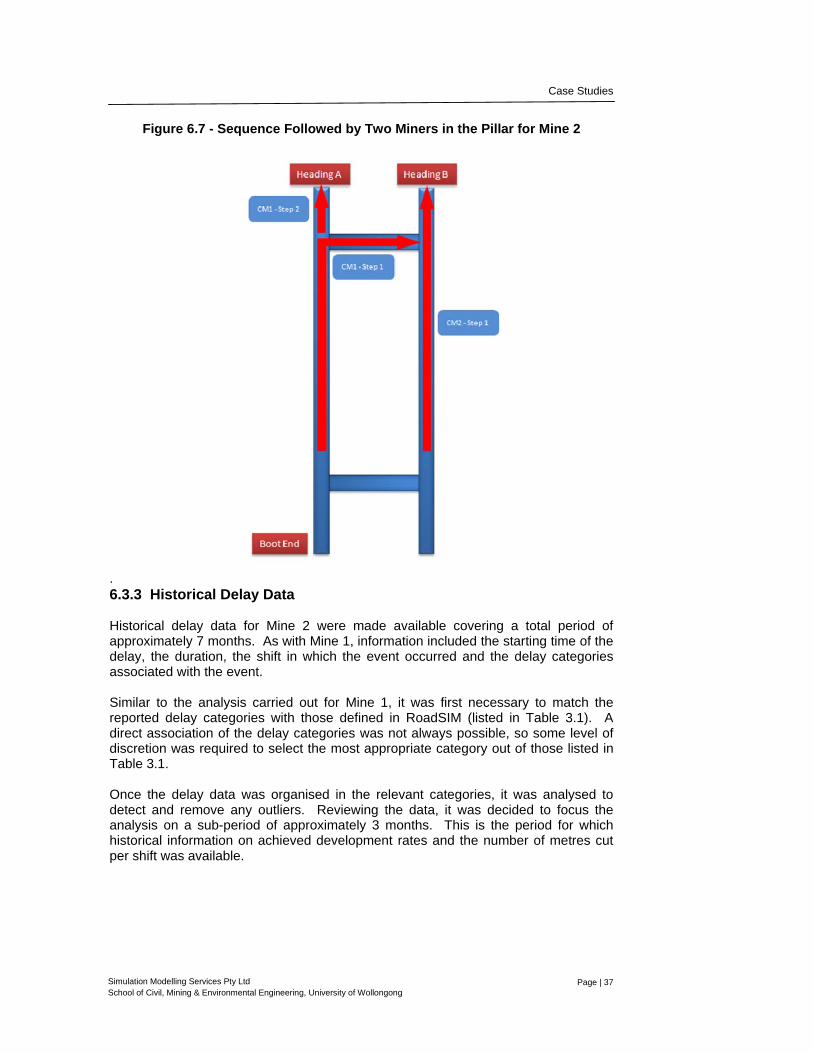
Figure 6.7 - Sequence Followed by Two Miners in the Pillar for Mine 2
. 6.3.3 Historical Delay Data Historical delay data for Mine 2 were made available covering a total period of approximately 7 months. As with Mine 1, information included the starting time of the delay, the duration, the shift in which the event occurred and the delay categories associated with the event. Similar to the analysis carried out for Mine 1, it was first necessary to match the reported delay categories with those defined in RoadSIM (listed in Table 3.1). A direct association of the delay categories was not always possible, so some level of discretion was required to select the most appropriate category out of those listed in Table 3.1. Once the delay data was organised in the relevant categories, it was analysed to detect and remove any outliers. Reviewing the data, it was decided to focus the analysis on a sub-period of approximately 3 months. This is the period for which historical information on achieved development rates and the number of metres cut per shift was available.
Case Studies
Page | 38
Simulation Modelling Services Pty Ltd School of Civil, Mining & Environmental Engineering, University of Wollongong
Min Avg Max
Mine Process Planned 13.8% 10 74 100 7.7
Mine Process Unplanned 2.3% 180 200 240 144
Outbye Services Unplanned 6.7% 15 45 180 10.4
Panel Engineering Unplanned 8.5% 10 52 120 9.3
Panel Process Unplanned 7.1% 10 48 92 10.5
Delay Category Total Duration (% of Operating Time)
Delay Duration (min) Mean Time Between
Events (hours)
05
101520253035404550
5 15 25 35 45 55 65 75 85 95
Freq
uenc
y (%
)
Delay Duration (minutes)
Mine Process Planned Delays
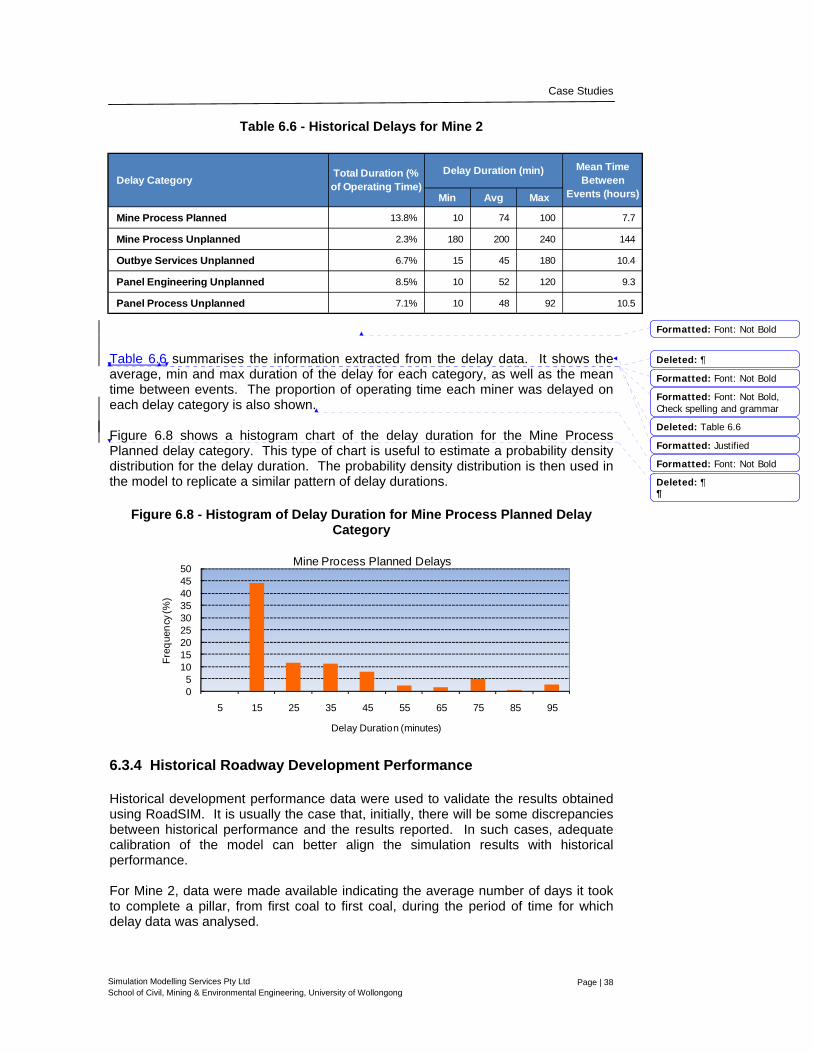
Table 6.6 - Historical Delays for Mine 2
Table 6.6 summarises the information extracted from the delay data. It shows the average, min and max duration of the delay for each category, as well as the mean time between events. The proportion of operating time each miner was delayed on each delay category is also shown.
Figure 6.8 shows a histogram chart of the delay duration for the Mine Process Planned delay category. This type of chart is useful to estimate a probability density distribution for the delay duration. The probability density distribution is then used in the model to replicate a similar pattern of delay durations.
Figure 6.8 - Histogram of Delay Duration for Mine Process Planned Delay Category
6.3.4 Historical Roadway Development Performance Historical development performance data were used to validate the results obtained using RoadSIM. It is usually the case that, initially, there will be some discrepancies between historical performance and the results reported. In such cases, adequate calibration of the model can better align the simulation results with historical performance. For Mine 2, data were made available indicating the average number of days it took to complete a pillar, from first coal to first coal, during the period of time for which delay data was analysed.
Formatted: Font: Not Bold
Formatted: Font: Not Bold
Formatted: Font: Not Bold,Check spelling and grammar
Formatted: Justified
Formatted: Font: Not Bold
Deleted: 
Deleted: Table 6.6
Deleted: ¶¶
Case Studies
Page | 39
Simulation Modelling Services Pty Ltd School of Civil, Mining & Environmental Engineering, University of Wollongong
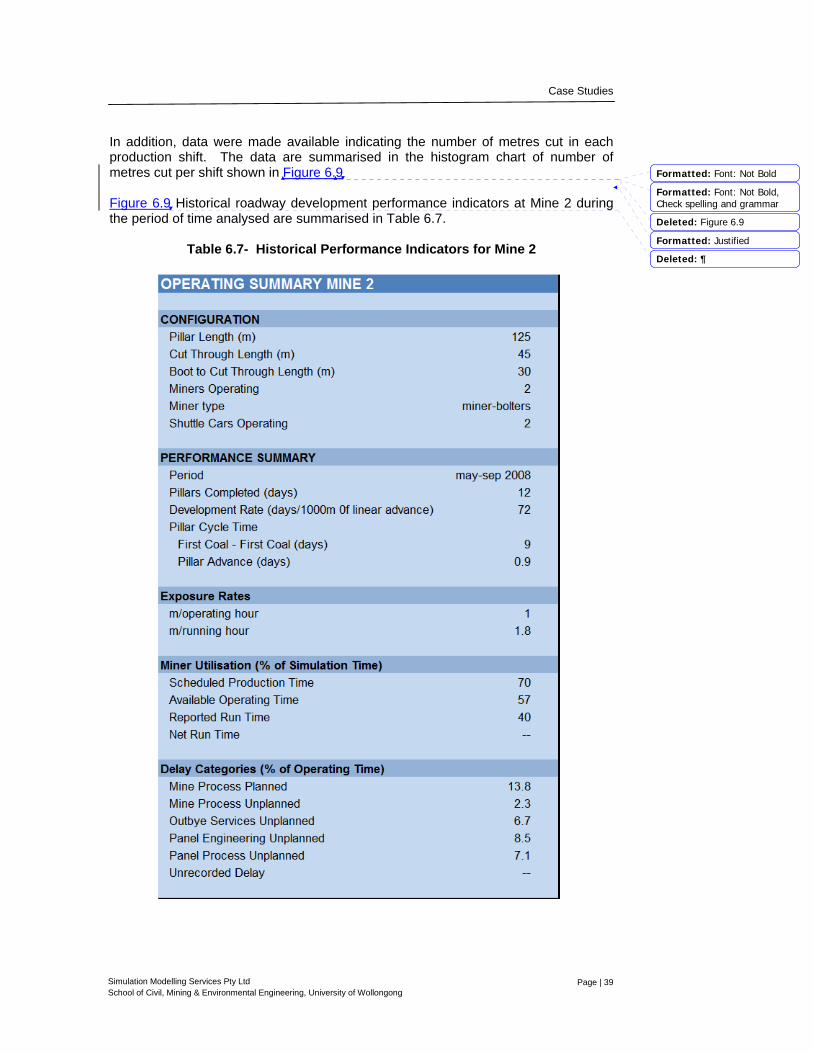
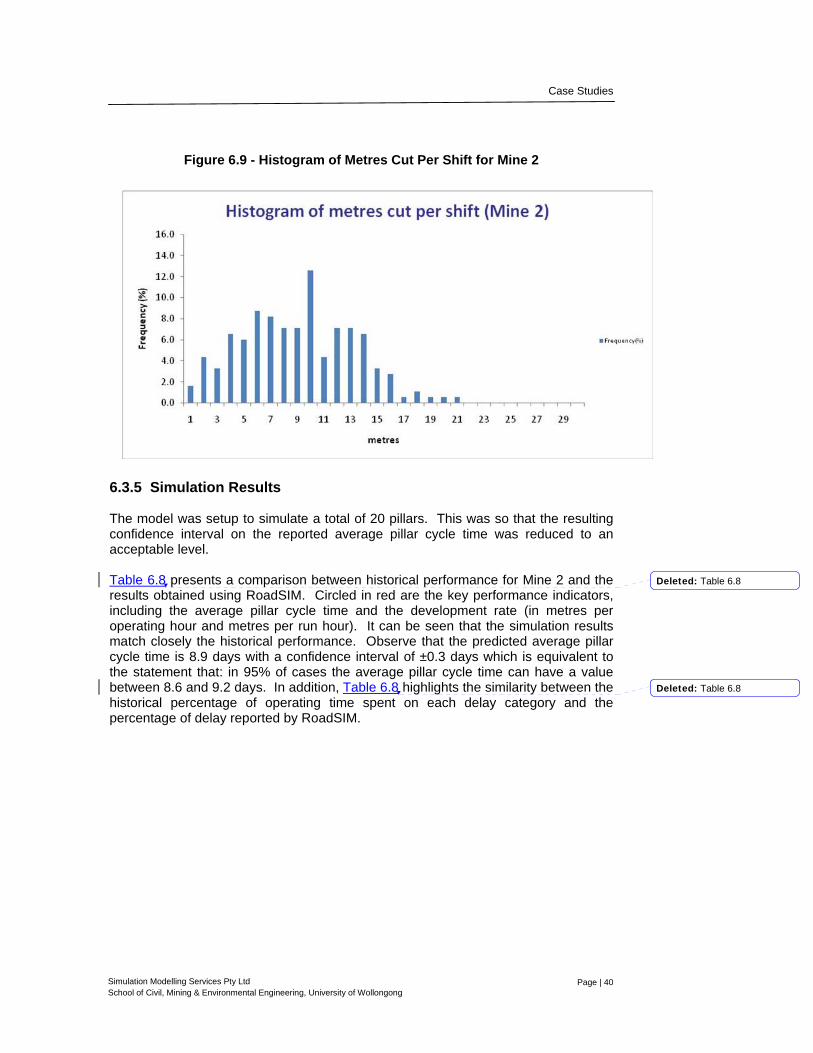
In addition, data were made available indicating the number of metres cut in each production shift. The data are summarised in the histogram chart of number of metres cut per shift shown in Figure 6.9 Figure 6.9 Historical roadway development performance indicators at Mine 2 during the period of time analysed are summarised in Table 6.7.
Table 6.7- Historical Performance Indicators for Mine 2
Formatted: Font: Not Bold
Formatted: Font: Not Bold,Check spelling and grammar
Formatted: Justified
Deleted: Figure 6.9
Deleted: 
Case Studies
Page | 40
Simulation Modelling Services Pty Ltd School of Civil, Mining & Environmental Engineering, University of Wollongong
Figure 6.9 - Histogram of Metres Cut Per Shift for Mine 2
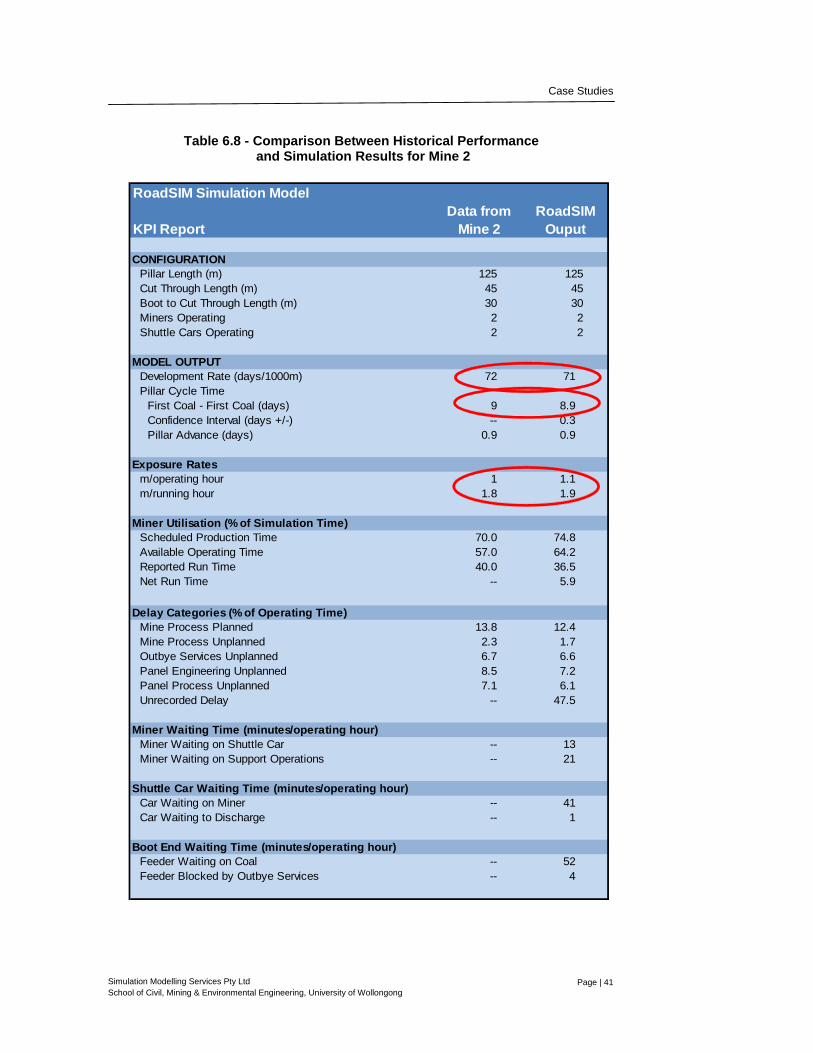
6.3.5 Simulation Results The model was setup to simulate a total of 20 pillars. This was so that the resulting confidence interval on the reported average pillar cycle time was reduced to an acceptable level. Table 6.8 presents a comparison between historical performance for Mine 2 and the results obtained using RoadSIM. Circled in red are the key performance indicators, including the average pillar cycle time and the development rate (in metres per operating hour and metres per run hour). It can be seen that the simulation results match closely the historical performance. Observe that the predicted average pillar cycle time is 8.9 days with a confidence interval of ±0.3 days which is equivalent to the statement that: in 95% of cases the average pillar cycle time can have a value between 8.6 and 9.2 days. In addition, Table 6.8 highlights the similarity between the historical percentage of operating time spent on each delay category and the percentage of delay reported by RoadSIM.
Deleted: Table 6.8
Deleted: Table 6.8
Case Studies
Page | 41
Simulation Modelling Services Pty Ltd School of Civil, Mining & Environmental Engineering, University of Wollongong
RoadSIM Simulation Model
KPI Report Data from
Mine 2RoadSIM
Ouput CONFIGURATION
Pillar Length (m) 125 125Cut Through Length (m) 45 45Boot to Cut Through Length (m) 30 30Miners Operating 2 2Shuttle Cars Operating 2 2
MODEL OUTPUT Development Rate (days/1000m) 72 71Pillar Cycle Time
First Coal - First Coal (days) 9 8.9Confidence Interval (days +/-) -- 0.3Pillar Advance (days) 0.9 0.9
Exposure Rates
m/operating hour 1 1.1m/running hour 1.8 1.9
Miner Utilisation (% of Simulation Time) Scheduled Production Time 70.0 74.8Available Operating Time 57.0 64.2Reported Run Time 40.0 36.5Net Run Time -- 5.9
Delay Categories (% of Operating Time) Mine Process Planned 13.8 12.4Mine Process Unplanned 2.3 1.7Outbye Services Unplanned 6.7 6.6Panel Engineering Unplanned 8.5 7.2Panel Process Unplanned 7.1 6.1Unrecorded Delay -- 47.5
Miner Waiting Time (minutes/operating hour) Miner Waiting on Shuttle Car -- 13Miner Waiting on Support Operations -- 21
Shuttle Car Waiting Time (minutes/operating hour) Car Waiting on Miner -- 41Car Waiting to Discharge -- 1
Boot End Waiting Time (minutes/operating hour) Feeder Waiting on Coal -- 52Feeder Blocked by Outbye Services -- 4
Table 6.8 - Comparison Between Historical Performance and Simulation Results for Mine 2
Case Studies
Page | 42
Simulation Modelling Services Pty Ltd School of Civil, Mining & Environmental Engineering, University of Wollongong
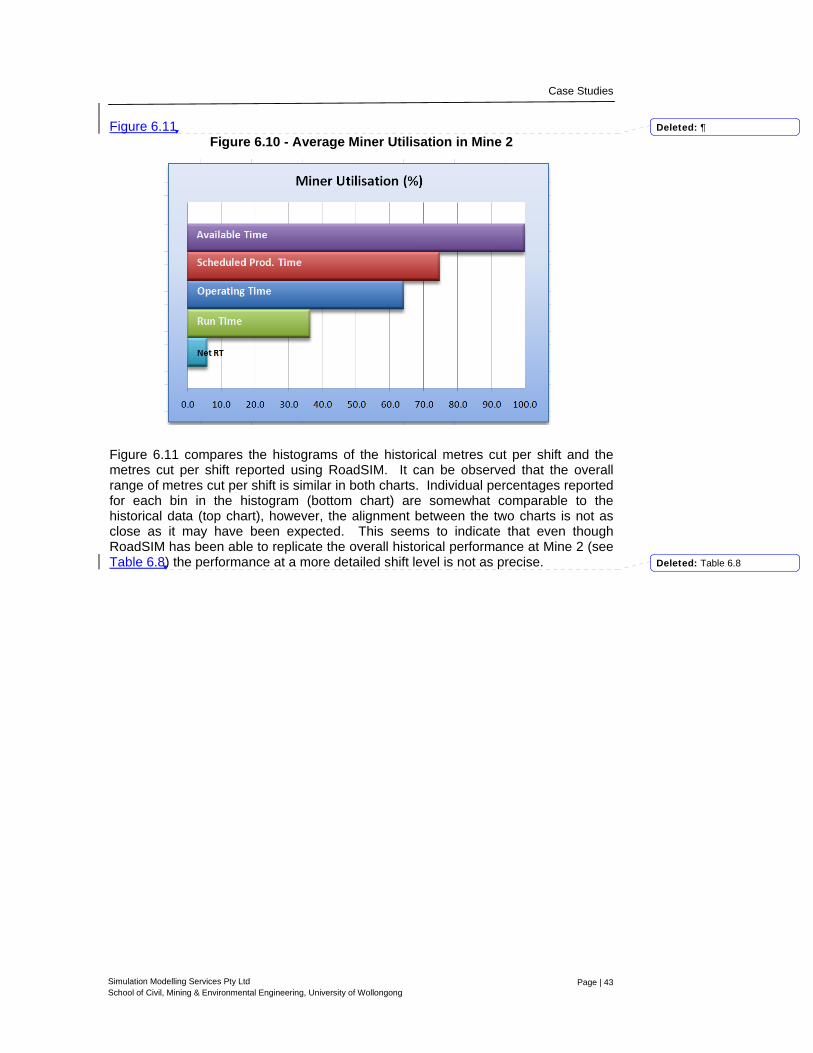
Figure 6.10 shows a chart of the miner utilisation in Mine 2 taken as the average
between Miner 1 and Miner 2, this is a graphical representation of the percentages reported in Table 6.8. It can be seen that scheduled production time accounts for 74.8% of the total time simulated, whilst operating time accounts for 64.2% of the
time. The percentage of time both miners are actually performing any development work accounts to 36.5%.
Formatted: Caption
Formatted: Font: Not Bold
Formatted: Font: Not Bold,Check spelling and grammar
Formatted: Font: Not Bold
Formatted: Font: Not Bold,Check spelling and grammar
Formatted: Font: Not Bold
Deleted: Figure 6.10
Deleted: Table 6.8
Case Studies
Page | 43
Simulation Modelling Services Pty Ltd School of Civil, Mining & Environmental Engineering, University of Wollongong
Figure 6.11
Figure 6.10 - Average Miner Utilisation in Mine 2
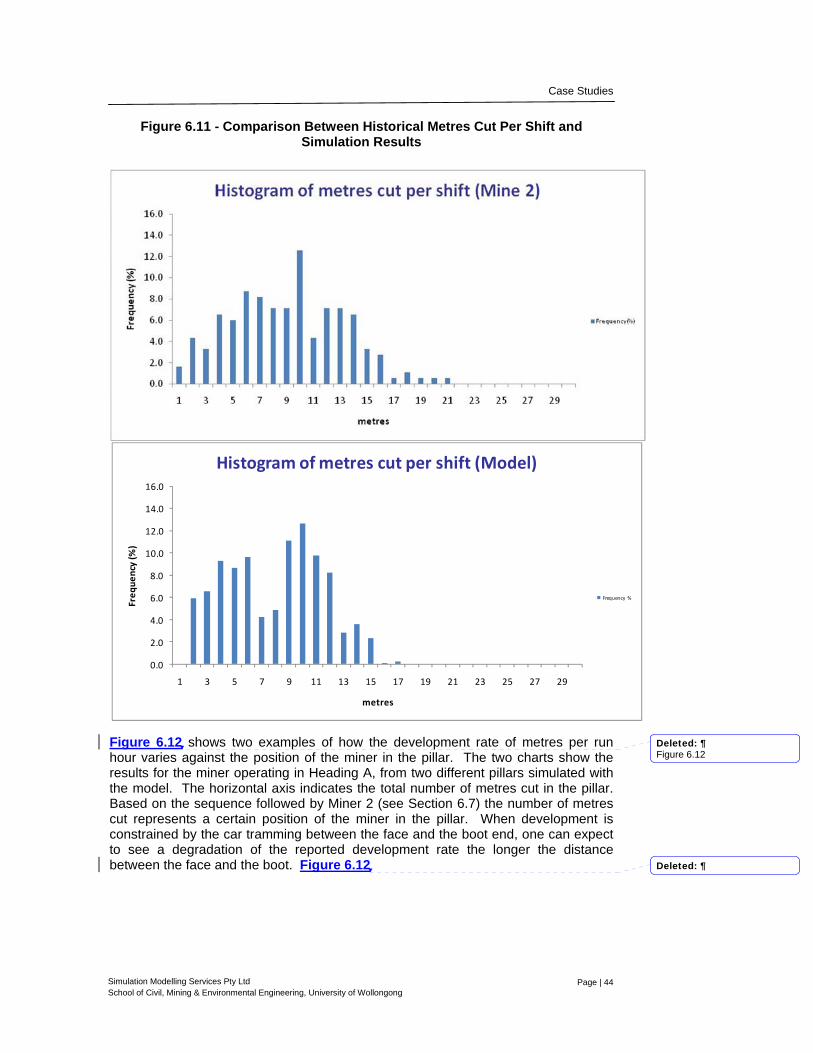
Figure 6.11 compares the histograms of the historical metres cut per shift and the metres cut per shift reported using RoadSIM. It can be observed that the overall range of metres cut per shift is similar in both charts. Individual percentages reported for each bin in the histogram (bottom chart) are somewhat comparable to the historical data (top chart), however, the alignment between the two charts is not as close as it may have been expected. This seems to indicate that even though RoadSIM has been able to replicate the overall historical performance at Mine 2 (see Table 6.8) the performance at a more detailed shift level is not as precise.
Deleted: 
Deleted: Table 6.8
Case Studies
Page | 44
Simulation Modelling Services Pty Ltd School of Civil, Mining & Environmental Engineering, University of Wollongong
0.0
2.0
4.0
6.0
8.0
10.0
12.0
14.0
16.0
1 3 5 7 9 11 13 15 17 19 21 23 25 27 29
Freq
uency (%
)
metres
Histogram of metres cut per shift (Model)
Frequency %
Figure 6.11 - Comparison Between Historical Metres Cut Per Shift and
Simulation Results
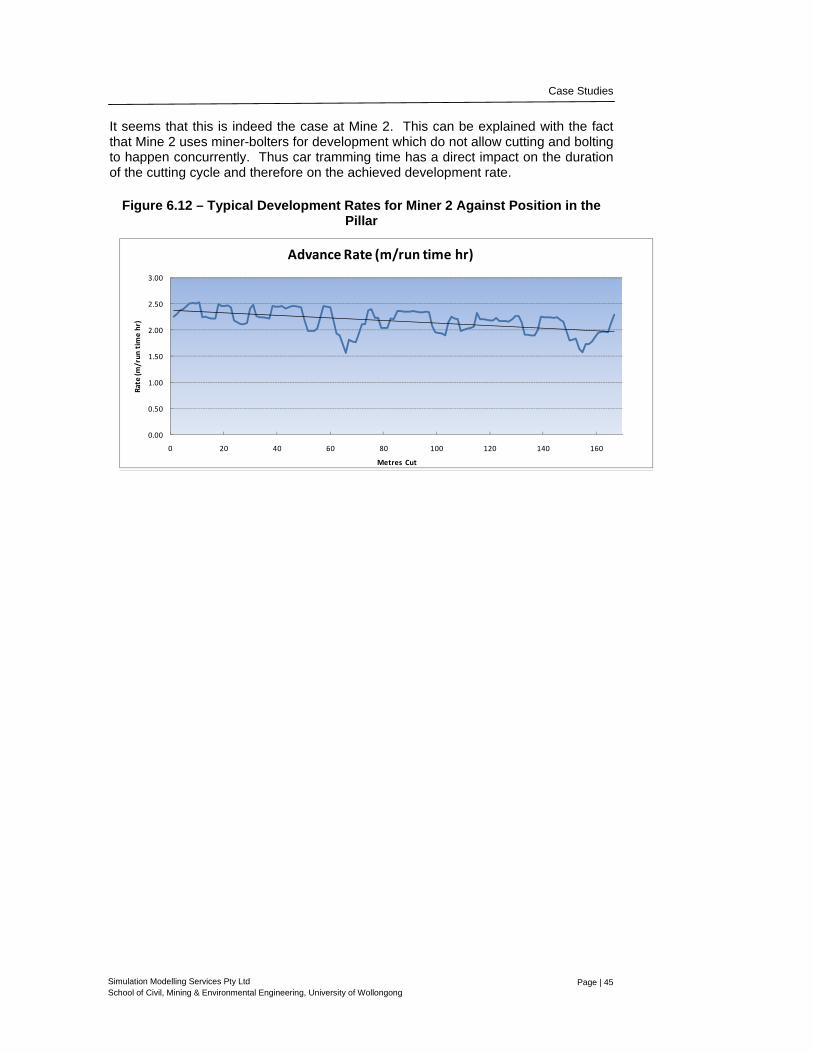
Figure 6.12 shows two examples of how the development rate of metres per run hour varies against the position of the miner in the pillar. The two charts show the results for the miner operating in Heading A, from two different pillars simulated with the model. The horizontal axis indicates the total number of metres cut in the pillar. Based on the sequence followed by Miner 2 (see Section 6.7) the number of metres cut represents a certain position of the miner in the pillar. When development is constrained by the car tramming between the face and the boot end, one can expect to see a degradation of the reported development rate the longer the distance between the face and the boot. Figure 6.12
Deleted: ¶Figure 6.12
Deleted: 
Case Studies
Page | 45
Simulation Modelling Services Pty Ltd School of Civil, Mining & Environmental Engineering, University of Wollongong
0.00
0.50
1.00
1.50
2.00
2.50
3.00
0 20 40 60 80 100 120 140 160
Rate (m
/run
tim
e hr)
Metres Cut
Advance Rate (m/run time hr)
It seems that this is indeed the case at Mine 2. This can be explained with the fact that Mine 2 uses miner-bolters for development which do not allow cutting and bolting to happen concurrently. Thus car tramming time has a direct impact on the duration of the cutting cycle and therefore on the achieved development rate.
Figure 6.12 – Typical Development Rates for Miner 2 Against Position in the Pillar
Page | 46
Simulation Modelling Services Pty Ltd School of Civil, Mining & Environmental Engineering, University of Wollongong
7.0 DATA RELATED ISSUES The effort required to provide suitable data for running RoadSIM will vary significantly from operation to operation. The level of detail required and the precision needed of data will also depend on the intended use of the RoadSIM results. Typically data will be required to define:
• equipment performance; • availability; • delay profiles; and • development rates achieved.
Without onboard data logging it can be difficult to assess cycle time for equipment, other than by direct measurement or by using “best estimate” values obtained from experienced operators. However, if the assumptions are too far out this should be picked up during model validation. If any doubt still exists as to the reliability of particular data items then a sensitivity analysis can be conducted using the model to determine how significant that data item is too estimates of overall performance. Determining overall historical system availability should not prove too time consuming, care, however, needs to be taken with definitions of terms such as available time or operating time as they can vary from mine to mine. Determining downtime profiles for various types of delays can be time consuming. The lack of standardisation in terms of delay categories has made it difficult for the RoadSIM system to obtain data directly from all mine downtime report or logs. In the case study mines varying degrees of effort were required to suitably categorise downtimes into the RoadSIM categories before they can be entered into the model setup. The development rates achieved are required for model validation, rather than configuration or analysis of options. These data in general are reasonably accessible. Even when not directly available they can usually be determined by correlating metres advanced from survey reports with recorded operating hours per shift. Subsequent work has indicated that useful results can still be obtained from RoadSIM even without detailed downtime data. If unplanned downtime is omitted from the model setup the modelling can still be used estimate (though not quite as accurately) the advance rate per hour of runtime. Assuming overall system availability is known metres/run hour can then be scaled up to allow estimates of say days to advance 1000 m(linear). This approach requires less time/effort to set up the model and may be useful for broad brush reviews.
Page | 47
Simulation Modelling Services Pty Ltd School of Civil, Mining & Environmental Engineering, University of Wollongong
8.0 TECHNOLOGY TRANSFER During the course of the project a number of activities were undertaken to introduce the concepts and technology to industry. Some of the activities were funded by ACARP others were undertaken separately. The principal activities undertaken to allow technology transfer throughout the project included:
• Delivery of a paper at the 2009 Coal Conference in Wollongong • Attendance and short presentations at general ACARP workshops in:
o Pokolbin; o Penrith; and o Mackay;
• Conducting full day RoadSIM workshops in: o Wollongong; and o Mackay;
• Delivery of a paper at the APCOM 2009 Conference in Vancouver, Canada; • Setting up demonstration systems at the case study mine sites.
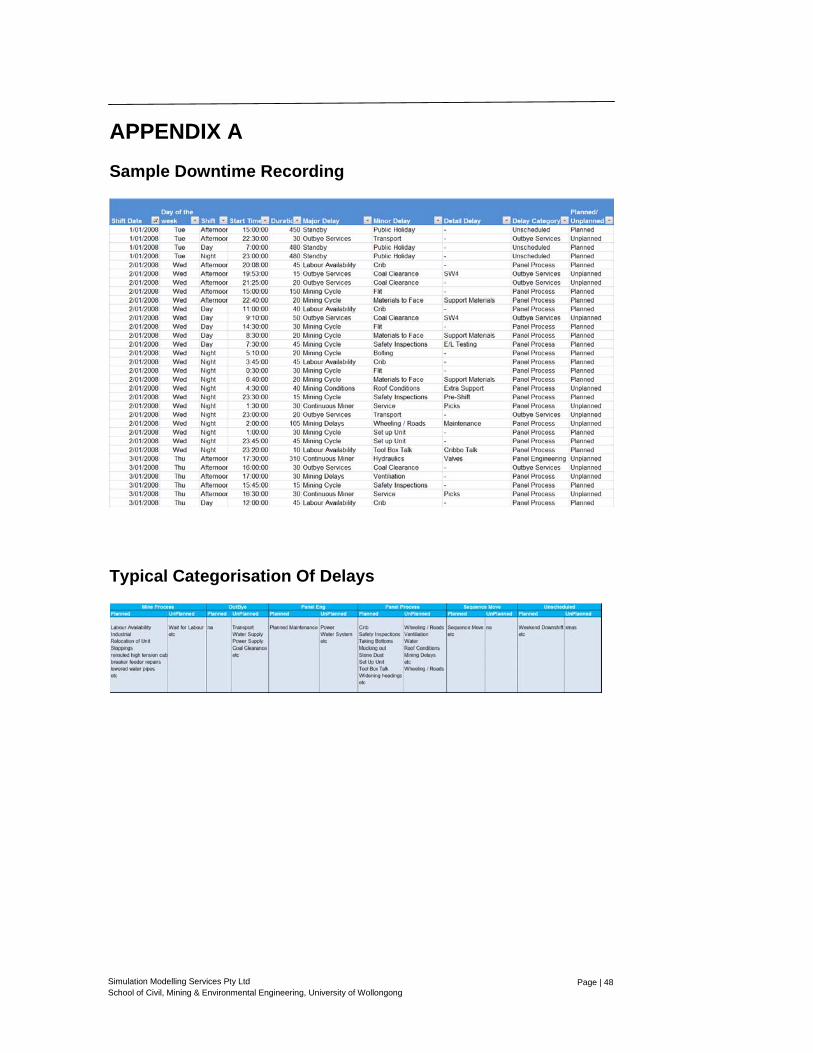
Page | 48
Simulation Modelling Services Pty Ltd School of Civil, Mining & Environmental Engineering, University of Wollongong
APPENDIX A Sample Downtime Recording
Typical Categorisation Of Delays
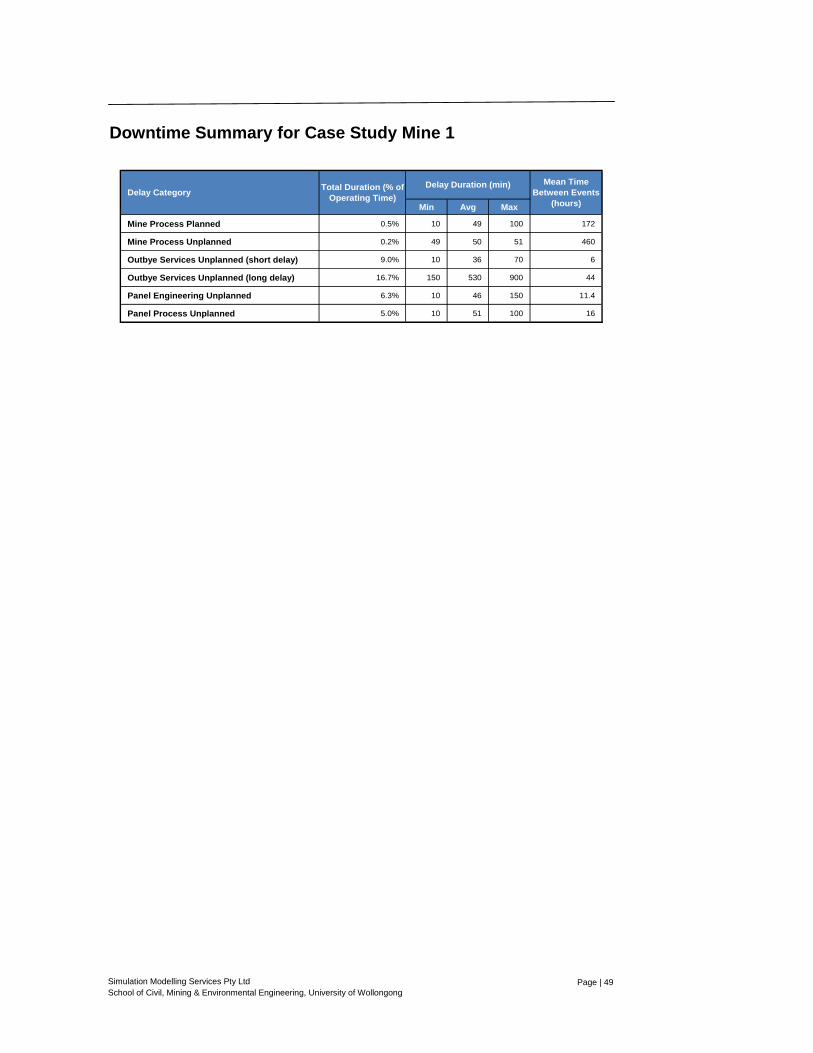
Page | 49
Simulation Modelling Services Pty Ltd School of Civil, Mining & Environmental Engineering, University of Wollongong
Downtime Summary for Case Study Mine 1
Min Avg Max
Mine Process Planned 0.5% 10 49 100 172
Mine Process Unplanned 0.2% 49 50 51 460
Outbye Services Unplanned (short delay) 9.0% 10 36 70 6
Outbye Services Unplanned (long delay) 16.7% 150 530 900 44
Panel Engineering Unplanned 6.3% 10 46 150 11.4
Panel Process Unplanned 5.0% 10 51 100 16
Delay Duration (min)Delay Category Total Duration (% of
Operating Time)
Mean Time Between Events
(hours)
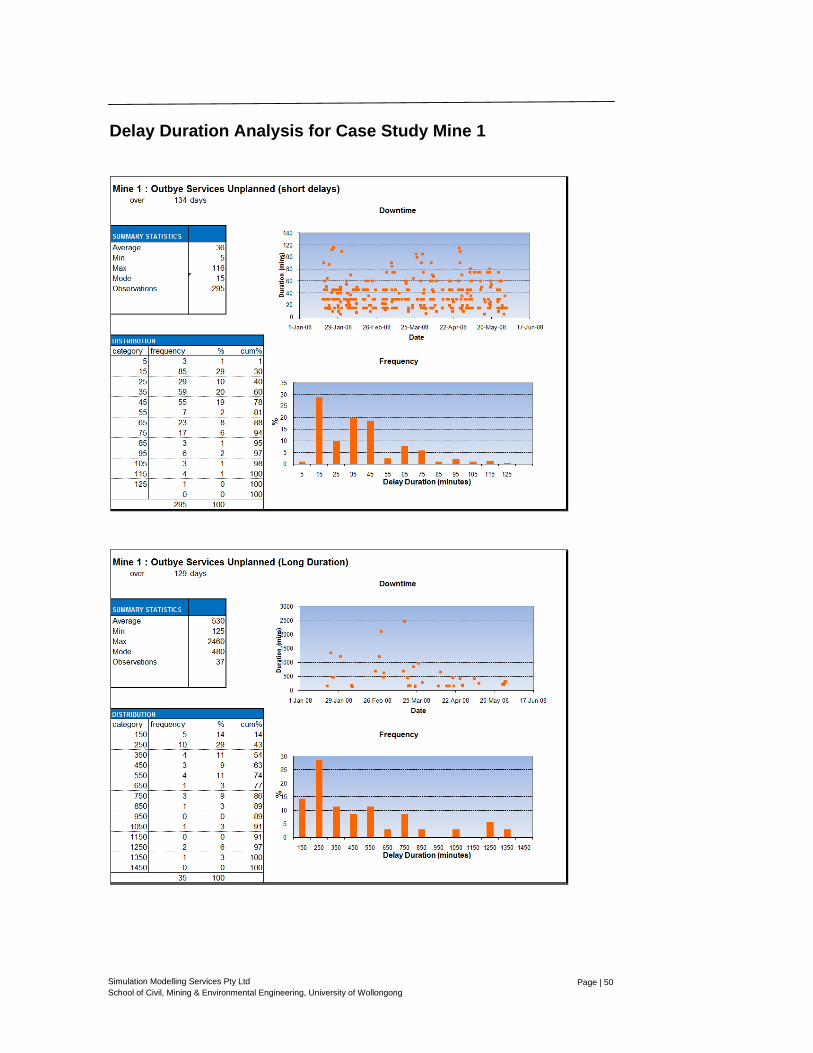
Page | 50
Simulation Modelling Services Pty Ltd School of Civil, Mining & Environmental Engineering, University of Wollongong
Delay Duration Analysis for Case Study Mine 1
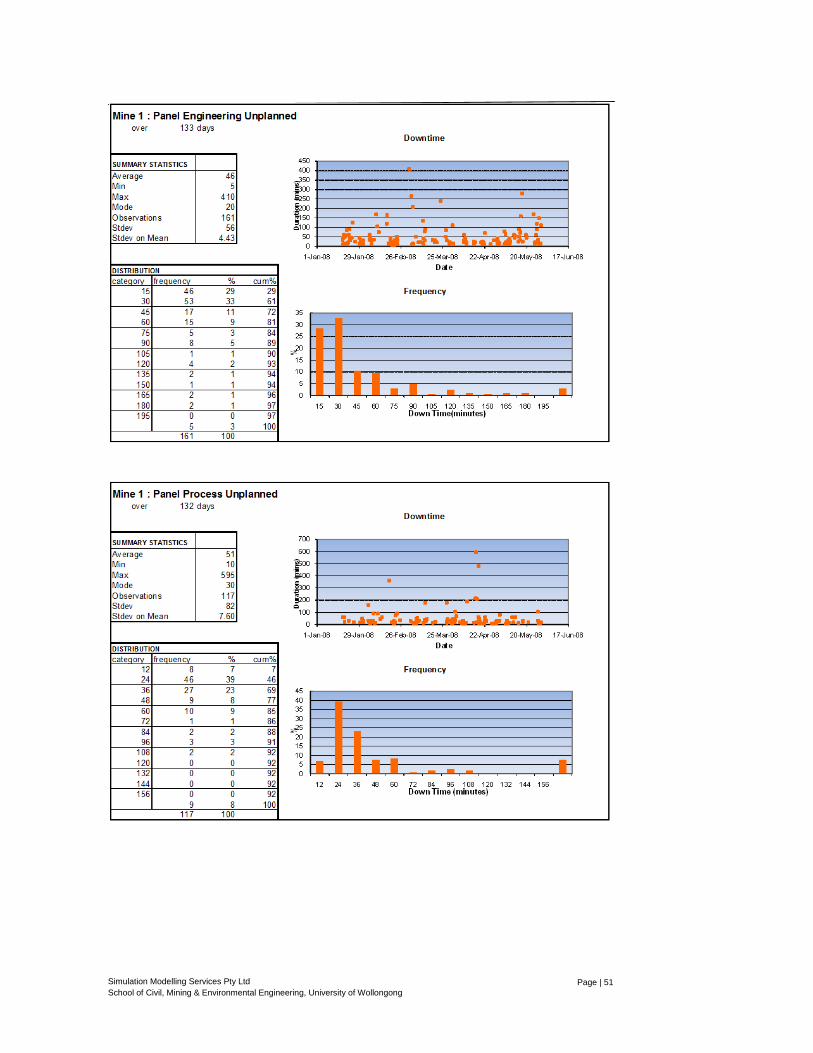
Page | 51
Simulation Modelling Services Pty Ltd School of Civil, Mining & Environmental Engineering, University of Wollongong
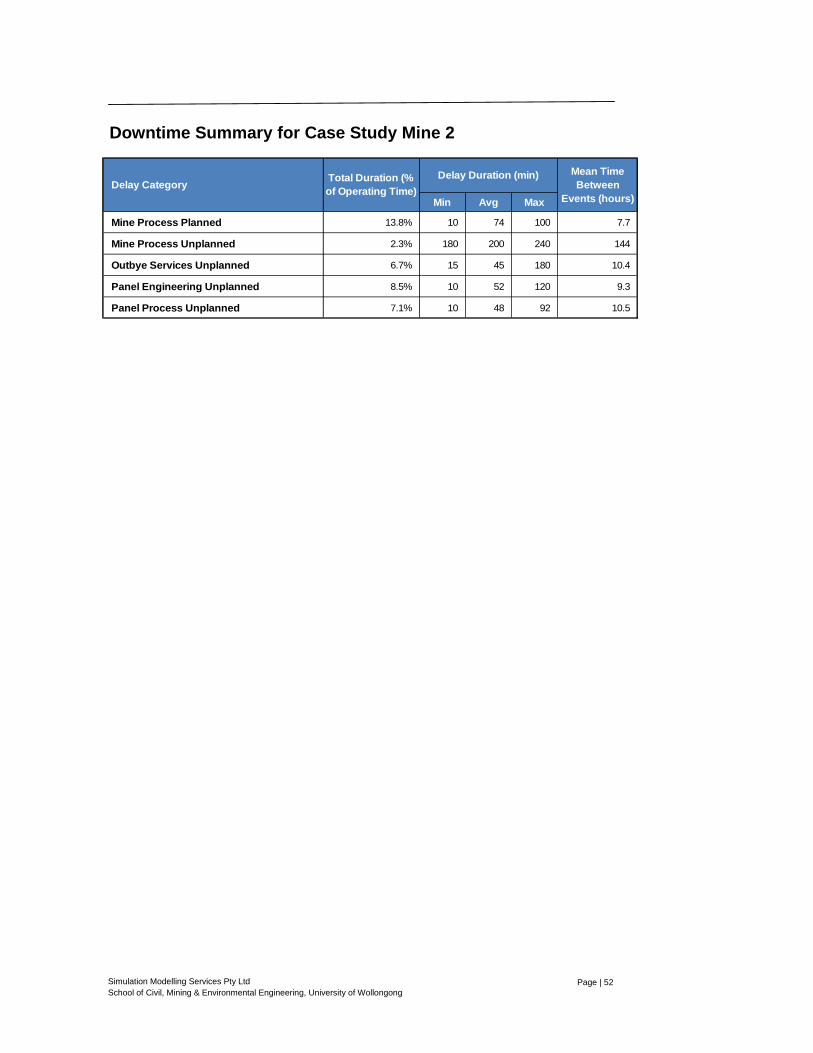
Page | 52
Simulation Modelling Services Pty Ltd School of Civil, Mining & Environmental Engineering, University of Wollongong
Min Avg Max
Mine Process Planned 13.8% 10 74 100 7.7
Mine Process Unplanned 2.3% 180 200 240 144
Outbye Services Unplanned 6.7% 15 45 180 10.4
Panel Engineering Unplanned 8.5% 10 52 120 9.3
Panel Process Unplanned 7.1% 10 48 92 10.5
Delay Category Total Duration (% of Operating Time)
Delay Duration (min) Mean Time Between
Events (hours)
Downtime Summary for Case Study Mine 2
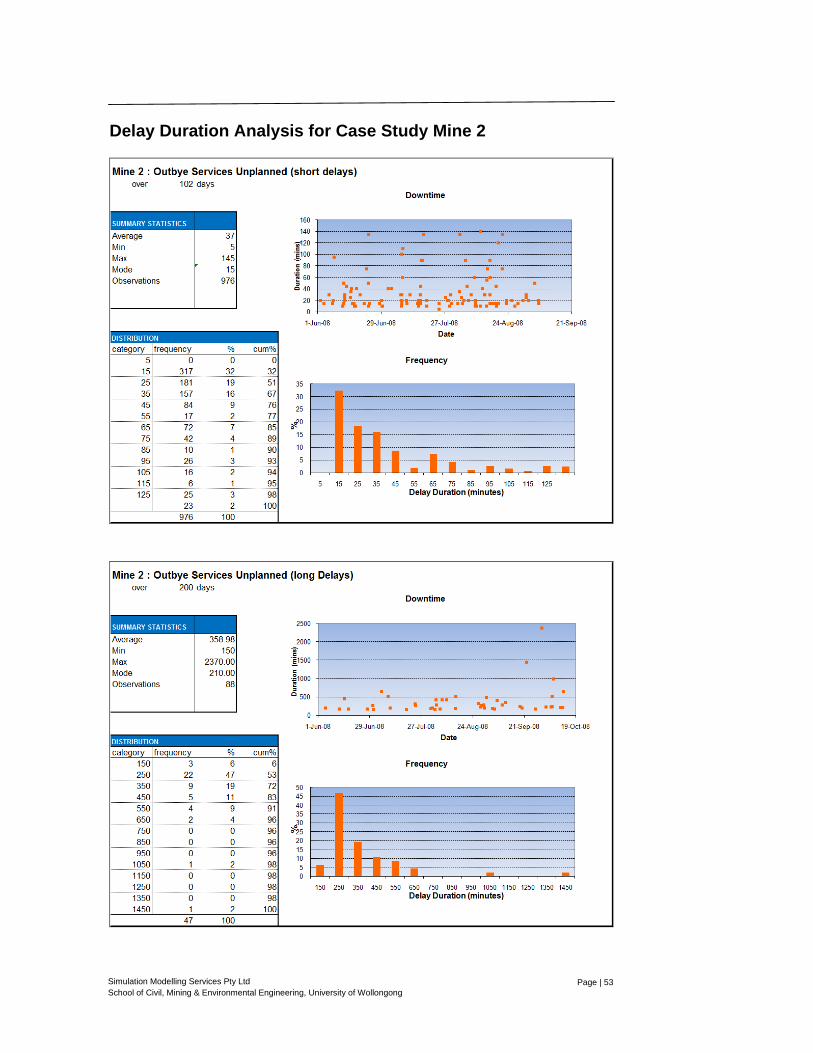
Page | 53
Simulation Modelling Services Pty Ltd School of Civil, Mining & Environmental Engineering, University of Wollongong
Delay Duration Analysis for Case Study Mine 2
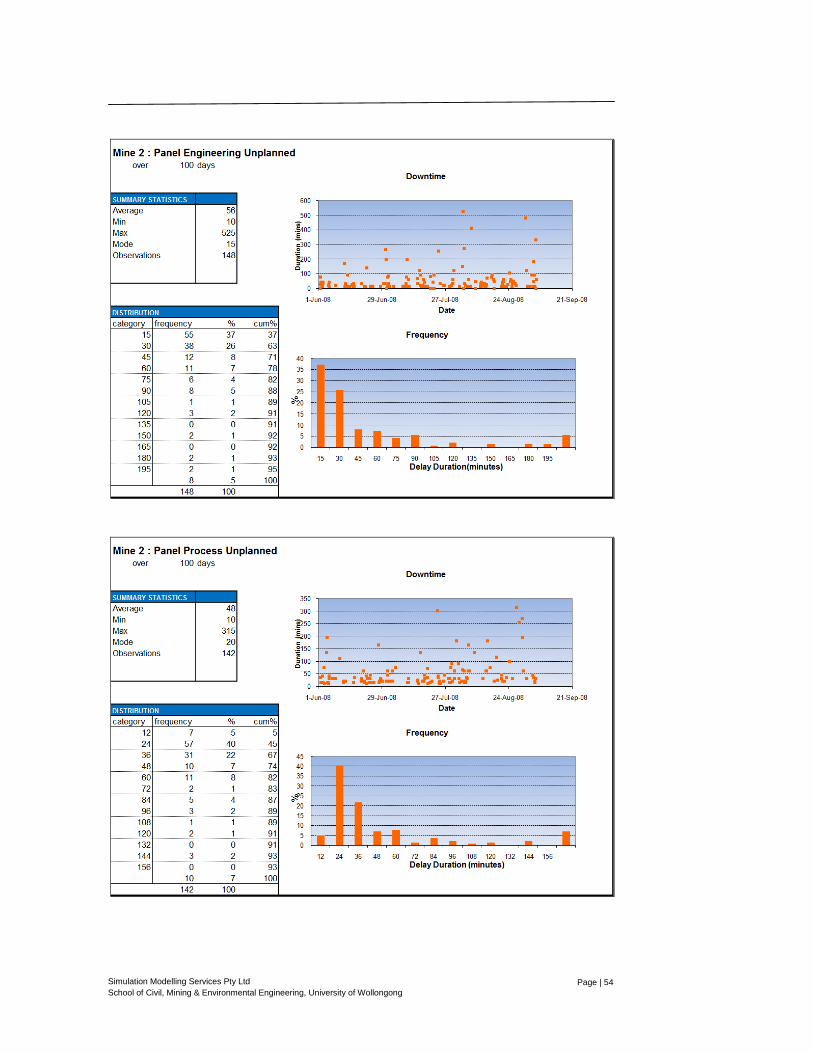
Page | 54
Simulation Modelling Services Pty Ltd School of Civil, Mining & Environmental Engineering, University of Wollongong
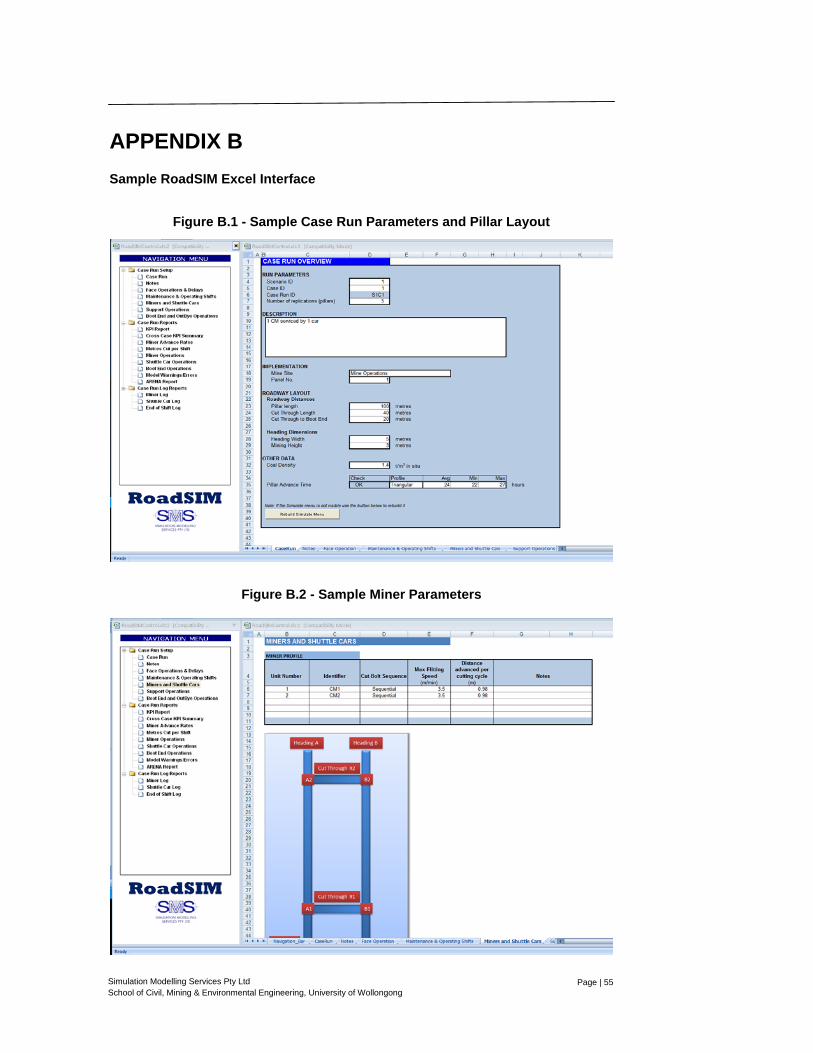
Page | 55
Simulation Modelling Services Pty Ltd School of Civil, Mining & Environmental Engineering, University of Wollongong
APPENDIX B Sample RoadSIM Excel Interface
Figure B.1 - Sample Case Run Parameters and Pillar Layout
Figure B.2 - Sample Miner Parameters
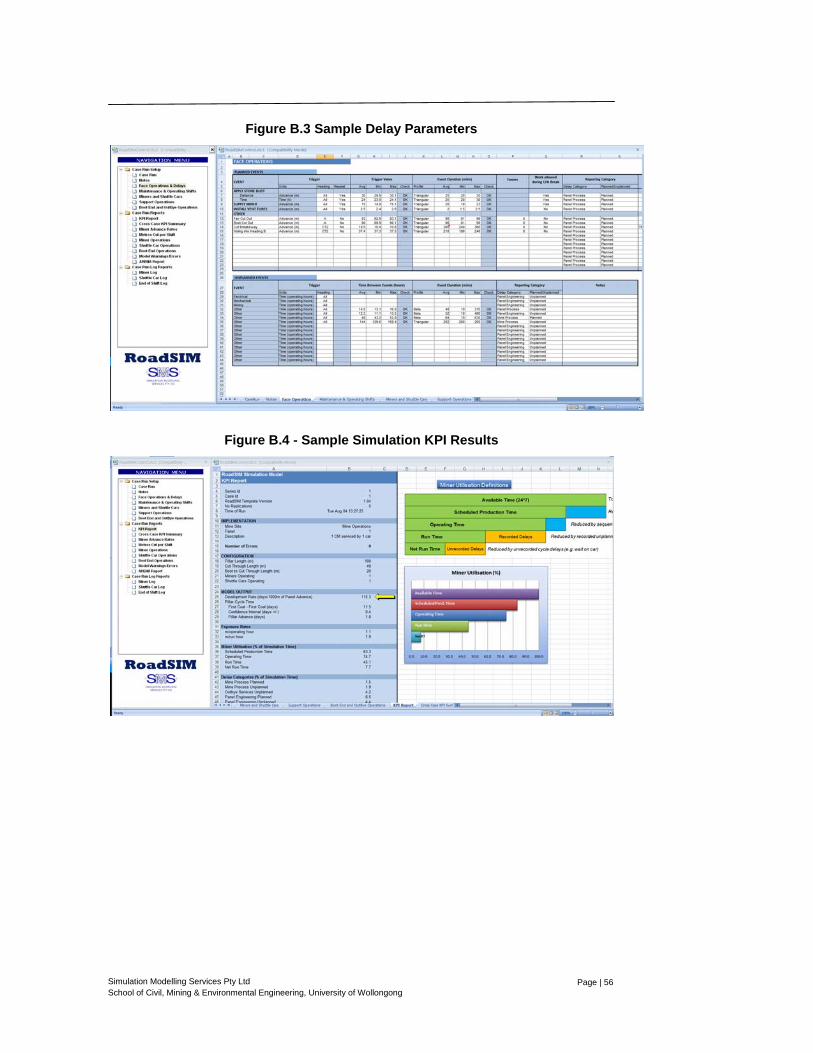
Page | 56
Simulation Modelling Services Pty Ltd School of Civil, Mining & Environmental Engineering, University of Wollongong
Figure B.3 Sample Delay Parameters
Figure B.4 - Sample Simulation KPI Results
Related Documents