The MJO signal in The MJO signal in tropical cyclone tropical cyclone activity activity A study using a genesis A study using a genesis potential index potential index Suzana J. Camargo Suzana J. Camargo Lamont-Doherty Earth Observatory, Columbia University, Palisades, NY Lamont-Doherty Earth Observatory, Columbia University, Palisades, NY Matthew C. Wheeler Matthew C. Wheeler Centre for Australian Weather and Climate Research, Melbourne, Australia Centre for Australian Weather and Climate Research, Melbourne, Australia Adam H. Sobel Adam H. Sobel Columbia University, New York, NY Columbia University, New York, NY

The MJO signal in tropical cyclone activity A study using a genesis potential index Suzana J. Camargo Lamont-Doherty Earth Observatory, Columbia University,
Jan 01, 2016
Welcome message from author
This document is posted to help you gain knowledge. Please leave a comment to let me know what you think about it! Share it to your friends and learn new things together.
Transcript
The MJO signal in tropical The MJO signal in tropical cyclone activity cyclone activity
A study using a genesis potential indexA study using a genesis potential index
Suzana J. Camargo Suzana J. Camargo Lamont-Doherty Earth Observatory, Columbia University, Palisades, NYLamont-Doherty Earth Observatory, Columbia University, Palisades, NY
Matthew C. WheelerMatthew C. WheelerCentre for Australian Weather and Climate Research, Melbourne, AustraliaCentre for Australian Weather and Climate Research, Melbourne, Australia
Adam H. SobelAdam H. SobelColumbia University, New York, NYColumbia University, New York, NY

The convective phase of the MJO brings increased TC The convective phase of the MJO brings increased TC activity in many basins. By what mechanism does this activity in many basins. By what mechanism does this occur? occur?
We examine this using an empirical genesis potential We examine this using an empirical genesis potential index. To the extent that the GP index captures theindex. To the extent that the GP index captures the
MJO signal in TC activity, it gives us an objectiveMJO signal in TC activity, it gives us an objective
way to compare quantitatively the influence of way to compare quantitatively the influence of
different environmental factors (humidity, wind sheardifferent environmental factors (humidity, wind shear
etc.) all of which are modulated by the MJO.etc.) all of which are modulated by the MJO.
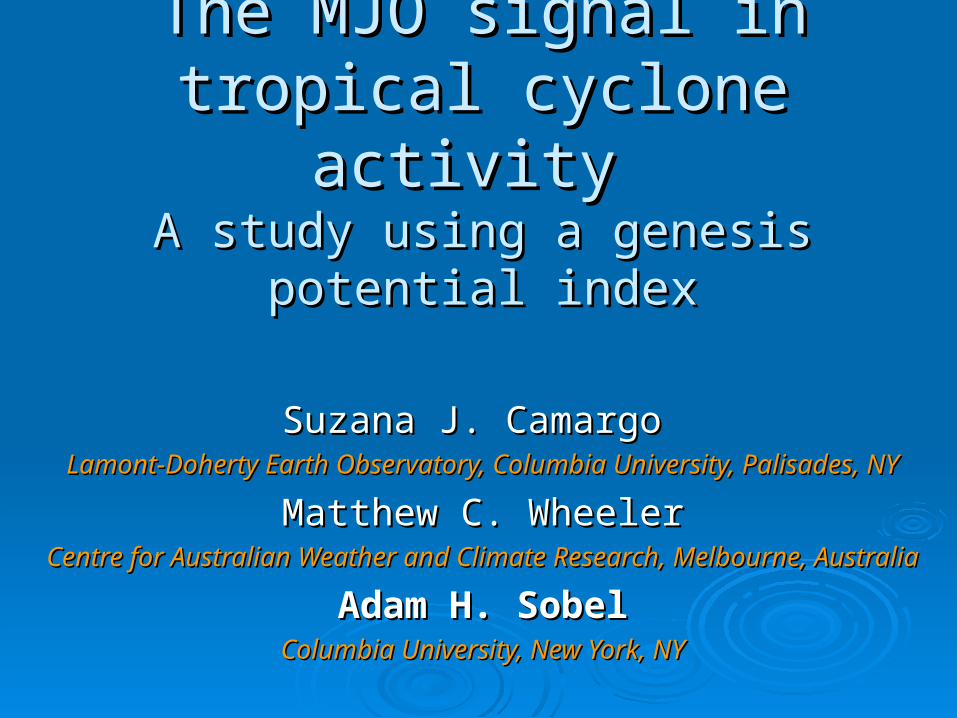
GP= |10GP= |1055 ηη||3/23/2 ( (/50)/50)33 (V (Vpotpot/70)/70)33 (1+0.1V (1+0.1Vshearshear))-2-2
ηη = = absolute vorticityabsolute vorticity at 850hPa (s at 850hPa (s-1-1)) = = relative humidityrelative humidity at 700hPa (%) at 700hPa (%)
VVpot pot = = potential intensitypotential intensity (m/s) as per Emanuel. (m/s) as per Emanuel.
VVshearshear = = magnitude of the vertical wind shearmagnitude of the vertical wind shear between between 200 and 850hPa (m/s).200 and 850hPa (m/s).
K.A. Emanuel and D. Nolan, 26th AMS Conf. Hurricanes & Tropical Meteorology, 2004.Camargo, Emanuel and Sobel, J. Climate, 20, 4819-4834.
We use the Emanuel-Nolan genesis potential index. The idea follows Gray (1979)(but e.g. no SST threshold)

We use the real-time multivariate MJO index of Wheeler and We use the real-time multivariate MJO index of Wheeler and Hendon (2004) to define the MJO phase and amplitude.Hendon (2004) to define the MJO phase and amplitude.
Composite OLR anomalies (shading, hatched=positive)and 850 hPa wind anomaliesassociated with 8 phases of the MJO
We compute MJO anomaly composites for the GPI (computed from NCEP Reanalysis data – similar results from ECMWF) and for observed TC genesis density and track density (computed from best track data sets).

GPI Anomaly composites - JFMGPI Anomaly composites - JFM
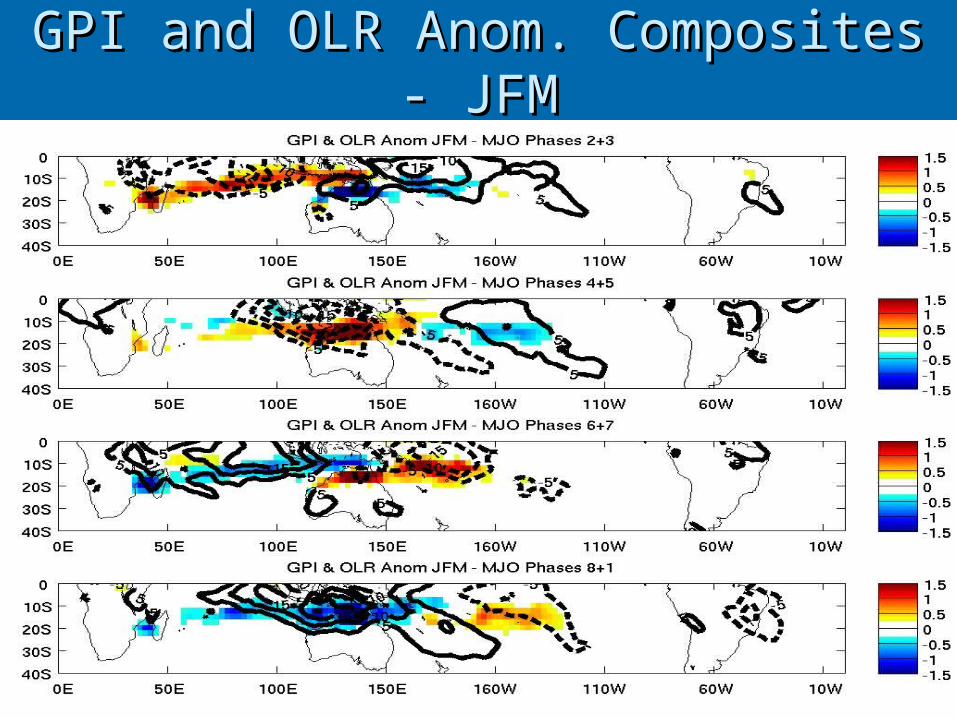
GPI and OLR Anom. Composites - JFMGPI and OLR Anom. Composites - JFM

Track Density Anom. composites - JFMTrack Density Anom. composites - JFM
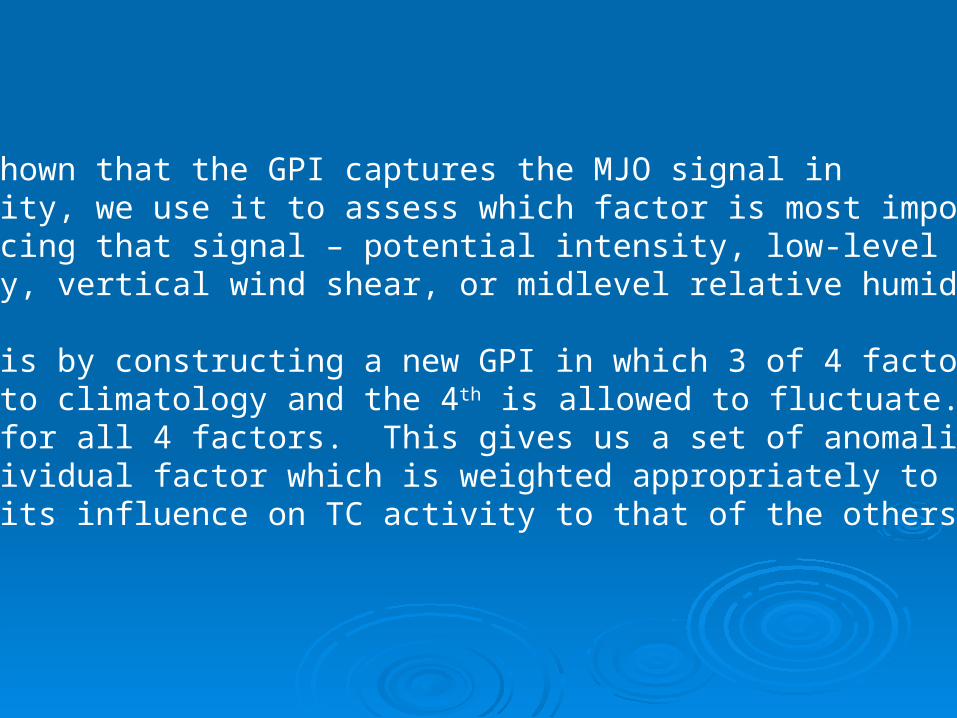
Having shown that the GPI captures the MJO signal in TC activity, we use it to assess which factor is most importantin producing that signal – potential intensity, low-level absolutevorticity, vertical wind shear, or midlevel relative humidity?
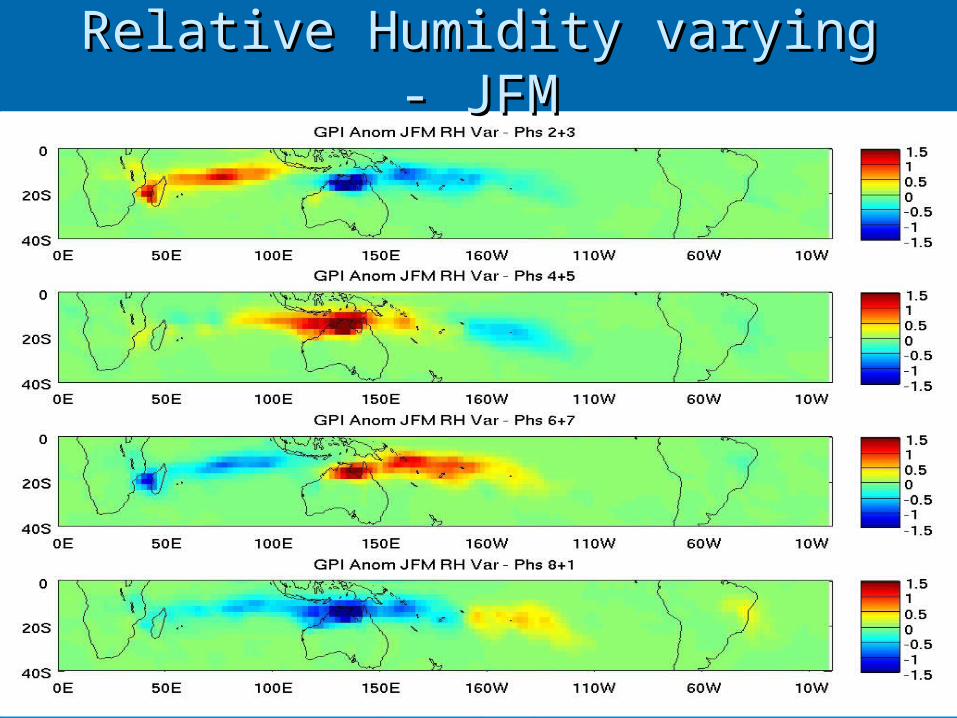
We do this by constructing a new GPI in which 3 of 4 factorsare set to climatology and the 4th is allowed to fluctuate. Wedo this for all 4 factors. This gives us a set of anomalies ineach individual factor which is weighted appropriately to compare its influence on TC activity to that of the others.
Relative Humidity varying - JFMRelative Humidity varying - JFM

Vorticity varying - JFMVorticity varying - JFM
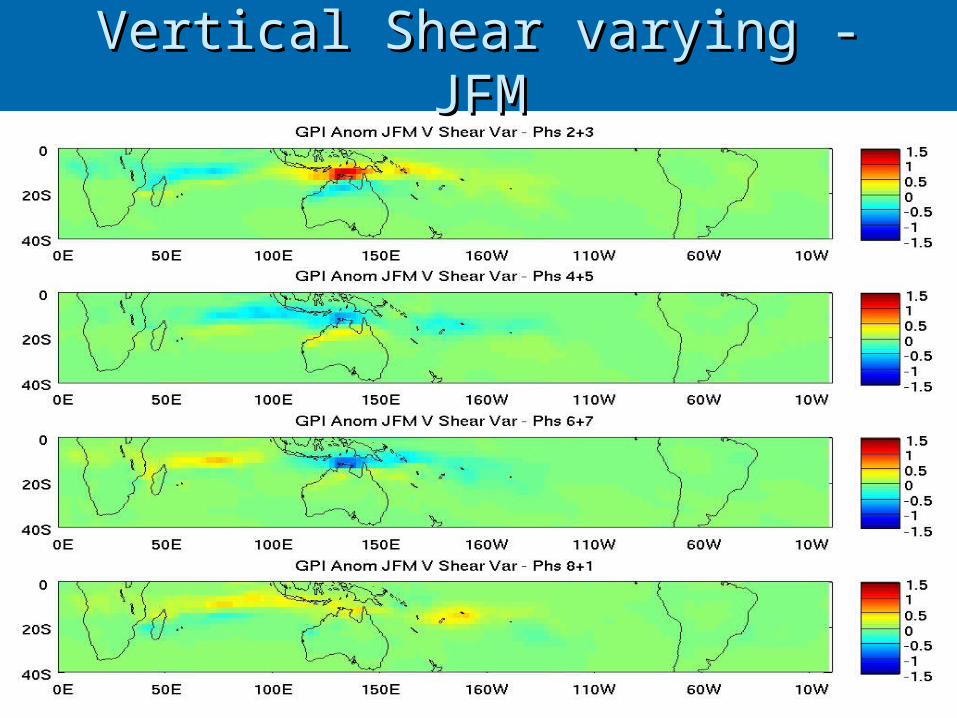
Vertical Shear varying - JFMVertical Shear varying - JFM

Potential Intensity Varying - JFMPotential Intensity Varying - JFM
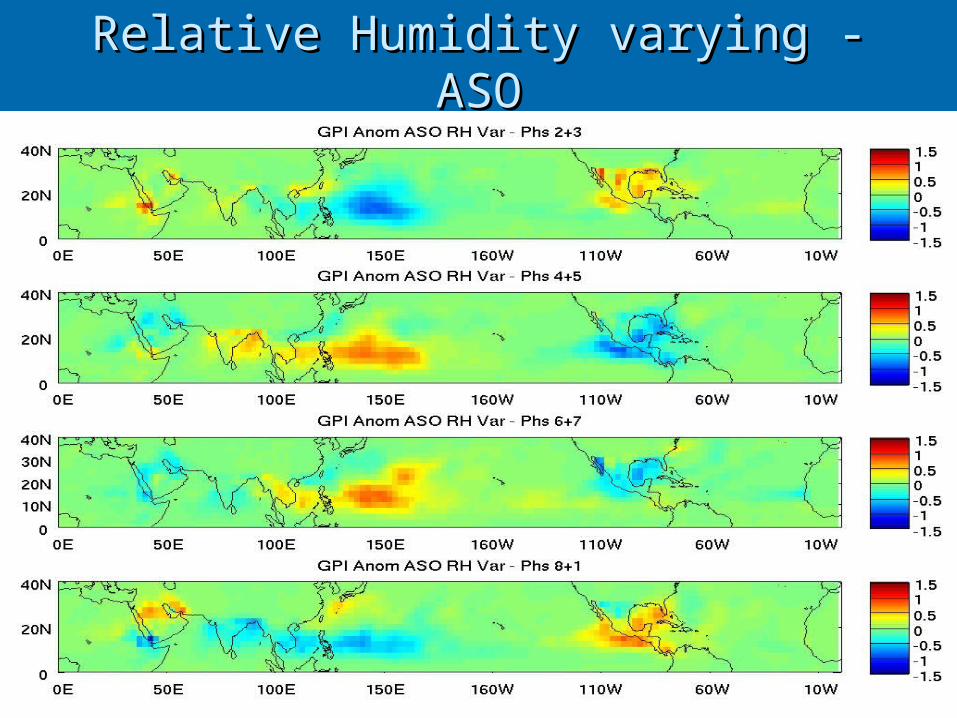
Relative Humidity varying - ASORelative Humidity varying - ASO
ConclusionsConclusions
The GP index is able to capture the observed The GP index is able to capture the observed TC activity variations with the MJO, qualitatively TC activity variations with the MJO, qualitatively and quantitatively.and quantitatively.
Parsing the GP into its various factors, relative Parsing the GP into its various factors, relative humidity makes the largest contribution to the humidity makes the largest contribution to the MJO enhancement to TC activity. Vorticity also MJO enhancement to TC activity. Vorticity also contributes, vertical shear goes the wrong way, contributes, vertical shear goes the wrong way, PI (which incorporates column stability and SST) PI (which incorporates column stability and SST) is relatively unimportant. is relatively unimportant.
Paper in review for J. Climate, available at www.columbia.edu/~ahs129/pubs.html

GPI Anom. Composites - ASOGPI Anom. Composites - ASO
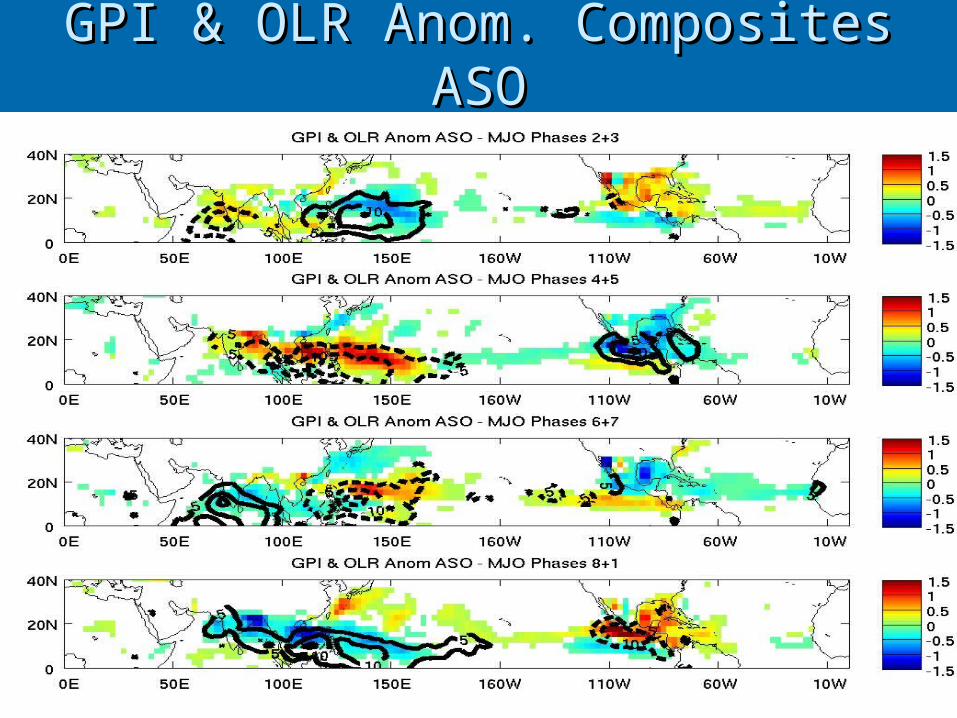
GPI & OLR Anom. Composites ASOGPI & OLR Anom. Composites ASO
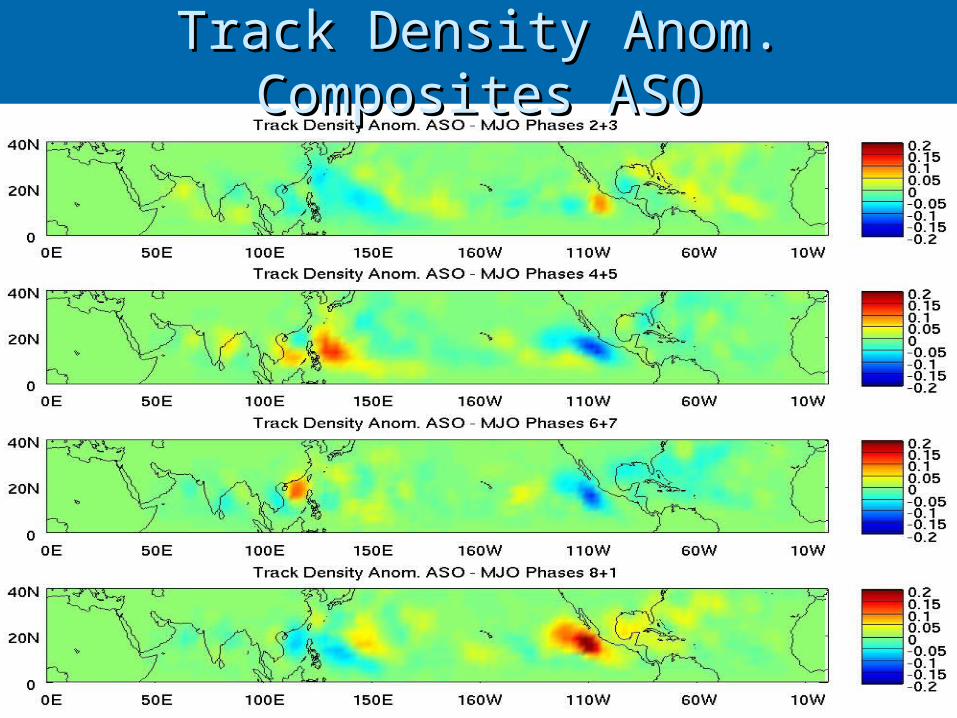
Track Density Anom. Composites ASOTrack Density Anom. Composites ASO
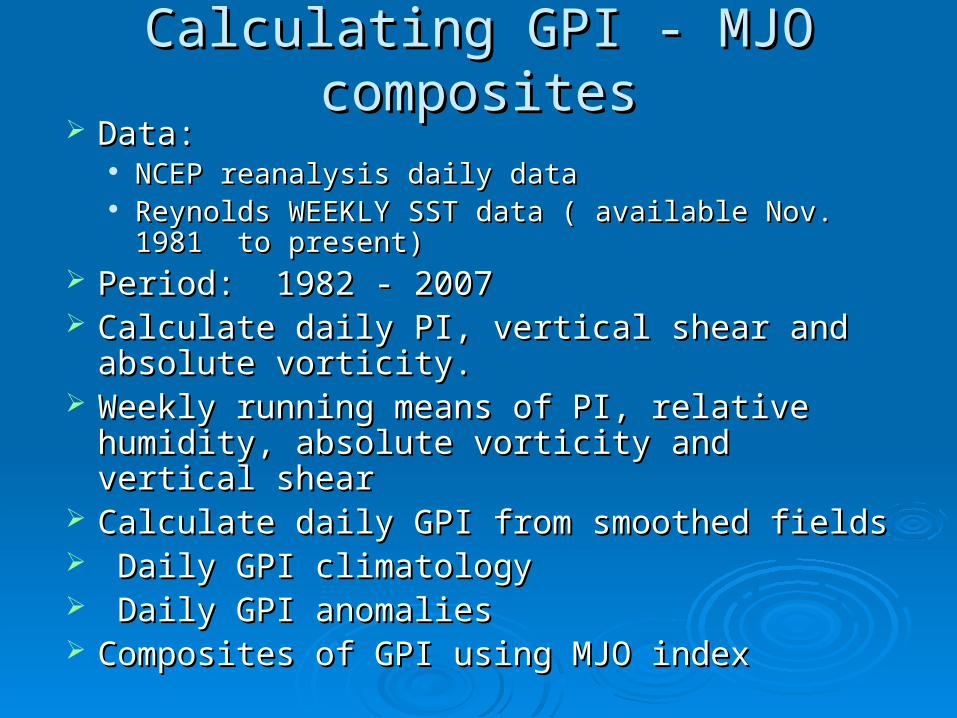
Calculating GPI - MJO compositesCalculating GPI - MJO composites Data:Data:
NCEP reanalysis daily dataNCEP reanalysis daily data Reynolds WEEKLY SST data ( available Nov. 1981 Reynolds WEEKLY SST data ( available Nov. 1981
to present)to present) Period: 1982 - 2007 Period: 1982 - 2007 Calculate daily PI, vertical shear and absolute Calculate daily PI, vertical shear and absolute
vorticity.vorticity. Weekly running means of PI, relative humidity, Weekly running means of PI, relative humidity,
absolute vorticity and vertical shear absolute vorticity and vertical shear Calculate daily GPI from smoothed fieldsCalculate daily GPI from smoothed fields Daily GPI climatologyDaily GPI climatology Daily GPI anomaliesDaily GPI anomalies Composites of GPI using MJO indexComposites of GPI using MJO index
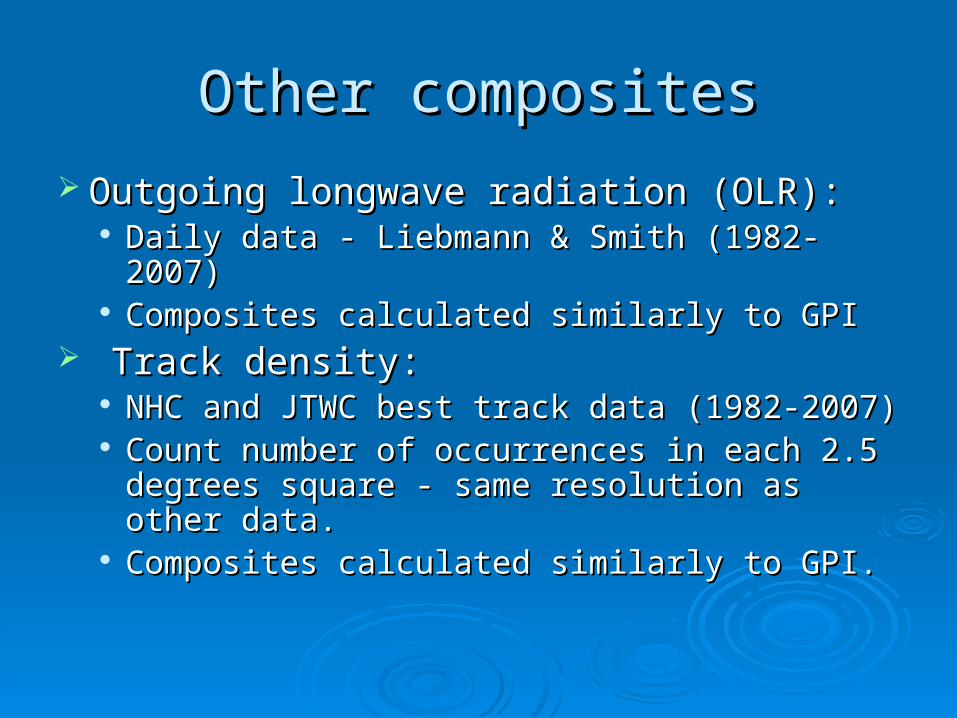
Other compositesOther composites
Outgoing longwave radiation (OLR):Outgoing longwave radiation (OLR): Daily data - Liebmann & Smith (1982-2007)Daily data - Liebmann & Smith (1982-2007) Composites calculated similarly to GPIComposites calculated similarly to GPI
Track density:Track density: NHC and JTWC best track data (1982-2007)NHC and JTWC best track data (1982-2007) Count number of occurrences in each 2.5 Count number of occurrences in each 2.5
degrees square - same resolution as other degrees square - same resolution as other data.data.
Composites calculated similarly to GPI.Composites calculated similarly to GPI.
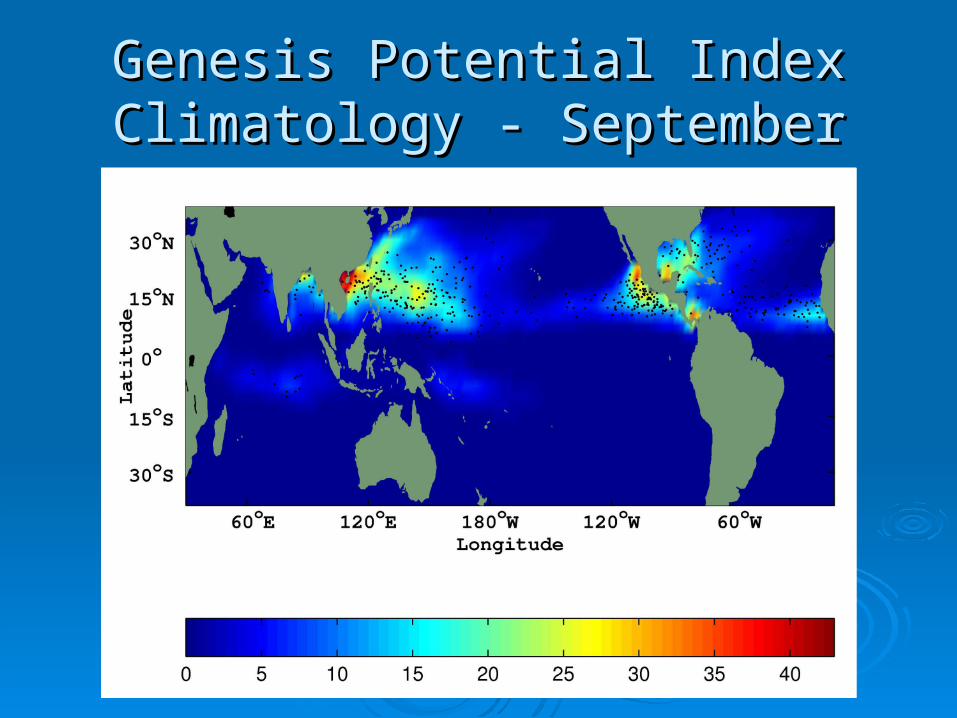
Genesis Potential Index Genesis Potential Index Climatology - SeptemberClimatology - September
Related Documents