The Mitochondrial Genome of Elodia flavipalpis Aldrich (Diptera: Tachinidae) and the Evolutionary Timescale of Tachinid Flies Zhe Zhao 1,2 , Tian-juan Su 2 , Douglas Chesters 2 , Shi-di Wang 1 , Simon Y. W. Ho 3 , Chao-dong Zhu 2 *, Xiao- lin Chen 2 *, Chun-tian Zhang 1 * 1 Liaoning Key Laboratory of Evolution and Biodiversity, Shenyang Normal University, Shenyang, Liaoning, China, 2 Key Laboratory of Zoological Systematics and Evolution, Institute of Zoology, Chinese Academy of Sciences, Beijing, China, 3 School of Biological Sciences, University of Sydney, Sydney, New South Wales, Australia Abstract Tachinid flies are natural enemies of many lepidopteran and coleopteran pests of forests, crops, and fruit trees. In order to address the lack of genetic data in this economically important group, we sequenced the complete mitochondrial genome of the Palaearctic tachinid fly Elodia flavipalpis Aldrich, 1933. Usually found in Northern China and Japan, this species is one of the primary natural enemies of the leaf-roller moths (Tortricidae), which are major pests of various fruit trees. The 14,932- bp mitochondrial genome was typical of Diptera, with 13 protein-coding genes, 22 tRNA genes, and 2 rRNA genes. However, its control region is only 105 bp in length, which is the shortest found so far in flies. In order to estimate dipteran evolutionary relationships, we conducted a phylogenetic analysis of 58 mitochondrial genomes from 23 families. Maximum- likelihood and Bayesian methods supported the monophyly of both Tachinidae and superfamily Oestroidea. Within the subsection Calyptratae, Muscidae was inferred as the sister group to Oestroidea. Within Oestroidea, Calliphoridae and Sarcophagidae formed a sister clade to Oestridae and Tachinidae. Using a Bayesian relaxed clock calibrated with fossil data, we estimated that Tachinidae originated in the middle Eocene. Citation: Zhao Z, Su T-j, Chesters D, Wang S-d, Ho SYW, et al. (2013) The Mitochondrial Genome of Elodia flavipalpis Aldrich (Diptera: Tachinidae) and the Evolutionary Timescale of Tachinid Flies. PLoS ONE 8(4): e61814. doi:10.1371/journal.pone.0061814 Editor: Daniel Doucet, Natural Resources Canada, Canada Received January 20, 2012; Accepted March 18, 2013; Published April 23, 2013 Copyright: ß 2013 Zhao et al. This is an open-access article distributed under the terms of the Creative Commons Attribution License, which permits unrestricted use, distribution, and reproduction in any medium, provided the original author and source are credited. Funding: This work was supported mainly by a grant from the Knowledge Innovation Program of Chinese Academy of Sciences (grant KSXC2-EW-B-02), Public Welfare Project from the Ministry of Agriculture, China (grant 201103024), and the National Science Foundation, China (grants 30870268, 31172048, J0930004) to Chao-dong Zhu; the National Science Foundation, China (grants 31093430, 31272279) to Chun-tian Zhang; National Special Science and Technology Foundation of China (2012FY111100) to Xiao-lin Chen and Chao-dong Zhu. The funders had no role in study design, data collection and analysis, decision to publish, or preparation of the manuscript. No additional external funding received for this study. Competing Interests: The authors have declared that no competing interests exist. * E-mail: [email protected] (CDZ); [email protected] (XLC); [email protected] (CTZ) Introduction Since the first insect mitochondrial genome (mitogenome) sequence was reported by Clary and Wolstenholme in 1985 [1], Diptera has remained the primary model system for mitogenomic research. This has included such diverse topics as species identification [2,3], molecular evolution and phylogenetic infer- ence [4–7], population structure and phylogeography [8–12], and genome structure and rearrangement [13–19]. Because of its small size and relative ease of sequencing, the number of mitogenome sequences has grown rapidly. As of January 2013, there are 64 complete or near-complete dipteran mitogenome sequences in GenBank, accounting for about 17.5% of the 365 insect mitogenomes that have been sequenced. In addition to the model organism Drosophila, most studies of Diptera have focused on taxa of medical and economic importance, such as the anopheline mosquitoes (Culicidae), which are vectors of malaria [20,21]; the fruit flies Ceratitis capitata and Bactrocera spp. (Tephritidae), which are serious agricultural pests [11,22]; the blowflies (Calliphoridae) and oestrid flies (Oestridae), which can cause myiasis [23,24]; and leaf-miners (Agromyzidae), which are vegetable and horticultural pests [16,25]. Tachinid flies have a worldwide distribution and comprise nearly 10,000 described species [29]. Despite Tachinidae being the second-largest dipteran family, the mitogenomes of only two species have been sequenced completely: Exorista sorbillans (Exoristinae, Exoristini) and Rutilia goerlingiana (Dexiinae; Rutiliini) [26,27,28]. They are natural enemies of many lepidopteran and coleopteran pests of forests, agricultural crops, and fruit trees, and thus are of economic importance. The Palaearctic tachinid fly, Elodia flavipalpis Aldrich, 1933 (Exoristinae, Goniini), is usually found in Northern China and Japan and is in the same subfamily, Exoristinae, as Ex. sorbillans [30,31]. It is one of the primary natural enemies of the leaf-roller moths (Tortricidae), which are major pests of various fruit trees [32,33]. The monophyly of Tachinidae is broadly supported by phylogenetic studies, but questions remain about its place in the superfamily Oestroidea, particularly the relationship between Tachinidae and several large families of Oestroidea [27,28,34–36]. There have been various studies of the divergence times of different groups of flies [7,11,12,37], with a recent study placing the rapid radiation of Schizophora 65 mya in the Paleocene [28]. However, owing to the uncertain taxonomic position of Tachinidae in Oestroidea, the evolutionary timescale of tachinid flies has not been well studied. PLOS ONE | www.plosone.org 1 April 2013 | Volume 8 | Issue 4 | e61814

Welcome message from author
This document is posted to help you gain knowledge. Please leave a comment to let me know what you think about it! Share it to your friends and learn new things together.
Transcript
The Mitochondrial Genome of Elodia flavipalpis Aldrich(Diptera: Tachinidae) and the Evolutionary Timescale ofTachinid FliesZhe Zhao1,2, Tian-juan Su2, Douglas Chesters2, Shi-di Wang1, Simon Y. W. Ho3, Chao-dong Zhu2*, Xiao-
lin Chen2*, Chun-tian Zhang1*
1 Liaoning Key Laboratory of Evolution and Biodiversity, Shenyang Normal University, Shenyang, Liaoning, China, 2 Key Laboratory of Zoological Systematics and
Evolution, Institute of Zoology, Chinese Academy of Sciences, Beijing, China, 3 School of Biological Sciences, University of Sydney, Sydney, New South Wales, Australia
Abstract
Tachinid flies are natural enemies of many lepidopteran and coleopteran pests of forests, crops, and fruit trees. In order toaddress the lack of genetic data in this economically important group, we sequenced the complete mitochondrial genomeof the Palaearctic tachinid fly Elodia flavipalpis Aldrich, 1933. Usually found in Northern China and Japan, this species is oneof the primary natural enemies of the leaf-roller moths (Tortricidae), which are major pests of various fruit trees. The 14,932-bp mitochondrial genome was typical of Diptera, with 13 protein-coding genes, 22 tRNA genes, and 2 rRNA genes.However, its control region is only 105 bp in length, which is the shortest found so far in flies. In order to estimate dipteranevolutionary relationships, we conducted a phylogenetic analysis of 58 mitochondrial genomes from 23 families. Maximum-likelihood and Bayesian methods supported the monophyly of both Tachinidae and superfamily Oestroidea. Within thesubsection Calyptratae, Muscidae was inferred as the sister group to Oestroidea. Within Oestroidea, Calliphoridae andSarcophagidae formed a sister clade to Oestridae and Tachinidae. Using a Bayesian relaxed clock calibrated with fossil data,we estimated that Tachinidae originated in the middle Eocene.
Citation: Zhao Z, Su T-j, Chesters D, Wang S-d, Ho SYW, et al. (2013) The Mitochondrial Genome of Elodia flavipalpis Aldrich (Diptera: Tachinidae) and theEvolutionary Timescale of Tachinid Flies. PLoS ONE 8(4): e61814. doi:10.1371/journal.pone.0061814
Editor: Daniel Doucet, Natural Resources Canada, Canada
Received January 20, 2012; Accepted March 18, 2013; Published April 23, 2013
Copyright: � 2013 Zhao et al. This is an open-access article distributed under the terms of the Creative Commons Attribution License, which permitsunrestricted use, distribution, and reproduction in any medium, provided the original author and source are credited.
Funding: This work was supported mainly by a grant from the Knowledge Innovation Program of Chinese Academy of Sciences (grant KSXC2-EW-B-02), PublicWelfare Project from the Ministry of Agriculture, China (grant 201103024), and the National Science Foundation, China (grants 30870268, 31172048, J0930004) toChao-dong Zhu; the National Science Foundation, China (grants 31093430, 31272279) to Chun-tian Zhang; National Special Science and Technology Foundationof China (2012FY111100) to Xiao-lin Chen and Chao-dong Zhu. The funders had no role in study design, data collection and analysis, decision to publish, orpreparation of the manuscript. No additional external funding received for this study.
Competing Interests: The authors have declared that no competing interests exist.
* E-mail: [email protected] (CDZ); [email protected] (XLC); [email protected] (CTZ)
Introduction
Since the first insect mitochondrial genome (mitogenome)
sequence was reported by Clary and Wolstenholme in 1985 [1],
Diptera has remained the primary model system for mitogenomic
research. This has included such diverse topics as species
identification [2,3], molecular evolution and phylogenetic infer-
ence [4–7], population structure and phylogeography [8–12], and
genome structure and rearrangement [13–19]. Because of its small
size and relative ease of sequencing, the number of mitogenome
sequences has grown rapidly. As of January 2013, there are 64
complete or near-complete dipteran mitogenome sequences in
GenBank, accounting for about 17.5% of the 365 insect
mitogenomes that have been sequenced. In addition to the model
organism Drosophila, most studies of Diptera have focused on taxa
of medical and economic importance, such as the anopheline
mosquitoes (Culicidae), which are vectors of malaria [20,21]; the
fruit flies Ceratitis capitata and Bactrocera spp. (Tephritidae), which
are serious agricultural pests [11,22]; the blowflies (Calliphoridae)
and oestrid flies (Oestridae), which can cause myiasis [23,24]; and
leaf-miners (Agromyzidae), which are vegetable and horticultural
pests [16,25].
Tachinid flies have a worldwide distribution and comprise
nearly 10,000 described species [29]. Despite Tachinidae being
the second-largest dipteran family, the mitogenomes of only two
species have been sequenced completely: Exorista sorbillans
(Exoristinae, Exoristini) and Rutilia goerlingiana (Dexiinae; Rutiliini)
[26,27,28]. They are natural enemies of many lepidopteran and
coleopteran pests of forests, agricultural crops, and fruit trees, and
thus are of economic importance. The Palaearctic tachinid fly,
Elodia flavipalpis Aldrich, 1933 (Exoristinae, Goniini), is usually
found in Northern China and Japan and is in the same subfamily,
Exoristinae, as Ex. sorbillans [30,31]. It is one of the primary
natural enemies of the leaf-roller moths (Tortricidae), which are
major pests of various fruit trees [32,33]. The monophyly of
Tachinidae is broadly supported by phylogenetic studies, but
questions remain about its place in the superfamily Oestroidea,
particularly the relationship between Tachinidae and several large
families of Oestroidea [27,28,34–36]. There have been various
studies of the divergence times of different groups of flies
[7,11,12,37], with a recent study placing the rapid radiation of
Schizophora 65 mya in the Paleocene [28]. However, owing to the
uncertain taxonomic position of Tachinidae in Oestroidea, the
evolutionary timescale of tachinid flies has not been well studied.
PLOS ONE | www.plosone.org 1 April 2013 | Volume 8 | Issue 4 | e61814
Here we describe the complete mitochondrial genome of El.
flavipalpis. The mitogenome contributes to discussion on the
evolutionary relationships and taxonomic positions of the
Tachinidae, puts forward a bold hypothesis regarding the
timescale in which the family originated, and will aid further
molecular research of related taxa through the findings on primer
selection for atypical regions and the optimization of PCR
experiments.
Materials and Methods
Specimen Collection, DNA Extraction, and DNAAmplification
Adult individuals of Elodia flavipalpis Aldrich, 1933 were
collected directly from the pupae of their host species, the leaf-
roller moth Spilonota lechriaspis Meyrick (Tortricidae). Moth pupae
were collected at an organic apple orchard in Beijing, China, and
hatched in the laboratory. The specimens were preserved in
99.5% ethanol and stored at 220uC for preservation of nucleic
acids. DNA extraction from a single specimen was performed
using the DNeasy Tissue kit (QIAGEN) following the manufac-
turer’s instructions.
The fragments were first amplified with the universal PCR
primers from Simon et al. [38] and some dipteran-specific primers
from Han [39] and Weigl et al. [24] (Table 1). Primer pairs for
amplification of the mitochondrial control region were modified
according to Lessinger et al. [40] and Oliveira et al. [41]. Species-
specific primers were designed using Primer Premier 6.0 software
[42], based on the initial fragments aligned with sequences from
three closely related species, Ex. sorbillans, Calliphoridae spp., and
Oestridae spp. (Table 2). PCR products covering the remaining
regions of the mitogenome were amplified using universal and
species-specific primers (Table 1). The entire genome of El.
flavipalpis was amplified in 21 fragments. All of the primers were
synthesized by Shanghai Sangon Bio-technology Co., Ltd (Beijing,
China).
In order to reduce time required for sequencing and walking,
we used both standard and nested PCR techniques. The PCR
conditions for all of the fragments are shown in Table 1. The
control region was amplified using a nested PCR approach. The
‘‘external’’ primers SR-J-14646 and N2-N-757 were used for the
first step of the PCR (long target), followed by nested amplification
(specific target) with the ‘‘internal’’ primers SR-J-14646 and N2-
N-309. All of the fragments were amplified using TaKaRa LA Taq
(Takara Co., Dalian, China), and performed on an Eppendorf
Mastercycler gradient in 50 ml reaction volumes. The reaction
volume consisted of 25.5 ml of sterilized distilled water, 5 ml of 106LA PCR Buffer II (Takara), 5 ml of 25 mM MgCl2, 8 ml of dNTPs
Mixture, 1.5 ml of each primer (10 mM), 3 ml of DNA template,
and 0.5 ml (1.25 U) of TaKaRa LA Taq polymerase (Takara).
Table 1. Details of mitogenome sequencing protocols used in this study.
Region Primer pairs (F/R) Sequence (forward and reverse) 59R39
Size(bp)
PCR conditions(annealing/extension)
ND2 TM-J-206a/N2-N-732a GCTAA-ATAAAGCTAACAGGTTCAT/GAAGTTTGGTTTAAACCTCC ,500 49uC, 45 s/72uC, 1 min
ND2-CO1 N2-J-283d/C1-N-1740d CATGACTAGGAACTTGAATAGG/AGAACTAAAGCAGGAGGTAA ,1500 47uC, 45 s/68uC, 4 min
CO1 TY-J-1460a/C1-N-2191a TACAATTTATCGCCTAAA-CTTCAGCC/CCCGGTAAAATTAAAATATAAACTTC ,700 49uC, 45 s/72uC, 1 min
CO1 C1-J-1751a/TL2-N-3014a GGATCACCTGATATAGCATTCCC/TCCAATGCACTAATCTGCCATATTA ,1200 52uC, 30 s/72uC, 1 min
CO1-CO3 Cl-J-2183a/C3-N-5460a CAACATTTATTTTGATTTTTTGG/TCAACAAAGTGTCAGTATCA ,3200 44.5uC, 45 s/68uC, 5 min
ATP8 C2-J-3530d/A6-N-4493d AAGTTGATGGAACTCCTGGA/GTAAGTCGAACTGCTAATGT ,950 49uC, 45 s/72uC, 1 min, 50 s
CO3-ND3 C3-J-5005d/E-revb CTCCATCAGTTGAATTAGGTGCTA/AGTGATAAGCCTCTTTTTGGCTTC ,1050 49uC, 45 s/72uC, 1 min, 50 s
ND5 F-fwb/N5-N-7707d CATTTGATTTGCATTCAAAAAGTATTG/AGGATGAGATGGATTAGGAT ,1800 45uC, 45 s/68uC, 3 min
ND5-ND4 H-fwb/N4-N-8718a GAAACAGGAGTAGGAGCTGCTATAGC/GCTTATTCATCGGTTGCTCA ,1200 53uC, 45 s/72uC, 1 min, 50 s
ND4 I-fwb/N4-N-8924a CAATTCTATTAATTAAAGAAATTTCTCC/AAAGCTCATGTTGAAGCTCC ,550 48uC, 45 s/72uC, 1 min, 50 s
ND4 N4-J-8614d/N4-N-9061d TGAGCAACAGAAGAATAAGC/ATCAACCAGAACGATTACAAG ,400 47uC, 45 s/72uC, 1 min, 50 s
ND4-ND6 N4-J-8944a/I-revb GGAGCTTCAACATGAGCTTT/CTTATTTTTGATTTACAAGACCAATG ,850 49uC, 45 s/72uC, 1 min, 20 s
ND4- CYTB N4-J-9511d/CB-N-11218d CTAAAATTGATAACCCTAAAGC/TCAGGTTGAATGTGAATTGG ,1700 45uC, 45 s/68uC, 3 min
CYTB-ND1 CB-J-10933a/N1-N-12051a TATGTACTACCATGAGGACAAATATC/GATTTTGCTGAAGGTGAATCAGA ,1100 50.5uC, 45 s/72uC, 1 min, 50 s
ND1- lrRNA N1-J-11891d/16S-N-12855d ATCCTCCTCTTCTATATTCAAT/GATTGCGACCTCGATGTT ,950 48uC, 45 s/72uC, 1 min, 30 s
lrRNA LR-J-12883c/LR-N-13398a CTCCGGTTTGAACTCAGATC/CGCCTGTTTATCAAAAACAT ,550 47uC, 45 s/72uC, 2 min
lrRNA - srRNA LR-J-12888d/SR -N-14373d ACGCTGTTATCCCTAAAGTA/AATCCACGATGAACCTTACT ,1500 45uC, 45 s/68uC, 3 min
srRNA SR-J-14233a/SR-N-14756a AAGAGCGACGGGCGATGTGT/GACAAA-ATTCGT-GCCAGCAGT ,500 50uC, 45 s/72uC, 1 min, 30 s
srRNA SR-J-14612a/SR-N-14922a AGGGTATCTAATCCTAGTTT/AAGTTTTATT-TTGGCTTA ,300 43uC, 45 s/72uC, 1 min
srRNA-ND2 SR-J-14646e/N2-N-757d GCTGGCACAAATTAAATC/GCTGCAAGTATTCAACTTAAATG ,1150 43uC, 1 min/68uC, 6 min
Control region SR-J-14646e/N2-N-309f GCTGGCACAAATTAAATC/CTAAACCTATTCAAGTTCC ,650 42uC, 1 min/68uC, 6 min
Note: CO1, CO2, CO3: cytochrome c oxidase subunit 1, 2, and 3 genes; CYTB: cytochrome b gene; ATP6, ATP8: ATP synthase subunit 6 and 8 genes; ND1, ND2, ND3, ND4,ND4L, ND5, ND6: NADH dehydrogenase subunit 1–6 and 4L genes. lrRNA, srRNA: large and small ribosomal RNA.aPrimers from Simon et al. [27].bPrimers from Weigl et al. [21].cPrimers from Han [28].dPrimers designed specially for this genome, using the nomenclature of Simon et al. [27].ePrimers modified from Lessinger et al. [29]. f Primers modified from Oliveira et al. [30].doi:10.1371/journal.pone.0061814.t001
The Mitochondrial Genome and Timescale of Tachinid
PLOS ONE | www.plosone.org 2 April 2013 | Volume 8 | Issue 4 | e61814
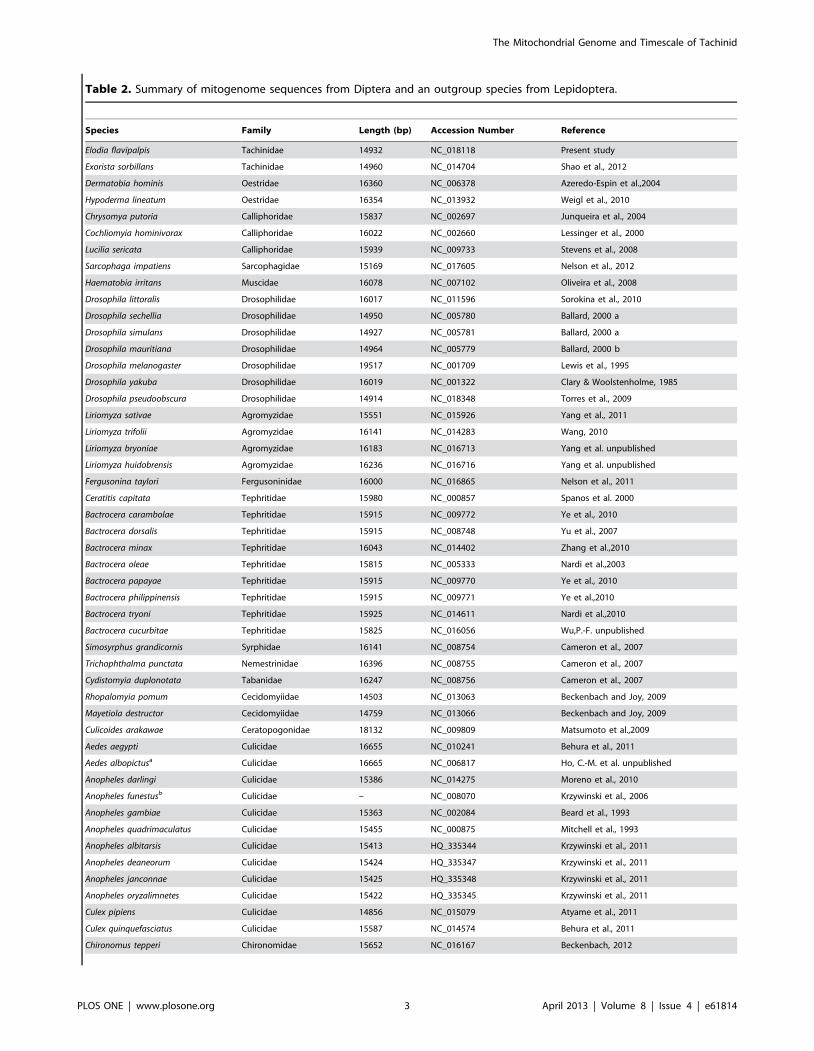
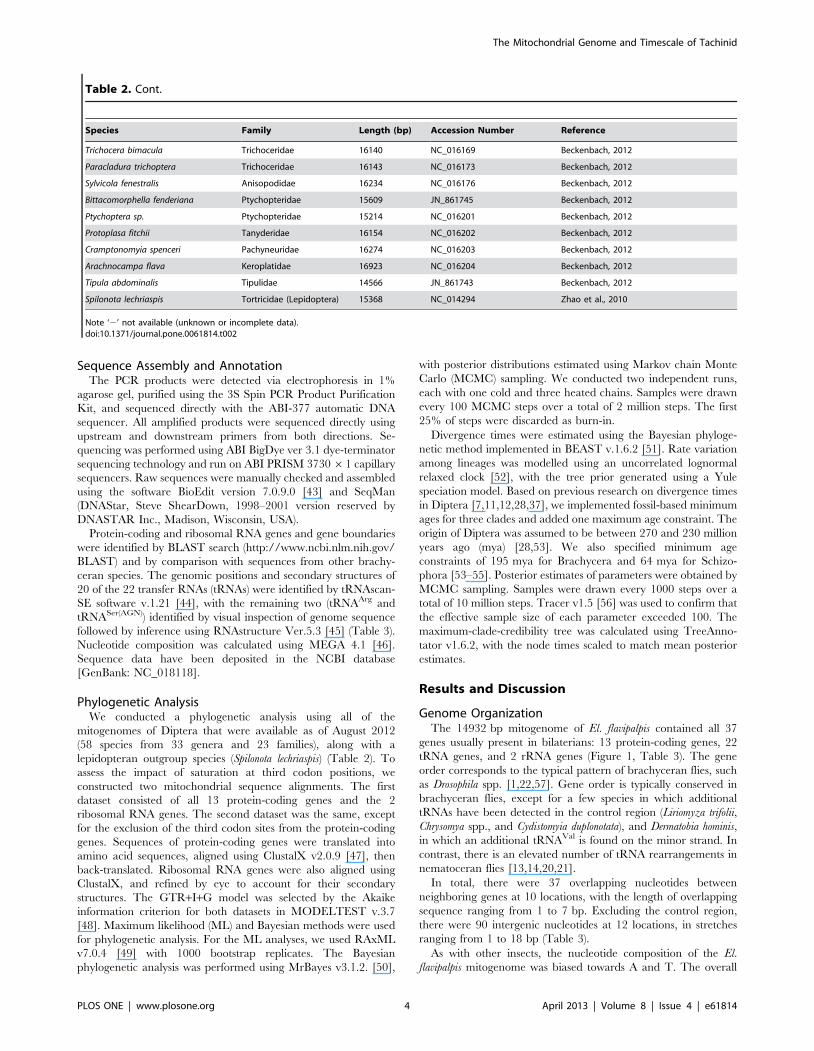
Table 2. Summary of mitogenome sequences from Diptera and an outgroup species from Lepidoptera.
Species Family Length (bp) Accession Number Reference
Elodia flavipalpis Tachinidae 14932 NC_018118 Present study
Exorista sorbillans Tachinidae 14960 NC_014704 Shao et al., 2012
Dermatobia hominis Oestridae 16360 NC_006378 Azeredo-Espin et al.,2004
Hypoderma lineatum Oestridae 16354 NC_013932 Weigl et al., 2010
Chrysomya putoria Calliphoridae 15837 NC_002697 Junqueira et al., 2004
Cochliomyia hominivorax Calliphoridae 16022 NC_002660 Lessinger et al., 2000
Lucilia sericata Calliphoridae 15939 NC_009733 Stevens et al., 2008
Sarcophaga impatiens Sarcophagidae 15169 NC_017605 Nelson et al., 2012
Haematobia irritans Muscidae 16078 NC_007102 Oliveira et al., 2008
Drosophila littoralis Drosophilidae 16017 NC_011596 Sorokina et al., 2010
Drosophila sechellia Drosophilidae 14950 NC_005780 Ballard, 2000 a
Drosophila simulans Drosophilidae 14927 NC_005781 Ballard, 2000 a
Drosophila mauritiana Drosophilidae 14964 NC_005779 Ballard, 2000 b
Drosophila melanogaster Drosophilidae 19517 NC_001709 Lewis et al., 1995
Drosophila yakuba Drosophilidae 16019 NC_001322 Clary & Woolstenholme, 1985
Drosophila pseudoobscura Drosophilidae 14914 NC_018348 Torres et al., 2009
Liriomyza sativae Agromyzidae 15551 NC_015926 Yang et al., 2011
Liriomyza trifolii Agromyzidae 16141 NC_014283 Wang, 2010
Liriomyza bryoniae Agromyzidae 16183 NC_016713 Yang et al. unpublished
Liriomyza huidobrensis Agromyzidae 16236 NC_016716 Yang et al. unpublished
Fergusonina taylori Fergusoninidae 16000 NC_016865 Nelson et al., 2011
Ceratitis capitata Tephritidae 15980 NC_000857 Spanos et al. 2000
Bactrocera carambolae Tephritidae 15915 NC_009772 Ye et al., 2010
Bactrocera dorsalis Tephritidae 15915 NC_008748 Yu et al., 2007
Bactrocera minax Tephritidae 16043 NC_014402 Zhang et al.,2010
Bactrocera oleae Tephritidae 15815 NC_005333 Nardi et al.,2003
Bactrocera papayae Tephritidae 15915 NC_009770 Ye et al., 2010
Bactrocera philippinensis Tephritidae 15915 NC_009771 Ye et al.,2010
Bactrocera tryoni Tephritidae 15925 NC_014611 Nardi et al.,2010
Bactrocera cucurbitae Tephritidae 15825 NC_016056 Wu,P.-F. unpublished
Simosyrphus grandicornis Syrphidae 16141 NC_008754 Cameron et al., 2007
Trichophthalma punctata Nemestrinidae 16396 NC_008755 Cameron et al., 2007
Cydistomyia duplonotata Tabanidae 16247 NC_008756 Cameron et al., 2007
Rhopalomyia pomum Cecidomyiidae 14503 NC_013063 Beckenbach and Joy, 2009
Mayetiola destructor Cecidomyiidae 14759 NC_013066 Beckenbach and Joy, 2009
Culicoides arakawae Ceratopogonidae 18132 NC_009809 Matsumoto et al.,2009
Aedes aegypti Culicidae 16655 NC_010241 Behura et al., 2011
Aedes albopictusa Culicidae 16665 NC_006817 Ho, C.-M. et al. unpublished
Anopheles darlingi Culicidae 15386 NC_014275 Moreno et al., 2010
Anopheles funestusb Culicidae – NC_008070 Krzywinski et al., 2006
Anopheles gambiae Culicidae 15363 NC_002084 Beard et al., 1993
Anopheles quadrimaculatus Culicidae 15455 NC_000875 Mitchell et al., 1993
Anopheles albitarsis Culicidae 15413 HQ_335344 Krzywinski et al., 2011
Anopheles deaneorum Culicidae 15424 HQ_335347 Krzywinski et al., 2011
Anopheles janconnae Culicidae 15425 HQ_335348 Krzywinski et al., 2011
Anopheles oryzalimnetes Culicidae 15422 HQ_335345 Krzywinski et al., 2011
Culex pipiens Culicidae 14856 NC_015079 Atyame et al., 2011
Culex quinquefasciatus Culicidae 15587 NC_014574 Behura et al., 2011
Chironomus tepperi Chironomidae 15652 NC_016167 Beckenbach, 2012
The Mitochondrial Genome and Timescale of Tachinid
PLOS ONE | www.plosone.org 3 April 2013 | Volume 8 | Issue 4 | e61814
Sequence Assembly and AnnotationThe PCR products were detected via electrophoresis in 1%
agarose gel, purified using the 3S Spin PCR Product Purification
Kit, and sequenced directly with the ABI-377 automatic DNA
sequencer. All amplified products were sequenced directly using
upstream and downstream primers from both directions. Se-
quencing was performed using ABI BigDye ver 3.1 dye-terminator
sequencing technology and run on ABI PRISM 373061 capillary
sequencers. Raw sequences were manually checked and assembled
using the software BioEdit version 7.0.9.0 [43] and SeqMan
(DNAStar, Steve ShearDown, 1998–2001 version reserved by
DNASTAR Inc., Madison, Wisconsin, USA).
Protein-coding and ribosomal RNA genes and gene boundaries
were identified by BLAST search (http://www.ncbi.nlm.nih.gov/
BLAST) and by comparison with sequences from other brachy-
ceran species. The genomic positions and secondary structures of
20 of the 22 transfer RNAs (tRNAs) were identified by tRNAscan-
SE software v.1.21 [44], with the remaining two (tRNAArg and
tRNASer(AGN)) identified by visual inspection of genome sequence
followed by inference using RNAstructure Ver.5.3 [45] (Table 3).
Nucleotide composition was calculated using MEGA 4.1 [46].
Sequence data have been deposited in the NCBI database
[GenBank: NC_018118].
Phylogenetic AnalysisWe conducted a phylogenetic analysis using all of the
mitogenomes of Diptera that were available as of August 2012
(58 species from 33 genera and 23 families), along with a
lepidopteran outgroup species (Spilonota lechriaspis) (Table 2). To
assess the impact of saturation at third codon positions, we
constructed two mitochondrial sequence alignments. The first
dataset consisted of all 13 protein-coding genes and the 2
ribosomal RNA genes. The second dataset was the same, except
for the exclusion of the third codon sites from the protein-coding
genes. Sequences of protein-coding genes were translated into
amino acid sequences, aligned using ClustalX v2.0.9 [47], then
back-translated. Ribosomal RNA genes were also aligned using
ClustalX, and refined by eye to account for their secondary
structures. The GTR+I+G model was selected by the Akaike
information criterion for both datasets in MODELTEST v.3.7
[48]. Maximum likelihood (ML) and Bayesian methods were used
for phylogenetic analysis. For the ML analyses, we used RAxML
v7.0.4 [49] with 1000 bootstrap replicates. The Bayesian
phylogenetic analysis was performed using MrBayes v3.1.2. [50],
with posterior distributions estimated using Markov chain Monte
Carlo (MCMC) sampling. We conducted two independent runs,
each with one cold and three heated chains. Samples were drawn
every 100 MCMC steps over a total of 2 million steps. The first
25% of steps were discarded as burn-in.
Divergence times were estimated using the Bayesian phyloge-
netic method implemented in BEAST v.1.6.2 [51]. Rate variation
among lineages was modelled using an uncorrelated lognormal
relaxed clock [52], with the tree prior generated using a Yule
speciation model. Based on previous research on divergence times
in Diptera [7,11,12,28,37], we implemented fossil-based minimum
ages for three clades and added one maximum age constraint. The
origin of Diptera was assumed to be between 270 and 230 million
years ago (mya) [28,53]. We also specified minimum age
constraints of 195 mya for Brachycera and 64 mya for Schizo-
phora [53–55]. Posterior estimates of parameters were obtained by
MCMC sampling. Samples were drawn every 1000 steps over a
total of 10 million steps. Tracer v1.5 [56] was used to confirm that
the effective sample size of each parameter exceeded 100. The
maximum-clade-credibility tree was calculated using TreeAnno-
tator v1.6.2, with the node times scaled to match mean posterior
estimates.
Results and Discussion
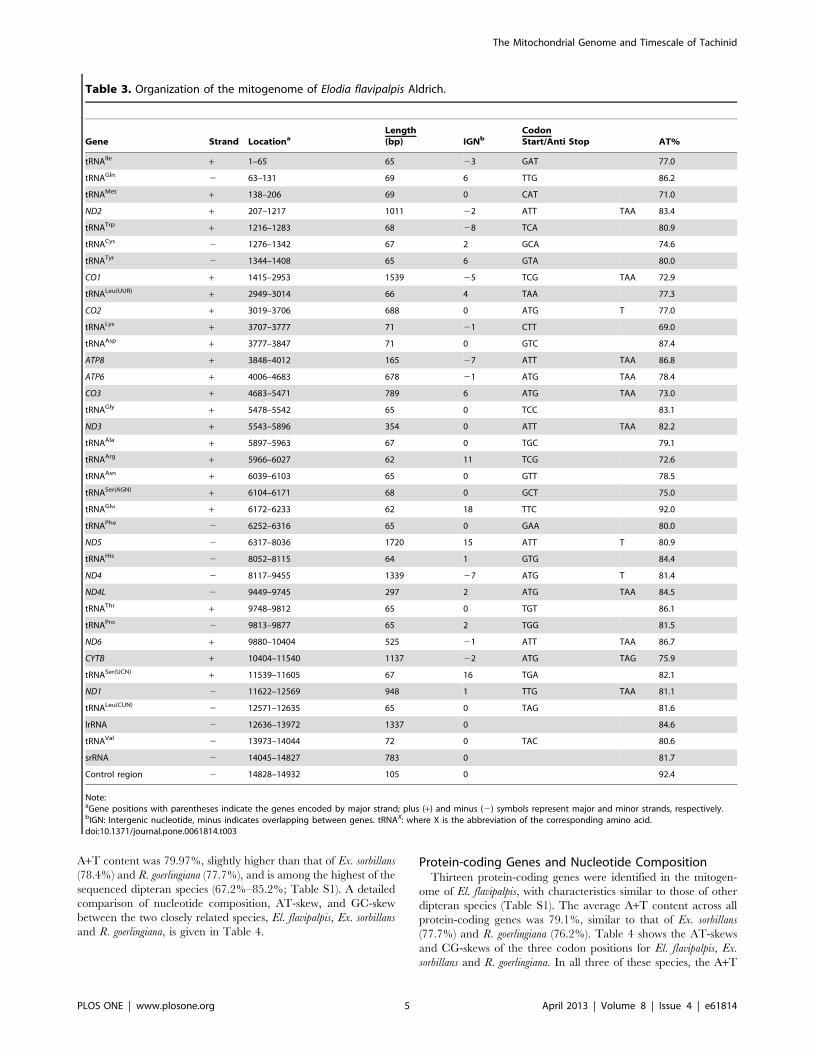
Genome OrganizationThe 14932 bp mitogenome of El. flavipalpis contained all 37
genes usually present in bilaterians: 13 protein-coding genes, 22
tRNA genes, and 2 rRNA genes (Figure 1, Table 3). The gene
order corresponds to the typical pattern of brachyceran flies, such
as Drosophila spp. [1,22,57]. Gene order is typically conserved in
brachyceran flies, except for a few species in which additional
tRNAs have been detected in the control region (Liriomyza trifolii,
Chrysomya spp., and Cydistomyia duplonotata), and Dermatobia hominis,
in which an additional tRNAVal is found on the minor strand. In
contrast, there is an elevated number of tRNA rearrangements in
nematoceran flies [13,14,20,21].
In total, there were 37 overlapping nucleotides between
neighboring genes at 10 locations, with the length of overlapping
sequence ranging from 1 to 7 bp. Excluding the control region,
there were 90 intergenic nucleotides at 12 locations, in stretches
ranging from 1 to 18 bp (Table 3).
As with other insects, the nucleotide composition of the El.
flavipalpis mitogenome was biased towards A and T. The overall
Table 2. Cont.
Species Family Length (bp) Accession Number Reference
Trichocera bimacula Trichoceridae 16140 NC_016169 Beckenbach, 2012
Paracladura trichoptera Trichoceridae 16143 NC_016173 Beckenbach, 2012
Sylvicola fenestralis Anisopodidae 16234 NC_016176 Beckenbach, 2012
Bittacomorphella fenderiana Ptychopteridae 15609 JN_861745 Beckenbach, 2012
Ptychoptera sp. Ptychopteridae 15214 NC_016201 Beckenbach, 2012
Protoplasa fitchii Tanyderidae 16154 NC_016202 Beckenbach, 2012
Cramptonomyia spenceri Pachyneuridae 16274 NC_016203 Beckenbach, 2012
Arachnocampa flava Keroplatidae 16923 NC_016204 Beckenbach, 2012
Tipula abdominalis Tipulidae 14566 JN_861743 Beckenbach, 2012
Spilonota lechriaspis Tortricidae (Lepidoptera) 15368 NC_014294 Zhao et al., 2010
Note ‘2’ not available (unknown or incomplete data).doi:10.1371/journal.pone.0061814.t002
The Mitochondrial Genome and Timescale of Tachinid
PLOS ONE | www.plosone.org 4 April 2013 | Volume 8 | Issue 4 | e61814
A+T content was 79.97%, slightly higher than that of Ex. sorbillans
(78.4%) and R. goerlingiana (77.7%), and is among the highest of the
sequenced dipteran species (67.2%–85.2%; Table S1). A detailed
comparison of nucleotide composition, AT-skew, and GC-skew
between the two closely related species, El. flavipalpis, Ex. sorbillans
and R. goerlingiana, is given in Table 4.
Protein-coding Genes and Nucleotide CompositionThirteen protein-coding genes were identified in the mitogen-
ome of El. flavipalpis, with characteristics similar to those of other
dipteran species (Table S1). The average A+T content across all
protein-coding genes was 79.1%, similar to that of Ex. sorbillans
(77.7%) and R. goerlingiana (76.2%). Table 4 shows the AT-skews
and CG-skews of the three codon positions for El. flavipalpis, Ex.
sorbillans and R. goerlingiana. In all three of these species, the A+T
Table 3. Organization of the mitogenome of Elodia flavipalpis Aldrich.
Gene Strand LocationaLength(bp) IGNb
CodonStart/Anti Stop AT%
tRNAIle + 1–65 65 23 GAT 77.0
tRNAGln 2 63–131 69 6 TTG 86.2
tRNAMet + 138–206 69 0 CAT 71.0
ND2 + 207–1217 1011 22 ATT TAA 83.4
tRNATrp + 1216–1283 68 28 TCA 80.9
tRNACys 2 1276–1342 67 2 GCA 74.6
tRNATyr 2 1344–1408 65 6 GTA 80.0
CO1 + 1415–2953 1539 25 TCG TAA 72.9
tRNALeu(UUR) + 2949–3014 66 4 TAA 77.3
CO2 + 3019–3706 688 0 ATG T 77.0
tRNALys + 3707–3777 71 21 CTT 69.0
tRNAAsp + 3777–3847 71 0 GTC 87.4
ATP8 + 3848–4012 165 27 ATT TAA 86.8
ATP6 + 4006–4683 678 21 ATG TAA 78.4
CO3 + 4683–5471 789 6 ATG TAA 73.0
tRNAGly + 5478–5542 65 0 TCC 83.1
ND3 + 5543–5896 354 0 ATT TAA 82.2
tRNAAla + 5897–5963 67 0 TGC 79.1
tRNAArg + 5966–6027 62 11 TCG 72.6
tRNAAsn + 6039–6103 65 0 GTT 78.5
tRNASer(AGN) + 6104–6171 68 0 GCT 75.0
tRNAGlu + 6172–6233 62 18 TTC 92.0
tRNAPhe 2 6252–6316 65 0 GAA 80.0
ND5 2 6317–8036 1720 15 ATT T 80.9
tRNAHis 2 8052–8115 64 1 GTG 84.4
ND4 2 8117–9455 1339 27 ATG T 81.4
ND4L 2 9449–9745 297 2 ATG TAA 84.5
tRNAThr + 9748–9812 65 0 TGT 86.1
tRNAPro 2 9813–9877 65 2 TGG 81.5
ND6 + 9880–10404 525 21 ATT TAA 86.7
CYTB + 10404–11540 1137 22 ATG TAG 75.9
tRNASer(UCN) + 11539–11605 67 16 TGA 82.1
ND1 2 11622–12569 948 1 TTG TAA 81.1
tRNALeu(CUN) 2 12571–12635 65 0 TAG 81.6
lrRNA 2 12636–13972 1337 0 84.6
tRNAVal 2 13973–14044 72 0 TAC 80.6
srRNA 2 14045–14827 783 0 81.7
Control region 2 14828–14932 105 0 92.4
Note:aGene positions with parentheses indicate the genes encoded by major strand; plus (+) and minus (2) symbols represent major and minor strands, respectively.bIGN: Intergenic nucleotide, minus indicates overlapping between genes. tRNAX: where X is the abbreviation of the corresponding amino acid.doi:10.1371/journal.pone.0061814.t003
The Mitochondrial Genome and Timescale of Tachinid
PLOS ONE | www.plosone.org 5 April 2013 | Volume 8 | Issue 4 | e61814
content of the third codon positions (87.1%, 84.7%, and 91.2%,
for El. flavipalpis, Ex. sorbillans, and R. goerlingiana, respectively) was
higher than those of the first (71.2%, 70.4%, and 70.1) and second
codon positions (79.1%, 78.0%, and 67%). This result is in
agreement with studies of other dipteran taxa (Table S1). AT-skew
and GC-skew were used to analyse the biases in nucleotide
composition. The A content was slightly lower than the T content
at all three codon positions, but almost equal over the whole
genome.
Except for CO1 and ND1, all of the protein-coding genes have
one of the common start codons for mitochondrial DNA, ATG,
ATA, or ATT (Table 3). The start codon TCG (Serine) in CO1 is
also found in Ex. sorbillans, R. goerlingiana, and other Oestroidea
species (Table 2). CO1 commonly uses nonstandard start codons in
Figure 1. Mitochondrial genome map of Elodia flavipalpis. Numbers indicate non-coding nucleotides between genes (positive values) or geneoverlap (negative values). Arrows indicate orientation on (+) strand (clockwise) or (2) strand (counterclockwise).doi:10.1371/journal.pone.0061814.g001
Table 4. Comparison of mitochondrial nucleotide composition in three tachinid flies.
Region A+T % G+C % AT-skew GC-skew
El. fla Ex. sor R. goe El. fla Ex. sor R. goe El. fla Ex. sor R. goe El. fla Ex. sor R. goe
Whole mitogenome 79.9 78.4 77.7 20.1 21.5 22.3 0.00 0.02 0.04 20.15 20.17 20.23
Protein-coding genes 79.1 77.7 76.2 20.9 22.3 23.8 20.14 20.15 20.15 0.04 0.00 0.00
1st codon position 71.2 70.4 70.1 28.8 29.6 29.9 20.19 20.18 20.07 0.12 0.09 0.22
2nd codon position 79.1 78.0 67.0 20.9 22.0 33.0 20.19 20.20 20.08 20.17 20.16 20.16
3rd codon position 87.1 84.7 91.2 12.9 15.3 8.8 20.07 20.07 20.04 0.19 0.07 20.16
tRNA genes 79.8 76.8 77.2 20.2 23.2 22.8 0.03 0.02 0.02 20.11 20.11 20.12
lrRNA 84.6 83.2 82.6 15.5 16.8 17.4 0.00 0.05 0.05 20.30 20.30 20.34
srRNA 81.7 79.4 80.5 18.3 20.5 19.5 20.04 0.01 0.00 20.30 20.30 20.28
Control region 92.4 98.1 92.6 7.7 1.9 7.4 0.11 20.05 0.11 0.74 1.00 20.71
Note: El. fla indicates Elodia flavipalpis, Ex. sor indicates Exorista sorbillans and R. goe indicates Rutilia goerlingiana. The A+T and G+C biases of protein-coding genes werecalculated by AT-skew = [A2T]/[A+T] and GC-skew = [G2C]/[G+C], respectively.doi:10.1371/journal.pone.0061814.t004
The Mitochondrial Genome and Timescale of Tachinid
PLOS ONE | www.plosone.org 6 April 2013 | Volume 8 | Issue 4 | e61814
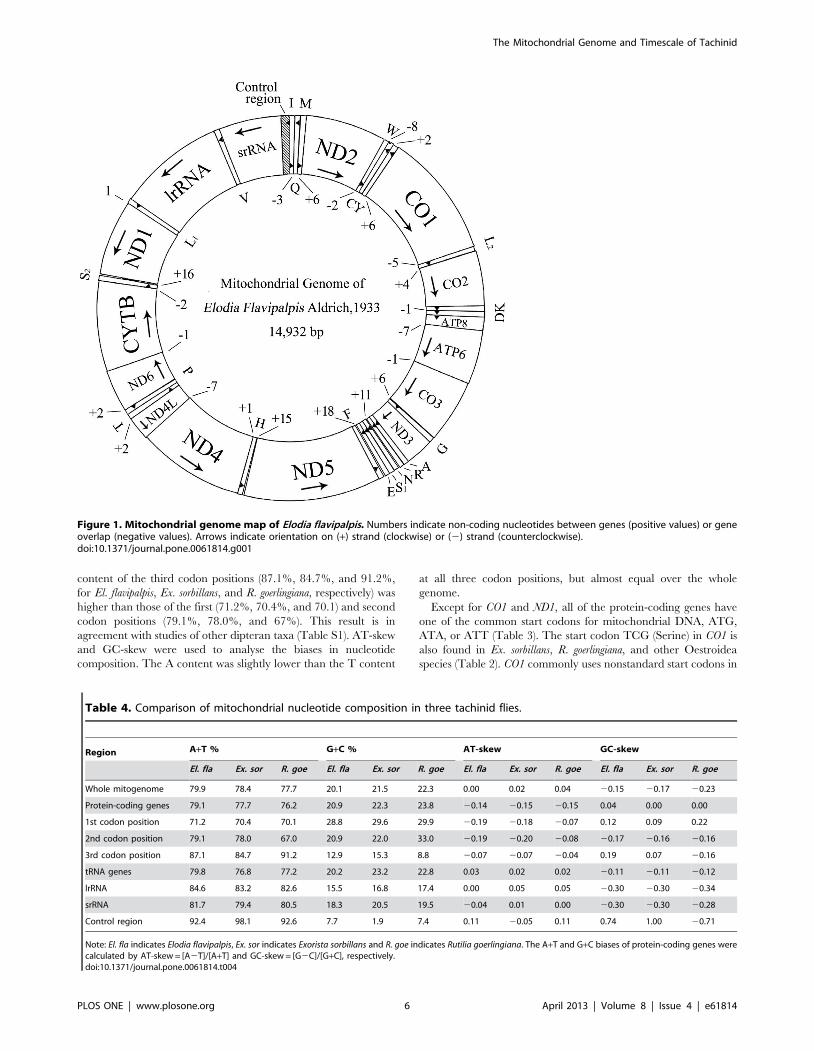
Figure 2. Putative secondary structures of tRNAs found in the mitochondrial genome of Elodia flavipalpis. All tRNAs can be folded intothe usual clover-leaf secondary structure.doi:10.1371/journal.pone.0061814.g002
The Mitochondrial Genome and Timescale of Tachinid
PLOS ONE | www.plosone.org 7 April 2013 | Volume 8 | Issue 4 | e61814
The Mitochondrial Genome and Timescale of Tachinid
PLOS ONE | www.plosone.org 8 April 2013 | Volume 8 | Issue 4 | e61814
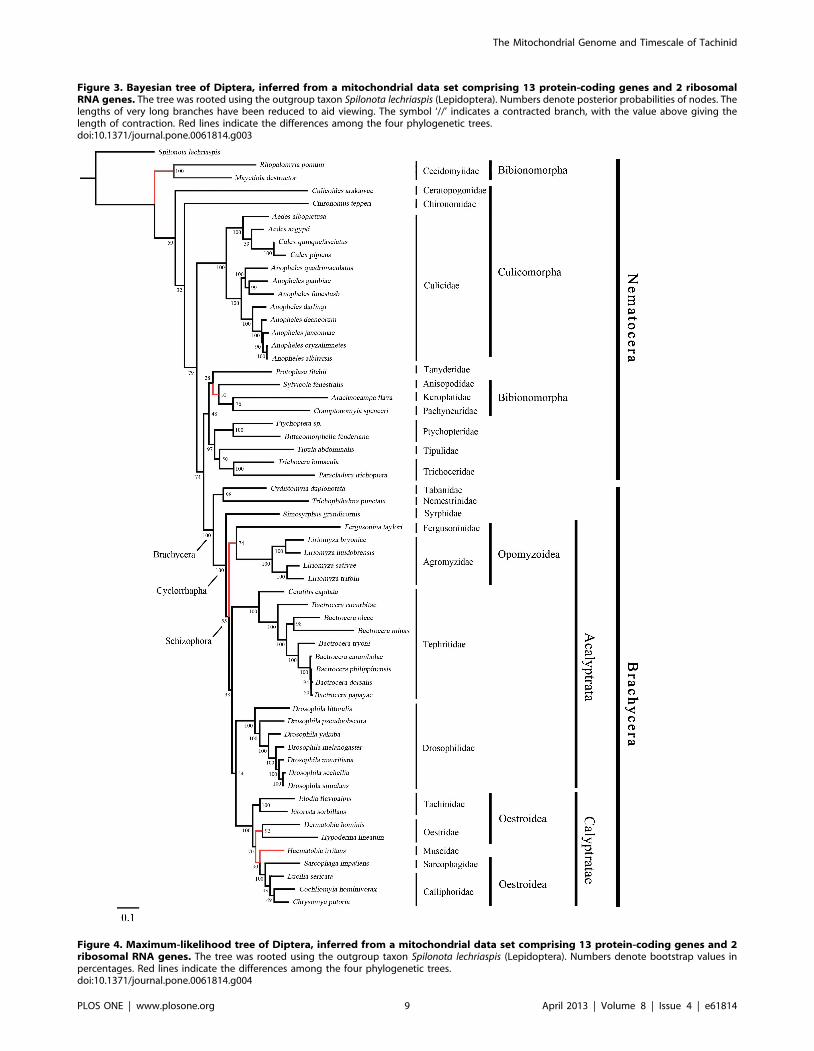
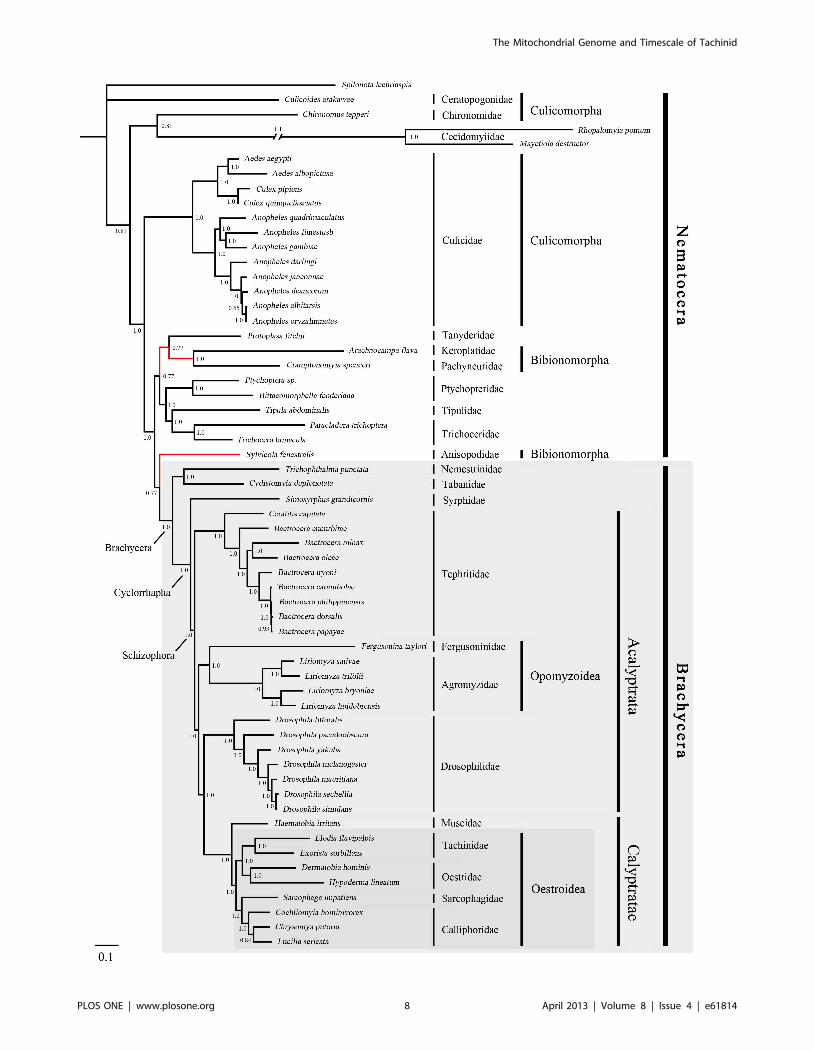
Figure 3. Bayesian tree of Diptera, inferred from a mitochondrial data set comprising 13 protein-coding genes and 2 ribosomalRNA genes. The tree was rooted using the outgroup taxon Spilonota lechriaspis (Lepidoptera). Numbers denote posterior probabilities of nodes. Thelengths of very long branches have been reduced to aid viewing. The symbol ‘//’ indicates a contracted branch, with the value above giving thelength of contraction. Red lines indicate the differences among the four phylogenetic trees.doi:10.1371/journal.pone.0061814.g003
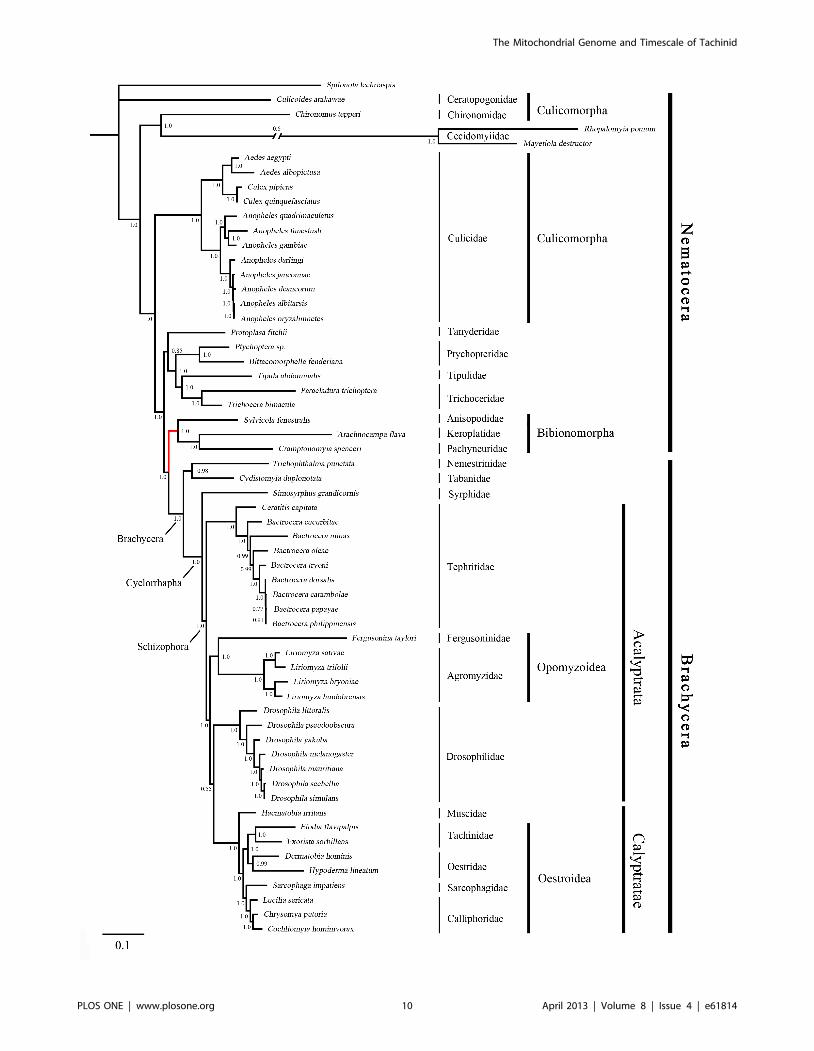
Figure 4. Maximum-likelihood tree of Diptera, inferred from a mitochondrial data set comprising 13 protein-coding genes and 2ribosomal RNA genes. The tree was rooted using the outgroup taxon Spilonota lechriaspis (Lepidoptera). Numbers denote bootstrap values inpercentages. Red lines indicate the differences among the four phylogenetic trees.doi:10.1371/journal.pone.0061814.g004
The Mitochondrial Genome and Timescale of Tachinid
PLOS ONE | www.plosone.org 9 April 2013 | Volume 8 | Issue 4 | e61814
The Mitochondrial Genome and Timescale of Tachinid
PLOS ONE | www.plosone.org 10 April 2013 | Volume 8 | Issue 4 | e61814
many other flies [5,16,20,58,59]. Within Diptera, the start codon
TTG (Leucine) in ND1 of El. flavipalpis is same as that in Dermatobia
hominis (Oestroidea). Of the 13 protein-coding genes, CO2, ND4,
and ND5 have incomplete stop codons and terminate with only a
single thymine. Similar structural features have also been
described for the mitogenomes of other dipteran taxa [4,5]. In
addition, CYTB terminates with a complete stop codon TAG,
whereas TAA or only a single thymine is utilized in some other fly
species.
Other Regions of the MitogenomeThe mitogenome of El. flavipalpis bears all of the 22 standard
tRNAs found in metazoan mitogenomes (Figure 1, Table 3). The
total length of the tRNA genes is 1463 bp, with individual genes
ranging from 62 to 71 bp and with A+T contents from 71%
(tRNAMet) to 92% (tRNAGlu). With the exception of
tRNASer (AGN), all tRNAs possess the typical clover-leaf secondary
structure (Figure 2). The DHU-arm of tRNASer (AGN) is entirely
absent, as observed in other insects [20,24,33,60]. In the
secondary structures, the lengths of the amino acid acceptor arms
(7 bp), anticodon arms (5 bp), and loops (7 bp) are relatively
conserved, while the TyC loop (3–10 bp) is more variable. There
are 21 mismatched base pairs in the tRNA genes, 14 of which are
weak G–U matches (nine sites in DHU arms, three sites in amino
acid acceptor arms, and two sites in anticodon arms). The other
seven include U–U (5 bp), C–U (1 bp), and A–A (1 bp).
The lengths of the lrRNA and srRNA genes are 1337 bp and
783 bp, respectively. Both are encoded on the minor strand and
the ends of those genes were assumed to be at the boundaries of
the flanking genes [61]. As in other dipteran species, the lrRNA
gene is flanked by tRNALeu (CUN) and tRNAVal, while the srRNA
gene is between tRNAVal and the control region. Their A+T
contents were 84.6% for lrRNA and 81.7% for srRNA, which are
within the range of other dipteran species (Table S1).
The length of the control region of El. flavipalpis is identical to
that of Ex. sorbillans (105 bp), the shortest among the sequenced
dipteran mitogenomes. It has an A+T content of 92.38%, which is
lower than that of Ex. sorbillans (98.1%) and R. goerlingiana (92.6%)
but higher than those of most other dipteran species. Owing to its
short length, there is no distinct duplicate fragment found in this
region. It should be noted that all three of the sequenced tachinid
mitogenomes bear a control region that is shorter than those of
most known in flies [62,63].
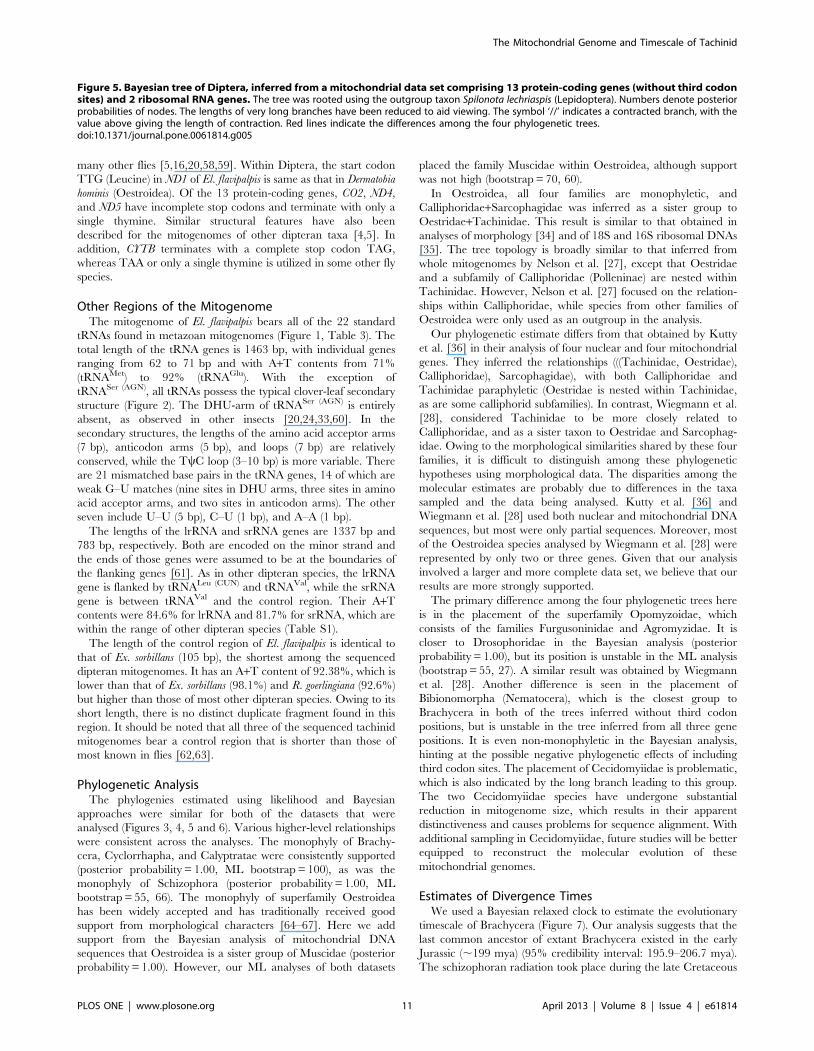
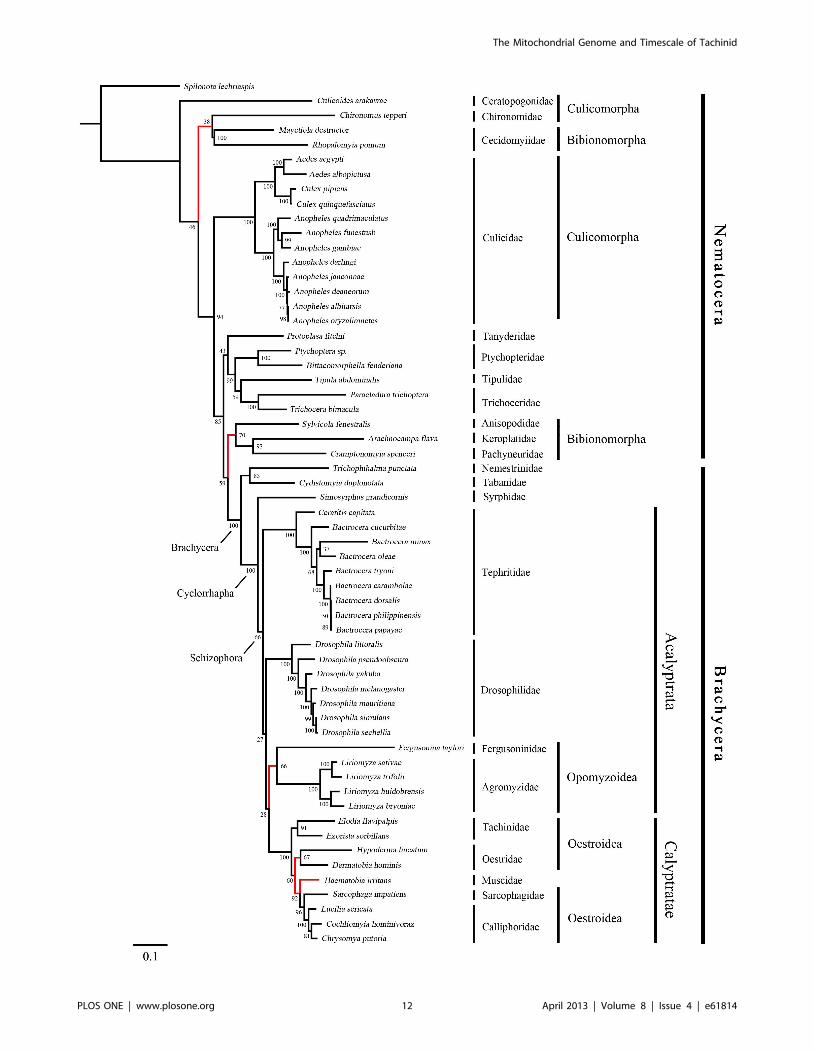
Phylogenetic AnalysisThe phylogenies estimated using likelihood and Bayesian
approaches were similar for both of the datasets that were
analysed (Figures 3, 4, 5 and 6). Various higher-level relationships
were consistent across the analyses. The monophyly of Brachy-
cera, Cyclorrhapha, and Calyptratae were consistently supported
(posterior probability = 1.00, ML bootstrap = 100), as was the
monophyly of Schizophora (posterior probability = 1.00, ML
bootstrap = 55, 66). The monophyly of superfamily Oestroidea
has been widely accepted and has traditionally received good
support from morphological characters [64–67]. Here we add
support from the Bayesian analysis of mitochondrial DNA
sequences that Oestroidea is a sister group of Muscidae (posterior
probability = 1.00). However, our ML analyses of both datasets
placed the family Muscidae within Oestroidea, although support
was not high (bootstrap = 70, 60).
In Oestroidea, all four families are monophyletic, and
Calliphoridae+Sarcophagidae was inferred as a sister group to
Oestridae+Tachinidae. This result is similar to that obtained in
analyses of morphology [34] and of 18S and 16S ribosomal DNAs
[35]. The tree topology is broadly similar to that inferred from
whole mitogenomes by Nelson et al. [27], except that Oestridae
and a subfamily of Calliphoridae (Polleninae) are nested within
Tachinidae. However, Nelson et al. [27] focused on the relation-
ships within Calliphoridae, while species from other families of
Oestroidea were only used as an outgroup in the analysis.
Our phylogenetic estimate differs from that obtained by Kutty
et al. [36] in their analysis of four nuclear and four mitochondrial
genes. They inferred the relationships (((Tachinidae, Oestridae),
Calliphoridae), Sarcophagidae), with both Calliphoridae and
Tachinidae paraphyletic (Oestridae is nested within Tachinidae,
as are some calliphorid subfamilies). In contrast, Wiegmann et al.
[28], considered Tachinidae to be more closely related to
Calliphoridae, and as a sister taxon to Oestridae and Sarcophag-
idae. Owing to the morphological similarities shared by these four
families, it is difficult to distinguish among these phylogenetic
hypotheses using morphological data. The disparities among the
molecular estimates are probably due to differences in the taxa
sampled and the data being analysed. Kutty et al. [36] and
Wiegmann et al. [28] used both nuclear and mitochondrial DNA
sequences, but most were only partial sequences. Moreover, most
of the Oestroidea species analysed by Wiegmann et al. [28] were
represented by only two or three genes. Given that our analysis
involved a larger and more complete data set, we believe that our
results are more strongly supported.
The primary difference among the four phylogenetic trees here
is in the placement of the superfamily Opomyzoidae, which
consists of the families Furgusoninidae and Agromyzidae. It is
closer to Drosophoridae in the Bayesian analysis (posterior
probability = 1.00), but its position is unstable in the ML analysis
(bootstrap = 55, 27). A similar result was obtained by Wiegmann
et al. [28]. Another difference is seen in the placement of
Bibionomorpha (Nematocera), which is the closest group to
Brachycera in both of the trees inferred without third codon
positions, but is unstable in the tree inferred from all three gene
positions. It is even non-monophyletic in the Bayesian analysis,
hinting at the possible negative phylogenetic effects of including
third codon sites. The placement of Cecidomyiidae is problematic,
which is also indicated by the long branch leading to this group.
The two Cecidomyiidae species have undergone substantial
reduction in mitogenome size, which results in their apparent
distinctiveness and causes problems for sequence alignment. With
additional sampling in Cecidomyiidae, future studies will be better
equipped to reconstruct the molecular evolution of these
mitochondrial genomes.
Estimates of Divergence TimesWe used a Bayesian relaxed clock to estimate the evolutionary
timescale of Brachycera (Figure 7). Our analysis suggests that the
last common ancestor of extant Brachycera existed in the early
Jurassic (,199 mya) (95% credibility interval: 195.9–206.7 mya).
The schizophoran radiation took place during the late Cretaceous
Figure 5. Bayesian tree of Diptera, inferred from a mitochondrial data set comprising 13 protein-coding genes (without third codonsites) and 2 ribosomal RNA genes. The tree was rooted using the outgroup taxon Spilonota lechriaspis (Lepidoptera). Numbers denote posteriorprobabilities of nodes. The lengths of very long branches have been reduced to aid viewing. The symbol ‘//’ indicates a contracted branch, with thevalue above giving the length of contraction. Red lines indicate the differences among the four phylogenetic trees.doi:10.1371/journal.pone.0061814.g005
The Mitochondrial Genome and Timescale of Tachinid
PLOS ONE | www.plosone.org 11 April 2013 | Volume 8 | Issue 4 | e61814
The Mitochondrial Genome and Timescale of Tachinid
PLOS ONE | www.plosone.org 12 April 2013 | Volume 8 | Issue 4 | e61814
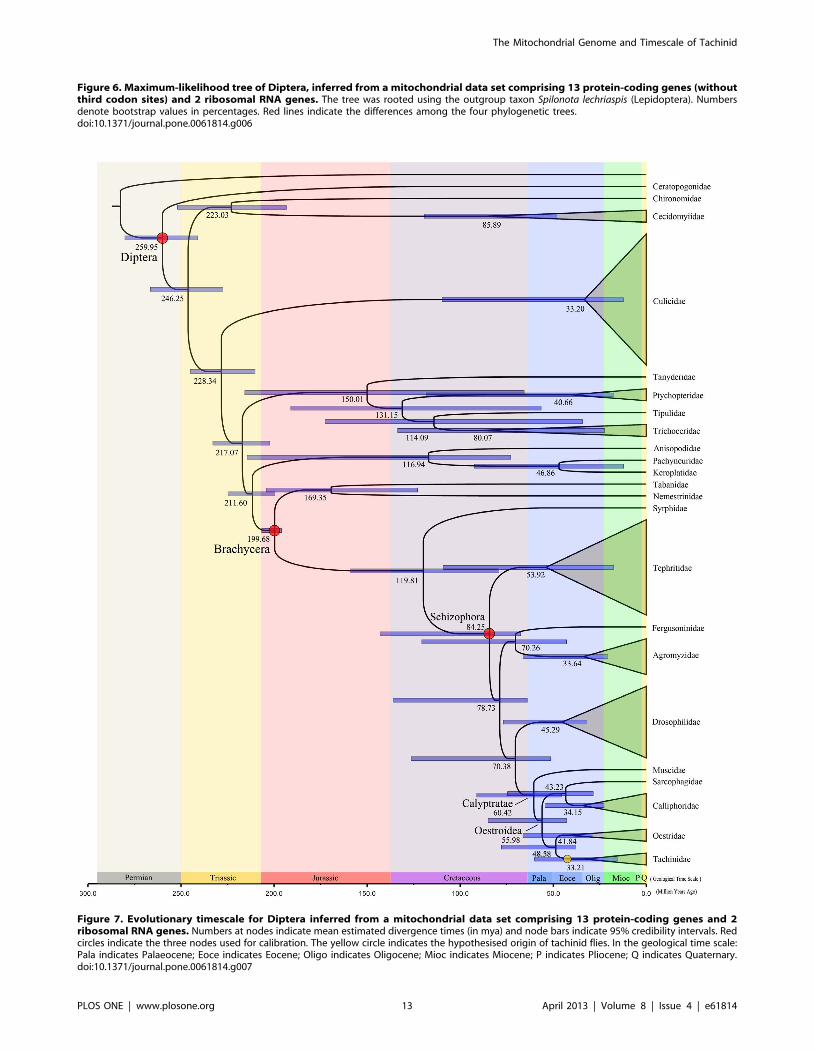
Figure 6. Maximum-likelihood tree of Diptera, inferred from a mitochondrial data set comprising 13 protein-coding genes (withoutthird codon sites) and 2 ribosomal RNA genes. The tree was rooted using the outgroup taxon Spilonota lechriaspis (Lepidoptera). Numbersdenote bootstrap values in percentages. Red lines indicate the differences among the four phylogenetic trees.doi:10.1371/journal.pone.0061814.g006
Figure 7. Evolutionary timescale for Diptera inferred from a mitochondrial data set comprising 13 protein-coding genes and 2ribosomal RNA genes. Numbers at nodes indicate mean estimated divergence times (in mya) and node bars indicate 95% credibility intervals. Redcircles indicate the three nodes used for calibration. The yellow circle indicates the hypothesised origin of tachinid flies. In the geological time scale:Pala indicates Palaeocene; Eoce indicates Eocene; Oligo indicates Oligocene; Mioc indicates Miocene; P indicates Pliocene; Q indicates Quaternary.doi:10.1371/journal.pone.0061814.g007
The Mitochondrial Genome and Timescale of Tachinid
PLOS ONE | www.plosone.org 13 April 2013 | Volume 8 | Issue 4 | e61814
(,84 mya), and the clade Calyptratae containing Oestroidea and
Muscidae (nested in Acalyptrata) split in the early Eocene
(,60 mya) (95% credibility interval: 45.6–91.1 mya). These
results are consistent with evidence from a number of amber
specimens from Acalyptrata and Calyptratae [68]. Subsequently,
Oestroidea divided into two groups in the middle Palaeocene
(,56 mya) (95% credibility interval (CI): 42.7–85.0 mya). The
split of Tachinidae with Oestridae is estimated to have occurred in
the early Eocene (,48 mya) (95% CI: 37.8–77.9 mya), with this
clade becoming the most speciose in Brachycera. Finally, the two
tachinid flies El. flavipalpis and Ex. sorbillans are estimated to have
separated in the early Oligocene (,33 mya) (95% CI: 15.5–
60.1 mya).
Our estimates suggest that the most recent common ancestor of
tachinid flies existed between 33 and 48 mya. The two tachinid
samples used in this study are from the same subfamily
Exoristinae, but are in separate tribes Goniini (El. flavipalpis) and
Exoristini (Ex. sorbillans). Among the four subfamilies of Tachini-
dae, Exoristinae was probably the latest to emerge [69–71].
Therefore, the time of origin of tachinid flies should be in the
earlier half of the time interval described above. We speculate that
the most recent common ancestor of tachinid flies existed in the
middle Eocene (,42–48 mya). Tachinid flies have a worldwide
distribution, but are mainly found in Palaearctic and Nearctic
regions. For a globally distributed family with significant
differences in distribution between northern and southern
continents, the relevant split is between the supercontinents
Laurasia and Gondwana in the mid-Mesozoic. Our estimates for
the origin of Tachinidae is much more recent than this. However,
given that most tachinid species are distributed throughout the
Holarctic Region, we suggest that the evolutionary history of
tachinid flies is probably tied to the split of Laurasia in the Eocene
rather than that between Laurasia and Gondwana.
We have shown that the availability of additional mitogenomes
can make a valuable contribution to our understanding of the
phylogeny and divergence times of Diptera. Our study serves as a
useful primer for the evolution of tachinid flies, but the accuracy of
divergence-time estimates can be improved by denser sampling of
tachinid mitogenomes, a greater number of fossil calibrations, and
combination with nuclear genes or morphological data. In
addition, we suggest that the stable gene order among brachyceran
species might be due to their comparatively short evolutionary
timeframe.
Supporting Information
Table S1 Nucleotide composition of all available mitogenome
sequences from Diptera.
(DOC)
Acknowledgments
We are grateful to to Jin-liang Zhao (Institute of Zoology, Chinese
Academy of Sciences, Beijing) for his arduous collection, to Fang Yu, Xiao-
he Wang (Institute of Zoology, Chinese Academy of Sciences, Beijing), and
Xiu-wei Liu (Northeast Forestry University, Harbin) for assistance with
analysis and experiments. Special thanks are due to Prof. H. Shima
(Kyushu University, Fukuoka, Japan), who generously provided the
valuable materials for identification.
Author Contributions
Conceived and designed the experiments: CDZ ZZ XLC. Performed the
experiments: ZZ TJS. Analyzed the data: ZZ DC SDW SYWH.
Contributed reagents/materials/analysis tools: CDZ XLC CTZ. Wrote
the paper: ZZ DC SYWH CTZ.
References
1. Clary DO, Wolstenholme DR (1985) The mitochondrial DNA molecule of
Drosophila yakuba: nucleotide sequence, gene organization, and genetic code. J Mol
Evol 22: 252–271.
2. Ye J, Fang R, Yi JP, Zhou GL, Zheng JZ (2010) The complete sequence
determination and analysis of four species of Bactrocera mitochondrial genome.
Plant Quarantine 24(3): 11–14.
3. Krzywinski J, Li C, Morris M, Conn JE, Lima JB et al. (2011) Analysis of the
evolutionary forces shaping mitochondrial genomes of a Neotropical malaria
vector complex. Mol Phylogenet Evol 58(3): 469–477.
4. Junqueira AC, Lessinger AC, Torres TT, Da Silva FR, Vettore AL et al. (2004)
The mitochondrial genome of the blowfly Chrysomya chloropyga (Diptera:
Calliphoridae). Gene 339: 7–15.
5. Oliveira MT, Barau JG, Martins-Junqueira AC, Feijao PC, da Rosa AC et al.
(2008) Structure and evolution of the mitochondrial genomes of Haematobia
irritans and Stomoxis calcitrans: the Muscidae (Diptera: Calyptratae) perspective.
Mol Phylogenet Evol 48: 850–857.
6. Cameron SL, Lambkin CL, Barker SC, Whiting MF (2007) A mitochondrial
genome phylogeny of Diptera: whole genome sequence data accurately resolve
relationships over broad timescales with high precision. Syst Entom 32(1): 40–
59.
7. Moreno M, Marinotti O, Krzywinski J, Tadei WP, James AA et al. (2010)
Complete mtDNA genomes of Anopheles darlingi and an approach to anopheline
divergence time. Malaria J 9: 127.
8. Mousson L, Dauga C, Garrigues T, Schaffner F, Vazeille M et al. (2005)
Phylogeography of Aedes (Stegomyia) aegypti (L.) and Aedes (Stegomyia) albopictus
(Skuse) (Diptera: Culicidae) based on mitochondrial DNA variations. Genet Res
86: 1–11.
9. ScheVer SJ, Lewis ML (2006) Mitochondrial phylogeography of the vegetable
pest Liriomyza trifolii (Diptera: Agromyzidae): diverged clades and invasive
populations. Ann Entomol Soc Am 99: 991–998.
10. Chatterjee S, Taraphdar T, Mohandas TP (2005) Molecular analysis of
divergence in tachinid uzi (Exorista sorbillans) populations in India. Genetica 125:
1–15.
11. Nardi F, Carapelli A, Boore JL, Roderick GK, Dallai R et al. (2010)
Domestication of olive fly through a multi-regional host shift to cultivated
olives: Comparative dating using complete mitochondrial genomes. Mol
Phylogenet Evol 57: 678–686.
12. Beckenbach AT (2012) Mitochondrial Genome Sequences of Nematocera
(Lower Diptera): Evidence of Rearrangement following a Complete Genome
Duplication in a Winter Crane Fly Genome Biol Evol 4(2): 89–101.
13. Matsumoto Y, Yanase T, Tsuda T, Noda H (2009) Species-specific
mitochondrial gene rearrangements in biting midges and vector species
identification. Med Vet Entomol 23: 47–55.
14. Beckenbach AT, Joy JB (2009) Evolution of the mitochondrial genomes of gall
midges (Diptera: Cecidomyiidae): rearrangement and severe truncation of tRNA
genes. Genome Biol Evol 1: 278–287.
15. Behura SK, Lobo NF, Haas B, deBruyn D, Lovin DD, et al. (2011) Complete
sequences of mitochondria genomes of Aedes aegypti and Culex quinquefasciatus and
comparative analysis of mitochondrial DNA fragments inserted in the nuclear
genomes. Insect Biochem Mol Biol 41: 770–777.
16. Yang F, Du YZ, Wang LP, Cao JM, Yu WW (2011) The complete
mitochondrial genome of the leafminer Liriomyza sativae (Diptera: Agromyzidae):
Great difference in the A+T-rich region compared to Liriomyza trifolii. Gene 485:
7–15.
17. Torres TT, Dolezal M, Schlotterer C, Ottenwalder B (2009) Expression profiling
of Drosophila mitochondrial genes via deep mRNA sequencing. Nucleic Acids Res
37(22): 7509–7518.
18. Nelson LA, Cameron SL, Yeates DK (2011) The complete mitochondrial
genome of the gall-forming fly, Fergusonina taylori Nelson and Yeates (Diptera:
Fergusoninidae). Mitochondrial DNA, 22(3): 197–199.
19. Nelson LA, Cameron SL, Yeates DK (2012 ) The complete mitochondrial
genome of the flesh fly, Sarcophaga impatiens Walker (Diptera: Sarcophagidae)
Mitochondrial DNA 23(2): 42–43.
20. Beard CB, Hamm DM, Collins FH (1993) The mitochondrial genome of the
mosquito Anophele gambiae, DNA sequence, genome organization, and compar-
isons with mitochondrial sequences of other insects. Insect Mol Biol 2(2): 103–
124.
21. Mitchell SE, Cockburn AF, Seawright JA (1993) The mitochondrial genome of
Anopheles quadrimaculatus species A: complete nucleotide sequence and gene
organization. Genome 36: 1058–1073.
22. Spanos L, Koutroumbas G, Kotsyfakis M, Louis C (2000) The mitochondrial
genome of the mediterranean fruit fly, Ceratitis capitata. Insect Mol Biol 9(2): 139–
144.
The Mitochondrial Genome and Timescale of Tachinid
PLOS ONE | www.plosone.org 14 April 2013 | Volume 8 | Issue 4 | e61814
23. Lessinger AC, Junqueira ACM, Lemos TA, Kemper EL, da Silva FR et al.
(2000) The mitochondrial genome of the primary screwwormfly Cochliomyia
hominivorax (Diptera: Calliphoridae). Insect Mol Biol 9: 521–529.
24. Weigl S, Testini G, Parisi A, Dantas-Torres F, Traversa D et al. (2010) The
mitochondrial genome of the common cattle grub, Hypoderma lineatum. Med VetEntomol 24: 329–335.
25. Wang S, Lei Z, Wang H, Dong B, Ren B (2009) The complete mitochondrialgenome of the leafminer Liriomyza trifolii (Diptera: Agromyzidae). Mol Biol Rep
38: 687–692.
26. Shao YJ, Hu XQ, Peng GD, Wang RX, Gao RN et al. (2012) Structure andevolution of the mitochondrial genome of Exorista sorbillans: the Tachinidae
(Diptera: Calyptratae) perspective. Mol Biol Rep 39: 11023–11030.27. Nelson LA, Lambkin CL, Batterham P, Wallman JF, Dowton M et al. (2012)
Beyond barcoding: A mitochondrial genomics approach to molecular phyloge-netics and diagnostics of blowflies (Diptera: Calliphoridae). Gene 511: 131–142.
28. Wiegmann BM, Trautwein MD, Winkler IS, Barr NB, Kim JW et al. (2011)
Episodic radiations in the fly tree of life. PNAS 108(14): 5690–5695.29. O’Hara JE (2010) World genera of the Tachinidae (Diptera) and their regional
occurrence. Version 5.0. PDF document, 74 pp. Available: http://www.nadsdiptera.org/Tach/Genera/Gentach_ver5.pdf.
30. Aldrich JM (1933) Notes on the Tachinid genus Elodia R. D., with three new
species of Elodia and Phorocera (Diptera) from Japan. Proceedings of theEntomological Society of Washington 35: 21–22.
31. Chao CM, Liang EY, Zhou SX (2009) Tachinidae, 555–816. In: Yang D, eds.Fauna of Hebei Province (Diptera) [In Chinese]. Beijing: China Agricultural
Science and Technology Press. 1–863.32. Liu YQ, Li GW (2002) Fauna sinica, insect vol.27, Lepidoptera, Tortricidae.
Beijing: Science Press. 315–316.
33. Zhao JL, Zhang YY, Luo AR, Jiang GF, Cameron SL et al. (2010) The completemitochondrial genome of Spilonota lechriaspis Meyrick (Lepidoptera: Tortricidae).
Mol Biol Rep 38: 3757–3764.34. McAlpine JF (1989) Phylogeny and classification of the Muscomorpha. In:
McAlpine JF, ed. Manual of Nearctic Diptera, Research Branch, Agriculture
Canada. Monograph 32, Vol. 3. 1397–1518.35. Nirmala X, Hypsa V, Zurovec M (2001) Molecular phylogeny of Calyptratae
(Diptera: Brachycera): the evolution of 18S and 16S ribosomal rDNAs in higherdipterans and their use in phylogenetic inference. Insect Mol Biol 10: 475–485.
36. Kutty SN, Pape T, Wiegmann BM, Meier R (2010) Molecular phylogeny of theCalyptratae (Diptera: Cyclorrhapha) with an emphasis on the superfamily
Oestroidea and the position of Mystacinobiidae and McAlpine’s fly. Syst Entom
35: 614–635.37. Wiegmann BM, Yeates DK, Thorne JL, Kishino H (2003) Time flies, a new
molecular time scale for brachyceran fly evolution without a clock. Syst Biol 52:745–756.
38. Simon C, Frati F, Beckenbach AT, Crespi B, Liu H et al. (1994) Evolution,
weighting and Phylogenetics utility of mitochondrial gene sequences andcompilation of conserved polymerase chain reaction Primers. Ann Entomol Soc
Am 87(6): 651–701.39. Han H (2000) Molecular phylogenetic study of the tribe Trypetini (Diptera:
Tephritidae), using mitochondrial 16S ribosomal DNA sequences. Biochem SystEcol 28(6): 501–513.
40. Lessinger AC, Junqueira AC, Conte FF, Azeredo-Espin AM (2004) Analysis of a
conserved duplicated tRNA gene in the mitochondrial genome of blowflies.Gene 339: 1–6.
41. Oliveira MT, da Rosa AC, Azeredo-Espin AML, Lessinger AC (2006)Improving access to the control region and tRNA gene clusters of dipteran
mitochondrial DNA. J Med Entomol 43: 636–639.
42. Singh VK, Mangalam AK, Dwivedi S, Naik S (1998) Primer premier: programfor design of degenerate primers from a protein sequence. Biotechniques 24:
318–319.43. Hall TA (1999) BioEdit: a user-friendly biological sequence alignment editor and
analysis program for Windows 95/98/NT. Nucleic Acids Symp Ser 41: 95–98.
44. Lowe TM, Eddy SR (1997) tRNAscan-SE: a program for improved detection oftransfer RNA genes in genomic sequence. Nucleic Acids Res 25: 955–964.
45. Zuker M, Stiegler P (1981) Optimal computer folding of large RNA sequencesusing thermodynamics and auxiliary information. Nucleic Acids Res 9(1): 133–
148.46. Tamura K, Dudley J, Nei M, Kumar S (2007) MEGA4: molecular evolutionary
genetics analysis (MEGA) software version 4.0. Molecular Biology and Evolution
24: 1596–1599.
47. Larkin MA, Blackshields G, Brown NP, Chenna R, McGettigan PA et al. (2007)
Clustal W and Clustal X version 2.0. Bioinformatics 23: 2947–2948.
48. Posada D, Crandall KA (1998) MODELTEST: testing the model of DNA
substitution. Bioinformatics 14: 817–818.
49. Stamatakis A (2006) RAxML-VI-HPC: maximum likelihood-based phylogenetic
analyses with thousands of taxa and mixed models. Bioinformatics 22(21): 2688–
2690.
50. Ronquist F, Huelsenbeck JP (2003) MrBayes 3: Bayesian phylogenetic inference
under mixed models. Bioinformatics 19: 1572–1574.
51. Drummond AJ, Rambaut A (2007) BEAST: Bayesian evolutionary analysis by
sampling trees. BMC Evol Biol 7: 214.
52. Drummond AJ, Ho SYW, Phillips MJ, Rambaut A (2006) Relaxed
phylogenetics and dating with confidence. PLoS Biology 4: e88.
53. Grimaldi D, Engel MS (2005) Evolution of the Insects. New York: Cambridge
Univ Press.
54. Krzeminski W, Krzeminska E, Papier F (1994) Grauvogelia arzvilleriana sp. n.–The
oldest Diptera species (Lower/Middle Triassic of France). Acta Zool Cracov 37:
95–99.
55. Winkler IS, Labandeira C, Wappler T, Wilf P (2010) Distinguishing
Agromyzidae (Diptera: Schizophora) leaf mines in the fossil record: New taxa
from the Paleogene of North America and Germany and their evolutionary
implications. J Paleontol 84: 935–954.
56. Rambaut A, Drummond AJ (2007) Tracer V1.4. Available: http://beast.bio.
edsac.uk/Tracer.
57. Lewis DL, Farr CL, Kaguni LS (1995) Drosophila melanogaster mitochondrial
DNA: completion of the nucleotide sequence and evolutionary comparisons.
Insect Mol Biol 4: 263–278.
58. Krzywinski J, Grushko OG, Besansky NJ (2006) Analysis of the complete
mitochondrial DNA from Anopheles funestus: an improved dipteran mitochondrial
genome annotation and a temporal dimension of mosquito evolution. Mol
Phylogenet Evol 39: 417–423.
59. Yu DJ, Xu L, Nardi F, Li JG, Zhang RJ (2007) The complete nucleotide
sequence of the mitochondrial genome of the oriental fruit fly, Bactrocera dorsalis
(Diptera: Tephritidae). Gene 396(1): 66–74.
60. Jiang ST, Hong GY, Yu M, Li N, Yang Y et al. (2009) Characterization of the
complete mitochondrial genome of the giant silkworm moth, Eriogyna pyretorum
(Lepidoptera: Saturniidae). Int J Biol Sci 5(4): 351–365.
61. Boore JL, Macey JR, Medina M (2005) Sequencing and comparing whole
mitochondrial genomes of animals. Methods Enzymol 395, 311–348.
62. Lessinger AC, Azeredo-Espin AML (2000) Evolution and structural organization
of mitochondrial DNA control region of myiasis-causing flies. Med Vet Entom
14: 71–80.
63. Oliveira MT, Azeredo-Espin AML, Lessinger AC (2007) The mitochondrial
DNA control region of Muscidae flies: evolution and structural conservation in a
dipteran context. J Mol Evol 64: 519–527.
64. Griffiths GCD (1972) The phylogenetic classification of Diptera Cyclorrhapha,
with special reference to the structure of the male postabdomen. Ser
Entomologica 8: 1–340.
65. Hennig W (1976) Das Hypopygium von Lonchoptera lutea Panzer und die
phylogenetischen Verwandtschaftsbeziehungen der Cyclorrhapha (Diptera).
Stuttgarter Beitrage zur Naturkunde. Ser A (Biologie) 283: 1–63.
66. Pape T (1992) Phylogeny of the Tachinidae family-group (Diptera: Calyptratae).
Tijdschrift voor Entomologie 135: 43–86.
67. Yeates DK, Wiegmann BM, Courtney GW, Meier R, Lambkin C et al. (2007)
Phylogeny and systematics of Diptera: Two decades of progress and prospects
Zootaxa 1668: 565–590. In: Zhang, Z.-Q. & Shear, W.A. (Eds) Linnaeus
Tercentenary: Progress in Invertebrate Taxonomy. Zootaxa, 1668, 1–766.
68. von Tschirnhaus M, Hoffeins C (2009) Fossil flies in Baltic amber–Insights in the
diversity of Tertiary Acalyptratae (Diptera, Schizophora), with new morpho-
logical characters and a key based on 1000 collected inclusions. Denisia 26: 171.
69. Stireman JO 3rd (2002) Phylogenetic relationships of tachinid flies in subfamily
Exoristinae (Tachinidae: Diptera) based on 28S rDNA and elongation factor 1-
a. Syst Entom 27: 409–435.
70. O’Hara JE, Shima H, Zhang CT (2009) Annotated catalogue of the Tachinidae
(Insecta: Diptera) of China. Zootaxa 2190: 1–236.
71. Tachi T, Shima H (2009) Molecular phylogeny of the subfamily Exoristinae
(Diptera, Tachinidae), with discussions on the evolutionary history of female
oviposition strategy. Syst Entom 35: 148–163.
The Mitochondrial Genome and Timescale of Tachinid
PLOS ONE | www.plosone.org 15 April 2013 | Volume 8 | Issue 4 | e61814
Related Documents


