ARTICLE doi:10.1038/nature13418 The mitochondrial deubiquitinase USP30 opposes parkin-mediated mitophagy Baris Bingol 1 *, Joy S. Tea 1 *, Lilian Phu 2 , Mike Reichelt 3 , Corey E. Bakalarski 4 , Qinghua Song 5 , Oded Foreman 3 , Donald S. Kirkpatrick 2 & Morgan Sheng 1 Cells maintain healthy mitochondria by degrading damaged mitochondria through mitophagy; defective mitophagy is linked to Parkinson’s disease. Here we report that USP30, a deubiquitinase localized to mitochondria, antagonizes mitophagy driven by the ubiquitin ligase parkin (also known as PARK2) and protein kinase PINK1, which are encoded by two genes associated with Parkinson’s disease. Parkin ubiquitinates and tags damaged mitochondria for clearance. Overexpression of USP30 removes ubiquitin attached by parkin onto damaged mitochondria and blocks parkin’s ability to drive mitophagy, whereas reducing USP30 activity enhances mitochondrial degradation in neurons. Global ubiquitination site profiling identified multiple mitochondrial substrates oppositely regulated by parkin and USP30. Knockdown of USP30 rescues the defective mitophagy caused by pathogenic mutations in parkin and improves mitochondrial integ- rity in parkin- or PINK1-deficient flies. Knockdown of USP30 in dopaminergic neurons protects flies against paraquat toxicity in vivo, ameliorating defects in dopamine levels, motor function and organismal survival. Thus USP30 inhibition is potentially beneficial for Parkinson’s disease by promoting mitochondrial clearance and quality control. Mitophagy, a specialized autophagy pathway that mediates the clear- ance of damaged mitochondria by lysosomes, is important for mito- chondrial quality control 1 . Defective mitochondria, if left uncleared, can be a source of oxidative stress and compromise the health of the entire mitochondrial network. Parkinson’s disease is characterized prominently, but not solely, by loss of dopaminergic neurons in the substantia nigra. Although the patho- genic mechanisms of Parkinson’s disease are unclear, several lines of evidence suggest that mitochondrial dysfunction is central to the disease 2 . Most compellingly, familial Parkinson’s disease can be caused by muta- tions in the ubiquitin ligase parkin and protein kinase PINK1 3,4 , both of which maintain healthy mitochondria via regulating mitochondrial dynamics and quality control 1 . Genetic studies established that PINK1 acts upstream of parkin 5–7 . PINK1 recruits parkin from the cytoplasm to the surface of damaged mitochondria, leading to parkin-mediated ubiquitination of mitochondrial outer membrane proteins and removal of damaged mitochondria by mitophagy 8–10 . Parkinson’s disease-associated mutations in PINK1 or parkin impair parkin recruitment, mitochon- drial ubiquitination, and/or mitophagy 8,11,12 . In the context of the inher- ently high mitochondrial oxidative stress in substantia nigra dopamine neurons 13 , loss of parkin-mediated mitophagy could explain the greater susceptibility of substantia nigra neurons to neurodegeneration. Thus, promoting mitophagy and enhancing mitochondrial quality control could benefit dopaminergic neurons. To this end, we performed a screen for deubiquitinase enzymes (DUBs) that function in opposition to parkin and identified USP30, a mitochondria-localized DUB, as an antag- onist of parkin-mediated mitophagy. USP30 antagonizes mitophagy We screened a Flag-tagged human DUB complementary DNA library in a well-established mitochondrial degradation assay 8 : in cultured cells overexpressing parkin, mitochondria depolarization induced by the protonophore carbonyl cyanide 3-chlorophenylhydrazone (CCCP) results in loss of mitochondria (measured by immunostaining for mito- chondrial outer membrane protein TOM20, also known as TOMM20). CCCP caused a robust disappearance of TOM20 staining in more than 80% of cells transfected with green fluorescent protein (GFP)-conjugated parkin (Fig. 1a). By testing individual cDNAs from a library of about 100 different DUBs, only two DUBs (USP30 and DUBA2; also known as OTUD6A) robustly blocked this loss of TOM20 staining (Fig. 1a). We focused on USP30 because it was reported to be localized in the mitochondrial outer membrane with its enzymatic domain putatively facing the cytoplasm 14 . We confirmed specific mitochondrial association of USP30 (Extended Data Fig. 1a–c). Thus, USP30 is in the right subcel- lular compartment to counteract the action of parkin on mitochondria. The ability of USP30 overexpression to prevent CCCP-induced mito- phagy was further confirmed in dopaminergic SH-SY5Y cells transfected with MYC–parkin (Fig. 1b). In addition to TOM20, USP30 overexpres- sion also blocked the CCCP-induced loss of HSP60 (a mitochondrial matrix protein, also known as HSPD1), indicating that USP30 antag- onizes en masse degradation of mitochondria (Fig. 1b–d). A catalytically inactive USP30(C77S) mutant 14 was ineffective at preventing parkin- mediated mitochondrial degradation, indicating that USP30 counteracts mitophagy through deubiquitination (Fig. 1b–d). Consistently, USP30 overexpression reduced accumulation of ubiquitin signal on mitochon- dria in CCCP-treated GFP–parkin-expressing cells, dependent on USP30 catalytic activity (Extended Data Fig. 2a, b). USP30 co-expressed with parkin also reduced CCCP-induced recruitment of autophagy markers p62 and LC3–GFP 15–17 to parkin-associated mitochondria (Extended Data Fig. 2c–f). Co-expression of USP30 did not alter parkin express- ion level or the translocation of parkin to mitochondria (Extended Data Fig. 1d, e; Fig. 1b, e). These data indicate that USP30 functions as a DUB that opposes ubiquitination of mitochondrial proteins by parkin, thereby inhibiting mitophagy. 1 Department of Neuroscience, Genentech, Inc., South San Francisco, California 94080, USA. 2 Department of Protein Chemistry, Genentech, Inc., South San Francisco, California 94080, USA. 3 Department of Pathology, Genentech, Inc., South San Francisco, California 94080, USA. 4 Department of Bioinformatics & Computational Biology, Genentech, Inc., South San Francisco, California 94080, USA. 5 Department of Non-Clinical Biostatistics, Genentech, Inc., South San Francisco, California 94080, USA. *These authors contributed equally to this work. 370 | NATURE | VOL 510 | 19 JUNE 2014 Macmillan Publishers Limited. All rights reserved ©2014

Welcome message from author
This document is posted to help you gain knowledge. Please leave a comment to let me know what you think about it! Share it to your friends and learn new things together.
Transcript
ARTICLEdoi:10.1038/nature13418
The mitochondrial deubiquitinase USP30opposes parkin-mediated mitophagyBaris Bingol1*, Joy S. Tea1*, Lilian Phu2, Mike Reichelt3, Corey E. Bakalarski4, Qinghua Song5, Oded Foreman3,Donald S. Kirkpatrick2 & Morgan Sheng1
Cells maintain healthy mitochondria by degrading damaged mitochondria through mitophagy; defective mitophagyis linked to Parkinson’s disease. Here we report that USP30, a deubiquitinase localized to mitochondria, antagonizesmitophagy driven by the ubiquitin ligase parkin (also known as PARK2) and protein kinase PINK1, which are encodedby two genes associated with Parkinson’s disease. Parkin ubiquitinates and tags damaged mitochondria for clearance.Overexpression of USP30 removes ubiquitin attached by parkin onto damaged mitochondria and blocks parkin’s ability todrive mitophagy, whereas reducing USP30 activity enhances mitochondrial degradation in neurons. Global ubiquitinationsite profiling identified multiple mitochondrial substrates oppositely regulated by parkin and USP30. Knockdown ofUSP30 rescues the defective mitophagy caused by pathogenic mutations in parkin and improves mitochondrial integ-rity in parkin- or PINK1-deficient flies. Knockdown of USP30 in dopaminergic neurons protects flies against paraquattoxicity in vivo, ameliorating defects in dopamine levels, motor function and organismal survival. Thus USP30 inhibition ispotentially beneficial for Parkinson’s disease by promoting mitochondrial clearance and quality control.
Mitophagy, a specialized autophagy pathway that mediates the clear-ance of damaged mitochondria by lysosomes, is important for mito-chondrial quality control1. Defective mitochondria, if left uncleared, canbe a source of oxidative stress and compromise the health of the entiremitochondrial network.
Parkinson’s disease is characterized prominently, but not solely, byloss of dopaminergic neurons in the substantia nigra. Although the patho-genic mechanisms of Parkinson’s disease are unclear, several lines ofevidence suggest that mitochondrial dysfunction is central to the disease2.Most compellingly, familial Parkinson’s disease can be caused by muta-tions in the ubiquitin ligase parkin and protein kinase PINK13,4, both ofwhich maintain healthy mitochondria via regulating mitochondrialdynamics and quality control1. Genetic studies established that PINK1acts upstream of parkin5–7. PINK1 recruits parkin from the cytoplasmto the surface of damaged mitochondria, leading to parkin-mediatedubiquitination of mitochondrial outer membrane proteins and removalof damaged mitochondria by mitophagy8–10. Parkinson’s disease-associatedmutations in PINK1 or parkin impair parkin recruitment, mitochon-drial ubiquitination, and/or mitophagy8,11,12. In the context of the inher-ently high mitochondrial oxidative stress in substantia nigra dopamineneurons13, loss of parkin-mediated mitophagy could explain the greatersusceptibility of substantia nigra neurons to neurodegeneration. Thus,promoting mitophagy and enhancing mitochondrial quality controlcould benefit dopaminergic neurons. To this end, we performed a screenfor deubiquitinase enzymes (DUBs) that function in opposition toparkin and identified USP30, a mitochondria-localized DUB, as an antag-onist of parkin-mediated mitophagy.
USP30 antagonizes mitophagyWe screened a Flag-tagged human DUB complementary DNA libraryin a well-established mitochondrial degradation assay8: in cultured cellsoverexpressing parkin, mitochondria depolarization induced by the
protonophore carbonyl cyanide 3-chlorophenylhydrazone (CCCP)results in loss of mitochondria (measured by immunostaining for mito-chondrial outer membrane protein TOM20, also known as TOMM20).CCCP caused a robust disappearance of TOM20 staining in more than80% of cells transfected with green fluorescent protein (GFP)-conjugatedparkin (Fig. 1a). By testing individual cDNAs from a library of about100 different DUBs, only two DUBs (USP30 and DUBA2; also knownas OTUD6A) robustly blocked this loss of TOM20 staining (Fig. 1a).We focused on USP30 because it was reported to be localized in themitochondrial outer membrane with its enzymatic domain putativelyfacing the cytoplasm14. We confirmed specific mitochondrial associationof USP30 (Extended Data Fig. 1a–c). Thus, USP30 is in the right subcel-lular compartment to counteract the action of parkin on mitochondria.
The ability of USP30 overexpression to prevent CCCP-induced mito-phagy was further confirmed in dopaminergic SH-SY5Y cells transfectedwith MYC–parkin (Fig. 1b). In addition to TOM20, USP30 overexpres-sion also blocked the CCCP-induced loss of HSP60 (a mitochondrialmatrix protein, also known as HSPD1), indicating that USP30 antag-onizes en masse degradation of mitochondria (Fig. 1b–d). A catalyticallyinactive USP30(C77S) mutant14 was ineffective at preventing parkin-mediated mitochondrial degradation, indicating that USP30 counteractsmitophagy through deubiquitination (Fig. 1b–d). Consistently, USP30overexpression reduced accumulation of ubiquitin signal on mitochon-dria in CCCP-treated GFP–parkin-expressing cells, dependent on USP30catalytic activity (Extended Data Fig. 2a, b). USP30 co-expressed withparkin also reduced CCCP-induced recruitment of autophagy markersp62 and LC3–GFP15–17 to parkin-associated mitochondria (ExtendedData Fig. 2c–f). Co-expression of USP30 did not alter parkin express-ion level or the translocation of parkin to mitochondria (Extended DataFig. 1d, e; Fig. 1b, e). These data indicate that USP30 functions as a DUBthat opposes ubiquitination of mitochondrial proteins by parkin, therebyinhibiting mitophagy.
1Department of Neuroscience, Genentech, Inc., South San Francisco, California 94080, USA. 2Department of Protein Chemistry, Genentech, Inc., South San Francisco, California 94080, USA. 3Departmentof Pathology, Genentech, Inc., South San Francisco, California 94080, USA. 4Department of Bioinformatics & Computational Biology, Genentech, Inc., South San Francisco, California 94080, USA.5Department of Non-Clinical Biostatistics, Genentech, Inc., South San Francisco, California 94080, USA.*These authors contributed equally to this work.
3 7 0 | N A T U R E | V O L 5 1 0 | 1 9 J U N E 2 0 1 4
Macmillan Publishers Limited. All rights reserved©2014
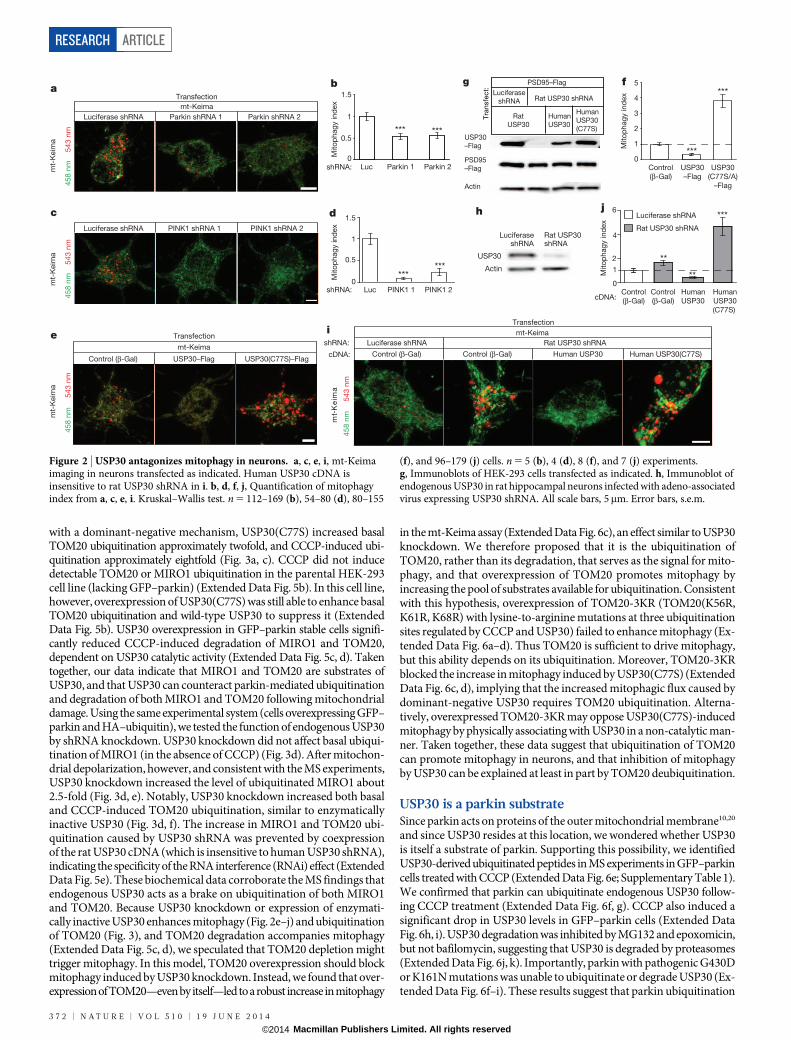
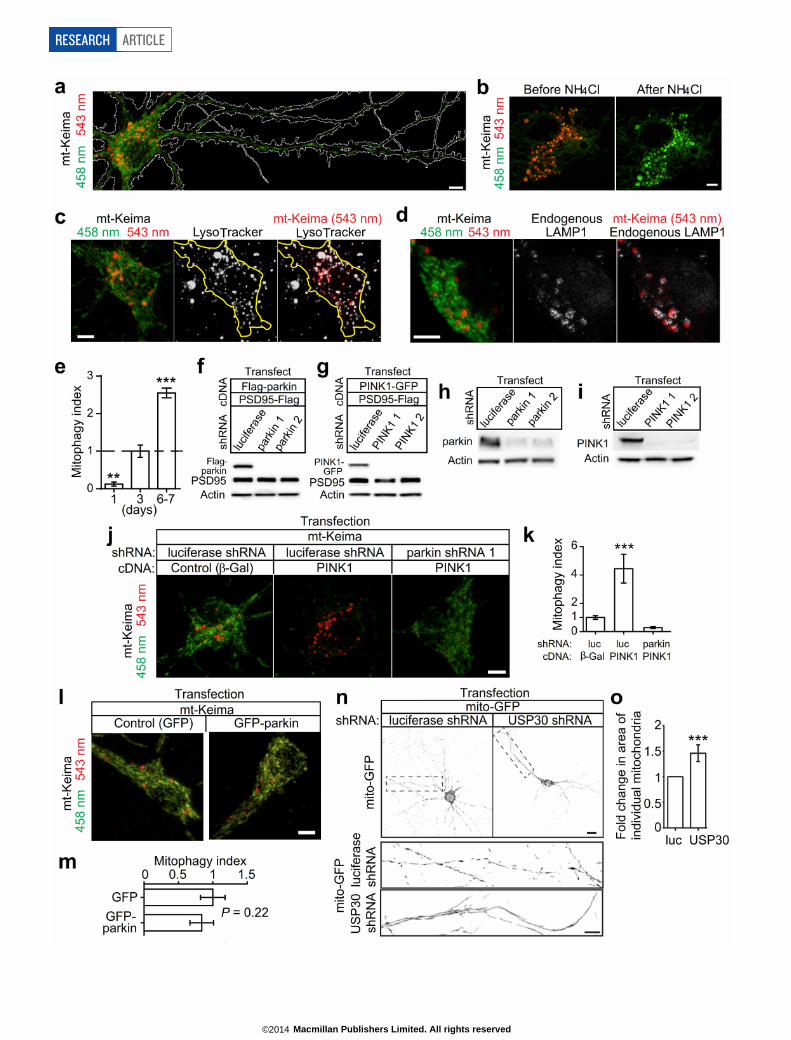
PINK1, parkin required for mitophagyTo measure mitophagy in neurons, we monitored mt-Keima, a ratio-metric pH-sensitive fluorescent protein that is targeted into the mito-chondrial matrix. A low-ratio mt-Keima-derived fluorescence (543 nm/458 nm) reports neutral environment, whereas a high-ratio fluorescencereports acidic pH18. Thus, mt-Keima enables differential imaging ofmitochondria in the cytoplasm and mitochondria in acidic lysosomes.Because mt-Keima is resistant to lysosomal proteases18, it allows for mea-surement of cumulative lysosomal delivery of mitochondria over time.
In cultured rat hippocampal neurons, mt-Keima signal accumu-lated in elongated structures characteristic of mitochondria with low543 nm/458 nm ratio values (Extended Data Fig. 3a, shown in green),and in multiple round structures throughout the cell body with highratio (acidic) signal (Extended Data Fig. 3a, red). We confirmed theseround mt-Keima-positive structures are most likely to be lysosomes,as previously described (Extended Data Fig. 3b–d)18. Since almost allof the ‘acidic’ mt-Keima signal was found in neuronal cell bodies, weused the ratio of the area of lysosomal (red) signal/mitochondrial (green)signal within the cell body as a measure of lysosomal delivery of mito-chondria (‘mitophagy index’)18. As quantified by this mitophagy index,the abundance of mt-Keima in lysosomes increased over a time courseof days (Extended Data Fig. 3e), indicating ongoing mitophagy in cul-tured neurons under basal conditions.
In heterologous cells, parkin overexpression can drive mitochondrialdegradation upon mitochondria depolarization; however, it is not yetestablished whether endogenous parkin and PINK1 are required formitophagy in either non-neural or neural cells1. To examine their rolesin neuronal mitophagy, we knocked down parkin or PINK1 in neuronalcultures using small hairpin RNAs (shRNAs) (Extended Data Fig. 3f–i).Compared to control luciferase shRNA, parkin or PINK1 shRNAs (eitherof two independent sequences) reduced mitochondria delivery to lyso-somes (Fig. 2a–d). Consistent with the genetic epistasis in flies6,7, PINK1overexpression enhanced mitophagy in neurons, an effect that was com-pletely eliminated by parkin knockdown (Extended Data Fig. 3j, k). Onthe other hand, parkin overexpression by itself had no apparent effecton basal mitophagy, as measured by the mt-Keima assay (Extended DataFig. 3l, m). Thus, neuronal mitophagy requires both PINK1 and par-kin, with PINK1—apparently the limiting factor—acting upstream ofparkin.
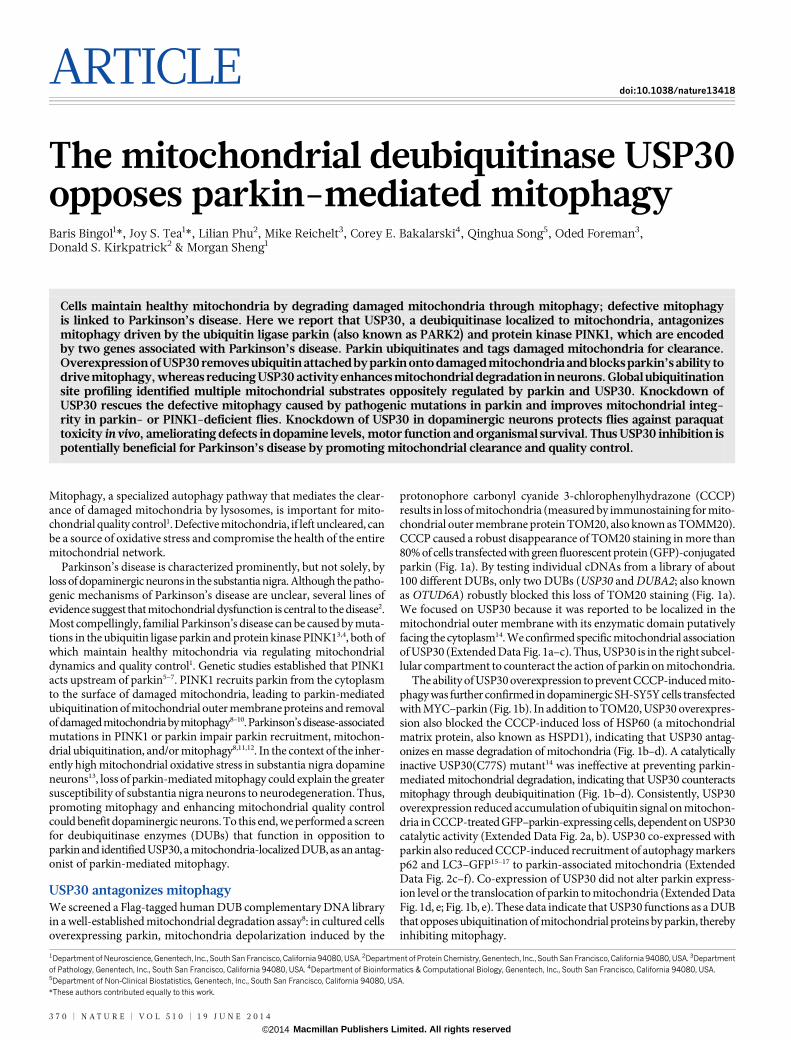
USP30 antagonizes mitophagy in neuronsDoes USP30 suppress mitophagy in neurons? In the mt-Keima assay,USP30 overexpression caused a ,70% reduction in mitophagy index,
indicating that USP30 inhibits lysosomal delivery of mitochondria inneurons (Fig. 2e, f). In contrast, overexpression of enzymatically inact-ive USP30 (C77S or C77A) induced a robust increase in mitophagy(Fig. 2e, f), probably reflecting a dominant-negative action of catalyti-cally inactive USP30. To test the function of endogenous USP30, weknocked down USP30 using shRNAs (Fig. 2g, h). In neurons, the ratUSP30 shRNA induced a modest increase in the area of individual mito-chondria in dendrites (Extended Data Fig. 3n, o). More importantly,USP30 knockdown enhanced mitophagy (,60% increase in mitophagyindex) (Fig. 2i, j). This effect was ‘rescued’ by co-transfection of shRNA-resistant human USP30 cDNA, indicating that USP30 shRNA was notexerting a non-specific effect (Fig. 2g, i, j). In fact, neurons co-transfectedwith human USP30 cDNA plus rat USP30 shRNA showed lower levelsof lysosomal accumulation of mt-Keima than controls, similar to neuronsoverexpressing wild-type USP30 by itself (Fig. 2e, f). Moreover, humanUSP30(C77S) mutant failed to reverse the enhanced mitophagy inducedby USP30 shRNA, and actually enhanced mitophagic activity even morethan USP30 shRNA (Fig. 2i, j), the latter result suggesting that USP30knockdown is incomplete. In HEK-293 cells, autophagic flux (as mea-sured by dynamic levels of LC3-II and p62) was inhibited by USP30 over-expression, dependent on enzymatic activity, and enhanced by USP30knockdown (Extended Data Fig. 4, see Supplementary Results). Togeth-er, these results show that endogenous USP30 restrains mitophagy incells through its DUB activity.
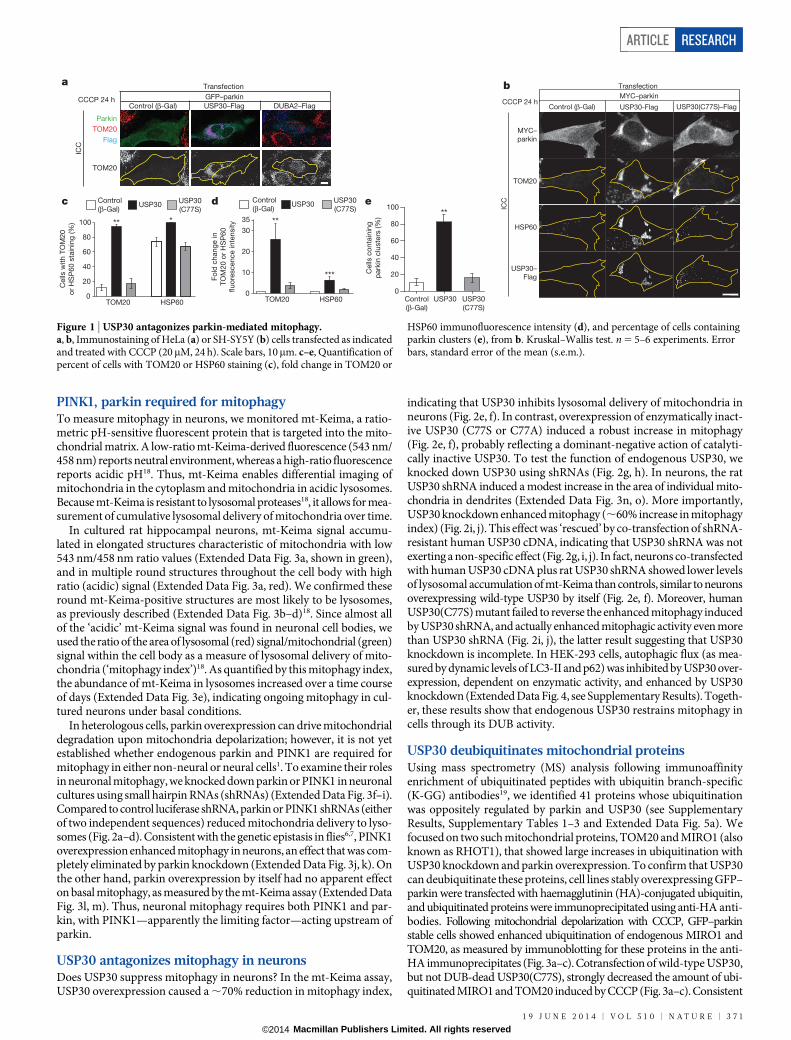
USP30 deubiquitinates mitochondrial proteinsUsing mass spectrometry (MS) analysis following immunoaffinityenrichment of ubiquitinated peptides with ubiquitin branch-specific(K-GG) antibodies19, we identified 41 proteins whose ubiquitinationwas oppositely regulated by parkin and USP30 (see SupplementaryResults, Supplementary Tables 1–3 and Extended Data Fig. 5a). Wefocused on two such mitochondrial proteins, TOM20 and MIRO1 (alsoknown as RHOT1), that showed large increases in ubiquitination withUSP30 knockdown and parkin overexpression. To confirm that USP30can deubiquitinate these proteins, cell lines stably overexpressing GFP–parkin were transfected with haemagglutinin (HA)-conjugated ubiquitin,and ubiquitinated proteins were immunoprecipitated using anti-HA anti-bodies. Following mitochondrial depolarization with CCCP, GFP–parkinstable cells showed enhanced ubiquitination of endogenous MIRO1 andTOM20, as measured by immunoblotting for these proteins in the anti-HA immunoprecipitates (Fig. 3a–c). Cotransfection of wild-type USP30,but not DUB-dead USP30(C77S), strongly decreased the amount of ubi-quitinated MIRO1 and TOM20 induced by CCCP (Fig. 3a–c). Consistent
c USP30
(C77S)
USP30
(C77S)
Control
(β-Gal) Control
(β-Gal)
USP30
(C77S)
Control
(β-Gal)
** **
***
**
d USP30USP30
Transfection
MYC–
parkin
USP30–
Flag
HSP60
TOM20
b
0
MYC–parkin
ICC
GFP–parkin
USP30–Flag
a
Parkin
TOM20
Flag
ICC
DUBA2–Flag
TOM20
Control (β-Gal)
Transfection
e
Cells
co
nta
inin
g
park
in c
luste
rs (%
)
USP30
CCCP 24 h
0
20
40
60
80
100
0
10
20
30
TOM20 HSP60
35
TOM20 HSP60
Control (β-Gal) USP30-Flag USP30(C77S)–Flag
*F
old
chang
e in
TO
M20 o
r H
SP
60
fluo
rescence inte
nsity
Cells
with T
OM
20
or
HS
P60 s
tain
ing
(%
)
CCCP 24 h
100
80
60
40
20
Figure 1 | USP30 antagonizes parkin-mediated mitophagy.a, b, Immunostaining of HeLa (a) or SH-SY5Y (b) cells transfected as indicatedand treated with CCCP (20mM, 24 h). Scale bars, 10mm. c–e, Quantification ofpercent of cells with TOM20 or HSP60 staining (c), fold change in TOM20 or
HSP60 immunofluorescence intensity (d), and percentage of cells containingparkin clusters (e), from b. Kruskal–Wallis test. n 5 5–6 experiments. Errorbars, standard error of the mean (s.e.m.).
ARTICLE RESEARCH
1 9 J U N E 2 0 1 4 | V O L 5 1 0 | N A T U R E | 3 7 1
Macmillan Publishers Limited. All rights reserved©2014
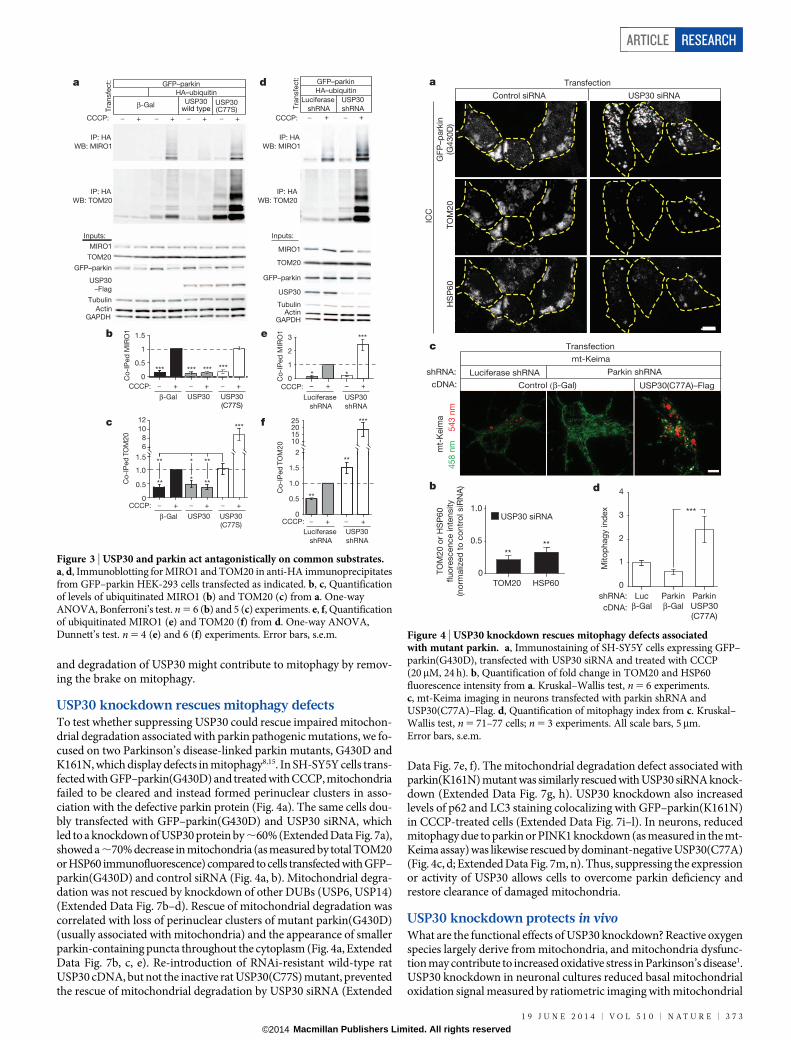
with a dominant-negative mechanism, USP30(C77S) increased basalTOM20 ubiquitination approximately twofold, and CCCP-induced ubi-quitination approximately eightfold (Fig. 3a, c). CCCP did not inducedetectable TOM20 or MIRO1 ubiquitination in the parental HEK-293cell line (lacking GFP–parkin) (Extended Data Fig. 5b). In this cell line,however, overexpression of USP30(C77S) was still able to enhance basalTOM20 ubiquitination and wild-type USP30 to suppress it (ExtendedData Fig. 5b). USP30 overexpression in GFP–parkin stable cells signifi-cantly reduced CCCP-induced degradation of MIRO1 and TOM20,dependent on USP30 catalytic activity (Extended Data Fig. 5c, d). Takentogether, our data indicate that MIRO1 and TOM20 are substrates ofUSP30, and that USP30 can counteract parkin-mediated ubiquitinationand degradation of both MIRO1 and TOM20 following mitochondrialdamage. Using the same experimental system (cells overexpressing GFP–parkin and HA–ubiquitin), we tested the function of endogenous USP30by shRNA knockdown. USP30 knockdown did not affect basal ubiqui-tination of MIRO1 (in the absence of CCCP) (Fig. 3d). After mitochon-drial depolarization, however, and consistent with the MS experiments,USP30 knockdown increased the level of ubiquitinated MIRO1 about2.5-fold (Fig. 3d, e). Notably, USP30 knockdown increased both basaland CCCP-induced TOM20 ubiquitination, similar to enzymaticallyinactive USP30 (Fig. 3d, f). The increase in MIRO1 and TOM20 ubi-quitination caused by USP30 shRNA was prevented by coexpressionof the rat USP30 cDNA (which is insensitive to human USP30 shRNA),indicating the specificity of the RNA interference (RNAi) effect (ExtendedData Fig. 5e). These biochemical data corroborate the MS findings thatendogenous USP30 acts as a brake on ubiquitination of both MIRO1and TOM20. Because USP30 knockdown or expression of enzymati-cally inactive USP30 enhances mitophagy (Fig. 2e–j) and ubiquitinationof TOM20 (Fig. 3), and TOM20 degradation accompanies mitophagy(Extended Data Fig. 5c, d), we speculated that TOM20 depletion mighttrigger mitophagy. In this model, TOM20 overexpression should blockmitophagy induced by USP30 knockdown. Instead, we found that over-expressionof TOM20—even by itself—led to arobust increase in mitophagy
in the mt-Keima assay (Extended Data Fig. 6c), an effect similar to USP30knockdown. We therefore proposed that it is the ubiquitination ofTOM20, rather than its degradation, that serves as the signal for mito-phagy, and that overexpression of TOM20 promotes mitophagy byincreasing the pool of substrates available for ubiquitination. Consistentwith this hypothesis, overexpression of TOM20-3KR (TOM20(K56R,K61R, K68R) with lysine-to-arginine mutations at three ubiquitinationsites regulated by CCCP and USP30) failed to enhance mitophagy (Ex-tended Data Fig. 6a–d). Thus TOM20 is sufficient to drive mitophagy,but this ability depends on its ubiquitination. Moreover, TOM20-3KRblocked the increase in mitophagy induced by USP30(C77S) (ExtendedData Fig. 6c, d), implying that the increased mitophagic flux caused bydominant-negative USP30 requires TOM20 ubiquitination. Alterna-tively, overexpressed TOM20-3KR may oppose USP30(C77S)-inducedmitophagy by physically associating with USP30 in a non-catalytic man-ner. Taken together, these data suggest that ubiquitination of TOM20can promote mitophagy in neurons, and that inhibition of mitophagyby USP30 can be explained at least in part by TOM20 deubiquitination.
USP30 is a parkin substrateSince parkin acts on proteins of the outer mitochondrial membrane10,20
and since USP30 resides at this location, we wondered whether USP30is itself a substrate of parkin. Supporting this possibility, we identifiedUSP30-derived ubiquitinated peptides in MS experiments in GFP–parkincells treated with CCCP (Extended Data Fig. 6e; Supplementary Table 1).We confirmed that parkin can ubiquitinate endogenous USP30 follow-ing CCCP treatment (Extended Data Fig. 6f, g). CCCP also induced asignificant drop in USP30 levels in GFP–parkin cells (Extended DataFig. 6h, i). USP30 degradation was inhibited by MG132 and epoxomicin,but not bafilomycin, suggesting that USP30 is degraded by proteasomes(Extended Data Fig. 6j, k). Importantly, parkin with pathogenic G430Dor K161N mutations was unable to ubiquitinate or degrade USP30 (Ex-tended Data Fig. 6f–i). These results suggest that parkin ubiquitination
Control
(β-Gal)
ieLuciferase shRNA
Control (β-Gal) Control (β-Gal)
shRNA:
cDNA: Human USP30(C77S)
Human
USP30 cDNA:
Human
USP30
(C77S)
Human USP30
Luciferase shRNA
Rat USP30 shRNA
0
2
4
6***
**
**
f
Rat USP30 shRNA
Transfection
mt-Keimaa
mie
K-tm
458 n
m
543 n
m
1
LuciferaseshRNA
PSD95–Flag
RatUSP30
HumanUSP30
HumanUSP30(C77S)
Tra
nsfe
ct:
Actin
PSD95–Flag
USP30–Flag
g
h
USP30
Actin
Rat USP30 shRNA
LuciferaseshRNA
USP30–Flag USP30(C77S)–Flag
c
Transfection
Control (β-Gal)
mt-Keima
458 n
m
543 n
m
0
1
2
3
4
5
***
***
Transfection
Parkin shRNA 1 Parkin shRNA 2
a b
d
Mito
phag
y ind
ex
0
0.5
1
1.5
0
0.5
1
1.5
******
shRNA: Luc Parkin 1
shRNA:
mt-Keima
458 n
m 543 n
m
Parkin 2
Mito
phag
y ind
ex
PINK1 1 PINK1 2
458 n
m 543 n
m
Luciferase shRNA PINK1 shRNA 1 PINK1 shRNA 2
j
Luc
*** ***
Mito
phag
y ind
ex
Mito
phag
y ind
ex
Luciferase shRNA
mt-
Keim
a
mt-
Keim
a
mt-
Keim
a
USP30
(C77S/A)
–Flag
USP30
–Flag
Rat USP30 shRNA
Control
(β-Gal)
Control
(β-Gal)
Figure 2 | USP30 antagonizes mitophagy in neurons. a, c, e, i, mt-Keimaimaging in neurons transfected as indicated. Human USP30 cDNA isinsensitive to rat USP30 shRNA in i. b, d, f, j, Quantification of mitophagyindex from a, c, e, i. Kruskal–Wallis test. n 5 112–169 (b), 54–80 (d), 80–155
(f), and 96–179 (j) cells. n 5 5 (b), 4 (d), 8 (f), and 7 (j) experiments.g, Immunoblots of HEK-293 cells transfected as indicated. h, Immunoblot ofendogenous USP30 in rat hippocampal neurons infected with adeno-associatedvirus expressing USP30 shRNA. All scale bars, 5mm. Error bars, s.e.m.
RESEARCH ARTICLE
3 7 2 | N A T U R E | V O L 5 1 0 | 1 9 J U N E 2 0 1 4
Macmillan Publishers Limited. All rights reserved©2014
and degradation of USP30 might contribute to mitophagy by remov-ing the brake on mitophagy.
USP30 knockdown rescues mitophagy defectsTo test whether suppressing USP30 could rescue impaired mitochon-drial degradation associated with parkin pathogenic mutations, we fo-cused on two Parkinson’s disease-linked parkin mutants, G430D andK161N, which display defects in mitophagy8,15. In SH-SY5Y cells trans-fected with GFP–parkin(G430D) and treated with CCCP, mitochondriafailed to be cleared and instead formed perinuclear clusters in asso-ciation with the defective parkin protein (Fig. 4a). The same cells dou-bly transfected with GFP–parkin(G430D) and USP30 siRNA, whichled to a knockdown of USP30 protein by ,60% (Extended Data Fig. 7a),showed a ,70% decrease in mitochondria (as measured by total TOM20or HSP60 immunofluorescence) compared to cells transfected with GFP–parkin(G430D) and control siRNA (Fig. 4a, b). Mitochondrial degra-dation was not rescued by knockdown of other DUBs (USP6, USP14)(Extended Data Fig. 7b–d). Rescue of mitochondrial degradation wascorrelated with loss of perinuclear clusters of mutant parkin(G430D)(usually associated with mitochondria) and the appearance of smallerparkin-containing puncta throughout the cytoplasm (Fig. 4a, ExtendedData Fig. 7b, c, e). Re-introduction of RNAi-resistant wild-type ratUSP30 cDNA, but not the inactive rat USP30(C77S) mutant, preventedthe rescue of mitochondrial degradation by USP30 siRNA (Extended
Data Fig. 7e, f). The mitochondrial degradation defect associated withparkin(K161N) mutant was similarly rescued with USP30 siRNA knock-down (Extended Data Fig. 7g, h). USP30 knockdown also increasedlevels of p62 and LC3 staining colocalizing with GFP–parkin(K161N)in CCCP-treated cells (Extended Data Fig. 7i–l). In neurons, reducedmitophagy due to parkin or PINK1 knockdown (as measured in the mt-Keima assay) was likewise rescued by dominant-negative USP30(C77A)(Fig. 4c, d; Extended Data Fig. 7m, n). Thus, suppressing the expressionor activity of USP30 allows cells to overcome parkin deficiency andrestore clearance of damaged mitochondria.
USP30 knockdown protects in vivoWhat are the functional effects of USP30 knockdown? Reactive oxygenspecies largely derive from mitochondria, and mitochondria dysfunc-tion may contribute to increased oxidative stress in Parkinson’s disease1.USP30 knockdown in neuronal cultures reduced basal mitochondrialoxidation signal measured by ratiometric imaging with mitochondrial
0
1
2
3
GFP–parkin
HA–ubiquitin
Luciferase
shRNA
USP30
shRNA
++ __CCCP:
Tra
nsfe
ct:
IP: HA
IP: HA
WB: TOM20
d
CCCP: + – – +
Co
-IP
ed
TO
M2
0C
o-I
Ped
MIR
O1
Luciferase
shRNA
USP30
shRNA
CCCP: + _ _ +
e
Luciferase
shRNA
c f
0
0.5
1.0
1.5
6
8
10
12
CCCP:
USP30
0
0.5
1
1.5
+
USP30
(C77S)β-Gal
_ _ _ + +
***
** ***
*** *** *** ***
CCCP: + _ _ _ + +
a
Tra
nsfe
ct:
β-Gal USP30wild type
HA–ubiquitin
USP30(C77S)
GFP–parkin
IP: HA
WB: MIRO1
Inputs:
GFP–parkin
USP30
–Flag
CCCP: ++++ ____
ActinGAPDH
IP: HA
WB: TOM20
TOM20
Co
-IP
ed
TO
M2
0C
o-I
Ped
MIR
O1b
Tubulin
MIRO1
USP30 USP30
(C77S)β-Gal
USP30
shRNA
**
***
0
0.5
1.0
1.5
2
10152025 ***
**
**
** * **
Inputs:
WB: MIRO1
USP30
GFP–parkin
TOM20
ActinGAPDH
Tubulin
MIRO1
Figure 3 | USP30 and parkin act antagonistically on common substrates.a, d, Immunoblotting for MIRO1 and TOM20 in anti-HA immunoprecipitatesfrom GFP–parkin HEK-293 cells transfected as indicated. b, c, Quantificationof levels of ubiquitinated MIRO1 (b) and TOM20 (c) from a. One-wayANOVA, Bonferroni’s test. n 5 6 (b) and 5 (c) experiments. e, f, Quantificationof ubiquitinated MIRO1 (e) and TOM20 (f) from d. One-way ANOVA,Dunnett’s test. n 5 4 (e) and 6 (f) experiments. Error bars, s.e.m.
c Transfection
cDNA:
shRNA: Luciferase shRNA Parkin shRNA
Mito
phag
y ind
ex
1
0
2
3
4d
cDNA:
shRNA:
Control (β-Gal)
Parkin
USP30
(C77A)
Parkin
β-Gal
Luc
β-Gal
***
458 n
m 543 n
m
mt-Keima
USP30 siRNA
****
Transfection
0
0.5
1.0
Control siRNA USP30 siRNA
TOM20 HSP60
ICC
GF
P–p
ark
in
(G4
30
D)
TO
M2
0H
SP
60
a
b
USP30(C77A)–Flag
TO
M2
0 o
r H
SP
60
flu
ore
scen
ce in
ten
sity
(no
rmaliz
ed
to
co
ntr
ol siR
NA
)
mt-
Keim
a
Figure 4 | USP30 knockdown rescues mitophagy defects associatedwith mutant parkin. a, Immunostaining of SH-SY5Y cells expressing GFP–parkin(G430D), transfected with USP30 siRNA and treated with CCCP(20mM, 24 h). b, Quantification of fold change in TOM20 and HSP60fluorescence intensity from a. Kruskal–Wallis test, n 5 6 experiments.c, mt-Keima imaging in neurons transfected with parkin shRNA andUSP30(C77A)–Flag. d, Quantification of mitophagy index from c. Kruskal–Wallis test, n 5 71–77 cells; n 5 3 experiments. All scale bars, 5mm.Error bars, s.e.m.
ARTICLE RESEARCH
1 9 J U N E 2 0 1 4 | V O L 5 1 0 | N A T U R E | 3 7 3
Macmillan Publishers Limited. All rights reserved©2014
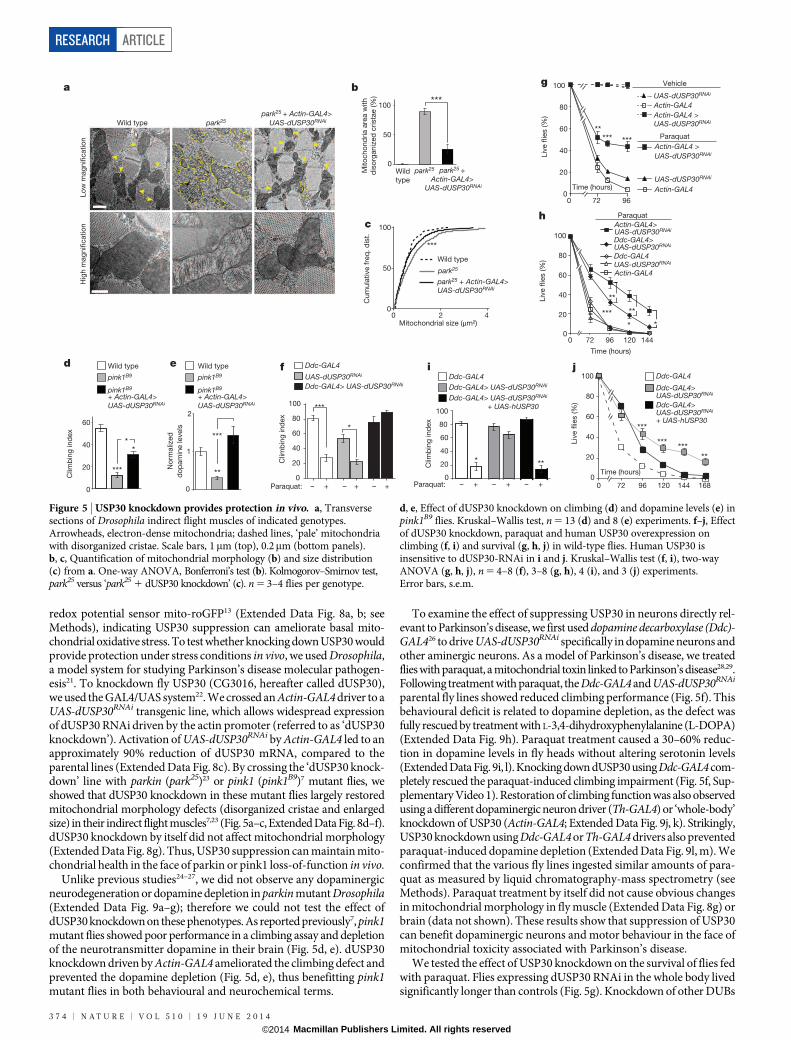
redox potential sensor mito-roGFP13 (Extended Data Fig. 8a, b; seeMethods), indicating USP30 suppression can ameliorate basal mito-chondrial oxidative stress. To test whether knocking down USP30 wouldprovide protection under stress conditions in vivo, we used Drosophila,a model system for studying Parkinson’s disease molecular pathogen-esis21. To knockdown fly USP30 (CG3016, hereafter called dUSP30),we used the GAL4/UAS system22. We crossed an Actin-GAL4 driver to aUAS-dUSP30RNAi transgenic line, which allows widespread expressionof dUSP30 RNAi driven by the actin promoter (referred to as ‘dUSP30knockdown’). Activation of UAS-dUSP30RNAi by Actin-GAL4 led to anapproximately 90% reduction of dUSP30 mRNA, compared to theparental lines (Extended Data Fig. 8c). By crossing the ‘dUSP30 knock-down’ line with parkin (park25)23 or pink1 (pink1B9)7 mutant flies, weshowed that dUSP30 knockdown in these mutant flies largely restoredmitochondrial morphology defects (disorganized cristae and enlargedsize) in their indirect flight muscles7,23 (Fig. 5a–c, Extended Data Fig. 8d–f).dUSP30 knockdown by itself did not affect mitochondrial morphology(Extended Data Fig. 8g). Thus, USP30 suppression can maintain mito-chondrial health in the face of parkin or pink1 loss-of-function in vivo.
Unlike previous studies24–27, we did not observe any dopaminergicneurodegeneration or dopamine depletion in parkin mutant Drosophila(Extended Data Fig. 9a–g); therefore we could not test the effect ofdUSP30 knockdown on these phenotypes. As reported previously7, pink1mutant flies showed poor performance in a climbing assay and depletionof the neurotransmitter dopamine in their brain (Fig. 5d, e). dUSP30knockdown driven by Actin-GAL4 ameliorated the climbing defect andprevented the dopamine depletion (Fig. 5d, e), thus benefitting pink1mutant flies in both behavioural and neurochemical terms.
To examine the effect of suppressing USP30 in neurons directly rel-evant to Parkinson’s disease, we first used dopamine decarboxylase (Ddc)-GAL426 to drive UAS-dUSP30RNAi specifically in dopamine neurons andother aminergic neurons. As a model of Parkinson’s disease, we treatedflies with paraquat, a mitochondrial toxin linked to Parkinson’s disease28,29.Following treatment with paraquat, the Ddc-GAL4 and UAS-dUSP30RNAi
parental fly lines showed reduced climbing performance (Fig. 5f). Thisbehavioural deficit is related to dopamine depletion, as the defect wasfully rescued by treatment with L-3,4-dihydroxyphenylalanine (L-DOPA)(Extended Data Fig. 9h). Paraquat treatment caused a 30–60% reduc-tion in dopamine levels in fly heads without altering serotonin levels(Extended Data Fig. 9i, l). Knocking down dUSP30 using Ddc-GAL4 com-pletely rescued the paraquat-induced climbing impairment (Fig. 5f, Sup-plementary Video 1). Restoration of climbing function was also observedusing a different dopaminergic neuron driver (Th-GAL4) or ‘whole-body’knockdown of USP30 (Actin-GAL4; Extended Data Fig. 9j, k). Strikingly,USP30 knockdown using Ddc-GAL4 or Th-GAL4 drivers also preventedparaquat-induced dopamine depletion (Extended Data Fig. 9l, m). Weconfirmed that the various fly lines ingested similar amounts of para-quat as measured by liquid chromatography-mass spectrometry (seeMethods). Paraquat treatment by itself did not cause obvious changesin mitochondrial morphology in fly muscle (Extended Data Fig. 8g) orbrain (data not shown). These results show that suppression of USP30can benefit dopaminergic neurons and motor behaviour in the face ofmitochondrial toxicity associated with Parkinson’s disease.
We tested the effect of USP30 knockdown on the survival of flies fedwith paraquat. Flies expressing dUSP30 RNAi in the whole body livedsignificantly longer than controls (Fig. 5g). Knockdown of other DUBs
b
50
100
0park25 +
Actin-GAL4> UAS-dUSP30RNAi
***
Mito
cho
nd
ria a
rea w
ith
dis
org
aniz
ed
crista
e (%
)
a
park25
park25
Wild type
Wild type
Wild
type
park25 + Actin-GAL4>
UAS-dUSP30RNAi
Lo
w m
ag
nifi
catio
nH
igh m
ag
nifi
catio
n
0
20
40
60
80
100
UAS-dUSP30RNAi
Ddc-GAL4> UAS-dUSP30RNAi
Ddc-GAL4
f
***
*
Actin-GAL4>UAS-dUSP30RNAi
Ddc-GAL4>UAS-dUSP30RNAi
Ddc-GAL4UAS-dUSP30RNAi
Actin-GAL4
Paraquath
Time (hours)
0
20
40
60
80
100
0
Liv
e fl
ies (%
)Liv
e fl
ies (%
)
Liv
e fl
ies (%
)
72 96 120 144
***
*
**
*
**0 40
50
100
Mitochondrial size (µm2)2
Cum
ula
tive f
req
. d
ist.
park25
Wild type
park25 + Actin-GAL4>UAS-dUSP30RNAi
c
d
+ Actin-GAL4>UAS-dUSP30RNAi
e
**
***
pink1B9
pink1B9
Wild type
+ Actin-GAL4>UAS-dUSP30RNAi
pink1B9
pink1B9
Paraquat: –
*
0
1
2
Clim
bin
g in
dex
0
20
40
60
*
*** No
rmaliz
ed
do
pam
ine levels
g
0
20
40
60
80
100
UAS-dUSP30RNAi
Actin-GAL4 >UAS-dUSP30RNAi
UAS-dUSP30RNAi
Actin-GAL4 >UAS-dUSP30RNAi
Time (hours)
0 72 96
***** ***
Vehicle
Paraquat
Actin-GAL4
Actin-GAL4
***
***
***
**
0
20
40
60
80
100
0 72 96 120 144 168
Ddc-GAL4> UAS-dUSP30RNAi
Ddc-GAL4> UAS-dUSP30RNAi + UAS-hUSP30
i j
Time (hours)
Ddc-GAL4> UAS-dUSP30RNAi
Ddc-GAL4> UAS-dUSP30RNAi
+ UAS-hUSP30
Ddc-GAL4
Clim
bin
g in
dex
0
40
20
60
80
100
Paraquat: – + – + – +
Ddc-GAL4
* **Clim
bin
g in
dex
***
+ – + – +
Figure 5 | USP30 knockdown provides protection in vivo. a, Transversesections of Drosophila indirect flight muscles of indicated genotypes.Arrowheads, electron-dense mitochondria; dashed lines, ‘pale’ mitochondriawith disorganized cristae. Scale bars, 1mm (top), 0.2mm (bottom panels).b, c, Quantification of mitochondrial morphology (b) and size distribution(c) from a. One-way ANOVA, Bonferroni’s test (b). Kolmogorov–Smirnov test,park25 versus ‘park25 1 dUSP30 knockdown’ (c). n 5 3–4 flies per genotype.
d, e, Effect of dUSP30 knockdown on climbing (d) and dopamine levels (e) inpink1B9 flies. Kruskal–Wallis test, n 5 13 (d) and 8 (e) experiments. f–j, Effectof dUSP30 knockdown, paraquat and human USP30 overexpression onclimbing (f, i) and survival (g, h, j) in wild-type flies. Human USP30 isinsensitive to dUSP30-RNAi in i and j. Kruskal–Wallis test (f, i), two-wayANOVA (g, h, j), n 5 4–8 (f), 3–8 (g, h), 4 (i), and 3 (j) experiments.Error bars, s.e.m.
RESEARCH ARTICLE
3 7 4 | N A T U R E | V O L 5 1 0 | 1 9 J U N E 2 0 1 4
Macmillan Publishers Limited. All rights reserved©2014
in flies (dUSP47, also known as Ubp64E, or dYOD1, also known asCG4603) did not improve survival; if anything, they exacerbated therate of death in response to paraquat (Extended Data Fig. 10a–c). Re-markably, USP30 knockdown driven by Ddc-GAL4 was sufficient toprovide significant survival benefit, albeit less than whole-body USP30knockdown (Fig. 5h). Similar results were obtained using Th-GAL4(Extended Data Fig. 10d). As these results rely on only a single dUSP30RNAi fly line, we confirmed RNAi specificity by introducing RNAi-resistant human USP30 cDNA into flies expressing dUSP30-RNAi(Extended Data Fig. 10e, f). Human USP30 cDNA (driven by eitherby Ddc-GAL4 or Actin-GAL4) reversed the benefit provided by dUSP30-RNAi in paraquat-treated flies in both the climbing and survival assays(Fig. 5i, j; Extended Data Fig. 10g, h). These results imply that a signifi-cant portion of the organismal benefit of USP30 suppression is mediatedin dopaminergic neurons, and it further reinforces the idea that USP30can play a critical role in dopaminergic neuron dysfunction.
Since suppression of USP30 restored mitochondrial integrity in par-kin and pink1 mutant flies and functionally protected dopaminergicneurons against the mitochondrial toxin paraquat, our findings pro-vide in vivo evidence that inhibition of USP30 might be helpful in dis-eases caused by mitochondrial damage and dysfunction.
METHODS SUMMARYStatistical tests and one-way ANOVA post-hoc tests are indicated in figure legends.For multiple comparison analysis, Dunn’s and Bonferroni’s post-hoc tests wereused for all Kruskal–Wallis and two-way ANOVA tests, respectively. P values arerepresented as*P , 0.05,**P , 0.01 and***P , 0.001. For details of experimentalmethods and statistical analysis, see Methods.
Online Content Any additional Methods, Extended Data display items and SourceData are available in the online version of the paper; references unique to thesesections appear only in the online paper.
Received 5 August 2013; accepted 28 April 2014.
Published online 4 June 2014.
1. Narendra, D. P. & Youle, R. J. Targeting mitochondrial dysfunction: role for PINK1andParkin inmitochondrial quality control. Antioxid.RedoxSignal. 14, 1929–1938(2011).
2. Hauser, D. N. & Hastings, T. G. Mitochondrial dysfunction and oxidative stress inParkinson’s disease and monogenic parkinsonism. Neurobiol. Dis. 51, 35–42(2013).
3. Kitada, T. et al. Mutations in the parkin gene cause autosomal recessive juvenileparkinsonism. Nature 392, 605–608 (1998).
4. Valente, E. M. et al. Hereditary early-onset Parkinson’s disease caused bymutations in PINK1. Science 304, 1158–1160 (2004).
5. Yang, Y. et al. Mitochondrial pathology and muscle and dopaminergic neurondegenerationcausedby inactivationofDrosophilaPink1 is rescuedbyParkin.Proc.Natl Acad. Sci. USA 103, 10793–10798 (2006).
6. Clark, I. E. et al. Drosophila pink1 is required for mitochondrial function andinteracts genetically with parkin. Nature 441, 1162–1166 (2006).
7. Park, J. et al. Mitochondrial dysfunction in Drosophila PINK1 mutants iscomplemented by parkin. Nature 441, 1157–1161 (2006).
8. Narendra, D. P. et al. PINK1 is selectively stabilized on impaired mitochondria toactivate Parkin. PLoS Biol. 8, e1000298 (2010).
9. Narendra, D., Tanaka, A., Suen, D. F. & Youle, R. J. Parkin is recruited selectively toimpaired mitochondria and promotes their autophagy. J. Cell Biol. 183, 795–803(2008).
10. Chan, N. C. et al. Broad activation of the ubiquitin-proteasome system by Parkin iscritical for mitophagy. Hum. Mol. Genet. 20, 1726–1737 (2011).
11. Matsuda, N. et al. PINK1 stabilized by mitochondrial depolarization recruitsParkinto damaged mitochondria and activates latent Parkin for mitophagy. J. Cell Biol.189, 211–221 (2010).
12. Vives-Bauza, C. et al. PINK1-dependent recruitment of Parkin to mitochondria inmitophagy. Proc. Natl Acad. Sci. USA 107, 378–383 (2010).
13. Guzman, J. N. et al. Oxidant stress evoked by pacemaking in dopaminergicneurons is attenuated by DJ-1. Nature 468, 696–700 (2010).
14. Nakamura, N. & Hirose, S. Regulation of mitochondrial morphology by USP30, adeubiquitinating enzyme present in the mitochondrial outer membrane. Mol. Biol.Cell 19, 1903–1911 (2008).
15. Geisler, S. et al. PINK1/Parkin-mediated mitophagy is dependent on VDAC1 andp62/SQSTM1. Nature Cell Biol. 12, 119–131 (2010).
16. Narendra, D., Kane, L. A., Hauser, D. N., Fearnley, I. M. & Youle, R. J. p62/SQSTM1 isrequired for Parkin-induced mitochondrial clustering but not mitophagy; VDAC1is dispensable for both. Autophagy 6, 1090–1106 (2010).
17. Lee, J.-Y., Nagano, Y., Taylor, J., Lim, K. & Yao, T.-P. Disease-causing mutations inparkin impair mitochondrial ubiquitination, aggregation, and HDAC6-dependentmitophagy. J. Cell Biol. 189, 671–679 (2010).
18. Katayama, H., Kogure, T., Mizushima, N., Yoshimori, T. & Miyawaki, A. A sensitiveand quantitative technique for detecting autophagic events based on lysosomaldelivery. Chem. Biol. 18, 1042–1052 (2011).
19. Sarraf, S. A. et al. Landscape of the PARKIN-dependent ubiquitylome in responseto mitochondrial depolarization. Nature 496, 372–376 (2013).
20. Yoshii, S. R., Kishi, C., Ishihara, N. & Mizushima, N. Parkin mediates proteasome-dependent protein degradation and rupture of the outer mitochondrialmembrane. J. Biol. Chem. 286, 19630–19640 (2011).
21. Guo, M. Drosophila as a model to study mitochondrial dysfunction in Parkinson’sdisease. Cold Spring Harb. Perspect. Med. http://dx.doi.org/10.1101/cshperspect.a009944 (2012).
22. Brand, A. H. & Perrimon, N. Targeted gene expression as a means of alteringcell fates and generating dominant phenotypes. Development 118, 401–415(1993).
23. Greene, J. C. et al. Mitochondrial pathology and apoptotic muscle degeneration inDrosophila parkin mutants. Proc. Natl Acad. Sci. USA 100, 4078–4083 (2003).
24. Whitworth, A. J. et al. Increased glutathione S-transferase activity rescuesdopaminergic neuron loss in a Drosophila model of Parkinson’s disease. Proc. NatlAcad. Sci. USA 102, 8024–8029 (2005).
25. Wang, C. et al. Drosophila overexpressing parkin R275W mutant exhibitsdopaminergic neuron degeneration and mitochondrial abnormalities. J. Neurosci.27, 8563–8570 (2007).
26. Sang, T. K. et al. A Drosophila model of mutant human parkin-induced toxicitydemonstrates selective loss of dopaminergic neurons and dependence on cellulardopamine. J. Neurosci. 27, 981–992 (2007).
27. Cha, G. H. et al. Parkin negatively regulates JNK pathway in the dopaminergicneurons of Drosophila. Proc. Natl Acad. Sci. USA 102, 10345–10350(2005).
28. Cocheme, H. M. & Murphy, M. P. Complex I is the major site of mitochondrialsuperoxide production by paraquat. J. Biol. Chem. 283, 1786–1798 (2008).
29. Tanner, C. M. et al. Rotenone, paraquat, and Parkinson’s disease. Environ. HealthPerspect. 119, 866–872 (2011).
Supplementary Information is available in the online version of the paper.
Acknowledgements We thank J. Corn and C. Cunningham for discussions. The park25
line was a gift of L. Pallanck. PTMscan studies are performed at Genentech under alimited use license from Cell Signaling Technology.
Author Contributions B.B. designed the study and executed and analysed the imagingand biochemistry experiments. J.S.T. executed and analysed the biochemistry and flyexperiments. M.R. and O.F. gathered the electron microscopy data. L.P. executed, andC.E.B., Q.S. and D.S.K. analysed the mass spectrometry experiments. B.B. and M.S.wrote the manuscript.
Author Information Reprints and permissions information is available atwww.nature.com/reprints. The authors declare competing financial interests: detailsare available in the online version of the paper. Readers are welcome to comment onthe online version of the paper. Correspondence and requests for materials should beaddressed to B.B. ([email protected]).
ARTICLE RESEARCH
1 9 J U N E 2 0 1 4 | V O L 5 1 0 | N A T U R E | 3 7 5
Macmillan Publishers Limited. All rights reserved©2014
METHODSDNA construction. For the DUB overexpression screen, a Flag-tagged DUB libraryconsisting of 100 cDNAs was used. For transfection, the following constructs weresubcloned into the b-actin promoter-based pCAGGS plasmid: USP30–Flag (rat),USP30–Flag (human), GFP–parkin (human), MYC–parkin (human), Flag–parkin(rat), red fluorescent protein (RFP)–parkin (human), PINK1–GFP (human), TOM20–MYC (human), LC3–GFP (human), HA–ubiquitin, PSD95–Flag, GFP, mito-GFP,and mt-Keima18. Point mutations were generated using QuikChange II XL (AgilentTechnologies) for the following constructs: USP30(C77S)–Flag (rat), USP30(C77A)–Flag (rat), USP30(C77S)–Flag (human), GFP–parkin(K161N) (human), GFP–parkin(G430D) (human). Mito-tagGFP2 (Evrogen) and TOM20-3KR–MYC (Blue Heron)were purchased. b-Gal30 and mito-roGFP31 expression plasmids were previouslydescribed. Short-hairpin sequences targeting the following regions were clonedinto pSuper or pSuper-GFP-neo plasmids: rat PINK1 1 (TCAGGAGATCCAGGCAATT), rat PINK1 2 (CCAGTACCTTGAAGAGCAA), rat parkin 1 (GGAAGTGGTTGCTAAGCGA), rat parkin 2 (GAGGAAAAGTCACGAAACA), rat USP30(CCAGAGCCCTGTTCGGTTT), human USP30 (CCAGAGTCCTGTTCGATTT),and firefly luciferase (CGTACGCGGAATACTTCGA).Antibodies and reagents. The following antibodies were used for immunocyto-chemistry: rabbit anti-TOM209 (clone no. FL-145; catalogue no. sc11415), mouseanti-TOM20 (clone no. F-10; catalogue no. sc17764), goat anti-HSP6010 (catalogueno. sc1052) (Santa Cruz Biotechnology); mouse anti-Flag-M2 (catalogue no. F1804),rabbit anti-Flag (catalogue no. F7425), mouse anti-MYC (catalogue no. M4439)(Sigma-Aldrich); chicken anti-GFP (catalogue no. A10262) (Invitrogen); mouseanti-p6232 (catalogue no. BDB610833) (BD Biosciences); rabbit anti-LC332 (cata-logue no. NB100-2220) (Novus Biologicals); and mouse anti-FK211 (catalogue no.BML-PW8810) (Enzo Life Sciences); mouse anti-LAMP1 (clone no. Ly1C6; cata-logue no. ADI-VAM-EN001-D) (StressGen).
The following antibodies were used for immunoblotting: rabbit anti-TOM209
(clone no. FL-145; catalogue no. sc11415), goat anti-HSP6010 (catalogue no. sc1052)(Santa Cruz Biotechnology); mouse anti-Mfn133 (clone no. 3C9; catalogue no.WH0055669M4), HRP-conjugated anti-Flag (catalogue no. A8592), mouse anti-MYC (catalogue no. M4439), rabbit anti-USP30 (catalogue no. HPA016952), rabbitanti-RHOT1 (MIRO1) (catalogue no. HPA010687), rabbit anti-TIMM8a (cloneno. 2F11; catalogue no. WH0001678M1) (Sigma-Aldrich); rabbit anti-GFP (cata-logue no. A11122), chicken anti-GFP (catalogue no. A10262) (Invitrogen); HRP-conjugated anti-GAPDH (clone no. 14C10; catalogue no. (3683), HRP-conjugatedanti-b-actin (clone no. 13E5; catalogue no. 5125), HRP-conjugated anti-b-tubulin(clone no. 9F3; catalogue no. 5346), rabbit anti-VDAC (clone no. D73D12; cata-logue no. 4661), mouse anti-parkin (clone no. Prk8; catalogue no. 4211) (Cell Signal-ing Technology); rabbit anti-Tom70 (catalogue no. 14528-1-AP) (Proteintech Group);mouse anti-ubiquitin11 (clone no. FK2; catalogue no. PW8810) (Enzo Life Sciences);HRP-conjugated anti-HA (clone no. 3F10; catalogue no. 12013819001) (Roche);mouse anti-p6232 (catalogue no. BDB610833) (BD Biosciences); rabbit anti-PINK1(catalogue no. BC100-494), rabbit anti-LC332 (catalogue no. NB100-2220) (NovusBio); and rabbit anti-USP30 (generated by immunizing rabbits with purifiedhuman USP30 amino acids 65-517).
Anti-HA affinity matrix beads (Roche Applied Science) were used for immu-noprecipitation experiments. Adeno-associated virus type2 (AAV2) particles expres-sing parkin, PINK1 and USP30 shRNAs were produced by Vector Biolabs, Inc. usingthe pAAV-BASIC-CAGeGFP-WPRE vector containing an H1 promoter and thesame shRNA expression cassette as the pSuper vectors.
The following reagents were purchased as indicated: blasticidin S, zeocin, Lipo-fectamine 2000, Lipofectamine LTX PLUS, LysoTracker Green DND-626 (Invitrogen);PhosSTOP phosphatase inhibitor tablets, cOmplete EDTA-free protease inhibitortablets, DNase I (Roche Applied Science); carbonyl cyanide 3-chlorophenylhydrazone(CCCP), doxycycline, dimethyl sulphoxide, ammonium chloride, rotenone, DTT,aldrithiol, paraquat dichloride, MG132, epoxomicin (Sigma-Aldrich); bafilomycin(Cayman Chemical); L-3,4-dihydroxyphenylalanine (Fluka Analytical); N-ethylmaleimide(Thermo Scientific); and hygromycin (Clontech Laboratories).Transfection and immunocytochemistry. All heterologous cells were transfectedwith Lipofectamine 2000 for cDNA expression and Lipofectamine RNAiMAX forsiRNA knockdown experiments, according to manufacturer’s instructions (Invi-trogen). siRNAs were purchased from Dharmacon as siGenome pools (non-Silencingpool 2 was used as control siRNA transfection). Hippocampal cultures were preparedas described previously30 and transfected with Lipofectamine LTX PLUS (Invitrogen)with 1.8mg DNA, 1.8ml PLUS reagent and 6.3ml LTX reagent. Following drug treatments,cells were fixed with 4% paraformaldehyde/4% sucrose in phosphate-bufferedsaline (PBS, pH 7.4) (Electron Microscopy Sciences). Following permeabilization(0.1% Triton-X in PBS), blocking (2% BSA in PBS) and primary antibody incuba-tion, antibodies were visualized using Alexa dye-conjugated secondary antibodies(Invitrogen). All immunocytochemistry images were acquired with a Leica SP5
laser scanning microscope with a 340/1.25 oil objective (0.34mm per pixel reso-lution, 1mm confocal z-step size).HEK-293 and SH-SY5Y stable cell line generation. Stably transfected HEK-293cell lines expressing GFP–parkin (human) wild type, K161N, and G430D weregenerated by co-transfecting FLP-In 293 cells with a pOG44 Flp-recombinase ex-pression vector (Invitrogen) and a pcDNA5-FRT vector (Invitrogen) expressingthe corresponding constructs under a CMV promoter. Cell lines were selectedand maintained using 50mg ml21 hygromycin selection. Inducible HEK stable cellline expressing GFP–parkin (human) was generated by co-transfecting FLP-InT-Rex 293 cells with pOG44 and a pcDNA5-FRT-TO vector (Invitrogen) expres-sing GFP–parkin (human). This line was selected and maintained using 50mg ml21
hygromycin and 15mg ml21 blasticidin. SH-SY5Y stable cells were generated simi-larly with a Flp-In inducible parental cell line using pcDNA5-FRT-TO and main-tained under 75 mg ml21 hygromycin and 3mg ml21 blasticidin. Cell lines werequality controlled by STR analysis and by testing for mycoplasma contamination.Isolation and identification of ubiquitin modifications by mass spectrometry.To identify parkin substrates, HEK-293 cells stably expressing inducible GFP–parkin (human) were induced using doxycycline (1mg ml21) for 24 h, then treatedwith 5mM CCCP or DMSO vehicle control for 2 h. To determine USP30 substrates,HEK-293 cells were transfected with human USP30 shRNA using Lipofectamine2000 (Invitrogen) for 6 days, then treated as above.
Immunoaffinity isolation and mass spectrometry methods were used to enrichand identify K-GG peptides from digested protein lysates as previously described34,35.Cell lysates were prepared in lysis buffer (8 M urea, 20 mM HEPES pH 8.0, 1 mMsodium orthovanadate, 2.5 mM sodium pyrophosphate, 1 mMb-glycerophosphate)by brief sonication on ice. Protein samples (60 mg) were reduced at 60 uC for 20 minin 4.1 mM DTT, cooled 10 min on ice, and alkylated with 9.1 mM iodoacetamide for15 min at room temperature in the dark. Samples were diluted 43 using 20 mMHEPES pH 8.0 and digested in 10 mg ml21 trypsin overnight at room temperature.Following digestion, TFA was added to a final concentration of 1% to acidify thepeptides before desalting on a Sep-Pak C18 cartridge (Waters). Peptides were elutedfrom the cartridge in 40% ACN/ 0.1% TFA, flash frozen and lyophilized for 48 h.Dry peptides were gently resuspended in 1.4 ml 13 IAP buffer (Cell SignalingTechnology) and cleared by centrifugation for 5 min at 1,800g. Precoupled anti-KGG beads (Cell Signaling Technology) were washed in 13 IAP buffer beforecontacting the digested peptides.
Immunoaffinity enrichment was performed for 2 h at 4 uC. Beads were washed23 with IAP buffer and 43 with water before 23 elution of peptides in 0.15%TFA for 10 min each at room temperature. Immunoaffinity enriched peptides weredesalted using STAGE-Tips as previously described36.
Liquid chromatography-mass spectrometry (LC-MS) analysis was performedon an LTQ-Orbitrap Velos mass spectrometer operating in data dependent top 15mode. Peptides were injected onto a 0.1 3 100-mm Waters 1.7-mm BEH-130 C18column using a NanoAcquity UPLC and separated at 1ml min21 using a two-stage linear gradient where solvent B ramped first from 2% to 25% over 85 minand then 25% to 40% over 5 min. Peptides eluting from the column were ionizedand introduced to the mass spectrometer using an ADVANCE source (Michrom-Bruker). In each duty cycle, one full MS scan collected was at 60,000 resolution inthe Orbitrap followed by up to 15 MS/MS scans in the ion trap on monoisotopic,charge state defined precursors (z . 1). Ions selected for MS/MS ( 6 20 p.p.m.)were subjected to dynamic exclusion for 30 s duration.
Mass spectral data were converted to mzxml for loading into a relational data-base. MS/MS spectra were searched using Mascot against a concatenated target-decoy database of tryptic peptides from human proteins (Uniprot) and commoncontaminants. Precursor ion mass tolerance was set to 6 50 p.p.m. Fixed modi-fication of carbamidomethyl cysteine (157.0214) and variable modifications ofoxidized methionine (115.9949) and K-GG (1114.0429) were considered. Lineardiscriminant analysis (LDA) was used to filter peptide spectral matches (PSMs)from each run to 5% false discovery rate (FDR) at the peptide level, and subsequentlyto a 2% protein level FDR as an aggregate of all runs (,0.5% peptide level FDR).Localization scores were generated for each K-GG PSM using a modified versionof the AScore algorithm and positions of the modifications localized accordinglyas the AScore sequence37. Given that trypsin cannot cut adjacent to ubiquitin mod-ified lysines38,39, PSMs where the AScore sequence reports a -GG modification onthe C-terminal lysine are dubious. Possible exceptions to this would be lysines atthe C termini of proteins (or in vivo truncation products) and PSMs stemmingfrom in source fragmentation of a bona fide K-GG peptide. To establish the mostreliable data set for downstream analysis, PSMs where the AScore sequence reporteda C-terminal lysine were split into two groups: those with an available internal lysineresidue to which the -GG could be alternatively localized, and those which lackedan available lysine. PSMs bearing a C-terminal K-GG but lacking an available lysinewere removed from consideration in downstream analyses. For the remaining PSMs,the –GG modification was relocalized to the available lysine closest to the C terminus.
RESEARCH ARTICLE
Macmillan Publishers Limited. All rights reserved©2014
Both lists, including the latent hits from the decoy protein sequences, are providedas supplementary tables to permit post hoc analysis.
A modified version of the VistaGrande algorithm, termed XQuant, was usedto interrogate the unlabelled peak areas for individual K-GG peptides, guided bydirect PSMs or accurate precursor ion and retention time matching (cross quan-tification). For direct PSMs, quantification of the unlabelled peak area was performedusing fixed mass and retention tolerances, as previously described39. To enable crossquantification within XQuant, retention time correlation across pairwise instru-ment analyses was determined based on high-scoring peptide sequences identifiedby between one and four PSMs across all analyses within an experiment. Matchedretention time pairings were modelled using a linear least squares regression modelto yield the retention time correlation equation. In instrument runs where a pep-tide was not identified by a discrete MS/MS, cross quantification was carried out byseeding the XQuant algorithm with the calculated mass of the precursor ion and itspredicted retention time derived from the regression model. While the m/z tol-erance was fixed, the retention time tolerance was dynamically adjusted for eachpairwise instrument run. In cases where peptides were not confidently identifiedwithin a given instrument run but were identified in multiple other runs, multiplecross quantification events were performed to ensure data quality. XQuant resultswere filtered to a heuristic confidence score of 83 or greater, as previously described39.Full scan peak area measurements arising from multiple quantification events ofthe same m/z within a single run were grouped together if their peak boundaries inretention time overlapped. From such a group, the peak with the largest total peakarea was chosen as its single representative.
To identify candidate substrates of parkin and USP30, graphical analysis andmixed-effect modelling were applied to XQuant data. A mixed-effect model wasfit to the AUC data for each protein. ‘Treatment’ (for example, Control, parkinoverexpression/USP30 knockdown, CCCP, Combo) was a categorical fixed effectand ‘Peptide’ was fit as random effect. False discovery rates (FDR) are calculatedbased on the P values of each treatment vs Control. Fold-changes and P values ofmean AUC from Combo vs Control and Combo vs CCCP were used in preparing‘LiME’ plots. The mixed-effect model was fit in R by ‘nlme’40.Preparation of cell lysates and immunoprecipitation. For total lysate experiments,cells were lysed after 24 h in SDS sample buffer (Invitrogen) containing samplereducing agent (Invitrogen) and boiled at 95 uC for 5 min. Total lysates were resolvedby SDS–PAGE and analysed by immunoblotting. For immunoprecipitation experi-ments, cells were treated with the indicated concentrations and durations of CCCPat 24 h (overexpression experiments) or 6 days (knockdown experiments) post-transfection. Then, cells were lysed in 0.5% SDS in Tris-buffered saline (137 mMNaCl, 5 mM KCl, 1.5 mM Na2HPO4, 25 mM Tris base, 1 mM CaCl2.2H2O, 0.5 mMMgCl2.6H2O, pH 7.5) and boiled at 70 uC for 10 min. Lysates were then diluted inimmunoprecipitation buffer (50 mM HEPES, 150 mM NaCl, 10% glycerol, 1% Triton-X, protease inhibitors (Roche Applied Science), phosphatase inhibitors (RocheApplied Science), DNase I (Roche Applied Science), 2 mM N-ethylmaleimide (ThermoScientific), pH 7.4), cleared by centrifugation at 31,000g for 10 min, and incubatedovernight with anti-HA affinity matrix beads (Roche Applied Science). Inputs andanti-HA immunoprecipitates were resolved by SDS–PAGE and analysed byimmunoblotting.Mitochondria fractionation. Subcellular fractionation was performed using theFOCUS SubCell Kit (G Biosciences) from ,P60 adult male rat forebrain.Drosophila stocks. The following Drosophila lines were obtained for analysis:Actin5C-GAL4 (Bloomington Drosophila Stock Center, 4414), Ddc-GAL44.3D
(Bloomington Drosophila Stock Center, 7010), ple-GAL4 (referred to here as Th-GAL4, Bloomington Drosophila Stock Center, 8848), UAS-CG3016RNAi (referredto here as UAS-dUSP30RNAi; NIG-Fly Stock Center, 3016R-2), UAS-CG5486RNAi
(referred to here as UAS-dUSP47RNAi; NIG-Fly Stock Center, 5486R-3), UAS-CG4603RNAi (referred to here as UAS-dYOD1RNAi; NIG-Fly Stock Center, 4603R-2),pink1B9 (Bloomington Drosophila Stock Center, 34749), park25 (Leo Pallanck, Uni-versity of Washington), and park1 (Bloomington Drosophila Stock Center, 34747).For USP30 knockdown experiments, Actin5C-GAL4 or Ddc-GAL4 were recom-bined onto the same chromosome as UAS-dUSP30RNAi using standard genetic tech-niques and were balanced over CyO, y1. For experiments using Th-GAL4, flieswere generated by crossing Th-GAL4 with UAS-dUSP30RNAi and were not balanced.The X chromosome of flies in pink1B9 experiments contained w; all other lines usedcontained y, w. Wild-type controls used were w or y, w, respectively.
UAS-hUSP30 and UAS-parkin constructs were generated by PCR amplifyinghuman USP30 or parkin cDNA (Origene), respectively, with primers adding restric-tion sites EcoRI (59) and NotI (39) and subcloning into pUAST-attB (gift of KonradBasler). Parkin R275W and Q311X mutations were made using QuikChange II XL(Agilent Technologies). Injections were performed by BestGene, Inc. (Chino Hills,CA) for integration into the 86Fb attP landing site (Bloomington 24749).
Flies were raised on Nutri-Fly ‘German Food’ Formulation (Genesee, 66-115),prepared per manufacturer’s instructions. All flies were raised at 25 uC and crossed
using standard genetic techniques. All experiments were performed using age-matchedmale flies.Quantitative RT–PCR. RNA and subsequent cDNA was obtained from five adultmale fly heads following manufacturer’s instructions (Qiagen RNeasy Plus kit, AppliedBiosystems High Capacity cDNA Reverse Transcription kit). Quantitative RT–PCRwas performed using an Applied Biosystems ViiA7 Real-Time PCR system usingTaqMan Assays Dm01796115_g1 and Dm01796116_g1 (Drosophila CG3016 (USP30)),Hs00261902_m1 (human USP30), Dm01795269_g1 (Drosophila CG5486 (USP47)),and Dm01840115_s1 (Drosophila CG4603 (YOD1)). Dm02134593_g1 (RpII140)was used for normalization.Transmission electron microscopy of Drosophila indirect flight muscles. Adultmale thoraxes of indicated ages and genotypes were isolated from the remainder ofthe body, then longitudinally hemi-sectioned and immediately fixed and processedas previously described23. Briefly, samples were fixed in modified Karnovsky’s fix-ative (2% paraformaldehyde and 2.5% glutaraldehyde in 0.1 M sodium cacodylatebuffer, pH 7.2), post-fixed in 1% aqueous osmium tetroxide, dehydrated through aseries of ethanol (50%, 70%, 90%, 95%, 100%) followed by propylene oxide treat-ments, and embedded in Eponate 12 (Ted Pella, Redding, CA). Ultrathin sections(80 nm) were cut with an Ultracut microtome (Leica), stained with 3.5% aqueousuranyl acetate and 0.2% lead citrate and examined in a JEOL JEM-1400 transmis-sion electron microscope (TEM) at 120 kV. Digital images were captured with aGATAN Ultrascan 1000 CCD camera.Climbing assays. Flies of indicated ages and genotypes were assayed as below. Forparaquat-fed experiments, 1-day old adult males were fed a solution containing5% sucrose only (in water) or 5% sucrose 1 10 mM paraquat (in water) or 5%sucrose 1 10 mM paraquat 1 1 mM L-3,4-dihydroxyphenylalanine (in water) onsaturated Whatman paper. After 48 h of treatment, flies were anesthetized usingcarbon dioxide and randomly transferred in groups of ten to fresh vials contain-ing only 1% agarose (in water) for a 1-h recovery period from the effects of carbondioxide. The flies were then transferred into new glass test tubes, gently tapped tothe bottom, and scored for their ability to climb. The number of flies climbing15 cm vertically was recorded at 12 s for pink1B9 experiments and 30 s for all otherexperiments; climbing index is calculated as % of flies climbing 15 cm at given time.Determination of neurotransmitter levels. Flies of indicated ages and genotypeswere assayed as below. For paraquat-fed experiments, 1-day old adult males werefed a solution containing 5% sucrose only (in water) or 5% sucrose 1 10 mMparaquat (in water) on saturated Whatman paper. After 48 h of treatment, flies wereanesthetized using carbon dioxide. Single fly heads were dissected off and imme-diately placed into 500ml cold lysis solution on ice. Heads were homogenized usinga TissueLyser II (Qiagen) with a 3 mm tungsten carbide bead (Qiagen) at a frequencyof 30 Hz for 3 min. Homogenates were spun down and supernatants used in sub-sequent ELISAs.
For dopamine ELISA, the lysis solution contained 0.01 N hydrochloric acid,1 mM EDTA, 4 mM sodium metabisulphite. ELISA was performed according tomanufacturer’s instructions (LDN, BA E-5300). For serotonin ELISA, the lysissolution was provided in the kit as ‘Diluent’ (LDN, BA E-5900).Determination of ingested paraquat concentration. 1-day old adult male flieswere fed a solution containing 5% sucrose only (in water) or 5% sucrose 1 10 mMparaquat (in water) on saturated Whatman paper. After 48 h of treatment, 15 flieswere collected per condition and homogenized in 100ml water. Standard curvesamples were generated by spiking appropriate amounts of paraquat to homoge-nates from untreated flies. Then the samples were vortex mixed, and 200ml of ace-tonitrile containing internal standard (Propranolol) was added. The samples werevortexed again and centrifuged at 10,000g for 10 min. 100ml of supernatants weretransferred to a new plate that contained 200ml of water and analysed by LC-MS/MS to quantify for concentrations of paraquat. The LC-MS/MS consisted of anAgilent 1100 series HPLC system (Santa Clara, CA) and an HTS PAL autosamplerfrom CTC Analytics (Carrboro, NC) coupled with a 4000 Q TRAP MS and Tur-boIonSpray ion source from Applied Biosystems (Foster City, CA). HPLC sepa-ration was performed on a Waters Atlantis dC18 column (3mm 100 3 2.1 mm) witha Krud Katcher guard column from Phenomenex. Quantitation was carried outusing the multiple reaction monitoring (MRM) with transition 185.1R165.1 forparaquat and 260.2R183.1 for propranolol. The lower and upper limit of the assayis 10mM and 1000mM, respectively. The quantification of the assay used a calibrationcurve which was constructed through plotting the analyte/IS peak area ration versusthe nominal concentration of paraquat with a weighed 1/x2 linear regression.
Using this protocol, we confirmed that various fly lines ingested similar amountsof paraquat. (average mass of paraquat per fly: UAS-dUSP30RNAi: 3.2mg, Actin-GAL4: 2.7mg, Actin-GAL4 .UAS-dUSP30RNAi: 2.7mg)Dopaminergic neuron degeneration assays. Fly brains were dissected as prev-iously described41 with the following modifications. Brains were fixed using 4%paraformaldehyde in PBS, primary antibody used was rabbit anti-tyrosine hydro-xylase (Pel Freez catalogue no. P40101-0) at 1:100, and secondary antibody used
ARTICLE RESEARCH
Macmillan Publishers Limited. All rights reserved©2014
was goat anti-rabbit 488 (Invitrogen) at 1:400. Similar results were obtained usingrabbit anti-tyrosine hydroxylase from Millipore (catalogue no. AB152). All imageswere quantified in a blinded manner. For flies of various parkin genotypes, brainswere dissected at 20 days of age unless otherwise noted.Survival assays. Ten adult 1-day old male flies per vial were fed a solution contain-ing 5% sucrose only (in water) or 5% sucrose 1 10 mM paraquat (in water) on sat-urated Whatman paper. The number of live flies was counted at described intervals.Data collection and statistics. No statistical methods were used to pre-determinesample sizes. Sample sizes were kept similar between experimental groups and rep-licates of experiments (for example, ,25–30 neurons per well were imaged for mt-Keima experiments from each culture; ,20–50 cells were imaged per well in cellline experiments). All experiments and analysis were done in a blind-manner (blindto the identity of the experimental groups during image acquisition and analysis;blind to the treatment and genotype groups in fly experiments). No data were ex-cluded in the analysis. Culture wells were randomly assigned to plasmid DNAs fortransfection in multi-well plates. Imaging fields were randomly chosen during imageacquisition. Flies were randomly assigned to treatment groups.
To compute P values, Mann–Whitney test, Kruskal–Wallis, and one-wayor two-way ANOVA tests were used. Normal distribution was assessed by theKolmogorov–Smirnov test. Bartlett’s test was used to estimate the variance betweenthe groups that are being compared in one-way ANOVA tests. For multiple com-parisons, the following post-hoc tests were used: Dunn’s multiple comparison test(following Kruskal–Wallis non-parametric tests), Dunnett’s multiple comparisontest (for comparisons to a single ‘control’ group, following one-way ANOVA tests),Bonferroni’s multiple comparison test (for comparisons between multiple condi-tions, following one-way or two-way ANOVA tests). P values are represented as*P , 0.05, **P , 0.01 and ***P , 0.001. GraphPad v5 was used for the statistics.
30. Seeburg, D. P. & Sheng, M. Activity-induced Polo-like kinase 2 is required forhomeostatic plasticity of hippocampal neurons during epileptiform activity.J. Neurosci. 28, 6583–6591 (2008).
31. Dooley, C. T. et al. Imaging dynamic redox changes in mammalian cells withgreen fluorescent protein indicators. J. Biol. Chem. 279, 22284–22293(2004).
32. Burchell, V. S. et al. The Parkinson’s disease-linked proteins Fbxo7 and Parkininteract to mediate mitophagy. Nature Neurosci. 16, 1257–1265 (2013).
33. Shiba-Fukushima, K. et al. PINK1-mediated phosphorylation of the Parkinubiquitin-like domain primes mitochondrial translocation of Parkin and regulatesmitophagy. Sci. Rep. 2, 1002 (2012).
34. Xu, G., Paige, J. S. & Jaffrey, S. R. Global analysis of lysine ubiquitination byubiquitin remnant immunoaffinity profiling. Nature Biotechnol. 28, 868–873(2010).
35. Kim, W. et al. Systematic and quantitative assessment of the ubiquitin-modifiedproteome. Mol. Cell 44, 325–340 (2011).
36. Rappsilber, J., Ishihama, Y. & Mann, M. Stop and go extraction tips for matrix-assisted laser desorption/ionization, nanoelectrospray, and LC/MS samplepretreatment in proteomics. Anal. Chem. 75, 663–670 (2003).
37. Beausoleil, S. A., Villen, J., Gerber, S. A., Rush, J. & Gygi, S. P. A probability-basedapproach for high-throughput protein phosphorylation analysis and sitelocalization. Nature Biotechnol. 24, 1285–1292 (2006).
38. Bustos, D., Bakalarski, C. E., Yang, Y., Peng, J. & Kirkpatrick, D. S. Characterizingubiquitination sites by peptide based immunoaffinity enrichment. Mol. Cell.Proteomics 11, 1529–1540 (2012).
39. Seyfried, N. T. et al. Systematic approach for validating the ubiquitinatedproteome. Anal. Chem. 80, 4161–4169 (2008).
40. Pinheiro, J., Bates, D., DebRoy, S., Sarkar, D. & the R Core Team. nlme: linear andnonlinear mixed effects models. R package version 3. (2011).
41. Wu, J. S. & Luo, L. A protocol for dissecting Drosophila melanogaster brains for liveimaging or immunostaining. Nature Protocols 1, 2110–2115 (2006).
RESEARCH ARTICLE
Macmillan Publishers Limited. All rights reserved©2014
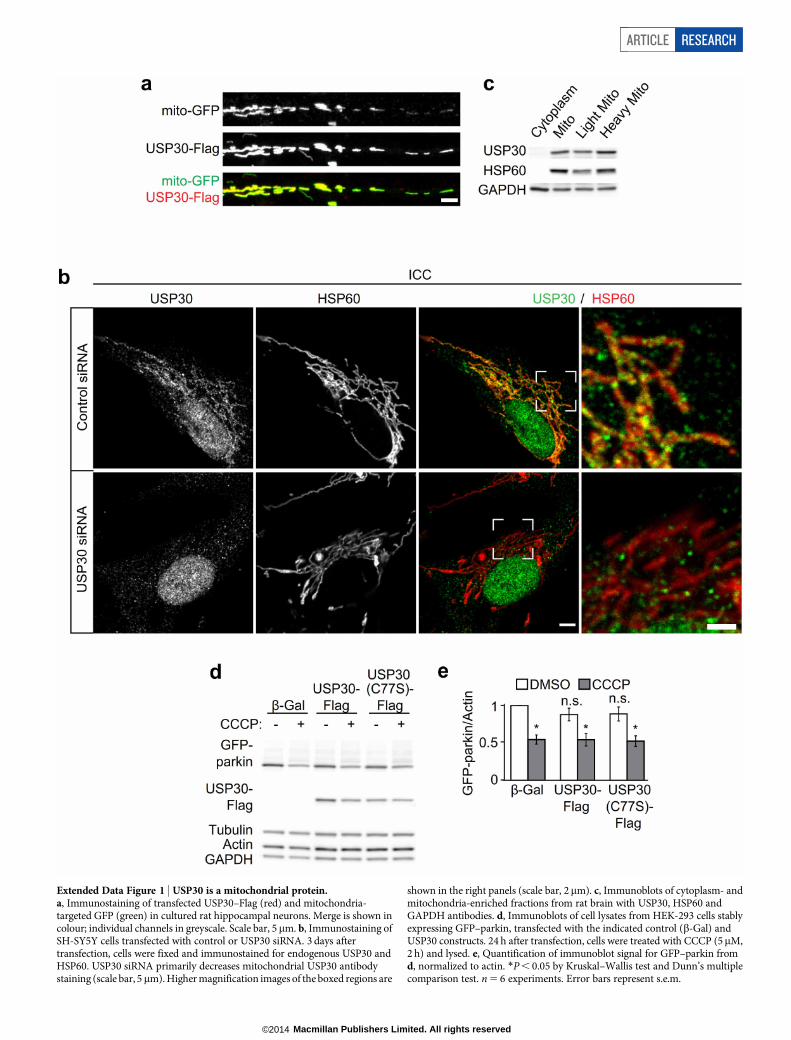
Extended Data Figure 1 | USP30 is a mitochondrial protein.a, Immunostaining of transfected USP30–Flag (red) and mitochondria-targeted GFP (green) in cultured rat hippocampal neurons. Merge is shown incolour; individual channels in greyscale. Scale bar, 5 mm. b, Immunostaining ofSH-SY5Y cells transfected with control or USP30 siRNA. 3 days aftertransfection, cells were fixed and immunostained for endogenous USP30 andHSP60. USP30 siRNA primarily decreases mitochondrial USP30 antibodystaining (scale bar, 5 mm). Higher magnification images of the boxed regions are
shown in the right panels (scale bar, 2mm). c, Immunoblots of cytoplasm- andmitochondria-enriched fractions from rat brain with USP30, HSP60 andGAPDH antibodies. d, Immunoblots of cell lysates from HEK-293 cells stablyexpressing GFP–parkin, transfected with the indicated control (b-Gal) andUSP30 constructs. 24 h after transfection, cells were treated with CCCP (5mM,2 h) and lysed. e, Quantification of immunoblot signal for GFP–parkin fromd, normalized to actin. *P , 0.05 by Kruskal–Wallis test and Dunn’s multiplecomparison test. n 5 6 experiments. Error bars represent s.e.m.
ARTICLE RESEARCH
Macmillan Publishers Limited. All rights reserved©2014
RESEARCH ARTICLE
Macmillan Publishers Limited. All rights reserved©2014
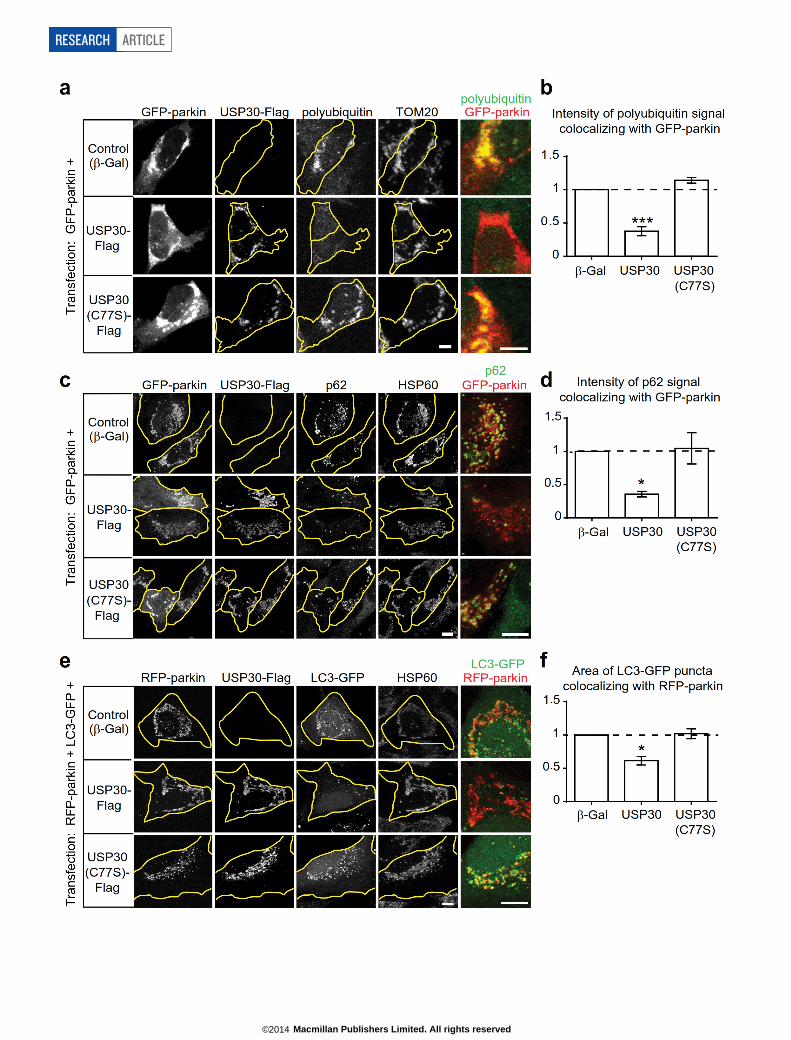
Extended Data Figure 2 | USP30 counteracts mitochondrial ubiquitinationand recruitment of p62 and LC3–GFP in CCCP-treated parkin-expressingcells. a, Immunostaining of SH-SY5Y cells co-transfected with GFP–parkinand the indicated control (b-Gal) and Flag-tagged USP30 constructs. 24 h aftertransfection, cells were treated with CCCP (20mM, 4 h) and immunostained forGFP, Flag, endogenous TOM20, and polyubiquitin chains (detected with FK2antibody). Co-localization of GFP–parkin (shown in red) and polyubiquitin(shown in green) is shown in the right panel. Scale bars, 5mm. b, Quantificationof GFP–parkin-associated polyubiquitin staining intensity from a, normalizedby GFP–parkin area (integrated fluorescence intensity of FK2 stainingcolocalizing with GFP–parkin/area of GFP–parkin staining). ***P , 0.001 byKruskal–Wallis test and Dunn’s multiple comparison test. n 5 6 experiments.Error bars represent s.e.m. c, Immunostaining of HeLa cells co-transfected withGFP–parkin and the indicated control (b-Gal) and Flag-tagged USP30constructs. Cells were treated as in a and immunostained for GFP, Flag,endogenous p62, and HSP60. Co-localization of GFP–parkin (shown in red)
and p62 (shown in green) is shown in the right panel. Scale bars, 10mm.d, Quantification of GFP–parkin-associated p62 staining intensity fromc, normalized by GFP–parkin area (integrated fluorescence intensity of p62staining colocalizing with GFP–parkin/area of GFP–parkin staining).*P , 0.05 by Kruskal–Wallis test and Dunn’s multiple comparison test. n 5 5experiments. Error bars represent s.e.m. e, Immunostaining of HeLa cellsco-transfected with RFP-parkin, LC3–GFP and the indicated control (b-Gal)and Flag-tagged USP30 constructs. Cells were treated as in a andimmunostained for GFP, Flag and endogenous HSP60. Co-localization ofRFP-parkin (shown in red) and LC3–GFP (shown in green) is shown in theright panel. Scale bars, 10mm. f, Quantification of RFP-parkin-associated LC3–GFP puncta area from e, normalized by RFP-parkin area (area of LC3–GFPpuncta colocalizing with RFP-parkin/area of RFP-parkin staining). *P , 0.05by Kruskal–Wallis test and Dunn’s multiple comparison test. n 5 5experiments. Error bars represent s.e.m.
ARTICLE RESEARCH
Macmillan Publishers Limited. All rights reserved©2014
RESEARCH ARTICLE
Macmillan Publishers Limited. All rights reserved©2014

Extended Data Figure 3 | mt-Keima imaging of mitophagy; PINK1 actsupstream of parkin in the mitophagy pathway. a, mt-Keima differentiallyhighlights cytoplasmic (green) and lysosomal (red) mitochondria. Culturedhippocampal neurons were transfected with mt-Keima and GFP. Following2 days of expression, cells were imaged with 458 nm (shown in green) or543 nm (shown in red) light excitation. GFP signal was used to outline thecell (shown in white). Scale bar, 5 mm. b, mt-Keima imaging in culturedhippocampal neurons before and after NH4Cl treatment (50 mM, 2 min). mt-Keima signal, collected with 543 nm or 458 nm laser excitation, is shown in redand green, respectively. Neutralizing cells with NH4Cl completely reversed thehigh ratio (543 nm/458 nm) signal to low ratio signal specifically in the roundstructures without affecting the tubular-reticular mitochondrial signal. Scalebar, 5 mm. c, Imaging of mt-Keima and Lysotracker (Lysotracker greenDND-26 shown in grey scale) in hippocampal neurons, showing Lysotrackerstained the high ratio mt-Keima structures. Scale bar, 5 mm. d, Post hocimmunostaining for endogenous Lamp1 in neurons imaged for mt-Keimasignal, showing the colocalization of high-ratio mt-Keima pixels with Lamp1staining. Immediately following mt-Keima imaging, cells were fixed andstained with anti-Lamp1 antibody (shown in grey scale). Scale bar, 5mm.e, Quantification of mitophagy index following 1, 3 and 6–7 days of mt-Keimaexpression in cultured hippocampal neurons. **P , 0.01 and ***P , 0.001 by
Kruskal–Wallis test and Dunn’s multiple comparison test. n 5 29–85 cells.n 5 2–4 experiments. Error bars represent s.e.m. f, g, Immunoblots of HEK-293 cell lysates transfected with the indicated cDNA and parkin (f) or PINK1(g) shRNA constructs. PSD-95–Flag was co-transfected as a control.Representative blots from three independent experiments are shown.h, i, Immunoblots of endogenous parkin (h) and PINK1 (i) in culturedhippocampal neurons infected with adeno-associated virus expressing theindicated shRNAs. Representative blots from two independent experiments areshown. j, mt-Keima imaging in neurons transfected with PINK1–GFP andparkin-shRNA 1 (b-Gal and luciferase shRNA as controls). Scale bar, 5 mm.k, Quantification of mitophagy index from j. ***P , 0.001 by Kruskal–Wallistest and Dunn’s multiple comparison test. n 5 55–75 cells. n 5 3 experiments.Error bars represent s.e.m. l, mt-Keima imaging in neurons transfected withGFP–parkin or GFP control. Scale bar, 5mm. m, Quantification of mitophagyindex from l. (P 5 0.22 by Mann–Whitney test. n 5 37–43 cells. n 5 3experiments. Error bars represent s.e.m. n, Mitochondria-targeted GFP(mito-GFP) imaging in neurons transfected with luciferase shRNA or USP30shRNA constructs. Scale bar, 10mm. Higher magnification images shown in thebottom panel. Scale bar, 5mm. o, Quantification of fold change in area ofindividual dendritic mitochondria from n. ***P , 0.001 by Mann–Whitneytest. n 5 9 experiments. Error bars represent s.e.m.
ARTICLE RESEARCH
Macmillan Publishers Limited. All rights reserved©2014
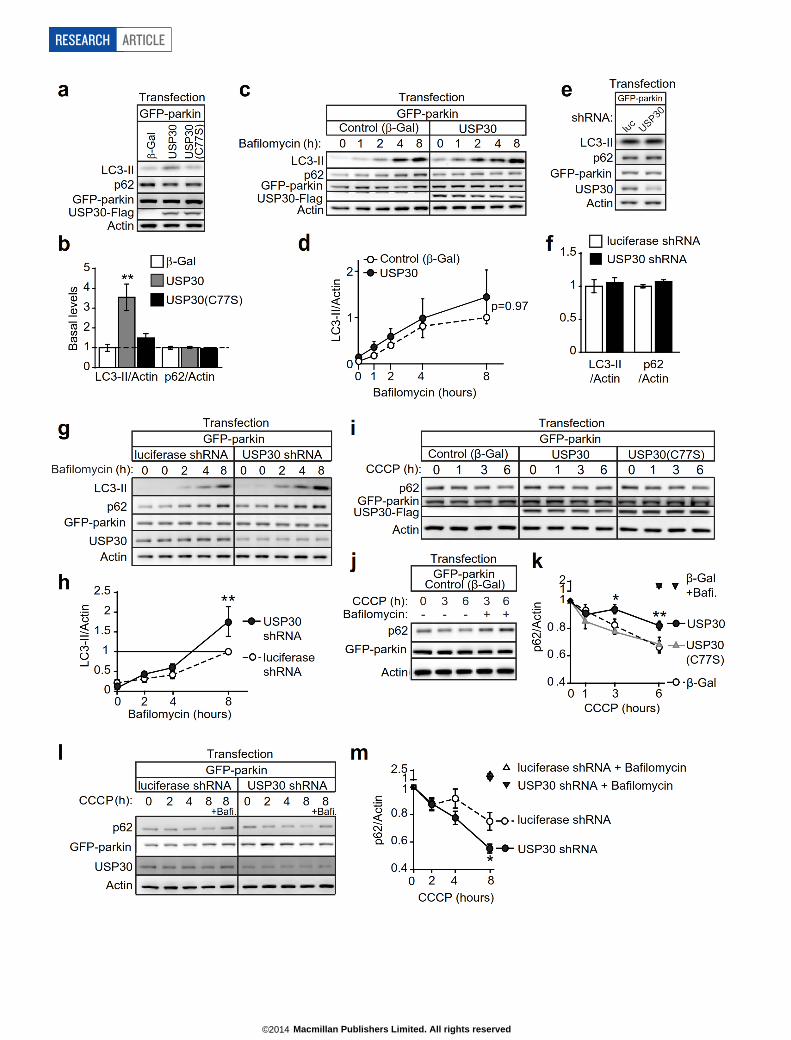
RESEARCH ARTICLE
Macmillan Publishers Limited. All rights reserved©2014
Extended Data Figure 4 | USP30 opposes autophagic flux. a, Immunoblotsof cell lysates from HEK-293 cells, transfected with GFP–parkin and theindicated control (b-Gal) or USP30 constructs. b, Quantification of the LC3-IIand p62 immunoblot signal from a, normalized to actin. **P , 0.01 byKruskal–Wallis test and Dunn’s multiple comparison test. n 5 6 experiments.Error bars represent s.e.m. c, Immunoblots of cell lysates from HEK-293 cells,transfected with GFP–parkin and b-Gal or USP30 wild type constructs, asindicated. 24 h after transfection, cells were treated with bafilomycin (100 nM,0–8 h). d, Quantification of the LC3-II immunoblot signal from c, normalizedto actin. P 5 0.97 by two-way ANOVA and Bonferroni’s multiple comparisontest. n 5 5 experiments. Error bars represent s.e.m. e, Immunoblots of celllysates from HEK-293 cells, transfected with GFP–parkin and control(luciferase) or USP30 shRNA constructs. f, Quantification of the LC3-II andp62 immunoblot signal from e, normalized to actin. g, Immunoblots of celllysates from HEK-293 cells, transfected with GFP–parkin and control(luciferase) or USP30 shRNA constructs. 6 days after transfection, cells were
treated with bafilomycin (100 nM, 0–8 h). h, Quantification of the LC3-IIimmunoblot signal from g, normalized to actin. **P , 0.01 by two-wayANOVA and Bonferroni’s multiple comparison test. n 5 4 experiments. Errorbars represent s.e.m. i, j, Immunoblots of cell lysates from HEK-293 cells,transfected with GFP–parkin and the indicated control (b-Gal) or USP30constructs. 24 h after transfection, cells were treated with CCCP (20mM, 0–6 h).b-Gal transfected cells were also treated with bafilomycin (100 nM, 0–6 h) as acontrol (shown in j). k, Quantification of the p62 immunoblot signal fromi, j, normalized to actin. *P , 0.05 and **P , 0.01 by two-way ANOVA andBonferroni’s multiple comparison test. n 5 6 experiments. Error bars represents.e.m. l, Immunoblots of cell lysates from HEK-293 cells, transfected with GFP–parkin and control (luciferase) or USP30 knockdown constructs. 24 h aftertransfection, cells were treated with CCCP (20mM, 0-8 h) and bafilomycin(100 nM), as indicated. m, Quantification of the p62 immuoblot signal froml, normalized to actin. *P , 0.05 by two-way ANOVA and Bonferroni’smultiple comparison test. n 5 6 experiments. Error bars represent s.e.m.
ARTICLE RESEARCH
Macmillan Publishers Limited. All rights reserved©2014
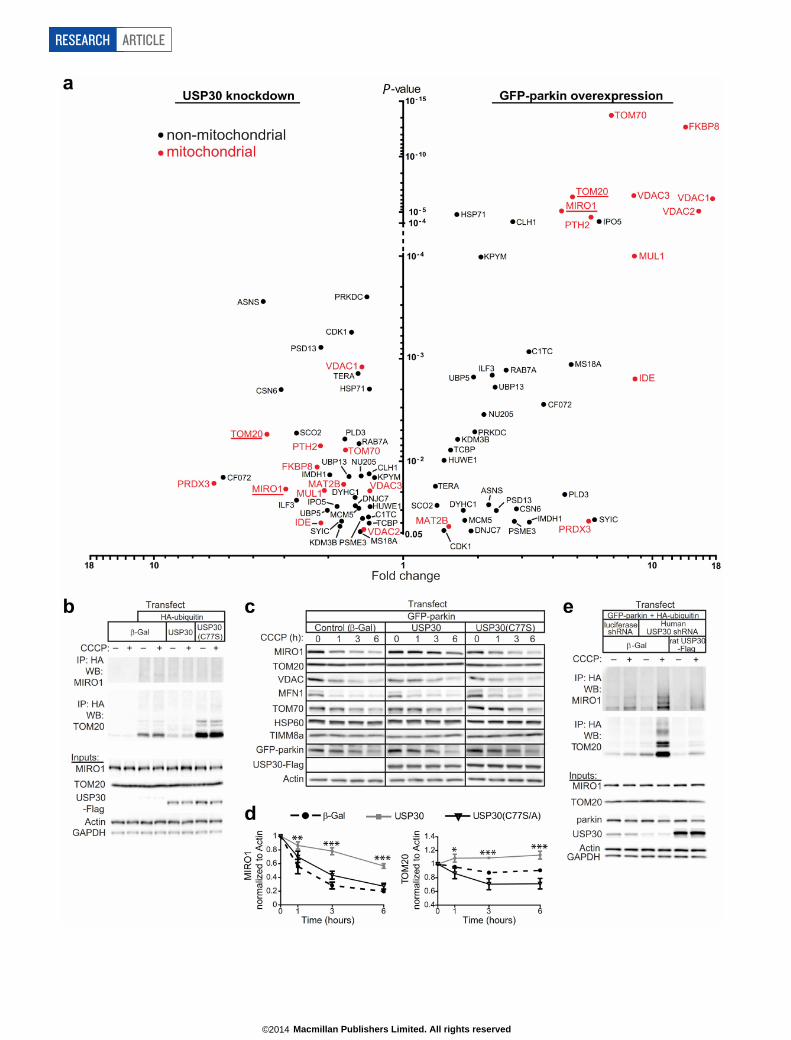
RESEARCH ARTICLE
Macmillan Publishers Limited. All rights reserved©2014
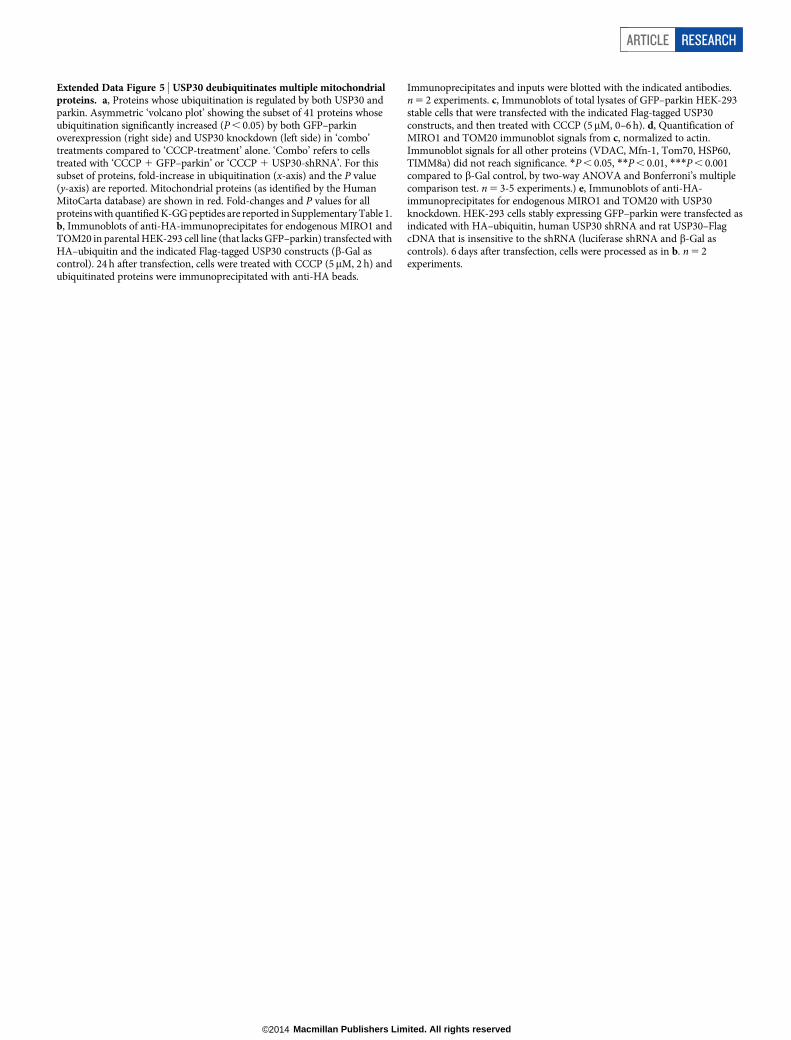
Extended Data Figure 5 | USP30 deubiquitinates multiple mitochondrialproteins. a, Proteins whose ubiquitination is regulated by both USP30 andparkin. Asymmetric ‘volcano plot’ showing the subset of 41 proteins whoseubiquitination significantly increased (P , 0.05) by both GFP–parkinoverexpression (right side) and USP30 knockdown (left side) in ‘combo’treatments compared to ‘CCCP-treatment’ alone. ‘Combo’ refers to cellstreated with ‘CCCP 1 GFP–parkin’ or ‘CCCP 1 USP30-shRNA’. For thissubset of proteins, fold-increase in ubiquitination (x-axis) and the P value(y-axis) are reported. Mitochondrial proteins (as identified by the HumanMitoCarta database) are shown in red. Fold-changes and P values for allproteins with quantified K-GG peptides are reported in Supplementary Table 1.b, Immunoblots of anti-HA-immunoprecipitates for endogenous MIRO1 andTOM20 in parental HEK-293 cell line (that lacks GFP–parkin) transfected withHA–ubiquitin and the indicated Flag-tagged USP30 constructs (b-Gal ascontrol). 24 h after transfection, cells were treated with CCCP (5mM, 2 h) andubiquitinated proteins were immunoprecipitated with anti-HA beads.
Immunoprecipitates and inputs were blotted with the indicated antibodies.n 5 2 experiments. c, Immunoblots of total lysates of GFP–parkin HEK-293stable cells that were transfected with the indicated Flag-tagged USP30constructs, and then treated with CCCP (5mM, 0–6 h). d, Quantification ofMIRO1 and TOM20 immunoblot signals from c, normalized to actin.Immunoblot signals for all other proteins (VDAC, Mfn-1, Tom70, HSP60,TIMM8a) did not reach significance. *P , 0.05, **P , 0.01, ***P , 0.001compared to b-Gal control, by two-way ANOVA and Bonferroni’s multiplecomparison test. n 5 3-5 experiments.) e, Immunoblots of anti-HA-immunoprecipitates for endogenous MIRO1 and TOM20 with USP30knockdown. HEK-293 cells stably expressing GFP–parkin were transfected asindicated with HA–ubiquitin, human USP30 shRNA and rat USP30–FlagcDNA that is insensitive to the shRNA (luciferase shRNA and b-Gal ascontrols). 6 days after transfection, cells were processed as in b. n 5 2experiments.
ARTICLE RESEARCH
Macmillan Publishers Limited. All rights reserved©2014
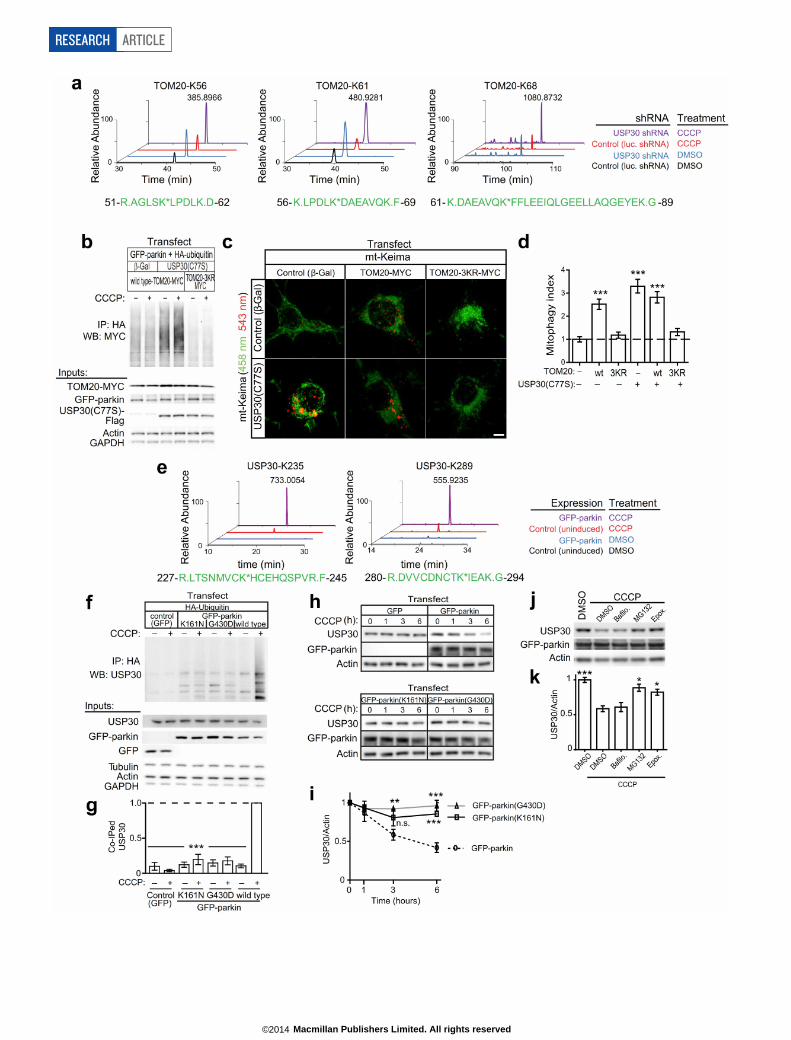
RESEARCH ARTICLE
Macmillan Publishers Limited. All rights reserved©2014
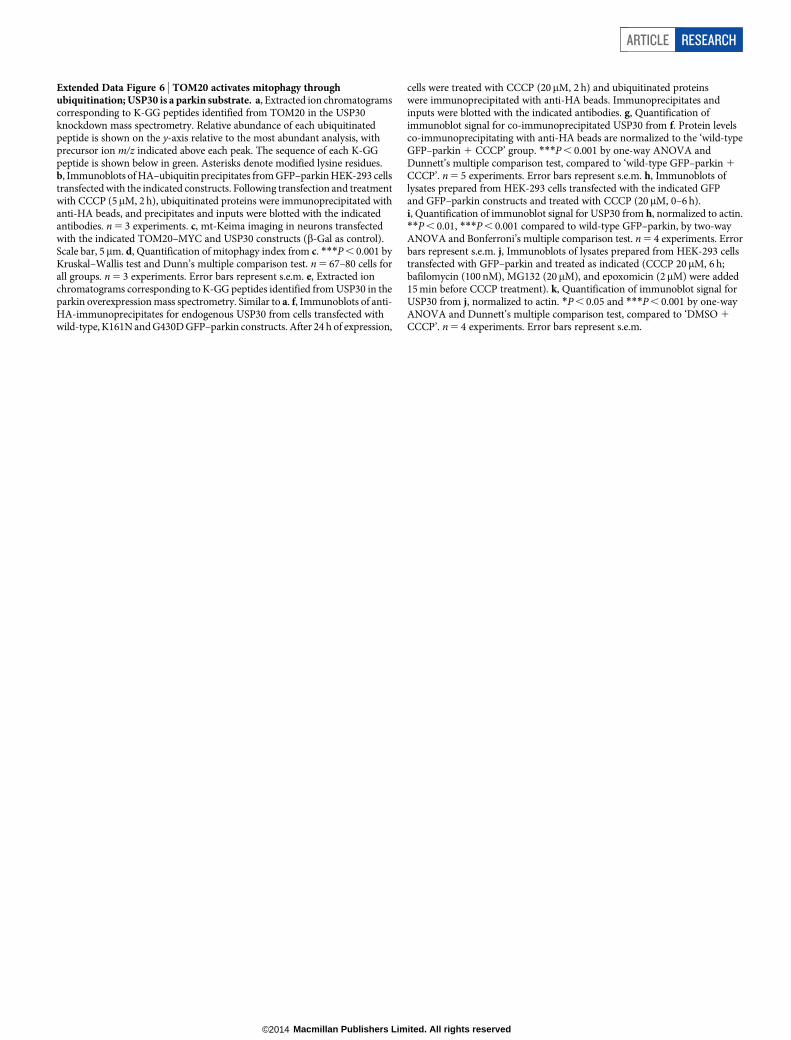
Extended Data Figure 6 | TOM20 activates mitophagy throughubiquitination; USP30 is a parkin substrate. a, Extracted ion chromatogramscorresponding to K-GG peptides identified from TOM20 in the USP30knockdown mass spectrometry. Relative abundance of each ubiquitinatedpeptide is shown on the y-axis relative to the most abundant analysis, withprecursor ion m/z indicated above each peak. The sequence of each K-GGpeptide is shown below in green. Asterisks denote modified lysine residues.b, Immunoblots of HA–ubiquitin precipitates from GFP–parkin HEK-293 cellstransfected with the indicated constructs. Following transfection and treatmentwith CCCP (5mM, 2 h), ubiquitinated proteins were immunoprecipitated withanti-HA beads, and precipitates and inputs were blotted with the indicatedantibodies. n 5 3 experiments. c, mt-Keima imaging in neurons transfectedwith the indicated TOM20–MYC and USP30 constructs (b-Gal as control).Scale bar, 5mm. d, Quantification of mitophagy index from c. ***P , 0.001 byKruskal–Wallis test and Dunn’s multiple comparison test. n 5 67–80 cells forall groups. n 5 3 experiments. Error bars represent s.e.m. e, Extracted ionchromatograms corresponding to K-GG peptides identified from USP30 in theparkin overexpression mass spectrometry. Similar to a. f, Immunoblots of anti-HA-immunoprecipitates for endogenous USP30 from cells transfected withwild-type, K161N and G430D GFP–parkin constructs. After 24 h of expression,
cells were treated with CCCP (20mM, 2 h) and ubiquitinated proteinswere immunoprecipitated with anti-HA beads. Immunoprecipitates andinputs were blotted with the indicated antibodies. g, Quantification ofimmunoblot signal for co-immunoprecipitated USP30 from f. Protein levelsco-immunoprecipitating with anti-HA beads are normalized to the ‘wild-typeGFP–parkin 1 CCCP’ group. ***P , 0.001 by one-way ANOVA andDunnett’s multiple comparison test, compared to ‘wild-type GFP–parkin 1
CCCP’. n 5 5 experiments. Error bars represent s.e.m. h, Immunoblots oflysates prepared from HEK-293 cells transfected with the indicated GFPand GFP–parkin constructs and treated with CCCP (20 mM, 0–6 h).i, Quantification of immunoblot signal for USP30 from h, normalized to actin.**P , 0.01, ***P , 0.001 compared to wild-type GFP–parkin, by two-wayANOVA and Bonferroni’s multiple comparison test. n 5 4 experiments. Errorbars represent s.e.m. j, Immunoblots of lysates prepared from HEK-293 cellstransfected with GFP–parkin and treated as indicated (CCCP 20mM, 6 h;bafilomycin (100 nM), MG132 (20mM), and epoxomicin (2mM) were added15 min before CCCP treatment). k, Quantification of immunoblot signal forUSP30 from j, normalized to actin. *P , 0.05 and ***P , 0.001 by one-wayANOVA and Dunnett’s multiple comparison test, compared to ‘DMSO 1
CCCP’. n 5 4 experiments. Error bars represent s.e.m.
ARTICLE RESEARCH
Macmillan Publishers Limited. All rights reserved©2014
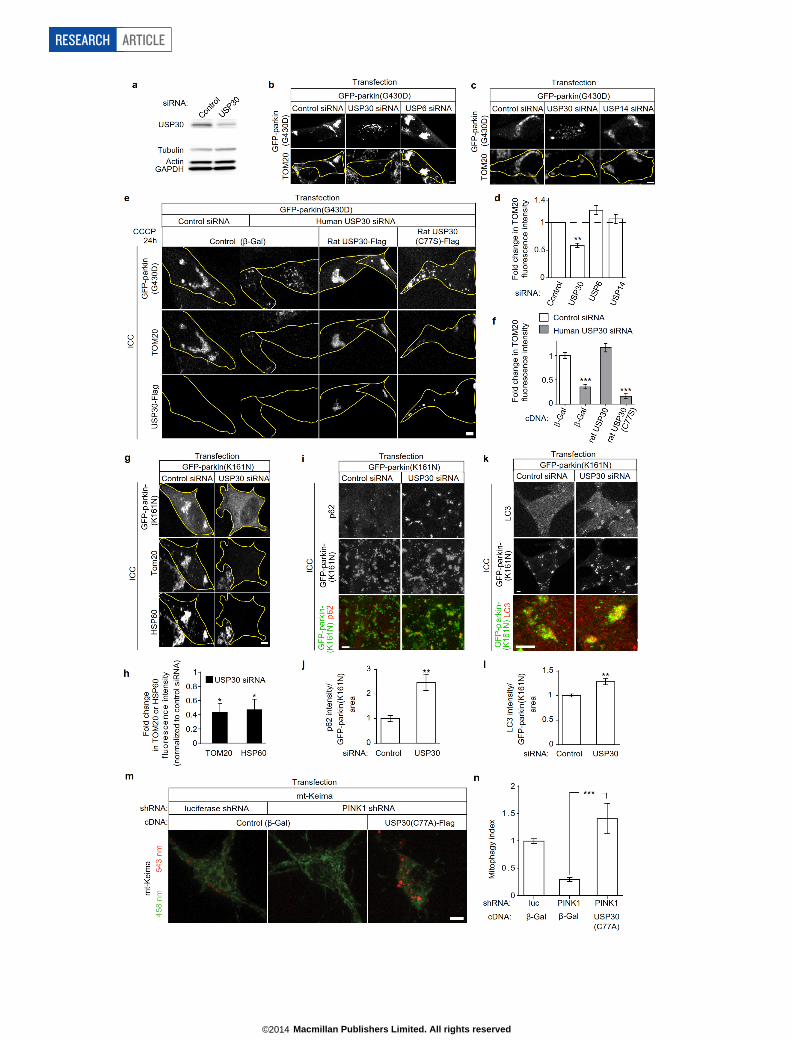
RESEARCH ARTICLE
Macmillan Publishers Limited. All rights reserved©2014

Extended Data Figure 7 | USP30 knockdown rescues mitophagy defects incells expressing mutant parkin. a, Immunoblot for endogenous USP30 in SH-SY5Y cells transfected with USP30 siRNA for 3 days. b, c, Immunostaining inSH-SY5Y cells stably expressing GFP–parkin(G430D), transfected withsiRNAs against USP30, USP6 or USP14. 3 days after transfection, cells weretreated with CCCP (20mM, 24 h), then fixed and stained for GFP andendogenous TOM20. Scale bars, 5mm. d, Quantification of fold change inTOM20 staining intensity from b and c, normalized to control siRNA.**P , 0.01 by Kruskal–Wallis test and Dunn’s multiple comparison test. n 5 3experiments. Error bars represent s.e.m. e, Immunostaining of SH-SY5Y cellsexpressing GFP–parkin(G430D), transfected as indicated, and treated withCCCP (20mM, 24 h). Rat USP30 cDNA is insensitive to human USP30 siRNA.f, Quantification of fold change in TOM20 intensity from e. Kruskal–Wallistest, n 5 3 experiments. g, Immunostaining of SH-SY5Y cells expressing GFP–parkin(K161N), and transfected with USP30 siRNA. Following 3 days ofknockdown, cells were treated with CCCP (20mM, 24 h), then fixed and
stained for GFP and endogenous TOM20 and HSP60. Scale bars, 5mm.h, Quantification of fold change in TOM20 or HSP60 staining intensity fromg, normalized to control siRNA. *P , 0.05 by Mann–Whitney test, n 5 4experiments. Error bars represent s.e.m. i, k, Immunostaining of SH-SY5Y cellsexpressing GFP–parkin(K161N), and transfected with USP30 siRNA.Following 3 days of knockdown, cells were treated with CCCP (20mM, 4 h),then fixed and stained for GFP and endogenous p62 (i) or LC3 (k). Co-localization of GFP–parkin (show in green) and p62 or LC3 (shown in red) isshown in the lower panel. Scale bars, 5mm. j, l, Quantification of GFP–parkin(K161N)-associated p62 (j) or LC3 (l) staining intensity normalized byGFP–parkin(K161N) area, from i, k. **P , 0.01 by Mann–Whitney test,n 5 9–10 experiments. Error bars represent s.e.m. m, mt-Keima imaging inneurons transfected with PINK1 shRNA and USP30(C77A)–Flag. Scale bar,5mm. n, Quantification of mitophagy index from m. Kruskal–Wallis test.n 5 127–166 cells. n 5 7 experiments. Error bars represent s.e.m.
ARTICLE RESEARCH
Macmillan Publishers Limited. All rights reserved©2014
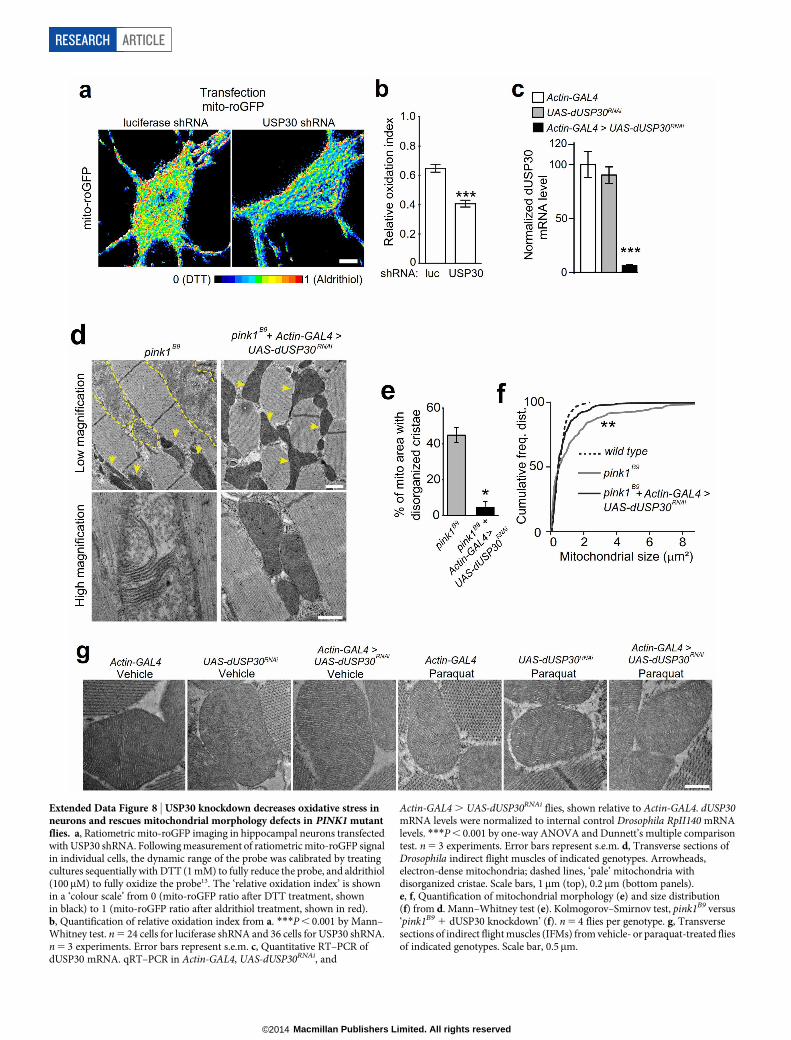
Extended Data Figure 8 | USP30 knockdown decreases oxidative stress inneurons and rescues mitochondrial morphology defects in PINK1 mutantflies. a, Ratiometric mito-roGFP imaging in hippocampal neurons transfectedwith USP30 shRNA. Following measurement of ratiometric mito-roGFP signalin individual cells, the dynamic range of the probe was calibrated by treatingcultures sequentially with DTT (1 mM) to fully reduce the probe, and aldrithiol(100mM) to fully oxidize the probe13. The ‘relative oxidation index’ is shownin a ‘colour scale’ from 0 (mito-roGFP ratio after DTT treatment, shownin black) to 1 (mito-roGFP ratio after aldrithiol treatment, shown in red).b, Quantification of relative oxidation index from a. ***P , 0.001 by Mann–Whitney test. n 5 24 cells for luciferase shRNA and 36 cells for USP30 shRNA.n 5 3 experiments. Error bars represent s.e.m. c, Quantitative RT–PCR ofdUSP30 mRNA. qRT–PCR in Actin-GAL4, UAS-dUSP30RNAi, and
Actin-GAL4 . UAS-dUSP30RNAi flies, shown relative to Actin-GAL4. dUSP30mRNA levels were normalized to internal control Drosophila RpII140 mRNAlevels. ***P , 0.001 by one-way ANOVA and Dunnett’s multiple comparisontest. n 5 3 experiments. Error bars represent s.e.m. d, Transverse sections ofDrosophila indirect flight muscles of indicated genotypes. Arrowheads,electron-dense mitochondria; dashed lines, ‘pale’ mitochondria withdisorganized cristae. Scale bars, 1mm (top), 0.2mm (bottom panels).e, f, Quantification of mitochondrial morphology (e) and size distribution(f) from d. Mann–Whitney test (e). Kolmogorov–Smirnov test, pink1B9 versus‘pink1B9 1 dUSP30 knockdown’ (f). n 5 4 flies per genotype. g, Transversesections of indirect flight muscles (IFMs) from vehicle- or paraquat-treated fliesof indicated genotypes. Scale bar, 0.5mm.
RESEARCH ARTICLE
Macmillan Publishers Limited. All rights reserved©2014
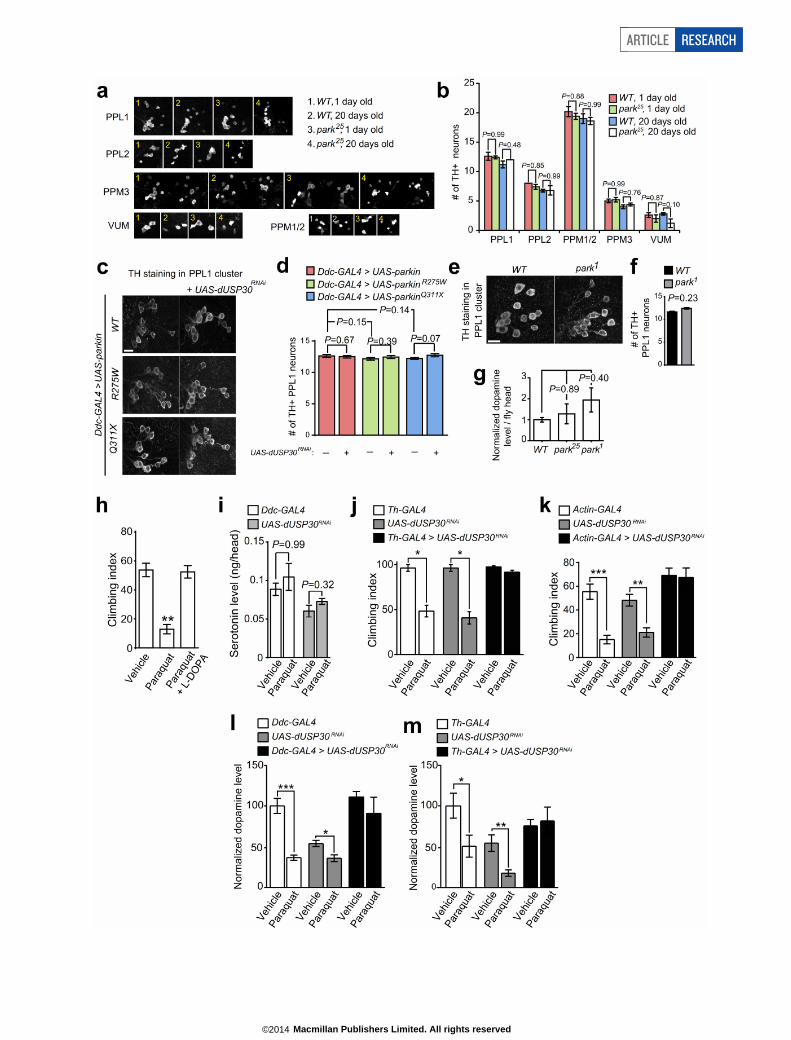
ARTICLE RESEARCH
Macmillan Publishers Limited. All rights reserved©2014
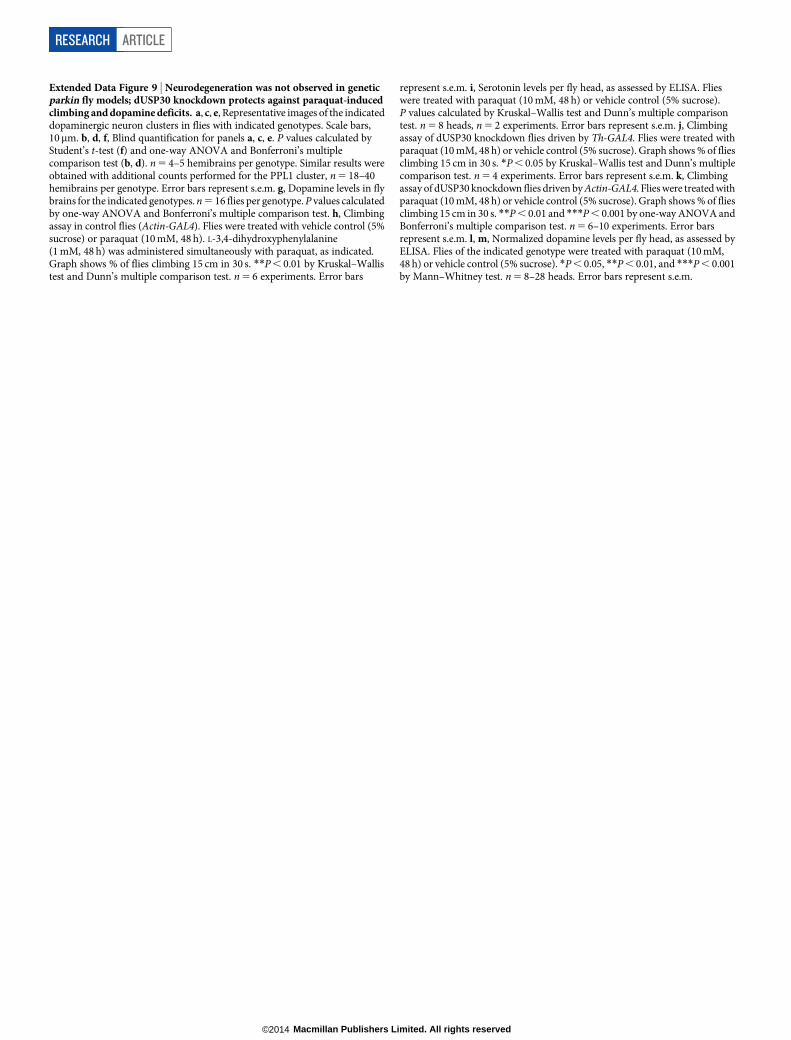
Extended Data Figure 9 | Neurodegeneration was not observed in geneticparkin fly models; dUSP30 knockdown protects against paraquat-inducedclimbing and dopamine deficits. a, c, e, Representative images of the indicateddopaminergic neuron clusters in flies with indicated genotypes. Scale bars,10mm. b, d, f, Blind quantification for panels a, c, e. P values calculated byStudent’s t-test (f) and one-way ANOVA and Bonferroni’s multiplecomparison test (b, d). n 5 4–5 hemibrains per genotype. Similar results wereobtained with additional counts performed for the PPL1 cluster, n 5 18–40hemibrains per genotype. Error bars represent s.e.m. g, Dopamine levels in flybrains for the indicated genotypes. n 5 16 flies per genotype. P values calculatedby one-way ANOVA and Bonferroni’s multiple comparison test. h, Climbingassay in control flies (Actin-GAL4). Flies were treated with vehicle control (5%sucrose) or paraquat (10 mM, 48 h). L-3,4-dihydroxyphenylalanine(1 mM, 48 h) was administered simultaneously with paraquat, as indicated.Graph shows % of flies climbing 15 cm in 30 s. **P , 0.01 by Kruskal–Wallistest and Dunn’s multiple comparison test. n 5 6 experiments. Error bars
represent s.e.m. i, Serotonin levels per fly head, as assessed by ELISA. Flieswere treated with paraquat (10 mM, 48 h) or vehicle control (5% sucrose).P values calculated by Kruskal–Wallis test and Dunn’s multiple comparisontest. n 5 8 heads, n 5 2 experiments. Error bars represent s.e.m. j, Climbingassay of dUSP30 knockdown flies driven by Th-GAL4. Flies were treated withparaquat (10 mM, 48 h) or vehicle control (5% sucrose). Graph shows % of fliesclimbing 15 cm in 30 s. *P , 0.05 by Kruskal–Wallis test and Dunn’s multiplecomparison test. n 5 4 experiments. Error bars represent s.e.m. k, Climbingassay of dUSP30 knockdown flies driven by Actin-GAL4. Flies were treated withparaquat (10 mM, 48 h) or vehicle control (5% sucrose). Graph shows % of fliesclimbing 15 cm in 30 s. **P , 0.01 and ***P , 0.001 by one-way ANOVA andBonferroni’s multiple comparison test. n 5 6–10 experiments. Error barsrepresent s.e.m. l, m, Normalized dopamine levels per fly head, as assessed byELISA. Flies of the indicated genotype were treated with paraquat (10 mM,48 h) or vehicle control (5% sucrose). *P , 0.05, **P , 0.01, and ***P , 0.001by Mann–Whitney test. n 5 8–28 heads. Error bars represent s.e.m.
RESEARCH ARTICLE
Macmillan Publishers Limited. All rights reserved©2014
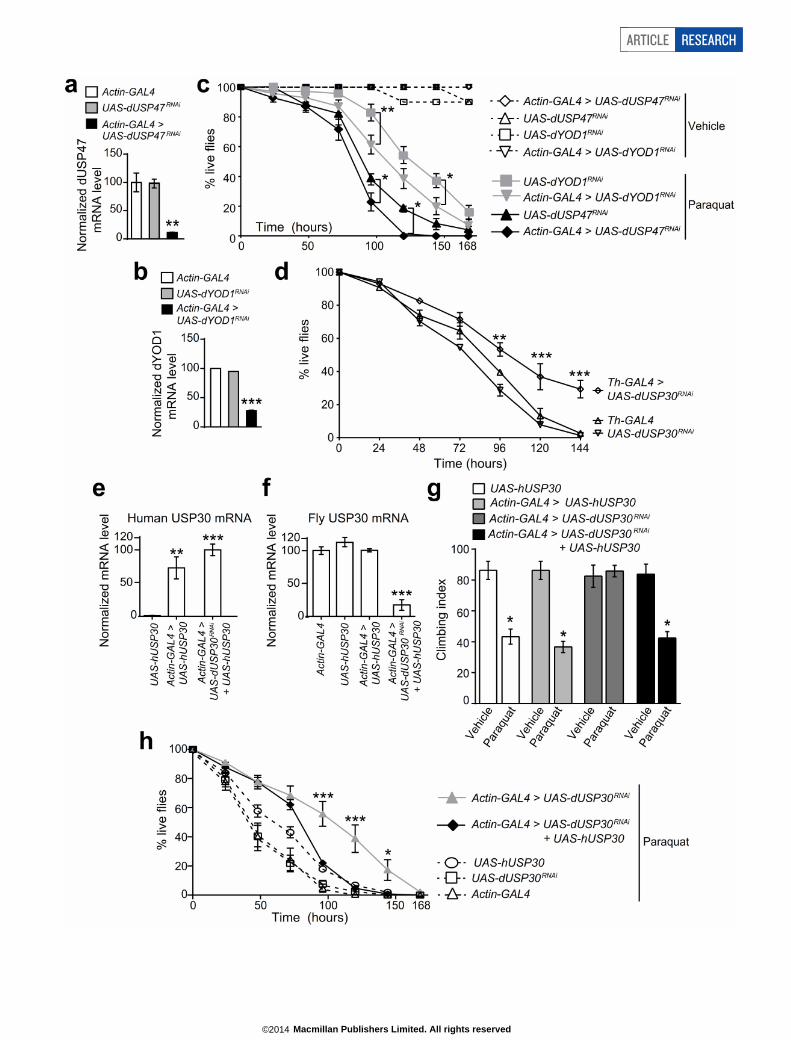
ARTICLE RESEARCH
Macmillan Publishers Limited. All rights reserved©2014

Extended Data Figure 10 | Knockdown of DUBs dYOD1 or dUSP47 in fliesdoes not provide protection against paraquat; hUSP30 overexpressionreverses dUSP30 knockdown benefits. a, b, Quantitative RT–PCRmeasurement of dUSP47 (a) and dYOD1 (b) mRNA levels in flies of theindicated genotypes, expressed as relative to Actin-GAL4 genotype. **P , 0.01and ***P , 0.001 by one-way ANOVA and Dunnett’s multiple comparisontest. n 5 3 technical replicates. Error bars represent s.e.m. c, Survival curves offlies with dUSP47 or dYOD1 knockdown, treated with vehicle (5% sucrose) orparaquat (10 mM). Graph shows percent of flies alive at indicated times.*P , 0.05 and **p,0.01 by two-way ANOVA and Bonferroni’s multiplecomparison test. n 5 5–7 experiments. Error bars represent s.e.m. d, Survivalcurves of flies with dUSP30 knockdown driven by Th-GAL4, treated withparaquat (10 mM). Graph shows percent of flies alive at indicated times after
feeding with paraquat. **P , 0.01 and ***P , 0.001 by two-way ANOVA andBonferroni’s multiple comparison test. n 5 3 experiments. Error bars represents.e.m. e, f, Quantitative RT–PCR measurement of hUSP30 and dUSP30 mRNAlevels in flies of the indicated genotypes. **P , 0.01 and ***P , 0.001 byone-way ANOVA and Dunnett’s multiple comparison test. n 5 4 experiments.Error bars represent s.e.m. g, Climbing assay for flies overexpressing hUSP30.Flies of indicated genotypes were fed with vehicle (5% sucrose) or paraquat(10 mM, 48 h); graph shows percent of flies climbing 15 cm in 30 s. *P , 0.05 byKruskal–Wallis test and Dunn’s multiple comparison test. n 5 4 experiments.Error bars represent s.e.m. h, Survival assay for flies overexpressing hUSP30.Flies were fed paraquat (10 mM); graph shows % live flies at indicated times.*P , 0.05 and ***P , 0.001 by two-way ANOVA and Bonferroni’s multiplecomparison test. n 5 4–11 experiments. Error bars represent s.e.m.
RESEARCH ARTICLE
Macmillan Publishers Limited. All rights reserved©2014
Related Documents