The Mitochondrial Complex I Activity Is Reduced in Cells with Impaired Cystic Fibrosis Transmembrane Conductance Regulator (CFTR) Function Angel G. Valdivieso, Maria ´ ngeles Clauzure, Marı ´a C. Marı´n ¤ , Guillermo L. Taminelli, Marı´a M. Massip Copiz, Francisco Sa ´ nchez, Gustavo Schulman, Marı ´a L. Teiber, Toma ´ s A. Santa-Coloma* Institute for Biomedical Research, Laboratory of Cellular and Molecular Biology, School of Medical Sciences, Pontifical Catholic University of Argentina (UCA) and The National Research Council of Argentina (CONICET), Buenos Aires, Argentina Abstract Cystic fibrosis (CF) is a frequent and lethal autosomal recessive disease. It results from different possible mutations in the CFTR gene, which encodes the CFTR chloride channel. We have previously studied the differential expression of genes in CF and CF corrected cell lines, and found a reduced expression of MTND4 in CF cells. MTND4 is a mitochondrial gene encoding the MTND4 subunit of the mitochondrial Complex I (mCx-I). Since this subunit is essential for the assembly and activity of mCx-I, we have now studied whether the activity of this complex was also affected in CF cells. By using Blue Native-PAGE, the in-gel activity (IGA) of the mCx-I was found reduced in CFDE and IB3-1 cells (CF cell lines) compared with CFDE/ 6RepCFTR and S9 cells, respectively (CFDE and IB3-1 cells ectopically expressing wild-type CFTR). Moreover, colon carcinoma T84 and Caco-2 cells, which express wt-CFTR, either treated with CFTR inhibitors (glibenclamide, CFTR(inh)-172 or GlyH101) or transfected with a CFTR-specific shRNAi, showed a significant reduction on the IGA of mCx-I. The reduction of the mCx-I activity caused by CFTR inhibition under physiological or pathological conditions may have a profound impact on mitochondrial functions of CF and non-CF cells. Citation: Valdivieso AG, Clauzure M, Marı ´n MC, Taminelli GL, Massip Copiz MM, et al. (2012) The Mitochondrial Complex I Activity Is Reduced in Cells with Impaired Cystic Fibrosis Transmembrane Conductance Regulator (CFTR) Function. PLoS ONE 7(11): e48059. doi:10.1371/journal.pone.0048059 Editor: Dominik Hartl, University of Tu ¨ bingen, Germany Received November 4, 2011; Accepted September 25, 2012; Published November 21, 2012 Copyright: ß 2012 Valdivieso et al. This is an open-access article distributed under the terms of the Creative Commons Attribution License, which permits unrestricted use, distribution, and reproduction in any medium, provided the original author and source are credited. Funding: This work was supported by the National Agency for the Promotion of Science and Technology (ANPCYT), grants BID OC-AR 1728, PICT 2004-13970 and PICT 2007-00628 to TASC; The National Research Council of Argentina (CONICET), grant PIP 11220080 102551, 2009-2011 to TASC and research fellowships to AGV, MCM, MMMC and GS; and The Pontifical Catholic University of Argentina, grant to TASC and fellowships to GLT, FS, and MLT. The funders had no role in study design, data collection and analysis, decision to publish, or preparation of the manuscript. Competing Interests: The authors have declared that no competing interests exist. * E-mail: [email protected] ¤ Current address: Laboratorios Richmond, Buenos Aires, Argentina Introduction Cystic fibrosis (CF) is an autosomal recessive disease caused by mutations in the CFTR (Cystic Fibrosis Transmembrane Conduc- tance Regulator) gene. This gene was cloned in 1989 [1,2] and soon identified as a chloride channel [3,4]. More than 1,900 possible mutations have been identified so far (www.genet.sickkids. on.ca)[5], which impair the expression of the CFTR mRNA, the traffic of its protein product towards the cell membrane or alter its turnover anddegradation [6,7,8,9]. Before the CFTR gene was cloned, several reports suggested a possible mitochondrial failure associated to CF. Burton L. Shapiro and colleagues found that CF cells are more sensitive to the Complex I (NADH:ubiquinone oxidoreductase, mCx-I, mitochondrial Complex I, EC 1.6.5.3) inhibitor rotenone and consume more oxygen than normal cells [10]. They also found altered optimal pH and Km values for this mitochondrial enzyme [11], as well as an elevated calcium uptake, in CF mitochondria, the latter attributed to a possible defect in the respiratory chain [12]. Based on these results, these authors postulated that the gene affected in CF might be a component of the mitochondrial Complex I [10,11]. However, after CFTR was identified as a membrane protein with chloride transport activity (chloride channel), the mitochondrial hypothesis was disregarded and no further work was done for many years on the subject. Possible indirect effects of CFTR or Cl 2 over mitochondria were not considered as a possibility at that time and until recently, no further studies suggested that the CFTR failure could indirectly lead to a mitochondrial failure [13,14,15,16]. By using differential display, we have previously studied the differential expression of genes in CF and non-CF cells, and identified several ‘‘CFTR-dependent genes’’, including c-Src [17], MUC1 [17], CISD1 [14] and MTND4 [15]. We first studied one spot that was increased in CF cells and resulted to be c-Src. Then, we selected two spots that, contrary to c-Src, were clearly reduced in CF cells. Noteworthy, both genes, CISD1 [14] and MTND4 [15], codified for mitochondrial proteins. CISD1 was also found by Colca et al. [18] as a mitochondrial receptor for pioglitazone, and was named by them mitoNEET. The exact function of CISD1 is unknown yet. It has been recently proposed that CISD1 might act as a redox sensor, as a modulator of oxidative phosphorylation (OXPHOS), or as a carrier of [2Fe2S] clusters to apoproteins acceptors into mitochondria [19,20,21,22,23,24,25,26]. On the other hand, MTND4 encodes the MTND4 subunit of mitochon- drial Complex I (mCx-I). This complex is the entry point of PLOS ONE | www.plosone.org 1 November 2012 | Volume 7 | Issue 11 | e48059

Welcome message from author
This document is posted to help you gain knowledge. Please leave a comment to let me know what you think about it! Share it to your friends and learn new things together.
Transcript
The Mitochondrial Complex I Activity Is Reduced in Cellswith Impaired Cystic Fibrosis TransmembraneConductance Regulator (CFTR) FunctionAngel G. Valdivieso, Mariangeles Clauzure, Marıa C. Marın¤, Guillermo L. Taminelli, Marıa M. Massip
Copiz, Francisco Sanchez, Gustavo Schulman, Marıa L. Teiber, Tomas A. Santa-Coloma*
Institute for Biomedical Research, Laboratory of Cellular and Molecular Biology, School of Medical Sciences, Pontifical Catholic University of Argentina (UCA) and The
National Research Council of Argentina (CONICET), Buenos Aires, Argentina
Abstract
Cystic fibrosis (CF) is a frequent and lethal autosomal recessive disease. It results from different possible mutations in theCFTR gene, which encodes the CFTR chloride channel. We have previously studied the differential expression of genes in CFand CF corrected cell lines, and found a reduced expression of MTND4 in CF cells. MTND4 is a mitochondrial gene encodingthe MTND4 subunit of the mitochondrial Complex I (mCx-I). Since this subunit is essential for the assembly and activity ofmCx-I, we have now studied whether the activity of this complex was also affected in CF cells. By using Blue Native-PAGE,the in-gel activity (IGA) of the mCx-I was found reduced in CFDE and IB3-1 cells (CF cell lines) compared with CFDE/6RepCFTR and S9 cells, respectively (CFDE and IB3-1 cells ectopically expressing wild-type CFTR). Moreover, colon carcinomaT84 and Caco-2 cells, which express wt-CFTR, either treated with CFTR inhibitors (glibenclamide, CFTR(inh)-172 or GlyH101)or transfected with a CFTR-specific shRNAi, showed a significant reduction on the IGA of mCx-I. The reduction of the mCx-Iactivity caused by CFTR inhibition under physiological or pathological conditions may have a profound impact onmitochondrial functions of CF and non-CF cells.
Citation: Valdivieso AG, Clauzure M, Marın MC, Taminelli GL, Massip Copiz MM, et al. (2012) The Mitochondrial Complex I Activity Is Reduced in Cells withImpaired Cystic Fibrosis Transmembrane Conductance Regulator (CFTR) Function. PLoS ONE 7(11): e48059. doi:10.1371/journal.pone.0048059
Editor: Dominik Hartl, University of Tubingen, Germany
Received November 4, 2011; Accepted September 25, 2012; Published November 21, 2012
Copyright: � 2012 Valdivieso et al. This is an open-access article distributed under the terms of the Creative Commons Attribution License, which permitsunrestricted use, distribution, and reproduction in any medium, provided the original author and source are credited.
Funding: This work was supported by the National Agency for the Promotion of Science and Technology (ANPCYT), grants BID OC-AR 1728, PICT 2004-13970 andPICT 2007-00628 to TASC; The National Research Council of Argentina (CONICET), grant PIP 11220080 102551, 2009-2011 to TASC and research fellowships toAGV, MCM, MMMC and GS; and The Pontifical Catholic University of Argentina, grant to TASC and fellowships to GLT, FS, and MLT. The funders had no role instudy design, data collection and analysis, decision to publish, or preparation of the manuscript.
Competing Interests: The authors have declared that no competing interests exist.
* E-mail: [email protected]
¤ Current address: Laboratorios Richmond, Buenos Aires, Argentina
Introduction
Cystic fibrosis (CF) is an autosomal recessive disease caused by
mutations in the CFTR (Cystic Fibrosis Transmembrane Conduc-
tance Regulator) gene. This gene was cloned in 1989 [1,2] and
soon identified as a chloride channel [3,4]. More than 1,900
possible mutations have been identified so far (www.genet.sickkids.
on.ca)[5], which impair the expression of the CFTR mRNA, the
traffic of its protein product towards the cell membrane or alter its
turnover anddegradation [6,7,8,9]. Before the CFTR gene was
cloned, several reports suggested a possible mitochondrial failure
associated to CF. Burton L. Shapiro and colleagues found that CF
cells are more sensitive to the Complex I (NADH:ubiquinone
oxidoreductase, mCx-I, mitochondrial Complex I, EC 1.6.5.3)
inhibitor rotenone and consume more oxygen than normal cells
[10]. They also found altered optimal pH and Km values for this
mitochondrial enzyme [11], as well as an elevated calcium uptake,
in CF mitochondria, the latter attributed to a possible defect in the
respiratory chain [12]. Based on these results, these authors
postulated that the gene affected in CF might be a component of
the mitochondrial Complex I [10,11]. However, after CFTR was
identified as a membrane protein with chloride transport activity
(chloride channel), the mitochondrial hypothesis was disregarded
and no further work was done for many years on the subject.
Possible indirect effects of CFTR or Cl2 over mitochondria were
not considered as a possibility at that time and until recently, no
further studies suggested that the CFTR failure could indirectly
lead to a mitochondrial failure [13,14,15,16].
By using differential display, we have previously studied the
differential expression of genes in CF and non-CF cells, and
identified several ‘‘CFTR-dependent genes’’, including c-Src [17],
MUC1 [17], CISD1 [14] and MTND4 [15]. We first studied one
spot that was increased in CF cells and resulted to be c-Src. Then,
we selected two spots that, contrary to c-Src, were clearly reduced
in CF cells. Noteworthy, both genes, CISD1 [14] and MTND4
[15], codified for mitochondrial proteins. CISD1 was also found
by Colca et al. [18] as a mitochondrial receptor for pioglitazone,
and was named by them mitoNEET. The exact function of CISD1
is unknown yet. It has been recently proposed that CISD1 might
act as a redox sensor, as a modulator of oxidative phosphorylation
(OXPHOS), or as a carrier of [2Fe2S] clusters to apoproteins
acceptors into mitochondria [19,20,21,22,23,24,25,26]. On the
other hand, MTND4 encodes the MTND4 subunit of mitochon-
drial Complex I (mCx-I). This complex is the entry point of
PLOS ONE | www.plosone.org 1 November 2012 | Volume 7 | Issue 11 | e48059
electrons to the OXPHOS system, transferring electrons from
NADH (reduced nicotinamide adenine dinucleotide) to ubiqui-
none; the electron transference is coupled to the proton pumping
inside the mitochondrial intermembrane space (IMS) to form, in
part, the proton gradient used to produce ATP [27,28].
Interestingly, MTND4 is essential for the assembly and proper
activity of the mCx-I [29]. Different mutations within the MTND4
gene result in a loss of enzyme activity [30], as evidenced in
Leber’s hereditary optic neuropathy (LHON) disease [31,32,33].
This condition is a maternally inherited form of central vision loss
in which the mCx-I activity is impaired.
The reduced expression of MTND4 found in CF cells [15], and
the important role of this subunit in mCx-I assembly, prompted us
to test whether the activity of this complex was affected in CF cells
or in cells with impaired CFTR activity (by using CFTR channel
inhibitors or shRNA). We show here that the in-gel activity (IGA)
of mCx-I was reduced in CF cells. Moreover, this activity can be
modulated in cells expressing wt-CFTR in the presence of CFTR
inhibitors or shRNA, demonstrating a causal effect between the
CFTR activity and the mCx-I activity. The results are in
agreement with earlier reports on mitochondrial alterations in
CF observed more than two decades ago [10,11,12,34,35,36,37],
which were later erroneously disregarded when the CFTR was
found to be a chloride channel.
Materials and Methods
MaterialsBovine fibronectin, collagen Type I, pepstatin, PMSF (phenyl-
methylsulfonyl fluoride), leupeptin, glibenclamide, dimethyl sulf-
oxide (DMSO, culture grade), NADH, dibutyryl-cAMP, lauryl
maltoside, IBMX (3-isobutyl-1-methyl xanthine), (2)-isoproterenol
hydrochloride and valinomycin were purchased from Sigma-
Aldrich (St. Louis, MO). Cytochrome c, CFTR(inh)-172 (5-[(4-
Carboxyphenyl) methylene]-2-thioxo-3-[(3-trifluoromethyl)phe-
nyl-4-thiazolidinone) and GlyH101 (N-(2-naphthalenyl)-[(3,5-
dibromo-2,4-ihydroxyphenyl)methylene]glycine hydrazide) were
from Calbiochem (San Diego, CA). Aminocaproic acid (6-
aminohexanoic acid) and nitroblue tetrazolium (NBT) were from
Fluka (Sigma-Aldrich). NBT-BCIP (BCIP, 5-bromo-4-chloro-39-
indolyphosphate) were from Promega (Madison, WI), Coomassie
brilliant blue G-250 and R-250 were supplied by Bio-Rad
Laboratories (Hercules, CA). Trypsin was purchased from Life
Technologies (GIBCO BRL, Rockville, MD) and SPQ (6-
methoxy-N-[3-sulfopropyl]quinolinium) from Invitrogen (Carls-
bad, CA). All other reagents were analytical grade.
Cell cultureCFDE, CFDE/6RepCFTR, IB3-1, S9, T84 and Caco-2 cells
were used in the experiments. CFDE and CFDE/6RepCFTR
cells were a gift from Dr. Dieter C. Gruenert (UCSF). IB3-1 (CRL-
2777), S9 (CRL-2778), T84 (CCL-248) and Caco-2 (HTB-37) cells
were purchased from ATCC (www.atcc.org). CFDE cells are
tracheobronchial cells derived from a CF patient with an unknown
genotype (the most frequent mutations are absent; unpublished
observations); CFDE/6RepCFTR are CFDE cells that ectopically
express the wt-CFTR [38]. IB3-1 cells are bronchial epithelial cells
derived from a CF patient that exhibited the most frequent
mutation, DF508. These last cells have been immortalized using
the hybrid adenovirus adeno-12-SV40 [39]. S9 cells are IB3-1 cells
transduced with an adeno-associated viral vector to stably express
wt-CFTR [40]. Finally, T84 and Caco-2 cells are human colon
carcinoma epithelial cells that express wt-CFTR [41,42,43]. All
cell lines were cultured in DMEM/F12 (Life Technologies,
GIBCO BRL, Rockville, MD) supplemented with 10% FBS
(BIOSER, Buenos Aires, Argentina), 100 units/ml penicillin,
100 mg/ml streptomycin, and 0.25 mg/ml amphotericin B (Life
Technologies, GIBCO BRL, Rockville, MD). Cultures were
grown in a humidified atmosphere containing 5% CO2.
Additionally, CFDE/6RepCFTR cells were grown in the presence
of 50 mg/ml hygromycin B (Sigma-Aldrich), in order to select and
maintain cells that ectopically expresses wt-CFTR. All cells were
plated at a density of 156103 cells/cm2. Before the assays, the cells
were cultured 24 h in serum-free medium, until cells reached 60–
70% confluence. In S9 and IB3-1 cells, the CFTR activity was
stimulated by adding to the cells 200 mM dibutyryl cAMP,
200 mM IBMX and 20 mM isoproterenol, in serum-free medium
for 24 h.
Inhibition of the CFTR chloride transport activityT84 cells were cultured in 150 cm2 tissue culture dishes until
they reached 60–70% confluence. At that point, the culture
medium was removed and serum-free medium was added to the
cells. After 24 h incubation at 37uC, 100 mM glibenclamide, 5 mM
CFTR(inh)-172 or 5 mM GlyH101 was added to the serum-free
medium and the cells were incubated at 37uC for additional 24 or
48 h (the culture medium containing the inhibitors was renewed
after 24 h of incubation; also the medium from controls cells was
replaced). Stock solutions for each inhibitor were prepared at 1000
X in DMSO and control cultures were treated with equal amounts
of DMSO (final concentration 0.1–0.3%).
Mitochondria isolationMitochondria were isolated by using differential centrifugation,
according to a slightly modified version of the method described
by Majander et al. [33]. Briefly, cells were washed with PBS,
scrapped and sedimented by centrifugation (5006g, 10 min). The
pellet was then resuspended in isolation buffer (250 mg of cells per
ml of buffer containing 0.25 M sucrose, 25 mM MOPS and
adjusted to pH 7.4 with KOH) and the cells permeabilized by
adding 0.12% w/v digitonin (stock solution 10 mg/ml in water)
for 40 s on ice. Then, the samples were diluted in three volumes of
isolation buffer and centrifuged at 10,0006 g for 30 min (4uC).
The pellet was resuspended again in 800 ml of isolation buffer and
centrifuged at 8006g for 5 min to discard nuclei and whole cells.
Then, the supernatant was centrifuged at 10,0006 g for 15 min
(4uC) to recover mitochondria. This final pellet was resuspended in
30–50 ml of Blue Native (BN) sample buffer A (1 M aminocaproic
acid, 150 mM bis-Tris-HCl, 10 mM pepstatin, 10 mM leupeptin,
100 mM PMSF, 1 mM EDTA, pH 7.0). Finally, the method of
Lowry was used to measure protein concentration in aliquots
previously incubated with 0.4 N NaOH for 30 min at RT, to
dissolve mitochondrial membranes [44].
Blue Native-PAGEMitochondrial membranes containing the respiratory chain
complexes were solubilized according to Schagger et al. [45], with
few modifications. Aliquots containing 150 mg of mitochondrial
protein were resuspended in BN sample buffer A to a final protein
concentration of 3 mg/ml. Protein complexes were solubilized at
4uC using lauryl maltoside (final concentration 0.6% w/v), and the
mixture was then centrifuged at 25,0006g for 30 min at 4uC. The
supernatants were collected and protein concentration was
measured by Lowry. Before loading the gel, BN sample buffer B
(1 M aminocaproic acid, 20% glycerol, 150 mM bis-Tris-HCl, 5%
w/v Coomassie brilliant blue G-250, pH 7.0) was added to
samples containing equal quantities of protein (60–100 mg in
different experiments; usually 80 mg) [46]. The ratio (BN sample
mCx-I Activity in CFTR Modulated Cells
PLOS ONE | www.plosone.org 2 November 2012 | Volume 7 | Issue 11 | e48059
buffer B)/sample was 1:14. Samples were electrophoresed in a 5–
13% BN-PAGE (Blue Native PAGE) gradient gel with a 4%
stacking gel. The gels and electrophoresis buffers were prepared as
described by Schagger [45]. The gel, the buffers and the
electrophoretic chamber were cooled to 0–4uC (ice/water) before
loading the samples and maintained at the same temperature
range during the run. Molecular weight standards were prepared
as indicated by the manufacturer (high molecular weight
calibration kit, Amersham Biosciences, Buckinghamshire, En-
gland). Electrophoresis was carried out at 80 V, 4uC until protein
samples migrated into the stacking gel. Voltage was then set to
200 V and the current limited to 15 mA. Once the trace dye had
migrated half-way into the separation gel, the cathode (2) buffer
(50 mM Tricine, 15 mM bis-Tris-HCl, 0.02% Coomassie brilliant
blue G-250, pH 7.0) was replaced with the same buffer without
the G-250 dye. This procedure helps to reduce the dye
background, which might prevent the detection of the mCx-I
activity at the end of the run.
Measurement of the in-gel mCx-I activity (IGA)Following electrophoresis, to measure the in-gel activity (IGA) of
mCx-I, the gel was incubated (protected from light) for 40 min in a
buffer containing 0.1 M Tris-HCl, 0.14 mM NADH, and
1.22 mM NBT, pH 7.4 [47]. A fixing solution containing 45%
methanol:10% acetic acid was then used to stop the reaction and
the gels were distained overnight (ON) in the same solution, to
remove the Coomassie background. The gels were then scanned
(HP ScanJet G3110 scanner) and the signal intensities quantified
by densitometry using the NIH Image software (Windows version,
Scion Corp., Frederick, MD), or its Java version (ImageJ,
rsbweb.nih.gov). As a first approach to control sample loads, the
gels were stained (0.25% Coomassie brilliant blue R-250, 40%
methanol, 7% acetic acid) for 1 h under constant shaking and then
distained ON (10% acetic acid and 10% methanol), scanned, and
quantified. The IGA of mCx-I was quantified by densitometry (HP
scanner and ImageJ) to obtain the relative areas of the peaks. The
results were expressed as the ratio of IGA/(total protein content)
measured by Lowry (not shown) or by quantifying the gel bands
after Coomassie staining (shown in results). Both procedures give
similar results. In some assays we used the mitochondrial Complex
IIII (mCx-III)(its UQCRC1 subunit or ubiquinol-cytochrome c
reductase core protein I), as an internal standard, quantified by
using Western blotting and densitometry, performed after the BN-
PAGE run, as indicated below.
Western blottingFor a more specific loading control, in some cases the BN-
PAGE proteins corresponding to the lower half of the gel (the
upper half was simultaneously used to measure the IGA as above
indicated) were transferred to PVDF (polyvinylidene difluoride)
membranes using transfer buffer without methanol (39 mM
glycine, 48 mM Tris-base, 0.037% SDS, pH 8.3), 4 h at 100 V,
constant voltage. Membranes were blocked with 5% defatted milk
in PBS and incubated with a monoclonal antibody raised against
the ubiquinol-cytochrome c reductase core protein I (UQCRC1),
a core subunit of the mitochondrial complex III (mCx-III, EC
1.10.2.2) (Santa Cruz Biotechnology, CA; sc-65238, dilution 1:700
in PBS plus Tween 20, 0.05% v/v), used as internal control for
sample loading and as a reference for mCx-I changes. After 1 h
incubation with the primary antibody, the membranes were
washed three times with PBS plus Tween 20, 0.05% v/v for
5 min. Then, the membranes were incubated for one hour with a
secondary goat IgG anti-mouse antibody (Santa Cruz Biotechnol-
ogy, sc2008, dilution 1:2500) coupled to alkaline phosphatase,
washed three times with PBS plus Tween 20 0.05% v/v for 5 min
and developed with the substrates NBT-BCIP following the
manufacturer’s instructions (Promega).
Spectrophotometric measurement of mitochondrialNADH-cytochrome c reductase (mCxI-mCxIII) activity
The mitochondria were isolated as previously described [48,49]
and were subjected to three freeze-thaw cycles to make them
permeable to substrates. To measure the activity of Complex I,
100 mg mitochondria were resuspended in buffer solution
(100 mM H2KPO4/HK2PO4, 0.5 mM KCN, 200 mM NADH,
25 mM cytocrome c, pH 7.4) and the reduction of cytocrome c was
recorded by monitoring the increase in absorbance at 550 nm
(E = 19 mM-1 cm-1), 30uC. The mCx-I activity was calculated as
nmol cytochrome c reduced/min/mg protein, and expressed in
percentage considering the activity in control cells as 100%.
Inhibition of mCxI by rotenone was measured after 5 min of pre-
incubation with the inhibitor and subtracted to the values in the
absence of rotenone incubation.
shRNAi preparation for transient transfectionTo specifically and transiently knock-down CFTR expression, we
prepared a shRNAi (short hairpin RNA interference) by inserting
into a pSilencer 1.0 U6 vector (Ambion, Austin, TX) the same
sequence previously used as an antisense oligonucleotide, which is
complementary to nucleotides 1–18 of the CFTR mRNA [17,50].
The antisense sequence and its complementary strand plus a small
connecting loop were synthesized by using an Oligo1000M DNA
synthesizer (Beckman-Coulter, Fullerton, CA). To construct the
insert, two complementary oligonucleotides containing EcoRI and
HindIII restriction sites were added at the 59and 39ends of the DNA
oligonucleotide, and also a connecting loop of sequence TTCAA-
GAGA, following the recommendations from Ambion (Oligo 1
HindIII: 59-AGCTTCATGCAGAGGTCGCCTCTGTTCAA-
GAGACAGAGGCGACC TCTGCATGTTTTTT-39; Oligo 2
EcoRI: 59-AATT AAAAAACATGCAGAGGTCGCCTCTG
TCTCTTGAACAGAGGCGACCTCTGCATG-39; the target
sequence is underlined). These oligonucleotides were then annealed
and cloned into the EcoRI and HindIII restriction sites of the
pSilencer 1.0 U6 vector. Finally, the plasmid was sequenced to
check for the proper insertion by using an institutional core
sequencing facility (at the Institute L.F. Leloir, Buenos Aires).
shRNAi transient transfectionsT84 cells cultured in DMEM/F12 medium containing 10%
FBS and maintained below 70% confluence were collected by
using 0.5% Trypsin/PBS and electroporated by using a BTX
ECM 830 square-wave electroporator (Genetronics Inc., San
Diego, CA) and electroporation cuvettes (Genetronics Inc. or Bio-
Rad Laboratories) for mammalian cells (electrode gap 0.4 cm).
The electroporation settings were ‘‘low voltage’’ mode at 140 volts
and 1 pulse of 70 ms. In order to set up the transfection
conditions, different amounts of shRNAi plasmid were used (20,
40 and 80 mg). The optimal amount of plasmid rendering
reproducible results towards mCx-I inhibition was 40 mg/46106
cells, in a final volume of 400 ml of serum-free DMEM/F12. This
amount was therefore used in subsequent experiments. In
addition, to determine the optimal culture time to inhibit mCx-I
expression, cells were cultured in serum-free DMEM/F12 for 24,
48 and 72 h after shRNAi transfection. Under these conditions,
the optimal culture time was 48 h and this time was then used for
the subsequent assays.
mCx-I Activity in CFTR Modulated Cells
PLOS ONE | www.plosone.org 3 November 2012 | Volume 7 | Issue 11 | e48059
shRNAi stable transfectionsTo specifically knock-down CFTR expression, we used four
short hairpin RNA interference (shRNAi) against four different
regions of CFTR. The knock down sequences were inserted for the
manufacturer (OriGene Technologies, Inc., Rockville, USA) as
shown below: Human U6 promoter – GATCG –29 nt sense –
TCAAGAG –29 nt reverse complement – TTTTTT -39. The
four sense sequences were pRS25: AAGAAATA
TGGAAAGTTGCAGAT GAGGTT; pRS26: AAATAT-
CATCTTTGGT GTTTCCTATGATG; pRS27: ACAACTG-
GAATCTGAAGGCAGGAGTCCAA; and pRS28:
CTTACTTTGAAACT CTGTTCCACAAAGCT. The se-
quence corresponding to pRS-shGFP was used as a control,
corresponding to a non-effective shRNA plasmid against GFP,
provided by OriGene. Caco-2 cells were cultured in DMEM/F12
medium containing 10% FBS and maintained below 70%
confluence. Then, cells were collected by trypsin (0.25% trypsin,
0.02% EDTA in PBS) treatment and electroporated using a BTX
ECM 830 square-wave electroporator (Genetronix Inc., San
Diego, CA). The electroporation was performed by using a
cuvette plus (Genetronix Inc., San Diego, CA) for mammalian
cells. Settings for electroporation were 140 volts and 1 pulse of
70 msec, using 40–100 mg of shRNAi plasmid and 46106 cells, in
a final volume of 400 ml. Transfected cells were selected in
DMEM/F12 plus 10% FBS, containing 4 mg/ml of Puromicin, for
20 days. To increase the plasmid concentration by cell, the
Puromicin was gradually incremented up to 20 mg/ml and then
returned to 5 mg/ml. Selected cells were cloned by limit dilution in
96 well plates. Then, clones with high CFTR knock-down were
selected by dot blot analysis with a monoclonal CFTR antibody
prepared in our laboratory, which has similar specificity and
sensitivity compared to the monoclonal Ab prepared by John
Riordan (unpublished results). To perform the mCx-I assay, cells
were plated at a density of 36103 cells in 150 cm2 tissue culture
dishes and grown in DMEM/F12 containing 10% FBS cand
Puromicin 1 mg/ml, at a confluence of 70–80%. Then, the cells
were cultured 24 h in serum-free medium.
CFTR transport activity in shRNAi-transfected cellsThe fluorescent probe SPQ (6-methoxy-N-[3-sulfopropyl]qui-
nolinium) was used to measure the CFTR chloride transport
activity, as SPQ fluorescence is quenched by chloride and other
halides, such as iodide and bromide. A slightly modified version of
the method described by Verkman’s laboratory [51,52] was used,
as described recently [53]. Briefly, a Hitachi’s slice holder was
adapted to form a perfusion chamber, allowing to measure CFTR
activity by using fluorescence spectrophotometry. T84 cells freshly
transfected with shRNAi and mock (control) plasmids were grown
in p60 plates (0.36104 cells/cm2) containing at least 2 rectangular
coverslips (2268 mm, from Hitachi). The coverslips were pre-
treated with a coating solution (10 mg/ml fibronectin, 4.4 mg/ml
collagen, 1.5 mg/ml BSA in DMEM/F12) for one h at 37uC and
washed with serum free medium. After transfection, the cells were
cultured for 24 or 48 h over the coverslips in DMEM-F12 serum-
free medium. The cells were then incubated ON in 5 mM SPQ
(dissolved in serum-free DMEM/F12) , washed three times with
NaI buffer (135 mM NaI, 10 mM Glucose, 1 mM CaSO4, 1 mM
MgSO4, 10 mM Hepes, 2.4 mM K2HPO4, and 0.6 mM
KH2PO4, pH 7.4 ) and maintained at 37uC for 30 min. Each
coverslip was then placed in a separated culture dish and
maintained under light-protecting conditions. For measurements,
the coverslips containing confluent monolayer cells were inserted
in a holder specially designed by Hitachi for the F2000
spectrophotometer, and immersed into a quartz cuvette containing
NaI buffer, inside the fluorescence spectrophotometer. The
coverslip holder was previously modified with a drill to allow the
insertion of two tubes of different diameter and length [53]. These
tubes, coupled to a peristaltic pump, were used to perfuse the
quartz chamber. All measurements were carried out at 37uC,
under perfusion and stirring. The selected wavelengths for SPQ
were Ex = 344 nm and Em = 443 nm. To measure the baseline
fluorescence (Fb), cells were perfused with NaI buffer for 100 s.
Then, the cells were sequentially perfused with the NaNO3 buffer
(135 mM NaNO3, 10 mM Glucose, 1 mM CaSO4, 1 mM
MgSO4, 10 mM Hepes, 2.4 mM K2HPO4, 0.6 mM KH2PO4,
pH 7.4), a cocktail containing CFTR activators (buffer NaNO3
containing 200 mM dibutyryl cAMP, 200 mM IBMX and 20 mM
isoproterenol) and the quenching buffer (5 mM valinomycin in NaI
buffer). Perfusion times were 200 s, 200 s and 100 s, respectively.
The stock solutions of valinomycin, IBMX, and dibutyryl cAMP
were prepared at 1000 X in culture-grade DMSO (Sigma-
Aldrich). Isoproterenol was dissolved in water at 1000 X
concentration. The collected data were plotted as F/Fi –1 vs time
(F: fluorescence; Fi: initial fluorescence when the NaNO3 buffer
was added). Later, F-Fq vs time (F: fluorescence; Fq: fluorescence
value obtained after quenching the SPQ fluorescence by adding
NaI plus valinomycin, at the end of SPQ fluorescence quenching)
was preferred, since the basal activity Fi was different between the
different analyzed cells whereas the background fluorescence Fq
was very reproducible. The software Origin (Originlab Corp.,
Northampton, MA) was used to integrate the area under the curve
and to obtain the slopes at initial times of stimulation.
Real-time RT-PCR (RT-PCR)To determine the levels of CFTR mRNA knock-down obtained
by shRNAi transfections, real-time PCRs (RT-PCR) were
performed and the DDCt method used for comparative quanti-
fication. Total RNA samples (4 mg) derived from Caco-2 clones
transfected with four different shRNAi specific for CFTR and one
shRNA control (shRNA for GFP) were used for reverse
transcription by using M-MLV Reverse Transcriptase (Promega)
and Oligo-dT, according to the manufacturer’s instructions
(100 U of RT/mg of RNA). Quantitative RT-PCR was carried
out using the expression of TBP as an internal control.
The primers were designed with Primer-BLAST software.
Primer sequences for CFTR were: Rv-CFTR 59-
TGGTCTGGTCCAGCTGAAAAA-39; Fw-CFTR 59-
GTAGGTCTTTGGCATTAGGAGCTT-39; and the primers
for TBP were Rv-TBP 59-C ACATCACAGCTCCCCACCA-39;
and Fw-TBP 59- TGCACAGGAGCCAAGAGTG AA-39. The
size of each amplification product and the presence of dimers were
verified by electrophoresis on a 3% agarose gel, stained with
ethidium bromide and visualized by using UV. Then, preliminary
experiments with different cDNA dilutions were performed to test
the dynamic range and efficiency of amplification for each
amplicon (TBP and CFTR). The cDNA samples (10 ml of a 1:50
cDNA dilution) were added to 15 ml of PCR reaction mixture
containing a final concentration of 2.5 mM MgCl2, 0.4 mM
deoxynucleotides triphosphates, 1 U of GoTaq DNA polymerase
(Promega), 0.1 X EvaGreen (Biotium, Hayward, CA), 50 nM
ROX (SIGMA) as passive reference dye and 0.2 nM of each
primer. qRT-PCR reactions were carried out in an Applied
Biosystems 7500 Real-Time PCR equipment. PCR conditions
were: denaturation at 94uC (5 min), and 40 cycles of 94uC (30 s),
60uC (30 s), and 72uC (30 s). qRT-PCR reactions were carried out
in technical (intraassay) and biological triplicates. The final
quantification values were obtained as the mean of the Relative
Quantification (RQ) for each biological triplicate (n = 3).
mCx-I Activity in CFTR Modulated Cells
PLOS ONE | www.plosone.org 4 November 2012 | Volume 7 | Issue 11 | e48059
StatisticsUnless otherwise indicated, all assays were performed in
triplicates, the experiments were repeated at least three times
and the results expressed as mean 6 SE (n = replicates). One-way
ANOVA and the Turkey’s test were applied to determine
significant differences among samples (a= 0.05).
Results
The mCx-I in-gel activity (IGA) of CFDE and CFDE/6RepCFTR cells
To test the hypothesis of a reduced mCx-I activity in CF cells,
mitochondrial extracts from CFDE and CFDE/6RepCFTR cells
cultured 24 h in serum-free medium, were run under Blue-Native
PAGE (BN-PAGE) to determine the IGA of mCx-I [45,46,54].
CFDE cells are tracheobronchial cells derived from a CF patient
and CFDE/6RepCFTR cells are CFDE cells ectopically express-
ing CFTR [38]. As shown in Figure 1, the IGA of mCx-I was
significantly (p,0.001) reduced in CFDE cells (47.062.1%; mean
6 SE, n = 3) as compared with the wt-CFTR-complemented
CFDE/6RepCFTR cells (104.964.9%, n = 3). As a control for
CFTR specific effects, CFDE/6RepCFTR cells were also treated
with 100 mM glibenclamide (a CFTR chloride channel inhibitor)
for 24 h, in serum-free medium. As shown in Figure 1A (IGA) and
1B (quantification), a significant (p,0.01) reduction of the IGA of
mCx-I was observed (71.363.9%, n = 3) as compared with
CFDE/6RepCFTR cells not treated with the inhibitor
(104.964.9%, n = 3). These results suggest a causal relationship
between the chloride transport activity of CFTR and the mCx-I,
and are in agreement with our previous observation showing that
the expression of MTND4 is reduced in CFDE cells [15].
The mCx-I in-gel activity (IGA) of IB3-1 and S9 cellsTo make sure that the differences in the mCx-I activity observed
between CFDE and CFDE/6RepCFTR cells did not resulted
from an artifact created by a different selection pressure (due to the
antibiotic used to select for CFDE/6RepCFTR cells, the different
passage number between the two cell lines or a randomly favored
clonal selection), we also measured the IGA of mCx-I using the cell
lines IB3-1 and S9, unrelated to CFDE cells. The IB3-1 cells were
derived from a CF patient exhibiting the most frequent CF
mutation (DF508) in one allele and a non-sense mutation
(W1282X) in the other allele [39]. S9 cells are IB3-1 cells
transduced with an adeno-associated viral vector to stably express
wt-CFTR [40]. Thus, antibiotics were not required to maintain
the expression of wt-CFTR in S9 cells. As shown in Figure 2A
(IGA) and 2B (quantification), under basal conditions, no
significant differences were observed on the IGA of mCx-I
between IB3-1 and S9 cells. However, when IB3-1 and S9 cells
were treated for 24 h with a CFTR-stimulating cocktail (200 mM
cAMP, 200 mM IBMX and 20 mM isoproterenol), a significant
(p,0.05) and reproducible difference on the IGA was observed
between IB3-1 cells (54.466.9%, mean 6 SE, n = 5) and S9 cells
(100.563.7%, n = 5). Thus, under CFTR-stimulation, the IGA of
mCx-I in IB3-1 CF cells was almost 50% lower than in wt-CFTR
complemented IB3-1 cells (S9 cell line).
The IGA of mCx-I was also measured by using the relative
UQCRC1 amounts as an internal standard (indicative of mCx-III)
(IGA of mCx-I/UQCRC1 amounts; Figure 2C and 2D), instead
of total protein load. In this case the IGA of mCx-I was also
significantly reduced in IB3-1 cells (72.2610.7%; mean 6 SE,
n = 4) compared to S9 cells (100.0610.2%, n = 4), although the
difference obtained was smaller. Taken together, these results
indicate that using either CFTR stimulation or inhibition to
modify the CFTR activity, a significant modulation of the IGA of
the mCx-I can be observed, and add further support to the results
initially obtained with CFDE cells (shown in Figure 1). The
relative specific activity (expressed as the ratio between mCx-I
IGA and the Coomassie blue staining shown in Figure 2E) is
shown in f panel 2F. In this case, no significant differences were
observed between IB3-1 (CF) and S9 (CF corrected) cells,
suggesting that the differences in mCx-I in gel activity reflect a
reduction in the amount of mCx-I rather than a difference in the
specific activity of Complex I.
In gel activity of mCx-I measured in cells expressing wt-CFTR
To add further support to the results, we next used non-CF cells,
in which the activity or expression of CFTR was modulated by
using CFTR inhibitors or shRNAs. For this purpose, T84 and
Caco-2 colon carcinoma cells were used; these cells express high
levels of CFTR [41,42,55].
As shown in Figure 3A (IGA) and 3B (quantification of 3A),
when T84 cells were cultured for 24 h in the presence of
glibenclamide (100 mM), the IGA of mCx-I was significantly
(p,0.05) reduced to 56.868.2% (mean 6 SE, n = 3) as compared
with control cells (100.160.12%, n = 3). When T84 cells were
cultured for 24 h in 5 mM CFTR(inh)-172 (a more specific and
potent CFTR inhibitor than Glibenclamide [56]) no changes were
observed in IGA of mCx-I (Figure 3A and 3B). However, as shown
in Figure 3C (IGA) and 3D (quantification of 3C), after 48 h of
incubation with CFTR(inh)-172, the IGA of mCx-I was signifi-
Figure 1. Mitochondrial complex I in-gel activity (IGA) of CFDEand CFDE/6RepCFTR cells. A: IGA of mitochondrial extracts fromCFDE (CF cells), CFDE/6RepCFTR cells (rescued cells ectopicallyexpressing wt-CFTR), and the same cells treated with glibenclamide, aCFTR chloride transport inhibitor. B: Densitometric quantification andstatistical analysis of the results shown in panel A. IGA was calculated asthe ratio (mCx-I activity)/(protein load), both expressed as arbitraryunits. The average activity of the mCx-I in CFDE/6RepCFTR cells wasconsidered 100%. Measurements were performed in duplicate and dataare expressed as mean 6 SE of three independent experiments (n = 3).** indicates p,0.01 and *** indicates p,0.001, referred to CFDE/6RepCFTR cells.doi:10.1371/journal.pone.0048059.g001
mCx-I Activity in CFTR Modulated Cells
PLOS ONE | www.plosone.org 5 November 2012 | Volume 7 | Issue 11 | e48059
cantly (p,0.05) reduced (64.464.1%, n = 3) compared to control
T84 cells (100.060.06%, n = 3). The IGA corresponding to the
glibenclamide treatment for 48 hours shown a significant reduc-
tion (Figure 3C and 3D); however, under these incubation
conditions (100 mM glibenclamide for 48 hours) this inhibitor
was probably toxic for these cells since the cells started to detach
and the medium became acid.
To assure that these results were not limited to T84 cells, we
then treated Caco-2 cells with 5 mM CFTR(inh)-172. In addition,
to diminish the possibility of a nonspecific effect of CFTR(inh)-
172, an additional CFTR inhibitor was now used, GlyH101, at
5 mM for 48 h. The GlyH101 inhibitor has a better solubility in
water compared with CFTR(inh)-172 [57]. As shown in Figure 3E
(IGA) and 3F (quantification of 3E), the IGA of mCx-I (IGA of
mCx-I/UQCRC1 amounts) was significantly (p,0.05) reduced in
Caco-2 cells treated with CFTR(inh)-172 (41.768.6%; mean 6
SE, n = 3) or treated with GlyH101 (61.9611.0%, n = 3)
compared to control cells (100.0620.9%, n = 3).
Transient shRNAi-mediated knock down of CFTRexpression in T84 cells
To reduce the possibility that the results obtained after treating
cells with glibenclamide, CFTR(inh)-172 or GlyH101 resulted
from nonspecific effects of these drugs [58], shRNAi was used to
knock-down the CFTR expression in T84 cells (CFTR-shRNAi).
SPQ fluorescence was used to verify that the CFTR chloride
channel activity was in fact reduced in the shRNAi-transfected
cells (Figure 4A). The Figure 4A shows that the CFTR activity was
reduced in cells transfected with shRNAi for CFTR (shRNAi-
CFTR) as compared to cells transfected whit empty plasmid, 24 h
and 48 h post electroporation. In Figure 4B, the changes in the
CFTR activity observed in Figure 4A were represented as the
areas under the curves (numerical integration). As shown in
Figure 4B, 24 h after shRNAi transfection, a significant (p,0.05)
reduction in the CFTR chloride transport activity was observed in
T84 cells (38.660.2 a.u., mean 6 SE, n = 2)(a.u. or A.U.: arbitrary
units), as compared with mock-transfected cells (transfected with
empty plasmid) (6561.1 a.u., n = 2). This inhibition was slightly
more pronounced 48 h after transfection (35.561.9 a.u., n = 2);
therefore, all subsequent experiments were performed 48 h after
transfection. The Figure 4C shows the IGA of mCx-I after
transfecting T84 cells with 40 mg of CFTR-shRNAi plasmid, 48 h
post-electroporation. The IGA of mCx-I in shRNAi-transfected
cells was significantly (p,0.05) lower (57.069.5%, mean 6 SE,
n = 4) than in mock-transfected cells (100.061.6%, n = 4). The
shRNAi effects are in agreement with the results obtained after
glibenclamide, CFTR(inh)-172 or GlyH101 treatments, and
further support the idea that the CFTR activity modulates the
mCx-I activity.
Figure 2. Mitochondrial complex I in-gel activity (IGA) of IB3-1and S9 cells. A: IGA of mitochondrial extracts from Control and CFTR-stimulated IB3-1 and S9 cells (IBMX-isop-cAMP), adding 200 mM cAMP,10 mM isoproterenol, 200 mM IBMX, for 24 h. B: Densitometricquantification and statistical analysis of the results shown in panel A.IGA was calculated as indicated in Figure 1. Measurements wereperformed in duplicate and data are expressed as mean 6 SE of fiveindependent experiments (n = 5). * indicates p,0.05, as compared withS9 stimulated cells. C: IGA of mCx-I and mCx-III (UQCRC1) expressionmeasured by using Western blots from S9 and IB3-1 cells (both afterCFTR stimulation). D: Densitometric quantification and statistical
analysis of the results shown in panel C. IGA of mCx-I was calculatedas the ratio mCx-I IGA/UQCRC1. Measurements were performed induplicate and data are expressed as mean 6 SE of two independentexperiments (n = 2). * indicates p,0.05, as compared with S9 stimulatedcells. E: IGA of the mCx-I and Coomassie blue stain from a BN-PAGEusing mitochondrial extracts from S9 and IB3-1 cells. F: Specific activityof the results shown in panel E, calculated as the ratio mCx-I IGA/mCx-Icoomassie blue stain. The mCx-I specific activity is expressed in arbitraryunits (a.u.) as mean 6 SE (n = 3). The specific activity of CF cells (IB3-1)and CF corrected cells (S9) showed similar values, without significantdifferences (p.0.05).doi:10.1371/journal.pone.0048059.g002
mCx-I Activity in CFTR Modulated Cells
PLOS ONE | www.plosone.org 6 November 2012 | Volume 7 | Issue 11 | e48059
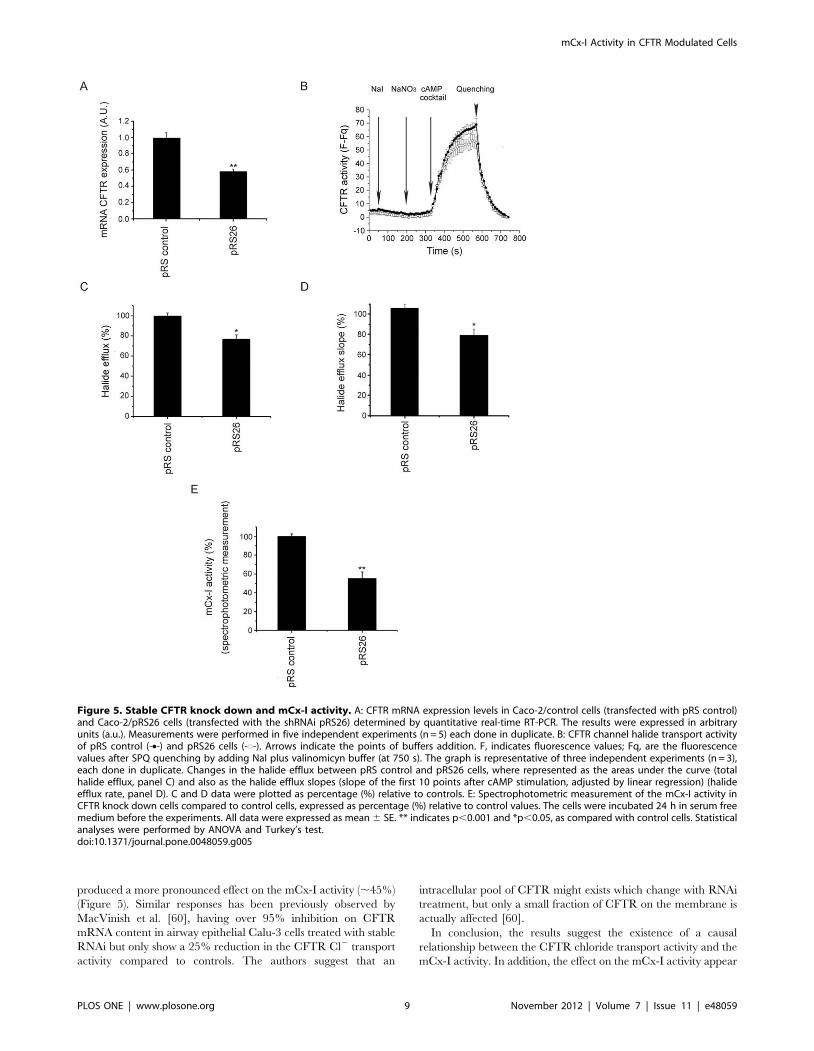
Stable shRNAi-mediated knock down of CFTR expressionin Caco-2 cells
The results obtained by using transient transfection of shRNAi
for CFTR were in agreement with the mCx-I decrease observed
previously. However, the transient transfections were difficult to
reproduce due to low transfection efficiencies. To overcome this
problem, Caco-2 cells were transfected with 4 commercial shRNAi
plasmids directed against CFTR and selected by using Puromi-
cine. Four commercial plasmids against different regions of CFTR
mRNA (named pRS25, pRS26, pRS27 and pRS28) and a control
plasmid (named pRS control) were used. The cell line with better
CFTR knock down (Caco-2/pRS26 cells) was selected to perform
the mCx-I analysis. The CFTR mRNA expression was analyzed
by qRT-PCR, and, as shown in Figure 5A, Caco-2/pRS26 cells
shows a highly significant (p,0.001) decrease in the CFTR levels
(0.5860.03 a.u.; mean 6 SE; n = 10) compared to control cells
(0.9960.06a.u., n = 10). To corroborate the CFTR knock down in
these cells, the activity of CFTR was measured by using the
chloride sensitive probe SPQ (Figure 5B). As shown in Figure 5C,
the halide efflux (area under the curves) was significant (p,0.05)
reduced in Caco-2/pRS26 cells (7763.99%; mean 6 SE; n = 6)
compared to control cells (10062.9%; n = 6). Similar results were
obtained for the halide efflux slopes using the first 10 points after
the CFTR stimulation and adjusted by linear regression
(Figure 5D), which also reflect a lower CFTR concentration in
Caco-2/pRS26 cells than in control cells. Finally, the Figure 5E,
shows the spectrophotometric analysis of the mCx-I/mCx-III
activity for the CFTR knock down cell lines. A highly significant
(p,0.001) reduction was observed (55.366.7%; mean 6 SE;
n = 5) as compared to controls (10062.5%; n = 5). These
spectrophotometric measurements are in agreement with the
IGA results.
While this work was in progress, Kelly-Aubert et al, studying
the effects of a glutathione analog (GSH monoethyl ester), also
found a reduced mCx-I activity in CF cells and KO mice [59], in
agreement with our previous findings regarding a reduced CISD1
[14] and MTND4 [15] expression in CF cells, which prompted us
to think again over the mitochondrial hypothesis of Shapiro and
Figure 3. Mitochondrial complex I in-gel activity (IGA) measured in cells expressing wt-CFTR. A: IGA of mitochondrial extracts from T84cells after 24 h of treatment with 100 mM glibenclamide or 5 mM CFTR(inh)-172. B: Densitometric quantification of the results shown in panel A,expressed as % ratio of (mCx-I activity)/(protein load). C: IGA of mitochondrial extracts from T84 cells after 48 h of treatment with 100 mMglibenclamide or 5 mM CFTR(inh)-172. D: Densitometric queantification of C. E: IGA of the mCx-I from Caco-2 cells after 48 h of treatment with 5 mMGlyH101 or 5 mM CFTR(inh)-172, and WB of the mCx-III subunit UQCRC1, as internal standard. F: Densitometric quantification of the results shown in Eexpressed as % ratio of (mCx-I IGA)/UQCRC1(a.u.). The activity of mCx-I in T84 and Caco-2 cells treated with the same amount of DMSO (0.1%) wasconsidered as 100%. Measurements in T84 cells were performed in duplicate and data are expressed as mean 6 SE of three independent experiments(n = 3). Caco-2 cells results were obtained in triplicate and expressed as mean 6 SE of three independent experiments (n = 3). * indicates p,0.05, ascompared with control cells (ANOVA and Turkey’s test).doi:10.1371/journal.pone.0048059.g003
mCx-I Activity in CFTR Modulated Cells
PLOS ONE | www.plosone.org 7 November 2012 | Volume 7 | Issue 11 | e48059
colleagues [10,11,12,34,35,36,37]. However, contrary to Kelly-
Aubert, which found similar amounts of total mCx-I and therefore
increased specific activity of mCx-I in normal cells (or reduced in
CF cells), we found a similar specific activity in both cases, as
shown in Figure 2 E and 2F and a reduced mCx-I amount.
Discussion
The results shown here suggest that the mitochondrial Complex
I activity is positively modulated by the chloride transport activity
of CFTR (or negatively regulated under inhibition of CFTR
activity or expression). This regulation was observed using
different cellular models, including cells from CF or non-CF
origin. A significant reduction in the in-gel activity (IGA) of mCx-I
(near 50%) was observed in CFDE cells (CF-derived cells) as
compared with CFDE/6RepCFTR (wt-CFTR complemented
cells). This effect was reverted in CFTR complemented cells
treated with the CFTR inhibitor glibenclamide. The inhibitory
effect of glibenclamide over the mCx-I activity suggests that the
differences observed between CFDE and complemented CFDE
cells are not just a simple correlation resulting from some
epiphenomena caused by unspecific clonal selection, antibiotic
treatment, differences in growth speed, or some other unknown
effects. Thus, the reduction in the mCx-I activity under CFTR
inhibition suggests that a causal relationship exists between the
chloride transport activity of CFTR and the IGA of mCx-I.
A similar effect (reduced IGA in CF cells) was observed using
IB3-1 and S9 cells (the last are wt-CFTR complemented IB3-1
cells), even though CFTR-stimulation instead of its pharmacolog-
ical inhibition was used in this case, effects corresponding to
different molecular mechanisms (PKA phosphorylation of the
CFTR domain R vs. blocking of the channel transport activity).
The hypothesis that CFTR activity or expression can modulate the
mCx-I activity was further supported using cells that naturally
express wt-CFTR (T84 and Caco-2 cells). In these cells, the CFTR
activity was inhibited by incubation with glibenclamide,
CFTR(inh)-172, GlyH101 or through transfection with a shRNAi,
obtaining similar results in each case. Thus, the observed effects on
the mCx-I activity cannot be attributed to nonspecific effects of the
pharmacological inhibitors used, since similar effects were
obtained by using shRNAi, which is using yet another mechanism
(RNA degradation vs. chloride transport inhibition or activation).
Noteworthy, the inhibition of the Cl2 transport activity was less
pronounced that the inhibition of the mRNA levels in shRNAi
treated cells (Figure 5). Also, a relatively small inhibition in the
CFTR chloride transport activity on shRNAi cells (,23%)
Figure 4. Effects of CFTR-shRNAi in T84 cells on the mitochon-drial complex I in-gel activity (IGA). The figure shows the CFTRchannel transport activity of T84 cells transiently transfected with ashRNAi plasmid against CFTR and its effects on the IGA of mCx-I. A: T84cells were transfected with empty plasmids (as control, mock-transfected cells) and shRNAi plasmids, to transiently knock downCFTR. Transfected cells were loaded overnight with 5 mM SPQ (Cl2
fluorescent probe) to measure CFTR chloride transport activity. TheCFTR activity was measured 24 h (shRNAi: -#-, mock: -N-) and 48 h(shRNAi: -D-, mock: -m-) post electroporation. NaI, indicates perfusionwith buffer NaI to quench the SPQ fluorescence at the beginning of theexperiment. NaNO3, indicates the addition of the NaNO3 buffer tomeasure the basal activity of the CFTR. cAMP, indicates stimulation ofthe CFTR activity by adding 200 mM cAMP, 10 mM isoproterenol,
200 mM IBMX in NaNO3 buffer. NaI plus Valinomicyn, indicates theaddition of quenching buffer. F, indicates fluorescence values; Fi, areinitial fluorescence values just before adding the NaNO3 buffer. B: Toanalyze the CFTR activity changes observed in panel A, the halide effluxwas expressed as the area under the curve (integration), expressed asarbitrary units (a.u.). Mock: T84 cells transfected with the empty plasmidas control; shRNAi: T84 cells transfected with the shRNAi plasmid, (24 hand 48 h post transfection). Data are expressed as mean 6 SE of twoindependent experiments (n = 2). * indicates p,0.05 as compared withmock-transfected cells. C: IGA of the mCx-I from mitochondrial extractscorresponding to T84 cells transfected with CFTR-specific shRNAi orempty pSilencer plasmids (Mock). Measurement was performed 48 hpost transfection. D: Densitometric quantification and statistical analysisof the results shown in panel C indicated as the ratio (mCx-I activity)/(protein load). Measurements were performed in duplicate and data areexpressed as mean 6 SE of four independent experiments (n = 4).* indicates p,0.05, as compared with mock-transfected cells (ANOVAand Turkey’s test).doi:10.1371/journal.pone.0048059.g004
mCx-I Activity in CFTR Modulated Cells
PLOS ONE | www.plosone.org 8 November 2012 | Volume 7 | Issue 11 | e48059
produced a more pronounced effect on the mCx-I activity (,45%)
(Figure 5). Similar responses has been previously observed by
MacVinish et al. [60], having over 95% inhibition on CFTR
mRNA content in airway epithelial Calu-3 cells treated with stable
RNAi but only show a 25% reduction in the CFTR Cl2 transport
activity compared to controls. The authors suggest that an
intracellular pool of CFTR might exists which change with RNAi
treatment, but only a small fraction of CFTR on the membrane is
actually affected [60].
In conclusion, the results suggest the existence of a causal
relationship between the CFTR chloride transport activity and the
mCx-I activity. In addition, the effect on the mCx-I activity appear
Figure 5. Stable CFTR knock down and mCx-I activity. A: CFTR mRNA expression levels in Caco-2/control cells (transfected with pRS control)and Caco-2/pRS26 cells (transfected with the shRNAi pRS26) determined by quantitative real-time RT-PCR. The results were expressed in arbitraryunits (a.u.). Measurements were performed in five independent experiments (n = 5) each done in duplicate. B: CFTR channel halide transport activityof pRS control (-N-) and pRS26 cells (-#-). Arrows indicate the points of buffers addition. F, indicates fluorescence values; Fq, are the fluorescencevalues after SPQ quenching by adding NaI plus valinomicyn buffer (at 750 s). The graph is representative of three independent experiments (n = 3),each done in duplicate. Changes in the halide efflux between pRS control and pRS26 cells, where represented as the areas under the curve (totalhalide efflux, panel C) and also as the halide efflux slopes (slope of the first 10 points after cAMP stimulation, adjusted by linear regression) (halideefflux rate, panel D). C and D data were plotted as percentage (%) relative to controls. E: Spectrophotometric measurement of the mCx-I activity inCFTR knock down cells compared to control cells, expressed as percentage (%) relative to control values. The cells were incubated 24 h in serum freemedium before the experiments. All data were expressed as mean 6 SE. ** indicates p,0.001 and *p,0.05, as compared with control cells. Statisticalanalyses were performed by ANOVA and Turkey’s test.doi:10.1371/journal.pone.0048059.g005
mCx-I Activity in CFTR Modulated Cells
PLOS ONE | www.plosone.org 9 November 2012 | Volume 7 | Issue 11 | e48059
to be dependent on the CFTR chloride transport activity and not
only due to the presence/absence of the CFTR in the cell
membrane, as reported for the expression of the chemokine
RANTES [61], which responds to the presence of the CFTR in
the cell membrane, being insensitive to pharmacological inhibitors
of CFTR.
In a previous work, we have shown that the expression of the
MTND4 gene was reduced by approximately 40% in CF cells or in
CFTR-corrected cells treated with CFTR inhibitors (glibencla-
mide and CFTR(inh)-172), after 24 h of incubation [15]. Here, we
show that a similar reduction is observed in the IGA of mCx-I,
although the reduction was observed 48 h after treatment with the
CFTR inhibitors (CFTR(inh)-172 or GlyH101). Since the
reduction of MTND4 expression could be seen earlier than the
reduction of the mCx-I IGA (24 h instead of 48 h), the results are
also in agreement with the fact that MTND4 is essential for the
assembly and activity of mCx-I [29] and suggest a down-stream
position of the mCx-I activity compared to the MTND4
expression.
Further studies are required to elucidate the mechanism(s) by
which CFTR modulate the activity and expression of CFTR-
dependent genes such as c-Src and MUC1 [17], CISD1 [14],
MTND4 [15] and now, the mCx-I activity. CFTR-dependent
genes and the possible CFTR-signaling effectors are of most
interest, since these molecules and their pathways might be
potential targets for CF therapy. So far we only know that c-Src is
increased in CF and appears to be a bridge between the CFTR
channel activity and MUC1 expression [17], and that RANTES
expression might be modulated trough interactions involving PDZ
binding domains and EBP50 related interactions [61].
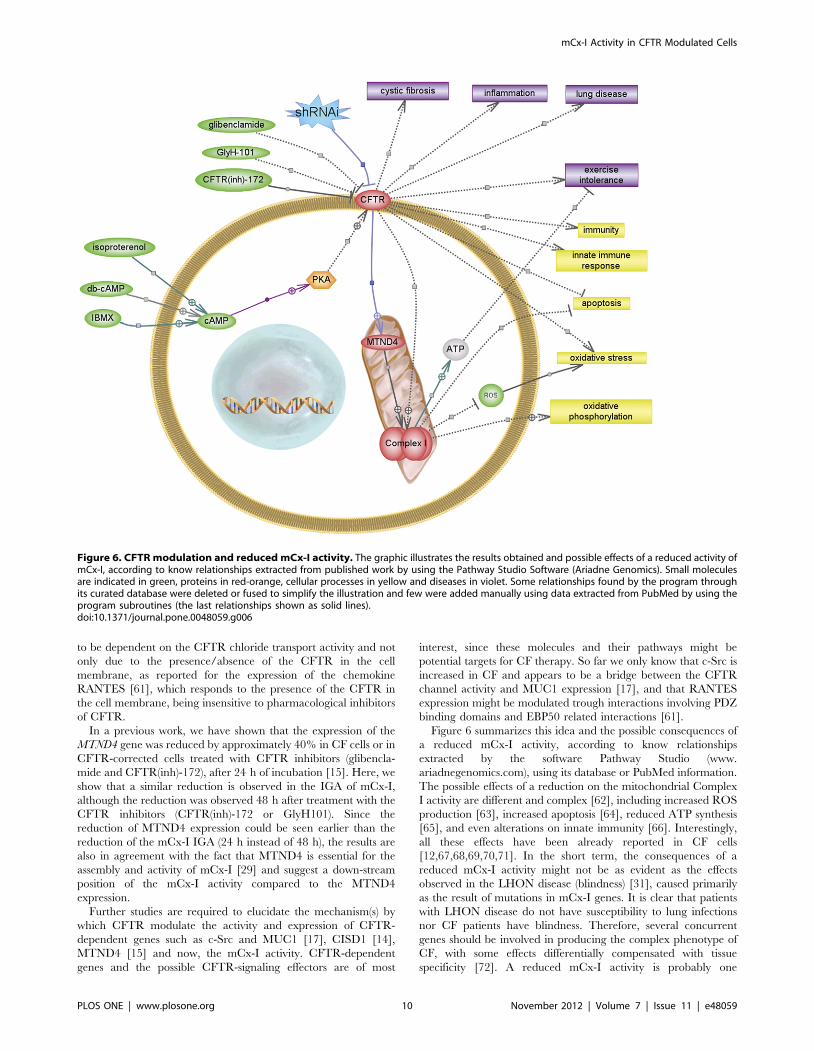
Figure 6 summarizes this idea and the possible consequences of
a reduced mCx-I activity, according to know relationships
extracted by the software Pathway Studio (www.
ariadnegenomics.com), using its database or PubMed information.
The possible effects of a reduction on the mitochondrial Complex
I activity are different and complex [62], including increased ROS
production [63], increased apoptosis [64], reduced ATP synthesis
[65], and even alterations on innate immunity [66]. Interestingly,
all these effects have been already reported in CF cells
[12,67,68,69,70,71]. In the short term, the consequences of a
reduced mCx-I activity might not be as evident as the effects
observed in the LHON disease (blindness) [31], caused primarily
as the result of mutations in mCx-I genes. It is clear that patients
with LHON disease do not have susceptibility to lung infections
nor CF patients have blindness. Therefore, several concurrent
genes should be involved in producing the complex phenotype of
CF, with some effects differentially compensated with tissue
specificity [72]. A reduced mCx-I activity is probably one
Figure 6. CFTR modulation and reduced mCx-I activity. The graphic illustrates the results obtained and possible effects of a reduced activity ofmCx-I, according to know relationships extracted from published work by using the Pathway Studio Software (Ariadne Genomics). Small moleculesare indicated in green, proteins in red-orange, cellular processes in yellow and diseases in violet. Some relationships found by the program throughits curated database were deleted or fused to simplify the illustration and few were added manually using data extracted from PubMed by using theprogram subroutines (the last relationships shown as solid lines).doi:10.1371/journal.pone.0048059.g006
mCx-I Activity in CFTR Modulated Cells
PLOS ONE | www.plosone.org 10 November 2012 | Volume 7 | Issue 11 | e48059
additional factor contributing to the complexity of the CF
phenotype, although it might be relevant to explain some of the
above mentioned mitochondrial defects observed in CF, perhaps
including an increased susceptibility to infections [73,74].
Acknowledgments
Preliminary results of this work were published by AGV as his PhD Thesis:
[Modulacion de la expresion del gen MTND4 mitocondrial mediada por la
actividad del CFTR]. University of Buenos Aires, 2009.
Author Contributions
Conceived and designed the experiments: AGV TASC. Performed the
experiments: AGV MCM GLT MC MMMC FS GS MLT. Analyzed the
data: AGV MCM GLT MC MMMC FS GS MLT TASC. Contributed
reagents/materials/analysis tools: TASC. Wrote the paper: AGV TASC.
References
1. Riordan JR, Rommens JM, Kerem B, Alon N, Rozmahel R, et al. (1989)
Identification of the cystic fibrosis gene: cloning and characterization of
complementary DNA. Science 245: 1066–1073.
2. Rommens JM, Iannuzzi MC, Kerem B, Drumm ML, Melmer G, et al. (1989)
Identification of the cystic fibrosis gene: chromosome walking and jumping.
Science 245: 1059–1065.
3. Rich DP, Anderson MP, Gregory RJ, Cheng SH, Paul S, et al. (1990)
Expression of cystic fibrosis transmembrane conductance regulator corrects
defective chloride channel regulation in cystic fibrosis airway epithelial cells.
Nature 347: 358–363.
4. Welsh MJ, Anderson MP, Rich DP, Berger HA, Denning GM, et al. (1992)
Cystic fibrosis transmembrane conductance regulator: a chloride channel with
novel regulation. Neuron 8: 821–829.
5. Consortium TCFGA (1994) Population variation of common cystic fibrosis
mutations. Hum Mutat 4: 167–177.
6. Cheng SH, Gregory RJ, Marshall J, Paul S, Souza DW, et al. (1990) Defective
intracellular transport and processing of CFTR is the molecular basis of most
cystic fibrosis. Cell 63: 827–834.
7. Grove DE, Rosser MF, Watkins RL, Cyr DM (2011) Analysis of CFTR folding
and degradation in transiently transfected cells. Methods Mol Biol 741: 219–232.
8. Averna M, Stifanese R, Grosso R, Pedrazzi M, De Tullio R, et al. (2011)
Calpain digestion and HSP90-based chaperone protection modulate the level of
plasma membrane F508del-CFTR. Biochim Biophys Acta 1813: 50–59.
9. Averna M, Stifanese R, Grosso R, Pedrazzi M, De Tullio R, et al. (2010) Role of
calpain in the regulation of CFTR (cystic fibrosis transmembrane conductance
regulator) turnover. Biochem J 430: 255–263.
10. Shapiro BL, Feigal RJ, Lam LF (1979) Mitrochondrial NADH dehydrogenase in
cystic fibrosis. Proc Natl Acad Sci U S A 76: 2979–2983.
11. Shapiro BL, Lam LF, Feigal RJ (1982) Mitochondrial NADH dehydrogenase in
cystic fibrosis: enzyme kinetics in cultured fibroblasts. Am J Hum Genet 34: 846–
852.
12. Feigal RJ, Tomczyk MS, Shapiro BL (1982) The calcium abnormality in cystic
fibrosis mitochondria: relative role of respiration and ATP hydrolysis. Life Sci
30: 93–98.
13. Antigny F, Girardin N, Raveau D, Frieden M, Becq F, et al. (2009) Dysfunction
of mitochondria Ca2+ uptake in cystic fibrosis airway epithelial cells.
Mitochondrion 9: 232–241.
14. Taminelli GL, Sotomayor V, Valdivieso AG, Teiber ML, Marin MC, et al.
(2008) CISD1 codifies a mitochondrial protein upregulated by the CFTR
channel. Biochem Biophys Res Commun 365: 856–862.
15. Valdivieso AG, Marcucci F, Taminelli G, Guerrico AG, Alvarez S, et al. (2007)
The expression of the mitochondrial gene MT-ND4 is downregulated in cystic
fibrosis. Biochem Biophys Res Commun 356: 805–809.
16. Velsor LW, Kariya C, Kachadourian R, Day BJ (2006) Mitochondrial oxidative
stress in the lungs of cystic fibrosis transmembrane conductance regulator
protein mutant mice. Am J Respir Cell Mol Biol 35: 579–586.
17. Gonzalez-Guerrico AM, Cafferata EG, Radrizzani M, Marcucci F, Gruenert D,
et al. (2002) Tyrosine kinase c-Src constitutes a bridge between cystic fibrosis
transmembrane regulator channel failure and MUC1 overexpression in cystic
fibrosis. J Biol Chem 277: 17239–17247.
18. Colca JR, McDonald WG, Waldon DJ, Leone JW, Lull JM, et al. (2004)
Identification of a novel mitochondrial protein (‘‘mitoNEET’’ cross-linked
specifically by a thiazolidinedione photoprobe. Am J Physiol Endocrinol Metab
286: E252–260.
19. Bieganski RM, Yarmush ML (2011) Novel ligands that target the mitochondrial
membrane protein mitoNEET. J Mol Graph Model 29: 965–973.
20. Baxter EL, Jennings PA, Onuchic JN (2011) Interdomain communication
revealed in the diabetes drug target mitoNEET. Proc Natl Acad Sci U S A 108:
5266–5271.
21. Zhou T, Lin J, Feng Y, Wang J (2010) Binding of reduced nicotinamide adenine
dinucleotide phosphate destabilizes the iron-sulfur clusters of human mitoNEET.
Biochemistry 49: 9604–9612.
22. Kaundal RK, Sharma SS (2010) Peroxisome proliferator-activated receptor
gamma agonists as neuroprotective agents. Drug News Perspect 23: 241–256.
23. Bak DW, Zuris JA, Paddock ML, Jennings PA, Elliott SJ (2009) Redox
characterization of the FeS protein MitoNEET and impact of thiazolidinedione
drug binding. Biochemistry 48: 10193–10195.
24. Conlan AR, Paddock ML, Axelrod HL, Cohen AE, Abresch EC, et al. (2009)
The novel 2Fe-2S outer mitochondrial protein mitoNEET displays conforma-
tional flexibility in its N-terminal cytoplasmic tethering domain. Acta Crystallogr
Sect F Struct Biol Cryst Commun 65: 654–659.
25. Wiley SE, Rardin MJ, Dixon JE (2009) Chapter 13 Localization and function of
the 2Fe-2S outer mitochondrial membrane protein mitoNEET. Methods
Enzymol 456: 233–246.
26. Zuris JA, Harir Y, Conlan AR, Shvartsman M, Michaeli D, et al. (2011) Facile
transfer of [2Fe-2S] clusters from the diabetes drug target mitoNEET to an apo-
acceptor protein. Proc Natl Acad Sci U S A.
27. Hatefi Y (1985) The mitochondrial electron transport and oxidative phosphor-
ylation system. Annu Rev Biochem 54: 1015–1069.
28. Smeitink JA, van den Heuvel LW, Koopman WJ, Nijtmans LG, Ugalde C, et al.
(2004) Cell biological consequences of mitochondrial NADH: ubiquinone
oxidoreductase deficiency. Curr Neurovasc Res 1: 29–40.
29. Bourges I, Ramus C, Mousson de Camaret B, Beugnot R, Remacle C, et al.
(2004) Structural organization of mitochondrial human complex I: role of the
ND4 and ND5 mitochondria-encoded subunits and interaction with prohibitin.
Biochem J 383: 491–499.
30. Hofhaus G, Attardi G (1993) Lack of assembly of mitochondrial DNA-encoded
subunits of respiratory NADH dehydrogenase and loss of enzyme activity in a
human cell mutant lacking the mitochondrial ND4 gene product. Embo J 12:
3043–3048.
31. Degli Esposti M, Carelli V, Ghelli A, Ratta M, Crimi M, et al. (1994) Functional
alterations of the mitochondrially encoded ND4 subunit associated with Leber’s
hereditary optic neuropathy. FEBS Lett 352: 375–379.
32. Lodi R, Montagna P, Cortelli P, Iotti S, Cevoli S, et al. (2000) ‘econdary’4216/
ND1 and 13708/ND5 Leber’s hereditary optic neuropathy mitochondrial DNA
mutations do not further impair in vivo mitochondrial oxidative metabolism
when associated with the 11778/ND4 mitochondrial DNA mutation. Brain 123
(Pt 9): 1896–1902.
33. Majander A, Huoponen K, Savontaus ML, Nikoskelainen E, Wikstrom M
(1991) Electron transfer properties of NADH:ubiquinone reductase in the ND1/
3460 and the ND4/11778 mutations of the Leber hereditary optic neuroretino-
pathy (LHON). FEBS Lett 292: 289–292.
34. Shapiro BL (1989) Evidence for a mitochondrial lesion in cystic fibrosis. Life Sci
44: 1327–1334.
35. Shapiro BL (1988) Mitochondrial dysfunction, energy expenditure, and cystic
fibrosis. Lancet 2: 289.
36. Feigal RJ, Shapiro BL (1986) Cystic fibrosis–a lethal exocrinopathy with altered
mitochondrial calcium metabolism. Ann N Y Acad Sci 488: 82–98.
37. Feigal RJ, Shapiro BL (1979) Mitochondrial calcium uptake and oxygen
consumption in cystic fibrosis. Nature 278: 276–277.
38. Lei DC, Kunzelmann K, Koslowsky T, Yezzi MJ, Escobar LC, et al. (1996)
Episomal expression of wild-type CFTR corrects cAMP-dependent chloride
transport in respiratory epithelial cells. Gene Ther 3: 427–436.
39. Zeitlin PL, Lu L, Rhim J, Cutting G, Stetten G, et al. (1991) A cystic fibrosis
bronchial epithelial cell line: immortalization by adeno-12-SV40 infection.
Am J Respir Cell Mol Biol 4: 313–319.
40. Egan M, Flotte T, Afione S, Solow R, Zeitlin PL, et al. (1992) Defective
regulation of outwardly rectifying Cl- channels by protein kinase A corrected by
insertion of CFTR. Nature 358: 581–584.
41. Cafferata EG, Gonzalez-Guerrico AM, Giordano L, Pivetta OH, Santa-Coloma
TA (2000) Interleukin-1beta regulates CFTR expression in human intestinal
T84 cells. Biochim Biophys Acta 1500: 241–248.
42. Gregory RJ, Cheng SH, Rich DP, Marshall J, Paul S, et al. (1990) Expression
and characterization of the cystic fibrosis transmembrane conductance regulator.
Nature 347: 382–386.
43. Strong TV, Boehm K, Collins FS (1994) Localization of cystic fibrosis
transmembrane conductance regulator mRNA in the human gastrointestinal
tract by in situ hybridization. J Clin Invest 93: 347–354.
44. Lowry OH, Rosebroug NJ, Farr AL, Randall RJ (1951) Protein measurement
with the Folin phenol reagent. JBiolChem 193: 265–275.
45. Schagger H, von Jagow G (1991) Blue native electrophoresis for isolation of
membrane protein complexes in enzymatically active form. Anal Biochem 199:
223–231.
mCx-I Activity in CFTR Modulated Cells
PLOS ONE | www.plosone.org 11 November 2012 | Volume 7 | Issue 11 | e48059
46. Zerbetto E, Vergani L, Dabbeni-Sala F (1997) Quantification of muscle
mitochondrial oxidative phosphorylation enzymes via histochemical staining ofblue native polyacrylamide gels. Electrophoresis 18: 2059–2064.
47. Lojda Z, Gossrau R, Schiebler TH (1979) in Enzyme Histochemistry, a
Laboratory Manual. p. 256–266.48. Joshi AK, Raju N, Rajini PS (2011) Microplate-based kinetic method for assay of
mitochondrial NADH– and succinate–cytochrome c reductase activities. AnalBiochem 415: 209–211.
49. Navarro A, Bandez MJ, Gomez C, Repetto MG, Boveris A (2010) Effects of
rotenone and pyridaben on complex I electron transfer and on mitochondrialnitric oxide synthase functional activity. J Bioenerg Biomembr 42: 405–412.
50. Wagner JA, McDonald TV, Nghiem PT, Lowe AW, Schulman H, et al. (1992)Antisense oligodeoxynucleotides to the cystic fibrosis transmembrane conduc-
tance regulator inhibit cAMP-activated but not calcium-activated chloridecurrents. Proc Natl Acad Sci U S A 89: 6785–6789.
51. Tondelier D, Brouillard F, Lipecka J, Labarthe R, Bali M, et al. (1999) Aspirin
and some other nonsteroidal anti-inflammatory drugs inhibit cystic fibrosistransmembrane conductance regulator protein gene expression in T-84 cells.
Mediators Inflamm 8: 219–227.52. Verkman AS (1990) Development and biological applications of chloride-
sensitive fluorescent indicators. Am J Physiol 259: C375–388.
53. Valdivieso AG, Marın MC, Clauzure M, Santa-Coloma TA (2011) Measure-ment of CFTR activity using Fluorescence Spectrophotometry. Analytical
Biochemistry 418(2): 231–237. doi: 101016/jab201107029.54. Nijtmans LG, Henderson NS, Holt IJ (2002) Blue Native electrophoresis to study
mitochondrial and other protein complexes. Methods 26: 327–334.55. Sood R, Bear C, Auerbach W, Reyes E, Jensen T, et al. (1992) Regulation of
CFTR expression and function during differentiation of intestinal epithelial cells.
Embo J 11: 2487–2494.56. Ma T, Thiagarajah JR, Yang H, Sonawane ND, Folli C, et al. (2002)
Thiazolidinone CFTR inhibitor identified by high-throughput screening blockscholera toxin-induced intestinal fluid secretion. J Clin Invest 110: 1651–1658.
57. Muanprasat C, Sonawane ND, Salinas D, Taddei A, Galietta LJ, et al. (2004)
Discovery of glycine hydrazide pore-occluding CFTR inhibitors: mechanism,structure-activity analysis, and in vivo efficacy. J Gen Physiol 124: 125–137.
58. Kelly M, Trudel S, Brouillard F, Bouillaud F, Colas J, et al. (2010) Cystic fibrosistransmembrane regulator inhibitors CFTR(inh)-172 and GlyH-101 target
mitochondrial functions, independently of chloride channel inhibition.J Pharmacol Exp Ther 333: 60–69.
59. Kelly-Aubert M, Trudel S, Fritsch J, Nguyen-Khoa T, Baudouin-Legros M, et
al. (2011) GSH monoethyl ester rescues mitochondrial defects in cystic fibrosismodels. Hum Mol Genet 20: 2745–2759.
60. MacVinish LJ, Cope G, Ropenga A, Cuthbert AW (2007) Chloride transportingcapability of Calu-3 epithelia following persistent knockdown of the cystic
fibrosis transmembrane conductance regulator, CFTR. Br J Pharmacol 150:
1055–1065.
61. Estell K, Braunstein G, Tucker T, Varga K, Collawn JF, et al. (2003) Plasma
membrane CFTR regulates RANTES expression via its C-terminal PDZ-
interacting motif. Mol Cell Biol 23: 594–606.
62. Pitkanen S, Feigenbaum A, Laframboise R, Robinson BH (1996) NADH-
coenzyme Q reductase (complex I) deficiency: heterogeneity in phenotype and
biochemical findings. J Inherit Metab Dis 19: 675–686.
63. He Y, Leung KW, Zhang YH, Duan S, Zhong XF, et al. (2008) Mitochondrial
complex I defect induces ROS release and degeneration in trabecular meshwork
cells of POAG patients: protection by antioxidants. Invest Ophthalmol Vis Sci
49: 1447–1458.
64. Chomova M, Racay P (2010) Mitochondrial complex I in the network of known
and unknown facts. Gen Physiol Biophys 29: 3–11.
65. Wijburg FA, Feller N, de Groot CJ, Wanders RJ (1990) Menadione partially
restores NADH-oxidation and ATP-synthesis in complex I deficient fibroblasts.
Biochem Int 22: 303–309.
66. Yi JS, Holbrook BC, Michalek RD, Laniewski NG, Grayson JM (2006) Electron
transport complex I is required for CD8+ T cell function. J Immunol 177: 852–
862.
67. Luciani A, Villella VR, Esposito S, Brunetti-Pierri N, Medina D, et al. (2010)
Defective CFTR induces aggresome formation and lung inflammation in cystic
fibrosis through ROS-mediated autophagy inhibition. Nat Cell Biol 12: 863–
875.
68. l’Hoste S, Chargui A, Belfodil R, Corcelle E, Duranton C, et al. (2010) CFTR
mediates apoptotic volume decrease and cell death by controlling glutathione
efflux and ROS production in cultured mice proximal tubules. Am J Physiol
Renal Physiol 298: F435–453.
69. Hayes E, Pohl K, McElvaney NG, Reeves EP (2011) The cystic fibrosis
neutrophil: a specialized yet potentially defective cell. Arch Immunol Ther Exp
(Warsz) 59: 97–112.
70. de Meer K, Jeneson JA, Gulmans VA, van der Laag J, Berger R (1995)
Efficiency of oxidative work performance of skeletal muscle in patients with
cystic fibrosis. Thorax 50: 980–983.
71. Troosters T, Langer D, Vrijsen B, Segers J, Wouters K, et al. (2009) Skeletal
muscle weakness, exercise tolerance and physical activity in adults with cystic
fibrosis. Eur Respir J 33: 99–106.
72. Fosslien E (2001) Mitochondrial medicine–molecular pathology of defective
oxidative phosphorylation. Ann Clin Lab Sci 31: 25–67.
73. Arnoult D, Soares F, Tattoli I, Girardin SE (2011) Mitochondria in innate
immunity. EMBO Rep 12: 901–910. doi: 10.1038/embor.2011.157.
74. West AP, Shadel GS, Ghosh S (2011) Mitochondria in innate immune
responses. Nat Rev Immunol 11: 389–402.
mCx-I Activity in CFTR Modulated Cells
PLOS ONE | www.plosone.org 12 November 2012 | Volume 7 | Issue 11 | e48059
Related Documents