UNESCO EOLSS ENCYCLOPEDIA The Milky Way galaxy James Binney Physics Department Oxford University Key Words: Milky Way, galaxies Contents • Summary • Introduction • Recognition of the size of the Milky Way • The Centre • The bulge-bar History of the bulge • Globular clusters • Satellites • The disc Spiral structure Interstellar gas Moving groups, associations and star clusters The thick disc Local mass density • The dark halo Summary Our Galaxy is typical of the galaxies that dominate star formation in the present Universe. It is a barred spiral galaxy – a still-forming disc surrounds an old and barred spheroid. A massive black hole marks the centre of the Galaxy. The Sun sits far out in the disc and in visible light our view of the Galaxy is limited by interstellar dust. Consequently, the large-scale structure of the Galaxy must be inferred from observations made at infrared and radio wavelengths. The central bar and spiral structure in the stellar disc generate significant non-axisymmetric gravitational forces that make the gas disc and its embedded star formation strongly non-axisymmetric. Molecular hydrogen is more centrally concentrated than atomic hydrogen and much of it is contained in molecular clouds within which stars form. Probably all stars are formed in an association or cluster, and energy released by the more massive stars quickly disperses gas left over from their birth. This dispersal of residual gas usually leads to the dissolution of the association or cluster. The stellar disc can be decomposed to a thin disc, which comprises stars formed over most of the Galaxy’s lifetime, and a thick disc, which contains only stars formed in about the Galaxy’s first gigayear. The Galaxy has two distinct populations of globular clusters, and an attendant host of dwarf spheroidal galaxies. Both globular clusters and dwarf spheroidal galaxies give rise to tidal streams. Globular clusters appear to contain no dark matter, while dwarf spheroidal galaxies are dominated by dark matter. Stars account for more than half of the gravitational force that holds the Sun in its roughly circular orbit, but the rest is probably attributable to a roughly spherical halo made up of still undiscovered elementary particles. 1

Welcome message from author
This document is posted to help you gain knowledge. Please leave a comment to let me know what you think about it! Share it to your friends and learn new things together.
Transcript

UNESCO EOLSS ENCYCLOPEDIA
The Milky Way galaxy
James Binney
Physics Department Oxford UniversityKey Words: Milky Way, galaxies
Contents
• Summary
• Introduction
• Recognition of the size of the Milky Way
• The Centre
• The bulge-bar
History of the bulge
• Globular clusters
• Satellites
• The disc
Spiral structure
Interstellar gas
Moving groups, associations and star clusters
The thick disc
Local mass density
• The dark halo
Summary
Our Galaxy is typical of the galaxies that dominate star formation in the present Universe. It is a barredspiral galaxy – a still-forming disc surrounds an old and barred spheroid. A massive black hole marks thecentre of the Galaxy. The Sun sits far out in the disc and in visible light our view of the Galaxy is limited byinterstellar dust. Consequently, the large-scale structure of the Galaxy must be inferred from observationsmade at infrared and radio wavelengths. The central bar and spiral structure in the stellar disc generatesignificant non-axisymmetric gravitational forces that make the gas disc and its embedded star formationstrongly non-axisymmetric. Molecular hydrogen is more centrally concentrated than atomic hydrogen andmuch of it is contained in molecular clouds within which stars form. Probably all stars are formed in anassociation or cluster, and energy released by the more massive stars quickly disperses gas left over from theirbirth. This dispersal of residual gas usually leads to the dissolution of the association or cluster. The stellardisc can be decomposed to a thin disc, which comprises stars formed over most of the Galaxy’s lifetime, anda thick disc, which contains only stars formed in about the Galaxy’s first gigayear. The Galaxy has twodistinct populations of globular clusters, and an attendant host of dwarf spheroidal galaxies. Both globularclusters and dwarf spheroidal galaxies give rise to tidal streams. Globular clusters appear to contain no darkmatter, while dwarf spheroidal galaxies are dominated by dark matter. Stars account for more than half ofthe gravitational force that holds the Sun in its roughly circular orbit, but the rest is probably attributableto a roughly spherical halo made up of still undiscovered elementary particles.
1

1 Introduction
Galaxies vary enormously in size from objects that contain only 100 000 stars, to ones with hundreds ofbillions of stars. The smaller galaxies are much more numerous than the larger ones, but not by a sufficientfactor to compensate for their lower luminosities. So most of the luminosity in the Universe is contributedby galaxies that lie just below the top of the scale. The Sun lies in just such a galaxy, the Milky Way galaxy.
Galaxies can usefully be considered to be made up of two components: a spheroid and a disc (Figure 1).The spheroid is made up of stars that move around in a disorganised way, rather like a swarm of bees. Itsname derives from its only moderately non-spherical shape. The disc is a highly flattened structure in whichstars move on nearly circular orbits around the centre and never go far from the system’s equatorial plane.The morphological type of a galaxy is determined by the relative contributions of these two components tothe system’s total luminosity. Early-type galaxies are dominated by their spheroids: in the extreme case ofan elliptical galaxy casual inspection reveals only a spheroid, although very precise measurements may reveala disc deeply buried inside the spheroid. In the case of a very late-type galaxy, there may be no detectablebulge, only a disc.
Besides the relative importance of disc and bulge, early- and late-type galaxies differ in their rates of starformation and the mean age of their stars: early-type galaxies have little or no cold, dense gas from whichstars can form, so their rates of star formation are small and nearly all their stars are old. Late-type galaxiespossess cold, dense gas so they have on-going star formation and significant populations of young stars. Ineach batch of freshly formed stars, there will be both massive stars (masses up to 100 M⊙) and low-massstars (below about 2 M⊙). Massive stars are extremely luminous, blue and short-lived, while low-mass starsare long-lived, red and faint. Consequently, early-type galaxies are red and their brightness distributions aresmooth because they are generated by enormous numbers of individually faint stars. Late-type galaxies, bycontrast, are blue and their brightness distributions are patchy, because a scattering of extremely luminousstars can make a particular region much more luminous than another of equal size.
The Milky Way is a moderately late-type galaxy in which about 90% of the luminosity is contributedby the disc, while the centre of the system is dominated by a spheroid, that is often called the bulge – fromthe outside it would look something like the galaxy shown in the middle panel of Figure 1. The Sun sitsquite near the rim of the luminous part of the disc, so the Galaxy appears as a band of stars across thesky, marking directions in which we see out into the disc (Figure 2). The bulge lies in the constellationSagittarius in the southern sky.
The distance to the Galactic centre is still not precisely known, but the best available value is now 8.3kiloparsecs, roughly 25 000 light years (Gillessen et al. 2009). The disc has a mass ∼ 6 × 10¹⁰ M⊙, whilethat of the bulge is ∼ 1010 M⊙ (Launhardt et al., 2002). Studies of the Milky Way frequently make use ofGalactic coordinates, (l, b), for the celestial sphere; the latitude b is the angle between a line of sight and theGalactic plane, with positive values lying to the north of the plane. The longitude l is the angle between theprojection of the line-of-sight into the plane and the direction to the Galactic centre (Figure 3). Thus theGalactic centre has coordinates (l, b) = (0, 0).
2 Recognition of the size of the Milky Way
Since time immemorial our ancestors have been familiar with the Milky Way as a band of light that stretchesright across the sky on a dark night. Gallileo first showed that this band is constituted of myriads of faintstars, but it was less than a century ago that astronomers finally grasped that the Milky Way is a galaxy likethose that in the early 19th century had been catalogued in great numbers by the Herschels. Two problemswere responsible for the delay in recognising what the Milky Way really is: the usual difficulty of measuringastronomical distances, and a lack of awareness of the existence of an obscuring interstellar medium.
The central plane of the disc contains most of the Galaxy’s supply of cold, star-forming gas. This gas isextremely heavily polluted by ejecta from stars: if it were compressed to the density of air (i.e., by a factor∼ 1021) one could see only a few cm through it because light is absorbed by particles of dust (a better namemight be smoke) suspended in the gas. Even at the extremely low densities characteristic of interstellarspace, we can see only of order a kiloparsec through this gas, which should be compared with the 8.3 kpcto the Galactic centre. Hence at optical wavelengths we cannot see through the disc to the bulge. Thisobscuration by dust strongly influenced the growth in our understanding of the Milky Way. In the first
2
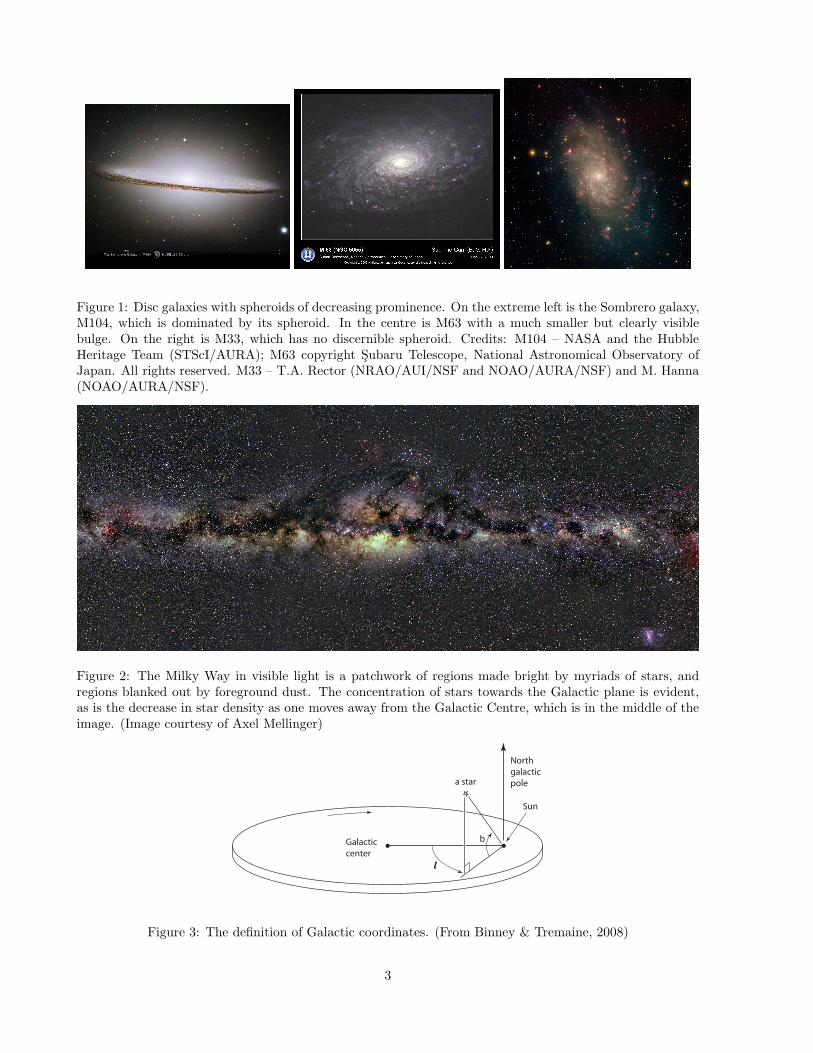
Figure 1: Disc galaxies with spheroids of decreasing prominence. On the extreme left is the Sombrero galaxy,M104, which is dominated by its spheroid. In the centre is M63 with a much smaller but clearly visiblebulge. On the right is M33, which has no discernible spheroid. Credits: M104 – NASA and the HubbleHeritage Team (STScI/AURA); M63 copyright Subaru Telescope, National Astronomical Observatory ofJapan. All rights reserved. M33 – T.A. Rector (NRAO/AUI/NSF and NOAO/AURA/NSF) and M. Hanna(NOAO/AURA/NSF).
Figure 2: The Milky Way in visible light is a patchwork of regions made bright by myriads of stars, andregions blanked out by foreground dust. The concentration of stars towards the Galactic plane is evident,as is the decrease in star density as one moves away from the Galactic Centre, which is in the middle of theimage. (Image courtesy of Axel Mellinger)
a star
North
galactic
pole
Galactic
center
b
Sun
l
Figure 3: The definition of Galactic coordinates. (From Binney & Tremaine, 2008)
3

Figure 4: The Galaxy in near-infrared light. The whole sky is shown, so what is shown at extreme rightand left is what lies behind your head as you look at the Galactic Centre, which appears in the middle ofthe image. The light comes from myriads of stars, only a few of which are resolved by the telescope intopoints of light. Credit: Two-micron Survey Infrared Processing and Analysis Center/ Caltech & Universityof Massachusetts.
decades of the 20th century, before astronomers knew of interstellar dust, it was thought that we lived nearthe centre of a disc of stars that was about 2 kpc in radius. The objects that we now know to be externalgalaxies were thought to lie within this disc, so the latter was thought to constitute the whole Universe – thisworld picture is called Kapteyn’s Universe after the Dutch astronomer who led an international effort to mapit. In the 1920s evidence for obscuration by interstellar dust mounted, and it was demonstrated that externalgalaxies lie far outside the bounds of Kapteyn’s Universe. These two advances made it natural to interpretthe Milky Way as an object similar to some external galaxies. The decisive step in this direction was takenin 1927 by another Dutch astronomer, Jan Oort, who interpreted the motions of nearby stars in terms ofdifferential rotation within a disc of stars that is ∼ 10 kpc in radius. A global view of the Galaxy was firstobtained in the 1950s following the detection of hydrogen at radio frequencies (at a wavelength of 21 cm)using technology that had been developed for radar in the Second World War: interstellar gas is almosttransparent to radio waves, so by scanning the sky with radio telescopes in the Netherlands and Australia itwas possible to study the large-scale structure of the Galactic disc. Normal stars cannot be usefully studiedat radio wavelengths, so our first clear view of the Galactic bulge came in 1991 in near-infrared data takenby the COBE/DIRBE satellite. The angular resolution of the COBE/DIRBE data was poor (∼ 0.5◦) anda much sharper image was subsequently obtained from the 2MASS infrared survey of the sky (Figure 4).In this picture one clearly sees the stellar disc and the bulge, and some dark wisps of obscuration by dust,which is very much weaker at near-infrared than at optical wavelengths, but not negligible.
3 The Centre
A black hole of mass 4.4 × 10⁶ M⊙ sits at the centre of the Milky Way (Gillessen et al. 2009). Weak radioand X-ray radiation emerges from its location, and it takes its name, Sgr A*, from the catalogue entry ofthe radio source that we now know is associated with the black hole. We know a black hole is there becausewe can study the motion of luminous stars as they orbit in its powerful gravitational field; a star called S2has now been followed through one complete orbit around Sgr A* (Figure 5). The orbit is highly eccentricand accurately fitted by a Kepler ellipse, demonstrating that it is moving in the gravitational field of pointmass.
A crucial distance from a black hole is the Schwarzschild radius, rs, interior to which light is trapped by
4

Figure 5: The orbit of S2 around the black hole that dominates the Galactic centre. The orbit has a periodof 15.2 yr and the data points cover the period 1994–2008. The orbit’s semi-major axis and eccentricity are0.119 arcsec and 0.87. The data points in the upper left part of the orbit have tiny error bars because theseare the most recent data and were obtained with the latest technology. (From Gillessen et al 2009).
the hole’s gravitational field. For Sgr A* rs = 107 km. The closest that S2 comes on its orbit is 2× 10¹⁰ km,so although at this point it is moving at 6000 km s−1, relativistic effects are not large along this orbit.
S2 is one of the most luminous stars in a star cluster that surrounds Sgr A*, and it is young. It comesas a surprise to find young stars so close to Sgr A* because theory suggests that density inhomogeneities ina protostellar cloud could not grow into stars so near to a huge point mass.
4 The bulge-bar
Moving out from Sgr A* we enter a region that is dominated by the Galaxy’s spheroid. This is stronglynon-axisymmetric; in fact, it resembles a cigar more than a saucer, so it is called the bar. The bar’s long axislies in the Galactic plane, and its nearer end is at positive longitudes (Figure 6); the angle between the longaxis and the Sun-centre line is ∼ 25◦. In the diagram stars stream clockwise around the bar, and the figureof the bar rotates in the same sense but more slowly – it completes a rotation in about 100 million years.This picture has emerged from two types of observation. On the one hand the line-of-sight velocities of gasclouds that move in the plane show unmistakable signs of moving in the bar’s rotating gravitational field(see below). On the other hand photometry of the inner galaxy shows asymmetries between the Galaxy’sleft and right sides that arise because the left-hand, nearer end of the bar subtends a bigger angle on thesky than the further, right-hand end. Moreover, individual stars in the left-hand end of the bar are closerto us and therefore brighter than corresponding stars in the right-hand end (Figure 7).
The pattern of gas density and star formation in the plane is structured by the bar’s rotating gravitationalfield. This field defines a corotation radius rcr at which a star on a circular orbit around the centre in theunderlying axisymmetric gravitational field of the Galaxy would have the same angular velocity as the longaxis of the bar: such a star would ride with the rotating gravitational field of the bar. Gas clouds that orbitjust outside rcr tend to pick up energy from the bar and be pushed outwards. On the other hand, gas cloudsare constantly colliding with one another and dissipating energy through friction, and this energy loss causes
5

Figure 6: Schematic of the Galactic bar, indicated by elliptical contours of constant density. The Sun is thestar on the right and from it two lines of sight are marked that make equal angles with the Sun-Centre line.The lower line of sight (at positive longitude l) intersects the nearer end of the bar and crosses the bar’smajor axis closer to the Centre than the line of sight at negative longitude.
Figure 7: The distributions of apparent magnitudes of stars seen in three fields. The full curve is for a fieldat l = −4.9◦, b = 3.4◦, while the dashed curve is for l = 5.5◦, b = 3.4◦. The peak of the dashed curve lies at abrighter magnitude than the peak of the dashed curve, indicating that the peak stellar density is reached atsmaller distances at positive than negative longitudes on account of the orientation of the bar with respectto the Sun-Centre line. The dotted curve is for “Baade’s window”, which lies at (l = 1◦, b = −3.9◦). (FromStanek et al. 1994)
6
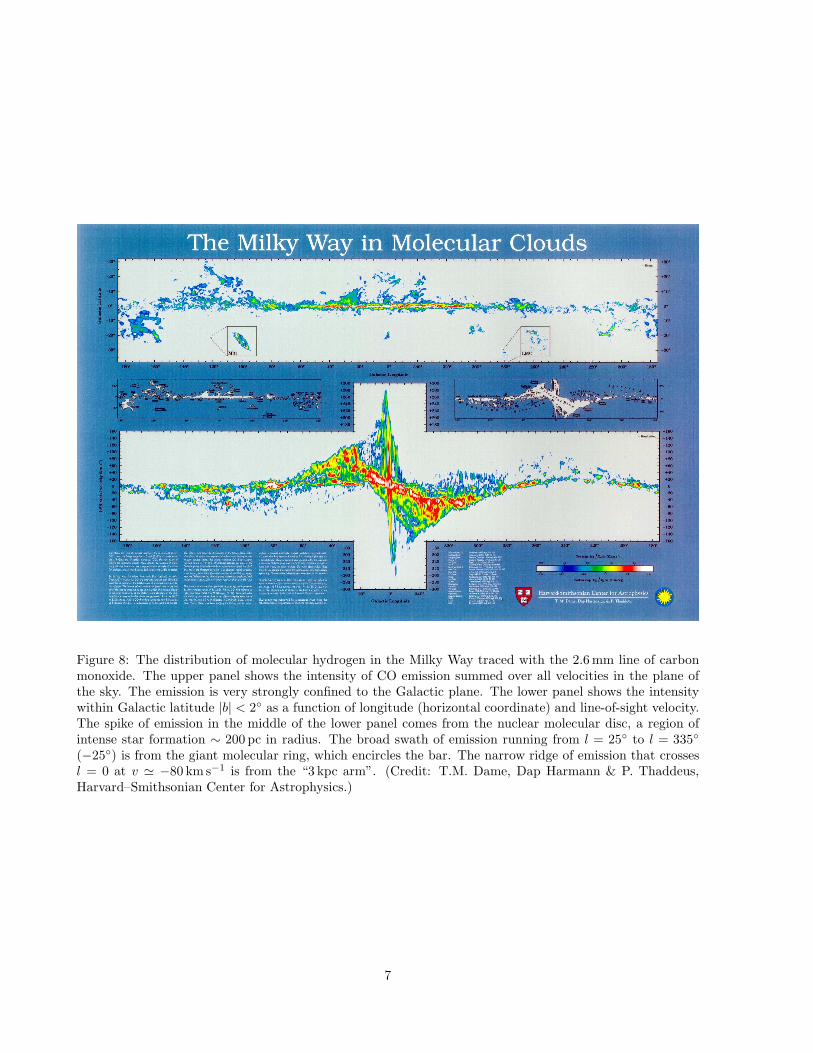
Figure 8: The distribution of molecular hydrogen in the Milky Way traced with the 2.6 mm line of carbonmonoxide. The upper panel shows the intensity of CO emission summed over all velocities in the plane ofthe sky. The emission is very strongly confined to the Galactic plane. The lower panel shows the intensitywithin Galactic latitude |b| < 2◦ as a function of longitude (horizontal coordinate) and line-of-sight velocity.The spike of emission in the middle of the lower panel comes from the nuclear molecular disc, a region ofintense star formation ∼ 200 pc in radius. The broad swath of emission running from l = 25◦ to l = 335◦
(−25◦) is from the giant molecular ring, which encircles the bar. The narrow ridge of emission that crossesl = 0 at v ≃ −80 km s−1 is from the “3 kpc arm”. (Credit: T.M. Dame, Dap Harmann & P. Thaddeus,Harvard–Smithsonian Center for Astrophysics.)
7

Figure 9: Orbits in a simple rotating bar potential. The orbits are plotted in the frame of reference thatrotates with the figure of the bar, and in this frame they are closed. Inside r ≃ 200 pc there is a family ofonly mildly elliptical orbits whose long axes are perpendicular to the bar. The gas that forms the nuclearmolecular disc moves on these orbits. The dotted line points to the location of the Sun. (From Binney &Merrifield 1998)
them to drift inwards. The outward thrust from the bar and the frictional inward drift balance just outsidercr, and gas accumulates here. This accumulation of gas near rcr is conspicuous in the lower panel of Figure8 as a band of emission that slopes from upper left to lower right at |l| < 25◦. Much of the Galaxy’s starformation takes place in this ring.
Inside rcr the bar causes gas clouds to move on orbits that are elongated with the bar and becomeincreasingly elongated as one moves inwards (Figure 9). Collisions between clouds on these orbits causesthem to move inwards rather rapidly, so the region occupied by these orbits is one of low gas density andlittle star formation (left panel of Figure 10). About 200 pc from the centre the orbits of gas clouds becomeabruptly rather circular (Figure 9) and the inward drift of clouds slows. Consequently, at r ∼ 200 pc gasbuilds up – in the lower panels of Figures 8 and 10 this region of high gas density shows up as the centralvertical spike that extends to |l| ∼ 2◦. Curiously in Figure 8 the spike is redder at upper left than lowerright, signalling that ∼ 3
4of the gas lies at l > 0. Despite this lop-sidedness (which is not understood) the
gas is thought to be organised into a mildly elliptical disc, the nuclear molecular disc.In the nuclear molecular disc stars form in abundance. Our knowledge of the resulting stellar population
is poor because it is heavily obscured at optical wavelengths, but Figure 11, which shows this region imagedin radio waves, attests to the high level of star formation by showing numbers of blisters associated withsupernova remnants, spherical cavities in the interstellar medium that have been blasted when a massivestar exploded at the end of its short life. Another noteworthy feature of Figure 11 is the bright streaks thatrun perpendicular to the plane at various points. These streaks are regions in which relativistic electronsare spiralling around magnetic field lines, and they suggest that in this region the magnetic field runsperpendicular to the plane. By contrast, near the Sun, the field runs broadly within the plane. Magneticfield lines are expected to be oriented in the direction in which gas flows, so field lines running perpendicularto the plane imply that 30 pc from the centre gas is flowing away from the plane. Figure 12 confirms thisinference by showing as a grayscale the intensity of emission at 8 µm by warm dust and as contours theintensity of radio emission at 3 cm in a region 1.5◦ (220 pc) square around the centre. In the north thecontours bulge outwards between l ∼ 0.3◦ on the left and l = −0.7◦ on the right. This is emission from hotgas that is flowing upwards, away from the plane. This gas can be traced to kiloparsec distances from theplane by its soft X-ray emission (Bland-Hawthorn & Cohen, 2003). Similar outflows are seen when someexternal galaxies are imaged in X-rays or the Balmer α emission line of hydrogen (Strickland et al., 2004).
Although our view of most of the central region is heavily obscured at optical wavelengths, there are
8
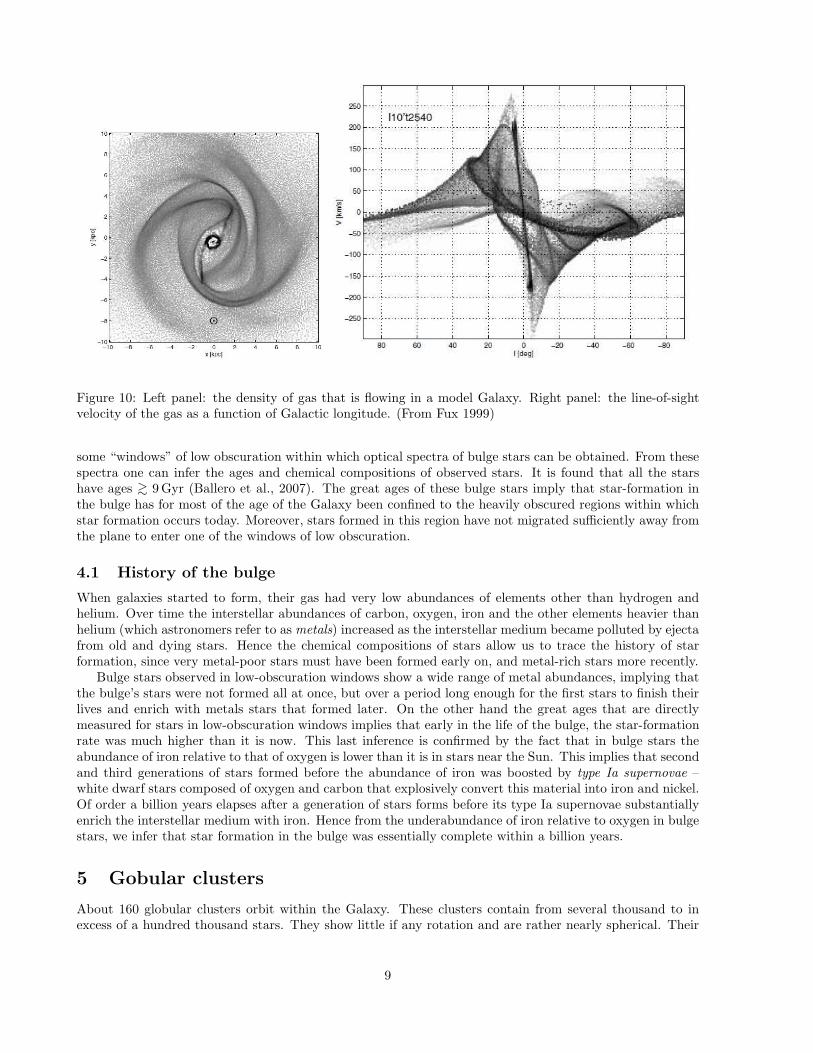
Figure 10: Left panel: the density of gas that is flowing in a model Galaxy. Right panel: the line-of-sightvelocity of the gas as a function of Galactic longitude. (From Fux 1999)
some “windows” of low obscuration within which optical spectra of bulge stars can be obtained. From thesespectra one can infer the ages and chemical compositions of observed stars. It is found that all the starshave ages ∼> 9 Gyr (Ballero et al., 2007). The great ages of these bulge stars imply that star-formation inthe bulge has for most of the age of the Galaxy been confined to the heavily obscured regions within whichstar formation occurs today. Moreover, stars formed in this region have not migrated sufficiently away fromthe plane to enter one of the windows of low obscuration.
4.1 History of the bulge
When galaxies started to form, their gas had very low abundances of elements other than hydrogen andhelium. Over time the interstellar abundances of carbon, oxygen, iron and the other elements heavier thanhelium (which astronomers refer to as metals) increased as the interstellar medium became polluted by ejectafrom old and dying stars. Hence the chemical compositions of stars allow us to trace the history of starformation, since very metal-poor stars must have been formed early on, and metal-rich stars more recently.
Bulge stars observed in low-obscuration windows show a wide range of metal abundances, implying thatthe bulge’s stars were not formed all at once, but over a period long enough for the first stars to finish theirlives and enrich with metals stars that formed later. On the other hand the great ages that are directlymeasured for stars in low-obscuration windows implies that early in the life of the bulge, the star-formationrate was much higher than it is now. This last inference is confirmed by the fact that in bulge stars theabundance of iron relative to that of oxygen is lower than it is in stars near the Sun. This implies that secondand third generations of stars formed before the abundance of iron was boosted by type Ia supernovae –white dwarf stars composed of oxygen and carbon that explosively convert this material into iron and nickel.Of order a billion years elapses after a generation of stars forms before its type Ia supernovae substantiallyenrich the interstellar medium with iron. Hence from the underabundance of iron relative to oxygen in bulgestars, we infer that star formation in the bulge was essentially complete within a billion years.
5 Gobular clusters
About 160 globular clusters orbit within the Galaxy. These clusters contain from several thousand to inexcess of a hundred thousand stars. They show little if any rotation and are rather nearly spherical. Their
9
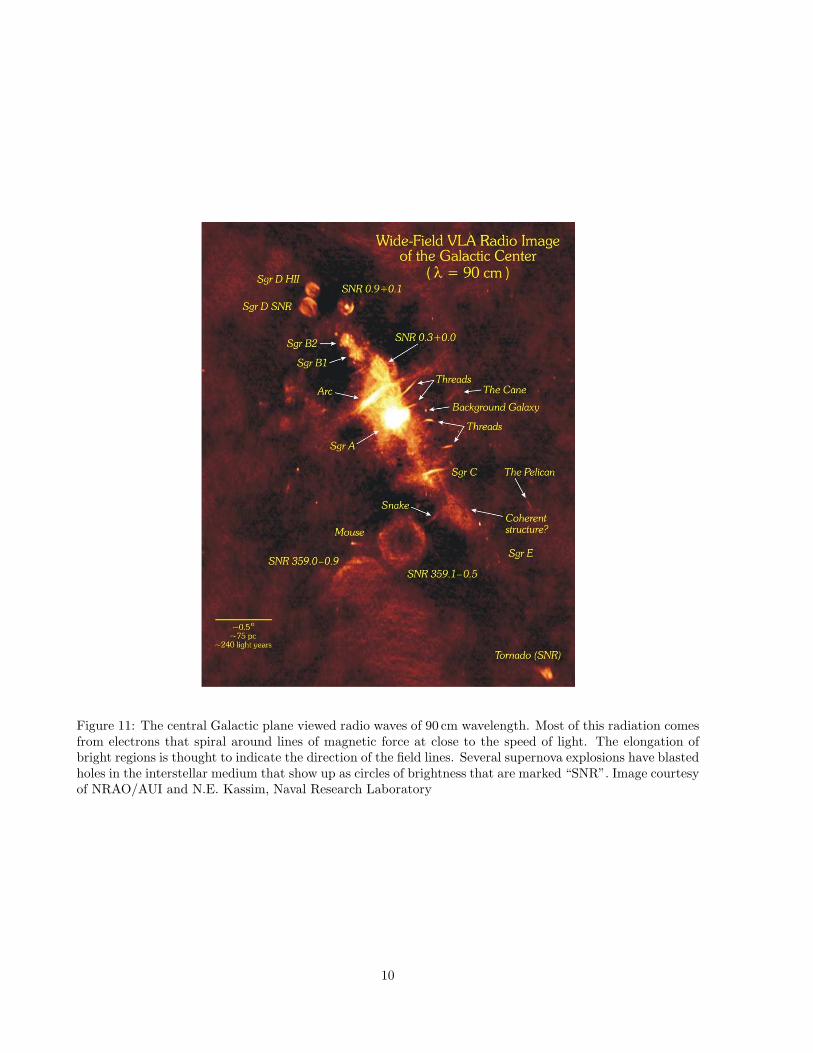
Figure 11: The central Galactic plane viewed radio waves of 90 cm wavelength. Most of this radiation comesfrom electrons that spiral around lines of magnetic force at close to the speed of light. The elongation ofbright regions is thought to indicate the direction of the field lines. Several supernova explosions have blastedholes in the interstellar medium that show up as circles of brightness that are marked “SNR”. Image courtesyof NRAO/AUI and N.E. Kassim, Naval Research Laboratory
10

Figure 12: The greyscale shows emission at 8 µm from hot dust in a region 3◦ (434 pc) square around theGalactic centre. The contours show the intensity of radio emission at 3 cm. The bulging contours to theNorth of the centre are the signature of gas heated by intense star formation in the nuclear molecular discthat is flowing out of the disc. (From Bland-Hawthorn & Cohen 2003)
radial profiles display a wide range of central concentrations from Messier 15 (M15), in which the centraldensity continues to rise towards the centre down to the smallest radii probed, to fluffy clusters such as Pal 5(Figure 13). Their central velocity dispersions are of order 6 km s−1, and in any given cluster the dispersionσ decreases outwards. The outward decline of σ is consistent with all the cluster’s matter being in stars –in this respect they differ markedly from dwarf spheroidal galaxies (see below), which show no sign of theoutward decline in velocity dispersion that is predicted by models in which light is a fair tracer of mass.
In the 20th century globular clusters were fundamental to the development of the theory of stellar evolu-tion, because to an excellent approximation each cluster consists of stars with common age and metallicity,but differing masses. As self-gravitating ensembles of near point masses that have short crossing times,globular clusters have also been important laboratories for stellar dynamics.
A key stellar-dynamical process is two-body relaxation: when the orbit of a star through the cluster isdeflected by the gravitational field of another star, the two stars exchange energy and we say the stars havehad an encounter. These energy exchanges drive the cluster towards thermodynamic equilibrium in thesame way that molecular collisions in air restore thermodynamic equilibrium after it has been disturbed, forexample by stirring or local heating. In thermodynamic equilibrium, the velocity distribution of particles (aMaxwellian) is non-zero right up to infinite velocity, but in a self-gravitating system there is a finite escapevelocity, ve: a star that after an encounter is moving faster than ve will escape the system. Hence starsare constantly evaporating from a star cluster. A star that loses energy in an encounter will sink inwards.If it loses energy in a second encounter, it will move still further inwards. Hence, in addition to drivingevaporation, two-body encounters lead to the formation of a high-density cusp at the centre of the cluster.The sharply peaked central density of M15 (right hand panel of Figure 14) is believed to have evolved inthis way long after the cluster formed.
In thermodynamic equilibrium the root-mean-square (rms) speed of a particle of mass m scales as 1/√
m.Hence stellar encounters tend to slow down more massive stars and speed up less massive stars. These changesof speed lead to the massive stars sinking to the cluster’s centre and the less massive stars populating itshalo, and possibly evaporating. The segregation of stars by mass can be studied in globular clusters throughthe radial distributions of stars of different spectral types.
Evaporation is not the only process that removes stars from clusters. The gravitational field of theGalaxy raises tides on clusters in just the same way that the gravitational field of the Moon raises tides onthe ocean: on the side of the cluster that is closest to the Galactic centre, the gravitational field is largerthan on the further side. Hence the cluster is stretched along the line that joins the cluster to the Galactic
11

Figure 13: The density on the sky of main-sequence stars with distances similar to that of the globularcluster Palomar 5. The cluster itself is the dark blob marked “Pal 5” and from it run up to the left anddown to the right tails of stars that have been pulled from the cluster by the Galaxy’s gravitational field andare on orbits through the Galaxy similar to that of Pal 5, but are either leading Pal 5 or lagging it. (FromOdenkirchen et al 2003)
Figure 14: Density of stars on the sky as a function of distance from the cluster centre: NGC 6864 (left) andM15 (right). Whereas the surface brightness is constant near the centre of NGC 6864, in M15 it continuesto rise all the way to the centre. (After Binney & Merrifield 1998)
12

Figure 15: The metallicity distribution of the Galaxy’s globular clusters is bimodal. The low-metallicitypopulation centred on [Fe/H] = −1.5 is that of the halo clusters, while the more metal-rich population isthat of the “disc” clusters. (From Binney & Merrifield 1998)
centre. This stretching increases as the cluster approaches the Galactic centre on an elliptical orbit, peakingat pericentre (the point of closest approach to the centre). At this point some stars become detached fromthe cluster and subsequently orbit the Galaxy independently of it (although on orbits similar to the cluster’sown). Recently it has become possible to map clusters out to extremely low surface brightnesses, revealingtidal streams formed in this way around some globular clusters (Figure 13). Many tidal streams have beendiscovered recently, including the Orphan Stream shown in Figure 13. Such streams offer one of the mostpromising tools for probing the Galaxy’s gravitational field far from the disc and considerable progress isexpected in this area in the next few years.
The metallicity distribution of the globular-cluster population is strongly bimodal (Figure 15), withpeaks at [Fe/H] ≃ −0.5 and [Fe/H] ≃ −1.5. Similar bimodality has been detected in the globular-clusterpopulations of several other galaxies. When this bimodality is used to decompose the cluster populationinto metal-rich and metal-poor components, it is found that the two components have distinct spatial andkinematic properties: the metal-rich population is confined in space to |z| < 3 kpc and r < 8 kpc and hassignificant rotation, while the metal-poor population is approximately spherically distributed and extendsout to r ≃ 100 kpc. In recognition of this fact, the metal-rich clusters are called disc clusters and the metal-poor ones halo clusters. The globular-cluster populations of many external galaxies show similar bimodalitybut the origin of this phenomenon is unknown. In all Galactic globular clusters the abundance of iron is lowrelative to that of oxygen compared to the Sun. This finding implies that globular clusters ceased to formstars before the first cluster stars exploded as type Ia supernovae.
The halo clusters are all extremely old – the data for the large majority of clusters are consistent with agesequal to the cosmologically-determined age of the Universe, 13.7 Gyr. Significantly smaller ages ∼ 10 Gyrare obtained for a minority of clusters. There is no evidence that among halo clusters age is correlated witheither metallicity or galactocentric distance. There are indications that some disc clusters are a few Gyryounger than the Universe.
6 Satellites
The Milky Way is one of two galaxies that dominate the Local Group of galaxies; the other dominant galaxyis the Andromeda Nebula, Messier 31 (M31). The Local Group contains dozens of smaller galaxies. A fewof these are conspicuous and have been known for over a century – the Small and Large Magellanic Clouds(SMC and LMC), the Triangulum Nebula, M33, and two close companions of M31, NGC 205 and M32.The great majority of the galaxies in the Local Group are inconspicuous and the list of the known ones
13

Figure 16: A false-colour representation of the density of faint stars near the North Galactic pole. Regions ofhigher star density are brighter. The densities of stars in three ranges of apparent magnitude (and thereforetypical distance) are plotted in the three primary colours, so the overall hue indicates the dominant distancecategory, with red most distant and blue least distant. The Sagittarius stream arcs from bottom left tomiddle right. In the right-hand half of the figure it is clearly split into two bands. A much narrower streamruns steeply up from α ∼ 164◦, δ = 0; this is the Orphan Stream. (Image courtesy Vasily Belokurov afterone in Belokurov et al., 2006)
has recently been lengthening rapidly as advances in observational technique make it possible to discovergalaxies with extemely low surface brightnesses. Some of these low-surface-brightness objects are on orbitsthat carry them inside the Milky Way, and systems of this type may have played a significant role in theGalaxy’s evolution.
An instructive example is the Sagittarius Dwarf, the centre of which is only ∼ 24 kpc from the Sun butwas not discovered until 1995 because it lies behind the bulge. It is moving almost perpendicular to theplane from south to north, and is elongated along its orbit for the same reason that the globular cluster Pal5 is. Remarkably, its tidal stream wraps right round the Galaxy: Figure 16 is an image of the stream asit passes over the North Galactic pole. On the right-hand side of the image, the stream is clearly double,indicating that it passes through this region twice. It seems that the Sagittarius dwarf is in the final stagesof being tidally disrupted by the Galaxy.
Dwarf spheroidal galaxies are particularly interesting from the perspective of “dark matter” (Section 8),because stars are believed to make only a very small contribution to the gravitational fields of these systems.The evidence for this is the magnitude of a typical stellar velocity dispersion (∼ 10 km s−1) and the very lowcharacteristic space density of stars; if the only mass were that contributed by stars, the velocity dispersionsof these systems would be lower than they are, especially at the largest radii probed by the observations.Figure 17 shows this fact by plotting alongside the data models based on the assumption that light tracesmass and the mass-to-light ratio is the same as that of the Sun (dotted lines), and what one expects ifthe stars are just test particles in the mass distribution that is predicted by the Cold Dark Matter (CDM)cosmological model (full lines).
Another respect in which dwarf spheroidal galaxies differ from globular clusters is their histories of starformation: whereas all the stars in globular clusters formed in a single burst, in several dwarf spheroidals thestars are known to have a wide spread of ages. Thus dwarf spheroidals have either been capable of sustainingstar formation over extended periods, or have experienced more than one burst of star formation.
A prerequisite for star formation is a stock of gas. Globular clusters contain very little gas because windsfrom the surfaces of member stars are generally moving faster than the local cluster escape velocity ve. Wedo not know what the escape velocities of dwarf spheroidals are, but they cannot be smaller than of ordertwice the velocity dispersion σ, and we have seen that in dwarf spheroidals σ does not decrease outwards asit does in globular clusters. Thus dwarf spheroidals are better able to retain gas, and hence to sustain starformation, than globular clusters. Another factor makes it extremely hard for a globular cluster to retainany gas: twice on each orbit of the Galaxy a globular cluster passes through the Galactic plane. Unless theradius of such a passage is large, gas in the plane will sweep any gas out of the globular cluster.
14

Figure 17: Velocity dispersion as a function of radius in seven dwarf spheroidal galaxies. The dotted linesshow the profiles expected if the stars were fair tracers of the mass. The full curves show the prediction ofa model in which the mass mass is concentrated in dark-matter particles. (Walker et al., 2007)
15
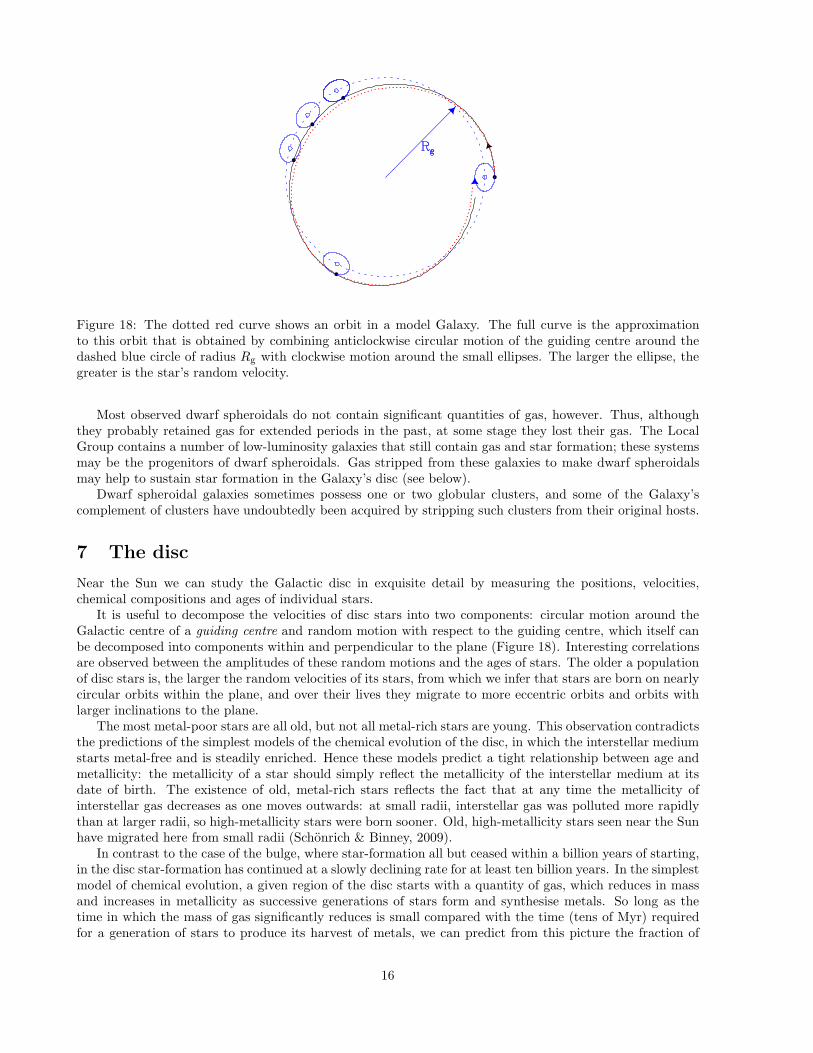
Figure 18: The dotted red curve shows an orbit in a model Galaxy. The full curve is the approximationto this orbit that is obtained by combining anticlockwise circular motion of the guiding centre around thedashed blue circle of radius Rg with clockwise motion around the small ellipses. The larger the ellipse, thegreater is the star’s random velocity.
Most observed dwarf spheroidals do not contain significant quantities of gas, however. Thus, althoughthey probably retained gas for extended periods in the past, at some stage they lost their gas. The LocalGroup contains a number of low-luminosity galaxies that still contain gas and star formation; these systemsmay be the progenitors of dwarf spheroidals. Gas stripped from these galaxies to make dwarf spheroidalsmay help to sustain star formation in the Galaxy’s disc (see below).
Dwarf spheroidal galaxies sometimes possess one or two globular clusters, and some of the Galaxy’scomplement of clusters have undoubtedly been acquired by stripping such clusters from their original hosts.
7 The disc
Near the Sun we can study the Galactic disc in exquisite detail by measuring the positions, velocities,chemical compositions and ages of individual stars.
It is useful to decompose the velocities of disc stars into two components: circular motion around theGalactic centre of a guiding centre and random motion with respect to the guiding centre, which itself canbe decomposed into components within and perpendicular to the plane (Figure 18). Interesting correlationsare observed between the amplitudes of these random motions and the ages of stars. The older a populationof disc stars is, the larger the random velocities of its stars, from which we infer that stars are born on nearlycircular orbits within the plane, and over their lives they migrate to more eccentric orbits and orbits withlarger inclinations to the plane.
The most metal-poor stars are all old, but not all metal-rich stars are young. This observation contradictsthe predictions of the simplest models of the chemical evolution of the disc, in which the interstellar mediumstarts metal-free and is steadily enriched. Hence these models predict a tight relationship between age andmetallicity: the metallicity of a star should simply reflect the metallicity of the interstellar medium at itsdate of birth. The existence of old, metal-rich stars reflects the fact that at any time the metallicity ofinterstellar gas decreases as one moves outwards: at small radii, interstellar gas was polluted more rapidlythan at larger radii, so high-metallicity stars were born sooner. Old, high-metallicity stars seen near the Sunhave migrated here from small radii (Schonrich & Binney, 2009).
In contrast to the case of the bulge, where star-formation all but ceased within a billion years of starting,in the disc star-formation has continued at a slowly declining rate for at least ten billion years. In the simplestmodel of chemical evolution, a given region of the disc starts with a quantity of gas, which reduces in massand increases in metallicity as successive generations of stars form and synthesise metals. So long as thetime in which the mass of gas significantly reduces is small compared with the time (tens of Myr) requiredfor a generation of stars to produce its harvest of metals, we can predict from this picture the fraction of
16

Figure 19: A possible structure of spiral arms traced by star-forming complexes. The Sun is at (x = 0, y =8.5). Examining this figure one should bear in mind that it is easier to trace features near the Sun than inremote parts of the Galaxy, so the figure shows more detail near the Sun. (From Russeil 2003)
stars that have metallicities in a given band without knowing the history of the conversion of gas to stars:that is, we expect the same metallicity distribution regardless of whether the rate of star formation has beenconstant, or rapidly decreasing in time, or has paused for extended periods. Unfortunately, this theoreticalprediction conflicts with the observed distribution of stars with respect to metallicity in the sense that thereare many fewer metal-poor stars than are predicted by the simple model.
There are two possible resolutions of this conflict: either the gas from which the disc formed had non-negligible metallicity, or the disc has been drip-fed with gas at a rate similar to the rate at which it hasturned gas into stars. The fact that the star-formation rate has not decreased by a large factor over the disc’slife supports the drip-feed hypothesis, as does the identification of external disc galaxies that are gas-poorand bereft of star formation in circumstances in which it would be difficult for them to acquire gas (Chunget al., 2009). Thus there is srong circumstantial evidence that the continuing star formation in the disc issustained by inflow of gas. On the other hand it is also likely that stars that lived before the disc started toform had pre-enriched its gas to some extent.
7.1 Spiral structure
Our position within the disc, from which lines of sight into the disc are heavily obscured by dust, makes itdifficult for us to trace the Galaxy’s spiral structure. The dots in Figure 19 show the locations of clustersof young stars that should lie in spiral arms; spiral arms have also been traced in other ways with similarresults. In some regions it is clear that the dots lie along a well defined spiral curve, but in other regionsthe dots could be randomly scattered, or joined by smooth curves with a variety of shapes. The curves inFigure 19 show a four-armed pattern of ridge-lines that provides an acceptable but less than convincing fitto the data. The spiral structure of external galaxies is classified as either “grand-design” or “flocculent”;Figure 19 indicates that it is unclear which designation is appropriate for the Milky Way. Since the discstars rotate clockwise in the figure, the arms trail, as in external spiral galaxies.
Radio-frequency observations of atomic hydrogen (HI) and carbon monoxide (CO) provide valuable in-sights into non-axisymmetries in the gas disc, which are jointly generated by spiral structure and the bar.Unfortunately, the interpretation of the data is complex because what is measured is the amount of gasmoving with each velocity along each line of sight – Figure 20 shows this distribution of emission by HI foreach longitude l and latitude b = 0. If the velocity field of the gas were known, the measured line-of-sight
17

Figure 20: The intensity of emission at latitude b = 0 in the 21 cm line of atomic hydrogen. The wavinessof the edge of the dark region at (0 < l < 90, v > 0) and (0 > l > −90, v < 0) reflects disturbance of gasclouds from circular orbits by spiral structure. Dark ridges trace individual spiral arms. (From Binney &Merrifield 1998)
velocities could be used to infer the distance to each element of emission, and then we could work out thedensity of gas throughout the disc; ridges of enhanced density in Figure 20 would correspond to spiral arms.The problem with this program is that we do not know the velocity field a priori, but must determine it fromthe same data. If gas clouds are assumed to move on circular orbits at a speed vc(r) that is an unknownfunction of radius, it is fairly straightforward to determine the appropriate function, but spiral structureensures that clouds do not move on circular orbits, so this procedure is flawed. However, when a theoreticalmodel of a galaxy with spiral structure is “observed” in the way we observe the Milky Way (right panel ofFigure 10), spiral arms give rise to ridges of enhanced emission in the theoretical analog of Figure 20. More-over, spiral structure leads to ripples in the edge of the region of dense emission very similar to those visiblein Figure 20. Unfortunately, the potential of this line of enquiry to uncover the Galaxy’s spiral structure hasyet to be fully exploited.
Spiral structure is not just decoration for a disc galaxy; it profoundly affects the evolution of the discbecause it is associated with a spiral distortion of the galaxy’s gravitational force-field. This distortiondeflects the velocities of gas clouds and stars from simple circular orbits. As a result, gas clouds crash intoeach other and are compressed at points that trace the leading edges of spiral arms. Stars form from thecompressed gas, so the mean rate of star formation within the disc depends on the amplitude of the spiralstructure. The deflection of stars by the spiral distortion of the galaxy’s gravitational field has several effects.First, it gives rise to the spiral pattern in the density of stars within the disc that itself causes the originalspiral distortion of the gravitational field. Second, it is largely responsible for the increase in the randomvelocities of stars that we discussed above. Third it mixes the disc radially, both by increasing the randomvelocities of stars, and by causing stars to change their guiding centres. The random motions of gas cloudsare strongly damped by cloud–cloud collisions, but the guiding centres of clouds are probably changed byspiral structure just as are those of stars. Hence spiral structure probably radially mixes both the gas andstellar discs. In particular, it is probably responsible for the presence near the Sun of old, metal-rich starsnoted above (Sellwood & Binney, 2002).
18

7.2 Interstellar gas
About half of the Galaxy’s stock of interstellar gas is contained in clouds of molecular gas inside the solarcircle. The gas density is high in the nuclear molecular disc of radius ∼ 200 pc and in the molecular ringof radius ∼ 5 kpc, both of which yield prominent features in Figure 8. Molecular clouds consist primarilyof molecular hydrogen (H2), but because H2 molecules have no convenient spectral lines, molecular gas isinvariably traced through molecules of carbon monoxide (CO) or carbon sulphide (CS) which emit readilyobserved spectral lines. Since the observed molecules are only trace constituents of the clouds, one needs toknow their abundance relative to H2 to infer the mass of a cloud. Unfortunately, these abundances, whichdepend on a variety of parameters including metallicity, are uncertain. The total mass of molecular gas isof order 109 M⊙.
The density of molecular gas is very non-uniform, and may be imagined to be concentrated into a largenumber of discrete molecular clouds – in the lower panel of Figure 8 each cloud generates a vertical streak.The vertical extent of the streak gives the range of velocities within the cloud. This range is found to beroughly proportional to the square root of the total line emission from a cloud, and for a typical cloud ofmass 104 M⊙ is of order 2.5 km s−1 (Strong et al., 1988).
The temperature of molecular gas can be estimated from the intensity of emission observed in differentspectral lines, and proves to be ∼< 30 K. At this temperature the speed of sound in the gas is ∼< 0.3 km s−1 sothe motions of gas within each cloud are extremely supersonic. This fact is surprising, because in any fluidsupersonic motions are strongly damped. How are the supersonic motions in interstellar clouds maintained?The current view is that individual clouds are transient structures that are constantly forming and disrupting.Clouds assemble when gas streams within the disc collide and gas is compressed. Stars form in the densegas and then energy released by the most massive and luminous of these stars disperses the remaining gas.
Stars disperse molecular gas in two ways. First they heat it mechanically by blasting it with high-velocityoutflowing gas. Second they heat it and dissociate its molecules by exposing it to ultraviolet radiation; thisprocess is not unlike the way morning sun burns away a ground fog. The Galaxy converts gas to stars ratherslowly because a molecular cloud is dispersed after only a small fraction of its mass has been turned intostars. Much remains to be understood about the internal structure and dynamics of molecular clouds andtheir relation to star formation.
Comparison of Figures 8 and 20 shows that the Galaxy’s stock of HI is less centrally concentrated thanthe molecular gas: features at l ∼> 80◦ that are prominent in HI are hard to trace in CO, while the nuclearmolecular disc at |l| < 2◦ is scarcely visible in HI. The greater central concentration of CO is related tothe way in which dust shields gas from ultraviolet radiation. The ultraviolet photons that dissociate H2
molecules into HI are strongly absorbed by dust grains. At large galactocentric radii the gas density is lower,so the dust grains are further apart and ultraviolet photons have a greater chance of penetrating deep into acloud by slipping between dust grains. Hence at large radii most of the gas is in atomic form. Since stars canonly form from cold, dense molecular gas, a low fraction of molecular gas implies a low rate of star formationat large radii.
A significant fraction of the Galaxy’s HI probably lies of order a kiloparsec above or below the plane,because large-scale outflows of gas from regions of recent star formation push gas away from the plane andthe gas takes a significant time to fall back to the plane. We observe this process in action in external galaxiesthat resemble the Milky Way and there are indications that it occurs in the Galaxy too, but interpreting therelevant observations is hard in the case of the Galaxy.
7.3 Moving groups, associations and star clusters
When a molecular cloud collapses, a cluster of stars is formed with a mass that depends on the mass of theparent cloud. Low-mass clouds yield small clusters that are identified observationally as OB associations;groups of luminous, short-lived stars. Rare, massive clouds yield massive open clusters.
While the original molecular cloud was bound by its gravitational field (that is why it collapsed to formstars), the stars to which it gives birth are usually not gravitationally bound to each other, because so muchof the cloud’s mass (and hence gravity) has been dispersed by the luminous stars. If the association is notbound, it gradually disperses. When it is young it is easily identified by the presence within it of luminous,short-lived stars. Once these have died the association can only be identified from the velocities of theremaining stars, which will be very similar, even though the stars may cover a large part of the sky. At this
19

Figure 21: The density of stars at the Sun’s radius as a function of distance |z| from the plane. Thedata points (from Gilmore & Reid 1983) can be fitted by a sum of two exponential profiles (with scaleheights 300 pc and 1350 pc); the sum is shown by the dashed line, while straight lines show the individualexponentials. (From Binney & Merrifield 1998)
stage the association is called a moving group. It is thought that all stars are born in associations, most ofwhich disperse. In the next decade the number of accurately know velocities of stars will increase enormously,and we expect to be able to unravel much of the history of star formation in the disc by identifying largenumbers of groups of stars that formed together but are now dispersed around the disc.
It sometimes happens that many of the stars formed during the collapse of a molecular cloud remainbound after luminous stars have blown away the remaining gas; an open cluster has formed. Open clustersare extremely useful because they contain stars of a variety of masses that all have very similar ages andchemical compositions.
Stars would evaporate (see §5) from even an isolated open cluster at an appreciable rate because thetimescale for evaporation decreases with cluster mass. Encounters with molecular clouds and spiral armssignificantly hasten the loss of stars by open clusters: the gravitational field of a passing cloud or arm shakesthe cluster and decreases the binding energies of its stars. Consequently, open clusters often live less than abillion years.
7.4 The thick disc
A plot of the density of disc stars versus the logarithm of distance from the plane appears to consist oftwo straight-line segments: within 500 pc of the plane, a straight-line fit implies that the density of starsdecreases with distance z like e−z/z0 with scale-height z0 ≃ 300 pc, while around z = 1.5 kpc a straight-linefit yields z0 ≃ 1 kpc (Figure 21). This observation suggests that the disc is made up of two sub-components,the thin disc with scale height 300 pc, and the thick disc with scale height 1 kpc. Studies of the velocitiesand chemical compositions of stars near the Sun support this interpretation: the thin disc contains stars ofall ages and a range of metallicities greater than a factor 3–4 below solar, while the thick disc consists ofstars that are all old and are metal-poorer than the Sun by a factor in excess of 3–4.
While the thin disc is clearly the cumulative product of the star formation that we see continuing today,the origin of the thick disc is less clear. One possibility is that it started life as a thin disc and became thickwhen a massive object such as a satellite galaxy spiralled towards the centre about 9 Gyr ago, scattering discstars onto more eccentric and more inclined orbits as it went. Another possibility is that it is made up ofstars that formed before type Ia supernovae had synthesised much iron (Schonrich & Binney, 2009).
7.5 Local mass density
Individual stars near the Sun oscillate perpendicular to the plane with amplitudes that are jointly determinedby the speeds at which the stars pass through the plane and the strength of the disc’s gravitational field,
20

Figure 22: The wavy curves show the circular speeds one infers from tangent velocities listed in Malhotra(1995) under the assumption that the local circular speed is Θ0 = 241 km s−1 (full curve) or Θ0 = 220 km s−1
(dashed curve). The undulations are artifacts that arise because gas clouds have been assumed to moveon circular orbits rather than the the slightly elliptical orbits associated with spiral structure (cf Figure20). The lower dotted curve shows the circular speeds generated by a disc in which the surface densitydecreases exponentially with radius with a scale length rd = 2.5 kpc. In this disc the local surface densityis Σ1.1 = 56 M⊙ pc−2. The upper dotted curve is for the combination of this disc with a dark halo withcharacteristic mass M0 = 6 × 10¹¹ M⊙ and scale length rs = 22 kpc.
which is proportional to the disc’s local mass-density. Hence by measuring the vertical speeds of stars andthe vertical thickness of the disc, one can weigh the disc. This programme has yielded three numbers: themass density in the plane (0.10 ± 0.01 M⊙ pc−3; Holmberg & Flynn 2000), the amount of mass that lieswithin 1.1 kpc of the plane (74 ± 6 M⊙ pc−2; Holmberg & Flynn 2004), and the surface density of the disc(56 ± 6)M⊙ pc−2. The surface density of the disc is smaller than the estimate of the mass that lies within1.1 kpc of the plane because the models used to obtain these estimates included an allowance for a spherical“halo” of dark matter (to be discussed below). The quoted uncertainties of the individual numbers indicatethat the vertical dynamics of the disc is consistent with the existence of a dark halo, but does not providecompelling evidence for it. If we take the density in the plane to be 0.1 M⊙ pc−3 and assume that away fromthe plane the density falls off like the star density plotted in Figure 21, then we predict that within 1.1 kpcof the plane there should be 61 M⊙ pc−2, so light is a reasonable tracer of mass near the disc.
8 The dark halo
The circular speed, vc, within the Galaxy can be extracted from data like that shown in Figure 20 andknowledge of the circular speed at the location of the Sun, Θ0. The latter is not securely known; the mostreliable value is obtained by measuring the apparent motion of Sgr A*, which reflects the motion of the Sun.If the distance to the Galactic centre is 8.3 kpc, the motion of Sgr A* implies that Θ0 = 241 ± 11 km s−1
(McMillan & Binney 2009). The full curve in Figure 22 shows the resulting plot of circular speed versusradius for Θ0 = 241 km s−1, while the dashed curve shows the circular speeds if Θ0 = 220 km s−1. Theseestimates are based on the assumption that gas clouds move on circular orbits. Actually spiral arms perturbthe velocities of clouds from vc by of order 7 km s−1, and neglect of this effect gives rise to the undulations inthe curves of vc in Figure 22. If these undulations are neglected, it is evident that vc is gently rising interiorto the Sun’s location, the rise being more pronounced for the larger value of Θ0.
The surface brightnesses of external galactic discs are found to decrease outwards as e−r/rd , where rd isthe disc scale length. If we assume that the surface brightness of the Galaxy’s disc obeys the same law, thenrd can be determined from counts of stars in a survey of the infrared sky; the result is rd ≃ 2.5 kpc (Robinet al. 2003). If we now assume that the local surface density is 56 M⊙ pc−2 and that mass follows light,the mass of the disc, Md = 6.1 × 10¹⁰ M⊙, follows, and we can calculate the circular speeds that the discalone generates. The lower dotted curve in Figure 22 shows these speeds. This curve not only lies below theobservationally determined curve, but interior to the Sun’s location it is gently falling, rather than rising.In fact, at the Sun the gravitational force generated by the disc is smaller than the measured rotation curverequires by a factor (190/241)2 = 0.62. It is believed that the balance of the required force is made up by a
21

dark halo.Evidence for dark halos first emerged from measurements of the velocities of galaxies that occur in clusters
of galaxies: already in 1933 the Swiss astronomer Fritz Zwicky pointed out that gravity could prevent thegalaxies of clusters flying apart only if the clusters contained almost ten times as much mass as was expectedto reside in the galaxies’ stars. In the 1980s the evidence for dark halos around individual galaxies was madesolid by studies of radio emission by atomic hydrogen (HI) around galaxies – many spiral galaxies have discsof HI that extend far beyond the optical image of the galaxy. The measured velocities are consistent with gasclouds that are moving on circular orbits around the galaxy, and the speed of these orbits does not declinewith radius r−1/2 as would be expected if the galaxy’s mass were concentrated in the optical image, but isroughly independent of radius, which implies that the clouds are moving through an extended distributionof matter in which density ρ ∝ r−2 (van Albada et al., 1985).
Unfortunately a major difficulty obstructs a convincing measurement of whether the circular speed ofthe Milky Way stays high beyond the Sun, as Figure 22 suggests. The problem is determining the radiusr of any object whose velocity can be measured. In an external galaxy r follows trivially from the object’sposition on the sky and the galaxy’s inclination to the line of sight. In the Milky Way this geometricalargument fails completely, and a direct distance determination is needed. Until recently, the best availabletechnique has been to infer the distance from the apparent brightness of a star whose luminosity can beinferred from its spectral type. This approach is limited both by the precision with which the luminositiesof stars can be inferred from spectra, and uncertainty in the amount of obscuring dust along the line ofsight. Distances based on “trigonometric parallaxes” (the tiny shift on the sky in the position of a star asthe Earth moves around the Sun) are in principle much more reliable, and are gradually becoming availableto sources sufficiently distant to probe the Galaxy’s rotation curve beyond the Sun (e.g., Reid et al. 2009).However, to this point the evidence is no more than consistent with the circular speed remaining fairly flatbeyond the Sun, as we would expect if the Milky Way was a typical spiral galaxy.
Powerful support for the concept of a dark halo is provided by cosmology: a wealth of data, from measure-ments of the cosmic microwave background, to measures of the clustering of galaxies, and to observations ofdistant supernovae, point to a cosmos in which the dominant source of gravity is particles that do not interactwith electromagnetic waves (and are therefore invisible or “dark”) and early on have small random velocities(and thus are “cold”). Simulations of the clustering of these particles under the influence of their mutualgravitational attraction indicate that galaxies should be embedded in dark-matter halos with a universaldensity profile that is roughly of the form ρ = M0/[4πr(rs + r)2], where the “scale radius” and characteristicmass M0 vary from halo to halo but are strongly correlated with one another, so dark halos can be consideredto form a one-parameter family quantified by M0 (Navarro et al., 1997). For the Milky Way’s halo thesequantities have been estimated to be rs ∼ 22 kpc and M0 ∼ 6× 10¹¹ M⊙ with uncertainties of order a factorof two (Klypin et al., 2002). The mass of the dark halo within the “virial radius” (∼ 260 kpc) at which darkmatter should cease to be in a statistically steady state is roughly 1.6M0 ∼ 1012 M⊙. Near the Sun this halocontributes ∼ 14 M⊙ kpc−2 to the mass within 1.1 kpc of the plane, which is consistent with the differencebetween the dynamically determined mass within this distance of the plane, (74 ± 6)M⊙ kpc−2, and theestimated contribution to this surface density from stars and interstellar gas, (56± 6)M⊙ kpc−2. The upperdotted curve in 22 shows the circular speeds generated by the combination of an exponential disc and thisdark halo. These speeds are in rough agreement with the observationally estimated ones if the local circularspeed is Θ0 ∼ 220 km s−1, but are on the low side if Θ0 is as large as its currently favoured value.
We know from experiments with nuclear interactions that dark matter exists: twenty six years afterWolfgang Pauli predicted the existence of neutrinos to conserve energy and momentum in 1930, they wereexperimentally detected. Recent measurements of the flux of neutrinos generated in the Sun have establishedthat neutrinos have non-zero rest masses, so there must be a contribution to the mass of the Galaxy fromneutrinos. However, the masses of neutrinos are so small that these particles had large random velocities whengravitational clustering began, with the result that they cannot comprise the dark halos of galaxies. Nonethe less, their existence is a proof of principle: Nature does include particles that only interact through the“weak” and gravitational forces. Consequently, it is reasonable to ask whether other, more massive, particlesexist with only these interactions. Theories of sub-atomic physics that are firmly based on experimental factpredict the existence of such particles. These particles are thought to be ∼ 100 times as massive as a proton(consequently about as massive as a silver atom). Because they are so much more massive than a neutrino,they are much less likely to be made in a nuclear reaction, so evidence for such particles did not surface in
22

parallel to evidence for neutrinos.The local density of dark matter, ∼ 4.3×10⁻¹⁹ kg m−3, corresponds to a number density ∼ 2.7×10³ m−3
of particles with 100 times the proton’s mass. Thus as the Earth moves at 30 km s−1 on its orbit around theSun, which is itself moving through the dark halo at ∼ 240 km s−1, vast numbers of dark-matter particlesmust be streaming through our laboratories. In fact the flux should be of order 6.4 × 10⁸ m−2 s−1. Theseparticles interact with ordinary matter through interactions that are not so much “weak” as short-range.Consequently, as a dark-matter particle whizzes through a laboratory, it has a small chance of smashing intoan ordinary atom. If, however, an impact does occur, it is with such violence that it can readily be detected.If the target area of each ordinary atom is 10−48A2 m2, where A is the number of neutrons and protons inthe nucleus, collisions will occur at a rate of order one per tonne of ordinary matter per year. Searches forthese events are currently under way at several laboratories around the world, and a couple of collisions mayeven have been observed (Ahmed et al., 2010).
Glossary
2MASS – the 2-micron all-sky survey. A ground-based survey of near-infrared light (which is dominatedby starlight).
b Galactic latitude
CO – Carbon monoxide. Widely used as a tracer for the much more abundant H2 molecule.
COBE – Cosmic Background Explorer; a NASA satellite that surveyed the sky at near to far infraredwavelengths and discovered the fluctuations in the density of the early universe from which galaxies latergrew. Its Diffuse Infrared Background Experiment instrument (DIRBE) provided the first clear view of thelarge-scale distribution of Galactic stars.
corotation radius – the radius at which a circular orbit in the underlying axisymmetric potential movesaround at the same angular speed as a non-axisymmetric disturbance such as a bar or a spiral arm.
dark matter – matter comprising particles that interact only by gravity and the “weak” force. Neutrinosare one constituent of dark matter but observations imply that the major constituent is much more massiveparticles.
disc cluster – a globular cluster with [Fe/H] ∼> −1.
dwarf spheroidal galaxy – a low-luminosity galaxy that has no interstellar gas or ongoing star formation.Like globular clusters, dSph galaxies orbit through, and are tidally stripped by, the Galaxy. Unlike globularclusters, most of their mass is made up of dark matter.
[Fe/H] – the standard measure of metallicity.
guiding centre – an imaginary point on a circular orbit around which a star on an eccentric orbit gyrates.
halo cluster – a globular cluster with [Fe/H] ∼< −1.
HI – atomic hydrogen. Formed when H2 molecules are dissociated by photons of ultraviolet light. Readilydetected by its hyperfine transition at 21 cm wavelength.
H2 – molecular hydrogen. Forms when hydrogen atoms meet on the surface of a dust grain.
kiloparsec – a thousand parsecs, roughly 3 0000 light years.
l – Galactic longitude.
magnitude – a measure of the apparent brightness of a star on a logarithmic scale: an increase of 2.5magnitudes corresponds to a decrease in flux by a factor 10.
metallicity – the abundance of elements heavier than helium relative to iron. Since these elements aremade in stars, the metallicity of interstellar gas has increased since the birth of the Galaxy. It is commonlyquantified by the iron abundance [Fe/H], which is defined to be log10[(nFe/nH)∗] − log10[(nFe/nH)⊙], so[Fe/H] = −1.5 implies that in the star Fe is less abundant than in the sun (relative to H) by a factor101.5 = 31.6.
nuclear molecular disc – a gas-rich disc centred on Sgr A* and roughly 200 pc in radius. It has a highrate of star formation.
parallax – the shift in the position of a star on the sky as the Earth moves round the Sun.
23

parsec – standard astronomical unit of distance equal to 3.08 × 10¹⁶ m ≃ 3 light years. At this distance astar moves on the sky around an ellipse with semi-major axis 1 arcsec.
relativistic – moving at a speed comparable to the speed of light. Shock waves caused by supernovaexplosions accelerate electrons and ions to relativistic speeds.
S2 – a luminous star whose orbit around Sgr A* has been tracked for a complete cycle.
Schwarzschild radius – The radius, equal to 2GM/c2, interior to which light cannot escape from thegravitational field of a point mass M .
Sgr A* – the radio source associated with the black hole at the very centre of the Galaxy.
supernova remnant (SNR) – bubble of expanding hot gas around the site of a supernova explosion.
tidal stream – a highly elongated distribution of stars that have been torn from a satellite galaxy or a starcluster by the Galaxy’s gravitational field.
thick disc – disc formed by old stars with relatively low abundances of iron relative to oxygen and carbon.As the name indicates, the vertical scale height of this disc is a factor 3–4 larger than that of the thin disc.
thin disc – disc formed by stars in which the abundances of iron and oxygen have a similar ratio to that inthe Sun. The vertical scale height of this disc is ∼ 300 pc.
type Ia supernova – an explosion of a carbon-oxygen white dwarf star that is driven by the conversion ofthe star’s atoms into nickel and iron atoms. The star is completely shattered by the explosion.
24

Bibliography
Ahmed, Z., Akerib, D. S.; Arrenberg, S.; Bailey, C. N.; Balakishiyeva, D.; Baudis, L.; Bauer, D. A.; Beaty, J.;Brink, P. L.; Bruch, T.; Bunker, R.; Cabrera, B.; Caldwell, D. O.; Cooley, J.; Cushman, P.; Dejongh, F.;Dragowsky, M. R.; Duong, L.; Figueroa-Feliciano, E.; Filippini, J.; Fritts, M.; Golwala, S. R.; Grant,D. R.; Hall, J.; Hennings-Yeomans, R.; Hertel, S.; Holmgren, D.; Hsu, L.; Huber, M. E.; Kamaev,O.; Kiveni, M.; Kos, M.; Leman, S. W.; Mahapatra, R.; Mandic, V.; Moore, D.; McCarthy, K. A.;Mirabolfathi, N.; Nelson, H.; Ogburn, R. W.; Pyle, M.; Qiu, X.; Ramberg, E.; Rau, W.; Reisetter,A.; Saab, T.; Sadoulet, B.; Sander, J.; Schnee, R. W.; Seitz, D. N.; Serfass, B.; Sundqvist, K. M.;Wang, G.; Wikus, P.; Yellin, S.; Yoo, J.; Young, B. A., (2010) Analysis of the low-energy electron-recoilspectrum of the CDMS experiment, PhRvD, 81, 042002 [An analysis of a laboratory experiment todetect dark-matter particles that suggests that some collisions may already have been observed]
Ballero, S.K., Matteucci, F., Origlia, L. & Rich, R.M. (2007) Formation and evolution of the Galactic bulge:constraints from stellar abundances, A&A, 467, 123
Belokurov, V.; Zucker, D. B.; Evans, N. W.; Gilmore, G.; Vidrih, S.; Bramich, D. M.; Newberg, H. J.; Wyse,R. F. G.; Irwin, M. J.; Fellhauer, M.; Hewett, P. C.; Walton, N. A.; Wilkinson, M. I.; Cole, N.; Yanny,B.; Rockosi, C. M.; Beers, T. C.; Bell, E. F.; Brinkmann, J.; Ivezic, Z.; Lupton, R. (2006), The fieldof streams: Sagittarius and its siblings ApJ, 642, L137
Binney, J. & Merrifield, M. (1998) Galactic astronomy, 796 pp. Princeton, NJ, USA [Graduate-level textbook]Binney, J. & Tremaine, S. (2008) Galactic dynamics, 885 pp. Princeton, NJ, USA [Graduate-level textbook]Bland-Hawthorn, J., & Cohen, M., (2003), The large-scale bipolar wind in the Galactic center, ApJ, 582,
246 [Discovery of the wind that blows of the nuclear star-forming disc]Chung, A., van Gorkom, J.H., Kenney, J.D.P., Crowl, H. & Vollmer, B., (2009), VLA imaging of Virgo
spirals in atomic gas, AJ, 138, 1741 [Evidence that disc galaxies lose their spiral structure when theycan no longer accrete gas]
Fux, R., (1999), 3D self-consistent N-body barred models of the Milky Way. II. Gas dynamics A&A, 345,787 [A dynamical model of the Galaxy’s bar and disc]
Gillessen, S. et al, (2009) The orbit of the star S2 around SGR A* from Very Large Telescope and Keckdata, ApJL, 707, L114 [A re-determination of the orbit of the star S2, which orbits the black hole atthe center of the Galaxy with a period of only 15 years]
Gilmore, G. & Reid, N., (1983), New light on faint stars. III - Galactic structure towards the South Poleand the Galactic thick disc, MNRAS, 202, 1025 [Discovery of the thick disc]
Holmberg, J. & Flynn, C., (2000) The local density of matter mapped by Hipparcos , MNRAS, 313, 209Klypin, A., Zhao, H-S. & Somerville, R.S., (2002) CDM-based models for the Milky Way and M31, ApJ,
573, 597 [Cosmologically inspired models of dark halos are fitted to available data for the Galaxy]Launhardt, R., Zylka, R., & Mezger, P.G., (2002) The nuclear bulge of the Galaxy. III. Large-scale physical
characteristics of stars and interstellar matter , A&A, 384, 112 [A review of the structure of theGalaxy’s spheroid]
Malhotra, S., (1995) The vertical distribution and kinematics of HI and mass models of the Galactic disk,ApJ, 448, 138 [Determination of the dependent of tangent velocities on l, which is key for the deter-mination of the circular-speed curve inside R0]
McMillan, P.M. & Binney, J., (2010) The uncertainty in Galactic parameters, MNRAS, 402, 934 [A reanalysisof the Galaxy’s fundamental parameters]
Navarro, J.F., Frenk, C.S. & White, (1997) A universal density profile from hierarchical clustering, ApJ,490, 493 [Demonstration that in N-body simulations dark-matter halos form an approximately one-parameter family]
Odenkirchen, Michael; Grebel, Eva K.; Dehnen, Walter; Rix, Hans-Walter; Yanny, Brian; Newberg, HeidiJo; Rockosi, Constance M.; Martnez-Delgado, David; Brinkmann, Jon; Pier, Jeffrey R., (2003) Theextended tails of Palomar 5: A 10 arc of globular cluster tidal debris, AJ, 126, 2385 [First evidencefor the great extent of the tidal streams formed by globular clusters]
Reid, M. J.; Menten, K. M.; Zheng, X. W.; Brunthaler, A.; Moscadelli, L.; Xu, Y.; Zhang, B.; Sato, M.;Honma, M.; Hirota, T.; Hachisuka, K.; Choi, Y. K.; Moellenbrock, G. A.; Bartkiewicz, A. (2009)Trigonometric parallaxes of massive star-forming regions. VI. Galactic structure, fundamental pa-rameters, and noncircular motions, ApJ, 700, 137 [Trigonometric parallaxes for objects at distances
25

of several kpc]Robin, A.C., Reyle, C., Derriere, S. & Picaud, S., (2003) A synthetic view on structure and evolution
of the Milky Way, A&A, 409, 523 [A determination of the structure of the disc from near-infraredphotometry]
Russeil, D., (2003) Star-forming complexes and the spiral structure of our Galaxy , A&A, 397, 133 [Anattempt to trace the Galaxy’s spiral arms]
Schonrich, R. & Binney, J., (2009) Origin and structure of the Galactic disc(s), MNRAS, 399, 1145 [Amodel of chemical evolution with mixing can acount for the thin disc / thick disc dichotomy withoutappealing to an early merger]
Sellwood, J.A. & Binney, J., (2002) Radial mixing in galactic discs, MNRAS, 336, 785 [Evidence thatspiral structure is effective at radially redistributing stars with profound implications for the chemicalevolution of the Galactic disc]
Stanek, K.Z., Mateo, M., Udalski, A., Szymanski, M., Kaluzny, J. & Kubiak, M., (1994) Color-magnitude di-agram distribution of the bulge red clump stars: Evidence for the galactic bar, ApJ, 429, L73 [Evidencethat the near end of the Galactic bar lies at l > 0]
Strickland, D.K., Heckman T.M., Colbert E.J.M., Hoopes C.G., Weaver K.A., (2004) A high spatial res-olution X-ray and Hα study of hot gas in the halos of star-forming disk galaxies, ApJS, 151, 193[Evidence for outflows of gas from galaxies like the Milky Way]
Strong, A. W.; Bloemen, J. B. G. M.; Dame, T. M.; Grenier, I. A.; Hermsen, W.; Lebrun, F.; Nyman,L.-A.; Pollock, A. M. T.; Thaddeus, P. (1988) The radial distribution of galactic gamma rays. IV -The whole galaxy, A&A, 207, 1 [Derives the scaling with mass of the random velocities in molecularclouds]
van Albada, T.S., Bahcall, J.N., Begeman, K. & Sancisi, R., (1985) Distribution of dark matter in the spiralgalaxy NGC 3198, ApJ, 295, 305 [The first absolutely clear evidence for dark matter around a spiralgalaxy]
Walker, Matthew G.; Mateo, Mario; Olszewski, Edward W.; Gnedin, Oleg Y.; Wang, Xiao; Sen, Bodhisattva;Woodroofe, Michael (2007) Velocity dispersion profiles of seven dwarf spheroidal galaxies, ApJ, 667,L53 [Strong evidence for dark matter in dwarf spheroidal galaxies]
Zwicky, F. (1933) Die Rotverschiebung von extragalaktischen Nebeln, Helv. Phys. Acta 6 110 [First indicationof the existence of dark matter]
26

Bigraphical Sketch
James Binney earned his BA degree at the University of Cambridge in 1971. After two semesters in Freiburgi Breisgau he wrote a doctoral thesis on the formation of galaxies in Oxford, graduating in 1975. He was aLindemann Fellow at Princeton University 1975/6, a Fellow by Examination of Magdalen College Oxford1975–1979, a Visiting Assistant Professor at Princeton University 1979–1981 and has been on the Facultyof Oxford University and a Fellow of Merton College since 1981. He was awarded the Maxwell Prize for1986 by the Institute of Physics and the Brouwer Award for 2003 by the American Astronomical Society.In 2000 he was elected a Fellow of the Royal Society of London. His books include Galactic Dynamics withScott Tremaine (Princeton University Press 1987 & 2008) and Galactic Astronomy with Michael Merrifield(Princeton University Press 1998).
His research concerns the structure, dynamics and formation of galaxies.
27
Related Documents


