The Melting Pot Generation: How Britain became more relaxed about race November 2012 polling, prepared by BritainThinks for British Future

Welcome message from author
This document is posted to help you gain knowledge. Please leave a comment to let me know what you think about it! Share it to your friends and learn new things together.
Transcript

The Melting Pot Generation: How Britain became more relaxed about race November 2012 polling, prepared by BritainThinks for British Future

Almost two thirds are comfortable with their children marrying someone of a different ethnic background
Q1. Some people feel uncomfortable with the choices that their children or grandchildren might make about their relationships. Regardless of whether you have children at the moment, how would you feel if your child or grandchild were to have a serious relationship or marriage with any of the following: [Base: Total population [n = 2149]]
77
68
62
58
51
45
41
35
23
14
5
9
15
16
15
31
29
32
50
56
Someone who is from a much wealthier background
Someone who is from a much poorer background
Someone of a different race or ethnicity to their own
Someone who practices a different faith
Someone with a disability or long-term health condition
Someone of the same sex
Someone in another country - which involved going to live abroad
Someone who is more than 15 years older or younger than them
Someone who is long-term unemployed
Someone with a criminal record
% of total saying comfortable
% of total saying uncomfortable

Women are more comfortable than men with mixed marriages
Q1. Some people feel uncomfortable with the choices that their children or grandchildren might make about their relationships. Regardless of whether you have children at the moment, how would you feel if your child or grandchild were to have a serious relationship or marriage with any of the following: [Bases: Men [n = 1053], Women [n = 1096]; 18-34 [n = 602], 35-54 [n = 774], 55+ [n = 773]]
66
58
Women Men
Total comfortable with the idea of “your child or grandchild having a serious relationship or marriage
with someone from a different race or ethnic background”

Those from black and mixed race backgrounds more likely to be comfortable with interracial marriages than white or Asian respondents
Q1. Some people feel uncomfortable with the choices that their children or grandchildren might make about their relationships. Regardless of whether you have children at the moment, how would you feel if your child or grandchild were to have a serious relationship or marriage with any of the following: [Bases: Mixed race [n = 47], Black [n = 55], White [n = 1869], Asian [n = 123]]
87 85
60 57
Mixed Race* Black* White Asian * NB Small sample size

Just under half think that mixed-race relationships are a good thing
Q2. When they are released, the 2011 UK Census figures will show an increase in the number of children born to parents of different ethnic backgrounds. Which of the following comes closest to your view? [Base: Total population [n = 2149]]
47
21
22
10
The growth of mixed-race relationships is a good thing. It shows that people can and do mix across
ethnic groups, which could help Britain become more integrated.
The growth of mixed-race relationships is a bad thing. It may lead to the dilution of the identity and culture of the different ethnic groups in our
society - including white and ethnic minority cultures and identities.
Neither of these.
Don't know
% of total

While there is little variation by age or gender, SEG has an impact on attitudes towards mixed relationships
Q2. When they are released, the 2011 UK Census figures will show an increase in the number of children born to parents of different ethnic backgrounds. Which of the following comes closest to your view? [Base: Total population [n = 2149]]
54
18
22
7
49
17
23
11
43
29
20
8
39
25
22
14
The growth of mixed-race relationships is a good thing. It shows that people can and
do mix across ethnic groups, which could help Britain become more integrated.
The growth of mixed-race relationships is a bad thing. It may lead to the dilution of
the identity and culture of the different ethnic groups in our society - including
Neither of these.
Don't know
% of AB
% of C1
% of C2
% of DE

Asian respondents are more sceptical of mixed relationships than other non-white groups
Q2. When they are released, the 2011 UK Census figures will show an increase in the number of children born to parents of different ethnic backgrounds. Which of the following comes closest to your view? [Base: Mixed race [n = 47], Black [n = 55], White [n = 1869], Asian [n = 123]]
83
5
9
3
77
3
11
9
57
18
7
17
44
23
24
10
The growth of mixed-race relationships is a good thing. It shows that people can and
do mix across ethnic groups, which could help Britain become more integrated.
The growth of mixed-race relationships is a bad thing. It may lead to the dilution of
the identity and culture of the different ethnic groups in our society - including
Neither of these.
Don't know
% of Black respondents*
% of Mixed-race respondents*
% of Asian group
* NB Small sample size

18-24 year olds are the only group more comfortable with mixed marriage than any other factor 18-24 25-34 35-44 45-54 55-64 65+
Someone of a different race or ethnicity to their own 65 56 49 45 48 27
Someone who is from a much wealthier background 63 73 68 71 75 80
Someone who is from a much poorer background 50 64 63 61 54 57 Someone with a disability or long-term health condition 42 43 44 35 32 24
Someone who practices a different faith 42 39 45 40 47 37 Someone of the same sex 37 26 26 20 7 -16 Someone in another in country which involved going to live abroad 16 17 7 8 9 15
Someone who is more than 15 years older or younger than them 4 1 5 1 1 8
Someone who is long-term unemployed -15 -4 -16 -26 -36 -58 Someone with a criminal record -26 -12 -36 -42 -56 -65
Q1. Some people feel uncomfortable with the choices that their children or grandchildren might make about their relationships. Regardless of whether you have children at the moment, how would you feel if your child or grandchild were to have a serious relationship or marriage with any of the following: [Base: Total population [n = 2149]]
Net Scores (total comfortable – total uncomfortable)
Numbers in darkest green indicate the best supported statement for each age group

A slight majority feel that children from mixed relationships can find it liberating to choose their own identity
Q3. Which of the following comes closest to your view? [Base: Total population [n = 2149]]
38
24
21
17
Children whose parents are from different racial or ethnic backgrounds
from each other can find it liberating as they are able to choose their own
identity for themselves. Children whose parents are from
different racial or ethnic backgrounds from each other can find it confusing or difficult to have a strong, secure ethnic
or racial identity.
Neither of these.
Don't know
% of total

Women are more positive on this issue than men
Q3. Which of the following comes closest to your view? [Bases: Men [n = 1053], Women [n = 1096]]
40
21
21
18
36
27
21
16
Children whose parents are from different racial or ethnic backgrounds from each other can find
it liberating as they are able to choose their own identity for themselves.
Children whose parents are from different racial or ethnic backgrounds from each other can find it confusing or difficult to have a strong, secure
ethnic or racial identity.
Neither of these.
Don't know
% of women
% of men

Black and mixed race respondents are more positive than white or Asian respondents
Q3. Which of the following comes closest to your view? [Base: Mixed race [n = 47], Black [n = 55], White [n = 1869], Asian [n = 123]]
62
8
16
14
49
27
14
10
37
24
22
17
37
30
12
22
Children whose parents are from different racial or ethnic backgrounds from each other can find
it liberating as they are able to choose their own identity for themselves.
Children whose parents are from different racial or ethnic backgrounds from each other can find it confusing or difficult to have a strong, secure
ethnic or racial identity.
Neither of these.
Don't know
% of Mixed-race respondents*
% of Black respondents*
% of White respondents
% of Asian respondents
* NB Small sample size

Almost one in three claim it is noticeable to see a mixed-race couple in public
Q4. Which of the following comes closest to your view? [Base: Total population [n = 2149]]
59
28
7
6
These days, people don't really notice when they see a mixed-race
couple in public
No matter what people say, it is noticeable when you see a mixed-
race couple in public
Neither of these.
Don't know
% of total

Men are more likely than women to claim to notice mixed-race couples in public
Q4. Which of the following comes closest to your view? [Bases: Men [n = 1053], Women [n = 1096]]
63
24
6
7
56
32
7
4
These days, people don't really notice when they see a mixed-
race couple in public
No matter what people say, it is noticeable when you see a mixed-race couple in public
Neither of these.
Don't know
% of women
% of men

Mixed race respondents are significantly less likely than any other group to say interracial couples are “noticeable in public”
Q4. Which of the following comes closest to your view? [Base: Mixed race [n = 47], Black [n = 55], White [n = 1869], Asian [n = 123]]
72
8
10
11
63
31
4
2
59
29
6
5
54
24
9
12
These days, people don't really notice when they see a mixed-race
couple in public
No matter what people say, it is noticeable when you see a mixed-
race couple in public
Neither of these.
Don't know
% of Mixed-race respondents* % of Black respondents* % of White respondents % of Asian respondents
* NB Small sample size

Opinion was fairly evenly split on the question of the importance of categorising people by their ethnic background, though slightly more are opposed to this
Q5. Which of the following comes closest to your view? [Base: Total population [n = 2149]]
39
31
17
13
By categorizing British people by their ethnic or racial background, we are simply
emphasizing differences that shouldn't matter at all.
In order to identify where discrimination is happening, it is important for the country
to keep track of the ethnic or racial backgrounds of British people.
Neither of these.
Don't know
% of total

Men are more likely to want to keep track of people’s ethnic backgrounds than women
Q5. Which of the following comes closest to your view? [Bases: Men [n = 1053], Women [n = 1096]]
41
27
17
15
38
36
16
10
By categorizing British people by their ethnic or racial background, we are simply
emphasizing differences that shouldn't matter at all.
In order to identify where discrimination is happening, it is important for the country
to keep track of the ethnic or racial backgrounds of British people.
Neither of these.
Don't know
% of women
% of men

White and Asian respondents are more likely to think categorisation is important than mixed or black respondents
Q5. Which of the following comes closest to your view? [Base: Mixed race [n = 47], Black [n = 55], White [n = 1869], Asian [n = 123]]
61
19
15
5
50
25
13
12
43
32
5
20
38
32
18
13
By categorizing British people by their ethnic or racial background, we are simply
emphasizing differences that shouldn't matter at all.
In order to identify where discrimination is happening, it is important for the country
to keep track of the ethnic or racial backgrounds of British people.
Neither of these.
Don't know
% of Black respondents*
% of Mixed-race respondents* % of Asian respondents
% of White respondents
* NB Small sample size

Slightly more respondents felt that the incidence of mixed marriage is higher in Britain than in the US
Q7. Given what you know about Britain and the United States of America, in which country would you expect ethnic minority citizens to be more likely to marry people of different ethnic backgrounds to themselves? [Base: Total population [n = 2149]]
42
27
19
12
I think there is a similar likelihood in both countries.
I think this is more likely to happen in Britain.
I think this is more likely to happen in the United States of
America.
Don't know
% of total

Women were less likely than men to be confident in having an opinion on this
Q7. Given what you know about Britain and the United States of America, in which country would you expect ethnic minority citizens to be more likely to marry people of different ethnic backgrounds to themselves? [Bases: Men [n = 1053], Women [n = 1096]]
45
25
16
15
38
30
23
9
I think there is a similar likelihood in both countries.
I think this is more likely to happen in Britain.
I think this is more likely to happen in the United States of
America.
Don't know
% of women % of men

Asians were the only racial group where a larger proportion think mixed marriage is more likely in the US than in the UK
Q7. Given what you know about Britain and the United States of America, in which country would you expect ethnic minority citizens to be more likely to marry people of different ethnic backgrounds to themselves? [Base: Mixed race [n = 47], Black [n = 55], White [n = 1869], Asian [n = 123]]
34
43
14
10
49
34
12
4
42
28
19
11
35
14
31
20
I think there is a similar likelihood in both countries.
I think this is more likely to happen in Britain.
I think this is more likely to happen in the United States of
America.
Don't know
% of Mixed-race respondents*
% of Black respondents*
% of White respondents
% of Asian respondents
* NB Small sample size
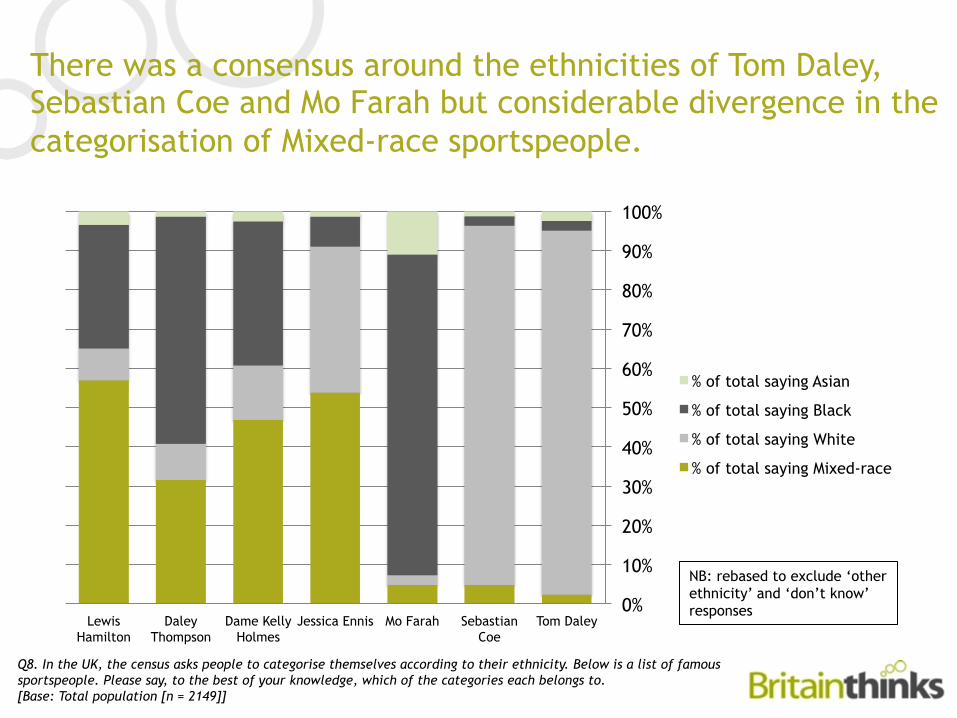
There was a consensus around the ethnicities of Tom Daley, Sebastian Coe and Mo Farah but considerable divergence in the categorisation of Mixed-race sportspeople.
Q8. In the UK, the census asks people to categorise themselves according to their ethnicity. Below is a list of famous sportspeople. Please say, to the best of your knowledge, which of the categories each belongs to. [Base: Total population [n = 2149]]
0%
10%
20%
30%
40%
50%
60%
70%
80%
90%
100%
Tom Daley Sebastian Coe
Mo Farah Jessica Ennis Dame Kelly Holmes
Daley Thompson
Lewis Hamilton
% of total saying Asian
% of total saying Black
% of total saying White
% of total saying Mixed-race
NB: rebased to exclude ‘other ethnicity’ and ‘don’t know’ responses

Similarly large proportion of respondents identified Tom Daley as white and Mo Farah as black
Q8. In the UK, the census asks people to categorise themselves according to their ethnicity. Below is a list of famous sportspeople. Please say, to the best of your knowledge, which of the categories each belongs to. [Base: Total population [n = 2149]]
NB: rebased to exclude ‘other ethnicity’ and ‘don’t know’ responses
0%
10%
20%
30%
40%
50%
60%
70%
80%
90%
100%
Tom Daley Mo Farah
% of total saying Asian
% of total saying Black
% of total saying White
% of total saying Mixed-race

There was far less consensus when it came to mixed-race sportspeople – with more even spread across different answers, with the exception of Seb Coe who the majority thought was white
Q8. In the UK, the census asks people to categorise themselves according to their ethnicity. Below is a list of famous sportspeople. Please say, to the best of your knowledge, which of the categories each belongs to. [Base: Total population [n = 2149]]
* Note: rebased to exclude ‘other ethnicity’ and ‘don’t know’ responses
0%
10%
20%
30%
40%
50%
60%
70%
80%
90%
100%
Sebastian Coe Jessica Ennis Dame Kelly Holmes
Daley Thompson Lewis Hamilton
% of total saying Asian
% of total saying Black
% of total saying White
% of total saying Mixed-race

After taking out all who answered “mixed race” or “Asian”, we can see that Jessica Ennis pulls apart from the others mixed race sportspeople: When they incorrectly identified Jessica Ennis’ racial background, they were more likely to say she was white, whereas for each of the others respondents were more likely to assume they were black.
Q8. In the UK, the census asks people to categorise themselves according to their ethnicity. Below is a list of famous sportspeople. Please say, to the best of your knowledge, which of the categories each belongs to. [Base: Total population [n = 2149]]
0% 20% 40% 60% 80% 100%
Jessica Ennis
Dame Kelly Holmes
Daley Thompson
Lewis Hamilton
% of total saying White
% of total saying Black
* Note: rebased to exclude ‘Mixed-race’, ‘Asian’, ‘other ethnicity’ and ‘don’t know’ responses

People who are uncomfortable with mixed marriages are generally less able to accurately identify individuals’ racial backgrounds
Q8. In the UK, the census asks people to categorise themselves according to their ethnicity. Below is a list of famous sportspeople. Please say, to the best of your knowledge, which of the categories each belongs to. [Base: Tolerant respondents [n = 1331], intolerant respondents [n = 327]]
47
24
52
39 31 27
47
34
Jessica Ennis Daley Thompson
Lewis Hamilton Dame Kelly Holmes
Percentage correctly identifying sportsperson as mixed race % of those
comfortable with mixed marriage
% of those uncomfortable with mixed marriage

18-30 year olds

Those aged 18-30 are more likely than those older than them to be comfortable with the idea of their child marrying someone of a different ethnicity to themselves
Q1. Some people feel uncomfortable with the choices that their children or grandchildren might make about their relationships. Regardless of whether you have children at the moment, how would you feel if your child or grandchild were to have a serious relationship or marriage with any of the following: [Base: Total population [n = 2149]]
68
60
Someone of a different race or ethnicity to their own
% of total aged 18-30 saying comfortable
% of total aged 31+ saying comfortable
9
17
Someone of a different race or ethnicity to their own
% of total aged 18-30 saying uncomfortable
% of total aged 31+ saying uncomfortable

59% of under 30s comfortable with mixed marriage compared to only 43% of over 30s
Q1. Some people feel uncomfortable with the choices that their children or grandchildren might make about their relationships. Regardless of whether you have children at the moment, how would you feel if your child or grandchild were to have a serious relationship or marriage with any of the following: [Base: Total population [n = 2149]]
Net Scores (total comfortable – total uncomfortable)
Numbers in darkest green indicate the best supported statement for each age group
18-30 31+ Someone who is from a much wealthier background 66 74 Someone of a different race or ethnicity to their own 59 43 Someone who is from a much poorer background 56 59 Someone with a disability or long-term health condition 42 35 Someone who practices a different faith 40 42 Someone of the same sex 31 11 Someone in another in country which involved going to live abroad 12 12 Someone who is more than 15 years older or younger than them -2 5 Someone who is long-term unemployed -12 -31 Someone with a criminal record -21 -46

18-30s are fractionally more likely to think that the growth of mixed-race relationships is a good thing.
Q2. When they are released, the 2011 UK Census figures will show an increase in the number of children born to parents of different ethnic backgrounds. Which of the following comes closest to your view? [Base: Total population [n = 2149]]
48
19
15
18
46
22
24
8
The growth of mixed-race relationships is a good thing. It shows that people can and do mix across
ethnic groups, which could help Britain become more integrated.
The growth of mixed-race relationships is a bad thing. It may lead to the dilution of the identity and culture of the different ethnic groups in our
society - including white and ethnic minority cultures and identities.
Neither of these.
Don't know
% of total aged 18-30
% of total aged 30+

18-30s are less likely than over-31s to think that having mixed-race parents makes children feel liberated, although this is because they don’t know rather than because they are more likely to to think it makes them feel confused.
Q3. Which of the following comes closest to your view? [Base: Total population [n = 2149]]
34
24
18
24
39
24
22
15
Children whose parents are from different racial or ethnic backgrounds from each other can find
it liberating as they are able to choose their own identity for themselves.
Children whose parents are from different racial or ethnic backgrounds from each other can find it confusing or difficult to have a strong, secure
ethnic or racial identity.
Neither of these.
Don't know
% of total aged 18-30
% of total aged 31+

18-30s are less likely than over-31s to think that seeing a mixed-race couple in public is noticeable and they are much less likely to have an opinion.
Q4. Which of the following comes closest to your view? [Base: Total population [n = 2149]]
59
21
5
15
59
30
7
3
These days, people don't really notice when they see a mixed-race
couple in public
No matter what people say, it is noticeable when you see a mixed-
race couple in public
Neither of these.
Don't know
% of total aged 18-30
% of total aged 31+

18-30s are fractionally more likely than over-31s to object to categorising people by ethnic or racial background.
Q5. Which of the following comes closest to your view? [Base: Total population [n = 2149]]
41
29
9
21
39
32
19
11
By categorizing British people by their ethnic or racial background, we are simply
emphasizing differences that shouldn't matter at all.
In order to identify where discrimination is happening, it is important for the country
to keep track of the ethnic or racial backgrounds of British people.
Neither of these.
Don't know
% of total aged 18-30
% of total aged 31+

As with over-31s, a majority of 18-30s believe there to be a similar likelihood of mixed-race marriages in the US and Britain, although 18-30s are much less likely to have an opinion at all.
Q7. Given what you know about Britain and the United States of America, in which country would you expect ethnic minority citizens to be more likely to marry people of different ethnic backgrounds to themselves? [Base: Total population [n = 2149]]
36
21
19
24
43
29
19
9
I think there is a similar likelihood in both countries.
I think this is more likely to happen in Britain.
I think this is more likely to happen in the United States of America.
Don't know
% of total aged 18-30
% of total aged 31+
Related Documents