IOP PUBLISHING JOURNAL OF GEOPHYSICS AND ENGINEERING J. Geophys. Eng. 9 (2012) S108–S117 doi:10.1088/1742-2132/9/4/S108 The measurement of surface roughness to determine the suitability of different methods for stone cleaning Carmen Vazquez-Calvo, Monica Alvarez de Buergo, Rafael Fort and Maria Jose Varas-Muriel Instituto de Geociencias IGEO (CSIC-UCM), Jose Antonio Novais 2, 28040 Madrid, Spain E-mail: [email protected] and [email protected] Received 26 January 2012 Accepted for publication 8 June 2012 Published 9 August 2012 Online at stacks.iop.org/JGE/9/S108 Abstract The roughness of stone surface was measured, before and after bead blasting-based cleaning methods, to select the most efficient one to be used in masonry and stonework of specific areas of the Cathedral of Segovia (Spain). These types of cleaning methods can, besides the removal of soiling and surface deposits, leave a rougher surface, which would mean higher and more rapid water retention and deposit accumulation due to a specific surface increase, therefore accelerating stone decay. Or, in contrast, the cleaning method can be so aggressive that it can smooth the surface by reducing its roughness, a fact that usually corresponds to excessive material removal—soot and deposits—but also part of the stone substrate. Roughness results were complemented with scanning electron microscopy observations and analyses and colour measurements. Finally, it was possible to select the best cleaning method among the six that were analysed, for different areas and different stone materials. Therefore, this study confirms the measurement of surface roughness as a reliable test to determine the suitability of stone cleaning methods; it is a non-destructive technique, portable and friendly to use, which can help us to rapidly assess—together with other techniques—the efficacy and aggressiveness of the stone cleaning method. Keywords: surface properties, stone conservation, roughness, cleaning Introduction, background and aims The scientific contribution to heritage conservation must be to assess the efficacy and suitability of any method in the laboratory and in situ before its application in the artwork, monument or building, as in the case of any stone cleaning method. The assessment of stone cleaning methods can comprise many tests, analyses, techniques and property determination studies. Here we present a procedure combining the determination of roughness, together with colour measurements and the observation and analysis by SEM-EDS, before and after cleaning. The former two are determined by the use of non-destructive and portable techniques; regarding the latter, very small samples are needed and significant information is obtained from each of them. Materials roughness is a physical characteristic of the surface texture that can deeply affect their durability due to its influence on particle retention and adhesion capacity, which may cause their further decay, e.g. organic matter particles, water drops and/or atmospheric pollution particles that can lead to soiling and salt crystallization processes (black crusts). In general, an increase in materials roughness also increases the specific surface and therefore, the material is more exposed to all environmental agents. Roughness can be qualitatively or quantitatively assessed by means of different techniques at different scales: optical microscopy, scanning electron microscopy, confocal microscopy, atomic force microscopy, stylus profilometry, laser triangulation profilometry, reflected-light image analysis, 1742-2132/12/040108+10$33.00 © 2012 Sinopec Geophysical Research Institute Printed in the UK S108

Welcome message from author
This document is posted to help you gain knowledge. Please leave a comment to let me know what you think about it! Share it to your friends and learn new things together.
Transcript

IOP PUBLISHING JOURNAL OF GEOPHYSICS AND ENGINEERING
J. Geophys. Eng. 9 (2012) S108–S117 doi:10.1088/1742-2132/9/4/S108
The measurement of surface roughness todetermine the suitability of differentmethods for stone cleaningCarmen Vazquez-Calvo, Monica Alvarez de Buergo, Rafael Fortand Maria Jose Varas-Muriel
Instituto de Geociencias IGEO (CSIC-UCM), Jose Antonio Novais 2, 28040 Madrid, Spain
E-mail: [email protected] and [email protected]
Received 26 January 2012Accepted for publication 8 June 2012Published 9 August 2012Online at stacks.iop.org/JGE/9/S108
AbstractThe roughness of stone surface was measured, before and after bead blasting-based cleaningmethods, to select the most efficient one to be used in masonry and stonework of specific areasof the Cathedral of Segovia (Spain). These types of cleaning methods can, besides the removalof soiling and surface deposits, leave a rougher surface, which would mean higher and morerapid water retention and deposit accumulation due to a specific surface increase, thereforeaccelerating stone decay. Or, in contrast, the cleaning method can be so aggressive that it cansmooth the surface by reducing its roughness, a fact that usually corresponds to excessivematerial removal—soot and deposits—but also part of the stone substrate. Roughness resultswere complemented with scanning electron microscopy observations and analyses and colourmeasurements. Finally, it was possible to select the best cleaning method among the six thatwere analysed, for different areas and different stone materials. Therefore, this study confirmsthe measurement of surface roughness as a reliable test to determine the suitability of stonecleaning methods; it is a non-destructive technique, portable and friendly to use, which canhelp us to rapidly assess—together with other techniques—the efficacy and aggressiveness ofthe stone cleaning method.
Keywords: surface properties, stone conservation, roughness, cleaning
Introduction, background and aims
The scientific contribution to heritage conservation must beto assess the efficacy and suitability of any method in thelaboratory and in situ before its application in the artwork,monument or building, as in the case of any stone cleaningmethod.
The assessment of stone cleaning methods can comprisemany tests, analyses, techniques and property determinationstudies.
Here we present a procedure combining the determinationof roughness, together with colour measurements and theobservation and analysis by SEM-EDS, before and aftercleaning. The former two are determined by the use ofnon-destructive and portable techniques; regarding the latter,
very small samples are needed and significant information isobtained from each of them.
Materials roughness is a physical characteristic of thesurface texture that can deeply affect their durability due to itsinfluence on particle retention and adhesion capacity, whichmay cause their further decay, e.g. organic matter particles,water drops and/or atmospheric pollution particles that canlead to soiling and salt crystallization processes (black crusts).In general, an increase in materials roughness also increasesthe specific surface and therefore, the material is more exposedto all environmental agents.
Roughness can be qualitatively or quantitatively assessedby means of different techniques at different scales:optical microscopy, scanning electron microscopy, confocalmicroscopy, atomic force microscopy, stylus profilometry,laser triangulation profilometry, reflected-light image analysis,
1742-2132/12/040108+10$33.00 © 2012 Sinopec Geophysical Research Institute Printed in the UK S108
Surface roughness to assess stone cleaning methods
white light interferometry, optical profilometry, digitalholography, etc. Among all of them, optical profilometry is acontact-free technique that consists of the projection of a gridof lines onto the surface at a certain angle, making evident anyirregularity in the surface.
In the case of stone decay and stone conservation, surfaceroughness has been measured to assess different processes,such as ageing, weathering or deterioration (Jaynes and Cooke1987, Guidobaldi and Mecchi 1993, Benavente et al 2003,Lopez-Arce et al 2010b), consolidation efficacy (Lopez-Arceet al 2010a), hydrophobization (Manoudis et al 2007, 2009,Della Volpe et al 2000, Illescas and Mosquera 2011) andalso the suitability of stone cleaning methods (Young et al1994, Grissom et al 2000, Colombo et al 2007, Alvarez deBuergo et al 2011). Moreover, even stone sculpture authorshipshave been analysed recently (Fort et al 2012), by measuringthe marks left on the stone surface by tools and engravingtechniques.
This study was performed at the end of 2009 and thebeginning of 2010, as part of the studies and analysis priorto the restoration project of the cloister of the cathedral ofSegovia, Spain. The efficacy and non-aggressiveness of thestone cleaning methods previously determined in the project—blasting-based methods (Iglesias et al 2006)—was the mainaim of this study, in order to apply the most adequate conditionsto avoid any further stone decay.
First references to roughness meters, to measure thematerials surface texture, go back to 1930, when 2D contactprofilometers were being used. Nowadays there are opticalor laser roughness meters that allow us to obtain 3D maps(topography) of the materials surface. Standard ISO 4287:1984defines roughness parameters as follows: Ra is the arithmeticmean of the absolute values of the deviations from the profileaverage; Rq is the deviation from the square root of themeasurement profile total; and Rz is the sum of the verticaldistances of the five highest (peaks) and the five deepest(valleys) values of each measurement.
Roughness measurements in heritage stone materials arevery useful to assess the efficacy and the aggressiveness ofcleaning methods, or to measure how consolidation productsapplied to these materials modify the surface roughness. Theless any treatment varies the surface roughness, the better,as when the characteristics of a material surface change,the material needs to adapt to the new conditions, meaningalteration.
The aim of this work is to assess the suitability andefficiency of a series of blasting-based stone cleaning methods,with the aid of the combination of the variation of the stonesurface measurements, together with colour measurements andSEM observations.
Materials and methods
Materials
The stone materials correspond to the stone masonry of theCathedral of Segovia, Spain, and the area to be cleaned, i.e. thecloister. The main building stones are dolomitic limestone—dolomitized oobioesparite according to Folk (1962), or
dolomitized packstone of oolites and bioclasts according toDunham (1962)—(white variety, W ), with dolomite, calciteand clay minerals as the main minerals; and a dolostone—micro and meso-crystalline dolostone (yellow variety, Y),mainly composed of dolomite, calcite, quartz, hematite andclay minerals.
Methods
Petrographic and mineralogical analysis. The petrographicanalysis of the stone materials and the surface deposits onthem was performed with the aid of an Olympus BX51polarized optical microscope fitted with an Olympus DP12digital camera. The carbonate rocks were partially stainedwith alizarin red to distinguish calcite from dolomite. Cross-sections of the stone samples were observed, analysing thesurface deposits to be removed by cleaning. Mineralogicalanalyses of the powder fraction from the entire samplewere performed by means of an x-ray diffractometer (PhilipsAnalytical PW 1752), operated at 40 kV and 30 mA, equippedwith a copper K-alpha anode tube, graphite monochromatorand PC-ADP diffraction software. Measurements were takenin the 2◦–65◦ range at a step size of 0.02◦, and 2◦ min−1 incontinuous mode.
A JEOL JSM 6400 scanning electron microscope was alsoused, with an EDS x-ray OXFORD-LINK PENTAFET micro-analyzer. Samples were analysed both as fragments and as thinsections, graphite sputtered to make them electron conductive.Both surface (fragments) and cross-sections (polished thinsections) were analysed. Analyses were performed before andafter cleaning trials.
Colour analysis. A MINOLTA CM-700d spectrophotometerwas used to measure CIELab (Commission Internationale del’Eclairage, CIE 1976) colour parameters (L∗, a∗ and b∗) undera D65 light source. L∗ denotes lightness, a∗ is the red–greenscale indicator (the more positive the value, the redder thespecimen and the more negative, the greener), and b∗ theblue–yellow scale indicator (the more positive the value, theyellower the specimen and the more negative, the bluer).
Colour parameters have been previously determined bysome of the co-authors for stone cleaning assessment purposes(Fort et al 2000, Perez-Monserrat et al 2011).
Roughness measurements. Roughness was measured witha TRACEit optical surface (OSR) roughness tester. Thisportable, white light analyser takes roughness measurementsnon-destructively and produces 3D topographic maps showingroughness on a micro-scale (microns). The measuring fieldwas 5 mm × 5 mm and the resolution along both the Z andthe X/Y-axes was 2.5 μm. The mean values for the roughnessparameters, Ra, Rq and Rz, were obtained from the 25 mm2 3Dmicro-topographic maps. Among these parameters, Rz wasselected as the best one to compare before and aftercleaning.
S109

C Vazquez-Calvo et al
(a)
(b)
Figure 1. (a) Selected area of white stone variety to be cleaned, and (b) the same area after cleaning trials. R is the reference testing area,which remained uncleaned for comparison purposes, and 1 to 6 are the testing areas in which the six cleaning operating conditions wereapplied.
Table 1. Particle nature and size, and cleaning pressure of thedifferent stone cleaning methods.
Operating Particle Particleconditions nature size Pressure
1 Glass micro-spheres 90/150 μm <1 atm2 Glass micro-spheres 90/150 μm > 1 <3 atm3 Aluminium oxide 150 105 μm <1 atm4 Aluminium oxide 150 105 μm > 1 <3 atm5 Aluminium oxide 180 88 μm <1 atm6 Aluminium oxide 180 88 μm > 1 <3 atm
Assessment of cleaning method. Different particle nature,particle size and pressure were tested, resulting in six differentoperating conditions (table 1). All particles were round-shaped(spheres).
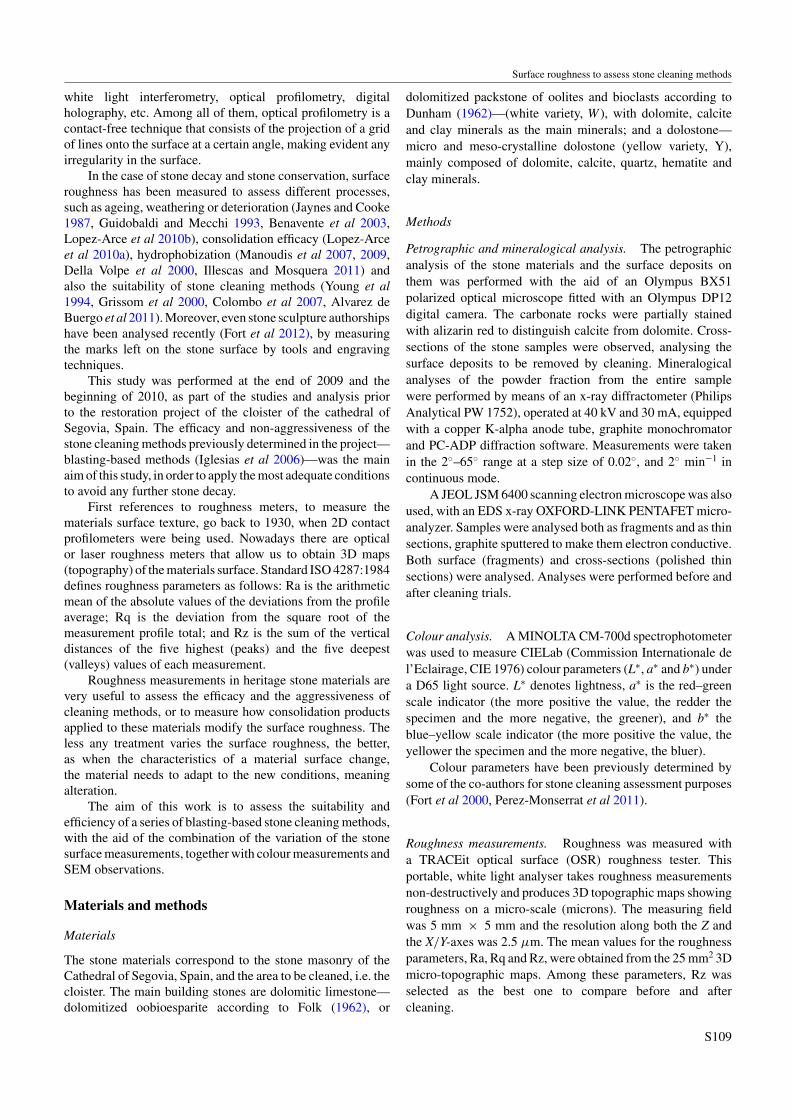
Cleaning tests were performed in the area to be cleaned(the cloister of the Cathedral) in both the white and yellowstone varieties. For this purpose, in each testing area, a net ofseven squares/rectangles were drawn with lime to be analysedbefore and after cleaning them with each of the six differentoperating conditions, plus one area of reference that remaineduncleaned for comparison purposes (figures 1 and 2).
Prior to the cleaning process, small samples from the stonesubstrate were petrographically studied, and the nature andthickness of the soiling or surface deposits determined, bypolarizing optical and scanning electron microscopy.
Colour and roughness were measured before and after thecleaning trials.
Regarding colour, the purpose was to determine theoperating conditions with which the total difference of colour,
according to CIELab 1976 (�E∗ = [(dL∗)2+(da∗)2+(db∗)2]12 ),
calculated from the cleaned testing areas with respect to thesame uncleaned areas, was the greatest. The higher the �E∗,the more effective the stone cleaning method, considering themethod removes the surface deposits on the stone.
With respect to roughness measurements, the mostefficient cleaning method should be one that removes the mostsurface deposits (or reduces the thickness of such surfacedeposits to the minimum), with minimum modification ofthe surface roughness. But it is likely that by increasing thestone surface roughness (which would result on increasingthe specific surface of the stone and therefore acceleratingits decay) and diminishing it too much so as to flatten it, inaddition to the removing the surface deposits, can go deep intothe stone, removing part of it as well.
Three measurements were performed in each testingrectangular area, considering two values of Rz, along boththe X and Y axes, and calculating the average and standarddeviation as the final value. 3D roughness maps were alsoobtained.
Results
Petrographical and mineralogical analyses of the stonevarieties
The ‘white variety’ is massive, hard and compact. It is ingeneral white coloured, with some reddish areas linked tofissures and to the concentration of iron-rich compounds (‘terrarosa’). It is a dolomitized oobiosparite according to Folk(1962), or a dolomitized packstone of oolites and bioclasts
S110
Surface roughness to assess stone cleaning methods
(a) (b)
(c) (d )
Figure 2. Plots (a) and (b) correspond to the selected area of yellow stone variety to be cleaned. Plots (c) and (d) are the same area aftercleaning trials. R is the reference testing area, which remained uncleaned for comparison purposes, and 1 to 6 are the testing areas in whichthe six cleaning operating conditions were applied.
according to Dunham (1962). It has a high content of bioclasts(20–30%), most of them are fragments of mainly gastropodsand bivalves. These bioclasts are dispersed and usually rangefrom 1 to 6 mm size, with their edges frequently micritized.Their inner structure is cemented by sparite crystals (calcite,with large crystals sometimes higher than 500 μm), and theyare included in a micrite matrix (cryptocrystalline dolomite),and slightly porous (intercrystalline porosity, pore size<2 mm). Micrite is sometimes concentrated in spherical andellipsoidal nodules (500–750 μm), which really account foroolites that have been micritized with significant dissolutionprocesses (that is the reason for the micrite edges). Porosity ofthis white variety is very high (25–30%), and mainly a mouldicporosity (intra- and intergranular).
XRD analyses revealed dolomite and calcite as the mainminerals, with traces of clay minerals (muscovite/illite) andalteration products (gypsum, epsomite, hydromagnesite andwavellite).
The ‘yellow variety’ corresponds to a very fine grain-size (micro-mesocrystalline, ranging from 30 to 100 μm)dolostone, composed of rhombic and equigranular crystals,
with dark and dirty crystal nuclei accounting for the dolomitealteration by dissolution, a typical alteration that occurs whenthe percentage of micro-pores is high.
Total porosity observed in thin section under thepolarizing optical microscope was estimated from 1% to 5%;it is an inter-crystalline porosity, irregular shaped pores, andusually with a pore diameter smaller than 500 μm. In somesamples of this type of dolostone, sparry carbonate cement(sparite) can be observed (in a percentage ranging from 1%to 5%). Also some dispersed quartz grains can be found inthis rock (up to 5%), monocrystalline and subangular shaped,with highly corroded rims, and a grain size from around 30 to60 μm.
The iron gel content is responsible for the yellowish-reddish colour of this stone variety. The iron-rich compoundsare heterogeneously distributed around the rock, surroundingdolomite crystals or concentrating in some points/areas. Thereare some clay minerals linked to the presence of these iron gels.
Mineralogically, XRD results show the presence ofdolomite as the main mineral, and quartz and hematite assecondary ones. Other minerals found in this dolostone (<5%)
S111
C Vazquez-Calvo et al
(a) (b)
(c ) (d )
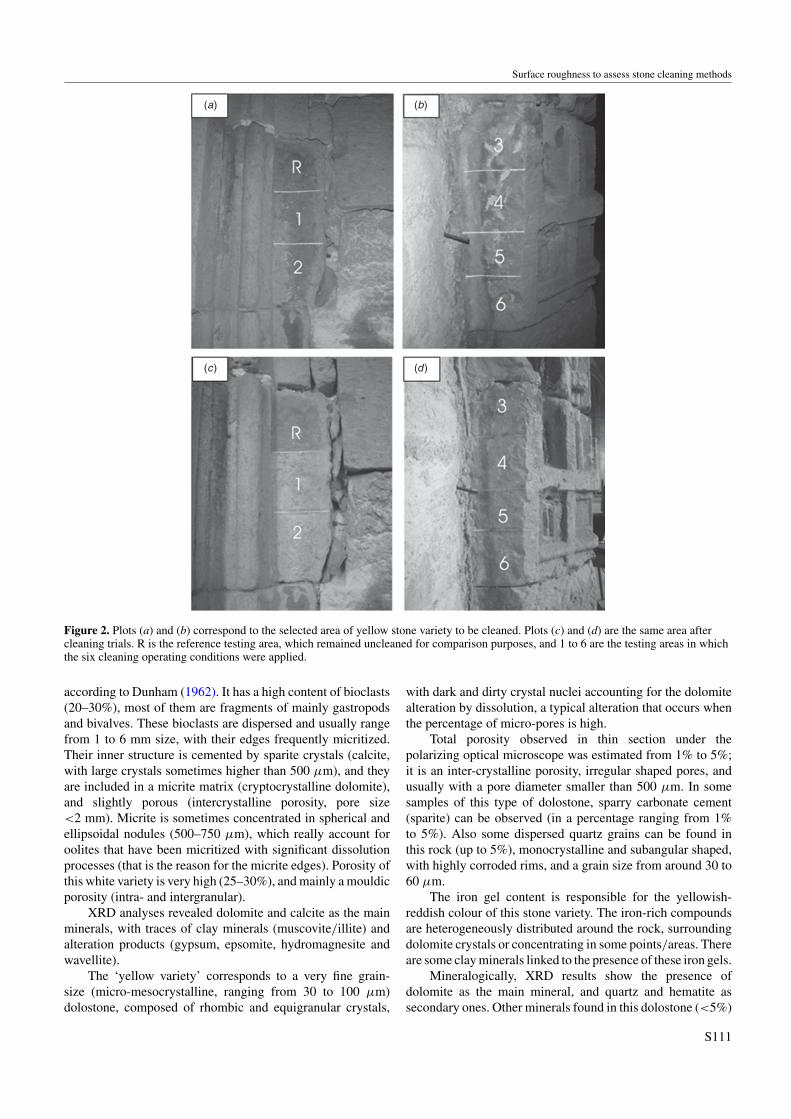
Figure 3. Polarizing optical microscopy images of stone cross sections with the surface deposits (white arrows) on top of the stone surfaces.Plots (a) and (b) white variety stone, natural and polarized light, respectively; (c) and (d) yellow variety stone, natural and polarized light,respectively.
are micas (muscovite and illite), clay minerals (smectite,palygorskite and kaolinite) and some salts as a result ofdecay processes to which the building is subjected (gypsum,hexahydrite, rozenite, wavellite and hydromagnesite).
Analysis of the deposits on the stone surface before cleaning
Figure 3 shows the appearance under a polarizing opticalmicroscope of both the stone substrates and the surfacedeposits on them, of both cross sections of the white(figures 3(a) and (b)) and yellow varieties (figures 3(c) and(d)). From these images a higher continuity of the surfacedeposits on the yellow stone with respect to the white one canbe observed, besides the fact that in both cases this soilingis not very thick (of micrometric scale) as well as that theinitial roughness of the white stone is slightly higher than ofthe yellow one.
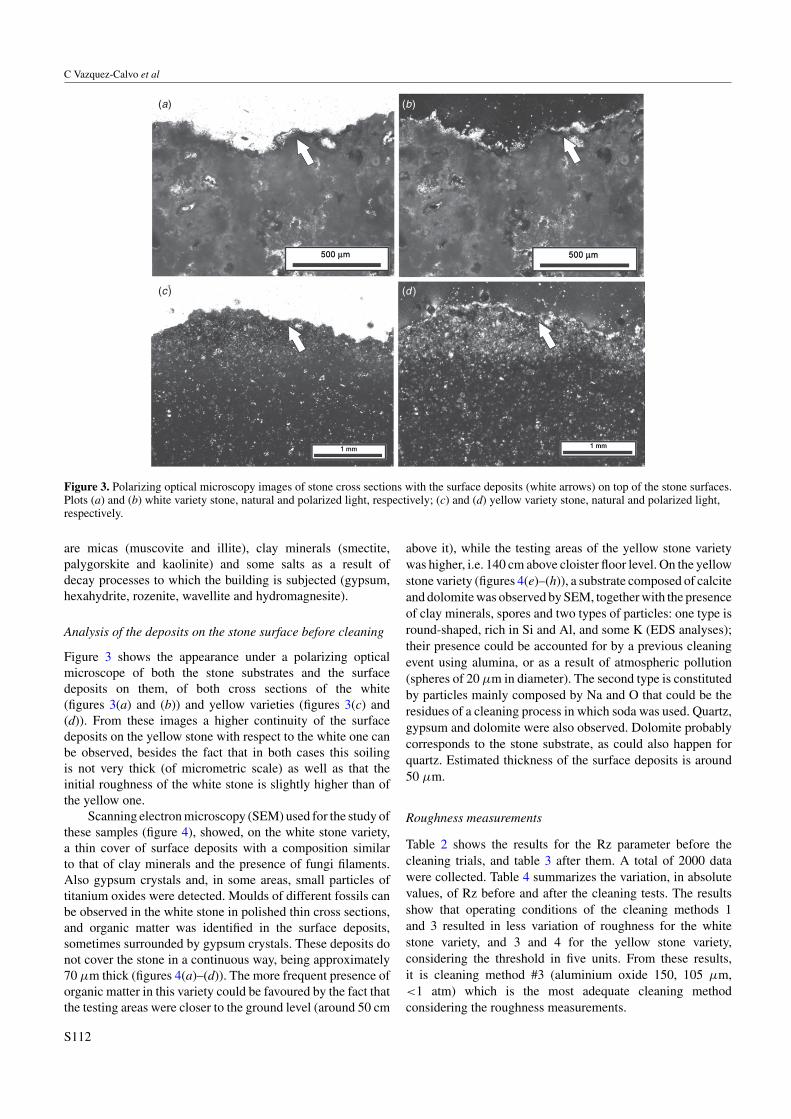
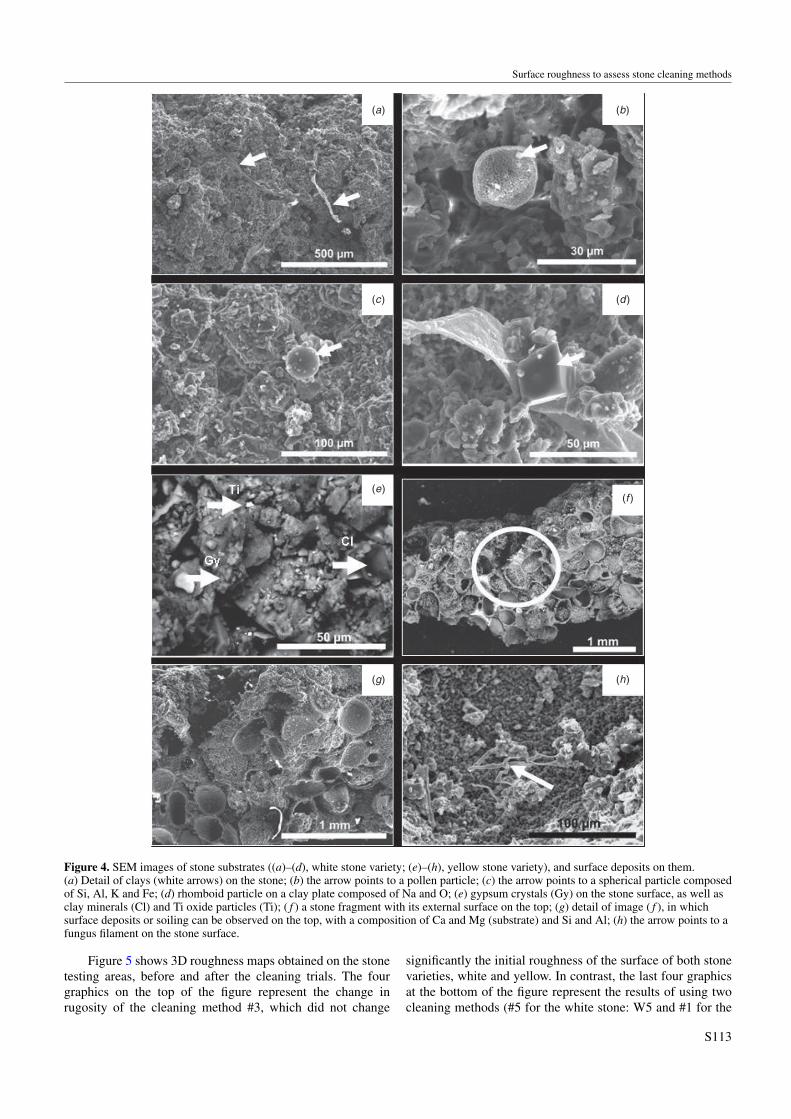
Scanning electron microscopy (SEM) used for the study ofthese samples (figure 4), showed, on the white stone variety,a thin cover of surface deposits with a composition similarto that of clay minerals and the presence of fungi filaments.Also gypsum crystals and, in some areas, small particles oftitanium oxides were detected. Moulds of different fossils canbe observed in the white stone in polished thin cross sections,and organic matter was identified in the surface deposits,sometimes surrounded by gypsum crystals. These deposits donot cover the stone in a continuous way, being approximately70 μm thick (figures 4(a)–(d)). The more frequent presence oforganic matter in this variety could be favoured by the fact thatthe testing areas were closer to the ground level (around 50 cm
above it), while the testing areas of the yellow stone varietywas higher, i.e. 140 cm above cloister floor level. On the yellowstone variety (figures 4(e)–(h)), a substrate composed of calciteand dolomite was observed by SEM, together with the presenceof clay minerals, spores and two types of particles: one type isround-shaped, rich in Si and Al, and some K (EDS analyses);their presence could be accounted for by a previous cleaningevent using alumina, or as a result of atmospheric pollution(spheres of 20 μm in diameter). The second type is constitutedby particles mainly composed by Na and O that could be theresidues of a cleaning process in which soda was used. Quartz,gypsum and dolomite were also observed. Dolomite probablycorresponds to the stone substrate, as could also happen forquartz. Estimated thickness of the surface deposits is around50 μm.
Roughness measurements
Table 2 shows the results for the Rz parameter before thecleaning trials, and table 3 after them. A total of 2000 datawere collected. Table 4 summarizes the variation, in absolutevalues, of Rz before and after the cleaning tests. The resultsshow that operating conditions of the cleaning methods 1and 3 resulted in less variation of roughness for the whitestone variety, and 3 and 4 for the yellow stone variety,considering the threshold in five units. From these results,it is cleaning method #3 (aluminium oxide 150, 105 μm,<1 atm) which is the most adequate cleaning methodconsidering the roughness measurements.
S112
Surface roughness to assess stone cleaning methods
(a) (b)
(c) (d )
(e)(f )
(g) (h)
Figure 4. SEM images of stone substrates ((a)–(d), white stone variety; (e)–(h), yellow stone variety), and surface deposits on them.(a) Detail of clays (white arrows) on the stone; (b) the arrow points to a pollen particle; (c) the arrow points to a spherical particle composedof Si, Al, K and Fe; (d) rhomboid particle on a clay plate composed of Na and O; (e) gypsum crystals (Gy) on the stone surface, as well asclay minerals (Cl) and Ti oxide particles (Ti); ( f ) a stone fragment with its external surface on the top; (g) detail of image ( f ), in whichsurface deposits or soiling can be observed on the top, with a composition of Ca and Mg (substrate) and Si and Al; (h) the arrow points to afungus filament on the stone surface.
Figure 5 shows 3D roughness maps obtained on the stonetesting areas, before and after the cleaning trials. The fourgraphics on the top of the figure represent the change inrugosity of the cleaning method #3, which did not change
significantly the initial roughness of the surface of both stonevarieties, white and yellow. In contrast, the last four graphicsat the bottom of the figure represent the results of using twocleaning methods (#5 for the white stone: W5 and #1 for the
S113

C Vazquez-Calvo et al
Table 2. Rz values (in μm) obtained before the cleaning tests, alongX and Y axes, in both yellow and white stone varieties.
Trial areas before cleaning X-axis Y-axis
White 1 44 ± 3 46 ± 10White 2 29 ± 5 30 ± 5White 3 30 ± 7 35 ± 11White 4 27 ± 6 32 ± 16White 5 25 ± 11 24 ± 8White 6 36 ± 13 31 ± 9Yellow 1 17 ± 11 21 ± 15Yellow 2 14 ± 9 19 ± 17Yellow 3 26 ± 6 26 ± 7Yellow 4 24 ± 15 26 ± 15Yellow 5 33 ± 13 39 ± 20Yellow 6 28 ± 11 34 ± 14
Table 3. Rz values (in μm) obtained after the cleaning tests, along Xand Y axes, in both white and the yellow stone varieties.
Trial areas after cleaning X-axis Y-axis
White 1 45 ± 4 50 ± 5White 2 45 ± 11 48 ± 13White 3 34 ± 5 38 ± 7White 4 37 ± 13 39 ± 16White 5 47 ± 5 50 ± 6White 6 20 ± 8 29 ± 14Yellow 1 32 ± 4 31 ± 1Yellow 2 30 ± 8 26 ± 6Yellow 3 30 ± 13 30 ± 10Yellow 4 27 ± 6 27 ± 4Yellow 5 37 ± 4 32 ± 6Yellow 6 26 ± 16 22 ± 8
Table 4. Rz value variations obtained before and after the cleaningtrials in both white and the yellow stone varieties.
Rz variation Rz variationTrial along X axis, μm along Y axis, μmareas (before/after) (before/after)
White 1 1 4White 2 16 18White 3 5 3White 4 11 7White 5 21 26White 6 −16 −2Yellow 1 15 9Yellow 2 15 7Yellow 3 4 4Yellow 4 2 1Yellow 5 3 −8Yellow 6 −3 −13
yellow stone: Y1). The increase of roughness after using thesemethods can be observed in these graphics.
From all the results it can be inferred that in general,roughness after cleaning increases more in the white stonevariety than in the yellow one.
Colour measurements
In table 5 the values of colour measurements on the stonetesting areas—both in the white and yellow varieties—before
Table 5. Chromatic parameters obtained in the stone trial areasbefore cleaning tests.
Trial areasbefore cleaning L∗ a∗ b∗ C∗
White 1 61 ± 2 2.9 ± 0.1 14 ± 1 15 ± 1White 2 59 ± 5 2.9 ± 0.2 14 ± 1 14 ± 1White 3 52 ± 4 3.2 ± 0.3 14 ± 1 14 ± 1White 4 49 ± 4 3.1 ± 0.2 13 ± 1 14 ± 1White 5 56 ± 2 3.4 ± 0.1 15 ± 1 15 ± 1White 6 56 ± 3 3.5 ± 0.4 15 ± 1 16 ± 1Yellow 1 52 ± 1 4.9 ± 0.4 20 ± 1 20 ± 1Yellow 2 50 ± 3 4.5 ± 0.5 18 ± 1 18 ± 1Yellow 3 48 ± 4 3.2 ± 0.4 15 ± 1 15 ± 1Yellow 4 44 ± 3 3.5 ± 0.7 15 ± 2 16 ± 2Yellow 5 46 ± 4 4.0 ± 0.3 17 ± 2 17 ± 2Yellow 6 49 ± 4 4.1 ± 0.3 18 ± 2 18 ± 2
Table 6. Total colour change calculated on the cleaned stone testingareas with respect to the same uncleaned ones (before/aftercleaning).
Testing area �E Testing area �E
White 1 13 Yellow 1 8White 2 13 Yellow 2 10White 3 20 Yellow 3 14White 4 21 Yellow 4 12White 5 13 Yellow 5 10White 6 16 Yellow 6 11
the cleaning trials are shown, and the total colour change�E∗ calculated from measuring cleaned areas with respectto the uncleaned ones can be observed in table 6. In generalterms, results show how the cleaning methods seem to be moreeffective for the white stone (higher �E∗) than for the yellow.
Analysis of the deposits on the stone surface after cleaning
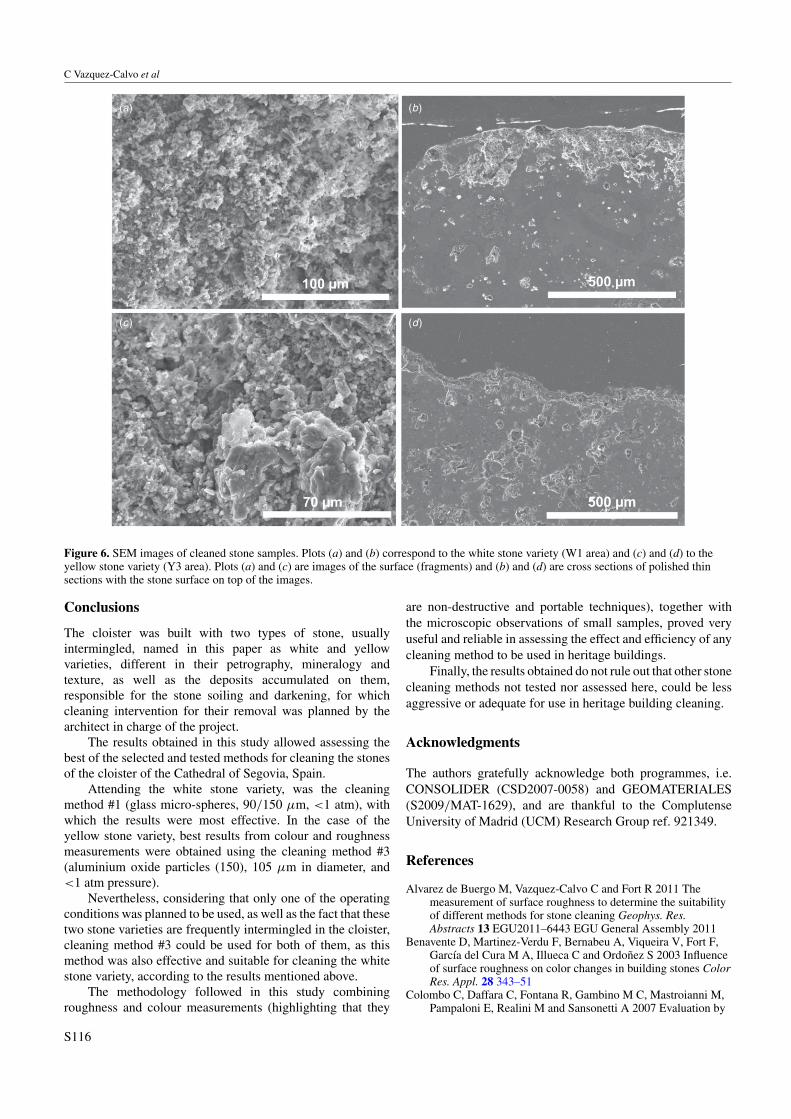
After the stone cleaning tests, two samples cleaned withtwo methods that provided good results in terms ofroughness measurements were analysed under scanningelectron microscopy (figure 6), both looking at the stonesurface (fragment samples) (figures 6(a) and (c)) and to thestone cross-section (polished thin sections) (figures 6(b) and(d)), in both stone varieties.
In the white stone variety, remains of surfacedeposits/soiling can still be observed in the valleys of thestone surface, which means that the cleaning method removedmost of the stone surface deposits, leaving a rougher surface(higher roughness) as observed in the yellow stone, confirmedby the roughness results above mentioned.
In the yellow stone variety, a continuous surface depositcover is still observed. This fact confirms what was obtainedby means of colour measurements, i.e. cleaning of the whitestone, using the same earlier methods, was more effective inthe white variety than in the yellow.
S114

Surface roughness to assess stone cleaning methods
(a) (b)
(c) (d )
(e)(f )
(g) (h)
Figure 5. 3D roughness maps of stone samples before (left column) and after cleaning (right column): (a), (b), (e), ( f ) white stone varietysamples; (c), (d), (g), (h) yellow stone variety samples; (b), (d) cleaning operating conditions #3; ( f ) cleaning operating conditions #5;(h) cleaning operating conditions #1.
S115
C Vazquez-Calvo et al
(a) (b)
(c ) (d)
Figure 6. SEM images of cleaned stone samples. Plots (a) and (b) correspond to the white stone variety (W1 area) and (c) and (d) to theyellow stone variety (Y3 area). Plots (a) and (c) are images of the surface (fragments) and (b) and (d) are cross sections of polished thinsections with the stone surface on top of the images.
Conclusions
The cloister was built with two types of stone, usuallyintermingled, named in this paper as white and yellowvarieties, different in their petrography, mineralogy andtexture, as well as the deposits accumulated on them,responsible for the stone soiling and darkening, for whichcleaning intervention for their removal was planned by thearchitect in charge of the project.
The results obtained in this study allowed assessing thebest of the selected and tested methods for cleaning the stonesof the cloister of the Cathedral of Segovia, Spain.
Attending the white stone variety, was the cleaningmethod #1 (glass micro-spheres, 90/150 μm, <1 atm), withwhich the results were most effective. In the case of theyellow stone variety, best results from colour and roughnessmeasurements were obtained using the cleaning method #3(aluminium oxide particles (150), 105 μm in diameter, and<1 atm pressure).
Nevertheless, considering that only one of the operatingconditions was planned to be used, as well as the fact that thesetwo stone varieties are frequently intermingled in the cloister,cleaning method #3 could be used for both of them, as thismethod was also effective and suitable for cleaning the whitestone variety, according to the results mentioned above.
The methodology followed in this study combiningroughness and colour measurements (highlighting that they
are non-destructive and portable techniques), together withthe microscopic observations of small samples, proved veryuseful and reliable in assessing the effect and efficiency of anycleaning method to be used in heritage buildings.
Finally, the results obtained do not rule out that other stonecleaning methods not tested nor assessed here, could be lessaggressive or adequate for use in heritage building cleaning.
Acknowledgments
The authors gratefully acknowledge both programmes, i.e.CONSOLIDER (CSD2007-0058) and GEOMATERIALES(S2009/MAT-1629), and are thankful to the ComplutenseUniversity of Madrid (UCM) Research Group ref. 921349.
References
Alvarez de Buergo M, Vazquez-Calvo C and Fort R 2011 Themeasurement of surface roughness to determine the suitabilityof different methods for stone cleaning Geophys. Res.Abstracts 13 EGU2011–6443 EGU General Assembly 2011
Benavente D, Martinez-Verdu F, Bernabeu A, Viqueira V, Fort F,Garcıa del Cura M A, Illueca C and Ordonez S 2003 Influenceof surface roughness on color changes in building stones ColorRes. Appl. 28 343–51
Colombo C, Daffara C, Fontana R, Gambino M C, Mastroianni M,Pampaloni E, Realini M and Sansonetti A 2007 Evaluation by
S116

Surface roughness to assess stone cleaning methods
laser micro-profilometry of morphological changes induced onstone materials by laser cleaning LACONA VI: Lasers in theConservation of Artworks (Vienna, Austria, 21–25 Sept. 2005)(Springer Proceedings in Physics vol 116) ed J Nimmrichter,W Kautek and M Schreiner (Berlin: Springer) pp 523–26
Della Volpe C, Penati A, Peruzzi R, Siboni S, Toniolo Land Colombo C 2000 The combined effect of roughnessand heterogeneity on contact angles: the case of polymercoating for stone protection J. Adhes. Sci. Technol.14/2 273–99(27)
Dunham R J 1962 Classification of carbonate rocks according todepositional texture Classification of Carbonate Rocks vol 1ed W E Ham (American Association of Petroleum GeologistsMemoir) pp 108–21
Folk R L 1962 Spectral subdivision of limestone types Classificationof Carbonate Rocks vol 1 ed W E Ham (AmericanAssociation of Petroleum Geologists Memoir) pp 62–84
Fort R, Mingarro F, Lopez de Azcona M C and Rodrıguez Blanco J2000 Chromatic parameters as performance indicators forstone cleaning techniques Color Res. Appl. 25 442–6
Fort R, Vazquez-Calvo C, Chapa T, Martınez-Navarrete Iand Belen M 2012 An analytical study of Iberian Iron Agestone sculptures and their surface marks Archaeometrydoi:10.1111/j.1475-4754.2012.00686.x
Grissom C A, Charola A E and Wachowiak M J 2000 Measuringsurface roughness on stone: back to basics Stud. Conserv.45/2 73–84
Guidobaldi F and Mecchi A M 1993 Corrosion of ancient marblemonuments by rain: evaluation of pre-industrial recession ratesby laboratory simulations Atmos. Environ. B 27 339–51
Iglesias M, Gea B, Prada J L and Guasch N 2006 Low-pressureabrasive cleaning of historic building materials Heritage,Weathering and Conservation vol 2 ed R Fort, M Alvarez de
Buergo, M Gomez-Heras and C Vazquez-Calvo (Balkema,Leiden) pp 681–6
Illescas J F and Mosquera M J 2011 Surfactant-synthesizedPDMS/silica nanomaterials improve robustness and stainresistance of carbonate stone J. Phys. Chem. C 115 14624–34
Jaynes S M and Cooke R U 1987 Stone weathering in SoutheastEngland Atmos. Environ. 21 1601–22
Lopez-Arce P, Gomez-Villalba L S, Pinho L, Fernandez-Valle M E,Alvarez de Buergoa M and Fort R 2010a Influence of porosityand relative humidity on consolidation of dolostone withcalcium hydroxide nanoparticles: effectiveness assessmentwith non-destructive techniques Mater. Charact. 61 168–84
Lopez-Arce P, Varas-Muriel M J, Fernandez-Revuelta B, Alvarez deBuergo M, Fort R and Perez-Soba C 2010b Artificialweathering of Spanish granites subjected to salt crystallizationtests: surface roughness quantification Catena 83 170–85
Manoudis P, Karapanagiotis I, Tsakalof A, Zuburtikudis I,Kolinkeova B and Panayiotou C 2009 Superhydrophobic filmsfor the protection of outdoor cultural heritage assets Appl.Phys. A 97 351–60
Manoudis P, Papadopoulou S, Karapanagiotis I, Tsakalof A,Zuburtikudis I and Panayiotou C 2007 Polymer-silicananoparticles composite films as protective coatings forstone-based monuments J. Phys.: Conf. Ser. 61 1361–5
Perez-Monserrat E M, Varas M J, Fort R and Alvarez de Buergo M2011 Cleaning methods assessment for the limestone facadesof the formerly Workers Hospital of Madrid, Spain Stud.Conserv. 56 297–312
Young M E, Andrew C A, MacDonald J, Thomson B W,Tonge K H, Urquhart D C M, Webster R G M and Wilson M J1994 Stonecleaning in Scotland Alteracion de granitos y rocasafines. Deterioro de monumentos historicos ed V Molinapp 173–9
S117
Related Documents