The MD Baystat website shows large P reductions in all three Eastern Shore tribs for 1985-2000, especially the lower Eastern Shore. The narrative for.
Dec 26, 2015
Welcome message from author
This document is posted to help you gain knowledge. Please leave a comment to let me know what you think about it! Share it to your friends and learn new things together.
Transcript
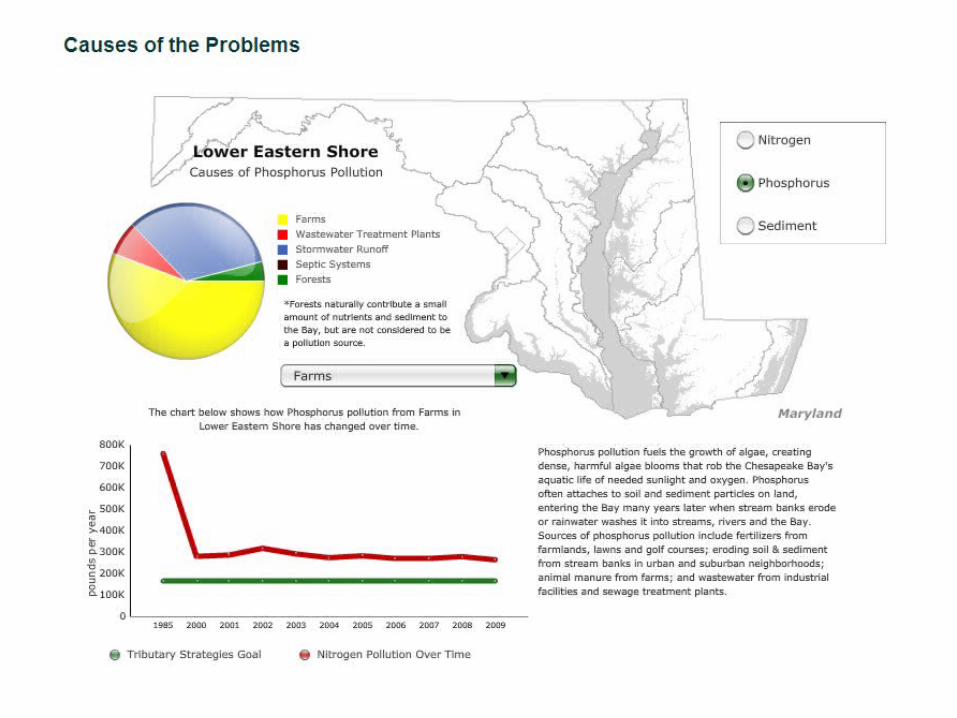
The MD Baystat website shows large P reductions in all three Eastern Shore tribs
for 1985-2000, especially the lower Eastern Shore.
The narrative for what actions generated these
reductions is largely absent.


What about monitoring data?
Unfortunately the only long-term site on the Eastern Shore is at
Greensboro on the upper Choptank. RIM load data expressed on a per
acre basis don’t suggest downward trends in TSS, P or N. WS 4.3
sediment loads for the Choptank seem high. LES??

Greensboro annual TP loads 1981-2009 calendar years
1980 1985 1990 1995 2000 2005 2010
Ann
ual t
otal
P d
isch
arge
(kg
/ha)
0.0
0.2
0.4
0.6
0.8
1.0
1.2
1.4
1.6Annual - USGS RIM data4 year rolling averageBPWSM4.3 total diffuse

Discussions Regarding How P Reductions from Agriculture on the Eastern Shore of
Maryland were Projected in the CBP Watershed Model for 1985-2000
MD DNRFebruary 16, 2011
Follow-up June 2011
Ken Staver
University of MarylandCollege of Agriculture and Natural Resources
Wye Research and Education CenterQueenstown, Maryland
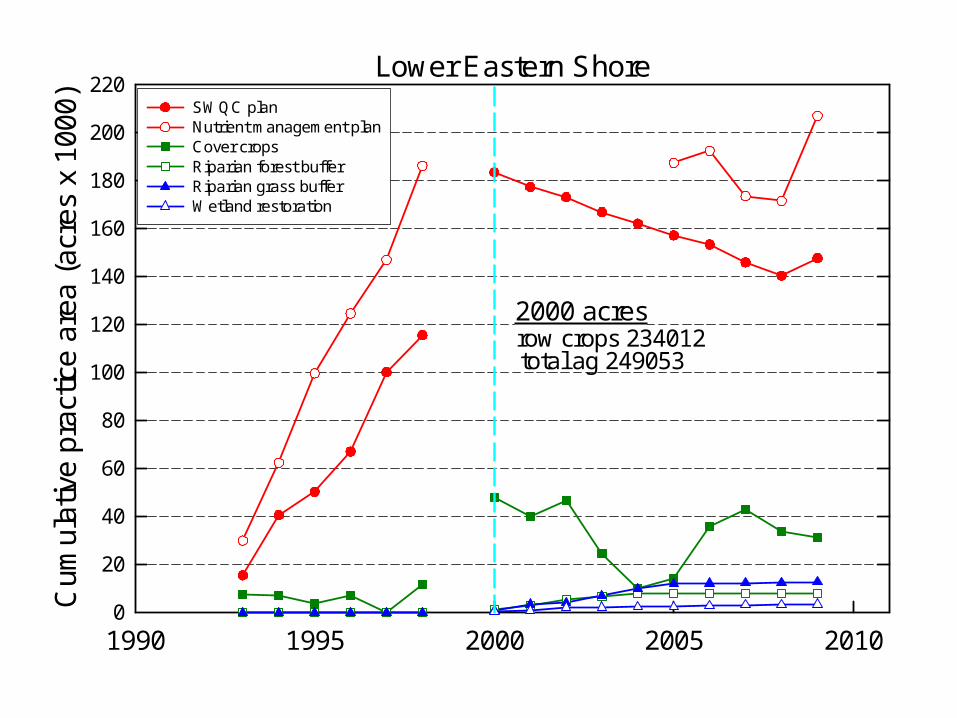
Lower Eastern Shore
1990 1995 2000 2005 2010
Cum
ulat
ive
prac
tice
area
(ac
res
x 10
00)
0
20
40
60
80
100
120
140
160
180
200
220SWQC planNutrient management planCover cropsRiparian forest bufferRiparian grass bufferWetland restoration
2000 acresrow crops 234012total ag 249053

The primary question remains: How were the effects of
implementation of N-based NMP and Soil and Water
Conservation Plans handled in the WSM to generate such
large reductions in delivered P loads from ag on the LES from
1985-2000?
Scientific and Technical Advisory Committee
September 14, 2011
Nutrient Transport in Maryland Coastal Plain Watersheds:
What We Know and What Next Ken Staver
University of MarylandCollege of Agriculture and Natural Resources
Wye Research and Education CenterQueenstown, Maryland
Objective 1 To gain an in-depth understanding
of how the CBP watershed model currently simulates phosphorus loads from cropland and whether the current simulation approach is consistent with the latest scientific consensus regarding phosphorus transport mechanisms.
Objective 2 To make recommendations
regarding how the CBP modeling approach should b restructured to more accurately reflect the latest research findings regarding phosphorus transport processes and what data inputs will be needed to support calibration and verification of a restructured modeling approach.

Richard Feynman - 1986
“For a successful technology, reality must take precedence over pubic relations,
for nature cannot be fooled.”
“Therefore, things must be learned only to be unlearned again or, more likely, to be corrected… The test of all knowledge is
experiment.”

Concluding Remarks
“The overall long-term goal of efforts to reduce P losses from agriculture
to surface waters should aim to balance off-farm inputs of P in feed
and fertilizer with P outputs as produce, along with managing soils
in ways that retain nutrients and applied P resources.”
Research Bottom Line
1. Soil P concentrations and how we manage P applications are the major drivers for P losses that we can control.
2. Changes in loads only come from changes in drivers. Need high quality pre- and post data sets. Baseline?
3. Small scale monitoring of runoff P losses impractical.
Related Documents