Welcome message from author
This document is posted to help you gain knowledge. Please leave a comment to let me know what you think about it! Share it to your friends and learn new things together.
Transcript

COMMISSION FOR AGRICULTURAL COSTS AND PRICESDepartment of Agriculture & Cooperation
Ministry of AgricultureGovernment of India
New DelhiMarch 2013
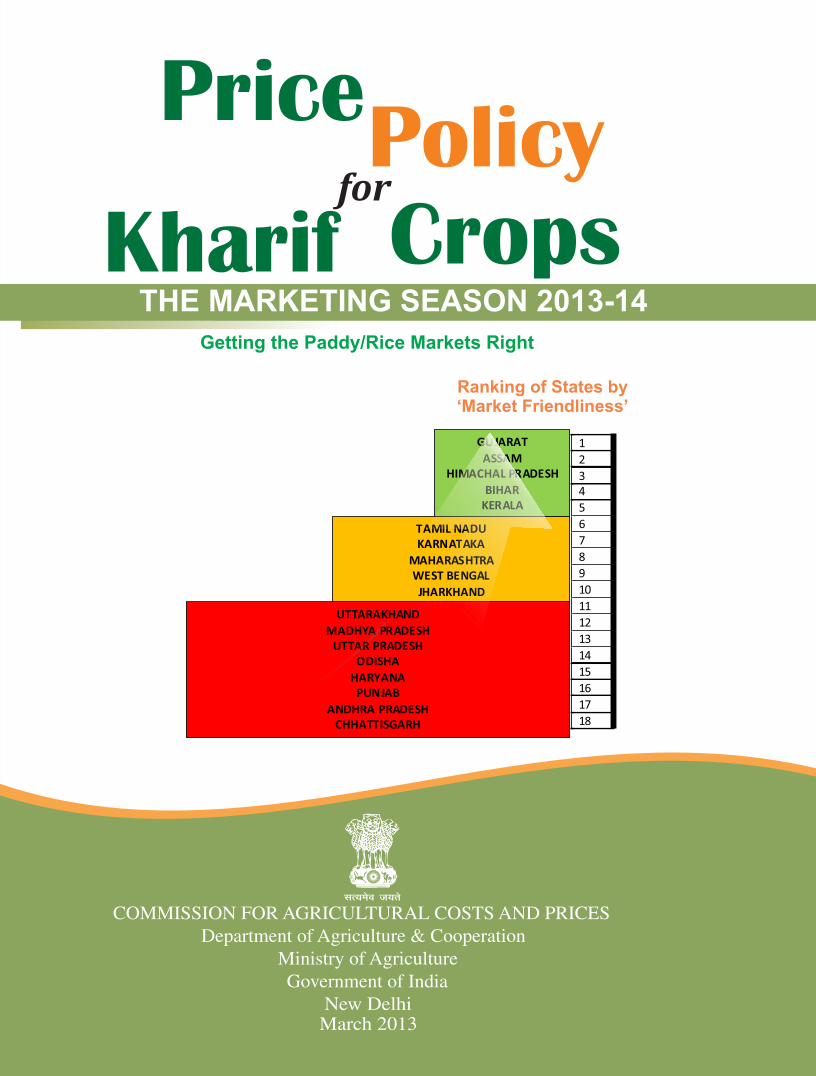
THE MARKETING SEASON 2013-14
forPolicyPrice
Kharif Crops


CONTENTSS. No. Description Page
Acronyms i-ii
List of Tables iii
List of Charts iv-v
List of Annex Tables vi
Summary of Recommendations viii-xii
1. Overview 1-9
2. Demand-Supply, Procurement, Prices and Market Distortions 10-26
3. India’s Trade Competitiveness 27-38
4. Costs, Returns and Inter Crop Price Parity 39-50
5. Productivity: Different Dimensions 51-62
6. Recommendations for Price Policy 63-68
Annex Tables 69-95

forPolicy
Kharif CropsPrice
i
List of AcronymsA2+FL Actual paid out cost plus imputed value of family labourAPMC Agricultural Produce Market CommitteeBGREI Bringing Green Revolution to Eastern IndiaC2 Comprehensive cost including imputed rent and interest on owned
land and capital respectively. CAB Cotton Advisory BoardCACP Commission for Agricultural Costs and PricesCAGR/CARG Compound Annual Growth Rate/Compound Annual Rate of GrowthCAP Cover and PlinthCCTs Conditional Cash Transfers CCI Cotton Corporation of IndiaCIF Cost, Insurance & FreightCF Correction factorCoP Cost of ProductionCS Comprehensive SchemeCSO Central Statistics OfficeCV Coefficient of VariationCWC Central Warehousing Corporation DAC Department of Agriculture & CooperationDCT Direct Cash TransferDES Directorate of Economics & StatisticsDFPD Department of Food & Public DistributionDGCIS Directorate General of Commercial Intelligence and StatisticsDGFT Directorate General of Foreign TradeDIPP Department of Industrial Policy & PromotionECA Essential Commodities Act F&V Fruits & VegetablesFAI Fertilizer Association of IndiaFAO Food and Agriculture Organization FCI Food Corporation of India

forPolicy
Kharif CropsPrice
ii
FFPI FAO Food Price Index FOB Free on BoardFY Financial YearGCF Gross Capital FormationGDP Gross Domestic ProductGVO Gross Value of OutputICAC International Cotton Advisory CommitteeIPGA India Pulses & Grains AssociationKMS Kharif Marketing SeasonLPA Long Period AverageMEP Minimum Export PriceMMTC Minerals and Metals Trading CorporationMGNREGA Mahatma Gandhi National Rural Employment Guarantee ActMSP Minimum Support PriceMSR Marketed Surplus RatioNAFED National Agricultural Cooperative Marketing Federation of India Limited NBS Nutrient Based SubsidyNCAER National Council of Applied Economic ResearchNCCF National Cooperative Consumers’ Federation of India LimitedNFSB National Food Security BillNFSM National Food Security MissionNSC National Seeds CorporationOEA Office of Economic AdviserOGL Open General LicensePDS Public Distribution SystemPPP Public-Private-Partnership PSS Price Support Scheme Qtl QuintalR & M Rapeseed and MustardRMS Rabi Marketing SeasonSEAI Solvent Extractors’ Association of IndiaSEWA Self Employed Women’s AssociationSOPA Soybean Processors Association of IndiaSPV Special Purpose VehicleSTC State Trading CorporationTE Triennium EndingTFP Total Factor ProductivityTRQ Tariff Rate QuotaUNDP United Nations Development ProgrammeUSDA United States Department of AgricultureVAT Value added TaxVGF Viability Gap FundingVVOF Directorate of Vanaspati, Vegetable Oils and FatsWPI Wholesale Price IndexWTO World Trade Organization

forPolicy
Kharif CropsPrice
iii
List of TablesTable No.
Topic Page No.
Table S.1 Actual and Recommended MSPs of Kharif crops xiiTable 2.1 Stock- to- Use Ratios of Kharif Crops 11Table 2.2 Major States Imposing Taxes/Levies (as % of MSP) (KMS
2013-14)20
Table 2.3 Time line of EC Act 1955 (Amendment Orders) 2002-2012 22Table 2.4 Ranking of major states according to the distortions created
in paddy/rice market25
Table 4.1 All India Gross and Net Returns on actual estimates of cost of Cultivation of Kharif Crops for the years from 2008-09 to 2010-11
40
Table 4.2 All India Projected Cost of Production (A2+FL & C2) of Kharif Crops for 2013-14 Marketing Season
44
Table 4.3 Relative returns (%) of Kharif crops over A2+FL and C2 (2008-09 to 2010-11)
50
Table 5.1 Growth Rates of Kharif Crops at All India Level during 1980s, 1990 and 2000s
52
Table 5.2 Water Productivity for Production of one kg of Rice in key Paddy Producing States
54
Table 5.3 Impact of Variation in Yield on CoP (%) 55Table 5.4 Benchmarking of Important Crops, TE 2011-12 58-59Table 5.5 Drivers of Yield- Kharif Crops 60Table 5.6 Gap in Irrigation Potential Created and Outlays Required to
Attain Full Potential61
Table 5.7 Public and Private Investment in Agriculture R & D, 2012-13 62Table 6.1 Recommended MSPs of Kharif Crops (KMS 2013-14) and
their Justification67

iv
List of ChartsFigure
No.Topic Page
No.
Chart 1.1 Comparative growth in GDP (overall) and GDP (agri) during Plan periods
2
Chart 1.2 India’s Exports and Imports of Agri- Commodities 3
Chart 1.3 Central Pool Stocks with FCI 4
Chart 1.4 Contribution of various items to Inflation in Primary Food Articles
5
Chart 1.5 Price Inflation in Rice & Wheat, 2011-12 & 2012-13 5
Chart 1.6 Composition of Public Expenditure on Agriculture 7
Chart 2.1 Rice Procurement as % of Production & Market Surplus 12
Chart 2.2 Rice Procurement as a % of Marketed Surplus, TE 2011-12 13
Chart 2.3 Rice Production & Procurement as a share of production in Chhattisgarh
14
Chart 2.4 Economic Cost of Rice Procurement to FCI 15
Chart 2.5 (a) – (h)
Wholesale price trends of Major Kharif Crops 16-17
Chart 2.6 Levy rates for Rice for KMS 2012-13 21
Chart 3.1 Composition of India’s Agri-Exports & Agri-Imports, TE 2011-12
28
Chart 3.2 India’s Exports of Rice from 2001-02 to 2011-2012 29
Chart 3.3 International vs Domestic Prices of Rice 29

forPolicy
Kharif CropsPrice
v
Chart 3.4 India’s Exports of Maize from 2001-02 to 2011-12 30
Chart 3.5 International vs Domestic Prices of maize 30
Chart 3.6 International vs Domestic Prices of Jowar 31
Chart 3.7 India’s Exports and Imports of Pulses (Volume) 32
Chart 3.8 International vs Domestic Prices of Arhar 32
Chart 3.9 International vs Domestic Prices of Urad 32
Chart 3.10 International prices vs Domestic prices of Moong 33
Chart 3.11 International vs Domestic prices of Soyabean and Soyabean Oil
35
Chart 3.12 India’s exports of soyabean meal from 2001-02 to 2011-12 35
Chart 3.13 International vs Domestic Prices of soyabean meal 35
Chart 3.14 International vs Domestic Prices of Groundnut and Groundnut Oil
36
Chart 3.15 International vs Domestic Prices of Sunflower Seed and Sunflower Oil
36
Chart 3.16 India’s Exports of Cotton from 2001-02 to 2011-12 37
Chart 3.17 International vs Domestic Prices of cotton (Lint) 37
Chart 4.1 Average Annual growth rate of agriculture labour wage rate (Rs/day) by states and at All-India level in Nominal terms (Jan-Dec 2009 to Jan–Dec 2012)
41
Chart 4.2 WPI and Percentage Increase in Prices of Farm Inputs (Dec 2012 over Dec 2011)
42
Chart 4.3 Relative Prices of Urea, DAP & MOP 43
Chart 4.4 (a to m)
Projected Cost and Supply of Kharif Crops by States for 2013-14
45-49
Chart 5.1 (i) to (xiv)
Relationship Between Cost of Production and Yield levels of kharif Crops, Based on panel data of various States for 2000-01 to 2010-11
56-57
Box 2.1 Chhattisgarh: State policy triggering distortions in rice market
14

ix
List of Annex TablesTable No.
Title Page No.
Table No. 2.1 All India Estimates of Area, Production and Yield of All Crops 71-73
Table No. 2.2 Availability of Kharif Crops 74-76
Table No. 2.3 Methodology of Ranking of States by the Nature and Degree of Distortions in Paddy/Rice Market
77-79
Table No. 2.4 States/Centres where prices of kharif crops dipped below MSP during 2011-12 marketing season
80-83
Table No. 4.1 State-wise Gross and Net returns on actual estimates of cost of cultivation of Kharif crops (Average of 2008-09 to 2010-11)
84-87
Table No. 4.2 Month-wise average daily wage rates for Agricultural Labour (Man)
88-89
Table No. 4.3 Farm Inputs: Index Numbers of Wholesale Prices 90
Table No. 4.4 State-wise Projected Cost of Production (C2 & A2+FL) for Kharif 2013-14 and their shares in Production in increasing order of Cost
91-92
Table No. 4.5 Index of Terms of Trade Between Agriculture and Non-Agriculture Sectors
93
Table No. 6.1 MSP Recommended by State Governments for the Kharif Crops of 2012-13
94
forPolicy
Kharif CropsPrice
Rising India's agri-exports
vi


Summary of RecommendationsS.1 In the last report on price policy for kharif crops, 2012-13 season, the Commission had recommended a major re-alignment of MSPs of various crops with a view to ‘get the prices right’. The Government accepted all those recommendations taking a major step in that direction. This report for kharif crops of 2013-14 season recommends only marginal changes in MSPs, but major changes in the functioning of markets to ‘get the markets right’. This will set the basis for efficient functioning of agri-markets, remunerative prices for farmers and taking Indian agriculture forward to at least a 4 percent growth trajectory. The non-price policy recommendations to ‘get the markets right’ as well as with respect to the NFSB, will also serve the poor consumers much better than has been the case so far.
Non-price Policy Recommendations
Paradox of overflowing granaries and rising food pricesS.2 The major challenge faced by the Indian food sector today is to manage the ‘problem of plenty of rice/wheat stocks’ prudently. The credit of abundance of grains goes to the Indian farmer but if this surplus is not managed judiciously, it inflicts huge economic losses on the food economy. The current situation of overflowing granaries (80.5 million tonnes of grain stocks on 1st July, 2012 and likely to cross 90 million tonnes in July 2013) co-existing with a sharp rise in prices of rice & wheat (in January 2013, wheat and rice prices were higher by 21 percent and 17 percent respectively over January, 2012) speaks about gross sub-optimal management of food economy.
S.3 Another anomaly is that paddy farmers in the entire eastern belt are selling much of their paddy at 10 to 20 percent below the MSP, while FCI is accepting procured
forPolicy
Kharif CropsPrice
viii

forPolicy
Kharif CropsPrice
paddy/rice from states (like Punjab, Haryana, Andhra Pradesh, Chhattisgarh, etc) at 10 to 15 percent above MSP due to high taxes and other statutory levies imposed by these states. Some states, notably Chhattisgarh, is also giving a bonus of Rs 270/qtl on paddy, which works out to more than 20 percent of current MSP. As a result, not only private trade is crowded out, but also rakes of paddy from these regions (especially eastern Uttar Pradesh, Bihar, Odisha, etc) are sent to Punjab/Haryana/Chhattisgarh, and after milling, in many cases, the same paddy comes back as rice through the Public Distribution System (PDS) at huge costs. These two illustrations are indicative of existence of gross distortions in paddy/rice markets, calling for urgent reform with a view to ‘get the markets right’. Accordingly, the Commission makes the following non-price policy recommendations:
Liquidation of StocksS.4 At least 15 million tonnes of stocks need to be urgently liquidated and the sales need to be at the last year’s MSP plus a maximum of 5 percent towards taxes/cesses etc. At these rates wheat price will be Rs 1350/qtl and rice price will be Rs 1900/qtl, say ex-Punjab. Further, by permitting private sector to lift from government godowns to sell in the domestic market or export, the government will make huge savings in terms of reduced cost of carrying these stocks, for even up to three years. The Centre also needs to review its open ended procurement policy and take a policy decision to not accept more than say, 75 percent of last year’s procurement from states that impose taxes and levies beyond 5% of MSP, or give special bonus on top of MSP. This is a necessary step to bring about rationality in pricing, contain the food subsidy bill and ‘getting the markets right’. Else, the Commission fears that a major crisis in food management will unfold, leading to large economic losses that the country can ill afford.
Resolving the Imbalance between Subsidies & Investments in AgricultureS.5 It is commendable to see that the public expenditure on agriculture as a percentage of agri-GDP has almost doubled between 2000-01 and 2011-12. But almost 80 percent of this is going as input subsidies and only 20 percent as investments in agriculture. As input subsidies have much lower marginal rates of return than investments, the Commission recommends that at least fertilizer subsidy, which has increased by more than 5 times during the last 10 years, must be restructured and rationalized. This calls for direct transfer of fertilizer subsidy to farmers on per hectare basis, and decontrolling the fertilizer sector with free imports. This will go a long way to correct the unbalanced use of N, P and K, as also encourage investments in fertilizer industry, which have remained dormant for more than a decade.
Stable and Open Agri-Trade PolicyS.6 Agri-trade continues to be strictly regulated and any adverse price movement makes the Government adopt knee-jerk trade, tariff and administrative means to restrain prices. Despite this, Indian agriculture sector has been a net exporter earning a large trade surplus. In 2011-12 alone, agri-exports were to the tune of US$ 37 billion vis-a-vis an import of only US$ 17 billion, earning a net surplus of $20 billion. In 2012-13, the performance of agriculture on this account is expected to be even better than
ix

forPolicy
Kharif CropsPrice
this, with exports likely to cross US$ 40 billion. Therefore, time has come to institute an open, stable, neutral and rational agri-trade policy with moderate duties of 5-10 percent in most of the years. From this angle, the Commission recommends fully opening up the exports, even for pulses and oilseeds/edible oils, as their imports are already open at zero or low import duties to make the trade policy neutral to producers and consumers. This will promote resource use efficiency, generate surpluses and promote agri-growth.
Integrating MGNREGA with AgricultureS.7 Labour costs have risen rapidly, by almost 20 percent per annum, during the last 3 years, which has pushed the costs of production in agriculture. Farmers also complain about serious shortage of labour during peak seasons largely perceived due to MGNREGA. To make sure that MGNREGA operations are in line with labour productivity, and to contain the rising costs of production in agriculture, there is need to do an innovative fusion between MGNREGA and agricultural operations, wherein say half is paid by the farmer and the other half by the scheme. This would help agriculture labour to earn more and also help the farmer save on labour costs, and keep the labour productive. It can be coordinated through panchayats.
Push towards Pulses and OilseedsS.8 An imbalance is emerging in the production basket of agricultural crops with a large surplus of cereals and a large deficit of pulses & oilseeds (edible oils). A prime reason for this is that the incentive environment is biased in favour of rice and wheat, which get not only marketing support through large procurement operations, but also through large subsidies on power, fertilizers and irrigation. The Commission recommends that this incentive environment should be made crop neutral and less irrigated (rainfed) crops, e.g., coarse cereals, oilseeds, and pulses be given additional incentives either through attractive prices and supportive marketing/procurement infrastructure, or through viability gap funding (VGF) on per hectare basis, which could be equal to the savings in subsidies say on power, water, and fertilizers on rice (and wheat), keeping in mind the import competitiveness of coarse cereals, oilseeds and pulses.
S.9 Developing oil palm on a million hectares that is identified as suitable for its cultivation is the main answer to bridging the gap between demand and supply of edible oils. The Commission has already submitted a separate report in January 2012, wherein it is analyzed and recommended that investing Rs 10,080 crore over the next six years can save the government an import bill of more than Rs 600,000 crore over the next 27 years. The Commission therefore recommends that oil palm development in the country should be taken up on a high priority, as it will benefit large numbers of farmers and consumers alike, and also save on the import bill.
S.10 The Commission recommends de-reservation for groundnut processing units (also mustard) from the small scale sector, along with emphasis on their technology up-gradation and modernization to make them cost effective. This will promote value addition and add to the domestic edible oil supply.
x
forPolicy
Kharif CropsPrice
S.11 There is a need to impose an import tariff of 10 percent on oilseeds and pulses to promote their production at home. The extant duty structure on oilseeds, raw and refined oils needs a review and revised as per economic rationality; say at 10, 12.5 and 15 percent respectively on oil seeds, crude edible oils and refined edible oils.
Removing domestic market distortionsS.12 It is time for some of the restrictive laws dealing with agriculture (e.g., Essential Commodities Act (ECA), 1955; APMC Act, tenancy laws, etc) to be reviewed and made much more liberal to let the markets function openly and competitively. There is need to phase out all levies on rice procurement, stocking limits on private trade, allow seamless movement of agri-commodities all over the country, direct buying by processors and retailers from farmers, freeing up the land lease market to let an economically viable size of the operational holdings emerge. It is vital that these archaic laws are modified/rescinded to facilitate the development of a barrier-free national market.
Making NFSB More EffectiveS.13 The National Food Security Bill (NFSB) envisages subsidized physical grain distribution to almost two-thirds of the country’s population of 1.2 billion. It implies a massive procurement of food grains and entails huge financial expenditure given the existing inefficient food security complex of procurement, stocking and distribution (leakages amount to about 40 percent as per the Commission’s calculations). It would crowd out private sector operations further with an adverse effect on overall efficiency of procurement and storage operations as well as on magnitude of food subsidies and open market prices. Literature, international experience and pilot studies in India itself have shown that cash transfers are more efficient and cost effective in promoting food and nutritional security. Thus, NFSB could be integrated with the ‘Direct Cash Transfer’ (DCT) scheme especially in 33 cities of more than one million population and cereal surplus states. This approach, i.e., using the right policy instrument (income policy rather than price policy) and right technology (IT) to reach the poor, will not only empower the poor but also allow the foodgrain markets to function effectively with an active private sector, allow natural process of diversification/growth in agriculture and plug leakages in distribution.
Price Policy RecommendationsS.14 After carefully considering the overall demand and supply situation of various crops, especially the excessive stocks of rice and wheat with government agencies, their costs of production, their domestic and international price situation along with export/import possibilities, the overall terms of trade between agriculture and industry, and the issue of food inflation in the country, the Commission recommends the following MSPs as given in the table S.1 below. The table also delineates the MSP increases during the last three years to have a medium term perspective of the price policy recommendations.
xi

forPolicy
Kharif CropsPrice
Table S.1: Actual and Recommended MSPs of Kharif crops (Rs/quintal)
CROP Recommen- dation for
KMS 2013-14
Justification KMS 2012-13
KMS 2011-12
KMS 2010-11
Paddy 1310(4.8)
Excessive stocks of rice (and wheat). MSP is touching fob price. Eastern belt needs a special package to improve marketing network as market prices are 10-20% below MSP. Recommended MSP fully covers C2 costs.
1250 (15.7)
1080 (8.0)
1000 (0.0)
Paddy Grade A 1345(5.1)
1280 (15.3)
1110 (7.8)
1030 (0.0)
Jowar-Hybrid 1500 (0.0)
Last year, MSP was increased by 53%. 1500 (53.1)
980 (11.4)
880(4.8)
Jowar-Maldandi 1520(0.0)
1520 (52.0)
1000 (11.1)
900 (4.7)
Bajra 1175 (0.0)
Last year, MSP was increased by 20%. MSP already covers C2 costs.
1175 (19.9)
980 (11.4)
880(4.8)
Ragi 1500 (0.0)
Last year, MSP was increased by 43% 1500 (42.9)
1050 (8.8)
965(5.5)
Maize 1310(11.5)
Low Stock to use ratio; MSP below domestic & international prices. Would encourage diversification in erstwhile states of Green Revolution from paddy to maize
1175 (19.9)
980 (11.4)
880(4.8)
Tur (Arhar) 3850 (0.0)
MSP higher than domestic & international prices
3850 (4.1)
3700* (5.7)
3500*(52.2)
Moong 4500 (2.3)
Expected Low Stocks 4400 (10.0)
4000*(9.0)
3670*(33.0)
Urad 4300 (0.0)
MSP higher than domestic & international prices
4300 (13.2)
3800* (11.8)
3400* (34.9)
Groundnut 4000 (8.1)
To encourage oilseeds. MSP way below domestic & international prices
3700 (37.0)
2700 (17.4)
2300(9.5)
Sunflower 3700 (0.0)
MSP higher than domestic & international prices
3700 (32.1)
2800 (19.1)
2350(6.1)
Soyabean (Black)
2500 (13.6)
To encourage oil and protein. MSP below domestic & international prices
2200 (33.3)
1650(17.9)
1400(3.7)
Soyabean (Yellow)
2560 (14.3)
2240 (32.5)
1690(17.4)
1440(3.6)
Sesamum 4500 (7.1)
To encourage oilseeds. MSP below domestic & international prices
4200 (23.5)
3400 (17.2)
2900(1.8)
Nigerseed 3500 (0.0)
MSP higher than current domestic prices 3500 (20.7)
2900 (18.4)
2450(1.9)
Cotton (Medium-Staple)
3700 (2.8)
In alignment with prevailing international prices
3600 (28.6)
2800 (12.0)
2500 (0.0)
Cotton (Long-Staple)
4000 (2.6)
3900 (18.2)
3300 (10.0)
3000 (0.0)
*includes bonus of Rs 500Note: Figures in parentheses are percentage increases over the previous year.
xii


1
forPolicy
Kharif CropsPrice
Performance by the Agricultural Sector: Production & Trade
1.1 The year 2011-12 witnessed a remarkable performance by Indian agricultural sector with a record production of 259.3 million tonnes of food grains (5.9 percent increase compared to 2010-11). By virtue of this vibrant growth in the terminal year of the Eleventh Plan (2007-2012), the agricultural sector grew at an annual average rate of 3.6 percent as compared to earlier estimated 3.3 percent1 and 2.4 percent in the tenth plan (2002- 2007) and 2.5 percent in the ninth plan (1997-2002) (Chart 1.1). This is closer to the 4.0 percent growth targeted for the Plan. The credit for this performance may be attributed to benevolent weather conditions, effective Government interventions like National Food Security Mission (NFSM), Second Green Revolution in Eastern India (BGREI) etc, push given to agri-investment and the Minimum Support Price (MSP) Policy. A slowdown in agricultural growth is expected in 2012-13 largely due to a deficient monsoon which was lower by 7.6 percent as compared to the long-period average (LPA). It is expected that foodgrain production would fall by 3.5 percent to 250.1 million tonnes in 2012-132. Rice and wheat production is expected to fall by 3.3 percent and 2.7 percent respectively from record outputs last year. However, the fall is steeper for coarse cereals as a whole at 8.5
1Twelfth Plan Document, Panning Commission2 Second Advance Estimates of Production of Foodgrains, 2012-13, DAC
Chapter-1An Overview
Agriculture grew at an annual average rate of 3.6 percent during the Eleventh Five Year Plan
1

2
forPolicy
Kharif CropsPrice
percent. There has been an increase of 2.9 percent in total pulses production in 2012-13 at 17.6 million tonnes as compared to last year. The production of total nine oilseeds in 2012-13 is marginally lower than last year by 1.1 percent at 29.5 million tonnes. Cotton has registered a fall of 4.0 percent in 2012-13 as compared to last year. The agricultural sector as a whole is expected to grow at 1.8 percent in 2012-13 as compared to 3.6 percent last year3.
Chart 1.1: Comparative growth in GDP (overall) and GDP (agri) during Plan periods
1.2 During 2011-12, India emerged as the world’s largest exporter of rice, replacing Thailand and Vietnam and also the biggest exporter of buffalo meat beating traditionally strong countries such as Brazil, Australia and the US. Agri-exports by India during the FY 2011-12 were more than US$ 37 billion against an import of agri-commodities worth around US$ 17 billion with the agricultural sector emerging as a large trade surplus sector (Chart 1.2). As per WTO, India’s share in total global exports of agri products has increased from 0.8 percent in 1990 to 2.1 percent in 2011. This share is more than the share that India has in global merchandise exports, i.e., 1.7 percent in 2011 (0.6 percent in 1990). This is indicative of the inherent comparative advantage in agri-products. An analysis4 of the composition of agricultural trade over the last decade shows that traditional agri-exports of India, such as tea, coffee, cashew, spices, etc have been over taken by new and more dynamic sectors like rice and maize, cotton, meat, guar gum, and the like, with the biggest change being registered in cotton. However, India’s agri-trade policy has been relatively restrictive and unstable with frequent export bans and irrational import duties. To enable the sector to realize its full potential, an open, stable, neutral and rational agri-trade policy
3 Advance Estimates for National Income, 2012-13, CSO4 ‘Farm Trade: tapping the Hidden Potential’, Discussion Paper No. 3, CACP available at http://cacp.dacnet.nic.in
As per WTO, India’s share in total global exports of agri products has increased from 0.8 percent in 1990 to 2.1 percent in 2011
Source: Central Statistics Office (CSO)
12
Chart 1.1: Comparative growth in GDP (overall) and GDP (agri) during Plan periods
Source: Central Statistics Office (CSO)
1.2 During 2011-12, India emerged as the world’s largest exporter of rice, replacing
Thailand and Vietnam and also the biggest exporter of buffalo meat beating traditionally strong countries such as Brazil, Australia and the US. Agri-exports by India during the FY 2011-12 were more than US$ 37 billion against an import of agri-commodities worth around US$ 17 billion with the agricultural sector emerging as a large trade surplus sector (Chart 1.2). As per WTO, India’s share in total global exports of agri products has increased from 0.8 percent in 1990 to 2.1 percent in 2011. This share is more than the share that India has in global merchandise exports, i.e., 1.7 percent in 2011 (0.6 percent in 1990). This is indicative of the inherent comparative advantage in agri-products. An analysis4 of the composition of agricultural trade over the last decade shows that traditional agri-exports of India, such as tea, coffee, cashew, spices, etc have been over taken by new and more dynamic sectors like rice and maize, cotton, meat, guar gum, and the like, with the biggest change being registered in cotton. However, India’s agri-trade policy has been relatively restrictive and unstable with frequent export bans and irrational import duties. To enable the sector to realize its full potential, an open, stable, neutral and rational agri-trade policy with moderate duties is the need of the hour. The guiding principles of such a policy should be the alignment of domestic and international prices along long-term trends, while guarding against sharp spikes and troughs through provision of special safeguards.
4 ‘Farm Trade: tapping the Hidden Potential’, Discussion Paper No. 3, CACP available at http://www.cacp.dacnet.in
6.5
5.7
7.6
4.8
2.5 2.4
3.6
0
1
2
3
4
5
6
7
8
Eighth Plan (1992-97)
Ninth Plan (1997-02)
Tenth Plan (2002-07)
Eleventh Plan (2007-12)
(%)
GDP (overall) GDP (agri)
8.0
As per WTO, India’s share in total global exports of agri products has increased from 0.8 percent in 1990 to 2.1 percent in 2011

3
forPolicy
Kharif CropsPrice
with moderate duties is the need of the hour. The guiding principles of such a policy should be the alignment of domestic and international prices along long-term trends, while guarding against sharp spikes and troughs through provision of special safeguards.
Chart 1.2: India’s Exports and Imports of Agri-Commodities
Source: Agricultural Statistics at a glance- various issues & Department of CommerceNote: Figures for 2012-13 are expected estimates. Agri-Exports & Agri-Imports were US$ 34.1 billion and US$ 17 billion respectively for the period Apr-Jan, 2012-13
Comfortable Stocks with the Central Pool
1.3 Despite the expected fall in production in foodgrains in 2012-13, there is adequate availability of foodgrain stocks with the central pool. As against the buffer stock norm of 31.9 million tonnes of rice & wheat (as on 1st July of each year), total Central Pool stocks were more than double at 80.5 million tonnes (30.7 million tonnes of rice and 49.8 million tonnes of wheat) on 1st July, 2012 (Chart 1.3). The situation is not very different as on 1st January, 2013 – with 66.6 million tonnes of central pool stocks and more than double the buffer stock norm of 25.0 million tonnes. It is expected that these would cross 90 million tonnes by 1st July, 2013 with record procurements for rice and wheat in KMS 2012-13 and RMS 2013-14. These excess stocks, beyond the buffer stock norms, as on 1st July, 2012 amount to around Rs 73,000 crore5 locked in FCI godowns. Accounting for the fact that the economic cost of FCI towards procurement incidentals, storing and distributing foodgrains is about 40 percent more than the procurement price, the locked in extra stocks value more than Rs 1 lakh crore - more than the budgeted food subsidy of Rs 90000 crore in 2013-14. The macroeconomic implication of this infusion of “excess” money into the economy without corresponding flow of goods is evident in the paradox of rising prices of rice & wheat amidst plenty stocks.
5 @Rs 12850 per tonne for 29.7 million tonnes of wheat and Rs 18000 per tonne, levy price for procurement of rice, for 18.9 million tonnes of rice held in excess of the norm, as on 1st July, 2012
Central Pool Stocks more than double the buffer stock norms, with extra locked in stocks worth more than Rs 1 lakh crore – creating inflationary pressures
13
Chart 1.2: India’s Exports and Imports of Agri-Commodities
Source: Agricultural Statistics at a glance- various issues & Department of Commerce
Note: Figures for 2012-13 are expected estimates. Agri-Exports & Agri-Imports were US$ 34.1 billion and US$ 17 billion respectively for the period Apr-Jan, 2012-13
Comfortable Stocks with the Central Pool 1.3 Despite the expected fall in production in foodgrains in 2012-13, there is adequate
availability of foodgrain stocks with the central pool. As against the buffer stock norm of 31.9 million tonnes of rice & wheat (as on 1st July of each year), total Central Pool stocks were more than double at 80.5 million tonnes (30.7 million tonnes of rice and 49.8 million tonnes of wheat) on 1st July, 2012 (Chart 1.3). The situation is not very different as on 1st January, 2013 – with 66.6 million tonnes of central pool stocks and more than double the buffer stock norm of 25.0 million tonnes. It is expected that these would cross 90 million tonnes by 1st July, 2013 with record procurements for rice and wheat in KMS 2012-13 and RMS 2013-14. These excess stocks, beyond the buffer stock norms, as on 1st July, 2012 amount to around Rs 73,000 crore5 locked in FCI godowns. Accounting for the fact that the economic cost of FCI for storing and distributing foodgrains is about 40 percent more than the procurement price, the locked in extra stocks value more than Rs 1 lakh crore - more than the budgeted food subsidy of Rs 90000 crore in 2013-14. The macroeconomic implication of this infusion of “excess” money into the economy without corresponding flow of goods is evident in the paradox of rising prices of rice & wheat amidst plenty stocks.
5 @Rs 12850 per tonne for 29.7 million tonnes of wheat and Rs 18000 per tonne, levy price for procurement of rice, for 18.9 million tonnes of rice held in excess of the norm, as on 1st July, 2012
0
5
10
15
20
25
30
35
40
45
1990
-91
1991
-92
1992
-93
1993
-94
1994
-95
1995
-96
1996
-97
1997
-98
1998
-99
1999
-00
2000
-01
2001
-02
2002
-03
2003
-04
2004
-05
2005
-06
2006
-07
2007
-08
2008
-09
2009
-10
2010
-11
2011
-12
2012
-13
US$
Bill
ion
Agri-Imports Agri-Exports
Expanding Trade Surplus
Central Pool Stocks more than double buffer stock norms with extra locked in stocks worth more than Rs 1 lakh crore – creating inflationary pressures

4
forPolicy
Kharif CropsPrice
Chart 1.3: Central Pool Stocks with FCI
Source: FCINote: Stocks are shown as on 1st July of each year.
Anomaly of High Food inflation with Overflowing Central Pool Stocks1.4 India has been experiencing persistent and elevated food inflation over the
last few years in the face of bumper crops of food grains and overflowing food stocks. In the year 2011-12, food inflation eased up a little due to good production, base year effect and tight monetary policy. But 2012-13 has seen a resurgence in food inflation which poses a major challenge for policymakers as high food inflation inflicts a ‘hidden tax’ on the poor, who spend almost 60% of their expenditure on food (NSSO). A distinct feature of food price inflation in recent years was the increased contribution of fruits & vegetables (F&V), milk and fish, meat & eggs to food inflation vis-à-vis the share of cereals and pulses. But in 2012-13, cereals have contributed more than 30 percent to food inflation-ahead of all other components (Chart 1.4). Despite good production and bulging central pool stocks, the inflation in rice and wheat have witnessed an upsurge in 2012-13 (Chart 1.5).
1.5 This ‘anomaly’ of a spurt in wheat and rice prices in the face of overflowing grain stocks is purely due to suboptimal grain management. In recent years, the government has procured more than one-thirds of the total production and more than half of the marketed surplus of rice & wheat leading to stock accumulation. Such large scale public procurement strangulates the private trade (as has been the case in Punjab, Haryana and now Madhya Pradesh & Chhattisgarh) and creates an artificial shortage resulting in shooting prices. Faced with increasing prices, the stocks are being liquidated but at a price which includes all levies incidental to procurement (additional bonuses on MSP in
In 2012-13, cereals have contributed more than 30 percent to food inflation
14
Chart 1.3: Central Pool Stocks with FCI
Source: FCI Note: Stocks are shown as on 1st July of each year.
Anomaly of High Food inflation with Overflowing Central Pool Stocks 1.4 India has been experiencing persistent and elevated food inflation over the last few
years in the face of bumper crops of food grains and overflowing food stocks. In the year 2011-12, food inflation eased up a little due to good production, base year effect and tight monetary policy. But 2012-13 has seen a resurgence in food inflation which poses a major challenge for policymakers as high food inflation inflicts a 'hidden tax' on the poor, who spend almost 60% of their expenditure on food (NSSO). A distinct feature of food price inflation in recent years was the increased contribution of fruits & vegetables (F&V), milk and fish, meat & eggs to food inflation vis-à-vis the share of cereals and pulses. But in 2012-13, cereals have contributed by more than 30 percent to food inflation –ahead of all other components (Chart 1.4). Despite good production and bulging central pool stocks, the inflation in rice and wheat have witnessed an upsurge in 2012-13 (Chart 1.5).
35.7
63.0
80.5
0
10
20
30
40
50
60
70
80
90
1992
-93
1993
-94
1994
-95
1995
-96
1996
-97
1997
-98
1998
-99
1999
-00
2000
-01
2001
-02
2002
-03
2003
-04
2004
-05
2005
-06
2006
-07
2007
-08
2008
-09
2009
-10
2010
-11
2011
-12
2012
-13
Mill
ion
tonn
es
Rice Wheat Norm
Expected to cross 90 million tonnes on 1st July, 2013
In 2012-13, cereals have contributed by more than 30 percent to food inflation

5
forPolicy
Kharif CropsPrice
Chhattisgarh and high statutory levies in Punjab, Andhra Pradesh, Haryana and Odisha) adding to the inflationary pressures and also making them unviable for exports (at a time when international prices of wheat are on an upswing). The visits of the Commission to some of the storage sites (such as in Haryana) revealed that food stocks of 2008-09 are still lying with the central agencies. Despite the huge carrying costs, fresh record procurements continue unabated. This mismanagement of food stocks is inflicting huge economic losses on the food economy. A complete overhaul of the current policy of open-ended procurement is urgently required.
National Food Security Bill (NFSB) - Making it more Effective
1.6 The NFSB, already introduced in the Lok Sabha and currently being deliberated upon, aims to address the issue of lack of economic access to food and eradicate hunger from India. The central pivot of the Bill is large-scale subsidized physical grain distribution to almost two-thirds of the country’s population of 1.2 billion. This would require further intensification of the role of government in augmenting production, enhancing procurement and stocking large amounts of grains to meet the underlying commitments of food distribution. The required increase in procurement by the state would crowd out private sector operations further with an adverse effect on overall efficiency of procurement and storage operations as well as on magnitude of food subsidies and open market prices. The existing food security complex of procurement, stocking and distribution would need to expand further and would increase the operational expenditure under NFSB given its creaking infrastructure, leakages (which amount to about
Chart 1.4: Contribution of various items to Inflation in Primary Food Articles
Chart 1.5: Price Inflation in Rice & Wheat, 2011-12 & 2012-13
Source: Computed from data available from DIPP
Note: The data for 2012-13 is till the month of January, 2013
‘Anomaly’ of a spurt in wheat and rice prices in the face of overflowing grain stocks is purely due to suboptimal grain management
0
2
4
6
8
10
12
14
16
18
-20%
0%
20%
40%
60%
80%
100%
2010-11 2011-12 2012-13
(%)
Other Eggs, Fish & Meat Milk F&V Pulses Cereals
Inflation in Primary Food Articles
-5
0
5
10
15
20
25
Ma
r-1
1
Ma
y-1
1
Jul-
11
Sep
-11
No
v-1
1
Jan
-12
Ma
r-1
2
Ma
y-1
2
Jul-
12
Sep
-12
No
v-1
2
Jan
-13
(%)
Wheat Rice
Rising prices despite record harvests of Rice & Wheat
6
forPolicy
Kharif CropsPrice
40 percent as per the Commission’s calculations6) and inefficient governance. This would also slow down or even regress the process of overall diversification in agriculture, from cereals to high-value commodities, contrary to the emerging demand patterns in the country. It may be noted here that internationally, conditional cash transfers (CCTs), rather than physical distribution of subsidized food, have been found to be more efficient in achieving food and nutritional security. The case of Brazil with the largest CCT scheme, which has been instrumental in replacing poorly targeted subsidies, improving the quality of delivery of services and achieving desired improvements in social welfare, is worth emulating here. Therefore, there is an exigency to reframe the foodgrains policy with movement from physical handling and distribution of foodgrains to cash transfers/food coupons/smart cards and cover food subsidy under the ‘Direct Cash Transfer’ (DCT) scheme. A pilot study by United Nations Development Programme (UNDP) and Self-Employed Women’s Association (SEWA) have shown that cash transfers do not adversely affect food security but provide additional opportunity to increase other nutritious food options7.
1.7 As enunciated in a discussion paper8, surplus states (in terms of production and consumption of cereals) and cities with a population of 1 million or more (currently 33 as per 2011 census) could move straightaway to cash transfers. States which are only consuming states may continue with the physical handling of foodgrains. As India is a vast country, it may be left to individual states to devise their own systems of provision of food security. Only an optimum level of buffer stocks needs to be maintained by FCI for contingencies. This would go a long way in pruning the food subsidy and more importantly help in achieving the welfare objectives efficiently.
Emerging Imbalance between Investments & Subsidies
1.8 As a percentage of agri-GDP, the Gross capital formation (GCF-agri) has increased substantially during the last decade from 11.9 percent in 2000-01 to 19.8 percent in 2011-12. Input subsidies, i.e on major inputs like fertilizers, power, irrigation and credit, are almost as high as 70 percent of the GCF in agriculture. It is interesting to note here that the public sector accounts for only 20 percent of the total investment in agricultural sector in India. Therefore, if one looks at input subsidies in relation to public investments in agriculture, subsidies are almost six times higher.
1.9 If we consider the total public expenditure on agriculture (including public investment & input subsidies) as a ratio of GDP (agri), it has more than doubled from 8.6 percent in 1993-94 to 20.6 percent in 2009-10. So it appears that
6 ‘National Food Security Bill: Challenges & Options’, Discussion paper No. 2, CACP available at http://cacp.dacnet.in7 http://www.undp.org/content/dam/india/docs/poverty/Final-study-results-SEWA-PDS.pdf8 ‘National Food Security Bill: Challenges & Options’, Discussion paper No. 2, CACP
It is time to reframe the foodgrains policy with movement from physical handling & distribution of foodgrains to cash transfers/food coupons/smart cards and cover food subsidy under the DCT scheme
Surplus states and cities with a population of 1 million or more could move straightaway to cash transfers

7
forPolicy
Kharif CropsPrice
there are sufficient public resources going to agriculture. The bane lies in the composition of that expenditure - Indian agriculture receives public resources more in the form of subsidies than public investments. Almost 80 percent is in the form of input subsidies and only 20 percent is investment in agriculture (Chart 1.6). This is reflective of the imbalance between use of subsidies & investments as policy instruments for agricultural growth and a tradeoff between short term growth and long term sustainability. Research9 shows that marginal returns from investments are much higher (5 to 10 times) than through subsidies. The Commission, therefore, reiterates its earlier recommendation10 that an expert committee be set up to suggest ways and means how this rationalization and containment of input subsidies can be carried out and the savings thereupon can be channeled towards agri-investments.
1.10 The biggest of all these input subsidies is fertilizer subsidy, and there are clear indications that it has led to imbalanced use of N, P and K in states like Punjab and Haryana, which needs to be corrected. With the launch of Nutrient Based Subsidy (NBS) Policy, the subsidy per kg of nutrients N, P and K is fixed by the Government and retail prices for P&K fertilizers have been freed. As the price of urea has remained fixed, the differential between the prices of urea and P&K fertilizers has widened leading to excess of use of N at the expense of P&K fertilizers. This has distorted the NPK ratio and has led to unbalanced use of soil nutrients. This distortion is on the higher side in Haryana and Punjab leading to deterioration in their soil quality and declining growth in
9 “ Investment, subsidies, and pro-poor growth in rural India” by Shenggen Fan, Ashok Gulati and Sukhadeo Thorat, Agricultural Economics 39 (2008) Pgs 163-170
10 Price Policy Report for Rabi Crops , 2013-14, CACP
Indian agriculture receives public resources more in the form of subsidies (80%) than public investments (20%)
Chart 1.6: Composition of Public Expenditure on Agriculture
17
Emerging Imbalance between Investments & Subsidies 1.8 As a percentage of agri-GDP, the Gross capital formation (GCF-agri) has increased
substantially during the last decade from 11.9 percent in 2000-01 to 19.8 in 2011-12. Input subsidies, i.e on major inputs like fertilizers, power, irrigation and credit, are almost as high as 70 percent of the GCF in agriculture. It is interesting to note here that the public sector accounts for only 20 percent of the total investment in agricultural sector in India. Therefore, if one looks at input subsidies in relation to public investments in agriculture, subsidies are almost six times higher. If we consider the total public expenditure on agriculture (including public investment & input subsidies) as a ratio of GDP (agri), it has more than doubled from 8.6 percent in 1993-94 to 20.6 percent in 2009-10. So it appears that there are sufficient public resources going to agriculture. The bane lies in the composition of that expenditure - Indian agriculture receives public resources more in the form of subsidies than public investments. Almost 80 percent is in the form of input subsidies and only 20 percent is investment in agriculture (Chart 1.6). This is reflective of the imbalance between use of subsidies & investments as policy instruments for agricultural growth and a tradeoff between short term growth and long term sustainability. Research9 shows that marginal returns from investments are much higher (5 to 10 times) than through subsidies. The Commission, therefore, reiterates its earlier recommendation10 that an expert committee be set up to suggest ways and means how this rationalization and containment of input subsidies can be carried out and the savings thereupon can be channeled towards agri-investments.
Chart 1.6: Composition of Public Expenditure on Agriculture
Source: CSO, Agricultural Statistics at a Glance, Various Issues
9 “Investment, subsidies, and pro-poor growth in rural India” by Shenggen Fan, Ashok Gulati and Sukhadeo Thorat, Agricultural Economics 39 (2008) Pgs 163-170 10 Price Policy Report for Rabi Crops , 2013-14, CACP
0
5
10
15
20
25
30
0
50000
100000
150000
200000
1993
-94
1994
-95
1995
-96
1996
-97
1997
-98
1998
-99
1999
-00
2000
-01
2001
-02
2002
-03
2003
-04
2004
-05
2005
-06
2006
-07
2007
-08
2008
-09
2009
-10
Tota
l Pub
lic E
xpen
ditu
re a
s a
% o
f A
gri-G
DP
Rs c
rore
(at 2
004-
05 p
rice
s)
GCF (Public) Input Subsidies Total Public Expenditure as a % of Agri-GDP
Indian agriculture receives public resources more in the form of subsidies (80%) than public investments (20%)
Source: CSO, Agricultural Statistics at a Glance, Various Issues
Fertilizer subsidy needs to be rationalized to prevent suboptimal use of fertilizers

8
forPolicy
Kharif CropsPrice
land productivity at the margin. As these two states are the leading producers of cereals in India, right signals need to be given in fertilizer usage for their sustainable growth. The fertilizer subsidy needs to be rationalized to prevent suboptimal use of fertilizers.
Imbalance in the Agricultural Production Structure
1.11 Indian farmers clocked a record food grain production of 259.3 million tonnes in 2011-12 – more than the likely demand of foodgrains estimated by the Planning Commission for the year 2016-17 at 257 million tonnes. Despite a fall in production expected in 2012-13, there are abundant stocks of rice and wheat with the Central Pool. On the other hand, oilseeds (edible oils) and pulses are major challenges for India in terms of meeting its demand from domestic production. Imports of edible oils constitute almost half of total domestic consumption of edible oils. India imported a record US$ 9.7 billion worth of edible oils in 2011-12 (47.5 percent jump from last year) and US$ 1.8 billion worth of pulses (an increase of 16.4 percent as compared to last year). During the first ten months of FY 2012-13, India has already imported US$ 9.6 billion of edible oil and US$ 1.9 billion of pulses. The Commission feels that the right strategy should be to shift focus from cereals to these crops by providing them attractive price incentives and supportive marketing/procurement infrastructure. Therefore, it has tried over the last few years to realign the price incentives in favour of oilseeds and pulses to help farmers allocate larger irrigated area for these crops and adopt best technologies/farm practices.
1.12 Budget 2013-14 has appreciably recognized this challenge and has made provisions to start a programme of crop diversification (from paddy/wheat to other crop alternatives) in original Green Revolution States. The existing schemes of NFSM and BGREI are already a step in the right direction and have proved successful. The natural step ahead is to synergize these schemes and evolve a comprehensive strategy towards crop diversification. The MSP policy, accordingly, can help achieve this overall objective of the government, which will promote rational utilization of scarce resources, especially land and water and promote efficiency in line with our global comparative advantages.
Global Outlook
1.13 According to FAO Food Outlook, November 2012, food prices have averaged 8 percent lower during the first ten months of 2012 compared to the same period last year. The FAO Food Price Index (FFPI), with the base of 2002-04, stabilized at 210 points in February 2013, same as January 2013, after declining consecutively for three months. Global cereal supply and demand balance is forecast to tighten considerably in 2012-13, due mainly to declines in wheat and maize production though rice supplies are expected to be ample. The
Abundant stocks of rice & wheat in the Central pool but large imports of pulses & edible oils – need to evolve a comprehensive strategy towards crop diversification

9
forPolicy
Kharif CropsPrice
prices of oilseeds are expected to be under pressure due to a disappointing soybean crop in the United States. According to International Cotton Advisory Committee (ICAC), global cotton production and global stocks could contract by 11 percent and 6 percent respectively in 2013-14. This would be the second consecutive season of decline in cotton production and the smallest output in four years.
Emphasis on ‘Getting the Markets Right’
1.14 Indian agriculture is a critical economic activity contributing about 14 per cent to overall GDP of the country and with half the workforce employed in it. But agriculture is stifled by various controls ranging from trade to domestic marketing and stocking under the ECA, 1955 or APMC Act or Land Tenancy Acts, etc. All these laws need a thorough review with an objective to make them more market friendly, promoting competition, efficiency and growth. Inadequate availability of quality inputs and low farm productivity have led to rising costs of production. The real costs are even higher given the increasing proportion of input subsidies in agriculture. It is high time that one focuses on not only ‘getting the prices right’ especially for inputs but also ‘getting the markets right’ for outputs. Only this would lead to rational utilization of scarce inputs, raise productivity, investment and growth in the agricultural sector.
1.15 The last Kharif Price Policy Report largely focused on ‘getting the prices right’ and as a consequence, there was a major realignment in the level and relative price structure. This Report, however, emphasizes the need for ‘getting the markets right’. Accordingly, chapter 2 delineates the various prevalent market distortions and also attempts to rank states in accordance with their market friendly policies in paddy & rice markets. Chapter 3 looks at domestic prices in relation to international prices and trade policies with a view to reduce distortions with respect to international trade. Chapter 4 presents the cost projections for the kharif crops. Chapter 5 looks at the relation between yields and real costs of production indicating clearly that if costs are to be contained and thereby real prices of agricultural products, there is no soft option but to increase yields by increasing investment in agri R&D (seeds) and devising incentive policies for faster adoption of modern technology. Finally in chapter 6, major highlights of all chapters are presented leading to the key price and non-price policy recommendations.
Globally, decline in wheat, maize, soyabean and cotton production but ample rice supplies

10
forPolicy
Kharif CropsPrice
Demand-Supply
2.1 The year 2012-13 is expected11 to register a fall in foodgrain production by 3.5 percent to 250.1 million tonnes as compared to a record production of 259 million tonnes in 2011-12. Production of rice and maize are expected to fall by 3.3 percent to 101.8 million tonnes and by 3.2 percent to 21.1 million tonnes respectively. Total pulses’ production is expected to be higher by 2.9 percent at 17.6 million tonnes; although production of kharif pulses is estimated to decline by 9.6 per cent to 5.5 million tonnes, with a 3.8 percent increase in tur, a fall in urad by 1.7 percent and in moong by a steep 22.1 percent. The production of total nine oilseeds in 2012-13 is also expected to be marginally lower than last year by 1.1 percent at 29.5 million tonnes with a sharp drop in groundnut by 16.7 percent to 5.8 million tonnes; however soyabean is estimated to increase at 6.1 percent to a record 13.0 million tonnes. Cotton production is expected to decline by 4.0 percent to 33.8 million bales (of 170 kg each) in 2012-13 as compared to last year. Thus, the year 2012-13 is expected to show some downward fluctuation on the supply side for most of kharif crops (Annex Table 2.1).
11Second Advance Estimates, DAC
forPolicy
Kharif CropsPrice
Chapter 2Demand-Supply, Procurement, Prices and
Market Distortions
The year 2012-13 is expected to show some downward fluctuation on the supply side with most of kharif crops
11
forPolicy
Kharif CropsPrice
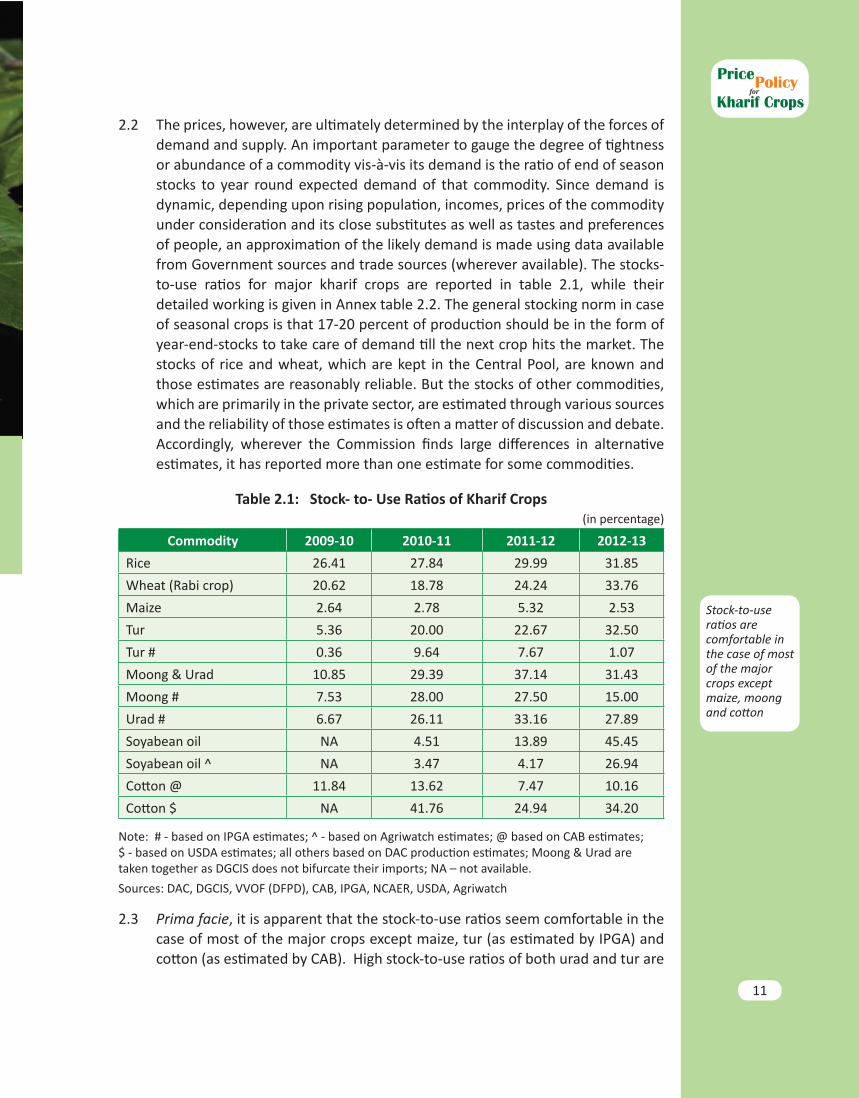
2.2 The prices, however, are ultimately determined by the interplay of the forces of demand and supply. An important parameter to gauge the degree of tightness or abundance of a commodity vis-à-vis its demand is the ratio of end of season stocks to year round expected demand of that commodity. Since demand is dynamic, depending upon rising population, incomes, prices of the commodity under consideration and its close substitutes as well as tastes and preferences of people, an approximation of the likely demand is made using data available from Government sources and trade sources (wherever available). The stocks-to-use ratios for major kharif crops are reported in table 2.1, while their detailed working is given in Annex table 2.2. The general stocking norm in case of seasonal crops is that 17-20 percent of production should be in the form of year-end-stocks to take care of demand till the next crop hits the market. The stocks of rice and wheat, which are kept in the Central Pool, are known and those estimates are reasonably reliable. But the stocks of other commodities, which are primarily in the private sector, are estimated through various sources and the reliability of those estimates is often a matter of discussion and debate. Accordingly, wherever the Commission finds large differences in alternative estimates, it has reported more than one estimate for some commodities.
Table 2.1: Stock- to- Use Ratios of Kharif Crops (in percentage)
Commodity 2009-10 2010-11 2011-12 2012-13
Rice 26.41 27.84 29.99 31.85
Wheat (Rabi crop) 20.62 18.78 24.24 33.76
Maize 2.64 2.78 5.32 2.53
Tur 5.36 20.00 22.67 32.50
Tur # 0.36 9.64 7.67 1.07
Moong & Urad 10.85 29.39 37.14 31.43
Moong # 7.53 28.00 27.50 15.00
Urad # 6.67 26.11 33.16 27.89
Soyabean oil NA 4.51 13.89 45.45
Soyabean oil ^ NA 3.47 4.17 26.94
Cotton @ 11.84 13.62 7.47 10.16
Cotton $ NA 41.76 24.94 34.20
Note: # - based on IPGA estimates; ^ - based on Agriwatch estimates; @ based on CAB estimates; $ - based on USDA estimates; all others based on DAC production estimates; Moong & Urad are taken together as DGCIS does not bifurcate their imports; NA – not available.
Sources: DAC, DGCIS, VVOF (DFPD), CAB, IPGA, NCAER, USDA, Agriwatch
2.3 Prima facie, it is apparent that the stock-to-use ratios seem comfortable in the case of most of the major crops except maize, tur (as estimated by IPGA) and cotton (as estimated by CAB). High stock-to-use ratios of both urad and tur are
Stock-to-use ratios are comfortable in the case of most of the major crops except maize, moong and cotton

12
forPolicy
Kharif CropsPrice
expected to exert a downward pressure on their prices. As per Second Advance Estimates of DAC, a steep decline in production of moong is expected leading to a decline in its stocks to use ratio. This is corroborated by the rising prices of moong. The shortfall in supply of groundnut is manifest in its rising prices (chart 2.5 a to h)
Procurement - Policy and Operations
2.4 Among the kharif crops, the role of procurement operations of FCI to give support to MSP is largely limited to rice. National Agricultural Cooperative Marketing Federation of India Limited (NAFED), National Cooperative Consumers’ Federation of India Limited (NCCF) and Central Warehousing Corporation (CWC) are the Central nodal agencies of the Government of India for undertaking procurement of oilseeds and pulses under Price Support Scheme (PSS), when the market rates of a particular commodity fall below MSP.
2.5 Since 2006-07, the procurement levels for rice have increased manifold with more than one-third of the total production (more than 40 percent of the marketed surplus) being procured for Central Pool (Chart 2.1). Such large scale procurement has led to the anomaly of piling up of rice stocks with FCI and double digit inflation in rice in recent months. As against the buffer stock norm of 11.8 million tonnes of rice (as on 1st July of each year), total Central Pool stocks of rice were more than double at 30.7 million tonnes on 1st July, 2012. This year procurement of rice, as on 14.3.2013, had already touched 28.4 million tonnes. With a targeted record procurement of 40 million tonnes of rice in KMS 2012-13, it is anticipated that the Central Pool stocks of rice would cross 40 million tonnes on 1st July, 2013.
Chart 2.1: Rice Procurement as % of Production & Marketed Surplus
23
surplus) being procured for Central Pool (Chart 2.1). Such large scale procurement has led to the anomaly of piling up of rice stocks with FCI and double digit inflation in rice in recent months. As against the buffer stock norm of 11.8 million tonnes of rice (as on 1st July of each year), total Central Pool stocks of rice were more than double at 30.7 million tonnes on 1st July, 2012. This year procurement of rice, as on 14.3.2013, had already touched 28.4 million tonnes. With a targeted record procurement of 40 million tonnes of rice in KMS 2012-13, it is anticipated that the Central Pool stocks of rice would cross 40 million tonnes on 1st July, 2013.
Chart 2.1: Rice Procurement as % of Production & Market Surplus
Note: Marketed Surplus Ratio (MSR) is available upto 2010-11 only and the figure of 2010-11 is repeated for the years thereafter. Source: DES, DFPD, Agricultural Statistics at a Glance, 2012
2.6 Apart from imposing a huge additional cost to procure, store, transport and distribute grain, increasing public procurement strangulates the domestic grain market. The private sector has been largely marginalized in traditional high contributing states like Andhra Pradesh, Punjab & Haryana (Chart 2.2). New entrants like Chhattisgarh, Odisha and Kerala are also catching up as far as procurement as a percentage of production is concerned.
22.1
16.4
22.924.7
27.625.1
28.7
34.132.0
34.2 35.0
20
25
30
35
40
45
50
55
0
5
10
15
20
25
30
35
40
2001
-02
2002
-03
2003
-04
2004
-05
2005
-06
2006
-07
2007
-08
2008
-09
2009
-10
2010
-11
2011
-12
(%)
Mill
ion
Tonn
es
Procurement Procurement as a % of Production
Procurement as a % of Marketed Surplus
Procuring more than 40% of the marketed surplus of rice has led to the anomaly of piling up of rice stocks with FCI and double digit inflation in rice in
Apart from imposing huge costs to procure, store, transport and distribute grain, increasing public procurement strangulates the domestic grain market
Note: Marketed Surplus Ratio (MSR) is available upto 2010-11 only and the figure of 2010-11 is repeated for the years thereafter.
Source: DES, DFPD, Agricultural Statistics at a Glance, 2012
Procuring more than 40% of the marketed surplus of rice has led to the anomaly of piling up of rice stocks with FCI and double digit inflation in rice in recent months

13
forPolicy
Kharif CropsPrice
Apart from imposing huge costs to procure, store, transport and distribute grain, increasing public procurement strangulates the domestic grain market
2.6 Apart from imposing a huge additional cost to procure, store, transport and distribute grain, increasing public procurement strangulates the domestic grain market. The private sector has been largely marginalized in traditional high contributing states like Andhra Pradesh, Punjab & Haryana (Chart 2.2). New entrants like Chhattisgarh, Odisha and Kerala are also catching up as far as procurement as a percentage of production is concerned.
2.7 Chhattisgarh has been announcing a bonus on MSP of paddy for the last five years and has almost totally crowded out the private sector (Box 2.1). Thus, the government has turned into a monopsonist, being the single largest buyer of rice. This has destroyed market competition in these states and is consequently leading to rising costs of inefficient procurement operations.
Chart 2.2: Rice Procurement as a % of Marketed Surplus, TE 2011-12
Source: DES, DFPD, Agricultural Statistics at a Glance, 2012
Note: MSR is available upto 2010-11 only and the figure of 2010-11 is repeated for the years thereafter. For Chhattisgarh, MSR has been estimated by market arrivals of paddy.

14
forPolicy
Kharif CropsPrice
Box 2.1: Chhattisgarh: State policy triggering distortions in rice market
= Chhattisgarh declared a bonus of Rs 220/qtl in 2008-09, in addition to the Rs 50 per qtl bonus announced by the Centre and has been providing Rs 50/qtl bonus to its farmers since then which has created a spurt in rice production and procurement in the state. In the latest Budget the State has announced a bonus of Rs 270/qtl for 2012-13, which is almost 22 percent of the MSP announced by the Centre.
= In a span of five years, from 2008-09 to 2012-13, while area under rice has remained stable at 3.7 million ha, production of rice increased by 42.2 per cent from 4.4 million tonnes to 6.3 million tonnes, while procurement increased by 67 per cent from 2.9 million tonnes to 4.8 million tonnes (as on 26.2.2013).
= From procuring half of its rice production in 2007-08, the Government has now (up to 26.2.13) cornered more than three-quarters of its total rice produce in 2012-13 (See chart 2.3).More than 90 per cent of market arrivals are now being procured by the state. While the efforts of the state in increasing rice production are laudable, its increasing presence in the market has totally marginalized the role of private trade in the state. During the Commission’s visit to the state, several reports of paddy coming from adjoining states, especially Odisha, to be sold to the government due to high bonus, came to light. Besides, it is leading to monoculture of rice in many pockets, which may not be good in the long run.
Chart 2.3: Rice Production & Procurement as a share of production in Chhattisgarh(2001-02 o 2012-13)
25
2.8 The economic cost of procurement to FCI has been increasing over time and with
rising procurement levels - demonstrating that it suffers from diseconomies of scale with increasing levels of procurement (Chart 2.4). Currently, the economic cost of FCI for acquiring, storing and distributing rice is about 40 percent more than the procurement price. To illustrate the costs involved in holding stocks, in terms of storage and interest cost alone, the cost of carrying rice for a year with government agencies is about Rs 300/qtl. As on 1st February, 2013, the rice stocks in the Central Pool were 35.4 million tonnes-two and a half times the buffer norm (13.8 million
Box 2.1: Chhattisgarh: State policy triggering distortions in rice market
Chhattisgarh declared a bonus of Rs 220/qtl in 2008-09, in addition to the Rs 50 per qtl bonus announced by the Centre and has been providing Rs 50/qtl bonus to its farmers since then which has created a spurt in rice production and procurement in the state. In the latest Budget the State has announced a bonus of Rs 270/qtl for 2012-13, which is almost 22 percent of the MSP announced by the Centre In a span of five years, from 2008-09 to 2012-13, while area under rice has remained stable at 3.7 million ha, production of rice increased by 42.2 per cent from 4.4 million tonnes to 6.3 million tonnes, while procurement increased by 67 per cent from 2.9 million tonnes to 4.8 million tonnes (as on 26.2.2013). From procuring half of its rice production in 2007-08, the Government has now (up to 26.2.13) cornered more than three-quarters of its total rice produce in 2012-13 (See chart 2.3).More than 90 per cent of market arrivals are now being procured by the state. While the efforts of the state in increasing rice production are laudable, its increasing presence in the market has totally marginalized the role of private trade in the state. During the Commission’s visit to the state, several reports of paddy coming from adjoining states, especially Odhisha, to be sold to the government due to high bonus, came to light. Besides, it is leading to monoculture of rice in many pockets, which may not be good in the long run.
Chart 2.3: Rice Production & Procurement as a share of production in Chhattisgarh (2001-02o 2012-13)
*Till 26.2.2013
Source: DES, FCI
30
40
50
60
70
80
90
0
1
2
3
4
5
6
7
2001
-02
2002
-03
2003
-04
2004
-05
2005
-06
2006
-07
2007
-08
2008
-09
2009
-10
2010
-11
2011
-12
2012
-13*
Mill
ion
Tonn
es
Production Procurement % share in Prod.
%
Increase in procurement in last five years due to additional bonuses by the State
*Till 26.2.2013 Source: DES, FCI

15
forPolicy
Kharif CropsPrice
2.8 The economic cost of procurement to FCI has been increasing over time and with rising procurement levels - demonstrating that it suffers from diseconomies of scale with increasing levels of procurement (Chart 2.4). Currently, the economic cost of FCI for acquiring, storing and distributing rice is about 40 percent more than the procurement price. To illustrate the costs involved in holding stocks, in terms of storage and interest cost alone, the cost of carrying rice for a year with government agencies is about Rs 300/qtl. As on 1st February, 2013, the rice stocks in the Central Pool were 35.4 million tonnes-two and a half times the buffer norm (13.8 million tonnes on 1st January). There are estimates that FCI is still carrying stocks which are 2-3 years old. This amounts to gross wastage of economic resources without serving any welfare objective. Also, the private sector needs to be involved to impart efficiency and transparency to the procurement and handling operations. Otherwise, increasing procurements will lead to more than proportionate increase in economic costs of FCI, given its diseconomies of scale, and consequently perpetual increases in food subsidy.
Chart 2.4: Economic Cost of Rice Procurement to FCI (1993-94 to 2011-12)
Source: Commission’s calculations based on the basic cost data from FCI
FCI suffers from diseconomies of scale with increasing levels of procurement
2.9 This sub-optimal management of stocks becomes all the more glaring when the quality and quantity of storage capacity is considered. The total storage capacity of FCI and state agencies, as on 1.2.2013, was 71.7 million tonnes, of which covered capacity was 53.4 million tonnes and the rest were under Cover and Plinth (CAP). The stock (rice + wheat) position as on 1st July, 2013 is expected to cross 90 million tonnes. The gross inadequacy of storage capacity is evident exposing stored grains to damage. It was observed during the visits of the Commission that many procurement centres in Chhattisgarh had minimal infrastructure for storage in place, where even dunnage (the plinth) and tarpolin covers were missing. In this context, the Commission recommends that the government revisit the policy of following an open-ended procurement by
Quantity and quality of storage capacity with State agencies is grossly inadequate

16
forPolicy
Kharif CropsPrice
FCI. Instead, rational procurement targets for states, based on what is the total requirement of FCI for public distribution, may be fixed for each state.
Prices and Efficacy of Price Policy
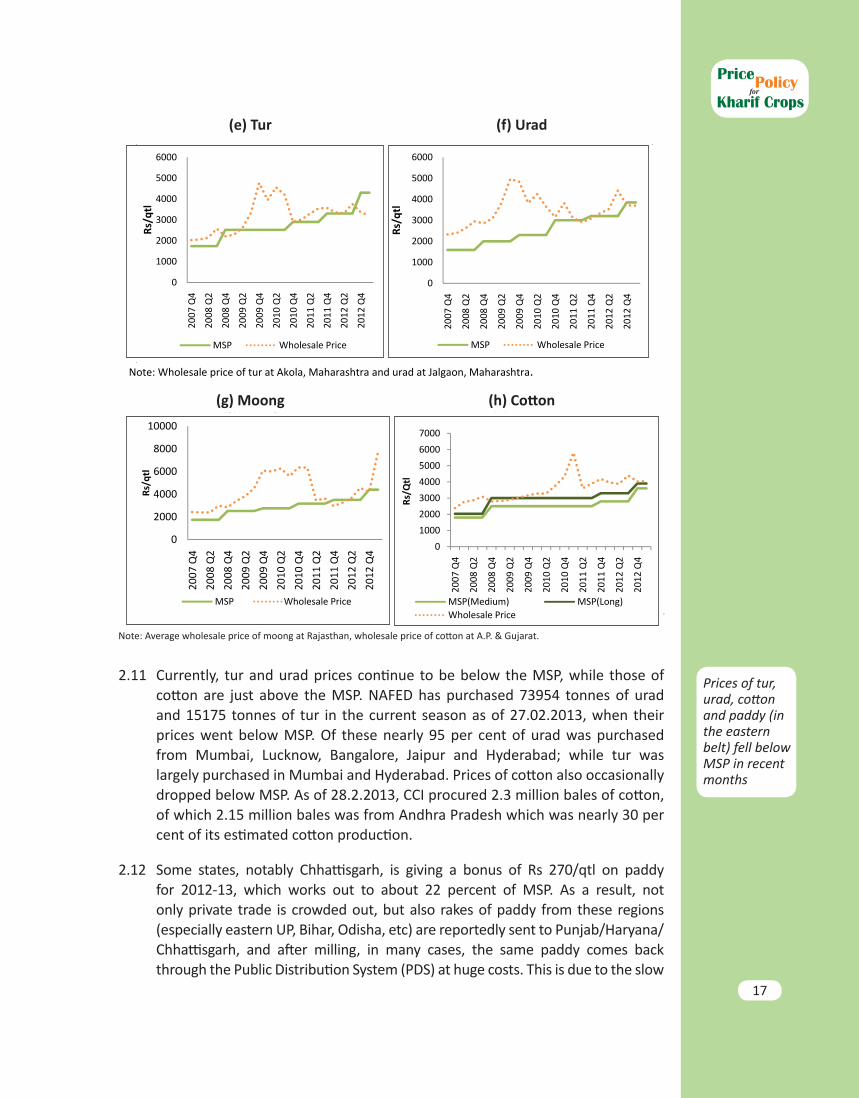
2.10 An examination of the wholesale prices of the major kharif crops reveals that prices of paddy (excluding the eastern belt), maize, moong, groundnut and soyabean are generally showing a rising trend, while the prices of paddy (in the eastern belt), tur, urad and cotton are currently ruling below or around their respective MSPs. States/centers where prices of kharif crops tipped below MSP during 2012-13 are given in annex table 2.4 (a&b). Charts showing the wholesale prices of the major crops vis-à-vis their MSPs are shown under chart 2.5 (a) to (h).
Chart 2.5: Wholesale price trends of Major Kharif Crops - 2007 Q4 to 2013 Q1 (Prices of 2013 Q1 up to 25.2.2013)
(a) Paddy (b) Maize
Source: DES Notes: Average wholesale prices of paddy at AP, Chhattisgarh, Punjab, Karnataka, Tamil Nadu, Maharashtra, Kerala and Gujarat; Average wholesale price of paddy in eastern states of Assam, Bihar, Odisha, UP and West Bengal; wholesale prices of maize at Karnataka and AP.
(c) Soyabean (d) Ground nut
Notes: Average wholesale prices of groundnut at M.P. and of soyabean at Gujarat.
500
700
900
1100
1300
1500
2007
Q4
2008
Q2
2008
Q4
2009
Q2
2009
Q4
2010
Q2
2010
Q4
2011
Q2
2011
Q4
2012
Q2
2012
Q4
Rs/q
tl
MSP(Common) OthersEastern Belt
0
200
400
600
800
1000
1200
1400
2007
Q4
2008
Q2
2008
Q4
2009
Q2
2009
Q4
2010
Q2
2010
Q4
2011
Q2
2011
Q4
2012
Q2
2012
Q4
Rs/q
tl
MSP Wholesale Price
0
1000
2000
3000
4000
5000
6000
2007
Q4
2008
Q2
2008
Q4
2009
Q2
2009
Q4
2010
Q2
2010
Q4
2011
Q2
2011
Q4
2012
Q2
2012
Q4
Rs/q
tl
MSP
0500
1000150020002500300035004000
2007
Q4
2008
Q2
2008
Q4
2009
Q2
2009
Q4
2010
Q2
2010
Q4
2011
Q2
2011
Q4
2012
Q2
2012
Q4
Rs/q
tl)
MSP(Black) Wholesale Price
(c) Soyabean (d) Groundnut(c) Soyabean (d) Groundnut
Notes: Average wholesale prices of soyabean at M.P. and of groundnut at Gujarat.
0
1000
2000
3000
4000
5000
6000
2007
Q4
2008
Q2
2008
Q4
2009
Q2
2009
Q4
2010
Q2
2010
Q4
2011
Q2
2011
Q4
2012
Q2
2012
Q4
Rs/q
tl
MSP Wholesale Price
0500
1000150020002500300035004000
2007
Q4
2008
Q2
2008
Q4
2009
Q2
2009
Q4
2010
Q2
2010
Q4
2011
Q2
2011
Q4
2012
Q2
2012
Q4
Rs/q
tl)
MSP(Black) Wholesale Price
17
forPolicy
Kharif CropsPrice
2.11 Currently, tur and urad prices continue to be below the MSP, while those of cotton are just above the MSP. NAFED has purchased 73954 tonnes of urad and 15175 tonnes of tur in the current season as of 27.02.2013, when their prices went below MSP. Of these nearly 95 per cent of urad was purchased from Mumbai, Lucknow, Bangalore, Jaipur and Hyderabad; while tur was largely purchased in Mumbai and Hyderabad. Prices of cotton also occasionally dropped below MSP. As of 28.2.2013, CCI procured 2.3 million bales of cotton, of which 2.15 million bales was from Andhra Pradesh which was nearly 30 per cent of its estimated cotton production.
2.12 Some states, notably Chhattisgarh, is giving a bonus of Rs 270/qtl on paddy for 2012-13, which works out to about 22 percent of MSP. As a result, not only private trade is crowded out, but also rakes of paddy from these regions (especially eastern UP, Bihar, Odisha, etc) are reportedly sent to Punjab/Haryana/Chhattisgarh, and after milling, in many cases, the same paddy comes back through the Public Distribution System (PDS) at huge costs. This is due to the slow
Note: Wholesale price of tur at Akola, Maharashtra and urad at Jalgaon, Maharashtra.
(g)Moong (h) Cotton
0
1000
2000
3000
4000
5000
6000
2007
Q4
2008
Q2
2008
Q4
2009
Q2
2009
Q4
2010
Q2
2010
Q4
2011
Q2
2011
Q4
2012
Q2
2012
Q4
Rs/q
tl
MSP Wholesale Price
0
1000
2000
3000
4000
5000
6000
2007
Q4
2008
Q2
2008
Q4
2009
Q2
2009
Q4
2010
Q2
2010
Q4
2011
Q2
2011
Q4
2012
Q2
2012
Q4
Rs/q
tl
MSP Wholesale Price
0
2000
4000
6000
8000
10000
2007
Q4
2008
Q2
2008
Q4
2009
Q2
2009
Q4
2010
Q2
2010
Q4
2011
Q2
2011
Q4
2012
Q2
2012
Q4
Rs/q
tl
MSP Wholesale Price
0
1000
2000
3000
4000
5000
6000
7000
2007
Q4
2008
Q2
2008
Q4
2009
Q2
2009
Q4
2010
Q2
2010
Q4
2011
Q2
2011
Q4
2012
Q2
2012
Q4
Rs/Q
tl
MSP(Medium) MSP(Long)Wholesale Price
Prices of tur, urad, cotton and paddy (in the eastern belt) fell below MSP in recent months
(e) Tur (f) Urad
(g) Moong (h) Cotton
Note: Average wholesale price of moong at Rajasthan, wholesale price of cotton at A.P. & Gujarat.

18
forPolicy
Kharif CropsPrice
growth of rice mills with large capacities in both UP and Bihar. Although Bihar has announced a subsidy of 35 per cent [40 per cent in the case of groups such as Special Purpose Vehicles (SPV)] of the project cost for setting up new rice mills or modernize existing ones, they are capped at Rs 50 lakhs (Rs 100 lakhs for SPVs), which has led to a mushrooming of small scale units with low capacities. Under the subsidy scheme, 55 units have been given subsidy and their average capacity is 4 tonnes per hour. It is reported that of the total of around 350 rice mills about 295 or more than 80 per cent of mills are of less than one tonne/hour capacity. It is also reported that the conversion rate of paddy to rice in these small units is only 60 per cent vis-à-vis 67 per cent in the bigger ones. Bihar needs modern and large scale mills that give higher recovery at lower costs and would promote efficiency and growth. For this, the subsidy cap needs to be reviewed.
2.13 This lack of marketing infrastructure especially in the eastern belt along with the spurt in prices of rice in the domestic market despite surplus stocks available with State Agencies is indicative of existence of gross distortions in agri-markets, calling for urgent reform with a view to “get the markets right”.
Market distortions2.14 The essential roles of a market are price discovery of traded goods and services and
serve as a signal for efficient allocation of productive resources. Any distortions to competitive functioning of markets adversely affect these functions and reduce the efficiency of market outcomes. Indian agricultural sector is currently stifled by various controls ranging from trade to domestic marketing and stocking. Reforming these distortions will create greater competition, promote efficiency and growth, and thus should be accorded high priority.
Bonuses on MSP
2.15 The MSP mechanism was adopted during the 1960s as an answer to market failure that was actually created due to market controls, such as stocking limits, movement restrictions, export controls etc. These led to an artificial glut in the market which was also compounded by the absence of long term storage capacities in the private sector. The MSP mechanism was put in place to act as insurance for the farmer against such market crashes that were unnaturally created. The aim was also to turn Indian agriculture into a remunerative sector so that farmers are incentivized to adopt modern technologies and better farming practices, raising productivity and overall production. The mechanism has over the years served to enhance the production of specific crops such as rice and wheat. In recent times, while this mechanism itself seems to have limited purpose, state governments have been announcing crop specific bonuses, which have affected the inter-crop parity as they influence the farmer to grow a particular crop at the cost of other equally important crops and thus distort the production basket. For instance, Chhattisgarh declared a bonus of Rs 220/
Paddy farmers in the entire eastern belt are selling at 10 - 20 % below MSP, while FCI is procuring paddy/rice from states (like Punjab, Haryana, AP, Chhattisgarh) at 10 to 15 percent above MSP due to high taxes and other statutory levies
Agriculture is stifled by various controls ranging from trade to domestic marketing & stocking

19
forPolicy
Kharif CropsPrice
qtl for paddy in 2008-09, in addition to the Rs 50 per qtl bonus announced by the Centre (thus totaling Rs 270/qtl) and has been providing Rs 50/qtl bonus to its farmers since then. A bonus of Rs 270/qtl on paddy has been announced for 2012-13, which would further distort the rice market with increased paddy/rice production and state procurement. Other states have also increased the bonus in 2012-13 over last year: Kerala from Rs 420 to Rs 450 per quintal, Madhya Pradesh from Rs 50 to Rs 100 per quintal for both common and grade A varieties. Tamil Nadu12 (at Rs 50 per quintal for both common and grade A varieties) and Karnataka (at Rs 250 per quintal) have maintained last year’s levels. The Commission recommends that any benefits/bonuses should be crop-neutral, unless there are some urgent reasons to promote a particular crop. Otherwise this will destroy natural process of diversification in the production basket, lead to monoculture, damage the soil health, and also go against the needs of the nation which is short of edible oils and pulses.
High State Taxes
2.16 As observed earlier, a major contribution of increasing procurement incidentals to FCI are the high rates of statutory levies imposed by some states, which vary from 0-1 per cent in Gujarat to 14.5 per cent in Punjab (Table 2.2). In addition to mandi tax and VAT, cesses are also levied in most states for Infrastructure Development (ID) and Rural Development (RD), all of which will have a cascading effect on prices and increase costs of procurement. Since revenues from the above taxes/levies accrue to state governments, it is therefore expected that more state governments will tap on this, as for instance, Odisha, which increased the total taxes/cesses levied from 8.5 per cent last year to 12 per cent this year. Andhra Pradesh also increased its taxes/levies by 1 per cent to 13.5 per cent. These taxes also drive out the private sector with the result that the entire stock of foodgrains has to be bought by the Government. As the costs of operations are higher, it leads to wastage of economic resources with the marginalization of the farmers in the states where the procurement infrastructure is weak (especially in the eastern belt for paddy). Also, in the international export market, the efficiency of farmers is blunted by these high taxes, thus lowering India’s competitiveness.
Bonuses on MSP affect the inter-crop parity and distort the production basket
12 Termed ‘Production Incentive’ in Tamil Nadu

20
forPolicy
Kharif CropsPrice
Table 2.2: Major States Imposing Taxes/Levies* (as % of MSP) (KMS 2013-14)
States Rice Paddy
Andhra Pradesh 13.5 5
Bihar 6.5 3.5
Chhattisgarh 9.7 10.7
Gujarat # 0-1
Himachal Pradesh 5 1
Haryana 11.5 11.5
Jharkhand 3.5 1
Karnataka 1.5
Kerala 1
Madhya Pradesh 4.7 4.7
Maharashtra 1.05 1.05
Odisha 12 12
Punjab 14.5 14.5
Rajasthan 3.6
Uttar Pradesh 8.5 9
Uttarakhand 7.5 7.5
West Bengal 3 3
Note: *- includes Market Fee, APMC Cess, Arthiya Commission, Dami, Commission to societies/Agents, Mopari Charges etc.; # - There are district wise variations of market fees in Gujarat – ranging from 0-1 per cent.
Source: FCI
Levy Rice
2.17 Another market distortion is the system of levy rice that is in practice. Rice is procured for the Central Pool under statutory levy system on rice millers. The State Governments/UT Administrations issue Levy Orders in exercise of the powers delegated to them under the Essential Commodities Act, 1955 after obtaining the prior concurrence of Central Government. The percentage of levy varies from State to State (Chart 2.6). In 19 of the 23 states/UTs imposing this levy, this is more than 50 percent leaving little rice for the open market. In recent years, the quantities procured under the levy order are declining as many state governments do not enforce the order.
Levy rates for rice in most states are more than 50% leaving little rice for the open market

21
forPolicy
Kharif CropsPrice
Stock Limits and Licensing Requirements
2.18 In addition, control orders that broadly relate to licensing of dealers, regulation of stock limits, restrictions on movement of goods and compulsory purchase under the system of levy are other forms of market distortion. The Essential Commodities Act 1955 (ECA), was enacted to ensure the easy availability of essential commodities to consumers and to protect them from exploitation by unscrupulous traders. The Act provides for the regulation and control of production, distribution and pricing of commodities which are declared as essential for maintaining or increasing supplies or for securing their equitable distribution and availability at fair prices. While the role of state was important during periods of scarcity, its continuation and extension even during years of plenty, such as during the current times, is proving to be counterproductive.
2.19 Keeping in view the comfortable availability of food products, the Central Government in exercise of the powers conferred by section 3 of the ECA issued orders on 15.02.200212
13 and 16.06.200314 removing the licensing requirements, stock limits and movement restrictions on specified foodstuffs; thus allowing the dealers15 to freely buy, stock, sell, transport, distribute, dispose, acquire, use or consume any quantity in respect of specified foodstuffs, namely, rice/paddy,
12 13 Removal of Licensing Requirements, Stock Limits and Movement Restrictions on Specified Foodstuffs, 2002.14 Removal of Licensing Requirements, Stock Limits and Movement Restrictions on Specified Foodstuffs (Amendment) Order,
2003.15 Dealer means any person engaged in the business of purchase, movement, sale, supply, distribution or storage for sale of any
of the commodities specified in clause 3 of the Order, directly or otherwise, whether as a wholesaler or retailer and whether or not in conjunction with any other business and his representative or agent. This definition was expanded in the Amend-ment Order issued in 2003, as follows: ‘Dealer’ means any person engaged in the business of purchase, movement, sale, supply, distribution or storage of any of the commodities specified in clause 3, directly or otherwise, whether as wholesaler or retailer or producer or manufacture or exporter or importer and whether or not in conjunction with any other business and includes his representative or agent but does not include a producer or manufacturer or importer or exporter of sugar.
Chart 2.6: Levy rates for Rice for KMS 2012-13
32
Chart 2.6: Levy rates for Rice for KMS 2012-13
Source: FCI
Stock Limits and Licensing Requirements 2.18 In addition, control orders that broadly relate to licensing of dealers, regulation of
stock limits, restrictions on movement of goods and compulsory purchase under the system of levy are other forms of market distortion. The Essential Commodities Act 1955 (ECA), was enacted to ensure the easy availability of essential commodities to consumers and to protect them from exploitation by unscrupulous traders. The Act provides for the regulation and control of production, distribution and pricing of commodities which are declared as essential for maintaining or increasing supplies or for securing their equitable distribution and availability at fair prices. While the role of state was important during periods of scarcity, its continuation and extension even during years of plenty, such as during the current times, is proving to be counterproductive.
2.19 Keeping in view the comfortable availability of food products, the Central
Government in exercise of the powers conferred by section 3 of the ECA issued orders on 15.02.200212 and 16.06.200313 removing the licensing requirements, stock limits and movement restrictions on specified foodstuffs; thus allowing the dealers14 to freely buy, stock, sell, transport, distribute, dispose, acquire, use or
12 Removal of Licensing Requirements, Stock Limits and Movement Restrictions on Specified Foodstuffs, 2002. 13 Removal of Licensing Requirements, Stock Limits and Movement Restrictions on Specified Foodstuffs (Amendment) Order, 2003. 14 Dealer means any person engaged in the business of purchase, movement, sale, supply, distribution or storage for sale of any of the commodities specified in clause 3 of the Order, directly or otherwise, whether as a wholesaler or retailer and whether or not in conjunction with any other business and his representative
75 75
60
50 50
33 30 30
0
10
20
30
40
50
60
70
80
And
hra
Prad
esh
Har
yana
Odi
sha
Punj
ab
Utt
arak
hand
Utt
ar P
rade
sh
Ass
am
Bih
ar
Chh
atti
sgar
h
Guj
arat
Him
acha
l Pr
ades
hJa
mm
u &
Ka
shm
ir
Jhar
khan
d
Wes
t B
enga
l
Karn
atak
a
Mad
hya
Prad
esh
Mah
aras
htra
Tam
il N
adu
(%)
Extension of ECA prevents development of vibrant markets
Source: FCI
Extension of ECA prevents development of vibrant markets

22
forPolicy
Kharif CropsPrice
wheat, coarse grains, sugar, edible oils and oilseeds16, pulses, gur, wheat products (namely, maida, rava, suji, atta, resultant atta and bran) and hydrogenated vegetable oil or vanaspati17. The aim was to facilitate free trade and movement of commodities, which would enable farmers to get better prices for their produce, achieve price stability and ensure availability of commodities specified in the Order at fair prices throughout the country.
2.20 However, in the context of rise in prices of some essential commodities in 2003-04 and widespread concern on speculative hoarding of stocks, these orders were kept in abeyance for a period of six months only initially with respect of wheat and pulses with no restrictions on inter-state movement and import of these two items18. This was periodically extended through notified Amendment Orders in respect of wheat, pulses, edible oils, edible oilseeds, rice, paddy and sugar enabled the State Governments to fix stock limits for these commodities and also prescribe licensing. An abridged time line of the EC Act (Amendment Orders) since 2002 till date is shown in table 2.3. At present stock limits are permitted for pulses, edible oils and edible oilseeds for a period upto 30.9.2013 and in respect of rice and paddy upto 30.11.2013.
Table 2.3: Time line of EC Act 1955 (Amendment Orders) 2002-2012
Date from which effective
Commodities covered (clause 3) Up to
15.3.2002 Wheat, paddy/rice, coarsegrains, sugar, edible oilseeds and edible oils
15.7.2003 Above + pulses, gur, wheat products (namely, maida, rava, suji, atta, resultant atta and bran) and hydrogenated vegetable oil or vanaspati
29.8.2006 Wheat 1.4.2009
29.8.2006 Pulses 30.9.2013
7.4.2008 Edible oils, edible oilseeds 30.9.2013
7.4.2008 Rice 30.11.2013
1.9.2008 Paddy 30.11.2013
9.3.2009 Sugar 30.11.2011
Source: Department of Consumer AffairsNote: Details available on www.consumeraffairs.nic.in
2.21 A total of 23 states/UTs have fixed stock limits on one or more commodities, and another 4 states/UTs have put only licensing/stock declaration requirements. While 3 states have fixed stock limits on paddy, 6 have fixed for rice, 22 for pulses, 16 for edible oilseeds and 19 for edible oils. While states like Andhra Pradesh, Jharkhand and Maharashtra have fixed stock limits for all 5 commodities,
16 Covered in 2002 Order17 Added in 2003 Order18 Removal of (Licensing Requirement, Stock Limits and Movement Restriction on Specified Foodstuffs), Amendment Order,
2006, which was notified on 29.08.2006
Stock limits exist for pulses, edible oils & edible oilseeds, rice and paddy
23
forPolicy
Kharif CropsPrice
Kerala, Madhya Pradesh and Rajasthan have imposed only on pulses, although Rajasthan has in addition, specific stocking limits on gram; other states have fixed for 2-4 commodities. However, there are no restrictions on inter-state movement and on imported foodgrains, provided the wholesaler or retailer or dealer demonstrates that the stocks in respect of any of the commodities were sourced from imports. Despite this, it is observed that some state governments have at different times imposed restrictions on inter-state movement of foodgrains. In addition, owing to difficulties in proving the imported status of goods, it is reported that wholesalers and retailers are unable to use the exemption provision available for imported goods.
APMC Act
2.22 Agricultural Markets in most parts of the country are established and regulated under the State Agricultural Produce Market Committees (APMC) Acts. The monopoly of Government regulated wholesale markets have prevented development of a competitive marketing system in the country and establishing effective linkages between farm production and retail chains. Accordingly, a model APMC Act was formulated by the Ministry of Agriculture in 2003. There are seven vital areas of reform that have been identified:
(i) Establishment of private market yards/private markets managed by a person other than a Market Committee.
(ii) Establishment of private yards and direct purchase of agricultural produce from agriculturist by a person other than a Market Committee (Direct purchasing from producer).
(iii) Single registration/license for trade transaction in more than one market.(iv) Provision of Contract Farming.(v) Promote and encourage e-trading.(vi) Single point levy of market fee.(vii) Establishment of consumer/farmers market by a person other than Market
Committee (Direct sale by the producer to the consumers).
2.23 Different states are in varying stages of progress. States like Tamil Nadu have completely reformed the APMC Act, while Bihar has repealed the same. In the latter case, while all market barriers have been removed, dynamic efforts to develop infrastructure to facilitate trade is lacking. States/ UTs of Kerala, Manipur, Andaman & Nicobar Islands, Dadra & Nagar Haveli, Daman & Diu, and Lakshadweep do not have APMC Act.
2.24 A step towards establishing a single market requires the Central Orders dated 15.2.2002 and 16.6.2003 issued under the EC Act to be revived so as to remove the licensing requirements, stock limits and movement restrictions on specified foodstuffs. In addition the levy order must also be withdrawn. These orders have their origins in situations like war, natural calamities that disrupt or threaten to disrupt supply of such essential commodities through normal trade channels and thus require Central Government’s intervention. They are thus anachronistic in the current scenario and must be removed to facilitate free trade and
Model APMC Act needs to be urgently adopted for creation of competitive markets and efficient supply chains
24
forPolicy
Kharif CropsPrice
movement of commodities, which would enable farmers to get better prices for their produce, achieve price stability and ensure availability of commodities at fair prices throughout the country. The First Report of Committee of State Ministers in-charge of agriculture marketing to promote reforms, April, 2011 has also recognized this and states that, ‘Due to the restrictive provisions of the ECA and various control orders issued there under, private investment in large scale storage and marketing infrastructure including in the areas of contract farming, direct marketing have not been very encouraging.’
Degree of Market Distortions and Ranking of States
2.25 An exercise was undertaken to study the degree of market distortions prevalent in the paddy/rice markets in 18 states of Andhra Pradesh, Assam, Bihar, Chhattisgarh, Gujarat, Haryana, Himachal Pradesh, Jharkhand, Karnataka, Kerala, Madhya Pradesh, Maharashtra, Odisha, Punjab, Tamil Nadu, Uttar Pradesh, Uttarakhand and West Bengal. Since the exercise was confined to paddy/rice, only those states that provide cost data for paddy under the CS scheme were selected.
2.26 Six parameters were considered: Taxes/cesses levied (as percent of MSP); additional bonus announced; rice procured (as percent of rice production); stock limits fixed on rice and paddy; levy rice (as per cent of rice milled by millers) and market reforms under APMC Act carried out in states. States were ranked on the basis of the extent to which prevalent state policies impacted on the market. The methodology adopted to study the degree of market distortions prevalent in the paddy/rice markets in India is explained in Annex 2.3.
2.27 A simple ranking was done of the 18 states on each of the six parameters. States were ranked from 1 to 18 with the first rank denoting the best. A simple average of the ranks for each state was then calculated. The states were then grouped into 3 bands – Band 1-5 denoting the top five (green) states; Band 6-10 indicating the next five (amber) states; and Band 11-18 including the bottom eight (red) states. This exercise reveals the relative status of each state with respect to the level of ‘market friendly’ policies adopted. It emerges that in the case of paddy/rice markets, the ‘green’ (top five) states are Gujarat, Assam, Himachal Pradesh, Bihar and Kerala. They are followed by (next five) ‘amber’ states of Tamil Nadu, Karnataka, Maharashtra, West Bengal and Jharkhand. The most distorted (bottom eight) markets (in ascending order of market distortions) are Uttarakhand, Madhya Pradesh, Uttar Pradesh, Odisha, Haryana, Punjab, Andhra Pradesh and Chhattisgarh. The ranking of the states and the comparative zones they fall into, from ‘green’ (relatively free market) to ‘red’ (distorted market), are shown in table 2.4. Thus, according to this exercise Gujarat was most market friendly and Chhattisgarh, the most distorted state with respect to paddy/rice market in India.
Urgent reform of ECA & APMC Acts required

25
forPolicy
Kharif CropsPrice
Table 2.4: Ranking of major states according to distortions created in paddy/rice market
2.28 Above eight states with most distorted markets with respect to paddy & rice procured about 62 percent of total marketed surplus of rice in 2011-12. Thus, the magnitude of distortion in the rice & paddy markets is clearly evident.
Recommendations
2.29 This report’s main focus is on ‘getting the markets right’, on bringing the focus back to establishing a single barrier free market, with minimum controls. However, the disparate policies adopted at the Centre and some states as discussed in the above paragraphs have cumulatively led to market distortions. The Commission recommends the following to enable markets to function efficiently:
(i) State governments need to facilitate setting up adequate infrastructure such as storage facilities by the private sector, milling capacities; they also need to be discouraged from embarking on a high procurement mission, as it is detrimental to the competitive functioning of the product markets, and discourages private sector participation. State should come only as a last resort where the markets fail, and not take over the functioning of markets as a first step.

26
forPolicy
Kharif CropsPrice
(ii) The Commission reiterates its recommendation that the government reviews its policy of following an open-ended procurement and limit its purchases to say only 75 percent of last year’s purchases, especially from States which levy bonus/high taxes. In this context there is also need to assess and indicate the exact quantum of procurement required to be made each year.
(iii) Revisit the need for EC Act, which is an anachronism in the current context of ample foodgrains. On similar lines, reduce and abolish the levy order on rice, which is dysfunctional in some states, over a three year horizon.
(iv) Get states to either repeal or reform their APMC Act in its various dimensions, especially with respect to the freedom to buy directly from farmers and have private agricultural markets. In states where it is repealed, like Bihar, the state needs to invite the private sector to build markets, say under Public-Private Partnership (PPP) mode, with a view to ensure that markets can function smoothly, efficiently, and in a transparent manner. This would be only in line with the objective of efficient governance and regulation.

27
3.1 The temporal behavior of India’s exports and imports shows that India has consistently remained a net exporter of agri-products during the last two decades. Agri-exports have increased more than ten times from US$ 3.5 billion in 1990-91 to US$ 37.1 billion in 2011-12. Agri-Imports have increased from US$ 0.7 billion in 1990-91 to US$ 17.2 billion in 2011-12. Indian agriculture has increasingly integrated with the world markets as measured by agri-trade as percentage of agri-GDP. The agri-trade (exports plus imports) as a percentage of agri-GDP, which was about 5 percent in 1990-91, when economic reforms started in India, is today more than three times of that, touching 18 percent in 2011-12. India’s share in total global exports of agri products has increased from 0.8 percent in 1990 to 2.1 percent in 2011. This share is more than the share that India has in global merchandise exports i.e 1.7 percent in 2011 (0.6 percent in 1990). Thus, India has an inherent competitive advantage in agri-products.
3.2 During triennium average ending (T.E) 2011-12, rice was the leading agriculture export product (with a share of 12.0 percent) closely followed by raw cotton (11.4 percent), marine products (9.9 percent), oil meals (7.9 percent), meat & preparations (7.6 percent), spices (7.1 percent), guargum meal (5.3 percent) and sugar (5.2 percent). India has emerged as the largest exporter of rice in 2012 and a leading exporter of cotton and maize. In terms of agri-imports,
India has consistently remained a net exporter of agri-products during the last two decades
Chapter 3India’s Trade Competitiveness
forPolicy
Kharif CropsPrice

28
forPolicy
Kharif CropsPrice
edible oils (accounting for 52.0 percent in TE 2011-12), wood & wood products (13.5 percent) and pulses (12.2 percent) cornered three-fourths of the total. (Chart 3.1).
3.3 India’s agri-export policy for most of the commodities has been a “residual policy”. Any actual or perceived shortage of any essential commodity impacting domestic price adversely makes the Government use trade, tariff and administrative means to contain pressure on prices in the market. Trade in agri-products can expand further if our trade policy is more open, liberal, neutral and stable. Efficiency gains from trade can be tapped not only by exporting commodities in which we have competitive advantage but also importing those where we don’t have competitive edge. This also helps the domestic production to restructure itself in line with global comparative advantage. But trade competitiveness is a dynamic phenomenon, which would vary depending upon the changes in international and domestic prices consequent upon demand and supply of commodities, as well as by changing technologies impacting costs of production and market conditions. In its simplest form trade competitiveness can be measured by comparing domestic prices with its export/import parity reference price measured over a period of time, which in turn is derived by deducting/adding freight, port handling, margins etc from the fob/cif price of that commodity. If domestic price of any commodity is lower than the export/import parity reference price, then the commodity is export/import competitive. In the absence of reliable data on transport and other charges, an attempt has been made to compare the domestic and international prices of major agri crops over the last decade to get an idea of the alignment between them, which can also help shaping the domestic MSP policy to ensure that domestic prices are not very much out of line with global price vector of important agri-commodities.
Rice, 12.0
Raw Cotton, 11.4
Marine Products, 9.9
Oil meals, 7.9Meat &
Prep, 7.6Spices, 7.1Guargum Meal, 5.3
Sugar, 5.2
Others, 33.6Pulses, 12.2
Edible Oils, 52.0
Wood & Wood
Products,13.5
Fruits & Nuts Inc Cashew
Nuts, 11.2
Raw Cotton, 1.5
Others, 9.6
Chart 3.1: Composition of India’s Agri-Exports & Agri-Imports, TE 2011-12
Agri-Exports Agri-Imports
Source: Agricultural Statistics at a Glance, various issues & Department of Commerce
India’s agri-export policy for most of the commodities has been a residual policy

29
forPolicy
Kharif CropsPrice
CEREALS - Rice
3.4 India’s export of rice has fluctuated between 2.2 million tonnes to 7.2 million tonnes during the period 2001-02 to 2011-12 (Chart 3.2). Domestic wholesale prices have been lower than international prices especially during the last six years (Chart 3.3). As exports of non-basmati rice were banned since April 2008, Indian farmers could not exploit this price competitiveness. Since exports of non-basmati rice have been opened from September, 2011, India exported record 7.2 million tonnes in FY 2011-12 and has already exported 7.5 million tonnes in Apr-Dec, 2012-13. As per FAO, India emerged as the world’s largest exporter of rice in calendar year 2012.
3.5 Exports of non-basmati rice from the country was banned vide DGFT Notification dated 15.10.2007. However, vide DGFT notification dated 31.10.2007, the ban on export of non-basmati rice was replaced with Minimum Export Price (MEP) regulation of US$ 425. Subsequently, the MEP was revised from time to time. Exports of rice from Central Pool were discontinued vide order dated 25.03.2008. Export of non-basmati rice on private account was also prohibited with effect from 01.04.2008 in view of the tight position of rice in the domestic market. This ban continued till 11.07.2011 when exports of 1 million tonnes of non-basmati rice on private account were allowed with a MEP of US$ 425. On 08.09.2011, exports of non-basmati rice were allowed under Open General License (OGL) by private parties out of privately held stocks and have been continued thereafter. India has emerged as the largest rice exporter since then. Regarding imports, import duties of 80 per cent for husked rice & broken rice and 70 per cent for milled and semi-milled rice were imposed on April 1,
Source: DGCI&S Source: World Bank for International Price for Rice (Thailand), 25% broken, f.o.b. Bangkok; Domestic prices for Rice have been taken from Amritsar, Punjab taken from State reply
0.0
1.0
2.0
3.0
4.0
5.0
6.0
0.0
1.0
2.0
3.0
4.0
5.0
6.0
7.0
8.0
2001
-02
2002
-03
2003
-04
2004
-05
2005
-06
2006
-07
2007
-08
2008
-09
2009
-10
2010
-11
2011
-12
US$
Bill
ion
Mill
ion
Tonn
es
Volume Value
5000
9000
13000
17000
21000
25000
29000
33000
2001
-02
Q1
2001
-02
Q4
2002
-03
Q3
2003
-04
Q2
2004
-05
Q1
2004
-05
Q4
2005
-06
Q3
2006
-07
Q2
2007
-08
Q1
2007
-08
Q4
2008
-09
Q3
2009
-10
Q2
2010
-11
Q1
2010
-11
Q4
2011
-12
Q3
Rs/t
onne
International Domestic
Source: World Bank for International Price for Rice (Thailand), 25% broken, f.o.b. Bangkok; Domestic prices for Rice have been taken from Amritsar, Punjab taken from State reply
Chart 3.3: International vs Domestic Prices of Rice
Chart 3.2: India’s Exports of Rice from 2001-02 to 2011-2012
Source: DGCI&S
India emerged as world’s largest exporter of rice in 2012 but has 70-80% import duties on rice

30
forPolicy
Kharif CropsPrice
2000. In view of tight position of rice in the domestic market, import duty on milled and semi-milled rice was reduced to zero per cent from 01.03.2008 to 31.03.2009. The Government withdrew the full exemption on import duty and imposed a basic customs tariff of 70 per cent on semi-milled or wholly milled rice on 31.03.2009. With some intermittent relaxations, import duty on rice remains at 70-80 percent. This defies any economic rationality that world’s biggest exporter of rice has an import duty of 70-80 percent, which in fact are totally unnecessary. It will be only in the fitness of trade realities that these import duties are slashed to 5-10 percent.
COARSE CEREALS – Maize (Corn)
3.6 India’s exports of maize have increased from a comparatively low quantity of 0.1 million tonnes in 2001-02 to 3.9 million tonnes in 2011-12 (Chart 3.4), in response to rising production after 2006-07. Since 2005, India introduced single cross hybrid varieties of corn which helped raise corn yields. Domestic wholesale prices of maize have been broadly in line with the international prices till 2010 (Chart 3.5). In recent years, international prices have risen and India exported a record 3.9 million tonnes in FY 2011-12 and 3.1 million tonnes in Apr-Dec, 2012-13.
India exported 3.9 million tonnes of maize in 2011-12 but restricts imports with 50% import duty
Source: World Bank for International Price of corn, US No.2 yellow, fob, US Gulf Ports and DES for domestic Price of Karnataka
0.0
0.2
0.4
0.6
0.8
1.0
1.2
0.0
0.5
1.0
1.5
2.0
2.5
3.0
3.5
4.0
2001
-02
2002
-03
2003
-04
2004
-05
2005
-06
2006
-07
2007
-08
2008
-09
2009
-10
2010
-11
2011
-12
US$
Bill
ion
Mill
ion
Tonn
es
Volume Value
0
3000
6000
9000
12000
15000
18000
2001
-02
Q1
2001
-02
Q4
2002
-03
Q3
2003
-04
Q2
2004
-05
Q1
2004
-05
Q4
2005
-06
Q3
2006
-07
Q2
2007
-08
Q1
2007
-08
Q4
2008
-09
Q3
2009
-10
Q2
2010
-11
Q1
2010
-11
Q4
2011
-12
Q3
2012
-13
Q2
Rs/T
onne
International Domestic
Chart 3.4: India’s Exports of Maize from 2001-02 to 2011-12
Chart 3.5: International versus Domestic prices of maize
Source: DGCI & S
3.7 Quantitative ceiling on export of maize was removed vide DGFT notification dated 5.3.2002. Export of maize (corn) was prohibited vide DGFT notification dated 3.7.2008 for a brief period up to 15.10.2008. Export of maize is free with effect from 16.10.2008. The Government of India, vide DGFT notification dated 12.6.2000, introduced a Tariff Rate Quota (TRQ) for maize imports, as part of its agreement with WTO. The maize TRQ was set at 3,50,000 tonnes

31
forPolicy
Kharif CropsPrice
in a financial year with 15 per cent in quota duty and 50 per cent import duty over the quota. Under the TRQ Scheme, NAFED, STC, MMTC, PEC and State Cooperative Marketing Federations were eligible to avail quota on behalf of actual users. TRQ for maize (corn) imports was raised to 4,00,000 tonnes vide DGFT notification dated 1.3.2001, 4,50,000 tonnes vide DGFT notification dated 1.3.2002 and 5,00,000 tonnes vide DGFT notification dated 4.4.2003. Import of maize, under TRQ, was allowed at zero import duty vide DGFT notification dated 25.1.2007. Import duty on maize outside TRQ Scheme continues to be at 50 per cent. Thus, exports of maize are free while imports are restricted with 50 percent duty creating a pro-producer policy.
COARSE CEREALS-Jowar (Sorghum)
3.8 India’s exports of Jowar increased from a negligible quantity of 0.4 thousand tonnes in 2001-02 to a high of 90.37 thousand tonnes in 2008-09 and then declined to 40.7 thousand tonnes in 2011-12. India’s imports of jowar are nil. During the period from 2002-03 (Q3) to 2012-13 (Q1), the domestic wholesale prices of jowar (yellow) in Maharashtra and Karnataka have been generally higher than the international prices (Chart 3.6). India’s exports are mainly to the neighbouring countries like Pakistan and Sri Lanka and the countries such as UAE, Yemen, Saudi Arabia, Kenya, Eritrea and Malaysia which are comparatively nearer to India than the main competitor USA. So the difference in freight charges is making it possible for India to export jowar to these countries.
42
TRQ Scheme continues to be at 50 per cent. Thus, exports of maize are free while imports are restricted with 50 percent duty creating a pro-producer policy.
COARSE CEREALS-Jowar (Sorghum) 3.8 India’s exports of Jowar increased from a negligible quantity of 0.4 thousand tonnes
in 2001-02 to a high of 90.37 thousand tonnes in 2008-09 and then declined to 40.7 thousand tonnes in 2011-12. India’s imports of jowar are nil. During the period from 2002-03 (Q3) to 2012-13 (Q1), the domestic wholesale prices of jowar (yellow) in Maharashtra and Karnataka have been generally higher than the international prices (Chart 3.6). India’s exports are mainly to the neighbouring countries like Pakistan and Sri Lanka and the countries such as UAE, Yemen, Saudi Arabia, Kenya, Eritrea and Malaysia which are comparatively nearer to India than the main competitor USA. So the difference in freight charges is making it possible for India to export jowar to these countries.
Chart 3.6: International vs Domestic prices of Jowar
Source: World Bank pink Sheet for international Price for Sorghum (US), No. 2 milo yellow, f.o.b. Gulf, Agmarknet for Domestic price of Jowar yellow variety in Maharashtra and Karnataka and CACP for MSP of Jowar (Maldandi).
3.9 The Government imposed import duty of 50 per cent on Jowar vide DGFT notification dated 5.4.2000. Quantitative ceiling on export of Jowar was removed vide DGFT notification dated 5.3.2002. Export of Jowar continues to be free. Thus, the pro-producer policy continues with respect to jowar too. This needs to change to a neutral stance wrt producers and consumers for all agri-commodities.
3500
6500
9500
12500
15500
18500
21500
24500
2002
-03
Q3
2003
-04
Q1
2003
-04
Q3
2004
-05
Q1
2004
-05
Q3
2005
-06
Q1
2005
-06
Q3
2006
-07
Q1
2006
-07
Q3
2007
-08
Q1
2007
-08
Q3
2008
-09
Q1
2008
-09
Q3
2009
-10
Q1
2009
-10
Q3
2010
-11
Q1
2010
-11
Q3
2011
-12
Q1
2011
-12
Q3
2012
-13
Q1
Rs/T
onne
International Maharashtra Karnatka MSP
Chart 3.6: International vs Domestic prices of Jowar
Source: World Bank pink Sheet for international Price for Sorghum (US), No. 2 milo yellow, f.o.b. Gulf, Agmarknet for Domestic price of Jowar yellow variety in Maharashtra and Karnataka and CACP for MSP of Jowar (Maldandi).
3.9 The Government imposed import duty of 50 per cent on Jowar vide DGFT notification dated 5.4.2000. Quantitative ceiling on export of Jowar was removed vide DGFT notification dated 5.3.2002. Export of Jowar continues to be free. Thus, the pro-producer policy continues with respect to jowar too. This needs to change to a neutral stance with respect to producers and consumers for all agri-commodities.

32
forPolicy
Kharif CropsPrice
PULSES
3.10 India is the biggest producer as well as biggest importer of pulses in the world. India’s imports of pulses have increased from 2.2 million tonnes in 2001-02 to 3.3 million tonnes in 2011-12. India’s exports of pulses have fluctuated during the 2000s decade as shown in chart 3.7 as exports of pulses are banned (with some exceptions).
43
PULSES 3.10 India is the biggest producer as well as biggest importer of pulses in the world.
India’s imports of pulses have increased from 2.2 million tonnes in 2001-02 to 3.3 million tonnes in 2011-12. India’s exports of pulses have fluctuated during the 2000s decade as shown in chart 3.7 as exports of pulses are banned (with some exceptions).
Chart 3.7: India’s Exports and Imports of Pulses (Volume)
Source: DGCI & S
3.11 During the period from 2001-02 (Q1) to 2012-13 (Q1), the domestic wholesale
prices of arhar (pigeon peas) and urad (black gram) have followed the trend line of international prices (Chart 3.8 & 3.9). During the same period, the domestic wholesale prices of moong (green gram) have been generally lower than the international prices and especially since 2007-08 (Q3) (Chart 3.10).
Source: NAFED
-3.5
-3.0
-2.5
-2.0
-1.5
-1.0
-0.5
0.0
0.5
1.0
2001
-02
2002
-03
2003
-04
2004
-05
2005
-06
2006
-07
2007
-08
2008
-09
2009
-10
2010
-11
2011
-12
Mill
ion
Tonn
es
Import Export
5000
15000
25000
35000
45000
55000
65000
2001
-02
Q1
2001
-02
Q4
2002
-03
Q3
2003
-04
Q2
2004
-05
Q1
2004
-05
Q4
2005
-06
Q3
2006
-07
Q2
2007
-08
Q1
2007
-08
Q4
2008
-09
Q3
2009
-10
Q2
2010
-11
Q1
2010
-11
Q4
2011
-12
Q3
Rs/T
onne
International Domestic
5000
15000
25000
35000
45000
55000
65000
2001
-02
Q1
2001
-02
Q4
2002
-03
Q3
2003
-04
Q2
2004
-05
Q1
2004
-05
Q4
2005
-06
Q3
2006
-07
Q2
2007
-08
Q1
2007
-08
Q4
2008
-09
Q3
2009
-10
Q2
2010
-11
Q1
2010
-11
Q4
2011
-12
Q3
Rs/T
onne
International Domestic
International and domestic prices of pulses are aligned with free imports allowed but exports of pulses are banned
Chart 3.7: India’s Exports and Imports of Pulses (Volume)
Source: DGCI & S
International and domestic prices of pulses are aligned with free imports allowed but exports of pulses are banned
3.11 During the period from 2001-02 (Q1) to 2012-13 (Q1), the domestic wholesale prices of arhar (pigeon peas) and urad (black gram) have followed the trend line of international prices (Chart 3.8 & 3.9). During the same period, the domestic wholesale prices of moong (green gram) have been generally lower than the international prices and especially since 2007-08 (Q3) (Chart 3.10).
43
PULSES 3.10 India is the biggest producer as well as biggest importer of pulses in the world.
India’s imports of pulses have increased from 2.2 million tonnes in 2001-02 to 3.3 million tonnes in 2011-12. India’s exports of pulses have fluctuated during the 2000s decade as shown in chart 3.7 as exports of pulses are banned (with some exceptions).
Chart 3.7: India’s Exports and Imports of Pulses (Volume)
Source: DGCI & S
3.11 During the period from 2001-02 (Q1) to 2012-13 (Q1), the domestic wholesale
prices of arhar (pigeon peas) and urad (black gram) have followed the trend line of international prices (Chart 3.8 & 3.9). During the same period, the domestic wholesale prices of moong (green gram) have been generally lower than the international prices and especially since 2007-08 (Q3) (Chart 3.10).
Source: NAFED
-3.5
-3.0
-2.5
-2.0
-1.5
-1.0
-0.5
0.0
0.5
1.0
2001
-02
2002
-03
2003
-04
2004
-05
2005
-06
2006
-07
2007
-08
2008
-09
2009
-10
2010
-11
2011
-12
Mill
ion
Tonn
es
Import Export
5000
15000
25000
35000
45000
55000
65000
2001
-02
Q1
2001
-02
Q4
2002
-03
Q3
2003
-04
Q2
2004
-05
Q1
2004
-05
Q4
2005
-06
Q3
2006
-07
Q2
2007
-08
Q1
2007
-08
Q4
2008
-09
Q3
2009
-10
Q2
2010
-11
Q1
2010
-11
Q4
2011
-12
Q3
Rs/T
onne
International Domestic
5000
15000
25000
35000
45000
55000
65000
2001
-02
Q1
2001
-02
Q4
2002
-03
Q3
2003
-04
Q2
2004
-05
Q1
2004
-05
Q4
2005
-06
Q3
2006
-07
Q2
2007
-08
Q1
2007
-08
Q4
2008
-09
Q3
2009
-10
Q2
2010
-11
Q1
2010
-11
Q4
2011
-12
Q3
Rs/T
onne
International Domestic
International and domestic prices of pulses are aligned with free imports allowed but exports of pulses are banned
Chart 3.8: International vs Domestic prices of Arhar
Chart 3.9: International vs Domestic prices of Urad

33
forPolicy
Kharif CropsPrice
3.12 Imports are permitted under OGL at zero duty since 8th June, 2006 – this is to ensure the availability of pulses at reasonable prices. Pulses exports from India, however, are prohibited since 27th June, 2006 except for kabuli chana (since 7.3.2007) and 10,000 tonnes of organic pulses (since 23.03.2011) & lentils (since 03.06.2011) per annum. This restrictive export policy along with free imports of pulses at zero import duty clearly shows a pro-consumer bias. This needs to change and exports need to be fully opened also to have a neutral trade policy for producers as well as consumers.
OILSEEDS/EDIBLE OILS
3.13 India is the largest importer of edible oils which constitute more than half of its total agri-imports. A record 10 million tonnes of edible oil were imported in 2011-12 (Nov-Oct). Till mid 1990s, imports of edible oils were tightly controlled through canalization. In 1994–95, India introduced a phased liberalization of edible oil imports and import duties have been reduced to the levels of zero percent and 7.5 percent for crude oils and refined oils respectively with effect from 1st April, 2008. However, the import duty on crude edible oils has been increased to 2.5 per cent vide D/o Revenue Notification dated 23.1.2013. The effective rates of duty were even lower as the tariff value, the base price on which custom duty is determined, remained fixed since 31st July 2006. Only recently, the tariff value on imported RBD palmolein (since 1st August, 2012) and on other oils (on 15th February, 2013) have been revised by 4-5 percent in light of their current international prices. On the other hand, imports of oilseeds continue to be restricted with 30 percent import duty since 1.1.2003. Logically, the import duty is graduated from low on raw material to highest on refined product. The duty structure of 2.5 percent duty on crude edible oils and 7.5 percent duty on refined edible oils and high duty of 30 percent on import
44
Chart 3.10: International vs Domestic prices of Moong
Source: NAFED
3.12 Imports are permitted under OGL at zero duty since 8th June, 2006 – this is to ensure the availability of pulses at reasonable prices. Pulses exports from India, however, are prohibited since 27th June, 2006 except for kabuli chana (since 7.3.2007) and 10,000 tonnes of organic pulses (since 23.03.2011) & lentils (since 03.06.2011) per annum. This restrictive export policy along with free imports of pulses at zero import duty clearly shows a pro-consumer bias. This needs to change and exports need to be fully opened also to have a neutral trade policy for producers as well as consumers.
OILSEEDS/EDIBLE OILS- Soyabean
India is the largest importer of edible oils which constitute more than half of its total agri-imports- it imported around 10 million tonnes in 2011-12 (Nov-Oct). Till mid 1990s, imports of edible oils were tightly controlled through canalization. In 1994–95, India introduced a phased liberalization of edible oil imports and import duties have been reduced to the levels of zero percent and 7.5 percent for crude oils and refined oils respectively with effect from 1st April, 2008. However, the import duty on crude edible oils has been increased to 2.5 per cent vide D/o Revenue Notification dated 23.1.2013. The effective rates of duty are even lower as the tariff value, the base price on which custom duty is determined, has remained fixed since 31st July 2006. Only recently, the tariff value on imported RBD palmolein (since 1st August, 2012) and on other oils (on 15th February, 2013) have been revised in light of their current international prices. On the other hand, imports of oilseeds continue to be restricted with 30 percent import duty since 1.1.2003. Logically, the import duty is graduated from low on raw material to highest on refined product. The duty structure of 2.5 percent duty on crude edible oils and 7.5 percent duty on refined edible oils and high duty of 30 percent on
10000
20000
30000
40000
50000
60000
70000
80000
2001
-02
Q1
2001
-02
Q3
2002
-03
Q1
2002
-03
Q3
2003
-04
Q1
2003
-04
Q3
2004
-05
Q1
2004
-05
Q3
2005
-06
Q1
2005
-06
Q3
2006
-07
Q1
2006
-07
Q3
2007
-08
Q1
2007
-08
Q3
2008
-09
Q1
2008
-09
Q3
2009
-10
Q1
2009
-10
Q3
2010
-11
Q1
2010
-11
Q3
2011
-12
Q1
2011
-12
Q3
2012
-13
Q1
Rs/T
onne
International Domestic
Chart 3.10: International vs Domestic prices of Moong
Source: NAFED
34
forPolicy
Kharif CropsPrice
of oilseeds defies economic sense. The import duty on oilseeds need to be reduced to 10 per cent, on crude oil 12.5 percent and on refined oil 15 percent, so that domestic edible oil industrials units, which have large surplus capacity, are able to import oilseeds at lower prices and are able to compete with the cheaper import of crude as well as refined edible oil in the domestic market.
3.14 Export of edible oils has been banned with effect from 17th March 2008, except (a) Castor Oil, (b) Coconut oil from all EDI Ports and through Land Customs Stations (LCS), (c) deemed export of edible oils (as input raw material) from DTA to 100 per cent EOUs for production of non-edible goods to be exported, (d) Edible oils from DTA to Special Economic Zones (SEZs) to be consumed by SEZ Units for manufacture of processed food products, subject to applicable value addition norms, and (e) Edible oils produced out of minor forest produce. Export of edible oils in branded consumer packs of upto 5 kgs subject to a limit of 10,000 tons per year (increased to 20000 tons per year19) is allowed. This has been further relaxed with export of edible oils allowed in branded consumer packs of up to 5 kgs with a MEP of US$ 1500 per tonne20. This has a pro-consumer bias, which needs to be changed and edible oil exports need to be fully opened for exports to have a neutral trade policy for consumers and producers/processors. It may be noted, however, that oilmeals are a major agri-export of India, and its export policy is open and liberal (though there is an import duty of 15% on imports of oilmeals).
Soyabean
3.15 International prices and domestic prices of soyabean have been in sync during the last ten years (Chart 3.11). Domestic prices of soyabean oil have remained higher than the international prices though the gap has been reducing over the years with the gradual reduction of import duties. India’s imports of soyabean oil have declined from 1.1 million tonnes in 2001-02 to 0.9 million tonnes in 2011-12.
19 Vide Notification dated 19.12 201220 vide Notification dated 5.2.2013
Imports of edible oils are free while exports are banned except certain exemptions

35
forPolicy
Kharif CropsPrice
3.16 India’s exports of soyabean meal have more than doubled from 2.4 million tonnes in 2001-02 to 5.3 million tonnes in 2011-12 (Chart 3.12). During the period from 2001-02 (Q1) to 2012-13 (Q1), the domestic wholesale prices of soyabean meal have been higher than international prices of soyabean meal but follow the trend line of international prices (Chart 3.13). India’s exports of soyabean meal are mainly to Asian countries which are nearer to India than the main competitors, Argentina and Brazil. So, the difference in freight charges makes it possible for India to export soyabean meal to these countries.
5000
10000
15000
20000
25000
30000
35000
40000
2001
-02
Q1
2001
-02
Q4
2002
-03
Q3
2003
-04
Q2
2004
-05
Q1
2004
-05
Q4
2005
-06
Q3
2006
-07
Q2
2007
-08
Q1
2007
-08
Q4
2008
-09
Q3
2009
-10
Q2
2010
-11
Q1
2010
-11
Q4
2011
-12
Q3
Rs/T
onne
International Domestic
10000
20000
30000
40000
50000
60000
70000
80000
2003
-04
Q2
2004
-05
Q1
2004
-05
Q4
2005
-06
Q3
2006
-07
Q2
2007
-08
Q1
2007
-08
Q4
2008
-09
Q3
2009
-10
Q2
2010
-11
Q1
2010
-11
Q4
2011
-12
Q3
Rs/T
onne
International Domestic
0.0
0.5
1.0
1.5
2.0
2.5
0.0
1.0
2.0
3.0
4.0
5.0
6.0
2001
-02
2002
-03
2003
-04
2004
-05
2005
-06
2006
-07
2007
-08
2008
-09
2009
-10
2010
-11
2011
-12
US$
Bill
ion
Mill
ion
Tonn
es
Volume Value
5000
10000
15000
20000
25000
30000
35000
40000
2001
-02
Q1
2001
-02
Q4
2002
-03
Q3
2003
-04
Q2
2004
-05
Q1
2004
-05
Q4
2005
-06
Q3
2006
-07
Q2
2007
-08
Q1
2007
-08
Q4
2008
-09
Q3
2009
-10
Q2
2010
-11
Q1
2010
-11
Q4
2011
-12
Q3
Rs/T
onne
International Domestic
Source: ISTA Mielke GmbH, Oil World; USDA; World Bank for International Price of Soyabean Argentina f.o.b; NAFED replies & Agmarknet for domestic price (Avg. Price of M.P.); Solvent Extractors Association of India (SEAI) for domestic price quoted at Mumbai
5000
10000
15000
20000
25000
30000
35000
4000020
01-0
2 Q
120
01-0
2 Q
420
02-0
3 Q
320
03-0
4 Q
220
04-0
5 Q
120
04-0
5 Q
420
05-0
6 Q
320
06-0
7 Q
220
07-0
8 Q
120
07-0
8 Q
420
08-0
9 Q
320
09-1
0 Q
220
10-1
1 Q
120
10-1
1 Q
420
11-1
2 Q
3
Rs/T
onne
International Domestic
10000
20000
30000
40000
50000
60000
70000
80000
2003
-04
Q2
2004
-05
Q1
2004
-05
Q4
2005
-06
Q3
2006
-07
Q2
2007
-08
Q1
2007
-08
Q4
2008
-09
Q3
2009
-10
Q2
2010
-11
Q1
2010
-11
Q4
2011
-12
Q3
Rs/T
onne
International Domestic
0.0
0.5
1.0
1.5
2.0
2.5
0.0
1.0
2.0
3.0
4.0
5.0
6.0
2001
-02
2002
-03
2003
-04
2004
-05
2005
-06
2006
-07
2007
-08
2008
-09
2009
-10
2010
-11
2011
-12
US$
Bill
ion
Mill
ion
Tonn
es
Volume Value
5000
10000
15000
20000
25000
30000
35000
40000
2001
-02
Q1
2001
-02
Q4
2002
-03
Q3
2003
-04
Q2
2004
-05
Q1
2004
-05
Q4
2005
-06
Q3
2006
-07
Q2
2007
-08
Q1
2007
-08
Q4
2008
-09
Q3
2009
-10
Q2
2010
-11
Q1
2010
-11
Q4
2011
-12
Q3
Rs/T
onne
International Domestic
Chart 3.11: International vs domestic prices Soyabean Soyabean Oil
India’s exports of soyabean meal have more than doubled from 2.4 million tonnes in 2001-02 to 5.3 million tonnes in 2011-12
Source: USDA; for international price of Argentina Pellets, f.o.b. Up River; Reuters; SEAI for domestic price quoted at Mumbai
Chart 3.12: India’s exports of soyabean meal from 2001-02 to 2011-12
Chart 3.13: Domestic wholesale prices vs international prices of soyabean meal
Source: DGCI & S

36
forPolicy
Kharif CropsPrice
Groundnuts (Peanuts)
3.17 India’s exports of groundnuts have increased from 0.1 million tonnes in 2001-02 to 0.8 million tonnes in 2011-12. The domestic prices of groundnut have been much lower than the international prices (Chart 3.14). The domestic and international prices of groundnut oil have moved in sync with each other during last five years.
Sunflower
3.18 During the period from 2001-02 (Q1) to 2012-13 (Q1), the domestic wholesale prices have followed the trend line of international prices of sunflower seed (Chart 3.15). The gap between the domestic wholesale prices of sunflower oil and the international prices of sunflower oil has narrowed down after 2007-08 when free imports were allowed.
Chart 3.14: International vs Domestic Prices
Groundnut Groundnut Oil
Source: World Bank, DES Note: International prices of groundnuts (US), Runners 40/50, shelled basis, c.i.f. Rotterdam, and Groundnut oil, c.i.f. Rotterdam. Domestic prices have been calculated by averaging monthly data at Rajkot in Gujarat
Chart 3.15: International Vs Domestic Prices Sunflower Seed Sunflower Oil
Source: USDA; for international price for Sunflower seed US Farm Price; USDA and EU f.o.b. NW Euro Ports; Oil World (Sunflower oil); NAFED replies and Agmarknet for domestic price of soyabean (Average Price of Maharashtra) & SEAI for domestic price of soyabean oil quoted at Mumbai
10000
60000
110000
160000
2006
Q1
2006
Q3
2007
Q1
2007
Q3
2008
Q1
2008
Q3
2009
Q1
2009
Q3
2010
Q1
2010
Q3
2011
Q1
2011
Q3
2012
Q1
2012
Q3
Rs/T
onne
International (Shelled) Domestic (With Shell)Domestic (Shelled)
20000
40000
60000
80000
100000
120000
140000
160000
2006
Q1
2006
Q3
2007
Q1
2007
Q3
2008
Q1
2008
Q3
2009
Q1
2009
Q3
2010
Q1
2010
Q3
2011
Q1
2011
Q3
2012
Q1
2012
Q3
Rs/T
onne
International Domestic
10000
15000
20000
25000
30000
35000
40000
2001
-02
Q1
2002
-03
Q1
2003
-04
Q1
2004
-05
Q1
2005
-06
Q1
2006
-07
Q1
2007
-08
Q1
2008
-09
Q1
2009
-10
Q1
2010
-11
Q1
2011
-12
Q1
2012
-13
Q1
Rs/T
onne
International Domestic
2000030000400005000060000700008000090000
2003
-04
Q2
2004
-05
Q1
2004
-05
Q4
2005
-06
Q3
2006
-07
Q2
2007
-08
Q1
2007
-08
Q4
2008
-09
Q3
2009
-10
Q2
2010
-11
Q1
2010
-11
Q4
2011
-12
Q3
Rs/T
onne
International Domestic

37
forPolicy
Kharif CropsPrice
FIBRES - COTTON
3.19 Imports of raw cotton accounted for 10.1 percent of total agri-imports in TE 2001-02 but now it is the second biggest agri-export accounting for 11.4 percent of total India’s agri-exports in TE 2011-12. India has emerged as the world’s second largest exporter of cotton. The transformation of cotton has been most spectacular with manifold increase in production, exports and declining imports- all being driven by the new Bt technology in cotton and newly found export markets in China. India’s cotton exports have increased from only 0.03 million bales in 2001-02 to 11.5 million bales in 2011-12 (Chart 3.16). During the period from 2001-02 (Q1) to 2012-13 (Q1), the domestic wholesale prices of cotton have been lower than international prices (Chart 3.17).
Cotton has transformed itself from being a large agri-import to second largest agri-export in a span of 10 years
Chart 3.16: India’s Exports of Cotton Chart 3.17: International vs Domestic prices of cotton (Lint)
Source: DGCI & S ; World Bank for International prices -Cotton (Cotton Outlook “Cotlook A index”), middling 1-3/32 inch, c.i.f. and Cotton Corporation of India for domestic price of Cotton (Lint) Mumbai
0
1
2
3
4
5
0
2
4
6
8
10
12
14
2001
-02
2002
-03
2003
-04
2004
-05
2005
-06
2006
-07
2007
-08
2008
-09
2009
-10
2010
-11
2011
-12
US$
Bill
ion
Mill
ion
Tonn
es
Volume Value
20000
60000
100000
140000
180000
220000
2001
-02
Q1
2001
-02
Q4
2002
-03
Q3
2003
-04
Q2
2004
-05
Q1
2004
-05
Q4
2005
-06
Q3
2006
-07
Q2
2007
-08
Q1
2007
-08
Q4
2008
-09
Q3
2009
-10
Q2
2010
-11
Q1
2010
-11
Q4
2011
-12
Q3
2012
-13
Q2
Rs/T
onne
International Domestic (S-6)
3.20 Cotton exports from India during the nineties (and even in 1980s) were placed under quota restrictions. The government liberalized raw cotton exports since July 2, 2001 and placed the same under OGL. Since then, India has emerged as the world’s second largest exporter of cotton. But recently, cotton exports were banned in mid-2010 and then export caps were placed for 2010-11. The quantitative restrictions on cotton exports were lifted in August, 2011 and exports of cotton were made free subject to registration of contracts with DGFT. India exported a record 12.9 million bales (of 170 kg each) in 2011-12 cotton season. On 5th March, 2012, cotton exports were suddenly banned with immediate effect. The ban was soon lifted but it was a reminder of the ‘flip-flop’ policy followed for agri-exports. These frequent policy changes not only cripple export performance of the country and lead to erosion of confidence of the International market for India as a regular supplier but also the farmers

38
forPolicy
Kharif CropsPrice
from realizing a remunerative value for their produce, and thereby slow down investments and growth in agriculture.
3.21 Cotton has been imported under the OGL since April 1994. Till July 8, 2008, a custom duty of 10 percent and 4 percent special countervailing duty were levied on cotton imports. However, from July 8, 2008, duty on cotton imports was abolished, thus enabling the domestic textile mills to import cotton as per their requirements. So the cotton trade policy, to be neutral to farmers and textile mills (consumers) should be open ended and stable on exports as well as imports. If any need arises to protect consumers (textile mills) from spikes in global prices or farmers from troughs in global prices, it is suggested that a moderate duty should be imposed on exports/imports, whenever domestic prices cross the trigger points; abrupt bans only serve to distort markets.
Recommendations
3.22 A long-term consistent, stable and predictable agri-trade policy with only moderate duties of 5-10 percent is the need of the hour to tap the full potential of agriculture sector. And it has to be as much focused on exports as on imports, giving a trade neutral level to producers as well as consumers. Exports of pulses and edible oils need to be opened up as well as import duties on rice, maize and other cereals need to be reduced, while those on edible oilseeds and edible oils need to be in line with economic rationality. This would promote resource use efficiency, generate surpluses and promote agri-growth. The guiding principle should be the alignment of the domestic and international prices along long-term trends while also guarding against sharp spikes and troughs through special safeguards. For such a policy to be operational, trigger points need to be identified for major crops. The Commission recommends setting up a working group with a view to operationalize such a policy.
A consistent, open, neutral and stable agri-trade policy is need of the hour

39
Chapter 4Costs, Returns, Inter-crop Price Parity and
Terms of Trade
4.1 At the outset, it is imperative to state that the cost of cultivation/production is a critical input, but not the sole one, for the Commission while arriving at its recommendations for the MSPs of its mandated crops. The Commission considers other equally important factors such as: demand supply balance, inter-crop price parity, trends in market prices – both domestic and international, terms of trade between agriculture and non-agriculture, effect on cost of living and industrial cost structure etc., in its price policy recommendations.
4.2 For preparing the price policy report of Kharif crops for 2013-14 season, the actual estimates of cost of production (CoP), generated under Comprehensive Scheme (CS) being implemented by DES, are available for the year 2010-11. As per established practice, the Commission prepares an Input Price Index based on the latest prices of different inputs like human labour, bullock labour, machine labour, manures, fertilizers, pesticides, irrigation charges, and seeds, based on latest data from different sources like Labour Bureau, replies from state governments, Office of the Economic Adviser (OEA), Ministry of Commerce and Industry; Fertilizers Association of India (FAI); National Seeds Corporation (NSC), etc. Based on this Input Price Index, the Commission, then makes projections for CoP likely to prevail in 2013-14 season.
4.3 Despite best methodology and assumptions, projections could turn out to be different than the reality, which will be known only after three years. Since 2012,
Actual estimates of cost of production generated under CS are available for the year 2010-11
forPolicy
Kharif CropsPrice

40
forPolicy
Kharif CropsPrice
Commission also introduced a correction factor (CF) based on the difference between actual and projected costs for three years, for which latest information is available. Continuing with a similar practice, in pursuit of improvising projections, the Commission looks into the changes in the CF and adjusts its projected costs accordingly. These projected cost estimates are then presented for various crops and for various states. But before giving its projections, the Commission first examines the actual costs and profitability of various crops, for which latest information is made available by DES. This is presented below.
Profitability of Kharif crops during 2008-09 to 2010-11
4.4 An analysis of the profitability and the rates of return over costs A2+FL and C2, for various crops during 2008-09 to 2010-11 – the latest years for which actual cost data is available is presented in Table 4.1.
Table 4.1: All India Gross and Net Returns on actual estimates of cost of Cultivation of Kharif Crops for the years from 2008-09 to 2010-11
CROPCost
A2+FL (Rs./ha.)
Cost C2 (Rs./
ha.)
GVO (Rs./ha.)
Gross Returns
over A2+FL
(Rs./ha)
Rate of Gross
Returns over
A2+FL (%)
Net Returns over C2 (Rs./ha)
Net Rate of Returns over C2
(%) (D-B) (E/B)*100 (D-C) (G/C)*100A B C D E F G H
CEREALS:
Paddy 22985.52 33696.94 38741.11 15755.58 68.55 5044.17 14.97
Maize 16815.64 23606.60 27051.21 10235.57 60.87 3444.60 14.59
Jowar 13363.71 18800.44 19162.52 5798.81 43.39 362.08 1.93
Bajra 10678.09 15048.51 16360.33 5682.24 53.21 1311.82 8.72
Ragi 14852.66 26745.93 21404.52 6551.86 44.11 -5341.40 -19.97
PULSES:
Tur 16875.79 26287.73 34193.94 17318.15 102.62 7906.21 30.08
Moong 8953.40 12840.87 15631.52 6678.12 74.59 2790.65 21.73
Urad 10346.25 15621.03 19412.34 9066.09 87.63 3791.31 24.27
OILSEEDS:
Groundnut 23675.27 32661.39 35061.52 11386.24 48.09 2400.12 7.35
Soyabean 14707.59 21480.54 25500.38 10792.80 73.38 4019.85 18.71
Sunflower 11822.50 14905.83 14086.64 2264.15 19.15 -819.18 -5.50
Sesamum 9616.52 14493.19 19310.30 9693.77 100.80 4817.11 33.24
Nigerseed 6124.67 9231.42 10249.14 4124.47 67.34 1017.72 11.02
Cotton 28351.83 42143.35 57454.83 29103.00 102.65 15311.48 36.33
Source: CS under implementation by DESNote: 1. Comprehensive Scheme (CS): Actual estimates for the years 2008-09, 2009-10 and 2010-11
by states have been averaged at all-India level, with weights being their relative shares in total area of states.
2. A2+FL cost includes all expenses in cash and kind on account of hired human labour, bullock labour, machine labour, seed, insecticides & pesticides, manure, fertilizers, irrigation charges and miscellaneous expenses including family labour.
3. C2 cost includes A2+FL cost, rental value of owned land, interest on fixed capital etc.

41
forPolicy
Kharif CropsPrice
4.5 As is apparent from table 4.1, at all India level gross returns, i.e., absolute profit over A2+FL is maximum for cotton at Rs. 29103/ha followed by tur at Rs 17318.15/ha and the lowest for sunflower at Rs. 2264.15/ha. It may also be observed that rate of gross return, i.e., profitability over A2+FL is again highest for cotton at 102.65 percent. It is also equally interesting to observe that net return, i.e., profits over C2 cost is also highest for cotton at Rs. 15311.48/ha., and so is its rate of return over C2 (36.33%), while at the other extreme are ragi and sunflower with negative returns at -19.9 percent and -5.5 percent respectively. The details of state-wise returns for kharif crops during 2008-09 to 2010-11 are given in Annex table 4.1.
Labour and Input Price Movement
4.6 As the cost on account of human labour is substantial in the total CoP, it is essential that an analysis is made of the likely increase in wage rate of agricultural labour. The latest data available from Labour Bureau, Shimla on agricultural wage rate is for the month of December, 2012. The increase in wage rate in percentage terms during December, 2012 compared to the corresponding month of previous year for different states is in the range of 0.8 percent to 45 percent. The highest wage rate increase is reported for Punjab at 44.5 percent and lowest wage rate increase for Odisha at 0.8 percent. In absolute terms, the highest wage rate for December, 2012 is reported from Kerala at Rs 461.3 per man day and it is worth noting here that almost all the reporting states have wage rates at least around Rs. 120 per man day (Annex. table 4.2). Preliminary observations of agricultural labour wage rate as given by Labour Bureau, Shimla are that it has gone up by 20 percent per annum over the last three years, i.e., during Jan-Dec 2009 to Jan-Dec 2012. The state-wise and All India details of increase in wage rate over the last three years are shown in Chart 4.1.
Rate of gross return and net return is highest for cotton
Chart 4.1: Average Annual growth rate of agriculture labour wage rate (Rs/day) by states
and at All-India level in Nominal terms (Jan-Dec 2009 to Jan–Dec 2012)
Source: Labour Bureau, Shimla
10
13
16
19
22
25
A. P
.
Ass
am
Biha
r
Guj
arat
Har
yana
H. P
.
Kar
nata
ka
Kera
la
M. P
.
Mah
aras
htra
Odi
sha
Punj
ab
Raj
asth
an
T. N
.
U. P
.
W. B
.
(%)
Growth in wage rate by states Growth in wage rate at All - India level
Chart 4.1: Average Annual growth rate of agriculture labour wage rate (Rs/day) by states and at All-India level in Nominal terms
(Jan-Dec 2009 to Jan–Dec 2012)
Agricultural labour wage rate has gone up by 20 percent per annum over the last three years

42
forPolicy
Kharif CropsPrice
4.7 Wholesale Price Index (WPI) with base 2004-05 =100 for major farm inputs during the period December, 2011 to December, 2012 has shown an upward trend, except non-electrical machinery (with decrease of 2.1 percent). Fertilizers recorded increase of 8.8 percent, electricity for irrigation purposes by 22.6 percent, pesticides by 5.9 percent, tractor by 4.2 percent, lubricants by 2.0 percent, high speed diesel oil (HSDO) by 14.6 percent, light speed diesel oil (LDO) by 9.9 percent, fodder by 19.8 percent, cattle feed by 18.9 percent (details available in annex table 4.3).
Chart 4.2: WPI and Percentage Increase in Prices of Farm Inputs(Dec 2012 over Dec 2011)
Fertilisers Electricity (Irrigation) Pesticides
Non-electricity (Mach)
Tractors Lubricants HSDO LSDO Fodder CattleFeed
Prices of Dec,2011 138.7 135.7 115.3 125.8 137.8 236.6 167.8 253.0 198.9 186.2
Prices of Dec,2012 150.9 166.3 122.1 123.2 143.6 241.4 192.3 278.1 238.2 221.3
Inflation rate 8.80 22.55 5.90 -2.07 4.21 2.03 14.60 9.92 19.76 18.85
-2
1
4
7
10
13
16
19
22
110130150170190210230250270290
Perc
enta
ge
Pric
e in
dice
s
Source: OEA, DIPP
4.8 It is worth noting here that fertilizer subsidy has increased by more than 5 times during the last 10 years. With the launch of the Nutrient Based Subsidy (NBS) scheme since 1st April, 2010, the retail prices for P&K fertilizers have been freed while the price of urea is statutorily fixed by the Government. As the price of urea has remained more or less fixed since then, the differential between the prices of urea and P&K fertilizers has widened (Chart 4.3). This has led to excess use of N at the expense of P&K fertilizers defeating the very objective of NBS to promote balanced use of nutrients. The Commission has calculated that an amount of Rs 19,783 crore could be saved by allowing direct cash transfer to farmers to purchase fertilizers in lieu of fertilizer subsidy and freeing up the fertilizer prices. This would give the right signals for a balanced use of NPK fertilizers, enhance productivity of agriculture, prevent leakages of subsidized fertilizers and incentivize the industry to become cost-efficient.
Rs 19,783 crore could be saved by allowing direct cash transfer to farmers to purchase fertilizers in lieu of fertilizer subsidy

43
forPolicy
Kharif CropsPrice
Cost projections for 2013-14 Crop Season
4.9 The latest data on actual estimates of cost of production for 14 major kharif crops of paddy, cotton, jowar, bajra, maize, ragi, tur, moong, urad, groundnut, soyabean, sunflower, sesasum, nigerseed have been made available to the Commission under the CS for the year 2010-11. The projections are made as per the methodology indicated in the earlier paragraphs. The details of actual cost estimates for 2010-11 compared to those of the previous year are available on the website of the Commission.
4.10 The projected cost for each crop varies widely across states. These costs by states are averaged to arrive at all India weighted cost of production with weights being relative shares of the states in the total production (which is the average of latest three years production data available). Table 4.2 gives the projected cost (A2+FL & C2) of kharif crops at all India level. Annex tables 4.4 outlines the projections for 2013-14 marketing season state-wise and at all India for different kharif crops.
Chart 4.3: Relative Prices of Urea, DAP & MOP
DAP
MOP
Urea
4500
8500
12500
16500
20500
24500
2010-11 2011-12 2012-13
Rs/T
onne
Widening Gap between N & PK fertilizers
Source: State Replies
Note: All India average has been calculated using state-wise consumption of various fertilizers as weights

44
forPolicy
Kharif CropsPrice
Table 4.2: All India Projected Cost of Production (A2+FL & C2) of Kharif Cropsfor 2013-14 Marketing Season
CropsCost of Production (Rs./qtl.)
A2+FL C2
Paddy 961.46 1234.06
Jowar 1269.18 1648.41
Bajra 767.58 1002.84
Maize 859.55 1112.37
Ragi 1338.20 1687.05
Tur 3089.87 3957.67
Moong 3775.10 4758.69
Urad 3143.93 4111.87
Groundnut 2720.25 3397.49
Soyabean 1691.87 2215.60
Sunflower 3000.10 3679.36
Seasmum 2919.31 4133.89
Nigerseed 2279.05 3628.41
Cotton 2484.66 3532.66
4.11 Chart 4.4 (a)to(m) represents the overall cost of production (C2) by states as well as all India level in increasing order of cost with their corresponding relative shares in total production for different kharif crops. These crop-wise charts illustrate the percentage of cost of major producing states that is covered by all India weighted cost of production in terms of relative share of production of those states for different kharif crops. As is apparent from chart 4.4(a) all India Cost of production (C2) for paddy is Rs. 1234.06 per quintal which is covering cost of 60 percent of production of major producing states.

45
forPolicy
Kharif CropsPrice
56
Chart 4.4: Projected Cost and Supply of Kharif Crops by States for 2013-14 (a) Paddy
(b) Jowar
(c) Bajra
0
500
1000
1500
2000
2500
3000
1 5 9 13 17 21 25 29 33 37 41 45 49 53 57 61 65 69 73 77 81 85 89 93 97Cos
t of P
rodu
ctio
n (R
s. p
er q
uint
al)
Production Shares (%)
H.P UKD A.P. GUJ U.P. Punjab M.P. Assam CHTGOrissa KTK T.N. W.B. Bihar Kerala HR JKD MAH
All India A2+Fl Rs.961.46/qtl.
All India C2 Rs.1234.06/qtl.
1000
1300
1600
1900
2200
1 6 11 16 21 26 31 36 41 46 51 56 61 66 71 76 81 86 91 96
Cos
t of P
rodu
ctio
n (R
s.pe
r qui
ntal
)
Productions Shares (%)
RAJ M.P. MAH T.N A.P KTK
All India C2 Rs.1648.41/qtl.
All India A2+FL Rs.1269.18/qtl.
600
900
1200
1500
1800
1 5 9 13 17 21 25 29 33 37 41 45 49 53 57 61 65 69 73 77 81 85 89 93 97
Cos
t of P
rodu
ctio
n (R
s. p
er q
uint
al)
Production Shares (%)
RAJ GUJ U.P. HR MAH KTK
All India C2 Rs.1002.84/qtl.
All India A2+FL Rs. 767.58/qtl.

46
forPolicy
Kharif CropsPrice
57
(d) Maize
(e) Ragi
(f) Tur
500
700
900
1100
1300
1500
1700
1 5 9 13 17 21 25 29 33 37 41 45 49 53 57 61 65 69 73 77 81 85 89 93 97
Cos
t of P
rodu
ctio
n (R
s.pe
r qui
tnta
l)
Production shares (%)
BIHAR GUJ A.P. M.P KTK T.N. RAJ H.P. U.P. CHTG
All India A2+FL Rs 859.55/qtl
All India C2 Rs 1112.37/qtl
1000
1200
1400
1600
1800
1 6 11 16 21 26 31 36 41 46 51 56 61 66 71 76 81 86 91 96
Cos
t of P
rodu
ctio
n (R
s. p
er q
uint
al
Production Shares (%)
MAH T.N KTK
All India C2 Rs.1687.05/qtl.
All India A2+FL Rs.1338.20/qtl.
10001500200025003000350040004500500055006000
1 4 7 10 13 16 19 22 25 28 31 34 37 40 43 46 49 52 55 58 61 64 67 70 73 76 79 82 85 88 91 94 97100
Cos
t of P
rodu
ctio
n (R
s.Pe
r Qui
ntal
)
Production Shares (%)
Bihar Orissa M.P. GUJ U.P. KTK MAH A.P. T.N.
All India C2 Rs.3957.67/qtl
All India A2+Fl Rs.3089.87/qtl.

47
forPolicy
Kharif CropsPrice
58
(g) Moong
(h) Urad
(i) Groundnut
30003500400045005000550060006500700075008000
1 5 9 13 17 21 25 29 33 37 41 45 49 53 57 61 65 69 73 77 81 85 89 93 97
Cos
t of P
rodu
ctio
n (R
s.Pe
r Qui
ntal
)
Production Shares (%)
MAH A.P. Odisha RAJ KTK
All India C2 Rs.4758.69/qtl
All India A2+Fl Rs.3775.10/qtl.
2500
3000
3500
4000
4500
5000
5500
6000
1 5 9 13 17 21 25 29 33 37 41 45 49 53 57 61 65 69 73 77 81 85 89 93 97Cos
t of P
rodu
ctio
n (R
s.Pe
r Qui
ntal
)
Production Shares (%)
M.P. CHTG U.P. Odisha A.P. T.N MAH RAJ
All India C2 Rs.4112.87 /qtl
All India A2+Fl Rs.3143.93/qtl.
2500
3000
3500
4000
4500
5000
5500
6000
1 5 9 13 17 21 25 29 33 37 41 45 49 53 57 61 65 69 73 77 81 85 89 93 97
Cos
t of P
rodu
ctio
n(R
s./q
tl.)
Production shares(%)
GUJ A.P. MAH ODISHA T.N KT
All India C2 Rs.3397.49/qtl.
All India A2+FL Rs.2720.25/qtl.

48
forPolicy
Kharif CropsPrice
59
(j) Soyabean
(k) Sunflower
(l) Sesamum
1600
1900
2200
2500
2800
3100
1 5 9 13 17 21 25 29 33 37 41 45 49 53 57 61 65 69 73 77 81 85 89 93 97
Cos
t of P
rodu
ctio
n (R
s./q
tl.)
Production Share(%)
M.P. MAH RAJ
All India A2+FL Rs. 1691.87/qtl.
All India C2 Rs.2215.60/qtl.
2600
2800
3000
3200
3400
3600
3800
4000
4200
1 5 9 13 17 21 25 29 33 37 41 45 49 53 57 61 65 69 73 77 81 85 89 93 97
Cos
t of P
rodu
ctio
n (R
s./q
tl.)
Production Share (%)MAH A.P. KTK
All India C2 Rs.3679.36/qtl.
All India A2+FL Rs. 3000.10/qtl.
2600
3100
3600
4100
4600
5100
5600
1 6 11 16 21 26 31 36 41 46 51 56 61 66 71 76 81 86 91 96
Cos
t of P
rodu
ctio
n(R
s./q
tl.)
Production Shares (%)
W.B. RAJ ODISHA T.N. GUJ
All India C2 Rs.4133.88/qtl.
All India A2+FL Rs.2919.31/qtl.

49
forPolicy
Kharif CropsPrice
Inter crop price parity
4.12 Inter crop price parity being a factor for determination of MSPs, the Commission makes an in-depth study of per hectare returns of different crops that are substitutes for each other. The underlying idea is that area allocation amongst different crops should be in line with the emerging patterns of demand in the country and export potential in line with their comparative advantage. Table 4.3 outlines relative returns over A2+FL and C2 in percentage terms for various kharif crops in reference to that of paddy, as numeraire and it is found that there is some degree of inequality in returns earned. As is apparent, returns ratio over C2 on jowar is 13 percent (but 63 percent over A2+FL); on bajra 58 percent; ragi (-) 133 percent (but 64% over A2+FL) relative to paddy. Paddy and maize are close to each other on profitability over C2 cost. However, pulses are much more profitable than paddy. And, in the oilseed sector, groundnut, sunflower and nigerseed are losing out in relation to paddy in terms of returns but soyabean and sesamum have more return ratio than paddy. Cotton has maximum returns over C2 as well as A2+FL in relation to paddy.
Cotton has maximum returns over C2 as well as A2+FL in relation to paddy
60
(m) Cotton
Inter crop price parity 4.12 Inter crop price parity being a factor for determination of MSPs, the Commission
makes an in-depth study of per hectare returns of different crops that are substitutes for each other. The underlying idea is that area allocation amongst different crops should be in line with the emerging patterns of demand in the country and export potential in line with their comparative advantage. Table 4.3 outlines relative returns over A2+FL and C2 in percentage terms for various kharif crops in reference to that of paddy, as numeraire and it is found that there is some degree of inequality in returns earned. As is apparent, returns ratio over C2 on jowar is 14 percent (but 65 percent over A2+FL); on bajra 64 percent; ragi (-) 147 percent (but 66% over A2+FL) relative to paddy. Paddy and maize are close to each other on profitability over C2 cost. However, pulses are much more profitable than paddy. And, in the oilseed sector, groundnut, sunflower and nigerseed are losing out in relation to paddy in terms of returns but soyabean and sesamum have more return ratio than paddy. Cotton has maximum returns over C2 as well as A2+FL in relation to paddy.
2400260028003000320034003600380040004200
1 5 9 13 17 21 25 29 33 37 41 45 49 53 57 61 65 69 73 77 81 85 89 93 97
Cos
t of P
rodu
ctio
n (R
s./q
tl.)
Production Share (%)
M.P. HR GUJ RAJ MAH ODISHA KTK Punjab A.P. T.N.
All India C2 Rs.3318.21/qtl.
All India A2+FL Rs.2491.72/qtl.
Cotton has maximum returns over C2 as well as A2+FL in relation to paddy
2400
2600
2800
3000
3200
3400
3600
3800
4000
4200
4400
1 6 11 16 21 26 31 36 41 46 51 56 61 66 71 76 81 86 91 96
Cos
t of P
rodu
ctio
n (R
s/Q
tl)
Production Shares (%)M.P. HR GUJ RAJ KTK Punjab A.P. OR T.N. MH
All India C2 Rs.3532.66/qtl.
All India A2+FL Rs.2484.66/qtl.

50
forPolicy
Kharif CropsPrice
Table 4.3: Relative returns (%) of Kharif crops over A2+FL and C2 (2008-09 to 2010-11)
CROPRelative returns over A2+FL of crops with paddy as numeraire
Relative returns over C2 of crops with paddy as numeraire
CEREALS:
Paddy 100 100
Maize 89 97
Jowar 63 13
Bajra 78 58
Ragi 64 -133
PULSES:
Tur 150 201
Moong 109 145
Urad 128 162
OILSEEDS:
Groundnut 70 49
Soyabean 107 125
Sunflower 28 -37
Sesamum 147 222
Nigerseed 98 74
Cotton 150 243
Terms of Trade analysis
4.13 The domestic terms of trade between agriculture and non-agriculture is one of the terms of reference for CACP in recommending its MSP policy. The terms of trade data are being compiled by the DES as prices received over prices paid by the farmers. The prices paid by the farmers are collected for three broad categories of goods for final consumption, intermediate consumption and for capital consumption. The index of terms of trade has remained relatively stable, and in fact, marginally favored agriculture in recent years. Terms of trade data available up to the year 2009-10 (provisional) are given in annex table 4.5. With base year TE 1990-91=100 the index has been oscillating between 101 and 107 since 1990-91 and has gone up to 102.6 in 2009-10. This methodology, which is more precise, is in contrast to the ratio of agricultural prices to non-agricultural prices, which is often taken as an indicator of terms of trade and has improved from 100.8 in 2005-06 to 136.5 in 2011-12 (with 2004-05 = 100). Government has already set up a new committee, under the aegis of DAC, to come up with fresh estimates of terms of trade as the base for current estimates is as old as 1980-81.
Index of terms of trade has marginally favored agriculture in recent years

51
forPolicy
Kharif CropsPrice
An Aerial View of Growth in Productivity
A. Land Productivity
5.1 Global competitive advantage on a sustainable basis is greatly influenced by prices. One way to reduce real prices of commodities is to increase their total factor productivity (TFP) much faster than demand. Land productivity, though a partial component of TFP, is a critical factor influencing real prices of agricultural products. It would therefore be interesting to see how productivity of important kharif crops impacts cost of production. For this, at first the long term annual growth rates of area, production and land productivity of major kharif crops during the decades of 1980s, 1990s and 2000s are considered. The annual growth during the decades of 1980s, 1990s and 2000s represent simple average annual growth in each year during the period from 1980-81 to 1989-90, 1990-91 to 1999-2000 and 2000-01 to 2011-12 respectively. The summary of these growth levels in area, production and yield along with relevant coefficient of variation (CV) is presented in table 5.1.
forPolicy
Kharif CropsPrice
Chapter 5Productivity: Different Dimensions
Shrinkage in area under oilseeds such as groundnuts, sunflower and nigerseed is a cause of concern

52
forPolicy
Kharif CropsPrice
5.2 Based on growth rates thus worked out, the following salient points emerge:
i. Groundnut stands out in terms of improvement in its land productivity in double digits in the decade of 2000s, faster than growth in its production which indicates shrinkage in its acreage. However, these high growth rates need to be taken with caution due to their high CV.
ii. Shrinkage in area under oilseeds such as groundnuts, sunflower and nigerseed is a cause of concern, given that India imported huge quantity of about 10 million MT of edible oils, valued at Rs 56000 crore during 2011-12 (Nov-Oct.). As cotton cultivation is more remunerative compared to groundnut, it appears that groundnut is losing area to cotton in many places. It may be relevant to add here that Gujarat commands around 40 percent share of country’s groundnut production, and cotton is doing quite well in the state of Gujarat compared to Maharashtra, due to higher irrigation ratio and higher yields of cotton in Gujarat vis-à-vis Maharashtra.
Table 5.1: Growth Rates of Kharif Crops at All India Level during 1980s, 1990 and 2000s
(Percent)
S. N.
Crop 1980s 1990s 2000s
A P Y A P Y A P Y1
Rice Growth 0.8 6.6 5.4 0.7 2.1 1.4 -0.1 2.0 1.9CV 3.1 15.8 13.5 2.4 6.9 4.8 3.1 9.1 7.8
2 Jowar Growth -1.1 2.3 3.2 -3.4 -0.9 1.9 -3.9 -2.7 1.5CV 4.2 9.9 10.8 13.3 19.2 11.8 13.7 9.0 11.1
3 Bajra Growth 1.4 13.9 8.8 -1.8 5.4 5.6 0.7 13.7 9.3CV 8.4 28.3 23.2 6.2 19.7 17.5 7.4 24.9 21.3
4 Maize Growth 0.4 7.5 6.6 0.8 2.2 1.4 2.7 6.5 3.6CV 2.2 16.7 15.6 3.1 10.7 8.3 10.7 23.3 13.6
5 Ragi Growth -1.0 1.4 2.0 -3.4 -1.2 2.1 -2.0 2.8 3.3CV 4.9 9.0 7.2 12.1 7.8 8.9 13.4 18.8 14.8
6 Tur Growth 2.9 5.3 2.1 0.7 2.0 2.0 1.7 1.1 -0.5CV 8.4 14.0 7.6 3.0 12.4 11.8 8.1 11.2 8.9
7 Moong Growth 2.8 7.9 4.6 -2.2 -0.6 0.7 3.1 14.5 9.5CV 7.5 17.7 12.8 8.9 13.0 10.5 9.9 29.5 22.9
8 Urad Growth 2.4 8.3 5.6 -1.4 -1.4 0.1 1.0 3.5 2.1CV 7.8 22.0 14.9 8.0 10.6 5.9 7.9 14.3 10.2
9 G’nut Growth 2.3 7.2 3.6 -2.3 -2.4 -0.3 -1.8 10.7 11.2CV 8.6 22.0 14.3 7.9 13.0 13.4 8.1 22.1 22.2
10 Sunflower Growth 42.9 46.2 2.5 3.1 3.2 0.8 -2.5 -0.4 3.4CV 65.8 62.2 17.4 22.0 23.7 8.2 32.7 33.4 13.7
11 S’bean Growth 18.5 24.0 5.4 11.0 16.4 4.7 4.2 7.3 3.1CV 49.4 57.5 14.6 32.4 41.1 12.3 19.1 30.1 15.7
12 S’mum Growth 0.3 9.0 8.7 -3.7 -3.4 1.3 2.0 8.5 5.5CV 6.8 20.4 19.7 17.9 18.1 9.9 9.4 20.1 14.9
13 Nigerseed Growth 1.1 9.5 6.9 -2.0 -1.8 0.1 -2.3 -1.9 0.0CV 6.3 18.7 14.7 7.5 12.5 7.4 10.1 13.5 8.5
14 Cotton Growth -0.4 7.0 7.4 1.4 2.1 0.5 3.1 7.8 4.4CV 6.6 18.7 20.4 9.4 14.8 6.9 13.9 32.3 23.7
Note: Decades of 1980s, 1990s & 2000s relate to period from 1980-81 to 1989-90, 1990-91 to 1999-2000 & 2000-01 to 2011-12 respectively.CV: Coefficient of Variation.

53
forPolicy
Kharif CropsPrice
iii. Advent of Bt cotton in 2002-03 led to a sort of “cotton revolution” with production growth of about 8 percent per annum during 2000s, which is the resultant effect of annual growth in yield levels in excess of 4 percent (made possible by containment of the pest attacks and thus helped in augmenting yields) and area expansion at an average growth of over 3 percent per annum during the corresponding period.
iv. Bajra and moong witnessed impressive annual growth at 9 percent each in their respective yield levels during the decade of 2000s. The growths in their respective production levels outstrip growth in the corresponding yield levels.
v. On a priori basis, one would expect subdued prices to follow high growth in production of moong at a high rate of 14.5 percent per annum during decade of 2000s but this is not visible in price trends, mainly for two reasons. Firstly, share of moong in total production of pulses (TE 2011-12) is 8.4 percent and therefore contribution of its growth in total pulses production would be only 1.2 percent. Secondly, other pulses (pulses as a group being deficient in domestic supply) are close substitutes of moong. It is also pertinent to note that fluctuations in production of this pulse are high at about 30 percent during decade of 2000s.
vi. Negative growth in yield level of Tur during 2000s, a major kharif pulse in the country, is a cause of concern. Given shortage of pulses in the country as also in oilseeds, a suitable incentive structure and an effective hedging of risk in pulse cultivation needs to be devised.
vii. Maize and soyabean, each registered a growth in production of more than 6 to 7 percent per annum during the decade of 2000s. However, distinguishing characteristics of the two is that area expansion under soyabean is faster at an average annual growth of over 4 compared to less than 3 percent per annum under maize.
B. Water Productivity
5.3 According to the existing practice, production per unit of area is taken into consideration to compare land productivity of a given crop across states. Based on this, Punjab with yield rate of 5.8 tonnes/ha during TE 2011-12 emerges more efficient compared to West Bengal which has 3.9 tonnes/ha of yield of paddy. However, this criterion captures only one dimension of land productivity. But since paddy is water guzzling crop, it becomes imperative to look at its water intake. This is important as land, water and power are increasingly becoming scarce in India with high opportunity costs. Therefore, the real resource cost of growing paddy in different regions cannot be correctly compared unless land productivity is seen in conjunction with its water intake. An attempt has been made in this direction and water productivities of key paddy producing states have been derived in table 5.2.
It takes 4000 litres of water to produce 1 kg of rice

54
forPolicy
Kharif CropsPrice
Table 5.2: Water Productivity for Production of one kg of Rice in key Paddy Producing States
Major States
T E 2011-12 Av. duration
of the crop (in months)
Irrigation required Water Requirement
for 1 kg of paddy {col.
(8)/ (4)}*100
Water Requirement
for 1 kg of rice {col.(9)*1.5}
Water Productivi-ty (Kg of rice/lakh
litre of water) {{Col.
(4)*1000*0.667}/col.(8)]
Efficiency gap (%)
Paddy Production
(Million Tonnes)
Share in all-India
Production (%)
Land Productivity of paddy (Tonnes/
Ha)
No. of irrigations
Av. height of
irrigated water
column (cm)
Qty of water (lakh
litre/ha) {col.(6)*
(7)}
(1) (2) (3) (4) (5) (6) (7) (8) (9) (10) (11) (12)
Andhra 18.93 13.03 4.62 4.5 17.5 5.5 96.3 2083 3124 32 13
Assam 6.79 4.68 2.71 4.0 10.0 5.5 55.0 2026 3039 33 11
Bihar 6.93 4.77 2.22 4.5 12.0 5.5 66.0 2974 4461 22 39
Chhattis 8.15 5.61 2.19 4.5 13.0 5.5 71.5 3265 4897 20 45
Haryana 5.43 3.74 4.42 4.8 18.0 7.5 135.0 3054 4581 22 41
Karnata 5.92 4.08 4.05 4.5 14.0 5.5 77.0 1902 2853 35 5
Odisha 9.78 6.73 2.32 4.5 13.0 5.5 71.5 3076 4614 22 41
Punjab 16.31 11.23 5.79 5.0 26.0 8.0 208.0 3593 5389 19 50
TN 9.46 6.51 4.77 4.5 20.0 5.5 110.0 2308 3462 29 22
UP 18.41 12.68 3.28 5.0 17.0 6.5 110.5 3368 5052 20 46
W.Bengal 21.00 14.46 3.95 4.5 13.0 5.5 71.5 1809 2713 37 0
All-India / Weighted Average
145.19 87.5 3.38 4.6 15.4 5.9 93.8 2665 3988 24 35
Sources: Deduced by CACP based on information received from Directorate of Rice Research, Hyderabad, CRRI, Cuttack and discussions with State Governments
Note : 1. Efficiency gap of a state is defined as (1- water productivity of the state/highest water productivity)*100 2. 1 ha. = 100 meter length X 100 meters width =10,000 sq. meters and 1 meter = 100 cms. Since 1 cubic meter of water = 1000 litres, therefore 1 ha
would require 1 lakh litres of water for 1 cm. height.
5.4 It may be seen from table 5.2 that water requirement for production of one kg of rice varies a great deal from state to state, with all-India weighted average of 3988 litre. Punjab consumes the highest quantity of water of 5400 litre for producing one kg of rice in contrast to the lowest of 2700 litre in West Bengal. This irrigation water comes mainly from groundwater.It is evident from table-5.2 that water productivity of Punjab at 19 kg/lakh litre is half of West Bengal’s 37 kg/lakh litre. Equivalently, Punjab consumes almost double water compared to West Bengal for producing every kilogram of rice. Thus, Punjab is less efficient to the tune of 50 percent compared to West Bengal in terms of water productivity. It raises an issue of comparative advantage of where to propagate paddy cultivation. Punjab is most efficient in terms of land productivity of paddy, but least efficient in terms of water productivity. In contrast, West Bengal is most efficient from water consumption for paddy cultivation. And if one considers the real cost of irrigation (massive power subsidy and falling water table in Punjab, which is two to three time more than in West Bengal), Punjab will become even less efficient producer of rice vis-à-vis West Bengal. It is, therefore, imperative to get our water and power pricing policies right so that paddy production
Punjab is less efficient to the tune of 50 percent compared to West Bengal in terms of water productivity

55
forPolicy
Kharif CropsPrice
follows the comparative advantage, based on natural resources endowments, which can be sustainable in the long run. India could be 50 percent short of its water requirement by 2030, as projected by the IWRG21. Given that paddy is a water guzzling crop, its long term development must ensure that it is in line with availability of sufficient water and concomitant requirement of power for extracting water from ground.
Cost of Production & Yield Rates
5.5 As noted earlier, MSP is recommended not solely on the basis of costs, though it is duly factored in while recommending price policy. In spite of this, various stakeholders often demand increase in MSP of various agricultural commodities on the ground of monotonously increasing cost of production year after year. The answer to contain increasing cost of production lies in enhancing yield levels as, on a priori basis, one would expect an inverse relationship between real cost of production and yield rates.
5.6 To statistically test this hypothesis of an inverse relationship between real cost of production and yields, cost and yield data of various kharif crops, drawn from CS Scheme for 2000-01 to 2010-11 across the key producing states of the relevant crops, are analyzed by fitting the following model:
Ln (CoPi ) = a+ ei*Ln(yi ) where CoPi = real Cost of Production of ith crop, i=1,2…14 yi = Yield rate of ith crop; ei = elasticity of ith crop; a = constant; and Ln denotes logrithimic function The crop-wise elasticities are presented in table-5.3.
Table 5.3 : Impact of Variation in Yield on CoP (%)
Crop Elasticity Crop Elasticity Paddy -0.211 * Jowar -0.031 #Maize -0.583 * Moong -0.416 *Tur -0.494 * Nigerseed -0.650 *Soyabeans -0.540 * Ragi -0.533 *Groundnut -0.394 * Sesamum -0.412 *Cotton -0.418 * Sunflower -0.255 *Bajra -0.063 # Urad -0.472 *
Note: Asterisk (*) denotes elasticities are significant at 95% level of confidence and # indicates not significant in statistical sense of the term
5.7 It can be inferred from table 5.3 that cost of production of paddy can be brought down by about 2 percent if its yield is improved by 10 percent. The impact of yield enhancement on cost reduction is more pronounced in case of other crops. The cost could be reduced by 5 to 7% (in cases of maize, ragi, tur, urad,
21 International Water Resources Group
An inverse relationship between real cost of production and yield exists

56
forPolicy
Kharif CropsPrice
soyabeans, and nigerseed), and 4% (moong, groundnut, sesamum and cotton) if their respective yield levels increase by 10 percent. Scatter diagrams {charts-5.1 (i) to (xiv)}, based on panel data for various kharif crops (across states and over these years), also depict such an inverse relationship.
Charts 5.1 (i) to (xiv) : Relationship Between Cost of Production and Yield levels of Various kharif Crops, Based on panel data of various States for 2000-01 to
2010-11 (Constant prices 2010-11 =100)
Chart-5.1 (v) : Ragi Chart-5.1 (vi) :Urad
Chart-5.1 (vii) : Moong Chart-5.1 (viii) :Tur
400
600
800
1000
1200
1400
5 15 25 35Cost
of P
rodu
ctio
n (R
s./q
tl.)
Yield (Q/Ha.)
500
700
900
1100
1300
1500
0 10 20 30Cost
of P
rodu
ctio
n (R
s./q
tl.)
Yield (Q/Ha.)
500
1000
1500
2000
2500
3000
6 16 26 36
Cost
of P
rodu
ctio
n (R
s./q
tl.)
Yield (Q/Ha.)
8001500220029003600430050005700
0 5 10 15
Cost
of P
rodu
ctio
n (R
s./q
tl.)
Yield (Q/Ha.)
10002000300040005000600070008000
0 5Cost
of P
rodu
ctio
n (R
s./q
tl.)
Yield (Q/Ha.)
70011001500190023002700310035003900
3 4 5 6 7 8 9 10 11 12 13Cost
of P
rodu
ctio
n (R
s./Q
)
Yield (Q/Ha.)
Char
Char
Cost
ofPr
oduc
tion
rt-5.1 (i) :Pad
rt-5.1 (iii) :Ba
500600700800900
100011001200130014001500
15 20
Cost
of P
rodu
ctio
n
(Rs.
/qtl
.)
ddy
ajra
0 25 30 35 40
Yield
0 45 50 55 60
d (Q/Ha.)
67
0 65 70 75
7
Cha
Chart-5.1
300500700900
1100130015001700
6Cost
of P
rodu
ctio
n (R
s./q
tl.)
art-5.1 (ii) :M
(iv) :Jowar
9 12 15 18 2Yie
Maize
21 24 27 30 3eld (Q/Ha.)
3 36 39 42 455
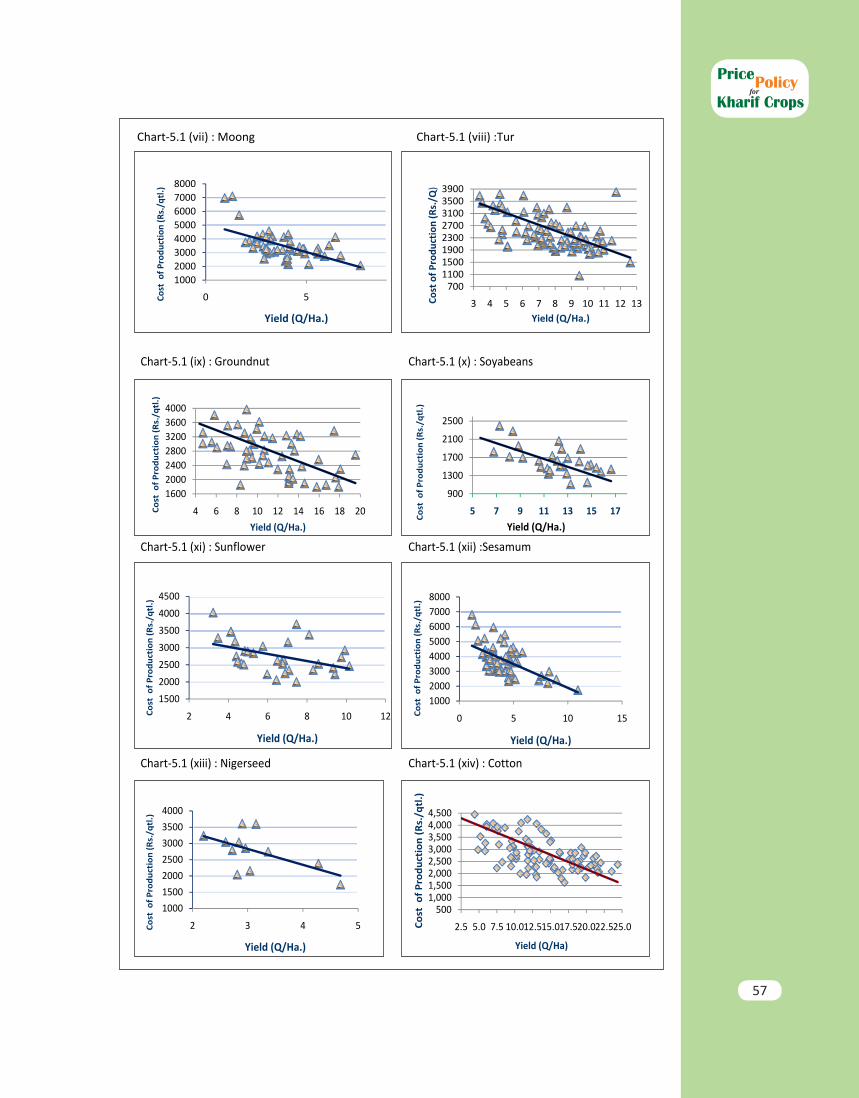
57
forPolicy
Kharif CropsPrice
Chart-5.1 (v) : Ragi Chart-5.1 (vi) :Urad
Chart-5.1 (vii) : Moong Chart-5.1 (viii) :Tur
400
600
800
1000
1200
1400
5 15 25 35Cost
of P
rodu
ctio
n (R
s./q
tl.)
Yield (Q/Ha.)
500
700
900
1100
1300
1500
0 10 20 30Cost
of P
rodu
ctio
n (R
s./q
tl.)
Yield (Q/Ha.)
500
1000
1500
2000
2500
3000
6 16 26 36
Cost
of P
rodu
ctio
n (R
s./q
tl.)
Yield (Q/Ha.)
8001500220029003600430050005700
0 5 10 15
Cost
of P
rodu
ctio
n (R
s./q
tl.)
Yield (Q/Ha.)
10002000300040005000600070008000
0 5Cost
of P
rodu
ctio
n (R
s./q
tl.)
Yield (Q/Ha.)
70011001500190023002700310035003900
3 4 5 6 7 8 9 10 11 12 13Cost
of P
rodu
ctio
n (R
s./Q
)
Yield (Q/Ha.)
69
Chart-5.1 (ix) : Groundnut Chart-5.1 (x) : Soyabeans
Chart-5.1 (xi) : Sunflower Chart-5.1 (xii) :Sesamum
Chart-5.1 (xiii) : Nigerseed Chart-5.1 (xiv) : Cotton
1600200024002800320036004000
4 6 8 10 12 14 16 18 20Cost
of
Prod
ucti
on (R
s./q
tl.)
Yield (Q/Ha.)
900
1300
1700
2100
2500
5 7 9 11 13 15 17
Cost
of
Prod
ucti
on (R
s./q
tl.)
Yield (Q/Ha.)
1500
2000
2500
3000
3500
4000
4500
2 4 6 8 10 12Cost
of
Prod
ucti
on (R
s./q
tl.)
Yield (Q/Ha.)
10002000300040005000600070008000
0 5 10 15Cost
of
Prod
ucti
on (R
s./q
tl.)
Yield (Q/Ha.)
1000
1500
2000
2500
3000
3500
4000
2 3 4 5Cost
of
Prod
ucti
on (R
s./q
tl.)
Yield (Q/Ha.)
5001,0001,5002,0002,5003,0003,5004,0004,500
2.5 5.0 7.5 10.012.515.017.520.022.525.0Cost
of P
rodu
ctio
n (R
s./q
tl.)
Yield (Q/Ha)

58
forPolicy
Kharif CropsPrice
Benchmarking Productivity: India vis-à-vis other Leading Producing Countries
5.8 Productivity plays a key role in enhancing competitiveness in a globalised scenario. It is, therefore, imperative to envision India’s position vis-à-vis other major producing countries (of kharif crops) on land productivity scale. This would help in “benchmarking” productivity standards, and set our targets accordingly with a view to gain greater competitiveness in production of those crops. With this end in view, India’s position vis-à-vis other leading countries producing these crops is tracked and is presented in table-5.4.
Table 5.4: Benchmarking of Important Crops, TE 2011-12
S.N Crop Yield (TE 2011-12) (Average
All-India)
(Tn/ Ha)
Benchmarking States TE 2011-12
Benchmarking Countries TE 2011
Efficiency Gap in
India’s Yield level w.r.t
benchmark Country (%)
Efficiency Gap in
India’s Yield level w.r.t
benchmark State (%)
(1) (2) (3) (4) (5) (6) (7)
1. Paddy 3.40 Punjab (5.79, 11.27%) TN (4.77, 6.34%), AP (4.62, 11.84%)
China (6.61, 28.3%) Vietnam (5.37, 5.8%) Indonesia (5.0, 9.3%)India (3.38, 20.6%)
48.9 12.4
2. Jowar 0.92 MP (1.42, 9.1%) AP (1.24, 5.7%)
Argentina (4.37, 5.66%) USA (4.10, 14.18%)Mexico (3.75, 11.53%)India (0.92, 12.4%)
78.9 67.5
3. Maize 2.35 Tamil Nadu (4.77, 6.23%) AP (4.4, 17.46%) West Bengal(3.91, 1.82%)
USA (9.72, 37.68%)China (5.49, 20.93%)Brazil ( 4.10, 6.33%)India (2.51, 2.35%)
74.2 50.9
4. Barley 2.33 Punjab (3.59, 2.94%) Haryana (3.46, 9.06%) Rajasthan (2.84, 51.1%)
France (6.3, 7.75%) Germany (6.1, 7.67%) Canada (3.24, 6.07%) India (2.31, 1.15%)
63.3 43.0
5. Tur 0.67 Bihar (1.61, 1.59%) Haryana (1.03, 0.92%) Gujarat (0.98, 9.68%)
Myanmar (1.28, 20.1%), India (0.68, 64.3%)
46.9 -25.8

59
forPolicy
Kharif CropsPrice
S.N Crop Yield (TE 2011-12) (Average
All-India)
(Tn/ Ha)
Benchmarking States TE 2011-12
Benchmarking Countries TE 2011
Efficiency Gap in
India’s Yield level w.r.t
benchmark Country (%)
Efficiency Gap in
India’s Yield level w.r.t
benchmark State (%)
(1) (2) (3) (4) (5) (6) (7)
6. Groundnut 1.24 TN (2.41, 13.8%) Rajasthan (1.66, 8.9%) Gujarat (1.5, 38.0%)
China (3.42, 39.83%)India (1.35, 17.64%)Nigeria (1.25, 8.33%)
63.7 29.5
7. Sunflower 0.66 Uttar Pd. Incl UK (2.23, 2.0%) Haryana (1.76, 3.05%) Punjab (1.74, 4.29%)
France (2.42, 5.03%) China (1.85, 5.15%)Argentina (1.65, 8.05%) India (0.63, 1.92%)
74.0 7.9
8. Soyabean 1.19 Rajas (1.39, 9.8%), Maha (1.21, 30.0%), MP (1.17, 55.4%)
Brazil (2.9, 26.82%) USA (2.89, 35.4%)Argentina (2.45, 17.70%) India (1.2, 4.67%)
58.6 52.1
9. Cotton 0.50 Tamil Nadu (0.94, 1.96%) Gujarat (0.66, 32.49%) Rajasthan(0.51, 3.96%)
China (1.28, 27.33%) Brazil (1.19, 5.25%) Pakistan (0.72, 8.93%) India (0.49, 23.91%)
61.7 26.6
Notes: i. Paired figures in parentheses in column (4) indicate yield and share of state in total production of
India in that order and corresponding figures in column (5) represent yield and share of a country in total world production.
ii. Countries with a minimum of 5% share in world production and states with around 1% share of all-India production have been considered for benchmarking analysis.
iii. Yield levels for India as given in col. (3) are slightly different from those in col. (5), due to difference in reference period.
iv. Efficiency gap = (1-e)*100, where e = yield of India/yield of benchmark country.
Sources: DES for col. (3) & (4); FAO for col.(5).
5.9 It may be noted that India’s land productivity is way behind those of benchmark countries in all crops mentioned in table 5.4 and efficiency gaps lie in the range of 47 percent in Tur to 79 percent in jowar. More importantly, efficiency gaps are quite significant even in such crops as paddy, maize and cotton in which India has export competitiveness. Even best performing states of the country lag behind benchmark countries in terms of land productivities of various crops mentioned in table-5.4, except tur. To enhance the productivity levels

60
forPolicy
Kharif CropsPrice
in major states and thus at all-India level, it may be useful to examine the best international farming practices, the factors (both natural and man-made) that have helped benchmark countries/states achieve high levels of productivity and replicate those practices/factors in concerned states, after taking its agro-climatic conditions and other relevant factors into consideration.
Drivers of Productivity 5.10 It has been statistically established (table-5.3) that real cost of production can
be reduced by increasing land productivity. To explore as to what drives land productivity, various causal factors are tested. Basically these factors fall in three categories: (a) gross returns over A2+FL of the crop under question in real terms in period t-1 as a proxy to price incentives; (b) technology factors such as fertilizers or seeds consumption per hectare, or percent area irrigated, etc.; and (c) Nature represented by monsoon rainfall. The impact of each one of this is explored by undertaking simple linear regression analyses. Based on this approach, elasticity of various kharif crops are estimated and presented in table-5.5.
Table-5.5: Drivers of Yield- Kharif Crops
Crop Elasticities
Gross Returns in preceding
year at constant
prices (2010-11=100)
Fertilizer (Quantity)
% Area Irrigated
Monsoon Rainfall
Manure
Paddy 0.185 * 0.153 * 0.247 * 0.232 *
Maize 0.068 * 0.721 * 0.243 *
Jowar 0.368 * 0.165 ** 0.110 *
Bajra 0.177 * 0.285 *
Ragi 0.024 *
Tur 0.164 * 0.048 # 0.003 #
Moong 0.076 ** 0.193 *
Urad 0.208 * 0.060 **
Groundnut 0.028 # 0.057 #
Soyabean 0.064 *
Cotton 0.190 * 0.502 * 0.167 *
Sunflower 0.765 * 0.534 *
Sesamum 0.200 *
Notes: Asterisk (*) & double asterisk (**) denote that elasticity is Statistically significant at 95% and 90% level of confidence respectively # : Not significantly different from zero in statistical sense of the term. Blank cells either indicate that the corresponding variable was not found appropriate to explain variability in yield levels or relevant data not available.
Nigerseed is not included due to non-availability of requisite data on various parameters
India’s land productivity is way behind those of benchmark countries in various kharif crops

61
forPolicy
Kharif CropsPrice
5.11 The results of the regression analyses show that farmers respond to gross returns over A2+FL. For instance, yields of paddy, bajra, urad and cotton can increase by 2 percent each if their respective gross returns in the preceding year increase by 10 percent. Consumption of fertilsers impacts yield of majority of crops analysed and its impact is more pronounced in case of maize, sunflower and cotton (5 to 8 percent) compared to about 2 percent each in cases of paddy, tur , moong and seasum. Area under irrigation impinges significantly in case of paddy, cotton and soyabeans in that order. However, these are preliminary results and their elasticity, as a measure of impact of the causal factors on yield, may change depending upon formulation of regression equations.
5.12 Irrigation is an important input that drives productivity, yet gap between irrigation potential created and ultimate irrigation potential is quite high at 29.14 million hectares (table 5.6).
Table 5.6: Gap in Irrigation potential Created and Outlays Required to Attain Full Potential
1 Ultimate Irrigation potential (million ha) 140.00
2 Irrigation potential created so far (million ha) 110.86
3 Irrigation potential utilised (million ha) 88.44
4 Irrigation Utilised as percentage of irrigation potential created 79.78
5 Irrigation Utilised as percentage of Ultimate irrigation potential 63.17
6 Gap between irrigation potential created and Ultimate irrigation potential (million ha) {row(1)-row(2)}
29.14
7 Untapped surface irrigation potential out of untapped potential irrigation as in row (6) (million ha)
13.00
8 Untapped minor surface irrigation potential out of untapped potential irrigation as in row (6) (million ha)
10.00
9 Investment required to attain Ultimate Potential (@ Rs2.5 lakh / ha for surface irrigation & @ Rs 1 lakh/ha for minor surface irrigation) (Rs. Lakh Crore)
4.25
10 Outlays for 12th Plan (2012-17) (Rs. Lakh Crore) 0.55
Note: There is about 6.2 million ha of groundwater potential for which no government intervention may be required. Source: Calculated by the Commission based on information gathered from Ministry of Water Resources & Central Water Commission
9.13 A back of envelope calculation indicates that an amount of over 4 lakh crore will be required to realize full potential of irrigation in the country. Against this, only about half lakh crore is provided in the 12th Five year plan. At this rate, it may take another eight Five Year Plans to fully accomplish ultimate potential of the irrigation in the country. Here, it may be pertinent to add that input subsidy in relation to public investment in agriculture is almost six times high. It is imperative to switch emphasis to investments (irrigation) from food and fertilizer subsidy as former is more cost effective.
Drivers of productivity are gross returns, consumption of fertilizers and area under irrigation
At current level of outlays for irrigation, it may take another eight Five Year Plans to realize full potential of irrigation in the country

62
forPolicy
Kharif CropsPrice
9.14 Empirical studies do indicate that quality of seeds significantly impinge on land productivity as was demonstrated by HYV, for instance, during Green Revolution period. Due to limitation of non-availability of authentic data on quality of seeds, regression analyses could not be undertaken to estimate impact of quality of seed on land productivity. However, it may be seen from table 5.7 that public investment (expenditure) in R & D, a proxy to quality of seed, is quite low in the country compared to what is being invested by private agencies.
Table-5.7: Public and Private Investment in Agriculture R & D, 2012-13(Rs. crores)
Organization Investment /ExpenditureDARE (Govt. of India) 4622 (RE)*Monsanto 8360Du Pont 4400
* Includes both Plan and non-Plan
Sources: For DARE, Department of Agriculture and Research, New Delhi, for Monsanto: www.monsanto.com, for Du Pont, telephonic discussions with their concerned officer at Hyderabad.
5.15 The need is to substantially augment public investment in R&D so as to discover and propagate new varieties of seed and ramp up land productivity in a big way, thereby contain cost of production. This will go a long way to make Indian agriculture globally competitive and agriculture sector as an attractive enterprise.
5.16 To recapitulate, the following points emerge from the foregoing analyses:
i. Productivity enhancement does lead to reduction in costs of production and this may improve global competitiveness.
ii. Paddy cultivation is a water guzzling crop and takes about 5400 litre of water for producing one kilogram of rice in Punjab compared to 2700 litre in West Bengal (WB). Thus WB, a major paddy producing state, is far more efficient compared to Punjab, from the point of view of water productivity. Given projection made by IWRG that India will be 50 percent short of water by 2030, our long term development must ensure that it is in line with availability of sufficient water and its cost. It is recommended to accord high priority in evolving such varieties which use less water, and get our water pricing policies right so that paddy cultivation follows a sustainable trajectory of growth with cost effectiveness on long term time basis.
iii. Irrigation and seeds are two important inputs that drive productivity. However, public investment in irrigation and agriculture research is quite low. To increase land productivity, public investment in agri R & D (seeds) and irrigation need to be enhanced substantially to hasten adoption of modern technology.
iv. Efficiency gaps in India’s yield levels compared to those of benchmark countries are quite substantial. To improve our productivity levels, there is a need to study the best international farming practices, deepen the understanding of factors that have helped benchmark countries to accomplish such levels of productivity with a view to replicate those practices/factors, wherever possible given Indian agro-climatic conditions.

63
6.1 As per the mandate of the Commission, the first and foremost need is to make Indian agriculture remunerative enough so that farmers feel incentivized to adopt new technologies, and raise productivity in a sustainable manner. The Commission has recently made a concerted effort to ‘getting the prices right’, especially in its last kharif and rabi reports. The priority for this report is now to ‘getting the markets right’ so that farmers can fully exploit the markets for their produce, both domestic and international, to maximize their returns while support prices extend them a floor price. In doing so, the Commission has taken into account the following factors which are part of its broad terms of reference namely, the cost of production of the commodity, overall demand-supply, domestic and international prices, inter-crop parity in returns, a balance in terms of trade between agriculture and non-agriculture sector and their likely impact on the overall prices in the economy.
Overall Demand and Supply
6.2 The year 2012-13 is expected to show some downward fluctuation on the supply side with most of kharif crops. But the stock-to-use ratios seem comfortable in
Chapter 6Recommendations for Price Policy
forPolicy
Kharif CropsPrice

64
forPolicy
Kharif CropsPrice
the case of most of the major crops except maize, tur (as estimated by IPGA) and cotton (as estimated by CAB). Total grain stocks with public agencies are estimated to touch 90 million tonnes on July 1, 2013 (almost 2.8 times the buffer stock norms of 32 million tonnes and much higher than the available covered stocking capacity of only 53 million tonnes). Despite these ballooning stocks, domestic inflation in wheat and rice is high (in January 2013, wheat and rice prices were higher by 21 percent and 17 percent respectively over January, 2012). This is mainly due to the fact the Government has emerged as the largest buyer and hoarder of foodgrain stocks. Considering the high carrying costs of surplus stocks, there is an urgent need to liquidate at least 15 million tonnes of stocks (of rice & wheat) in domestic and/or foreign markets to prepare for the next incoming crops. This has to be done at last year’s MSP plus 5 percent taxes if any. Failing this, there is likely to be severe ‘crisis of plenty’ inflicting high economic costs on the system.
6.3 In the case of oilseeds (edible oils) and pulses, India still remains a large importer, indicating that demand exceeds supplies by large margin. India imported a record US$ 9.7 billion (Rs 46,242 crore) worth of edible oils in 2011-12 (47.5 percent jump from last year) and US$ 1.8 billion (Rs 8767 crore) worth of pulses (an increase of 16.4 percent as compared to last year). During the first ten months of FY 2012-13, India has already imported US$ 9.6 billion of edible oil and US$ 1.9 billion of pulses. The right strategy should be to shift policy focus from cereals to these crops by providing them attractive price incentives along with supportive marketing/procurement infrastructure, besides better technologies (seeds), so that farmers allocate larger irrigated area for these crops and adopt best technologies/farm practices to raise their production.
6.4 As discussed in chapter 2 in detail, agricultural markets in India are stifled by various controls on stocking (via ECA), on marketing (via APMC Act) and various distortions caused by the pricing and procurement policies followed by Centre and State Governments. An exercise was undertaken to study the degree of market distortions prevalent in the paddy/rice markets in 18 states. States’ policies that impact on paddy/rice market in India were classified into six parameters. States were ranked on the basis of the extent to which prevalent state policies impacted on the market. According to this exercise Gujarat was most market friendly and Chhattisgarh, the most distorted state with respect to paddy/rice market in India. Efficient and well-functioning markets are an urgent need to enhance agricultural growth, efficient use of resources and bringing prosperity to farmers. Therefore, the focus should be on ‘getting the markets right’.
Global Scenario6.5 India is a net exporter of agricultural commodities with agricultural exports
constituting 11.9 percent of India’s total exports and agricultural imports
Urgent need to liquidate central pool stocks at last year’s MSP plus 5 percent taxes if any
Emphasis on crop diversification from cereals to pulses & oilseeds & Removal of market distortions

65
forPolicy
Kharif CropsPrice
constituting only 3.4 per cent of India’s total imports in 2011-12. India’s comparative trade advantage is also reflected in the share in total global exports of agri products at 2.1 percent in 2011 – higher than India’s share in global merchandise exports at 1.7 percent in 2011. However, it needs to be appreciated here that India’s agri-trade policy has been relatively restrictive and unstable. The success of the agri-sector against this backdrop, therefore, deserves all the more credit and signifies that a more supportive and liberal trade policy can help propel growth and prosperity in rural areas.
6.6 As discussed in Chapter 3, a comparison of international prices and domestic prices for major crops shows that these have increasingly aligned over the last decade indicating that Indian agriculture is very much in tune with global markets for major agri-products. In several commodities, our domestic prices are below fob prices indicating our trade competitive advantage. India is internationally competitive in the production of rice, cotton and maize which is corroborated by the increasing share of India in their global trade. India emerged as the largest exporter of rice in 2012, as per FAO. India is also the largest importer of pulses and edible oils. Imports of pulses are permitted under OGL at zero duty while imports of crude edible oils and refined edible oils are freely allowed with 2.5 percent and 7.5 percent duties respectively but exports are banned. Logically, the import duty is graduated from low on raw material to highest on refined product. This restrictive export policy along with free imports clearly shows a pro-consumer bias and needs to change in order to take into account producer interest as well. Exports need to be fully opened as also imports to have a neutral trade policy for producers as well as consumers. The need of the hour is a stable, liberal and neutral (for producers as well as consumers) trade policy with only moderate duties of 5-10% in most of the years aiming at the alignment of the domestic and international prices and guard against sharp spikes and troughs through Agricultural Special Safeguards.
Costs of Production and Profitability
6.7 Actual C2 and A2+FL costs for the kharif crops are now available for the year 2010-11. At all India level gross rate of returns, i.e., relative profit over A2+FL and net rate of returns, i.e., relative profit over C2 are maximum for cotton followed by tur. At the other extreme with negative gross and net returns are sunflower and ragi. Analyzing inter crop price parity reveals that paddy and maize are close to each other on profitability over C2 cost; cotton, pulses, soyabean & sesamum are much more profitable than paddy while groundnut, sunflower and nigerseed are losing out in relation to paddy. The projected costs (C2 and A2+FL) of major kharif crops for the 2013-14 season are estimated to be: Rs 961.46/qtl & Rs 1234.06/qtl for paddy; Rs 1269.18/qtl & Rs 1648.41/qtl for jowar, Rs 767.58/qtl & Rs 1002.84 for Bajra, Rs 859.55/qtl & Rs 1112.37 for maize, Rs 1338.2 & Rs 1687.05 for Ragi; Rs 3089.87/qtl & Rs 3957.67/qtl for
Need for a supportive, stable and liberal agri-trade policy

66
forPolicy
Kharif CropsPrice
Tur; Rs 3775.1/qtl & Rs 4758.69/qtl for Moong; Rs 3143.93/qtl & Rs 4111.87/qtl for Urad; Rs 2720.25/qtl & Rs 3397.49/qtl for Groundnut; Rs 1691.87/qtl & Rs 2215.6/qtl for Soyabean; Rs 3000.1/qtl & Rs 3679.36/qtl for Sunflower; Rs 2919.31/qtl & Rs 4133.89/qtl for Sesamum; Rs 2279.05/qtl & Rs 3628.41/qtl for Nigerseed and Rs 2484.66/qtl & Rs 3532.66/qtl for Cotton.
Drivers of Productivity
6.8 A prudent response to ever increasing costs of production lies in productivity enhancement. Chapter 5 empirically establishes the existence of an inverse relationship between yield rates and real cost of production. An attempt has been made to assess the water productivity for production of rice in various states. Punjab consumes the highest quantity of water of 5400 liters for producing one kg of rice in contrast to almost half by West Bengal at 2700 litre. It raises the issue of comparative advantage of where to propagate paddy cultivation. Punjab is most efficient in terms of land productivity of paddy, but least efficient in terms of water productivity. And if one considers the real cost of irrigation (massive power subsidy and falling water table in Punjab, which is two to three times more than in West Bengal), Punjab will become even less efficient producer of rice vis-à-vis West Bengal. It is, therefore, imperative for Punjab to diversify to demand driven crops like oilseeds and pulses which, in any case, use less water.
6.9 Gross returns over A2+FL, fertilizer consumption, irrigation ratio, monsoon rainfall are found to drive yield levels and their impact of these factors varies from crop to crop. As efficiency gaps in India’s yield levels compared to those of benchmark countries are quite substantial, an attempt needs to be made to study best international farming practices and adapt them to Indian conditions after factoring in agro-climatic and soil conditions.
Terms of Trade
6.10 The terms of trade between agriculture and non-agriculture, measured as the ratio of prices received by the farming community for their produce sold, and prices paid for products that are bought by peasantry, have remained somewhat stable during the last five years. The index is prepared by DES, and it shows movement marginally in favor of agriculture.
Commission’s recommendation for MSP Policy for kharif crops to be marketed in 2013-14:
6.11 Keeping all these factors in mind, the Commission recommends the following MSPs of different kharif crops:
Gross returns over A2+FL, fertilizer consumption, irrigation ratio, monsoon rainfall are found to drive yield levels

67
forPolicy
Kharif CropsPrice
Crop
sM
SP (M
arke
ting
sea
son)
Proj
ecte
d Co
sts
Dom
esti
c A
vera
ge
who
lesa
le p
rice
Inte
rnati
onal
Pri
ce
Dem
and-
Supp
lyM
SP R
ecom
men
ded
by C
ACP
A2
+FL
C2
2012
-13
2011
-12
2010
-11
201
3-14
2012
-201
3(D
ec-F
eb)
2012
-201
3(D
ec-F
eb)
Stoc
ks to
Use
Rati
oM
arke
ting
Sea
son
2013
-14
Padd
y12
50
(15.
7)10
80 (8
.0)
1000
(0.0
)96
112
3411
8013
00Ex
cess
ive
stoc
ks13
10 (4
.8)
Padd
y G
rade
A12
80 (1
5.3)
1110
(7.8
)10
30 (0
.0)
----
----
--13
45 (5
.1)
Jow
ar-H
ybri
d15
00
(53.
1)98
0 (1
1.4)
880
(4.8
)12
6916
4815
8015
55--
1500
(0
.0)
Jow
ar-M
alda
ndi
1520
(52.
0)10
00 (1
1.1)
900
(4.7
)--
----
----
1520
(0.0
)
Bajra
1175
(19.
9)98
0 (1
1.4)
880
(4.8
)76
810
0313
40--
--11
75(0
.0)
Ragi
1500
(4
2.9)
1050
(8
.8)
965
(5.5
)13
3816
8718
00--
--15
00(0
.0)
Mai
ze11
75 (1
9.9)
980
(11.
4)
880
(4.8
)86
011
1213
5016
50Lo
w13
10(1
1.5)
Tur
(Arh
ar)
3850
(4
.1)
3700
* (5
.7)
3500
*(5
2.2)
3090
3958
3275
3580
Com
fort
able
3850
(0.0
)
Moo
ng44
00 (1
0.0)
4000
*(9
.0)
3670
*(3
3.0)
3775
4759
5000
5590
Tow
ards
low
4500
(2.3
)
Ura
d43
00
(13.
2)38
00*
(11.
8)34
00*
(34.
9)31
4441
1242
2535
00Co
mfo
rtab
le43
00(0
.0)
Gro
undn
ut37
00
(37.
0)27
00
(17.
4)23
00(9
.5)
2720
3397
5050
5000
--40
00(8
.1)
Sunfl
ower
3700
(3
2.1)
2800
(1
9.1)
2350
(6.1
)30
0036
7934
2035
00--
3700
(0.0
)
Soya
bean
(B
lack
)22
00
(33.
3)16
50(1
7.9)
1400
(3.7
)16
9222
1632
0032
40--
2500
(1
3.6)
Soya
bean
(Y
ello
w)
2240
(32.
5)16
90 (1
7.4)
1440
(3.6
)--
----
----
2560
(14.
3)
Sesa
mum
4200
(2
3.5)
3400
(1
7.2)
2900
(1.8
)29
1941
3473
60--
--45
00(7
.1)
Nig
erse
ed35
00 (2
0.7)
2900
(1
8.4)
2450
(1.9
)22
7936
2834
80--
--35
00 (0
.0)
Cott
on (M
S)36
00
(28.
6)28
00
(12.
0)25
00 (0
.0)
2485
3533
4200
3600
Low
3700
(2
.8)
Cott
on (L
S)39
00
(18.
2)33
00
(10.
0)30
00 (0
.0)
----
----
--40
00
(2.6
)
Not
e: 1
. Fig
ures
in p
aren
thes
es in
dica
te in
crea
se o
ver
last
yea
r2.
Who
lesa
le p
rice
for p
addy
is a
vera
ged
over
Sta
tes
of U
P, W
B &
Pun
jab;
for j
owar
, tur
& u
rad
in M
ahar
asht
ra; f
or b
ajra
in R
ajas
than
; for
ragi
, mai
ze &
sun
flow
er in
Kar
nata
ka; m
oong
in R
ajas
than
; gr
ound
nut i
n G
ujar
at; s
oyab
ean
& n
iger
seed
in M
P; fo
r se
sam
um in
UP;
for
cott
on in
Guj
& M
ahar
asht
ra.
3. In
tern
ation
al p
rice
s ar
e ta
ken
from
USD
A fo
r Vie
t 25%
rice
and
con
vert
ed to
pad
dy u
sing
con
vers
ion
fact
or o
f 0.6
7; fr
om W
orld
Ban
k fo
r Sor
ghum
(US)
, yel
low
, f.o
.b. G
ulf;
Mai
ze (U
S), n
o. 2
, yel
low
, f.o
.b. G
ulf;
Gro
undn
uts
(US)
, she
lled
basi
s, c
.i.f.
Rott
erda
m c
onve
rted
to
nut
(with
she
ll) u
sing
con
vers
ion
fact
or 0
.66;
Soy
bean
s (U
S), c
.i.f.
Rott
erda
m; C
otlo
ok A
inde
x, m
iddl
ing
1-3/
32 in
ch, c
.i.f.
conv
erte
d to
kap
as u
sing
a c
onve
rsio
n fa
ctor
of 0
.33;
from
NA
FED
for
tur,
moo
ng &
ura
d, c
&f.
Inte
rnati
onal
pri
ces
have
bee
n co
nver
ted
assu
min
g th
e ex
chan
ge ra
te a
t 1U
S$ =
Rs 5
4
Tabl
e 6.
1: R
ecom
men
ded
MSP
s of
Kha
rif C
rops
(KM
S 20
13-1
4) a
nd th
eir
Justi
ficati
on (R
s/qt
l)

68
forPolicy
Kharif CropsPrice
(Ashok Gulati)
CHAIRMAN
(Ashok Vishandass) (Anandi Subramanian)
MEMBER MEMBER SECRETARY
25th March, 2013
6.12 The Commission feels that these recommendations would lead to better incentive structures, particularly for oilseeds, pulses and coarse cereals, which have been hitherto somewhat neglected. This would lead to diversification of the cropping patterns in line with emerging demand patterns in the economy. It would also lead to a better utilization of water resources which are becoming increasingly scarce. In case of paddy, particularly, the Commission has been conservative in recommending an increase in MSP as last year itself a major realignment of paddy prices was done by raising MSP by 15.7 percent. The MSP for paddy is now touching export parity prices and any further increase may make Indian common rice lose its export competitive edge leading to more accumulation of stocks at home. What is needed is a major overhaul in the functioning of paddy/rice markets by rationalizing taxes/bonuses, encouraging milling capacities and marketing infrastructure especially in the eastern belt. That would go a long way to help farmers realize better rewards and promote efficiency & growth within a seamless unified all India market.

69
forPolicy
Kharif CropsPrice
Annex Tables

70
forPolicy
Kharif CropsPrice

71
forPolicy
Kharif CropsPrice
Table - 2.1 All India Estimates of Area of Agricultural Commodities
(Million hectares)Crops 2005-06 2006-07 2007-08 2008-09 2009-10 2010-11 2011-12 2012-13*
Rice Kharif 39.34 39.60 39.45 40.79 37.60 38.03 40.12 38.37
Rabi 4.32 4.21 4.46 4.74 4.32 4.83 3.88 3.79
Total 43.66 43.81 43.91 45.53 41.92 42.86 44.01 42.16
Wheat 26.48 27.99 28.04 27.75 28.46 29.07 29.86 29.43
Barley 0.63 0.65 0.60 0.71 0.62 0.71 0.64 0.76
Jowar Kharif 3.76 3.74 3.50 2.89 3.24 3.07 2.62 2.41
Rabi 4.90 4.73 4.26 4.64 4.55 4.31 3.63 3.82
Total 8.67 8.47 7.76 7.53 7.79 7.38 6.25 6.23
Bajra 9.58 9.51 9.57 8.75 8.90 9.61 8.78 8.78
Maize Kharif 6.76 6.96 7.12 6.89 7.06 7.28 7.38 7.08
Rabi 0.83 0.93 1.00 1.28 1.20 1.27 1.40 1.27
Total 7.59 7.89 8.12 8.17 8.26 8.55 8.78 8.36
Ragi 1.53 1.18 1.39 1.38 1.27 1.29 1.18 1.18
Coarse Cereals
Kharif 22.70 22.39 22.62 20.83 21.31 22.15 20.75 18.62
Rabi 6.36 6.31 5.87 6.62 6.37 6.29 5.67 5.85
Total 29.06 28.71 28.49 27.45 27.68 28.43 26.42 24.47
Cereals Kharif 62.04 62.00 62.07 61.62 58.91 60.18 60.88 56.99
Rabi 37.17 38.52 38.36 39.12 39.14 40.18 39.42 39.07
Total 99.21 100.52 100.43 100.74 98.05 100.36 100.29 96.06
Tur (Arhar) 3.58 3.56 3.73 3.38 3.47 4.37 4.01 3.79
Moong 3.11 3.19 3.73 2.84 3.07 3.51 3.43 2.73
Urad 2.97 3.07 3.19 2.67 2.96 3.26 3.30 3.26
Gram 6.90 7.49 7.54 7.89 8.17 9.19 8.30 8.93
Pulses Kharif 10.68 10.68 11.49 9.81 10.58 12.32 11.19 9.64
Rabi 11.68 12.52 12.14 12.29 12.70 14.08 13.27 14.22
Total 22.36 23.19 23.63 22.09 23.28 26.40 24.46 23.86
Foodgrains Kharif 72.72 72.67 73.56 71.43 69.49 72.50 72.07 66.63
Rabi 48.85 51.04 50.51 51.40 51.84 54.27 52.69 53.29
Total 121.57 123.71 124.07 122.83 121.33 126.76 124.75 119.92
Groundnut Kharif 5.74 4.78 5.31 5.29 4.62 4.98 4.32 3.82
Rabi 1.00 0.83 0.98 0.88 0.86 0.88 0.95 1.04
Total 6.74 5.61 6.29 6.16 5.48 5.86 5.26 4.87
Soyabean 7.71 8.33 8.88 9.51 9.73 9.60 10.11 10.63
Sunflower Kharif 0.92 0.86 0.76 0.66 0.57 0.32 0.26 0.32
Rabi 1.42 1.30 1.15 1.15 0.91 0.61 0.47 0.56
Total 2.34 2.16 1.91 1.81 1.48 0.93 0.73 0.87
Sesamum 1.72 1.70 1.80 1.81 1.94 2.08 1.90 1.70
Nigerseed 0.41 0.47 0.41 0.39 0.38 0.37 0.36 0.29
R&M 7.28 6.79 5.83 6.30 5.59 6.90 5.89 6.20
Safflower 0.36 0.38 0.32 0.29 0.29 0.24 0.25 0.16
Nine Oilseeds
Kharif 17.37 16.77 17.95 18.53 17.97 18.23 18.42 18.06
Rabi 10.49 9.74 8.74 9.03 7.99 9.00 7.89 8.26
Total 27.86 26.51 26.69 27.56 25.96 27.22 26.31 26.32
Cotton 8.68 9.14 9.41 9.41 10.13 11.24 12.18 11.77
Jute 0.76 0.79 0.81 0.79 0.81 0.77 0.81 0.77
Mesta 0.14 0.14 0.15 0.12 0.09 0.10 0.10 0.09
Jute & Mesta
0.90 0.94 0.96 0.90 0.91 0.87 0.90 0.86
Sugarcane 4.20 5.15 5.06 4.42 4.17 4.88 4.04 5.06 (Contd..)
Source : Directorate of Economics & Statistics, Ministry of Agriculture.

72
forPolicy
Kharif CropsPrice
Table - 2.1 All India Estimates of Production of Agricultural Commodities
(Million tonnes)
Crops 2005-06 2006-07 2007-08 2008-09 2009-10 2010-11 2011-12 2012-13*Rice Kharif 78.27 80.17 82.66 84.91 75.92 80.65 92.75 90.69
Rabi 13.52 13.18 14.03 14.27 13.18 15.33 12.56 11.11Total 91.79 93.35 96.69 99.18 89.09 95.98 105.31 101.80
Wheat 69.35 75.81 78.57 80.68 80.80 86.87 94.88 92.30Barley 1.22 0.65 1.20 1.69 1.35 1.66 1.62 1.82Jowar Kharif 4.07 3.71 4.12 3.05 2.76 3.44 3.32 2.58
Rabi 3.56 3.44 3.81 4.19 3.94 3.56 2.69 2.68Total 7.63 7.15 7.93 7.25 6.70 7.00 6.01 5.26
Bajra 7.68 8.42 9.97 8.89 6.51 10.37 10.28 8.15Maize Kharif 12.16 11.56 15.11 14.12 12.29 16.64 16.49 15.59
Rabi 2.55 3.54 3.85 5.61 4.43 5.09 5.27 5.46Total 14.71 15.10 18.96 19.73 16.72 21.73 21.76 21.06
Ragi 2.35 1.18 2.15 2.04 1.89 2.19 1.93 1.78Coarse Cereals
Kharif 26.74 25.61 31.89 28.54 23.83 33.37 32.46 28.51
Rabi 7.33 8.31 8.86 11.49 9.72 10.32 9.58 9.96
Total 34.07 33.92 40.75 40.04 33.55 43.68 42.04 38.47Cereals Kharif 105.01 105.78 114.55 113.45 99.75 11.40 125.21 119.19
Rabi 90.21 97.30 101.46 106.45 103.70 112.52 117.02 113.37Total 195.22 203.08 216.01 219.90 203.45 123.92 242.23 232.57
Tur (Arhar) 2.74 2.31 3.08 2.27 2.46 2.86 2.65 2.75Moong 0.95 1.12 1.52 1.03 0.69 1.80 1.71 1.27Urad 1.25 1.44 1.46 1.17 1.23 1.77 1.83 1.74Gram 5.58 6.33 5.75 7.06 7.48 8.22 7.70 8.57Pulses Kharif 4.86 4.80 6.40 4.69 4.20 7.12 6.06 5.48
Rabi 8.50 9.40 8.36 9.88 10.46 11.12 11.03 12.09Total 13.36 14.20 14.76 14.57 14.66 18.24 17.09 17.58
Foodgrains Kharif 109.87 110.57 120.96 118.14 103.95 121.14 131.27 124.68Rabi 98.70 106.71 109.82 116.33 114.16 123.64 128.05 125.47Total 208.58 217.28 230.78 234.47 218.11 244.78 259.32 250.14
Groundnut Kharif 6.30 3.29 7.36 5.62 3.85 6.64 5.13 3.77Rabi 1.70 1.57 1.82 1.55 1.58 1.62 1.84 2.01Total 7.99 4.86 9.18 7.17 5.43 8.26 6.96 5.78
Soyabean 8.27 8.85 10.97 9.91 9.96 12.74 12.21 12.96Sunflower Kharif 0.46 0.37 0.46 0.36 0.21 0.19 0.15 0.17
Rabi 0.98 0.86 1.00 0.80 0.64 0.46 0.37 0.41Total 1.44 1.23 1.46 1.16 0.85 0.65 0.52 0.58
Sesamum 0.64 0.62 0.76 0.64 0.59 0.89 0.81 0.75Nigerseed 0.11 0.12 0.11 0.12 0.10 0.11 0.10 0.08R&M 8.13 7.44 5.83 7.20 6.61 8.18 6.60 7.36Safflower 0.23 0.24 0.22 0.19 0.18 0.15 0.15 0.09Nine Oilseeds
Kharif 16.77 14.01 20.71 17.81 15.73 21.92 20.69 19.45Rabi 11.21 10.28 9.04 9.91 9.15 10.56 9.11 10.01Total 27.98 24.29 29.76 27.72 24.88 32.48 29.80 29.47
Cotton$$ 18.50 22.63 25.88 22.28 24.02 33.00 35.20 33.80Jute## 9.97 10.32 10.22 9.63 11.23 10.01 10.74 10.56Mesta## 0.87 0.96 0.99 0.73 0.59 0.61 0.66 0.57Jute & Mesta##
10.84 11.27 11.21 10.37 11.82 10.62 11.40 11.13
Sugarcane 281.17 355.52 348.19 285.03 292.30 342.38 361.04 334.54
(Contd..)
$ $ : E&S estmates of million bales of 170 kgs each. Source : Directorate of Economics & Statistics, Ministry of Agriculture.

73
forPolicy
Kharif CropsPrice
Table - 2.1 All India Estimates of Yield of Agricultural Commodities (Concluded)
(Kgs per hectare)Crops 2005-06 2006-07 2007-08 2008-09 2009-10 2010-11 2011-12 2012-13*Rice Kharif 1990 2024 2095 2081 2019 2121 2312 2363
Rabi 3127 3129 3146 3011 3053 3174 3235 2934Total 2102 2131 2202 2178 2125 2239 2393 2415
Wheat 2619 2708 2802 2907 2839 2989 3177 3136Barley 1938 1006 2000 2394 2172 2357 2517 2405Jowar Kharif 1082 992 1177 1055 853 1119 1267 1070
Rabi 726 727 894 904 865 827 741 701Total 880 844 1021 962 860 949 962 844
Bajra 802 886 1042 1015 731 1079 1171 928Maize Kharif 1799 1661 2123 2048 1740 2285 2234 2201
Rabi 3076 3792 3855 4387 3694 4003 3765 4287Total 1938 1913 2336 2414 2024 2540 2478 2519
Ragi 1534 1002 1550 1477 1489 1705 1641 1514Coarse Cereals
Kharif 1178 1144 1410 1371 1119 1507 1564 1531
Rabi 1152 1316 1511 1735 1525 1641 1689 1702Total 1172 1182 1431 1459 1212 1536 1591 1572
Cereals Kharif 1693 1706 1845 1841 1693 189 2057 2092
Rabi 2427 2526 2645 2721 2649 2800 2969 2902Total 1968 2020 2151 2183 2075 1235 2415 2421
Tur (Arhar) 765 649 827 671 713 655 662 724Moong 304 351 364 360 225 513 498 465Urad 419 470 440 427 418 543 555 535Gram 808 845 763 895 915 895 928 960Pulses Kharif 456 450 557 478 397 578 541 569
Rabi 727 751 689 804 823 790 831 850Total 597 612 625 659 630 691 699 737
Foodgrains Kharif 1511 1522 1644 1654 1496 1671 1822 1871Rabi 2020 2091 2174 2263 2202 2278 2430 2354Total 1716 1756 1860 1909 1798 1931 2079 2086
Groundnut Kharif 1097 689 1386 1063 835 1335 1188 985Rabi 1702 1879 1857 1764 1830 1846 1938 1929
Total 1187 866 1459 1163 991 1411 1323 1188
Soyabean 1073 1063 1235 1041 1024 1327 1208 1219
Sunflower Kharif 496 426 605 540 378 608 566 544
Rabi 692 661 870 696 697 748 783 736Total 615 567 764 639 574 701 706 667
Sesamum 372 363 422 354 303 429 426 439Nigerseed 261 258 268 297 266 290 269 290R&M 1117 1095 1000 1143 1183 1185 1121 1188Safflower 627 637 688 642 621 617 580 553Nine Oilseeds
Kharif 965 836 1154 961 875 1203 1123 1077Rabi 1068 1055 1034 1097 1146 1174 1155 1213Total 1004 916 1115 1006 958 1193 1133 1120
Cotton 362 421 468 403 403 499 491 488Jute 2362 2342 2271 2207 2492 2329 2389 2456Mesta 1136 1212 1188 1141 1122 1115 1248 1180Jute & Mesta 2176 2159 2102 2071 2349 2192 2268 2327Sugarcane 66930 69033 68812 64553 70021 70091 89416 66082* : Second Advance EstimatesSource : Directorate of Economics & Statistics, Ministry of Agriculture.

74
forPolicy
Kharif CropsPrice
Tabl
e - 2
.2
Ava
ilabi
lity
of K
hari
f Cro
psA
: Ric
e A
vaila
bilit
y an
d U
se
B: W
heat
Ava
ilabi
lity
and
Use
(in m
illio
n to
nnes
)(in
mill
ion
tonn
es)
20
09-1
020
10-1
120
11-1
220
12-1
320
09-1
020
10-1
120
11-1
220
12-1
3
Begi
nnin
g St
ock
^19
.62
24.2
726
.86
30.7
1Be
ginn
ing
Stoc
k ^
13.4
316
.13
15.3
619
.95
Prod
uctio
n #
89.0
995
.98
105.
3110
1.80
Prod
uctio
n #
80.6
880
.80
86.8
794
.88
Impo
rts
0.00
0.00
0.00
0.00
Impo
rts
0.22
0.27
0.03
0.00
Tota
l Sup
ply
108.
7112
0.25
132.
1713
2.51
Tota
l Sup
ply
94.3
397
.20
102.
2611
4.83
Expo
rts
2.10
2.80
8.50
7.00
Expo
rts
0.06
0.07
0.75
4.00
Cons
umpti
on83
.90
91.2
793
.18
93.5
0Co
nsum
ption
78.1
481
.76
81.5
681
.85
Tota
l Use
86.0
094
.07
101.
6810
0.50
Tota
l Use
78.2
081
.83
82.3
185
.85
Endi
ng S
tock
22.7
226
.19
30.4
932
.01
Endi
ng S
tock
16.1
315
.36
19.9
528
.98
Stoc
k to
Use
Rati
o (%
)26
.41
27.8
429
.99
31.8
5St
ock
to U
se R
atio
(%)
20.6
218
.78
24.2
433
.76
Not
es: #
: Pr
oduc
tion
figur
es a
re fr
om D
AC; f
or 2
012-
13 a
s pe
r 2n
d A
dvan
ce E
stim
ates
^ :
Begi
nnin
g st
ock
(Ist J
uly)
is a
s pe
r D
eptt
. of F
ood
& P
D
Sour
ces
: NCA
ER, D
AC, F
ood
Bulle
tin
C: M
aize
Ava
ilabi
lity
and
Use
D: T
ur/A
rhar
Ava
ilabi
lity
and
Use
(in m
illio
n to
nnes
)(in
mill
ion
tonn
es)
20
09-1
020
10-1
120
11-1
220
12-1
3
2009
-10
2010
-11
2011
-12
2012
-13
Begi
nnin
g St
ock
^0.
750.
450.
601.
13O
peni
ng S
tock
s 0.
100.
150.
560.
68
Prod
uctio
n #
16.7
221
.73
21.7
621
.06
Prod
uctio
n #
2.46
2.86
2.65
2.75
Impo
rts
0.00
0.00
0.00
0.00
Impo
rts
0.39
0.35
0.47
0.28
Tota
l Sup
ply
17.4
722
.18
22.3
622
.19
Tota
l Sup
ply
2.95
3.36
3.68
3.71
Expo
rts
1.90
2.80
3.00
2.50
Expo
rts
0.00
0.00
0.00
0.00
Cons
umpti
on15
.12
18.7
818
.23
19.1
4Co
nsum
ption
2.80
2.80
3.00
2.80
Tota
l Use
17.0
221
.58
21.2
321
.64
Tota
l Use
2.80
2.80
3.00
2.80
Endi
ng S
tock
0.45
0.60
1.13
0.55
Endi
ng S
tock
0.15
0.56
0.68
0.91
Stoc
k to
Use
Rati
o (%
)2.
642.
785.
322.
53St
ock
to U
se R
atio
(%)
5.36
20.0
022
.67
32.5
0
Not
es: #
: Pr
oduc
tion
figur
es a
re fr
om D
AC; f
or 2
012-
13 a
s pe
r 2n
d A
dvan
ce E
stim
ates
Not
es: #
: Pr
oduc
tion
figur
es a
re fr
om D
AC; f
or 2
012-
13 a
s pe
r 2n
d A
dvan
ce E
stim
ates
; ^
2012
-13
figur
es a
re u
p to
Set
embe
r 20
12 ^
: Be
ginn
ing
stoc
k is
as
per
NCA
ER
Sour
ces
: NCA
ER, D
ACSo
urce
s : D
AC, D
GCI
S, IP
GA

75
forPolicy
Kharif CropsPrice
E: U
rad
& M
oong
Ava
ilabi
lity
and
Use
(in m
illio
n to
nnes
)F:
Tur
/Arh
ar A
vaila
bilit
y an
d U
se(in
mill
ion
tonn
es)
20
09-1
020
10-1
120
11-1
220
12-1
3
2009
-10
2010
-11
2011
-12
2012
-13
Ope
ning
Sto
cks
0.22
0.28
0.97
1.30
Ope
ning
Sto
cks
0.10
0.01
0.27
0.23
Prod
uctio
n #
1.93
3.56
3.40
3.01
Prod
uctio
n 2.
462.
862.
712.
40
Impo
rts
0.71
0.43
0.43
0.29
Impo
rts
0.25
0.20
0.25
0.20
Tota
l Sup
ply
2.86
4.27
4.80
4.60
Tota
l Sup
ply
2.81
3.07
3.23
2.83
Expo
rts
0.00
0.00
0.00
0.00
Expo
rts
0.00
0.00
0.00
0.00
Cons
umpti
on2.
583.
303.
503.
50Co
nsum
ption
2.80
2.80
3.00
2.80
Tota
l Use
2.58
3.30
3.50
3.50
Tota
l Use
2.80
2.80
3.00
2.80
Endi
ng S
tock
0.28
0.97
1.30
1.10
Endi
ng S
tock
0.01
0.27
0.23
0.03
Stoc
k to
Use
Rati
o (%
)10
.85
29.3
937
.14
31.4
3St
ock
to U
se R
atio
(%)
0.36
9.64
7.67
1.07
Not
es: #
: Pr
oduc
tion
figur
es a
re fr
om D
AC, f
or 2
012-
13 a
s pe
r 2n
d A
dvan
ce E
stim
ates
; Im
port
figu
res
from
DG
CIS;
Ope
ning
sto
ck o
f 200
9-10
from
IPG
A
Sour
ces
: Ind
ia P
ulse
s &
Gra
ins
Ass
ocia
tion
(IPG
A)
Sour
ces
: DAC
, DG
CIS,
IPG
A
G: U
rad
Ava
ilabi
lity
and
Use
(in m
illio
n to
nnes
)H
: Moo
ng A
vaila
bilit
y an
d U
se(in
mill
ion
tonn
es)
20
09-1
020
10-1
120
11-1
220
12-1
320
09-1
020
10-1
120
11-1
220
12-1
3
Ope
ning
Sto
cks
0.06
0.11
0.47
0.63
Ope
ning
Sto
cks
0.16
0.07
0.42
0.44
Prod
uctio
n1.
231.
761.
811.
60Pr
oduc
tion
0.69
1.80
1.57
1.25
Impo
rts
0.47
0.40
0.25
0.20
Impo
rts
0.15
0.05
0.05
0.15
Tota
l Sup
ply
1.76
2.27
2.53
2.43
Tota
l Sup
ply
1.00
1.92
2.04
1.84
Expo
rts
0.00
0.00
0.00
0.00
Expo
rts
0.00
0.00
0.00
0.00
Cons
umpti
on1.
651.
801.
901.
90Co
nsum
ption
0.93
1.50
1.60
1.60
Tota
l Use
1.65
1.80
1.90
1.90
Tota
l Use
0.93
1.50
1.60
1.60
Endi
ng S
tock
0.11
0.47
0.63
0.53
Endi
ng S
tock
0.07
0.42
0.44
0.24
Stoc
k to
Use
Rati
o (%
)6.
6726
.11
33.1
627
.89
Stoc
k to
Use
Rati
o (%
)7.
5328
.00
27.5
015
.00
Sour
ces
: Ind
ia P
ulse
s &
Gra
ins
Ass
ocia
tion
(IPG
A)
Not
e : F
igur
es fo
r ta
ble
E m
ay n
ot c
orre
spon
d w
ith ta
ble
G a
nd H
as
they
are
from
Diff
eren
t sou
rces
.So
urce
s : I
ndia
Pul
ses
& G
rain
s A
ssoc
iatio
n (IP
GA
)
Ava
ilabi
lity
of K
hari
f Cro
ps
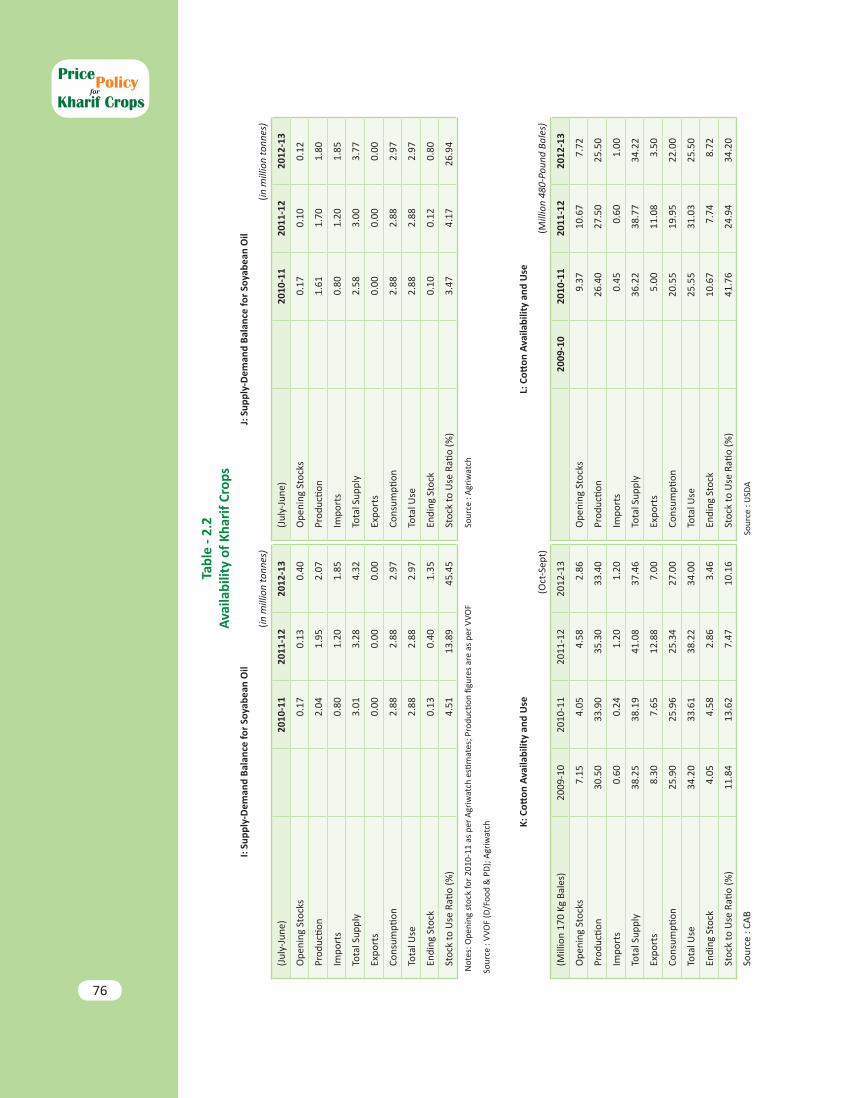
76
forPolicy
Kharif CropsPrice
Tabl
e - 2
.2
Ava
ilabi
lity
of K
hari
f Cro
psI:
Supp
ly-D
eman
d Ba
lanc
e fo
r So
yabe
an O
ilJ:
Sup
ply-
Dem
and
Bala
nce
for
Soya
bean
Oil
(in
mill
ion
tonn
es)
(in
mill
ion
tonn
es)
(Jul
y-Ju
ne)
20
10-1
120
11-1
220
12-1
3(J
uly-
June
)
2010
-11
2011
-12
2012
-13
Ope
ning
Sto
cks
0.17
0.13
0.40
Ope
ning
Sto
cks
0.17
0.10
0.12
Prod
uctio
n 2.
041.
952.
07Pr
oduc
tion
1.61
1.70
1.80
Impo
rts
0.80
1.20
1.85
Impo
rts
0.80
1.20
1.85
Tota
l Sup
ply
3.01
3.28
4.32
Tota
l Sup
ply
2.58
3.00
3.77
Expo
rts
0.00
0.00
0.00
Expo
rts
0.00
0.00
0.00
Cons
umpti
on2.
882.
882.
97Co
nsum
ption
2.88
2.88
2.97
Tota
l Use
2.88
2.88
2.97
Tota
l Use
2.88
2.88
2.97
Endi
ng S
tock
0.13
0.40
1.35
Endi
ng S
tock
0.10
0.12
0.80
Stoc
k to
Use
Rati
o (%
)4.
5113
.89
45.4
5St
ock
to U
se R
atio
(%)
3.47
4.17
26.9
4
Not
es: O
peni
ng s
tock
for
2010
-11
as p
er A
griw
atch
esti
mat
es; P
rodu
ction
figu
res
are
as p
er V
VOF
Sour
ce :
Agr
iwat
ch
Sour
ce :
VVO
F (D
/Foo
d &
PD
); A
griw
atch
K: C
otton
Ava
ilabi
lity
and
Use
L:
Cott
on A
vaila
bilit
y an
d U
se
(Oct
-Sep
t) (
Mill
ion
480-
Poun
d Ba
les)
(Mill
ion
170
Kg B
ales
)20
09-1
020
10-1
120
11-1
220
12-1
3
2009
-10
2010
-11
2011
-12
2012
-13
Ope
ning
Sto
cks
7.15
4.05
4.58
2.86
Ope
ning
Sto
cks
9.37
10.6
77.
72
Prod
uctio
n 30
.50
33.9
035
.30
33.4
0Pr
oduc
tion
26.4
027
.50
25.5
0
Impo
rts
0.60
0.24
1.20
1.20
Impo
rts
0.45
0.60
1.00
Tota
l Sup
ply
38.2
538
.19
41.0
837
.46
Tota
l Sup
ply
36.2
238
.77
34.2
2
Expo
rts
8.30
7.65
12.8
87.
00Ex
port
s5.
0011
.08
3.50
Cons
umpti
on25
.90
25.9
625
.34
27.0
0Co
nsum
ption
20.5
519
.95
22.0
0
Tota
l Use
34.2
033
.61
38.2
234
.00
Tota
l Use
25.5
531
.03
25.5
0
Endi
ng S
tock
4.05
4.58
2.86
3.46
Endi
ng S
tock
10.6
77.
748.
72
Stoc
k to
Use
Rati
o (%
)11
.84
13.6
27.
4710
.16
Stoc
k to
Use
Rati
o (%
)41
.76
24.9
434
.20
Sour
ce :
CAB
Sour
ce :
USD
A

77
forPolicy
Kharif CropsPrice
Tabl
e 2.
3
NAT
URE
& D
EGRE
E O
F M
ARK
ET D
ISTO
RTIO
NS
- Pad
dy &
Ric
eSl
N
oSt
ate
Taxe
s/Le
vies
(as
% o
f MSP
)
Rank
Bonu
s#Ra
nkPr
oc a
s %
shar
e in
pro
d
Rank
Stoc
k Li
mits
(t
onne
s)St
ock
Lim
its S
core
Rank
Levy
O
n Ri
ce
Rank
No.
of V
ital
Mar
ket
Refo
rms
not d
one
out o
f 7
Rank
Aver
age
Rank
(col
4+
6+8+
14+
16+1
8)/6
Fina
l Ra
nks
On
Rice
O
n Pa
ddy
O
f Ric
e
On
Padd
yO
n Ri
cePa
ddy
((1/W
)+(1
/R))
Rice
((1
/W)+
(1/R
))To
tal
(col
s 11
+12)
12
34
56
78
910
1112
1314
1516
1718
1920
1AN
DHRA
PR
ADES
H13
.517
01
35.5
413
W -
75 ;
R-15
0^
0.08
0.00
0.08
1775
142
711
.517
2AS
SAM
01
01
0.14
10
00.
000.
000.
001
507
27
3.0
2
3BI
HAR
6.5
110
113
.19
90
00.
000.
000.
001
507
01
5.0
4
4CH
HATT
ISGA
RH9.
714
270
1776
.80
180
00.
000.
000.
001
507
412
11.5
18
5GU
JARA
T0.
5*1
01
0.01
10
00.
000.
000.
001
01
14
1.5
1
6HA
RYAN
A11
.515
01
68.3
616
00
0.00
0.00
0.00
175
146
1510
.315
7HI
MAC
HAL
PD5
90
10.
681
00
0.00
0.00
0.00
150
71
43.
83
8JH
ARKH
AND
3.5
80
13.
295
W -
100
W -
100
0.01
0.01
0.02
1550
72
77.
210
9KA
RNAT
AKA
1.5
625
016
1.39
40
00.
000.
000.
001
33.3
62
76.
76
10KE
RALA
14
450
1817
.84
110
00.
000.
000.
001
01
01
6.0
5
11M
ADHY
A PD
.4.
79
100
(Com
); 10
0 (G
r A)
1536
.41
140
00.
000.
000.
001
304
412
9.2
12
12M
AHAR
ASHT
RA1.
054
01
5.57
6W
- 20
0-35
0; R
- 1
0-20
W -
200-
350;
R
- 10-
20
0.11
0.11
0.21
1830
42
76.
77
13O
DISH
A12
160
133
.40
120
00.
000.
000.
001
7514
615
9.8
14
14PU
NJA
B14
.518
01
75.7
717
00
0.00
0.00
0.00
175
145
1410
.816
15TA
MIL
NA
DU
01
50
(Com
); 70
(Gr
A)
146.
637
0W
- 20
0; R
- 4
0
0.00
0.03
0.03
160
10
16.
78
16U
TTA
R PD
.8.
513
01
14.0
910
00
0.00
0.00
0.00
160
137
179.
213
17U
TTA
RAKH
AN
D7.
512
01
63.6
115
00
0.00
0.00
0.00
175
141
47.
811
18W
EST
BEN
GA
L3
70
17.
448
00
0.00
0.00
0.00
150
77
176.
89
Not
es: #
- Te
rmed
‘pro
ducti
on in
centi
ve’ i
n Ta
mil
Nad
u; ^
- St
ocki
ng li
mit
for
rice
in A
ndhr
a Pr
ades
h is
fixe
d on
ly fo
r ri
ce m
ills
and
not o
n w
hole
sale
rs a
nd re
taile
rs, h
ence
take
n as
zer
o; W
- W
hole
sale
r, R
- Ret
aile
r* -
In G
ujar
at th
e m
arke
t fee
var
ies
amon
g di
stri
cts
in th
e ra
nge
of 0
-1%
; the
ave
rage
mar
ket f
ee ra
te h
as b
een
take
n; .
Sour
ces:
FCI
, DAC
, DCA
Det
ail g
iven
an
expl
anat
ory
Not
e

78
forPolicy
Kharif CropsPrice
Explanatory Note Methodology of Ranking of States by the Nature and Degree of Distortions in Paddy/Rice
Market
1 Since the exercise is confined to paddy/rice, only those states that provided cost data for paddy under the CS scheme were selected. These are 18 states namely, Andhra Pradesh, Assam, Bihar, Chhattisgarh, Gujarat, Haryana, Himachal Pradesh, Jharkhand, Karnataka, Kerala, Madhya Pradesh, Maharashtra, Orissa, Punjab, Tamil Nadu, Uttar Pradesh, Uttarakhand and West Bengal.
2 States’ policies that impacted on paddy/rice markets were classified into the following six parameters:
Taxes/cesses charged (as percent of MSP) on rice by states; (i) Additional bonus on paddy announced by states; (ii) Rice procured by states (as percent of rice production); (iii) Stock limits fixed by states on rice and paddy; (iv) Levy rice imposed by states (as per cent of rice milled by millers) and (v) Extent of market reforms carried out by states (APMC Act). (vi)
3 In the case of market reforms, there are seven areas of vital areas which have been identified under the model APMC Act, 2003, that was formulated by the Ministry of Agriculture. These are:
Establishment of private market yards/private markets managed by a (i) person other than a Market Committee.Establishment of private yards and direct purchase of agricultural produce (ii) from agriculturist by a person other than a Market Committee (Direct purchasing from producer).Single registration / license for trade transaction in more than one (iii) market.Provision of Contract Farming.(iv) Promote and encourage e-trading.(v) Single point levy of market fee.(vi)
Establishment of consumer/farmers market by a person other than (vii) Market Committee (Direct Sale by the producer to the consumers).
4 Data on each of the parameters relate to 2012-13; while procurement figures are up to 12.3.2013, market reforms are as of 28.2.2013. Data was obtained from FCI, DCA and DAC.
5 In the case of all parameters, except stock limits, a lower figure was indicative of lesser distortion and a ‘freer’ market. Thus states that charged no taxes/cesses, or imposed no bonuses or levy on rice were given a ranking of one. Again states whose rice procurement as a percentage of their respective rice production was lower got a better ranking, as it signified greater degree of freedom for private trade to operate.

79
forPolicy
Kharif CropsPrice
6 However, in the case of stock limits, a lower stock limit imposed actually implied greater market control and therefore the inverse of stock limit was taken. Stock limits are imposed on mills, wholesalers and retailers by only 4 of the 18 states. Stock limits imposed on mills was not considered since it varied in accordance with the installed capacity of the mills, and further as in the case of Maharashtra could not be quantified. Hence the stock limits fixed for wholesalers and retailers only were considered. For example, in the case of Andhra Pradesh, the wholesaler limit was 75 tonnes and retailers 15 tonnes in case of paddy. The paddy stock limit was then derived by adding the inverse ratios of the stock limits on both wholesalers and retailers, that is [(1/75)+(1/15)]=0.08. Similarly the stock limit figure for rice was obtained. The two were then added to obtain the total stock limit on paddy and rice for the state, which was then ranked. States that had fixed no stock limits were given the first rank.
7 In the case of market reforms, states were ranked on the basis of the number of vital reforms out of the seven that were still needed to be carried out. Thus states like Bihar, which had repealed the APMC Act with effect from 1.9.2006, Kerala, which had no APMC Act, and Tamil Nadu, which had carried out all areas of reform, got zero scores and were given a ranking of one as their markets were ‘free’. Market reforms are generally not commodity specific; except in Odisha, which had excluded paddy/rice under the first market reform, listed under para 3 (i) above. Hence this was considered as a reform that was required to be done for paddy/rice by Odisha and accordingly ranked. In Punjab, partial reforms were carried out with respect to market reforms (ii) and (vii) listed above, as only enabling provisions had been provided and hence was accordingly ranked.
8 A simple ranking was done of the 18 states on each of the six parameters. States were ranked from 1 to 18 with the first rank denoting the best. The Standard competition ranking method was used. Under this, states that tied were assigned the same rank, with the next ranking(s) skipped. So, if there were 3 states at rank 2, the next rank listed would be ranked 5. A simple average of the ranks for each state was then calculated. The states were then grouped in to 3 bands – Band 1-5 denoting the top five (green) states; Band 6-10 indicating the next five (amber) states; and Band 11-18 including the bottom eight (red) states. This exercise reveals the relative status of each state with respect to the level of ‘market friendly’ policies adopted. The average of ranks was then calculated to get the final ranking of the states. In cases where states had equal ranks, the state that fared better on carrying out market reforms got precedence and was given higher ranking; in case where states were tied on that score also, such as Karnataka and Maharashtra, the state with better ranking on any other parameter was ranked higher. Thus according to this exercise Gujarat was most market friendly and Chhattisgarh, the most distorted state with respect to paddy/rice market in India.

80
forPolicy
Kharif CropsPrice
Table 2.4(a) States/Centres where prices of kharif crops dipped below MSP
during 2012-2013 marketing season (Rs per quintal)
State Centre MSP Oct Nov Dec Jan FebPaddy 1250
Andhra Pd. Cuddaph 1022 1128
Krishna 1110 1168 1186 1228
Nellore 1114 1142 1139
Srikakulam 1206 1180
Assam Bangaigaon 931 1025Barpeta 980 1031 897 1100Darrang 957 895 918 954Dibrugarh 890 800 800 750 750Nagaon 971 916 858 991
Bihar Aarah 1160 1150Buxur 1155 1150 1200Darbhanga 1140 1130 1175Jainagar 1140 1100 1150Sasaram 1155 1165 1185
Chhattisgarh Bastar 1065 1149 1208 1226Bilaspur 1159 1199 1233Kanker 1007 1162 1198 1190Kawardha 1214 1152 1144 1158Mahasamund 1108 1224 1237
Chattisgarh Bilaspur 1135 1155 1170Jagdalpur 950 855 950 1050 925
Jharkhand Deogarh 1088 1099 1090 1101Gumla 965 956 963 975Jamtara 1078 1070 1086 1053Pakur 1012 1015
Karnataka Bangalore 1219 1090Dharwad 1081 1086 1200Hassan 1107 1094 1213Madikeri 1093 1052 1212
Madhya Pd. Damoh 1031 1179 1224Katni 1007 1012 1034 1123Balaghat 1150 1150 1150 1150 1150Waraseoni 1100 1100 1150 1150 1150
Maharashtra Gondia 1200 1150 1100Latur 1011 1011 977 958Nandurbar 933 1165Osmanabad 1031 1029 1086 1066Thane 1011 1149 991
Odisha Balasore 1022 1138 1184Dhenkanal 1080 1189Jajpur 1108 1195Jharsuguda 1080 1147Rayagada 1080 1158
Uttar Pd. Azamgarh 1084 1075 1071 1062Balrampur 1076 1073 1082 1132 1140Bareilly 1059 1093 1087 1125 1150Gorakhpur 1060 1058 1070 1070 1125Shahjahanpur 1021 1013 1078 1115 1190
West Bengal Birbhum 1076 1099 1042 1113Burdwan 1167 1208 1207 1236Coochbehar 1142 1103 1134 1113
Jhantipari 1080 1130 1060 1060 1100 Midnapore(E) 1083 1081 1068 1028
(Contd..)

81
forPolicy
Kharif CropsPrice
Table 2.4(a) States/Centres where prices of kharif crops dipped below MSP
during 2012-2013 marketing season (Rs per quintal)
State Centre MSP Oct Nov Dec Jan Feb
Jowar 1500
Andhra Pd. Guntur 1400 1400
Nandyal 1400 1400 1450
Gujarat Patan 1335 1362
Karnataka Dharwad 1250 1300 1110 1200 1475
Bellary 1246 1277 1229 1272 1274
Gokak 1040 1290 1300
Madhya Pd. Bhopal 1235 1265 1300 1251 1280
Chhindwara 900 900 1000
Maharashtra Akola 1200 1200 1300 1200 1200
Amarawati 1200 1300 1200 1200 1200
Chalisgaon 1050 1200 1200
Nanded 1050 1200 1250 1250 1200
Rajasthan Jaipur 1400 1400
Bikaner 1340 1400
Uttar Pd. Bahraich 1070 1060 1050 1035 1060
Kanpur 1240 1145 1140 1240
Varanasi 980 1020 1060
Bajra 1175
Gujarat Patan 1112
Deesa 1140
Jamnagar 1165
Haryana Hissar 1100
Karnataka Bijapur 1135
Gulbarga 1135
Madhya Pd. Morena 905 1000
Maharashtra Dhule 1100
Pachora 1100
Rajasthan Alwar 1130
Jaipur 1080
Jodhpur 1100
Tonk 1080 1140
Uttar Pd. Agra 1060 1070 1075 1100
Chandausi 1095 1130 1130
Hathras 980 1150
Jaswatnagar 1045 1100 1115
Varanasi 990 1025 1065
Maize 1175
Assam Tezpur 1000
Tihu 1000
Karnataka Mandla 1080 950
Jamkandi 1000
Punjab Patiala 1000 1000 1000 1000 1000
Uttar Pd. Bahraich 1165
Ragi 1500
Odisha Ganjam 1180 1180 1180 1180 1180
Berhampur 1180 1180 1180 1180 1180
Karnataka Hassan 1100
(Contd..)

82
forPolicy
Kharif CropsPrice
Table 2.4(a) States/Centres where prices of kharif crops dipped below MSP during 2012-2013
marketing season (Rs per quintal)
State Centre MSP Oct Nov Dec Jan FebTur 3850Andhra Pd. Vijayawada 3500 3800 3800
Karnataka Gulbarga 3615 3561 3575
Madhya Pd. Bhopal 3500 3100 3400 3350
Sagar 3600 3500Maharashtra Akola 3800 3500 3650 3800
Bhusaval 2600 3000 3000 2700
Uttar Pd. Hapur 3500 3300 3450 3600
Moong 4400
Andhra Pd. Suryapeta 4317
Karnataka Gadag 4395 3800 4310
Madhya Pd. Bhopal 3700 3550 3550 3650Sagar 3000 3500
Maharashtra Akola 3700Bhusaval 3200 3400 3100
Uttar Pd. Hapur 4200 4200Urad 4300Andhra Pd. Suryapeta NR 3309
Vijayawada 3600 3500 3600
Vizianagaram 3100 3100
Gujarat Patan 3100 3165
Karnataka Gulbarga 3163 3134 3302 3206
Madhya Pd. Bhopal 2800 2600 2801 2800
Sagar 3000 3500
Maharashtra Bhusaval 4200 3700 3550 3000
Mumbai
Tamil Nadu Virdhunagar 3700 3700 4000 3900
Uttar Pd. Hapur 3350 3250 3350 3400
Agra 4255 4270 4010Sunflower Seed 3700Andhra Pd. Adoni 3300 3160 3000 3000
Hyderabad 3425 3400 3500Kurnool 3689 3260 3400 3420
Karnataka Gulbarga 3376 3243 3234 3501Raichur 3659 3649 3425 3444
Maharashtra Khamgaon 3250 3250Latur 3300 3500 3600
Tamil Nadu Virudhunagar 3500 3500 3500 3500Cotton 3600Gujarat Panchmahal 3127Andhra Pd. Cuddapah 3571
Krishna 3500 3000
Nizamabad 3570
Prakasam 3571 3575Srikakulam 3479Vijayanagram 3300 3200
Karnataka Raichur 3550Maharashtra Nandurbar 2498
Source : Directorate of Economics & Statistics, /Agmarknet Ministry of Agriculture
Concluded.

83
forPolicy
Kharif CropsPrice
Table 2.4 (b)States/Centres where prices of kharif crops dipped below MSP
during 2012-2013 marketing season
(Rs per quintal)
State Centre MSP Oct Nov Dec
Paddy 1250
Assam Nalbari 750-850 650-750 650-750
Golpara 700-800 700-875 800-875
Dibrugarh 850-950 800-900 850-1000
Howly 800-950 750-850 750-850
Boko 925-1050 850-1000 750-900
Gujarat Sanand 1235
Jharkhand NA 1125 1150
Bajra 1175
Gujarat Himatnagar 1113
Tur 3850
Gujarat Himatnagar 3684 3569
Dahegaon 3011 3000
Dahod 3371 3582 3661
Moong 4400
Gujarat Himatnagar 3708
Urad 4300
Gujarat Dahod 3490 3388
Himatnagar 2617 2629
Rajkot 3510 3898
Source : State Replies

84
forPolicy
Kharif CropsPrice
Table - 4.1State-wise Gross and Net returns on actual estimates of cost of cultivation of Kharif crops
(Average of 2008-09 to 2010-11)PADDY
State Cost A2+FL
(Rs./ha.)
Cost C2 (Rs./ha.)
GVO (Rs./ha.)
Gross Returns
over A2+FL
(Rs./ha)
Rate of Gross
Returns over
A2+FL (%)
Net Returns over C2 (Rs./ha)
Net Rate of Returns over C2
(%)
Andhra Pradesh 33287 50719 58862 25575 76.8 8143 16.1
Assam 16689 23100 22919 6229 37.3 -181 -0.8
Bihar 14205 19645 21170 6965 49.0 1526 7.8
Chhatisgarh 14318 21334 24299 9980 69.7 2965 13.9
Gujarat 22179 31147 49542 27363 123.4 18395 59.1
Haryana 26838 48070 68794 41957 156.3 20725 43.1
Himachal Pradesh 11412 17084 24235 12823 112.4 7151 41.9
Jharkhand 13655 18663 14114 459 3.4 -4549 -24.4
Kerala 29586 40241 52768 23183 78.4 12528 31.1
Karnataka 28849 41071 53492 24643 85.4 12422 30.2
Madhya Pradesh 14170 22741 30097 15927 112.4 7356 32.3
Maharashtra 33769 42291 33308 -461 -1.4 -8984 -21.2
Odisha 19516 28124 29506 9990 51.2 1382 4.9
Punjab 28327 49074 68559 40233 142.0 19486 39.7
Tamilnadu 33912 45945 51896 17984 53.0 5952 13.0
Uttar Pradesh 19880 30924 37798 17918 90.1 6874 22.2
Uttarakhand 18885 32868 39714 20829 110.3 6846 20.8
West Bengal 28569 38059 38507 9939 34.8 448 1.2
ALL-INDIA wt.ave 22986 33697 38741 15756 68.5 5044 15.0
MAIZE
Andhra Pradesh 27834 40865 43172 15338 55 2307 6
Bihar 15635 21612 46329 30694 196 24717 114
Chhatisgarh 6312 8713 7835 1522 24 -878 -10
Gujarat 14315 18929 23036 8721 61 4108 22
Himachal Pradesh 10846 15888 15309 4462 41 -579 -4
Karnataka 15397 22466 29037 13640 89 6571 29
Madhya Pradesh 10838 14382 11233 394 4 -3149 -22
Rajasthan 17657 23442 23974 6318 36 533 2
Tamilnadu 26486 36975 45892 19406 73 8917 24
Uttar Pradesh 15961 23003 17210 1249 8 -5794 -25
ALL-INDIA wt.ave 16816 23607 27051 10236 61 3445 15 (Contd.)

85
forPolicy
Kharif CropsPrice
Table - 4.1
State-wise Gross and Net returns on actual estimates of cost of cultivation of Kharif crops (Average of 2008-09 to 2010-11)
State Cost A2+FL (Rs./ha.)
Cost C2 (Rs./ha.)
GVO (Rs./ha.)
Gross Returns
over A2+FL (Rs./ha)
Rate of Gross
Returns over A2+FL
(%)
Net Returns over C2 (Rs./ha)
Net Rate of Returns over C2 (%)
JOWAR
Andhra Pradesh 17385 26479 28012 10628 61 1534 6
Karnataka 8946 12411 11987 3041 34 -424 -3
Maharashtra 14242 22457 23404 9162 64 946 4
Rajasthan 8134 10592 10409 2275 28 -184 -2
Tamilnadu 10180 12860 13185 3005 30 326 3
Madhya Pradesh] 10535 14412 11971 1436 14 -2442 -17
ALL-INDIA wt.ave 13364 18800 19163 5799 43 362 2
BAJRA
Gujarat 15150 20909 28898 13748 91 7990 38
Haryana 13054 20781 19747 6693 51 -1034 -5
Karnataka 7294 9332 7325 31 0.4 -2007 -22
Maharashtra 18085 24321 22677 4593 25 -1644 -7
Rajasthan 7993 11196 13043 5050 63 1847 16
Uttar Pradesh 12988 19272 17919 4932 38 -1353 -7
ALL-INDIA wt.ave 10678 15049 16360 5682 53 1312 9
RAGI
Andhra Pradesh 30883 41899 35482 4599 15 -6416 -15
Karnataka 13879 25226 19842 5963 43 -5384 -21
Tamilnadu 15813 23301 29445 13632 86 6144 26
Maharashtra 18548 35470 22420 3872 21 -13050 -37
ALL-INDIA wt.ave 14853 26746 21405 6552 44 -5341 -20
TUR
Andhra Pradesh 16708 26642 28021 11314 68 1379 5
Bihar 8403 14677 34754 26351 314 20077 137
Gujarat 15150 22043 36633 21484 142 14591 66
Karnataka 12690 19532 27525 14835 117 7994 41
Madhya Pradesh 10290 17823 25232 14942 145 7409 42
Maharashtra 25291 36743 45883 20592 81 9140 25
Odisha 7633 13052 17814 10181 133 4762 36
Tamilnadu 14275 18820 20963 6688 47 2143 11
Uttar Pradesh 10610 23801 32195 21585 203 8394 35
ALL-INDIA wt.ave 16876 26288 34194 17318 103 7906 30
MOONG
Andhra Pradesh 7314 12874 16101 8787 120 3227 25
Karnataka 7351 9801 9177 1826 25 -624 -6
Maharashtra 14562 19702 22523 7961 55 2821 14
Odisha 6649 10386 12826 6178 93 2441 24
Rajasthan 7844 11037 15048 7204 92 4011 36
ALL-INDIA wt.ave 8953 12841 15632 6678 75 2791 22
(Contd.)

86
forPolicy
Kharif CropsPrice
Table - 4.1
State-wise Gross and Net returns on actual estimates of cost of cultivation of Kharif crops (Average of 2008-09 to 2010-11)
State Cost A2+FL (Rs./ha.)
Cost C2 (Rs./ha.)
GVO (Rs./ha.)
Gross Returns
over A2+FL (Rs./ha)
Rate of Gross
Returns over A2+FL
(%)
Net Returns over C2 (Rs./ha)
Net Rate of Returns over C2 (%)
URAD
Andhra Pradesh 11667 20227 29419 17752 152 9192 45
Chhatisgarh 8414 12241 14046 5632 67 1805 15
Madhya Pradesh 10534 15725 19329 8796 83 3604 23
Maharashtra 13692 18452 18401 4709 34 -51 -0.3
Odisha 6828 11221 15147 8319 122 3925 35
Rajasthan 9331 12849 15580 6249 67 2731 21
Tamilnadu 9617 13917 19111 9495 99 5195 37
Uttar Pradesh 8135 12686 14970 6836 84 2285 18
ALL-INDIA wt.ave 10346 15621 19412 9066 88 3791 24
GROUNDNUT
Andhra Pradesh 26941 39585 37660 10719 40 -1926 -5
Gujarat 23839 31692 39738 15899 67 8046 25
Karnataka 14967 19912 18117 3150 21 -1795 -9
Maharashtra 26397 35606 40970 14573 55 5364 15
Odisha 20392 29577 33355 12963 64 3778 13
Tamilnadu 25952 33919 33834 7882 30 -84 -0.2
ALL-INDIA wt.ave 23675 32661 35062 11386 48 2400 7
SOYABEAN
Madhya Pradesh 12951 20495 26955 14003 108 6460 32
Maharashtra 18761 24622 24638 5877 31 17 0.1
Rajasthan 12238 17151 19008 6770 55 1856 11
ALL-INDIA wt.ave 14708 21481 25500 10793 73 4020 19
SUNFLOWER
Andhra Pradesh 16337 18592 18549 2212 14 -43 -0.2
Karnataka 9231 12065 10261 1030 11 -1804 -15
Maharashtra 14119 19140 20722 6603 47 1582 8
ALL-INDIA wt.ave 11822 14906 14087 2264 19 -819 -5
SESAMUM
Gujarat 12219 17851 22751 10532 86 4900 27
Odisha 7942 11840 12002 4060 51 161 1
Rajasthan 6071 9817 16221 10149 167 6403 65
Tamilnadu 11909 18711 20498 8590 72 1787 10
West Bengal 13987 20190 23136 9149 65 2946 15
ALL-INDIA wt.ave 9617 14493 19310 9694 101 4817 33
NIGERSEED
Odisha 6125 9231 10249 4124 67 1018 11
ALL-INDIA wt.ave 6125 9231 10249 4124 67 1018 11
(Contd.)
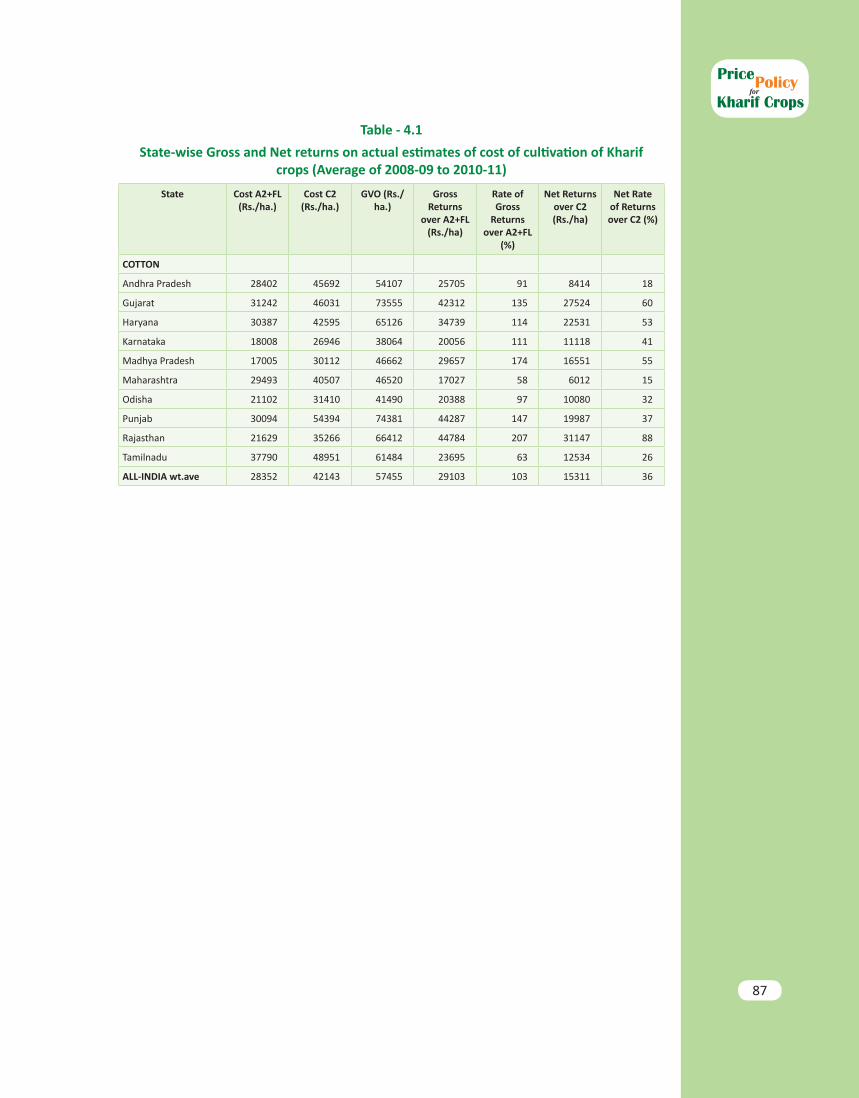
87
forPolicy
Kharif CropsPrice
Table - 4.1
State-wise Gross and Net returns on actual estimates of cost of cultivation of Kharif crops (Average of 2008-09 to 2010-11)
State Cost A2+FL (Rs./ha.)
Cost C2 (Rs./ha.)
GVO (Rs./ha.)
Gross Returns
over A2+FL (Rs./ha)
Rate of Gross
Returns over A2+FL
(%)
Net Returns over C2 (Rs./ha)
Net Rate of Returns over C2 (%)
COTTON
Andhra Pradesh 28402 45692 54107 25705 91 8414 18
Gujarat 31242 46031 73555 42312 135 27524 60
Haryana 30387 42595 65126 34739 114 22531 53
Karnataka 18008 26946 38064 20056 111 11118 41
Madhya Pradesh 17005 30112 46662 29657 174 16551 55
Maharashtra 29493 40507 46520 17027 58 6012 15
Odisha 21102 31410 41490 20388 97 10080 32
Punjab 30094 54394 74381 44287 147 19987 37
Rajasthan 21629 35266 66412 44784 207 31147 88
Tamilnadu 37790 48951 61484 23695 63 12534 26
ALL-INDIA wt.ave 28352 42143 57455 29103 103 15311 36
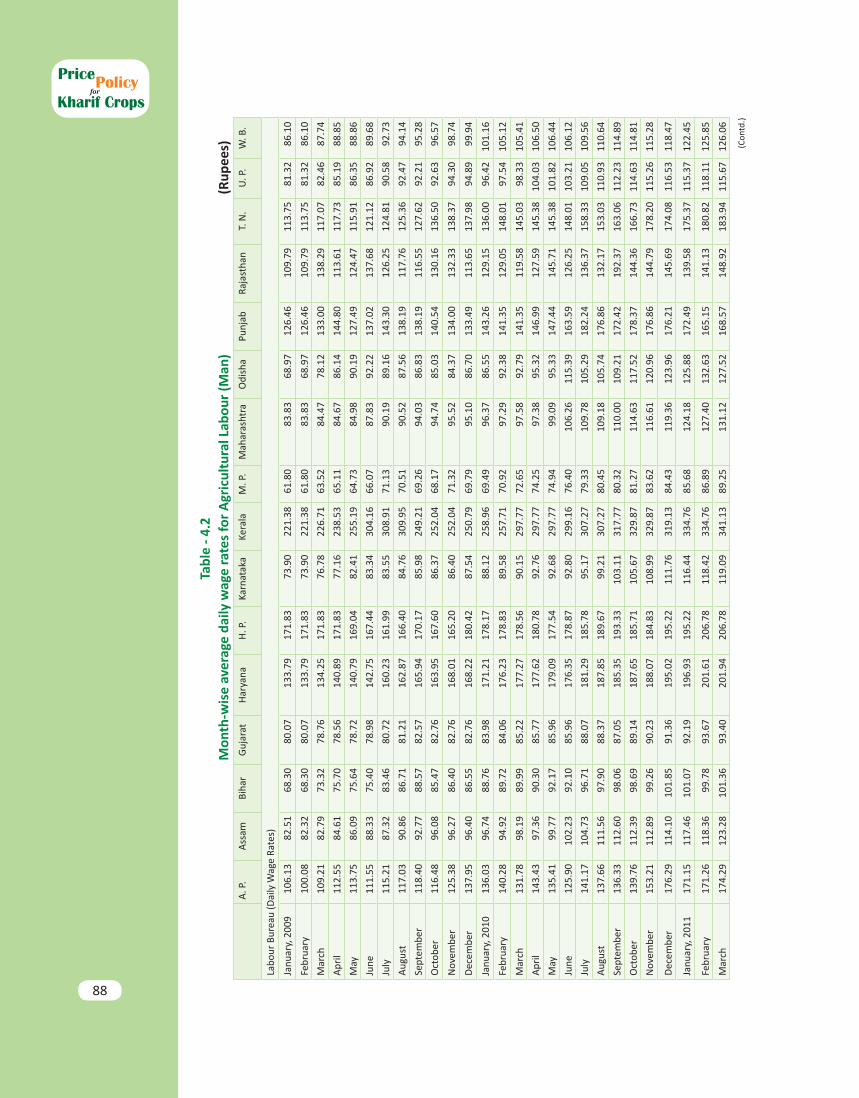
88
forPolicy
Kharif CropsPrice
Tabl
e - 4
.2M
onth
-wis
e av
erag
e da
ily w
age
rate
s fo
r A
gric
ultu
ral L
abou
r (M
an)
(Rup
ees)
A. P
.A
ssam
Biha
rG
ujar
atH
arya
naH
. P.
Karn
atak
aKe
rala
M. P
. M
ahar
asht
raO
dish
aPu
njab
Raja
stha
nT.
N.
U. P
. W
. B.
Labo
ur B
urea
u (D
aily
Wag
e Ra
tes)
Janu
ary,
200
910
6.13
82.5
168
.30
80.0
713
3.79
171.
8373
.90
221.
3861
.80
83.8
368
.97
126.
4610
9.79
113.
7581
.32
86.1
0
Febr
uary
100.
0882
.32
68.3
080
.07
133.
7917
1.83
73.9
022
1.38
61.8
083
.83
68.9
712
6.46
109.
7911
3.75
81.3
286
.10
Mar
ch10
9.21
82.7
973
.32
78.7
613
4.25
171.
8376
.78
226.
7163
.52
84.4
778
.12
133.
0013
8.29
117.
0782
.46
87.7
4
Apr
il11
2.55
84.6
175
.70
78.5
614
0.89
171.
8377
.16
238.
5365
.11
84.6
786
.14
144.
8011
3.61
117.
7385
.19
88.8
5
May
113.
7586
.09
75.6
478
.72
140.
7916
9.04
82.4
125
5.19
64.7
384
.98
90.1
912
7.49
124.
4711
5.91
86.3
588
.86
June
111.
5588
.33
75.4
078
.98
142.
7516
7.44
83.3
430
4.16
66.0
787
.83
92.2
213
7.02
137.
6812
1.12
86.9
289
.68
July
115.
2187
.32
83.4
680
.72
160.
2316
1.99
83.5
530
8.91
71.1
390
.19
89.1
614
3.30
126.
2512
4.81
90.5
892
.73
Aug
ust
117.
0390
.86
86.7
181
.21
162.
8716
6.40
84.7
630
9.95
70.5
190
.52
87.5
613
8.19
117.
7612
5.36
92.4
794
.14
Sept
embe
r11
8.40
92.7
788
.57
82.5
716
5.94
170.
1785
.98
249.
2169
.26
94.0
386
.83
138.
1911
6.55
127.
6292
.21
95.2
8
Oct
ober
116.
4896
.08
85.4
782
.76
163.
9516
7.60
86.3
725
2.04
68.1
794
.74
85.0
314
0.54
130.
1613
6.50
92.6
396
.57
Nov
embe
r12
5.38
96.2
786
.40
82.7
616
8.01
165.
2086
.40
252.
0471
.32
95.5
284
.37
134.
0013
2.33
138.
3794
.30
98.7
4
Dec
embe
r13
7.95
96.4
086
.55
82.7
616
8.22
180.
4287
.54
250.
7969
.79
95.1
086
.70
133.
4911
3.65
137.
9894
.89
99.9
4
Janu
ary,
201
013
6.03
96.7
488
.76
83.9
817
1.21
178.
1788
.12
258.
9669
.49
96.3
786
.55
143.
2612
9.15
136.
0096
.42
101.
16
Febr
uary
140.
2894
.92
89.7
284
.06
176.
2317
8.83
89.5
825
7.71
70.9
297
.29
92.3
814
1.35
129.
0514
8.01
97.5
410
5.12
Mar
ch13
1.78
98.1
989
.99
85.2
217
7.27
178.
5690
.15
297.
7772
.65
97.5
892
.79
141.
3511
9.58
145.
0398
.33
105.
41
Apr
il14
3.43
97.3
690
.30
85.7
717
7.62
180.
7892
.76
297.
7774
.25
97.3
895
.32
146.
9912
7.59
145.
3810
4.03
106.
50
May
135.
4199
.77
92.1
785
.96
179.
0917
7.54
92.6
829
7.77
74.9
499
.09
95.3
314
7.44
145.
7114
5.38
101.
8210
6.44
June
125.
9010
2.23
92.1
085
.96
176.
3517
8.87
92.8
029
9.16
76.4
010
6.26
115.
3916
3.59
126.
2514
8.01
103.
2110
6.12
July
141.
1710
4.73
96.7
188
.07
181.
2918
5.78
95.1
730
7.27
79.3
310
9.78
105.
2918
2.24
136.
3715
8.33
109.
0510
9.56
Aug
ust
137.
6611
1.56
97.9
088
.37
187.
8518
9.67
99.2
130
7.27
80.4
510
9.18
105.
7417
6.86
132.
1715
3.03
110.
9311
0.64
Sept
embe
r13
6.33
112.
6098
.06
87.0
518
5.35
193.
3310
3.11
317.
7780
.32
110.
0010
9.21
172.
4219
2.37
163.
0611
2.23
114.
89
Oct
ober
139.
7611
2.39
98.6
989
.14
187.
6518
5.71
105.
6732
9.87
81.2
711
4.63
117.
5217
8.37
144.
3616
6.73
114.
6311
4.81
Nov
embe
r15
3.21
112.
8999
.26
90.2
318
8.07
184.
8310
8.99
329.
8783
.62
116.
6112
0.96
176.
8614
4.79
178.
2011
5.26
115.
28
Dec
embe
r17
6.29
114.
1010
1.85
91.3
619
5.02
195.
2211
1.76
319.
1384
.43
119.
3612
3.96
176.
2114
5.69
174.
0811
6.53
118.
47
Janu
ary,
201
117
1.15
117.
4610
1.07
92.1
919
6.93
195.
2211
6.44
334.
7685
.68
124.
1812
5.88
172.
4913
9.58
175.
3711
5.37
122.
45
Febr
uary
171.
2611
8.36
99.7
893
.67
201.
6120
6.78
118.
4233
4.76
86.8
912
7.40
132.
6316
5.15
141.
1318
0.82
118.
1112
5.85
Mar
ch17
4.29
123.
2810
1.36
93.4
020
1.94
206.
7811
9.09
341.
1389
.25
131.
1212
7.52
168.
5714
8.92
183.
9411
5.67
126.
06
(Con
td.)
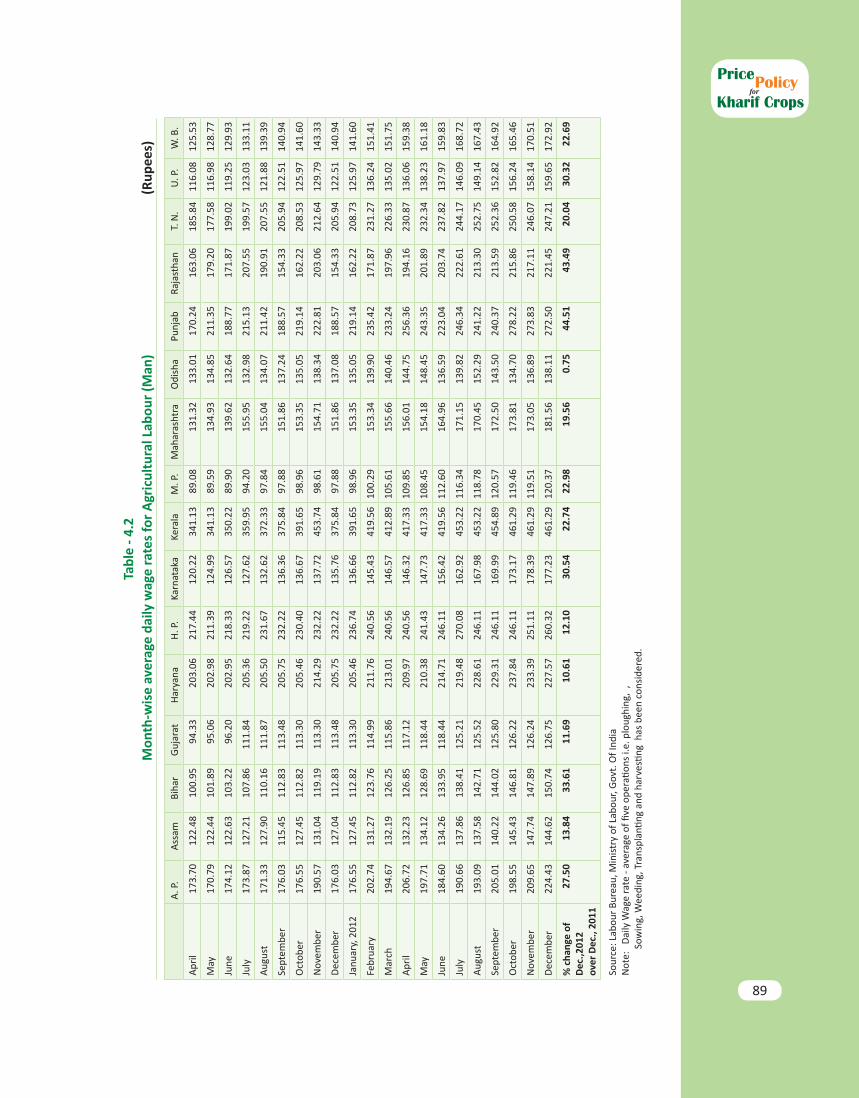
89
forPolicy
Kharif CropsPrice
A. P
.A
ssam
Biha
rG
ujar
atH
arya
naH
. P.
Karn
atak
aKe
rala
M. P
. M
ahar
asht
raO
dish
aPu
njab
Raja
stha
nT.
N.
U. P
. W
. B.
Apr
il17
3.70
122.
4810
0.95
94.3
320
3.06
217.
4412
0.22
341.
1389
.08
131.
3213
3.01
170.
2416
3.06
185.
8411
6.08
125.
53
May
170.
7912
2.44
101.
8995
.06
202.
9821
1.39
124.
9934
1.13
89.5
913
4.93
134.
8521
1.35
179.
2017
7.58
116.
9812
8.77
June
174.
1212
2.63
103.
2296
.20
202.
9521
8.33
126.
5735
0.22
89.9
013
9.62
132.
6418
8.77
171.
8719
9.02
119.
2512
9.93
July
173.
8712
7.21
107.
8611
1.84
205.
3621
9.22
127.
6235
9.95
94.2
015
5.95
132.
9821
5.13
207.
5519
9.57
123.
0313
3.11
Aug
ust
171.
3312
7.90
110.
1611
1.87
205.
5023
1.67
132.
6237
2.33
97.8
415
5.04
134.
0721
1.42
190.
9120
7.55
121.
8813
9.39
Sept
embe
r17
6.03
115.
4511
2.83
113.
4820
5.75
232.
2213
6.36
375.
8497
.88
151.
8613
7.24
188.
5715
4.33
205.
9412
2.51
140.
94
Oct
ober
176.
5512
7.45
112.
8211
3.30
205.
4623
0.40
136.
6739
1.65
98.9
615
3.35
135.
0521
9.14
162.
2220
8.53
125.
9714
1.60
Nov
embe
r19
0.57
131.
0411
9.19
113.
3021
4.29
232.
2213
7.72
453.
7498
.61
154.
7113
8.34
222.
8120
3.06
212.
6412
9.79
143.
33
Dec
embe
r17
6.03
127.
0411
2.83
113.
4820
5.75
232.
2213
5.76
375.
8497
.88
151.
8613
7.08
188.
5715
4.33
205.
9412
2.51
140.
94
Janu
ary,
201
217
6.55
127.
4511
2.82
113.
3020
5.46
236.
7413
6.66
391.
6598
.96
153.
3513
5.05
219.
1416
2.22
208.
7312
5.97
141.
60
Febr
uary
202.
7413
1.27
123.
7611
4.99
211.
7624
0.56
145.
4341
9.56
100.
2915
3.34
139.
9023
5.42
171.
8723
1.27
136.
2415
1.41
Mar
ch
194.
6713
2.19
126.
2511
5.86
213.
0124
0.56
146.
5741
2.89
105.
6115
5.66
140.
4623
3.24
197.
9622
6.33
135.
0215
1.75
Apr
il20
6.72
132.
2312
6.85
117.
1220
9.97
240.
5614
6.32
417.
3310
9.85
156.
0114
4.75
256.
3619
4.16
230.
8713
6.06
159.
38
May
197.
7113
4.12
128.
6911
8.44
210.
3824
1.43
147.
7341
7.33
108.
4515
4.18
148.
4524
3.35
201.
8923
2.34
138.
2316
1.18
June
184.
6013
4.26
133.
9511
8.44
214.
7124
6.11
156.
4241
9.56
112.
6016
4.96
136.
5922
3.04
203.
7423
7.82
137.
9715
9.83
July
190.
6613
7.86
138.
4112
5.21
219.
4827
0.08
162.
9245
3.22
116.
3417
1.15
139.
8224
6.34
222.
6124
4.17
146.
0916
8.72
Aug
ust
193.
0913
7.58
142.
7112
5.52
228.
6124
6.11
167.
9845
3.22
118.
7817
0.45
152.
2924
1.22
213.
3025
2.75
149.
1416
7.43
Sept
embe
r20
5.01
140.
2214
4.02
125.
8022
9.31
246.
1116
9.99
454.
8912
0.57
172.
5014
3.50
240.
3721
3.59
252.
3615
2.82
164.
92
Oct
ober
198.
5514
5.43
146.
8112
6.22
237.
8424
6.11
173.
1746
1.29
119.
4617
3.81
134.
7027
8.22
215.
8625
0.58
156.
2416
5.46
Nov
embe
r20
9.65
147.
7414
7.89
126.
2423
3.39
251.
1117
8.39
461.
2911
9.51
173.
0513
6.89
273.
8321
7.11
246.
0715
8.14
170.
51
Dec
embe
r22
4.43
144.
6215
0.74
126.
7522
7.57
260.
3217
7.23
461.
2912
0.37
181.
5613
8.11
272.
5022
1.45
247.
2115
9.65
172.
92
% c
hang
e of
D
ec.,2
012
over
Dec
., 20
11
27.5
0
13.8
4
33.6
1
11.6
9
10.6
1
12.1
0
30.5
4
22.7
4
22.9
8
19.5
6
0.75
44.5
1
43.4
9
20.0
4
30.3
2
22.6
9
Sour
ce: L
abou
r Bu
reau
, Min
istr
y of
Lab
our,
Gov
t. O
f Ind
iaN
ote:
D
aily
Wag
e ra
te -
aver
age
of fi
ve o
pera
tions
i.e.
plo
ughi
ng,
,
Sow
ing,
Wee
ding
, Tra
nspl
antin
g an
d ha
rves
ting
has
bee
n co
nsid
ered
.
Tabl
e - 4
.2M
onth
-wis
e av
erag
e da
ily w
age
rate
s fo
r A
gric
ultu
ral L
abou
r (M
an)
(Rup
ees)
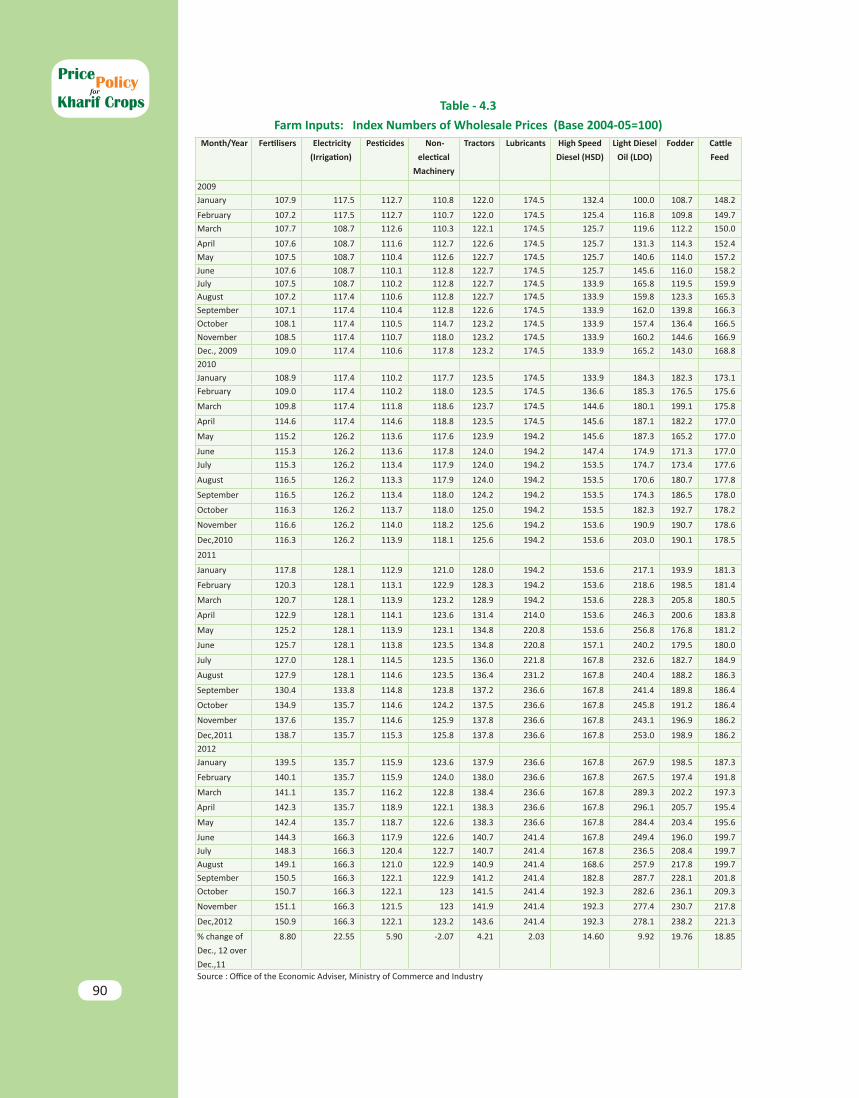
90
forPolicy
Kharif CropsPrice
Table - 4.3
Farm Inputs: Index Numbers of Wholesale Prices (Base 2004-05=100) Month/Year Fertilisers Electricity
(Irrigation)
Pesticides Non-
electical
Machinery
Tractors Lubricants High Speed
Diesel (HSD)
Light Diesel
Oil (LDO)
Fodder Cattle
Feed
2009
January 107.9 117.5 112.7 110.8 122.0 174.5 132.4 100.0 108.7 148.2
February 107.2 117.5 112.7 110.7 122.0 174.5 125.4 116.8 109.8 149.7
March 107.7 108.7 112.6 110.3 122.1 174.5 125.7 119.6 112.2 150.0
April 107.6 108.7 111.6 112.7 122.6 174.5 125.7 131.3 114.3 152.4
May 107.5 108.7 110.4 112.6 122.7 174.5 125.7 140.6 114.0 157.2
June 107.6 108.7 110.1 112.8 122.7 174.5 125.7 145.6 116.0 158.2July 107.5 108.7 110.2 112.8 122.7 174.5 133.9 165.8 119.5 159.9August 107.2 117.4 110.6 112.8 122.7 174.5 133.9 159.8 123.3 165.3
September 107.1 117.4 110.4 112.8 122.6 174.5 133.9 162.0 139.8 166.3
October 108.1 117.4 110.5 114.7 123.2 174.5 133.9 157.4 136.4 166.5
November 108.5 117.4 110.7 118.0 123.2 174.5 133.9 160.2 144.6 166.9
Dec., 2009 109.0 117.4 110.6 117.8 123.2 174.5 133.9 165.2 143.0 168.8
2010
January 108.9 117.4 110.2 117.7 123.5 174.5 133.9 184.3 182.3 173.1
February 109.0 117.4 110.2 118.0 123.5 174.5 136.6 185.3 176.5 175.6
March 109.8 117.4 111.8 118.6 123.7 174.5 144.6 180.1 199.1 175.8
April 114.6 117.4 114.6 118.8 123.5 174.5 145.6 187.1 182.2 177.0
May 115.2 126.2 113.6 117.6 123.9 194.2 145.6 187.3 165.2 177.0
June 115.3 126.2 113.6 117.8 124.0 194.2 147.4 174.9 171.3 177.0
July 115.3 126.2 113.4 117.9 124.0 194.2 153.5 174.7 173.4 177.6
August 116.5 126.2 113.3 117.9 124.0 194.2 153.5 170.6 180.7 177.8
September 116.5 126.2 113.4 118.0 124.2 194.2 153.5 174.3 186.5 178.0
October 116.3 126.2 113.7 118.0 125.0 194.2 153.5 182.3 192.7 178.2
November 116.6 126.2 114.0 118.2 125.6 194.2 153.6 190.9 190.7 178.6
Dec,2010 116.3 126.2 113.9 118.1 125.6 194.2 153.6 203.0 190.1 178.5
2011
January 117.8 128.1 112.9 121.0 128.0 194.2 153.6 217.1 193.9 181.3
February 120.3 128.1 113.1 122.9 128.3 194.2 153.6 218.6 198.5 181.4
March 120.7 128.1 113.9 123.2 128.9 194.2 153.6 228.3 205.8 180.5
April 122.9 128.1 114.1 123.6 131.4 214.0 153.6 246.3 200.6 183.8
May 125.2 128.1 113.9 123.1 134.8 220.8 153.6 256.8 176.8 181.2
June 125.7 128.1 113.8 123.5 134.8 220.8 157.1 240.2 179.5 180.0
July 127.0 128.1 114.5 123.5 136.0 221.8 167.8 232.6 182.7 184.9
August 127.9 128.1 114.6 123.5 136.4 231.2 167.8 240.4 188.2 186.3
September 130.4 133.8 114.8 123.8 137.2 236.6 167.8 241.4 189.8 186.4
October 134.9 135.7 114.6 124.2 137.5 236.6 167.8 245.8 191.2 186.4
November 137.6 135.7 114.6 125.9 137.8 236.6 167.8 243.1 196.9 186.2
Dec,2011 138.7 135.7 115.3 125.8 137.8 236.6 167.8 253.0 198.9 186.2
2012
January 139.5 135.7 115.9 123.6 137.9 236.6 167.8 267.9 198.5 187.3
February 140.1 135.7 115.9 124.0 138.0 236.6 167.8 267.5 197.4 191.8
March 141.1 135.7 116.2 122.8 138.4 236.6 167.8 289.3 202.2 197.3
April 142.3 135.7 118.9 122.1 138.3 236.6 167.8 296.1 205.7 195.4
May 142.4 135.7 118.7 122.6 138.3 236.6 167.8 284.4 203.4 195.6
June 144.3 166.3 117.9 122.6 140.7 241.4 167.8 249.4 196.0 199.7
July 148.3 166.3 120.4 122.7 140.7 241.4 167.8 236.5 208.4 199.7
August 149.1 166.3 121.0 122.9 140.9 241.4 168.6 257.9 217.8 199.7
September 150.5 166.3 122.1 122.9 141.2 241.4 182.8 287.7 228.1 201.8
October 150.7 166.3 122.1 123 141.5 241.4 192.3 282.6 236.1 209.3
November 151.1 166.3 121.5 123 141.9 241.4 192.3 277.4 230.7 217.8
Dec,2012 150.9 166.3 122.1 123.2 143.6 241.4 192.3 278.1 238.2 221.3
% change of
Dec., 12 over
Dec.,11
8.80 22.55 5.90 -2.07 4.21 2.03 14.60 9.92 19.76 18.85
Source : Office of the Economic Adviser, Ministry of Commerce and Industry

91
forPolicy
Kharif CropsPrice
Table - 4.4
Statewise Projected Cost of Production (C2 & A2+FL) for Kharif 2013-14 and their shares in Production in increasing order of Cost
States A2+FL C2 Relative Shares in
Production(%)
States A2+FL C2 Relative Shares in Production
(%)
Paddy Maize
Himachal Pradesh 403.25 663.99 1 Andhra Pradesh 746.20 1028.97 24
Uttarakhand 630.25 974.62 1 Bihar 519.29 655.18 9
Andhra Pradesh 799.46 1030.01 13 Chhattisgarh 1447.30 1692.74 1
Gujarat 737.80 1031.88 2 Gujarat 592.64 860.38 5
Uttar Pradesh 756.22 1062.83 13 Himachal Pradesh 1075.03 1360.92 4
Punjab 769.62 1067.26 11 Karnataka 988.88 1181.79 23
Madhya Pradesh 743.18 1102.02 2 Madhya Pradesh 910.42 1152.97 7
Assam 890.84 1126.95 4 Rajasthan 871.74 1196.83 10
Chhattisgarh 883.44 1147.63 6 Tamil Nadu 918.41 1195.63 9
Odisha 933.65 1163.75 7 Uttar Pradesh 1078.60 1424.29 7
Karnataka 1001.46 1235.12 4 All India 859.55 1112.37
Tamil Nadu 1090.14 1309.52 6 Ragi
West Bengal 1104.16 1310.78 14
Bihar 1101.22 1343.37 6 Karnataka 1413.59 1757.14 80
Kerala 1172.19 1404.37 1 Maharashtra 492.69 1141.15 8
Haryana 1064.55 1623.69 4 Tamil Nadu 1373.40 1577.31 13
Jharkhand 1365.54 1688.87 2 All India 1338.20 1687.05
Maharashtra 2247.29 2677.10 3
All India 961.46 1234.06
Jowar Bajra
Andhra Pradesh 1268.16 1854.30 7 Gujarat 712.73 938.54 13
Karnataka 1564.16 1976.64 23 Haryana 628.65 1020.27 12
Madhya Pradesh 1043.60 1313.49 10 Karnataka 1375.55 1710.19 3
Maharashtra 1207.72 1586.51 48 Maharashtra 1099.13 1345.38 9
Rajasthan 1025.74 1279.57 8 Rajasthan 728.53 913.12 46
Tamil Nadu 1303.68 1659.25 5 Uttar Pradesh 733.06 976.66 18
All India 1269.18 1648.41 All India 767.58 1002.84
Tur Urad
Bihar 1070.04 1083.48 1 Madhya Pradesh 2222.57 3013.83 14
Odisha 2793.23 3263.10 5 Chhatisgarh 2486.73 3145.55 2
Madhya Pradesh 2441.04 3415.06 12 Uttar Pradesh 2445.36 3371.39 24
Gujarat 3020.23 3637.23 10 Odisha 2793.90 3807.20 2
Uttar Pradesh 2781.27 3708.41 13 Andhra Pradesh 2988.87 4031.94 21
Karnataka 3093.42 4116.27 16 Tamil Nadu 3013.88 4079.57 11
Maharashtra 3146.15 4231.94 34 Maharashtra 4401.61 5473.92 17
Andhra Pradesh 4674.39 4676.76 8 Rajasthan 4941.45 5865.73 9
Tamil Nadu 4817.93 6008.87 1 All India 3143.93 4111.87
All India 3089.87 3957.67 (Contd…)

92
forPolicy
Kharif CropsPrice
Table 4.4 (concluded)Statewise Projected Cost of Production (C2 & A2+FL) for Kharif 2013-14
and their shares in Production in increasing order of Cost
States A2+FL C2 Relative Shares in Production(%)
States A2+FL C2 Relative Shares in Production(%)
Moong Seasmum
Maharashtra 2974.57 3823.80 24 West Bengal 2561.61 3285.68 33
Andhra Pradesh 2935.06 4127.80 14 Rajasthan 2203.89 3786.03 39
Odisha 3592.44 4798.09 6 Odisha 3850.88 5208.84 1
Rajasthan 4069.11 4934.35 49 Tamil Nadu 4007.44 5359.26 6
Karnataka 6429.07 8091.21 7 Gujarat 4520.02 5786.58 20
All India 3775.10 4758.69 All India 2919.31 4133.89
Soyabean Sunflower
Madhya Pradesh
1190.09 1727.71 56 Maharashtra 2142.56 2654.58 15
Maharashtra 2284.79 2745.42 33 Andhra Pradesh 2838.04 3520.99 33
Rajasthan 2460.86 3108.99 11 Karnataka 3347.34 4072.06 52
All India 1691.87 2215.60 All India 3000.10 3679.36
Groundnut Cotton
Gujarat 2299.10 2897.73 45 Madhya Pradesh
1486.21 2505.93 6
Andhra Pradesh 2363.79 3175.55 20 Haryana 2160.77 3120.68 7
Maharashtra 2533.91 3219.68 7 Gujarat 2265.98 3129.76 31
Odisha 2570.02 3309.94 1 Rajasthan 2247.86 3204.66 3
Tamil Nadu 3039.45 3672.30 18 Karnataka 2422.61 3604.45 4
Karnataka 4978.90 5820.71 10 Punjab 2427.95 3663.26 7
All India 2720.25 3397.49 Andhra Pradesh 2296.42 3702.40 17
Orissa 2979.12 3768.06 1
Tamil Nadu 3367.08 4093.82 1
Maharashtra 3256.19 4295.67 23
All India 2484.66 3532.66

93
forPolicy
Kharif CropsPrice
Table - 4.5Index of Terms of Trade Between Agriculture and Non-Agriculture Sectors
Triennium Ending 1990-91=100
Year Index of Prices Received
(IPR)
Index of Prices Paid (IPP) for Index of Terms of Trade (ITT)
Final Consumption
Intermediate Consumption
Capital Formation
Combined Index
Weights 73.54 21.63 4.83 100
1981-82 54.9 54.4 88.5 56.9 61.9 88.7
1982-83 60.3 58.8 91.1 62.6 66.0 91.4
1983-84 64.2 64.2 91.0 67.4 70.1 91.6
1984-85 68.0 66.6 92.3 72.5 72.4 93.9
1985-86 70.4 69.5 94.3 76.4 75.2 93.6
1986-87 76.7 74.8 98.7 78.8 80.2 95.6
1987-88 86.0 84.6 102.3 82.5 88.3 97.4
1988-89 90.3 90.4 96.9 90.9 91.8 98.4
1989-90 97.5 97.6 99.2 100.6 98.1 99.4
1990-91 112.3 112.1 104.0 108.5 110.2 101.9
1991-92 130.8 124.9 119.4 127.2 123.8 105.7
1992-93 138.7 131.5 139.5 137.5 133.5 103.9
1993-94 151.4 143.9 152.9 147.3 146.1 103.6
1994-95 171.1 159.0 166.1 158.4 160.5 106.6
1995-96 182.9 173.4 174.2 176.1 173.7 105.3
1996-97 190.6 185.6 181.5 188.8 184.9 103.1
1997-98 205.9 195.7 192.0 196.7 194.9 105.6
1998-99 220.8 213.8 197.1 206.8 209.8 105.2
1999-00 219.8 217.1 203.9 212.6 214.0 102.7
2000-01 225.0 220.5 230.4 227.0 223.0 100.9
2001-02 235.3 226.4 235.2 240.4 229.0 102.8
2002-03 247.9 234.9 252.7 245.2 239.2 103.6
2003-04 251.2 245.2 259.1 255.7 248.7 101.0
2004-05 258.2 252.3 264.5 305.6 257.5 100.3
2005-06 275.8 266.0 277.1 310.5 270.6 101.9
2006-07 291.2 283.4 284.6 327.8 285.8 101.9
2007-08* 324.3 323.2 301.5 356.1 320.1 101.3
2008-09* 350.9 350.8 332.8 380.1 348.3 100.7
2009-10* 411.6 415.1 355.0 394.0 401.1 102.6
Source: Directorate of Economics and Statistics, Ministry of Agriculture, New Delhi* Provisional

94
forPolicy
Kharif CropsPrice
Tabl
e - 6
.1
MSP
Rec
omm
ende
d by
Sta
te G
ovts
. for
the
Khar
if Cr
ops
of 2
013-
2014
(Rs.
/Qtl.
)
Stat
e
Padd
y(C
omm
on)
Padd
y(G
r-A
)
Jow
ar(H
ybri
d)
Jow
ar(M
alda
ndi)
Bajr
a
Mai
ze
Ragi
Moo
ng
Ura
d
Tur
Gro
undn
ut-
in-s
hell
Sesa
-m
um
Soya
-be
an
Soya
-be
an(Y
ello
w)
Soya
-be
an(B
lack
)
Sunfl
ower
-se
ed
Nig
er-
seed
Cott
on
Cott
on(L
ong
Stap
le-
Org
anic
)
Cott
on(L
ong
Stap
le)
Cott
on(M
ediu
m)
Stap
le)
And
hra
Pd.
2547
2811
2334
21
2419
3724
7268
4966
1870
1059
9478
47
32
9461
19
7158
6575
Ass
am14
2514
70
3675
4800
3350
44
00
And
a. &
Nic
o.12
00
Biha
r16
14
15
48
Chha
ttisg
arh
2050
2100
12
50
6000
5200
6500
5000
5850
31
5030
5046
0049
00
Del
hi
Guj
arat
1300
1320
1600
12
9013
30
4400
4300
4000
4000
4860
4100
-46
00
3900
-44
00
Har
yana
1850
14
0018
00
42
00
Him
acha
l Pd.
1250
1280
1500
1520
1175
1175
1500
3500
4300
3200
3700
4200
22
4022
0037
0035
00
39
0036
00
J & K
1800
2200
17
50
6500
6500
1000
0
Jhar
khan
d13
94
13
97
4707
4607
4010
Karn
atak
a
Kera
la18
0018
50
Mad
hya
Pd.
1600
1800
1700
1500
42
0039
0046
00
2450
4050
42
00
Mah
aras
htra
Odi
sha
1700
1430
52
00
3950
4000
4900
3700
5000
4500
Punj
ab17
5018
00
1700
59
0057
0053
0049
00
46
74
Raja
stha
n
18
00
1500
1500
40
0045
00
45
0030
00
45
00
Tam
il N
adu
2000
2100
1650
16
0018
0018
0055
0052
0050
0050
0060
0030
00
50
00
4500
4000
Utt
ar P
d.18
1020
3516
55
1490
1480
47
7545
6542
5540
25
2960
Utt
arak
hand
Wes
t Ben
gal
1430
Sour
ce :
Stat
e Re
plie
s

Related Documents