Welcome message from author
This document is posted to help you gain knowledge. Please leave a comment to let me know what you think about it! Share it to your friends and learn new things together.
Transcript

Equity Market Outlook
O v e r v i e wThe MarketTechnicals
Oct-17 Sep-17Investments by Institutions in the cash segment (Rs. Cr)
Avg Advance Decline Ratio
Valuation Ratios
Oct-17 Sep-17
Oct-17 10 Year Average
Oct-17Indices Movement Last 1 Yr
None of the aforesaid recommendations are based on any assumptions. These are purely for reference and the investors are requested to consult their financial advisors before investing.
Global economy
The International Monetary Fund (IMF) revised global growth projection
upwards to 3.6% from 3.5%, alongwith the 2018 outlook which was
raised to 3.7% from 3.6%. Despite the upswing in global economic
activity, the IMF warned of risks arising from uncomfortably low inflation
and rising geopolitical risks. The US economy grew 3% year-on-year in
Q3 2017 on the back of an increase in inventory investment and a smaller
trade deficit. While the IMF raised the US economy's growth forecast for
2017 to 2.2%, it predicted sluggish gains going forward due to absence of
growth-oriented policies from the government. The US Federal Reserve
had also indicated at an interest rate hike in its latest monetary policy.
In line with its strategy to end easy money policies, the European Central
Bank (ECB) announced a plan to halve its monthly asset purchases to EUR
30 billion from January 2018 while extending its monetary stimulus
program until at least September 2018. Interest rates, however, remained
unchanged at zero. The UK economy registered a slightly faster growth of
0.4% on-quarter in Q3 2017 aided by growth in the services and
manufacturing sectors. Brexit continues to play spoilsport for UK's
economy as the IMF reduced its growth forecast for the country by 0.3%
to 1.7% citing negative impact on account of it, even as the UK economy
grew 1.5% in Q3 2017.
The Japanese government remains moderately optimistic about
economic growth indicating recovery is on track owing to increased
consumer spending and capital expenditure. Bank of Japan, the
Japanese Central Bank, lowered inflation outlook for FY18 to 0.8% from
1.1% even while maintaining short-term interest rate at -0.1% and the 10-
year government yield at 0%. China's Q3 GDP growth, however, was
lower at 6.8% compared to 6.9% in Q2. The country is set to touch 7%
growth during the second half of the year owing to rapid household
consumption growth, the People's Bank of China Governor said.
Source: CRISIL Research
Fundamentals and economics:
Growth
India's GDP slowed to 5.7% in April-June 2017, lower than 7.9% growth in
the same quarter last year and 6.1% in the preceding January-March
2017 quarter. Total gross value added (GVA) during Q1 2017-18 stood at
5.6% against 7.6% in the same quarter last year. The agricultural sector
grew 2.3% in Q1 FY2018 against 2.5% in Q1 FY2017. Manufacturing
growth in the quarter fell to a mere 1.2% against 10.7% during the same
period. However, construction activities revived marginally to 2% in June
quarter from -3.7% in the March quarter.
Index of Industrial Production (IIP) recorded a strong performance at
4.3% in August 2017, up from 0.94% in July 2017 and negative growth in
June 2017, indicating GST-related disruptions could have somewhat
settled. The improvement in IIP performance was on the back of strong
growth in the manufacturing sector (3.09%) – the largest contributor to IIP
- and the electricity sector (8.3%). The mining sector, at 9.5%, clocked the
highest growth among the three but largely on account of negative
growth in the comparative year-ago period.
Infrastructure and construction goods grew a healthy 2.5%, suggesting
some revival in the construction space. Consumer goods too displayed
healthy growth in both the durables (1.6%) and non-durables (6.9%)
segments.
The core sector output rose to 5.2% in September 2017 compared to
downwardly revised 4.4% growth in August 2017. The cumulative
growth during April to September 2017 was 3.3%. While coal (10.6%),
steel (3.7%), electricity (5.2%) and natural gas production (6.3%) rose
sharply, crude oil production and cement grew marginally at 0.1%.
Fertilizer output, however, fell 7.7% in September 2017.
Source: Mospi.nic.in, CRISIL Centre for Economic Research (CCER)
BSE 1.24 1.14
NSE 1.14 1.37
FIIs (Net Purchases / Sales) 1923 -15337
MFs (Net Purchases / Sales)* 8621 15826
MF Data till Oct 27
P/E ratio- Sensex 24.16 18.76
P/E ratio- Nifty 26.26 18.52
Price/Book Value Ratio-Sensex 3.06 2.83
Price/Book Value Ratio-Nifty 3.44 2.73
Dividend Yield-Sensex 1.20 1.43
Dividend Yield-Nifty 1.12 1.40
S&P BSE Sensex 6.17% 18.91%
Nifty 50 5.59% 19.82%
S&P BSE Auto 5.11% 14.56%
S&P BSE Bankex 4.66% 26.45%
S&P BSE Capital Goods 7.29% 23.47%
S&P BSE Consumer Durables 5.19% 42.84%
S&P BSE Fast Moving Consumer Goods 5.02% 20.60%
S&P BSE Healthcare 5.89% -13.30%
S&P BSE Information Technology 4.18% 3.28%
S&P BSE Metal 8.60% 42.77%
S&P BSE MidCap 7.46% 23.12%
S&P BSE Oil & Gas 11.52% 34.39%
S&P BSE PSU 12.96% 18.46%
S&P BSE Realty 11.42% 47.88%
S&P BSE SmallCap 9.23% 29.58%
S&P BSE Teck Index 6.55% 8.14%
Data Source : Crisil research
2
O v e r v i e wThe MarketEquity Market Outlook
None of the aforesaid recommendations are based on any assumptions. These are purely for reference and the investors are requested to consult their financial advisors before investing.
Currency
The rupee strengthened against the USD and ended at Rs.64.75 per dollar on October 31 as against Rs.65.28 per dollar on September 29, on the back of intermittent dollar sales, sporadic weakness in the USD globally, lower-than-expected domestic CPI data for September, and positive trade deficit data. However, further gains were erased owing to dollar demand from state-owned banks on behalf of importers and a few strong US economic indicators, including manufacturing and service sector data.
Source: CRISIL Research
One-year CD rate
One-year certificate of deposit (CD) rate was 6.58% on October 31, 2017 versus 6.62% on September 29, 2017.
Source: CRISIL Fixed Income Database
Deficit
India's fiscal deficit in the first half of the fiscal (April-September) touched Rs. 4.99 trillion or 91.3% of the budgeted target of Rs. 5.46 trillion, compared to 83.9% of last year's full-year target during the same period.
India's current account deficit (CAD) widened to $14.3 billion, or 2.4% of GDP, in Q1 FY2018 - the highest deficit since Q1 FY2013. This is up from $3.4 billion (0.6% of GDP) in Q4 FY2017 and $0.4 billion (0.1% of GDP) in Q1 FY2017. The goods trade deficit, which touched a four-year high of $41.2 billion in Q1 FY2018, mainly contributed to the increase in CAD along with broad-based growth in imports. Services trade and income receipts from abroad showed modest improvement.
Majority of capital inflows in Q1 FY2018 came in the form of foreign portfolio investors (FPIs), who were net-buyers at $12.5 billion, against $10.8 billion in Q4 FY2017 and $2.1 billion in Q1 FY 2017. Implementation of key reforms such as GST, low inflation and victory of ruling party in key state elections boosted investor sentiments. Foreign direct investment (FDI), a more durable type of investment, increased to $7.2 billion in Q1 FY2018 from $5.0 billion in Q4 FY2017 and $3.9 billion in Q1 FY2017. The RBI increased its foreign exchange reserves by $11.4 billion in Q1 FY2018 (against $7 billion in Q1 FY2017) to curb the rapid appreciation of the rupee brought on by robust capital flows.
Exports increased by 25.67% on–year (to $28.61 billion) in September 2017, as opposed to a 10.3% growth in August - the first time exports growth has surpassed imports growth during this fiscal. On the other hand, imports slowed by 18.1% (to $37.6 billion), compared to 21% in the previous month, resulting in a trade deficit of $8.98 billon.
Brent
London Brent crude oil prices rose sharply by 6.7% to close at $61.37 per barrel on October 31 vis-à-vis $57.54 per barrel on September 29 on the International Petroleum Exchange (IPE). Oil prices were primarily supported by the pledge from Saudi Arabia to reduce monthly crude exports, talk of progress toward a balanced market by the Organization of the Petroleum Exporting Countries (OPEC) and a hurricane-induced fall in crude output.
Source: CCER
Source: Mospi.nic.in, CCER
Inflation
Market sentiment
Flows
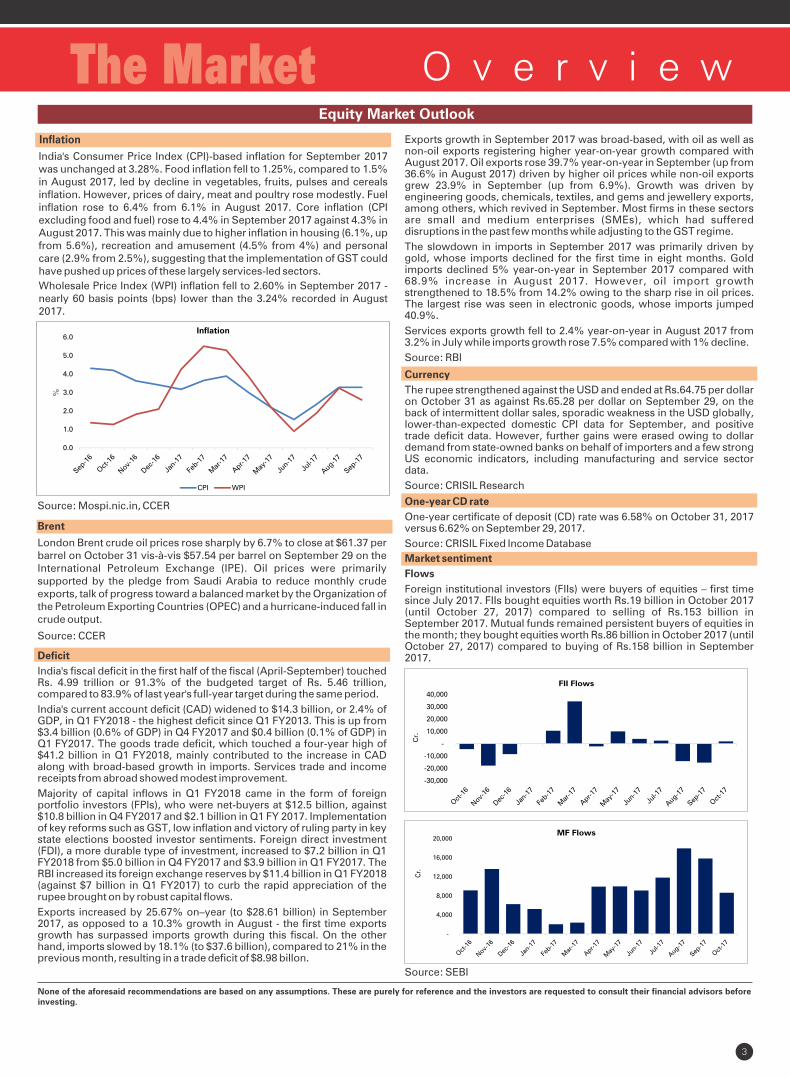
Foreign institutional investors (FIIs) were buyers of equities – first time since July 2017. FIIs bought equities worth Rs.19 billion in October 2017 (until October 27, 2017) compared to selling of Rs.153 billion in September 2017. Mutual funds remained persistent buyers of equities in the month; they bought equities worth Rs.86 billion in October 2017 (until October 27, 2017) compared to buying of Rs.158 billion in September 2017.
Exports growth in September 2017 was broad-based, with oil as well as non-oil exports registering higher year-on-year growth compared with August 2017. Oil exports rose 39.7% year-on-year in September (up from 36.6% in August 2017) driven by higher oil prices while non-oil exports grew 23.9% in September (up from 6.9%). Growth was driven by engineering goods, chemicals, textiles, and gems and jewellery exports, among others, which revived in September. Most firms in these sectors are small and medium enterprises (SMEs), which had suffered disruptions in the past few months while adjusting to the GST regime.
The slowdown in imports in September 2017 was primarily driven by gold, whose imports declined for the first time in eight months. Gold imports declined 5% year-on-year in September 2017 compared with 68.9% increase in August 2017. However, oil import growth strengthened to 18.5% from 14.2% owing to the sharp rise in oil prices. The largest rise was seen in electronic goods, whose imports jumped 40.9%.
Services exports growth fell to 2.4% year-on-year in August 2017 from 3.2% in July while imports growth rose 7.5% compared with 1% decline.
Source: RBI
Inflation
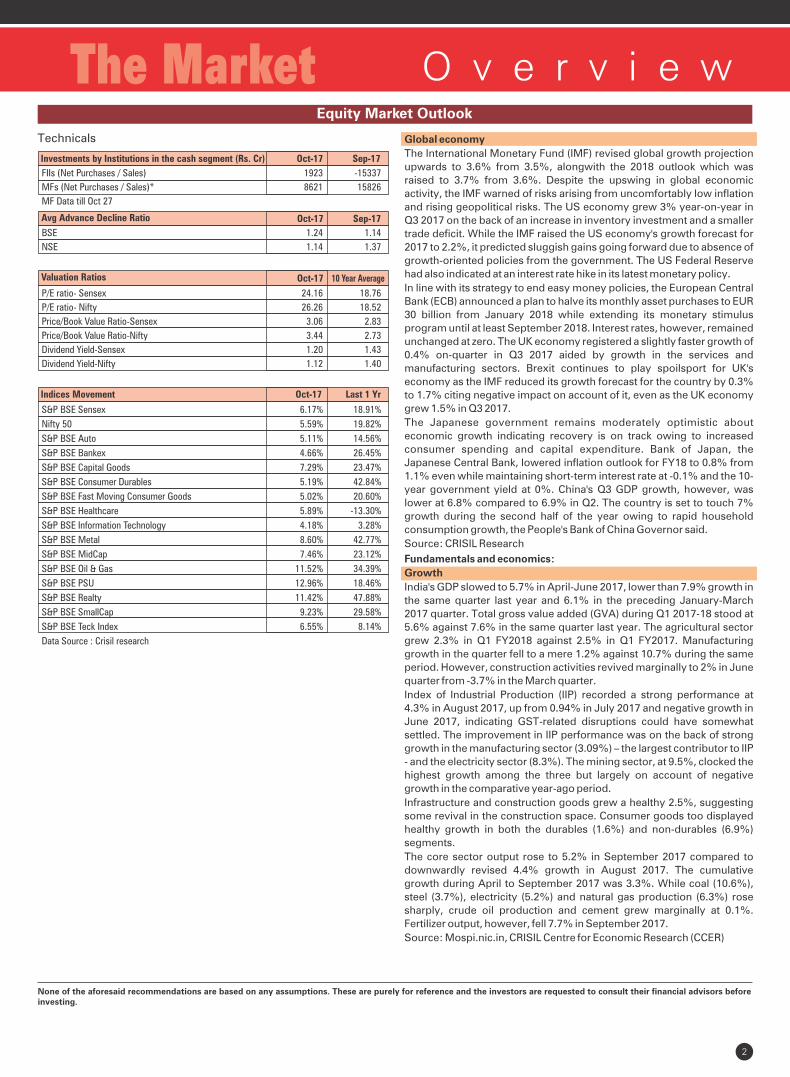
India's Consumer Price Index (CPI)-based inflation for September 2017 was unchanged at 3.28%. Food inflation fell to 1.25%, compared to 1.5% in August 2017, led by decline in vegetables, fruits, pulses and cereals inflation. However, prices of dairy, meat and poultry rose modestly. Fuel inflation rose to 6.4% from 6.1% in August 2017. Core inflation (CPI excluding food and fuel) rose to 4.4% in September 2017 against 4.3% in August 2017. This was mainly due to higher inflation in housing (6.1%, up from 5.6%), recreation and amusement (4.5% from 4%) and personal care (2.9% from 2.5%), suggesting that the implementation of GST could have pushed up prices of these largely services-led sectors.
Wholesale Price Index (WPI) inflation fell to 2.60% in September 2017 - nearly 60 basis points (bps) lower than the 3.24% recorded in August 2017.
0.0
1.0
2.0
3.0
4.0
5.0
6.0
%
CPI WPI
FII Flows
-30,000
-20,000
-10,000
-
10,000
20,000
30,000
40,000
Cr.
MF Flows
Cr.
-
4,000
8,000
12,000
16,000
20,000
Source: SEBI
3
O v e r v i e wThe Market
None of the aforesaid recommendations are based on any assumptions. These are purely for reference and the investors are requested to consult their financial advisors before investing.
ICICI Prudential Value Discovery FundICICI Prudential Top 100 FundICICI Prudential Multicap FundICICI Prudential Focused Bluechip Equity Fund
Pure Equity Schemes
These schemes are positioned aggressively to gain from recovery in the economy. These Schemes aim to generate long term wealth creation.
Our Recommendations – Equity Schemes
Asset Allocation Schemes
ICICI Prudential Balanced Advantage Fund
ICICI Prudential Balanced Fund
ICICI Prudential Dynamic Plan
ICICI Prudential Equity Income Fund
Theme-based schemes
ICICI Prudential Infrastructure FundICICI Prudential Exports and Other Services Fund
Investors could invest in these thematic schemes for tactical allocation. It would be a high risk investment option.
These schemes aim to benefit from volatility and can be suitable for investors aiming to participate in equities with low volatility.
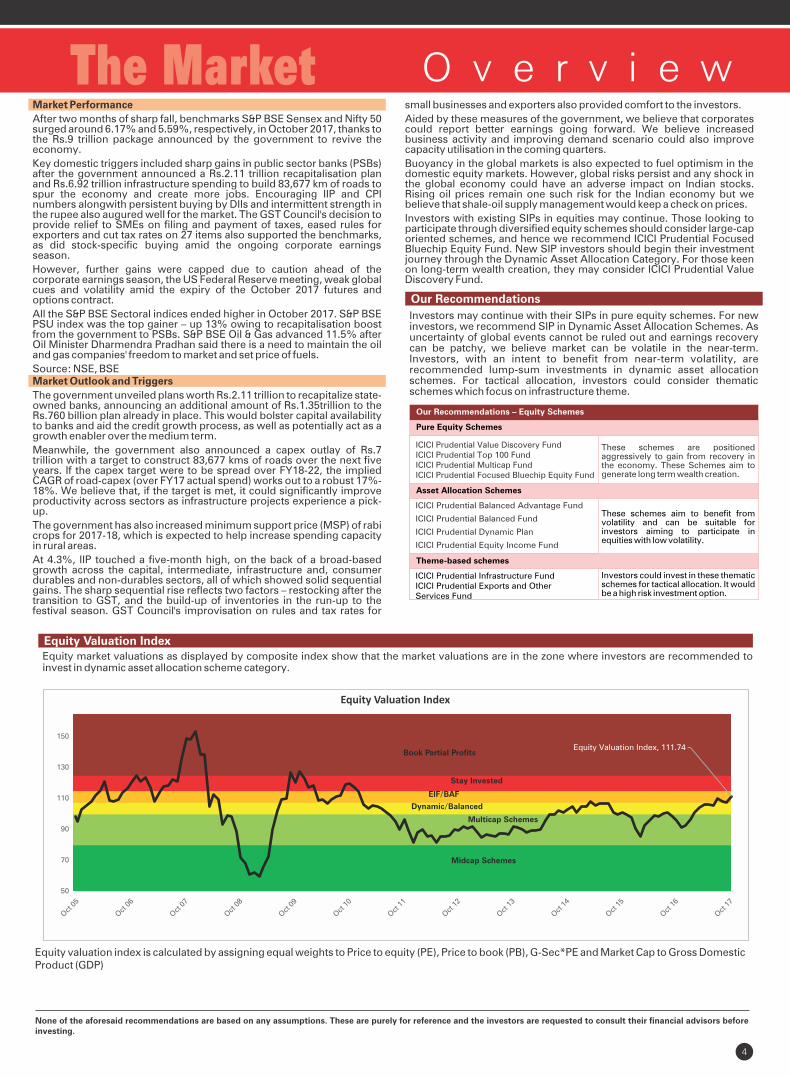
Equity market valuations as displayed by composite index show that the market valuations are in the zone where investors are recommended to invest in dynamic asset allocation scheme category.
Equity Valuation Index
Equity valuation index is calculated by assigning equal weights to Price to equity (PE), Price to book (PB), G-Sec*PE and Market Cap to Gross Domestic Product (GDP)
Equity Valuation Index
Market Outlook and Triggers
The government unveiled plans worth Rs.2.11 trillion to recapitalize state-owned banks, announcing an additional amount of Rs.1.35trillion to the Rs.760 billion plan already in place. This would bolster capital availability to banks and aid the credit growth process, as well as potentially act as a growth enabler over the medium term.
Meanwhile, the government also announced a capex outlay of Rs.7 trillion with a target to construct 83,677 kms of roads over the next five years. If the capex target were to be spread over FY18-22, the implied CAGR of road-capex (over FY17 actual spend) works out to a robust 17%-18%. We believe that, if the target is met, it could significantly improve productivity across sectors as infrastructure projects experience a pick-up.
The government has also increased minimum support price (MSP) of rabi crops for 2017-18, which is expected to help increase spending capacity in rural areas.
At 4.3%, IIP touched a five-month high, on the back of a broad-based growth across the capital, intermediate, infrastructure and, consumer durables and non-durables sectors, all of which showed solid sequential gains. The sharp sequential rise reflects two factors – restocking after the transition to GST, and the build-up of inventories in the run-up to the festival season. GST Council's improvisation on rules and tax rates for
small businesses and exporters also provided comfort to the investors.
Aided by these measures of the government, we believe that corporates could report better earnings going forward. We believe increased business activity and improving demand scenario could also improve capacity utilisation in the coming quarters.
Buoyancy in the global markets is also expected to fuel optimism in the domestic equity markets. However, global risks persist and any shock in the global economy could have an adverse impact on Indian stocks. Rising oil prices remain one such risk for the Indian economy but we believe that shale-oil supply management would keep a check on prices.
Investors with existing SIPs in equities may continue. Those looking to participate through diversified equity schemes should consider large-cap oriented schemes, and hence we recommend ICICI Prudential Focused Bluechip Equity Fund. New SIP investors should begin their investment journey through the Dynamic Asset Allocation Category. For those keen on long-term wealth creation, they may consider ICICI Prudential Value Discovery Fund.
Market Performance
After two months of sharp fall, benchmarks S&P BSE Sensex and Nifty 50 surged around 6.17% and 5.59%, respectively, in October 2017, thanks to the Rs.9 trillion package announced by the government to revive the economy.
Key domestic triggers included sharp gains in public sector banks (PSBs) after the government announced a Rs.2.11 trillion recapitalisation plan and Rs.6.92 trillion infrastructure spending to build 83,677 km of roads to spur the economy and create more jobs. Encouraging IIP and CPI numbers alongwith persistent buying by DIIs and intermittent strength in the rupee also augured well for the market. The GST Council's decision to provide relief to SMEs on filing and payment of taxes, eased rules for exporters and cut tax rates on 27 items also supported the benchmarks, as did stock-specific buying amid the ongoing corporate earnings season.
However, further gains were capped due to caution ahead of the corporate earnings season, the US Federal Reserve meeting, weak global cues and volatility amid the expiry of the October 2017 futures and options contract.
All the S&P BSE Sectoral indices ended higher in October 2017. S&P BSE PSU index was the top gainer – up 13% owing to recapitalisation boost from the government to PSBs. S&P BSE Oil & Gas advanced 11.5% after Oil Minister Dharmendra Pradhan said there is a need to maintain the oil and gas companies' freedom to market and set price of fuels.
Source: NSE, BSE
Our Recommendations
Investors may continue with their SIPs in pure equity schemes. For new investors, we recommend SIP in Dynamic Asset Allocation Schemes. As uncertainty of global events cannot be ruled out and earnings recovery can be patchy, we believe market can be volatile in the near-term. Investors, with an intent to benefit from near-term volatility, are recommended lump-sum investments in dynamic asset allocation schemes. For tactical allocation, investors could consider thematic schemes which focus on infrastructure theme.
Equity Valuation Index, 111.74
50
70
90
110
130
150
Multicap Schemes
Midcap Schemes
Dynamic/Balanced
EIF/BAF
Stay Invested
Book Partial Profits
4
Note: None of the aforesaid recommendations are based on any assumptions. These are purely for reference and the investors are requested to consult their financial advisors
before investing.
O v e r v i e wThe MarketFixed Income Market Outlook
Average Liquidity Support by RBI
Rs -1.43 trillion Includes: LAF, MSF, SLF & Term Repo
Bank Credit Growth
7.7%
Bank Deposit Growth
9.8%
Money Market
Tenure
Change in basis points (bps)
CD
1M
Change CP Change
3M
6M
12M
Bond Market Change in basis points
Tenure G-Sec ChangeAAA
CBChange
1Y
3Y
5Y
10Y
Macro Economy Data Release
IndicatorLatest
Update
Previous
Update
IIP
GDP
USD/INR
WPI
CPI
Month Overview (as on October 31, 2017)
6.65
6.85
7.10
7.20
14
28
20
5
6.26
6.51
6.75
6.86
0
6
8
20
6.78
6.99
7.17
7.60
0
-4
3
13
4.3% (Aug)
5.7% (1QFY18)
64.75 (Oct)
2.60% (Sep)
3.28% (Sep)
0.9% (Jul)
6.1% (4QFY17)
65.28 (Sep)
3.24% (Aug)
3.28% (Aug)
-5
9
12
-4
6.07
6.19
6.50
6.58
INDICATORS
Credit Markets
Credit Spreads
Credit Spread as on 31st October, 2017
Tenure 6M 1Y 2Y 3Y 5Y 7Y 10Y 15Y
AAA 0.50% 0.57% 0.37% 0.36% 0.30% 0.35% 0.61% 0.21%
AA+ 0.72% 0.83% 0.59% 0.66% 0.66% 0.68% 0.95% 0.56%
AA 0.97% 1.08% 0.84% 0.93% 0.95% 0.97% 1.43% 0.93%
AA- 1.11% 1.23% 1.09% 1.25% 1.28% 1.33% 1.83% 1.42%
A+ 1.37% 1.47% 1.30% 1.54% 1.57% 1.57% 2.17% 1.76%
A 1.54% 1.64% 1.62% 1.86% 1.91% 1.92% 2.42% 2.01%
A- 1.86% 1.96% 2.01% 2.53% 2.51% 2.59% 3.02% 2.67%
Data Source – RBI, Mospi.Nic.in, CRISIL Fixed Income Database, LAF – Liquidity Adjustment Facility, MSF – Marginal Standing Facility, SLF – Standing Liquidity Facility, CP - Commercial Paper, CD – Certificate of Deposit, CB – Corporate Bond, IIP – India Industrial Production, CPI – Consumer Price Index, WPI – Wholesale Price Index, CAD – Current Account Deficit, GDP – Gross Domestic Product
Source: CRISIL
Spread Market Data in basis points
Credit Ratio
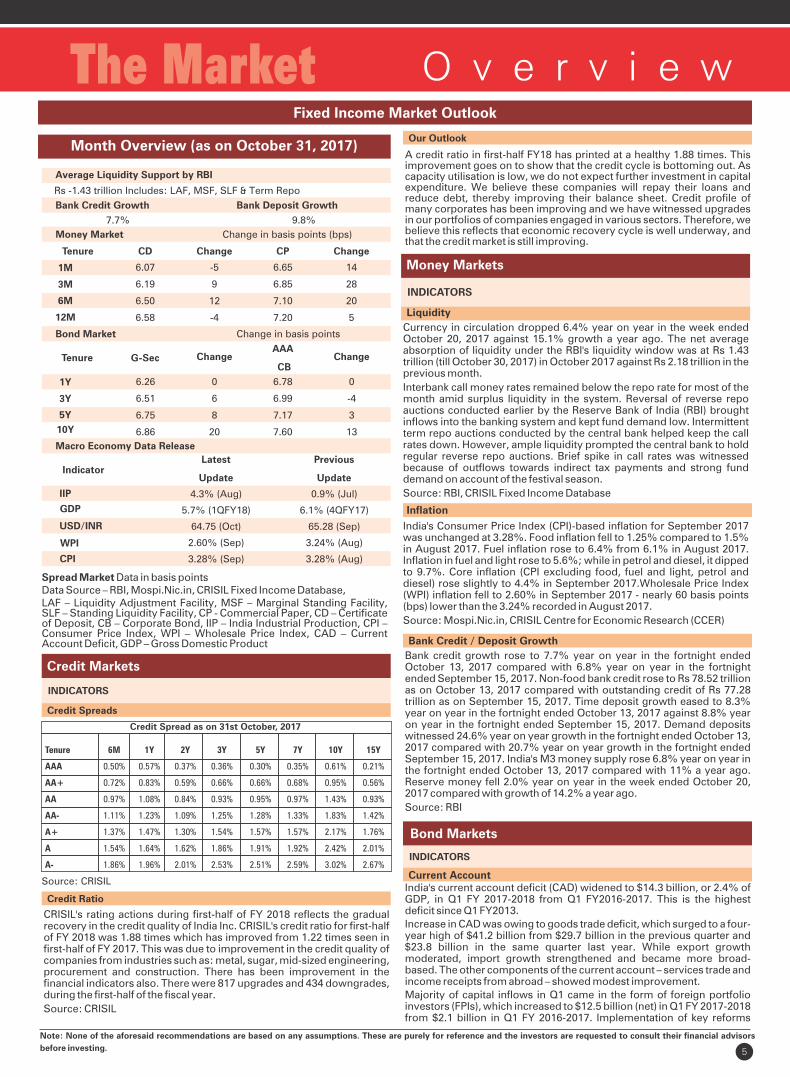
CRISIL's rating actions during first-half of FY 2018 reflects the gradual recovery in the credit quality of India Inc. CRISIL's credit ratio for first-half of FY 2018 was 1.88 times which has improved from 1.22 times seen in first-half of FY 2017. This was due to improvement in the credit quality of companies from industries such as: metal, sugar, mid-sized engineering, procurement and construction. There has been improvement in the financial indicators also. There were 817 upgrades and 434 downgrades, during the first-half of the fiscal year.
Source: CRISIL
Bank Credit / Deposit Growth
Bank credit growth rose to 7.7% year on year in the fortnight ended October 13, 2017 compared with 6.8% year on year in the fortnight ended September 15, 2017. Non-food bank credit rose to Rs 78.52 trillion as on October 13, 2017 compared with outstanding credit of Rs 77.28 trillion as on September 15, 2017. Time deposit growth eased to 8.3% year on year in the fortnight ended October 13, 2017 against 8.8% year on year in the fortnight ended September 15, 2017. Demand deposits witnessed 24.6% year on year growth in the fortnight ended October 13, 2017 compared with 20.7% year on year growth in the fortnight ended September 15, 2017. India's M3 money supply rose 6.8% year on year in the fortnight ended October 13, 2017 compared with 11% a year ago. Reserve money fell 2.0% year on year in the week ended October 20, 2017 compared with growth of 14.2% a year ago.
Source: RBI
Our Outlook
A credit ratio in first-half FY18 has printed at a healthy 1.88 times. This improvement goes on to show that the credit cycle is bottoming out. As capacity utilisation is low, we do not expect further investment in capital expenditure. We believe these companies will repay their loans and reduce debt, thereby improving their balance sheet. Credit profile of many corporates has been improving and we have witnessed upgrades in our portfolios of companies engaged in various sectors. Therefore, we believe this reflects that economic recovery cycle is well underway, and that the credit market is still improving.
Inflation
India's Consumer Price Index (CPI)-based inflation for September 2017 was unchanged at 3.28%. Food inflation fell to 1.25% compared to 1.5% in August 2017. Fuel inflation rose to 6.4% from 6.1% in August 2017. Inflation in fuel and light rose to 5.6%; while in petrol and diesel, it dipped to 9.7%. Core inflation (CPI excluding food, fuel and light, petrol and diesel) rose slightly to 4.4% in September 2017.Wholesale Price Index (WPI) inflation fell to 2.60% in September 2017 - nearly 60 basis points (bps) lower than the 3.24% recorded in August 2017.
Source: Mospi.Nic.in, CRISIL Centre for Economic Research (CCER)
Currency in circulation dropped 6.4% year on year in the week ended October 20, 2017 against 15.1% growth a year ago. The net average absorption of liquidity under the RBI's liquidity window was at Rs 1.43 trillion (till October 30, 2017) in October 2017 against Rs 2.18 trillion in the previous month.
Interbank call money rates remained below the repo rate for most of the month amid surplus liquidity in the system. Reversal of reverse repo auctions conducted earlier by the Reserve Bank of India (RBI) brought inflows into the banking system and kept fund demand low. Intermittent term repo auctions conducted by the central bank helped keep the call rates down. However, ample liquidity prompted the central bank to hold regular reverse repo auctions. Brief spike in call rates was witnessed because of outflows towards indirect tax payments and strong fund demand on account of the festival season.
Source: RBI, CRISIL Fixed Income Database
Money Markets
INDICATORS
Liquidity
INDICATORS
Bond Markets
Current Account India's current account deficit (CAD) widened to $14.3 billion, or 2.4% of GDP, in Q1 FY 2017-2018 from Q1 FY2016-2017. This is the highest deficit since Q1 FY2013.
Increase in CAD was owing to goods trade deficit, which surged to a four-year high of $41.2 billion from $29.7 billion in the previous quarter and $23.8 billion in the same quarter last year. While export growth moderated, import growth strengthened and became more broad-based. The other components of the current account – services trade and income receipts from abroad – showed modest improvement.
Majority of capital inflows in Q1 came in the form of foreign portfolio investors (FPIs), which increased to $12.5 billion (net) in Q1 FY 2017-2018 from $2.1 billion in Q1 FY 2016-2017. Implementation of key reforms
5
O v e r v i e wThe MarketFixed Income Market Outlook
Note: None of the aforesaid recommendations are based on any assumptions. These are purely for reference and the investors are requested to consult their financial advisors before investing. 6
Physical assets
Indian gold prices ended down by 1.62% to end at Rs 29,220 per 10 gms on NCDEX despite the festive season in October owing to weak domestic demand. Subdued global market also dampened sentiment for domestic gold prices.
Source: NCDEX
Government Borrowing
In the Union Budget 2017-18, the government pegged the net market borrowing at Rs 3.48 trillion after taking into account the buyback of Rs 750 billion in FY18 compared to Rs 4.07 trillion (after cancelling Rs 180 billion of auctions in January 2017) in FY17. The Centre will borrow Rs 2.08 trillion in the second half of FY18, sticking to the aggregate gross market borrowing target of Rs 5.80 trillion planned in FY18. However, the government said the need for additional borrowing will be assessed in December 2017 once the supplementary demand for grants is placed in the Parliament. Auctions of government securities worth Rs 600 billion are scheduled for November 2017.
Source: Union Budget 2017-18, RBI
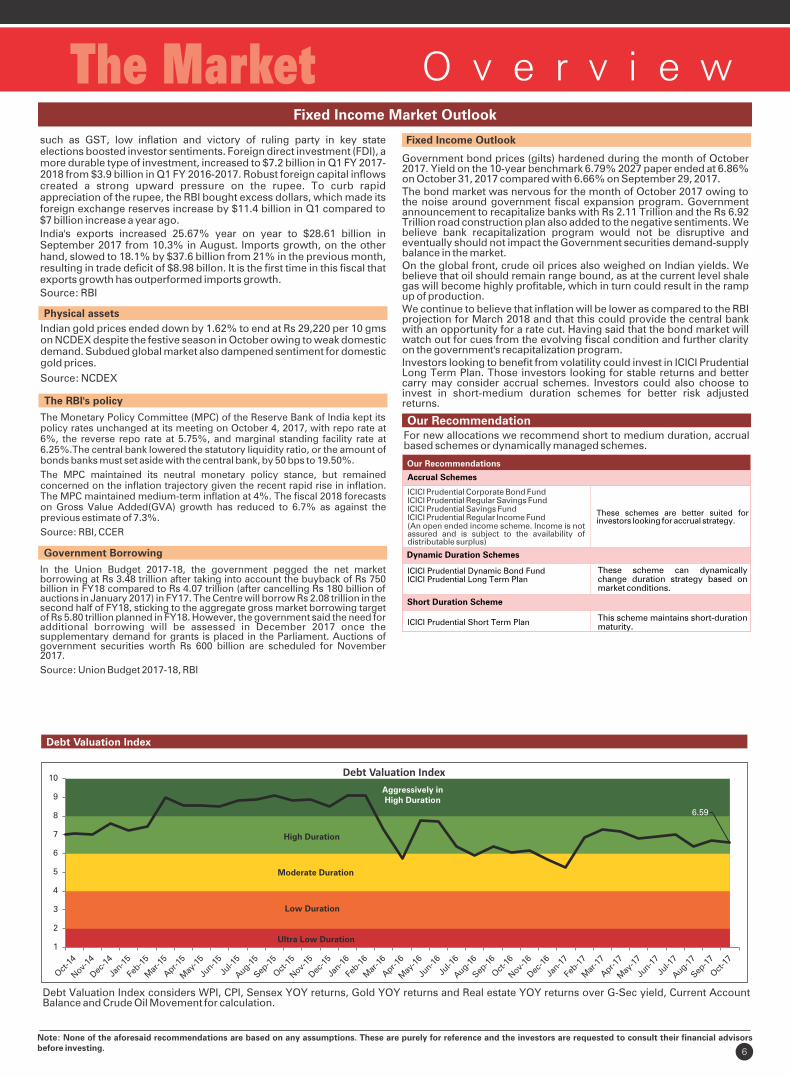
Debt Valuation Index
The RBI's policy
The Monetary Policy Committee (MPC) of the Reserve Bank of India kept its policy rates unchanged at its meeting on October 4, 2017, with repo rate at 6%, the reverse repo rate at 5.75%, and marginal standing facility rate at 6.25%.The central bank lowered the statutory liquidity ratio, or the amount of bonds banks must set aside with the central bank, by 50 bps to 19.50%.
The MPC maintained its neutral monetary policy stance, but remained concerned on the inflation trajectory given the recent rapid rise in inflation. The MPC maintained medium-term inflation at 4%. The fiscal 2018 forecasts on Gross Value Added(GVA) growth has reduced to 6.7% as against the previous estimate of 7.3%.
Source: RBI, CCER
such as GST, low inflation and victory of ruling party in key state elections boosted investor sentiments. Foreign direct investment (FDI), a more durable type of investment, increased to $7.2 billion in Q1 FY 2017-2018 from $3.9 billion in Q1 FY 2016-2017. Robust foreign capital inflows created a strong upward pressure on the rupee. To curb rapid appreciation of the rupee, the RBI bought excess dollars, which made its foreign exchange reserves increase by $11.4 billion in Q1 compared to $7 billion increase a year ago.
India's exports increased 25.67% year on year to $28.61 billion in September 2017 from 10.3% in August. Imports growth, on the other hand, slowed to 18.1% by $37.6 billion from 21% in the previous month, resulting in trade deficit of $8.98 billon. It is the first time in this fiscal that exports growth has outperformed imports growth.
Source: RBI
Debt Valuation Index considers WPI, CPI, Sensex YOY returns, Gold YOY returns and Real estate YOY returns over G-Sec yield, Current Account Balance and Crude Oil Movement for calculation.
Fixed Income Outlook
Government bond prices (gilts) hardened during the month of October 2017. Yield on the 10-year benchmark 6.79% 2027 paper ended at 6.86% on October 31, 2017 compared with 6.66% on September 29, 2017. The bond market was nervous for the month of October 2017 owing to the noise around government fiscal expansion program. Government announcement to recapitalize banks with Rs 2.11 Trillion and the Rs 6.92 Trillion road construction plan also added to the negative sentiments. We believe bank recapitalization program would not be disruptive and eventually should not impact the Government securities demand-supply balance in the market.On the global front, crude oil prices also weighed on Indian yields. We believe that oil should remain range bound, as at the current level shale gas will become highly profitable, which in turn could result in the ramp up of production.We continue to believe that inflation will be lower as compared to the RBI projection for March 2018 and that this could provide the central bank with an opportunity for a rate cut. Having said that the bond market will watch out for cues from the evolving fiscal condition and further clarity on the government's recapitalization program.Investors looking to benefit from volatility could invest in ICICI Prudential Long Term Plan. Those investors looking for stable returns and better carry may consider accrual schemes. Investors could also choose to invest in short-medium duration schemes for better risk adjusted returns.
Accrual Schemes
These scheme can dynamically change duration strategy based on market conditions.
These schemes are better suited for investors looking for accrual strategy.
Dynamic Duration Schemes
Our Recommendations
Our RecommendationFor new allocations we recommend short to medium duration, accrual based schemes or dynamically managed schemes.
ICICI Prudential Corporate Bond FundICICI Prudential Regular Savings FundICICI Prudential Savings FundICICI Prudential Regular Income Fund(An open ended income scheme. Income is not assured and is subject to the availability of distributable surplus)
ICICI Prudential Dynamic Bond FundICICI Prudential Long Term Plan
Short Duration Scheme
ICICI Prudential Short Term PlanThis scheme maintains short-duration maturity.
Debt Valuation Index
6.59
1
2
3
4
5
6
7
8
9
10
Ultra Low Duration
Low Duration
Moderate Duration
High Duration
Aggressively in High Duration
Fund Name Brief Description Page No.
Index
Equity Funds
Abbreviations
Large Cap
ICICI Prudential Focused Bluechip Equity Fund IPFBEF Diversified Largecap Equity fund focussed on Top 200 stocks by Market capitalisation 9
ICICI Prudential Select Large Cap Fund IPSLCF Concentrated Large Cap Fund 10
Large & Mid-cap
A large and mid cap equity Fund with high variation in sector allocation ICICI Prudential Top 100 Fund IPT100F compared to benchmark 11
Multi-cap
ICICI Prudential Dynamic Plan IPDP Conservative multi-cap Fund investing in equity and debt. 12
ICICI Prudential Multicap Fund IPMULTIF Diversified equity fund investing in a mix of large, mid and small cap stocks 13
Value Style
ICICI Prudential Dividend Yield Equity Fund IPDYEF Equity Fund which invests in high dividend yield stocks 14
ICICI Prudential Value Discovery Fund IPVDF Diversified Value Style Investing with flexicap approach 15
Mid Cap
ICICI Prudential Midcap Fund IPMIDF Diversified Mid-Cap Oriented Fund 16
Thematic/Sectoral
ICICI Prudential Infrastructure Fund IPIF Thematic Fund encompassing Infrastructure 17
ICICI Prudential Technology Fund IPTF Technology Sector Oriented Fund 18
ICICI Prudential FMCG Fund IPFF FMCG Sector Oriented Fund 19
ICICI Prudential Banking & Financial Services Fund IPBFSF Banking & Financial Services Sector Oriented Fund 20
ICICI Prudential Exports and Other Services Fund IPEOSF Exports and Services Industry Oriented Thematic Fund 21
Tax Planning
ICICI Prudential Long Term Equity Fund (Tax Saving) IPLTEF(TS) Open Ended Equity Scheme with Tax Saving advantage 22
International
Open ended Fund of Funds Scheme investing in overseas mutual fund schemes ICICI Prudential Global Stable Equity Fund IPGSEF 23 which invest in stable companies globally
ICICI Prudential US Bluechip Equity Fund IPUSBEF International Equity Scheme investing in Companies listed on the US Stock Markets 24
ICICI Prudential Indo Asia Equity Fund IPIAEF Blend of Indian & Asian Equities (through an International Fund) Fund 25
Arbitrage
ICICI Prudential Equity - Arbitrage Fund IPEAF Equity Arbitrage Fund 26-27
Close Ended Equity Funds
ICICI Prudential Growth Fund - Series 1 IPGF1 Close ended equity scheme 28
ICICI Prudential Growth Fund - Series 2 IPGF2 Close ended equity scheme 29
ICICI Prudential Growth Fund - Series 3 IPGF3 Close ended equity scheme 30
ICICI Prudential Growth Fund - Series 4 IPGF4 Close ended equity scheme 31
ICICI Prudential Growth Fund - Series 5 IPGF5 Close ended equity scheme 32
ICICI Prudential Growth Fund - Series 6 IPGF6 Close ended equity scheme 33
ICICI Prudential Growth Fund - Series 7 IPGF7 Close ended equity scheme 34
ICICI Prudential Growth Fund - Series 8 IPGF8 Close ended equity scheme 35
ICICI Prudential Value Fund - Series 1 IPVF1 Close ended equity scheme 36
ICICI Prudential Value Fund - Series 2 IPVF2 Close ended equity scheme 37
ICICI Prudential Value Fund - Series 3 IPVF3 Close ended equity scheme 38
ICICI Prudential Value Fund - Series 4 IPVF4 Close ended equity scheme 39
ICICI Prudential Value Fund - Series 5 IPVF5 Close ended equity scheme 40
ICICI Prudential Value Fund - Series 6 IPVF6 Close ended equity scheme 41
ICICI Prudential Value Fund - Series 7 IPVF7 Close ended equity scheme 42
ICICI Prudential Value Fund - Series 8 IPVF8 Close ended equity scheme 43
ICICI Prudential Value Fund - Series 9 IPVF9 Close ended equity scheme 44
ICICI Prudential Value Fund - Series 10 IPVF10 Close ended equity scheme 45
ICICI Prudential Value Fund - Series 11 IPVF11 Close ended equity scheme 46
ICICI Prudential Value Fund - Series 12 IPVF12 Close ended equity scheme 47
ICICI Prudential Value Fund - Series 13 IPVF13 Close ended equity scheme 48
ICICI Prudential Value Fund - Series 14 IPVF14 Close ended equity scheme 49
ICICI Prudential Value Fund - Series 15 IPVF15 Close ended equity scheme 50
ICICI Prudential Value Fund - Series 16 IPVF16 Close ended equity scheme 51
ICICI Prudential Value Fund - Series 17 IPVF17 Close ended equity scheme 52
ICICI Prudential Value Fund - Series 18 IPVF18 Close ended equity scheme 53
ICICI Prudential India Recovery Fund – Series 1 IPIRF1 Close ended equity scheme 54
ICICI Prudential India Recovery Fund – Series 2 IPIRF2 Close ended equity scheme 55
ICICI Prudential India Recovery Fund - Series 3 IPIRF3 Close ended equity scheme 56
ICICI Prudential India Recovery Fund - Series 4 IPIRF4 Close ended equity scheme 57
ICICI Prudential India Recovery Fund - Series 5 IPIRF5 Close ended equity scheme 58
ICICI Prudential India Recovery Fund - Series 7 IPIRF7 Close ended equity scheme 59
ICICI Prudential Business Cycle Fund - Series 1 IPBCF1 Close ended equity scheme 60
ICICI Prudential Business Cycle Fund - Series 2 IPBCF2 Close ended equity scheme 61
ICICI Prudential Business Cycle Fund - Series 3 IPBCF3 Close ended equity scheme 62
ICICI Prudential R.I.G.H.T (Rewards of investing & generation ofIPRIGHT Closed Ended ELSS 63
healthy tax savings) Fund
Balanced
ICICI Prudential Balanced Fund IPBF A balanced Fund with allocation to equity (ranging from 65-80%) and Debt. 64
ICICI Prudential Child Care Plan (Gift Plan) IPCCP(GP) Diversified Long Term Child Benefit Oriented Plan 65
Equity Oriented Dynamic Asset Allocation
ICICI Prudential Balanced Advantage Fund IPBAF Asset Allocation Fund with equity exposure ranging between 30-80% and has exposure to debt. 66
Asset Allocation Fund with allocation to equity (range 20% -40%), ICICI Prudential Equity Income Fund IPEIF 67 arbitrage and fixed income. Index and ETFs ICICI Prudential Nifty 100 iWIN ETF IPN100ETF Exchange Traded Nifty 100 ETF 68ICICI Prudential Nifty Index Fund IPNIF Nifty Index Fund 69ICICI Prudential Nifty iWIN ETF IPNETF Exchange Traded Nifty Fund 70ICICI Prudential Nifty Low Vol 30 iWIN ETF IPNLV30ETF An open-ended Index Exchange Traded Fund 71ICICI Prudential Nifty Next 50 Index Fund IPNN50IF Index Fund 72
ICICI Prudential Sensex Index Fund IPSIF Sensex Index fund 73ICICI Prudential NV20 iWIN ETF IPNV20ETF An open-ended Index Exchange Traded Fund 74ICICI Prudential Sensex iWIN ETF IPSETF Exchange Traded Sensex Fund 75ICICI Prudential Midcap Select iWIN ETF IPMSETF An open-ended Index Exchange Traded Fund 76 Gold Funds & ETFs ICICI Prudential Gold iWIN ETF IPGETF Gold Exchange Traded Fund 77ICICI Prudential Regular Gold Savings Fund IPRGSF Open Ended Fund of Funds Scheme investing in Gold iWIN ETF 78
7
Debt Funds
8
Fund Name Brief Description Page No.
Hybrid Others
ICICI Prudential Child Care Plan (Study Plan) IPCCP(SP) Child Benefit Oriented Plan 82
Liquid
ICICI Prudential Money Market Fund IPMMF Open Ended Money Market Fund 83
Ultra Short Term
ICICI Prudential Savings Fund IPSF Ultra Short Term Income Fund with exposure to Floating rate instruments 84
ICICI Prudential Ultra Short Term Plan IPUSTP Ultra Short Term Income Fund with moderate duration 85
Short Term
ICICI Prudential Dynamic Bond Fund IPDBF Actively Managed Dynamic Bond Fund with 1 - 5 years Modified duration range 86
ICICI Prudential Short Term Plan IPSTP Short Term Income Fund 87
Credit Opportunities
ICICI Prudential Regular Savings Fund IPRSF Retail Debt-Accrual Fund 88
ICICI Prudential Corporate Bond Fund IPCBF Medium Term Income Fund investing in Corporate Bonds 89
Income
ICICI Prudential Income Opportunities Fund IPIOF Long Term Income Fund investing predominantly in higher maturity corporate bonds 90
ICICI Prudential Income Plan IPIP Long Term Income Fund with high duration strategy 91
ICICI Prudential Long Term Plan IPLTP Dynamic Income Fund with 1 to 10 years Modified Duration range 92
Gilt Short Term
ICICI Prudential Gilt Fund - Treasury Plan - PF Option IPGFTP(PF) Short Term Gilt Fund 93
ICICI Prudential Short Term Gilt Fund IPSTGF Short Term Gilt Fund 94
Gilt Long Term
ICICI Prudential Constant Maturity Gilt Fund IPCMGF Open Ended GIlt Fund with static duration strategy 95
ICICI Prudential Gilt Fund - Investment Plan - PF Option IPGFIP(PF) Gilt Fund with very high duration strategy 96
ICICI Prudential Long Term Gilt Fund IPLTGF Gilt Fund with high duration strategy 97
ICICI Prudential Advisor Series IPAS Fund of Funds Scheme 98
Annexure for Returns of all the Schemes 99-122
Systematic Investment Plan (SIP) Performance of Select Schemes 123-125
Annexure - I 126
Annexure - II 127
Dividend History for all Schemes 127-135
Investment Objective of all the schemes 136-139
Schedule 1: One Liner Definitions 140
Schedule 2: How To Read Factsheet 141-142
Statutory Details & Risk Factors 143
IndexAbbreviations
ICICI Prudential Regular Income Fund (An open ended income fund. IPRIF A hybrid debt Fund which generally invests 0-5% in Equity 81
Income is not assured and is subject to the availability of distributable surplus.)
ICICI Prudential Monthly Income Plan (An open ended income fund.
Monthly income is not assured and is subject to the availability of IPMIP Hybrid Fund which generally invests 0-15% in Equity 80distributable surplus.)
MIP
ICICI Prudential MIP 25 (An open ended Income fund. Monthly income is IPMIP25 Hybrid Fund which generally invests 0-25% in Equity 79
not assured and is subject to the availability of distributable surplus.)
Hybrid Funds
Style Box
Quantitative Indicators
Fund Details
• Top Ten HoldingsDerivatives are considered at exposure value.
Fund Managers** :
Sankaran Naren(Managing this fund since Jul, 2017 & Overall 26 years of experience)Rajat Chandak(Managing this fund since Jul, 2017 &Overall 8 years of experience)
Indicative Investment Horizon: 5 yearsand above
Inception/Allotment date: 23-May-08
Options :Growth & Dividend(dividend payout*** and re-investment facility available)
Application Amount for freshSubscription :Rs.5,000 (plus in multiples of Re.1)
Min.Addl.Investment :Rs.500 (plus in multiples of Re.1) (w.e.f. 10-January-17)
Exit load for Redemption / Switchout :- Lumpsum & SIP / STP / SWP OptionUpto 1 Year from allotment - 1% of appli-cable NAV, more than 1 Year - Nil
##SIP :Monthly Frequency: Rs. 500/- and in multiple of Rs. 1/-Quarterly Frequency: Rs. 5,000/- and in multiple of Rs. 1/-
&&SWP :Rs. 500/- and in multiples of Rs. 1/-
STP/ Flex STP/ Value STP *:Daily Frequency: Rs. 250/- and inmultiples of Rs. 50/-Weekly, Monthly and Quarterly Frequency: Rs. 1,000/- and in multiples of Rs. 1/-
Min.Redemption Amt. :500/- or all units where amount is below 500/-
9
Std Dev (Annualised) : 13.22% Sharpe Ratio : 0.46
Average P/E : 28.46 Average P/BV : 5.74 Average Dividend Yield : 1.19
Portfolio Beta : 0.95 R squared : 0.95
Portfolio turnover has been computed as the ratio of the lower value of purchase and sales, to the average net assets in the past one year (since inception for schemes that have not completed a year). The figures are not netted for derivative transactions.Risk-free rate based on the last Overnight MIBOR cut-off of 6.00%**In addition to the fund manager managing this fund, the ADR/GDR exposure is managed by Ms. Priyanka Khandelwal.@@ Total Expense Ratio is weighted average for the month. Ratio excludes Goods and Service Tax on management fees and includes B-15 clawback reversal, if any.## Minimum number of installments for monthly frequency will be 6 and for Quarterly frequency will be 4. w.e.f February 01, 2017.* Minimum number of installments for daily, weekly and monthly frequency will be 6 and for Quarterly frequency will be 4. w.e.f February 01, 2017. Refer page No. 142 for definition of Flex STP and Value STP.&&
Minimum number of installments for both monthly and quarterly will be 2. w.e.f February 01, 2017.*** In case the unit holder has opted for dividend payout option, the minimum amount for dividend payout shall be 100 (net of dividend distribution tax and other statutory levy, if any), else the dividend would be mandatorily reinvested.
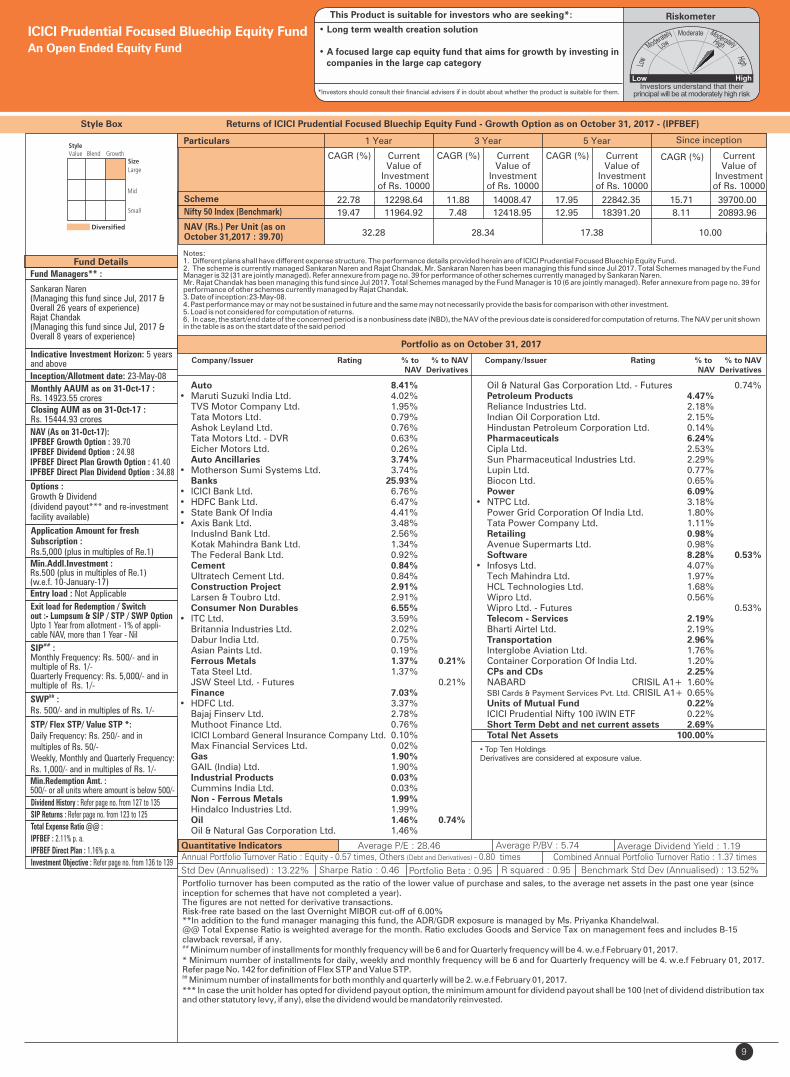
Style Box Returns of ICICI Prudential Focused Bluechip Equity Fund - Growth Option as on October 31, 2017 - (IPFBEF)
Monthly AAUM as on 31-Oct-17 : Rs. 14923.55 crores
Portfolio as on October 31, 2017
ICICI Prudential Focused Bluechip Equity FundAn Open Ended Equity Fund
Auto 8.41% • Maruti Suzuki India Ltd. 4.02% TVS Motor Company Ltd. 1.95% Tata Motors Ltd. 0.79% Ashok Leyland Ltd. 0.76% Tata Motors Ltd. - DVR 0.63% Eicher Motors Ltd. 0.26% Auto Ancillaries 3.74% • Motherson Sumi Systems Ltd. 3.74% Banks 25.93% • ICICI Bank Ltd. 6.76% • HDFC Bank Ltd. 6.47% • State Bank Of India 4.41% • Axis Bank Ltd. 3.48% IndusInd Bank Ltd. 2.56% Kotak Mahindra Bank Ltd. 1.34% The Federal Bank Ltd. 0.92% Cement 0.84% Ultratech Cement Ltd. 0.84% Construction Project 2.91% Larsen & Toubro Ltd. 2.91% Consumer Non Durables 6.55% • ITC Ltd. 3.59% Britannia Industries Ltd. 2.02% Dabur India Ltd. 0.75% Asian Paints Ltd. 0.19% Ferrous Metals 1.37% 0.21% Tata Steel Ltd. 1.37% JSW Steel Ltd. - Futures 0.21% Finance 7.03% • HDFC Ltd. 3.37% Bajaj Finserv Ltd. 2.78% Muthoot Finance Ltd. 0.76% ICICI Lombard General Insurance Company Ltd. 0.10% Max Financial Services Ltd. 0.02% Gas 1.90% GAIL (India) Ltd. 1.90% Industrial Products 0.03% Cummins India Ltd. 0.03% Non - Ferrous Metals 1.99% Hindalco Industries Ltd. 1.99% Oil 1.46% 0.74% Oil & Natural Gas Corporation Ltd. 1.46%
Oil & Natural Gas Corporation Ltd. - Futures 0.74% Petroleum Products 4.47% Reliance Industries Ltd. 2.18% Indian Oil Corporation Ltd. 2.15% Hindustan Petroleum Corporation Ltd. 0.14% Pharmaceuticals 6.24% Cipla Ltd. 2.53% Sun Pharmaceutical Industries Ltd. 2.29% Lupin Ltd. 0.77% Biocon Ltd. 0.65% Power 6.09% • NTPC Ltd. 3.18% Power Grid Corporation Of India Ltd. 1.80% Tata Power Company Ltd. 1.11% Retailing 0.98% Avenue Supermarts Ltd. 0.98% Software 8.28% 0.53%• Infosys Ltd. 4.07% Tech Mahindra Ltd. 1.97% HCL Technologies Ltd. 1.68% Wipro Ltd. 0.56% Wipro Ltd. - Futures 0.53% Telecom - Services 2.19% Bharti Airtel Ltd. 2.19% Transportation 2.96% Interglobe Aviation Ltd. 1.76% Container Corporation Of India Ltd. 1.20% CPs and CDs 2.25% NABARD CRISIL A1+ 1.60% SBI Cards & Payment Services Pvt. Ltd. CRISIL A1+ 0.65% Units of Mutual Fund 0.22% ICICI Prudential Nifty 100 iWIN ETF 0.22% Short Term Debt and net current assets 2.69% Total Net Assets 100.00%
NAV (As on 31-Oct-17):IPFBEF Growth Option : 39.70IPFBEF Dividend Option : 24.98IPFBEF Direct Plan Growth Option : 41.40IPFBEF Direct Plan Dividend Option : 34.88
Closing AUM as on 31-Oct-17 : Rs. 15444.93 crores
Benchmark Std Dev (Annualised) : 13.52%
Entry load : Not Applicable
Dividend History : Refer page no. from 127 to 135
SIP Returns : Refer page no. from 123 to 125
Total Expense Ratio @@ :
IPFBEF : 2.11% p. a.
IPFBEF Direct Plan : 1.16% p. a.
Investment Objective : Refer page no. from 136 to 139
Riskometer
• Long term wealth creation solution
• A focused large cap equity fund that aims for growth by investing in companies in the large cap category
This Product is suitable for investors who are seeking*:
*Investors should consult their financial advisers if in doubt about whether the product is suitable for them.
Annual Portfolio Turnover Ratio : Equity - 0.57 times, Others (Debt and Derivatives) - 0.80 times Combined Annual Portfolio Turnover Ratio : 1.37 times
Notes:1. Different plans shall have different expense structure. The performance details provided herein are of ICICI Prudential Focused Bluechip Equity Fund.2. The scheme is currently managed Sankaran Naren and . Mr. Sankaran Naren has been managing this fund since Jul 2017. Total Schemes managed by the Fund Rajat ChandakManager . Refer annexure from page no. 39 for performance of other schemes currently managed by Sankaran Naren.is 32 (31 are jointly managed)Mr. has been managing this fund since . Total Schemes managed by the Fund Manager . Refer annexure from page no. 39 for Rajat Chandak Jul 2017 is 10 (6 are jointly managed)performance of other schemes currently managed by . Rajat Chandak3. Date of inception:23-May-08.4. Past performance may or may not be sustained in future and the same may not necessarily provide the basis for comparison with other investment.5. Load is not considered for computation of returns.6. In case, the start/end date of the concerned period is a nonbusiness date (NBD), the NAV of the previous date is considered for computation of returns. The NAV per unit shown in the table is as on the start date of the said period
Scheme
NAV (Rs.) Per Unit (as on October 31,2017 : 39.70)
CAGR (%)
10.00
Nifty 50 Index (Benchmark)
Since inception
CurrentValue of
Investment of Rs. 10000
CAGR (%) Current Value of
Investment of Rs. 10000
1 Year 3 Year 5 Year
CAGR (%) Current Value of
Investment of Rs. 10000
CAGR (%) Current Value of
Investment of Rs. 10000
32.28 28.34 17.38
Particulars
22.78 12298.64 11.88 14008.47 17.95 22842.35 15.71 39700.00
19.47 11964.92 7.48 12418.95 12.95 18391.20 8.11 20893.96
Company/Issuer Rating % to % to NAV NAV Derivatives
Company/Issuer Rating % to % to NAV NAV Derivatives
Fund Managers **:
Mrinal Singh(Managing this fund since Dec, 2015 &Overall 14 years of experience)Vinay Sharma (Managing this fund since Apr, 2014 &Overall 11 years of experience)
Indicative Investment Horizon : 5 years and above
Inception/Allotment date: 28-May-09
NAV (As on 31-Oct-17):IPSLCF Growth Option : 28.74IPSLCF Dividend Option : 17.99IPSLCF Direct Plan Growth Option : 30.14IPSLCF Direct Plan Dividend Option : 26.71
Options :Growth, Dividend(dividend payout*** and re-investment facility available)
Application Amount for freshSubscription :Rs.5,000 (plus in multiples of Re.1)
Min.Addl.Investment :Rs.1,000 (plus in multiples of Re.1)
Exit load for Redemption / Switchout :- Lumpsum Investment OptionWithin 1 Year from allotment - 1% ofapplicable NAV, more than 1 Year - Nil
Min.Redemption Amt. :500/- or all units where amount is below 500/-
Std Dev (Annualised) : 13.81% Sharpe Ratio : 0.18
Average P/E : 18.36 Average P/BV : 3.46 Average Dividend Yield : 1.65
Portfolio Beta : 0.98 R squared : 0.93
Note : Default trigger is now set at 50% of the appreciation of NAV.Portfolio turnover has been computed as the ratio of the lower value of purchase and sales, to the average net assets in the past one year (since inception for schemes that have not completed a year). The figures are not netted for derivative transactions.Risk-free rate based on the last Overnight MIBOR cut-off of 6.00%**In addition to the fund manager managing this fund, the ADR/GDR exposure is managed by Ms. Priyanka Khandelwal.@@ Total Expense Ratio is weighted average for the month. Ratio excludes on management fees and includes B-15 clawback Goods and Service Taxreversal, if any.## Minimum number of installments for monthly frequency will be 6 and for Quarterly frequency will be 4. w.e.f February 01, 2017.* Minimum number of installments for daily, weekly and monthly frequency will be 6 and for Quarterly frequency will be 4. w.e.f February 01, 2017. Refer page No. 142 for definition of Flex STP and Value STP.&&
Minimum number of installments for both monthly and quarterly will be 2. w.e.f February 01, 2017.*** In case the unit holder has opted for dividend payout option, the minimum amount for dividend payout shall be 100 (net of dividend distribution tax and other statutory levy, if any), else the dividend would be mandatorily reinvested.
• Top Ten Holdings
Portfolio as on October 31, 2017
Monthly AAUM as on 31-Oct-17 : Rs. 655.07 crores
##SIP :Monthly Frequency: Rs. 1,000/- and in multiple of Rs. 1/-Quarterly Frequency: Rs. 5,000/- and in multiple of Rs. 1/-
STP/ Flex STP/ Value STP * :Daily Frequency: Rs. 250/- and in multiples of Rs. 50/-Weekly, Monthly and Quarterly Frequency: Rs. 1,000/- and in multiples of Rs. 1/-
Closing AUM as on 31-Oct-17 :Rs. 665.21 crores
Benchmark Std Dev (Annualised) : 13.63%
10
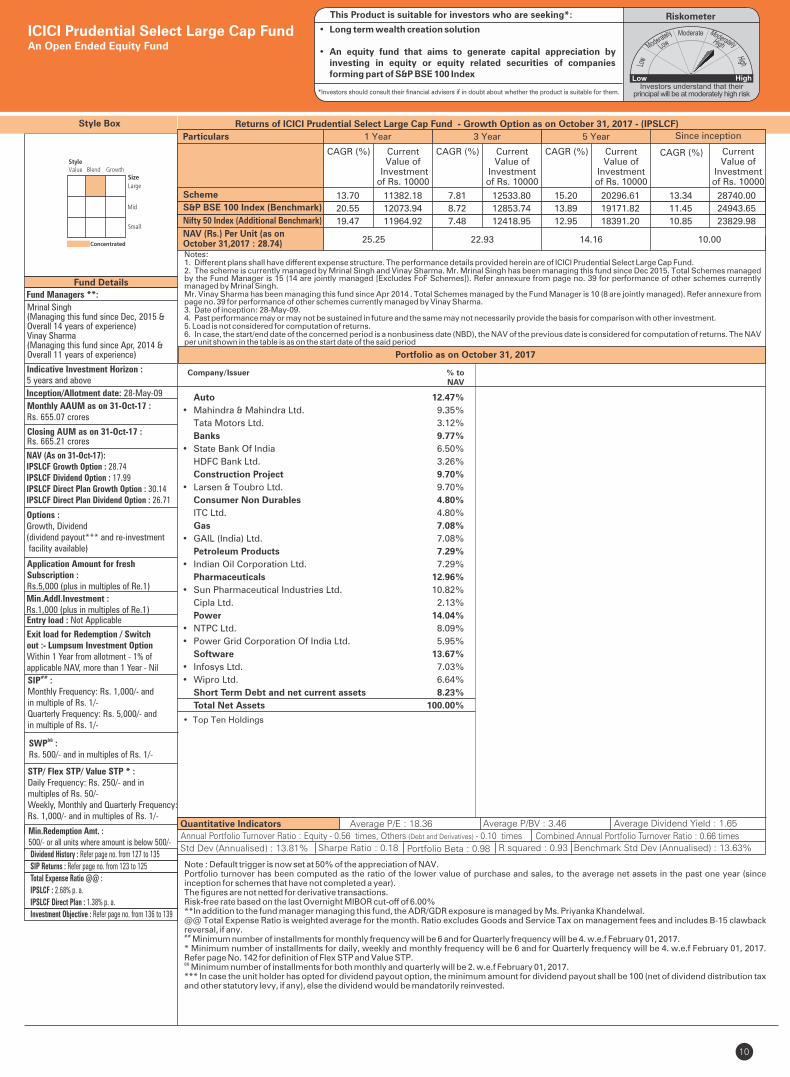
Style Box Returns of ICICI Prudential Select Large Cap Fund - Growth Option as on October 31, 2017 - (IPSLCF)
ICICI Prudential Select Large Cap FundAn Open Ended Equity Fund
Entry load : Not Applicable
RiskometerThis Product is suitable for investors who are seeking*:
• Long term wealth creation solution
• An equity fund that aims to generate capital appreciation by investing in equity or equity related securities of companies forming part of S&P BSE 100 Index
*Investors should consult their financial advisers if in doubt about whether the product is suitable for them.
&&SWP :Rs. 500/- and in multiples of Rs. 1/-
Annual Portfolio Turnover Ratio : Equity - 0.56 times, Others (Debt and Derivatives) - 0.10 times Combined Annual Portfolio Turnover Ratio : 0.66 times
Auto 12.47%
• Mahindra & Mahindra Ltd. 9.35%
Tata Motors Ltd. 3.12%
Banks 9.77%
• State Bank Of India 6.50%
HDFC Bank Ltd. 3.26%
Construction Project 9.70%
• Larsen & Toubro Ltd. 9.70%
Consumer Non Durables 4.80%
ITC Ltd. 4.80%
Gas 7.08%
• GAIL (India) Ltd. 7.08%
Petroleum Products 7.29%
• Indian Oil Corporation Ltd. 7.29%
Pharmaceuticals 12.96%
• Sun Pharmaceutical Industries Ltd. 10.82%
Cipla Ltd. 2.13%
Power 14.04%
• NTPC Ltd. 8.09%
• Power Grid Corporation Of India Ltd. 5.95%
Software 13.67%
• Infosys Ltd. 7.03%
• Wipro Ltd. 6.64%
Short Term Debt and net current assets 8.23%
Total Net Assets 100.00%
Company/Issuer % to NAV
Dividend History : Refer page no. from 127 to 135
SIP Returns : Refer page no. from 123 to 125
Total Expense Ratio @@ :
IPSLCF : 2.68% p. a.
IPSLCF Direct Plan : 1.38% p. a.
Investment Objective : Refer page no. from 136 to 139
Notes:1. Different plans shall have different expense structure. The performance details provided herein are of ICICI Prudential Select Large Cap Fund.2. The scheme is currently managed by Mrinal Singh and Vinay Sharma. Mr. Mrinal Singh has been managing this fund since Dec 2015. Total Schemes managed by the Fund Manager . Refer annexure from page no. 39 for performance of other schemes currently is 15 (14 are jointly managed [Excludes FoF Schemes])managed by Mrinal Singh. Mr. Vinay Sharma has been managing this fund since Apr 2014 . Total Schemes managed by the Fund Manager Refer annexure from is 10 (8 are jointly managed).page no. 39 for performance of other schemes currently managed by Vinay Sharma .3. Date of inception: 28-May-09.4. Past performance may or may not be sustained in future and the same may not necessarily provide the basis for comparison with other investment.5. Load is not considered for computation of returns.6. In case, the start/end date of the concerned period is a nonbusiness date (NBD), the NAV of the previous date is considered for computation of returns. The NAV per unit shown in the table is as on the start date of the said period
Scheme
Nifty 50 Index (Additional Benchmark)
NAV (Rs.) Per Unit (as on October 31,2017 : 28.74)
CAGR (%)
10.00
S&P BSE 100 Index (Benchmark)
Since inception
CurrentValue of
Investment of Rs. 10000
CAGR (%) Current Value of
Investment of Rs. 10000
1 Year 3 Year 5 Year
CAGR (%) Current Value of
Investment of Rs. 10000
CAGR (%) Current Value of
Investment of Rs. 10000
25.25 22.93 14.16
Particulars
13.70 11382.18 7.81 12533.80 15.20 20296.61 13.34 28740.00
20.55 12073.94 8.72 12853.74 13.89 19171.82 11.45 24943.65
19.47 11964.92 7.48 12418.95 12.95 18391.20 10.85 23829.98
11
Fund Details
Quantitative Indicators
Style Box
Portfolio as on October 31, 2017
Fund Managers** :
Sankaran Naren (Managing this fund from Feb 2012, earlier managed from Aug 2009 to Feb 2011 & has Overall 26 Years of experience)
Mr Prakash Gaurav Goel(Managing this fund since October, 2017 & Overall 14 years of experience)
Inception/Allotment date: 09-Jul-98
Indicative Investment Horizon: 5 yearsand above
NAV (As on 31-Oct-17):IPT100F Growth Option : 327.70IPT100F Dividend Option : 19.93IPT100F Direct Plan Growth Option : 342.17IPT100F Direct Plan Dividend Option : 25.96
Options :Growth, Dividend(dividend payout*** and re-investment facility available)
Application Amount for freshSubscription :Rs.5,000 (plus in multiples of Re.1)
Min.Addl.Investment :Rs.1,000 (plus in multiples of Re.1)
Exit load for Redemption / Switchout :- Lumpsum & SIP / STP / SWP OptionWithin 1 Year from allotment - 1% ofapplicable NAV, more than 1 Year - Nil
&&SWP :Rs. 500/- and in multiples of Rs. 1/-
STP/ Flex STP/ Value STP * :Daily Frequency: Rs. 250/- and in multiples of Rs. 50/-Weekly, Monthly and Quarterly Frequency: Rs. 1,000/- and in multiples of Rs. 1/-
Min.Redemption Amt. :500/- or all units where amount is below 500/-
Std Dev (Annualised) : 13.34% Sharpe Ratio : 0.42
Average P/E : 20.49 Average P/BV : 3.32 Average Dividend Yield : 1.58
Portfolio Beta : 0.92 R squared : 0.87
Portfolio turnover has been computed as the ratio of the lower value of purchase and sales, to the average net assets in the past one year (since inception for schemes that have not completed a year). The figures are not netted for derivative transactions.Risk-free rate based on the last Overnight MIBOR cut-off of 6.00%
**In addition to the fund manager managing this fund, the ADR/GDR exposure is managed by Ms. Priyanka Khandelwal.Industry classification is done as per Global Industry Classification Standard (GICS) by MSCI and Standard & Poor’s for Foreign Equity
Goods and Service Tax@@ Total Expense Ratio is weighted average for the month. Ratio excludes on management fees and includes B-15 clawback reversal, if any.
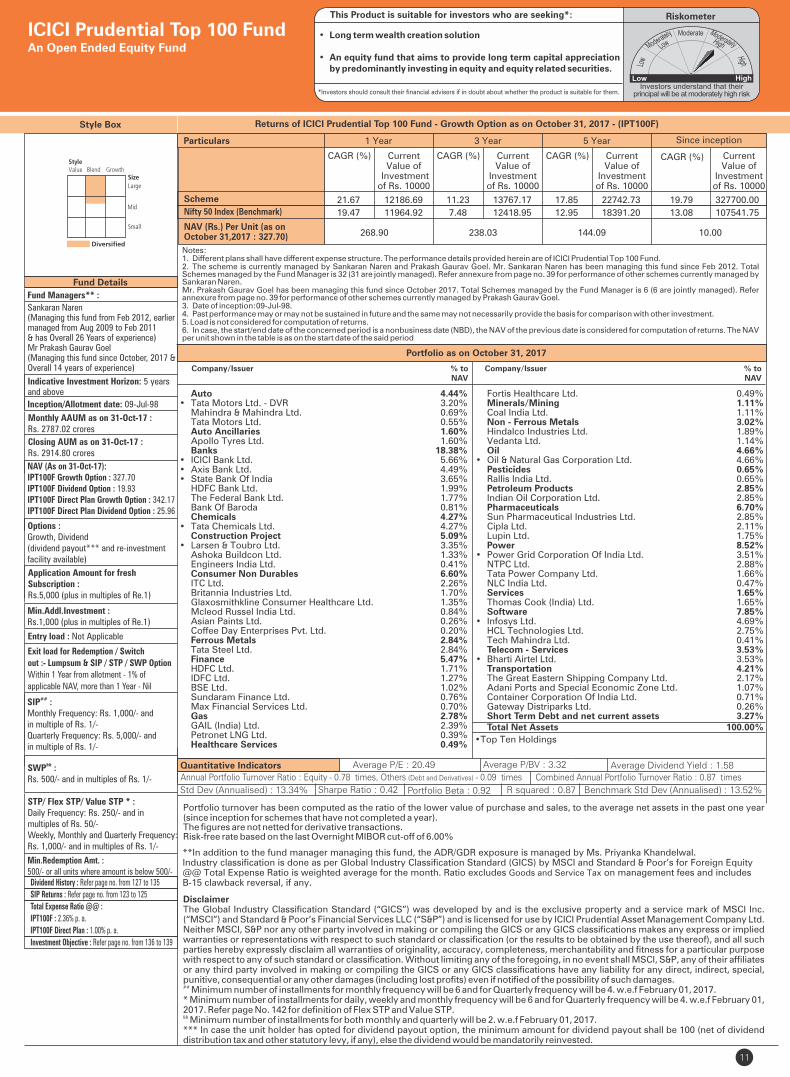
Returns of ICICI Prudential Top 100 Fund - Growth Option as on October 31, 2017 - (IPT100F)
Monthly AAUM as on 31-Oct-17 :Rs. 2787.02 crores
ICICI Prudential Top 100 FundAn Open Ended Equity Fund
Closing AUM as on 31-Oct-17 : Rs. 2914.80 crores
Benchmark Std Dev (Annualised) : 13.52%
Entry load : Not Applicable
RiskometerThis Product is suitable for investors who are seeking*:
• Long term wealth creation solution
• An equity fund that aims to provide long term capital appreciation by predominantly investing in equity and equity related securities.
*Investors should consult their financial advisers if in doubt about whether the product is suitable for them.
Annual Portfolio Turnover Ratio : Equity - 0.78 times, Others (Debt and Derivatives) - 0.09 times Combined Annual Portfolio Turnover Ratio : 0.87 times
DisclaimerThe Global Industry Classification Standard (“GICS”) was developed by and is the exclusive property and a service mark of MSCI Inc. (“MSCI”) and Standard & Poor’s Financial Services LLC (“S&P”) and is licensed for use by ICICI Prudential Asset Management Company Ltd. Neither MSCI, S&P nor any other party involved in making or compiling the GICS or any GICS classifications makes any express or implied warranties or representations with respect to such standard or classification (or the results to be obtained by the use thereof), and all such parties hereby expressly disclaim all warranties of originality, accuracy, completeness, merchantability and fitness for a particular purpose with respect to any of such standard or classification. Without limiting any of the foregoing, in no event shall MSCI, S&P, any of their affiliates or any third party involved in making or compiling the GICS or any GICS classifications have any liability for any direct, indirect, special, punitive, consequential or any other damages (including lost profits) even if notified of the possibility of such damages.## Minimum number of installments for monthly frequency will be 6 and for Quarterly frequency will be 4. w.e.f February 01, 2017.* Minimum number of installments for daily, weekly and monthly frequency will be 6 and for Quarterly frequency will be 4. w.e.f February 01, 2017. Refer page No. 142 for definition of Flex STP and Value STP.&& Minimum number of installments for both monthly and quarterly will be 2. w.e.f February 01, 2017.*** In case the unit holder has opted for dividend payout option, the minimum amount for dividend payout shall be 100 (net of dividend distribution tax and other statutory levy, if any), else the dividend would be mandatorily reinvested.
Dividend History : Refer page no. from 127 to 135
SIP Returns : Refer page no. from 123 to 125
Total Expense Ratio @@ :
IPT100F : 2.36% p. a.
IPT100F Direct Plan : 1.00% p. a.
Investment Objective : Refer page no. from 136 to 139
##SIP :Monthly Frequency: Rs. 1,000/- and in multiple of Rs. 1/-Quarterly Frequency: Rs. 5,000/- and in multiple of Rs. 1/-
Notes:1. Different plans shall have different expense structure. The performance details provided herein are of ICICI Prudential Top 100 Fund.2. The scheme is currently managed by Sankaran Naren and Prakash Gaurav Goel. Mr. Sankaran Naren has been managing this fund since Feb 2012. Total Schemes managed by the Fund Manager . Refer annexure from page no. 39 for performance of other schemes currently managed by is 32 (31 are jointly managed)Sankaran Naren.Mr. Prakash Gaurav Goel has been managing this fund since October 2017. Total Schemes managed by the Fund Manager . Refer is 6 (6 are jointly managed)annexure from page no. 39 for performance of other schemes currently managed by Prakash Gaurav Goel. 3. Date of inception:09-Jul-98.4. Past performance may or may not be sustained in future and the same may not necessarily provide the basis for comparison with other investment.5. Load is not considered for computation of returns.6. In case, the start/end date of the concerned period is a nonbusiness date (NBD), the NAV of the previous date is considered for computation of returns. The NAV per unit shown in the table is as on the start date of the said period
Scheme
NAV (Rs.) Per Unit (as on October 31,2017 : 327.70)
CAGR (%)
10.00
Nifty 50 Index (Benchmark)
Since inception
CurrentValue of
Investment of Rs. 10000
CAGR (%) Current Value of
Investment of Rs. 10000
1 Year 3 Year 5 Year
CAGR (%) Current Value of
Investment of Rs. 10000
CAGR (%) Current Value of
Investment of Rs. 10000
268.90 238.03 144.09
Particulars
21.67 12186.69 11.23 13767.17 17.85 22742.73 19.79 327700.00
19.47 11964.92 7.48 12418.95 12.95 18391.20 13.08 107541.75
Auto 4.44%• Tata Motors Ltd. - DVR 3.20% Mahindra & Mahindra Ltd. 0.69% Tata Motors Ltd. 0.55% Auto Ancillaries 1.60% Apollo Tyres Ltd. 1.60% Banks 18.38%• ICICI Bank Ltd. 5.66%• Axis Bank Ltd. 4.49%• State Bank Of India 3.65% HDFC Bank Ltd. 1.99% The Federal Bank Ltd. 1.77% Bank Of Baroda 0.81% Chemicals 4.27%• Tata Chemicals Ltd. 4.27% Construction Project 5.09%• Larsen & Toubro Ltd. 3.35% Ashoka Buildcon Ltd. 1.33% Engineers India Ltd. 0.41% Consumer Non Durables 6.60% ITC Ltd. 2.26% Britannia Industries Ltd. 1.70% Glaxosmithkline Consumer Healthcare Ltd. 1.35% Mcleod Russel India Ltd. 0.84% Asian Paints Ltd. 0.26% Coffee Day Enterprises Pvt. Ltd. 0.20% Ferrous Metals 2.84% Tata Steel Ltd. 2.84% Finance 5.47% HDFC Ltd. 1.71% IDFC Ltd. 1.27% BSE Ltd. 1.02% Sundaram Finance Ltd. 0.76% Max Financial Services Ltd. 0.70% Gas 2.78% GAIL (India) Ltd. 2.39% Petronet LNG Ltd. 0.39% Healthcare Services 0.49%
Fortis Healthcare Ltd. 0.49% Minerals/Mining 1.11% Coal India Ltd. 1.11% Non - Ferrous Metals 3.02% Hindalco Industries Ltd. 1.89% Vedanta Ltd. 1.14% Oil 4.66%• Oil & Natural Gas Corporation Ltd. 4.66% Pesticides 0.65% Rallis India Ltd. 0.65% Petroleum Products 2.85% Indian Oil Corporation Ltd. 2.85% Pharmaceuticals 6.70% Sun Pharmaceutical Industries Ltd. 2.85% Cipla Ltd. 2.11% Lupin Ltd. 1.75% Power 8.52%• Power Grid Corporation Of India Ltd. 3.51% NTPC Ltd. 2.88% Tata Power Company Ltd. 1.66% NLC India Ltd. 0.47% Services 1.65% Thomas Cook (India) Ltd. 1.65% Software 7.85%• Infosys Ltd. 4.69% HCL Technologies Ltd. 2.75% Tech Mahindra Ltd. 0.41% Telecom - Services 3.53%• Bharti Airtel Ltd. 3.53% Transportation 4.21% The Great Eastern Shipping Company Ltd. 2.17% Adani Ports and Special Economic Zone Ltd. 1.07% Container Corporation Of India Ltd. 0.71% Gateway Distriparks Ltd. 0.26% Short Term Debt and net current assets 3.27% Total Net Assets 100.00%
Company/Issuer % to NAV
Company/Issuer % to NAV
• Top Ten Holdings
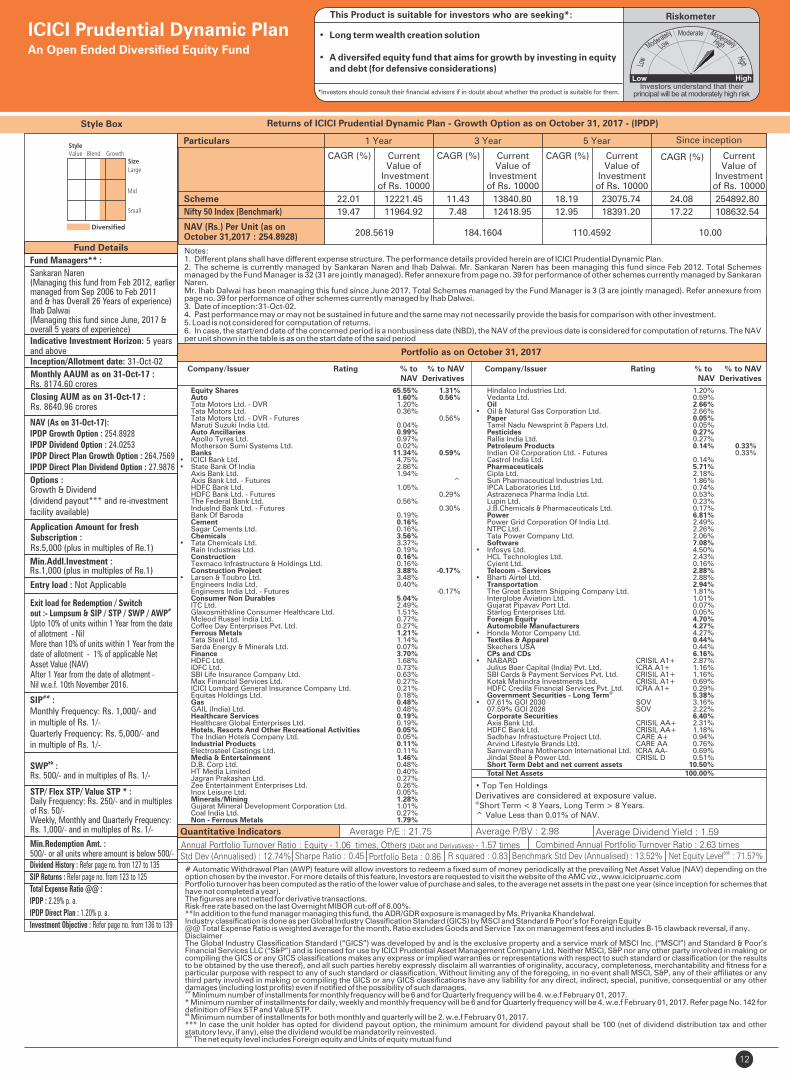
Returns of ICICI Prudential Dynamic Plan - Growth Option as on October 31, 2017 - (IPDP)
Portfolio as on October 31, 2017
Quantitative Indicators
• Top Ten Holdings
Derivatives are considered at exposure value.@Short Term < 8 Years, Long Term > 8 Years.
^ Value Less than 0.01% of NAV.
Std Dev (Annualised) : 12.74% Sharpe Ratio : 0.45
Average P/E : 21.75 Average P/BV : 2.98 Average Dividend Yield : 1.59
Portfolio Beta : 0.86 R squared : 0.83
# Automatic Withdrawal Plan (AWP) feature will allow investors to redeem a fixed sum of money periodically at the prevailing Net Asset Value (NAV) depending on the option chosen by the investor. For more details of this feature, Investors are requested to visit the website of the AMC viz., www.icicipruamc.comPortfolio turnover has been computed as the ratio of the lower value of purchase and sales, to the average net assets in the past one year (since inception for schemes that have not completed a year). The figures are not netted for derivative transactions.Risk-free rate based on the last Overnight MIBOR cut-off of 6.00%.**In addition to the fund manager managing this fund, the ADR/GDR exposure is managed by Ms. Priyanka Khandelwal.Industry classification is done as per Global Industry Classification Standard (GICS) by MSCI and Standard & Poor’s for Foreign Equity@@ Total Expense Ratio is weighted average for the month. Ratio excludes on management fees and includes B-15 clawback reversal, if any.Goods and Service TaxDisclaimerThe Global Industry Classification Standard (“GICS”) was developed by and is the exclusive property and a service mark of MSCI Inc. (“MSCI”) and Standard & Poor’s Financial Services LLC (“S&P”) and is licensed for use by ICICI Prudential Asset Management Company Ltd. Neither MSCI, S&P nor any other party involved in making or compiling the GICS or any GICS classifications makes any express or implied warranties or representations with respect to such standard or classification (or the results to be obtained by the use thereof), and all such parties hereby expressly disclaim all warranties of originality, accuracy, completeness, merchantability and fitness for a particular purpose with respect to any of such standard or classification. Without limiting any of the foregoing, in no event shall MSCI, S&P, any of their affiliates or any third party involved in making or compiling the GICS or any GICS classifications have any liability for any direct, indirect, special, punitive, consequential or any other damages (including lost profits) even if notified of the possibility of such damages.##
Minimum number of installments for monthly frequency will be 6 and for Quarterly frequency will be 4. w.e.f February 01, 2017.* Minimum number of installments for daily, weekly and monthly frequency will be 6 and for Quarterly frequency will be 4. w.e.f February 01, 2017. Refer page No. 142 for definition of Flex STP and Value STP.&& Minimum number of installments for both monthly and quarterly will be 2. w.e.f February 01, 2017.*** In case the unit holder has opted for dividend payout option, the minimum amount for dividend payout shall be 100 (net of dividend distribution tax and other statutory levy, if any), else the dividend would be mandatorily reinvested.&&& The net equity level includes Foreign equity and Units of equity mutual fund
Fund Managers** :
Sankaran Naren (Managing this fund from Feb 2012, earlier managed from Sep 2006 to Feb 2011 and & has Overall 26 Years of experience)Ihab Dalwai(Managing this fund since June, 2017 & overall 5 years of experience)Indicative Investment Horizon: 5 yearsand aboveInception/Allotment date: 31-Oct-02
NAV (As on 31-Oct-17):IPDP Growth Option : 254.8928IPDP Dividend Option : 24.0253IPDP Direct Plan Growth Option : 264.7569IPDP Direct Plan Dividend Option : 27.9876
Options :Growth & Dividend(dividend payout*** and re-investment facility available)
Application Amount for freshSubscription :Rs.5,000 (plus in multiples of Re.1)
Min.Addl.Investment :Rs.1,000 (plus in multiples of Re.1)
Exit load for Redemption / Switch#out :- Lumpsum & SIP / STP / SWP / AWP
Upto 10% of units within 1 Year from the date of allotment - Nil More than 10% of units within 1 Year from the date of allotment - 1% of applicable Net Asset Value (NAV) After 1 Year from the date of allotment - Nil w.e.f. 10th November 2016.
&&SWP :Rs. 500/- and in multiples of Rs. 1/-
STP/ Flex STP/ Value STP * :Daily Frequency: Rs. 250/- and in multiples of Rs. 50/-Weekly, Monthly and Quarterly Frequency: Rs. 1,000/- and in multiples of Rs. 1/-
Min.Redemption Amt. :500/- or all units where amount is below 500/-
Fund Details
12
Style Box
Monthly AAUM as on 31-Oct-17 : Rs. 8174.60 crores
&&&Net Equity Level : 71.57%
ICICI Prudential Dynamic PlanAn Open Ended Diversified Equity Fund
Closing AUM as on 31-Oct-17 : Rs. 8640.96 crores
Benchmark Std Dev (Annualised) : 13.52%
Entry load : Not Applicable
RiskometerThis Product is suitable for investors who are seeking*:
• Long term wealth creation solution • A diversifed equity fund that aims for growth by investing in equity
and debt (for defensive considerations)
*Investors should consult their financial advisers if in doubt about whether the product is suitable for them.
Annual Portfolio Turnover Ratio : Equity - 1.06 times, Others (Debt and Derivatives) - 1.57 times Combined Annual Portfolio Turnover Ratio : 2.63 times
Dividend History : Refer page no. from 127 to 135
SIP Returns : Refer page no. from 123 to 125
Total Expense Ratio @@ :
IPDP : 2.29% p. a.
IPDP Direct Plan : 1.20% p. a.
Investment Objective : Refer page no. from 136 to 139
Equity Shares 65.55% 1.31% Auto 1.60% 0.56% Tata Motors Ltd. - DVR 1.20% Tata Motors Ltd. 0.36% Tata Motors Ltd. - DVR - Futures 0.56% Maruti Suzuki India Ltd. 0.04% Auto Ancillaries 0.99% Apollo Tyres Ltd. 0.97% Motherson Sumi Systems Ltd. 0.02% Banks 11.34% 0.59%• ICICI Bank Ltd. 4.75% • State Bank Of India 2.86% Axis Bank Ltd. 1.94% Axis Bank Ltd. - Futures ^ HDFC Bank Ltd. 1.05% HDFC Bank Ltd. - Futures 0.29% The Federal Bank Ltd. 0.56% IndusInd Bank Ltd. - Futures 0.30% Bank Of Baroda 0.19% Cement 0.16% Sagar Cements Ltd. 0.16% Chemicals 3.56% • Tata Chemicals Ltd. 3.37% Rain Industries Ltd. 0.19% Construction 0.16% Texmaco Infrastructure & Holdings Ltd. 0.16% Construction Project 3.88% -0.17%• Larsen & Toubro Ltd. 3.48% Engineers India Ltd. 0.40% Engineers India Ltd. - Futures -0.17% Consumer Non Durables 5.04% ITC Ltd. 2.49% Glaxosmithkline Consumer Healthcare Ltd. 1.51% Mcleod Russel India Ltd. 0.77% Coffee Day Enterprises Pvt. Ltd. 0.27% Ferrous Metals 1.21% Tata Steel Ltd. 1.14% Sarda Energy & Minerals Ltd. 0.07% Finance 3.70% HDFC Ltd. 1.68% IDFC Ltd. 0.73% SBI Life Insurance Company Ltd. 0.63% Max Financial Services Ltd. 0.27% ICICI Lombard General Insurance Company Ltd. 0.21% Equitas Holdings Ltd. 0.18% Gas 0.48% GAIL (India) Ltd. 0.48% Healthcare Services 0.19% Healthcare Global Enterprises Ltd. 0.19% Hotels, Resorts And Other Recreational Activities 0.05% The Indian Hotels Company Ltd. 0.05% Industrial Products 0.11% Electrosteel Castings Ltd. 0.11% Media & Entertainment 1.46% D.B. Corp Ltd. 0.48% HT Media Limited 0.40% Jagran Prakashan Ltd. 0.27% Zee Entertainment Enterprises Ltd. 0.26% Inox Leisure Ltd. 0.05% Minerals/Mining 1.28% Gujarat Mineral Development Corporation Ltd. 1.01% Coal India Ltd. 0.27% Non - Ferrous Metals 1.79%
Hindalco Industries Ltd. 1.20% Vedanta Ltd. 0.59% Oil 2.66% • Oil & Natural Gas Corporation Ltd. 2.66% Paper 0.05% Tamil Nadu Newsprint & Papers Ltd. 0.05% Pesticides 0.27% Rallis India Ltd. 0.27% Petroleum Products 0.14% 0.33% Indian Oil Corporation Ltd. - Futures 0.33% Castrol India Ltd. 0.14% Pharmaceuticals 5.71% Cipla Ltd. 2.18% Sun Pharmaceutical Industries Ltd. 1.86% IPCA Laboratories Ltd. 0.74% Astrazeneca Pharma India Ltd. 0.53% Lupin Ltd. 0.23% J.B.Chemicals & Pharmaceuticals Ltd. 0.17% Power 6.81% Power Grid Corporation Of India Ltd. 2.49% NTPC Ltd. 2.26% Tata Power Company Ltd. 2.06% Software 7.08% • Infosys Ltd. 4.50% HCL Technologies Ltd. 2.43% Cyient Ltd. 0.16% Telecom - Services 2.88% • Bharti Airtel Ltd. 2.88% Transportation 2.94% The Great Eastern Shipping Company Ltd. 1.81% Interglobe Aviation Ltd. 1.01% Gujarat Pipavav Port Ltd. 0.07% Starlog Enterprises Ltd. 0.05% Foreign Equity 4.70% Automobile Manufacturers 4.27% • Honda Motor Company Ltd. 4.27% Textiles & Apparel 0.44% Skechers USA 0.44% CPs and CDs 6.16% • NABARD CRISIL A1+ 2.87% Julius Baer Capital (India) Pvt. Ltd. ICRA A1+ 1.16% SBI Cards & Payment Services Pvt. Ltd. CRISIL A1+ 1.16% Kotak Mahindra Investments Ltd. CRISIL A1+ 0.69% HDFC Credila Financial Services Pvt. Ltd. ICRA A1+ 0.29%
@ Government Securities - Long Term 5.38% • 07.61% GOI 2030 SOV 3.16% 07.59% GOI 2026 SOV 2.22% Corporate Securities 6.40% Axis Bank Ltd. CRISIL AA+ 2.31% HDFC Bank Ltd. CRISIL AA+ 1.18% Sadbhav Infrastucture Project Ltd. CARE A+ 0.94% Arvind Lifestyle Brands Ltd. CARE AA 0.76% Samvardhana Motherson International Ltd. ICRA AA- 0.69% Jindal Steel & Power Ltd. CRISIL D 0.51% Short Term Debt and net current assets 10.50% Total Net Assets 100.00%
Company/Issuer Rating % to % to NAV NAV Derivatives
Company/Issuer Rating % to % to NAV NAV Derivatives
##SIP :Monthly Frequency: Rs. 1,000/- and in multiple of Rs. 1/-Quarterly Frequency: Rs. 5,000/- and in multiple of Rs. 1/-
Notes:1. Different plans shall have different expense structure. The performance details provided herein are of ICICI Prudential Dynamic Plan.2. The scheme is currently managed by Sankaran Naren and Ihab Dalwai. Mr. Sankaran Naren has been managing this fund since Feb 2012. Total Schemes managed by the Fund Manager . Refer annexure from page no. 39 for performance of other schemes currently managed by Sankaran is 32 (31 are jointly managed) Naren.Mr. Ihab Dalwai has been managing this fund since June 2017. Total Schemes managed by the Fund Manager is 3 . Refer annexure from (3 are jointly managed)page no. 39 for performance of other schemes currently managed by Ihab Dalwai.3. Date of inception:31-Oct-02.4. Past performance may or may not be sustained in future and the same may not necessarily provide the basis for comparison with other investment.5. Load is not considered for computation of returns.6. In case, the start/end date of the concerned period is a nonbusiness date (NBD), the NAV of the previous date is considered for computation of returns. The NAV per unit shown in the table is as on the start date of the said period
Scheme
NAV (Rs.) Per Unit (as on October 31,2017 : 254.8928)
CAGR (%)
10.00
Nifty 50 Index (Benchmark)
Since inception
CurrentValue of
Investment of Rs. 10000
CAGR (%) Current Value of
Investment of Rs. 10000
1 Year 3 Year 5 Year
CAGR (%) Current Value of
Investment of Rs. 10000
CAGR (%) Current Value of
Investment of Rs. 10000
208.5619 184.1604 110.4592
Particulars
22.01 12221.45 11.43 13840.80 18.19 23075.74 24.08 254892.80
19.47 11964.92 7.48 12418.95 12.95 18391.20 17.22 108632.54
13
Style Box
Fund Details
Quantitative Indicators
Fund Managers** :
George Heber Joseph(Managing this fund since Dec, 2015 &Overall 13 years of experience)Atul Patel(Managing this fund since Aug, 2016 &Overall 7 years of experience)
Indicative Investment Horizon: 5 years and above
Inception/Allotment date: 01-Oct-94
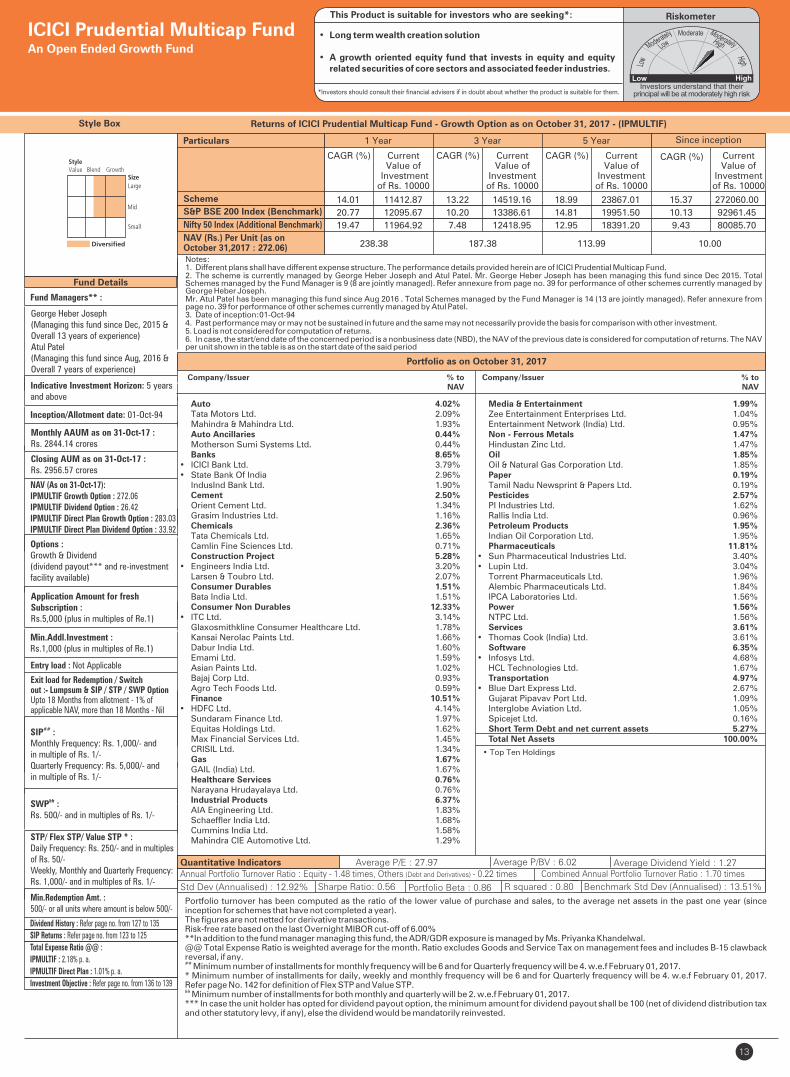
NAV (As on 31-Oct-17):IPMULTIF Growth Option : 272.06IPMULTIF Dividend Option : 26.42IPMULTIF Direct Plan Growth Option : 283.03IPMULTIF Direct Plan Dividend Option : 33.92
Options :Growth & Dividend(dividend payout*** and re-investment facility available)
Application Amount for freshSubscription :Rs.5,000 (plus in multiples of Re.1)
Min.Addl.Investment :Rs.1,000 (plus in multiples of Re.1)
Exit load for Redemption / Switchout :- Lumpsum & SIP / STP / SWP OptionUpto 18 Months from allotment - 1% of applicable NAV, more than 18 Months - Nil
&&SWP :Rs. 500/- and in multiples of Rs. 1/-
STP/ Flex STP/ Value STP * :Daily Frequency: Rs. 250/- and in multiples of Rs. 50/-Weekly, Monthly and Quarterly Frequency: Rs. 1,000/- and in multiples of Rs. 1/-
Min.Redemption Amt. : 500/- or all units where amount is below 500/-
Std Dev (Annualised) : 12.92% Sharpe Ratio: 0.56
Average P/E : 27.97 Average P/BV : 6.02 Average Dividend Yield : 1.27
Portfolio Beta : 0.86 R squared : 0.80
Portfolio turnover has been computed as the ratio of the lower value of purchase and sales, to the average net assets in the past one year (since inception for schemes that have not completed a year). The figures are not netted for derivative transactions.Risk-free rate based on the last Overnight MIBOR cut-off of 6.00%**In addition to the fund manager managing this fund, the ADR/GDR exposure is managed by Ms. Priyanka Khandelwal.@@ Total Expense Ratio is weighted average for the month. Ratio excludes on management fees and includes B-15 clawback Goods and Service Taxreversal, if any.## Minimum number of installments for monthly frequency will be 6 and for Quarterly frequency will be 4. w.e.f February 01, 2017.* Minimum number of installments for daily, weekly and monthly frequency will be 6 and for Quarterly frequency will be 4. w.e.f February 01, 2017. Refer page No. 142 for definition of Flex STP and Value STP.&&
Minimum number of installments for both monthly and quarterly will be 2. w.e.f February 01, 2017.*** In case the unit holder has opted for dividend payout option, the minimum amount for dividend payout shall be 100 (net of dividend distribution tax and other statutory levy, if any), else the dividend would be mandatorily reinvested.
• Top Ten Holdings
Portfolio as on October 31, 2017
Returns of ICICI Prudential Multicap Fund - Growth Option as on October 31, 2017 - (IPMULTIF)
Monthly AAUM as on 31-Oct-17 : Rs. 2844.14 crores
Closing AUM as on 31-Oct-17 : Rs. 2956.57 crores
ICICI Prudential Multicap Fund
Benchmark Std Dev (Annualised) : 13.51%
An Open Ended Growth Fund
Entry load : Not Applicable
RiskometerThis Product is suitable for investors who are seeking*:
• Long term wealth creation solution
• A growth oriented equity fund that invests in equity and equity related securities of core sectors and associated feeder industries.
*Investors should consult their financial advisers if in doubt about whether the product is suitable for them.
Annual Portfolio Turnover Ratio : Equity - 1.48 times, Others (Debt and Derivatives) - 0.22 times Combined Annual Portfolio Turnover Ratio : 1.70 times
Dividend History : Refer page no. from 127 to 135
SIP Returns : Refer page no. from 123 to 125
Total Expense Ratio @@ :
IPMULTIF : 2.18% p. a.
IPMULTIF Direct Plan : 1.01% p. a.
Investment Objective : Refer page no. from 136 to 139
##SIP :Monthly Frequency: Rs. 1,000/- and in multiple of Rs. 1/-Quarterly Frequency: Rs. 5,000/- and in multiple of Rs. 1/-
Notes:1. Different plans shall have different expense structure. The performance details provided herein are of ICICI Prudential Multicap Fund.2. The scheme is currently managed by George Heber Joseph and Atul Patel. Mr. George Heber Joseph has been managing this fund since Dec 2015. Total Schemes managed by the Fund Manager . Refer annexure from page no. 39 for performance of other schemes currently managed byis 9 (8 are jointly managed) George Heber Joseph.Mr. Atul Patel has been managing this fund since Aug 2016 . Total Schemes managed by the Fund Manager is 14 (13 are jointly managed). Refer annexure from page no. 39 for performance of other schemes currently managed by Atul Patel .3. Date of inception:01-Oct-944. Past performance may or may not be sustained in future and the same may not necessarily provide the basis for comparison with other investment.5. Load is not considered for computation of returns.6. In case, the start/end date of the concerned period is a nonbusiness date (NBD), the NAV of the previous date is considered for computation of returns. The NAV per unit shown in the table is as on the start date of the said period
Scheme
Nifty 50 Index (Additional Benchmark)
NAV (Rs.) Per Unit (as on October 31,2017 : 272.06)
CAGR (%)
10.00
S&P BSE 200 Index (Benchmark)
Since inception
CurrentValue of
Investment of Rs. 10000
CAGR (%) Current Value of
Investment of Rs. 10000
1 Year 3 Year 5 Year
CAGR (%) Current Value of
Investment of Rs. 10000
CAGR (%) Current Value of
Investment of Rs. 10000
238.38 187.38 113.99
Particulars
14.01 11412.87 13.22 14519.16 18.99 23867.01 15.37 272060.00
20.77 12095.67 10.20 13386.61 14.81 19951.50 10.13 92961.45
19.47 11964.92 7.48 12418.95 12.95 18391.20 9.43 80085.70
Auto 4.02% Tata Motors Ltd. 2.09% Mahindra & Mahindra Ltd. 1.93% Auto Ancillaries 0.44% Motherson Sumi Systems Ltd. 0.44% Banks 8.65%• ICICI Bank Ltd. 3.79%• State Bank Of India 2.96% IndusInd Bank Ltd. 1.90% Cement 2.50% Orient Cement Ltd. 1.34% Grasim Industries Ltd. 1.16% Chemicals 2.36% Tata Chemicals Ltd. 1.65% Camlin Fine Sciences Ltd. 0.71% Construction Project 5.28%• Engineers India Ltd. 3.20% Larsen & Toubro Ltd. 2.07% Consumer Durables 1.51% Bata India Ltd. 1.51% Consumer Non Durables 12.33%• ITC Ltd. 3.14% Glaxosmithkline Consumer Healthcare Ltd. 1.78% Kansai Nerolac Paints Ltd. 1.66% Dabur India Ltd. 1.60% Emami Ltd. 1.59% Asian Paints Ltd. 1.02% Bajaj Corp Ltd. 0.93% Agro Tech Foods Ltd. 0.59% Finance 10.51%• HDFC Ltd. 4.14% Sundaram Finance Ltd. 1.97% Equitas Holdings Ltd. 1.62% Max Financial Services Ltd. 1.45% CRISIL Ltd. 1.34% Gas 1.67% GAIL (India) Ltd. 1.67% Healthcare Services 0.76% Narayana Hrudayalaya Ltd. 0.76% Industrial Products 6.37% AIA Engineering Ltd. 1.83% Schaeffler India Ltd. 1.68% Cummins India Ltd. 1.58% Mahindra CIE Automotive Ltd. 1.29%
Media & Entertainment 1.99% Zee Entertainment Enterprises Ltd. 1.04% Entertainment Network (India) Ltd. 0.95% Non - Ferrous Metals 1.47% Hindustan Zinc Ltd. 1.47% Oil 1.85% Oil & Natural Gas Corporation Ltd. 1.85% Paper 0.19% Tamil Nadu Newsprint & Papers Ltd. 0.19% Pesticides 2.57% PI Industries Ltd. 1.62% Rallis India Ltd. 0.96% Petroleum Products 1.95% Indian Oil Corporation Ltd. 1.95% Pharmaceuticals 11.81%• Sun Pharmaceutical Industries Ltd. 3.40%• Lupin Ltd. 3.04% Torrent Pharmaceuticals Ltd. 1.96% Alembic Pharmaceuticals Ltd. 1.84% IPCA Laboratories Ltd. 1.56% Power 1.56% NTPC Ltd. 1.56% Services 3.61%• Thomas Cook (India) Ltd. 3.61% Software 6.35%• Infosys Ltd. 4.68% HCL Technologies Ltd. 1.67% Transportation 4.97%• Blue Dart Express Ltd. 2.67% Gujarat Pipavav Port Ltd. 1.09% Interglobe Aviation Ltd. 1.05% Spicejet Ltd. 0.16% Short Term Debt and net current assets 5.27% Total Net Assets 100.00%
Company/Issuer % to NAV
Company/Issuer % to NAV
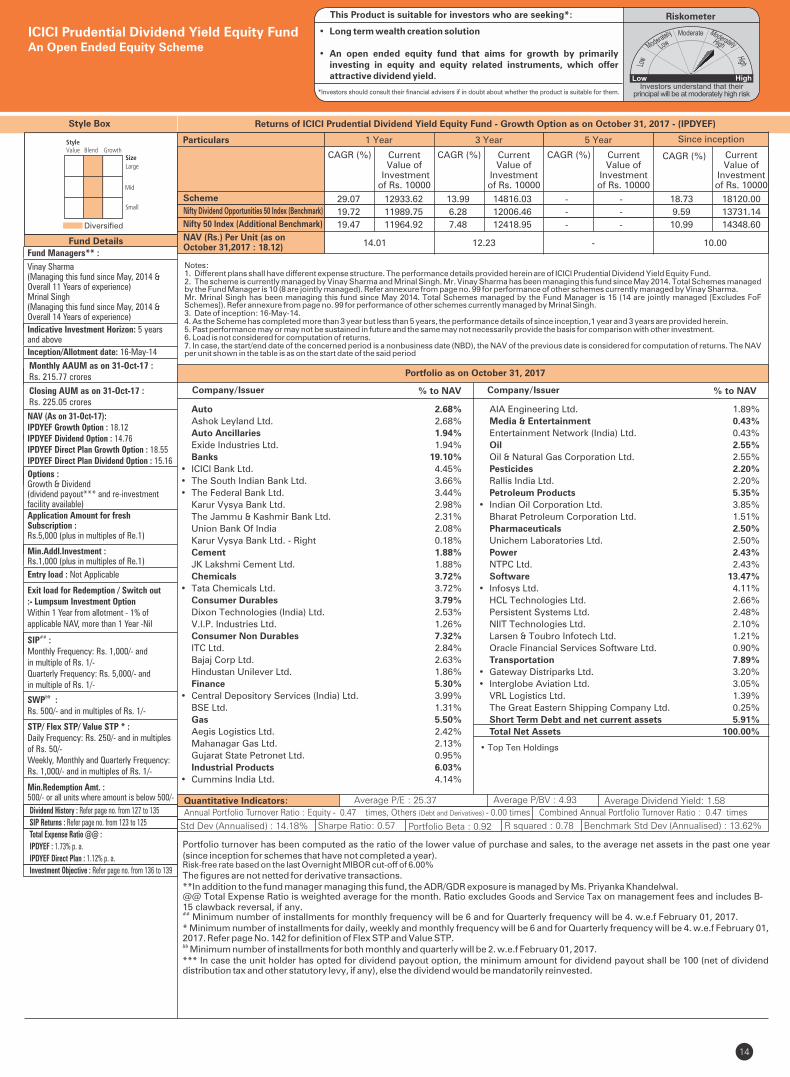
Auto 2.68%
Ashok Leyland Ltd. 2.68%
Auto Ancillaries 1.94%
Exide Industries Ltd. 1.94%
Banks 19.10%
• ICICI Bank Ltd. 4.45%
• The South Indian Bank Ltd. 3.66%
• The Federal Bank Ltd. 3.44%
Karur Vysya Bank Ltd. 2.98%
The Jammu & Kashmir Bank Ltd. 2.31%
Union Bank Of India 2.08%
Karur Vysya Bank Ltd. - Right 0.18%
Cement 1.88%
JK Lakshmi Cement Ltd. 1.88%
Chemicals 3.72%
• Tata Chemicals Ltd. 3.72%
Consumer Durables 3.79%
Dixon Technologies (India) Ltd. 2.53%
V.I.P. Industries Ltd. 1.26%
Consumer Non Durables 7.32%
ITC Ltd. 2.84%
Bajaj Corp Ltd. 2.63%
Hindustan Unilever Ltd. 1.86%
Finance 5.30%
• Central Depository Services (India) Ltd. 3.99%
BSE Ltd. 1.31%
Gas 5.50%
Aegis Logistics Ltd. 2.42%
Mahanagar Gas Ltd. 2.13%
Gujarat State Petronet Ltd. 0.95%
Industrial Products 6.03%
• Cummins India Ltd. 4.14%
14
Style Box
Company/Issuer % to NAV
Portfolio turnover has been computed as the ratio of the lower value of purchase and sales, to the average net assets in the past one year (since inception for schemes that have not completed a year). Risk-free rate based on the last Overnight MIBOR cut-off of 6.00%
The figures are not netted for derivative transactions.**In addition to the fund manager managing this fund, the ADR/GDR exposure is managed by Ms. Priyanka Khandelwal.@@ Total Expense Ratio is weighted average for the month. Ratio excludes Goods and Service Tax on management fees and includes B-15 clawback reversal, if any.## Minimum number of installments for monthly frequency will be 6 and for Quarterly frequency will be 4. w.e.f February 01, 2017.* Minimum number of installments for daily, weekly and monthly frequency will be 6 and for Quarterly frequency will be 4. w.e.f February 01, 2017. Refer page No. 142 for definition of Flex STP and Value STP.&& Minimum number of installments for both monthly and quarterly will be 2. w.e.f February 01, 2017.*** In case the unit holder has opted for dividend payout option, the minimum amount for dividend payout shall be 100 (net of dividend distribution tax and other statutory levy, if any), else the dividend would be mandatorily reinvested.
Fund Managers** :
Vinay Sharma(Managing this fund since May, 2014 &Overall 11 Years of experience)Mrinal Singh(Managing this fund since May, 2014 &Overall 14 Years of experience)
Indicative Investment Horizon: 5 years and above
Inception/Allotment date: 16-May-14
NAV (As on 31-Oct-17):IPDYEF Growth Option : 18.12IPDYEF Dividend Option : 14.76IPDYEF Direct Plan Growth Option : 18.55IPDYEF Direct Plan Dividend Option : 15.16
Fund Details
• Top Ten Holdings
Diversified
Quantitative Indicators: Average P/E : 25.37 Average P/BV : 4.93 Average Dividend Yield: 1.58
Monthly AAUM as on 31-Oct-17 : Rs. 215.77 crores
Closing AUM as on 31-Oct-17 : Rs. 225.05 crores
Company/Issuer % to NAV
ICICI Prudential Dividend Yield Equity FundAn Open Ended Equity Scheme
Returns of ICICI Prudential Dividend Yield Equity Fund - Growth Option as on - (IPDYEF)October 31, 2017
Portfolio as on October 31, 2017
AIA Engineering Ltd. 1.89%
Media & Entertainment 0.43%
Entertainment Network (India) Ltd. 0.43%
Oil 2.55%
Oil & Natural Gas Corporation Ltd. 2.55%
Pesticides 2.20%
Rallis India Ltd. 2.20%
Petroleum Products 5.35%
• Indian Oil Corporation Ltd. 3.85%
Bharat Petroleum Corporation Ltd. 1.51%
Pharmaceuticals 2.50%
Unichem Laboratories Ltd. 2.50%
Power 2.43%
NTPC Ltd. 2.43%
Software 13.47%
• Infosys Ltd. 4.11%
HCL Technologies Ltd. 2.66%
Persistent Systems Ltd. 2.48%
NIIT Technologies Ltd. 2.10%
Larsen & Toubro Infotech Ltd. 1.21%
Oracle Financial Services Software Ltd. 0.90%
Transportation 7.89%
• Gateway Distriparks Ltd. 3.20%
• Interglobe Aviation Ltd. 3.05%
VRL Logistics Ltd. 1.39%
The Great Eastern Shipping Company Ltd. 0.25%
Short Term Debt and net current assets 5.91%
Total Net Assets 100.00%
Riskometer
• Long term wealth creation solution
• An open ended equity fund that aims for growth by primarily investing in equity and equity related instruments, which offer attractive dividend yield.
*Investors should consult their financial advisers if in doubt about whether the product is suitable for them.
This Product is suitable for investors who are seeking*:
Options :Growth & Dividend(dividend payout*** and re-investment facility available)Application Amount for freshSubscription :Rs.5,000 (plus in multiples of Re.1)
Min.Addl.Investment :Rs.1,000 (plus in multiples of Re.1)
Exit load for Redemption / Switch out:- Lumpsum Investment OptionWithin 1 Year from allotment - 1% of applicable NAV, more than 1 Year -Nil
SIP :##
Monthly Frequency: Rs. 1,000/- and in multiple of Rs. 1/-Quarterly Frequency: Rs. 5,000/- and in multiple of Rs. 1/-
&&SWP :Rs. 500/- and in multiples of Rs. 1/-
Min.Redemption Amt. :500/- or all units where amount is below 500/-
Entry load : Not Applicable
STP/ Flex STP/ Value STP * :Daily Frequency: Rs. 250/- and in multiples of Rs. 50/-Weekly, Monthly and Quarterly Frequency: Rs. 1,000/- and in multiples of Rs. 1/-
Annual Portfolio Turnover Ratio : Equity - 0.47 times, Others (Debt and Derivatives) - 0.00 times Combined Annual Portfolio Turnover Ratio : 0.47 timesDividend History : Refer page no. from 127 to 135
SIP Returns : Refer page no. from 123 to 125
Total Expense Ratio @@ :
IPDYEF : 1.73% p. a.
IPDYEF Direct Plan : 1.12% p. a.
Investment Objective : Refer page no. from 136 to 139
Notes:1. Different plans shall have different expense structure. The performance details provided herein are of ICICI Prudential Dividend Yield Equity Fund.2. The scheme is currently managed by Vinay Sharma and Mrinal Singh. Mr. Vinay Sharma has been managing this fund since . Total Schemes managed May 2014by the Fund Manager Refer annexure from page no. 99 for performance of other schemes currently managed by Vinay Sharma.is 10 (8 are jointly managed).Mr. Mrinal Singh has been managing this fund since . Total Schemes managed by the Fund Manager May 2014 is 15 (14 are jointly managed [Excludes FoF Schemes]) . Refer annexure from page no. 99 for performance of other schemes currently managed by Mrinal Singh.3. Date of inception: 16-May-14.4. As the Scheme has completed more than 3 year but less than 5 years, the performance details of since inception,1 year and 3 years are provided herein.5. Past performance may or may not be sustained in future and the same may not necessarily provide the basis for comparison with other investment.6. Load is not considered for computation of returns.7. In case, the start/end date of the concerned period is a nonbusiness date (NBD), the NAV of the previous date is considered for computation of returns. The NAV per unit shown in the table is as on the start date of the said period
Scheme
Nifty 50 Index (Additional Benchmark)
NAV (Rs.) Per Unit (as on October 31,2017 : 18.12)
CAGR (%)
10.00
Nifty Dividend Opportunities 50 Index (Benchmark)
Since inception
CurrentValue of
Investment of Rs. 10000
CAGR (%) Current Value of
Investment of Rs. 10000
1 Year 3 Year 5 Year
CAGR (%) Current Value of
Investment of Rs. 10000
CAGR (%) Current Value of
Investment of Rs. 10000
14.01 12.23 -
Particulars
29.07 12933.62 13.99 14816.03 - - 18.73 18120.00
19.72 11989.75 6.28 12006.46 - - 9.59 13731.14
19.47 11964.92 7.48 12418.95 - - 10.99 14348.60
Std Dev (Annualised) : 14.18% Sharpe Ratio: 0.57 Portfolio Beta : 0.92 R squared : 0.78 Benchmark Std Dev (Annualised) : 13.62%

Fund Details
Quantitative Indicators
Portfolio as on October 31, 2017
Returns of ICICI Prudential Value Discovery Fund - Growth Option as on October 31, 2017 - (IPVDF)Style Box
15
Inception/Allotment date: 16-Aug-04
Fund Managers** :
Mrinal Singh(Managing this fund since Feb 2011 &Overall 14 years of experience)
Indicative Investment Horizon: 5 yearsand above
NAV (As on 31-Oct-17):IPVDF Growth Option : 142.14IPVDF Dividend Option : 33.63IPVDF Direct Plan Growth Option : 149.06IPVDF Direct Plan Dividend Option : 54.24
Options :Growth & Dividend(dividend payout*** and re-investment facility available)
Application Amount for freshSubscription :Rs.1,000 (plus in multiples of Re.1)
Min.Addl.Investment :Rs.500 (plus in multiples of Re.1) (w.e.f. 10-January-17)
Exit load for Redemption / Switchout :- Lumpsum & SIP / STP / SWP OptionUpto 12 Months from allotment - 1%of applicable NAV, more than 12Months - Nil
##SIP :Monthly Frequency: Rs. 500/- and in multiple of Rs. 1/-Quarterly Frequency: Rs. 5,000/- and in multiple of Rs. 1/-
&&SWP :Rs. 500/- and in multiples of Rs. 1/-
STP/ Flex STP/ Value STP * :Daily Frequency: Rs. 250/- and in multiples of Rs. 50/-Weekly, Monthly and Quarterly Frequency: Rs. 1,000/- and in multiples of Rs. 1/-
Min.Redemption Amt. :500/- or all units where amount is below 500/-
• Top Ten Holdings
Std Dev (Annualised) : 12.66% Sharpe Ratio : 0.43
Average P/E : 22.25 Average P/BV : 3.95 Average Dvidend Yield : 1.23
Portfolio Beta : 0.86 R squared : 0.87
Portfolio turnover has been computed as the ratio of the lower value of purchase and sales, to the average net assets in the past one year (since inception for schemes that have not completed a year). The figures are not netted for derivative transactions.Risk-free rate based on the last Overnight MIBOR cut-off of 6.00%**In addition to the fund manager managing this fund, the ADR/GDR exposure is managed by Ms. Priyanka Khandelwal.@@ Total Expense Ratio is weighted average for the month. Ratio excludes on management fees and includes B-15 clawback Goods and Service Taxreversal, if any.##
Minimum number of installments for monthly frequency will be 6 and for Quarterly frequency will be 4. w.e.f February 01, 2017.* Minimum number of installments for daily, weekly and monthly frequency will be 6 and for Quarterly frequency will be 4. w.e.f February 01, 2017. Refer page No. 142 for definition of Flex STP and Value STP.&&
Minimum number of installments for both monthly and quarterly will be 2. w.e.f February 01, 2017.*** In case the unit holder has opted for dividend payout option, the minimum amount for dividend payout shall be 100 (net of dividend distribution tax and other statutory levy, if any), else the dividend would be mandatorily reinvested.
Monthly AAUM as on 31-Oct-17 : Rs. 17172.75 crores
Closing AUM as on 31-Oct-17 :Rs. 17495.53 crores
ICICI Prudential Value Discovery FundAn Open Ended Diversified Equity Fund
Auto 5.16%
• Mahindra & Mahindra Ltd. 3.69%
Tata Motors Ltd. 1.47%
Auto Ancillaries 3.71%
Exide Industries Ltd. 2.27%
Amara Raja Batteries Ltd. 1.20%
Balkrishna Industries Ltd. 0.25%
Banks 15.07%
• HDFC Bank Ltd. 6.24%
• State Bank Of India 3.58%
Kotak Mahindra Bank Ltd. 2.37%
ICICI Bank Ltd. 2.05%
The Jammu & Kashmir Bank Ltd. 0.47%
Karur Vysya Bank Ltd. 0.34%
Karur Vysya Bank Ltd. - Right 0.02%
Construction Project 10.48%
• Larsen & Toubro Ltd. 9.05%
Sadbhav Engineering Ltd. 1.42%
Consumer Durables 0.87%
Blue Star Ltd. 0.87%
Consumer Non Durables 2.08%
ITC Ltd. 2.08%
Finance 2.47%
Max Financial Services Ltd. 1.52%
ICICI Lombard General Insurance Company Ltd. 0.51%
SBI Life Insurance Company Ltd. 0.44%
Gas 1.99%
Petronet LNG Ltd. 1.99%
Industrial Capital Goods 1.39%
Bharat Electronics Ltd. 1.39%
Industrial Products 1.10%
Bharat Forge Ltd. 1.10%
Non - Ferrous Metals 1.80%
Hindalco Industries Ltd. 1.80%
Oil 0.57%
Oil & Natural Gas Corporation Ltd. 0.57%
Pesticides 1.92%
PI Industries Ltd. 1.92%
Petroleum Products 3.62%
• Indian Oil Corporation Ltd. 3.62%
Pharmaceuticals 11.95%
• Sun Pharmaceutical Industries Ltd. 10.37%
Cipla Ltd. 0.84%
Divi's Laboratories Ltd. 0.74%
Power 6.41%
• NTPC Ltd. 5.17%
Power Grid Corporation Of India Ltd. 1.24%
Software 14.79%
• Wipro Ltd. 7.57%
• Infosys Ltd. 4.56%
HCL Technologies Ltd. 1.09%
Mphasis Ltd. 0.85%
Persistent Systems Ltd. 0.48%
Mindtree Ltd. 0.24%
Transportation 4.75%
• Container Corporation Of India Ltd. 2.37%
Gujarat Pipavav Port Ltd. 0.81%
Gateway Distriparks Ltd. 0.80%
The Great Eastern Shipping Company Ltd. 0.77%
Short Term Debt and net current assets 9.84%
Total Net Assets 100.00%
Company/Issuer Rating % to NAV
Benchmark Std Dev (Annualised) : 13.73%
Entry load : Not Applicable
RiskometerThis Product is suitable for investors who are seeking*:
• Long term wealth creation solution
• A diversified equity fund that aims to generate returns by investing in stocks with attractive valuations
*Investors should consult their financial advisers if in doubt about whether the product is suitable for them.
Annual Portfolio Turnover Ratio : Equity - 0.32 times, Others (Debt and Derivatives) - 0.34 times Combined Annual Portfolio Turnover Ratio : 0.66 times
Company/Issuer Rating % to NAV
Dividend History : Refer page no. from 127 to 135
SIP Returns : Refer page no. from 123 to 125
Total Expense Ratio @@ :
IPVDF : 2.12% p. a.
IPVDF Direct Plan : 1.14% p. a.
Investment Objective : Refer page no. from 136 to 139
Notes:1. Different plans shall have different expense structure. The performance details provided herein are of ICICI Prudential Value Discovery Fund.2. The scheme is currently managed by Mrinal Singh. Mr. Mrinal Singh has been managing this fund since Feb 2011. Total Schemes managed by the Fund Manager . Refer annexure from page no. 39 for performance of other schemes currently managed by Mrinal is 15 (14 are jointly managed [Excludes FoF Schemes]) Singh.3. Date of inception:16-Aug-04.4. Past performance may or may not be sustained in future and the same may not necessarily provide the basis for comparison with other investment.5. Load is not considered for computation of returns.6. In case, the start/end date of the concerned period is a nonbusiness date (NBD), the NAV of the previous date is considered for computation of returns. The NAV per unit shown in the table is as on the start date of the said period
Scheme
Nifty 50 Index (Additional Benchmark)
NAV (Rs.) Per Unit (as on October 31,2017 : 142.14)
CAGR (%)
10.00
S&P BSE 500 Index (Benchmark)
Since inception
CurrentValue of
Investment of Rs. 10000
CAGR (%) Current Value of
Investment of Rs. 10000
1 Year 3 Year 5 Year
CAGR (%) Current Value of
Investment of Rs. 10000
CAGR (%) Current Value of
Investment of Rs. 10000
125.79 103.26 52.96
Particulars
12.89 11299.79 11.23 13765.25 21.82 26839.12 22.24 142140.00
22.01 12220.63 10.98 13672.22 15.26 20348.42 15.93 70528.86
19.47 11964.92 7.48 12418.95 12.95 18391.20 15.16 64629.96
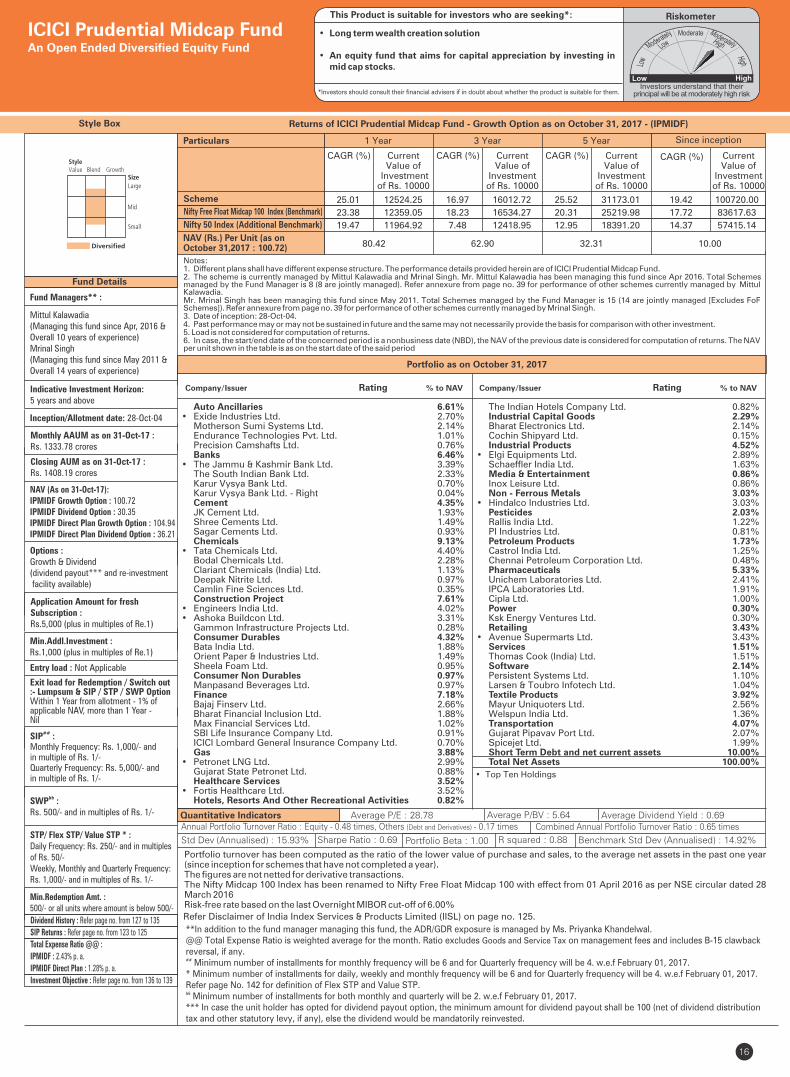
16
**In addition to the fund manager managing this fund, the ADR/GDR exposure is managed by Ms. Priyanka Khandelwal.Goods and Service Tax@@ Total Expense Ratio is weighted average for the month. Ratio excludes on management fees and includes B-15 clawback
reversal, if any.##
Minimum number of installments for monthly frequency will be 6 and for Quarterly frequency will be 4. w.e.f February 01, 2017.* Minimum number of installments for daily, weekly and monthly frequency will be 6 and for Quarterly frequency will be 4. w.e.f February 01, 2017. Refer page No. 142 for definition of Flex STP and Value STP.&& Minimum number of installments for both monthly and quarterly will be 2. w.e.f February 01, 2017.*** In case the unit holder has opted for dividend payout option, the minimum amount for dividend payout shall be 100 (net of dividend distribution tax and other statutory levy, if any), else the dividend would be mandatorily reinvested.
Refer Disclaimer of India Index Services & Products Limited (IISL) on page no. 125.
Quantitative Indicators
Style Box
Fund Details
Fund Managers** :
Mittul Kalawadia(Managing this fund since Apr, 2016 &Overall 10 years of experience)Mrinal Singh(Managing this fund since May 2011 &Overall 14 years of experience)
Indicative Investment Horizon: 5 years and above
Inception/Allotment date: 28-Oct-04
NAV (As on 31-Oct-17):IPMIDF Growth Option : 100.72IPMIDF Dividend Option : 30.35IPMIDF Direct Plan Growth Option : 104.94IPMIDF Direct Plan Dividend Option : 36.21
Options :Growth & Dividend(dividend payout*** and re-investment facility available)
Application Amount for freshSubscription :Rs.5,000 (plus in multiples of Re.1)
Min.Addl.Investment :Rs.1,000 (plus in multiples of Re.1)
Exit load for Redemption / Switch out:- Lumpsum & SIP / STP / SWP OptionWithin 1 Year from allotment - 1% ofapplicable NAV, more than 1 Year -Nil
##SIP :Monthly Frequency: Rs. 1,000/- and in multiple of Rs. 1/-Quarterly Frequency: Rs. 5,000/- and in multiple of Rs. 1/-
&&SWP :Rs. 500/- and in multiples of Rs. 1/-
STP/ Flex STP/ Value STP * :Daily Frequency: Rs. 250/- and in multiples of Rs. 50/-Weekly, Monthly and Quarterly Frequency: Rs. 1,000/- and in multiples of Rs. 1/-
Min.Redemption Amt. :500/- or all units where amount is below 500/-
Std Dev (Annualised) : 15.93% Sharpe Ratio : 0.69
Average P/E : 28.78 Average P/BV : 5.64 Average Dividend Yield : 0.69
Portfolio Beta : 1.00 R squared : 0.88
Portfolio turnover has been computed as the ratio of the lower value of purchase and sales, to the average net assets in the past one year (since inception for schemes that have not completed a year).The figures are not netted for derivative transactions. The Nifty Midcap 100 Index has been renamed to Nifty Free Float Midcap 100 with effect from 01 April 2016 as per NSE circular dated 28 March 2016Risk-free rate based on the last Overnight MIBOR cut-off of 6.00%
• Top Ten Holdings
Portfolio as on October 31, 2017
Returns of ICICI Prudential Midcap Fund - Growth Option as on October 31, 2017 - (IPMIDF)
Monthly AAUM as on 31-Oct-17 :Rs. 1333.78 crores
Closing AUM as on 31-Oct-17 : Rs. 1408.19 crores
Auto Ancillaries 6.61%• Exide Industries Ltd. 2.70% Motherson Sumi Systems Ltd. 2.14% Endurance Technologies Pvt. Ltd. 1.01% Precision Camshafts Ltd. 0.76% Banks 6.46%• The Jammu & Kashmir Bank Ltd. 3.39% The South Indian Bank Ltd. 2.33% Karur Vysya Bank Ltd. 0.70% Karur Vysya Bank Ltd. - Right 0.04% Cement 4.35% JK Cement Ltd. 1.93% Shree Cements Ltd. 1.49% Sagar Cements Ltd. 0.93% Chemicals 9.13%• Tata Chemicals Ltd. 4.40% Bodal Chemicals Ltd. 2.28% Clariant Chemicals (India) Ltd. 1.13% Deepak Nitrite Ltd. 0.97% Camlin Fine Sciences Ltd. 0.35% Construction Project 7.61%• Engineers India Ltd. 4.02%• Ashoka Buildcon Ltd. 3.31% Gammon Infrastructure Projects Ltd. 0.28% Consumer Durables 4.32% Bata India Ltd. 1.88% Orient Paper & Industries Ltd. 1.49% Sheela Foam Ltd. 0.95% Consumer Non Durables 0.97% Manpasand Beverages Ltd. 0.97% Finance 7.18% Bajaj Finserv Ltd. 2.66% Bharat Financial Inclusion Ltd. 1.88% Max Financial Services Ltd. 1.02% SBI Life Insurance Company Ltd. 0.91% ICICI Lombard General Insurance Company Ltd. 0.70% Gas 3.88%• Petronet LNG Ltd. 2.99% Gujarat State Petronet Ltd. 0.88% Healthcare Services 3.52%• Fortis Healthcare Ltd. 3.52% Hotels, Resorts And Other Recreational Activities 0.82%
The Indian Hotels Company Ltd. 0.82% Industrial Capital Goods 2.29% Bharat Electronics Ltd. 2.14% Cochin Shipyard Ltd. 0.15% Industrial Products 4.52%• Elgi Equipments Ltd. 2.89% Schaeffler India Ltd. 1.63% Media & Entertainment 0.86% Inox Leisure Ltd. 0.86% Non - Ferrous Metals 3.03%• Hindalco Industries Ltd. 3.03% Pesticides 2.03% Rallis India Ltd. 1.22% PI Industries Ltd. 0.81% Petroleum Products 1.73% Castrol India Ltd. 1.25% Chennai Petroleum Corporation Ltd. 0.48% Pharmaceuticals 5.33% Unichem Laboratories Ltd. 2.41% IPCA Laboratories Ltd. 1.91% Cipla Ltd. 1.00% Power 0.30% Ksk Energy Ventures Ltd. 0.30% Retailing 3.43%• Avenue Supermarts Ltd. 3.43% Services 1.51% Thomas Cook (India) Ltd. 1.51% Software 2.14% Persistent Systems Ltd. 1.10% Larsen & Toubro Infotech Ltd. 1.04% Textile Products 3.92% Mayur Uniquoters Ltd. 2.56% Welspun India Ltd. 1.36% Transportation 4.07% Gujarat Pipavav Port Ltd. 2.07% Spicejet Ltd. 1.99% Short Term Debt and net current assets 10.00% Total Net Assets 100.00%
ICICI Prudential Midcap FundAn Open Ended Diversified Equity Fund
Benchmark Std Dev (Annualised) : 14.92%
Entry load : Not Applicable
RiskometerThis Product is suitable for investors who are seeking*:
• Long term wealth creation solution
• An equity fund that aims for capital appreciation by investing in mid cap stocks.
*Investors should consult their financial advisers if in doubt about whether the product is suitable for them.
Annual Portfolio Turnover Ratio : Equity - 0.48 times, Others (Debt and Derivatives) - 0.17 times Combined Annual Portfolio Turnover Ratio : 0.65 times
Dividend History : Refer page no. from 127 to 135
SIP Returns : Refer page no. from 123 to 125
Total Expense Ratio @@ :
IPMIDF : 2.43% p. a.
IPMIDF Direct Plan : 1.28% p. a.
Investment Objective : Refer page no. from 136 to 139
Notes:1. Different plans shall have different expense structure. The performance details provided herein are of ICICI Prudential Midcap Fund.2. The scheme is currently managed by Mittul Kalawadia and Mrinal Singh. Mr. Mittul Kalawadia has been managing this fund since Apr 2016. Total Schemes managed by the Fund Manager is 8 (8 are jointly managed). Refer annexure from page no. 39 for performance of other schemes currently managed by Mittul Kalawadia.Mr. Mrinal Singh has been managing this fund since May 2011. Total Schemes managed by the Fund Manager is 15 (14 are jointly managed [Excludes FoF Schemes]). Refer annexure from page no. 39 for performance of other schemes currently managed by Mrinal Singh .3. Date of inception: 28-Oct-04.4. Past performance may or may not be sustained in future and the same may not necessarily provide the basis for comparison with other investment.5. Load is not considered for computation of returns.6. In case, the start/end date of the concerned period is a nonbusiness date (NBD), the NAV of the previous date is considered for computation of returns. The NAV per unit shown in the table is as on the start date of the said period
Scheme
Nifty 50 Index (Additional Benchmark)
NAV (Rs.) Per Unit (as on October 31,2017 : 100.72)
CAGR (%)
10.00
Nifty Free Float Midcap 100 Index (Benchmark)
Since inception
CurrentValue of
Investment of Rs. 10000
CAGR (%) Current Value of
Investment of Rs. 10000
1 Year 3 Year 5 Year
CAGR (%) Current Value of
Investment of Rs. 10000
CAGR (%) Current Value of
Investment of Rs. 10000
80.42 62.90 32.31
Particulars
25.01 12524.25 16.97 16012.72 25.52 31173.01 19.42 100720.00
23.38 12359.05 18.23 16534.27 20.31 25219.98 17.72 83617.63
19.47 11964.92 7.48 12418.95 12.95 18391.20 14.37 57415.14
Company/Issuer Rating % to NAVCompany/Issuer Rating % to NAV
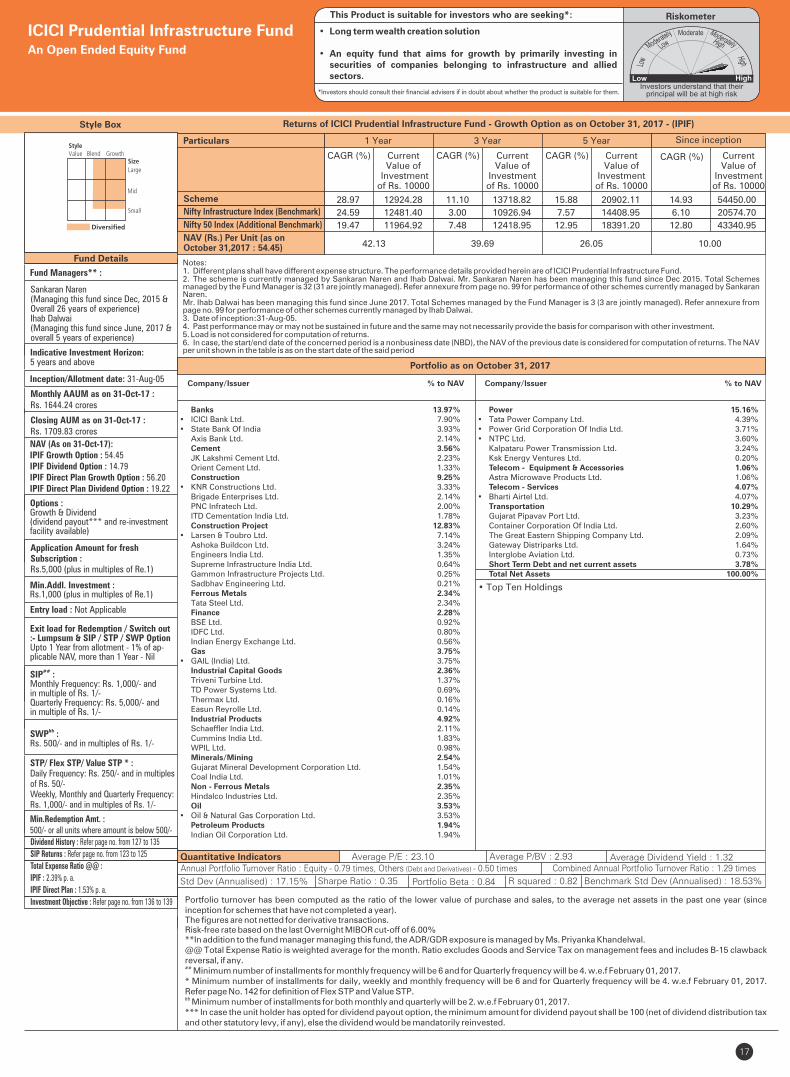
17
Fund Details
Portfolio as on October 31, 2017
Style Box
Quantitative Indicators
Returns of ICICI Prudential Infrastructure Fund - Growth Option as on October 31, 2017 - (IPIF)
Fund Managers** :
Sankaran Naren(Managing this fund since Dec, 2015 &Overall 26 years of experience)Ihab Dalwai(Managing this fund since June, 2017 & overall 5 years of experience)
Indicative Investment Horizon: 5 years and above
Inception/Allotment date: 31-Aug-05
NAV (As on 31-Oct-17):IPIF Growth Option : 54.45IPIF Dividend Option : 14.79IPIF Direct Plan Growth Option : 56.20IPIF Direct Plan Dividend Option : 19.22
Options :Growth & Dividend(dividend payout*** and re-investment facility available)
Application Amount for freshSubscription :Rs.5,000 (plus in multiples of Re.1)
Min.Addl. Investment :Rs.1,000 (plus in multiples of Re.1)
Exit load for Redemption / Switch out:- Lumpsum & SIP / STP / SWP OptionUpto 1 Year from allotment - 1% of ap-plicable NAV, more than 1 Year - Nil
##SIP :Monthly Frequency: Rs. 1,000/- and in multiple of Rs. 1/-Quarterly Frequency: Rs. 5,000/- and in multiple of Rs. 1/-
&&SWP :Rs. 500/- and in multiples of Rs. 1/-
STP/ Flex STP/ Value STP * :Daily Frequency: Rs. 250/- and in multiples of Rs. 50/-Weekly, Monthly and Quarterly Frequency: Rs. 1,000/- and in multiples of Rs. 1/-
Min.Redemption Amt. :500/- or all units where amount is below 500/-
• Top Ten Holdings
Std Dev (Annualised) : 17.15% Sharpe Ratio : 0.35
Average P/E : 23.10 Average P/BV : 2.93 Average Dividend Yield : 1.32
Portfolio Beta : 0.84 R squared : 0.82
Portfolio turnover has been computed as the ratio of the lower value of purchase and sales, to the average net assets in the past one year (since inception for schemes that have not completed a year). The figures are not netted for derivative transactions.Risk-free rate based on the last Overnight MIBOR cut-off of 6.00%**In addition to the fund manager managing this fund, the ADR/GDR exposure is managed by Ms. Priyanka Khandelwal.@@ Total Expense Ratio is weighted average for the month. Ratio excludes Goods and Service Tax on management fees and includes B-15 clawback reversal, if any.## Minimum number of installments for monthly frequency will be 6 and for Quarterly frequency will be 4. w.e.f February 01, 2017.* Minimum number of installments for daily, weekly and monthly frequency will be 6 and for Quarterly frequency will be 4. w.e.f February 01, 2017. Refer page No. 142 for definition of Flex STP and Value STP.&&
Minimum number of installments for both monthly and quarterly will be 2. w.e.f February 01, 2017.*** In case the unit holder has opted for dividend payout option, the minimum amount for dividend payout shall be 100 (net of dividend distribution tax and other statutory levy, if any), else the dividend would be mandatorily reinvested.
Monthly AAUM as on 31-Oct-17 : Rs. 1644.24 crores
Closing AUM as on 31-Oct-17 : Rs. 1709.83 crores
ICICI Prudential Infrastructure FundAn Open Ended Equity Fund
Benchmark Std Dev (Annualised) : 18.53%
Entry load : Not Applicable
RiskometerThis Product is suitable for investors who are seeking*:
• Long term wealth creation solution
• An equity fund that aims for growth by primarily investing in securities of companies belonging to infrastructure and allied sectors.
*Investors should consult their financial advisers if in doubt about whether the product is suitable for them.
Annual Portfolio Turnover Ratio : Equity - 0.79 times, Others (Debt and Derivatives) - 0.50 times Combined Annual Portfolio Turnover Ratio : 1.29 times
Dividend History : Refer page no. from 127 to 135
SIP Returns : Refer page no. from 123 to 125
Total Expense Ratio @@ :
IPIF : 2.39% p. a.
IPIF Direct Plan : 1.53% p. a.
Investment Objective : Refer page no. from 136 to 139
Notes:1. Different plans shall have different expense structure. The performance details provided herein are of ICICI Prudential Infrastructure Fund.2. The scheme is currently managed by Sankaran Naren and Ihab Dalwai. Mr. Sankaran Naren has been managing this fund since Dec 2015. Total Schemes managed by the Fund Manager . Refer annexure from page no. 99 for performance of other schemes currently managed by Sankaran is 32 (31 are jointly managed) Naren.Mr. Ihab Dalwai has been managing this fund since June 2017. Total Schemes managed by the Fund Manager is 3 . Refer annexure from (3 are jointly managed)page no. 99 for performance of other schemes currently managed by Ihab Dalwai.3. Date of inception:31-Aug-05.4. Past performance may or may not be sustained in future and the same may not necessarily provide the basis for comparison with other investment.5. Load is not considered for computation of returns.6. In case, the start/end date of the concerned period is a nonbusiness date (NBD), the NAV of the previous date is considered for computation of returns. The NAV per unit shown in the table is as on the start date of the said period
Scheme
Nifty 50 Index (Additional Benchmark)
NAV (Rs.) Per Unit (as on October 31,2017 : 54.45)
CAGR (%)
10.00
Nifty Infrastructure Index (Benchmark)
Since inception
CurrentValue of
Investment of Rs. 10000
CAGR (%) Current Value of
Investment of Rs. 10000
1 Year 3 Year 5 Year
CAGR (%) Current Value of
Investment of Rs. 10000
CAGR (%) Current Value of
Investment of Rs. 10000
42.13 39.69 26.05
Particulars
28.97 12924.28 11.10 13718.82 15.88 20902.11 14.93 54450.00
24.59 12481.40 3.00 10926.94 7.57 14408.95 6.10 20574.70
19.47 11964.92 7.48 12418.95 12.95 18391.20 12.80 43340.95
Banks 13.97%• ICICI Bank Ltd. 7.90%• State Bank Of India 3.93% Axis Bank Ltd. 2.14% Cement 3.56% JK Lakshmi Cement Ltd. 2.23% Orient Cement Ltd. 1.33% Construction 9.25%• KNR Constructions Ltd. 3.33% Brigade Enterprises Ltd. 2.14% PNC Infratech Ltd. 2.00% ITD Cementation India Ltd. 1.78% Construction Project 12.83%• Larsen & Toubro Ltd. 7.14% Ashoka Buildcon Ltd. 3.24% Engineers India Ltd. 1.35% Supreme Infrastructure India Ltd. 0.64% Gammon Infrastructure Projects Ltd. 0.25% Sadbhav Engineering Ltd. 0.21% Ferrous Metals 2.34% Tata Steel Ltd. 2.34% Finance 2.28% BSE Ltd. 0.92% IDFC Ltd. 0.80% Indian Energy Exchange Ltd. 0.56% Gas 3.75%• GAIL (India) Ltd. 3.75% Industrial Capital Goods 2.36% Triveni Turbine Ltd. 1.37% TD Power Systems Ltd. 0.69% Thermax Ltd. 0.16% Easun Reyrolle Ltd. 0.14% Industrial Products 4.92% Schaeffler India Ltd. 2.11% Cummins India Ltd. 1.83% WPIL Ltd. 0.98% Minerals/Mining 2.54% Gujarat Mineral Development Corporation Ltd. 1.54% Coal India Ltd. 1.01% Non - Ferrous Metals 2.35% Hindalco Industries Ltd. 2.35% Oil 3.53%• Oil & Natural Gas Corporation Ltd. 3.53% Petroleum Products 1.94% Indian Oil Corporation Ltd. 1.94%
Power 15.16%• Tata Power Company Ltd. 4.39%• Power Grid Corporation Of India Ltd. 3.71%• NTPC Ltd. 3.60% Kalpataru Power Transmission Ltd. 3.24% Ksk Energy Ventures Ltd. 0.20% Telecom - Equipment & Accessories 1.06% Astra Microwave Products Ltd. 1.06% Telecom - Services 4.07%• Bharti Airtel Ltd. 4.07% Transportation 10.29% Gujarat Pipavav Port Ltd. 3.23% Container Corporation Of India Ltd. 2.60% The Great Eastern Shipping Company Ltd. 2.09% Gateway Distriparks Ltd. 1.64% Interglobe Aviation Ltd. 0.73% Short Term Debt and net current assets 3.78% Total Net Assets 100.00%
Company/Issuer % to NAV
Company/Issuer % to NAV
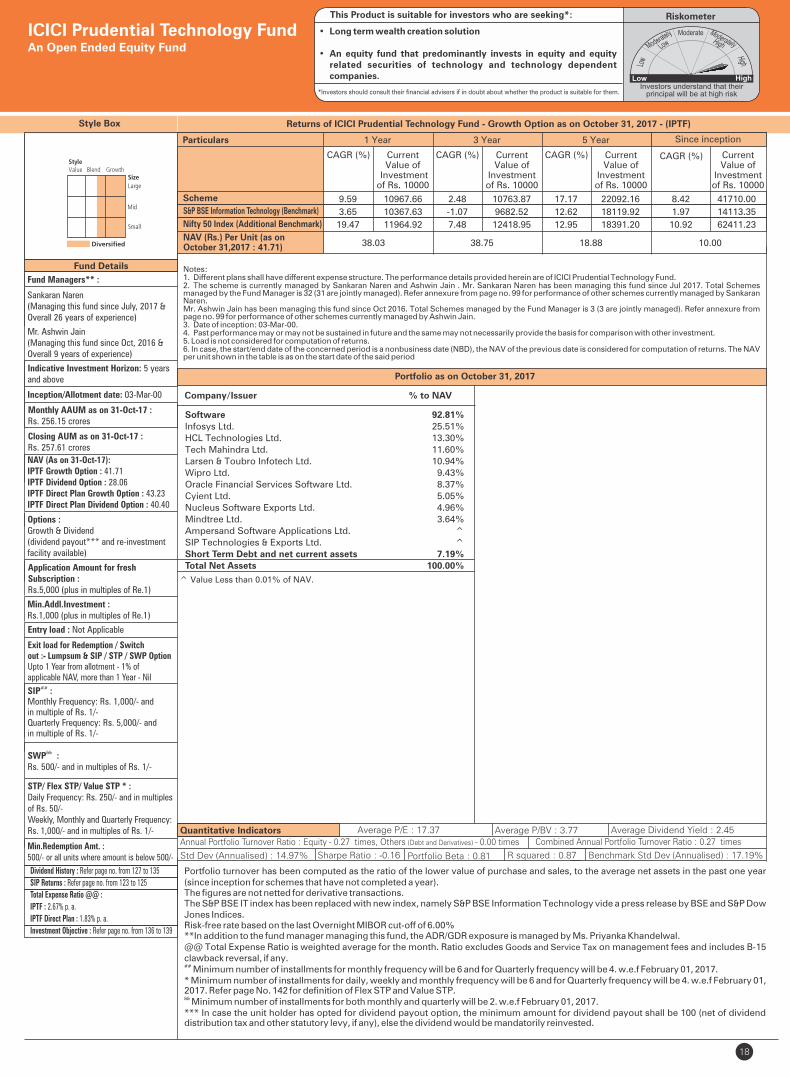
18
Fund Details
Quantitative Indicators
Style Box
Company/Issuer % to NAV
Fund Managers** :
Mr. Ashwin Jain (Managing this fund since Oct, 2016 & Overall 9 years of experience)
Indicative Investment Horizon: 5 yearsand above
Inception/Allotment date: 03-Mar-00
Monthly AAUM as on 31-Oct-17 :Rs. 256.15 crores
Closing AUM as on 31-Oct-17 : Rs. 257.61 crores
NAV (As on 31-Oct-17):IPTF Growth Option : 41.71IPTF Dividend Option : 28.06IPTF Direct Plan Growth Option : 43.23IPTF Direct Plan Dividend Option : 40.40
Options :Growth & Dividend(dividend payout*** and re-investment facility available)
Application Amount for freshSubscription :Rs.5,000 (plus in multiples of Re.1)
Min.Addl.Investment :Rs.1,000 (plus in multiples of Re.1)
Exit load for Redemption / Switchout :- Lumpsum & SIP / STP / SWP OptionUpto 1 Year from allotment - 1% ofapplicable NAV, more than 1 Year - Nil
SIP :##
Monthly Frequency: Rs. 1,000/- and in multiple of Rs. 1/-Quarterly Frequency: Rs. 5,000/- and in multiple of Rs. 1/-
&&SWP :Rs. 500/- and in multiples of Rs. 1/-
STP/ Flex STP/ Value STP * :Daily Frequency: Rs. 250/- and in multiples of Rs. 50/-Weekly, Monthly and Quarterly Frequency: Rs. 1,000/- and in multiples of Rs. 1/-
Min.Redemption Amt. : 500/- or all units where amount is below 500/- Std Dev (Annualised) : 14.97% Sharpe Ratio : -0.16
Average P/E : 17.37 Average P/BV : 3.77 Average Dividend Yield : 2.45
Portfolio Beta : 0.81 R squared : 0.87
Portfolio turnover has been computed as the ratio of the lower value of purchase and sales, to the average net assets in the past one year (since inception for schemes that have not completed a year). The figures are not netted for derivative transactions.The S&P BSE IT index has been replaced with new index, namely S&P BSE Information Technology vide a press release by BSE and S&P Dow Jones Indices. Risk-free rate based on the last Overnight MIBOR cut-off of 6.00%**In addition to the fund manager managing this fund, the ADR/GDR exposure is managed by Ms. Priyanka Khandelwal.@@ Total Expense Ratio is weighted average for the month. Ratio excludes Goods and Service Tax on management fees and includes B-15 clawback reversal, if any.## Minimum number of installments for monthly frequency will be 6 and for Quarterly frequency will be 4. w.e.f February 01, 2017.* Minimum number of installments for daily, weekly and monthly frequency will be 6 and for Quarterly frequency will be 4. w.e.f February 01, 2017. Refer page No. 142 for definition of Flex STP and Value STP.&& Minimum number of installments for both monthly and quarterly will be 2. w.e.f February 01, 2017.*** In case the unit holder has opted for dividend payout option, the minimum amount for dividend payout shall be 100 (net of dividend distribution tax and other statutory levy, if any), else the dividend would be mandatorily reinvested.
^ Value Less than 0.01% of NAV.
Portfolio as on October 31, 2017
Returns of ICICI Prudential Technology Fund - Growth Option as on October 31, 2017 - (IPTF)
Software 92.81%Infosys Ltd. 25.51%HCL Technologies Ltd. 13.30%Tech Mahindra Ltd. 11.60%Larsen & Toubro Infotech Ltd. 10.94%Wipro Ltd. 9.43%Oracle Financial Services Software Ltd. 8.37%Cyient Ltd. 5.05%Nucleus Software Exports Ltd. 4.96%Mindtree Ltd. 3.64%Ampersand Software Applications Ltd. ^SIP Technologies & Exports Ltd. ^Short Term Debt and net current assets 7.19%Total Net Assets 100.00%
ICICI Prudential Technology FundAn Open Ended Equity Fund
Benchmark Std Dev (Annualised) : 17.19%
Entry load : Not Applicable
Riskometer
• Long term wealth creation solution
• An equity fund that predominantly invests in equity and equity related securities of technology and technology dependent companies.
*Investors should consult their financial advisers if in doubt about whether the product is suitable for them.
This Product is suitable for investors who are seeking*:
Annual Portfolio Turnover Ratio : Equity - 0.27 times, Others (Debt and Derivatives) - 0.00 times Combined Annual Portfolio Turnover Ratio : 0.27 times
Dividend History : Refer page no. from 127 to 135
SIP Returns : Refer page no. from 123 to 125
Total Expense Ratio @@ :
IPTF : 2.67% p. a.
IPTF Direct Plan : 1.83% p. a.
Investment Objective : Refer page no. from 136 to 139
Sankaran Naren(Managing this fund since July, 2017 &Overall 26 years of experience)
Notes:1. Different plans shall have different expense structure. The performance details provided herein are of ICICI Prudential Technology Fund.2. The scheme is currently managed by Sankaran Naren and Ashwin Jain . Mr. Sankaran Naren has been managing this fund since Jul 2017. Total Schemes managed by the Fund Manager is 32 (31 are jointly managed). Refer annexure from page no. 99 for performance of other schemes currently managed by Sankaran Naren.Mr. Ashwin Jain has been managing this fund since Oct 2016. Total Schemes managed by the Fund Manager ). Refer annexure from is 3 (3 are jointly managedpage no. 99 for performance of other schemes currently managed by Ashwin Jain. 3. Date of inception: 03-Mar-00.4. Past performance may or may not be sustained in future and the same may not necessarily provide the basis for comparison with other investment.5. Load is not considered for computation of returns.6. In case, the start/end date of the concerned period is a nonbusiness date (NBD), the NAV of the previous date is considered for computation of returns. The NAV per unit shown in the table is as on the start date of the said period
Scheme
Nifty 50 Index (Additional Benchmark)
NAV (Rs.) Per Unit (as on October 31,2017 : 41.71)
CAGR (%)
10.00
S&P BSE Information Technology (Benchmark)
Since inception
CurrentValue of
Investment of Rs. 10000
CAGR (%) Current Value of
Investment of Rs. 10000
1 Year 3 Year 5 Year
CAGR (%) Current Value of
Investment of Rs. 10000
CAGR (%) Current Value of
Investment of Rs. 10000
38.03 38.75 18.88
Particulars
9.59 10967.66 2.48 10763.87 17.17 22092.16 8.42 41710.00
3.65 10367.63 -1.07 9682.52 12.62 18119.92 1.97 14113.35
19.47 11964.92 7.48 12418.95 12.95 18391.20 10.92 62411.23
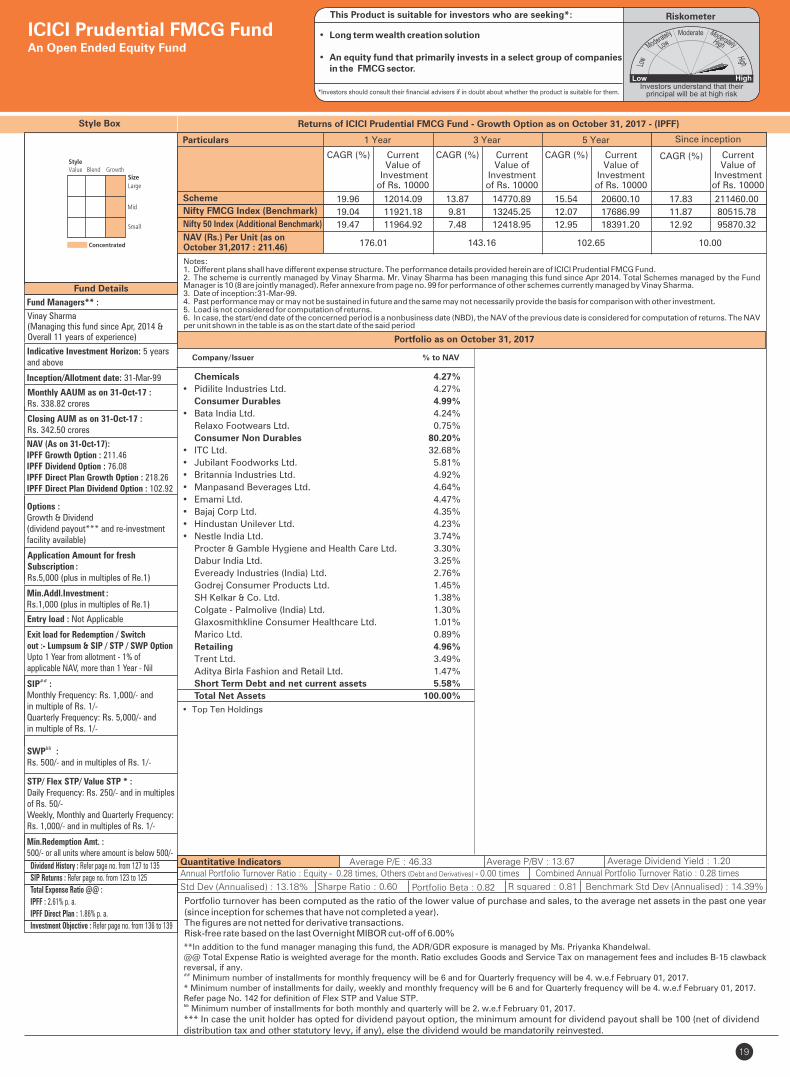
19
Fund Details
Quantitative Indicators
Style Box
Company/Issuer % to NAV
Fund Managers** :
Vinay Sharma (Managing this fund since Apr, 2014 &Overall 11 years of experience)
Indicative Investment Horizon: 5 yearsand above
Inception/Allotment date: 31-Mar-99
Monthly AAUM as on 31-Oct-17 : Rs. 338.82 crores
Closing AUM as on 31-Oct-17 : Rs. 342.50 crores
NAV (As on 31-Oct-17):IPFF Growth Option : 211.46IPFF Dividend Option : 76.08IPFF Direct Plan Growth Option : 218.26IPFF Direct Plan Dividend Option : 102.92
Options :Growth & Dividend(dividend payout*** and re-investment facility available)
Application Amount for freshSubscription :Rs.5,000 (plus in multiples of Re.1)
Min.Addl.Investment :Rs.1,000 (plus in multiples of Re.1)
Exit load for Redemption / Switchout :- Lumpsum & SIP / STP / SWP OptionUpto 1 Year from allotment - 1% ofapplicable NAV, more than 1 Year - Nil
SIP :##
Monthly Frequency: Rs. 1,000/- and in multiple of Rs. 1/-Quarterly Frequency: Rs. 5,000/- and in multiple of Rs. 1/-
&&SWP :Rs. 500/- and in multiples of Rs. 1/-
STP/ Flex STP/ Value STP * :Daily Frequency: Rs. 250/- and in multiples of Rs. 50/-Weekly, Monthly and Quarterly Frequency: Rs. 1,000/- and in multiples of Rs. 1/-
Min.Redemption Amt. :500/- or all units where amount is below 500/-
Portfolio turnover has been computed as the ratio of the lower value of purchase and sales, to the average net assets in the past one year (since inception for schemes that have not completed a year). The figures are not netted for derivative transactions.Risk-free rate based on the last Overnight MIBOR cut-off of 6.00%
**In addition to the fund manager managing this fund, the ADR/GDR exposure is managed by Ms. Priyanka Khandelwal.@@ Total Expense Ratio is weighted average for the month. Ratio excludes Goods and Service Tax on management fees and includes B-15 clawback reversal, if any.## Minimum number of installments for monthly frequency will be 6 and for Quarterly frequency will be 4. w.e.f February 01, 2017.* Minimum number of installments for daily, weekly and monthly frequency will be 6 and for Quarterly frequency will be 4. w.e.f February 01, 2017. Refer page No. 142 for definition of Flex STP and Value STP.&& Minimum number of installments for both monthly and quarterly will be 2. w.e.f February 01, 2017.
*** In case the unit holder has opted for dividend payout option, the minimum amount for dividend payout shall be 100 (net of dividend distribution tax and other statutory levy, if any), else the dividend would be mandatorily reinvested.
Std Dev (Annualised) : 13.18% Sharpe Ratio : 0.60
Average P/E : 46.33 Average P/BV : 13.67 Average Dividend Yield : 1.20
Portfolio Beta : 0.82 R squared : 0.81
• Top Ten Holdings
Portfolio as on October 31, 2017
Returns of ICICI Prudential FMCG Fund - Growth Option as on October 31, 2017 - (IPFF)
Chemicals 4.27%
• Pidilite Industries Ltd. 4.27%
Consumer Durables 4.99%
• Bata India Ltd. 4.24%
Relaxo Footwears Ltd. 0.75%
Consumer Non Durables 80.20%
• ITC Ltd. 32.68%
• Jubilant Foodworks Ltd. 5.81%
• Britannia Industries Ltd. 4.92%
• Manpasand Beverages Ltd. 4.64%
• Emami Ltd. 4.47%
• Bajaj Corp Ltd. 4.35%
• Hindustan Unilever Ltd. 4.23%
• Nestle India Ltd. 3.74%
Procter & Gamble Hygiene and Health Care Ltd. 3.30%
Dabur India Ltd. 3.25%
Eveready Industries (India) Ltd. 2.76%
Godrej Consumer Products Ltd. 1.45%
SH Kelkar & Co. Ltd. 1.38%
Colgate - Palmolive (India) Ltd. 1.30%
Glaxosmithkline Consumer Healthcare Ltd. 1.01%
Marico Ltd. 0.89%
Retailing 4.96%
Trent Ltd. 3.49%
Aditya Birla Fashion and Retail Ltd. 1.47%
Short Term Debt and net current assets 5.58%
Total Net Assets 100.00%
ICICI Prudential FMCG FundAn Open Ended Equity Fund
Benchmark Std Dev (Annualised) : 14.39%
Entry load : Not Applicable
Riskometer
• Long term wealth creation solution
• An equity fund that primarily invests in a select group of companies in the FMCG sector.
*Investors should consult their financial advisers if in doubt about whether the product is suitable for them.
This Product is suitable for investors who are seeking*:
Annual Portfolio Turnover Ratio : Equity - 0.28 times, Others (Debt and Derivatives) - 0.00 times Combined Annual Portfolio Turnover Ratio : 0.28 timesDividend History : Refer page no. from 127 to 135
SIP Returns : Refer page no. from 123 to 125
Total Expense Ratio @@ :
IPFF : 2.61% p. a.
IPFF Direct Plan : 1.86% p. a.
Investment Objective : Refer page no. from 136 to 139
Notes:1. Different plans shall have different expense structure. The performance details provided herein are of ICICI Prudential FMCG Fund.2. The scheme is currently managed by Vinay Sharma. Mr. Vinay Sharma has been managing this fund since Apr 2014. Total Schemes managed by the Fund Manager Refer annexure from page no. 99 for performance of other schemes currently managed by Vinay Sharma.is 10 (8 are jointly managed).3. Date of inception:31-Mar-99.4. Past performance may or may not be sustained in future and the same may not necessarily provide the basis for comparison with other investment.5. Load is not considered for computation of returns.6. In case, the start/end date of the concerned period is a nonbusiness date (NBD), the NAV of the previous date is considered for computation of returns. The NAV per unit shown in the table is as on the start date of the said period
Scheme
Nifty 50 Index (Additional Benchmark)
NAV (Rs.) Per Unit (as on October 31,2017 : 211.46)
CAGR (%)
10.00
Nifty FMCG Index (Benchmark)
Since inception
CurrentValue of
Investment of Rs. 10000
CAGR (%) Current Value of
Investment of Rs. 10000
1 Year 3 Year 5 Year
CAGR (%) Current Value of
Investment of Rs. 10000
CAGR (%) Current Value of
Investment of Rs. 10000
176.01 143.16 102.65
Particulars
19.96 12014.09 13.87 14770.89 15.54 20600.10 17.83 211460.00
19.04 11921.18 9.81 13245.25 12.07 17686.99 11.87 80515.78
19.47 11964.92 7.48 12418.95 12.95 18391.20 12.92 95870.32
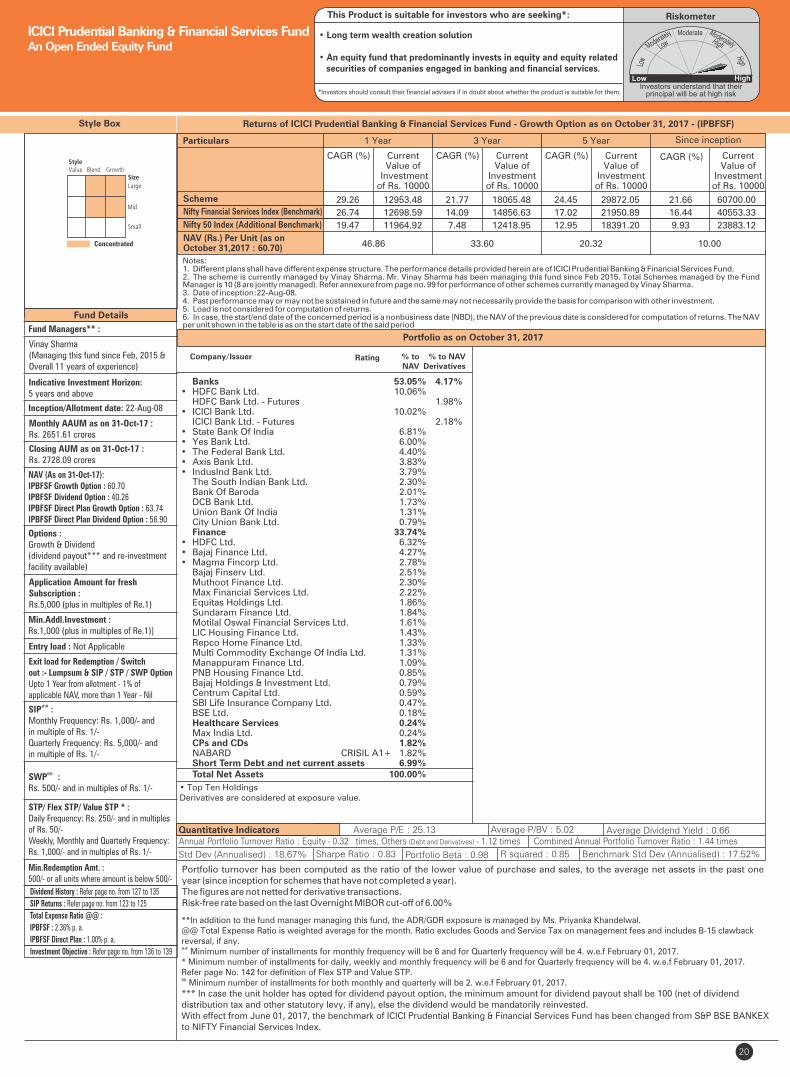
20
Fund Details
Quantitative Indicators
Portfolio turnover has been computed as the ratio of the lower value of purchase and sales, to the average net assets in the past one year (since inception for schemes that have not completed a year). The figures are not netted for derivative transactions.Risk-free rate based on the last Overnight MIBOR cut-off of 6.00%
**In addition to the fund manager managing this fund, the ADR/GDR exposure is managed by Ms. Priyanka Khandelwal.@@ Total Expense Ratio is weighted average for the month. Ratio excludes Goods and Service Tax on management fees and includes B-15 clawback reversal, if any.## Minimum number of installments for monthly frequency will be 6 and for Quarterly frequency will be 4. w.e.f February 01, 2017.* Minimum number of installments for daily, weekly and monthly frequency will be 6 and for Quarterly frequency will be 4. w.e.f February 01, 2017.Refer page No. 142 for definition of Flex STP and Value STP.&& Minimum number of installments for both monthly and quarterly will be 2. w.e.f February 01, 2017.
*** In case the unit holder has opted for dividend payout option, the minimum amount for dividend payout shall be 100 (net of dividend distribution tax and other statutory levy, if any), else the dividend would be mandatorily reinvested.With effect from June 01, 2017, the benchmark of ICICI Prudential Banking & Financial Services Fund has been changed from S&P BSE BANKEX to NIFTY Financial Services Index.
Fund Managers** :
Vinay Sharma(Managing this fund since Feb, 2015 &Overall 11 years of experience)
Indicative Investment Horizon: 5 years and above
Inception/Allotment date: 22-Aug-08
NAV (As on 31-Oct-17):IPBFSF Growth Option : 60.70IPBFSF Dividend Option : 40.26IPBFSF Direct Plan Growth Option : 63.74IPBFSF Direct Plan Dividend Option : 56.90
Options :Growth & Dividend(dividend payout*** and re-investment facility available)
Application Amount for freshSubscription :Rs.5,000 (plus in multiples of Re.1)
Min.Addl.Investment :Rs.1,000 (plus in multiples of Re.1)]
Exit load for Redemption / Switchout :- Lumpsum & SIP / STP / SWP OptionUpto 1 Year from allotment - 1% ofapplicable NAV, more than 1 Year - Nil
SIP :##
Monthly Frequency: Rs. 1,000/- and in multiple of Rs. 1/-Quarterly Frequency: Rs. 5,000/- and in multiple of Rs. 1/-
&&SWP :Rs. 500/- and in multiples of Rs. 1/-
STP/ Flex STP/ Value STP * :Daily Frequency: Rs. 250/- and in multiples of Rs. 50/-Weekly, Monthly and Quarterly Frequency: Rs. 1,000/- and in multiples of Rs. 1/-
Min.Redemption Amt. :500/- or all units where amount is below 500/-
Std Dev (Annualised) : 18.67% Sharpe Ratio : 0.83
Average P/E : 25.13 Average P/BV : 5.02 Average Dividend Yield : 0.66
Portfolio Beta : 0.98 R squared : 0.85
Style Box
Portfolio as on October 31, 2017
Returns of ICICI Prudential Banking & Financial Services Fund - Growth Option as on October 31, 2017 - (IPBFSF)
• Top Ten HoldingsDerivatives are considered at exposure value.
Concentrated
Monthly AAUM as on 31-Oct-17 : Rs. 2651.61 crores
ICICI Prudential Banking & Financial Services FundAn Open Ended Equity Fund
Closing AUM as on 31-Oct-17 : Rs. 2728.09 crores
Benchmark Std Dev (Annualised) : 17.52%
Entry load : Not Applicable
RiskometerThis Product is suitable for investors who are seeking*:
• Long term wealth creation solution
• An equity fund that predominantly invests in equity and equity related securities of companies engaged in banking and financial services.
*Investors should consult their financial advisers if in doubt about whether the product is suitable for them.
Annual Portfolio Turnover Ratio : Equity - 0.32 times, Others (Debt and Derivatives) - 1.12 times Combined Annual Portfolio Turnover Ratio : 1.44 times
Dividend History : Refer page no. from 127 to 135
SIP Returns : Refer page no. from 123 to 125
Total Expense Ratio @@ :
IPBFSF : 2.36% p. a.
IPBFSF Direct Plan : 1.00% p. a.
Investment Objective : Refer page no. from 136 to 139
Banks 53.05% 4.17%• HDFC Bank Ltd. 10.06% HDFC Bank Ltd. - Futures 1.98%• ICICI Bank Ltd. 10.02% ICICI Bank Ltd. - Futures 2.18%• State Bank Of India 6.81% • Yes Bank Ltd. 6.00% • The Federal Bank Ltd. 4.40% • Axis Bank Ltd. 3.83% • IndusInd Bank Ltd. 3.79% The South Indian Bank Ltd. 2.30% Bank Of Baroda 2.01% DCB Bank Ltd. 1.73% Union Bank Of India 1.31% City Union Bank Ltd. 0.79% Finance 33.74% • HDFC Ltd. 6.32% • Bajaj Finance Ltd. 4.27% • Magma Fincorp Ltd. 2.78% Bajaj Finserv Ltd. 2.51% Muthoot Finance Ltd. 2.30% Max Financial Services Ltd. 2.22% Equitas Holdings Ltd. 1.86% Sundaram Finance Ltd. 1.84% Motilal Oswal Financial Services Ltd. 1.61% LIC Housing Finance Ltd. 1.43% Repco Home Finance Ltd. 1.33% Multi Commodity Exchange Of India Ltd. 1.31% Manappuram Finance Ltd. 1.09% PNB Housing Finance Ltd. 0.85% Bajaj Holdings & Investment Ltd. 0.79% Centrum Capital Ltd. 0.59% SBI Life Insurance Company Ltd. 0.47% BSE Ltd. 0.18% Healthcare Services 0.24% Max India Ltd. 0.24% CPs and CDs 1.82% NABARD CRISIL A1+ 1.82% Short Term Debt and net current assets 6.99% Total Net Assets 100.00%
Company/Issuer % to % to NAV NAV Derivatives
Notes:1. Different plans shall have different expense structure. The performance details provided herein are of ICICI Prudential Banking & Financial Services Fund.2. The scheme is currently managed by Vinay Sharma. Mr. Vinay Sharma has been managing this fund since Feb 2015. Total Schemes managed by the Fund Manager Refer annexure from page no. 99 for performance of other schemes currently managed by Vinay Sharma.is 10 (8 are jointly managed).3. Date of inception:22-Aug-08.4. Past performance may or may not be sustained in future and the same may not necessarily provide the basis for comparison with other investment.5. Load is not considered for computation of returns.6. In case, the start/end date of the concerned period is a nonbusiness date (NBD), the NAV of the previous date is considered for computation of returns. The NAV per unit shown in the table is as on the start date of the said period
Scheme
Nifty 50 Index (Additional Benchmark)
NAV (Rs.) Per Unit (as on October 31,2017 : 60.70)
CAGR (%)
10.00
Nifty Financial Services Index (Benchmark)
Since inception
CurrentValue of
Investment of Rs. 10000
CAGR (%) Current Value of
Investment of Rs. 10000
1 Year 3 Year 5 Year
CAGR (%) Current Value of
Investment of Rs. 10000
CAGR (%) Current Value of
Investment of Rs. 10000
46.86 33.60 20.32
Particulars
29.26 12953.48 21.77 18065.48 24.45 29872.05 21.66 60700.00
26.74 12698.59 14.09 14856.63 17.02 21950.89 16.44 40553.33
19.47 11964.92 7.48 12418.95 12.95 18391.20 9.93 23883.12
Rating
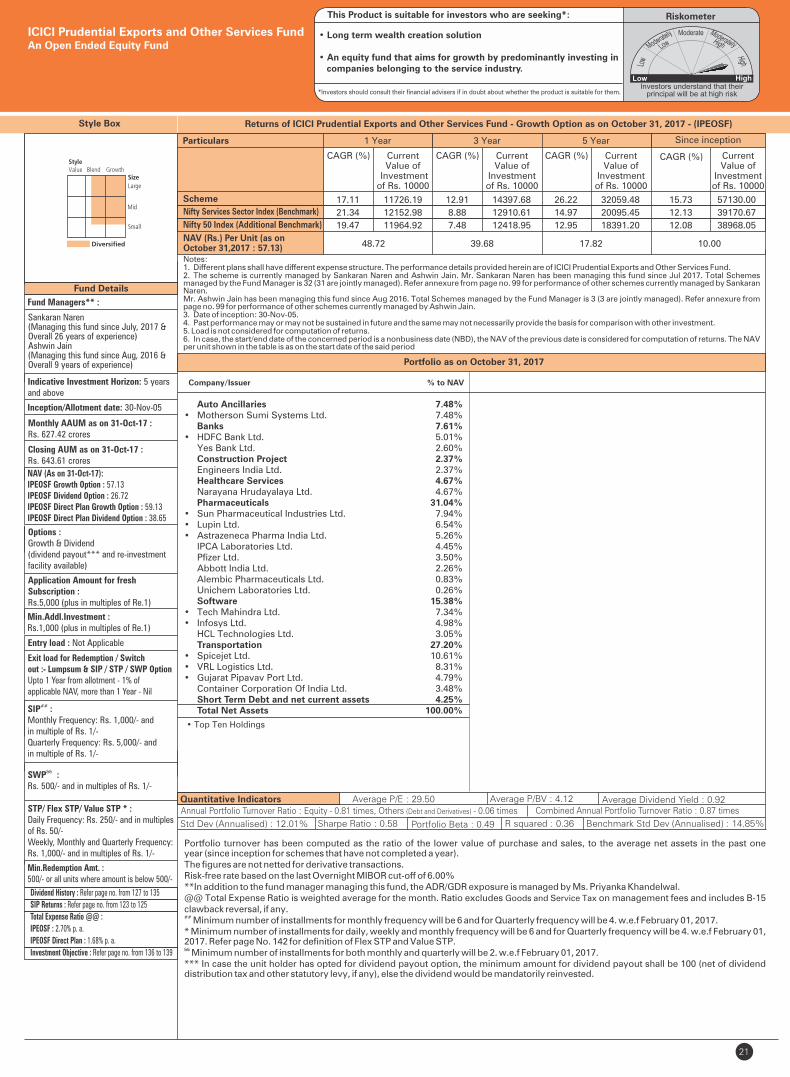
21
Fund Managers** :
Sankaran Naren(Managing this fund since July, 2017 &Overall 26 years of experience)Ashwin Jain(Managing this fund since Aug, 2016 &Overall 9 years of experience)
Indicative Investment Horizon: 5 yearsand above
Inception/Allotment date: 30-Nov-05
NAV (As on 31-Oct-17):IPEOSF Growth Option : 57.13IPEOSF Dividend Option : 26.72IPEOSF Direct Plan Growth Option : 59.13IPEOSF Direct Plan Dividend Option : 38.65
Application Amount for freshSubscription :Rs.5,000 (plus in multiples of Re.1)
Min.Addl.Investment :Rs.1,000 (plus in multiples of Re.1)
Exit load for Redemption / Switchout :- Lumpsum & SIP / STP / SWP OptionUpto 1 Year from allotment - 1% ofapplicable NAV, more than 1 Year - Nil
SIP :##
Monthly Frequency: Rs. 1,000/- and in multiple of Rs. 1/-Quarterly Frequency: Rs. 5,000/- and in multiple of Rs. 1/-
&&SWP :Rs. 500/- and in multiples of Rs. 1/-
STP/ Flex STP/ Value STP * :Daily Frequency: Rs. 250/- and in multiples of Rs. 50/-Weekly, Monthly and Quarterly Frequency: Rs. 1,000/- and in multiples of Rs. 1/-
Min.Redemption Amt. :500/- or all units where amount is below 500/-
Portfolio turnover has been computed as the ratio of the lower value of purchase and sales, to the average net assets in the past one year (since inception for schemes that have not completed a year). The figures are not netted for derivative transactions.Risk-free rate based on the last Overnight MIBOR cut-off of 6.00%**In addition to the fund manager managing this fund, the ADR/GDR exposure is managed by Ms. Priyanka Khandelwal.@@ Total Expense Ratio is weighted average for the month. Ratio excludes Goods and Service Tax on management fees and includes B-15 clawback reversal, if any.## Minimum number of installments for monthly frequency will be 6 and for Quarterly frequency will be 4. w.e.f February 01, 2017.* Minimum number of installments for daily, weekly and monthly frequency will be 6 and for Quarterly frequency will be 4. w.e.f February 01, 2017. Refer page No. 142 for definition of Flex STP and Value STP.&& Minimum number of installments for both monthly and quarterly will be 2. w.e.f February 01, 2017.*** In case the unit holder has opted for dividend payout option, the minimum amount for dividend payout shall be 100 (net of dividend distribution tax and other statutory levy, if any), else the dividend would be mandatorily reinvested.
Std Dev (Annualised) : 12.01% Sharpe Ratio : 0.58
Average P/E : 29.50 Average P/BV : 4.12 Average Dividend Yield : 0.92
Portfolio Beta : 0.49 R squared : 0.36
Style Box
• Top Ten Holdings
Portfolio as on October 31, 2017
Returns of ICICI Prudential Exports and Other Services Fund - Growth Option as on October 31, 2017 - (IPEOSF)
Monthly AAUM as on 31-Oct-17 : Rs. 627.42 crores
Closing AUM as on 31-Oct-17 :Rs. 643.61 crores
ICICI Prudential Exports and Other Services FundAn Open Ended Equity Fund
Benchmark Std Dev (Annualised) : 14.85%
Entry load : Not Applicable
RiskometerThis Product is suitable for investors who are seeking*:
• Long term wealth creation solution
• An equity fund that aims for growth by predominantly investing in companies belonging to the service industry.
*Investors should consult their financial advisers if in doubt about whether the product is suitable for them.
Annual Portfolio Turnover Ratio : Equity - 0.81 times, Others (Debt and Derivatives) - 0.06 times Combined Annual Portfolio Turnover Ratio : 0.87 times
Options :Growth & Dividend(dividend payout*** and re-investment facility available)
Dividend History : Refer page no. from 127 to 135
SIP Returns : Refer page no. from 123 to 125
Total Expense Ratio @@ :
IPEOSF : 2.70% p. a.
IPEOSF Direct Plan : 1.68% p. a.
Investment Objective : Refer page no. from 136 to 139
Notes:1. Different plans shall have different expense structure. The performance details provided herein are of ICICI Prudential Exports and Other Services Fund.2. The scheme is currently managed by Sankaran Naren and Ashwin Jain. Mr. Sankaran Naren has been managing this fund since Jul 2017. Total Schemes managed by the Fund Manager is 32 (31 are jointly managed). Refer annexure from page no. 99 for performance of other schemes currently managed by Sankaran Naren.Mr. Ashwin Jain has been managing this fund since Aug 2016. Total Schemes managed by the Fund Manager ). Refer annexure from is 3 (3 are jointly managedpage no. 99 for performance of other schemes currently managed by Ashwin Jain. 3. Date of inception: 30-Nov-05.4. Past performance may or may not be sustained in future and the same may not necessarily provide the basis for comparison with other investment.5. Load is not considered for computation of returns.6. In case, the start/end date of the concerned period is a nonbusiness date (NBD), the NAV of the previous date is considered for computation of returns. The NAV per unit shown in the table is as on the start date of the said period
Scheme
Nifty 50 Index (Additional Benchmark)
NAV (Rs.) Per Unit (as on October 31,2017 : 57.13)
CAGR (%)
10.00
Nifty Services Sector Index (Benchmark)
Since inception
CurrentValue of
Investment of Rs. 10000
CAGR (%) Current Value of
Investment of Rs. 10000
1 Year 3 Year 5 Year
CAGR (%) Current Value of
Investment of Rs. 10000
CAGR (%) Current Value of
Investment of Rs. 10000
48.72 39.68 17.82
Particulars
17.11 11726.19 12.91 14397.68 26.22 32059.48 15.73 57130.00
21.34 12152.98 8.88 12910.61 14.97 20095.45 12.13 39170.67
19.47 11964.92 7.48 12418.95 12.95 18391.20 12.08 38968.05
Company/Issuer % to NAV
Auto Ancillaries 7.48%• Motherson Sumi Systems Ltd. 7.48% Banks 7.61%• HDFC Bank Ltd. 5.01% Yes Bank Ltd. 2.60% Construction Project 2.37% Engineers India Ltd. 2.37% Healthcare Services 4.67% Narayana Hrudayalaya Ltd. 4.67% Pharmaceuticals 31.04%• Sun Pharmaceutical Industries Ltd. 7.94%• Lupin Ltd. 6.54%• Astrazeneca Pharma India Ltd. 5.26% IPCA Laboratories Ltd. 4.45% Pfizer Ltd. 3.50% Abbott India Ltd. 2.26% Alembic Pharmaceuticals Ltd. 0.83% Unichem Laboratories Ltd. 0.26% Software 15.38%• Tech Mahindra Ltd. 7.34%• Infosys Ltd. 4.98% HCL Technologies Ltd. 3.05% Transportation 27.20%• Spicejet Ltd. 10.61%• VRL Logistics Ltd. 8.31%• Gujarat Pipavav Port Ltd. 4.79% Container Corporation Of India Ltd. 3.48% Short Term Debt and net current assets 4.25% Total Net Assets 100.00%
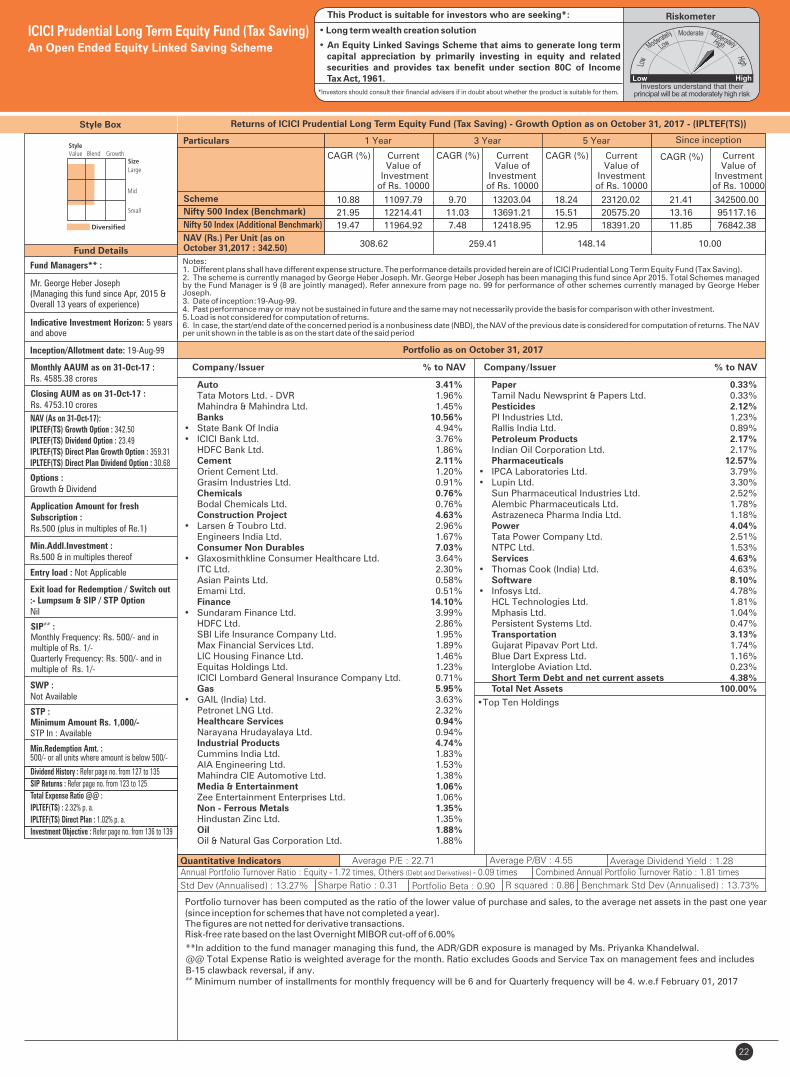
22
Fund Details
Portfolio as on October 31, 2017
Quantitative Indicators
Style Box
Fund Managers** :
Mr. George Heber Joseph(Managing this fund since Apr, 2015 &Overall 13 years of experience)
Indicative Investment Horizon: 5 yearsand above
Inception/Allotment date: 19-Aug-99
NAV (As on 31-Oct-17):IPLTEF(TS) Growth Option : 342.50IPLTEF(TS) Dividend Option : 23.49IPLTEF(TS) Direct Plan Growth Option : 359.31IPLTEF(TS) Direct Plan Dividend Option : 30.68
Options :Growth & Dividend
Application Amount for freshSubscription :Rs.500 (plus in multiples of Re.1)
Min.Addl.Investment :Rs.500 & in multiples thereof
Exit load for Redemption / Switch out:- Lumpsum & SIP / STP OptionNil
Min.Redemption Amt. :500/- or all units where amount is below 500/-
Std Dev (Annualised) : 13.27% Sharpe Ratio : 0.31
Average P/E : 22.71 Average P/BV : 4.55 Average Dividend Yield : 1.28
Portfolio Beta : 0.90 R squared : 0.86
• Top Ten Holdings
Returns of ICICI Prudential Long Term Equity Fund (Tax Saving) - Growth Option as on October 31, 2017 - (IPLTEF(TS))
Auto 3.41% Tata Motors Ltd. - DVR 1.96% Mahindra & Mahindra Ltd. 1.45% Banks 10.56%• State Bank Of India 4.94%• ICICI Bank Ltd. 3.76% HDFC Bank Ltd. 1.86% Cement 2.11% Orient Cement Ltd. 1.20% Grasim Industries Ltd. 0.91% Chemicals 0.76% Bodal Chemicals Ltd. 0.76% Construction Project 4.63%• Larsen & Toubro Ltd. 2.96% Engineers India Ltd. 1.67% Consumer Non Durables 7.03%• Glaxosmithkline Consumer Healthcare Ltd. 3.64% ITC Ltd. 2.30% Asian Paints Ltd. 0.58% Emami Ltd. 0.51% Finance 14.10%• Sundaram Finance Ltd. 3.99% HDFC Ltd. 2.86% SBI Life Insurance Company Ltd. 1.95% Max Financial Services Ltd. 1.89% LIC Housing Finance Ltd. 1.46% Equitas Holdings Ltd. 1.23% ICICI Lombard General Insurance Company Ltd. 0.71% Gas 5.95%• GAIL (India) Ltd. 3.63% Petronet LNG Ltd. 2.32% Healthcare Services 0.94% Narayana Hrudayalaya Ltd. 0.94% Industrial Products 4.74% Cummins India Ltd. 1.83% AIA Engineering Ltd. 1.53% Mahindra CIE Automotive Ltd. 1.38% Media & Entertainment 1.06% Zee Entertainment Enterprises Ltd. 1.06% Non - Ferrous Metals 1.35% Hindustan Zinc Ltd. 1.35% Oil 1.88% Oil & Natural Gas Corporation Ltd. 1.88%
Monthly AAUM as on 31-Oct-17 : Rs. 4585.38 crores
Closing AUM as on 31-Oct-17 : Rs. 4753.10 crores
Company/Issuer % to NAV
Paper 0.33% Tamil Nadu Newsprint & Papers Ltd. 0.33% Pesticides 2.12% PI Industries Ltd. 1.23% Rallis India Ltd. 0.89% Petroleum Products 2.17% Indian Oil Corporation Ltd. 2.17% Pharmaceuticals 12.57%• IPCA Laboratories Ltd. 3.79%• Lupin Ltd. 3.30% Sun Pharmaceutical Industries Ltd. 2.52% Alembic Pharmaceuticals Ltd. 1.78% Astrazeneca Pharma India Ltd. 1.18% Power 4.04% Tata Power Company Ltd. 2.51% NTPC Ltd. 1.53% Services 4.63%• Thomas Cook (India) Ltd. 4.63% Software 8.10%• Infosys Ltd. 4.78% HCL Technologies Ltd. 1.81% Mphasis Ltd. 1.04% Persistent Systems Ltd. 0.47% Transportation 3.13% Gujarat Pipavav Port Ltd. 1.74% Blue Dart Express Ltd. 1.16% Interglobe Aviation Ltd. 0.23% Short Term Debt and net current assets 4.38% Total Net Assets 100.00%
ICICI Prudential Long Term Equity Fund (Tax Saving)An Open Ended Equity Linked Saving Scheme
Benchmark Std Dev (Annualised) : 13.73%
Entry load : Not Applicable
RiskometerThis Product is suitable for investors who are seeking*:
• Long term wealth creation solution
• An Equity Linked Savings Scheme that aims to generate long term capital appreciation by primarily investing in equity and related securities and provides tax benefit under section 80C of Income Tax Act, 1961.
*Investors should consult their financial advisers if in doubt about whether the product is suitable for them.
Annual Portfolio Turnover Ratio : Equity - 1.72 times, Others (Debt and Derivatives) - 0.09 times Combined Annual Portfolio Turnover Ratio : 1.81 times
Company/Issuer % to NAV
Dividend History : Refer page no. from 127 to 135
SIP Returns : Refer page no. from 123 to 125
Total Expense Ratio @@ :
IPLTEF(TS) : 2.32% p. a.
IPLTEF(TS) Direct Plan : 1.02% p. a.
Investment Objective : Refer page no. from 136 to 139
**In addition to the fund manager managing this fund, the ADR/GDR exposure is managed by Ms. Priyanka Khandelwal.Goods and Service Tax@@ Total Expense Ratio is weighted average for the month. Ratio excludes on management fees and includes
B-15 clawback reversal, if any.##
Minimum number of installments for monthly frequency will be 6 and for Quarterly frequency will be 4. w.e.f February 01, 2017
Portfolio turnover has been computed as the ratio of the lower value of purchase and sales, to the average net assets in the past one year (since inception for schemes that have not completed a year). The figures are not netted for derivative transactions.Risk-free rate based on the last Overnight MIBOR cut-off of 6.00%
SIP :## Monthly Frequency: Rs. 500/- and in multiple of Rs. 1/-Quarterly Frequency: Rs. 500/- and in multiple of Rs. 1/-
SWP :Not Available
STP :Minimum Amount Rs. 1,000/-STP In : Available
Notes:1. Different plans shall have different expense structure. The performance details provided herein are of ICICI Prudential Long Term Equity Fund (Tax Saving).2. The scheme is currently managed by George Heber Joseph. Mr. George Heber Joseph has been managing this fund since Apr 2015. Total Schemes managed by the Fund Manager . Refer annexure from page no. 99 for performance of other schemes currently managed by George Heber is 9 (8 are jointly managed) Joseph.3. Date of inception:19-Aug-99.4. Past performance may or may not be sustained in future and the same may not necessarily provide the basis for comparison with other investment.5. Load is not considered for computation of returns.6. In case, the start/end date of the concerned period is a nonbusiness date (NBD), the NAV of the previous date is considered for computation of returns. The NAV per unit shown in the table is as on the start date of the said period
Scheme
Nifty 50 Index (Additional Benchmark)
NAV (Rs.) Per Unit (as on October 31,2017 : 342.50)
CAGR (%)
10.00
Nifty 500 Index (Benchmark)
Since inception
CurrentValue of
Investment of Rs. 10000
CAGR (%) Current Value of
Investment of Rs. 10000
1 Year 3 Year 5 Year
CAGR (%) Current Value of
Investment of Rs. 10000
CAGR (%) Current Value of
Investment of Rs. 10000
308.62 259.41 148.14
Particulars
10.88 11097.79 9.70 13203.04 18.24 23120.02 21.41 342500.00
21.95 12214.41 11.03 13691.21 15.51 20575.20 13.16 95117.16
19.47 11964.92 7.48 12418.95 12.95 18391.20 11.85 76842.38
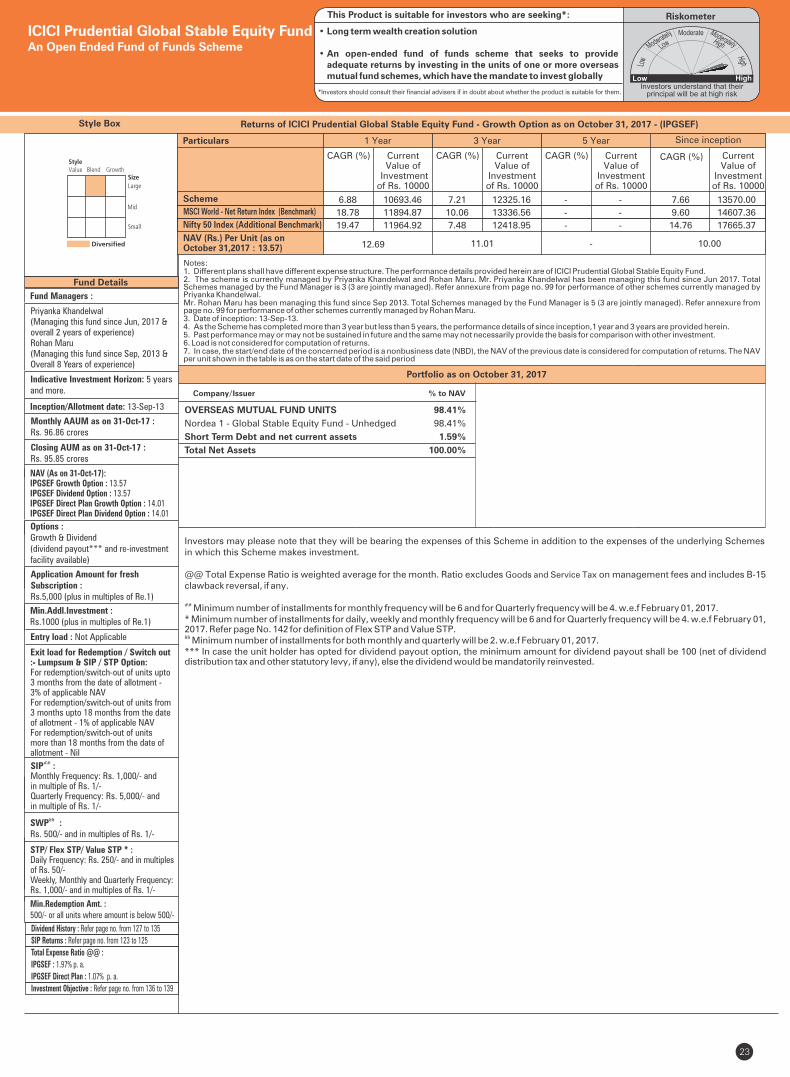
23
Style Box
Fund Details
Returns of ICICI Prudential Global Stable Equity Fund - Growth Option as on October 31, 2017 - (IPGSEF)
Company/Issuer % to NAV
Fund Managers :
Priyanka Khandelwal(Managing this fund since Jun, 2017 & overall 2 years of experience)Rohan Maru(Managing this fund since Sep, 2013 &Overall 8 Years of experience)
Indicative Investment Horizon: 5 yearsand more.
Inception/Allotment date: 13-Sep-13
Options :Growth & Dividend (dividend payout*** and re-investment facility available)
Application Amount for freshSubscription :Rs.5,000 (plus in multiples of Re.1)
Min.Addl.Investment :Rs.1000 (plus in multiples of Re.1)
Exit load for Redemption / Switch out:- Lumpsum & SIP / STP Option:For redemption/switch-out of units upto3 months from the date of allotment -3% of applicable NAVFor redemption/switch-out of units from3 months upto 18 months from the dateof allotment - 1% of applicable NAVFor redemption/switch-out of unitsmore than 18 months from the date ofallotment - Nil
SIP :##
Monthly Frequency: Rs. 1,000/- and in multiple of Rs. 1/-Quarterly Frequency: Rs. 5,000/- and in multiple of Rs. 1/-
&&SWP :Rs. 500/- and in multiples of Rs. 1/-
STP/ Flex STP/ Value STP * :Daily Frequency: Rs. 250/- and in multiples of Rs. 50/-Weekly, Monthly and Quarterly Frequency: Rs. 1,000/- and in multiples of Rs. 1/-
Min.Redemption Amt. : 500/- or all units where amount is below 500/-
Investors may please note that they will be bearing the expenses of this Scheme in addition to the expenses of the underlying Schemes in which this Scheme makes investment.
@@ Total Expense Ratio is weighted average for the month. Ratio excludes Goods and Service Tax on management fees and includes B-15 clawback reversal, if any.
## Minimum number of installments for monthly frequency will be 6 and for Quarterly frequency will be 4. w.e.f February 01, 2017.* Minimum number of installments for daily, weekly and monthly frequency will be 6 and for Quarterly frequency will be 4. w.e.f February 01, 2017. Refer page No. 142 for definition of Flex STP and Value STP.&& Minimum number of installments for both monthly and quarterly will be 2. w.e.f February 01, 2017.*** In case the unit holder has opted for dividend payout option, the minimum amount for dividend payout shall be 100 (net of dividend distribution tax and other statutory levy, if any), else the dividend would be mandatorily reinvested.
Portfolio as on October 31, 2017
ICICI Prudential Global Stable Equity FundAn Open Ended Fund of Funds Scheme
Entry load : Not Applicable
RiskometerThis Product is suitable for investors who are seeking*:
• Long term wealth creation solution
• An open-ended fund of funds scheme that seeks to provide adequate returns by investing in the units of one or more overseas mutual fund schemes, which have the mandate to invest globally
*Investors should consult their financial advisers if in doubt about whether the product is suitable for them.
NAV (As on 31-Oct-17):IPGSEF Growth Option : 13.57IPGSEF Dividend Option : 13.57IPGSEF Direct Plan Growth Option : 14.01IPGSEF Direct Plan Dividend Option : 14.01
OVERSEAS MUTUAL FUND UNITS 98.41%
Nordea 1 - Global Stable Equity Fund - Unhedged 98.41%
Short Term Debt and net current assets 1.59%
Total Net Assets 100.00%
Monthly AAUM as on 31-Oct-17 :Rs. 96.86 crores
Closing AUM as on 31-Oct-17 :Rs. 95.85 crores
Dividend History : Refer page no. from 127 to 135
SIP Returns : Refer page no. from 123 to 125
Total Expense Ratio @@ :
IPGSEF : 1.97% p. a.
IPGSEF Direct Plan : 1.07% p. a.
Investment Objective : Refer page no. from 136 to 139
Notes:1. Different plans shall have different expense structure. The performance details provided herein are of ICICI Prudential Global Stable Equity Fund.2. The scheme is currently managed by Priyanka Khandelwal and Rohan Maru. Mr. Priyanka Khandelwal has been managing this fund since Jun 2017. Total Schemes managed by the Fund Manager Refer annexure from page no. 99 for performance of other schemes currently managed by is 3 (3 are jointly managed).Priyanka Khandelwal.Mr. Rohan Maru has been managing this fund since Sep 2013. Total Schemes managed by the Fund Manager ). Refer annexure from is 5 (3 are jointly managedpage no. 99 for performance of other schemes currently managed by Rohan Maru. 3. Date of inception: 13-Sep-13.4. As the Scheme has completed more than 3 year but less than 5 years, the performance details of since inception,1 year and 3 years are provided herein.5. Past performance may or may not be sustained in future and the same may not necessarily provide the basis for comparison with other investment.6. Load is not considered for computation of returns.7. In case, the start/end date of the concerned period is a nonbusiness date (NBD), the NAV of the previous date is considered for computation of returns. The NAV per unit shown in the table is as on the start date of the said period
Scheme
Nifty 50 Index (Additional Benchmark)
NAV (Rs.) Per Unit (as on October 31,2017 : 13.57)
CAGR (%)
10.00
MSCI World - Net Return Index (Benchmark)
Since inception
CurrentValue of
Investment of Rs. 10000
CAGR (%) Current Value of
Investment of Rs. 10000
1 Year 3 Year 5 Year
CAGR (%) Current Value of
Investment of Rs. 10000
CAGR (%) Current Value of
Investment of Rs. 10000
12.69 11.01 -
Particulars
6.88 10693.46 7.21 12325.16 - - 7.66 13570.00
18.78 11894.87 10.06 13336.56 - - 9.60 14607.36
19.47 11964.92 7.48 12418.95 - - 14.76 17665.37
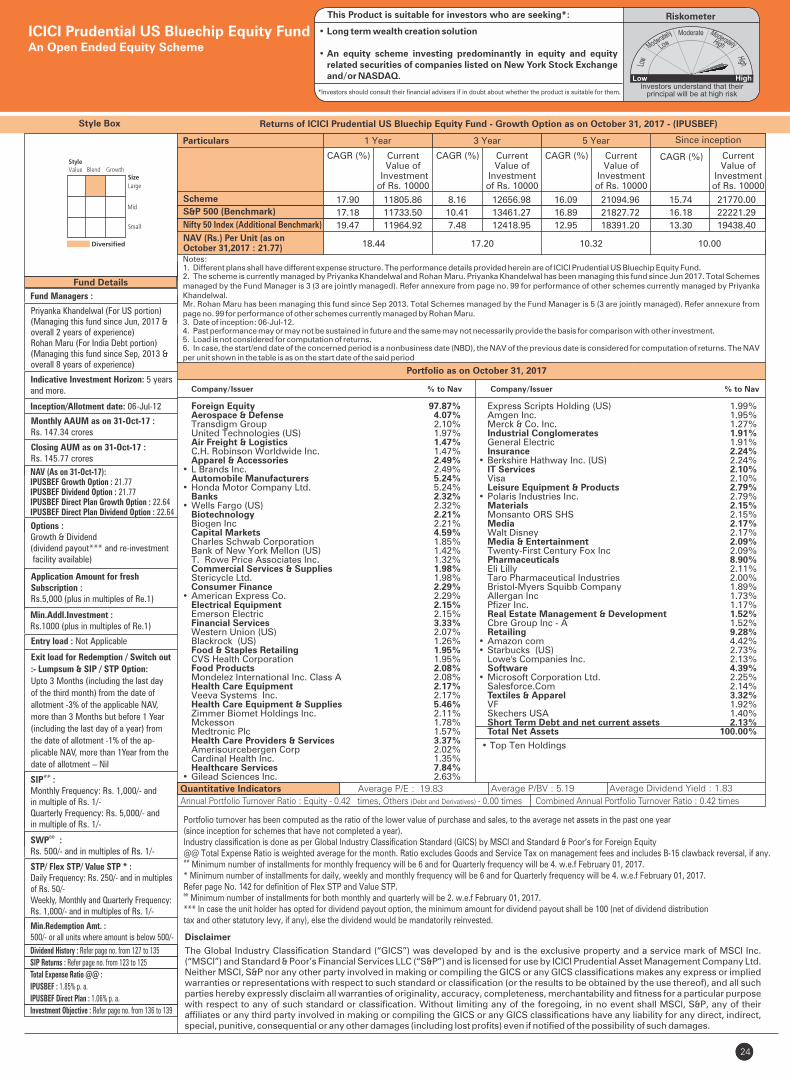
2324
Fund Details
Quantitative Indicators
Portfolio turnover has been computed as the ratio of the lower value of purchase and sales, to the average net assets in the past one year (since inception for schemes that have not completed a year).Industry classification is done as per Global Industry Classification Standard (GICS) by MSCI and Standard & Poor’s for Foreign Equity@@ Total Expense Ratio is weighted average for the month. Ratio excludes Goods and Service Tax on management fees and includes B-15 clawback reversal, if any.## Minimum number of installments for monthly frequency will be 6 and for Quarterly frequency will be 4. w.e.f February 01, 2017.* Minimum number of installments for daily, weekly and monthly frequency will be 6 and for Quarterly frequency will be 4. w.e.f February 01, 2017. Refer page No. 142 for definition of Flex STP and Value STP.&& Minimum number of installments for both monthly and quarterly will be 2. w.e.f February 01, 2017.*** In case the unit holder has opted for dividend payout option, the minimum amount for dividend payout shall be 100 (net of dividend distribution tax and other statutory levy, if any), else the dividend would be mandatorily reinvested.
Style Box
Company/Issuer % to Nav Company/Issuer % to Nav
Fund Managers :
Priyanka Khandelwal (For US portion)(Managing this fund since Jun, 2017 & overall 2 years of experience)Rohan Maru (For India Debt portion)(Managing this fund since Sep, 2013 &overall 8 years of experience)
Indicative Investment Horizon: 5 yearsand more.
Inception/Allotment date: 06-Jul-12
Options :Growth & Dividend (dividend payout*** and re-investment facility available)
Application Amount for freshSubscription :Rs.5,000 (plus in multiples of Re.1)
Min.Addl.Investment :Rs.1000 (plus in multiples of Re.1)
Exit load for Redemption / Switch out
:- Lumpsum & SIP / STP Option:
Upto 3 Months (including the last day
of the third month) from the date of
allotment -3% of the applicable NAV,
more than 3 Months but before 1 Year
(including the last day of a year) from
the date of allotment -1% of the ap-
plicable NAV, more than 1Year from the
date of allotment – Nil
SIP :##
Monthly Frequency: Rs. 1,000/- and in multiple of Rs. 1/-Quarterly Frequency: Rs. 5,000/- and in multiple of Rs. 1/-
&&SWP :Rs. 500/- and in multiples of Rs. 1/-
STP/ Flex STP/ Value STP * :Daily Frequency: Rs. 250/- and in multiples of Rs. 50/-Weekly, Monthly and Quarterly Frequency: Rs. 1,000/- and in multiples of Rs. 1/-
Min.Redemption Amt. : 500/- or all units where amount is below 500/- Disclaimer
The Global Industry Classification Standard (“GICS”) was developed by and is the exclusive property and a service mark of MSCI Inc. (“MSCI”) and Standard & Poor’s Financial Services LLC (“S&P”) and is licensed for use by ICICI Prudential Asset Management Company Ltd. Neither MSCI, S&P nor any other party involved in making or compiling the GICS or any GICS classifications makes any express or implied warranties or representations with respect to such standard or classification (or the results to be obtained by the use thereof), and all such parties hereby expressly disclaim all warranties of originality, accuracy, completeness, merchantability and fitness for a particular purpose with respect to any of such standard or classification. Without limiting any of the foregoing, in no event shall MSCI, S&P, any of their affiliates or any third party involved in making or compiling the GICS or any GICS classifications have any liability for any direct, indirect, special, punitive, consequential or any other damages (including lost profits) even if notified of the possibility of such damages.
• Top Ten Holdings
Portfolio as on October 31, 2017
Returns of ICICI Prudential US Bluechip Equity Fund - Growth Option as on October 31, 2017 - (IPUSBEF)
Average P/E : 19.83 Average P/BV : 5.19 Average Dividend Yield : 1.83
ICICI Prudential US Bluechip Equity FundAn Open Ended Equity Scheme
Entry load : Not Applicable
RiskometerThis Product is suitable for investors who are seeking*:
• Long term wealth creation solution
• An equity scheme investing predominantly in equity and equity related securities of companies listed on New York Stock Exchange and/or NASDAQ.
*Investors should consult their financial advisers if in doubt about whether the product is suitable for them.
NAV (As on 31-Oct-17):IPUSBEF Growth Option : 21.77IPUSBEF Dividend Option : 21.77IPUSBEF Direct Plan Growth Option : 22.64IPUSBEF Direct Plan Dividend Option : 22.64
Foreign Equity 97.87% Aerospace & Defense 4.07% Transdigm Group 2.10% United Technologies (US) 1.97% Air Freight & Logistics 1.47% C.H. Robinson Worldwide Inc. 1.47% Apparel & Accessories 2.49%• L Brands Inc. 2.49% Automobile Manufacturers 5.24%• Honda Motor Company Ltd. 5.24% Banks 2.32%• Wells Fargo (US) 2.32% Biotechnology 2.21% Biogen Inc 2.21% Capital Markets 4.59% Charles Schwab Corporation 1.85% Bank of New York Mellon (US) 1.42% T. Rowe Price Associates Inc. 1.32% Commercial Services & Supplies 1.98% Stericycle Ltd. 1.98% Consumer Finance 2.29%• American Express Co. 2.29% Electrical Equipment 2.15% Emerson Electric 2.15% Financial Services 3.33% Western Union (US) 2.07% Blackrock (US) 1.26% Food & Staples Retailing 1.95% CVS Health Corporation 1.95% Food Products 2.08% Mondelez International Inc. Class A 2.08% Health Care Equipment 2.17% Veeva Systems Inc. 2.17% Health Care Equipment & Supplies 5.46% Zimmer Biomet Holdings Inc. 2.11% Mckesson 1.78% Medtronic Plc 1.57% Health Care Providers & Services 3.37% Amerisourcebergen Corp 2.02% Cardinal Health Inc. 1.35% Healthcare Services 7.84%• Gilead Sciences Inc. 2.63%
Monthly AAUM as on 31-Oct-17 : Rs. 147.34 crores
Closing AUM as on 31-Oct-17 :Rs. 145.77 crores
Express Scripts Holding (US) 1.99% Amgen Inc. 1.95% Merck & Co. Inc. 1.27% Industrial Conglomerates 1.91% General Electric 1.91% Insurance 2.24%• Berkshire Hathway Inc. (US) 2.24% IT Services 2.10% Visa 2.10% Leisure Equipment & Products 2.79%• Polaris Industries Inc. 2.79% Materials 2.15% Monsanto ORS SHS 2.15% Media 2.17% Walt Disney 2.17% Media & Entertainment 2.09% Twenty-First Century Fox Inc 2.09% Pharmaceuticals 8.90% Eli Lilly 2.11% Taro Pharmaceutical Industries 2.00% Bristol-Myers Squibb Company 1.89% Allergan Inc 1.73% Pfizer Inc. 1.17% Real Estate Management & Development 1.52% Cbre Group Inc - A 1.52% Retailing 9.28%• Amazon com 4.42%• Starbucks (US) 2.73% Lowe's Companies Inc. 2.13% Software 4.39%• Microsoft Corporation Ltd. 2.25% Salesforce.Com 2.14% Textiles & Apparel 3.32% VF 1.92% Skechers USA 1.40% Short Term Debt and net current assets 2.13% Total Net Assets 100.00%
Annual Portfolio Turnover Ratio : Equity - 0.42 times, Others (Debt and Derivatives) - 0.00 times Combined Annual Portfolio Turnover Ratio : 0.42 times
Dividend History : Refer page no. from 127 to 135
SIP Returns : Refer page no. from 123 to 125
Total Expense Ratio @@ :
IPUSBEF : 1.85% p. a.
IPUSBEF Direct Plan : 1.06% p. a.
Investment Objective : Refer page no. from 136 to 139
Notes:1. Different plans shall have different expense structure. The performance details provided herein are of ICICI Prudential US Bluechip Equity Fund.2. The scheme is currently managed by Priyanka Khandelwal and Rohan Maru. Priyanka Khandelwal has been managing this fund since Jun 2017. Total Schemes managed by the Fund Manager Refer annexure from page no. 99 for performance of other schemes currently managed by Priyanka is 3 (3 are jointly managed).Khandelwal.Mr. Rohan Maru has been managing this fund since Sep 2013. Total Schemes managed by the Fund Manager ). Refer annexure from is 5 (3 are jointly managedpage no. 99 for performance of other schemes currently managed by Rohan Maru. 3. Date of inception: 06-Jul-12.4. Past performance may or may not be sustained in future and the same may not necessarily provide the basis for comparison with other investment.5. Load is not considered for computation of returns.6. In case, the start/end date of the concerned period is a nonbusiness date (NBD), the NAV of the previous date is considered for computation of returns. The NAV per unit shown in the table is as on the start date of the said period
Scheme
Nifty 50 Index (Additional Benchmark)
NAV (Rs.) Per Unit (as on October 31,2017 : 21.77)
CAGR (%)
10.00
S&P 500 (Benchmark)
Since inception
CurrentValue of
Investment of Rs. 10000
CAGR (%) Current Value of
Investment of Rs. 10000
1 Year 3 Year 5 Year
CAGR (%) Current Value of
Investment of Rs. 10000
CAGR (%) Current Value of
Investment of Rs. 10000
18.44 17.20 10.32
Particulars
17.90 11805.86 8.16 12656.98 16.09 21094.96 15.74 21770.00
17.18 11733.50 10.41 13461.27 16.89 21827.72 16.18 22221.29
19.47 11964.92 7.48 12418.95 12.95 18391.20 13.30 19438.40
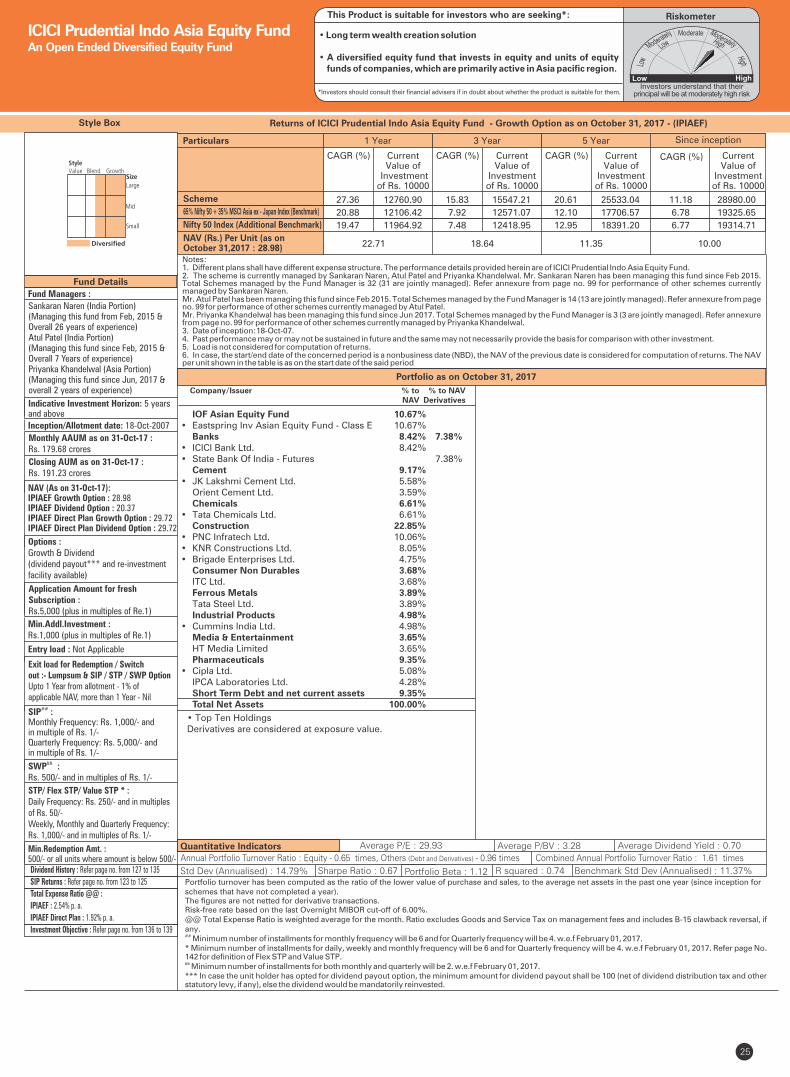
25
Fund Details
Quantitative Indicators
Style Box
Fund Managers :
Sankaran Naren (India Portion)(Managing this fund from Feb, 2015 &Overall 26 years of experience)Atul Patel (India Portion)(Managing this fund since Feb, 2015 &Overall 7 Years of experience)Priyanka Khandelwal (Asia Portion)(Managing this fund since Jun, 2017 & overall 2 years of experience)
Indicative Investment Horizon: 5 yearsand above
Inception/Allotment date: 18-Oct-2007
Monthly AAUM as on 31-Oct-17 :Rs. 179.68 crores
Closing AUM as on 31-Oct-17 : Rs. 191.23 crores
NAV (As on 31-Oct-17):IPIAEF Growth Option : 28.98IPIAEF Dividend Option : 20.37IPIAEF Direct Plan Growth Option : 29.72IPIAEF Direct Plan Dividend Option : 29.72
Options :Growth & Dividend(dividend payout*** and re-investment facility available)
Application Amount for freshSubscription :Rs.5,000 (plus in multiples of Re.1)
Min.Addl.Investment :Rs.1,000 (plus in multiples of Re.1)
Entry load : Not Applicable
Exit load for Redemption / Switchout :- Lumpsum & SIP / STP / SWP OptionUpto 1 Year from allotment - 1% ofapplicable NAV, more than 1 Year - Nil
SIP :##
Monthly Frequency: Rs. 1,000/- and in multiple of Rs. 1/-Quarterly Frequency: Rs. 5,000/- and in multiple of Rs. 1/-
&&SWP :Rs. 500/- and in multiples of Rs. 1/-
STP/ Flex STP/ Value STP * :Daily Frequency: Rs. 250/- and in multiples of Rs. 50/-Weekly, Monthly and Quarterly Frequency: Rs. 1,000/- and in multiples of Rs. 1/-
Min.Redemption Amt. :500/- or all units where amount is below 500/-
Portfolio turnover has been computed as the ratio of the lower value of purchase and sales, to the average net assets in the past one year (since inception for schemes that have not completed a year). The figures are not netted for derivative transactions.Risk-free rate based on the last Overnight MIBOR cut-off of 6.00%.@@ Total Expense Ratio is weighted average for the month. Ratio excludes Goods and Service Tax on management fees and includes B-15 clawback reversal, if any.## Minimum number of installments for monthly frequency will be 6 and for Quarterly frequency will be 4. w.e.f February 01, 2017.* Minimum number of installments for daily, weekly and monthly frequency will be 6 and for Quarterly frequency will be 4. w.e.f February 01, 2017. Refer page No. 142 for definition of Flex STP and Value STP.&&
Minimum number of installments for both monthly and quarterly will be 2. w.e.f February 01, 2017.*** In case the unit holder has opted for dividend payout option, the minimum amount for dividend payout shall be 100 (net of dividend distribution tax and other statutory levy, if any), else the dividend would be mandatorily reinvested.
Std Dev (Annualised) : 14.79% Sharpe Ratio : 0.67
Average P/E : 29.93 Average P/BV : 3.28 Average Dividend Yield : 0.70
Portfolio Beta : 1.12 R squared : 0.74
Portfolio as on October 31, 2017
Returns of ICICI Prudential Indo Asia Equity Fund - Growth Option as on October 31, 2017 - (IPIAEF)
• Top Ten HoldingsDerivatives are considered at exposure value.
ICICI Prudential Indo Asia Equity FundAn Open Ended Diversified Equity Fund
Benchmark Std Dev (Annualised) : 11.37%
RiskometerThis Product is suitable for investors who are seeking*:
• Long term wealth creation solution
• A diversified equity fund that invests in equity and units of equity funds of companies, which are primarily active in Asia pacific region.
*Investors should consult their financial advisers if in doubt about whether the product is suitable for them.
Annual Portfolio Turnover Ratio : Equity - 0.65 times, Others (Debt and Derivatives) - 0.96 times Combined Annual Portfolio Turnover Ratio : 1.61 times
Dividend History : Refer page no. from 127 to 135
SIP Returns : Refer page no. from 123 to 125
Total Expense Ratio @@ :
IPIAEF : 2.54% p. a.
IPIAEF Direct Plan : 1.92% p. a.
Investment Objective : Refer page no. from 136 to 139
IOF Asian Equity Fund 10.67% • Eastspring Inv Asian Equity Fund - Class E 10.67% Banks 8.42% 7.38%• ICICI Bank Ltd. 8.42% • State Bank Of India - Futures 7.38% Cement 9.17% • JK Lakshmi Cement Ltd. 5.58% Orient Cement Ltd. 3.59% Chemicals 6.61% • Tata Chemicals Ltd. 6.61% Construction 22.85% • PNC Infratech Ltd. 10.06% • KNR Constructions Ltd. 8.05% • Brigade Enterprises Ltd. 4.75% Consumer Non Durables 3.68% ITC Ltd. 3.68% Ferrous Metals 3.89% Tata Steel Ltd. 3.89% Industrial Products 4.98% • Cummins India Ltd. 4.98% Media & Entertainment 3.65% HT Media Limited 3.65% Pharmaceuticals 9.35% • Cipla Ltd. 5.08% IPCA Laboratories Ltd. 4.28% Short Term Debt and net current assets 9.35% Total Net Assets 100.00%
Company/Issuer % to % to NAV NAV Derivatives
Notes:1. Different plans shall have different expense structure. The performance details provided herein are of ICICI Prudential Indo Asia Equity Fund.2. The scheme is currently managed by Sankaran Naren, Atul Patel and Priyanka Khandelwal. Mr. Sankaran Naren has been managing this fund since Feb 2015. Total Schemes managed by the Fund Manager ). Refer annexure from page no. 99 for performance of other schemes currently is 32 (31 are jointly managedmanaged by Sankaran Naren. Mr. Atul Patel has been managing this fund since Feb 2015. Total Schemes managed by the Fund Manager ). Refer annexure from page is 14 (13 are jointly managedno. 99 for performance of other schemes currently managed by Atul Patel. Mr. Priyanka Khandelwal has been managing this fund since Jun 2017. Total Schemes managed by the Fund Manager (3 are jointly managed) Refer annexure is 3 .from page no. 99 for performance of other schemes currently managed by Priyanka Khandelwal.3. Date of inception:18-Oct-07.4. Past performance may or may not be sustained in future and the same may not necessarily provide the basis for comparison with other investment.5. Load is not considered for computation of returns.6. In case, the start/end date of the concerned period is a nonbusiness date (NBD), the NAV of the previous date is considered for computation of returns. The NAV per unit shown in the table is as on the start date of the said period
Scheme
Nifty 50 Index (Additional Benchmark)
NAV (Rs.) Per Unit (as on October 31,2017 : 28.98)
CAGR (%)
10.00
65% Nifty 50 + 35% MSCI Asia ex - Japan Index (Benchmark)
Since inception
CurrentValue of
Investment of Rs. 10000
CAGR (%) Current Value of
Investment of Rs. 10000
1 Year 3 Year 5 Year
CAGR (%) Current Value of
Investment of Rs. 10000
CAGR (%) Current Value of
Investment of Rs. 10000
22.71 18.64 11.35
Particulars
27.36 12760.90 15.83 15547.21 20.61 25533.04 11.18 28980.00
20.88 12106.42 7.92 12571.07 12.10 17706.57 6.78 19325.65
19.47 11964.92 7.48 12418.95 12.95 18391.20 6.77 19314.71
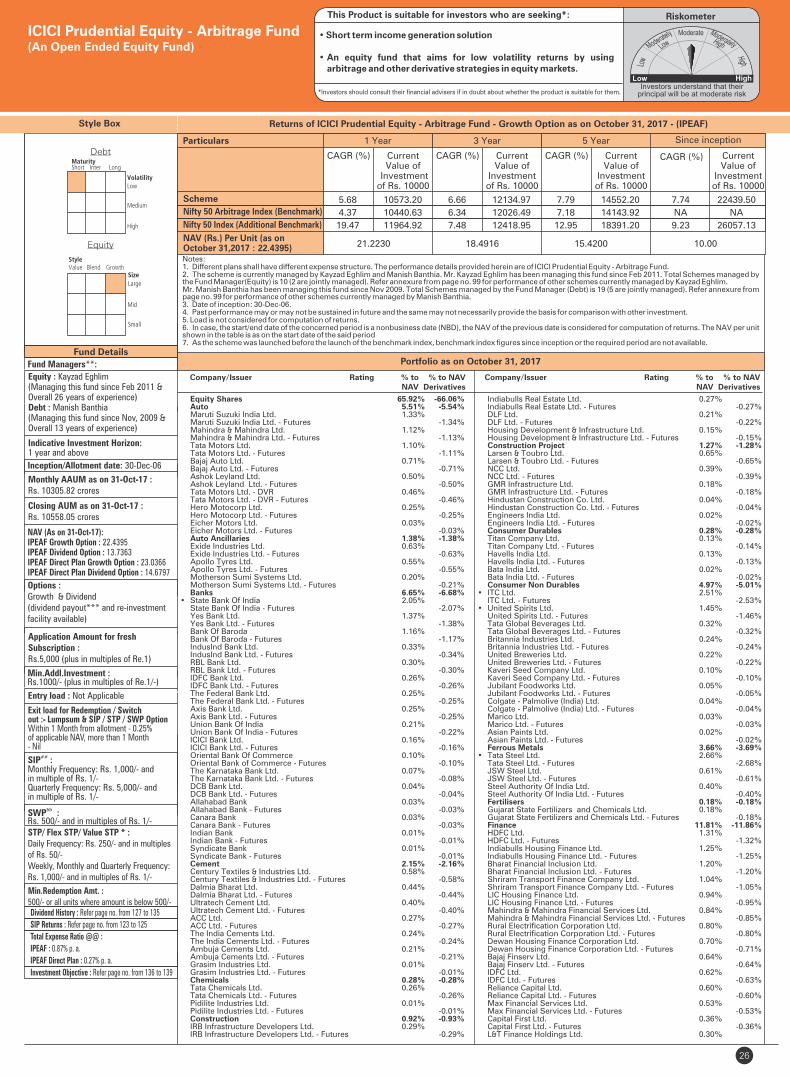
Equity Shares 65.92% -66.06% Auto 5.51% -5.54% Maruti Suzuki India Ltd. 1.33% Maruti Suzuki India Ltd. - Futures -1.34% Mahindra & Mahindra Ltd. 1.12% Mahindra & Mahindra Ltd. - Futures -1.13% Tata Motors Ltd. 1.10% Tata Motors Ltd. - Futures -1.11% Bajaj Auto Ltd. 0.71% Bajaj Auto Ltd. - Futures -0.71% Ashok Leyland Ltd. 0.50% Ashok Leyland Ltd. - Futures -0.50% Tata Motors Ltd. - DVR 0.46% Tata Motors Ltd. - DVR - Futures -0.46% Hero Motocorp Ltd. 0.25% Hero Motocorp Ltd. - Futures -0.25% Eicher Motors Ltd. 0.03% Eicher Motors Ltd. - Futures -0.03% Auto Ancillaries 1.38% -1.38% Exide Industries Ltd. 0.63% Exide Industries Ltd. - Futures -0.63% Apollo Tyres Ltd. 0.55% Apollo Tyres Ltd. - Futures -0.55% Motherson Sumi Systems Ltd. 0.20% Motherson Sumi Systems Ltd. - Futures -0.21% Banks 6.65% -6.68%• State Bank Of India 2.05% State Bank Of India - Futures -2.07% Yes Bank Ltd. 1.37% Yes Bank Ltd. - Futures -1.38% Bank Of Baroda 1.16% Bank Of Baroda - Futures -1.17% IndusInd Bank Ltd. 0.33% IndusInd Bank Ltd. - Futures -0.34% RBL Bank Ltd. 0.30% RBL Bank Ltd. - Futures -0.30% IDFC Bank Ltd. 0.26% IDFC Bank Ltd. - Futures -0.26% The Federal Bank Ltd. 0.25% The Federal Bank Ltd. - Futures -0.25% Axis Bank Ltd. 0.25% Axis Bank Ltd. - Futures -0.25% Union Bank Of India 0.21% Union Bank Of India - Futures -0.22% ICICI Bank Ltd. 0.16% ICICI Bank Ltd. - Futures -0.16% Oriental Bank Of Commerce 0.10% Oriental Bank of Commerce - Futures -0.10% The Karnataka Bank Ltd. 0.07% The Karnataka Bank Ltd. - Futures -0.08% DCB Bank Ltd. 0.04% DCB Bank Ltd. - Futures -0.04% Allahabad Bank 0.03% Allahabad Bank - Futures -0.03% Canara Bank 0.03% Canara Bank - Futures -0.03% Indian Bank 0.01% Indian Bank - Futures -0.01% Syndicate Bank 0.01% Syndicate Bank - Futures -0.01% Cement 2.15% -2.16% Century Textiles & Industries Ltd. 0.58% Century Textiles & Industries Ltd. - Futures -0.58% Dalmia Bharat Ltd. 0.44% Dalmia Bharat Ltd. - Futures -0.44% Ultratech Cement Ltd. 0.40% Ultratech Cement Ltd. - Futures -0.40% ACC Ltd. 0.27% ACC Ltd. - Futures -0.27% The India Cements Ltd. 0.24% The India Cements Ltd. - Futures -0.24% Ambuja Cements Ltd. 0.21% Ambuja Cements Ltd. - Futures -0.21% Grasim Industries Ltd. 0.01% Grasim Industries Ltd. - Futures -0.01% Chemicals 0.28% -0.28% Tata Chemicals Ltd. 0.26% Tata Chemicals Ltd. - Futures -0.26% Pidilite Industries Ltd. 0.01% Pidilite Industries Ltd. - Futures -0.01% Construction 0.92% -0.93% IRB Infrastructure Developers Ltd. 0.29% IRB Infrastructure Developers Ltd. - Futures -0.29%
26
Fund Details
Style Box
Equity
Debt
Fund Managers**:
Equity : Kayzad Eghlim (Managing this fund since Feb 2011 & Overall 26 years of experience)Debt : Manish Banthia (Managing this fund since Nov, 2009 & Overall 13 years of experience)
Inception/Allotment date: 30-Dec-06
Monthly AAUM as on 31-Oct-17 : Rs. 10305.82 crores
Closing AUM as on 31-Oct-17 : Rs. 10558.05 crores
NAV (As on 31-Oct-17):IPEAF Growth Option : 22.4395IPEAF Dividend Option : 13.7363IPEAF Direct Plan Growth Option : 23.0366IPEAF Direct Plan Dividend Option : 14.6797
Options :Growth & Dividend(dividend payout*** and re-investment facility available)
Application Amount for freshSubscription :Rs.5,000 (plus in multiples of Re.1)
Min.Addl.Investment :Rs.1000/- (plus in multiples of Re.1/-)
Exit load for Redemption / Switchout :- Lumpsum & SIP / STP / SWP OptionWithin 1 Month from allotment - 0.25%of applicable NAV, more than 1 Month- Nil
SIP :##
Monthly Frequency: Rs. 1,000/- and in multiple of Rs. 1/-Quarterly Frequency: Rs. 5,000/- and in multiple of Rs. 1/-
&&SWP :Rs. 500/- and in multiples of Rs. 1/-STP/ Flex STP/ Value STP * :Daily Frequency: Rs. 250/- and in multiples of Rs. 50/-Weekly, Monthly and Quarterly Frequency: Rs. 1,000/- and in multiples of Rs. 1/-
Portfolio as on October 31, 2017
Returns of ICICI Prudential Equity - Arbitrage Fund - Growth Option as on October 31, 2017 - (IPEAF)
Company/Issuer Rating % to % to NAV NAV Derivatives
Indiabulls Real Estate Ltd. 0.27% Indiabulls Real Estate Ltd. - Futures -0.27% DLF Ltd. 0.21% DLF Ltd. - Futures -0.22% Housing Development & Infrastructure Ltd. 0.15% Housing Development & Infrastructure Ltd. - Futures -0.15% Construction Project 1.27% -1.28% Larsen & Toubro Ltd. 0.65% Larsen & Toubro Ltd. - Futures -0.65% NCC Ltd. 0.39% NCC Ltd. - Futures -0.39% GMR Infrastructure Ltd. 0.18% GMR Infrastructure Ltd. - Futures -0.18% Hindustan Construction Co. Ltd. 0.04% Hindustan Construction Co. Ltd. - Futures -0.04% Engineers India Ltd. 0.02% Engineers India Ltd. - Futures -0.02% Consumer Durables 0.28% -0.28% Titan Company Ltd. 0.13% Titan Company Ltd. - Futures -0.14% Havells India Ltd. 0.13% Havells India Ltd. - Futures -0.13% Bata India Ltd. 0.02% Bata India Ltd. - Futures -0.02% Consumer Non Durables 4.97% -5.01%• ITC Ltd. 2.51% ITC Ltd. - Futures -2.53%• United Spirits Ltd. 1.45% United Spirits Ltd. - Futures -1.46% Tata Global Beverages Ltd. 0.32% Tata Global Beverages Ltd. - Futures -0.32% Britannia Industries Ltd. 0.24% Britannia Industries Ltd. - Futures -0.24% United Breweries Ltd. 0.22% United Breweries Ltd. - Futures -0.22% Kaveri Seed Company Ltd. 0.10% Kaveri Seed Company Ltd. - Futures -0.10% Jubilant Foodworks Ltd. 0.05% Jubilant Foodworks Ltd. - Futures -0.05% Colgate - Palmolive (India) Ltd. 0.04% Colgate - Palmolive (India) Ltd. - Futures -0.04% Marico Ltd. 0.03% Marico Ltd. - Futures -0.03% Asian Paints Ltd. 0.02% Asian Paints Ltd. - Futures -0.02% Ferrous Metals 3.66% -3.69%• Tata Steel Ltd. 2.66% Tata Steel Ltd. - Futures -2.68% JSW Steel Ltd. 0.61% JSW Steel Ltd. - Futures -0.61% Steel Authority Of India Ltd. 0.40% Steel Authority Of India Ltd. - Futures -0.40% Fertilisers 0.18% -0.18% Gujarat State Fertilizers and Chemicals Ltd. 0.18% Gujarat State Fertilizers and Chemicals Ltd. - Futures -0.18% Finance 11.81% -11.86% HDFC Ltd. 1.31% HDFC Ltd. - Futures -1.32% Indiabulls Housing Finance Ltd. 1.25% Indiabulls Housing Finance Ltd. - Futures -1.25% Bharat Financial Inclusion Ltd. 1.20% Bharat Financial Inclusion Ltd. - Futures -1.20% Shriram Transport Finance Company Ltd. 1.04% Shriram Transport Finance Company Ltd. - Futures -1.05% LIC Housing Finance Ltd. 0.94% LIC Housing Finance Ltd. - Futures -0.95% Mahindra & Mahindra Financial Services Ltd. 0.84% Mahindra & Mahindra Financial Services Ltd. - Futures -0.85% Rural Electrification Corporation Ltd. 0.80% Rural Electrification Corporation Ltd. - Futures -0.80% Dewan Housing Finance Corporation Ltd. 0.70% Dewan Housing Finance Corporation Ltd. - Futures -0.71% Bajaj Finserv Ltd. 0.64% Bajaj Finserv Ltd. - Futures -0.64% IDFC Ltd. 0.62% IDFC Ltd. - Futures -0.63% Reliance Capital Ltd. 0.60% Reliance Capital Ltd. - Futures -0.60% Max Financial Services Ltd. 0.53% Max Financial Services Ltd. - Futures -0.53% Capital First Ltd. 0.36% Capital First Ltd. - Futures -0.36% L&T Finance Holdings Ltd. 0.30%
Company/Issuer Rating % to % to NAV NAV Derivatives
ICICI Prudential Equity - Arbitrage Fund(An Open Ended Equity Fund)
Entry load : Not Applicable
RiskometerThis Product is suitable for investors who are seeking*:
• Short term income generation solution
• An equity fund that aims for low volatility returns by using arbitrage and other derivative strategies in equity markets.
*Investors should consult their financial advisers if in doubt about whether the product is suitable for them.
Indicative Investment Horizon: 1 year and above
Dividend History : Refer page no. from 127 to 135
SIP Returns : Refer page no. from 123 to 125
Total Expense Ratio @@ :
IPEAF : 0.87% p. a.
IPEAF Direct Plan : 0.27% p. a.
Investment Objective : Refer page no. from 136 to 139
Min.Redemption Amt. :500/- or all units where amount is below 500/-
Notes:1. Different plans shall have different expense structure. The performance details provided herein are of ICICI Prudential Equity - Arbitrage Fund.2. The scheme is currently managed by Kayzad Eghlim and Manish Banthia. Mr. Kayzad Eghlim has been managing this fund since Feb 2011. Total Schemes managed by the Fund Manager Refer annexure from page no. 99 for performance of other schemes currently managed by Kayzad Eghlim.(Equity) is 10 (2 are jointly managed).Mr. has been managing this fund since . Total Schemes managed by the Fund Manager . Refer annexure from Manish Banthia Nov 2009 (Debt) is 19 (5 are jointly managed)page no. 99 for performance of other schemes currently managed by . Manish Banthia3. Date of inception: 30-Dec-06.4. Past performance may or may not be sustained in future and the same may not necessarily provide the basis for comparison with other investment.5. Load is not considered for computation of returns.6. In case, the start/end date of the concerned period is a nonbusiness date (NBD), the NAV of the previous date is considered for computation of returns. The NAV per unit shown in the table is as on the start date of the said period7. As the scheme was launched before the launch of the benchmark index, benchmark index figures since inception or the required period are not available.
Scheme
Nifty 50 Index (Additional Benchmark)
NAV (Rs.) Per Unit (as on October 31,2017 : 22.4395)
CAGR (%)
10.00
Nifty 50 Arbitrage Index (Benchmark)
Since inception
CurrentValue of
Investment of Rs. 10000
CAGR (%) Current Value of
Investment of Rs. 10000
1 Year 3 Year 5 Year
CAGR (%) Current Value of
Investment of Rs. 10000
CAGR (%) Current Value of
Investment of Rs. 10000
21.2230 18.4916 15.4200
Particulars
5.68 10573.20 6.66 12134.97 7.79 14552.20 7.74 22439.50
4.37 10440.63 6.34 12026.49 7.18 14143.92 NA NA
19.47 11964.92 7.48 12418.95 12.95 18391.20 9.23 26057.13
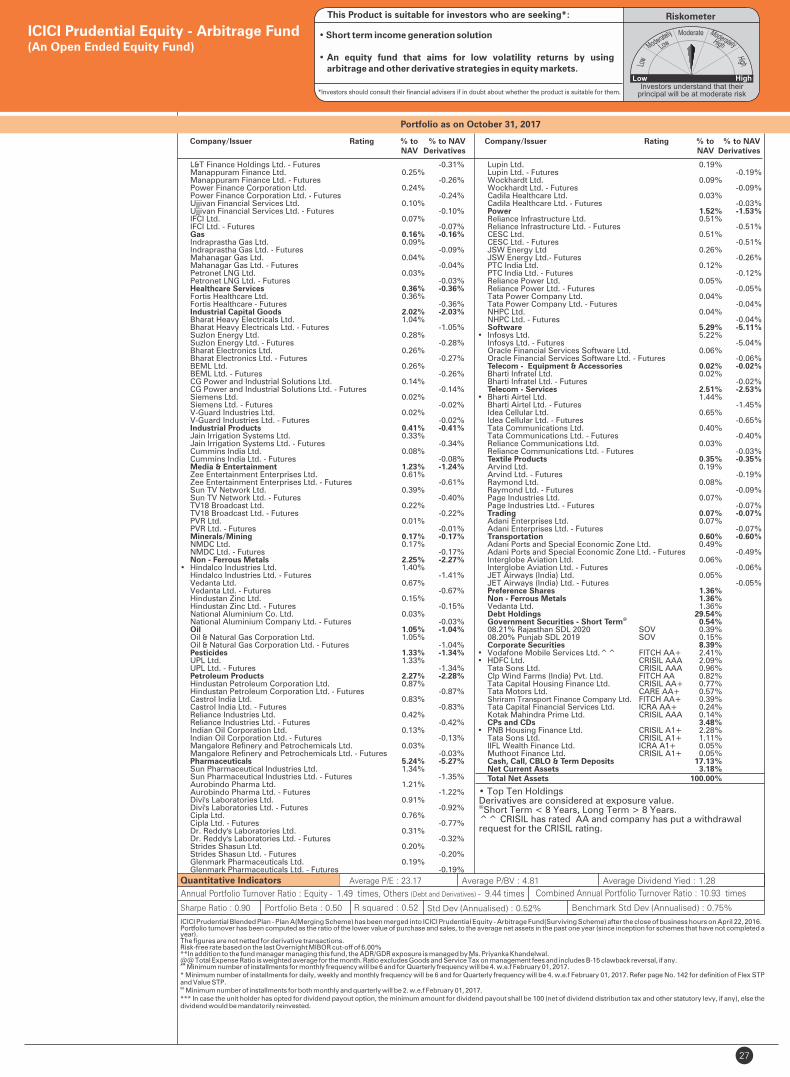
L&T Finance Holdings Ltd. - Futures -0.31% Manappuram Finance Ltd. 0.25% Manappuram Finance Ltd. - Futures -0.26% Power Finance Corporation Ltd. 0.24% Power Finance Corporation Ltd. - Futures -0.24% Ujjivan Financial Services Ltd. 0.10% Ujjivan Financial Services Ltd. - Futures -0.10% IFCI Ltd. 0.07% IFCI Ltd. - Futures -0.07% Gas 0.16% -0.16% Indraprastha Gas Ltd. 0.09% Indraprastha Gas Ltd. - Futures -0.09% Mahanagar Gas Ltd. 0.04% Mahanagar Gas Ltd. - Futures -0.04% Petronet LNG Ltd. 0.03% Petronet LNG Ltd. - Futures -0.03% Healthcare Services 0.36% -0.36% Fortis Healthcare Ltd. 0.36% Fortis Healthcare - Futures -0.36% Industrial Capital Goods 2.02% -2.03% Bharat Heavy Electricals Ltd. 1.04% Bharat Heavy Electricals Ltd. - Futures -1.05% Suzlon Energy Ltd. 0.28% Suzlon Energy Ltd. - Futures -0.28% Bharat Electronics Ltd. 0.26% Bharat Electronics Ltd. - Futures -0.27% BEML Ltd. 0.26% BEML Ltd. - Futures -0.26% CG Power and Industrial Solutions Ltd. 0.14% CG Power and Industrial Solutions Ltd. - Futures -0.14% Siemens Ltd. 0.02% Siemens Ltd. - Futures -0.02% V-Guard Industries Ltd. 0.02% V-Guard Industries Ltd. - Futures -0.02% Industrial Products 0.41% -0.41% Jain Irrigation Systems Ltd. 0.33% Jain Irrigation Systems Ltd. - Futures -0.34% Cummins India Ltd. 0.08% Cummins India Ltd. - Futures -0.08% Media & Entertainment 1.23% -1.24% Zee Entertainment Enterprises Ltd. 0.61% Zee Entertainment Enterprises Ltd. - Futures -0.61% Sun TV Network Ltd. 0.39% Sun TV Network Ltd. - Futures -0.40% TV18 Broadcast Ltd. 0.22% TV18 Broadcast Ltd. - Futures -0.22% PVR Ltd. 0.01% PVR Ltd. - Futures -0.01% Minerals/Mining 0.17% -0.17% NMDC Ltd. 0.17% NMDC Ltd. - Futures -0.17% Non - Ferrous Metals 2.25% -2.27%• Hindalco Industries Ltd. 1.40% Hindalco Industries Ltd. - Futures -1.41% Vedanta Ltd. 0.67% Vedanta Ltd. - Futures -0.67% Hindustan Zinc Ltd. 0.15% Hindustan Zinc Ltd. - Futures -0.15% National Aluminium Co. Ltd. 0.03% National Aluminium Company Ltd. - Futures -0.03% Oil 1.05% -1.04% Oil & Natural Gas Corporation Ltd. 1.05% Oil & Natural Gas Corporation Ltd. - Futures -1.04% Pesticides 1.33% -1.34% UPL Ltd. 1.33% UPL Ltd. - Futures -1.34% Petroleum Products 2.27% -2.28% Hindustan Petroleum Corporation Ltd. 0.87% Hindustan Petroleum Corporation Ltd. - Futures -0.87% Castrol India Ltd. 0.83% Castrol India Ltd. - Futures -0.83% Reliance Industries Ltd. 0.42% Reliance Industries Ltd. - Futures -0.42% Indian Oil Corporation Ltd. 0.13% Indian Oil Corporation Ltd. - Futures -0.13% Mangalore Refinery and Petrochemicals Ltd. 0.03% Mangalore Refinery and Petrochemicals Ltd. - Futures -0.03% Pharmaceuticals 5.24% -5.27% Sun Pharmaceutical Industries Ltd. 1.34% Sun Pharmaceutical Industries Ltd. - Futures -1.35% Aurobindo Pharma Ltd. 1.21% Aurobindo Pharma Ltd. - Futures -1.22% Divi's Laboratories Ltd. 0.91% Divi's Laboratories Ltd. - Futures -0.92% Cipla Ltd. 0.76% Cipla Ltd. - Futures -0.77% Dr. Reddy's Laboratories Ltd. 0.31% Dr. Reddy's Laboratories Ltd. - Futures -0.32% Strides Shasun Ltd. 0.20% Strides Shasun Ltd. - Futures -0.20% Glenmark Pharmaceuticals Ltd. 0.19% Glenmark Pharmaceuticals Ltd. - Futures -0.19%
27
• Top Ten HoldingsDerivatives are considered at exposure value.@Short Term < 8 Years, Long Term > 8 Years.^^ CRISIL has rated AA and company has put a withdrawalrequest for the CRISIL rating.
Quantitative Indicators
ICICI Prudential Blended Plan - Plan A(Merging Scheme) has been merged into ICICI Prudential Equity - Arbitrage Fund(Surviving Scheme) after the close of business hours on April 22, 2016.Portfolio turnover has been computed as the ratio of the lower value of purchase and sales, to the average net assets in the past one year (since inception for schemes that have not completed a year). The figures are not netted for derivative transactions.Risk-free rate based on the last Overnight MIBOR cut-off of 6.00%**In addition to the fund manager managing this fund, the ADR/GDR exposure is managed by Ms. Priyanka Khandelwal.@@ Total Expense Ratio is weighted average for the month. Ratio excludes Goods and Service Tax on management fees and includes B-15 clawback reversal, if any.## Minimum number of installments for monthly frequency will be 6 and for Quarterly frequency will be 4. w.e.f February 01, 2017.* Minimum number of installments for daily, weekly and monthly frequency will be 6 and for Quarterly frequency will be 4. w.e.f February 01, 2017. Refer page No. 142 for definition of Flex STP and Value STP.&& Minimum number of installments for both monthly and quarterly will be 2. w.e.f February 01, 2017.*** In case the unit holder has opted for dividend payout option, the minimum amount for dividend payout shall be 100 (net of dividend distribution tax and other statutory levy, if any), else the dividend would be mandatorily reinvested.
Sharpe Ratio : 0.90
Average P/E : 23.17 Average P/BV : 4.81 Average Dividend Yied : 1.28
Portfolio Beta : 0.50 Std Dev (Annualised) : 0.52% Benchmark Std Dev (Annualised) : 0.75%
Portfolio as on October 31, 2017
Company/Issuer Rating % to % to NAV NAV Derivatives
Lupin Ltd. 0.19% Lupin Ltd. - Futures -0.19% Wockhardt Ltd. 0.09% Wockhardt Ltd. - Futures -0.09% Cadila Healthcare Ltd. 0.03% Cadila Healthcare Ltd. - Futures -0.03% Power 1.52% -1.53% Reliance Infrastructure Ltd. 0.51% Reliance Infrastructure Ltd. - Futures -0.51% CESC Ltd. 0.51% CESC Ltd. - Futures -0.51% JSW Energy Ltd 0.26% JSW Energy Ltd.- Futures -0.26% PTC India Ltd. 0.12% PTC India Ltd. - Futures -0.12% Reliance Power Ltd. 0.05% Reliance Power Ltd. - Futures -0.05% Tata Power Company Ltd. 0.04% Tata Power Company Ltd. - Futures -0.04% NHPC Ltd. 0.04% NHPC Ltd. - Futures -0.04% Software 5.29% -5.11%• Infosys Ltd. 5.22% Infosys Ltd. - Futures -5.04% Oracle Financial Services Software Ltd. 0.06% Oracle Financial Services Software Ltd. - Futures -0.06% Telecom - Equipment & Accessories 0.02% -0.02% Bharti Infratel Ltd. 0.02% Bharti Infratel Ltd. - Futures -0.02% Telecom - Services 2.51% -2.53%• Bharti Airtel Ltd. 1.44% Bharti Airtel Ltd. - Futures -1.45% Idea Cellular Ltd. 0.65% Idea Cellular Ltd. - Futures -0.65% Tata Communications Ltd. 0.40% Tata Communications Ltd. - Futures -0.40% Reliance Communications Ltd. 0.03% Reliance Communications Ltd. - Futures -0.03% Textile Products 0.35% -0.35% Arvind Ltd. 0.19% Arvind Ltd. - Futures -0.19% Raymond Ltd. 0.08% Raymond Ltd. - Futures -0.09% Page Industries Ltd. 0.07% Page Industries Ltd. - Futures -0.07% Trading 0.07% -0.07% Adani Enterprises Ltd. 0.07% Adani Enterprises Ltd. - Futures -0.07% Transportation 0.60% -0.60% Adani Ports and Special Economic Zone Ltd. 0.49% Adani Ports and Special Economic Zone Ltd. - Futures -0.49% Interglobe Aviation Ltd. 0.06% Interglobe Aviation Ltd. - Futures -0.06% JET Airways (India) Ltd. 0.05% JET Airways (India) Ltd. - Futures -0.05% Preference Shares 1.36% Non - Ferrous Metals 1.36% Vedanta Ltd. 1.36% Debt Holdings 29.54%
@ Government Securities - Short Term 0.54% 08.21% Rajasthan SDL 2020 SOV 0.39% 08.20% Punjab SDL 2019 SOV 0.15% Corporate Securities 8.39% • Vodafone Mobile Services Ltd.^^ FITCH AA+ 2.41% • HDFC Ltd. CRISIL AAA 2.09% Tata Sons Ltd. CRISIL AAA 0.96% Clp Wind Farms (India) Pvt. Ltd. FITCH AA 0.82% Tata Capital Housing Finance Ltd. CRISIL AA+ 0.77% Tata Motors Ltd. CARE AA+ 0.57% Shriram Transport Finance Company Ltd. FITCH AA+ 0.39% Tata Capital Financial Services Ltd. ICRA AA+ 0.24% Kotak Mahindra Prime Ltd. CRISIL AAA 0.14% CPs and CDs 3.48% • PNB Housing Finance Ltd. CRISIL A1+ 2.28% Tata Sons Ltd. CRISIL A1+ 1.11% IIFL Wealth Finance Ltd. ICRA A1+ 0.05% Muthoot Finance Ltd. CRISIL A1+ 0.05% Cash, Call, CBLO & Term Deposits 17.13% Net Current Assets 3.18% Total Net Assets 100.00%
Company/Issuer Rating % to % to NAV NAV Derivatives
ICICI Prudential Equity - Arbitrage Fund(An Open Ended Equity Fund)
R squared : 0.52
RiskometerThis Product is suitable for investors who are seeking*:
• Short term income generation solution
• An equity fund that aims for low volatility returns by using arbitrage and other derivative strategies in equity markets.
*Investors should consult their financial advisers if in doubt about whether the product is suitable for them.
Annual Portfolio Turnover Ratio : Equity - 1.49 times, Others (Debt and Derivatives) - 9.44 times Combined Annual Portfolio Turnover Ratio : 10.93 times
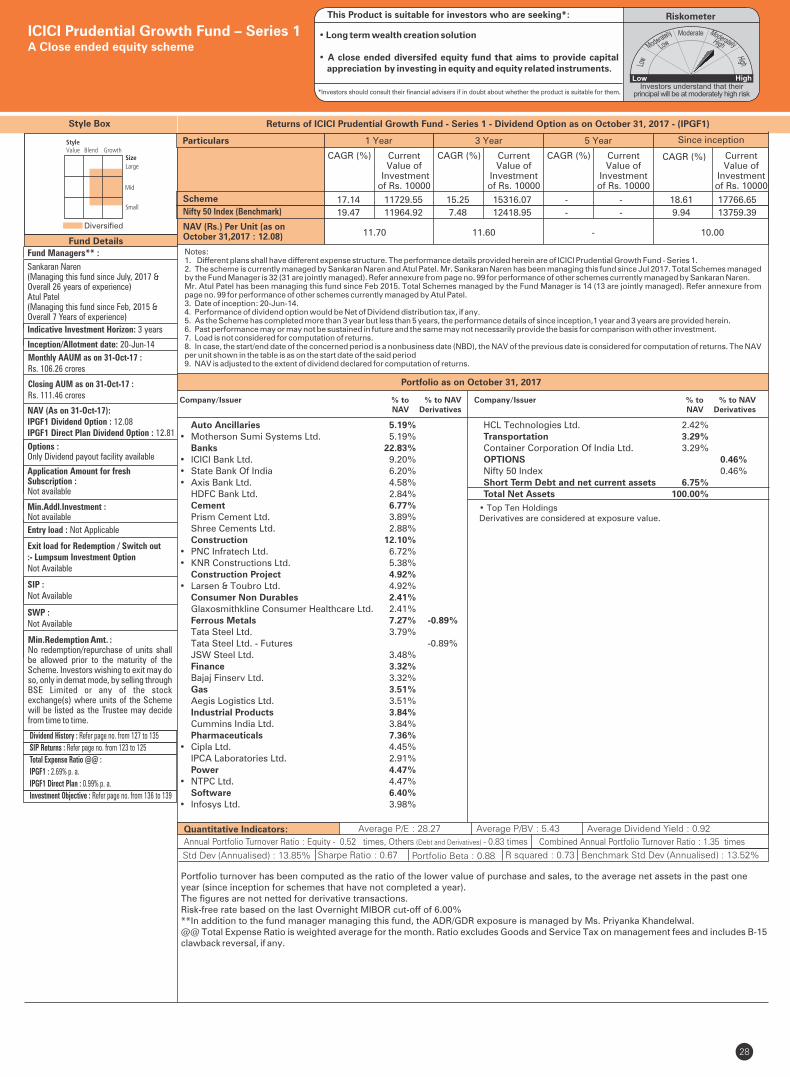
28
Style Box
Portfolio turnover has been computed as the ratio of the lower value of purchase and sales, to the average net assets in the past one year (since inception for schemes that have not completed a year). The figures are not netted for derivative transactions.Risk-free rate based on the last Overnight MIBOR cut-off of 6.00%**In addition to the fund manager managing this fund, the ADR/GDR exposure is managed by Ms. Priyanka Khandelwal.@@ Total Expense Ratio is weighted average for the month. Ratio excludes Goods and Service Tax on management fees and includes B-15 clawback reversal, if any.
Fund Managers** :
Sankaran Naren(Managing this fund since July, 2017 &Overall 26 years of experience)Atul Patel(Managing this fund since Feb, 2015 &Overall 7 Years of experience)
Indicative Investment Horizon: 3 years
Inception/Allotment date: 20-Jun-14
NAV (As on 31-Oct-17):IPGF1 Dividend Option : 12.08IPGF1 Direct Plan Dividend Option : 12.81
Options :Only Dividend payout facility available
Application Amount for freshSubscription :Not available
Min.Addl.Investment :Not available
Exit load for Redemption / Switch out:- Lumpsum Investment OptionNot Available
SIP :Not Available
SWP :Not Available
Min.Redemption Amt. :No redemption/repurchase of units shall be allowed prior to the maturity of the Scheme. Investors wishing to exit may do so, only in demat mode, by selling through BSE Limited or any of the stock exchange(s) where units of the Scheme will be listed as the Trustee may decide from time to time.
Fund Details
• Top Ten HoldingsDerivatives are considered at exposure value.
Diversified
Quantitative Indicators:
Monthly AAUM as on 31-Oct-17 : Rs. 106.26 crores
Closing AUM as on 31-Oct-17 :Rs. 111.46 crores
Average P/E : 28.27 Average P/BV : 5.43 Average Dividend Yield : 0.92
ICICI Prudential Growth Fund – Series 1A Close ended equity scheme
Returns of ICICI Prudential Growth Fund - Series 1 - Dividend Option as on October 31, 2017 - (IPGF1)
Portfolio as on October 31, 2017
Entry load : Not Applicable
RiskometerThis Product is suitable for investors who are seeking*:
• Long term wealth creation solution
• A close ended diversifed equity fund that aims to provide capital appreciation by investing in equity and equity related instruments.
*Investors should consult their financial advisers if in doubt about whether the product is suitable for them.
Annual Portfolio Turnover Ratio : Equity - 0.52 times, Others (Debt and Derivatives) - 0.83 times Combined Annual Portfolio Turnover Ratio : 1.35 times
Dividend History : Refer page no. from 127 to 135
SIP Returns : Refer page no. from 123 to 125
Total Expense Ratio @@ :
IPGF1 : 2.69% p. a.
IPGF1 Direct Plan : 0.99% p. a.
Investment Objective : Refer page no. from 136 to 139
Auto Ancillaries 5.19% • Motherson Sumi Systems Ltd. 5.19% Banks 22.83% • ICICI Bank Ltd. 9.20% • State Bank Of India 6.20% • Axis Bank Ltd. 4.58% HDFC Bank Ltd. 2.84% Cement 6.77% Prism Cement Ltd. 3.89% Shree Cements Ltd. 2.88% Construction 12.10% • PNC Infratech Ltd. 6.72% • KNR Constructions Ltd. 5.38% Construction Project 4.92% • Larsen & Toubro Ltd. 4.92% Consumer Non Durables 2.41% Glaxosmithkline Consumer Healthcare Ltd. 2.41% Ferrous Metals 7.27% -0.89% Tata Steel Ltd. 3.79% Tata Steel Ltd. - Futures -0.89% JSW Steel Ltd. 3.48% Finance 3.32% Bajaj Finserv Ltd. 3.32% Gas 3.51% Aegis Logistics Ltd. 3.51% Industrial Products 3.84% Cummins India Ltd. 3.84% Pharmaceuticals 7.36% • Cipla Ltd. 4.45% IPCA Laboratories Ltd. 2.91% Power 4.47% • NTPC Ltd. 4.47% Software 6.40% • Infosys Ltd. 3.98%
Company/Issuer % to % to NAV NAV Derivatives
Company/Issuer % to % to NAV NAV Derivatives
HCL Technologies Ltd. 2.42% Transportation 3.29% Container Corporation Of India Ltd. 3.29% OPTIONS 0.46% Nifty 50 Index 0.46% Short Term Debt and net current assets 6.75% Total Net Assets 100.00%
Notes:1. Different plans shall have different expense structure. The performance details provided herein are of ICICI Prudential Growth Fund - Series 1.2. The scheme is currently managed by Sankaran Naren and Atul Patel. Mr. Sankaran Naren has been managing this fund since Jul 2017. Total Schemes managed by the Fund Manager is 32 (31 are jointly managed). Refer annexure from page no. 99 for performance of other schemes currently managed by Sankaran Naren.Mr. has been managing this fund since . Total Schemes managed by the Fund Manager ). Refer annexure from Atul Patel Feb 2015 is 14 (13 are jointly managedpage no. 99 for performance of other schemes currently managed by . Atul Patel3. Date of inception: 20-Jun-14.4. Performance of dividend option would be Net of Dividend distribution tax, if any.5. As the Scheme has completed more than 3 year but less than 5 years, the performance details of since inception,1 year and 3 years are provided herein.6. Past performance may or may not be sustained in future and the same may not necessarily provide the basis for comparison with other investment.7. Load is not considered for computation of returns.8. In case, the start/end date of the concerned period is a nonbusiness date (NBD), the NAV of the previous date is considered for computation of returns. The NAV per unit shown in the table is as on the start date of the said period9. NAV is adjusted to the extent of dividend declared for computation of returns.
Scheme
NAV (Rs.) Per Unit (as on October 31,2017 : 12.08)
CAGR (%)
10.00
Nifty 50 Index (Benchmark)
Since inception
CurrentValue of
Investment of Rs. 10000
CAGR (%) Current Value of
Investment of Rs. 10000
1 Year 3 Year 5 Year
CAGR (%) Current Value of
Investment of Rs. 10000
CAGR (%) Current Value of
Investment of Rs. 10000
11.70 11.60 -
Particulars
17.14 11729.55 15.25 15316.07 - - 18.61 17766.65
19.47 11964.92 7.48 12418.95 - - 9.94 13759.39
Std Dev (Annualised) : 13.85% Sharpe Ratio : 0.67 Portfolio Beta : 0.88 R squared : 0.73 Benchmark Std Dev (Annualised) : 13.52%
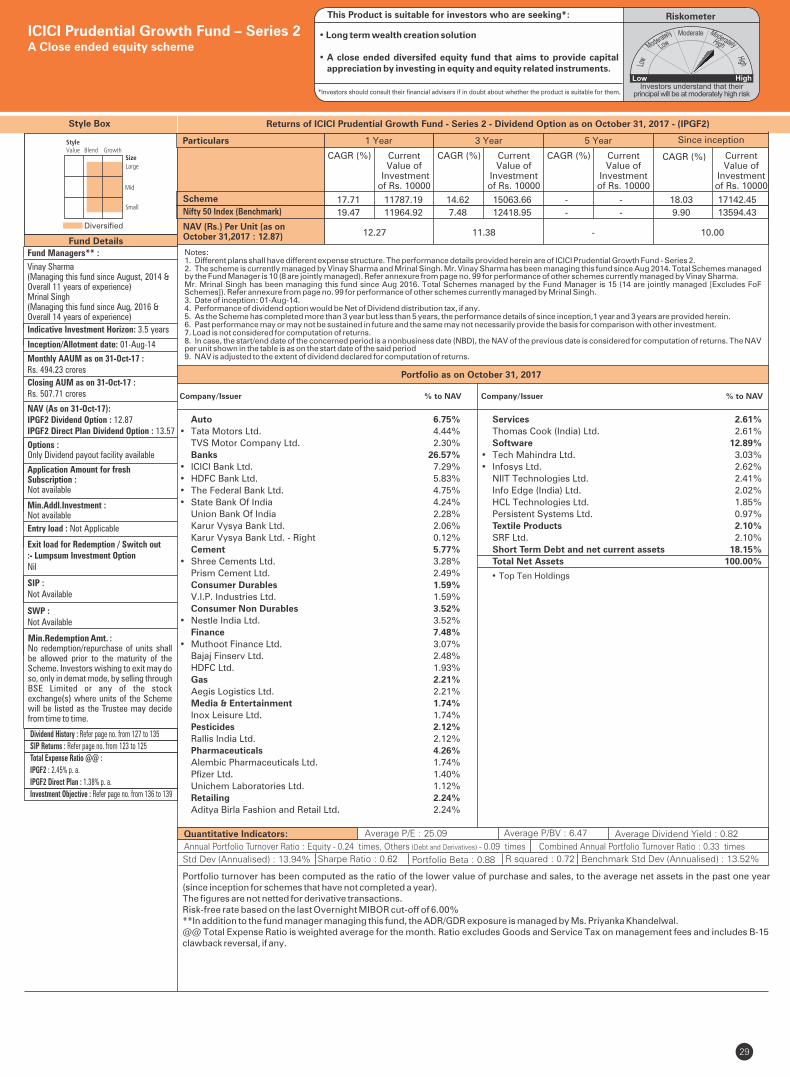
29
Style Box
Portfolio turnover has been computed as the ratio of the lower value of purchase and sales, to the average net assets in the past one year (since inception for schemes that have not completed a year). The figures are not netted for derivative transactions.Risk-free rate based on the last Overnight MIBOR cut-off of 6.00%**In addition to the fund manager managing this fund, the ADR/GDR exposure is managed by Ms. Priyanka Khandelwal.@@ Total Expense Ratio is weighted average for the month. Ratio excludes Goods and Service Tax on management fees and includes B-15 clawback reversal, if any.
Fund Managers** :
Vinay Sharma(Managing this fund since August, 2014 &Overall 11 years of experience)Mrinal Singh (Managing this fund since Aug, 2016 & Overall 14 years of experience)
Indicative Investment Horizon: 3.5 years
Inception/Allotment date: 01-Aug-14
NAV (As on 31-Oct-17):IPGF2 Dividend Option : 12.87IPGF2 Direct Plan Dividend Option : 13.57
Options :Only Dividend payout facility available
Application Amount for freshSubscription :Not available
Min.Addl.Investment :Not available
Exit load for Redemption / Switch out:- Lumpsum Investment OptionNil
SIP :Not Available
SWP :Not Available
Min.Redemption Amt. :No redemption/repurchase of units shall be allowed prior to the maturity of the Scheme. Investors wishing to exit may do so, only in demat mode, by selling through BSE Limited or any of the stock exchange(s) where units of the Scheme will be listed as the Trustee may decide from time to time.
Fund Details
Diversified
Quantitative Indicators:
• Top Ten Holdings
Monthly AAUM as on 31-Oct-17 : Rs. 494.23 crores
Closing AUM as on 31-Oct-17 : Rs. 507.71 crores
ICICI Prudential Growth Fund – Series 2A Close ended equity scheme
Average P/E : 25.09 Average P/BV : 6.47 Average Dividend Yield : 0.82
Portfolio as on October 31, 2017
Returns of ICICI Prudential Growth Fund - Series 2 - Dividend Option as on October 31, 2017 - (IPGF2)
Entry load : Not Applicable
RiskometerThis Product is suitable for investors who are seeking*:
• Long term wealth creation solution
• A close ended diversifed equity fund that aims to provide capital appreciation by investing in equity and equity related instruments.
*Investors should consult their financial advisers if in doubt about whether the product is suitable for them.
Annual Portfolio Turnover Ratio : Equity - 0.24 times, Others (Debt and Derivatives) - 0.09 times Combined Annual Portfolio Turnover Ratio : 0.33 times
Dividend History : Refer page no. from 127 to 135
SIP Returns : Refer page no. from 123 to 125
Total Expense Ratio @@ :
IPGF2 : 2.45% p. a.
IPGF2 Direct Plan : 1.38% p. a.
Investment Objective : Refer page no. from 136 to 139
Notes:1. Different plans shall have different expense structure. The performance details provided herein are of ICICI Prudential Growth Fund - Series 2.2. The scheme is currently managed by Vinay Sharma and Mrinal Singh. Mr. Vinay Sharma has been managing this fund since . Total Schemes managed Aug 2014by the Fund Manager Refer annexure from page no. 99 for performance of other schemes currently managed by Vinay Sharma.is 10 (8 are jointly managed).Mr. Mrinal Singh has been managing this fund since . Total Schemes managed by the Fund Manager Aug 2016 is 15 (14 are jointly managed [Excludes FoF Schemes]) . Refer annexure from page no. 99 for performance of other schemes currently managed by Mrinal Singh.3. Date of inception: 01-Aug-14.4. Performance of dividend option would be Net of Dividend distribution tax, if any.5. As the Scheme has completed more than 3 year but less than 5 years, the performance details of since inception,1 year and 3 years are provided herein.6. Past performance may or may not be sustained in future and the same may not necessarily provide the basis for comparison with other investment.7. Load is not considered for computation of returns.8. In case, the start/end date of the concerned period is a nonbusiness date (NBD), the NAV of the previous date is considered for computation of returns. The NAV per unit shown in the table is as on the start date of the said period9. NAV is adjusted to the extent of dividend declared for computation of returns.
Scheme
NAV (Rs.) Per Unit (as on October 31,2017 : 12.87)
CAGR (%)
10.00
Nifty 50 Index (Benchmark)
Since inception
CurrentValue of
Investment of Rs. 10000
CAGR (%) Current Value of
Investment of Rs. 10000
1 Year 3 Year 5 Year
CAGR (%) Current Value of
Investment of Rs. 10000
CAGR (%) Current Value of
Investment of Rs. 10000
12.27 11.38 -
Particulars
17.71 11787.19 14.62 15063.66 - - 18.03 17142.45
19.47 11964.92 7.48 12418.95 - - 9.90 13594.43
Auto 6.75%
• Tata Motors Ltd. 4.44%
TVS Motor Company Ltd. 2.30%
Banks 26.57%
• ICICI Bank Ltd. 7.29%
• HDFC Bank Ltd. 5.83%
• The Federal Bank Ltd. 4.75%
• State Bank Of India 4.24%
Union Bank Of India 2.28%
Karur Vysya Bank Ltd. 2.06%
Karur Vysya Bank Ltd. - Right 0.12%
Cement 5.77%
• Shree Cements Ltd. 3.28%
Prism Cement Ltd. 2.49%
Consumer Durables 1.59%
V.I.P. Industries Ltd. 1.59%
Consumer Non Durables 3.52%
• Nestle India Ltd. 3.52%
Finance 7.48%
• Muthoot Finance Ltd. 3.07%
Bajaj Finserv Ltd. 2.48%
HDFC Ltd. 1.93%
Gas 2.21%
Aegis Logistics Ltd. 2.21%
Media & Entertainment 1.74%
Inox Leisure Ltd. 1.74%
Pesticides 2.12%
Rallis India Ltd. 2.12%
Pharmaceuticals 4.26%
Alembic Pharmaceuticals Ltd. 1.74%
Pfizer Ltd. 1.40%
Unichem Laboratories Ltd. 1.12%
Retailing 2.24%
Aditya Birla Fashion and Retail Ltd. 2.24%
Services 2.61%
Thomas Cook (India) Ltd. 2.61%
Software 12.89%
• Tech Mahindra Ltd. 3.03%
• Infosys Ltd. 2.62%
NIIT Technologies Ltd. 2.41%
Info Edge (India) Ltd. 2.02%
HCL Technologies Ltd. 1.85%
Persistent Systems Ltd. 0.97%
Textile Products 2.10%
SRF Ltd. 2.10%
Short Term Debt and net current assets 18.15%
Total Net Assets 100.00%
Company/Issuer % to NAV Company/Issuer % to NAV
Std Dev (Annualised) : 13.94% Sharpe Ratio : 0.62 Portfolio Beta : 0.88 R squared : 0.72 Benchmark Std Dev (Annualised) : 13.52%
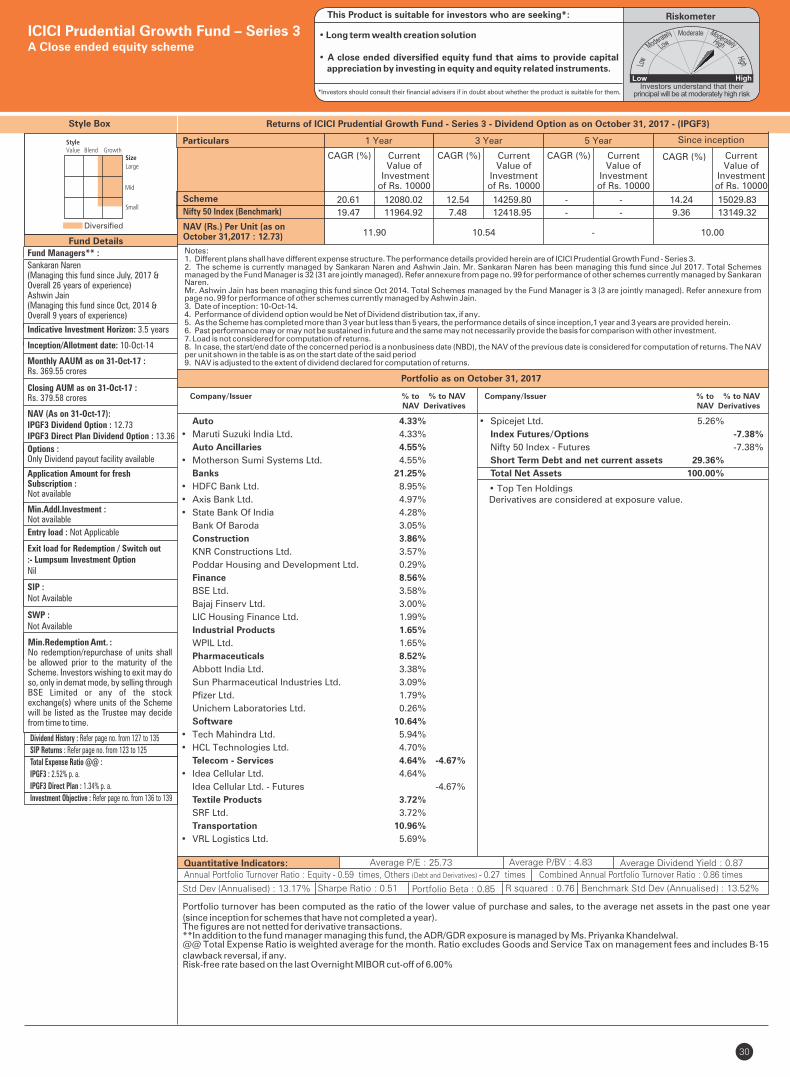
30
Style Box
Portfolio turnover has been computed as the ratio of the lower value of purchase and sales, to the average net assets in the past one year (since inception for schemes that have not completed a year). The figures are not netted for derivative transactions.**In addition to the fund manager managing this fund, the ADR/GDR exposure is managed by Ms. Priyanka Khandelwal. @@ Total Expense Ratio is weighted average for the month. Ratio excludes Goods and Service Tax on management fees and includes B-15 clawback reversal, if any.Risk-free rate based on the last Overnight MIBOR cut-off of 6.00%
Fund Managers** :
Sankaran Naren(Managing this fund since July, 2017 &Overall 26 years of experience)Ashwin Jain(Managing this fund since Oct, 2014 &Overall 9 years of experience)
Indicative Investment Horizon: 3.5 years
Inception/Allotment date: 10-Oct-14
NAV (As on 31-Oct-17):IPGF3 Dividend Option : 12.73IPGF3 Direct Plan Dividend Option : 13.36
Options :Only Dividend payout facility available
Application Amount for freshSubscription :Not available
Min.Addl.Investment :Not available
Exit load for Redemption / Switch out:- Lumpsum Investment OptionNil
SIP :Not Available
SWP :Not Available
Min.Redemption Amt. :No redemption/repurchase of units shall be allowed prior to the maturity of the Scheme. Investors wishing to exit may do so, only in demat mode, by selling through BSE Limited or any of the stock exchange(s) where units of the Scheme will be listed as the Trustee may decide from time to time.
Fund Details
Diversified
Quantitative Indicators: Average P/E : 25.73 Average P/BV : 4.83 Average Dividend Yield : 0.87
• Top Ten HoldingsDerivatives are considered at exposure value.
Monthly AAUM as on 31-Oct-17 : Rs. 369.55 crores
Closing AUM as on 31-Oct-17 :Rs. 379.58 crores
ICICI Prudential Growth Fund – Series 3A Close ended equity scheme
Entry load : Not Applicable
Riskometer
• Long term wealth creation solution
• A close ended diversified equity fund that aims to provide capital appreciation by investing in equity and equity related instruments.
*Investors should consult their financial advisers if in doubt about whether the product is suitable for them.
This Product is suitable for investors who are seeking*:
Annual Portfolio Turnover Ratio : Equity - 0.59 times, Others (Debt and Derivatives) - 0.27 times Combined Annual Portfolio Turnover Ratio : 0.86 times
Portfolio as on October 31, 2017
Returns of ICICI Prudential Growth Fund - Series 3 - Dividend Option as on October 31, 2017 - (IPGF3)
Dividend History : Refer page no. from 127 to 135
SIP Returns : Refer page no. from 123 to 125
Total Expense Ratio @@ :
IPGF3 : 2.52% p. a.
IPGF3 Direct Plan : 1.34% p. a.
Investment Objective : Refer page no. from 136 to 139
Auto 4.33%
• Maruti Suzuki India Ltd. 4.33%
Auto Ancillaries 4.55%
• Motherson Sumi Systems Ltd. 4.55%
Banks 21.25%
• HDFC Bank Ltd. 8.95%
• Axis Bank Ltd. 4.97%
• State Bank Of India 4.28%
Bank Of Baroda 3.05%
Construction 3.86%
KNR Constructions Ltd. 3.57%
Poddar Housing and Development Ltd. 0.29%
Finance 8.56%
BSE Ltd. 3.58%
Bajaj Finserv Ltd. 3.00%
LIC Housing Finance Ltd. 1.99%
Industrial Products 1.65%
WPIL Ltd. 1.65%
Pharmaceuticals 8.52%
Abbott India Ltd. 3.38%
Sun Pharmaceutical Industries Ltd. 3.09%
Pfizer Ltd. 1.79%
Unichem Laboratories Ltd. 0.26%
Software 10.64%
• Tech Mahindra Ltd. 5.94%
• HCL Technologies Ltd. 4.70%
Telecom - Services 4.64% -4.67%
• Idea Cellular Ltd. 4.64%
Idea Cellular Ltd. - Futures -4.67%
Textile Products 3.72%
SRF Ltd. 3.72%
Transportation 10.96%
• VRL Logistics Ltd. 5.69%
• Spicejet Ltd. 5.26%
Index Futures/Options -7.38%
Nifty 50 Index - Futures -7.38%
Short Term Debt and net current assets 29.36%
Total Net Assets 100.00%
Company/Issuer % to % to NAV NAV Derivatives
Company/Issuer % to % to NAV NAV Derivatives
Notes:1. Different plans shall have different expense structure. The performance details provided herein are of ICICI Prudential Growth Fund - Series 3.2. The scheme is currently managed by Sankaran Naren and Ashwin Jain. Mr. Sankaran Naren has been managing this fund since Jul 2017. Total Schemes managed by the Fund Manager is 32 (31 are jointly managed). Refer annexure from page no. 99 for performance of other schemes currently managed by Sankaran Naren.Mr. Ashwin Jain has been managing this fund since Oct 2014. Total Schemes managed by the Fund Manager ). Refer annexure from is 3 (3 are jointly managedpage no. 99 for performance of other schemes currently managed by Ashwin Jain. 3. Date of inception: 10-Oct-14.4. Performance of dividend option would be Net of Dividend distribution tax, if any.5. As the Scheme has completed more than 3 year but less than 5 years, the performance details of since inception,1 year and 3 years are provided herein.6. Past performance may or may not be sustained in future and the same may not necessarily provide the basis for comparison with other investment.7. Load is not considered for computation of returns.8. In case, the start/end date of the concerned period is a nonbusiness date (NBD), the NAV of the previous date is considered for computation of returns. The NAV per unit shown in the table is as on the start date of the said period9. NAV is adjusted to the extent of dividend declared for computation of returns.
Scheme
NAV (Rs.) Per Unit (as on October 31,2017 : 12.73)
CAGR (%)
10.00
Nifty 50 Index (Benchmark)
Since inception
CurrentValue of
Investment of Rs. 10000
CAGR (%) Current Value of
Investment of Rs. 10000
1 Year 3 Year 5 Year
CAGR (%) Current Value of
Investment of Rs. 10000
CAGR (%) Current Value of
Investment of Rs. 10000
11.90 10.54 -
Particulars
20.61 12080.02 12.54 14259.80 - - 14.24 15029.83
19.47 11964.92 7.48 12418.95 - - 9.36 13149.32
Std Dev (Annualised) : 13.17% Sharpe Ratio : 0.51 Portfolio Beta : 0.85 R squared : 0.76 Benchmark Std Dev (Annualised) : 13.52%
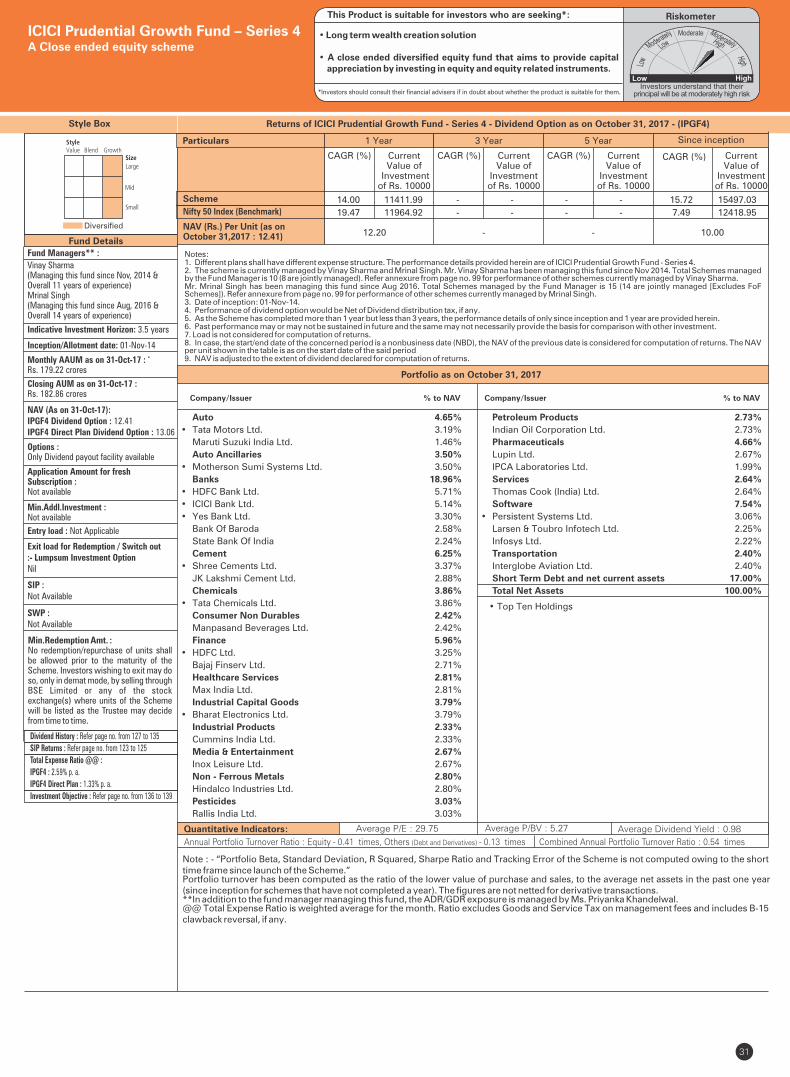
31
Style Box
Note : - “Portfolio Beta, Standard Deviation, R Squared, Sharpe Ratio and Tracking Error of the Scheme is not computed owing to the short time frame since launch of the Scheme.”Portfolio turnover has been computed as the ratio of the lower value of purchase and sales, to the average net assets in the past one year (since inception for schemes that have not completed a year). The figures are not netted for derivative transactions.**In addition to the fund manager managing this fund, the ADR/GDR exposure is managed by Ms. Priyanka Khandelwal.@@ Total Expense Ratio is weighted average for the month. Ratio excludes Goods and Service Tax on management fees and includes B-15 clawback reversal, if any.
Fund Managers** :
Vinay Sharma(Managing this fund since Nov, 2014 &Overall 11 years of experience)Mrinal Singh (Managing this fund since Aug, 2016 & Overall 14 years of experience)
Indicative Investment Horizon: 3.5 years
Inception/Allotment date: 01-Nov-14
NAV (As on 31-Oct-17):IPGF4 Dividend Option : 12.41IPGF4 Direct Plan Dividend Option : 13.06
Options :Only Dividend payout facility available
Application Amount for freshSubscription :Not available
Min.Addl.Investment :Not available
Exit load for Redemption / Switch out:- Lumpsum Investment OptionNil
SIP :Not Available
SWP :Not Available
Min.Redemption Amt. :No redemption/repurchase of units shall be allowed prior to the maturity of the Scheme. Investors wishing to exit may do so, only in demat mode, by selling through BSE Limited or any of the stock exchange(s) where units of the Scheme will be listed as the Trustee may decide from time to time.
Fund Details
Diversified
Quantitative Indicators: Average P/E : 29.75 Average P/BV : 5.27 Average Dividend Yield : 0.98
Monthly AAUM as on 31-Oct-17 : ‘Rs. 179.22 crores
Closing AUM as on 31-Oct-17 : Rs. 182.86 crores
ICICI Prudential Growth Fund – Series 4A Close ended equity scheme
Entry load : Not Applicable
RiskometerThis Product is suitable for investors who are seeking*:
• Long term wealth creation solution
• A close ended diversified equity fund that aims to provide capital appreciation by investing in equity and equity related instruments.
*Investors should consult their financial advisers if in doubt about whether the product is suitable for them.
Annual Portfolio Turnover Ratio : Equity - 0.41 times, Others (Debt and Derivatives) - 0.13 times Combined Annual Portfolio Turnover Ratio : 0.54 times
Portfolio as on October 31, 2017
Returns of ICICI Prudential Growth Fund - Series 4 - Dividend Option as on October 31, 2017 - (IPGF4)
• Top Ten Holdings
Dividend History : Refer page no. from 127 to 135
SIP Returns : Refer page no. from 123 to 125
Total Expense Ratio @@ :
IPGF4 : 2.59% p. a.
IPGF4 Direct Plan : 1.33% p. a.
Investment Objective : Refer page no. from 136 to 139
Auto 4.65%
• Tata Motors Ltd. 3.19%
Maruti Suzuki India Ltd. 1.46%
Auto Ancillaries 3.50%
• Motherson Sumi Systems Ltd. 3.50%
Banks 18.96%
• HDFC Bank Ltd. 5.71%
• ICICI Bank Ltd. 5.14%
• Yes Bank Ltd. 3.30%
Bank Of Baroda 2.58%
State Bank Of India 2.24%
Cement 6.25%
• Shree Cements Ltd. 3.37%
JK Lakshmi Cement Ltd. 2.88%
Chemicals 3.86%
• Tata Chemicals Ltd. 3.86%
Consumer Non Durables 2.42%
Manpasand Beverages Ltd. 2.42%
Finance 5.96%
• HDFC Ltd. 3.25%
Bajaj Finserv Ltd. 2.71%
Healthcare Services 2.81%
Max India Ltd. 2.81%
Industrial Capital Goods 3.79%
• Bharat Electronics Ltd. 3.79%
Industrial Products 2.33%
Cummins India Ltd. 2.33%
Media & Entertainment 2.67%
Inox Leisure Ltd. 2.67%
Non - Ferrous Metals 2.80%
Hindalco Industries Ltd. 2.80%
Pesticides 3.03%
Rallis India Ltd. 3.03%
Petroleum Products 2.73%
Indian Oil Corporation Ltd. 2.73%
Pharmaceuticals 4.66%
Lupin Ltd. 2.67%
IPCA Laboratories Ltd. 1.99%
Services 2.64%
Thomas Cook (India) Ltd. 2.64%
Software 7.54%
• Persistent Systems Ltd. 3.06%
Larsen & Toubro Infotech Ltd. 2.25%
Infosys Ltd. 2.22%
Transportation 2.40%
Interglobe Aviation Ltd. 2.40%
Short Term Debt and net current assets 17.00%
Total Net Assets 100.00%
Company/Issuer % to NAV Company/Issuer % to NAV
Notes:1. Different plans shall have different expense structure. The performance details provided herein are of ICICI Prudential Growth Fund - Series 4.2. The scheme is currently managed by Vinay Sharma and Mrinal Singh. Mr. Vinay Sharma has been managing this fund since Nov 2014. Total Schemes managed by the Fund Manager Refer annexure from page no. 99 for performance of other schemes currently managed by Vinay Sharma.is 10 (8 are jointly managed).Mr. Mrinal Singh has been managing this fund since . Total Schemes managed by the Fund Manager Aug 2016 is 15 (14 are jointly managed [Excludes FoF Schemes]) . Refer annexure from page no. 99 for performance of other schemes currently managed by Mrinal Singh.3. Date of inception: 01-Nov-14.4. Performance of dividend option would be Net of Dividend distribution tax, if any.5. As the Scheme has completed more than 1 year but less than 3 years, the performance details of only since inception and 1 year are provided herein.6. Past performance may or may not be sustained in future and the same may not necessarily provide the basis for comparison with other investment.7. Load is not considered for computation of returns.8. In case, the start/end date of the concerned period is a nonbusiness date (NBD), the NAV of the previous date is considered for computation of returns. The NAV per unit shown in the table is as on the start date of the said period9. NAV is adjusted to the extent of dividend declared for computation of returns.
Scheme
NAV (Rs.) Per Unit (as on October 31,2017 : 12.41)
CAGR (%)
10.00
Nifty 50 Index (Benchmark)
Since inception
CurrentValue of
Investment of Rs. 10000
CAGR (%) Current Value of
Investment of Rs. 10000
1 Year 3 Year 5 Year
CAGR (%) Current Value of
Investment of Rs. 10000
CAGR (%) Current Value of
Investment of Rs. 10000
12.20 - -
Particulars
14.00 11411.99 - - - - 15.72 15497.03
19.47 11964.92 - - - - 7.49 12418.95
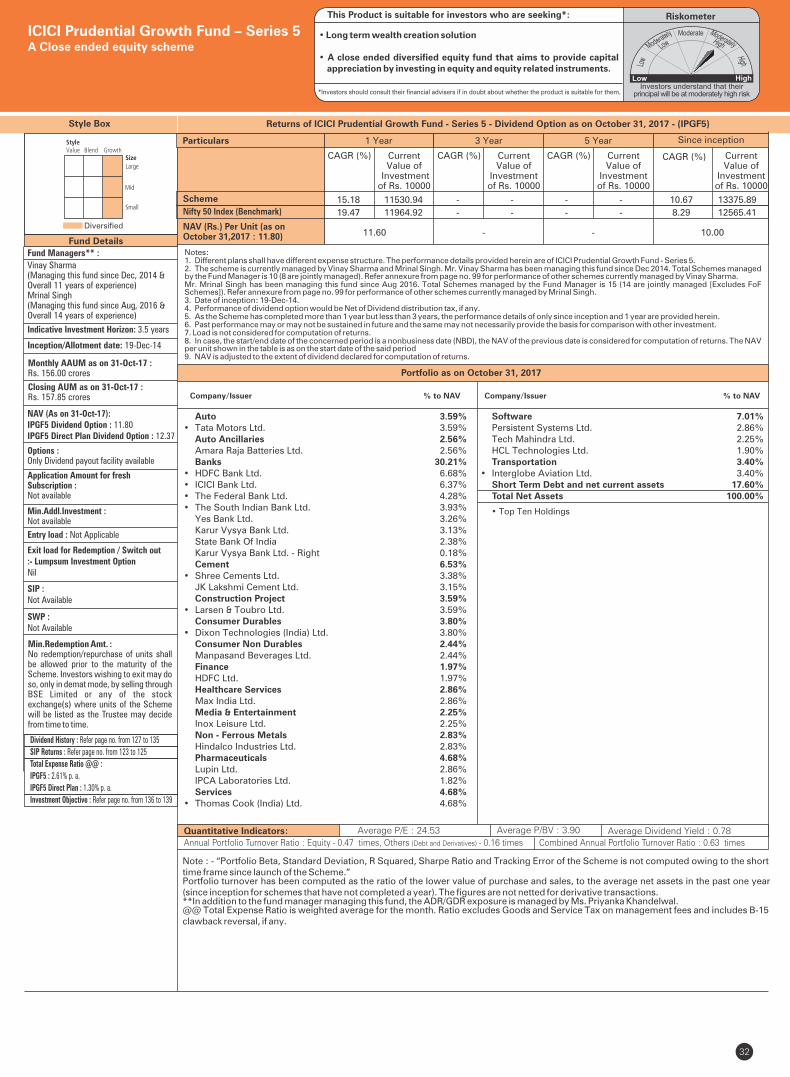
32
Style Box
Note : - “Portfolio Beta, Standard Deviation, R Squared, Sharpe Ratio and Tracking Error of the Scheme is not computed owing to the short time frame since launch of the Scheme.”Portfolio turnover has been computed as the ratio of the lower value of purchase and sales, to the average net assets in the past one year (since inception for schemes that have not completed a year). The figures are not netted for derivative transactions.**In addition to the fund manager managing this fund, the ADR/GDR exposure is managed by Ms. Priyanka Khandelwal.@@ Total Expense Ratio is weighted average for the month. Ratio excludes Goods and Service Tax on management fees and includes B-15 clawback reversal, if any.
Fund Managers** :
Vinay Sharma(Managing this fund since Dec, 2014 & Overall 11 years of experience) Mrinal Singh (Managing this fund since Aug, 2016 & Overall 14 years of experience)
Indicative Investment Horizon: 3.5 years
Inception/Allotment date: 19-Dec-14
NAV (As on 31-Oct-17):IPGF5 Dividend Option : 11.80IPGF5 Direct Plan Dividend Option : 12.37
Options :Only Dividend payout facility available
Application Amount for freshSubscription :Not available
Min.Addl.Investment :Not available
Entry load : Not Applicable
Exit load for Redemption / Switch out:- Lumpsum Investment OptionNil
SIP :Not Available
SWP :Not Available
Min.Redemption Amt. :No redemption/repurchase of units shall be allowed prior to the maturity of the Scheme. Investors wishing to exit may do so, only in demat mode, by selling through BSE Limited or any of the stock exchange(s) where units of the Scheme will be listed as the Trustee may decide from time to time.
Fund Details
Diversified
Quantitative Indicators: Average P/E : 24.53 Average P/BV : 3.90 Average Dividend Yield : 0.78
Monthly AAUM as on 31-Oct-17 : Rs. 156.00 crores
Closing AUM as on 31-Oct-17 : Rs. 157.85 crores
ICICI Prudential Growth Fund – Series 5A Close ended equity scheme
RiskometerThis Product is suitable for investors who are seeking*:
• Long term wealth creation solution
• A close ended diversified equity fund that aims to provide capital appreciation by investing in equity and equity related instruments.
*Investors should consult their financial advisers if in doubt about whether the product is suitable for them.
Annual Portfolio Turnover Ratio : Equity - 0.47 times, Others (Debt and Derivatives) - 0.16 times Combined Annual Portfolio Turnover Ratio : 0.63 times
Portfolio as on October 31, 2017
Returns of ICICI Prudential Growth Fund - Series 5 - Dividend Option as on October 31, 2017 - (IPGF5)
• Top Ten Holdings
Auto 3.59%• Tata Motors Ltd. 3.59% Auto Ancillaries 2.56% Amara Raja Batteries Ltd. 2.56% Banks 30.21%• HDFC Bank Ltd. 6.68%• ICICI Bank Ltd. 6.37%• The Federal Bank Ltd. 4.28%• The South Indian Bank Ltd. 3.93% Yes Bank Ltd. 3.26% Karur Vysya Bank Ltd. 3.13% State Bank Of India 2.38% Karur Vysya Bank Ltd. - Right 0.18% Cement 6.53%• Shree Cements Ltd. 3.38% JK Lakshmi Cement Ltd. 3.15% Construction Project 3.59%• Larsen & Toubro Ltd. 3.59% Consumer Durables 3.80%• Dixon Technologies (India) Ltd. 3.80% Consumer Non Durables 2.44% Manpasand Beverages Ltd. 2.44% Finance 1.97% HDFC Ltd. 1.97% Healthcare Services 2.86% Max India Ltd. 2.86% Media & Entertainment 2.25% Inox Leisure Ltd. 2.25% Non - Ferrous Metals 2.83% Hindalco Industries Ltd. 2.83% Pharmaceuticals 4.68% Lupin Ltd. 2.86% IPCA Laboratories Ltd. 1.82% Services 4.68%• Thomas Cook (India) Ltd. 4.68%
Software 7.01% Persistent Systems Ltd. 2.86% Tech Mahindra Ltd. 2.25% HCL Technologies Ltd. 1.90% Transportation 3.40%• Interglobe Aviation Ltd. 3.40% Short Term Debt and net current assets 17.60% Total Net Assets 100.00%
Dividend History : Refer page no. from 127 to 135
SIP Returns : Refer page no. from 123 to 125
Total Expense Ratio @@ :
IPGF5 : 2.61% p. a.
IPGF5 Direct Plan : 1.30% p. a.
Investment Objective : Refer page no. from 136 to 139
Notes:1. Different plans shall have different expense structure. The performance details provided herein are of ICICI Prudential Growth Fund - Series 5.2. The scheme is currently managed by Vinay Sharma and Mrinal Singh. Mr. Vinay Sharma has been managing this fund since Dec 2014. Total Schemes managed by the Fund Manager Refer annexure from page no. 99 for performance of other schemes currently managed by Vinay Sharma.is 10 (8 are jointly managed).Mr. Mrinal Singh has been managing this fund since . Total Schemes managed by the Fund Manager Aug 2016 is 15 (14 are jointly managed [Excludes FoF Schemes]) . Refer annexure from page no. 99 for performance of other schemes currently managed by Mrinal Singh.3. Date of inception: 19-Dec-14.4. Performance of dividend option would be Net of Dividend distribution tax, if any.5. As the Scheme has completed more than 1 year but less than 3 years, the performance details of only since inception and 1 year are provided herein.6. Past performance may or may not be sustained in future and the same may not necessarily provide the basis for comparison with other investment.7. Load is not considered for computation of returns.8. In case, the start/end date of the concerned period is a nonbusiness date (NBD), the NAV of the previous date is considered for computation of returns. The NAV per unit shown in the table is as on the start date of the said period9. NAV is adjusted to the extent of dividend declared for computation of returns.
Scheme
NAV (Rs.) Per Unit (as on October 31,2017 : 11.80)
CAGR (%)
10.00
Nifty 50 Index (Benchmark)
Since inception
CurrentValue of
Investment of Rs. 10000
CAGR (%) Current Value of
Investment of Rs. 10000
1 Year 3 Year 5 Year
CAGR (%) Current Value of
Investment of Rs. 10000
CAGR (%) Current Value of
Investment of Rs. 10000
11.60 - -
Particulars
15.18 11530.94 - - - - 10.67 13375.89
19.47 11964.92 - - - - 8.29 12565.41
Company/Issuer % to NAV Company/Issuer % to NAV
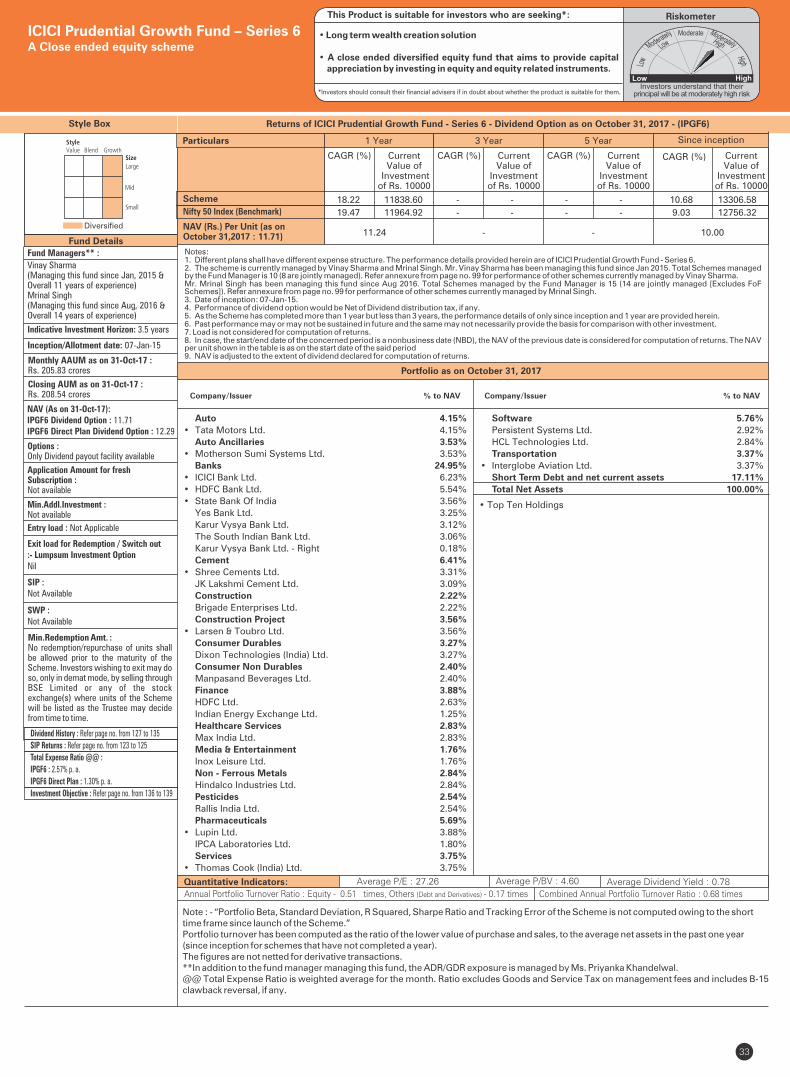
33
Style Box
Note : - “Portfolio Beta, Standard Deviation, R Squared, Sharpe Ratio and Tracking Error of the Scheme is not computed owing to the shorttime frame since launch of the Scheme.”Portfolio turnover has been computed as the ratio of the lower value of purchase and sales, to the average net assets in the past one year(since inception for schemes that have not completed a year). The figures are not netted for derivative transactions.**In addition to the fund manager managing this fund, the ADR/GDR exposure is managed by Ms. Priyanka Khandelwal.@@ Total Expense Ratio is weighted average for the month. Ratio excludes Goods and Service Tax on management fees and includes B-15 clawback reversal, if any.
Fund Managers** :
Vinay Sharma(Managing this fund since Jan, 2015 &Overall 11 years of experience)Mrinal Singh (Managing this fund since Aug, 2016 & Overall 14 years of experience)
Indicative Investment Horizon: 3.5 years
Inception/Allotment date: 07-Jan-15
NAV (As on 31-Oct-17):IPGF6 Dividend Option : 11.71IPGF6 Direct Plan Dividend Option : 12.29
Options :Only Dividend payout facility available
Application Amount for freshSubscription :Not available
Min.Addl.Investment :Not available
Entry load : Not Applicable
Exit load for Redemption / Switch out:- Lumpsum Investment OptionNil
SIP :Not Available
SWP :Not Available
Min.Redemption Amt. :No redemption/repurchase of units shall be allowed prior to the maturity of the Scheme. Investors wishing to exit may do so, only in demat mode, by selling through BSE Limited or any of the stock exchange(s) where units of the Scheme will be listed as the Trustee may decide from time to time.
Fund Details
Diversified
Quantitative Indicators: Average P/E : 27.26 Average P/BV : 4.60 Average Dividend Yield : 0.78
Monthly AAUM as on 31-Oct-17 :Rs. 205.83 crores
Closing AUM as on 31-Oct-17 : Rs. 208.54 crores
ICICI Prudential Growth Fund – Series 6A Close ended equity scheme
RiskometerThis Product is suitable for investors who are seeking*:
• Long term wealth creation solution
• A close ended diversified equity fund that aims to provide capital appreciation by investing in equity and equity related instruments.
*Investors should consult their financial advisers if in doubt about whether the product is suitable for them.
Annual Portfolio Turnover Ratio : Equity - 0.51 times, Others (Debt and Derivatives) - 0.17 times Combined Annual Portfolio Turnover Ratio : 0.68 times
Returns of ICICI Prudential Growth Fund - Series 6 - Dividend Option as on October 31, 2017 - (IPGF6)
Portfolio as on October 31, 2017
Dividend History : Refer page no. from 127 to 135
SIP Returns : Refer page no. from 123 to 125
Total Expense Ratio @@ :
IPGF6 : 2.57% p. a.
IPGF6 Direct Plan : 1.30% p. a.
Investment Objective : Refer page no. from 136 to 139
• Top Ten Holdings
Auto 4.15%
• Tata Motors Ltd. 4.15%
Auto Ancillaries 3.53%
• Motherson Sumi Systems Ltd. 3.53%
Banks 24.95%
• ICICI Bank Ltd. 6.23%
• HDFC Bank Ltd. 5.54%
• State Bank Of India 3.56%
Yes Bank Ltd. 3.25%
Karur Vysya Bank Ltd. 3.12%
The South Indian Bank Ltd. 3.06%
Karur Vysya Bank Ltd. - Right 0.18%
Cement 6.41%
• Shree Cements Ltd. 3.31%
JK Lakshmi Cement Ltd. 3.09%
Construction 2.22%
Brigade Enterprises Ltd. 2.22%
Construction Project 3.56%
• Larsen & Toubro Ltd. 3.56%
Consumer Durables 3.27%
Dixon Technologies (India) Ltd. 3.27%
Consumer Non Durables 2.40%
Manpasand Beverages Ltd. 2.40%
Finance 3.88%
HDFC Ltd. 2.63%
Indian Energy Exchange Ltd. 1.25%
Healthcare Services 2.83%
Max India Ltd. 2.83%
Media & Entertainment 1.76%
Inox Leisure Ltd. 1.76%
Non - Ferrous Metals 2.84%
Hindalco Industries Ltd. 2.84%
Pesticides 2.54%
Rallis India Ltd. 2.54%
Pharmaceuticals 5.69%
• Lupin Ltd. 3.88%
IPCA Laboratories Ltd. 1.80%
Services 3.75%
• Thomas Cook (India) Ltd. 3.75%
Software 5.76%
Persistent Systems Ltd. 2.92%
HCL Technologies Ltd. 2.84%
Transportation 3.37%
• Interglobe Aviation Ltd. 3.37%
Short Term Debt and net current assets 17.11%
Total Net Assets 100.00%
Notes:1. Different plans shall have different expense structure. The performance details provided herein are of ICICI Prudential Growth Fund - Series 6.2. The scheme is currently managed by Vinay Sharma and Mrinal Singh. Mr. Vinay Sharma has been managing this fund since Jan 2015. Total Schemes managed by the Fund Manager Refer annexure from page no. 99 for performance of other schemes currently managed by Vinay Sharma.is 10 (8 are jointly managed).Mr. Mrinal Singh has been managing this fund since . Total Schemes managed by the Fund Manager Aug 2016 is 15 (14 are jointly managed [Excludes FoF Schemes]) . Refer annexure from page no. 99 for performance of other schemes currently managed by Mrinal Singh.3. Date of inception: 07-Jan-15.4. Performance of dividend option would be Net of Dividend distribution tax, if any.5. As the Scheme has completed more than 1 year but less than 3 years, the performance details of only since inception and 1 year are provided herein.6. Past performance may or may not be sustained in future and the same may not necessarily provide the basis for comparison with other investment.7. Load is not considered for computation of returns.8. In case, the start/end date of the concerned period is a nonbusiness date (NBD), the NAV of the previous date is considered for computation of returns. The NAV per unit shown in the table is as on the start date of the said period9. NAV is adjusted to the extent of dividend declared for computation of returns.
Scheme
NAV (Rs.) Per Unit (as on October 31,2017 : 11.71)
CAGR (%)
10.00
Nifty 50 Index (Benchmark)
Since inception
CurrentValue of
Investment of Rs. 10000
CAGR (%) Current Value of
Investment of Rs. 10000
1 Year 3 Year 5 Year
CAGR (%) Current Value of
Investment of Rs. 10000
CAGR (%) Current Value of
Investment of Rs. 10000
11.24 - -
Particulars
18.22 11838.60 - - - - 10.68 13306.58
19.47 11964.92 - - - - 9.03 12756.32
Company/Issuer % to NAV Company/Issuer % to NAV
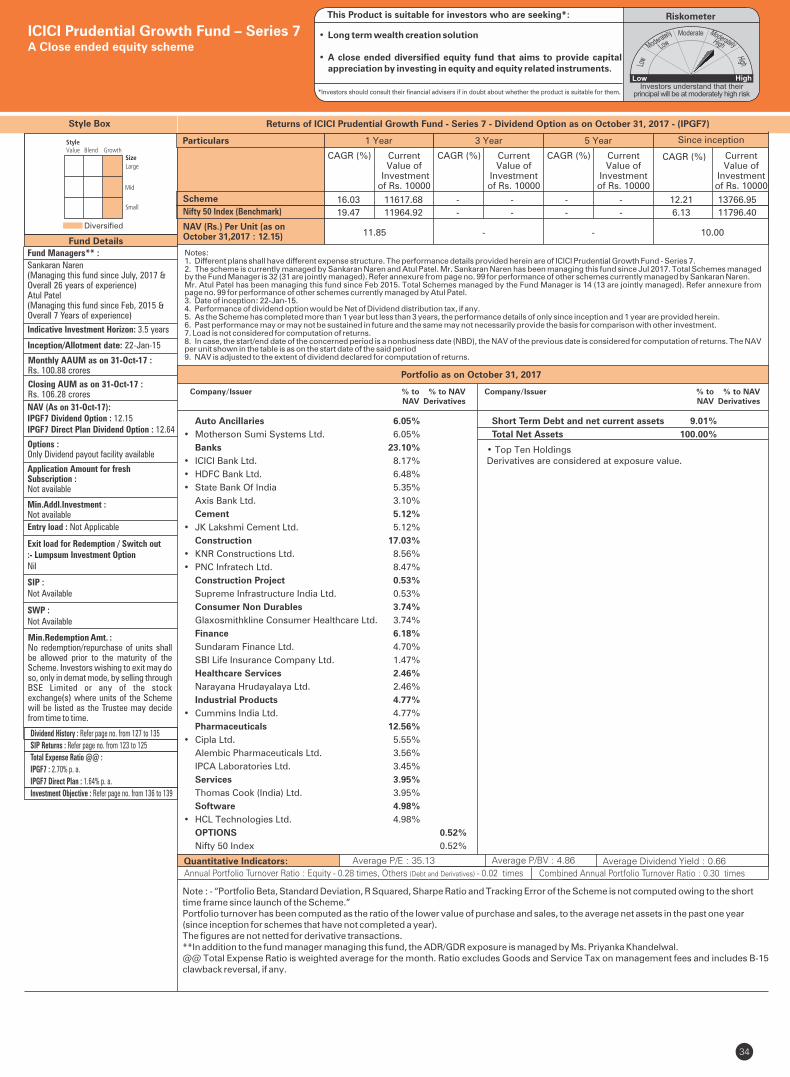
34
Style Box
Note : - “Portfolio Beta, Standard Deviation, R Squared, Sharpe Ratio and Tracking Error of the Scheme is not computed owing to the shorttime frame since launch of the Scheme.”Portfolio turnover has been computed as the ratio of the lower value of purchase and sales, to the average net assets in the past one year(since inception for schemes that have not completed a year). The figures are not netted for derivative transactions.**In addition to the fund manager managing this fund, the ADR/GDR exposure is managed by Ms. Priyanka Khandelwal.@@ Total Expense Ratio is weighted average for the month. Ratio excludes Goods and Service Tax on management fees and includes B-15 clawback reversal, if any.
Fund Managers** :
Sankaran Naren(Managing this fund since July, 2017 &Overall 26 years of experience)Atul Patel(Managing this fund since Feb, 2015 &Overall 7 Years of experience)
Indicative Investment Horizon: 3.5 years
Inception/Allotment date: 22-Jan-15
NAV (As on 31-Oct-17):IPGF7 Dividend Option : 12.15IPGF7 Direct Plan Dividend Option : 12.64
Options :Only Dividend payout facility available
Application Amount for freshSubscription :Not available
Min.Addl.Investment :Not available
Exit load for Redemption / Switch out:- Lumpsum Investment OptionNil
SIP :Not Available
SWP :Not Available
Min.Redemption Amt. :No redemption/repurchase of units shall be allowed prior to the maturity of the Scheme. Investors wishing to exit may do so, only in demat mode, by selling through BSE Limited or any of the stock exchange(s) where units of the Scheme will be listed as the Trustee may decide from time to time.
Fund Details
Diversified
Quantitative Indicators: Average P/E : 35.13 Average P/BV : 4.86 Average Dividend Yield : 0.66
• Top Ten HoldingsDerivatives are considered at exposure value.
Monthly AAUM as on 31-Oct-17 : Rs. 100.88 crores
Closing AUM as on 31-Oct-17 : Rs. 106.28 crores
ICICI Prudential Growth Fund – Series 7A Close ended equity scheme
Entry load : Not Applicable
RiskometerThis Product is suitable for investors who are seeking*:
• Long term wealth creation solution
• A close ended diversified equity fund that aims to provide capital appreciation by investing in equity and equity related instruments.
*Investors should consult their financial advisers if in doubt about whether the product is suitable for them.
Annual Portfolio Turnover Ratio : Equity - 0.28 times, Others (Debt and Derivatives) - 0.02 times Combined Annual Portfolio Turnover Ratio : 0.30 times
Returns of ICICI Prudential Growth Fund - Series 7 - Dividend Option as on October 31, 2017 - (IPGF7)
Portfolio as on October 31, 2017
Dividend History : Refer page no. from 127 to 135
SIP Returns : Refer page no. from 123 to 125
Total Expense Ratio @@ :
IPGF7 : 2.70% p. a.
IPGF7 Direct Plan : 1.64% p. a.
Investment Objective : Refer page no. from 136 to 139
Auto Ancillaries 6.05%
• Motherson Sumi Systems Ltd. 6.05%
Banks 23.10%
• ICICI Bank Ltd. 8.17%
• HDFC Bank Ltd. 6.48%
• State Bank Of India 5.35%
Axis Bank Ltd. 3.10%
Cement 5.12%
• JK Lakshmi Cement Ltd. 5.12%
Construction 17.03%
• KNR Constructions Ltd. 8.56%
• PNC Infratech Ltd. 8.47%
Construction Project 0.53%
Supreme Infrastructure India Ltd. 0.53%
Consumer Non Durables 3.74%
Glaxosmithkline Consumer Healthcare Ltd. 3.74%
Finance 6.18%
Sundaram Finance Ltd. 4.70%
SBI Life Insurance Company Ltd. 1.47%
Healthcare Services 2.46%
Narayana Hrudayalaya Ltd. 2.46%
Industrial Products 4.77%
• Cummins India Ltd. 4.77%
Pharmaceuticals 12.56%
• Cipla Ltd. 5.55%
Alembic Pharmaceuticals Ltd. 3.56%
IPCA Laboratories Ltd. 3.45%
Services 3.95%
Thomas Cook (India) Ltd. 3.95%
Software 4.98%
• HCL Technologies Ltd. 4.98%
OPTIONS 0.52%
Nifty 50 Index 0.52%
Short Term Debt and net current assets 9.01%
Total Net Assets 100.00%
Notes:1. Different plans shall have different expense structure. The performance details provided herein are of ICICI Prudential Growth Fund - Series 7.2. The scheme is currently managed by Sankaran Naren and Atul Patel. Mr. Sankaran Naren has been managing this fund since Jul 2017. Total Schemes managed by the Fund Manager is 32 (31 are jointly managed). Refer annexure from page no. 99 for performance of other schemes currently managed by Sankaran Naren.Mr. has been managing this fund since . Total Schemes managed by the Fund Manager ). Refer annexure from Atul Patel Feb 2015 is 14 (13 are jointly managedpage no. 99 for performance of other schemes currently managed by . Atul Patel3. Date of inception: 22-Jan-15.4. Performance of dividend option would be Net of Dividend distribution tax, if any.5. As the Scheme has completed more than 1 year but less than 3 years, the performance details of only since inception and 1 year are provided herein.6. Past performance may or may not be sustained in future and the same may not necessarily provide the basis for comparison with other investment.7. Load is not considered for computation of returns.8. In case, the start/end date of the concerned period is a nonbusiness date (NBD), the NAV of the previous date is considered for computation of returns. The NAV per unit shown in the table is as on the start date of the said period9. NAV is adjusted to the extent of dividend declared for computation of returns.
Scheme
NAV (Rs.) Per Unit (as on October 31,2017 : 12.15)
CAGR (%)
10.00
Nifty 50 Index (Benchmark)
Since inception
CurrentValue of
Investment of Rs. 10000
CAGR (%) Current Value of
Investment of Rs. 10000
1 Year 3 Year 5 Year
CAGR (%) Current Value of
Investment of Rs. 10000
CAGR (%) Current Value of
Investment of Rs. 10000
11.85 - -
Particulars
16.03 11617.68 - - - - 12.21 13766.95
19.47 11964.92 - - - - 6.13 11796.40
Company/Issuer % to % to NAV NAV Derivatives
Company/Issuer % to % to NAV NAV Derivatives
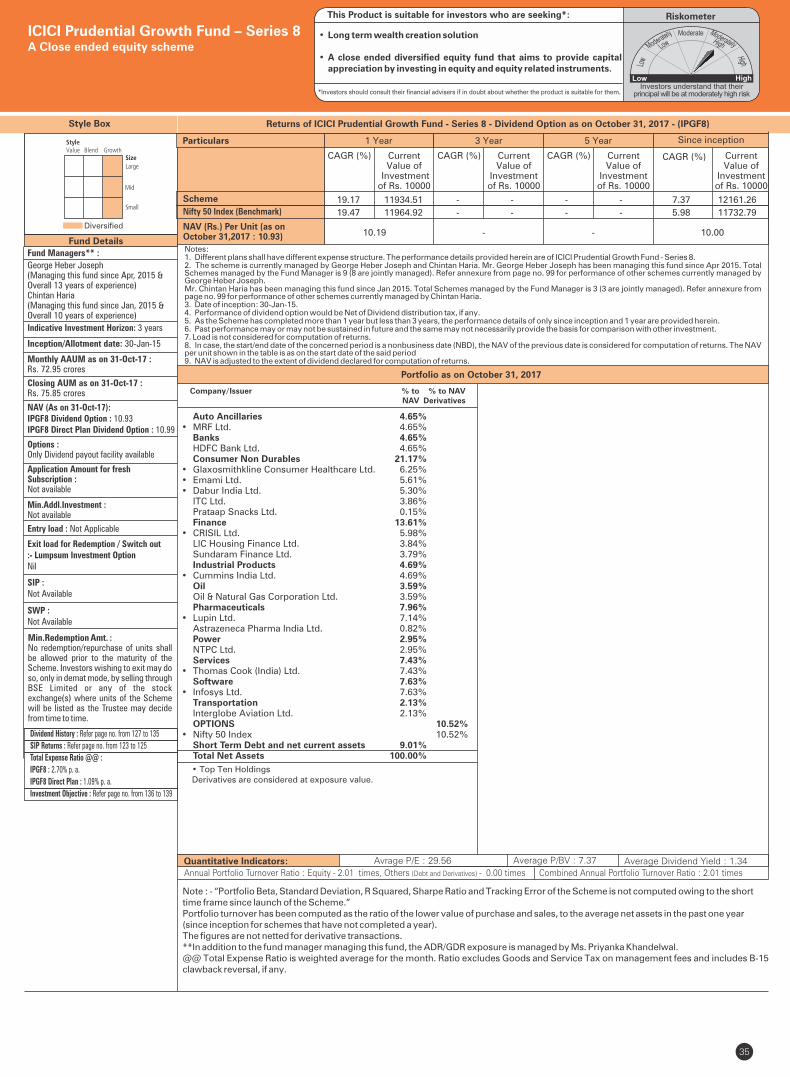
35
Style Box
Note : - “Portfolio Beta, Standard Deviation, R Squared, Sharpe Ratio and Tracking Error of the Scheme is not computed owing to the shorttime frame since launch of the Scheme.”Portfolio turnover has been computed as the ratio of the lower value of purchase and sales, to the average net assets in the past one year(since inception for schemes that have not completed a year). The figures are not netted for derivative transactions.**In addition to the fund manager managing this fund, the ADR/GDR exposure is managed by Ms. Priyanka Khandelwal.@@ Total Expense Ratio is weighted average for the month. Ratio excludes Goods and Service Tax on management fees and includes B-15 clawback reversal, if any.
Fund Managers** :
George Heber Joseph(Managing this fund since Apr, 2015 &Overall 13 years of experience)Chintan Haria(Managing this fund since Jan, 2015 & Overall 10 years of experience)
Indicative Investment Horizon: 3 years
Inception/Allotment date: 30-Jan-15
NAV (As on 31-Oct-17):IPGF8 Dividend Option : 10.93IPGF8 Direct Plan Dividend Option : 10.99
Options :Only Dividend payout facility available
Application Amount for freshSubscription :Not available
Min.Addl.Investment :Not available
Exit load for Redemption / Switch out:- Lumpsum Investment OptionNil
SIP :Not Available
SWP :Not Available
Min.Redemption Amt. :No redemption/repurchase of units shall be allowed prior to the maturity of the Scheme. Investors wishing to exit may do so, only in demat mode, by selling through BSE Limited or any of the stock exchange(s) where units of the Scheme will be listed as the Trustee may decide from time to time.
Fund Details
Diversified
Quantitative Indicators: Avrage P/E : 29.56 Average P/BV : 7.37 Average Dividend Yield : 1.34
• Top Ten HoldingsDerivatives are considered at exposure value.
Monthly AAUM as on 31-Oct-17 : Rs. 72.95 crores
Closing AUM as on 31-Oct-17 : Rs. 75.85 crores
ICICI Prudential Growth Fund – Series 8A Close ended equity scheme
Entry load : Not Applicable
RiskometerThis Product is suitable for investors who are seeking*:
• Long term wealth creation solution
• A close ended diversified equity fund that aims to provide capital appreciation by investing in equity and equity related instruments.
*Investors should consult their financial advisers if in doubt about whether the product is suitable for them.
Auto Ancillaries 4.65% • MRF Ltd. 4.65% Banks 4.65% HDFC Bank Ltd. 4.65% Consumer Non Durables 21.17% • Glaxosmithkline Consumer Healthcare Ltd. 6.25% • Emami Ltd. 5.61% • Dabur India Ltd. 5.30% ITC Ltd. 3.86% Prataap Snacks Ltd. 0.15% Finance 13.61% • CRISIL Ltd. 5.98% LIC Housing Finance Ltd. 3.84% Sundaram Finance Ltd. 3.79% Industrial Products 4.69% • Cummins India Ltd. 4.69% Oil 3.59% Oil & Natural Gas Corporation Ltd. 3.59% Pharmaceuticals 7.96% • Lupin Ltd. 7.14% Astrazeneca Pharma India Ltd. 0.82% Power 2.95% NTPC Ltd. 2.95% Services 7.43% • Thomas Cook (India) Ltd. 7.43% Software 7.63% • Infosys Ltd. 7.63% Transportation 2.13% Interglobe Aviation Ltd. 2.13% OPTIONS 10.52%• Nifty 50 Index 10.52% Short Term Debt and net current assets 9.01% Total Net Assets 100.00%
Company/Issuer % to % to NAV NAV Derivatives
Annual Portfolio Turnover Ratio : Equity - 2.01 times, Others (Debt and Derivatives) - 0.00 times Combined Annual Portfolio Turnover Ratio : 2.01 times
Returns of ICICI Prudential Growth Fund - Series 8 - Dividend Option as on October 31, 2017 - (IPGF8)
Portfolio as on October 31, 2017
Dividend History : Refer page no. from 127 to 135
SIP Returns : Refer page no. from 123 to 125
Total Expense Ratio @@ :
IPGF8 : 2.70% p. a.
IPGF8 Direct Plan : 1.09% p. a.
Investment Objective : Refer page no. from 136 to 139
Notes:1. Different plans shall have different expense structure. The performance details provided herein are of ICICI Prudential Growth Fund - Series 8.2. The scheme is currently managed by George Heber Joseph and Chintan Haria. Mr. George Heber Joseph has been managing this fund since Apr 2015. Total Schemes managed by the Fund Manager Refer annexure from page no. 99 for performance of other schemes currently managed by is 9 (8 are jointly managed).George Heber Joseph.Mr. Chintan Haria has been managing this fund since . Total Schemes managed by the Fund Manager ). Refer annexure from Jan 2015 is 3 (3 are jointly managedpage no. 99 for performance of other schemes currently managed by Chintan Haria. 3. Date of inception: 30-Jan-15.4. Performance of dividend option would be Net of Dividend distribution tax, if any.5. As the Scheme has completed more than 1 year but less than 3 years, the performance details of only since inception and 1 year are provided herein.6. Past performance may or may not be sustained in future and the same may not necessarily provide the basis for comparison with other investment.7. Load is not considered for computation of returns.8. In case, the start/end date of the concerned period is a nonbusiness date (NBD), the NAV of the previous date is considered for computation of returns. The NAV per unit shown in the table is as on the start date of the said period9. NAV is adjusted to the extent of dividend declared for computation of returns.
Scheme
NAV (Rs.) Per Unit (as on October 31,2017 : 10.93)
CAGR (%)
10.00
Nifty 50 Index (Benchmark)
Since inception
CurrentValue of
Investment of Rs. 10000
CAGR (%) Current Value of
Investment of Rs. 10000
1 Year 3 Year 5 Year
CAGR (%) Current Value of
Investment of Rs. 10000
CAGR (%) Current Value of
Investment of Rs. 10000
10.19 - -
Particulars
19.17 11934.51 - - - - 7.37 12161.26
19.47 11964.92 - - - - 5.98 11732.79
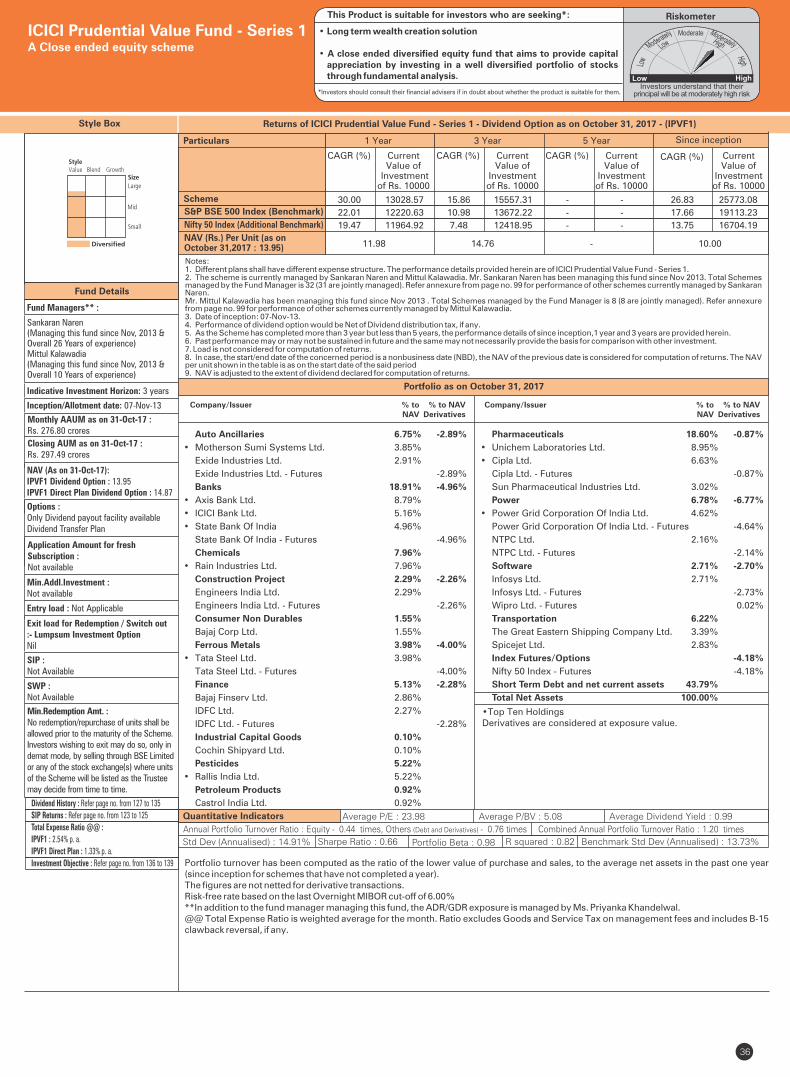
�
Quantitative Indicators
36
Style Box
Fund Details
Portfolio turnover has been computed as the ratio of the lower value of purchase and sales, to the average net assets in the past one year (since inception for schemes that have not completed a year). The figures are not netted for derivative transactions.Risk-free rate based on the last Overnight MIBOR cut-off of 6.00%**In addition to the fund manager managing this fund, the ADR/GDR exposure is managed by Ms. Priyanka Khandelwal.@@ Total Expense Ratio is weighted average for the month. Ratio excludes Goods and Service Tax on management fees and includes B-15 clawback reversal, if any.
Fund Managers** :
Sankaran Naren (Managing this fund since Nov, 2013 & Overall 26 Years of experience)Mittul Kalawadia (Managing this fund since Nov, 2013 & Overall 10 Years of experience)
Indicative Investment Horizon: 3 years
Inception/Allotment date: 07-Nov-13
NAV (As on 31-Oct-17):IPVF1 Dividend Option : 13.95IPVF1 Direct Plan Dividend Option : 14.87
Options :Only Dividend payout facility availableDividend Transfer Plan
Application Amount for freshSubscription :Not available
Min.Addl.Investment :Not available
Exit load for Redemption / Switch out:- Lumpsum Investment OptionNil
SIP :Not Available
SWP :Not Available
Min.Redemption Amt. :No redemption/repurchase of units shall beallowed prior to the maturity of the Scheme.Investors wishing to exit may do so, only indemat mode, by selling through BSE Limitedor any of the stock exchange(s) where unitsof the Scheme will be listed as the Trusteemay decide from time to time.
Average P/E : 23.98 Average P/BV : 5.08 Average Dividend Yield : 0.99
Monthly AAUM as on 31-Oct-17 : Rs. 276.80 crores
Closing AUM as on 31-Oct-17 : Rs. 297.49 crores
Returns of ICICI Prudential Value Fund - Series 1 - Dividend Option as on October 31, 2017 - (IPVF1)
Portfolio as on October 31, 2017
• Top Ten HoldingsDerivatives are considered at exposure value.
ICICI Prudential Value Fund - Series 1A Close ended equity scheme
Entry load : Not Applicable
RiskometerThis Product is suitable for investors who are seeking*:
• Long term wealth creation solution
• A close ended diversified equity fund that aims to provide capital appreciation by investing in a well diversified portfolio of stocks through fundamental analysis.
*Investors should consult their financial advisers if in doubt about whether the product is suitable for them.
Annual Portfolio Turnover Ratio : Equity - 0.44 times, Others (Debt and Derivatives) - 0.76 times Combined Annual Portfolio Turnover Ratio : 1.20 times
Dividend History : Refer page no. from 127 to 135
SIP Returns : Refer page no. from 123 to 125
Total Expense Ratio @@ :
IPVF1 : 2.54% p. a.
IPVF1 Direct Plan : 1.33% p. a.
Investment Objective : Refer page no. from 136 to 139
Std Dev (Annualised) : 14.91% Sharpe Ratio : 0.66 Portfolio Beta : 0.98 R squared : 0.82 Benchmark Std Dev (Annualised) : 13.73%
Notes:1. Different plans shall have different expense structure. The performance details provided herein are of ICICI Prudential Value Fund - Series 1.2. The scheme is currently managed by Sankaran Naren and Mittul Kalawadia. Mr. Sankaran Naren has been managing this fund since Nov 2013. Total Schemes managed by the Fund Manager . Refer annexure from page no. 99 for performance of other schemes currently managed by Sankaran is 32 (31 are jointly managed) Naren.Mr. Mittul Kalawadia has been managing this fund since Nov 2013 . Total Schemes managed by the Fund Manager Refer annexure is 8 (8 are jointly managed).from page no. 99 for performance of other schemes currently managed by Mittul Kalawadia .3. Date of inception: 07-Nov-13.4. Performance of dividend option would be Net of Dividend distribution tax, if any.5. As the Scheme has completed more than 3 year but less than 5 years, the performance details of since inception,1 year and 3 years are provided herein.6. Past performance may or may not be sustained in future and the same may not necessarily provide the basis for comparison with other investment.7. Load is not considered for computation of returns.8. In case, the start/end date of the concerned period is a nonbusiness date (NBD), the NAV of the previous date is considered for computation of returns. The NAV per unit shown in the table is as on the start date of the said period9. NAV is adjusted to the extent of dividend declared for computation of returns.
Scheme
Nifty 50 Index (Additional Benchmark)
NAV (Rs.) Per Unit (as on October 31,2017 : 13.95)
CAGR (%)
10.00
S&P BSE 500 Index (Benchmark)
Since inception
CurrentValue of
Investment of Rs. 10000
CAGR (%) Current Value of
Investment of Rs. 10000
1 Year 3 Year 5 Year
CAGR (%) Current Value of
Investment of Rs. 10000
CAGR (%) Current Value of
Investment of Rs. 10000
11.98 14.76 -
Particulars
30.00 13028.57 15.86 15557.31 - - 26.83 25773.08
22.01 12220.63 10.98 13672.22 - - 17.66 19113.23
19.47 11964.92 7.48 12418.95 - - 13.75 16704.19
Auto Ancillaries 6.75% -2.89%
• Motherson Sumi Systems Ltd. 3.85%
Exide Industries Ltd. 2.91%
Exide Industries Ltd. - Futures -2.89%
Banks 18.91% -4.96%
• Axis Bank Ltd. 8.79%
• ICICI Bank Ltd. 5.16%
• State Bank Of India 4.96%
State Bank Of India - Futures -4.96%
Chemicals 7.96%
• Rain Industries Ltd. 7.96%
Construction Project 2.29% -2.26%
Engineers India Ltd. 2.29%
Engineers India Ltd. - Futures -2.26%
Consumer Non Durables 1.55%
Bajaj Corp Ltd. 1.55%
Ferrous Metals 3.98% -4.00%
• Tata Steel Ltd. 3.98%
Tata Steel Ltd. - Futures -4.00%
Finance 5.13% -2.28%
Bajaj Finserv Ltd. 2.86%
IDFC Ltd. 2.27%
IDFC Ltd. - Futures -2.28%
Industrial Capital Goods 0.10%
Cochin Shipyard Ltd. 0.10%
Pesticides 5.22%
• Rallis India Ltd. 5.22%
Petroleum Products 0.92%
Castrol India Ltd. 0.92%
Pharmaceuticals 18.60% -0.87%
• Unichem Laboratories Ltd. 8.95%
• Cipla Ltd. 6.63%
Cipla Ltd. - Futures -0.87%
Sun Pharmaceutical Industries Ltd. 3.02%
Power 6.78% -6.77%
• Power Grid Corporation Of India Ltd. 4.62%
Power Grid Corporation Of India Ltd. - Futures -4.64%
NTPC Ltd. 2.16%
NTPC Ltd. - Futures -2.14%
Software 2.71% -2.70%
Infosys Ltd. 2.71%
Infosys Ltd. - Futures -2.73%
Wipro Ltd. - Futures 0.02%
Transportation 6.22%
The Great Eastern Shipping Company Ltd. 3.39%
Spicejet Ltd. 2.83%
Index Futures/Options -4.18%
Nifty 50 Index - Futures -4.18%
Short Term Debt and net current assets 43.79%
Total Net Assets 100.00%
Company/Issuer % to % to NAV NAV Derivatives
Company/Issuer % to % to NAV NAV Derivatives
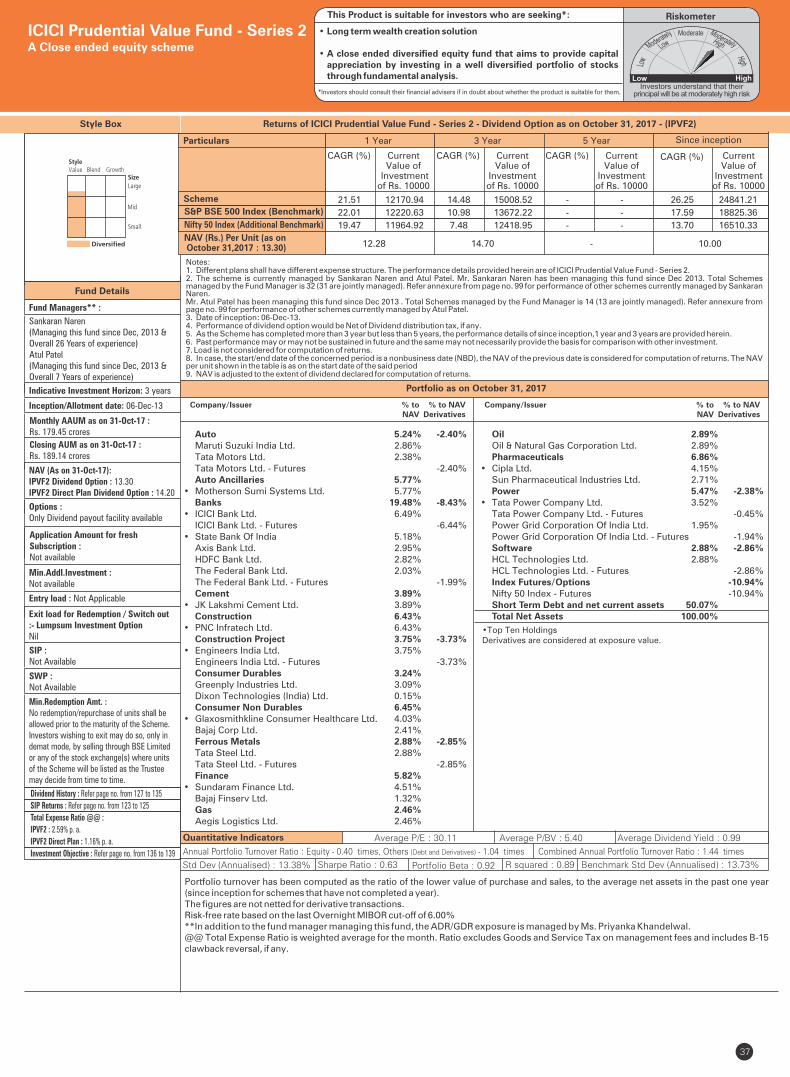
�
Style Box
Fund Details
Fund Managers** :
Indicative Investment Horizon: 3 years
Inception/Allotment date: 06-Dec-13
NAV (As on 31-Oct-17):IPVF2 Dividend Option : 13.30IPVF2 Direct Plan Dividend Option : 14.20
Options : Only Dividend payout facility available
Application Amount for fresh Subscription : Not available
Min.Addl.Investment : Not available
Entry load : Not Applicable
Exit load for Redemption / Switch out :- Lumpsum Investment OptionNil
SIP : Not Available
SWP : Not Available
Min.Redemption Amt. : No redemption/repurchase of units shall be allowed prior to the maturity of the Scheme.Investors wishing to exit may do so, only in demat mode, by selling through BSE Limited or any of the stock exchange(s) where units of the Scheme will be listed as the Trustee may decide from time to time.
Sankaran Naren (Managing this fund since Dec, 2013 & Overall 26 Years of experience)Atul Patel(Managing this fund since Dec, 2013 & Overall 7 Years of experience)
37
Portfolio turnover has been computed as the ratio of the lower value of purchase and sales, to the average net assets in the past one year (since inception for schemes that have not completed a year). The figures are not netted for derivative transactions.Risk-free rate based on the last Overnight MIBOR cut-off of 6.00%**In addition to the fund manager managing this fund, the ADR/GDR exposure is managed by Ms. Priyanka Khandelwal.@@ Total Expense Ratio is weighted average for the month. Ratio excludes Goods and Service Tax on management fees and includes B-15 clawback reversal, if any.
Monthly AAUM as on 31-Oct-17 : Rs. 179.45 crores
Closing AUM as on 31-Oct-17 :Rs. 189.14 crores
Quantitative Indicators Average P/E : 30.11 Average P/BV : 5.40 Average Dividend Yield : 0.99
Returns of ICICI Prudential Value Fund - Series 2 - Dividend Option as on October 31, 2017 - (IPVF2)
Portfolio as on October 31, 2017
• Top Ten HoldingsDerivatives are considered at exposure value.
ICICI Prudential Value Fund - Series 2A Close ended equity scheme
RiskometerThis Product is suitable for investors who are seeking*:
• Long term wealth creation solution
• A close ended diversified equity fund that aims to provide capital appreciation by investing in a well diversified portfolio of stocks through fundamental analysis.
*Investors should consult their financial advisers if in doubt about whether the product is suitable for them.
Annual Portfolio Turnover Ratio : Equity - 0.40 times, Others (Debt and Derivatives) - 1.04 times Combined Annual Portfolio Turnover Ratio : 1.44 times
Dividend History : Refer page no. from 127 to 135
SIP Returns : Refer page no. from 123 to 125
Total Expense Ratio @@ :
IPVF2 : 2.59% p. a.
IPVF2 Direct Plan : 1.16% p. a.
Investment Objective : Refer page no. from 136 to 139Std Dev (Annualised) : 13.38% Sharpe Ratio : 0.63 Portfolio Beta : 0.92 R squared : 0.89 Benchmark Std Dev (Annualised) : 13.73%
Notes:1. Different plans shall have different expense structure. The performance details provided herein are of ICICI Prudential Value Fund - Series 2.2. The scheme is currently managed by Sankaran Naren and Atul Patel. Mr. Sankaran Naren has been managing this fund since Dec 2013. Total Schemes managed by the Fund Manager . Refer annexure from page no. 99 for performance of other schemes currently managed by Sankaran is 32 (31 are jointly managed) Naren.Mr. Atul Patel has been managing this fund since Dec 2013 . Total Schemes managed by the Fund Manager is 14 (13 are jointly managed). Refer annexure from page no. 99 for performance of other schemes currently managed by Atul Patel .3. Date of inception: 06-Dec-13.4. Performance of dividend option would be Net of Dividend distribution tax, if any.5. As the Scheme has completed more than 3 year but less than 5 years, the performance details of since inception,1 year and 3 years are provided herein.6. Past performance may or may not be sustained in future and the same may not necessarily provide the basis for comparison with other investment.7. Load is not considered for computation of returns.8. In case, the start/end date of the concerned period is a nonbusiness date (NBD), the NAV of the previous date is considered for computation of returns. The NAV per unit shown in the table is as on the start date of the said period9. NAV is adjusted to the extent of dividend declared for computation of returns.
Scheme
Nifty 50 Index (Additional Benchmark)
NAV (Rs.) Per Unit (as on October 31,2017 : 13.30)
CAGR (%)
10.00
S&P BSE 500 Index (Benchmark)
Since inception
CurrentValue of
Investment of Rs. 10000
CAGR (%) Current Value of
Investment of Rs. 10000
1 Year 3 Year 5 Year
CAGR (%) Current Value of
Investment of Rs. 10000
CAGR (%) Current Value of
Investment of Rs. 10000
12.28 14.70 -
Particulars
21.51 12170.94 14.48 15008.52 - - 26.25 24841.21
22.01 12220.63 10.98 13672.22 - - 17.59 18825.36
19.47 11964.92 7.48 12418.95 - - 13.70 16510.33
Auto 5.24% -2.40% Maruti Suzuki India Ltd. 2.86% Tata Motors Ltd. 2.38% Tata Motors Ltd. - Futures -2.40% Auto Ancillaries 5.77% • Motherson Sumi Systems Ltd. 5.77% Banks 19.48% -8.43%• ICICI Bank Ltd. 6.49% ICICI Bank Ltd. - Futures -6.44%• State Bank Of India 5.18% Axis Bank Ltd. 2.95% HDFC Bank Ltd. 2.82% The Federal Bank Ltd. 2.03% The Federal Bank Ltd. - Futures -1.99% Cement 3.89% • JK Lakshmi Cement Ltd. 3.89% Construction 6.43% • PNC Infratech Ltd. 6.43% Construction Project 3.75% -3.73%• Engineers India Ltd. 3.75% Engineers India Ltd. - Futures -3.73% Consumer Durables 3.24% Greenply Industries Ltd. 3.09% Dixon Technologies (India) Ltd. 0.15% Consumer Non Durables 6.45% • Glaxosmithkline Consumer Healthcare Ltd. 4.03% Bajaj Corp Ltd. 2.41% Ferrous Metals 2.88% -2.85% Tata Steel Ltd. 2.88% Tata Steel Ltd. - Futures -2.85% Finance 5.82% • Sundaram Finance Ltd. 4.51% Bajaj Finserv Ltd. 1.32% Gas 2.46% Aegis Logistics Ltd. 2.46%
Oil 2.89% Oil & Natural Gas Corporation Ltd. 2.89% Pharmaceuticals 6.86% • Cipla Ltd. 4.15% Sun Pharmaceutical Industries Ltd. 2.71% Power 5.47% -2.38%• Tata Power Company Ltd. 3.52% Tata Power Company Ltd. - Futures -0.45% Power Grid Corporation Of India Ltd. 1.95% Power Grid Corporation Of India Ltd. - Futures -1.94% Software 2.88% -2.86% HCL Technologies Ltd. 2.88% HCL Technologies Ltd. - Futures -2.86% Index Futures/Options -10.94% Nifty 50 Index - Futures -10.94% Short Term Debt and net current assets 50.07% Total Net Assets 100.00%
Company/Issuer % to % to NAV NAV Derivatives
Company/Issuer % to % to NAV NAV Derivatives
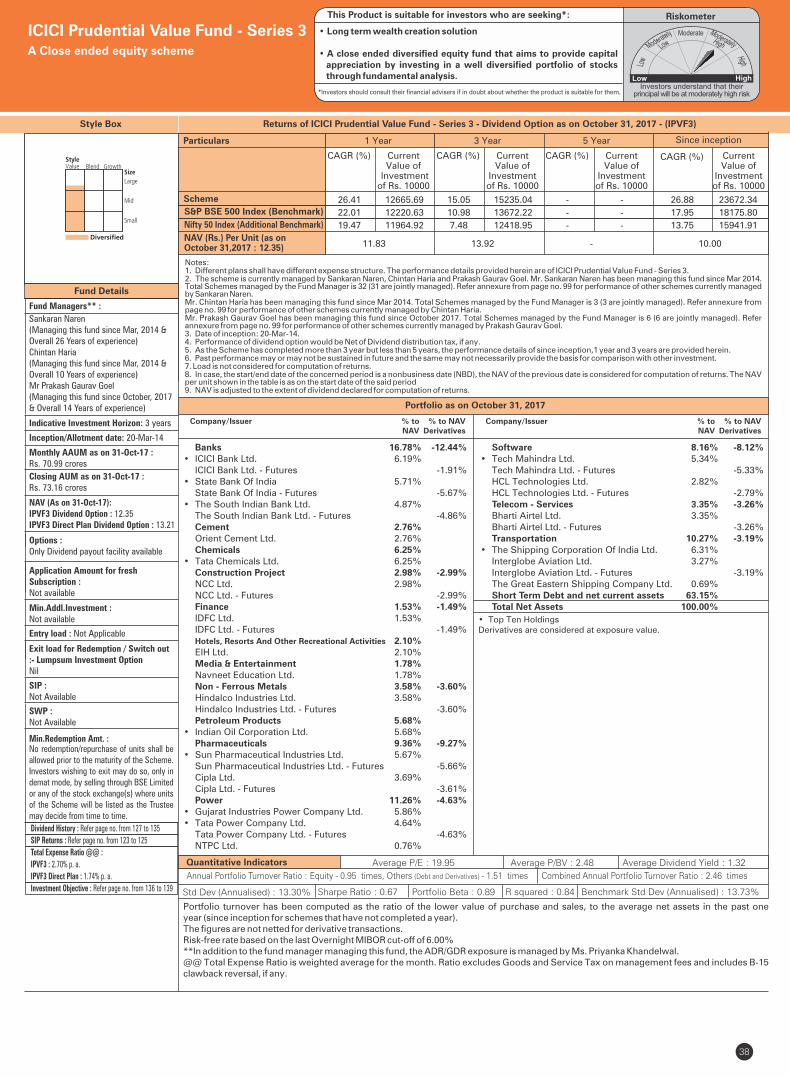
Style Box
Fund Details
• Top Ten HoldingsDerivatives are considered at exposure value.
38
Fund Managers** :
Sankaran Naren (Managing this fund since Mar, 2014 & Overall 26 Years of experience)Chintan Haria (Managing this fund since Mar, 2014 & Overall 10 Years of experience)
Mr Prakash Gaurav Goel(Managing this fund since October, 2017 & Overall 14 Years of experience)
Indicative Investment Horizon: 3 years
Inception/Allotment date: 20-Mar-14
NAV (As on 31-Oct-17):IPVF3 Dividend Option : 12.35IPVF3 Direct Plan Dividend Option : 13.21
Options :Only Dividend payout facility available
Application Amount for freshSubscription :Not available
Min.Addl.Investment :Not available
Exit load for Redemption / Switch out:- Lumpsum Investment OptionNil
SIP :Not Available
SWP :Not Available
No redemption/repurchase of units shall beallowed prior to the maturity of the Scheme.Investors wishing to exit may do so, only indemat mode, by selling through BSE Limitedor any of the stock exchange(s) where unitsof the Scheme will be listed as the Trusteemay decide from time to time.
Min.Redemption Amt. :
Portfolio turnover has been computed as the ratio of the lower value of purchase and sales, to the average net assets in the past one year (since inception for schemes that have not completed a year). The figures are not netted for derivative transactions.Risk-free rate based on the last Overnight MIBOR cut-off of 6.00%**In addition to the fund manager managing this fund, the ADR/GDR exposure is managed by Ms. Priyanka Khandelwal.@@ Total Expense Ratio is weighted average for the month. Ratio excludes Goods and Service Tax on management fees and includes B-15 clawback reversal, if any.
Quantitative Indicators Average P/E : 19.95 Average P/BV : 2.48 Average Dividend Yield : 1.32
Monthly AAUM as on 31-Oct-17 : Rs. 70.99 crores
Closing AUM as on 31-Oct-17 : Rs. 73.16 crores
Returns of ICICI Prudential Value Fund - Series 3 - Dividend Option as on October 31, 2017 - (IPVF3)
Portfolio as on October 31, 2017
ICICI Prudential Value Fund - Series 3A Close ended equity scheme
Entry load : Not Applicable
RiskometerThis Product is suitable for investors who are seeking*:
• Long term wealth creation solution
• A close ended diversified equity fund that aims to provide capital appreciation by investing in a well diversified portfolio of stocks through fundamental analysis.
*Investors should consult their financial advisers if in doubt about whether the product is suitable for them.
Annual Portfolio Turnover Ratio : Equity - 0.95 times, Others (Debt and Derivatives) - 1.51 times Combined Annual Portfolio Turnover Ratio : 2.46 times
Dividend History : Refer page no. from 127 to 135
SIP Returns : Refer page no. from 123 to 125
Total Expense Ratio @@ :
IPVF3 : 2.70% p. a.
IPVF3 Direct Plan : 1.74% p. a.
Investment Objective : Refer page no. from 136 to 139
Notes:1. Different plans shall have different expense structure. The performance details provided herein are of ICICI Prudential Value Fund - Series 3.2. The scheme is currently managed by Sankaran Naren, and Prakash Gaurav Goel. Mr. Sankaran Naren has been managing this fund since . Chintan Haria Mar 2014Total Schemes managed by the Fund Manager . Refer annexure from page no. 99 for performance of other schemes currently managed is 32 (31 are jointly managed)bySankaran Naren. Mr. Chintan Haria has been managing this fund since . Total Schemes managed by the Fund Manager ). Refer annexure from Mar 2014 is 3 (3 are jointly managedpage no. 99 for performance of other schemes currently managed by Chintan Haria.Mr. Prakash Gaurav Goel has been managing this fund since October 2017. Total Schemes managed by the Fund Manager . Refer is 6 (6 are jointly managed)annexure from page no. 99 for performance of other schemes currently managed by Prakash Gaurav Goel. 3. Date of inception: 20-Mar-14.4. Performance of dividend option would be Net of Dividend distribution tax, if any.5. As the Scheme has completed more than 3 year but less than 5 years, the performance details of since inception,1 year and 3 years are provided herein.6. Past performance may or may not be sustained in future and the same may not necessarily provide the basis for comparison with other investment.7. Load is not considered for computation of returns.8. In case, the start/end date of the concerned period is a nonbusiness date (NBD), the NAV of the previous date is considered for computation of returns. The NAV per unit shown in the table is as on the start date of the said period9. NAV is adjusted to the extent of dividend declared for computation of returns.
Scheme
Nifty 50 Index (Additional Benchmark)
NAV (Rs.) Per Unit (as on October 31,2017 : 12.35)
CAGR (%)
10.00
S&P BSE 500 Index (Benchmark)
Since inception
CurrentValue of
Investment of Rs. 10000
CAGR (%) Current Value of
Investment of Rs. 10000
1 Year 3 Year 5 Year
CAGR (%) Current Value of
Investment of Rs. 10000
CAGR (%) Current Value of
Investment of Rs. 10000
11.83 13.92 -
Particulars
26.41 12665.69 15.05 15235.04 - - 26.88 23672.34
22.01 12220.63 10.98 13672.22 - - 17.95 18175.80
19.47 11964.92 7.48 12418.95 - - 13.75 15941.91
Std Dev (Annualised) : 13.30% Sharpe Ratio : 0.67 Portfolio Beta : 0.89 R squared : 0.84 Benchmark Std Dev (Annualised) : 13.73%
Company/Issuer % to % to NAV NAV Derivatives
Company/Issuer % to % to NAV NAV Derivatives
Banks 16.78% -12.44%• ICICI Bank Ltd. 6.19% ICICI Bank Ltd. - Futures -1.91%• State Bank Of India 5.71% State Bank Of India - Futures -5.67%• The South Indian Bank Ltd. 4.87% The South Indian Bank Ltd. - Futures -4.86% Cement 2.76% Orient Cement Ltd. 2.76% Chemicals 6.25% • Tata Chemicals Ltd. 6.25% Construction Project 2.98% -2.99% NCC Ltd. 2.98% NCC Ltd. - Futures -2.99% Finance 1.53% -1.49% IDFC Ltd. 1.53% IDFC Ltd. - Futures -1.49% Hotels, Resorts And Other Recreational Activities 2.10% EIH Ltd. 2.10% Media & Entertainment 1.78% Navneet Education Ltd. 1.78% Non - Ferrous Metals 3.58% -3.60% Hindalco Industries Ltd. 3.58% Hindalco Industries Ltd. - Futures -3.60% Petroleum Products 5.68% • Indian Oil Corporation Ltd. 5.68% Pharmaceuticals 9.36% -9.27%• Sun Pharmaceutical Industries Ltd. 5.67% Sun Pharmaceutical Industries Ltd. - Futures -5.66% Cipla Ltd. 3.69% Cipla Ltd. - Futures -3.61% Power 11.26% -4.63%• Gujarat Industries Power Company Ltd. 5.86% • Tata Power Company Ltd. 4.64% Tata Power Company Ltd. - Futures -4.63% NTPC Ltd. 0.76%
Software 8.16% -8.12%• Tech Mahindra Ltd. 5.34% Tech Mahindra Ltd. - Futures -5.33% HCL Technologies Ltd. 2.82% HCL Technologies Ltd. - Futures -2.79% Telecom - Services 3.35% -3.26% Bharti Airtel Ltd. 3.35% Bharti Airtel Ltd. - Futures -3.26% Transportation 10.27% -3.19%• The Shipping Corporation Of India Ltd. 6.31% Interglobe Aviation Ltd. 3.27% Interglobe Aviation Ltd. - Futures -3.19% The Great Eastern Shipping Company Ltd. 0.69% Short Term Debt and net current assets 63.15% Total Net Assets 100.00%
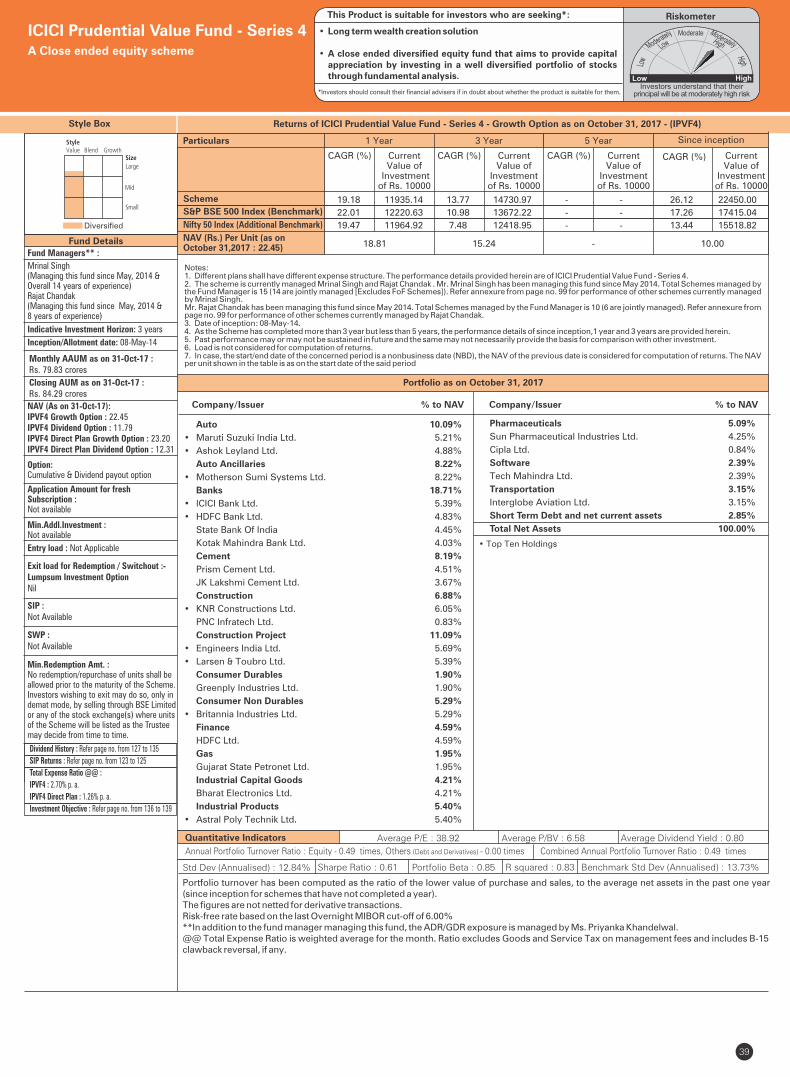
Style Box
Portfolio turnover has been computed as the ratio of the lower value of purchase and sales, to the average net assets in the past one year (since inception for schemes that have not completed a year). The figures are not netted for derivative transactions. Risk-free rate based on the last Overnight MIBOR cut-off of 6.00%**In addition to the fund manager managing this fund, the ADR/GDR exposure is managed by Ms. Priyanka Khandelwal.@@ Total Expense Ratio is weighted average for the month. Ratio excludes Goods and Service Tax on management fees and includes B-15 clawback reversal, if any.
Fund Managers** :
Mrinal Singh (Managing this fund since May, 2014 & Overall 14 years of experience)Rajat Chandak (Managing this fund since May, 2014 & 8 years of experience)
Indicative Investment Horizon: 3 years
Inception/Allotment date: 08-May-14
SWP :Not Available
Min.Redemption Amt. :No redemption/repurchase of units shall be allowed prior to the maturity of the Scheme.Investors wishing to exit may do so, only in demat mode, by selling through BSE Limited or any of the stock exchange(s) where unitsof the Scheme will be listed as the Trustee may decide from time to time.
SIP :Not Available
NAV (As on 31-Oct-17):IPVF4 Growth Option : 22.45IPVF4 Dividend Option : 11.79IPVF4 Direct Plan Growth Option : 23.20IPVF4 Direct Plan Dividend Option : 12.31
Option:Cumulative & Dividend payout option
Application Amount for freshSubscription :Not available
Min.Addl.Investment :Not available
Exit load for Redemption / Switchout :- Lumpsum Investment OptionNil
39
Fund Details
Diversified
Quantitative Indicators Average P/E : 38.92 Average P/BV : 6.58 Average Dividend Yield : 0.80
Monthly AAUM as on 31-Oct-17 : Rs. 79.83 crores
Closing AUM as on 31-Oct-17 :Rs. 84.29 crores
• Top Ten Holdings
ICICI Prudential Value Fund - Series 4A Close ended equity scheme
Returns of ICICI Prudential Value Fund - Series 4 - Growth Option as on October 31, 2017 - (IPVF4)
Portfolio as on October 31, 2017
Entry load : Not Applicable
RiskometerThis Product is suitable for investors who are seeking*:
• Long term wealth creation solution
• A close ended diversified equity fund that aims to provide capital appreciation by investing in a well diversified portfolio of stocks through fundamental analysis.
*Investors should consult their financial advisers if in doubt about whether the product is suitable for them.
Auto 10.09%
• Maruti Suzuki India Ltd. 5.21%
• Ashok Leyland Ltd. 4.88%
Auto Ancillaries 8.22%
• Motherson Sumi Systems Ltd. 8.22%
Banks 18.71%
• ICICI Bank Ltd. 5.39%
• HDFC Bank Ltd. 4.83%
State Bank Of India 4.45%
Kotak Mahindra Bank Ltd. 4.03%
Cement 8.19%
Prism Cement Ltd. 4.51%
JK Lakshmi Cement Ltd. 3.67%
Construction 6.88%
• KNR Constructions Ltd. 6.05%
PNC Infratech Ltd. 0.83%
Construction Project 11.09%
• Engineers India Ltd. 5.69%
• Larsen & Toubro Ltd. 5.39%
Consumer Durables 1.90%
Greenply Industries Ltd. 1.90%
Consumer Non Durables 5.29%
• Britannia Industries Ltd. 5.29%
Finance 4.59%
HDFC Ltd. 4.59%
Gas 1.95%
Gujarat State Petronet Ltd. 1.95%
Industrial Capital Goods 4.21%
Bharat Electronics Ltd. 4.21%
Industrial Products 5.40%
• Astral Poly Technik Ltd. 5.40%
Pharmaceuticals 5.09%
Sun Pharmaceutical Industries Ltd. 4.25%
Cipla Ltd. 0.84%
Software 2.39%
Tech Mahindra Ltd. 2.39%
Transportation 3.15%
Interglobe Aviation Ltd. 3.15%
Short Term Debt and net current assets 2.85%
Total Net Assets 100.00%
Company/Issuer % to NAV Company/Issuer % to NAV
Annual Portfolio Turnover Ratio : Equity - 0.49 times, Others (Debt and Derivatives) - 0.00 times Combined Annual Portfolio Turnover Ratio : 0.49 times
Dividend History : Refer page no. from 127 to 135
SIP Returns : Refer page no. from 123 to 125
Total Expense Ratio @@ :
IPVF4 : 2.70% p. a.
IPVF4 Direct Plan : 1.26% p. a.
Investment Objective : Refer page no. from 136 to 139
Notes:1. Different plans shall have different expense structure. The performance details provided herein are of ICICI Prudential Value Fund - Series 4.2. The scheme is currently managed Mrinal Singh . Mr. Mrinal Singh has been managing this fund since . Total Schemes managed by and Rajat Chandak May 2014the Fund Manager . Refer annexure from page no. 99 for performance of other schemes currently managed is 15 (14 are jointly managed [Excludes FoF Schemes])by Mrinal Singh.Mr. has been managing this fund since . Total Schemes managed by the Fund Manager . Refer annexure from Rajat Chandak May 2014 is 10 (6 are jointly managed)page no. 99 for performance of other schemes currently managed by . Rajat Chandak3. Date of inception: 08-May-14.4. As the Scheme has completed more than 3 year but less than 5 years, the performance details of since inception,1 year and 3 years are provided herein.5. Past performance may or may not be sustained in future and the same may not necessarily provide the basis for comparison with other investment.6. Load is not considered for computation of returns.7. In case, the start/end date of the concerned period is a nonbusiness date (NBD), the NAV of the previous date is considered for computation of returns. The NAV per unit shown in the table is as on the start date of the said period
Scheme
Nifty 50 Index (Additional Benchmark)
NAV (Rs.) Per Unit (as on October 31,2017 : 22.45)
CAGR (%)
10.00
S&P BSE 500 Index (Benchmark)
Since inception
CurrentValue of
Investment of Rs. 10000
CAGR (%) Current Value of
Investment of Rs. 10000
1 Year 3 Year 5 Year
CAGR (%) Current Value of
Investment of Rs. 10000
CAGR (%) Current Value of
Investment of Rs. 10000
18.81 15.24 -
Particulars
19.18 11935.14 13.77 14730.97 - - 26.12 22450.00
22.01 12220.63 10.98 13672.22 - - 17.26 17415.04
19.47 11964.92 7.48 12418.95 - - 13.44 15518.82
Std Dev (Annualised) : 12.84% Sharpe Ratio : 0.61 Portfolio Beta : 0.85 R squared : 0.83 Benchmark Std Dev (Annualised) : 13.73%
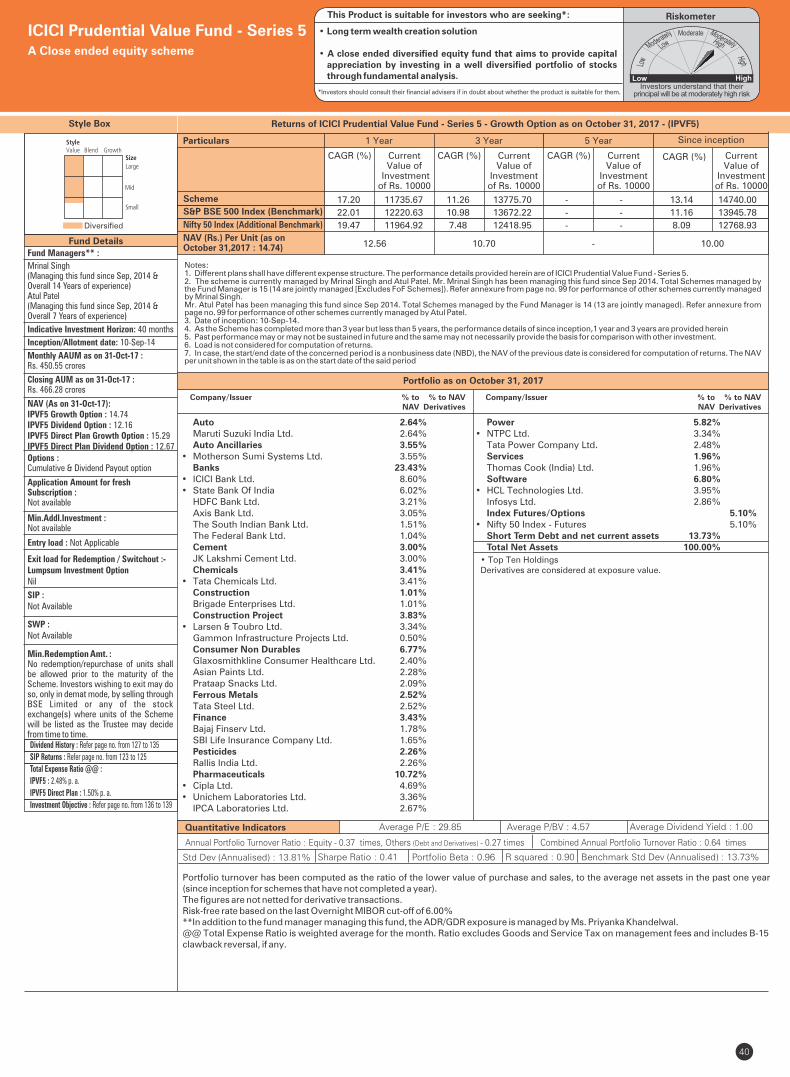
Style Box
Portfolio turnover has been computed as the ratio of the lower value of purchase and sales, to the average net assets in the past one year (since inception for schemes that have not completed a year). The figures are not netted for derivative transactions.Risk-free rate based on the last Overnight MIBOR cut-off of 6.00%**In addition to the fund manager managing this fund, the ADR/GDR exposure is managed by Ms. Priyanka Khandelwal.@@ Total Expense Ratio is weighted average for the month. Ratio excludes Goods and Service Tax on management fees and includes B-15 clawback reversal, if any.
Fund Managers** :
Mrinal Singh(Managing this fund since Sep, 2014 &Overall 14 Years of experience)Atul Patel(Managing this fund since Sep, 2014 &Overall 7 Years of experience)
Indicative Investment Horizon: 40 months
Inception/Allotment date: 10-Sep-14
SWP :Not Available
Min.Redemption Amt. :No redemption/repurchase of units shall be allowed prior to the maturity of the Scheme. Investors wishing to exit may do so, only in demat mode, by selling through BSE Limited or any of the stock exchange(s) where units of the Scheme will be listed as the Trustee may decide from time to time.
SIP :Not Available
NAV (As on 31-Oct-17):IPVF5 Growth Option : 14.74IPVF5 Dividend Option : 12.16IPVF5 Direct Plan Growth Option : 15.29IPVF5 Direct Plan Dividend Option : 12.67Options :Cumulative & Dividend Payout option
Application Amount for freshSubscription :Not available
Min.Addl.Investment :Not available
Exit load for Redemption / Switchout :- Lumpsum Investment OptionNil
40
Fund Details
Diversified
Quantitative Indicators Average P/E : 29.85 Average P/BV : 4.57 Average Dividend Yield : 1.00
• Top Ten HoldingsDerivatives are considered at exposure value.
Monthly AAUM as on 31-Oct-17 : Rs. 450.55 crores
Closing AUM as on 31-Oct-17 : Rs. 466.28 crores
ICICI Prudential Value Fund - Series 5A Close ended equity scheme
Portfolio as on October 31, 2017
Returns of ICICI Prudential Value Fund - Series 5 - Growth Option as on October 31, 2017 - (IPVF5)
Entry load : Not Applicable
RiskometerThis Product is suitable for investors who are seeking*:
• Long term wealth creation solution
• A close ended diversified equity fund that aims to provide capital appreciation by investing in a well diversified portfolio of stocks through fundamental analysis.
*Investors should consult their financial advisers if in doubt about whether the product is suitable for them.
Annual Portfolio Turnover Ratio : Equity - 0.37 times, Others (Debt and Derivatives) - 0.27 times Combined Annual Portfolio Turnover Ratio : 0.64 times
Dividend History : Refer page no. from 127 to 135
SIP Returns : Refer page no. from 123 to 125
Total Expense Ratio @@ :
IPVF5 : 2.48% p. a.
IPVF5 Direct Plan : 1.50% p. a.
Investment Objective : Refer page no. from 136 to 139
Notes:1. Different plans shall have different expense structure. The performance details provided herein are of ICICI Prudential Value Fund - Series 5.2. The scheme is currently managed by and . Mr. Mrinal Singh has been managing this fund since . Total Schemes managed by Mrinal Singh Atul Patel Sep 2014the Fund Manager . Refer annexure from page no. 99 for performance of other schemes currently managed is 15 (14 are jointly managed [Excludes FoF Schemes])by Mrinal Singh.Mr. has been managing this fund since Sep 2014. Total Schemes managed by the Fund Manager ). Refer annexure from Atul Patel is 14 (13 are jointly managedpage no. 99 for performance of other schemes currently managed by . Atul Patel3. Date of inception: 10-Sep-14.4. As the Scheme has completed more than 3 year but less than 5 years, the performance details of since inception,1 year and 3 years are provided herein5. Past performance may or may not be sustained in future and the same may not necessarily provide the basis for comparison with other investment.6. Load is not considered for computation of returns.7. In case, the start/end date of the concerned period is a nonbusiness date (NBD), the NAV of the previous date is considered for computation of returns. The NAV per unit shown in the table is as on the start date of the said period
Scheme
Nifty 50 Index (Additional Benchmark)
NAV (Rs.) Per Unit (as on October 31,2017 : 14.74)
CAGR (%)
10.00
S&P BSE 500 Index (Benchmark)
Since inception
CurrentValue of
Investment of Rs. 10000
CAGR (%) Current Value of
Investment of Rs. 10000
1 Year 3 Year 5 Year
CAGR (%) Current Value of
Investment of Rs. 10000
CAGR (%) Current Value of
Investment of Rs. 10000
12.56 10.70 -
Particulars
17.20 11735.67 11.26 13775.70 - - 13.14 14740.00
22.01 12220.63 10.98 13672.22 - - 11.16 13945.78
19.47 11964.92 7.48 12418.95 - - 8.09 12768.93
Company/Issuer % to % to NAV NAV Derivatives
Auto 2.64% Maruti Suzuki India Ltd. 2.64% Auto Ancillaries 3.55% • Motherson Sumi Systems Ltd. 3.55% Banks 23.43% • ICICI Bank Ltd. 8.60% • State Bank Of India 6.02% HDFC Bank Ltd. 3.21% Axis Bank Ltd. 3.05% The South Indian Bank Ltd. 1.51% The Federal Bank Ltd. 1.04% Cement 3.00% JK Lakshmi Cement Ltd. 3.00% Chemicals 3.41% • Tata Chemicals Ltd. 3.41% Construction 1.01% Brigade Enterprises Ltd. 1.01% Construction Project 3.83% • Larsen & Toubro Ltd. 3.34% Gammon Infrastructure Projects Ltd. 0.50% Consumer Non Durables 6.77% Glaxosmithkline Consumer Healthcare Ltd. 2.40% Asian Paints Ltd. 2.28% Prataap Snacks Ltd. 2.09% Ferrous Metals 2.52% Tata Steel Ltd. 2.52% Finance 3.43% Bajaj Finserv Ltd. 1.78% SBI Life Insurance Company Ltd. 1.65% Pesticides 2.26% Rallis India Ltd. 2.26% Pharmaceuticals 10.72% • Cipla Ltd. 4.69% • Unichem Laboratories Ltd. 3.36% IPCA Laboratories Ltd. 2.67%
Power 5.82% • NTPC Ltd. 3.34% Tata Power Company Ltd. 2.48% Services 1.96% Thomas Cook (India) Ltd. 1.96% Software 6.80% • HCL Technologies Ltd. 3.95% Infosys Ltd. 2.86% Index Futures/Options 5.10%• Nifty 50 Index - Futures 5.10% Short Term Debt and net current assets 13.73% Total Net Assets 100.00%
Company/Issuer % to % to NAV NAV Derivatives
Std Dev (Annualised) : 13.81% Sharpe Ratio : 0.41 Portfolio Beta : 0.96 R squared : 0.90 Benchmark Std Dev (Annualised) : 13.73%
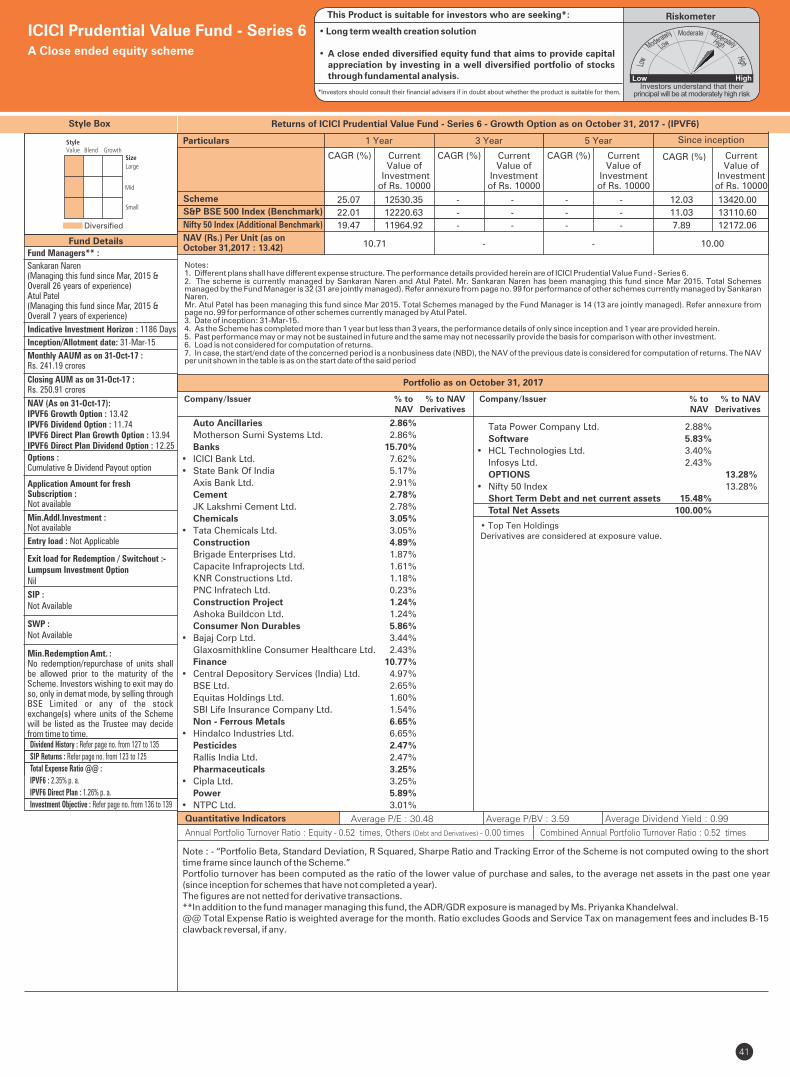
Style Box
Note : - “Portfolio Beta, Standard Deviation, R Squared, Sharpe Ratio and Tracking Error of the Scheme is not computed owing to the short time frame since launch of the Scheme.”Portfolio turnover has been computed as the ratio of the lower value of purchase and sales, to the average net assets in the past one year (since inception for schemes that have not completed a year). The figures are not netted for derivative transactions.**In addition to the fund manager managing this fund, the ADR/GDR exposure is managed by Ms. Priyanka Khandelwal.@@ Total Expense Ratio is weighted average for the month. Ratio excludes Goods and Service Tax on management fees and includes B-15 clawback reversal, if any.
Fund Managers** :
Sankaran Naren(Managing this fund since Mar, 2015 &Overall 26 years of experience)Atul Patel(Managing this fund since Mar, 2015 &Overall 7 years of experience)
Indicative Investment Horizon : 1186 Days
Inception/Allotment date: 31-Mar-15
SWP :Not Available
Min.Redemption Amt. :No redemption/repurchase of units shall be allowed prior to the maturity of the Scheme. Investors wishing to exit may do so, only in demat mode, by selling through BSE Limited or any of the stock exchange(s) where units of the Scheme will be listed as the Trustee may decide from time to time.
SIP :Not Available
NAV (As on 31-Oct-17):IPVF6 Growth Option : 13.42IPVF6 Dividend Option : 11.74IPVF6 Direct Plan Growth Option : 13.94IPVF6 Direct Plan Dividend Option : 12.25
Options :Cumulative & Dividend Payout option
Application Amount for freshSubscription :Not available
Min.Addl.Investment :Not available
Exit load for Redemption / Switchout :- Lumpsum Investment OptionNil
41
Fund Details
Quantitative Indicators Average P/E : 30.48 Average P/BV : 3.59 Average Dividend Yield : 0.99
Diversified
ICICI Prudential Value Fund - Series 6A Close ended equity scheme
Monthly AAUM as on 31-Oct-17 : Rs. 241.19 crores
Closing AUM as on 31-Oct-17 : Rs. 250.91 crores
Entry load : Not Applicable
Riskometer
• Long term wealth creation solution
• A close ended diversified equity fund that aims to provide capital appreciation by investing in a well diversified portfolio of stocks through fundamental analysis.
This Product is suitable for investors who are seeking*:
*Investors should consult their financial advisers if in doubt about whether the product is suitable for them.
Annual Portfolio Turnover Ratio : Equity - 0.52 times, Others (Debt and Derivatives) - 0.00 times Combined Annual Portfolio Turnover Ratio : 0.52 times
Returns of ICICI Prudential Value Fund - Series 6 - Growth Option as on October 31, 2017 - (IPVF6)
Portfolio as on October 31, 2017
Auto Ancillaries 2.86%
Motherson Sumi Systems Ltd. 2.86%
Banks 15.70%
• ICICI Bank Ltd. 7.62%
• State Bank Of India 5.17%
Axis Bank Ltd. 2.91%
Cement 2.78%
JK Lakshmi Cement Ltd. 2.78%
Chemicals 3.05%
• Tata Chemicals Ltd. 3.05%
Construction 4.89%
Brigade Enterprises Ltd. 1.87%
Capacite Infraprojects Ltd. 1.61%
KNR Constructions Ltd. 1.18%
PNC Infratech Ltd. 0.23%
Construction Project 1.24%
Ashoka Buildcon Ltd. 1.24%
Consumer Non Durables 5.86%
• Bajaj Corp Ltd. 3.44%
Glaxosmithkline Consumer Healthcare Ltd. 2.43%
Finance 10.77%
• Central Depository Services (India) Ltd. 4.97%
BSE Ltd. 2.65%
Equitas Holdings Ltd. 1.60%
SBI Life Insurance Company Ltd. 1.54%
Non - Ferrous Metals 6.65%
• Hindalco Industries Ltd. 6.65%
Pesticides 2.47%
Rallis India Ltd. 2.47%
Pharmaceuticals 3.25%
• Cipla Ltd. 3.25%
Power 5.89%
• NTPC Ltd. 3.01%
Company/Issuer % to % to NAV NAV Derivatives
Company/Issuer % to % to NAV NAV Derivatives
Tata Power Company Ltd. 2.88%
Software 5.83%
• HCL Technologies Ltd. 3.40%
Infosys Ltd. 2.43%
OPTIONS 13.28%
• Nifty 50 Index 13.28%
Short Term Debt and net current assets 15.48%
Total Net Assets 100.00%
• Top Ten HoldingsDerivatives are considered at exposure value.
Dividend History : Refer page no. from 127 to 135
SIP Returns : Refer page no. from 123 to 125
Total Expense Ratio @@ :
IPVF6 : 2.35% p. a.
IPVF6 Direct Plan : 1.26% p. a.
Investment Objective : Refer page no. from 136 to 139
Notes:1. Different plans shall have different expense structure. The performance details provided herein are of ICICI Prudential Value Fund - Series 6.2. The scheme is currently managed by Sankaran Naren and Atul Patel. Mr. Sankaran Naren has been managing this fund since Mar 2015. Total Schemes managed by the Fund Manager . Refer annexure from page no. 99 for performance of other schemes currently managed by Sankaran is 32 (31 are jointly managed) Naren.Mr. Atul Patel has been managing this fund since Mar 2015. Total Schemes managed by the Fund Manager is 14 (13 are jointly managed). Refer annexure from page no. 99 for performance of other schemes currently managed by Atul Patel .3. Date of inception: 31-Mar-15.4. As the Scheme has completed more than 1 year but less than 3 years, the performance details of only since inception and 1 year are provided herein.5. Past performance may or may not be sustained in future and the same may not necessarily provide the basis for comparison with other investment.6. Load is not considered for computation of returns.7. In case, the start/end date of the concerned period is a nonbusiness date (NBD), the NAV of the previous date is considered for computation of returns. The NAV per unit shown in the table is as on the start date of the said period
Scheme
Nifty 50 Index (Additional Benchmark)
NAV (Rs.) Per Unit (as on October 31,2017 : 13.42)
CAGR (%)
10.00
S&P BSE 500 Index (Benchmark)
Since inception
CurrentValue of
Investment of Rs. 10000
CAGR (%) Current Value of
Investment of Rs. 10000
1 Year 3 Year 5 Year
CAGR (%) Current Value of
Investment of Rs. 10000
CAGR (%) Current Value of
Investment of Rs. 10000
10.71 - -
Particulars
25.07 12530.35 - - - - 12.03 13420.00
22.01 12220.63 - - - - 11.03 13110.60
19.47 11964.92 - - - - 7.89 12172.06
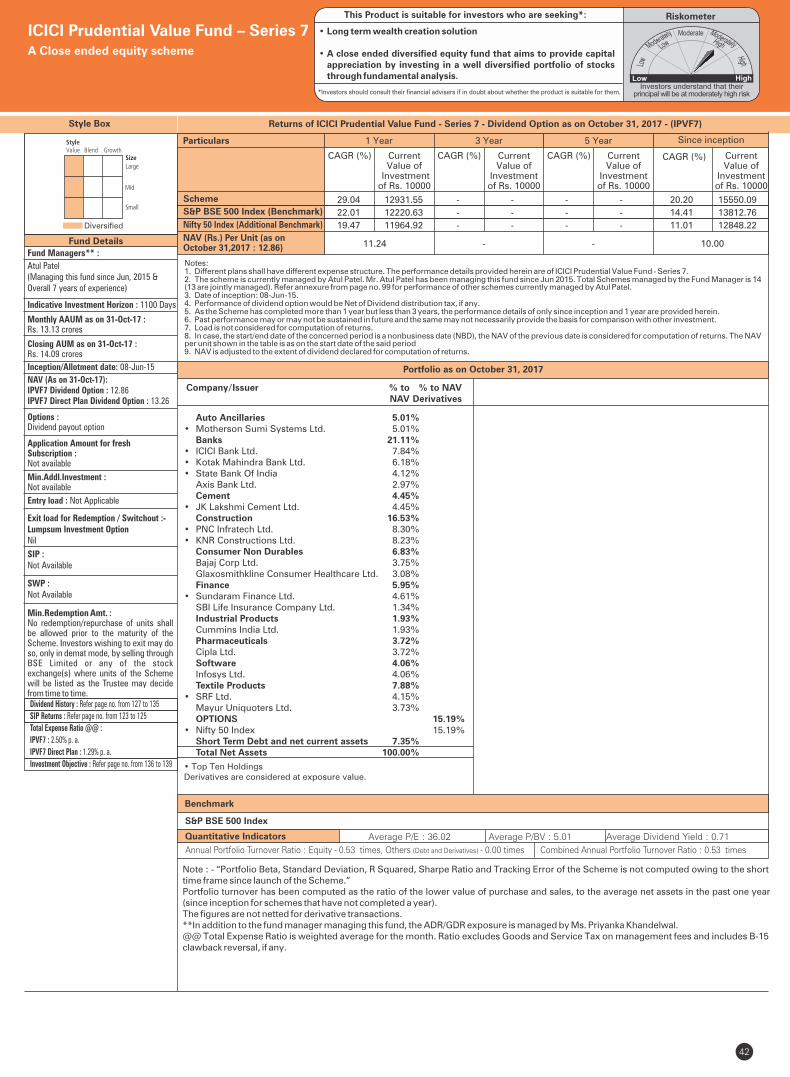
Style Box
Note : - “Portfolio Beta, Standard Deviation, R Squared, Sharpe Ratio and Tracking Error of the Scheme is not computed owing to the short time frame since launch of the Scheme.”Portfolio turnover has been computed as the ratio of the lower value of purchase and sales, to the average net assets in the past one year (since inception for schemes that have not completed a year). The figures are not netted for derivative transactions.**In addition to the fund manager managing this fund, the ADR/GDR exposure is managed by Ms. Priyanka Khandelwal.@@ Total Expense Ratio is weighted average for the month. Ratio excludes Goods and Service Tax on management fees and includes B-15 clawback reversal, if any.
Fund Managers** :
Atul Patel(Managing this fund since Jun, 2015 &Overall 7 years of experience)
Indicative Investment Horizon : 1100 Days
Inception/Allotment date: 08-Jun-15
SWP :Not Available
Min.Redemption Amt. :No redemption/repurchase of units shall be allowed prior to the maturity of the Scheme. Investors wishing to exit may do so, only in demat mode, by selling through BSE Limited or any of the stock exchange(s) where units of the Scheme will be listed as the Trustee may decide from time to time.
SIP :Not Available
NAV (As on 31-Oct-17):IPVF7 Dividend Option : 12.86IPVF7 Direct Plan Dividend Option : 13.26
Options :Dividend payout option
Application Amount for freshSubscription :Not available
Min.Addl.Investment :Not available
Exit load for Redemption / Switchout :- Lumpsum Investment OptionNil
42
Fund Details
Quantitative Indicators
Benchmark
Average P/E : 36.02 Average P/BV : 5.01 Average Dividend Yield : 0.71
S&P BSE 500 Index
Diversified
ICICI Prudential Value Fund – Series 7A Close ended equity scheme
Monthly AAUM as on 31-Oct-17 : Rs. 13.13 crores
Closing AUM as on 31-Oct-17 : Rs. 14.09 crores
• Top Ten HoldingsDerivatives are considered at exposure value.
Company/Issuer % to % to NAV NAV Derivatives
Auto Ancillaries 5.01% • Motherson Sumi Systems Ltd. 5.01% Banks 21.11% • ICICI Bank Ltd. 7.84% • Kotak Mahindra Bank Ltd. 6.18% • State Bank Of India 4.12% Axis Bank Ltd. 2.97% Cement 4.45% • JK Lakshmi Cement Ltd. 4.45% Construction 16.53% • PNC Infratech Ltd. 8.30% • KNR Constructions Ltd. 8.23% Consumer Non Durables 6.83% Bajaj Corp Ltd. 3.75% Glaxosmithkline Consumer Healthcare Ltd. 3.08% Finance 5.95% • Sundaram Finance Ltd. 4.61% SBI Life Insurance Company Ltd. 1.34% Industrial Products 1.93% Cummins India Ltd. 1.93% Pharmaceuticals 3.72% Cipla Ltd. 3.72% Software 4.06% Infosys Ltd. 4.06% Textile Products 7.88% • SRF Ltd. 4.15% Mayur Uniquoters Ltd. 3.73% OPTIONS 15.19%• Nifty 50 Index 15.19% Short Term Debt and net current assets 7.35% Total Net Assets 100.00%
Entry load : Not Applicable
Riskometer This Product is suitable for investors who are seeking*:
• Long term wealth creation solution
• A close ended diversified equity fund that aims to provide capital appreciation by investing in a well diversified portfolio of stocks through fundamental analysis.
*Investors should consult their financial advisers if in doubt about whether the product is suitable for them.
Annual Portfolio Turnover Ratio : Equity - 0.53 times, Others (Debt and Derivatives) - 0.00 times Combined Annual Portfolio Turnover Ratio : 0.53 times
Portfolio as on October 31, 2017
Returns of ICICI Prudential Value Fund - Series 7 - Dividend Option as on October 31, 2017 - (IPVF7)
Dividend History : Refer page no. from 127 to 135
SIP Returns : Refer page no. from 123 to 125
Total Expense Ratio @@ :
IPVF7 : 2.50% p. a.
IPVF7 Direct Plan : 1.29% p. a.
Investment Objective : Refer page no. from 136 to 139
Notes:1. Different plans shall have different expense structure. The performance details provided herein are of ICICI Prudential Value Fund - Series 7.2. The scheme is currently managed by Atul Patel. Mr. Atul Patel has been managing this fund since Jun 2015. Total Schemes managed by the Fund Manager is 14 (13 are jointly managed). Refer annexure from page no. 99 for performance of other schemes currently managed by Atul Patel.3. Date of inception: 08-Jun-15.4. Performance of dividend option would be Net of Dividend distribution tax, if any.5. As the Scheme has completed more than 1 year but less than 3 years, the performance details of only since inception and 1 year are provided herein.6. Past performance may or may not be sustained in future and the same may not necessarily provide the basis for comparison with other investment.7. Load is not considered for computation of returns.8. In case, the start/end date of the concerned period is a nonbusiness date (NBD), the NAV of the previous date is considered for computation of returns. The NAV per unit shown in the table is as on the start date of the said period9. NAV is adjusted to the extent of dividend declared for computation of returns.
Scheme
Nifty 50 Index (Additional Benchmark)
NAV (Rs.) Per Unit (as on October 31,2017 : 12.86)
CAGR (%)
10.00
S&P BSE 500 Index (Benchmark)
Since inception
CurrentValue of
Investment of Rs. 10000
CAGR (%) Current Value of
Investment of Rs. 10000
1 Year 3 Year 5 Year
CAGR (%) Current Value of
Investment of Rs. 10000
CAGR (%) Current Value of
Investment of Rs. 10000
11.24 - -
Particulars
29.04 12931.55 - - - - 20.20 15550.09
22.01 12220.63 - - - - 14.41 13812.76
19.47 11964.92 - - - - 11.01 12848.22
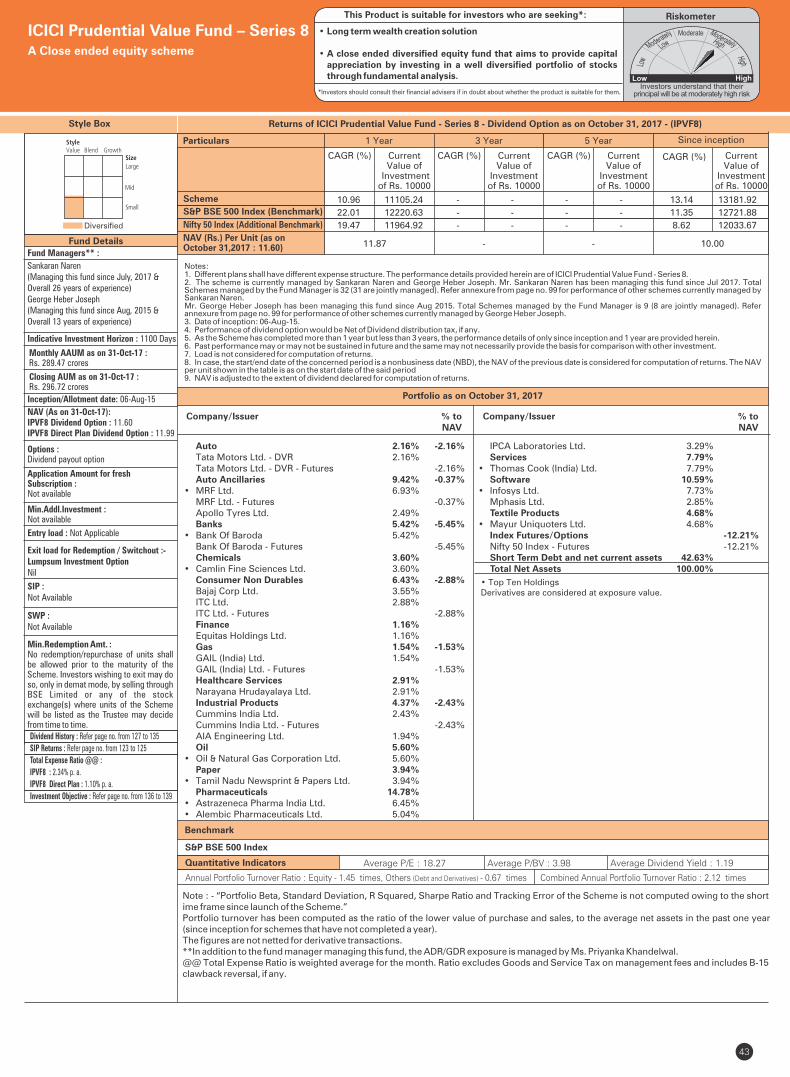
Style Box
Note : - “Portfolio Beta, Standard Deviation, R Squared, Sharpe Ratio and Tracking Error of the Scheme is not computed owing to the short ime frame since launch of the Scheme.”Portfolio turnover has been computed as the ratio of the lower value of purchase and sales, to the average net assets in the past one year (since inception for schemes that have not completed a year). The figures are not netted for derivative transactions.**In addition to the fund manager managing this fund, the ADR/GDR exposure is managed by Ms. Priyanka Khandelwal.@@ Total Expense Ratio is weighted average for the month. Ratio excludes Goods and Service Tax on management fees and includes B-15 clawback reversal, if any.
Fund Managers** :
Sankaran Naren(Managing this fund since July, 2017 &Overall 26 years of experience)George Heber Joseph(Managing this fund since Aug, 2015 &Overall 13 years of experience)
Indicative Investment Horizon : 1100 Days
Inception/Allotment date: 06-Aug-15
SWP :Not Available
Min.Redemption Amt. :No redemption/repurchase of units shall be allowed prior to the maturity of the Scheme. Investors wishing to exit may do so, only in demat mode, by selling through BSE Limited or any of the stock exchange(s) where units of the Scheme will be listed as the Trustee may decide from time to time.
SIP :Not Available
NAV (As on 31-Oct-17):IPVF8 Dividend Option : 11.60IPVF8 Direct Plan Dividend Option : 11.99
Options :Dividend payout option
Application Amount for freshSubscription :Not available
Min.Addl.Investment :Not available
Exit load for Redemption / Switchout :- Lumpsum Investment OptionNil
43
Fund Details
Quantitative Indicators
Benchmark
Average P/E : 18.27 Average P/BV : 3.98 Average Dividend Yield : 1.19
S&P BSE 500 Index
• Top Ten HoldingsDerivatives are considered at exposure value.
Diversified
ICICI Prudential Value Fund – Series 8A Close ended equity scheme
Entry load : Not Applicable
Riskometer This Product is suitable for investors who are seeking*:
• Long term wealth creation solution
• A close ended diversified equity fund that aims to provide capital appreciation by investing in a well diversified portfolio of stocks through fundamental analysis.
*Investors should consult their financial advisers if in doubt about whether the product is suitable for them.
Monthly AAUM as on 31-Oct-17 :Rs. 289.47 crores
Closing AUM as on 31-Oct-17 : Rs. 296.72 crores
Annual Portfolio Turnover Ratio : Equity - 1.45 times, Others (Debt and Derivatives) - 0.67 times Combined Annual Portfolio Turnover Ratio : 2.12 times
Company/Issuer % to NAV
Dividend History : Refer page no. from 127 to 135
SIP Returns : Refer page no. from 123 to 125
Total Expense Ratio @@ :
IPVF8 : 2.34% p. a.
IPVF8 Direct Plan : 1.10% p. a.
Investment Objective : Refer page no. from 136 to 139
Company/Issuer % to NAV
Portfolio as on October 31, 2017
Returns of ICICI Prudential Value Fund - Series 8 - Dividend Option as on October 31, 2017 - (IPVF8)
Notes:1. Different plans shall have different expense structure. The performance details provided herein are of ICICI Prudential Value Fund - Series 8.2. The scheme is currently managed by Sankaran Naren and George Heber Joseph. Mr. Sankaran Naren has been managing this fund since Jul 2017. Total Schemes managed by the Fund Manager is 32 (31 are jointly managed). Refer annexure from page no. 99 for performance of other schemes currently managed by Sankaran Naren.Mr. George Heber Joseph has been managing this fund since Aug 2015. Total Schemes managed by the Fund Manager Refer is 9 (8 are jointly managed).annexure from page no. 99 for performance of other schemes currently managed by George Heber Joseph.3. Date of inception: 06-Aug-15.4. Performance of dividend option would be Net of Dividend distribution tax, if any.5. As the Scheme has completed more than 1 year but less than 3 years, the performance details of only since inception and 1 year are provided herein.6. Past performance may or may not be sustained in future and the same may not necessarily provide the basis for comparison with other investment.7. Load is not considered for computation of returns.8. In case, the start/end date of the concerned period is a nonbusiness date (NBD), the NAV of the previous date is considered for computation of returns. The NAV per unit shown in the table is as on the start date of the said period9. NAV is adjusted to the extent of dividend declared for computation of returns.
Scheme
Nifty 50 Index (Additional Benchmark)
NAV (Rs.) Per Unit (as on October 31,2017 : 11.60)
CAGR (%)
10.00
S&P BSE 500 Index (Benchmark)
Since inception
CurrentValue of
Investment of Rs. 10000
CAGR (%) Current Value of
Investment of Rs. 10000
1 Year 3 Year 5 Year
CAGR (%) Current Value of
Investment of Rs. 10000
CAGR (%) Current Value of
Investment of Rs. 10000
11.87 - -
Particulars
10.96 11105.24 - - - - 13.14 13181.92
22.01 12220.63 - - - - 11.35 12721.88
19.47 11964.92 - - - - 8.62 12033.67
Auto 2.16% -2.16% Tata Motors Ltd. - DVR 2.16% Tata Motors Ltd. - DVR - Futures -2.16% Auto Ancillaries 9.42% -0.37%• MRF Ltd. 6.93% MRF Ltd. - Futures -0.37% Apollo Tyres Ltd. 2.49% Banks 5.42% -5.45%• Bank Of Baroda 5.42% Bank Of Baroda - Futures -5.45% Chemicals 3.60% • Camlin Fine Sciences Ltd. 3.60% Consumer Non Durables 6.43% -2.88% Bajaj Corp Ltd. 3.55% ITC Ltd. 2.88% ITC Ltd. - Futures -2.88% Finance 1.16% Equitas Holdings Ltd. 1.16% Gas 1.54% -1.53% GAIL (India) Ltd. 1.54% GAIL (India) Ltd. - Futures -1.53% Healthcare Services 2.91% Narayana Hrudayalaya Ltd. 2.91% Industrial Products 4.37% -2.43% Cummins India Ltd. 2.43% Cummins India Ltd. - Futures -2.43% AIA Engineering Ltd. 1.94% Oil 5.60% • Oil & Natural Gas Corporation Ltd. 5.60% Paper 3.94% • Tamil Nadu Newsprint & Papers Ltd. 3.94% Pharmaceuticals 14.78% • Astrazeneca Pharma India Ltd. 6.45% • Alembic Pharmaceuticals Ltd. 5.04%
IPCA Laboratories Ltd. 3.29% Services 7.79% • Thomas Cook (India) Ltd. 7.79% Software 10.59% • Infosys Ltd. 7.73% Mphasis Ltd. 2.85% Textile Products 4.68% • Mayur Uniquoters Ltd. 4.68% Index Futures/Options -12.21% Nifty 50 Index - Futures -12.21% Short Term Debt and net current assets 42.63% Total Net Assets 100.00%
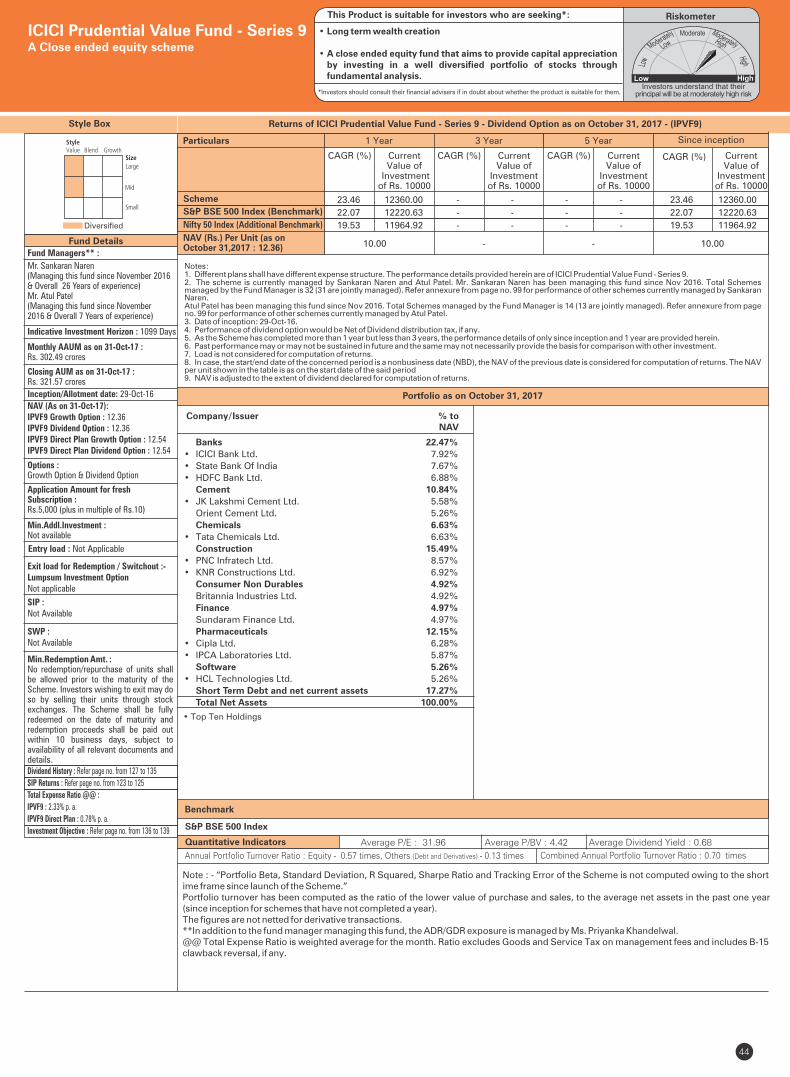
Style Box
Fund Managers** :
Mr. Sankaran Naren(Managing this fund since November 2016 & Overall 26 Years of experience)Mr. Atul Patel (Managing this fund since November 2016 & Overall 7 Years of experience)
Indicative Investment Horizon : 1099 Days
Inception/Allotment date: 29-Oct-16
SWP :Not Available
Min.Redemption Amt. :No redemption/repurchase of units shall be allowed prior to the maturity of the Scheme. Investors wishing to exit may do so by selling their units through stock exchanges. The Scheme shall be fully redeemed on the date of maturity and redemption proceeds shall be paid out within 10 business days, subject to availability of all relevant documents and details.
SIP :Not Available
NAV (As on 31-Oct-17):IPVF9 Growth Option : 12.36IPVF9 Dividend Option : 12.36IPVF9 Direct Plan Growth Option : 12.54IPVF9 Direct Plan Dividend Option : 12.54
Options :Growth Option & Dividend Option
Application Amount for freshSubscription :Rs.5,000 (plus in multiple of Rs.10)
Min.Addl.Investment :Not available
Exit load for Redemption / Switchout :- Lumpsum Investment OptionNot applicable
44
Fund Details
Diversified
Quantitative Indicators
Benchmark
Average P/E : 31.96 Average P/BV : 4.42 Average Dividend Yield : 0.68
S&P BSE 500 Index
ICICI Prudential Value Fund - Series 9A Close ended equity scheme
RiskometerThis Product is suitable for investors who are seeking*:
*Investors should consult their financial advisers if in doubt about whether the product is suitable for them.
Monthly AAUM as on 31-Oct-17 : Rs. 302.49 crores
Closing AUM as on 31-Oct-17 : Rs. 321.57 crores
Entry load : Not Applicable
Annual Portfolio Turnover Ratio : Equity - 0.57 times, Others (Debt and Derivatives) - 0.13 times Combined Annual Portfolio Turnover Ratio : 0.70 times
Dividend History : Refer page no. from 127 to 135
SIP Returns : Refer page no. from 123 to 125
Total Expense Ratio @@ :
IPVF9 : 2.33% p. a.
IPVF9 Direct Plan : 0.78% p. a.
Investment Objective : Refer page no. from 136 to 139
• Top Ten Holdings
Company/Issuer % to NAV
Banks 22.47%
• ICICI Bank Ltd. 7.92%
• State Bank Of India 7.67%
• HDFC Bank Ltd. 6.88%
Cement 10.84%
• JK Lakshmi Cement Ltd. 5.58%
Orient Cement Ltd. 5.26%
Chemicals 6.63%
• Tata Chemicals Ltd. 6.63%
Construction 15.49%
• PNC Infratech Ltd. 8.57%
• KNR Constructions Ltd. 6.92%
Consumer Non Durables 4.92%
Britannia Industries Ltd. 4.92%
Finance 4.97%
Sundaram Finance Ltd. 4.97%
Pharmaceuticals 12.15%
• Cipla Ltd. 6.28%
• IPCA Laboratories Ltd. 5.87%
Software 5.26%
• HCL Technologies Ltd. 5.26%
Short Term Debt and net current assets 17.27%
Total Net Assets 100.00%
Note : - “Portfolio Beta, Standard Deviation, R Squared, Sharpe Ratio and Tracking Error of the Scheme is not computed owing to the short ime frame since launch of the Scheme.”Portfolio turnover has been computed as the ratio of the lower value of purchase and sales, to the average net assets in the past one year (since inception for schemes that have not completed a year). The figures are not netted for derivative transactions.**In addition to the fund manager managing this fund, the ADR/GDR exposure is managed by Ms. Priyanka Khandelwal.@@ Total Expense Ratio is weighted average for the month. Ratio excludes Goods and Service Tax on management fees and includes B-15 clawback reversal, if any.
• Long term wealth creation
• A close ended equity fund that aims to provide capital appreciation by investing in a well diversified portfolio of stocks through fundamental analysis.
Portfolio as on October 31, 2017
Notes:1. Different plans shall have different expense structure. The performance details provided herein are of ICICI Prudential Value Fund - Series 9.2. The scheme is currently managed by Sankaran Naren and Atul Patel. Mr. Sankaran Naren has been managing this fund since Nov 2016. Total Schemes managed by the Fund Manager is 32 (31 are jointly managed). Refer annexure from page no. 99 for performance of other schemes currently managed by Sankaran Naren.Atul Patel has been managing this fund since Nov 2016. Total Schemes managed by the Fund Manager is 14 (13 are jointly managed). Refer annexure from page no. 99 for performance of other schemes currently managed by Atul Patel.3. Date of inception: 29-Oct-16.4. Performance of dividend option would be Net of Dividend distribution tax, if any.5. As the Scheme has completed more than 1 year but less than 3 years, the performance details of only since inception and 1 year are provided herein.6. Past performance may or may not be sustained in future and the same may not necessarily provide the basis for comparison with other investment.7. Load is not considered for computation of returns.8. In case, the start/end date of the concerned period is a nonbusiness date (NBD), the NAV of the previous date is considered for computation of returns. The NAV per unit shown in the table is as on the start date of the said period9. NAV is adjusted to the extent of dividend declared for computation of returns.
Scheme
Nifty 50 Index (Additional Benchmark)
NAV (Rs.) Per Unit (as onOctober 31,2017 : 12.36)
CAGR (%)
10.00
S&P BSE 500 Index (Benchmark)
Since inception
CurrentValue of
Investment of Rs. 10000
CAGR (%) Current Value of
Investment of Rs. 10000
1 Year 3 Year 5 Year
CAGR (%) Current Value of
Investment of Rs. 10000
CAGR (%) Current Value of
Investment of Rs. 10000
10.00 - -
Particulars
23.46 12360.00 - - - - 23.46 12360.00
22.07 12220.63 - - - - 22.07 12220.63
19.53 11964.92 - - - - 19.53 11964.92
Returns of ICICI Prudential Value Fund - Series 9 - Dividend Option as on October 31, 2017 - (IPVF9)
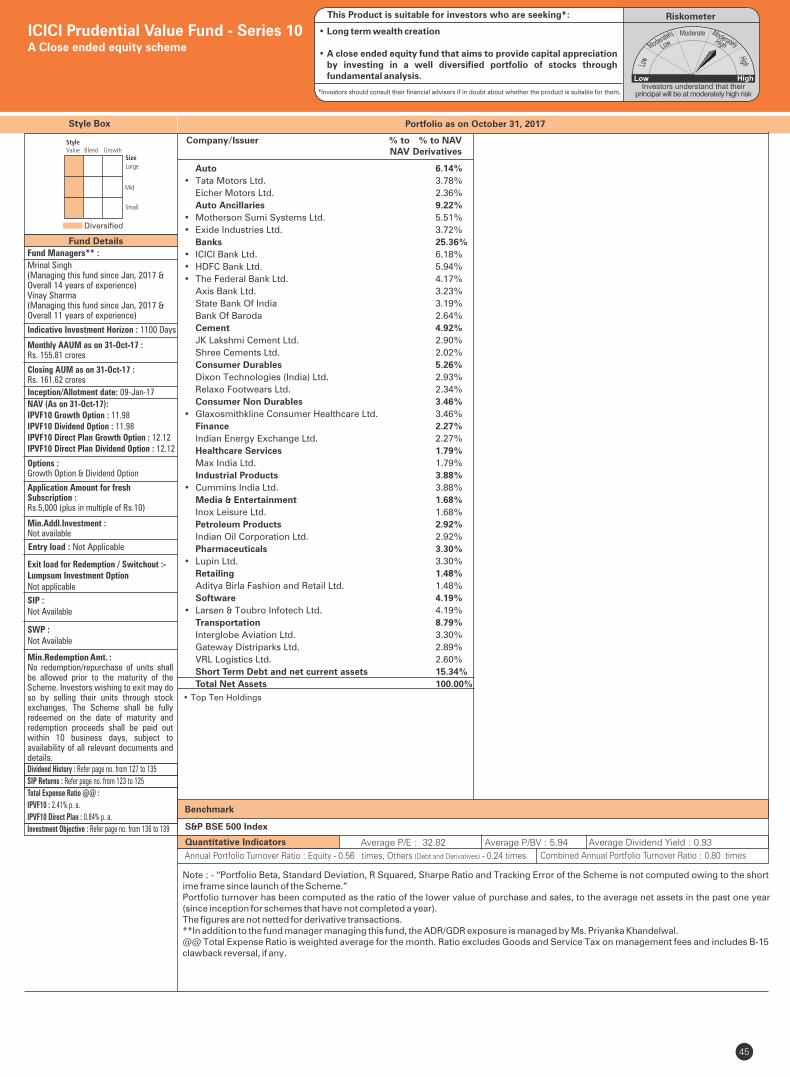
Style Box
Fund Managers** :
Indicative Investment Horizon : 1100 Days
Inception/Allotment date: 09-Jan-17
SWP :Not Available
Min.Redemption Amt. :No redemption/repurchase of units shall be allowed prior to the maturity of the Scheme. Investors wishing to exit may do so by selling their units through stock exchanges. The Scheme shall be fully redeemed on the date of maturity and redemption proceeds shall be paid out within 10 business days, subject to availability of all relevant documents and details.
SIP :Not Available
NAV (As on 31-Oct-17):IPVF10 Growth Option : 11.98IPVF10 Dividend Option : 11.98IPVF10 Direct Plan Growth Option : 12.12IPVF10 Direct Plan Dividend Option : 12.12
Options :Growth Option & Dividend Option
Application Amount for freshSubscription :Rs.5,000 (plus in multiple of Rs.10)
Min.Addl.Investment :Not available
Exit load for Redemption / Switchout :- Lumpsum Investment OptionNot applicable
45
Fund Details
Diversified
Portfolio as on October 31, 2017
Quantitative Indicators
Benchmark
Average P/E : 32.82 Average P/BV : 5.94 Average Dividend Yield : 0.93
S&P BSE 500 Index
ICICI Prudential Value Fund - Series 10A Close ended equity scheme
RiskometerThis Product is suitable for investors who are seeking*:
*Investors should consult their financial advisers if in doubt about whether the product is suitable for them.
Monthly AAUM as on 31-Oct-17 : Rs. 155.81 crores
Closing AUM as on 31-Oct-17 : Rs. 161.62 crores
• Top Ten Holdings
Entry load : Not Applicable
Annual Portfolio Turnover Ratio : Equity - 0.56 times, Others (Debt and Derivatives) - 0.24 times Combined Annual Portfolio Turnover Ratio : 0.80 times
Dividend History : Refer page no. from 127 to 135
SIP Returns : Refer page no. from 123 to 125
Total Expense Ratio @@ :
IPVF10 : 2.41% p. a.
IPVF10 Direct Plan : 0.84% p. a.
Investment Objective : Refer page no. from 136 to 139
Auto 6.14%
• Tata Motors Ltd. 3.78%
Eicher Motors Ltd. 2.36%
Auto Ancillaries 9.22%
• Motherson Sumi Systems Ltd. 5.51%
• Exide Industries Ltd. 3.72%
Banks 25.36%
• ICICI Bank Ltd. 6.18%
• HDFC Bank Ltd. 5.94%
• The Federal Bank Ltd. 4.17%
Axis Bank Ltd. 3.23%
State Bank Of India 3.19%
Bank Of Baroda 2.64%
Cement 4.92%
JK Lakshmi Cement Ltd. 2.90%
Shree Cements Ltd. 2.02%
Consumer Durables 5.26%
Dixon Technologies (India) Ltd. 2.93%
Relaxo Footwears Ltd. 2.34%
Consumer Non Durables 3.46%
• Glaxosmithkline Consumer Healthcare Ltd. 3.46%
Finance 2.27%
Indian Energy Exchange Ltd. 2.27%
Healthcare Services 1.79%
Max India Ltd. 1.79%
Industrial Products 3.88%
• Cummins India Ltd. 3.88%
Media & Entertainment 1.68%
Inox Leisure Ltd. 1.68%
Petroleum Products 2.92%
Indian Oil Corporation Ltd. 2.92%
Pharmaceuticals 3.30%
• Lupin Ltd. 3.30%
Retailing 1.48%
Aditya Birla Fashion and Retail Ltd. 1.48%
Software 4.19%
• Larsen & Toubro Infotech Ltd. 4.19%
Transportation 8.79%
Interglobe Aviation Ltd. 3.30%
Gateway Distriparks Ltd. 2.89%
VRL Logistics Ltd. 2.60%
Short Term Debt and net current assets 15.34%
Total Net Assets 100.00%
Note : - “Portfolio Beta, Standard Deviation, R Squared, Sharpe Ratio and Tracking Error of the Scheme is not computed owing to the short ime frame since launch of the Scheme.”Portfolio turnover has been computed as the ratio of the lower value of purchase and sales, to the average net assets in the past one year (since inception for schemes that have not completed a year). The figures are not netted for derivative transactions.**In addition to the fund manager managing this fund, the ADR/GDR exposure is managed by Ms. Priyanka Khandelwal.@@ Total Expense Ratio is weighted average for the month. Ratio excludes Goods and Service Tax on management fees and includes B-15 clawback reversal, if any.
Mrinal Singh (Managing this fund since Jan, 2017 & Overall 14 years of experience)Vinay Sharma(Managing this fund since Jan, 2017 & Overall 11 years of experience)
Company/Issuer % to % to NAV NAV Derivatives
• Long term wealth creation
• A close ended equity fund that aims to provide capital appreciation by investing in a well diversified portfolio of stocks through fundamental analysis.
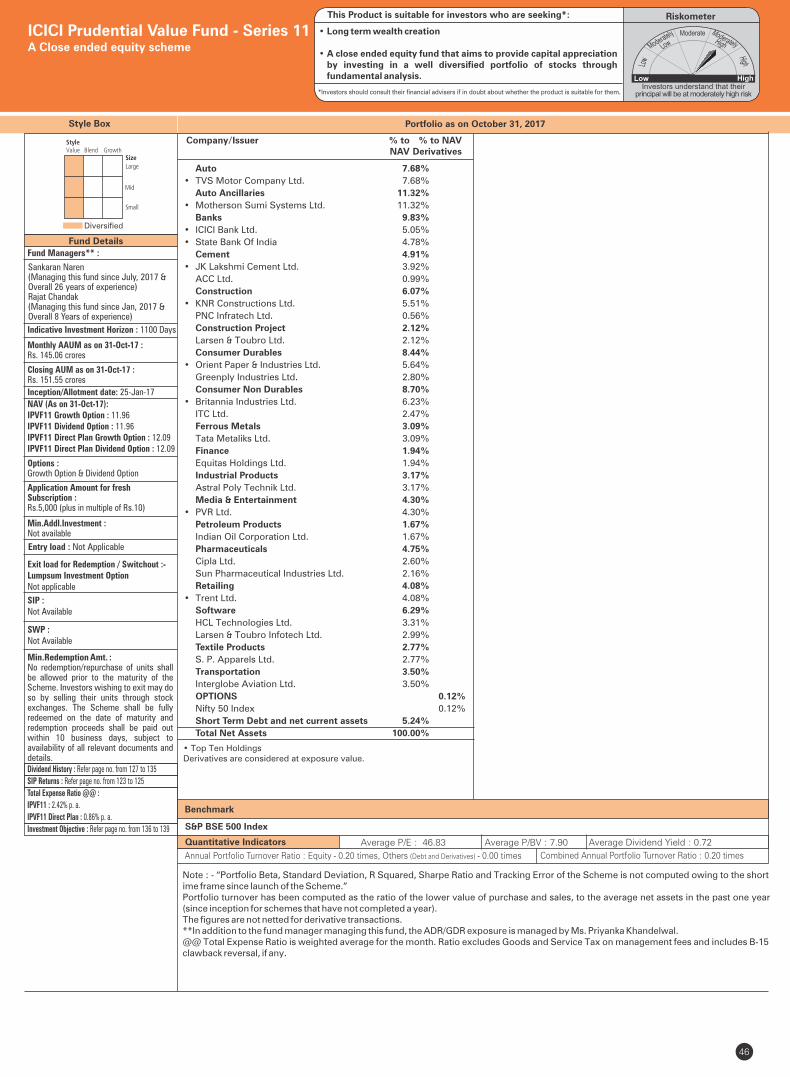
Style Box
Fund Managers** :
Indicative Investment Horizon : 1100 Days
Inception/Allotment date: 25-Jan-17
SWP :Not Available
Min.Redemption Amt. :No redemption/repurchase of units shall be allowed prior to the maturity of the Scheme. Investors wishing to exit may do so by selling their units through stock exchanges. The Scheme shall be fully redeemed on the date of maturity and redemption proceeds shall be paid out within 10 business days, subject to availability of all relevant documents and details.
SIP :Not Available
NAV (As on 31-Oct-17):IPVF11 Growth Option : 11.96IPVF11 Dividend Option : 11.96IPVF11 Direct Plan Growth Option : 12.09IPVF11 Direct Plan Dividend Option : 12.09
Options :Growth Option & Dividend Option
Application Amount for freshSubscription :Rs.5,000 (plus in multiple of Rs.10)
Min.Addl.Investment :Not available
Exit load for Redemption / Switchout :- Lumpsum Investment OptionNot applicable
46
Fund Details
Diversified
Portfolio as on October 31, 2017
Quantitative Indicators
Benchmark
Average P/E : 46.83 Average P/BV : 7.90 Average Dividend Yield : 0.72
S&P BSE 500 Index
ICICI Prudential Value Fund - Series 11A Close ended equity scheme
RiskometerThis Product is suitable for investors who are seeking*:
*Investors should consult their financial advisers if in doubt about whether the product is suitable for them.
Monthly AAUM as on 31-Oct-17 :Rs. 145.06 crores
Closing AUM as on 31-Oct-17 : Rs. 151.55 crores
• Top Ten HoldingsDerivatives are considered at exposure value.
Entry load : Not Applicable
Annual Portfolio Turnover Ratio : Equity - 0.20 times, Others (Debt and Derivatives) - 0.00 times Combined Annual Portfolio Turnover Ratio : 0.20 times
Dividend History : Refer page no. from 127 to 135
SIP Returns : Refer page no. from 123 to 125
Total Expense Ratio @@ :
IPVF11 : 2.42% p. a.
IPVF11 Direct Plan : 0.86% p. a.
Investment Objective : Refer page no. from 136 to 139
Auto 7.68%
• TVS Motor Company Ltd. 7.68%
Auto Ancillaries 11.32%
• Motherson Sumi Systems Ltd. 11.32%
Banks 9.83%
• ICICI Bank Ltd. 5.05%
• State Bank Of India 4.78%
Cement 4.91%
• JK Lakshmi Cement Ltd. 3.92%
ACC Ltd. 0.99%
Construction 6.07%
• KNR Constructions Ltd. 5.51%
PNC Infratech Ltd. 0.56%
Construction Project 2.12%
Larsen & Toubro Ltd. 2.12%
Consumer Durables 8.44%
• Orient Paper & Industries Ltd. 5.64%
Greenply Industries Ltd. 2.80%
Consumer Non Durables 8.70%
• Britannia Industries Ltd. 6.23%
ITC Ltd. 2.47%
Ferrous Metals 3.09%
Tata Metaliks Ltd. 3.09%
Finance 1.94%
Equitas Holdings Ltd. 1.94%
Industrial Products 3.17%
Astral Poly Technik Ltd. 3.17%
Media & Entertainment 4.30%
• PVR Ltd. 4.30%
Petroleum Products 1.67%
Indian Oil Corporation Ltd. 1.67%
Pharmaceuticals 4.75%
Cipla Ltd. 2.60%
Sun Pharmaceutical Industries Ltd. 2.16%
Retailing 4.08%
• Trent Ltd. 4.08%
Software 6.29%
HCL Technologies Ltd. 3.31%
Larsen & Toubro Infotech Ltd. 2.99%
Textile Products 2.77%
S. P. Apparels Ltd. 2.77%
Transportation 3.50%
Interglobe Aviation Ltd. 3.50%
OPTIONS 0.12%
Nifty 50 Index 0.12%
Short Term Debt and net current assets 5.24%
Total Net Assets 100.00%
Note : - “Portfolio Beta, Standard Deviation, R Squared, Sharpe Ratio and Tracking Error of the Scheme is not computed owing to the short ime frame since launch of the Scheme.”Portfolio turnover has been computed as the ratio of the lower value of purchase and sales, to the average net assets in the past one year (since inception for schemes that have not completed a year). The figures are not netted for derivative transactions.**In addition to the fund manager managing this fund, the ADR/GDR exposure is managed by Ms. Priyanka Khandelwal.@@ Total Expense Ratio is weighted average for the month. Ratio excludes Goods and Service Tax on management fees and includes B-15 clawback reversal, if any.
Sankaran Naren(Managing this fund since July, 2017 &Overall 26 years of experience)Rajat Chandak(Managing this fund since Jan, 2017 & Overall 8 Years of experience)
Company/Issuer % to % to NAV NAV Derivatives
• Long term wealth creation
• A close ended equity fund that aims to provide capital appreciation by investing in a well diversified portfolio of stocks through fundamental analysis.
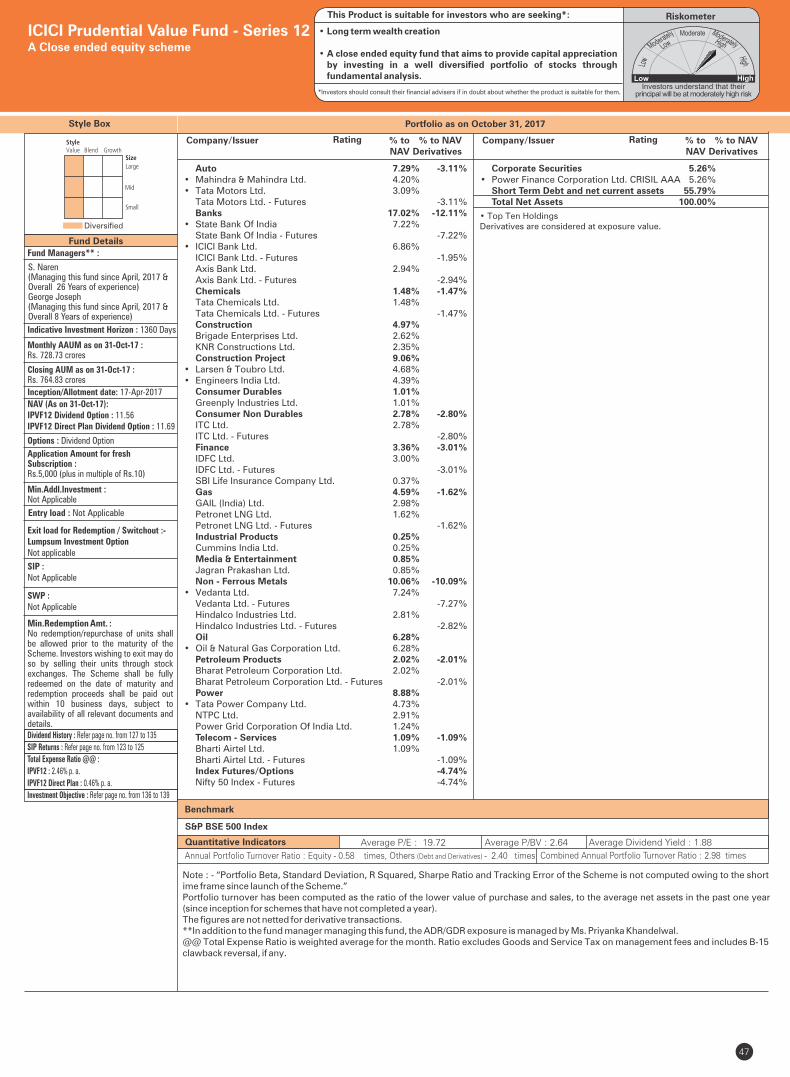
Style Box
Fund Managers** :
Indicative Investment Horizon : 1360 Days
Inception/Allotment date: 17-Apr-2017
SWP :Not Applicable
Min.Redemption Amt. :No redemption/repurchase of units shall be allowed prior to the maturity of the Scheme. Investors wishing to exit may do so by selling their units through stock exchanges. The Scheme shall be fully redeemed on the date of maturity and redemption proceeds shall be paid out within 10 business days, subject to availability of all relevant documents and details.
SIP :Not Applicable
NAV (As on 31-Oct-17):IPVF12 Dividend Option : 11.56IPVF12 Direct Plan Dividend Option : 11.69
Options : Dividend Option
Application Amount for freshSubscription :Rs.5,000 (plus in multiple of Rs.10)
Min.Addl.Investment :Not Applicable
Exit load for Redemption / Switchout :- Lumpsum Investment OptionNot applicable
47
Fund Details
Diversified
Portfolio as on October 31, 2017
Quantitative Indicators
Benchmark
Average P/E : 19.72 Average P/BV : 2.64 Average Dividend Yield : 1.88
S&P BSE 500 Index
ICICI Prudential Value Fund - Series 12A Close ended equity scheme
RiskometerThis Product is suitable for investors who are seeking*:
*Investors should consult their financial advisers if in doubt about whether the product is suitable for them.
Monthly AAUM as on 31-Oct-17 : Rs. 728.73 crores
Closing AUM as on 31-Oct-17 : Rs. 764.83 crores
• Top Ten HoldingsDerivatives are considered at exposure value.
Entry load : Not Applicable
Annual Portfolio Turnover Ratio : Equity - 0.58 times, Others (Debt and Derivatives) - 2.40 times Combined Annual Portfolio Turnover Ratio : 2.98 times
Dividend History : Refer page no. from 127 to 135
SIP Returns : Refer page no. from 123 to 125
Total Expense Ratio @@ :
IPVF12 : 2.46% p. a.
IPVF12 Direct Plan : 0.46% p. a.
Investment Objective : Refer page no. from 136 to 139
Auto 7.29% -3.11%• Mahindra & Mahindra Ltd. 4.20% • Tata Motors Ltd. 3.09% Tata Motors Ltd. - Futures -3.11% Banks 17.02% -12.11%• State Bank Of India 7.22% State Bank Of India - Futures -7.22%• ICICI Bank Ltd. 6.86% ICICI Bank Ltd. - Futures -1.95% Axis Bank Ltd. 2.94% Axis Bank Ltd. - Futures -2.94% Chemicals 1.48% -1.47% Tata Chemicals Ltd. 1.48% Tata Chemicals Ltd. - Futures -1.47% Construction 4.97% Brigade Enterprises Ltd. 2.62% KNR Constructions Ltd. 2.35% Construction Project 9.06% • Larsen & Toubro Ltd. 4.68% • Engineers India Ltd. 4.39% Consumer Durables 1.01% Greenply Industries Ltd. 1.01% Consumer Non Durables 2.78% -2.80% ITC Ltd. 2.78% ITC Ltd. - Futures -2.80% Finance 3.36% -3.01% IDFC Ltd. 3.00% IDFC Ltd. - Futures -3.01% SBI Life Insurance Company Ltd. 0.37% Gas 4.59% -1.62% GAIL (India) Ltd. 2.98% Petronet LNG Ltd. 1.62% Petronet LNG Ltd. - Futures -1.62% Industrial Products 0.25% Cummins India Ltd. 0.25% Media & Entertainment 0.85% Jagran Prakashan Ltd. 0.85% Non - Ferrous Metals 10.06% -10.09%• Vedanta Ltd. 7.24% Vedanta Ltd. - Futures -7.27% Hindalco Industries Ltd. 2.81% Hindalco Industries Ltd. - Futures -2.82% Oil 6.28% • Oil & Natural Gas Corporation Ltd. 6.28% Petroleum Products 2.02% -2.01% Bharat Petroleum Corporation Ltd. 2.02% Bharat Petroleum Corporation Ltd. - Futures -2.01% Power 8.88% • Tata Power Company Ltd. 4.73% NTPC Ltd. 2.91% Power Grid Corporation Of India Ltd. 1.24% Telecom - Services 1.09% -1.09% Bharti Airtel Ltd. 1.09% Bharti Airtel Ltd. - Futures -1.09% Index Futures/Options -4.74% Nifty 50 Index - Futures -4.74%
Note : - “Portfolio Beta, Standard Deviation, R Squared, Sharpe Ratio and Tracking Error of the Scheme is not computed owing to the short ime frame since launch of the Scheme.”Portfolio turnover has been computed as the ratio of the lower value of purchase and sales, to the average net assets in the past one year (since inception for schemes that have not completed a year). The figures are not netted for derivative transactions.**In addition to the fund manager managing this fund, the ADR/GDR exposure is managed by Ms. Priyanka Khandelwal.@@ Total Expense Ratio is weighted average for the month. Ratio excludes Goods and Service Tax on management fees and includes B-15 clawback reversal, if any.
Company/Issuer % to % to NAV NAV Derivatives
S. Naren (Managing this fund since April, 2017 & Overall 26 Years of experience)George Joseph(Managing this fund since April, 2017 & Overall 8 Years of experience)
Rating
• Long term wealth creation
• A close ended equity fund that aims to provide capital appreciation by investing in a well diversified portfolio of stocks through fundamental analysis.
Company/Issuer % to % to NAV NAV Derivatives
Rating
Corporate Securities 5.26% • Power Finance Corporation Ltd. CRISIL AAA 5.26% Short Term Debt and net current assets 55.79% Total Net Assets 100.00%
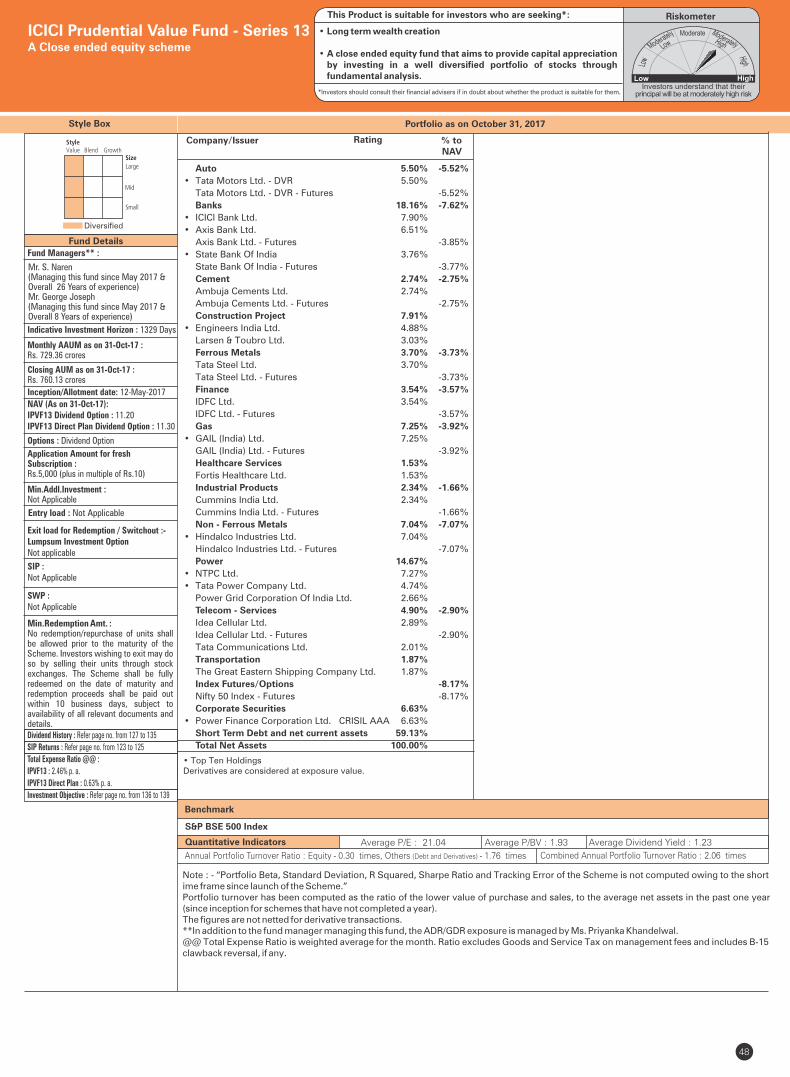
Style Box
Fund Managers** :
Indicative Investment Horizon : 1329 Days
Inception/Allotment date: 12-May-2017
SWP :Not Applicable
Min.Redemption Amt. :No redemption/repurchase of units shall be allowed prior to the maturity of the Scheme. Investors wishing to exit may do so by selling their units through stock exchanges. The Scheme shall be fully redeemed on the date of maturity and redemption proceeds shall be paid out within 10 business days, subject to availability of all relevant documents and details.
SIP :Not Applicable
NAV (As on 31-Oct-17):IPVF13 Dividend Option : 11.20IPVF13 Direct Plan Dividend Option : 11.30
Options : Dividend Option
Application Amount for freshSubscription :Rs.5,000 (plus in multiple of Rs.10)
Min.Addl.Investment :Not Applicable
Exit load for Redemption / Switchout :- Lumpsum Investment OptionNot applicable
48
Fund Details
Diversified
Portfolio as on October 31, 2017
Quantitative Indicators
Benchmark
Average P/E : 21.04 Average P/BV : 1.93 Average Dividend Yield : 1.23
S&P BSE 500 Index
ICICI Prudential Value Fund - Series 13A Close ended equity scheme
RiskometerThis Product is suitable for investors who are seeking*:
*Investors should consult their financial advisers if in doubt about whether the product is suitable for them.
Monthly AAUM as on 31-Oct-17 :Rs. 729.36 crores
Closing AUM as on 31-Oct-17 : Rs. 760.13 crores
• Top Ten HoldingsDerivatives are considered at exposure value.
Entry load : Not Applicable
Annual Portfolio Turnover Ratio : Equity - 0.30 times, Others (Debt and Derivatives) - 1.76 times Combined Annual Portfolio Turnover Ratio : 2.06 times
Dividend History : Refer page no. from 127 to 135
SIP Returns : Refer page no. from 123 to 125
Total Expense Ratio @@ :
IPVF13 : 2.46% p. a.
IPVF13 Direct Plan : 0.63% p. a.
Investment Objective : Refer page no. from 136 to 139
Note : - “Portfolio Beta, Standard Deviation, R Squared, Sharpe Ratio and Tracking Error of the Scheme is not computed owing to the short ime frame since launch of the Scheme.”Portfolio turnover has been computed as the ratio of the lower value of purchase and sales, to the average net assets in the past one year (since inception for schemes that have not completed a year). The figures are not netted for derivative transactions.**In addition to the fund manager managing this fund, the ADR/GDR exposure is managed by Ms. Priyanka Khandelwal.@@ Total Expense Ratio is weighted average for the month. Ratio excludes Goods and Service Tax on management fees and includes B-15 clawback reversal, if any.
Company/Issuer % to NAV
Mr. S. Naren (Managing this fund since May 2017 & Overall 26 Years of experience)Mr. George Joseph (Managing this fund since May 2017 & Overall 8 Years of experience)
Rating
Auto 5.50% -5.52%
• Tata Motors Ltd. - DVR 5.50%
Tata Motors Ltd. - DVR - Futures -5.52%
Banks 18.16% -7.62%
• ICICI Bank Ltd. 7.90%
• Axis Bank Ltd. 6.51%
Axis Bank Ltd. - Futures -3.85%
• State Bank Of India 3.76%
State Bank Of India - Futures -3.77%
Cement 2.74% -2.75%
Ambuja Cements Ltd. 2.74%
Ambuja Cements Ltd. - Futures -2.75%
Construction Project 7.91%
• Engineers India Ltd. 4.88%
Larsen & Toubro Ltd. 3.03%
Ferrous Metals 3.70% -3.73%
Tata Steel Ltd. 3.70%
Tata Steel Ltd. - Futures -3.73%
Finance 3.54% -3.57%
IDFC Ltd. 3.54%
IDFC Ltd. - Futures -3.57%
Gas 7.25% -3.92%
• GAIL (India) Ltd. 7.25%
GAIL (India) Ltd. - Futures -3.92%
Healthcare Services 1.53%
Fortis Healthcare Ltd. 1.53%
Industrial Products 2.34% -1.66%
Cummins India Ltd. 2.34%
Cummins India Ltd. - Futures -1.66%
Non - Ferrous Metals 7.04% -7.07%
• Hindalco Industries Ltd. 7.04%
Hindalco Industries Ltd. - Futures -7.07%
Power 14.67%
• NTPC Ltd. 7.27%
• Tata Power Company Ltd. 4.74%
Power Grid Corporation Of India Ltd. 2.66%
Telecom - Services 4.90% -2.90%
Idea Cellular Ltd. 2.89%
Idea Cellular Ltd. - Futures -2.90%
Tata Communications Ltd. 2.01%
Transportation 1.87%
The Great Eastern Shipping Company Ltd. 1.87%
Index Futures/Options -8.17%
Nifty 50 Index - Futures -8.17%
Corporate Securities 6.63%
• Power Finance Corporation Ltd. CRISIL AAA 6.63%
Short Term Debt and net current assets 59.13%
Total Net Assets 100.00%
• Long term wealth creation
• A close ended equity fund that aims to provide capital appreciation by investing in a well diversified portfolio of stocks through fundamental analysis.
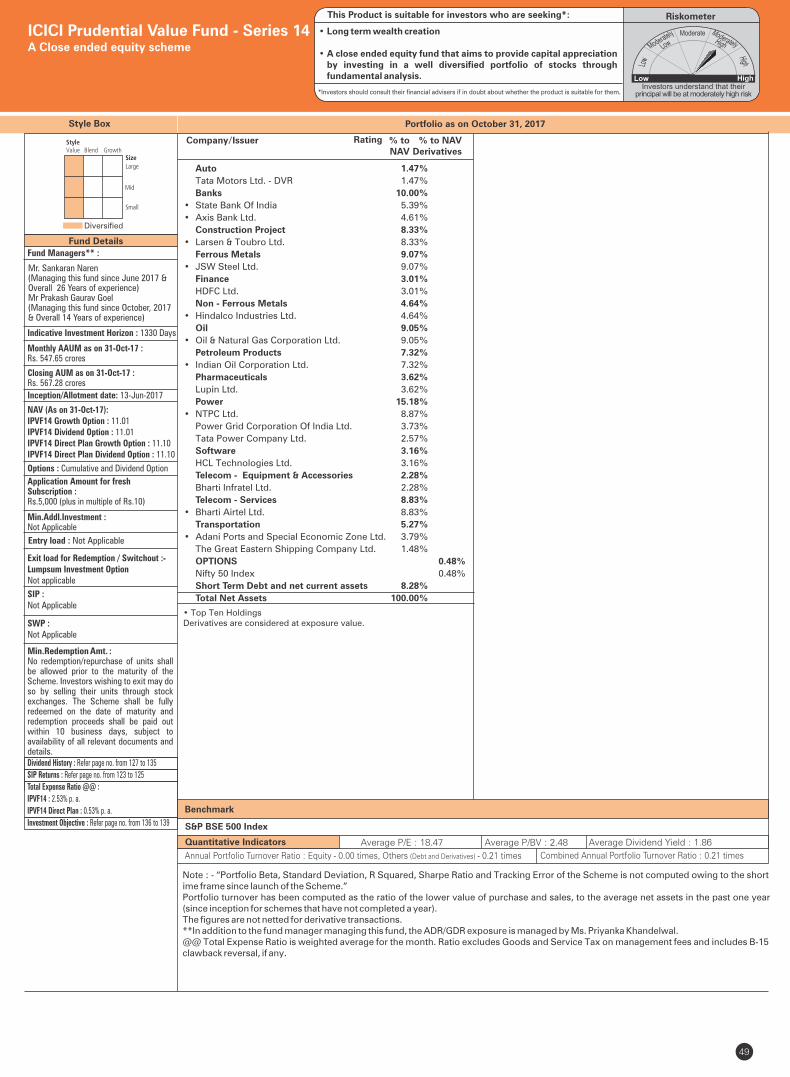
Style Box
Fund Managers** :
Indicative Investment Horizon : 1330 Days
Inception/Allotment date: 13-Jun-2017
SWP :Not Applicable
Min.Redemption Amt. :No redemption/repurchase of units shall be allowed prior to the maturity of the Scheme. Investors wishing to exit may do so by selling their units through stock exchanges. The Scheme shall be fully redeemed on the date of maturity and redemption proceeds shall be paid out within 10 business days, subject to availability of all relevant documents and details.
SIP :Not Applicable
NAV (As on 31-Oct-17):IPVF14 Growth Option : 11.01IPVF14 Dividend Option : 11.01IPVF14 Direct Plan Growth Option : 11.10IPVF14 Direct Plan Dividend Option : 11.10
Options : Cumulative and Dividend Option
Application Amount for freshSubscription :Rs.5,000 (plus in multiple of Rs.10)
Min.Addl.Investment :Not Applicable
Exit load for Redemption / Switchout :- Lumpsum Investment OptionNot applicable
49
Fund Details
Diversified
Portfolio as on October 31, 2017
Quantitative Indicators
Benchmark
Average P/E : 18.47 Average P/BV : 2.48 Average Dividend Yield : 1.86
S&P BSE 500 Index
ICICI Prudential Value Fund - Series 14A Close ended equity scheme
RiskometerThis Product is suitable for investors who are seeking*:
*Investors should consult their financial advisers if in doubt about whether the product is suitable for them.
Monthly AAUM as on 31-Oct-17 : Rs. 547.65 crores
Closing AUM as on 31-Oct-17 : Rs. 567.28 crores
• Top Ten HoldingsDerivatives are considered at exposure value.
Entry load : Not Applicable
Annual Portfolio Turnover Ratio : Equity - 0.00 times, Others (Debt and Derivatives) - 0.21 times Combined Annual Portfolio Turnover Ratio : 0.21 times
Dividend History : Refer page no. from 127 to 135
SIP Returns : Refer page no. from 123 to 125
Total Expense Ratio @@ :
IPVF14 : 2.53% p. a.
IPVF14 Direct Plan : 0.53% p. a.
Investment Objective : Refer page no. from 136 to 139
Note : - “Portfolio Beta, Standard Deviation, R Squared, Sharpe Ratio and Tracking Error of the Scheme is not computed owing to the short ime frame since launch of the Scheme.”Portfolio turnover has been computed as the ratio of the lower value of purchase and sales, to the average net assets in the past one year (since inception for schemes that have not completed a year). The figures are not netted for derivative transactions.**In addition to the fund manager managing this fund, the ADR/GDR exposure is managed by Ms. Priyanka Khandelwal.@@ Total Expense Ratio is weighted average for the month. Ratio excludes Goods and Service Tax on management fees and includes B-15 clawback reversal, if any.
Mr. Sankaran Naren (Managing this fund since June 2017 & Overall 26 Years of experience)
Mr Prakash Gaurav Goel(Managing this fund since October, 2017 & Overall 14 Years of experience)
Rating
Auto 1.47%
Tata Motors Ltd. - DVR 1.47%
Banks 10.00%
• State Bank Of India 5.39%
• Axis Bank Ltd. 4.61%
Construction Project 8.33%
• Larsen & Toubro Ltd. 8.33%
Ferrous Metals 9.07%
• JSW Steel Ltd. 9.07%
Finance 3.01%
HDFC Ltd. 3.01%
Non - Ferrous Metals 4.64%
• Hindalco Industries Ltd. 4.64%
Oil 9.05%
• Oil & Natural Gas Corporation Ltd. 9.05%
Petroleum Products 7.32%
• Indian Oil Corporation Ltd. 7.32%
Pharmaceuticals 3.62%
Lupin Ltd. 3.62%
Power 15.18%
• NTPC Ltd. 8.87%
Power Grid Corporation Of India Ltd. 3.73%
Tata Power Company Ltd. 2.57%
Software 3.16%
HCL Technologies Ltd. 3.16%
Telecom - Equipment & Accessories 2.28%
Bharti Infratel Ltd. 2.28%
Telecom - Services 8.83%
• Bharti Airtel Ltd. 8.83%
Transportation 5.27%
• Adani Ports and Special Economic Zone Ltd. 3.79%
The Great Eastern Shipping Company Ltd. 1.48%
OPTIONS 0.48%
Nifty 50 Index 0.48%
Short Term Debt and net current assets 8.28%
Total Net Assets 100.00%
Company/Issuer % to % to NAV NAV Derivatives
• Long term wealth creation
• A close ended equity fund that aims to provide capital appreciation by investing in a well diversified portfolio of stocks through fundamental analysis.
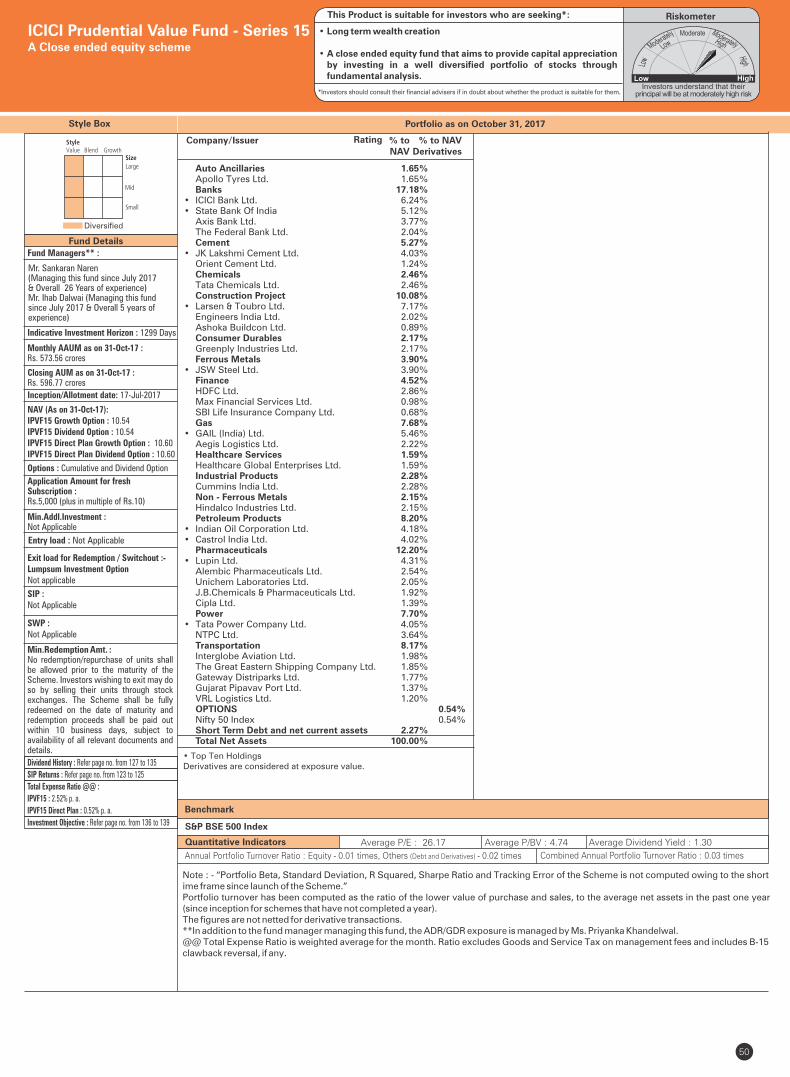
Style Box
Fund Managers** :
Indicative Investment Horizon : 1299 Days
Inception/Allotment date: 17-Jul-2017
SWP :Not Applicable
Min.Redemption Amt. :No redemption/repurchase of units shall be allowed prior to the maturity of the Scheme. Investors wishing to exit may do so by selling their units through stock exchanges. The Scheme shall be fully redeemed on the date of maturity and redemption proceeds shall be paid out within 10 business days, subject to availability of all relevant documents and details.
SIP :Not Applicable
NAV (As on 31-Oct-17):IPVF15 Growth Option : 10.54IPVF15 Dividend Option : 10.54IPVF15 Direct Plan Growth Option : 10.60IPVF15 Direct Plan Dividend Option : 10.60
Options : Cumulative and Dividend Option
Application Amount for freshSubscription :Rs.5,000 (plus in multiple of Rs.10)
Min.Addl.Investment :Not Applicable
Exit load for Redemption / Switchout :- Lumpsum Investment OptionNot applicable
50
Fund Details
Diversified
Portfolio as on October 31, 2017
Quantitative Indicators
Benchmark
Average P/E : 26.17 Average P/BV : 4.74 Average Dividend Yield : 1.30
S&P BSE 500 Index
ICICI Prudential Value Fund - Series 15A Close ended equity scheme
RiskometerThis Product is suitable for investors who are seeking*:
*Investors should consult their financial advisers if in doubt about whether the product is suitable for them.
Monthly AAUM as on 31-Oct-17 : Rs. 573.56 crores
Closing AUM as on 31-Oct-17 :Rs. 596.77 crores
• Top Ten HoldingsDerivatives are considered at exposure value.
Entry load : Not Applicable
Annual Portfolio Turnover Ratio : Equity - 0.01 times, Others (Debt and Derivatives) - 0.02 times Combined Annual Portfolio Turnover Ratio : 0.03 times
Dividend History : Refer page no. from 127 to 135
SIP Returns : Refer page no. from 123 to 125
Total Expense Ratio @@ :
IPVF15 : 2.52% p. a.
IPVF15 Direct Plan : 0.52% p. a.
Investment Objective : Refer page no. from 136 to 139
Note : - “Portfolio Beta, Standard Deviation, R Squared, Sharpe Ratio and Tracking Error of the Scheme is not computed owing to the short ime frame since launch of the Scheme.”Portfolio turnover has been computed as the ratio of the lower value of purchase and sales, to the average net assets in the past one year (since inception for schemes that have not completed a year). The figures are not netted for derivative transactions.**In addition to the fund manager managing this fund, the ADR/GDR exposure is managed by Ms. Priyanka Khandelwal.@@ Total Expense Ratio is weighted average for the month. Ratio excludes Goods and Service Tax on management fees and includes B-15 clawback reversal, if any.
Mr. Sankaran Naren (Managing this fund since July 2017 & Overall 26 Years of experience)Mr. Ihab Dalwai (Managing this fund since July 2017 & Overall 5 years of experience)
Rating
Auto Ancillaries 1.65% Apollo Tyres Ltd. 1.65% Banks 17.18% • ICICI Bank Ltd. 6.24% • State Bank Of India 5.12% Axis Bank Ltd. 3.77% The Federal Bank Ltd. 2.04% Cement 5.27% • JK Lakshmi Cement Ltd. 4.03% Orient Cement Ltd. 1.24% Chemicals 2.46% Tata Chemicals Ltd. 2.46% Construction Project 10.08% • Larsen & Toubro Ltd. 7.17% Engineers India Ltd. 2.02% Ashoka Buildcon Ltd. 0.89% Consumer Durables 2.17% Greenply Industries Ltd. 2.17% Ferrous Metals 3.90% • JSW Steel Ltd. 3.90% Finance 4.52% HDFC Ltd. 2.86% Max Financial Services Ltd. 0.98% SBI Life Insurance Company Ltd. 0.68% Gas 7.68% • GAIL (India) Ltd. 5.46% Aegis Logistics Ltd. 2.22% Healthcare Services 1.59% Healthcare Global Enterprises Ltd. 1.59% Industrial Products 2.28% Cummins India Ltd. 2.28% Non - Ferrous Metals 2.15% Hindalco Industries Ltd. 2.15% Petroleum Products 8.20% • Indian Oil Corporation Ltd. 4.18% • Castrol India Ltd. 4.02% Pharmaceuticals 12.20% • Lupin Ltd. 4.31% Alembic Pharmaceuticals Ltd. 2.54% Unichem Laboratories Ltd. 2.05% J.B.Chemicals & Pharmaceuticals Ltd. 1.92% Cipla Ltd. 1.39% Power 7.70% • Tata Power Company Ltd. 4.05% NTPC Ltd. 3.64% Transportation 8.17% Interglobe Aviation Ltd. 1.98% The Great Eastern Shipping Company Ltd. 1.85% Gateway Distriparks Ltd. 1.77% Gujarat Pipavav Port Ltd. 1.37% VRL Logistics Ltd. 1.20% OPTIONS 0.54% Nifty 50 Index 0.54% Short Term Debt and net current assets 2.27% Total Net Assets 100.00%
Company/Issuer % to % to NAV NAV Derivatives
• Long term wealth creation
• A close ended equity fund that aims to provide capital appreciation by investing in a well diversified portfolio of stocks through fundamental analysis.
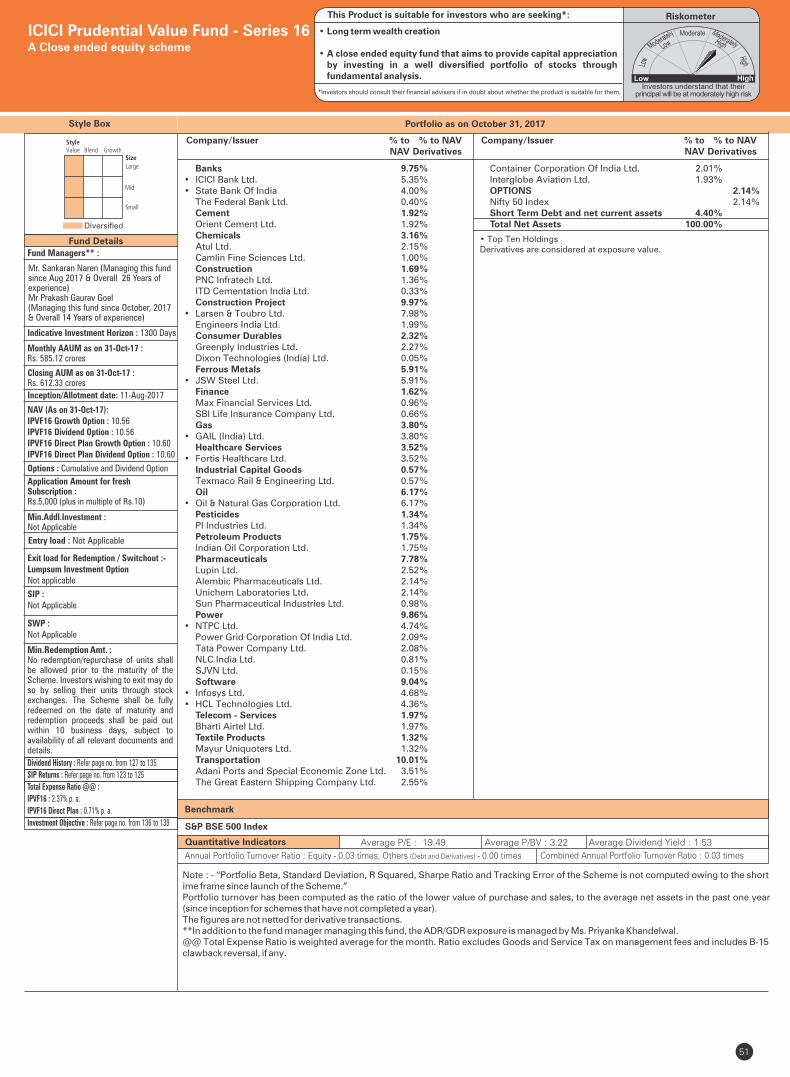
Style Box
Fund Managers** :
Indicative Investment Horizon : 1300 Days
Inception/Allotment date: 11-Aug-2017
SWP :Not Applicable
Min.Redemption Amt. :No redemption/repurchase of units shall be allowed prior to the maturity of the Scheme. Investors wishing to exit may do so by selling their units through stock exchanges. The Scheme shall be fully redeemed on the date of maturity and redemption proceeds shall be paid out within 10 business days, subject to availability of all relevant documents and details.
SIP :Not Applicable
NAV (As on 31-Oct-17):IPVF16 Growth Option : 10.56IPVF16 Dividend Option : 10.56IPVF16 Direct Plan Growth Option : 10.60IPVF16 Direct Plan Dividend Option : 10.60
Options : Cumulative and Dividend Option
Application Amount for freshSubscription :Rs.5,000 (plus in multiple of Rs.10)
Min.Addl.Investment :Not Applicable
Exit load for Redemption / Switchout :- Lumpsum Investment OptionNot applicable
51
Fund Details
Diversified
Portfolio as on October 31, 2017
Quantitative Indicators
Benchmark
Average P/E : 19.49 Average P/BV : 3.22 Average Dividend Yield : 1.53
S&P BSE 500 Index
ICICI Prudential Value Fund - Series 16A Close ended equity scheme
RiskometerThis Product is suitable for investors who are seeking*:
*Investors should consult their financial advisers if in doubt about whether the product is suitable for them.
Monthly AAUM as on 31-Oct-17 : Rs. 585.12 crores
Closing AUM as on 31-Oct-17 :Rs. 612.33 crores
Entry load : Not Applicable
Annual Portfolio Turnover Ratio : Equity - 0.03 times, Others (Debt and Derivatives) - 0.00 times Combined Annual Portfolio Turnover Ratio : 0.03 times
Dividend History : Refer page no. from 127 to 135
SIP Returns : Refer page no. from 123 to 125
Total Expense Ratio @@ :
IPVF16 : 2.37% p. a.
IPVF16 Direct Plan : 0.71% p. a.
Investment Objective : Refer page no. from 136 to 139
Note : - “Portfolio Beta, Standard Deviation, R Squared, Sharpe Ratio and Tracking Error of the Scheme is not computed owing to the short ime frame since launch of the Scheme.”Portfolio turnover has been computed as the ratio of the lower value of purchase and sales, to the average net assets in the past one year (since inception for schemes that have not completed a year). The figures are not netted for derivative transactions.**In addition to the fund manager managing this fund, the ADR/GDR exposure is managed by Ms. Priyanka Khandelwal.@@ Total Expense Ratio is weighted average for the month. Ratio excludes Goods and Service Tax on management fees and includes B-15 clawback reversal, if any.
Mr. Sankaran Naren (Managing this fund since Aug 2017 & Overall 26 Years of experience)
Mr Prakash Gaurav Goel(Managing this fund since October, 2017 & Overall 14 Years of experience)
Banks 9.75% • ICICI Bank Ltd. 5.35% • State Bank Of India 4.00% The Federal Bank Ltd. 0.40% Cement 1.92% Orient Cement Ltd. 1.92% Chemicals 3.16% Atul Ltd. 2.15% Camlin Fine Sciences Ltd. 1.00% Construction 1.69% PNC Infratech Ltd. 1.36% ITD Cementation India Ltd. 0.33% Construction Project 9.97% • Larsen & Toubro Ltd. 7.98% Engineers India Ltd. 1.99% Consumer Durables 2.32% Greenply Industries Ltd. 2.27% Dixon Technologies (India) Ltd. 0.05% Ferrous Metals 5.91% • JSW Steel Ltd. 5.91% Finance 1.62% Max Financial Services Ltd. 0.96% SBI Life Insurance Company Ltd. 0.66% Gas 3.80% • GAIL (India) Ltd. 3.80% Healthcare Services 3.52% • Fortis Healthcare Ltd. 3.52% Industrial Capital Goods 0.57% Texmaco Rail & Engineering Ltd. 0.57% Oil 6.17% • Oil & Natural Gas Corporation Ltd. 6.17% Pesticides 1.34% PI Industries Ltd. 1.34% Petroleum Products 1.75% Indian Oil Corporation Ltd. 1.75% Pharmaceuticals 7.78% Lupin Ltd. 2.52% Alembic Pharmaceuticals Ltd. 2.14% Unichem Laboratories Ltd. 2.14% Sun Pharmaceutical Industries Ltd. 0.98% Power 9.86% • NTPC Ltd. 4.74% Power Grid Corporation Of India Ltd. 2.09% Tata Power Company Ltd. 2.08% NLC India Ltd. 0.81% SJVN Ltd. 0.15% Software 9.04% • Infosys Ltd. 4.68% • HCL Technologies Ltd. 4.36% Telecom - Services 1.97% Bharti Airtel Ltd. 1.97% Textile Products 1.32% Mayur Uniquoters Ltd. 1.32% Transportation 10.01% Adani Ports and Special Economic Zone Ltd. 3.51% The Great Eastern Shipping Company Ltd. 2.55%
Company/Issuer % to % to NAV NAV Derivatives
Company/Issuer % to % to NAV NAV Derivatives
Container Corporation Of India Ltd. 2.01% Interglobe Aviation Ltd. 1.93% OPTIONS 2.14% Nifty 50 Index 2.14% Short Term Debt and net current assets 4.40% Total Net Assets 100.00%
• Top Ten HoldingsDerivatives are considered at exposure value.
• Long term wealth creation
• A close ended equity fund that aims to provide capital appreciation by investing in a well diversified portfolio of stocks through fundamental analysis.
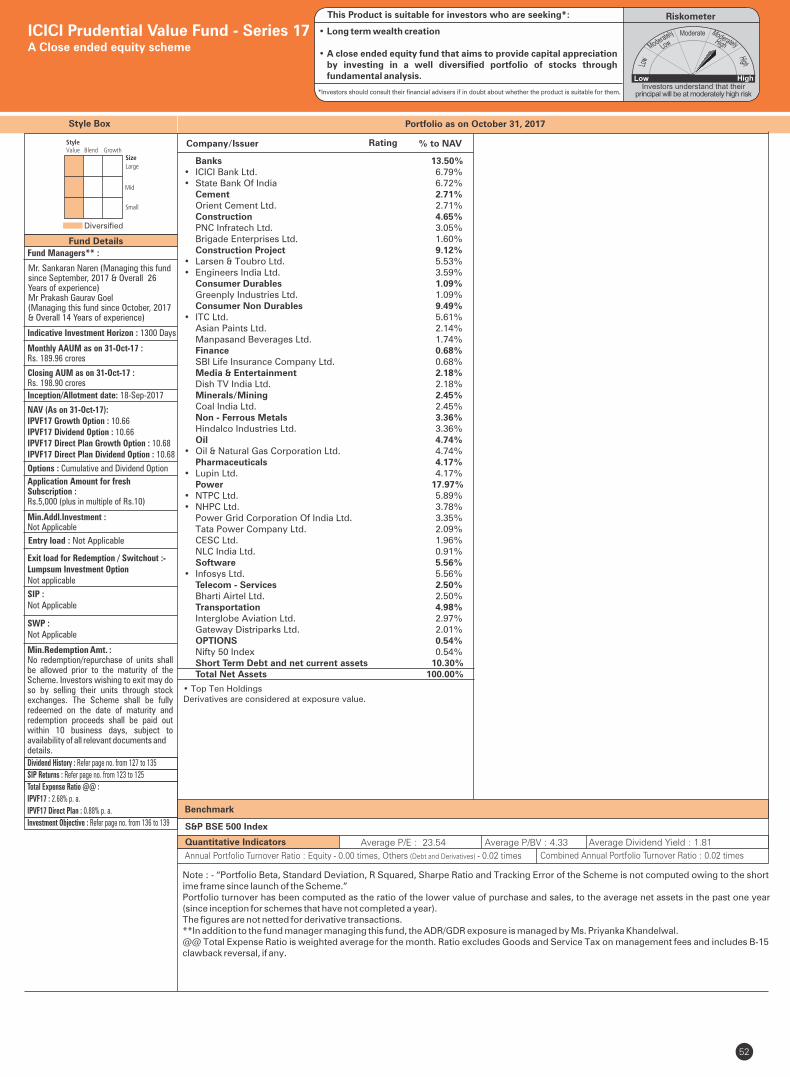
Style Box
Fund Managers** :
Indicative Investment Horizon : 1300 Days
Inception/Allotment date: 18-Sep-2017
SWP :Not Applicable
Min.Redemption Amt. :No redemption/repurchase of units shall be allowed prior to the maturity of the Scheme. Investors wishing to exit may do so by selling their units through stock exchanges. The Scheme shall be fully redeemed on the date of maturity and redemption proceeds shall be paid out within 10 business days, subject to availability of all relevant documents anddetails.
SIP :Not Applicable
NAV (As on 31-Oct-17):IPVF17 Growth Option : 10.66IPVF17 Dividend Option : 10.66IPVF17 Direct Plan Growth Option : 10.68IPVF17 Direct Plan Dividend Option : 10.68
Options : Cumulative and Dividend Option
Application Amount for freshSubscription :Rs.5,000 (plus in multiple of Rs.10)
Min.Addl.Investment :Not Applicable
Exit load for Redemption / Switchout :- Lumpsum Investment OptionNot applicable
52
Fund Details
Diversified
Portfolio as on October 31, 2017
Quantitative Indicators
Benchmark
Average P/E : 23.54 Average P/BV : 4.33 Average Dividend Yield : 1.81
S&P BSE 500 Index
ICICI Prudential Value Fund - Series 17A Close ended equity scheme
RiskometerThis Product is suitable for investors who are seeking*:
*Investors should consult their financial advisers if in doubt about whether the product is suitable for them.
Monthly AAUM as on 31-Oct-17 : Rs. 189.96 crores
Closing AUM as on 31-Oct-17 : Rs. 198.90 crores
Entry load : Not Applicable
Annual Portfolio Turnover Ratio : Equity - 0.00 times, Others (Debt and Derivatives) - 0.02 times Combined Annual Portfolio Turnover Ratio : 0.02 times
Dividend History : Refer page no. from 127 to 135
SIP Returns : Refer page no. from 123 to 125
Total Expense Ratio @@ :
IPVF17 : 2.68% p. a.
IPVF17 Direct Plan : 0.88% p. a.
Investment Objective : Refer page no. from 136 to 139
Note : - “Portfolio Beta, Standard Deviation, R Squared, Sharpe Ratio and Tracking Error of the Scheme is not computed owing to the short ime frame since launch of the Scheme.”Portfolio turnover has been computed as the ratio of the lower value of purchase and sales, to the average net assets in the past one year (since inception for schemes that have not completed a year). The figures are not netted for derivative transactions.**In addition to the fund manager managing this fund, the ADR/GDR exposure is managed by Ms. Priyanka Khandelwal.@@ Total Expense Ratio is weighted average for the month. Ratio excludes Goods and Service Tax on management fees and includes B-15 clawback reversal, if any.
Mr. Sankaran Naren (Managing this fund since September, 2017 & Overall 26 Years of experience)
Mr Prakash Gaurav Goel(Managing this fund since October, 2017 & Overall 14 Years of experience)
Banks 13.50% • ICICI Bank Ltd. 6.79% • State Bank Of India 6.72% Cement 2.71% Orient Cement Ltd. 2.71% Construction 4.65% PNC Infratech Ltd. 3.05% Brigade Enterprises Ltd. 1.60% Construction Project 9.12% • Larsen & Toubro Ltd. 5.53% • Engineers India Ltd. 3.59% Consumer Durables 1.09% Greenply Industries Ltd. 1.09% Consumer Non Durables 9.49% • ITC Ltd. 5.61% Asian Paints Ltd. 2.14% Manpasand Beverages Ltd. 1.74% Finance 0.68% SBI Life Insurance Company Ltd. 0.68% Media & Entertainment 2.18% Dish TV India Ltd. 2.18% Minerals/Mining 2.45% Coal India Ltd. 2.45% Non - Ferrous Metals 3.36% Hindalco Industries Ltd. 3.36% Oil 4.74% • Oil & Natural Gas Corporation Ltd. 4.74% Pharmaceuticals 4.17% • Lupin Ltd. 4.17% Power 17.97% • NTPC Ltd. 5.89% • NHPC Ltd. 3.78% Power Grid Corporation Of India Ltd. 3.35% Tata Power Company Ltd. 2.09% CESC Ltd. 1.96% NLC India Ltd. 0.91% Software 5.56% • Infosys Ltd. 5.56% Telecom - Services 2.50% Bharti Airtel Ltd. 2.50% Transportation 4.98% Interglobe Aviation Ltd. 2.97% Gateway Distriparks Ltd. 2.01% OPTIONS 0.54% Nifty 50 Index 0.54% Short Term Debt and net current assets 10.30% Total Net Assets 100.00%
RatingCompany/Issuer % to NAV
• Top Ten HoldingsDerivatives are considered at exposure value.
• Long term wealth creation
• A close ended equity fund that aims to provide capital appreciation by investing in a well diversified portfolio of stocks through fundamental analysis.
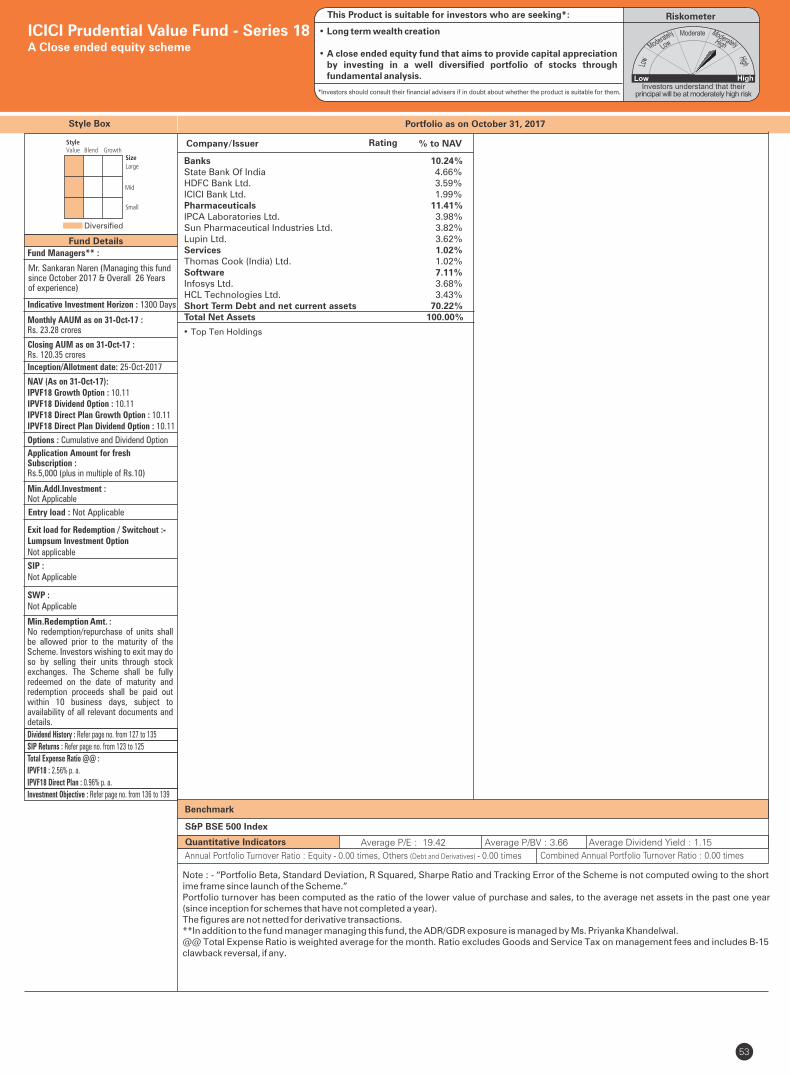
Style Box
Fund Managers** :
Indicative Investment Horizon : 1300 Days
Inception/Allotment date: 25-Oct-2017
SWP :Not Applicable
Min.Redemption Amt. :No redemption/repurchase of units shall be allowed prior to the maturity of the Scheme. Investors wishing to exit may do so by selling their units through stock exchanges. The Scheme shall be fully redeemed on the date of maturity and redemption proceeds shall be paid out within 10 business days, subject to availability of all relevant documents and details.
SIP :Not Applicable
NAV (As on 31-Oct-17):IPVF18 Growth Option : 10.11IPVF18 Dividend Option : 10.11IPVF18 Direct Plan Growth Option : 10.11IPVF18 Direct Plan Dividend Option : 10.11
Options : Cumulative and Dividend Option
Application Amount for freshSubscription :Rs.5,000 (plus in multiple of Rs.10)
Min.Addl.Investment :Not Applicable
Exit load for Redemption / Switchout :- Lumpsum Investment OptionNot applicable
53
Fund Details
Diversified
Portfolio as on October 31, 2017
Quantitative Indicators
Benchmark
Average P/E : 19.42 Average P/BV : 3.66 Average Dividend Yield : 1.15
S&P BSE 500 Index
ICICI Prudential Value Fund - Series 18A Close ended equity scheme
RiskometerThis Product is suitable for investors who are seeking*:
*Investors should consult their financial advisers if in doubt about whether the product is suitable for them.
Monthly AAUM as on 31-Oct-17 : Rs. 23.28 crores
Closing AUM as on 31-Oct-17 : Rs. 120.35 crores
Entry load : Not Applicable
Annual Portfolio Turnover Ratio : Equity - 0.00 times, Others (Debt and Derivatives) - 0.00 times Combined Annual Portfolio Turnover Ratio : 0.00 times
Dividend History : Refer page no. from 127 to 135
SIP Returns : Refer page no. from 123 to 125
Total Expense Ratio @@ :
IPVF18 : 2.56% p. a.
IPVF18 Direct Plan : 0.96% p. a.
Investment Objective : Refer page no. from 136 to 139
Note : - “Portfolio Beta, Standard Deviation, R Squared, Sharpe Ratio and Tracking Error of the Scheme is not computed owing to the short ime frame since launch of the Scheme.”Portfolio turnover has been computed as the ratio of the lower value of purchase and sales, to the average net assets in the past one year (since inception for schemes that have not completed a year). The figures are not netted for derivative transactions.**In addition to the fund manager managing this fund, the ADR/GDR exposure is managed by Ms. Priyanka Khandelwal.@@ Total Expense Ratio is weighted average for the month. Ratio excludes Goods and Service Tax on management fees and includes B-15 clawback reversal, if any.
Mr. Sankaran Naren (Managing this fund since October 2017 & Overall 26 Years of experience)
Banks 10.24%State Bank Of India 4.66%HDFC Bank Ltd. 3.59%ICICI Bank Ltd. 1.99%Pharmaceuticals 11.41%IPCA Laboratories Ltd. 3.98%Sun Pharmaceutical Industries Ltd. 3.82%Lupin Ltd. 3.62%Services 1.02%Thomas Cook (India) Ltd. 1.02%Software 7.11%Infosys Ltd. 3.68%HCL Technologies Ltd. 3.43%Short Term Debt and net current assets 70.22%Total Net Assets 100.00%
RatingCompany/Issuer % to NAV
• Top Ten Holdings
• Long term wealth creation
• A close ended equity fund that aims to provide capital appreciation by investing in a well diversified portfolio of stocks through fundamental analysis.
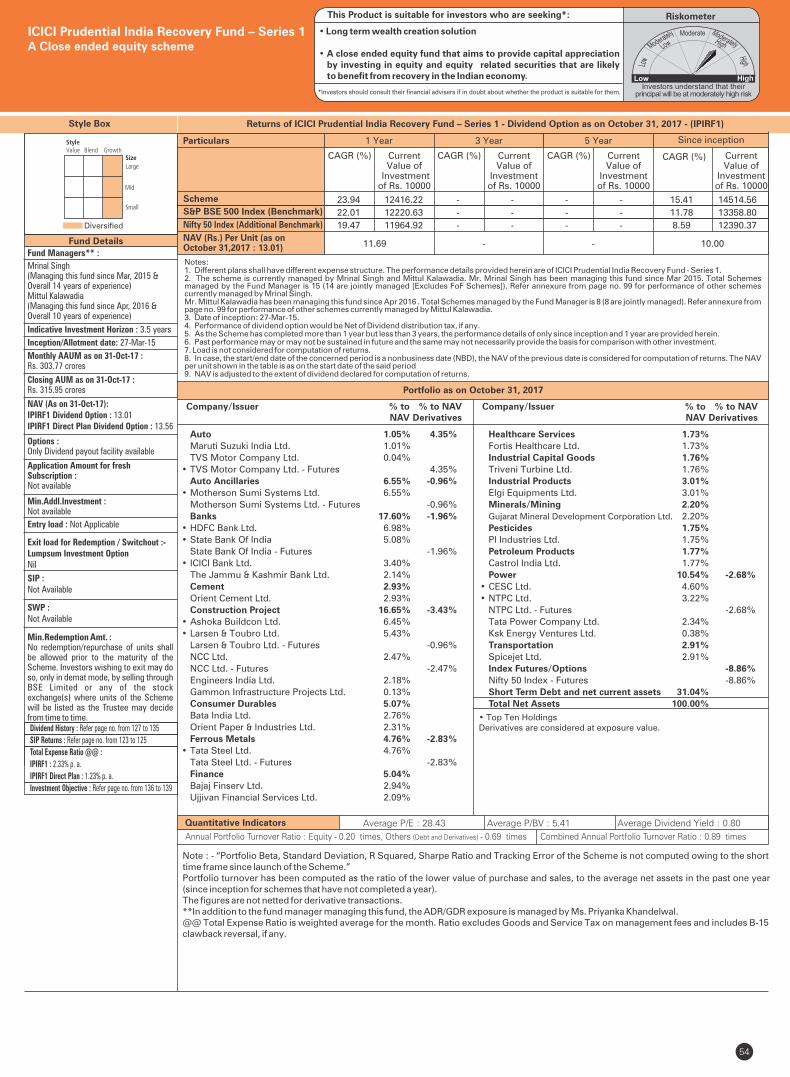
• Top Ten HoldingsDerivatives are considered at exposure value.
Style Box
Note : - “Portfolio Beta, Standard Deviation, R Squared, Sharpe Ratio and Tracking Error of the Scheme is not computed owing to the short time frame since launch of the Scheme.”Portfolio turnover has been computed as the ratio of the lower value of purchase and sales, to the average net assets in the past one year (since inception for schemes that have not completed a year). The figures are not netted for derivative transactions.**In addition to the fund manager managing this fund, the ADR/GDR exposure is managed by Ms. Priyanka Khandelwal.@@ Total Expense Ratio is weighted average for the month. Ratio excludes Goods and Service Tax on management fees and includes B-15 clawback reversal, if any.
Fund Managers** :
Mrinal Singh(Managing this fund since Mar, 2015 &Overall 14 years of experience)Mittul Kalawadia(Managing this fund since Apr, 2016 &Overall 10 years of experience)
Indicative Investment Horizon : 3.5 years
Inception/Allotment date: 27-Mar-15
SWP :Not Available
Min.Redemption Amt. :No redemption/repurchase of units shall be allowed prior to the maturity of the Scheme. Investors wishing to exit may do so, only in demat mode, by selling through BSE Limited or any of the stock exchange(s) where units of the Scheme will be listed as the Trustee may decide from time to time.
SIP :Not Available
NAV (As on 31-Oct-17):IPIRF1 Dividend Option : 13.01IPIRF1 Direct Plan Dividend Option : 13.56
Options :Only Dividend payout facility available
Application Amount for freshSubscription :Not available
Min.Addl.Investment :Not available
Exit load for Redemption / Switchout :- Lumpsum Investment OptionNil
54
Fund Details
Diversified
Quantitative Indicators Average P/E : 28.43 Average P/BV : 5.41 Average Dividend Yield : 0.80
Monthly AAUM as on 31-Oct-17 : Rs. 303.77 crores
Closing AUM as on 31-Oct-17 : Rs. 315.95 crores
ICICI Prudential India Recovery Fund – Series 1A Close ended equity scheme
Entry load : Not Applicable
RiskometerThis Product is suitable for investors who are seeking*:
• Long term wealth creation solution
• A close ended equity fund that aims to provide capital appreciation by investing in equity and equity related securities that are likely to benefit from recovery in the Indian economy.
*Investors should consult their financial advisers if in doubt about whether the product is suitable for them.
Annual Portfolio Turnover Ratio : Equity - 0.20 times, Others (Debt and Derivatives) - 0.69 times Combined Annual Portfolio Turnover Ratio : 0.89 times
Portfolio as on October 31, 2017
Returns of ICICI Prudential India Recovery Fund – Series 1 - Dividend Option as on October 31, 2017 - (IPIRF1)
Dividend History : Refer page no. from 127 to 135
SIP Returns : Refer page no. from 123 to 125
Total Expense Ratio @@ :
IPIRF1 : 2.33% p. a.
IPIRF1 Direct Plan : 1.23% p. a.
Investment Objective : Refer page no. from 136 to 139
Notes:1. Different plans shall have different expense structure. The performance details provided herein are of ICICI Prudential India Recovery Fund - Series 1.2. The scheme is currently managed by Mrinal Singh and Mittul Kalawadia. Mr. Mrinal Singh has been managing this fund since Mar 2015. Total Schemes managed by the Fund Manager . Refer annexure from page no. 99 for performance of other schemes is 15 (14 are jointly managed [Excludes FoF Schemes])currently managed by Mrinal Singh.Mr. Mittul Kalawadia has been managing this fund since Apr 2016 . Total Schemes managed by the Fund Manager Refer annexure from is 8 (8 are jointly managed).page no. 99 for performance of other schemes currently managed by Mittul Kalawadia.3. Date of inception: 27-Mar-15.4. Performance of dividend option would be Net of Dividend distribution tax, if any.5. As the Scheme has completed more than 1 year but less than 3 years, the performance details of only since inception and 1 year are provided herein.6. Past performance may or may not be sustained in future and the same may not necessarily provide the basis for comparison with other investment.7. Load is not considered for computation of returns.8. In case, the start/end date of the concerned period is a nonbusiness date (NBD), the NAV of the previous date is considered for computation of returns. The NAV per unit shown in the table is as on the start date of the said period9. NAV is adjusted to the extent of dividend declared for computation of returns.
Scheme
Nifty 50 Index (Additional Benchmark)
NAV (Rs.) Per Unit (as on October 31,2017 : 13.01)
CAGR (%)
10.00
S&P BSE 500 Index (Benchmark)
Since inception
CurrentValue of
Investment of Rs. 10000
CAGR (%) Current Value of
Investment of Rs. 10000
1 Year 3 Year 5 Year
CAGR (%) Current Value of
Investment of Rs. 10000
CAGR (%) Current Value of
Investment of Rs. 10000
11.69 - -
Particulars
23.94 12416.22 - - - - 15.41 14514.56
22.01 12220.63 - - - - 11.78 13358.80
19.47 11964.92 - - - - 8.59 12390.37
Auto 1.05% 4.35%
Maruti Suzuki India Ltd. 1.01%
TVS Motor Company Ltd. 0.04%
• TVS Motor Company Ltd. - Futures 4.35%
Auto Ancillaries 6.55% -0.96%
• Motherson Sumi Systems Ltd. 6.55%
Motherson Sumi Systems Ltd. - Futures -0.96%
Banks 17.60% -1.96%
• HDFC Bank Ltd. 6.98%
• State Bank Of India 5.08%
State Bank Of India - Futures -1.96%
• ICICI Bank Ltd. 3.40%
The Jammu & Kashmir Bank Ltd. 2.14%
Cement 2.93%
Orient Cement Ltd. 2.93%
Construction Project 16.65% -3.43%
• Ashoka Buildcon Ltd. 6.45%
• Larsen & Toubro Ltd. 5.43%
Larsen & Toubro Ltd. - Futures -0.96%
NCC Ltd. 2.47%
NCC Ltd. - Futures -2.47%
Engineers India Ltd. 2.18%
Gammon Infrastructure Projects Ltd. 0.13%
Consumer Durables 5.07%
Bata India Ltd. 2.76%
Orient Paper & Industries Ltd. 2.31%
Ferrous Metals 4.76% -2.83%
• Tata Steel Ltd. 4.76%
Tata Steel Ltd. - Futures -2.83%
Finance 5.04%
Bajaj Finserv Ltd. 2.94%
Ujjivan Financial Services Ltd. 2.09%
Company/Issuer % to % to NAV NAV Derivatives
Company/Issuer % to % to NAV NAV Derivatives
Healthcare Services 1.73%
Fortis Healthcare Ltd. 1.73%
Industrial Capital Goods 1.76%
Triveni Turbine Ltd. 1.76%
Industrial Products 3.01%
Elgi Equipments Ltd. 3.01%
Minerals/Mining 2.20%
Gujarat Mineral Development Corporation Ltd. 2.20%
Pesticides 1.75%
PI Industries Ltd. 1.75%
Petroleum Products 1.77%
Castrol India Ltd. 1.77%
Power 10.54% -2.68%
• CESC Ltd. 4.60%
• NTPC Ltd. 3.22%
NTPC Ltd. - Futures -2.68%
Tata Power Company Ltd. 2.34%
Ksk Energy Ventures Ltd. 0.38%
Transportation 2.91%
Spicejet Ltd. 2.91%
Index Futures/Options -8.86%
Nifty 50 Index - Futures -8.86%
Short Term Debt and net current assets 31.04%
Total Net Assets 100.00%
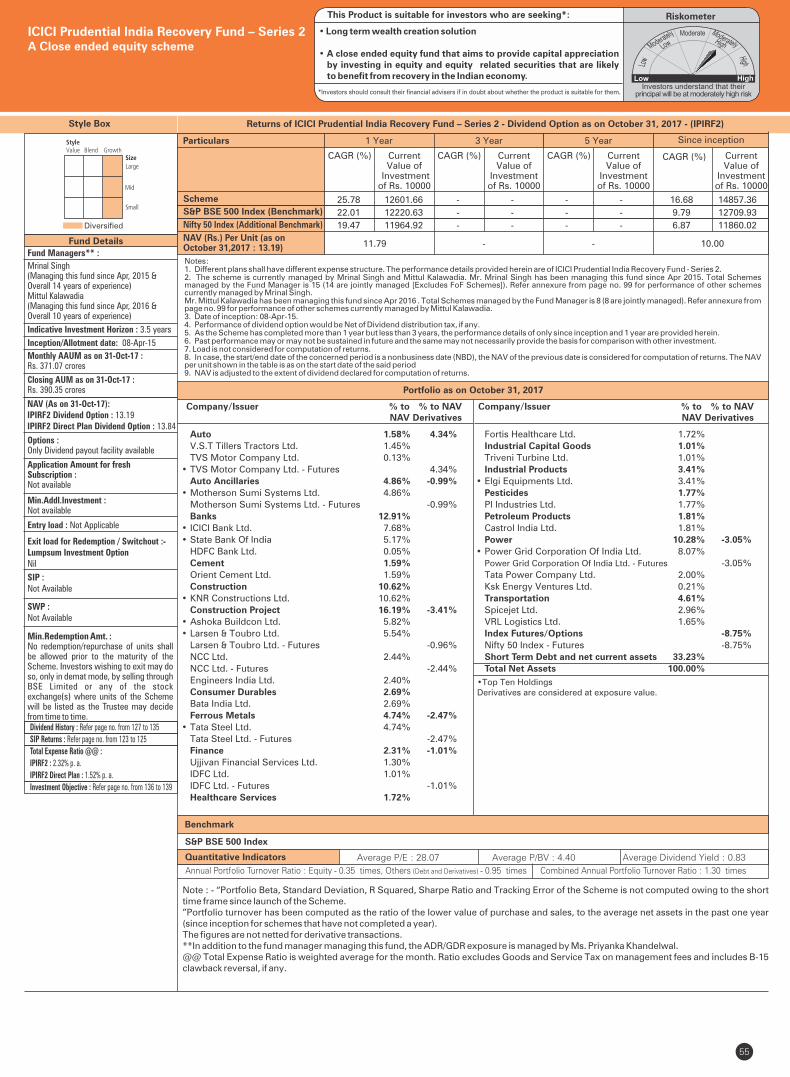
Style Box
Note : - “Portfolio Beta, Standard Deviation, R Squared, Sharpe Ratio and Tracking Error of the Scheme is not computed owing to the short time frame since launch of the Scheme.”Portfolio turnover has been computed as the ratio of the lower value of purchase and sales, to the average net assets in the past one year (since inception for schemes that have not completed a year). The figures are not netted for derivative transactions.**In addition to the fund manager managing this fund, the ADR/GDR exposure is managed by Ms. Priyanka Khandelwal.@@ Total Expense Ratio is weighted average for the month. Ratio excludes Goods and Service Tax on management fees and includes B-15 clawback reversal, if any.
Fund Managers** :
Mrinal Singh(Managing this fund since Apr, 2015 &Overall 14 years of experience)Mittul Kalawadia(Managing this fund since Apr, 2016 &Overall 10 years of experience)
Indicative Investment Horizon : 3.5 years
Inception/Allotment date: 08-Apr-15
SWP :Not Available
Min.Redemption Amt. :No redemption/repurchase of units shall be allowed prior to the maturity of the Scheme. Investors wishing to exit may do so, only in demat mode, by selling through BSE Limited or any of the stock exchange(s) where units of the Scheme will be listed as the Trustee may decide from time to time.
SIP :Not Available
NAV (As on 31-Oct-17):IPIRF2 Dividend Option : 13.19IPIRF2 Direct Plan Dividend Option : 13.84
Options :Only Dividend payout facility available
Application Amount for freshSubscription :Not available
Min.Addl.Investment :Not available
Entry load : Not Applicable
Exit load for Redemption / Switchout :- Lumpsum Investment OptionNil
55
Fund Details
Diversified
Quantitative Indicators
Benchmark
Average P/E : 28.07 Average P/BV : 4.40 Average Dividend Yield : 0.83
S&P BSE 500 Index
• Top Ten HoldingsDerivatives are considered at exposure value.
Auto 1.58% 4.34%
V.S.T Tillers Tractors Ltd. 1.45%
TVS Motor Company Ltd. 0.13%
• TVS Motor Company Ltd. - Futures 4.34%
Auto Ancillaries 4.86% -0.99%
• Motherson Sumi Systems Ltd. 4.86%
Motherson Sumi Systems Ltd. - Futures -0.99%
Banks 12.91%
• ICICI Bank Ltd. 7.68%
• State Bank Of India 5.17%
HDFC Bank Ltd. 0.05%
Cement 1.59%
Orient Cement Ltd. 1.59%
Construction 10.62%
• KNR Constructions Ltd. 10.62%
Construction Project 16.19% -3.41%
• Ashoka Buildcon Ltd. 5.82%
• Larsen & Toubro Ltd. 5.54%
Larsen & Toubro Ltd. - Futures -0.96%
NCC Ltd. 2.44%
NCC Ltd. - Futures -2.44%
Engineers India Ltd. 2.40%
Consumer Durables 2.69%
Bata India Ltd. 2.69%
Ferrous Metals 4.74% -2.47%
• Tata Steel Ltd. 4.74%
Tata Steel Ltd. - Futures -2.47%
Finance 2.31% -1.01%
Ujjivan Financial Services Ltd. 1.30%
IDFC Ltd. 1.01%
IDFC Ltd. - Futures -1.01%
Healthcare Services 1.72%
ICICI Prudential India Recovery Fund – Series 2A Close ended equity scheme
RiskometerThis Product is suitable for investors who are seeking*:
• Long term wealth creation solution
• A close ended equity fund that aims to provide capital appreciation by investing in equity and equity related securities that are likely to benefit from recovery in the Indian economy.
*Investors should consult their financial advisers if in doubt about whether the product is suitable for them.
Annual Portfolio Turnover Ratio : Equity - 0.35 times, Others (Debt and Derivatives) - 0.95 times Combined Annual Portfolio Turnover Ratio : 1.30 times
Monthly AAUM as on 31-Oct-17 : Rs. 371.07 crores
Closing AUM as on 31-Oct-17 : Rs. 390.35 crores Portfolio as on October 31, 2017
Returns of ICICI Prudential India Recovery Fund – Series 2 - Dividend Option as on October 31, 2017 - (IPIRF2)
Dividend History : Refer page no. from 127 to 135
SIP Returns : Refer page no. from 123 to 125
Total Expense Ratio @@ :
IPIRF2 : 2.32% p. a.
IPIRF2 Direct Plan : 1.52% p. a.
Investment Objective : Refer page no. from 136 to 139
Fortis Healthcare Ltd. 1.72%
Industrial Capital Goods 1.01%
Triveni Turbine Ltd. 1.01%
Industrial Products 3.41%
• Elgi Equipments Ltd. 3.41%
Pesticides 1.77%
PI Industries Ltd. 1.77%
Petroleum Products 1.81%
Castrol India Ltd. 1.81%
Power 10.28% -3.05%
• Power Grid Corporation Of India Ltd. 8.07%
Power Grid Corporation Of India Ltd. - Futures -3.05%
Tata Power Company Ltd. 2.00%
Ksk Energy Ventures Ltd. 0.21%
Transportation 4.61%
Spicejet Ltd. 2.96%
VRL Logistics Ltd. 1.65%
Index Futures/Options -8.75%
Nifty 50 Index - Futures -8.75%
Short Term Debt and net current assets 33.23%
Total Net Assets 100.00%
Notes:1. Different plans shall have different expense structure. The performance details provided herein are of ICICI Prudential India Recovery Fund - Series 2.2. The scheme is currently managed by Mrinal Singh and Mittul Kalawadia. Mr. Mrinal Singh has been managing this fund since Apr 2015. Total Schemes managed by the Fund Manager . Refer annexure from page no. 99 for performance of other schemes is 15 (14 are jointly managed [Excludes FoF Schemes])currently managed by Mrinal Singh.Mr. Mittul Kalawadia has been managing this fund since Apr 2016 . Total Schemes managed by the Fund Manager Refer annexure from is 8 (8 are jointly managed).page no. 99 for performance of other schemes currently managed by Mittul Kalawadia.3. Date of inception: 08-Apr-15.4. Performance of dividend option would be Net of Dividend distribution tax, if any.5. As the Scheme has completed more than 1 year but less than 3 years, the performance details of only since inception and 1 year are provided herein.6. Past performance may or may not be sustained in future and the same may not necessarily provide the basis for comparison with other investment.7. Load is not considered for computation of returns.8. In case, the start/end date of the concerned period is a nonbusiness date (NBD), the NAV of the previous date is considered for computation of returns. The NAV per unit shown in the table is as on the start date of the said period9. NAV is adjusted to the extent of dividend declared for computation of returns.
Scheme
Nifty 50 Index (Additional Benchmark)
NAV (Rs.) Per Unit (as on October 31,2017 : 13.19)
CAGR (%)
10.00
S&P BSE 500 Index (Benchmark)
Since inception
CurrentValue of
Investment of Rs. 10000
CAGR (%) Current Value of
Investment of Rs. 10000
1 Year 3 Year 5 Year
CAGR (%) Current Value of
Investment of Rs. 10000
CAGR (%) Current Value of
Investment of Rs. 10000
11.79 - -
Particulars
25.78 12601.66 - - - - 16.68 14857.36
22.01 12220.63 - - - - 9.79 12709.93
19.47 11964.92 - - - - 6.87 11860.02
Company/Issuer % to % to NAV NAV Derivatives
Company/Issuer % to % to NAV NAV Derivatives
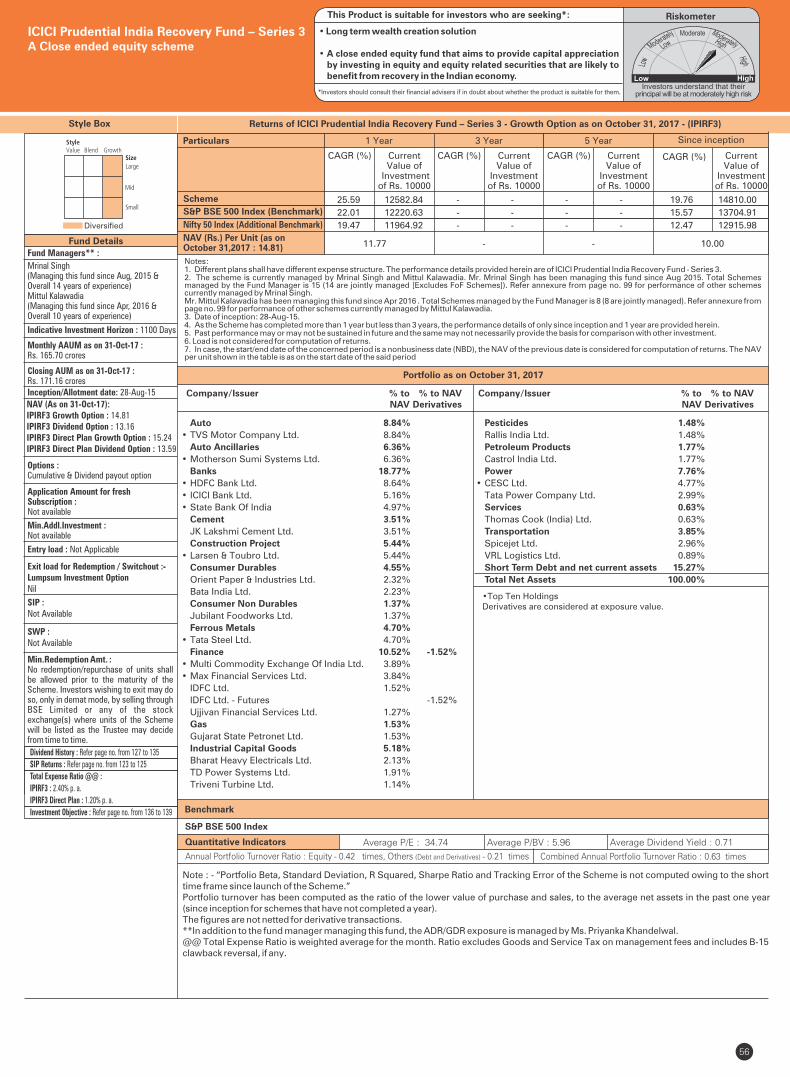
Style Box
Note : - “Portfolio Beta, Standard Deviation, R Squared, Sharpe Ratio and Tracking Error of the Scheme is not computed owing to the short time frame since launch of the Scheme.”Portfolio turnover has been computed as the ratio of the lower value of purchase and sales, to the average net assets in the past one year (since inception for schemes that have not completed a year). The figures are not netted for derivative transactions.**In addition to the fund manager managing this fund, the ADR/GDR exposure is managed by Ms. Priyanka Khandelwal.@@ Total Expense Ratio is weighted average for the month. Ratio excludes Goods and Service Tax on management fees and includes B-15 clawback reversal, if any.
Fund Managers** :
Mrinal Singh(Managing this fund since Aug, 2015 &Overall 14 years of experience)Mittul Kalawadia(Managing this fund since Apr, 2016 &Overall 10 years of experience)
Indicative Investment Horizon : 1100 Days
Inception/Allotment date: 28-Aug-15
SWP :Not Available
Min.Redemption Amt. :No redemption/repurchase of units shall be allowed prior to the maturity of the Scheme. Investors wishing to exit may do so, only in demat mode, by selling through BSE Limited or any of the stock exchange(s) where units of the Scheme will be listed as the Trustee may decide from time to time.
SIP :Not Available
NAV (As on 31-Oct-17):IPIRF3 Growth Option : 14.81IPIRF3 Dividend Option : 13.16IPIRF3 Direct Plan Growth Option : 15.24IPIRF3 Direct Plan Dividend Option : 13.59
Options :Cumulative & Dividend payout option
Application Amount for freshSubscription :Not available
Min.Addl.Investment :Not available
Exit load for Redemption / Switchout :- Lumpsum Investment OptionNil
56
Fund Details
Diversified
Quantitative Indicators
Benchmark
Average P/E : 34.74 Average P/BV : 5.96 Average Dividend Yield : 0.71
S&P BSE 500 Index
• Top Ten HoldingsDerivatives are considered at exposure value.
ICICI Prudential India Recovery Fund – Series 3A Close ended equity scheme
Entry load : Not Applicable
RiskometerThis Product is suitable for investors who are seeking*:
• Long term wealth creation solution
• A close ended equity fund that aims to provide capital appreciation by investing in equity and equity related securities that are likely to benefit from recovery in the Indian economy.
*Investors should consult their financial advisers if in doubt about whether the product is suitable for them.
Monthly AAUM as on 31-Oct-17 : Rs. 165.70 crores
Closing AUM as on 31-Oct-17 : Rs. 171.16 crores
Annual Portfolio Turnover Ratio : Equity - 0.42 times, Others (Debt and Derivatives) - 0.21 times Combined Annual Portfolio Turnover Ratio : 0.63 times
Dividend History : Refer page no. from 127 to 135
SIP Returns : Refer page no. from 123 to 125
Total Expense Ratio @@ :
IPIRF3 : 2.40% p. a.
IPIRF3 Direct Plan : 1.20% p. a.
Investment Objective : Refer page no. from 136 to 139
Portfolio as on October 31, 2017
Returns of ICICI Prudential India Recovery Fund – Series 3 - Growth Option as on October 31, 2017 - (IPIRF3)
Notes:1. Different plans shall have different expense structure. The performance details provided herein are of ICICI Prudential India Recovery Fund - Series 3.2. The scheme is currently managed by Mrinal Singh and Mittul Kalawadia. Mr. Mrinal Singh has been managing this fund since Aug 2015. Total Schemes managed by the Fund Manager . Refer annexure from page no. 99 for performance of other schemes is 15 (14 are jointly managed [Excludes FoF Schemes])currently managed by Mrinal Singh.Mr. Mittul Kalawadia has been managing this fund since Apr 2016 . Total Schemes managed by the Fund Manager Refer annexure from is 8 (8 are jointly managed).page no. 99 for performance of other schemes currently managed by Mittul Kalawadia.3. Date of inception: 28-Aug-15.4. As the Scheme has completed more than 1 year but less than 3 years, the performance details of only since inception and 1 year are provided herein.5. Past performance may or may not be sustained in future and the same may not necessarily provide the basis for comparison with other investment.6. Load is not considered for computation of returns.7. In case, the start/end date of the concerned period is a nonbusiness date (NBD), the NAV of the previous date is considered for computation of returns. The NAV per unit shown in the table is as on the start date of the said period
Scheme
Nifty 50 Index (Additional Benchmark)
NAV (Rs.) Per Unit (as on October 31,2017 : 14.81)
CAGR (%)
10.00
S&P BSE 500 Index (Benchmark)
Since inception
CurrentValue of
Investment of Rs. 10000
CAGR (%) Current Value of
Investment of Rs. 10000
1 Year 3 Year 5 Year
CAGR (%) Current Value of
Investment of Rs. 10000
CAGR (%) Current Value of
Investment of Rs. 10000
11.77 - -
Particulars
25.59 12582.84 - - - - 19.76 14810.00
22.01 12220.63 - - - - 15.57 13704.91
19.47 11964.92 - - - - 12.47 12915.98
Auto 8.84%
• TVS Motor Company Ltd. 8.84%
Auto Ancillaries 6.36%
• Motherson Sumi Systems Ltd. 6.36%
Banks 18.77%
• HDFC Bank Ltd. 8.64%
• ICICI Bank Ltd. 5.16%
• State Bank Of India 4.97%
Cement 3.51%
JK Lakshmi Cement Ltd. 3.51%
Construction Project 5.44%
• Larsen & Toubro Ltd. 5.44%
Consumer Durables 4.55%
Orient Paper & Industries Ltd. 2.32%
Bata India Ltd. 2.23%
Consumer Non Durables 1.37%
Jubilant Foodworks Ltd. 1.37%
Ferrous Metals 4.70%
• Tata Steel Ltd. 4.70%
Finance 10.52% -1.52%
• Multi Commodity Exchange Of India Ltd. 3.89%
• Max Financial Services Ltd. 3.84%
IDFC Ltd. 1.52%
IDFC Ltd. - Futures -1.52%
Ujjivan Financial Services Ltd. 1.27%
Gas 1.53%
Gujarat State Petronet Ltd. 1.53%
Industrial Capital Goods 5.18%
Bharat Heavy Electricals Ltd. 2.13%
TD Power Systems Ltd. 1.91%
Triveni Turbine Ltd. 1.14%
Pesticides 1.48%
Rallis India Ltd. 1.48%
Petroleum Products 1.77%
Castrol India Ltd. 1.77%
Power 7.76%
• CESC Ltd. 4.77%
Tata Power Company Ltd. 2.99%
Services 0.63%
Thomas Cook (India) Ltd. 0.63%
Transportation 3.85%
Spicejet Ltd. 2.96%
VRL Logistics Ltd. 0.89%
Short Term Debt and net current assets 15.27%
Total Net Assets 100.00%
Company/Issuer % to % to NAV NAV Derivatives
Company/Issuer % to % to NAV NAV Derivatives
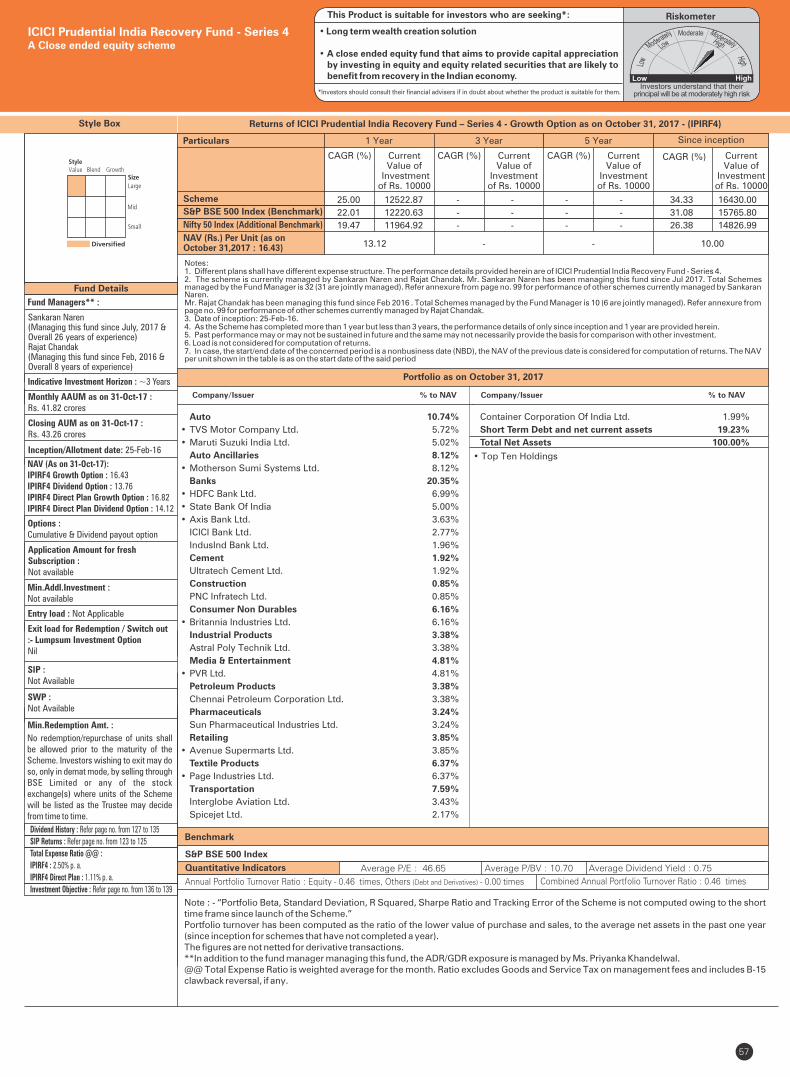
57
Fund Managers** :
Sankaran Naren(Managing this fund since July, 2017 &Overall 26 years of experience)Rajat Chandak(Managing this fund since Feb, 2016 &Overall 8 years of experience)
Indicative Investment Horizon : ~3 Years
Inception/Allotment date: 25-Feb-16
NAV (As on 31-Oct-17):IPIRF4 Growth Option : 16.43IPIRF4 Dividend Option : 13.76IPIRF4 Direct Plan Growth Option : 16.82IPIRF4 Direct Plan Dividend Option : 14.12
Options :Cumulative & Dividend payout option
Application Amount for freshSubscription :Not available
Min.Addl.Investment :Not available
Exit load for Redemption / Switch out :- Lumpsum Investment OptionNil
SIP :Not Available
SWP :Not Available
Min.Redemption Amt. :
Style Box
Monthly AAUM as on 31-Oct-17 : Rs. 41.82 crores
Closing AUM as on 31-Oct-17 : Rs. 43.26 crores
ICICI Prudential India Recovery Fund - Series 4A Close ended equity scheme
Entry load : Not Applicable
RiskometerThis Product is suitable for investors who are seeking*:
• Long term wealth creation solution
• A close ended equity fund that aims to provide capital appreciation by investing in equity and equity related securities that are likely to benefit from recovery in the Indian economy.
*Investors should consult their financial advisers if in doubt about whether the product is suitable for them.
No redemption/repurchase of units shall be allowed prior to the maturity of the Scheme. Investors wishing to exit may do so, only in demat mode, by selling through BSE Limited or any of the stock exchange(s) where units of the Scheme will be listed as the Trustee may decide from time to time.
Benchmark
S&P BSE 500 Index
Note : - “Portfolio Beta, Standard Deviation, R Squared, Sharpe Ratio and Tracking Error of the Scheme is not computed owing to the short time frame since launch of the Scheme.”Portfolio turnover has been computed as the ratio of the lower value of purchase and sales, to the average net assets in the past one year (since inception for schemes that have not completed a year). The figures are not netted for derivative transactions.**In addition to the fund manager managing this fund, the ADR/GDR exposure is managed by Ms. Priyanka Khandelwal.@@ Total Expense Ratio is weighted average for the month. Ratio excludes Goods and Service Tax on management fees and includes B-15 clawback reversal, if any.
Auto 10.74%
• TVS Motor Company Ltd. 5.72%
• Maruti Suzuki India Ltd. 5.02%
Auto Ancillaries 8.12%
• Motherson Sumi Systems Ltd. 8.12%
Banks 20.35%
• HDFC Bank Ltd. 6.99%
• State Bank Of India 5.00%
• Axis Bank Ltd. 3.63%
ICICI Bank Ltd. 2.77%
IndusInd Bank Ltd. 1.96%
Cement 1.92%
Ultratech Cement Ltd. 1.92%
Construction 0.85%
PNC Infratech Ltd. 0.85%
Consumer Non Durables 6.16%
• Britannia Industries Ltd. 6.16%
Industrial Products 3.38%
Astral Poly Technik Ltd. 3.38%
Media & Entertainment 4.81%
• PVR Ltd. 4.81%
Petroleum Products 3.38%
Chennai Petroleum Corporation Ltd. 3.38%
Pharmaceuticals 3.24%
Sun Pharmaceutical Industries Ltd. 3.24%
Retailing 3.85%
• Avenue Supermarts Ltd. 3.85%
Textile Products 6.37%
• Page Industries Ltd. 6.37%
Transportation 7.59%
Interglobe Aviation Ltd. 3.43%
Spicejet Ltd. 2.17%
Quantitative Indicators Average P/E : 46.65 Average P/BV : 10.70 Average Dividend Yield : 0.75
Annual Portfolio Turnover Ratio : Equity - 0.46 times, Others (Debt and Derivatives) - 0.00 times Combined Annual Portfolio Turnover Ratio : 0.46 times
• Top Ten Holdings
Dividend History : Refer page no. from 127 to 135
SIP Returns : Refer page no. from 123 to 125
Total Expense Ratio @@ :
IPIRF4 : 2.50% p. a.
IPIRF4 Direct Plan : 1.11% p. a.
Investment Objective : Refer page no. from 136 to 139
Notes:1. Different plans shall have different expense structure. The performance details provided herein are of ICICI Prudential India Recovery Fund - Series 4.2. The scheme is currently managed by Sankaran Naren and Rajat Chandak. Mr. Sankaran Naren has been managing this fund since Jul 2017. Total Schemes managed by the Fund Manager is 32 (31 are jointly managed). Refer annexure from page no. 99 for performance of other schemes currently managed by Sankaran Naren.Mr. Rajat Chandak has been managing this fund since Feb 2016 . Total Schemes managed by the Fund Manager is 10 (6 are jointly managed). Refer annexure from page no. 99 for performance of other schemes currently managed by Rajat Chandak.3. Date of inception: 25-Feb-16.4. As the Scheme has completed more than 1 year but less than 3 years, the performance details of only since inception and 1 year are provided herein.5. Past performance may or may not be sustained in future and the same may not necessarily provide the basis for comparison with other investment.6. Load is not considered for computation of returns.7. In case, the start/end date of the concerned period is a nonbusiness date (NBD), the NAV of the previous date is considered for computation of returns. The NAV per unit shown in the table is as on the start date of the said period
Scheme
Nifty 50 Index (Additional Benchmark)
NAV (Rs.) Per Unit (as on October 31,2017 : 16.43)
CAGR (%)
10.00
S&P BSE 500 Index (Benchmark)
Since inception
CurrentValue of
Investment of Rs. 10000
CAGR (%) Current Value of
Investment of Rs. 10000
1 Year 3 Year 5 Year
CAGR (%) Current Value of
Investment of Rs. 10000
CAGR (%) Current Value of
Investment of Rs. 10000
13.12 - -
Particulars
25.00 12522.87 - - - - 34.33 16430.00
22.01 12220.63 - - - - 31.08 15765.80
19.47 11964.92 - - - - 26.38 14826.99
Company/Issuer % to NAV
Portfolio as on October 31, 2017
Company/Issuer % to NAV
Returns of ICICI Prudential India Recovery Fund – Series 4 - Growth Option as on October 31, 2017 - (IPIRF4)
Container Corporation Of India Ltd. 1.99%
Short Term Debt and net current assets 19.23%
Total Net Assets 100.00%
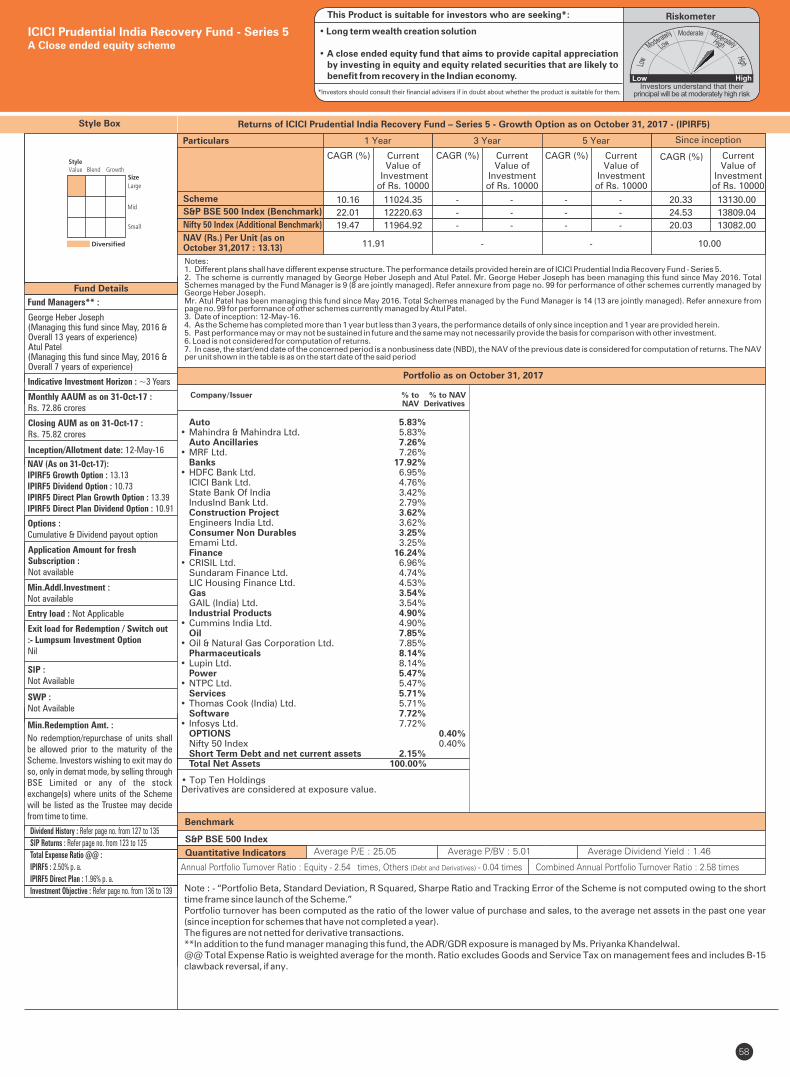
58
Fund Managers** :
George Heber Joseph(Managing this fund since May, 2016 &Overall 13 years of experience)Atul Patel(Managing this fund since May, 2016 &Overall 7 years of experience)
Indicative Investment Horizon : ~3 Years
Inception/Allotment date: 12-May-16
NAV (As on 31-Oct-17):IPIRF5 Growth Option : 13.13IPIRF5 Dividend Option : 10.73IPIRF5 Direct Plan Growth Option : 13.39IPIRF5 Direct Plan Dividend Option : 10.91
Options :Cumulative & Dividend payout option
Application Amount for freshSubscription :Not available
Min.Addl.Investment :Not available
Exit load for Redemption / Switch out :- Lumpsum Investment OptionNil
SIP :Not Available
SWP :Not Available
Min.Redemption Amt. :
Style Box Returns of ICICI Prudential India Recovery Fund – Series 5 - Growth Option as on October 31, 2017 - (IPIRF5)
Monthly AAUM as on 31-Oct-17 : Rs. 72.86 crores
Closing AUM as on 31-Oct-17 : Rs. 75.82 crores
ICICI Prudential India Recovery Fund - Series 5A Close ended equity scheme
Entry load : Not Applicable
RiskometerThis Product is suitable for investors who are seeking*:
• Long term wealth creation solution
• A close ended equity fund that aims to provide capital appreciation by investing in equity and equity related securities that are likely to benefit from recovery in the Indian economy.
*Investors should consult their financial advisers if in doubt about whether the product is suitable for them.
No redemption/repurchase of units shall be allowed prior to the maturity of the Scheme. Investors wishing to exit may do so, only in demat mode, by selling through BSE Limited or any of the stock exchange(s) where units of the Scheme will be listed as the Trustee may decide from time to time.
Benchmark
S&P BSE 500 Index
Note : - “Portfolio Beta, Standard Deviation, R Squared, Sharpe Ratio and Tracking Error of the Scheme is not computed owing to the short time frame since launch of the Scheme.”Portfolio turnover has been computed as the ratio of the lower value of purchase and sales, to the average net assets in the past one year (since inception for schemes that have not completed a year). The figures are not netted for derivative transactions.**In addition to the fund manager managing this fund, the ADR/GDR exposure is managed by Ms. Priyanka Khandelwal.@@ Total Expense Ratio is weighted average for the month. Ratio excludes Goods and Service Tax on management fees and includes B-15 clawback reversal, if any.
Quantitative Indicators Average P/E : 25.05 Average P/BV : 5.01 Average Dividend Yield : 1.46
• Top Ten HoldingsDerivatives are considered at exposure value.
Auto 5.83% • Mahindra & Mahindra Ltd. 5.83% Auto Ancillaries 7.26% • MRF Ltd. 7.26% Banks 17.92% • HDFC Bank Ltd. 6.95% ICICI Bank Ltd. 4.76% State Bank Of India 3.42% IndusInd Bank Ltd. 2.79% Construction Project 3.62% Engineers India Ltd. 3.62% Consumer Non Durables 3.25% Emami Ltd. 3.25% Finance 16.24% • CRISIL Ltd. 6.96% Sundaram Finance Ltd. 4.74% LIC Housing Finance Ltd. 4.53% Gas 3.54% GAIL (India) Ltd. 3.54% Industrial Products 4.90% • Cummins India Ltd. 4.90% Oil 7.85% • Oil & Natural Gas Corporation Ltd. 7.85% Pharmaceuticals 8.14% • Lupin Ltd. 8.14% Power 5.47% • NTPC Ltd. 5.47% Services 5.71% • Thomas Cook (India) Ltd. 5.71% Software 7.72% • Infosys Ltd. 7.72% OPTIONS 0.40% Nifty 50 Index 0.40% Short Term Debt and net current assets 2.15% Total Net Assets 100.00%
Company/Issuer % to % to NAV NAV Derivatives
Annual Portfolio Turnover Ratio : Equity - 2.54 times, Others (Debt and Derivatives) - 0.04 times Combined Annual Portfolio Turnover Ratio : 2.58 times
Dividend History : Refer page no. from 127 to 135
SIP Returns : Refer page no. from 123 to 125
Total Expense Ratio @@ :
IPIRF5 : 2.50% p. a.
IPIRF5 Direct Plan : 1.96% p. a.
Investment Objective : Refer page no. from 136 to 139
Scheme
Nifty 50 Index (Additional Benchmark)
NAV (Rs.) Per Unit (as on October 31,2017 : 13.13)
CAGR (%)
10.00
S&P BSE 500 Index (Benchmark)
Since inception
CurrentValue of
Investment of Rs. 10000
CAGR (%) Current Value of
Investment of Rs. 10000
1 Year 3 Year 5 Year
CAGR (%) Current Value of
Investment of Rs. 10000
CAGR (%) Current Value of
Investment of Rs. 10000
11.91 - -
Particulars
10.16 11024.35 - - - - 20.33 13130.00
22.01 12220.63 - - - - 24.53 13809.04
19.47 11964.92 - - - - 20.03 13082.00
Notes:1. Different plans shall have different expense structure. The performance details provided herein are of ICICI Prudential India Recovery Fund - Series 5.2. The scheme is currently managed by George Heber Joseph and Atul Patel. Mr. George Heber Joseph has been managing this fund since May 2016. Total Schemes managed by the Fund Manager is 9 (8 are jointly managed). Refer annexure from page no. 99 for performance of other schemes currently managed by George Heber Joseph.Mr. Atul Patel has been managing this fund since May 2016. Total Schemes managed by the Fund Manager is 14 (13 are jointly managed). Refer annexure from page no. 99 for performance of other schemes currently managed by Atul Patel.3. Date of inception: 12-May-16.4. As the Scheme has completed more than 1 year but less than 3 years, the performance details of only since inception and 1 year are provided herein.5. Past performance may or may not be sustained in future and the same may not necessarily provide the basis for comparison with other investment.6. Load is not considered for computation of returns.7. In case, the start/end date of the concerned period is a nonbusiness date (NBD), the NAV of the previous date is considered for computation of returns. The NAV per unit shown in the table is as on the start date of the said period
Portfolio as on October 31, 2017
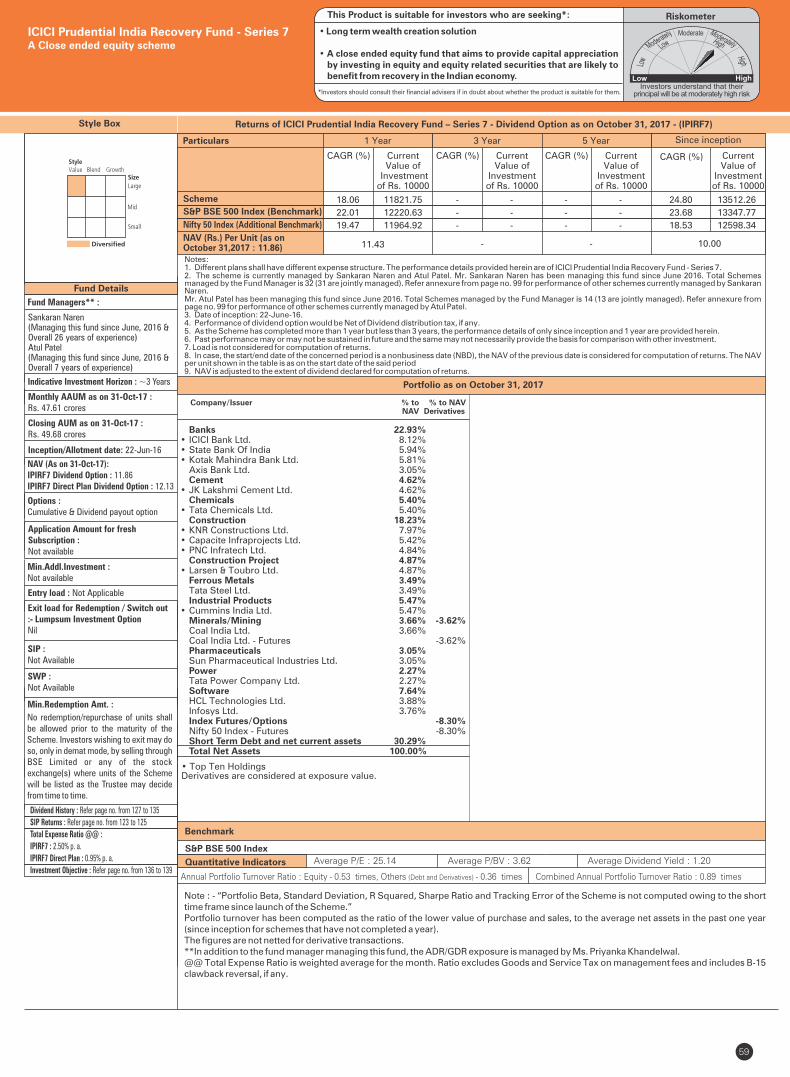
59
Fund Managers** :
Sankaran Naren(Managing this fund since June, 2016 &Overall 26 years of experience)Atul Patel(Managing this fund since June, 2016 &Overall 7 years of experience)
Indicative Investment Horizon : ~3 Years
Inception/Allotment date: 22-Jun-16
NAV (As on 31-Oct-17):IPIRF7 Dividend Option : 11.86IPIRF7 Direct Plan Dividend Option : 12.13
Options :Cumulative & Dividend payout option
Application Amount for freshSubscription :Not available
Min.Addl.Investment :Not available
Exit load for Redemption / Switch out :- Lumpsum Investment OptionNil
SIP :Not Available
SWP :Not Available
Min.Redemption Amt. :
Style Box
Monthly AAUM as on 31-Oct-17 : Rs. 47.61 crores
Closing AUM as on 31-Oct-17 :Rs. 49.68 crores
ICICI Prudential India Recovery Fund - Series 7A Close ended equity scheme
Entry load : Not Applicable
RiskometerThis Product is suitable for investors who are seeking*:
• Long term wealth creation solution
• A close ended equity fund that aims to provide capital appreciation by investing in equity and equity related securities that are likely to benefit from recovery in the Indian economy.
*Investors should consult their financial advisers if in doubt about whether the product is suitable for them.
No redemption/repurchase of units shall be allowed prior to the maturity of the Scheme. Investors wishing to exit may do so, only in demat mode, by selling through BSE Limited or any of the stock exchange(s) where units of the Scheme will be listed as the Trustee may decide from time to time.
Benchmark
S&P BSE 500 Index
Note : - “Portfolio Beta, Standard Deviation, R Squared, Sharpe Ratio and Tracking Error of the Scheme is not computed owing to the short time frame since launch of the Scheme.”Portfolio turnover has been computed as the ratio of the lower value of purchase and sales, to the average net assets in the past one year (since inception for schemes that have not completed a year). The figures are not netted for derivative transactions.**In addition to the fund manager managing this fund, the ADR/GDR exposure is managed by Ms. Priyanka Khandelwal.@@ Total Expense Ratio is weighted average for the month. Ratio excludes Goods and Service Tax on management fees and includes B-15 clawback reversal, if any.
Quantitative Indicators Average P/E : 25.14 Average P/BV : 3.62 Average Dividend Yield : 1.20
Annual Portfolio Turnover Ratio : Equity - 0.53 times, Others (Debt and Derivatives) - 0.36 times Combined Annual Portfolio Turnover Ratio : 0.89 times
Dividend History : Refer page no. from 127 to 135
SIP Returns : Refer page no. from 123 to 125
Total Expense Ratio @@ :
IPIRF7 : 2.50% p. a.
IPIRF7 Direct Plan : 0.95% p. a.
Investment Objective : Refer page no. from 136 to 139
• Top Ten HoldingsDerivatives are considered at exposure value.
Scheme
Nifty 50 Index (Additional Benchmark)
NAV (Rs.) Per Unit (as on October 31,2017 : 11.86)
CAGR (%)
10.00
S&P BSE 500 Index (Benchmark)
Since inception
CurrentValue of
Investment of Rs. 10000
CAGR (%) Current Value of
Investment of Rs. 10000
1 Year 3 Year 5 Year
CAGR (%) Current Value of
Investment of Rs. 10000
CAGR (%) Current Value of
Investment of Rs. 10000
11.43 - -
Particulars
18.06 11821.75 - - - - 24.80 13512.26
22.01 12220.63 - - - - 23.68 13347.77
19.47 11964.92 - - - - 18.53 12598.34
Notes:1. Different plans shall have different expense structure. The performance details provided herein are of ICICI Prudential India Recovery Fund - Series 7.2. The scheme is currently managed by Sankaran Naren and Atul Patel. Mr. Sankaran Naren has been managing this fund since June 2016. Total Schemes managed by the Fund Manager . Refer annexure from page no. 99 for performance of other schemes currently managed by Sankaran is 32 (31 are jointly managed)Naren.Mr. Atul Patel has been managing this fund since June 2016. Total Schemes managed by the Fund Manager is 14 (13 are jointly managed). Refer annexure from page no. 99 for performance of other schemes currently managed by Atul Patel.3. Date of inception: 22-June-16.4. Performance of dividend option would be Net of Dividend distribution tax, if any.5. As the Scheme has completed more than 1 year but less than 3 years, the performance details of only since inception and 1 year are provided herein.6. Past performance may or may not be sustained in future and the same may not necessarily provide the basis for comparison with other investment.7. Load is not considered for computation of returns.8. In case, the start/end date of the concerned period is a nonbusiness date (NBD), the NAV of the previous date is considered for computation of returns. The NAV per unit shown in the table is as on the start date of the said period9. NAV is adjusted to the extent of dividend declared for computation of returns.
Returns of ICICI Prudential India Recovery Fund – Series 7 - Dividend Option as on October 31, 2017 - (IPIRF7)
Portfolio as on October 31, 2017
Banks 22.93% • ICICI Bank Ltd. 8.12% • State Bank Of India 5.94% • Kotak Mahindra Bank Ltd. 5.81% Axis Bank Ltd. 3.05% Cement 4.62% • JK Lakshmi Cement Ltd. 4.62% Chemicals 5.40% • Tata Chemicals Ltd. 5.40% Construction 18.23% • KNR Constructions Ltd. 7.97% • Capacite Infraprojects Ltd. 5.42% • PNC Infratech Ltd. 4.84% Construction Project 4.87% • Larsen & Toubro Ltd. 4.87% Ferrous Metals 3.49% Tata Steel Ltd. 3.49% Industrial Products 5.47% • Cummins India Ltd. 5.47% Minerals/Mining 3.66% -3.62% Coal India Ltd. 3.66% Coal India Ltd. - Futures -3.62% Pharmaceuticals 3.05% Sun Pharmaceutical Industries Ltd. 3.05% Power 2.27% Tata Power Company Ltd. 2.27% Software 7.64% HCL Technologies Ltd. 3.88% Infosys Ltd. 3.76% Index Futures/Options -8.30% Nifty 50 Index - Futures -8.30% Short Term Debt and net current assets 30.29% Total Net Assets 100.00%
Company/Issuer % to % to NAV NAV Derivatives
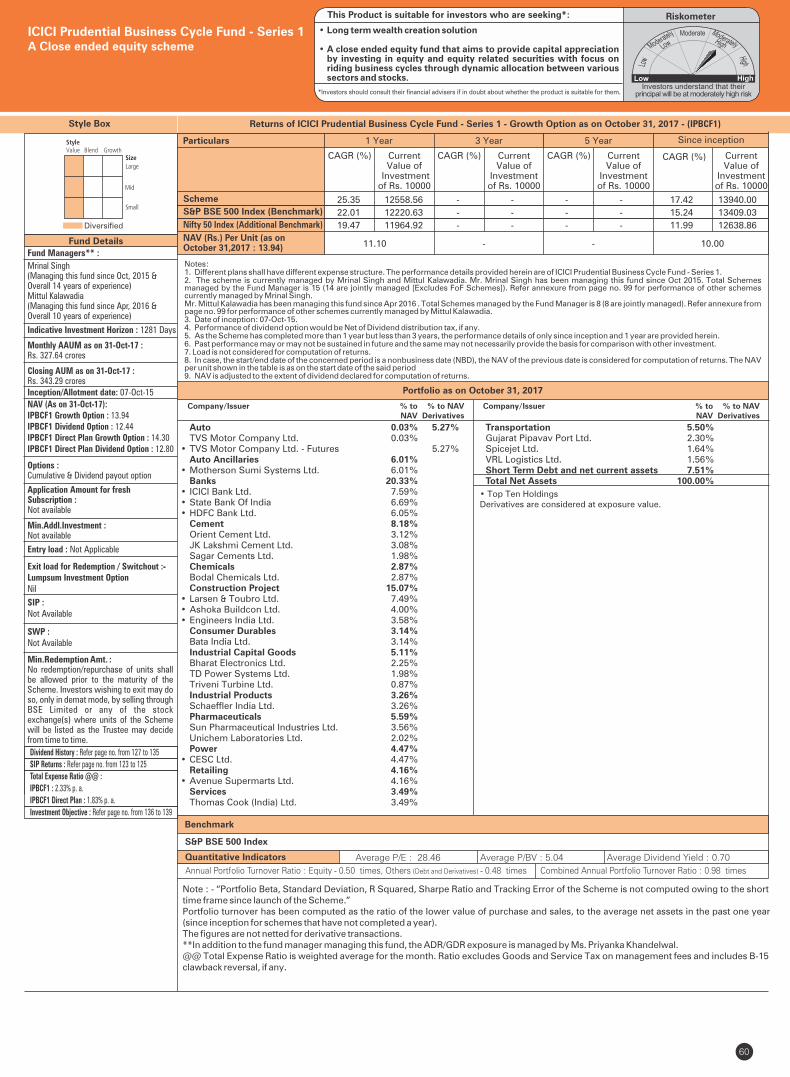
Style Box
Note : - “Portfolio Beta, Standard Deviation, R Squared, Sharpe Ratio and Tracking Error of the Scheme is not computed owing to the short time frame since launch of the Scheme.”Portfolio turnover has been computed as the ratio of the lower value of purchase and sales, to the average net assets in the past one year (since inception for schemes that have not completed a year). The figures are not netted for derivative transactions.**In addition to the fund manager managing this fund, the ADR/GDR exposure is managed by Ms. Priyanka Khandelwal.@@ Total Expense Ratio is weighted average for the month. Ratio excludes Goods and Service Tax on management fees and includes B-15 clawback reversal, if any.
Fund Managers** :
Mrinal Singh(Managing this fund since Oct, 2015 &Overall 14 years of experience)Mittul Kalawadia(Managing this fund since Apr, 2016 &Overall 10 years of experience)
Indicative Investment Horizon : 1281 Days
Inception/Allotment date: 07-Oct-15
SWP :Not Available
Min.Redemption Amt. :No redemption/repurchase of units shall be allowed prior to the maturity of the Scheme. Investors wishing to exit may do so, only in demat mode, by selling through BSE Limited or any of the stock exchange(s) where units of the Scheme will be listed as the Trustee may decide from time to time.
SIP :Not Available
NAV (As on 31-Oct-17):IPBCF1 Growth Option : 13.94IPBCF1 Dividend Option : 12.44IPBCF1 Direct Plan Growth Option : 14.30IPBCF1 Direct Plan Dividend Option : 12.80
Options :Cumulative & Dividend payout option
Application Amount for freshSubscription :Not available
Min.Addl.Investment :Not available
Exit load for Redemption / Switchout :- Lumpsum Investment OptionNil
60
Fund Details
Diversified
Quantitative Indicators
Benchmark
Average P/E : 28.46 Average P/BV : 5.04 Average Dividend Yield : 0.70
S&P BSE 500 Index
ICICI Prudential Business Cycle Fund - Series 1A Close ended equity scheme
Entry load : Not Applicable
RiskometerThis Product is suitable for investors who are seeking*:
• Long term wealth creation solution
• A close ended equity fund that aims to provide capital appreciation by investing in equity and equity related securities with focus on riding business cycles through dynamic allocation between various sectors and stocks.
*Investors should consult their financial advisers if in doubt about whether the product is suitable for them.
Monthly AAUM as on 31-Oct-17 : Rs. 327.64 crores
Closing AUM as on 31-Oct-17 :Rs. 343.29 crores
Annual Portfolio Turnover Ratio : Equity - 0.50 times, Others (Debt and Derivatives) - 0.48 times Combined Annual Portfolio Turnover Ratio : 0.98 times
• Top Ten HoldingsDerivatives are considered at exposure value.
Auto 0.03% 5.27% TVS Motor Company Ltd. 0.03% • TVS Motor Company Ltd. - Futures 5.27% Auto Ancillaries 6.01% • Motherson Sumi Systems Ltd. 6.01% Banks 20.33% • ICICI Bank Ltd. 7.59% • State Bank Of India 6.69% • HDFC Bank Ltd. 6.05% Cement 8.18% Orient Cement Ltd. 3.12% JK Lakshmi Cement Ltd. 3.08% Sagar Cements Ltd. 1.98% Chemicals 2.87% Bodal Chemicals Ltd. 2.87% Construction Project 15.07% • Larsen & Toubro Ltd. 7.49% • Ashoka Buildcon Ltd. 4.00% • Engineers India Ltd. 3.58% Consumer Durables 3.14% Bata India Ltd. 3.14% Industrial Capital Goods 5.11% Bharat Electronics Ltd. 2.25% TD Power Systems Ltd. 1.98% Triveni Turbine Ltd. 0.87% Industrial Products 3.26% Schaeffler India Ltd. 3.26% Pharmaceuticals 5.59% Sun Pharmaceutical Industries Ltd. 3.56% Unichem Laboratories Ltd. 2.02% Power 4.47% • CESC Ltd. 4.47% Retailing 4.16% • Avenue Supermarts Ltd. 4.16% Services 3.49% Thomas Cook (India) Ltd. 3.49%
Dividend History : Refer page no. from 127 to 135
SIP Returns : Refer page no. from 123 to 125
Total Expense Ratio @@ :
IPBCF1 : 2.33% p. a.
IPBCF1 Direct Plan : 1.83% p. a.
Investment Objective : Refer page no. from 136 to 139
Portfolio as on October 31, 2017
Returns of ICICI Prudential Business Cycle Fund - Series 1 - Growth Option as on October 31, 2017 - ( )IPBCF1
Transportation 5.50% Gujarat Pipavav Port Ltd. 2.30% Spicejet Ltd. 1.64% VRL Logistics Ltd. 1.56% Short Term Debt and net current assets 7.51% Total Net Assets 100.00%
Notes:1. Different plans shall have different expense structure. The performance details provided herein are of ICICI Prudential Business Cycle Fund - Series 1.2. The scheme is currently managed by Mrinal Singh and Mittul Kalawadia. Mr. Mrinal Singh has been managing this fund since Oct 2015. Total Schemes managed by the Fund Manager . Refer annexure from page no. 99 for performance of other schemes is 15 (14 are jointly managed [Excludes FoF Schemes])currently managed by Mrinal Singh.Mr. Mittul Kalawadia has been managing this fund since Apr 2016 . Total Schemes managed by the Fund Manager Refer annexure from is 8 (8 are jointly managed).page no. 99 for performance of other schemes currently managed by Mittul Kalawadia.3. Date of inception: 07-Oct-15.4. Performance of dividend option would be Net of Dividend distribution tax, if any.5. As the Scheme has completed more than 1 year but less than 3 years, the performance details of only since inception and 1 year are provided herein.6. Past performance may or may not be sustained in future and the same may not necessarily provide the basis for comparison with other investment.7. Load is not considered for computation of returns.8. In case, the start/end date of the concerned period is a nonbusiness date (NBD), the NAV of the previous date is considered for computation of returns. The NAV per unit shown in the table is as on the start date of the said period9. NAV is adjusted to the extent of dividend declared for computation of returns.
Scheme
Nifty 50 Index (Additional Benchmark)
NAV (Rs.) Per Unit (as on October 31,2017 : 13.94)
CAGR (%)
10.00
S&P BSE 500 Index (Benchmark)
Since inception
CurrentValue of
Investment of Rs. 10000
CAGR (%) Current Value of
Investment of Rs. 10000
1 Year 3 Year 5 Year
CAGR (%) Current Value of
Investment of Rs. 10000
CAGR (%) Current Value of
Investment of Rs. 10000
11.10 - -
Particulars
25.35 12558.56 - - - - 17.42 13940.00
22.01 12220.63 - - - - 15.24 13409.03
19.47 11964.92 - - - - 11.99 12638.86
Company/Issuer % to % to NAV NAV Derivatives
Company/Issuer % to % to NAV NAV Derivatives
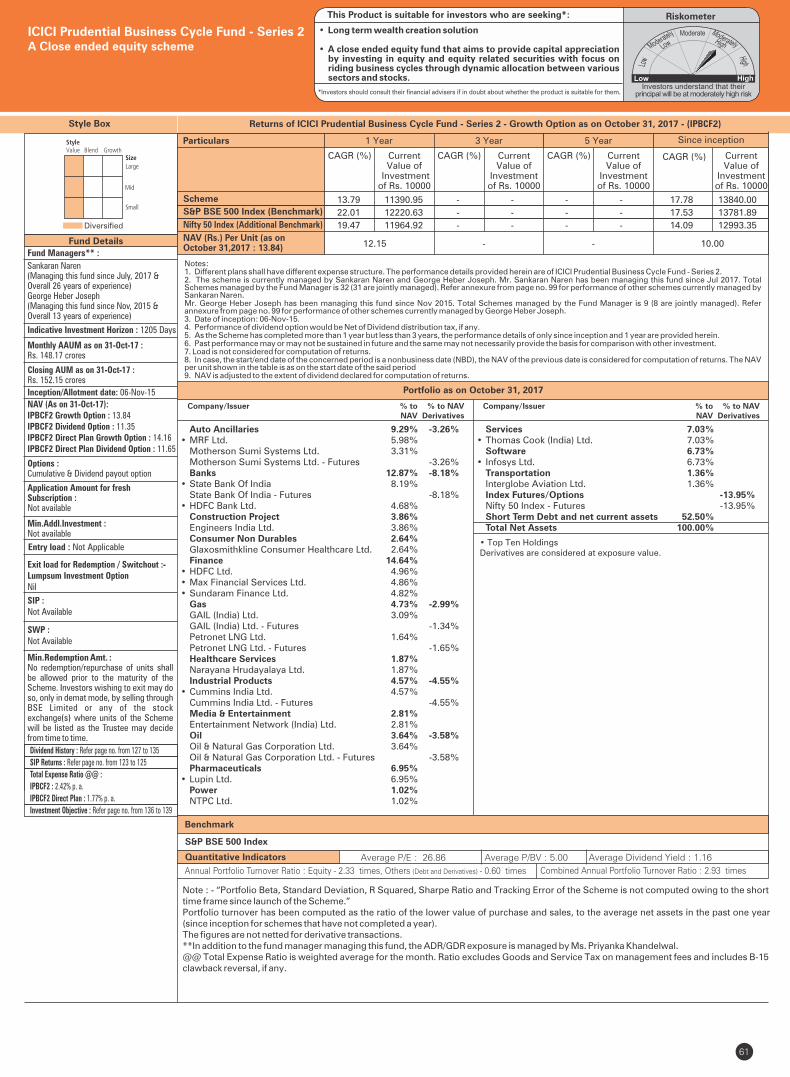
Style Box
Note : - “Portfolio Beta, Standard Deviation, R Squared, Sharpe Ratio and Tracking Error of the Scheme is not computed owing to the short time frame since launch of the Scheme.”Portfolio turnover has been computed as the ratio of the lower value of purchase and sales, to the average net assets in the past one year (since inception for schemes that have not completed a year). The figures are not netted for derivative transactions.**In addition to the fund manager managing this fund, the ADR/GDR exposure is managed by Ms. Priyanka Khandelwal.@@ Total Expense Ratio is weighted average for the month. Ratio excludes Goods and Service Tax on management fees and includes B-15 clawback reversal, if any.
Fund Managers** :
Sankaran Naren(Managing this fund since July, 2017 &Overall 26 years of experience)George Heber Joseph(Managing this fund since Nov, 2015 &Overall 13 years of experience)
Indicative Investment Horizon : 1205 Days
Inception/Allotment date: 06-Nov-15
SWP :Not Available
Min.Redemption Amt. :No redemption/repurchase of units shall be allowed prior to the maturity of the Scheme. Investors wishing to exit may do so, only in demat mode, by selling through BSE Limited or any of the stock exchange(s) where units of the Scheme will be listed as the Trustee may decide from time to time.
SIP :Not Available
NAV (As on 31-Oct-17):IPBCF2 Growth Option : 13.84IPBCF2 Dividend Option : 11.35IPBCF2 Direct Plan Growth Option : 14.16IPBCF2 Direct Plan Dividend Option : 11.65
Options :Cumulative & Dividend payout option
Application Amount for freshSubscription :Not available
Min.Addl.Investment :Not available
Exit load for Redemption / Switchout :- Lumpsum Investment OptionNil
61
Fund Details
Diversified
Quantitative Indicators
Benchmark
Average P/E : 26.86 Average P/BV : 5.00 Average Dividend Yield : 1.16
S&P BSE 500 Index
ICICI Prudential Business Cycle Fund - Series 2A Close ended equity scheme
RiskometerThis Product is suitable for investors who are seeking*:
• Long term wealth creation solution
• A close ended equity fund that aims to provide capital appreciation by investing in equity and equity related securities with focus on riding business cycles through dynamic allocation between various sectors and stocks.
*Investors should consult their financial advisers if in doubt about whether the product is suitable for them.
Monthly AAUM as on 31-Oct-17 : Rs. 148.17 crores
Closing AUM as on 31-Oct-17 :Rs. 152.15 crores
• Top Ten HoldingsDerivatives are considered at exposure value.
Entry load : Not Applicable
Annual Portfolio Turnover Ratio : Equity - 2.33 times, Others (Debt and Derivatives) - 0.60 times Combined Annual Portfolio Turnover Ratio : 2.93 times
Dividend History : Refer page no. from 127 to 135
SIP Returns : Refer page no. from 123 to 125
Total Expense Ratio @@ :
IPBCF2 : 2.42% p. a.
IPBCF2 Direct Plan : 1.77% p. a.
Investment Objective : Refer page no. from 136 to 139
Portfolio as on October 31, 2017
Returns of ICICI Prudential Business Cycle Fund - Series 2 - Growth Option as on October 31, 2017 - ( 2)IPBCF
Notes:1. Different plans shall have different expense structure. The performance details provided herein are of ICICI Prudential Business Cycle Fund - Series 2.2. The scheme is currently managed by Sankaran Naren and George Heber Joseph. Mr. Sankaran Naren has been managing this fund since Jul 2017. Total Schemes managed by the Fund Manager is 32 (31 are jointly managed). Refer annexure from page no. 99 for performance of other schemes currently managed by Sankaran Naren.Mr. George Heber Joseph has been managing this fund since Nov 2015. Total Schemes managed by the Fund Manager Refer is 9 (8 are jointly managed).annexure from page no. 99 for performance of other schemes currently managed by George Heber Joseph.3. Date of inception: 06-Nov-15.4. Performance of dividend option would be Net of Dividend distribution tax, if any.5. As the Scheme has completed more than 1 year but less than 3 years, the performance details of only since inception and 1 year are provided herein.6. Past performance may or may not be sustained in future and the same may not necessarily provide the basis for comparison with other investment.7. Load is not considered for computation of returns.8. In case, the start/end date of the concerned period is a nonbusiness date (NBD), the NAV of the previous date is considered for computation of returns. The NAV per unit shown in the table is as on the start date of the said period9. NAV is adjusted to the extent of dividend declared for computation of returns.
Scheme
Nifty 50 Index (Additional Benchmark)
NAV (Rs.) Per Unit (as on October 31,2017 : 13.84)
CAGR (%)
10.00
S&P BSE 500 Index (Benchmark)
Since inception
CurrentValue of
Investment of Rs. 10000
CAGR (%) Current Value of
Investment of Rs. 10000
1 Year 3 Year 5 Year
CAGR (%) Current Value of
Investment of Rs. 10000
CAGR (%) Current Value of
Investment of Rs. 10000
12.15 - -
Particulars
13.79 11390.95 - - - - 17.78 13840.00
22.01 12220.63 - - - - 17.53 13781.89
19.47 11964.92 - - - - 14.09 12993.35
Auto Ancillaries 9.29% -3.26%• MRF Ltd. 5.98% Motherson Sumi Systems Ltd. 3.31% Motherson Sumi Systems Ltd. - Futures -3.26% Banks 12.87% -8.18%• State Bank Of India 8.19% State Bank Of India - Futures -8.18%• HDFC Bank Ltd. 4.68% Construction Project 3.86% Engineers India Ltd. 3.86% Consumer Non Durables 2.64% Glaxosmithkline Consumer Healthcare Ltd. 2.64% Finance 14.64% • HDFC Ltd. 4.96% • Max Financial Services Ltd. 4.86% • Sundaram Finance Ltd. 4.82% Gas 4.73% -2.99% GAIL (India) Ltd. 3.09% GAIL (India) Ltd. - Futures -1.34% Petronet LNG Ltd. 1.64% Petronet LNG Ltd. - Futures -1.65% Healthcare Services 1.87% Narayana Hrudayalaya Ltd. 1.87% Industrial Products 4.57% -4.55%• Cummins India Ltd. 4.57% Cummins India Ltd. - Futures -4.55% Media & Entertainment 2.81% Entertainment Network (India) Ltd. 2.81% Oil 3.64% -3.58% Oil & Natural Gas Corporation Ltd. 3.64% Oil & Natural Gas Corporation Ltd. - Futures -3.58% Pharmaceuticals 6.95% • Lupin Ltd. 6.95% Power 1.02% NTPC Ltd. 1.02%
Services 7.03% • Thomas Cook (India) Ltd. 7.03% Software 6.73% • Infosys Ltd. 6.73% Transportation 1.36% Interglobe Aviation Ltd. 1.36% Index Futures/Options -13.95% Nifty 50 Index - Futures -13.95% Short Term Debt and net current assets 52.50% Total Net Assets 100.00%
Company/Issuer % to % to NAV NAV Derivatives
Company/Issuer % to % to NAV NAV Derivatives
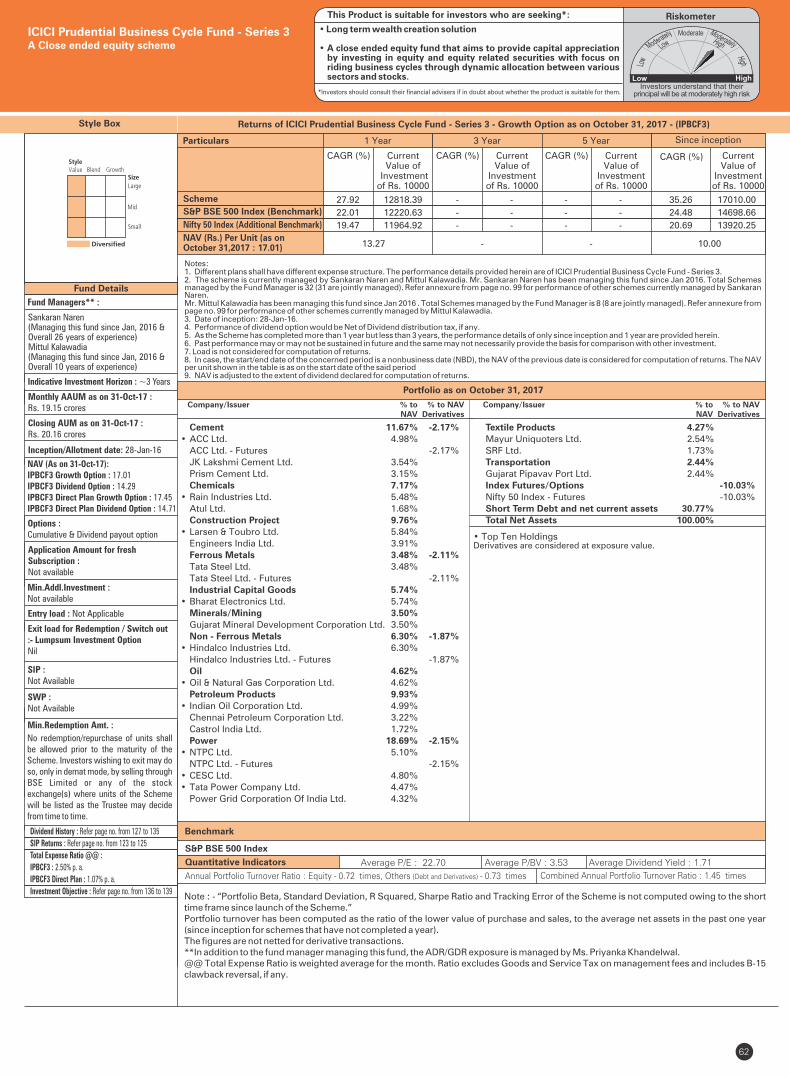
62
Fund Managers** :
Sankaran Naren(Managing this fund since Jan, 2016 &Overall 26 years of experience)Mittul Kalawadia(Managing this fund since Jan, 2016 &Overall 10 years of experience)
Indicative Investment Horizon : ~3 Years
Inception/Allotment date: 28-Jan-16
NAV (As on 31-Oct-17):IPBCF3 Growth Option : 17.01IPBCF3 Dividend Option : 14.29IPBCF3 Direct Plan Growth Option : 17.45IPBCF3 Direct Plan Dividend Option : 14.71
Options :Cumulative & Dividend payout option
Application Amount for freshSubscription :Not available
Min.Addl.Investment :Not available
Exit load for Redemption / Switch out :- Lumpsum Investment OptionNil
SIP :Not Available
SWP :Not Available
Min.Redemption Amt. :
Style Box Returns of ICICI Prudential Business Cycle Fund - Series 3 - Growth Option as on October 31, 2017 - ( 3)IPBCF
Monthly AAUM as on 31-Oct-17 : Rs. 19.15 crores
Closing AUM as on 31-Oct-17 : Rs. 20.16 crores
ICICI Prudential Business Cycle Fund - Series 3A Close ended equity scheme
Entry load : Not Applicable
RiskometerThis Product is suitable for investors who are seeking*:
• Long term wealth creation solution
• A close ended equity fund that aims to provide capital appreciation by investing in equity and equity related securities with focus on riding business cycles through dynamic allocation between various sectors and stocks.
*Investors should consult their financial advisers if in doubt about whether the product is suitable for them.
No redemption/repurchase of units shall be allowed prior to the maturity of the Scheme. Investors wishing to exit may do so, only in demat mode, by selling through BSE Limited or any of the stock exchange(s) where units of the Scheme will be listed as the Trustee may decide from time to time.
Benchmark
S&P BSE 500 Index
Note : - “Portfolio Beta, Standard Deviation, R Squared, Sharpe Ratio and Tracking Error of the Scheme is not computed owing to the short time frame since launch of the Scheme.”Portfolio turnover has been computed as the ratio of the lower value of purchase and sales, to the average net assets in the past one year (since inception for schemes that have not completed a year). The figures are not netted for derivative transactions.**In addition to the fund manager managing this fund, the ADR/GDR exposure is managed by Ms. Priyanka Khandelwal.@@ Total Expense Ratio is weighted average for the month. Ratio excludes Goods and Service Tax on management fees and includes B-15 clawback reversal, if any.
Quantitative Indicators Average P/E : 22.70 Average P/BV : 3.53 Average Dividend Yield : 1.71
Annual Portfolio Turnover Ratio : Equity - 0.72 times, Others (Debt and Derivatives) - 0.73 times Combined Annual Portfolio Turnover Ratio : 1.45 times
• Top Ten HoldingsDerivatives are considered at exposure value.
Dividend History : Refer page no. from 127 to 135
SIP Returns : Refer page no. from 123 to 125
Total Expense Ratio @@ :
IPBCF3 : 2.50% p. a.
IPBCF3 Direct Plan : 1.07% p. a.
Investment Objective : Refer page no. from 136 to 139
Portfolio as on October 31, 2017
Notes:1. Different plans shall have different expense structure. The performance details provided herein are of ICICI Prudential Business Cycle Fund - Series 3.2. The scheme is currently managed by Sankaran Naren and Mittul Kalawadia. Mr. Sankaran Naren has been managing this fund since Jan 2016. Total Schemes managed by the Fund Manager is 32 (31 are jointly managed). Refer annexure from page no. 99 for performance of other schemes currently managed by Sankaran Naren.Mr. Mittul Kalawadia has been managing this fund since Jan 2016 . Total Schemes managed by the Fund Manager is 8 (8 are jointly managed). Refer annexure from page no. 99 for performance of other schemes currently managed by Mittul Kalawadia.3. Date of inception: 28-Jan-16.4. Performance of dividend option would be Net of Dividend distribution tax, if any.5. As the Scheme has completed more than 1 year but less than 3 years, the performance details of only since inception and 1 year are provided herein.6. Past performance may or may not be sustained in future and the same may not necessarily provide the basis for comparison with other investment.7. Load is not considered for computation of returns.8. In case, the start/end date of the concerned period is a nonbusiness date (NBD), the NAV of the previous date is considered for computation of returns. The NAV per unit shown in the table is as on the start date of the said period9. NAV is adjusted to the extent of dividend declared for computation of returns.
Scheme
Nifty 50 Index (Additional Benchmark)
NAV (Rs.) Per Unit (as on October 31,2017 : 17.01)
CAGR (%)
10.00
S&P BSE 500 Index (Benchmark)
Since inception
CurrentValue of
Investment of Rs. 10000
CAGR (%) Current Value of
Investment of Rs. 10000
1 Year 3 Year 5 Year
CAGR (%) Current Value of
Investment of Rs. 10000
CAGR (%) Current Value of
Investment of Rs. 10000
13.27 - -
Particulars
27.92 12818.39 - - - - 35.26 17010.00
22.01 12220.63 - - - - 24.48 14698.66
19.47 11964.92 - - - - 20.69 13920.25
Cement 11.67% -2.17%• ACC Ltd. 4.98% ACC Ltd. - Futures -2.17% JK Lakshmi Cement Ltd. 3.54% Prism Cement Ltd. 3.15% Chemicals 7.17% • Rain Industries Ltd. 5.48% Atul Ltd. 1.68% Construction Project 9.76% • Larsen & Toubro Ltd. 5.84% Engineers India Ltd. 3.91% Ferrous Metals 3.48% -2.11% Tata Steel Ltd. 3.48% Tata Steel Ltd. - Futures -2.11% Industrial Capital Goods 5.74% • Bharat Electronics Ltd. 5.74% Minerals/Mining 3.50% Gujarat Mineral Development Corporation Ltd. 3.50% Non - Ferrous Metals 6.30% -1.87%• Hindalco Industries Ltd. 6.30% Hindalco Industries Ltd. - Futures -1.87% Oil 4.62% • Oil & Natural Gas Corporation Ltd. 4.62% Petroleum Products 9.93% • Indian Oil Corporation Ltd. 4.99% Chennai Petroleum Corporation Ltd. 3.22% Castrol India Ltd. 1.72% Power 18.69% -2.15%• NTPC Ltd. 5.10% NTPC Ltd. - Futures -2.15%• CESC Ltd. 4.80% • Tata Power Company Ltd. 4.47% Power Grid Corporation Of India Ltd. 4.32%
Textile Products 4.27% Mayur Uniquoters Ltd. 2.54% SRF Ltd. 1.73% Transportation 2.44% Gujarat Pipavav Port Ltd. 2.44% Index Futures/Options -10.03% Nifty 50 Index - Futures -10.03% Short Term Debt and net current assets 30.77% Total Net Assets 100.00%
Company/Issuer % to % to NAV NAV Derivatives
Company/Issuer % to % to NAV NAV Derivatives
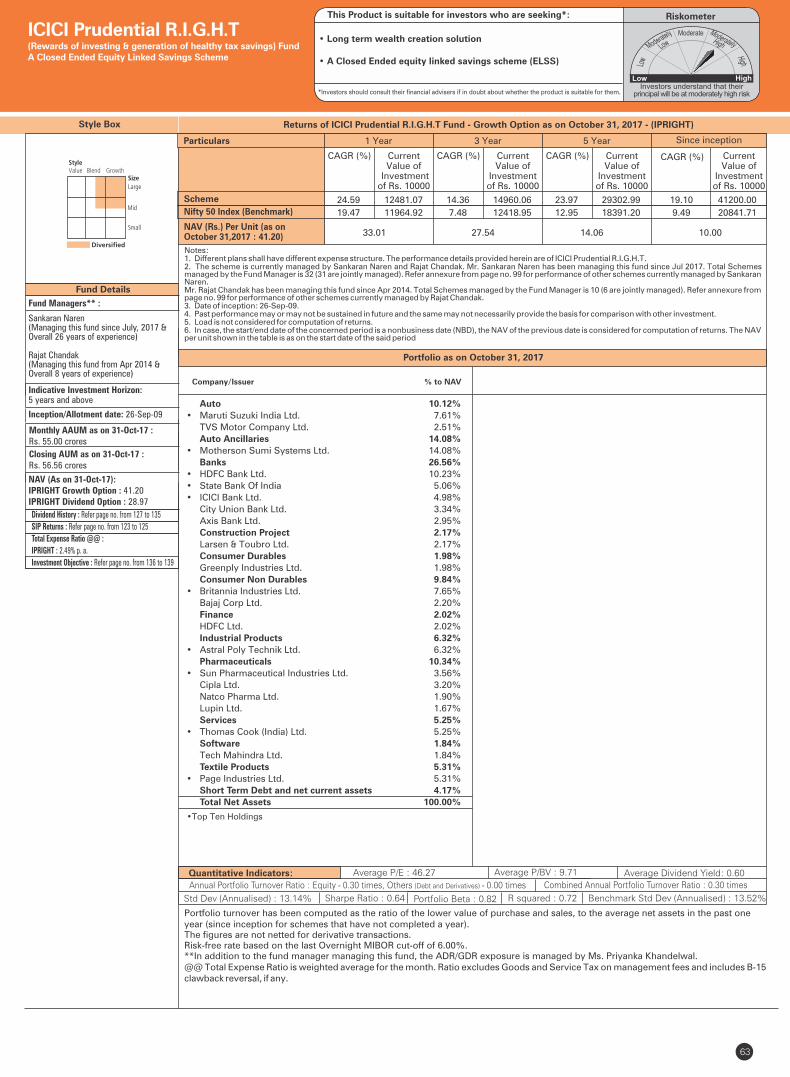
63
�
Quantitative Indicators:
Fund Details
Company/Issuer % to NAV
Fund Managers** :
Sankaran Naren(Managing this fund since July, 2017 &Overall 26 years of experience)
Rajat Chandak(Managing this fund from Apr 2014 &Overall 8 years of experience)
Indicative Investment Horizon:5 years and above
Inception/Allotment date: 26-Sep-09
Monthly AAUM as on 31-Oct-17 : Rs. 55.00 crores
Closing AUM as on 31-Oct-17 : Rs. 56.56 crores
NAV (As on 31-Oct-17):IPRIGHT Growth Option : 41.20IPRIGHT Dividend Option : 28.97
Std Dev (Annualised) : 13.14% Sharpe Ratio : 0.64
Average P/E : 46.27 Average P/BV : 9.71 Average Dividend Yield: 0.60
Portfolio Beta : 0.82 R squared : 0.72
Portfolio turnover has been computed as the ratio of the lower value of purchase and sales, to the average net assets in the past one year (since inception for schemes that have not completed a year). The figures are not netted for derivative transactions.Risk-free rate based on the last Overnight MIBOR cut-off of 6.00%.**In addition to the fund manager managing this fund, the ADR/GDR exposure is managed by Ms. Priyanka Khandelwal.@@ Total Expense Ratio is weighted average for the month. Ratio excludes Goods and Service Tax on management fees and includes B-15 clawback reversal, if any.
Style Box
• Top Ten Holdings
Portfolio as on October 31, 2017
Returns of ICICI Prudential R.I.G.H.T Fund - Growth Option as on October 31, 2017 - (IPRIGHT)
Auto 10.12%
• Maruti Suzuki India Ltd. 7.61%
TVS Motor Company Ltd. 2.51%
Auto Ancillaries 14.08%
• Motherson Sumi Systems Ltd. 14.08%
Banks 26.56%
• HDFC Bank Ltd. 10.23%
• State Bank Of India 5.06%
• ICICI Bank Ltd. 4.98%
City Union Bank Ltd. 3.34%
Axis Bank Ltd. 2.95%
Construction Project 2.17%
Larsen & Toubro Ltd. 2.17%
Consumer Durables 1.98%
Greenply Industries Ltd. 1.98%
Consumer Non Durables 9.84%
• Britannia Industries Ltd. 7.65%
Bajaj Corp Ltd. 2.20%
Finance 2.02%
HDFC Ltd. 2.02%
Industrial Products 6.32%
• Astral Poly Technik Ltd. 6.32%
Pharmaceuticals 10.34%
• Sun Pharmaceutical Industries Ltd. 3.56%
Cipla Ltd. 3.20%
Natco Pharma Ltd. 1.90%
Lupin Ltd. 1.67%
Services 5.25%
• Thomas Cook (India) Ltd. 5.25%
Software 1.84%
Tech Mahindra Ltd. 1.84%
Textile Products 5.31%
• Page Industries Ltd. 5.31%
Short Term Debt and net current assets 4.17%
Total Net Assets 100.00%
ICICI Prudential R.I.G.H.T(Rewards of investing & generation of healthy tax savings) FundA Closed Ended Equity Linked Savings Scheme
Benchmark Std Dev (Annualised) : 13.52%
RiskometerThis Product is suitable for investors who are seeking*:
• Long term wealth creation solution
• A Closed Ended equity linked savings scheme (ELSS)
*Investors should consult their financial advisers if in doubt about whether the product is suitable for them.
Annual Portfolio Turnover Ratio : Equity - 0.30 times, Others (Debt and Derivatives) - 0.00 times Combined Annual Portfolio Turnover Ratio : 0.30 times
Dividend History : Refer page no. from 127 to 135
SIP Returns : Refer page no. from 123 to 125
Total Expense Ratio @@ :
IPRIGHT : 2.49% p. a.
Investment Objective : Refer page no. from 136 to 139
Notes:1. Different plans shall have different expense structure. The performance details provided herein are of ICICI Prudential R.I.G.H.T.2. The scheme is currently managed by Sankaran Naren and Rajat Chandak. Mr. Sankaran Naren has been managing this fund since Jul 2017. Total Schemes managed by the Fund Manager is 32 (31 are jointly managed). Refer annexure from page no. 99 for performance of other schemes currently managed by Sankaran Naren.Mr. has been managing this fund since Apr 2014. Total Schemes managed by the Fund Manager . Refer annexure from Rajat Chandak is 10 (6 are jointly managed)page no. 99 for performance of other schemes currently managed by . Rajat Chandak3. Date of inception: 26-Sep-09.4. Past performance may or may not be sustained in future and the same may not necessarily provide the basis for comparison with other investment.5. Load is not considered for computation of returns.6. In case, the start/end date of the concerned period is a nonbusiness date (NBD), the NAV of the previous date is considered for computation of returns. The NAV per unit shown in the table is as on the start date of the said period
Scheme
NAV (Rs.) Per Unit (as on October 31,2017 : 41.20)
CAGR (%)
10.00
Nifty 50 Index (Benchmark)
Since inception
CurrentValue of
Investment of Rs. 10000
CAGR (%) Current Value of
Investment of Rs. 10000
1 Year 3 Year 5 Year
CAGR (%) Current Value of
Investment of Rs. 10000
CAGR (%) Current Value of
Investment of Rs. 10000
33.01 27.54 14.06
Particulars
24.59 12481.07 14.36 14960.06 23.97 29302.99 19.10 41200.00
19.47 11964.92 7.48 12418.95 12.95 18391.20 9.49 20841.71
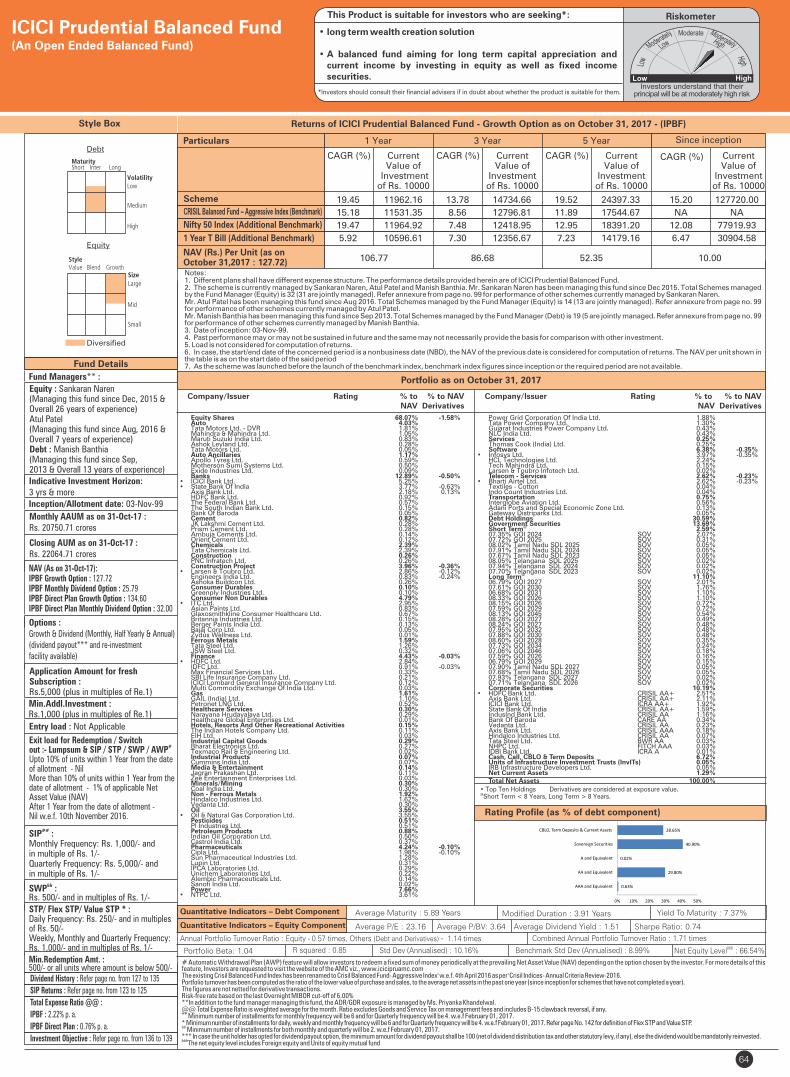
64
Fund Details
Rating Profile (as % of debt component)
Quantitative Indicators – Equity Component
Quantitative Indicators – Debt Component
# Automatic Withdrawal Plan (AWP) feature will allow investors to redeem a fixed sum of money periodically at the prevailing Net Asset Value (NAV) depending on the option chosen by the investor. For more details of this feature, Investors are requested to visit the website of the AMC viz., www.icicipruamc.comThe existing Crisil Balanced Fund Index has been renamed to Crisil Balanced Fund- Aggressive Index' w.e.f. 4th April 2016 as per 'Crisil Indices- Annual Criteria Review-2016.Portfolio turnover has been computed as the ratio of the lower value of purchase and sales, to the average net assets in the past one year (since inception for schemes that have not completed a year). The figures are not netted for derivative transactions.Risk-free rate based on the last Overnight MIBOR cut-off of 6.00%**In addition to the fund manager managing this fund, the ADR/GDR exposure is managed by Ms. Priyanka Khandelwal.@@ Total Expense Ratio is weighted average for the month. Ratio excludes Goods and Service Tax on management fees and includes B-15 clawback reversal, if any.##
Minimum number of installments for monthly frequency will be 6 and for Quarterly frequency will be 4. w.e.f February 01, 2017.* Minimum number of installments for daily, weekly and monthly frequency will be 6 and for Quarterly frequency will be 4. w.e.f February 01, 2017. Refer page No. 142 for definition of Flex STP and Value STP.&&
Minimum number of installments for both monthly and quarterly will be 2. w.e.f February 01, 2017.*** In case the unit holder has opted for dividend payout option, the minimum amount for dividend payout shall be 100 (net of dividend distribution tax and other statutory levy, if any), else the dividend would be mandatorily reinvested.&&&The net equity level includes Foreign equity and Units of equity mutual fund
Style Box
Fund Managers** :
Equity : Sankaran Naren(Managing this fund since Dec, 2015 &Overall 26 years of experience)Atul Patel(Managing this fund since Aug, 2016 &Overall 7 years of experience)Debt : Manish Banthia (Managing this fund since Sep, 2013 & Overall 13 years of experience)Indicative Investment Horizon:3 yrs & moreInception/Allotment date: 03-Nov-99
Monthly AAUM as on 31-Oct-17 : Rs. 20750.71 crores
Closing AUM as on 31-Oct-17 : Rs. 22064.71 crores
NAV (As on 31-Oct-17):IPBF Growth Option : 127.72IPBF Monthly Dividend Option : 25.79IPBF Direct Plan Growth Option : 134.60IPBF Direct Plan Monthly Dividend Option : 32.00
Options :Growth & Dividend (Monthly, Half Yearly & Annual)(dividend payout*** and re-investment facility available)
Application Amount for freshSubscription :Rs.5,000 (plus in multiples of Re.1)
Min.Addl.Investment :Rs.1,000 (plus in multiples of Re.1)
Exit load for Redemption / Switch#out :- Lumpsum & SIP / STP / SWP / AWP
Upto 10% of units within 1 Year from the date of allotment - Nil More than 10% of units within 1 Year from the date of allotment - 1% of applicable Net Asset Value (NAV) After 1 Year from the date of allotment - Nil w.e.f. 10th November 2016.
##SIP :Monthly Frequency: Rs. 1,000/- and in multiple of Rs. 1/-Quarterly Frequency: Rs. 5,000/- and in multiple of Rs. 1/-
&&SWP :Rs. 500/- and in multiples of Rs. 1/-
STP/ Flex STP/ Value STP * :Daily Frequency: Rs. 250/- and in multiples of Rs. 50/-Weekly, Monthly and Quarterly Frequency: Rs. 1,000/- and in multiples of Rs. 1/-
Min.Redemption Amt. :500/- or all units where amount is below 500/-
Average Maturity : 5.89 Years Modified Duration : 3.91 Years Yield To Maturity : 7.37%
Average P/E : 23.16 Average P/BV: 3.64 Average Dividend Yield : 1.51 Sharpe Ratio: 0.74
Portfolio Beta: 1.04 R squared : 0.85 Std Dev (Annualised) : 10.16%
• Top Ten Holdings Derivatives are considered at exposure value.@Short Term < 8 Years, Long Term > 8 Years.
Portfolio as on October 31, 2017
Returns of ICICI Prudential Balanced Fund - Growth Option as on October 31, 2017 - (IPBF)
Diversified
Equity
Debt
&&&Net Equity Level : 66.54%
ICICI Prudential Balanced Fund(An Open Ended Balanced Fund)
Benchmark Std Dev (Annualised) : 8.99%
Entry load : Not Applicable
RiskometerThis Product is suitable for investors who are seeking*:
• long term wealth creation solution
• A balanced fund aiming for long term capital appreciation and current income by investing in equity as well as fixed income securities.
*Investors should consult their financial advisers if in doubt about whether the product is suitable for them.
Annual Portfolio Turnover Ratio : Equity - 0.57 times, Others (Debt and Derivatives) - 1.14 times Combined Annual Portfolio Turnover Ratio : 1.71 times
Dividend History : Refer page no. from 127 to 135
SIP Returns : Refer page no. from 123 to 125
Total Expense Ratio @@ :
IPBF : 2.22% p. a.
IPBF Direct Plan : 0.76% p. a.
Investment Objective : Refer page no. from 136 to 139
Notes:1. Different plans shall have different expense structure. The performance details provided herein are of ICICI Prudential Balanced Fund.2. The scheme is currently managed by Sankaran Naren, Atul Patel and . Mr. Sankaran Naren has been managing this fund since Dec 2015. Total Schemes managed Manish Banthiaby the Fund Manager . Refer annexure from page no. 99 for performance of other schemes currently managed by Sankaran Naren.(Equity) is 32 (31 are jointly managed) Mr. Atul Patel has been managing this fund since Aug 2016. Total Schemes managed by the Fund Manager . Refer annexure from page no. 99 (Equity) is 14 (13 are jointly managed)for performance of other schemes currently managed by Atul Patel .Mr. has been managing this fund since Sep 2013. Total Schemes managed by the Fund Manager . Refer annexure from page no. 99 Manish Banthia (Debt) is 19 (5 are jointly managedfor performance of other schemes currently managed by .Manish Banthia3. Date of inception: 03-Nov-99.4. Past performance may or may not be sustained in future and the same may not necessarily provide the basis for comparison with other investment.5. Load is not considered for computation of returns.6. In case, the start/end date of the concerned period is a nonbusiness date (NBD), the NAV of the previous date is considered for computation of returns. The NAV per unit shown in the table is as on the start date of the said period7. As the scheme was launched before the launch of the benchmark index, benchmark index figures since inception or the required period are not available.
Scheme
Nifty 50 Index (Additional Benchmark)
CAGR (%)
CRISIL Balanced Fund – Aggressive Index (Benchmark)
Since inception
CurrentValue of
Investment of Rs. 10000
CAGR (%) Current Value of
Investment of Rs. 10000
1 Year 3 Year 5 Year
CAGR (%) Current Value of
Investment of Rs. 10000
CAGR (%) Current Value of
Investment of Rs. 10000
NAV (Rs.) Per Unit (as on October 31,2017 : 127.72) 10.00106.77 86.68 52.35
Particulars
1 Year T Bill (Additional Benchmark)
19.45 11962.16 13.78 14734.66 19.52 24397.33 15.20 127720.00
15.18 11531.35 8.56 12796.81 11.89 17544.67 NA NA
19.47 11964.92 7.48 12418.95 12.95 18391.20 12.08 77919.93
5.92 10596.61 7.30 12356.67 7.23 14179.16 6.47 30904.58
Equity Shares 68.07% -1.58% Auto 4.03% Tata Motors Ltd. - DVR 1.81% Mahindra & Mahindra Ltd. 1.05% Maruti Suzuki India Ltd. 0.83% Ashok Leyland Ltd. 0.28% Tata Motors Ltd. 0.05% Auto Ancillaries 1.17% Apollo Tyres Ltd. 0.59% Motherson Sumi Systems Ltd. 0.50% Exide Industries Ltd. 0.09% Banks 12.89% -0.50%• ICICI Bank Ltd. 5.25% • State Bank Of India 3.77% -0.63% Axis Bank Ltd. 2.18% 0.13% HDFC Bank Ltd. 0.92% The Federal Bank Ltd. 0.57% The South Indian Bank Ltd. 0.15% Bank Of Baroda 0.05% Cement 0.82% JK Lakshmi Cement Ltd. 0.28% Prism Cement Ltd. 0.28% Ambuja Cements Ltd. 0.14% Orient Cement Ltd. 0.12% Chemicals 2.39% Tata Chemicals Ltd. 2.39% Construction 0.26% PNC Infratech Ltd. 0.26% Construction Project 3.96% -0.36%• Larsen & Toubro Ltd. 2.86% -0.12% Engineers India Ltd. 0.83% -0.24% Ashoka Buildcon Ltd. 0.26% Consumer Durables 0.10% Greenply Industries Ltd. 0.10% Consumer Non Durables 4.79% • ITC Ltd. 2.95% Asian Paints Ltd. 0.83% Glaxosmithkline Consumer Healthcare Ltd. 0.67% Britannia Industries Ltd. 0.15% Berger Paints India Ltd. 0.13% Bajaj Corp Ltd. 0.05% Zydus Wellness Ltd. 0.01% Ferrous Metals 1.59% Tata Steel Ltd. 1.26% JSW Steel Ltd. 0.32% Finance 4.43% -0.03%• HDFC Ltd. 2.84% IDFC Ltd. 0.91% -0.03% Max Financial Services Ltd. 0.33% SBI Life Insurance Company Ltd. 0.21% ICICI Lombard General Insurance Company Ltd. 0.12% Multi Commodity Exchange Of India Ltd. 0.03% Gas 1.61% GAIL (India) Ltd. 1.10% Petronet LNG Ltd. 0.52% Healthcare Services 0.30% Narayana Hrudayalaya Ltd. 0.29% Healthcare Global Enterprises Ltd. 0.01% Hotels, Resorts And Other Recreational Activities 0.15% The Indian Hotels Company Ltd. 0.11% EIH Ltd. 0.03% Industrial Capital Goods 0.29% Bharat Electronics Ltd. 0.27% Texmaco Rail & Engineering Ltd. 0.02% Industrial Products 0.07% Cummins India Ltd. 0.07% Media & Entertainment 0.14% Jagran Prakashan Ltd. 0.11% Zee Entertainment Enterprises Ltd. 0.03% Minerals/Mining 0.30% Coal India Ltd. 0.30% Non - Ferrous Metals 1.92% Hindalco Industries Ltd. 1.62% Vedanta Ltd. 0.30% Oil 3.55% • Oil & Natural Gas Corporation Ltd. 3.55% Pesticides 0.51% PI Industries Ltd. 0.51% Petroleum Products 0.88% Indian Oil Corporation Ltd. 0.50% Castrol India Ltd. 0.37% Pharmaceuticals 4.24% -0.10% Cipla Ltd. 1.98% -0.10% Sun Pharmaceutical Industries Ltd. 1.28% Lupin Ltd. 0.31% IPCA Laboratories Ltd. 0.29% Unichem Laboratories Ltd. 0.22% Alembic Pharmaceuticals Ltd. 0.14% Sanofi India Ltd. 0.02% Power 7.66% • NTPC Ltd. 3.61%
Power Grid Corporation Of India Ltd. 1.88% Tata Power Company Ltd. 1.30% Gujarat Industries Power Company Ltd. 0.43% NLC India Ltd. 0.43% Services 0.25% Thomas Cook (India) Ltd. 0.25% Software 6.38% -0.35%• Infosys Ltd. 3.97% -0.35% HCL Technologies Ltd. 2.24% Tech Mahindra Ltd. 0.15% Larsen & Toubro Infotech Ltd. 0.02% Telecom - Services 2.62% -0.23%• Bharti Airtel Ltd. 2.62% -0.23% Textiles - Cotton 0.04% Indo Count Industries Ltd. 0.04% Transportation 0.75% Interglobe Aviation Ltd. 0.56% Adani Ports and Special Economic Zone Ltd. 0.13% Gateway Distriparks Ltd. 0.05% Debt Holdings 30.59% Government Securities 13.69%
@ Short Term 2.59% 07.35% GOI 2024 SOV 2.07% 07.72% GOI 2025 SOV 0.31% 08.02% Tamil Nadu SDL 2025 SOV 0.05% 07.91% Tamil Nadu SDL 2024 SOV 0.05% 07.67% Tamil Nadu SDL 2023 SOV 0.05% 08.05% Telangana SDL 2025 SOV 0.02% 07.94% Telangana SDL 2024 SOV 0.02% 07.70% Telangana SDL 2023 SOV 0.02%
@ Long Term 11.10% 06.79% GOI 2027 SOV 2.01% 07.61% GOI 2030 SOV 1.76% 06.68% GOI 2031 SOV 1.10% 08.33% GOI 2026 SOV 1.10% 08.15% GOI 2026 SOV 0.72% 07.59% GOI 2029 SOV 0.72% 08.13% GOI 2045 SOV 0.54% 08.28% GOI 2027 SOV 0.49% 08.24% GOI 2027 SOV 0.48% 07.95% GOI 2032 SOV 0.48% 07.88% GOI 2030 SOV 0.48% 08.60% GOI 2028 SOV 0.35% 07.73% GOI 2034 SOV 0.24% 07.06% GOI 2046 SOV 0.18% 07.59% GOI 2026 SOV 0.16% 06.79% GOI 2029 SOV 0.15% 07.90% Tamil Nadu SDL 2027 SOV 0.05% 07.68% Tamil Nadu SDL 2026 SOV 0.05% 07.93% Telangana SDL 2027 SOV 0.02% 07.71% Telangana SDL 2026 SOV 0.02% Corporate Securities 10.19% • HDFC Bank Ltd. CRISIL AA+ 2.51% Axis Bank Ltd. CRISIL AA+ 2.11% ICICI Bank Ltd. ICRA AA+ 1.92% State Bank Of India CRISIL AA+ 1.59% IndusInd Bank Ltd. CRISIL AA 1.16% Bank Of Baroda CARE AA 0.34% Vedanta Ltd. CRISIL AA 0.23% Axis Bank Ltd. CRISIL AAA 0.18% Hindalco Industries Ltd. CRISIL AA 0.07% Tata Steel Ltd. BWR AA 0.03% NHPC Ltd. FITCH AAA 0.03% IDBI Bank Ltd. ICRA A 0.01% Cash, Call, CBLO & Term Deposits 6.72% Units of Infrastructure Investment Trusts (InvITs) 0.05% IRB Infrastructure Developers Ltd. 0.05% Net Current Assets 1.29% Total Net Assets 100.00%
Company/Issuer Rating % to % to NAV NAV Derivatives
Company/Issuer Rating % to % to NAV NAV Derivatives
0.63%
29.80%
0.02%
40.90%
28.65%
0% 10% 20% 30% 40% 50%
AAA and Equivalent
AA and Equivalent
A and Equivalent
Sovereign Securities
CBLO, Term Deposits & Current Assets
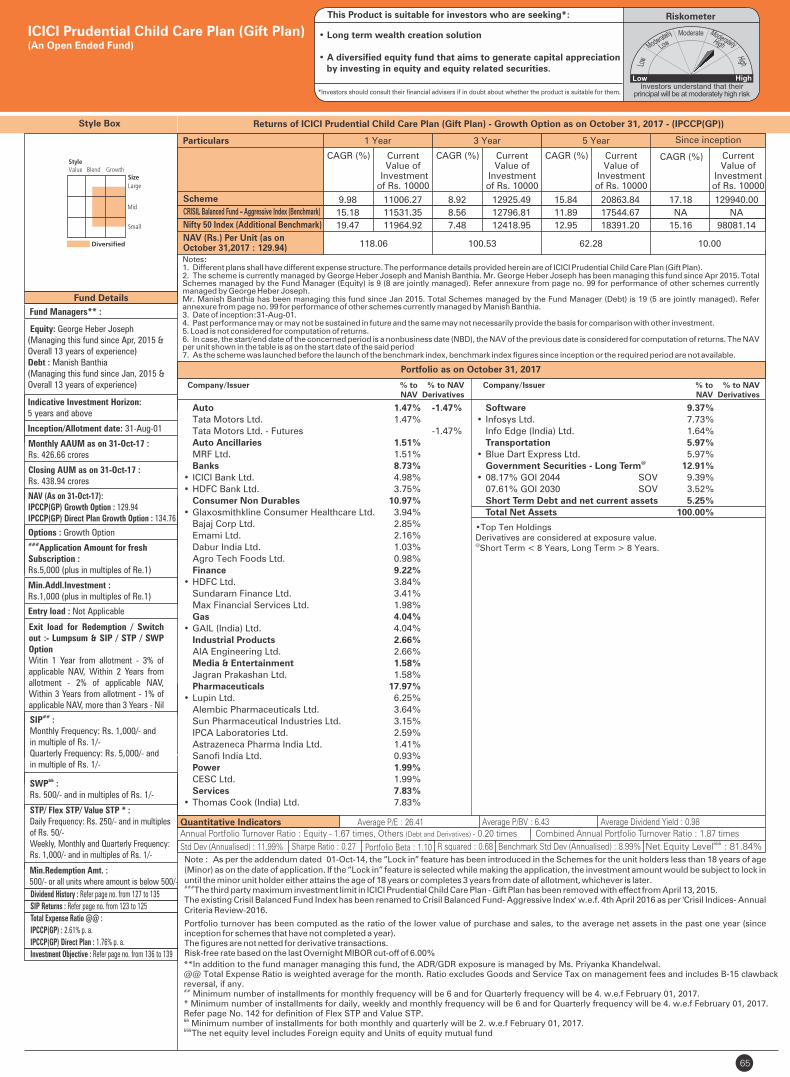
65
Fund Details
Quantitative Indicators
Style Box
Fund Managers** :
Equity: George Heber Joseph(Managing this fund since Apr, 2015 &Overall 13 years of experience)Debt : Manish Banthia(Managing this fund since Jan, 2015 &Overall 13 years of experience)
Indicative Investment Horizon:5 years and above
Inception/Allotment date: 31-Aug-01
Monthly AAUM as on 31-Oct-17 : Rs. 426.66 crores
Closing AUM as on 31-Oct-17 : Rs. 438.94 crores
NAV (As on 31-Oct-17):IPCCP(GP) Growth Option : 129.94IPCCP(GP) Direct Plan Growth Option : 134.76
Options : Growth Option###Application Amount for freshSubscription :Rs.5,000 (plus in multiples of Re.1)
Min.Addl.Investment :Rs.1,000 (plus in multiples of Re.1)
Exit load for Redemption / Switchout :- Lumpsum & SIP / STP / SWPOptionWitin 1 Year from allotment - 3% of applicable NAV, Within 2 Years from allotment - 2% of applicable NAV, Within 3 Years from allotment - 1% of applicable NAV, more than 3 Years - Nil
##SIP :Monthly Frequency: Rs. 1,000/- and in multiple of Rs. 1/-Quarterly Frequency: Rs. 5,000/- and in multiple of Rs. 1/-
&&SWP :Rs. 500/- and in multiples of Rs. 1/-
STP/ Flex STP/ Value STP * :Daily Frequency: Rs. 250/- and in multiples of Rs. 50/-Weekly, Monthly and Quarterly Frequency: Rs. 1,000/- and in multiples of Rs. 1/-
Min.Redemption Amt. :500/- or all units where amount is below 500/-
Portfolio turnover has been computed as the ratio of the lower value of purchase and sales, to the average net assets in the past one year (since inception for schemes that have not completed a year). The figures are not netted for derivative transactions.Risk-free rate based on the last Overnight MIBOR cut-off of 6.00%
**In addition to the fund manager managing this fund, the ADR/GDR exposure is managed by Ms. Priyanka Khandelwal.@@ Total Expense Ratio is weighted average for the month. Ratio excludes Goods and Service Tax on management fees and includes B-15 clawback reversal, if any.##
Minimum number of installments for monthly frequency will be 6 and for Quarterly frequency will be 4. w.e.f February 01, 2017.* Minimum number of installments for daily, weekly and monthly frequency will be 6 and for Quarterly frequency will be 4. w.e.f February 01, 2017. Refer page No. 142 for definition of Flex STP and Value STP.&& Minimum number of installments for both monthly and quarterly will be 2. w.e.f February 01, 2017.&&&The net equity level includes Foreign equity and Units of equity mutual fund
Std Dev (Annualised) : 11.99% Sharpe Ratio : 0.27
Average P/E : 26.41 Average P/BV : 6.43 Average Dividend Yield : 0.98
Portfolio Beta : 1.10 R squared : 0.68
Portfolio as on October 31, 2017
Returns of ICICI Prudential Child Care Plan (Gift Plan) - Growth Option as on October 31, 2017 - (IPCCP(GP))
• Top Ten HoldingsDerivatives are considered at exposure value.@Short Term < 8 Years, Long Term > 8 Years.
Note : As per the addendum dated 01-Oct-14, the ”Lock in” feature has been introduced in the Schemes for the unit holders less than 18 years of age (Minor) as on the date of application. If the ”Lock in” feature is selected while making the application, the investment amount would be subject to lock in until the minor unit holder either attains the age of 18 years or completes 3 years from date of allotment, whichever is later.###The third party maximum investment limit in ICICI Prudential Child Care Plan - Gift Plan has been removed with effect from April 13, 2015. The existing Crisil Balanced Fund Index has been renamed to Crisil Balanced Fund- Aggressive Index' w.e.f. 4th April 2016 as per 'Crisil Indices- Annual Criteria Review-2016.
&&&Net Equity Level : 81.84%
ICICI Prudential Child Care Plan (Gift Plan)(An Open Ended Fund)
Benchmark Std Dev (Annualised) : 8.99%
Entry load : Not Applicable
RiskometerThis Product is suitable for investors who are seeking*:
• Long term wealth creation solution
• A diversified equity fund that aims to generate capital appreciation by investing in equity and equity related securities.
*Investors should consult their financial advisers if in doubt about whether the product is suitable for them.
Annual Portfolio Turnover Ratio : Equity - 1.67 times, Others (Debt and Derivatives) - 0.20 times Combined Annual Portfolio Turnover Ratio : 1.87 times
Dividend History : Refer page no. from 127 to 135
SIP Returns : Refer page no. from 123 to 125
Total Expense Ratio @@ :
IPCCP(GP) : 2.61% p. a.
IPCCP(GP) Direct Plan : 1.76% p. a.
Investment Objective : Refer page no. from 136 to 139
Notes:1. Different plans shall have different expense structure. The performance details provided herein are of ICICI Prudential Child Care Plan (Gift Plan).2. The scheme is currently managed by George Heber Joseph and Manish Banthia. Mr. George Heber Joseph has been managing this fund since Apr 2015. Total Schemes managed by the Fund Manager . Refer annexure from page no. 99 for performance of other schemes currently (Equity) is 9 (8 are jointly managed)managed by George Heber Joseph. Mr. Manish Banthia has been managing this fund since Jan 2015. Total Schemes managed by the Fund Manager . Refer (Debt) is 19 (5 are jointly managed)annexure from page no. 99 for performance of other schemes currently managed by Manish Banthia. 3. Date of inception:31-Aug-01.4. Past performance may or may not be sustained in future and the same may not necessarily provide the basis for comparison with other investment.5. Load is not considered for computation of returns.6. In case, the start/end date of the concerned period is a nonbusiness date (NBD), the NAV of the previous date is considered for computation of returns. The NAV per unit shown in the table is as on the start date of the said period7. As the scheme was launched before the launch of the benchmark index, benchmark index figures since inception or the required period are not available.
Scheme
Nifty 50 Index (Additional Benchmark)
NAV (Rs.) Per Unit (as on October 31,2017 : 129.94)
CAGR (%)
10.00
CRISIL Balanced Fund – Aggressive Index (Benchmark)
Since inception
CurrentValue of
Investment of Rs. 10000
CAGR (%) Current Value of
Investment of Rs. 10000
1 Year 3 Year 5 Year
CAGR (%) Current Value of
Investment of Rs. 10000
CAGR (%) Current Value of
Investment of Rs. 10000
118.06 100.53 62.28
Particulars
9.98 11006.27 8.92 12925.49 15.84 20863.84 17.18 129940.00
15.18 11531.35 8.56 12796.81 11.89 17544.67 NA NA
19.47 11964.92 7.48 12418.95 12.95 18391.20 15.16 98081.14
Software 9.37% • Infosys Ltd. 7.73% Info Edge (India) Ltd. 1.64% Transportation 5.97% • Blue Dart Express Ltd. 5.97%
@ Government Securities - Long Term 12.91% • 08.17% GOI 2044 SOV 9.39% 07.61% GOI 2030 SOV 3.52% Short Term Debt and net current assets 5.25% Total Net Assets 100.00%
Company/Issuer % to % to NAV NAV Derivatives
Company/Issuer % to % to NAV NAV Derivatives
Auto 1.47% -1.47% Tata Motors Ltd. 1.47% Tata Motors Ltd. - Futures -1.47% Auto Ancillaries 1.51% MRF Ltd. 1.51% Banks 8.73% • ICICI Bank Ltd. 4.98% • HDFC Bank Ltd. 3.75% Consumer Non Durables 10.97% • Glaxosmithkline Consumer Healthcare Ltd. 3.94% Bajaj Corp Ltd. 2.85% Emami Ltd. 2.16% Dabur India Ltd. 1.03% Agro Tech Foods Ltd. 0.98% Finance 9.22% • HDFC Ltd. 3.84% Sundaram Finance Ltd. 3.41% Max Financial Services Ltd. 1.98% Gas 4.04% • GAIL (India) Ltd. 4.04% Industrial Products 2.66% AIA Engineering Ltd. 2.66% Media & Entertainment 1.58% Jagran Prakashan Ltd. 1.58% Pharmaceuticals 17.97% • Lupin Ltd. 6.25% Alembic Pharmaceuticals Ltd. 3.64% Sun Pharmaceutical Industries Ltd. 3.15% IPCA Laboratories Ltd. 2.59% Astrazeneca Pharma India Ltd. 1.41% Sanofi India Ltd. 0.93% Power 1.99% CESC Ltd. 1.99% Services 7.83% • Thomas Cook (India) Ltd. 7.83%
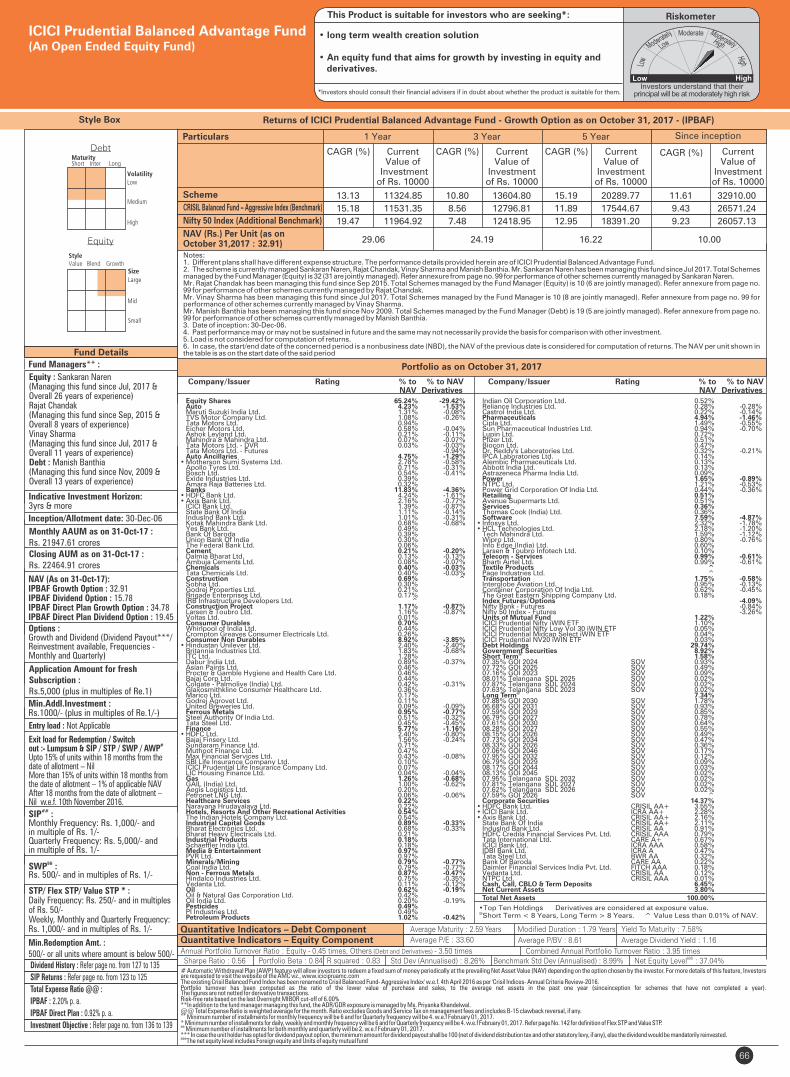
Equity Shares 65.24% -29.42% Auto 4.23% -1.53% Maruti Suzuki India Ltd. 1.31% -0.08% TVS Motor Company Ltd. 1.08% -0.26% Tata Motors Ltd. 0.94% Eicher Motors Ltd. 0.58% -0.04% Ashok Leyland Ltd. 0.21% -0.11% Mahindra & Mahindra Ltd. 0.07% -0.07% Tata Motors Ltd. - DVR 0.03% -0.03% Tata Motors Ltd. - Futures -0.94% Auto Ancillaries 4.75% -1.29%• Motherson Sumi Systems Ltd. 2.78% -0.58% Apollo Tyres Ltd. 0.71% -0.31% Bosch Ltd. 0.54% -0.41% Exide Industries Ltd. 0.39% Amara Raja Batteries Ltd. 0.32% Banks 11.83% -4.36%• HDFC Bank Ltd. 4.24% -1.61%• Axis Bank Ltd. 2.16% -0.77% ICICI Bank Ltd. 1.39% -0.87% State Bank Of India 1.11% -0.14% IndusInd Bank Ltd. 1.01% -0.31% Kotak Mahindra Bank Ltd. 0.68% -0.68% Yes Bank Ltd. 0.49% Bank Of Baroda 0.39% Union Bank Of India 0.30% The Federal Bank Ltd. 0.06% Cement 0.21% -0.20% Dalmia Bharat Ltd. 0.13% -0.13% Ambuja Cements Ltd. 0.08% -0.07% Chemicals 0.40% -0.03% Tata Chemicals Ltd. 0.40% -0.03% Construction 0.69% ^ Sobha Ltd. 0.30% Godrej Properties Ltd. 0.21% Brigade Enterprises Ltd. 0.17% IRB Infrastructure Developers Ltd. ^ Construction Project 1.17% -0.87% Larsen & Toubro Ltd. 1.16% -0.87% Voltas Ltd. 0.01% Consumer Durables 0.70% Whirlpool of India Ltd. 0.44% Crompton Greaves Consumer Electricals Ltd. 0.26% Consumer Non Durables 8.92% -3.85%• Hindustan Unilever Ltd. 2.40% -2.40% Britannia Industries Ltd. 1.83% -0.68% ITC Ltd. 1.28% Dabur India Ltd. 0.89% -0.37% Asian Paints Ltd. 0.46% Procter & Gamble Hygiene and Health Care Ltd. 0.46% Bajaj Corp Ltd. 0.44% Colgate - Palmolive (India) Ltd. 0.42% -0.31% Glaxosmithkline Consumer Healthcare Ltd. 0.36% Marico Ltd. 0.17% Godrej Agrovet Ltd. 0.11% United Breweries Ltd. 0.09% -0.09% Ferrous Metals 0.95% -0.77% Steel Authority Of India Ltd. 0.51% -0.32% Tata Steel Ltd. 0.45% -0.45% Finance 5.77% -1.16%• HDFC Ltd. 2.40% -0.80% Bajaj Finserv Ltd. 1.56% -0.24% Sundaram Finance Ltd. 0.71% Muthoot Finance Ltd. 0.47% Max Financial Services Ltd. 0.43% -0.08% SBI Life Insurance Company Ltd. 0.10% ICICI Prudential Life Insurance Company Ltd. 0.07% LIC Housing Finance Ltd. 0.04% -0.04% Gas 1.26% -0.68% GAIL (India) Ltd. 1.00% -0.62% Aegis Logistics Ltd. 0.20% Petronet LNG Ltd. 0.06% -0.06% Healthcare Services 0.22% Narayana Hrudayalaya Ltd. 0.22% Hotels, Resorts And Other Recreational Activities 0.54% The Indian Hotels Company Ltd. 0.54% Industrial Capital Goods 0.89% -0.33% Bharat Electronics Ltd. 0.68% -0.33% Bharat Heavy Electricals Ltd. 0.21% Industrial Products 0.18% Schaeffler India Ltd. 0.18% Media & Entertainment 0.97% PVR Ltd. 0.97% Minerals/Mining 0.79% -0.77% Coal India Ltd. 0.79% -0.77% Non - Ferrous Metals 0.87% -0.47% Hindalco Industries Ltd. 0.75% -0.35% Vedanta Ltd. 0.11% -0.12% Oil 0.62% -0.19% Oil & Natural Gas Corporation Ltd. 0.42% Oil India Ltd. 0.20% -0.19% Pesticides 0.49% PI Industries Ltd. 0.49% Petroleum Products 1.02% -0.42%
66
Equity
Debt
Fund Details
Style Box
Fund Managers** :
Equity : Sankaran Naren (Managing this fund since Jul, 2017 & Overall 26 years of experience)Rajat Chandak(Managing this fund since Sep, 2015 &Overall 8 years of experience)Vinay Sharma (Managing this fund since Jul, 2017 &Overall 11 years of experience)Debt : Manish Banthia (Managing this fund since Nov, 2009 & Overall 13 years of experience)
Indicative Investment Horizon:3yrs & more
Inception/Allotment date: 30-Dec-06
Monthly AAUM as on 31-Oct-17 : Rs. 21947.61 croresClosing AUM as on 31-Oct-17 : Rs. 22464.91 crores
NAV (As on 31-Oct-17):IPBAF Growth Option : 32.91IPBAF Dividend Option : 15.78IPBAF Direct Plan Growth Option : 34.78IPBAF Direct Plan Dividend Option : 19.45
# Automatic Withdrawal Plan (AWP) feature will allow investors to redeem a fixed sum of money periodically at the prevailing Net Asset Value (NAV) depending on the option chosen by the investor. For more details of this feature, Investors are requested to visit the website of the AMC viz., www.icicipruamc.comThe existing Crisil Balanced Fund Index has been renamed to Crisil Balanced Fund- Aggressive Index' w.e.f. 4th April 2016 as per 'Crisil Indices- Annual Criteria Review-2016.Portfolio turnover has been computed as the ratio of the lower value of purchase and sales, to the average net assets in the past one year (sinceinception for schemes that have not completed a year). The figures are not netted for derivative transactions.Risk-free rate based on the last Overnight MIBOR cut-off of 6.00%**In addition to the fund manager managing this fund, the ADR/GDR exposure is managed by Ms. Priyanka Khandelwal.@@ Total Expense Ratio is weighted average for the month. Ratio excludes Goods and Service Tax on management fees and includes B-15 clawback reversal, if any.##
Minimum number of installments for monthly frequency will be 6 and for Quarterly frequency will be 4. w.e.f February 01, 2017.* Minimum number of installments for daily, weekly and monthly frequency will be 6 and for Quarterly frequency will be 4. w.e.f February 01, 2017. Refer page No. 142 for definition of Flex STP and Value STP.&&
Minimum number of installments for both monthly and quarterly will be 2. w.e.f February 01, 2017.*** In case the unit holder has opted for dividend payout option, the minimum amount for dividend payout shall be 100 (net of dividend distribution tax and other statutory levy, if any), else the dividend would be mandatorily reinvested.&&&The net equity level includes Foreign equity and Units of equity mutual fund
Sharpe Ratio : 0.56 Portfolio Beta : 0.84 R squared : 0.83
• Top Ten Holdings Derivatives are considered at exposure value.@Short Term < 8 Years, Long Term > 8 Years. ^ Value Less than 0.01% of NAV.
Portfolio as on October 31, 2017
Returns of ICICI Prudential Balanced Advantage Fund - Growth Option as on October 31, 2017 - (IPBAF)
Company/Issuer Rating % to % to NAV NAV Derivatives
Quantitative Indicators – Debt Component Average Maturity : 2.59 Years Modified Duration : 1.79 Years Yield To Maturity : 7.58%
Quantitative Indicators – Equity Component
Benchmark Std Dev (Annualised) : 8.99% &&&Net Equity Level : 37.04%
Indian Oil Corporation Ltd. 0.52% Reliance Industries Ltd. 0.28% -0.28% Castrol India Ltd. 0.22% -0.14% Pharmaceuticals 4.94% -1.46% Cipla Ltd. 1.49% -0.55% Sun Pharmaceutical Industries Ltd. 0.94% -0.70% Lupin Ltd. 0.72% Pfizer Ltd. 0.51% Biocon Ltd. 0.47% Dr. Reddy's Laboratories Ltd. 0.32% -0.21% IPCA Laboratories Ltd. 0.14% Alembic Pharmaceuticals Ltd. 0.13% Abbott India Ltd. 0.13% Astrazeneca Pharma India Ltd. 0.09% Power 1.65% -0.89% NTPC Ltd. 1.21% -0.53% Power Grid Corporation Of India Ltd. 0.44% -0.36% Retailing 0.51% Avenue Supermarts Ltd. 0.51% Services 0.36% Thomas Cook (India) Ltd. 0.36% Software 7.59% -4.87%• Infosys Ltd. 2.32% -1.78%• HCL Technologies Ltd. 2.18% -1.20% Tech Mahindra Ltd. 1.59% -1.12% Wipro Ltd. 0.80% -0.76% Info Edge (India) Ltd. 0.60% Larsen & Toubro Infotech Ltd. 0.10% Telecom - Services 0.99% -0.61% Bharti Airtel Ltd. 0.99% -0.61% Textile Products ^ Page Industries Ltd. ^ Transportation 1.75% -0.58% Interglobe Aviation Ltd. 0.95% -0.13% Container Corporation Of India Ltd. 0.62% -0.45% The Great Eastern Shipping Company Ltd. 0.18% Index Futures/Options -4.09% Nifty Bank - Futures -0.84% Nifty 50 Index - Futures -3.26% Units of Mutual Fund 1.22% ICICI Prudential Nifty iWIN ETF 1.10% ICICI Prudential Nifty Low Vol 30 iWIN ETF 0.05% ICICI Prudential Midcap Select iWIN ETF 0.04% ICICI Prudential NV20 iWIN ETF 0.03% Debt Holdings 29.74% Government Securities 8.92%
@ Short Term 1.58% 07.35% GOI 2024 SOV 0.93% 07.72% GOI 2025 SOV 0.49% 07.16% GOI 2023 SOV 0.09% 08.01% Telangana SDL 2025 SOV 0.02% 07.87% Telangana SDL 2024 SOV 0.02% 07.63% Telangana SDL 2023 SOV 0.02%
@ Long Term 7.34% 07.88% GOI 2030 SOV 1.78% 06.68% GOI 2031 SOV 0.93% 07.59% GOI 2029 SOV 0.85% 06.79% GOI 2027 SOV 0.78% 07.61% GOI 2030 SOV 0.64% 08.28% GOI 2027 SOV 0.55% 08.15% GOI 2026 SOV 0.49% 07.73% GOI 2034 SOV 0.47% 08.33% GOI 2026 SOV 0.36% 07.06% GOI 2046 SOV 0.17% 07.95% GOI 2032 SOV 0.12% 06.79% GOI 2029 SOV 0.09% 08.17% GOI 2044 SOV 0.03% 08.13% GOI 2045 SOV 0.02% 07.95% Telangana SDL 2032 SOV 0.02% 07.81% Telangana SDL 2027 SOV 0.02% 07.62% Telangana SDL 2026 SOV 0.02% 07.59% GOI 2026 SOV ^ Corporate Securities 14.37% • HDFC Bank Ltd. CRISIL AA+ 3.55% • ICICI Bank Ltd. ICRA AA+ 2.28% • Axis Bank Ltd. CRISIL AA+ 2.16% State Bank Of India CRISIL AA+ 2.11% IndusInd Bank Ltd. CRISIL AA 0.91% HDFC Credila Financial Services Pvt. Ltd. CRISIL AAA 0.79% Tata International Ltd. CARE A+ 0.67% ICICI Bank Ltd. ICRA AAA 0.58% IDBI Bank Ltd. ICRA A 0.47% Tata Steel Ltd. BWR AA 0.32% Bank Of Baroda CARE AA 0.22% Daimler Financial Services India Pvt. Ltd. FITCH AAA 0.18% Vedanta Ltd. CRISIL AA 0.12% NTPC Ltd. CRISIL AAA 0.01% Cash, Call, CBLO & Term Deposits 6.45% Net Current Assets 3.80% Total Net Assets 100.00%
Company/Issuer Rating % to % to NAV NAV Derivatives
ICICI Prudential Balanced Advantage Fund(An Open Ended Equity Fund)
Std Dev (Annualised) : 8.26%
Options :Growth and Dividend (Dividend Payout***/Reinvestment available, Frequencies - Monthly and Quarterly)
Application Amount for freshSubscription :Rs.5,000 (plus in multiples of Re.1)
Min.Addl.Investment :Rs.1000/- (plus in multiples of Re.1/-)
Exit load for Redemption / Switch#out :- Lumpsum & SIP / STP / SWP / AWP
Upto 15% of units within 18 months from the date of allotment – Nil More than 15% of units within 18 months from the date of allotment – 1% of applicable NAV After 18 months from the date of allotment – Nil w.e.f. 10th November 2016.
##SIP :Monthly Frequency: Rs. 1,000/- and in multiple of Rs. 1/-Quarterly Frequency: Rs. 5,000/- and in multiple of Rs. 1/-
&&SWP :Rs. 500/- and in multiples of Rs. 1/-
STP/ Flex STP/ Value STP * :Daily Frequency: Rs. 250/- and in multiples of Rs. 50/-Weekly, Monthly and Quarterly Frequency: Rs. 1,000/- and in multiples of Rs. 1/-
Min.Redemption Amt. :500/- or all units where amount is below 500/-
Entry load : Not Applicable
RiskometerThis Product is suitable for investors who are seeking*:
• long term wealth creation solution
• An equity fund that aims for growth by investing in equity and derivatives.
*Investors should consult their financial advisers if in doubt about whether the product is suitable for them.
Average P/E : 33.60 Average P/BV : 8.61 Average Dividend Yield : 1.16
Annual Portfolio Turnover Ratio : Equity - 0.45 times, Others (Debt and Derivatives) - 3.50 times Combined Annual Portfolio Turnover Ratio : 3.95 times
Dividend History : Refer page no. from 127 to 135
SIP Returns : Refer page no. from 123 to 125
Total Expense Ratio @@ :
IPBAF : 2.20% p. a.
IPBAF Direct Plan : 0.92% p. a.
Investment Objective : Refer page no. from 136 to 139
Notes:1. Different plans shall have different expense structure. The performance details provided herein are of ICICI Prudential Balanced Advantage Fund.2. The scheme is currently managed Sankaran Naren, Vinay Sharma and Manish Banthia. Mr. Sankaran Naren has been managing this fund since Jul 2017. Total Schemes Rajat Chandak, managed by the Fund Manager . Refer annexure from page no. 99 for performance of other schemes currently managed by Sankaran Naren.(Equity) is 32 (31 are jointly managed)Mr. has been managing this fund since . Total Schemes managed by the Fund Manager . Refer annexure from page no. Rajat Chandak Sep 2015 (Equity) is 10 (6 are jointly managed)99 for performance of other schemes currently managed by . Rajat ChandakMr. Vinay Sharma has been managing this fund since Jul 2017. Total Schemes managed by the Fund Manager Refer annexure from page no. 99 for is 10 (8 are jointly managed).performance of other schemes currently managed by Vinay Sharma.Mr. Manish Banthia has been managing this fund since . Total Schemes managed by the Fund Manager . Refer annexure from page no. Nov 2009 (Debt) is 19 (5 are jointly managed)99 for performance of other schemes currently managed by Manish Banthia. 3. Date of inception: 30-Dec-06.4. Past performance may or may not be sustained in future and the same may not necessarily provide the basis for comparison with other investment.5. Load is not considered for computation of returns.6. In case, the start/end date of the concerned period is a nonbusiness date (NBD), the NAV of the previous date is considered for computation of returns. The NAV per unit shown in the table is as on the start date of the said period
Scheme
Nifty 50 Index (Additional Benchmark)
NAV (Rs.) Per Unit (as on October 31,2017 : 32.91)
CAGR (%)
10.00
CRISIL Balanced Fund – Aggressive Index (Benchmark)
Since inception
CurrentValue of
Investment of Rs. 10000
CAGR (%) Current Value of
Investment of Rs. 10000
1 Year 3 Year 5 Year
CAGR (%) Current Value of
Investment of Rs. 10000
CAGR (%) Current Value of
Investment of Rs. 10000
29.06 24.19 16.22
Particulars
13.13 11324.85 10.80 13604.80 15.19 20289.77 11.61 32910.00
15.18 11531.35 8.56 12796.81 11.89 17544.67 9.43 26571.24
19.47 11964.92 7.48 12418.95 12.95 18391.20 9.23 26057.13
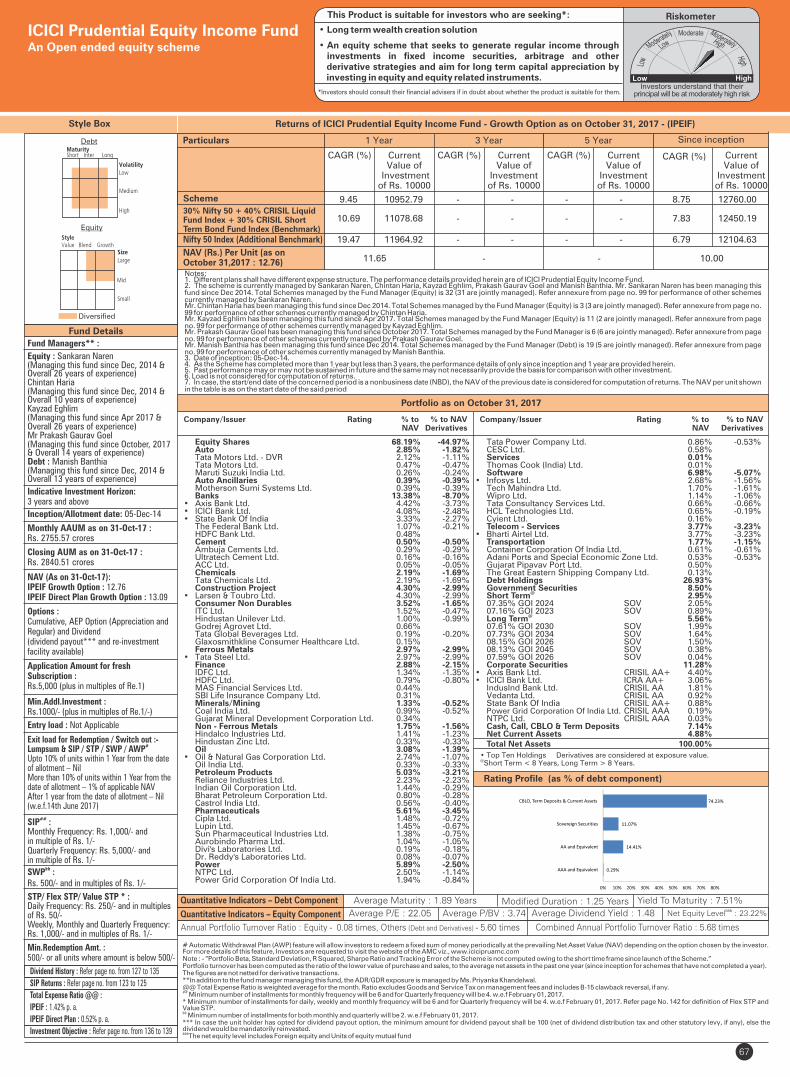
Style Box
Fund Managers** :
Equity : Sankaran Naren(Managing this fund since Dec, 2014 & Overall 26 years of experience)Chintan Haria(Managing this fund since Dec, 2014 & Overall 10 years of experience)Kayzad Eghlim(Managing this fund since Apr 2017 &Overall 26 years of experience)Mr Prakash Gaurav Goel (Managing this fund since October, 2017 & Overall 14 years of experience)Debt : Manish Banthia(Managing this fund since Dec, 2014 & Overall 13 years of experience)
Indicative Investment Horizon: 3 years and above
Inception/Allotment date: 05-Dec-14
NAV (As on 31-Oct-17):IPEIF Growth Option : 12.76IPEIF Direct Plan Growth Option : 13.09
Options :Cumulative, AEP Option (Appreciation and Regular) and Dividend (dividend payout*** and re-investment facility available)
Application Amount for freshSubscription :Rs.5,000 (plus in multiples of Re.1)
Min.Addl.Investment :Rs.1000/- (plus in multiples of Re.1/-)
Exit load for Redemption / Switch out :- #Lumpsum & SIP / STP / SWP / AWP
Upto 10% of units within 1 Year from the date of allotment – Nil More than 10% of units within 1 Year from the date of allotment – 1% of applicable NAV After 1 year from the date of allotment – Nil (w.e.f.14th June 2017)
Fund Details
• Top Ten Holdings Derivatives are considered at exposure value.@Short Term < 8 Years, Long Term > 8 Years.
Company/Issuer Rating % to % to NAV NAV Derivatives
Company/Issuer Rating % to % to NAV NAV Derivatives
Equity Shares 68.19% -44.97% Auto 2.85% -1.82% Tata Motors Ltd. - DVR 2.12% -1.11% Tata Motors Ltd. 0.47% -0.47% Maruti Suzuki India Ltd. 0.26% -0.24% Auto Ancillaries 0.39% -0.39% Motherson Sumi Systems Ltd. 0.39% -0.39% Banks 13.38% -8.70%• Axis Bank Ltd. 4.42% -3.73%• ICICI Bank Ltd. 4.08% -2.48%• State Bank Of India 3.33% -2.27% The Federal Bank Ltd. 1.07% -0.21% HDFC Bank Ltd. 0.48% Cement 0.50% -0.50% Ambuja Cements Ltd. 0.29% -0.29% Ultratech Cement Ltd. 0.16% -0.16% ACC Ltd. 0.05% -0.05% Chemicals 2.19% -1.69% Tata Chemicals Ltd. 2.19% -1.69% Construction Project 4.30% -2.99%• Larsen & Toubro Ltd. 4.30% -2.99% Consumer Non Durables 3.52% -1.65% ITC Ltd. 1.52% -0.47% Hindustan Unilever Ltd. 1.00% -0.99% Godrej Agrovet Ltd. 0.66% Tata Global Beverages Ltd. 0.19% -0.20% Glaxosmithkline Consumer Healthcare Ltd. 0.15% Ferrous Metals 2.97% -2.99%• Tata Steel Ltd. 2.97% -2.99% Finance 2.88% -2.15% IDFC Ltd. 1.34% -1.35% HDFC Ltd. 0.79% -0.80% MAS Financial Services Ltd. 0.44% SBI Life Insurance Company Ltd. 0.31% Minerals/Mining 1.33% -0.52% Coal India Ltd. 0.99% -0.52% Gujarat Mineral Development Corporation Ltd. 0.34% Non - Ferrous Metals 1.75% -1.56% Hindalco Industries Ltd. 1.41% -1.23% Hindustan Zinc Ltd. 0.33% -0.33% Oil 3.08% -1.39%• Oil & Natural Gas Corporation Ltd. 2.74% -1.07% Oil India Ltd. 0.33% -0.33% Petroleum Products 5.03% -3.21% Reliance Industries Ltd. 2.23% -2.23% Indian Oil Corporation Ltd. 1.44% -0.29% Bharat Petroleum Corporation Ltd. 0.80% -0.28% Castrol India Ltd. 0.56% -0.40% Pharmaceuticals 5.61% -3.45% Cipla Ltd. 1.48% -0.72% Lupin Ltd. 1.45% -0.67% Sun Pharmaceutical Industries Ltd. 1.38% -0.75% Aurobindo Pharma Ltd. 1.04% -1.05% Divi's Laboratories Ltd. 0.19% -0.18% Dr. Reddy's Laboratories Ltd. 0.08% -0.07% Power 5.89% -2.50% NTPC Ltd. 2.50% -1.14% Power Grid Corporation Of India Ltd. 1.94% -0.84%
Monthly AAUM as on 31-Oct-17 :Rs. 2755.57 crores
Closing AUM as on 31-Oct-17 : Rs. 2840.51 crores
Debt
Diversified
Equity
Tata Power Company Ltd. 0.86% -0.53% CESC Ltd. 0.58% Services 0.01% Thomas Cook (India) Ltd. 0.01% Software 6.98% -5.07%• Infosys Ltd. 2.68% -1.56% Tech Mahindra Ltd. 1.70% -1.61% Wipro Ltd. 1.14% -1.06% Tata Consultancy Services Ltd. 0.66% -0.66% HCL Technologies Ltd. 0.65% -0.19% Cyient Ltd. 0.16% Telecom - Services 3.77% -3.23%• Bharti Airtel Ltd. 3.77% -3.23% Transportation 1.77% -1.15% Container Corporation Of India Ltd. 0.61% -0.61% Adani Ports and Special Economic Zone Ltd. 0.53% -0.53% Gujarat Pipavav Port Ltd. 0.50% The Great Eastern Shipping Company Ltd. 0.13% Debt Holdings 26.93% Government Securities 8.50%
@ Short Term 2.95% 07.35% GOI 2024 SOV 2.05% 07.16% GOI 2023 SOV 0.89%
@ Long Term 5.56% 07.61% GOI 2030 SOV 1.99% 07.73% GOI 2034 SOV 1.64% 08.15% GOI 2026 SOV 1.50% 08.13% GOI 2045 SOV 0.38% 07.59% GOI 2026 SOV 0.04% Corporate Securities 11.28% • Axis Bank Ltd. CRISIL AA+ 4.40% • ICICI Bank Ltd. ICRA AA+ 3.06% IndusInd Bank Ltd. CRISIL AA 1.81% Vedanta Ltd. CRISIL AA 0.92% State Bank Of India CRISIL AA+ 0.88% Power Grid Corporation Of India Ltd. CRISIL AAA 0.19% NTPC Ltd. CRISIL AAA 0.03% Cash, Call, CBLO & Term Deposits 7.14% Net Current Assets 4.88% Total Net Assets 100.00%
ICICI Prudential Equity Income FundAn Open ended equity scheme
Entry load : Not Applicable
Rating Profile (as % of debt component)
RiskometerThis Product is suitable for investors who are seeking*:
• Long term wealth creation solution
• An equity scheme that seeks to generate regular income through investments in fixed income securities, arbitrage and other derivative strategies and aim for long term capital appreciation by investing in equity and equity related instruments.
*Investors should consult their financial advisers if in doubt about whether the product is suitable for them.
# Automatic Withdrawal Plan (AWP) feature will allow investors to redeem a fixed sum of money periodically at the prevailing Net Asset Value (NAV) depending on the option chosen by the investor. For more details of this feature, Investors are requested to visit the website of the AMC viz., www.icicipruamc.comNote : - “Portfolio Beta, Standard Deviation, R Squared, Sharpe Ratio and Tracking Error of the Scheme is not computed owing to the short time frame since launch of the Scheme.”Portfolio turnover has been computed as the ratio of the lower value of purchase and sales, to the average net assets in the past one year (since inception for schemes that have not completed a year). The figures are not netted for derivative transactions.**In addition to the fund manager managing this fund, the ADR/GDR exposure is managed by Ms. Priyanka Khandelwal.@@ Total Expense Ratio is weighted average for the month. Ratio excludes Goods and Service Tax on management fees and includes B-15 clawback reversal, if any.##
Minimum number of installments for monthly frequency will be 6 and for Quarterly frequency will be 4. w.e.f February 01, 2017.* Minimum number of installments for daily, weekly and monthly frequency will be 6 and for Quarterly frequency will be 4. w.e.f February 01, 2017. Refer page No. 142 for definition of Flex STP and Value STP.&&
Minimum number of installments for both monthly and quarterly will be 2. w.e.f February 01, 2017.*** In case the unit holder has opted for dividend payout option, the minimum amount for dividend payout shall be 100 (net of dividend distribution tax and other statutory levy, if any), else the dividend would be mandatorily reinvested.&&&The net equity level includes Foreign equity and Units of equity mutual fund
&&SWP :Rs. 500/- and in multiples of Rs. 1/-
Min.Redemption Amt. :500/- or all units where amount is below 500/-
##SIP :Monthly Frequency: Rs. 1,000/- and in multiple of Rs. 1/-Quarterly Frequency: Rs. 5,000/- and in multiple of Rs. 1/-
67
Quantitative Indicators – Equity Component Average P/E : 22.05 Average P/BV : 3.74 Average Dividend Yield : 1.48
STP/ Flex STP/ Value STP * :Daily Frequency: Rs. 250/- and in multiples of Rs. 50/-Weekly, Monthly and Quarterly Frequency: Rs. 1,000/- and in multiples of Rs. 1/-
&&&Net Equity Level : 23.22%
Quantitative Indicators – Debt Component Average Maturity : 1.89 Years Modified Duration : 1.25 Years Yield To Maturity : 7.51%
Annual Portfolio Turnover Ratio : Equity - 0.08 times, Others (Debt and Derivatives) - 5.60 times Combined Annual Portfolio Turnover Ratio : 5.68 times
Portfolio as on October 31, 2017
Returns of ICICI Prudential Equity Income Fund - Growth Option as on - (IPEIF)October 31, 2017
Dividend History : Refer page no. from 127 to 135
SIP Returns : Refer page no. from 123 to 125
Total Expense Ratio @@ :
IPEIF : 1.42% p. a.
IPEIF Direct Plan : 0.52% p. a.
Investment Objective : Refer page no. from 136 to 139
Notes:1. Different plans shall have different expense structure. The performance details provided herein are of ICICI Prudential Equity Income Fund.2. The scheme is currently managed , , Kayzad Eghlim, Prakash Gaurav Goel and Manish Banthia. Mr. Sankaran Naren has been managing this by Sankaran Naren Chintan Hariafund since Dec 2014. Total Schemes managed by the Fund Manager . Refer annexure from page no. 99 for performance of other schemes (Equity) is 32 (31 are jointly managed)currently managed by Sankaran Naren.Mr. has been managing this fund since . Total Schemes managed by the Fund Manager . Refer annexure from page no. Chintan Haria Dec 2014 (Equity) is 3 (3 are jointly managed)99 for performance of other schemes currently managed by . Chintan HariaMr. has been managing this fund since Apr 2017. Total Schemes managed by the Fund Manager . Refer annexure from page Kayzad Eghlim (Equity) is 11 (2 are jointly managed)no. 99 for performance of other schemes currently managed by .Kayzad EghlimMr. Prakash Gaurav Goel has been managing this fund since October 2017. Total Schemes managed by the Fund Manager . Refer annexure from page is 6 (6 are jointly managed)no. 99 for performance of other schemes currently managed by Prakash Gaurav Goel. Mr. Manish Banthia has been managing this fund since . Total Schemes managed by the Fund Manager . Refer annexure from page Dec 2014 (Debt) is 19 (5 are jointly managed)no. 99 for performance of other schemes currently managed by Manish Banthia. 3. Date of inception: 05-Dec-14.4. As the Scheme has completed more than 1 year but less than 3 years, the performance details of only since inception and 1 year are provided herein.5. Past performance may or may not be sustained in future and the same may not necessarily provide the basis for comparison with other investment.6. Load is not considered for computation of returns.7. In case, the start/end date of the concerned period is a nonbusiness date (NBD), the NAV of the previous date is considered for computation of returns. The NAV per unit shown in the table is as on the start date of the said period
Scheme
Nifty 50 Index (Additional Benchmark)
NAV (Rs.) Per Unit (as on October 31,2017 : 12.76)
CAGR (%)
10.00
30% Nifty 50 + 40% CRISIL Liquid Fund Index + 30% CRISIL Short Term Bond Fund Index (Benchmark)
Since inception
CurrentValue of
Investment of Rs. 10000
CAGR (%) Current Value of
Investment of Rs. 10000
1 Year 3 Year 5 Year
CAGR (%) Current Value of
Investment of Rs. 10000
CAGR (%) Current Value of
Investment of Rs. 10000
11.65 - -
Particulars
9.45 10952.79 - - - - 8.75 12760.00
10.69 11078.68 - - - - 7.83 12450.19
19.47 11964.92 - - - - 6.79 12104.63
0.29%
14.41%
11.07%
74.23%
0% 10% 20% 30% 40% 50% 60% 70% 80%
AAA and Equivalent
AA and Equivalent
Sovereign Securities
CBLO, Term Deposits & Current Assets
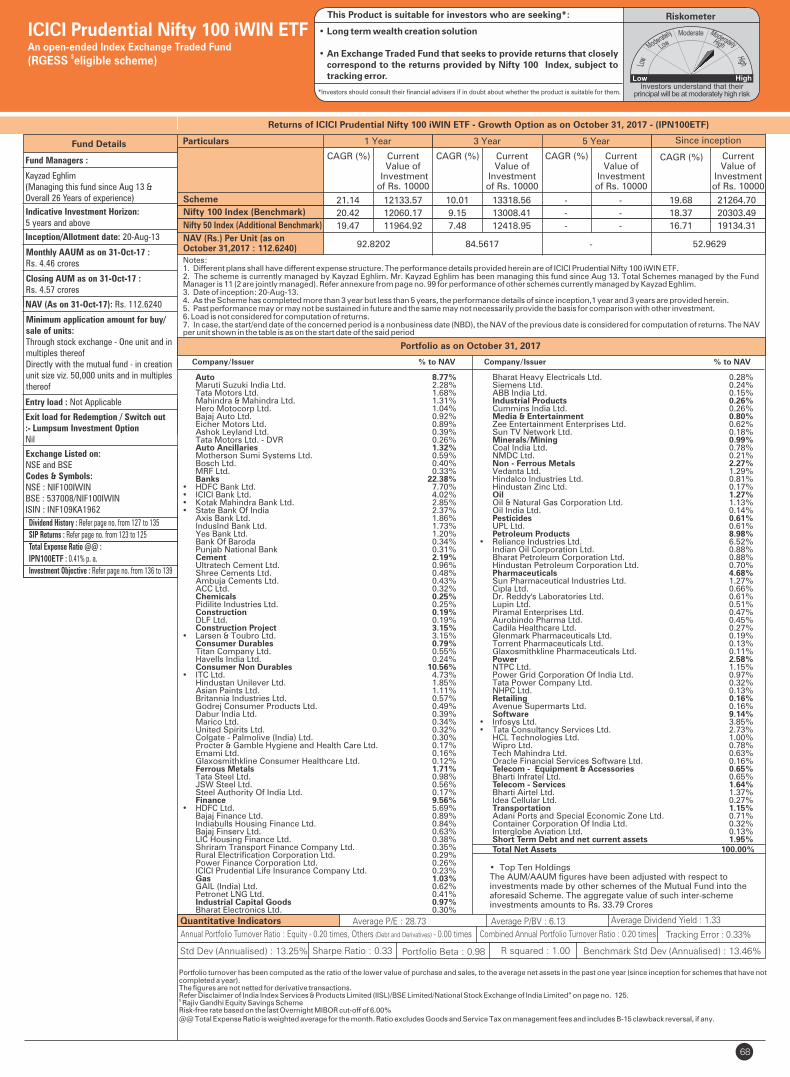
68
Fund Details
Quantitative Indicators
Company/Issuer % to NAV
Fund Managers :
Kayzad Eghlim(Managing this fund since Aug 13 &Overall 26 Years of experience)
Indicative Investment Horizon: 5 years and above
Inception/Allotment date: 20-Aug-13
Monthly AAUM as on 31-Oct-17 : Rs. 4.46 crores
Closing AUM as on 31-Oct-17 : Rs. 4.57 crores
NAV (As on 31-Oct-17): Rs. 112.6240
Minimum application amount for buy/sale of units:Through stock exchange - One unit and inmultiples thereofDirectly with the mutual fund - in creationunit size viz. 50,000 units and in multiplesthereof
Exit load for Redemption / Switch out:- Lumpsum Investment OptionNil
Exchange Listed on:NSE and BSECodes & Symbols:NSE : NIF100IWINBSE : 537008/NIF100IWINISIN : INF109KA1962
Average P/E : 28.73 Average P/BV : 6.13 Average Dividend Yield : 1.33
Portfolio turnover has been computed as the ratio of the lower value of purchase and sales, to the average net assets in the past one year (since inception for schemes that have not completed a year). The figures are not netted for derivative transactions.Refer Disclaimer of India Index Services & Products Limited (IISL)/BSE Limited/National Stock Exchange of India Limited” on page no. 125.$ Rajiv Gandhi Equity Savings SchemeRisk-free rate based on the last Overnight MIBOR cut-off of 6.00%@@ Total Expense Ratio is weighted average for the month. Ratio excludes Goods and Service Tax on management fees and includes B-15 clawback reversal, if any.
Company/Issuer % to NAV
Portfolio as on October 31, 2017
• Top Ten HoldingsThe AUM/AAUM figures have been adjusted with respect to investments made by other schemes of the Mutual Fund into the aforesaid Scheme. The aggregate value of such inter-scheme investments amounts to Rs. 33.79 Crores
Auto 8.77% Maruti Suzuki India Ltd. 2.28% Tata Motors Ltd. 1.68% Mahindra & Mahindra Ltd. 1.31% Hero Motocorp Ltd. 1.04% Bajaj Auto Ltd. 0.92% Eicher Motors Ltd. 0.89% Ashok Leyland Ltd. 0.39% Tata Motors Ltd. - DVR 0.26% Auto Ancillaries 1.32% Motherson Sumi Systems Ltd. 0.59% Bosch Ltd. 0.40% MRF Ltd. 0.33% Banks 22.38%• HDFC Bank Ltd. 7.70%• ICICI Bank Ltd. 4.02%• Kotak Mahindra Bank Ltd. 2.85%• State Bank Of India 2.37% Axis Bank Ltd. 1.86% IndusInd Bank Ltd. 1.73% Yes Bank Ltd. 1.20% Bank Of Baroda 0.34% Punjab National Bank 0.31% Cement 2.19% Ultratech Cement Ltd. 0.96% Shree Cements Ltd. 0.48% Ambuja Cements Ltd. 0.43% ACC Ltd. 0.32% Chemicals 0.25% Pidilite Industries Ltd. 0.25% Construction 0.19% DLF Ltd. 0.19% Construction Project 3.15%• Larsen & Toubro Ltd. 3.15% Consumer Durables 0.79% Titan Company Ltd. 0.55% Havells India Ltd. 0.24% Consumer Non Durables 10.56%• ITC Ltd. 4.73% Hindustan Unilever Ltd. 1.85% Asian Paints Ltd. 1.11% Britannia Industries Ltd. 0.57% Godrej Consumer Products Ltd. 0.49% Dabur India Ltd. 0.39% Marico Ltd. 0.34% United Spirits Ltd. 0.32% Colgate - Palmolive (India) Ltd. 0.30% Procter & Gamble Hygiene and Health Care Ltd. 0.17% Emami Ltd. 0.16% Glaxosmithkline Consumer Healthcare Ltd. 0.12% Ferrous Metals 1.71% Tata Steel Ltd. 0.98% JSW Steel Ltd. 0.56% Steel Authority Of India Ltd. 0.17% Finance 9.56%• HDFC Ltd. 5.69% Bajaj Finance Ltd. 0.89% Indiabulls Housing Finance Ltd. 0.84% Bajaj Finserv Ltd. 0.63% LIC Housing Finance Ltd. 0.38% Shriram Transport Finance Company Ltd. 0.35% Rural Electrification Corporation Ltd. 0.29% Power Finance Corporation Ltd. 0.26% ICICI Prudential Life Insurance Company Ltd. 0.23% Gas 1.03% GAIL (India) Ltd. 0.62% Petronet LNG Ltd. 0.41% Industrial Capital Goods 0.97% Bharat Electronics Ltd. 0.30%
Bharat Heavy Electricals Ltd. 0.28% Siemens Ltd. 0.24% ABB India Ltd. 0.15% Industrial Products 0.26% Cummins India Ltd. 0.26% Media & Entertainment 0.80% Zee Entertainment Enterprises Ltd. 0.62% Sun TV Network Ltd. 0.18% Minerals/Mining 0.99% Coal India Ltd. 0.78% NMDC Ltd. 0.21% Non - Ferrous Metals 2.27% Vedanta Ltd. 1.29% Hindalco Industries Ltd. 0.81% Hindustan Zinc Ltd. 0.17% Oil 1.27% Oil & Natural Gas Corporation Ltd. 1.13% Oil India Ltd. 0.14% Pesticides 0.61% UPL Ltd. 0.61% Petroleum Products 8.98%• Reliance Industries Ltd. 6.52% Indian Oil Corporation Ltd. 0.88% Bharat Petroleum Corporation Ltd. 0.88% Hindustan Petroleum Corporation Ltd. 0.70% Pharmaceuticals 4.68% Sun Pharmaceutical Industries Ltd. 1.27% Cipla Ltd. 0.66% Dr. Reddy's Laboratories Ltd. 0.61% Lupin Ltd. 0.51% Piramal Enterprises Ltd. 0.47% Aurobindo Pharma Ltd. 0.45% Cadila Healthcare Ltd. 0.27% Glenmark Pharmaceuticals Ltd. 0.19% Torrent Pharmaceuticals Ltd. 0.13% Glaxosmithkline Pharmaceuticals Ltd. 0.11% Power 2.58% NTPC Ltd. 1.15% Power Grid Corporation Of India Ltd. 0.97% Tata Power Company Ltd. 0.32% NHPC Ltd. 0.13% Retailing 0.16% Avenue Supermarts Ltd. 0.16% Software 9.14%• Infosys Ltd. 3.85%• Tata Consultancy Services Ltd. 2.73% HCL Technologies Ltd. 1.00% Wipro Ltd. 0.78% Tech Mahindra Ltd. 0.63% Oracle Financial Services Software Ltd. 0.16% Telecom - Equipment & Accessories 0.65% Bharti Infratel Ltd. 0.65% Telecom - Services 1.64% Bharti Airtel Ltd. 1.37% Idea Cellular Ltd. 0.27% Transportation 1.15% Adani Ports and Special Economic Zone Ltd. 0.71% Container Corporation Of India Ltd. 0.32% Interglobe Aviation Ltd. 0.13% Short Term Debt and net current assets 1.95% Total Net Assets 100.00%
Returns of ICICI Prudential Nifty 100 iWIN ETF - Growth Option as on - (IPN100ETF)October 31, 2017
ICICI Prudential Nifty 100 iWIN ETF An open-ended Index Exchange Traded Fund
$(RGESS eligible scheme)
Entry load : Not Applicable
RiskometerThis Product is suitable for investors who are seeking*:
• Long term wealth creation solution
• An Exchange Traded Fund that seeks to provide returns that closely correspond to the returns provided by Nifty 100 Index, subject to tracking error.
*Investors should consult their financial advisers if in doubt about whether the product is suitable for them.
Annual Portfolio Turnover Ratio : Equity - 0.20 times, Others (Debt and Derivatives) - 0.00 times Combined Annual Portfolio Turnover Ratio : 0.20 times
Dividend History : Refer page no. from 127 to 135
SIP Returns : Refer page no. from 123 to 125
Total Expense Ratio @@ :
: 0.41% p. a.IPN100ETF
Investment Objective : Refer page no. from 136 to 139
Std Dev (Annualised) : 13.25% Sharpe Ratio : 0.33 Portfolio Beta : 0.98 R squared : 1.00 Benchmark Std Dev (Annualised) : 13.46%
Tracking Error : 0.33%
Notes:1. Different plans shall have different expense structure. The performance details provided herein are of ICICI Prudential Nifty 100 iWIN ETF.2. The scheme is currently managed by Kayzad Eghlim. Mr. Kayzad Eghlim has been managing this fund since Aug 13. Total Schemes managed by the Fund Manager Refer annexure from page no. 99 for performance of other schemes currently managed by Kayzad Eghlim. is 11 (2 are jointly managed).3. Date of inception: 20-Aug-13.4. As the Scheme has completed more than 3 year but less than 5 years, the performance details of since inception,1 year and 3 years are provided herein.5. Past performance may or may not be sustained in future and the same may not necessarily provide the basis for comparison with other investment.6. Load is not considered for computation of returns.7. In case, the start/end date of the concerned period is a nonbusiness date (NBD), the NAV of the previous date is considered for computation of returns. The NAV per unit shown in the table is as on the start date of the said period
Scheme
Nifty 50 Index (Additional Benchmark)
NAV (Rs.) Per Unit (as on October 31,2017 : 112.6240)
CAGR (%)
52.9629
Nifty 100 Index (Benchmark)
Since inception
CurrentValue of
Investment of Rs. 10000
CAGR (%) Current Value of
Investment of Rs. 10000
1 Year 3 Year 5 Year
CAGR (%) Current Value of
Investment of Rs. 10000
CAGR (%) Current Value of
Investment of Rs. 10000
92.8202 84.5617 -
Particulars
21.14 12133.57 10.01 13318.56 - - 19.68 21264.70
20.42 12060.17 9.15 13008.41 - - 18.37 20303.49
19.47 11964.92 7.48 12418.95 - - 16.71 19134.31
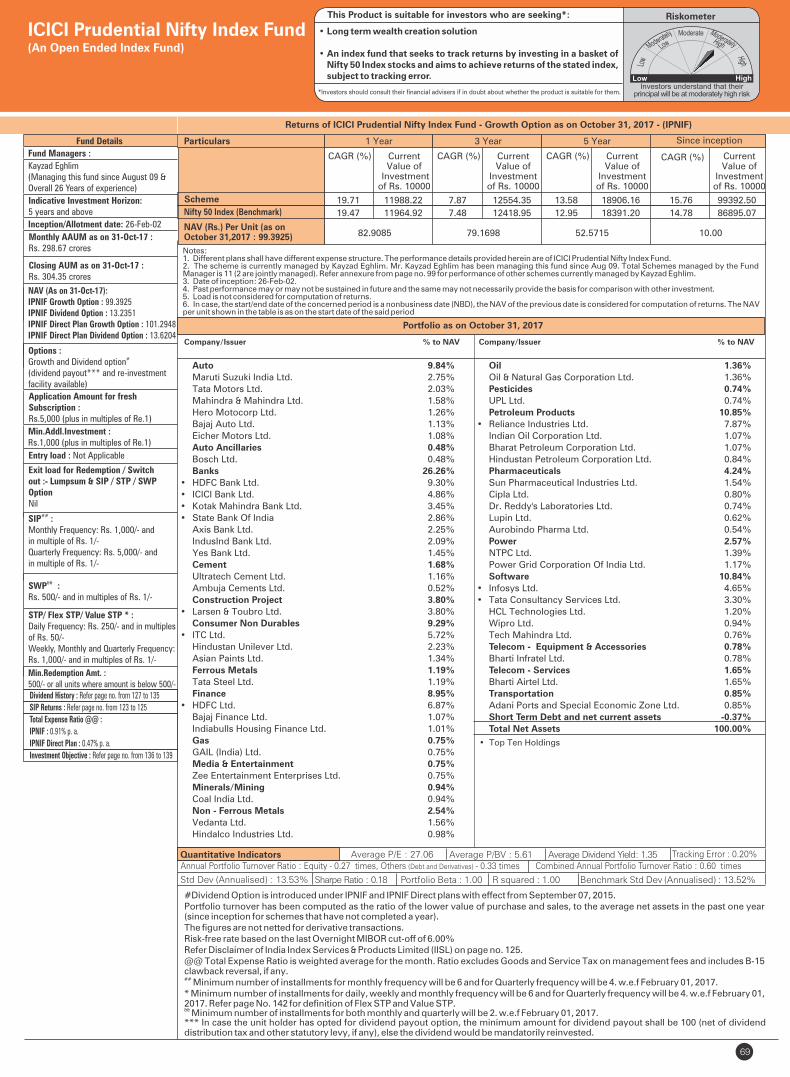
Quantitative Indicators
Fund Managers :
Kayzad Eghlim(Managing this fund since August 09 &Overall 26 Years of experience)
Indicative Investment Horizon: 5 years and above
Inception/Allotment date: 26-Feb-02
Monthly AAUM as on 31-Oct-17 :Rs. 298.67 crores
Closing AUM as on 31-Oct-17 :Rs. 304.35 crores
NAV (As on 31-Oct-17):IPNIF Growth Option : 99.3925IPNIF Dividend Option : 13.2351IPNIF Direct Plan Growth Option : 101.2948IPNIF Direct Plan Dividend Option : 13.6204
Options :#Growth and Dividend option
(dividend payout*** and re-investment facility available)
Application Amount for freshSubscription :Rs.5,000 (plus in multiples of Re.1)
Min.Addl.Investment :Rs.1,000 (plus in multiples of Re.1)
Exit load for Redemption / Switchout :- Lumpsum & SIP / STP / SWPOptionNil
SIP :##
Monthly Frequency: Rs. 1,000/- and in multiple of Rs. 1/-Quarterly Frequency: Rs. 5,000/- and in multiple of Rs. 1/-
&&SWP :Rs. 500/- and in multiples of Rs. 1/-
STP/ Flex STP/ Value STP * :Daily Frequency: Rs. 250/- and in multiples of Rs. 50/-Weekly, Monthly and Quarterly Frequency: Rs. 1,000/- and in multiples of Rs. 1/-
Min.Redemption Amt. :500/- or all units where amount is below 500/-
Std Dev (Annualised) : 13.53%
Average P/E : 27.06 Average P/BV : 5.61 Average Dividend Yield: 1.35
Sharpe Ratio : 0.18 Portfolio Beta : 1.00
Tracking Error : 0.20%
R squared : 1.00
#Dividend Option is introduced under IPNIF and IPNIF Direct plans with effect from September 07, 2015.Portfolio turnover has been computed as the ratio of the lower value of purchase and sales, to the average net assets in the past one year (since inception for schemes that have not completed a year). The figures are not netted for derivative transactions.Risk-free rate based on the last Overnight MIBOR cut-off of 6.00%Refer Disclaimer of India Index Services & Products Limited (IISL) on page no. 125.@@ Total Expense Ratio is weighted average for the month. Ratio excludes Goods and Service Tax on management fees and includes B-15 clawback reversal, if any.## Minimum number of installments for monthly frequency will be 6 and for Quarterly frequency will be 4. w.e.f February 01, 2017.* Minimum number of installments for daily, weekly and monthly frequency will be 6 and for Quarterly frequency will be 4. w.e.f February 01, 2017. Refer page No. 142 for definition of Flex STP and Value STP.&& Minimum number of installments for both monthly and quarterly will be 2. w.e.f February 01, 2017.*** In case the unit holder has opted for dividend payout option, the minimum amount for dividend payout shall be 100 (net of dividend distribution tax and other statutory levy, if any), else the dividend would be mandatorily reinvested.
69
Fund Details
Portfolio as on October 31, 2017
Returns of ICICI Prudential Nifty Index Fund - Growth Option as on - (IPNIF)October 31, 2017
• Top Ten Holdings
Auto 9.84%
Maruti Suzuki India Ltd. 2.75%
Tata Motors Ltd. 2.03%
Mahindra & Mahindra Ltd. 1.58%
Hero Motocorp Ltd. 1.26%
Bajaj Auto Ltd. 1.13%
Eicher Motors Ltd. 1.08%
Auto Ancillaries 0.48%
Bosch Ltd. 0.48%
Banks 26.26%
• HDFC Bank Ltd. 9.30%
• ICICI Bank Ltd. 4.86%
• Kotak Mahindra Bank Ltd. 3.45%
• State Bank Of India 2.86%
Axis Bank Ltd. 2.25%
IndusInd Bank Ltd. 2.09%
Yes Bank Ltd. 1.45%
Cement 1.68%
Ultratech Cement Ltd. 1.16%
Ambuja Cements Ltd. 0.52%
Construction Project 3.80%
• Larsen & Toubro Ltd. 3.80%
Consumer Non Durables 9.29%
• ITC Ltd. 5.72%
Hindustan Unilever Ltd. 2.23%
Asian Paints Ltd. 1.34%
Ferrous Metals 1.19%
Tata Steel Ltd. 1.19%
Finance 8.95%
• HDFC Ltd. 6.87%
Bajaj Finance Ltd. 1.07%
Indiabulls Housing Finance Ltd. 1.01%
Gas 0.75%
GAIL (India) Ltd. 0.75%
Media & Entertainment 0.75%
Zee Entertainment Enterprises Ltd. 0.75%
Minerals/Mining 0.94%
Coal India Ltd. 0.94%
Non - Ferrous Metals 2.54%
Vedanta Ltd. 1.56%
Hindalco Industries Ltd. 0.98%
Oil 1.36%
Oil & Natural Gas Corporation Ltd. 1.36%
Pesticides 0.74%
UPL Ltd. 0.74%
Petroleum Products 10.85%
• Reliance Industries Ltd. 7.87%
Indian Oil Corporation Ltd. 1.07%
Bharat Petroleum Corporation Ltd. 1.07%
Hindustan Petroleum Corporation Ltd. 0.84%
Pharmaceuticals 4.24%
Sun Pharmaceutical Industries Ltd. 1.54%
Cipla Ltd. 0.80%
Dr. Reddy's Laboratories Ltd. 0.74%
Lupin Ltd. 0.62%
Aurobindo Pharma Ltd. 0.54%
Power 2.57%
NTPC Ltd. 1.39%
Power Grid Corporation Of India Ltd. 1.17%
Software 10.84%
• Infosys Ltd. 4.65%
• Tata Consultancy Services Ltd. 3.30%
HCL Technologies Ltd. 1.20%
Wipro Ltd. 0.94%
Tech Mahindra Ltd. 0.76%
Telecom - Equipment & Accessories 0.78%
Bharti Infratel Ltd. 0.78%
Telecom - Services 1.65%
Bharti Airtel Ltd. 1.65%
Transportation 0.85%
Adani Ports and Special Economic Zone Ltd. 0.85%
Short Term Debt and net current assets -0.37%
Total Net Assets 100.00%
Company/Issuer % to NAV Company/Issuer % to NAV
ICICI Prudential Nifty Index Fund (An Open Ended Index Fund)
Benchmark Std Dev (Annualised) : 13.52%
Entry load : Not Applicable
RiskometerThis Product is suitable for investors who are seeking*:
• Long term wealth creation solution
• An index fund that seeks to track returns by investing in a basket of Nifty 50 Index stocks and aims to achieve returns of the stated index, subject to tracking error.
*Investors should consult their financial advisers if in doubt about whether the product is suitable for them.
Annual Portfolio Turnover Ratio : Equity - 0.27 times, Others (Debt and Derivatives) - 0.33 times Combined Annual Portfolio Turnover Ratio : 0.60 times
Dividend History : Refer page no. from 127 to 135
SIP Returns : Refer page no. from 123 to 125
Total Expense Ratio @@ :
IPNIF : 0.91% p. a.
IPNIF Direct Plan : 0.47% p. a.
Investment Objective : Refer page no. from 136 to 139
Notes:1. Different plans shall have different expense structure. The performance details provided herein are of ICICI Prudential Nifty Index Fund.2. The scheme is currently managed by Kayzad Eghlim. Mr. Kayzad Eghlim has been managing this fund since Aug 09. Total Schemes managed by the Fund Manager Refer annexure from page no. 99 for performance of other schemes currently managed by Kayzad Eghlim. is 11 (2 are jointly managed).3. Date of inception: 26-Feb-02.4. Past performance may or may not be sustained in future and the same may not necessarily provide the basis for comparison with other investment.5. Load is not considered for computation of returns.6. In case, the start/end date of the concerned period is a nonbusiness date (NBD), the NAV of the previous date is considered for computation of returns. The NAV per unit shown in the table is as on the start date of the said period
Scheme
NAV (Rs.) Per Unit (as on October 31,2017 : 99.3925)
CAGR (%)
10.00
Nifty 50 Index (Benchmark)
Since inception
CurrentValue of
Investment of Rs. 10000
CAGR (%) Current Value of
Investment of Rs. 10000
1 Year 3 Year 5 Year
CAGR (%) Current Value of
Investment of Rs. 10000
CAGR (%) Current Value of
Investment of Rs. 10000
82.9085 79.1698 52.5715
Particulars
19.71 11988.22 7.87 12554.35 13.58 18906.16 15.76 99392.50
19.47 11964.92 7.48 12418.95 12.95 18391.20 14.78 86895.07
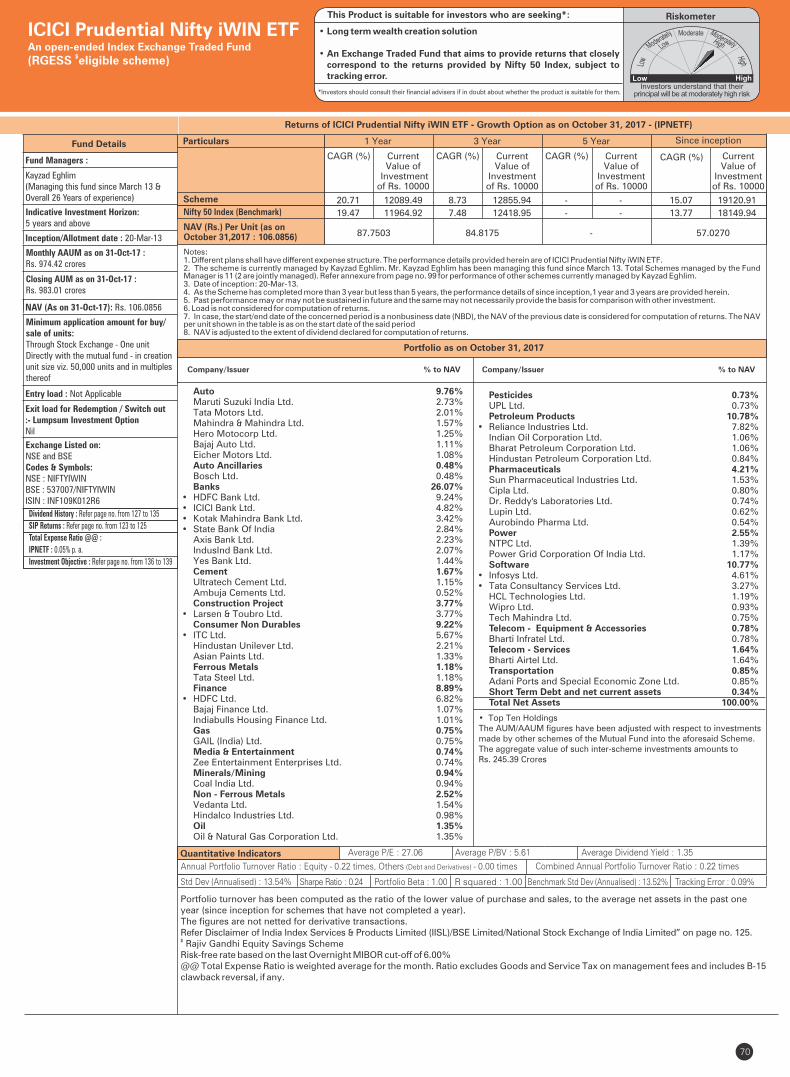
Quantitative Indicators
Fund Details
Fund Managers :
Kayzad Eghlim(Managing this fund since March 13 &Overall 26 Years of experience)
Indicative Investment Horizon: 5 years and above
Inception/Allotment date : 20-Mar-13
Monthly AAUM as on 31-Oct-17 : Rs. 974.42 crores
Closing AUM as on 31-Oct-17 : Rs. 983.01 crores
Minimum application amount for buy/sale of units:Through Stock Exchange - One unitDirectly with the mutual fund - in creationunit size viz. 50,000 units and in multiplesthereof
Exit load for Redemption / Switch out:- Lumpsum Investment OptionNil
Exchange Listed on:NSE and BSECodes & Symbols:NSE : NIFTYIWINBSE : 537007/NIFTYIWINISIN : INF109K012R6
NAV (As on 31-Oct-17): Rs. 106.0856
Average P/E : 27.06 Average P/BV : 5.61 Average Dividend Yield : 1.35
Portfolio turnover has been computed as the ratio of the lower value of purchase and sales, to the average net assets in the past one year (since inception for schemes that have not completed a year). The figures are not netted for derivative transactions.Refer Disclaimer of India Index Services & Products Limited (IISL)/BSE Limited/National Stock Exchange of India Limited” on page no. 125.$ Rajiv Gandhi Equity Savings SchemeRisk-free rate based on the last Overnight MIBOR cut-off of 6.00%@@ Total Expense Ratio is weighted average for the month. Ratio excludes Goods and Service Tax on management fees and includes B-15 clawback reversal, if any.
70
• Top Ten HoldingsThe AUM/AAUM figures have been adjusted with respect to investments made by other schemes of the Mutual Fund into the aforesaid Scheme. The aggregate value of such inter-scheme investments amounts to Rs. 245.39 Crores
Returns of ICICI Prudential Nifty iWIN ETF - Growth Option as on - (IPNETF)October 31, 2017
Portfolio as on October 31, 2017
Auto 9.76% Maruti Suzuki India Ltd. 2.73% Tata Motors Ltd. 2.01% Mahindra & Mahindra Ltd. 1.57% Hero Motocorp Ltd. 1.25% Bajaj Auto Ltd. 1.11% Eicher Motors Ltd. 1.08% Auto Ancillaries 0.48% Bosch Ltd. 0.48% Banks 26.07%• HDFC Bank Ltd. 9.24%• ICICI Bank Ltd. 4.82%• Kotak Mahindra Bank Ltd. 3.42%• State Bank Of India 2.84% Axis Bank Ltd. 2.23% IndusInd Bank Ltd. 2.07% Yes Bank Ltd. 1.44% Cement 1.67% Ultratech Cement Ltd. 1.15% Ambuja Cements Ltd. 0.52% Construction Project 3.77%• Larsen & Toubro Ltd. 3.77% Consumer Non Durables 9.22%• ITC Ltd. 5.67% Hindustan Unilever Ltd. 2.21% Asian Paints Ltd. 1.33% Ferrous Metals 1.18% Tata Steel Ltd. 1.18% Finance 8.89%• HDFC Ltd. 6.82% Bajaj Finance Ltd. 1.07% Indiabulls Housing Finance Ltd. 1.01% Gas 0.75% GAIL (India) Ltd. 0.75% Media & Entertainment 0.74% Zee Entertainment Enterprises Ltd. 0.74% Minerals/Mining 0.94% Coal India Ltd. 0.94% Non - Ferrous Metals 2.52% Vedanta Ltd. 1.54% Hindalco Industries Ltd. 0.98% Oil 1.35% Oil & Natural Gas Corporation Ltd. 1.35%
Pesticides 0.73% UPL Ltd. 0.73% Petroleum Products 10.78%• Reliance Industries Ltd. 7.82% Indian Oil Corporation Ltd. 1.06% Bharat Petroleum Corporation Ltd. 1.06% Hindustan Petroleum Corporation Ltd. 0.84% Pharmaceuticals 4.21% Sun Pharmaceutical Industries Ltd. 1.53% Cipla Ltd. 0.80% Dr. Reddy's Laboratories Ltd. 0.74% Lupin Ltd. 0.62% Aurobindo Pharma Ltd. 0.54% Power 2.55% NTPC Ltd. 1.39% Power Grid Corporation Of India Ltd. 1.17% Software 10.77%• Infosys Ltd. 4.61%• Tata Consultancy Services Ltd. 3.27% HCL Technologies Ltd. 1.19% Wipro Ltd. 0.93% Tech Mahindra Ltd. 0.75% Telecom - Equipment & Accessories 0.78% Bharti Infratel Ltd. 0.78% Telecom - Services 1.64% Bharti Airtel Ltd. 1.64% Transportation 0.85% Adani Ports and Special Economic Zone Ltd. 0.85% Short Term Debt and net current assets 0.34% Total Net Assets 100.00%
ICICI Prudential Nifty iWIN ETFAn open-ended Index Exchange Traded Fund
$(RGESS eligible scheme)
Entry load : Not Applicable
RiskometerThis Product is suitable for investors who are seeking*:
• Long term wealth creation solution
• An Exchange Traded Fund that aims to provide returns that closely correspond to the returns provided by Nifty 50 Index, subject to tracking error.
*Investors should consult their financial advisers if in doubt about whether the product is suitable for them.
Annual Portfolio Turnover Ratio : Equity - 0.22 times, Others (Debt and Derivatives) - 0.00 times Combined Annual Portfolio Turnover Ratio : 0.22 times
Std Dev (Annualised) : 13.54% Sharpe Ratio : 0.24 Portfolio Beta : 1.00 R squared : 1.00 Benchmark Std Dev (Annualised) : 13.52% Tracking Error : 0.09%
Company/Issuer % to NAV Company/Issuer % to NAV
Dividend History : Refer page no. from 127 to 135
SIP Returns : Refer page no. from 123 to 125
Total Expense Ratio @@ :
IPNETF : 0.05% p. a.
Investment Objective : Refer page no. from 136 to 139
Notes:1. Different plans shall have different expense structure. The performance details provided herein are of ICICI Prudential Nifty iWIN ETF.2. The scheme is currently managed by Kayzad Eghlim. Mr. Kayzad Eghlim has been managing this fund since March 13. Total Schemes managed by the Fund Manager Refer annexure from page no. 99 for performance of other schemes currently managed by Kayzad Eghlim. is 11 (2 are jointly managed).3. Date of inception: 20-Mar-13.4. As the Scheme has completed more than 3 year but less than 5 years, the performance details of since inception,1 year and 3 years are provided herein.5. Past performance may or may not be sustained in future and the same may not necessarily provide the basis for comparison with other investment.6. Load is not considered for computation of returns.7. In case, the start/end date of the concerned period is a nonbusiness date (NBD), the NAV of the previous date is considered for computation of returns. The NAV per unit shown in the table is as on the start date of the said period8. NAV is adjusted to the extent of dividend declared for computation of returns.
Scheme
NAV (Rs.) Per Unit (as on October 31,2017 : 106.0856)
CAGR (%)
57.0270
Nifty 50 Index (Benchmark)
Since inception
CurrentValue of
Investment of Rs. 10000
CAGR (%) Current Value of
Investment of Rs. 10000
1 Year 3 Year 5 Year
CAGR (%) Current Value of
Investment of Rs. 10000
CAGR (%) Current Value of
Investment of Rs. 10000
87.7503 84.8175 -
Particulars
20.71 12089.49 8.73 12855.94 - - 15.07 19120.91
19.47 11964.92 7.48 12418.95 - - 13.77 18149.94
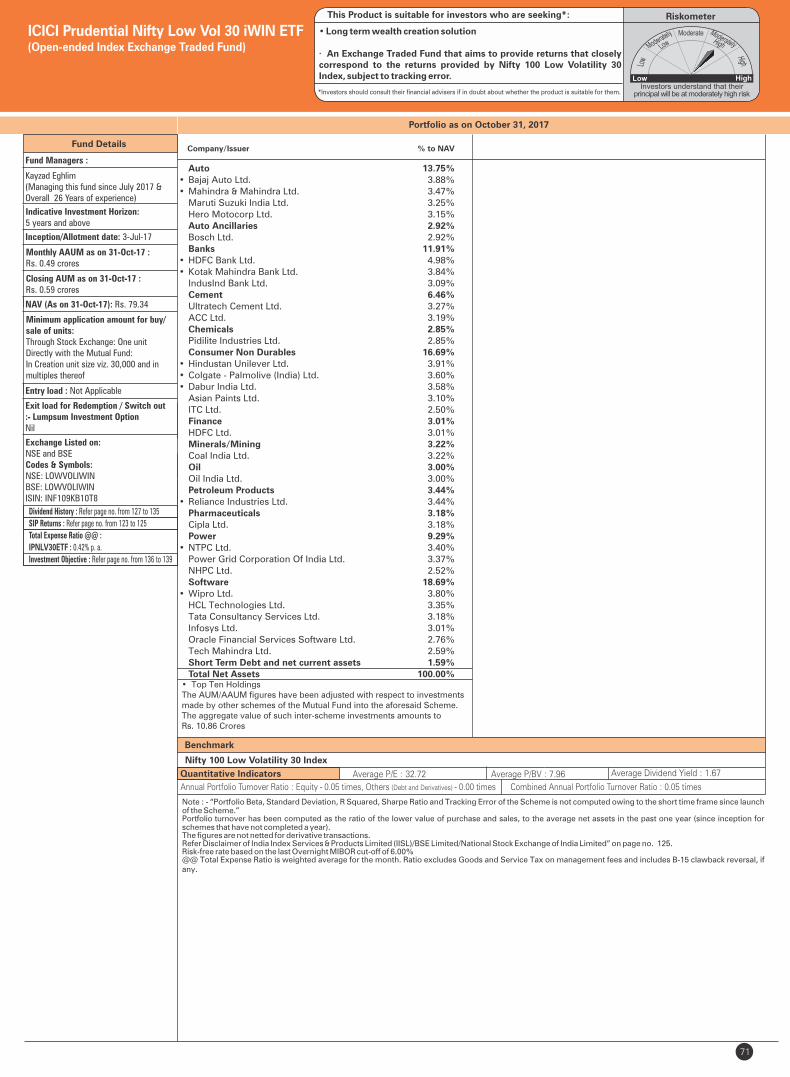
Portfolio as on October 31, 2017
71
ICICI Prudential Nifty Low Vol 30 iWIN ETF(Open-ended Index Exchange Traded Fund)
RiskometerThis Product is suitable for investors who are seeking*:
• Long term wealth creation solution
· An Exchange Traded Fund that aims to provide returns that closely correspond to the returns provided by Nifty 100 Low Volatility 30 Index, subject to tracking error.
*Investors should consult their financial advisers if in doubt about whether the product is suitable for them.
Company/Issuer % to NAV
Auto 13.75%• Bajaj Auto Ltd. 3.88%• Mahindra & Mahindra Ltd. 3.47% Maruti Suzuki India Ltd. 3.25% Hero Motocorp Ltd. 3.15% Auto Ancillaries 2.92% Bosch Ltd. 2.92% Banks 11.91%• HDFC Bank Ltd. 4.98%• Kotak Mahindra Bank Ltd. 3.84% IndusInd Bank Ltd. 3.09% Cement 6.46% Ultratech Cement Ltd. 3.27% ACC Ltd. 3.19% Chemicals 2.85% Pidilite Industries Ltd. 2.85% Consumer Non Durables 16.69%• Hindustan Unilever Ltd. 3.91%• Colgate - Palmolive (India) Ltd. 3.60%• Dabur India Ltd. 3.58% Asian Paints Ltd. 3.10% ITC Ltd. 2.50% Finance 3.01% HDFC Ltd. 3.01% Minerals/Mining 3.22% Coal India Ltd. 3.22% Oil 3.00% Oil India Ltd. 3.00% Petroleum Products 3.44%• Reliance Industries Ltd. 3.44% Pharmaceuticals 3.18% Cipla Ltd. 3.18% Power 9.29%• NTPC Ltd. 3.40% Power Grid Corporation Of India Ltd. 3.37% NHPC Ltd. 2.52% Software 18.69%• Wipro Ltd. 3.80% HCL Technologies Ltd. 3.35% Tata Consultancy Services Ltd. 3.18% Infosys Ltd. 3.01% Oracle Financial Services Software Ltd. 2.76% Tech Mahindra Ltd. 2.59% Short Term Debt and net current assets 1.59% Total Net Assets 100.00%
Benchmark
Nifty 100 Low Volatility 30 Index
Fund Details
Fund Managers :
Kayzad Eghlim(Managing this fund since July 2017 &Overall 26 Years of experience)
Indicative Investment Horizon: 5 years and above
Inception/Allotment date: 3-Jul-17
Monthly AAUM as on 31-Oct-17 : Rs. 0.49 crores
Closing AUM as on 31-Oct-17 :Rs. 0.59 crores
NAV (As on 31-Oct-17): Rs. 79.34
Minimum application amount for buy/sale of units:Through Stock Exchange: One unitDirectly with the Mutual Fund: In Creation unit size viz. 30,000 and in multiples thereof
Exit load for Redemption / Switch out:- Lumpsum Investment OptionNil
Exchange Listed on:NSE and BSECodes & Symbols:NSE: LOWVOLIWINBSE: LOWVOLIWINISIN: INF109KB10T8
Entry load : Not Applicable
Dividend History : Refer page no. from 127 to 135
SIP Returns : Refer page no. from 123 to 125
Total Expense Ratio @@ :
: 0.42% p. a.IPNLV30ETF
Investment Objective : Refer page no. from 136 to 139
Quantitative Indicators Average P/E : 32.72 Average P/BV : 7.96 Average Dividend Yield : 1.67
Note : - “Portfolio Beta, Standard Deviation, R Squared, Sharpe Ratio and Tracking Error of the Scheme is not computed owing to the short time frame since launch of the Scheme.”Portfolio turnover has been computed as the ratio of the lower value of purchase and sales, to the average net assets in the past one year (since inception for schemes that have not completed a year). The figures are not netted for derivative transactions.Refer Disclaimer of India Index Services & Products Limited (IISL)/BSE Limited/National Stock Exchange of India Limited” on page no. 125.Risk-free rate based on the last Overnight MIBOR cut-off of 6.00%@@ Total Expense Ratio is weighted average for the month. Ratio excludes Goods and Service Tax on management fees and includes B-15 clawback reversal, if any.
Annual Portfolio Turnover Ratio : Equity - 0.05 times, Others (Debt and Derivatives) - 0.00 times Combined Annual Portfolio Turnover Ratio : 0.05 times
• Top Ten HoldingsThe AUM/AAUM figures have been adjusted with respect to investments made by other schemes of the Mutual Fund into the aforesaid Scheme. The aggregate value of such inter-scheme investments amounts to Rs. 10.86 Crores
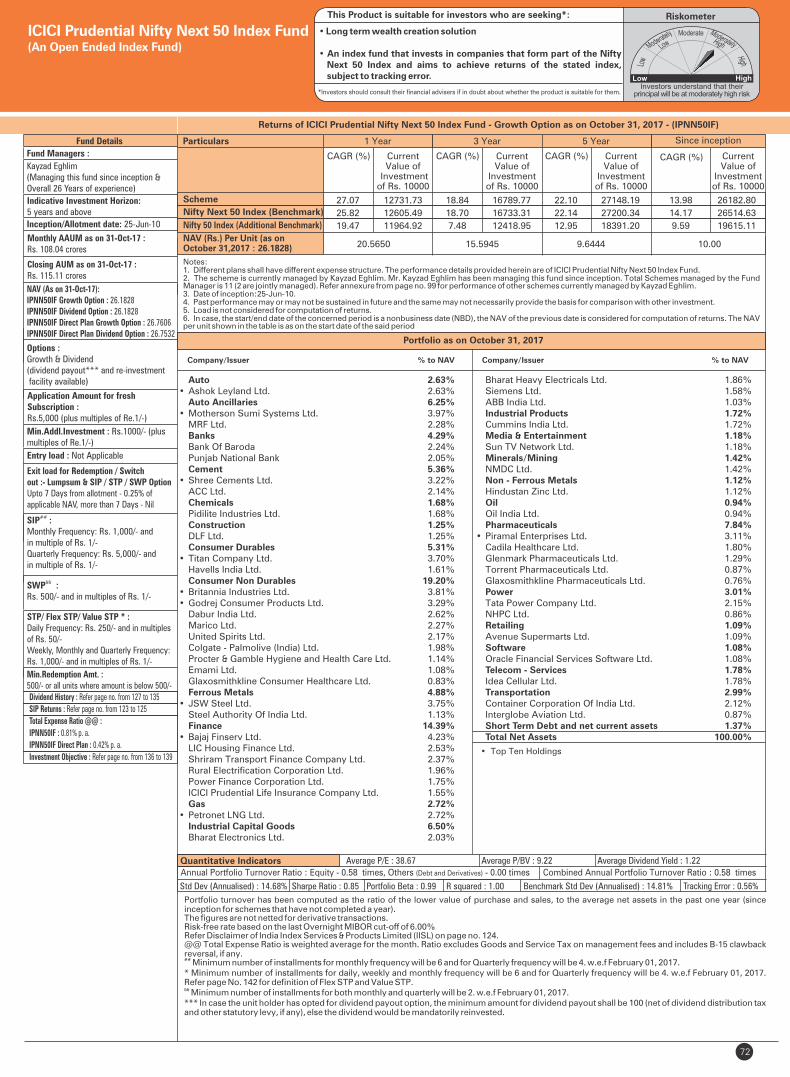
Fund Details
Quantitative Indicators
Company/Issuer % to NAV
Portfolio turnover has been computed as the ratio of the lower value of purchase and sales, to the average net assets in the past one year (since inception for schemes that have not completed a year). The figures are not netted for derivative transactions.Risk-free rate based on the last Overnight MIBOR cut-off of 6.00%Refer Disclaimer of India Index Services & Products Limited (IISL) on page no. 124.@@ Total Expense Ratio is weighted average for the month. Ratio excludes Goods and Service Tax on management fees and includes B-15 clawback reversal, if any.## Minimum number of installments for monthly frequency will be 6 and for Quarterly frequency will be 4. w.e.f February 01, 2017.* Minimum number of installments for daily, weekly and monthly frequency will be 6 and for Quarterly frequency will be 4. w.e.f February 01, 2017. Refer page No. 142 for definition of Flex STP and Value STP.&&
Minimum number of installments for both monthly and quarterly will be 2. w.e.f February 01, 2017.*** In case the unit holder has opted for dividend payout option, the minimum amount for dividend payout shall be 100 (net of dividend distribution tax and other statutory levy, if any), else the dividend would be mandatorily reinvested.
Fund Managers :
Kayzad Eghlim(Managing this fund since inception &Overall 26 Years of experience)
Indicative Investment Horizon: 5 years and above
Inception/Allotment date: 25-Jun-10
Monthly AAUM as on 31-Oct-17 : Rs. 108.04 crores
Closing AUM as on 31-Oct-17 : Rs. 115.11 crores
NAV (As on 31-Oct-17):IPNN50IF Growth Option : 26.1828IPNN50IF Dividend Option : 26.1828IPNN50IF Direct Plan Growth Option : 26.7606IPNN50IF Direct Plan Dividend Option : 26.7532
Options :Growth & Dividend(dividend payout*** and re-investment facility available)
Application Amount for freshSubscription :Rs.5,000 (plus multiples of Re.1/-)
Min.Addl.Investment : Rs.1000/- (plusmultiples of Re.1/-)
Exit load for Redemption / Switchout :- Lumpsum & SIP / STP / SWP OptionUpto 7 Days from allotment - 0.25% ofapplicable NAV, more than 7 Days - Nil
SIP :##
Monthly Frequency: Rs. 1,000/- and in multiple of Rs. 1/-Quarterly Frequency: Rs. 5,000/- and in multiple of Rs. 1/-
&&SWP :Rs. 500/- and in multiples of Rs. 1/-
STP/ Flex STP/ Value STP * :Daily Frequency: Rs. 250/- and in multiples of Rs. 50/-Weekly, Monthly and Quarterly Frequency: Rs. 1,000/- and in multiples of Rs. 1/-
Min.Redemption Amt. :500/- or all units where amount is below 500/-
Std Dev (Annualised) : 14.68% Sharpe Ratio : 0.85
Average P/E : 38.67 Average P/BV : 9.22 Average Dividend Yield : 1.22
Portfolio Beta : 0.99 R squared : 1.00
Portfolio as on October 31, 2017
Returns of ICICI Prudential Nifty Next 50 Index Fund - Growth Option as on - (IPNN50IF)October 31, 2017
Auto 2.63%• Ashok Leyland Ltd. 2.63% Auto Ancillaries 6.25%• Motherson Sumi Systems Ltd. 3.97% MRF Ltd. 2.28% Banks 4.29% Bank Of Baroda 2.24% Punjab National Bank 2.05% Cement 5.36%• Shree Cements Ltd. 3.22% ACC Ltd. 2.14% Chemicals 1.68% Pidilite Industries Ltd. 1.68% Construction 1.25% DLF Ltd. 1.25% Consumer Durables 5.31%• Titan Company Ltd. 3.70% Havells India Ltd. 1.61% Consumer Non Durables 19.20%• Britannia Industries Ltd. 3.81%• Godrej Consumer Products Ltd. 3.29% Dabur India Ltd. 2.62% Marico Ltd. 2.27% United Spirits Ltd. 2.17% Colgate - Palmolive (India) Ltd. 1.98% Procter & Gamble Hygiene and Health Care Ltd. 1.14% Emami Ltd. 1.08% Glaxosmithkline Consumer Healthcare Ltd. 0.83% Ferrous Metals 4.88%• JSW Steel Ltd. 3.75% Steel Authority Of India Ltd. 1.13% Finance 14.39%• Bajaj Finserv Ltd. 4.23% LIC Housing Finance Ltd. 2.53% Shriram Transport Finance Company Ltd. 2.37% Rural Electrification Corporation Ltd. 1.96% Power Finance Corporation Ltd. 1.75% ICICI Prudential Life Insurance Company Ltd. 1.55% Gas 2.72%• Petronet LNG Ltd. 2.72% Industrial Capital Goods 6.50% Bharat Electronics Ltd. 2.03%
Bharat Heavy Electricals Ltd. 1.86% Siemens Ltd. 1.58% ABB India Ltd. 1.03% Industrial Products 1.72% Cummins India Ltd. 1.72% Media & Entertainment 1.18% Sun TV Network Ltd. 1.18% Minerals/Mining 1.42% NMDC Ltd. 1.42% Non - Ferrous Metals 1.12% Hindustan Zinc Ltd. 1.12% Oil 0.94% Oil India Ltd. 0.94% Pharmaceuticals 7.84%• Piramal Enterprises Ltd. 3.11% Cadila Healthcare Ltd. 1.80% Glenmark Pharmaceuticals Ltd. 1.29% Torrent Pharmaceuticals Ltd. 0.87% Glaxosmithkline Pharmaceuticals Ltd. 0.76% Power 3.01% Tata Power Company Ltd. 2.15% NHPC Ltd. 0.86% Retailing 1.09% Avenue Supermarts Ltd. 1.09% Software 1.08% Oracle Financial Services Software Ltd. 1.08% Telecom - Services 1.78% Idea Cellular Ltd. 1.78% Transportation 2.99% Container Corporation Of India Ltd. 2.12% Interglobe Aviation Ltd. 0.87% Short Term Debt and net current assets 1.37% Total Net Assets 100.00%
• Top Ten Holdings
72
Tracking Error : 0.56%
ICICI Prudential Nifty Next 50 Index Fund(An Open Ended Index Fund)
Benchmark Std Dev (Annualised) : 14.81%
Entry load : Not Applicable
RiskometerThis Product is suitable for investors who are seeking*:
• Long term wealth creation solution
• An index fund that invests in companies that form part of the Nifty Next 50 Index and aims to achieve returns of the stated index, subject to tracking error.
*Investors should consult their financial advisers if in doubt about whether the product is suitable for them.
Annual Portfolio Turnover Ratio : Equity - 0.58 times, Others (Debt and Derivatives) - 0.00 times Combined Annual Portfolio Turnover Ratio : 0.58 times
Company/Issuer % to NAV
Dividend History : Refer page no. from 127 to 135
SIP Returns : Refer page no. from 123 to 125
Total Expense Ratio @@ :
IPNN50IF : 0.81% p. a.
IPNN50IF Direct Plan : 0.42% p. a.
Investment Objective : Refer page no. from 136 to 139
Notes:1. Different plans shall have different expense structure. The performance details provided herein are of ICICI Prudential Nifty Next 50 Index Fund.2. The scheme is currently managed by Kayzad Eghlim. Mr. Kayzad Eghlim has been managing this fund since inception. Total Schemes managed by the Fund Manager Refer annexure from page no. 99 for performance of other schemes currently managed by Kayzad Eghlim. is 11 (2 are jointly managed).3. Date of inception:25-Jun-10.4. Past performance may or may not be sustained in future and the same may not necessarily provide the basis for comparison with other investment.5. Load is not considered for computation of returns.6. In case, the start/end date of the concerned period is a nonbusiness date (NBD), the NAV of the previous date is considered for computation of returns. The NAV per unit shown in the table is as on the start date of the said period
Scheme
Nifty 50 Index (Additional Benchmark)
NAV (Rs.) Per Unit (as on October 31,2017 : 26.1828)
CAGR (%)
10.00
Nifty Next 50 Index (Benchmark)
Since inception
CurrentValue of
Investment of Rs. 10000
CAGR (%) Current Value of
Investment of Rs. 10000
1 Year 3 Year 5 Year
CAGR (%) Current Value of
Investment of Rs. 10000
CAGR (%) Current Value of
Investment of Rs. 10000
20.5650 15.5945 9.6444
Particulars
27.07 12731.73 18.84 16789.77 22.10 27148.19 13.98 26182.80
25.82 12605.49 18.70 16733.31 22.14 27200.34 14.17 26514.63
19.47 11964.92 7.48 12418.95 12.95 18391.20 9.59 19615.11
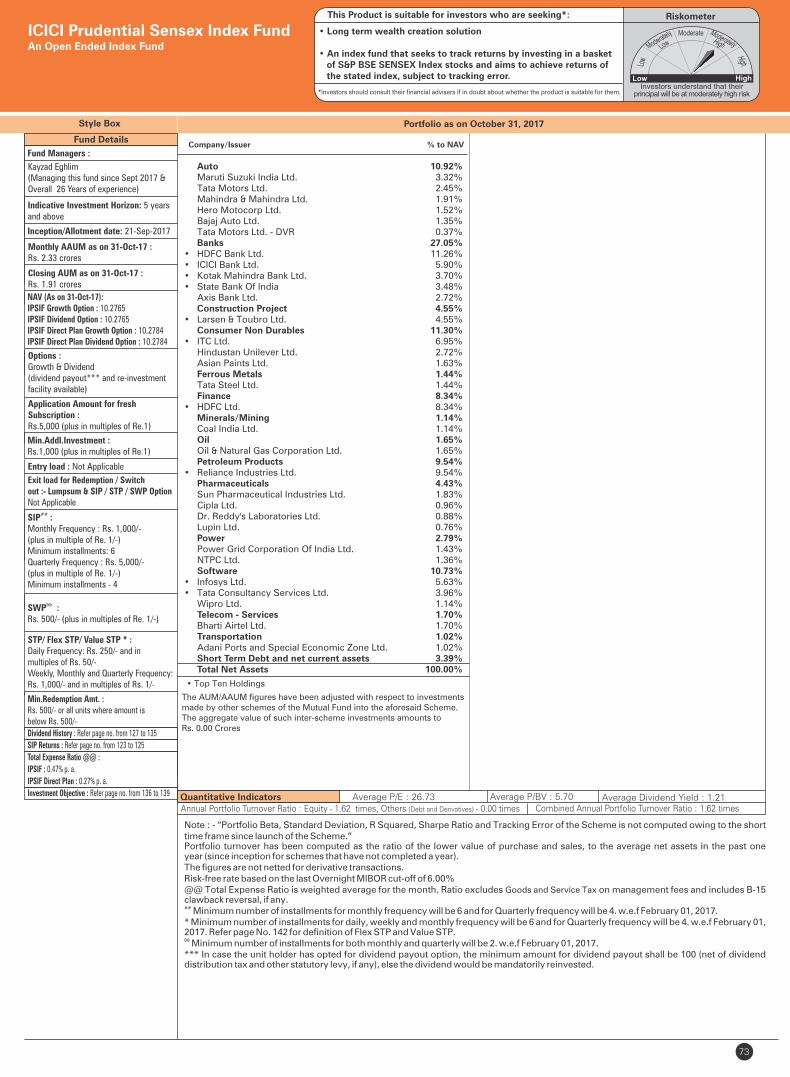
73
Note : - “Portfolio Beta, Standard Deviation, R Squared, Sharpe Ratio and Tracking Error of the Scheme is not computed owing to the short time frame since launch of the Scheme.”Portfolio turnover has been computed as the ratio of the lower value of purchase and sales, to the average net assets in the past one year (since inception for schemes that have not completed a year). The figures are not netted for derivative transactions.Risk-free rate based on the last Overnight MIBOR cut-off of 6.00%@@ Total Expense Ratio is weighted average for the month. Ratio excludes Goods and Service Tax on management fees and includes B-15 clawback reversal, if any.## Minimum number of installments for monthly frequency will be 6 and for Quarterly frequency will be 4. w.e.f February 01, 2017.* Minimum number of installments for daily, weekly and monthly frequency will be 6 and for Quarterly frequency will be 4. w.e.f February 01, 2017. Refer page No. 142 for definition of Flex STP and Value STP.&& Minimum number of installments for both monthly and quarterly will be 2. w.e.f February 01, 2017.*** In case the unit holder has opted for dividend payout option, the minimum amount for dividend payout shall be 100 (net of dividend distribution tax and other statutory levy, if any), else the dividend would be mandatorily reinvested.
Average P/E : 26.73 Average P/BV : 5.70 Average Dividend Yield : 1.21
Style Box
• Top Ten Holdings
Portfolio as on October 31, 2017
ICICI Prudential Sensex Index FundAn Open Ended Index Fund
RiskometerThis Product is suitable for investors who are seeking*:
• Long term wealth creation solution
• An index fund that seeks to track returns by investing in a basket of S&P BSE SENSEX Index stocks and aims to achieve returns of the stated index, subject to tracking error.
*Investors should consult their financial advisers if in doubt about whether the product is suitable for them.
Annual Portfolio Turnover Ratio : Equity - 1.62 times, Others (Debt and Derivatives) - 0.00 times Combined Annual Portfolio Turnover Ratio : 1.62 times
Company/Issuer % to NAV
Auto 10.92% Maruti Suzuki India Ltd. 3.32% Tata Motors Ltd. 2.45% Mahindra & Mahindra Ltd. 1.91% Hero Motocorp Ltd. 1.52% Bajaj Auto Ltd. 1.35% Tata Motors Ltd. - DVR 0.37% Banks 27.05%• HDFC Bank Ltd. 11.26%• ICICI Bank Ltd. 5.90%• Kotak Mahindra Bank Ltd. 3.70%• State Bank Of India 3.48% Axis Bank Ltd. 2.72% Construction Project 4.55%• Larsen & Toubro Ltd. 4.55% Consumer Non Durables 11.30%• ITC Ltd. 6.95% Hindustan Unilever Ltd. 2.72% Asian Paints Ltd. 1.63% Ferrous Metals 1.44% Tata Steel Ltd. 1.44% Finance 8.34%• HDFC Ltd. 8.34% Minerals/Mining 1.14% Coal India Ltd. 1.14% Oil 1.65% Oil & Natural Gas Corporation Ltd. 1.65% Petroleum Products 9.54%• Reliance Industries Ltd. 9.54% Pharmaceuticals 4.43% Sun Pharmaceutical Industries Ltd. 1.83% Cipla Ltd. 0.96% Dr. Reddy's Laboratories Ltd. 0.88% Lupin Ltd. 0.76% Power 2.79% Power Grid Corporation Of India Ltd. 1.43% NTPC Ltd. 1.36% Software 10.73%• Infosys Ltd. 5.63%• Tata Consultancy Services Ltd. 3.96% Wipro Ltd. 1.14% Telecom - Services 1.70% Bharti Airtel Ltd. 1.70% Transportation 1.02% Adani Ports and Special Economic Zone Ltd. 1.02% Short Term Debt and net current assets 3.39% Total Net Assets 100.00%
Fund Managers :
Indicative Investment Horizon: 5 yearsand above
Inception/Allotment date: 21-Sep-2017
NAV (As on 31-Oct-17):IPSIF Growth Option : 10.2765IPSIF Dividend Option : 10.2765IPSIF Direct Plan Growth Option : 10.2784IPSIF Direct Plan Dividend Option : 10.2784
Application Amount for freshSubscription :Rs.5,000 (plus in multiples of Re.1)
Min.Addl.Investment :Rs.1,000 (plus in multiples of Re.1)
Exit load for Redemption / Switchout :- Lumpsum & SIP / STP / SWP OptionNot Applicable
SIP :##
Monthly Frequency : Rs. 1,000/-(plus in multiple of Re. 1/-) Minimum installments: 6 Quarterly Frequency : Rs. 5,000/- (plus in multiple of Re. 1/-) Minimum installments - 4
&&SWP :Rs. 500/- (plus in multiples of Re. 1/-)
STP/ Flex STP/ Value STP * :Daily Frequency: Rs. 250/- and in multiples of Rs. 50/-Weekly, Monthly and Quarterly Frequency: Rs. 1,000/- and in multiples of Rs. 1/-
Min.Redemption Amt. :Rs. 500/- or all units where amount is below Rs. 500/-
Monthly AAUM as on 31-Oct-17 : Rs. 2.33 crores
Closing AUM as on 31-Oct-17 : Rs. 1.91 crores
Entry load : Not Applicable
Options :Growth & Dividend(dividend payout*** and re-investment facility available)
Dividend History : Refer page no. from 127 to 135
SIP Returns : Refer page no. from 123 to 125
Total Expense Ratio @@ :
IPSIF : 0.47% p. a.
IPSIF Direct Plan : 0.27% p. a.
Investment Objective : Refer page no. from 136 to 139
Kayzad Eghlim (Managing this fund since Sept 2017 & Overall 26 Years of experience)
The AUM/AAUM figures have been adjusted with respect to investments made by other schemes of the Mutual Fund into the aforesaid Scheme. The aggregate value of such inter-scheme investments amounts to Rs. 0.00 Crores
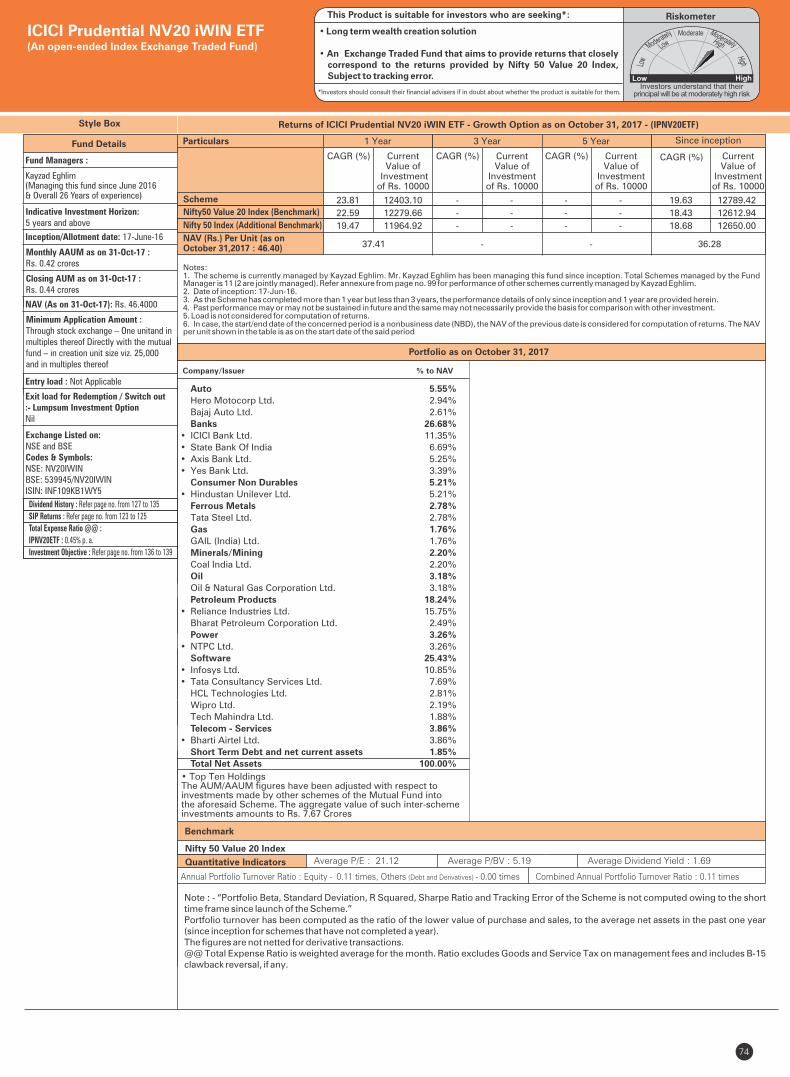
74
Style Box
RiskometerThis Product is suitable for investors who are seeking*:
• Long term wealth creation solution
• An Exchange Traded Fund that aims to provide returns that closely correspond to the returns provided by Nifty 50 Value 20 Index, Subject to tracking error.
*Investors should consult their financial advisers if in doubt about whether the product is suitable for them.
Benchmark
Nifty 50 Value 20 Index
Note : - “Portfolio Beta, Standard Deviation, R Squared, Sharpe Ratio and Tracking Error of the Scheme is not computed owing to the short time frame since launch of the Scheme.”Portfolio turnover has been computed as the ratio of the lower value of purchase and sales, to the average net assets in the past one year (since inception for schemes that have not completed a year). The figures are not netted for derivative transactions.@@ Total Expense Ratio is weighted average for the month. Ratio excludes Goods and Service Tax on management fees and includes B-15 clawback reversal, if any.
Quantitative Indicators Average P/E : 21.12 Average P/BV : 5.19 Average Dividend Yield : 1.69
• Top Ten HoldingsThe AUM/AAUM figures have been adjusted with respect to investments made by other schemes of the Mutual Fund into the aforesaid Scheme. The aggregate value of such inter-scheme investments amounts to Rs. 7.67 Crores
Annual Portfolio Turnover Ratio : Equity - 0.11 times, Others (Debt and Derivatives) - 0.00 times Combined Annual Portfolio Turnover Ratio : 0.11 times
ICICI Prudential NV20 iWIN ETF(An open-ended Index Exchange Traded Fund)
Company/Issuer % to NAV
Auto 5.55%
Hero Motocorp Ltd. 2.94%
Bajaj Auto Ltd. 2.61%
Banks 26.68%
• ICICI Bank Ltd. 11.35%
• State Bank Of India 6.69%
• Axis Bank Ltd. 5.25%
• Yes Bank Ltd. 3.39%
Consumer Non Durables 5.21%
• Hindustan Unilever Ltd. 5.21%
Ferrous Metals 2.78%
Tata Steel Ltd. 2.78%
Gas 1.76%
GAIL (India) Ltd. 1.76%
Minerals/Mining 2.20%
Coal India Ltd. 2.20%
Oil 3.18%
Oil & Natural Gas Corporation Ltd. 3.18%
Petroleum Products 18.24%
• Reliance Industries Ltd. 15.75%
Bharat Petroleum Corporation Ltd. 2.49%
Power 3.26%
• NTPC Ltd. 3.26%
Software 25.43%
• Infosys Ltd. 10.85%
• Tata Consultancy Services Ltd. 7.69%
HCL Technologies Ltd. 2.81%
Wipro Ltd. 2.19%
Tech Mahindra Ltd. 1.88%
Telecom - Services 3.86%
• Bharti Airtel Ltd. 3.86%
Short Term Debt and net current assets 1.85%
Total Net Assets 100.00%
Fund Details
Fund Managers :
Kayzad Eghlim (Managing this fund since June 2016 & Overall 26 Years of experience)
Indicative Investment Horizon: 5 years and above
Inception/Allotment date: 17-June-16
Monthly AAUM as on 31-Oct-17 : Rs. 0.42 crores
Closing AUM as on 31-Oct-17 : Rs. 0.44 crores
NAV (As on 31-Oct-17): Rs. 46.4000
Minimum Application Amount :Through stock exchange – One unitand in multiples thereof Directly with the mutual fund – in creation unit size viz. 25,000 and in multiples thereof
Exit load for Redemption / Switch out:- Lumpsum Investment OptionNil
Exchange Listed on:NSE and BSECodes & Symbols:NSE: NV20IWINBSE: 539945/NV20IWINISIN: INF109KB1WY5
Entry load : Not Applicable
Dividend History : Refer page no. from 127 to 135
SIP Returns : Refer page no. from 123 to 125
Total Expense Ratio @@ :
IPNV20ETF : 0.45% p. a.
Investment Objective : Refer page no. from 136 to 139
Notes:1. The scheme is currently managed by Kayzad Eghlim. Mr. Kayzad Eghlim has been managing this fund since inception. Total Schemes managed by the Fund Manager Refer annexure from page no. 99 for performance of other schemes currently managed by Kayzad Eghlim. is 11 (2 are jointly managed).2. Date of inception: 17-Jun-16.3. As the Scheme has completed more than 1 year but less than 3 years, the performance details of only since inception and 1 year are provided herein.4. Past performance may or may not be sustained in future and the same may not necessarily provide the basis for comparison with other investment.5. Load is not considered for computation of returns.6. In case, the start/end date of the concerned period is a nonbusiness date (NBD), the NAV of the previous date is considered for computation of returns. The NAV per unit shown in the table is as on the start date of the said period
Scheme
Nifty 50 Index (Additional Benchmark)
NAV (Rs.) Per Unit (as on October 31,2017 : 46.40)
CAGR (%)
36.28
Nifty50 Value 20 Index (Benchmark)
Since inception
CurrentValue of
Investment of Rs. 10000
CAGR (%) Current Value of
Investment of Rs. 10000
1 Year 3 Year 5 Year
CAGR (%) Current Value of
Investment of Rs. 10000
CAGR (%) Current Value of
Investment of Rs. 10000
37.41 - -
Particulars
23.81 12403.10 - - - - 19.63 12789.42
22.59 12279.66 - - - - 18.43 12612.94
19.47 11964.92 - - - - 18.68 12650.00
Portfolio as on October 31, 2017
Returns of ICICI Prudential NV20 iWIN ETF - Growth Option as on October 31, 2017 - ( )IPNV20ETF
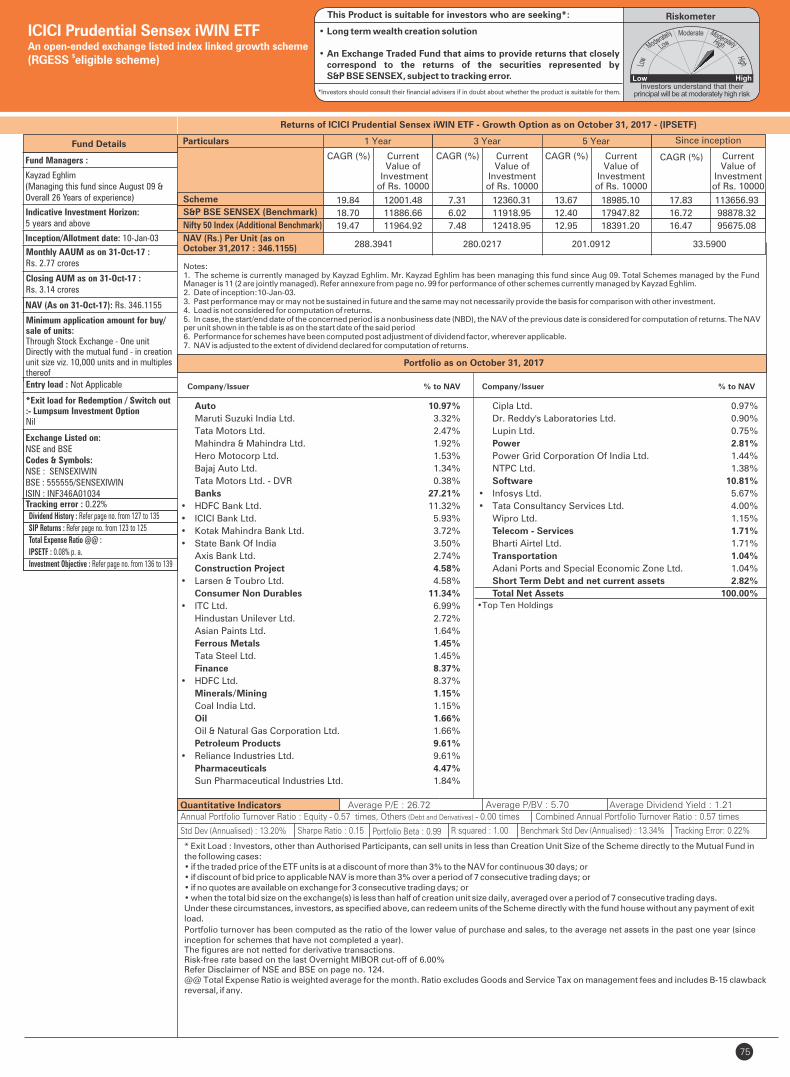
75
Fund Details
Quantitative Indicators
Fund Managers :
Kayzad Eghlim(Managing this fund since August 09 &Overall 26 Years of experience)
Indicative Investment Horizon: 5 years and above
Inception/Allotment date: 10-Jan-03
Monthly AAUM as on 31-Oct-17 :Rs. 2.77 crores
Closing AUM as on 31-Oct-17 : Rs. 3.14 crores
NAV (As on 31-Oct-17): Rs. 346.1155
Minimum application amount for buy/sale of units:Through Stock Exchange - One unitDirectly with the mutual fund - in creationunit size viz. 10,000 units and in multiplesthereof
*Exit load for Redemption / Switch out:- Lumpsum Investment OptionNil
Exchange Listed on:NSE and BSECodes & Symbols:NSE : SENSEXIWINBSE : 555555/SENSEXIWINISIN : INF346A01034
Portfolio turnover has been computed as the ratio of the lower value of purchase and sales, to the average net assets in the past one year (since inception for schemes that have not completed a year). The figures are not netted for derivative transactions.Risk-free rate based on the last Overnight MIBOR cut-off of 6.00%Refer Disclaimer of NSE and BSE on page no. 124.@@ Total Expense Ratio is weighted average for the month. Ratio excludes Goods and Service Tax on management fees and includes B-15 clawback reversal, if any.
Std Dev (Annualised) : 13.20% Sharpe Ratio : 0.15
Average P/E : 26.72 Average P/BV : 5.70 Average Dividend Yield : 1.21
Portfolio Beta : 0.99 R squared : 1.00
• Top Ten Holdings
Portfolio as on October 31, 2017
Returns of ICICI Prudential Sensex iWIN ETF - Growth Option as on - (IPSETF)October 31, 2017
Auto 10.97%
Maruti Suzuki India Ltd. 3.32%
Tata Motors Ltd. 2.47%
Mahindra & Mahindra Ltd. 1.92%
Hero Motocorp Ltd. 1.53%
Bajaj Auto Ltd. 1.34%
Tata Motors Ltd. - DVR 0.38%
Banks 27.21%
• HDFC Bank Ltd. 11.32%
• ICICI Bank Ltd. 5.93%
• Kotak Mahindra Bank Ltd. 3.72%
• State Bank Of India 3.50%
Axis Bank Ltd. 2.74%
Construction Project 4.58%
• Larsen & Toubro Ltd. 4.58%
Consumer Non Durables 11.34%
• ITC Ltd. 6.99%
Hindustan Unilever Ltd. 2.72%
Asian Paints Ltd. 1.64%
Ferrous Metals 1.45%
Tata Steel Ltd. 1.45%
Finance 8.37%
• HDFC Ltd. 8.37%
Minerals/Mining 1.15%
Coal India Ltd. 1.15%
Oil 1.66%
Oil & Natural Gas Corporation Ltd. 1.66%
Petroleum Products 9.61%
• Reliance Industries Ltd. 9.61%
Pharmaceuticals 4.47%
Sun Pharmaceutical Industries Ltd. 1.84%
Cipla Ltd. 0.97%
Dr. Reddy's Laboratories Ltd. 0.90%
Lupin Ltd. 0.75%
Power 2.81%
Power Grid Corporation Of India Ltd. 1.44%
NTPC Ltd. 1.38%
Software 10.81%
• Infosys Ltd. 5.67%
• Tata Consultancy Services Ltd. 4.00%
Wipro Ltd. 1.15%
Telecom - Services 1.71%
Bharti Airtel Ltd. 1.71%
Transportation 1.04%
Adani Ports and Special Economic Zone Ltd. 1.04%
Short Term Debt and net current assets 2.82%
Total Net Assets 100.00%
Tracking error : 0.22%
* Exit Load : Investors, other than Authorised Participants, can sell units in less than Creation Unit Size of the Scheme directly to the Mutual Fund in the following cases:• if the traded price of the ETF units is at a discount of more than 3% to the NAV for continuous 30 days; or • if discount of bid price to applicable NAV is more than 3% over a period of 7 consecutive trading days; or• if no quotes are available on exchange for 3 consecutive trading days; or• when the total bid size on the exchange(s) is less than half of creation unit size daily, averaged over a period of 7 consecutive trading days.Under these circumstances, investors, as specified above, can redeem units of the Scheme directly with the fund house without any payment of exit load.
ICICI Prudential Sensex iWIN ETFAn open-ended exchange listed index linked growth scheme
$(RGESS eligible scheme)
Tracking Error: 0.22%Benchmark Std Dev (Annualised) : 13.34%
Entry load : Not Applicable
RiskometerThis Product is suitable for investors who are seeking*:
• Long term wealth creation solution
• An Exchange Traded Fund that aims to provide returns that closely correspond to the returns of the securities represented by S&P BSE SENSEX, subject to tracking error.
*Investors should consult their financial advisers if in doubt about whether the product is suitable for them.
Annual Portfolio Turnover Ratio : Equity - 0.57 times, Others (Debt and Derivatives) - 0.00 times Combined Annual Portfolio Turnover Ratio : 0.57 times
Company/Issuer % to NAV Company/Issuer % to NAV
Dividend History : Refer page no. from 127 to 135
SIP Returns : Refer page no. from 123 to 125
Total Expense Ratio @@ :
IPSETF : 0.08% p. a.
Investment Objective : Refer page no. from 136 to 139
Notes:1. The scheme is currently managed by Kayzad Eghlim. Mr. Kayzad Eghlim has been managing this fund since Aug 09. Total Schemes managed by the Fund Manager Refer annexure from page no. 99 for performance of other schemes currently managed by Kayzad Eghlim. is 11 (2 are jointly managed).2. Date of inception:10-Jan-03.3. Past performance may or may not be sustained in future and the same may not necessarily provide the basis for comparison with other investment.4. Load is not considered for computation of returns.5. In case, the start/end date of the concerned period is a nonbusiness date (NBD), the NAV of the previous date is considered for computation of returns. The NAV per unit shown in the table is as on the start date of the said period6. Performance for schemes have been computed post adjustment of dividend factor, wherever applicable. 7. NAV is adjusted to the extent of dividend declared for computation of returns.
Scheme
Nifty 50 Index (Additional Benchmark)
NAV (Rs.) Per Unit (as onOctober 31,2017 : 346.1155)
CAGR (%)
33.5900
S&P BSE SENSEX (Benchmark)
Since inception
CurrentValue of
Investment of Rs. 10000
CAGR (%) Current Value of
Investment of Rs. 10000
1 Year 3 Year 5 Year
CAGR (%) Current Value of
Investment of Rs. 10000
CAGR (%) Current Value of
Investment of Rs. 10000
288.3941 280.0217 201.0912
Particulars
19.84 12001.48 7.31 12360.31 13.67 18985.10 17.83 113656.93
18.70 11886.66 6.02 11918.95 12.40 17947.82 16.72 98878.32
19.47 11964.92 7.48 12418.95 12.95 18391.20 16.47 95675.08
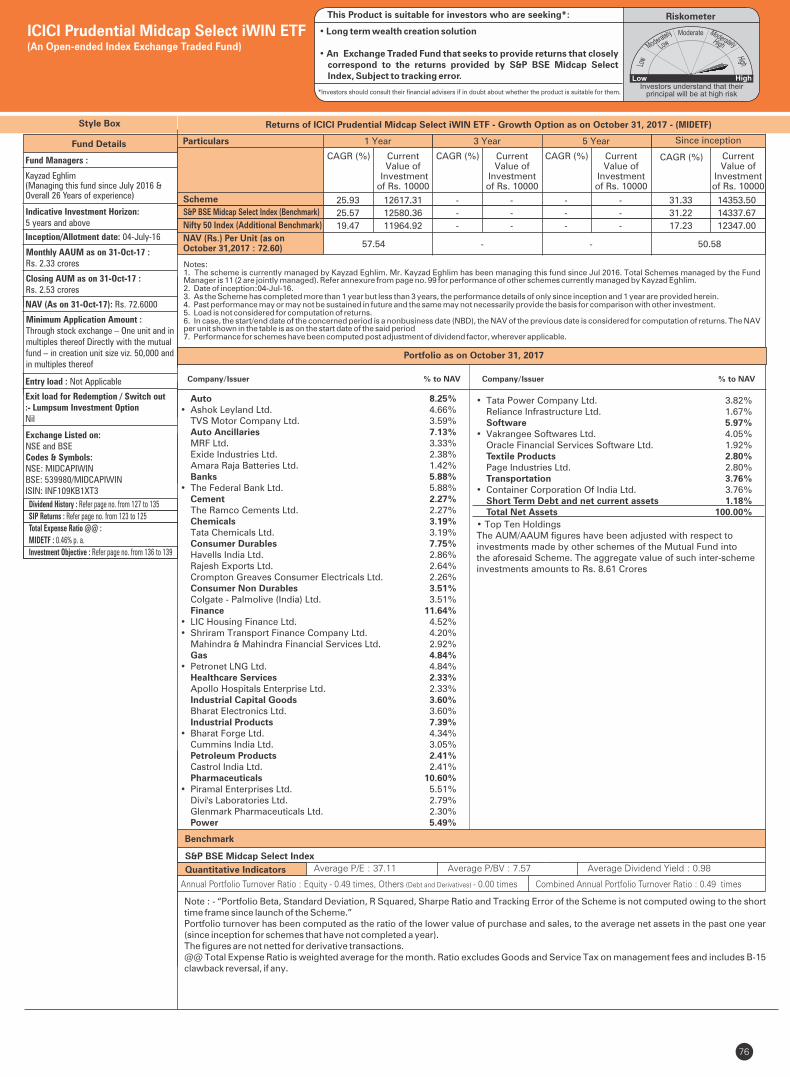
76
Style Box
RiskometerThis Product is suitable for investors who are seeking*:
• Long term wealth creation solution
• An Exchange Traded Fund that seeks to provide returns that closely correspond to the returns provided by S&P BSE Midcap Select Index, Subject to tracking error.
*Investors should consult their financial advisers if in doubt about whether the product is suitable for them.
Benchmark
S&P BSE Midcap Select Index
Note : - “Portfolio Beta, Standard Deviation, R Squared, Sharpe Ratio and Tracking Error of the Scheme is not computed owing to the short time frame since launch of the Scheme.”Portfolio turnover has been computed as the ratio of the lower value of purchase and sales, to the average net assets in the past one year (since inception for schemes that have not completed a year). The figures are not netted for derivative transactions.@@ Total Expense Ratio is weighted average for the month. Ratio excludes Goods and Service Tax on management fees and includes B-15 clawback reversal, if any.
Quantitative Indicators Average P/E : 37.11 Average P/BV : 7.57 Average Dividend Yield : 0.98
• Top Ten HoldingsThe AUM/AAUM figures have been adjusted with respect to investments made by other schemes of the Mutual Fund into the aforesaid Scheme. The aggregate value of such inter-scheme investments amounts to Rs. 8.61 Crores
Annual Portfolio Turnover Ratio : Equity - 0.49 times, Others (Debt and Derivatives) - 0.00 times Combined Annual Portfolio Turnover Ratio : 0.49 times
ICICI Prudential Midcap Select iWIN ETF(An Open-ended Index Exchange Traded Fund)
Auto 8.25%• Ashok Leyland Ltd. 4.66% TVS Motor Company Ltd. 3.59% Auto Ancillaries 7.13% MRF Ltd. 3.33% Exide Industries Ltd. 2.38% Amara Raja Batteries Ltd. 1.42% Banks 5.88%• The Federal Bank Ltd. 5.88% Cement 2.27% The Ramco Cements Ltd. 2.27% Chemicals 3.19% Tata Chemicals Ltd. 3.19% Consumer Durables 7.75% Havells India Ltd. 2.86% Rajesh Exports Ltd. 2.64% Crompton Greaves Consumer Electricals Ltd. 2.26% Consumer Non Durables 3.51% Colgate - Palmolive (India) Ltd. 3.51% Finance 11.64%• LIC Housing Finance Ltd. 4.52%• Shriram Transport Finance Company Ltd. 4.20% Mahindra & Mahindra Financial Services Ltd. 2.92% Gas 4.84%• Petronet LNG Ltd. 4.84% Healthcare Services 2.33% Apollo Hospitals Enterprise Ltd. 2.33% Industrial Capital Goods 3.60% Bharat Electronics Ltd. 3.60% Industrial Products 7.39%• Bharat Forge Ltd. 4.34% Cummins India Ltd. 3.05% Petroleum Products 2.41% Castrol India Ltd. 2.41% Pharmaceuticals 10.60%• Piramal Enterprises Ltd. 5.51% Divi's Laboratories Ltd. 2.79% Glenmark Pharmaceuticals Ltd. 2.30% Power 5.49%
Fund Details
Fund Managers :
Kayzad Eghlim (Managing this fund since July 2016 & Overall 26 Years of experience)
Indicative Investment Horizon: 5 years and above
Inception/Allotment date: 04-July-16
Monthly AAUM as on 31-Oct-17 : Rs. 2.33 crores
Closing AUM as on 31-Oct-17 : Rs. 2.53 crores
NAV (As on 31-Oct-17): Rs. 72.6000
Minimum Application Amount :Through stock exchange – One unit and in multiples thereof Directly with the mutual fund – in creation unit size viz. 50,000 andin multiples thereof
Exit load for Redemption / Switch out:- Lumpsum Investment OptionNil
Exchange Listed on:NSE and BSECodes & Symbols:NSE: MIDCAPIWINBSE: 539980/MIDCAPIWIN ISIN: INF109KB1XT3
Entry load : Not Applicable
Dividend History : Refer page no. from 127 to 135
SIP Returns : Refer page no. from 123 to 125
Total Expense Ratio @@ :
MIDETF : 0.46% p. a.
Investment Objective : Refer page no. from 136 to 139
Portfolio as on October 31, 2017
Company/Issuer % to NAV Company/Issuer % to NAV
• Tata Power Company Ltd. 3.82% Reliance Infrastructure Ltd. 1.67% Software 5.97%• Vakrangee Softwares Ltd. 4.05% Oracle Financial Services Software Ltd. 1.92% Textile Products 2.80% Page Industries Ltd. 2.80% Transportation 3.76%• Container Corporation Of India Ltd. 3.76% Short Term Debt and net current assets 1.18% Total Net Assets 100.00%
Returns of ICICI Prudential Midcap Select iWIN ETF - Growth Option as on October 31, 2017 - ( )MIDETF
Notes:1. The scheme is currently managed by Kayzad Eghlim. Mr. Kayzad Eghlim has been managing this fund since Jul 2016. Total Schemes managed by the Fund Manager Refer annexure from page no. 99 for performance of other schemes currently managed by Kayzad Eghlim. is 11 (2 are jointly managed).2. Date of inception:04-Jul-16.3. As the Scheme has completed more than 1 year but less than 3 years, the performance details of only since inception and 1 year are provided herein.4. Past performance may or may not be sustained in future and the same may not necessarily provide the basis for comparison with other investment.5. Load is not considered for computation of returns.6. In case, the start/end date of the concerned period is a nonbusiness date (NBD), the NAV of the previous date is considered for computation of returns. The NAV per unit shown in the table is as on the start date of the said period7. Performance for schemes have been computed post adjustment of dividend factor, wherever applicable.
Scheme
Nifty 50 Index (Additional Benchmark)
NAV (Rs.) Per Unit (as on October 31,2017 : 72.60)
CAGR (%)
50.58
S&P BSE Midcap Select Index (Benchmark)
Since inception
CurrentValue of
Investment of Rs. 10000
CAGR (%) Current Value of
Investment of Rs. 10000
1 Year 3 Year 5 Year
CAGR (%) Current Value of
Investment of Rs. 10000
CAGR (%) Current Value of
Investment of Rs. 10000
57.54 - -
Particulars
25.93 12617.31 - - - - 31.33 14353.50
25.57 12580.36 - - - - 31.22 14337.67
19.47 11964.92 - - - - 17.23 12347.00
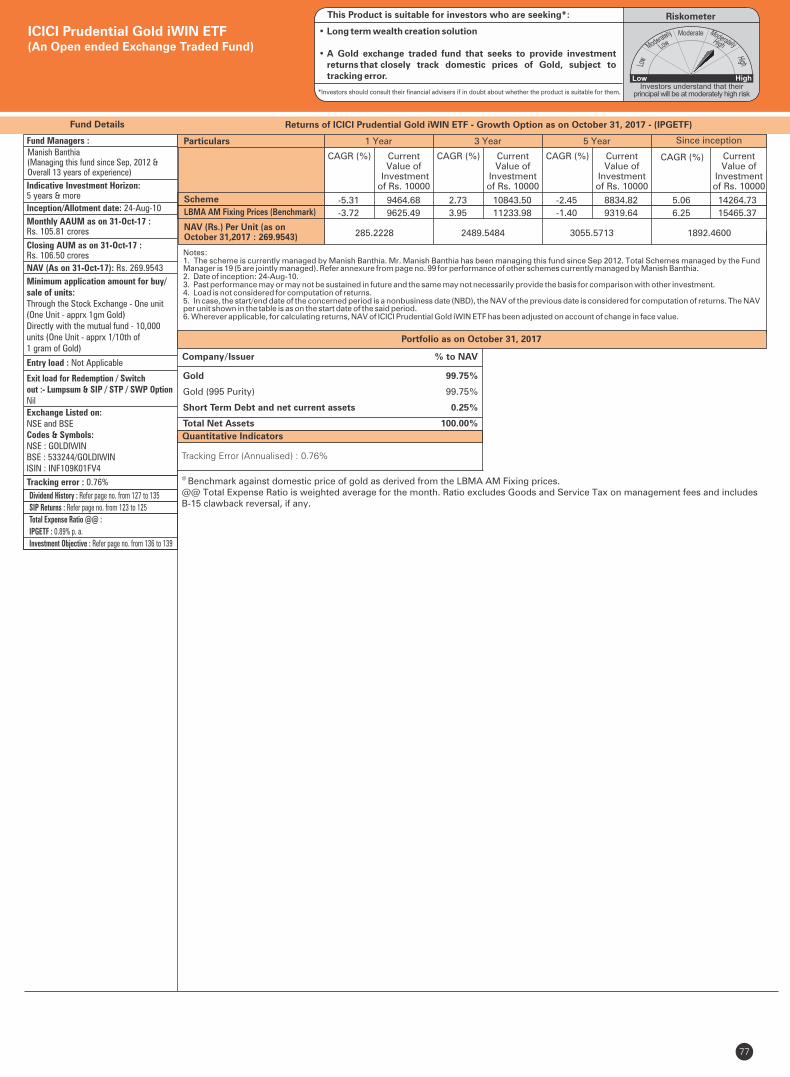
Fund Managers :
Fund Details
Portfolio as on October 31, 2017
Company/Issuer % to NAV
Quantitative Indicators
@ Benchmark against domestic price of gold as derived from the LBMA AM Fixing prices.
@@ Total Expense Ratio is weighted average for the month. Ratio excludes Goods and Service Tax on management fees and includes B-15 clawback reversal, if any.
Manish Banthia (Managing this fund since Sep, 2012 & Overall 13 years of experience)
Indicative Investment Horizon:5 years & more
Inception/Allotment date: 24-Aug-10
Monthly AAUM as on 31-Oct-17 : Rs. 105.81 crores
Closing AUM as on 31-Oct-17 : Rs. 106.50 crores
NAV (As on 31-Oct-17): Rs. 269.9543
Minimum application amount for buy/sale of units:Through the Stock Exchange - One unit(One Unit - apprx 1gm Gold)Directly with the mutual fund - 10,000units (One Unit - apprx 1/10th of 1 gram of Gold)
Exit load for Redemption / Switchout :- Lumpsum & SIP / STP / SWP OptionNil
Exchange Listed on:NSE and BSECodes & Symbols:NSE : GOLDIWINBSE : 533244/GOLDIWINISIN : INF109K01FV4
77
Returns of ICICI Prudential Gold iWIN ETF - Growth Option as on October 31, 2017 - (IPGETF)
Tracking Error (Annualised) : 0.76%
Tracking error : 0.76%
Gold 99.75%
Gold (995 Purity) 99.75%
Short Term Debt and net current assets 0.25%
Total Net Assets 100.00%
ICICI Prudential Gold iWIN ETF(An Open ended Exchange Traded Fund)
Entry load : Not Applicable
RiskometerThis Product is suitable for investors who are seeking*:
• Long term wealth creation solution
• A Gold exchange traded fund that seeks to provide investment returns that closely track domestic prices of Gold, subject to tracking error.
*Investors should consult their financial advisers if in doubt about whether the product is suitable for them.
Dividend History : Refer page no. from 127 to 135
SIP Returns : Refer page no. from 123 to 125
Total Expense Ratio @@ :
IPGETF : 0.89% p. a.
Investment Objective : Refer page no. from 136 to 139
Notes:1. The scheme is currently managed by Manish Banthia. Mr. has been managing this fund since . Total Schemes managed by the Fund Manish Banthia Sep 2012Manager . Refer annexure from page no. 99 for performance of other schemes currently managed by . is 19 (5 are jointly managed) Manish Banthia2. Date of inception: 24-Aug-10.3. Past performance may or may not be sustained in future and the same may not necessarily provide the basis for comparison with other investment.4. Load is not considered for computation of returns.5. In case, the start/end date of the concerned period is a nonbusiness date (NBD), the NAV of the previous date is considered for computation of returns. The NAV per unit shown in the table is as on the start date of the said period.6. Wherever applicable, for calculating returns, NAV of ICICI Prudential Gold iWIN ETF has been adjusted on account of change in face value.
Scheme
NAV (Rs.) Per Unit (as on October 31,2017 : 269.9543)
CAGR (%)
1892.4600
LBMA AM Fixing Prices (Benchmark)
Since inception
CurrentValue of
Investment of Rs. 10000
CAGR (%) Current Value of
Investment of Rs. 10000
1 Year 3 Year 5 Year
CAGR (%) Current Value of
Investment of Rs. 10000
CAGR (%) Current Value of
Investment of Rs. 10000
285.2228 2489.5484 3055.5713
Particulars
-5.31 9464.68 2.73 10843.50 -2.45 8834.82 5.06 14264.73
-3.72 9625.49 3.95 11233.98 -1.40 9319.64 6.25 15465.37
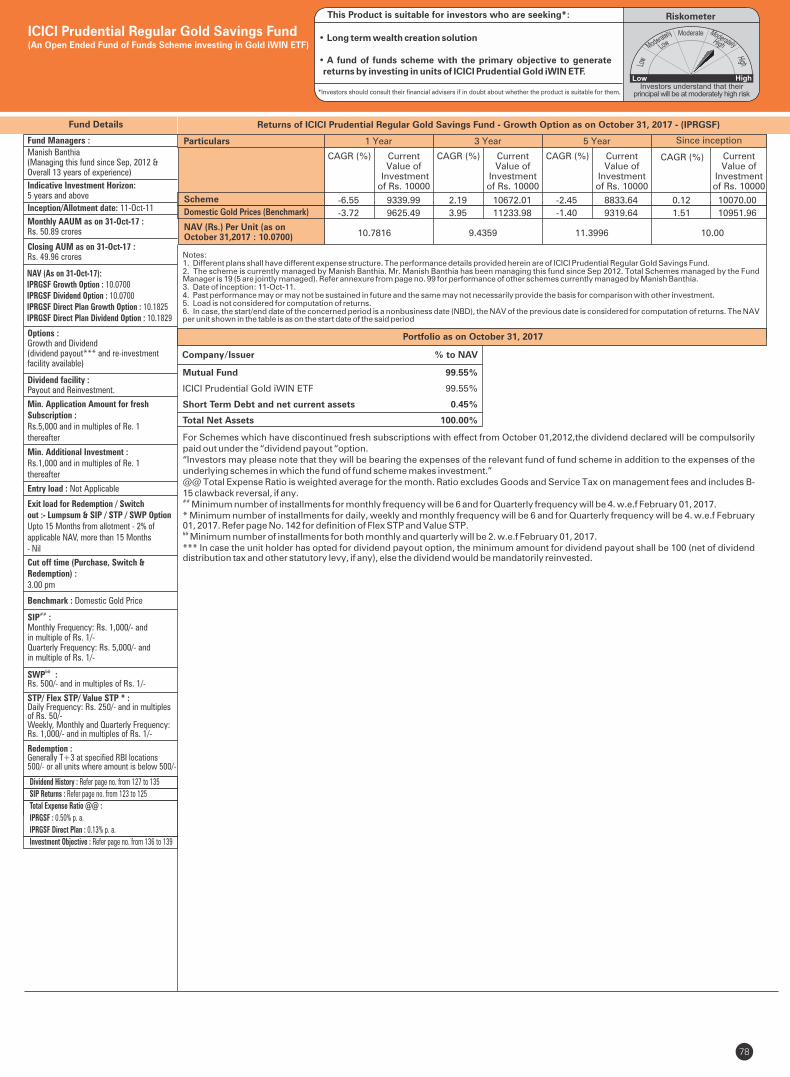
Fund Details
Portfolio as on October 31, 2017
For Schemes which have discontinued fresh subscriptions with effect from October 01,2012,the dividend declared will be compulsorily paid out under the “dividend payout “option.“Investors may please note that they will be bearing the expenses of the relevant fund of fund scheme in addition to the expenses of the underlying schemes in which the fund of fund scheme makes investment.”@@ Total Expense Ratio is weighted average for the month. Ratio excludes Goods and Service Tax on management fees and includes B-15 clawback reversal, if any.## Minimum number of installments for monthly frequency will be 6 and for Quarterly frequency will be 4. w.e.f February 01, 2017.* Minimum number of installments for daily, weekly and monthly frequency will be 6 and for Quarterly frequency will be 4. w.e.f February 01, 2017. Refer page No. 142 for definition of Flex STP and Value STP.&& Minimum number of installments for both monthly and quarterly will be 2. w.e.f February 01, 2017.*** In case the unit holder has opted for dividend payout option, the minimum amount for dividend payout shall be 100 (net of dividend distribution tax and other statutory levy, if any), else the dividend would be mandatorily reinvested.
Fund Managers :
Manish Banthia (Managing this fund since Sep, 2012 & Overall 13 years of experience)
Indicative Investment Horizon:5 years and above
Inception/Allotment date: 11-Oct-11
Monthly AAUM as on 31-Oct-17 : Rs. 50.89 crores
Closing AUM as on 31-Oct-17 : Rs. 49.96 crores
Options :Growth and Dividend(dividend payout*** and re-investment facility available)
Dividend facility :Payout and Reinvestment.
Min. Application Amount for freshSubscription :Rs.5,000 and in multiples of Re. 1thereafter
Min. Additional Investment :Rs.1,000 and in multiples of Re. 1thereafter
Exit load for Redemption / Switchout :- Lumpsum & SIP / STP / SWP OptionUpto 15 Months from allotment - 2% ofapplicable NAV, more than 15 Months- Nil
Cut off time (Purchase, Switch &Redemption) :3.00 pm
Benchmark : Domestic Gold Price
SIP :##
Monthly Frequency: Rs. 1,000/- and in multiple of Rs. 1/-Quarterly Frequency: Rs. 5,000/- and in multiple of Rs. 1/-
&&SWP :Rs. 500/- and in multiples of Rs. 1/-
STP/ Flex STP/ Value STP * :Daily Frequency: Rs. 250/- and in multiples of Rs. 50/-Weekly, Monthly and Quarterly Frequency: Rs. 1,000/- and in multiples of Rs. 1/-
Redemption :Generally T+3 at specified RBI locations500/- or all units where amount is below 500/-
78
Returns of ICICI Prudential Regular Gold Savings Fund - Growth Option as on October 31, 2017 - (IPRGSF)
NAV (As on 31-Oct-17):IPRGSF Growth Option : 10.0700IPRGSF Dividend Option : 10.0700IPRGSF Direct Plan Growth Option : 10.1825IPRGSF Direct Plan Dividend Option : 10.1829
ICICI Prudential Regular Gold Savings Fund(An Open Ended Fund of Funds Scheme investing in Gold iWIN ETF)
Company/Issuer % to NAV
Mutual Fund 99.55%
ICICI Prudential Gold iWIN ETF 99.55%
Short Term Debt and net current assets 0.45%
Total Net Assets 100.00%
Entry load : Not Applicable
RiskometerThis Product is suitable for investors who are seeking*:
• Long term wealth creation solution • A fund of funds scheme with the primary objective to generate returns by investing in units of ICICI Prudential Gold iWIN ETF.
*Investors should consult their financial advisers if in doubt about whether the product is suitable for them.
Dividend History : Refer page no. from 127 to 135
SIP Returns : Refer page no. from 123 to 125
Total Expense Ratio @@ :
IPRGSF : 0.50% p. a.
IPRGSF Direct Plan : 0.13% p. a.
Investment Objective : Refer page no. from 136 to 139
Notes:1. Different plans shall have different expense structure. The performance details provided herein are of ICICI Prudential Regular Gold Savings Fund.2. The scheme is currently managed by Manish Banthia. Mr. has been managing this fund since . Total Schemes managed by the Fund Manish Banthia Sep 2012Manager . Refer annexure from page no. 99 for performance of other schemes currently managed by . is 19 (5 are jointly managed) Manish Banthia3. Date of inception: 11-Oct-11.4. Past performance may or may not be sustained in future and the same may not necessarily provide the basis for comparison with other investment.5. Load is not considered for computation of returns.6. In case, the start/end date of the concerned period is a nonbusiness date (NBD), the NAV of the previous date is considered for computation of returns. The NAV per unit shown in the table is as on the start date of the said period
Scheme
NAV (Rs.) Per Unit (as onOctober 31,2017 : 10.0700)
CAGR (%)
10.00
Domestic Gold Prices (Benchmark)
Since inception
CurrentValue of
Investment of Rs. 10000
CAGR (%) Current Value of
Investment of Rs. 10000
1 Year 3 Year 5 Year
CAGR (%) Current Value of
Investment of Rs. 10000
CAGR (%) Current Value of
Investment of Rs. 10000
10.7816 9.4359 11.3996
Particulars
-6.55 9339.99 2.19 10672.01 -2.45 8833.64 0.12 10070.00
-3.72 9625.49 3.95 11233.98 -1.40 9319.64 1.51 10951.96
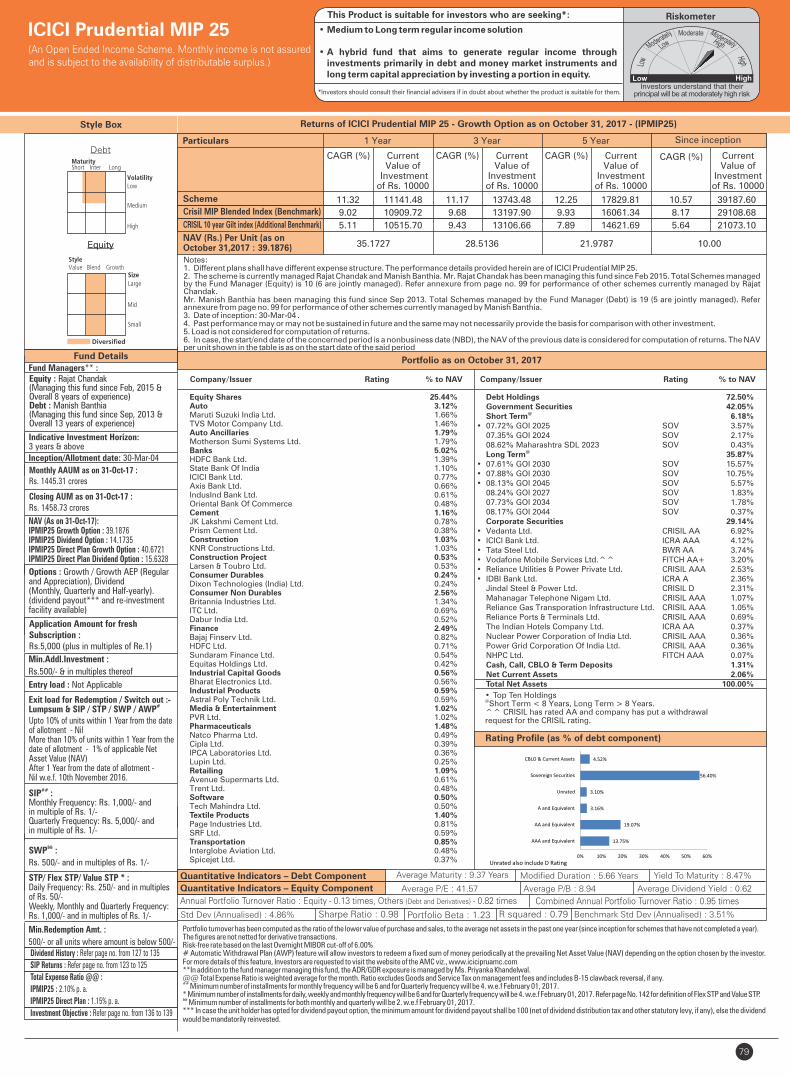
Debt Holdings 72.50% Government Securities 42.05%
@ Short Term 6.18%• 07.72% GOI 2025 SOV 3.57% 07.35% GOI 2024 SOV 2.17% 08.62% Maharashtra SDL 2023 SOV 0.43%
@ Long Term 35.87%• 07.61% GOI 2030 SOV 15.57%• 07.88% GOI 2030 SOV 10.75%• 08.13% GOI 2045 SOV 5.57% 08.24% GOI 2027 SOV 1.83% 07.73% GOI 2034 SOV 1.78% 08.17% GOI 2044 SOV 0.37% Corporate Securities 29.14%• Vedanta Ltd. CRISIL AA 6.92%• ICICI Bank Ltd. ICRA AAA 4.12%• Tata Steel Ltd. BWR AA 3.74%• Vodafone Mobile Services Ltd.^^ FITCH AA+ 3.20%• Reliance Utilities & Power Private Ltd. CRISIL AAA 2.53%• IDBI Bank Ltd. ICRA A 2.36% Jindal Steel & Power Ltd. CRISIL D 2.31% Mahanagar Telephone Nigam Ltd. CRISIL AAA 1.07% Reliance Gas Transporation Infrastructure Ltd. CRISIL AAA 1.05% Reliance Ports & Terminals Ltd. CRISIL AAA 0.69% The Indian Hotels Company Ltd. ICRA AA 0.37% Nuclear Power Corporation of India Ltd. CRISIL AAA 0.36% Power Grid Corporation Of India Ltd. CRISIL AAA 0.36% NHPC Ltd. FITCH AAA 0.07% Cash, Call, CBLO & Term Deposits 1.31% Net Current Assets 2.06% Total Net Assets 100.00%
79
• Top Ten Holdings@Short Term < 8 Years, Long Term > 8 Years.
^^ CRISIL has rated AA and company has put a withdrawal request for the CRISIL rating.
Style Box
Fund Details
Quantitative Indicators – Debt Component
Quantitative Indicators – Equity Component
Average Maturity : 9.37 Years Modified Duration : 5.66 Years Yield To Maturity : 8.47%
Average P/E : 41.57 Average P/B : 8.94 Average Dividend Yield : 0.62
Portfolio turnover has been computed as the ratio of the lower value of purchase and sales, to the average net assets in the past one year (since inception for schemes that have not completed a year). The figures are not netted for derivative transactions.Risk-free rate based on the last Overnight MIBOR cut-off of 6.00%# Automatic Withdrawal Plan (AWP) feature will allow investors to redeem a fixed sum of money periodically at the prevailing Net Asset Value (NAV) depending on the option chosen by the investor. For more details of this feature, Investors are requested to visit the website of the AMC viz., www.icicipruamc.com**In addition to the fund manager managing this fund, the ADR/GDR exposure is managed by Ms. Priyanka Khandelwal.@@ Total Expense Ratio is weighted average for the month. Ratio excludes Goods and Service Tax on management fees and includes B-15 clawback reversal, if any.## Minimum number of installments for monthly frequency will be 6 and for Quarterly frequency will be 4. w.e.f February 01, 2017.* Minimum number of installments for daily, weekly and monthly frequency will be 6 and for Quarterly frequency will be 4. w.e.f February 01, 2017. Refer page No. 142 for definition of Flex STP and Value STP.&& Minimum number of installments for both monthly and quarterly will be 2. w.e.f February 01, 2017.*** In case the unit holder has opted for dividend payout option, the minimum amount for dividend payout shall be 100 (net of dividend distribution tax and other statutory levy, if any), else the dividend would be mandatorily reinvested.
Equity
Exit load for Redemption / Switch out :-#Lumpsum & SIP / STP / SWP / AWP
Fund Managers** :
Indicative Investment Horizon: 3 years & above
Inception/Allotment date: 30-Mar-04
NAV (As on 31-Oct-17):IPMIP25 Growth Option : 39.1876IPMIP25 Dividend Option : 14.1735IPMIP25 Direct Plan Growth Option : 40.6721IPMIP25 Direct Plan Dividend Option : 15.6328
&&SWP :
Rs. 500/- and in multiples of Rs. 1/-
STP/ Flex STP/ Value STP * :Daily Frequency: Rs. 250/- and in multiples of Rs. 50/-Weekly, Monthly and Quarterly Frequency: Rs. 1,000/- and in multiples of Rs. 1/-
Equity : Rajat Chandak(Managing this fund since Feb, 2015 &Overall 8 years of experience)Debt : Manish Banthia (Managing this fund since Sep, 2013 & Overall 13 years of experience)
Application Amount for freshSubscription :Rs.5,000 (plus in multiples of Re.1)
Options : Growth / Growth AEP (Regularand Appreciation), Dividend (Monthly, Quarterly and Half-yearly).(dividend payout*** and re-investmentfacility available)
Min.Addl.Investment :
Rs.500/- & in multiples thereof
Upto 10% of units within 1 Year from the date of allotment - Nil More than 10% of units within 1 Year from the date of allotment - 1% of applicable Net Asset Value (NAV) After 1 Year from the date of allotment - Nil w.e.f. 10th November 2016.
##SIP :Monthly Frequency: Rs. 1,000/- and in multiple of Rs. 1/-Quarterly Frequency: Rs. 5,000/- and in multiple of Rs. 1/-
Min.Redemption Amt. :
500/- or all units where amount is below 500/-
Monthly AAUM as on 31-Oct-17 : Rs. 1445.31 crores
Closing AUM as on 31-Oct-17 : Rs. 1458.73 crores
Portfolio as on October 31, 2017
Returns of ICICI Prudential MIP 25 - Growth Option as on October 31, 2017 - (IPMIP25)
Equity
Equity Shares 25.44% Auto 3.12% Maruti Suzuki India Ltd. 1.66% TVS Motor Company Ltd. 1.46% Auto Ancillaries 1.79% Motherson Sumi Systems Ltd. 1.79% Banks 5.02% HDFC Bank Ltd. 1.39% State Bank Of India 1.10% ICICI Bank Ltd. 0.77% Axis Bank Ltd. 0.66% IndusInd Bank Ltd. 0.61% Oriental Bank Of Commerce 0.48% Cement 1.16% JK Lakshmi Cement Ltd. 0.78% Prism Cement Ltd. 0.38% Construction 1.03% KNR Constructions Ltd. 1.03% Construction Project 0.53% Larsen & Toubro Ltd. 0.53% Consumer Durables 0.24% Dixon Technologies (India) Ltd. 0.24% Consumer Non Durables 2.56% Britannia Industries Ltd. 1.34% ITC Ltd. 0.69% Dabur India Ltd. 0.52% Finance 2.49% Bajaj Finserv Ltd. 0.82% HDFC Ltd. 0.71% Sundaram Finance Ltd. 0.54% Equitas Holdings Ltd. 0.42% Industrial Capital Goods 0.56% Bharat Electronics Ltd. 0.56% Industrial Products 0.59% Astral Poly Technik Ltd. 0.59% Media & Entertainment 1.02% PVR Ltd. 1.02% Pharmaceuticals 1.48% Natco Pharma Ltd. 0.49% Cipla Ltd. 0.39% IPCA Laboratories Ltd. 0.36% Lupin Ltd. 0.25% Retailing 1.09% Avenue Supermarts Ltd. 0.61% Trent Ltd. 0.48% Software 0.50% Tech Mahindra Ltd. 0.50% Textile Products 1.40% Page Industries Ltd. 0.81% SRF Ltd. 0.59% Transportation 0.85% Interglobe Aviation Ltd. 0.48% Spicejet Ltd. 0.37%
Company/Issuer Rating % to NAV
Debt
Company/Issuer Rating % to NAV
ICICI Prudential MIP 25(An Open Ended Income Scheme. Monthly income is not assured and is subject to the availability of distributable surplus.)
Entry load : Not Applicable
Std Dev (Annualised) : 4.86% Sharpe Ratio : 0.98 Portfolio Beta : 1.23 R squared : 0.79 Benchmark Std Dev (Annualised) : 3.51%
RiskometerThis Product is suitable for investors who are seeking*:
• Medium to Long term regular income solution
• A hybrid fund that aims to generate regular income through investments primarily in debt and money market instruments and long term capital appreciation by investing a portion in equity.
*Investors should consult their financial advisers if in doubt about whether the product is suitable for them.
Annual Portfolio Turnover Ratio : Equity - 0.13 times, Others (Debt and Derivatives) - 0.82 times Combined Annual Portfolio Turnover Ratio : 0.95 times
Unrated also include D Rating
Rating Profile (as % of debt component)
Dividend History : Refer page no. from 127 to 135
SIP Returns : Refer page no. from 123 to 125
Total Expense Ratio @@ :
IPMIP25 : 2.10% p. a.
IPMIP25 Direct Plan : 1.15% p. a.
Investment Objective : Refer page no. from 136 to 139
Notes:1. Different plans shall have different expense structure. The performance details provided herein are of ICICI Prudential MIP 25.2. The scheme is currently managed and Manish Banthia. Mr. has been managing this fund since Feb 2015. Total Schemes managed Rajat Chandak Rajat Chandakby the Fund Manager . Refer annexure from page no. 99 for performance of other schemes currently managed by(Equity) is 10 (6 are jointly managed) Rajat Chandak.Mr. Manish Banthia has been managing this fund since Sep 2013. Total Schemes managed by the Fund Manager . Refer (Debt) is 19 (5 are jointly managed)annexure from page no. 99 for performance of other schemes currently managed by Manish Banthia. 3. Date of inception: 30-Mar-04 .4. Past performance may or may not be sustained in future and the same may not necessarily provide the basis for comparison with other investment.5. Load is not considered for computation of returns.6. In case, the start/end date of the concerned period is a nonbusiness date (NBD), the NAV of the previous date is considered for computation of returns. The NAV per unit shown in the table is as on the start date of the said period
Scheme
CRISIL 10 year Gilt index (Additional Benchmark)
NAV (Rs.) Per Unit (as onOctober 31,2017 : 39.1876)
CAGR (%)
10.00
Crisil MIP Blended Index (Benchmark)
Since inception
CurrentValue of
Investment of Rs. 10000
CAGR (%) Current Value of
Investment of Rs. 10000
1 Year 3 Year 5 Year
CAGR (%) Current Value of
Investment of Rs. 10000
CAGR (%) Current Value of
Investment of Rs. 10000
35.1727 28.5136 21.9787
Particulars
11.32 11141.48 11.17 13743.48 12.25 17829.81 10.57 39187.60
9.02 10909.72 9.68 13197.90 9.93 16061.34 8.17 29108.68
5.11 10515.70 9.43 13106.66 7.89 14621.69 5.64 21073.10
13.75%
19.07%
3.16%
3.10%
56.40%
4.52%
0% 10% 20% 30% 40% 50% 60%
AAA and Equivalent
AA and Equivalent
A and Equivalent
Unrated
Sovereign Securities
CBLO & Current Assets
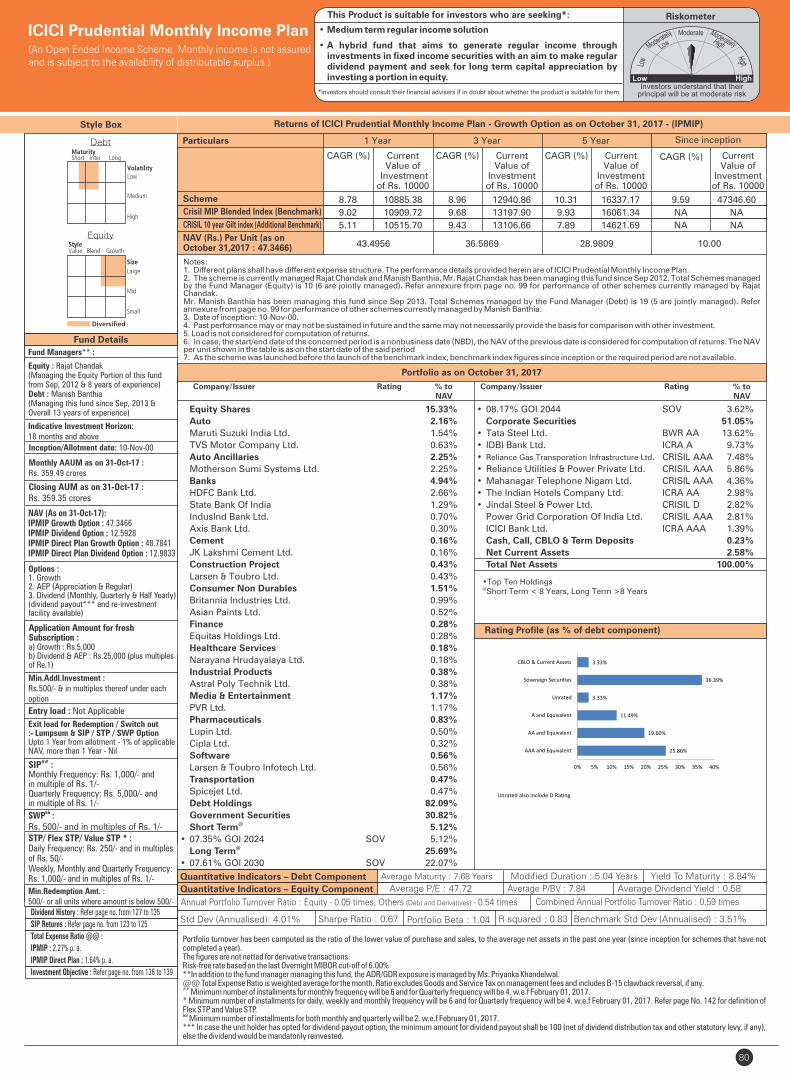
Equity Shares 15.33%
Auto 2.16%
Maruti Suzuki India Ltd. 1.54%
TVS Motor Company Ltd. 0.63%
Auto Ancillaries 2.25%
Motherson Sumi Systems Ltd. 2.25%
Banks 4.94%
HDFC Bank Ltd. 2.66%
State Bank Of India 1.29%
IndusInd Bank Ltd. 0.70%
Axis Bank Ltd. 0.30%
Cement 0.16%
JK Lakshmi Cement Ltd. 0.16%
Construction Project 0.43%
Larsen & Toubro Ltd. 0.43%
Consumer Non Durables 1.51%
Britannia Industries Ltd. 0.99%
Asian Paints Ltd. 0.52%
Finance 0.28%
Equitas Holdings Ltd. 0.28%
Healthcare Services 0.18%
Narayana Hrudayalaya Ltd. 0.18%
Industrial Products 0.38%
Astral Poly Technik Ltd. 0.38%
Media & Entertainment 1.17%
PVR Ltd. 1.17%
Pharmaceuticals 0.83%
Lupin Ltd. 0.50%
Cipla Ltd. 0.32%
Software 0.56%
Larsen & Toubro Infotech Ltd. 0.56%
Transportation 0.47%
Spicejet Ltd. 0.47%
Debt Holdings 82.09%
Government Securities 30.82%@ Short Term 5.12%
• 07.35% GOI 2024 SOV 5.12%@ Long Term 25.69%
• 07.61% GOI 2030 SOV 22.07%
80
Fund Details
Quantitative Indicators – Equity Component
Equity
Debt
Style Box
Fund Managers** :
Indicative Investment Horizon:18 months and above
Inception/Allotment date: 10-Nov-00
Monthly AAUM as on 31-Oct-17 :Rs. 359.49 crores
Closing AUM as on 31-Oct-17 : Rs. 359.35 crores
Options :1. Growth2. AEP (Appreciation & Regular)3. Dividend (Monthly, Quarterly & Half Yearly)(dividend payout*** and re-investment facility available)
Application Amount for freshSubscription :a) Growth : Rs.5,000b) Dividend & AEP : Rs.25,000 (plus multiplesof Re.1)
Min.Addl.Investment :Rs.500/- & in multiples thereof under eachoption
Exit load for Redemption / Switch out:- Lumpsum & SIP / STP / SWP OptionUpto 1 Year from allotment - 1% of applicableNAV, more than 1 Year - Nil
##SIP :Monthly Frequency: Rs. 1,000/- and in multiple of Rs. 1/-Quarterly Frequency: Rs. 5,000/- and in multiple of Rs. 1/-
&&SWP :Rs. 500/- and in multiples of Rs. 1/-STP/ Flex STP/ Value STP * :Daily Frequency: Rs. 250/- and in multiples of Rs. 50/-Weekly, Monthly and Quarterly Frequency: Rs. 1,000/- and in multiples of Rs. 1/-
Min.Redemption Amt. :500/- or all units where amount is below 500/-
Portfolio turnover has been computed as the ratio of the lower value of purchase and sales, to the average net assets in the past one year (since inception for schemes that have not completed a year). The figures are not netted for derivative transactions.Risk-free rate based on the last Overnight MIBOR cut-off of 6.00%**In addition to the fund manager managing this fund, the ADR/GDR exposure is managed by Ms. Priyanka Khandelwal.@@ Total Expense Ratio is weighted average for the month. Ratio excludes Goods and Service Tax on management fees and includes B-15 clawback reversal, if any.## Minimum number of installments for monthly frequency will be 6 and for Quarterly frequency will be 4. w.e.f February 01, 2017.* Minimum number of installments for daily, weekly and monthly frequency will be 6 and for Quarterly frequency will be 4. w.e.f February 01, 2017. Refer page No. 142 for definition of Flex STP and Value STP.&& Minimum number of installments for both monthly and quarterly will be 2. w.e.f February 01, 2017.*** In case the unit holder has opted for dividend payout option, the minimum amount for dividend payout shall be 100 (net of dividend distribution tax and other statutory levy, if any), else the dividend would be mandatorily reinvested.
Average Maturity : 7.68 Years Modified Duration : 5.04 Years Yield To Maturity : 8.84%
Average P/E : 47.72 Average P/BV : 7.84 Average Dividend Yield : 0.58
• Top Ten Holdings@Short Term < 8 Years, Long Term >8 Years
Portfolio as on October 31, 2017
Returns of ICICI Prudential Monthly Income Plan - Growth Option as on October 31, 2017 - (IPMIP)
Company/Issuer Rating % to NAV
Company/Issuer Rating % to NAV
ICICI Prudential Monthly Income Plan(An Open Ended Income Scheme. Monthly income is not assuredand is subject to the availability of distributable surplus.)
• 08.17% GOI 2044 SOV 3.62%
Corporate Securities 51.05%
• Tata Steel Ltd. BWR AA 13.62%
• IDBI Bank Ltd. ICRA A 9.73%
• Reliance Gas Transporation Infrastructure Ltd. CRISIL AAA 7.48%
• Reliance Utilities & Power Private Ltd. CRISIL AAA 5.86%
• Mahanagar Telephone Nigam Ltd. CRISIL AAA 4.36%
• The Indian Hotels Company Ltd. ICRA AA 2.98%
• Jindal Steel & Power Ltd. CRISIL D 2.82%
Power Grid Corporation Of India Ltd. CRISIL AAA 2.81%
ICICI Bank Ltd. ICRA AAA 1.39%
Cash, Call, CBLO & Term Deposits 0.23%
Net Current Assets 2.58%
Total Net Assets 100.00%
Entry load : Not Applicable
Std Dev (Annualised): 4.01% Sharpe Ratio : 0.67 Portfolio Beta : 1.04 R squared : 0.83 Benchmark Std Dev (Annualised) : 3.51%
RiskometerThis Product is suitable for investors who are seeking*:
• Medium term regular income solution
• A hybrid fund that aims to generate regular income through investments in fixed income securities with an aim to make regular dividend payment and seek for long term capital appreciation by investing a portion in equity.
*Investors should consult their financial advisers if in doubt about whether the product is suitable for them.
Annual Portfolio Turnover Ratio : Equity - 0.05 times, Others (Debt and Derivatives) - 0.54 times Combined Annual Portfolio Turnover Ratio : 0.59 times
Quantitative Indicators – Debt Component
Unrated also include D Rating
Rating Profile (as % of debt component)
Dividend History : Refer page no. from 127 to 135
SIP Returns : Refer page no. from 123 to 125
Total Expense Ratio @@ :
IPMIP : 2.27% p. a.
IPMIP Direct Plan : 1.64% p. a.
Investment Objective : Refer page no. from 136 to 139
Equity : Rajat Chandak(Managing the Equity Portion of this fundfrom Sep, 2012 & 8 years of experience)Debt : Manish Banthia(Managing this fund since Sep, 2013 &Overall 13 years of experience)
Notes:1. Different plans shall have different expense structure. The performance details provided herein are of ICICI Prudential Monthly Income Plan.2. The scheme is currently managed and Manish Banthia. Mr. has been managing this fund since . Total Schemes managed Rajat Chandak Rajat Chandak Sep 2012by the Fund Manager . Refer annexure from page no. 99 for performance of other schemes currently managed by(Equity) is 10 (6 are jointly managed) Rajat Chandak.Mr. Manish Banthia has been managing this fund since Sep 2013. Total Schemes managed by the Fund Manager . Refer (Debt) is 19 (5 are jointly managed)annexure from page no. 99 for performance of other schemes currently managed by Manish Banthia. 3. Date of inception: 10-Nov-00.4. Past performance may or may not be sustained in future and the same may not necessarily provide the basis for comparison with other investment.5. Load is not considered for computation of returns.6. In case, the start/end date of the concerned period is a nonbusiness date (NBD), the NAV of the previous date is considered for computation of returns. The NAV per unit shown in the table is as on the start date of the said period7. As the scheme was launched before the launch of the benchmark index, benchmark index figures since inception or the required period are not available.
Scheme
CRISIL 10 year Gilt index (Additional Benchmark)
NAV (Rs.) Per Unit (as onOctober 31,2017 : 47.3466)
CAGR (%)
10.00
Crisil MIP Blended Index (Benchmark)
Since inception
CurrentValue of
Investment of Rs. 10000
CAGR (%) Current Value of
Investment of Rs. 10000
1 Year 3 Year 5 Year
CAGR (%) Current Value of
Investment of Rs. 10000
CAGR (%) Current Value of
Investment of Rs. 10000
43.4956 36.5869 28.9809
Particulars
8.78 10885.38 8.96 12940.86 10.31 16337.17 9.59 47346.60
9.02 10909.72 9.68 13197.90 9.93 16061.34 NA NA
5.11 10515.70 9.43 13106.66 7.89 14621.69 NA NA
NAV (As on 31-Oct-17):IPMIP Growth Option : 47.3466IPMIP Dividend Option : 12.5928IPMIP Direct Plan Growth Option : 48.7841IPMIP Direct Plan Dividend Option : 12.9833
25.86%
19.60%
11.49%
3.33%
36.39%
3.33%
0% 5% 10% 15% 20% 25% 30% 35% 40%
AAA and Equivalent
AA and Equivalent
A and Equivalent
Unrated
Sovereign Securities
CBLO & Current Assets
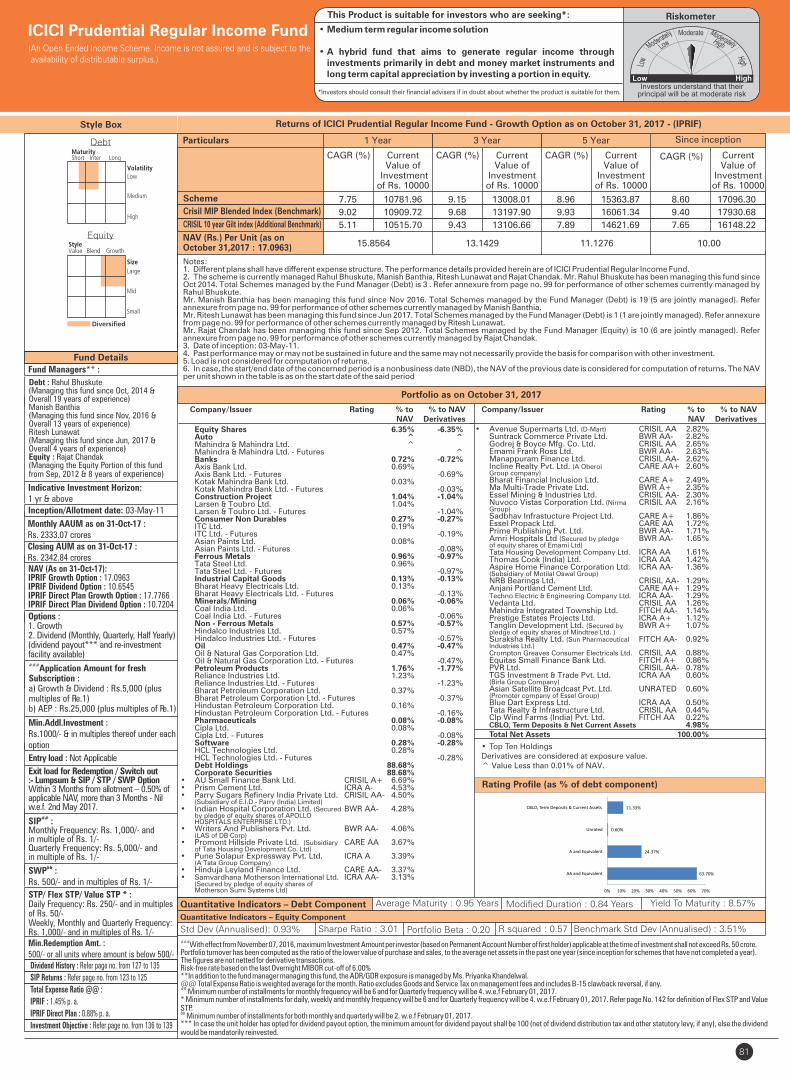
81
Fund Details
Quantitative Indicators – Debt Component Average Maturity : 0.95 Years
Equity
Debt
Style Box
Fund Managers** :
Debt : Rahul Bhuskute(Managing this fund since Oct, 2014 &Overall 19 years of experience)Manish Banthia(Managing this fund since Nov, 2016 & Overall 13 years of experience)Ritesh Lunawat(Managing this fund since Jun, 2017 & Overall 4 years of experience)Equity : Rajat Chandak (Managing the Equity Portion of this fund from Sep, 2012 & 8 years of experience)
Indicative Investment Horizon:1 yr & aboveInception/Allotment date: 03-May-11
Monthly AAUM as on 31-Oct-17 : Rs. 2333.07 croresClosing AUM as on 31-Oct-17 : Rs. 2342.84 croresNAV (As on 31-Oct-17):IPRIF Growth Option : 17.0963IPRIF Dividend Option : 10.6545IPRIF Direct Plan Growth Option : 17.7766IPRIF Direct Plan Dividend Option : 10.7204
Options :1. Growth2. Dividend (Monthly, Quarterly, Half Yearly)(dividend payout*** and re-investment facility available)###Application Amount for freshSubscription :a) Growth & Dividend : Rs.5,000 (plusmultiples of Re.1)b) AEP : Rs.25,000 (plus multiples of Re.1)
Min.Addl.Investment :Rs.1000/- & in multiples thereof under eachoption
Exit load for Redemption / Switch out:- Lumpsum & SIP / STP / SWP OptionWithin 3 Months from allotment – 0.50% of applicable NAV, more than 3 Months - Nilw.e.f. 2nd May 2017.
##SIP :Monthly Frequency: Rs. 1,000/- and in multiple of Rs. 1/-Quarterly Frequency: Rs. 5,000/- and in multiple of Rs. 1/-
&&SWP :Rs. 500/- and in multiples of Rs. 1/-
STP/ Flex STP/ Value STP * :Daily Frequency: Rs. 250/- and in multiples of Rs. 50/-Weekly, Monthly and Quarterly Frequency: Rs. 1,000/- and in multiples of Rs. 1/-Min.Redemption Amt. :500/- or all units where amount is below 500/-
Modified Duration : 0.84 Years Yield To Maturity : 8.57%
###With effect from November 07, 2016, maximum Investment Amount per investor (based on Permanent Account Number of first holder) applicable at the time of investment shall not exceed Rs. 50 crore.
Portfolio turnover has been computed as the ratio of the lower value of purchase and sales, to the average net assets in the past one year (since inception for schemes that have not completed a year). The figures are not netted for derivative transactions.Risk-free rate based on the last Overnight MIBOR cut-off of 6.00%**In addition to the fund manager managing this fund, the ADR/GDR exposure is managed by Ms. Priyanka Khandelwal.@@ Total Expense Ratio is weighted average for the month. Ratio excludes Goods and Service Tax on management fees and includes B-15 clawback reversal, if any.##
Minimum number of installments for monthly frequency will be 6 and for Quarterly frequency will be 4. w.e.f February 01, 2017.* Minimum number of installments for daily, weekly and monthly frequency will be 6 and for Quarterly frequency will be 4. w.e.f February 01, 2017. Refer page No. 142 for definition of Flex STP and Value STP.&&
Minimum number of installments for both monthly and quarterly will be 2. w.e.f February 01, 2017.*** In case the unit holder has opted for dividend payout option, the minimum amount for dividend payout shall be 100 (net of dividend distribution tax and other statutory levy, if any), else the dividend would be mandatorily reinvested.
Portfolio as on October 31, 2017
Returns of ICICI Prudential Regular Income Fund - Growth Option as on October 31, 2017 - (IPRIF)
ICICI Prudential Regular Income Fund(An Open Ended Income Scheme. Income is not assured and is subject to the availability of distributable surplus.)
• Top Ten HoldingsDerivatives are considered at exposure value.^ Value Less than 0.01% of NAV.
Company/Issuer Rating % to % to NAV NAV Derivatives
Entry load : Not Applicable
Std Dev (Annualised): 0.93% Sharpe Ratio : 3.01 Portfolio Beta : 0.20 R squared : 0.57 Benchmark Std Dev (Annualised) : 3.51%
RiskometerThis Product is suitable for investors who are seeking*:
• Medium term regular income solution
• A hybrid fund that aims to generate regular income through investments primarily in debt and money market instruments and long term capital appreciation by investing a portion in equity.
*Investors should consult their financial advisers if in doubt about whether the product is suitable for them.
Quantitative Indicators – Equity Component
Rating Profile (as % of debt component)
Company/Issuer Rating % to % to NAV NAV Derivatives
Dividend History : Refer page no. from 127 to 135
SIP Returns : Refer page no. from 123 to 125
Total Expense Ratio @@ :
IPRIF : 1.45% p. a.
IPRIF Direct Plan : 0.88% p. a.
Investment Objective : Refer page no. from 136 to 139
Notes:1. Different plans shall have different expense structure. The performance details provided herein are of ICICI Prudential Regular Income Fund.2. The scheme is currently managed Manish Banthia, Ritesh Lunawat and Rajat Chandak. Mr. has been managing this fund since Rahul Bhuskute, Rahul BhuskuteOct 2014 (Debt) is 3 . Total Schemes managed by the Fund Manager . Refer annexure from page no. 99 for performance of other schemes currently managed by Rahul Bhuskute.Mr. Manish Banthia has been managing this fund since . Total Schemes managed by the Fund Manager . Refer Nov 2016 (Debt) is 19 (5 are jointly managed)annexure from page no. 99 for performance of other schemes currently managed by Manish Banthia. Mr. has been managing this fund since . Total Schemes managed by the Fund Manager . Refer annexure Ritesh Lunawat Jun 2017 (Debt) is 1 (1 are jointly managed)from page no. 99 for performance of other schemes currently managed by . Ritesh LunawatMr. Rajat Chandak has been managing this fund since . Total Schemes managed by the Fund Manager . Refer Sep 2012 (Equity) is 10 (6 are jointly managed)annexure from page no. 99 for performance of other schemes currently managed by Rajat Chandak.3. Date of inception: 03-May-11.4. Past performance may or may not be sustained in future and the same may not necessarily provide the basis for comparison with other investment.5. Load is not considered for computation of returns.6. In case, the start/end date of the concerned period is a nonbusiness date (NBD), the NAV of the previous date is considered for computation of returns. The NAV per unit shown in the table is as on the start date of the said period
Scheme
CRISIL 10 year Gilt index (Additional Benchmark)
NAV (Rs.) Per Unit (as on October 31,2017 : 17.0963)
CAGR (%)
10.00
Crisil MIP Blended Index (Benchmark)
Since inception
CurrentValue of
Investment of Rs. 10000
CAGR (%) Current Value of
Investment of Rs. 10000
1 Year 3 Year 5 Year
CAGR (%) Current Value of
Investment of Rs. 10000
CAGR (%) Current Value of
Investment of Rs. 10000
15.8564 13.1429 11.1276
Particulars
7.75 10781.96 9.15 13008.01 8.96 15363.87 8.60 17096.30
9.02 10909.72 9.68 13197.90 9.93 16061.34 9.40 17930.68
5.11 10515.70 9.43 13106.66 7.89 14621.69 7.65 16148.22
63.70%
24.37%
0.60%
11.33%
0% 10% 20% 30% 40% 50% 60% 70%
AA and Equivalent
A and Equivalent
Unrated
CBLO, Term Deposits & Current Assets
• Avenue Supermarts Ltd. (D-Mart) CRISIL AA 2.82% Suntrack Commerce Private Ltd. BWR AA- 2.82% Godrej & Boyce Mfg. Co. Ltd. CRISIL AA 2.65% Emami Frank Ross Ltd. BWR AA- 2.63% Manappuram Finance Ltd. CRISIL AA- 2.62% Incline Realty Pvt. Ltd. (A Oberoi CARE AA+ 2.60% Group company) Bharat Financial Inclusion Ltd. CARE A+ 2.49% Ma Multi-Trade Private Ltd. BWR A+ 2.35% Essel Mining & Industries Ltd. CRISIL AA- 2.30% Nuvoco Vistas Corporation Ltd. (Nirma CRISIL AA 2.16% Group) Sadbhav Infrastucture Project Ltd. CARE A+ 1.86% Essel Propack Ltd. CARE AA 1.72% Prime Publishing Pvt. Ltd. BWR AA- 1.71% Amri Hospitals Ltd (Secured by pledge BWR AA- 1.65% of equity shares of Emami Ltd) Tata Housing Development Company Ltd. ICRA AA 1.61% Thomas Cook (India) Ltd. ICRA AA 1.42% Aspire Home Finance Corporation Ltd. ICRA AA- 1.36% (Subsidiary of Motilal Oswal Group) NRB Bearings Ltd. CRISIL AA- 1.29% Anjani Portland Cement Ltd. CARE AA+ 1.29% Techno Electric & Engineering Company Ltd. ICRA AA- 1.29% Vedanta Ltd. CRISIL AA 1.26% Mahindra Integrated Township Ltd. FITCH AA- 1.14% Prestige Estates Projects Ltd. ICRA A+ 1.12% Tanglin Development Ltd. (Secured by BWR A+ 1.07% pledge of equity shares of Mindtree Ltd. ) Suraksha Realty Ltd. (Sun Pharmaceutical FITCH AA- 0.92% Industries Ltd.) Crompton Greaves Consumer Electricals Ltd. CRISIL AA 0.88% Equitas Small Finance Bank Ltd. FITCH A+ 0.86% PVR Ltd. CRISIL AA- 0.78% TGS Investment & Trade Pvt. Ltd. ICRA AA 0.60% (Birla Group Company) Asian Satellite Broadcast Pvt. Ltd. UNRATED 0.60% (Promoter company of Essel Group) Blue Dart Express Ltd. ICRA AA 0.50% Tata Realty & Infrastructure Ltd. CRISIL AA 0.44% Clp Wind Farms (India) Pvt. Ltd. FITCH AA 0.22% CBLO, Term Deposits & Net Current Assets 4.98% Total Net Assets 100.00%
Equity Shares 6.35% -6.35% Auto ^ ^ Mahindra & Mahindra Ltd. ^ Mahindra & Mahindra Ltd. - Futures ^ Banks 0.72% -0.72% Axis Bank Ltd. 0.69% Axis Bank Ltd. - Futures -0.69% Kotak Mahindra Bank Ltd. 0.03% Kotak Mahindra Bank Ltd. - Futures -0.03% Construction Project 1.04% -1.04% Larsen & Toubro Ltd. 1.04% Larsen & Toubro Ltd. - Futures -1.04% Consumer Non Durables 0.27% -0.27% ITC Ltd. 0.19% ITC Ltd. - Futures -0.19% Asian Paints Ltd. 0.08% Asian Paints Ltd. - Futures -0.08% Ferrous Metals 0.96% -0.97% Tata Steel Ltd. 0.96% Tata Steel Ltd. - Futures -0.97% Industrial Capital Goods 0.13% -0.13% Bharat Heavy Electricals Ltd. 0.13% Bharat Heavy Electricals Ltd. - Futures -0.13% Minerals/Mining 0.06% -0.06% Coal India Ltd. 0.06% Coal India Ltd. - Futures -0.06% Non - Ferrous Metals 0.57% -0.57% Hindalco Industries Ltd. 0.57% Hindalco Industries Ltd. - Futures -0.57% Oil 0.47% -0.47% Oil & Natural Gas Corporation Ltd. 0.47% Oil & Natural Gas Corporation Ltd. - Futures -0.47% Petroleum Products 1.76% -1.77% Reliance Industries Ltd. 1.23% Reliance Industries Ltd. - Futures -1.23% Bharat Petroleum Corporation Ltd. 0.37% Bharat Petroleum Corporation Ltd. - Futures -0.37% Hindustan Petroleum Corporation Ltd. 0.16% Hindustan Petroleum Corporation Ltd. - Futures -0.16% Pharmaceuticals 0.08% -0.08% Cipla Ltd. 0.08% Cipla Ltd. - Futures -0.08% Software 0.28% -0.28% HCL Technologies Ltd. 0.28% HCL Technologies Ltd. - Futures -0.28% Debt Holdings 88.68% Corporate Securities 88.68% • AU Small Finance Bank Ltd. CRISIL A+ 6.69% • Prism Cement Ltd. ICRA A- 4.53% • Parry Sugars Refinery India Private Ltd. CRISIL AA- 4.50% (Subsidiary of E.I.D - Parry (India) Limited)• Indian Hospital Corporation Ltd. (Secured BWR AA- 4.28% by pledge of equity shares of APOLLO HOSPITALS ENTERPRISE LTD.)• Writers And Publishers Pvt. Ltd. BWR AA- 4.06% (LAS of DB Corp)• Promont Hillside Private Ltd. (Subsidiary CARE AA 3.67% of Tata Housing Development Co. Ltd)• Pune Solapur Expressway Pvt. Ltd. ICRA A 3.39% (A Tata Group Company)• Hinduja Leyland Finance Ltd. CARE AA- 3.37% • Samvardhana Motherson International Ltd. ICRA AA- 3.13% (Secured by pledge of equity shares of Motherson Sumi Systems Ltd)
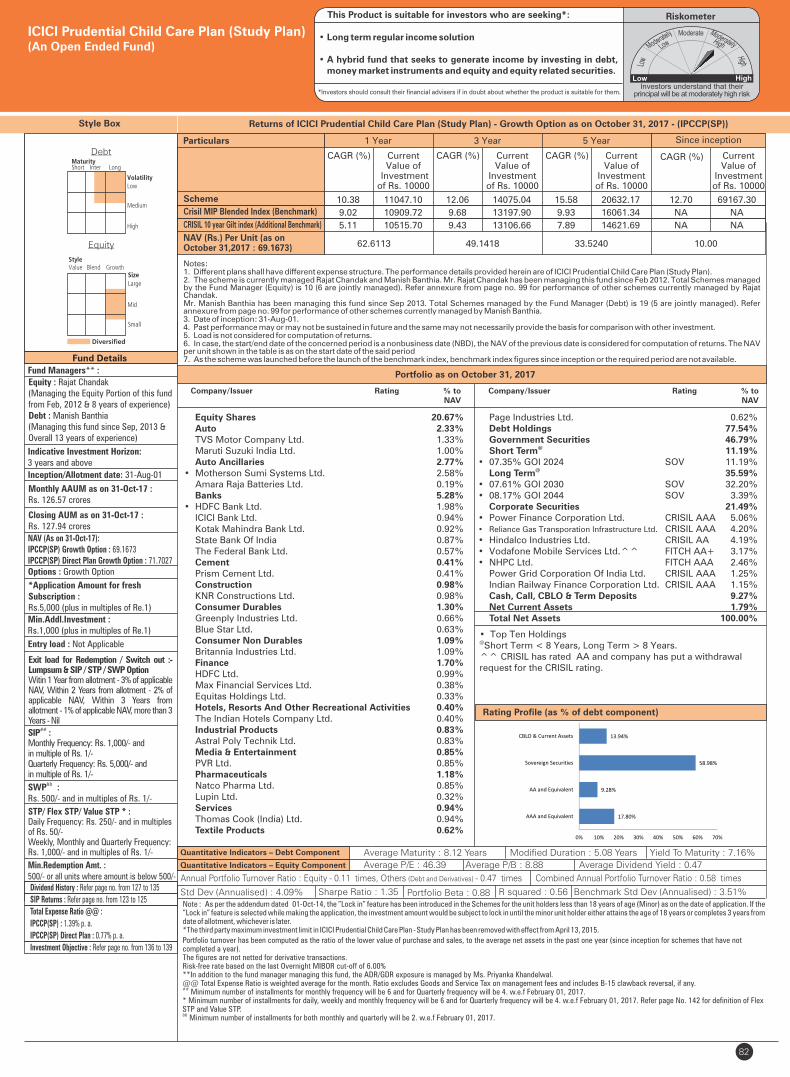
82
Fund Details
Rating Profile (as % of debt component)
Style Box
Portfolio turnover has been computed as the ratio of the lower value of purchase and sales, to the average net assets in the past one year (since inception for schemes that have not completed a year). The figures are not netted for derivative transactions.Risk-free rate based on the last Overnight MIBOR cut-off of 6.00%**In addition to the fund manager managing this fund, the ADR/GDR exposure is managed by Ms. Priyanka Khandelwal.@@ Total Expense Ratio is weighted average for the month. Ratio excludes Goods and Service Tax on management fees and includes B-15 clawback reversal, if any.##
Minimum number of installments for monthly frequency will be 6 and for Quarterly frequency will be 4. w.e.f February 01, 2017.* Minimum number of installments for daily, weekly and monthly frequency will be 6 and for Quarterly frequency will be 4. w.e.f February 01, 2017. Refer page No. 142 for definition of Flex STP and Value STP.&&
Minimum number of installments for both monthly and quarterly will be 2. w.e.f February 01, 2017.
Equity : Rajat Chandak (Managing the Equity Portion of this fund from Feb, 2012 & 8 years of experience)Debt : Manish Banthia (Managing this fund since Sep, 2013 & Overall 13 years of experience)
Fund Managers** :
Indicative Investment Horizon: 3 years and above
Inception/Allotment date: 31-Aug-01
Monthly AAUM as on 31-Oct-17 : Rs. 126.57 crores
Closing AUM as on 31-Oct-17 : Rs. 127.94 crores
NAV (As on 31-Oct-17):IPCCP(SP) Growth Option : 69.1673IPCCP(SP) Direct Plan Growth Option : 71.7027Options : Growth Option
*Application Amount for freshSubscription :Rs.5,000 (plus in multiples of Re.1)
Min.Addl.Investment :Rs.1,000 (plus in multiples of Re.1)
Exit load for Redemption / Switch out :- Lumpsum & SIP / STP / SWP OptionWitin 1 Year from allotment - 3% of applicable NAV, Within 2 Years from allotment - 2% of applicable NAV, Within 3 Years from allotment - 1% of applicable NAV, more than 3 Years - Nil
SIP :##
Monthly Frequency: Rs. 1,000/- and in multiple of Rs. 1/-Quarterly Frequency: Rs. 5,000/- and in multiple of Rs. 1/-
&&SWP :Rs. 500/- and in multiples of Rs. 1/-
STP/ Flex STP/ Value STP * :Daily Frequency: Rs. 250/- and in multiples of Rs. 50/-Weekly, Monthly and Quarterly Frequency: Rs. 1,000/- and in multiples of Rs. 1/-
Min.Redemption Amt. :500/- or all units where amount is below 500/-
• Top Ten Holdings@Short Term < 8 Years, Long Term > 8 Years.^^ CRISIL has rated AA and company has put a withdrawal request for the CRISIL rating.
Equity
Debt
Portfolio as on October 31, 2017
Returns of ICICI Prudential Child Care Plan (Study Plan) - Growth Option as on October 31, 2017 - (IPCCP(SP))
Equity Shares 20.67% Auto 2.33% TVS Motor Company Ltd. 1.33% Maruti Suzuki India Ltd. 1.00% Auto Ancillaries 2.77%• Motherson Sumi Systems Ltd. 2.58% Amara Raja Batteries Ltd. 0.19% Banks 5.28%• HDFC Bank Ltd. 1.98% ICICI Bank Ltd. 0.94% Kotak Mahindra Bank Ltd. 0.92% State Bank Of India 0.87% The Federal Bank Ltd. 0.57% Cement 0.41% Prism Cement Ltd. 0.41% Construction 0.98% KNR Constructions Ltd. 0.98% Consumer Durables 1.30% Greenply Industries Ltd. 0.66% Blue Star Ltd. 0.63% Consumer Non Durables 1.09% Britannia Industries Ltd. 1.09% Finance 1.70% HDFC Ltd. 0.99% Max Financial Services Ltd. 0.38% Equitas Holdings Ltd. 0.33% Hotels, Resorts And Other Recreational Activities 0.40% The Indian Hotels Company Ltd. 0.40% Industrial Products 0.83% Astral Poly Technik Ltd. 0.83% Media & Entertainment 0.85% PVR Ltd. 0.85% Pharmaceuticals 1.18% Natco Pharma Ltd. 0.85% Lupin Ltd. 0.32% Services 0.94% Thomas Cook (India) Ltd. 0.94% Textile Products 0.62%
Company/Issuer Rating % to NAV
Company/Issuer Rating % to NAV
Note : As per the addendum dated 01-Oct-14, the ”Lock in” feature has been introduced in the Schemes for the unit holders less than 18 years of age (Minor) as on the date of application. If the ”Lock in” feature is selected while making the application, the investment amount would be subject to lock in until the minor unit holder either attains the age of 18 years or completes 3 years from date of allotment, whichever is later.*The third party maximum investment limit in ICICI Prudential Child Care Plan - Study Plan has been removed with effect from April 13, 2015.
Quantitative Indicators – Equity Component
Quantitative Indicators – Debt Component Modified Duration : 5.08 Years Yield To Maturity : 7.16%Average Maturity : 8.12 Years
Page Industries Ltd. 0.62% Debt Holdings 77.54% Government Securities 46.79%
@ Short Term 11.19%• 07.35% GOI 2024 SOV 11.19%
@ Long Term 35.59%• 07.61% GOI 2030 SOV 32.20%• 08.17% GOI 2044 SOV 3.39% Corporate Securities 21.49%• Power Finance Corporation Ltd. CRISIL AAA 5.06%• Reliance Gas Transporation Infrastructure Ltd. CRISIL AAA 4.20%• Hindalco Industries Ltd. CRISIL AA 4.19%• Vodafone Mobile Services Ltd.^^ FITCH AA+ 3.17%• NHPC Ltd. FITCH AAA 2.46% Power Grid Corporation Of India Ltd. CRISIL AAA 1.25% Indian Railway Finance Corporation Ltd. CRISIL AAA 1.15% Cash, Call, CBLO & Term Deposits 9.27% Net Current Assets 1.79% Total Net Assets 100.00%
ICICI Prudential Child Care Plan (Study Plan)(An Open Ended Fund)
Entry load : Not Applicable
Std Dev (Annualised) : 4.09% Sharpe Ratio : 1.35 Portfolio Beta : 0.88 R squared : 0.56 Benchmark Std Dev (Annualised) : 3.51%
RiskometerThis Product is suitable for investors who are seeking*:
• Long term regular income solution
• A hybrid fund that seeks to generate income by investing in debt, money market instruments and equity and equity related securities.
*Investors should consult their financial advisers if in doubt about whether the product is suitable for them.
Average P/E : 46.39 Average P/B : 8.88 Average Dividend Yield : 0.47
Annual Portfolio Turnover Ratio : Equity - 0.11 times, Others (Debt and Derivatives) - 0.47 times Combined Annual Portfolio Turnover Ratio : 0.58 timesDividend History : Refer page no. from 127 to 135
SIP Returns : Refer page no. from 123 to 125
Total Expense Ratio @@ :
IPCCP(SP) : 1.39% p. a.
IPCCP(SP) Direct Plan : 0.77% p. a.
Investment Objective : Refer page no. from 136 to 139
Notes:1. Different plans shall have different expense structure. The performance details provided herein are of ICICI Prudential Child Care Plan (Study Plan).2. The scheme is currently managed Rajat Chandak and Mr. Rajat Chandak has been managing this fund since . Total Schemes managed Manish Banthia. Feb 2012by the Fund Manager is . Refer annexure from page no. 99 for performance of other schemes currently managed by Rajat (Equity) 10 (6 are jointly managed)Chandak.Mr. Manish Banthia has been managing this fund since 3. Total Schemes managed by the Fund Manager . Refer Sep 201 (Debt) is 19 (5 are jointly managed)annexure from page no. 99 for performance of other schemes currently managed by Manish Banthia.3. Date of inception: 31-Aug-01.4. Past performance may or may not be sustained in future and the same may not necessarily provide the basis for comparison with other investment.5. Load is not considered for computation of returns.6. In case, the start/end date of the concerned period is a nonbusiness date (NBD), the NAV of the previous date is considered for computation of returns. The NAV per unit shown in the table is as on the start date of the said period7. As the scheme was launched before the launch of the benchmark index, benchmark index figures since inception or the required period are not available.
Scheme
CRISIL 10 year Gilt index (Additional Benchmark)
NAV (Rs.) Per Unit (as on October 31,2017 : 69.1673)
CAGR (%)
10.00
Crisil MIP Blended Index (Benchmark)
Since inception
CurrentValue of
Investment of Rs. 10000
CAGR (%) Current Value of
Investment of Rs. 10000
1 Year 3 Year 5 Year
CAGR (%) Current Value of
Investment of Rs. 10000
CAGR (%) Current Value of
Investment of Rs. 10000
62.6113 49.1418 33.5240
Particulars
10.38 11047.10 12.06 14075.04 15.58 20632.17 12.70 69167.30
9.02 10909.72 9.68 13197.90 9.93 16061.34 NA NA
5.11 10515.70 9.43 13106.66 7.89 14621.69 NA NA
17.80%
9.28%
58.98%
13.94%
0% 10% 20% 30% 40% 50% 60% 70%
AAA and Equivalent
AA and Equivalent
Sovereign Securities
CBLO & Current Assets
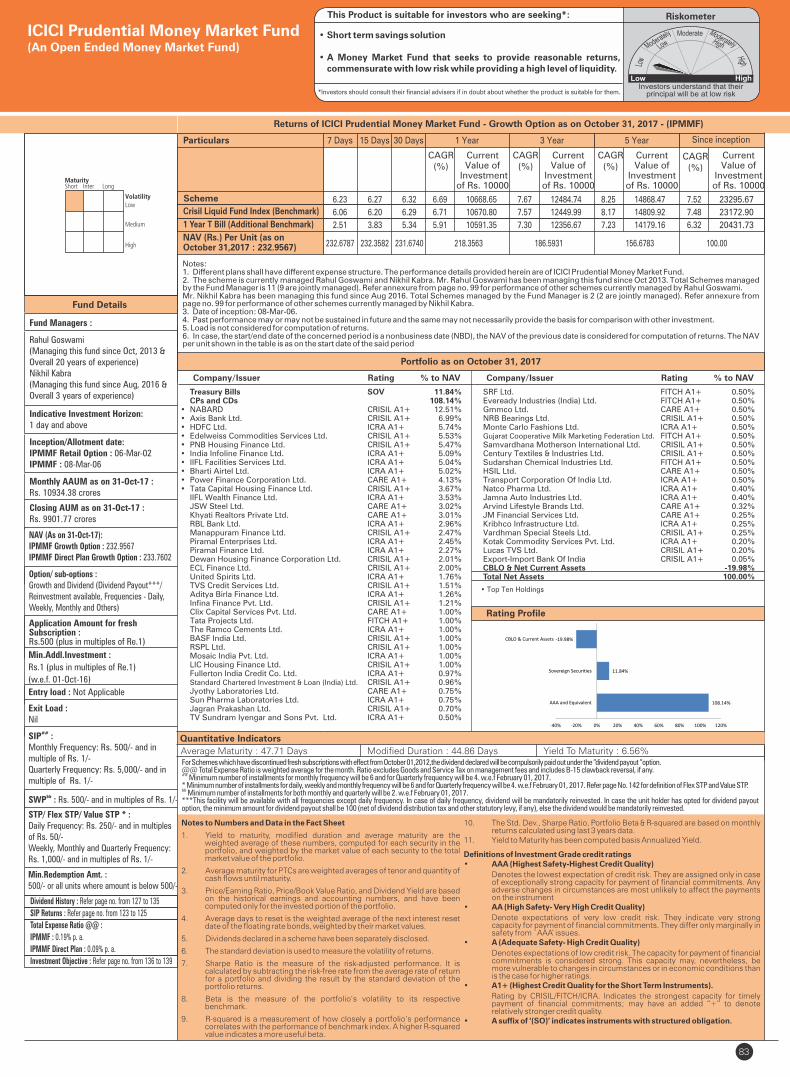
SRF Ltd. FITCH A1+ 0.50% Eveready Industries (India) Ltd. FITCH A1+ 0.50% Gmmco Ltd. CARE A1+ 0.50% NRB Bearings Ltd. CRISIL A1+ 0.50% Monte Carlo Fashions Ltd. ICRA A1+ 0.50% Gujarat Cooperative Milk Marketing Federation Ltd. FITCH A1+ 0.50% Samvardhana Motherson International Ltd. CRISIL A1+ 0.50% Century Textiles & Industries Ltd. CRISIL A1+ 0.50% Sudarshan Chemical Industries Ltd. FITCH A1+ 0.50% HSIL Ltd. CARE A1+ 0.50% Transport Corporation Of India Ltd. ICRA A1+ 0.50% Natco Pharma Ltd. ICRA A1+ 0.40% Jamna Auto Industries Ltd. ICRA A1+ 0.40% Arvind Lifestyle Brands Ltd. CARE A1+ 0.32% JM Financial Services Ltd. CARE A1+ 0.25% Kribhco Infrastructure Ltd. ICRA A1+ 0.25% Vardhman Special Steels Ltd. CRISIL A1+ 0.25% Kotak Commodity Services Pvt. Ltd. ICRA A1+ 0.20% Lucas TVS Ltd. CRISIL A1+ 0.20% Export-Import Bank Of India CRISIL A1+ 0.05% CBLO & Net Current Assets -19.98% Total Net Assets 100.00%
83
Quantitative Indicators
Fund Details
Company/Issuer Rating % to NAV
For Schemes which have discontinued fresh subscriptions with effect from October 01,2012,the dividend declared will be compulsorily paid out under the “dividend payout “option.@@ Total Expense Ratio is weighted average for the month. Ratio excludes Goods and Service Tax on management fees and includes B-15 clawback reversal, if any.##
Minimum number of installments for monthly frequency will be 6 and for Quarterly frequency will be 4. w.e.f February 01, 2017.* Minimum number of installments for daily, weekly and monthly frequency will be 6 and for Quarterly frequency will be 4. w.e.f February 01, 2017. Refer page No. 142 for definition of Flex STP and Value STP.&& Minimum number of installments for both monthly and quarterly will be 2. w.e.f February 01, 2017.***This facility will be available with all frequencies except daily frequency. In case of daily frequency, dividend will be mandatorily reinvested. In case the unit holder has opted for dividend payout option, the minimum amount for dividend payout shall be 100 (net of dividend distribution tax and other statutory levy, if any), else the dividend would be mandatorily reinvested.
Notes to Numbers and Data in the Fact Sheet
1. Yield to maturity, modified duration and average maturity are the weighted average of these numbers, computed for each security in the portfolio, and weighted by the market value of each security to the total market value of the portfolio.
2. Average maturity for PTCs are weighted averages of tenor and quantity of cash flows until maturity.
3. Price/Earning Ratio, Price/Book Value Ratio, and Dividend Yield are based on the historical earnings and accounting numbers, and have been computed only for the invested portion of the portfolio.
4. Average days to reset is the weighted average of the next interest reset date of the floating rate bonds, weighted by their market values.
5. Dividends declared in a scheme have been separately disclosed.
6. The standard deviation is used to measure the volatility of returns.
7. Sharpe Ratio is the measure of the risk-adjusted performance. It is calculated by subtracting the risk-free rate from the average rate of return for a portfolio and dividing the result by the standard deviation of the portfolio returns.
8. Beta is the measure of the portfolio’s volatility to its respective benchmark.
9. R-squared is a measurement of how closely a portfolio’s performance correlates with the performance of benchmark index. A higher R-squared value indicates a more useful beta.
10. The Std. Dev., Sharpe Ratio, Portfolio Beta & R-squared are based on monthly returns calculated using last 3 years data.
11. Yield to Maturity has been computed basis Annualized Yield. Definitions of Investment Grade credit ratings• AAA (Highest Safety-Highest Credit Quality)
Denotes the lowest expectation of credit risk. They are assigned only in case of exceptionally strong capacity for payment of financial commitments. Any adverse changes in circumstances are most unlikely to affect the payments on the instrument
• AA (High Safety- Very High Credit Quality)
Denote expectations of very low credit risk. They indicate very strong capacity for payment of financial commitments. They differ only marginally in safety from ̀ AAA’ issues.
• A (Adequate Safety- High Credit Quality)
Denotes expectations of low credit risk. The capacity for payment of financial commitments is considered strong. This capacity may, nevertheless, be more vulnerable to changes in circumstances or in economic conditions than is the case for higher ratings.
• A1+ (Highest Credit Quality for the Short Term Instruments).
Rating by CRISIL/FITCH/ICRA. Indicates the strongest capacity for timely payment of financial commitments; may have an added “+” to denote relatively stronger credit quality.
• A suffix of ‘(SO)’ indicates instruments with structured obligation.
Fund Managers :
Rahul Goswami (Managing this fund since Oct, 2013 & Overall 20 years of experience)Nikhil Kabra(Managing this fund since Aug, 2016 & Overall 3 years of experience)
Indicative Investment Horizon:1 day and above
Inception/Allotment date:IPMMF Retail Option : 06-Mar-02IPMMF : 08-Mar-06
Monthly AAUM as on 31-Oct-17 : Rs. 10934.38 crores
Closing AUM as on 31-Oct-17 : Rs. 9901.77 crores
NAV (As on 31-Oct-17):IPMMF Growth Option : 232.9567IPMMF Direct Plan Growth Option : 233.7602
Option/ sub-options :Growth and Dividend (Dividend Payout***/Reinvestment available, Frequencies - Daily, Weekly, Monthly and Others)
Application Amount for freshSubscription :Rs.500 (plus in multiples of Re.1)
Min.Addl.Investment :
Rs.1 (plus in multiples of Re.1)
(w.e.f. 01-Oct-16)
Exit Load : Nil
##SIP :Monthly Frequency: Rs. 500/- and in multiple of Rs. 1/-Quarterly Frequency: Rs. 5,000/- and in multiple of Rs. 1/-
&&SWP : Rs. 500/- and in multiples of Rs. 1/-
STP/ Flex STP/ Value STP * :Daily Frequency: Rs. 250/- and in multiples of Rs. 50/-Weekly, Monthly and Quarterly Frequency: Rs. 1,000/- and in multiples of Rs. 1/-
Min.Redemption Amt. :500/- or all units where amount is below 500/-
• Top Ten Holdings
Portfolio as on October 31, 2017
Returns of ICICI Prudential Money Market Fund - Growth Option as on - (IPMMF)October 31, 2017
Average Maturity : 47.71 Days Modified Duration : 44.86 Days Yield To Maturity : 6.56%
ICICI Prudential Money Market Fund(An Open Ended Money Market Fund)
Entry load : Not Applicable
RiskometerThis Product is suitable for investors who are seeking*:
• Short term savings solution
• A Money Market Fund that seeks to provide reasonable returns, commensurate with low risk while providing a high level of liquidity.
*Investors should consult their financial advisers if in doubt about whether the product is suitable for them.
Company/Issuer Rating % to NAV
Dividend History : Refer page no. from 127 to 135
SIP Returns : Refer page no. from 123 to 125
Total Expense Ratio @@ :
IPMMF : 0.19% p. a.
IPMMF Direct Plan : 0.09% p. a.
Investment Objective : Refer page no. from 136 to 139
Rating Profile
Treasury Bills SOV 11.84% CPs and CDs 108.14%• NABARD CRISIL A1+ 12.51%• Axis Bank Ltd. CRISIL A1+ 6.99%• HDFC Ltd. ICRA A1+ 5.74%• Edelweiss Commodities Services Ltd. CRISIL A1+ 5.53%• PNB Housing Finance Ltd. CRISIL A1+ 5.47%• India Infoline Finance Ltd. ICRA A1+ 5.09%• IIFL Facilities Services Ltd. ICRA A1+ 5.04%• Bharti Airtel Ltd. ICRA A1+ 5.02%• Power Finance Corporation Ltd. CARE A1+ 4.13%• Tata Capital Housing Finance Ltd. CRISIL A1+ 3.67% IIFL Wealth Finance Ltd. ICRA A1+ 3.53% JSW Steel Ltd. CARE A1+ 3.02% Khyati Realtors Private Ltd. CARE A1+ 3.01% RBL Bank Ltd. ICRA A1+ 2.96% Manappuram Finance Ltd. CRISIL A1+ 2.47% Piramal Enterprises Ltd. ICRA A1+ 2.45% Piramal Finance Ltd. ICRA A1+ 2.27% Dewan Housing Finance Corporation Ltd. CRISIL A1+ 2.01% ECL Finance Ltd. CRISIL A1+ 2.00% United Spirits Ltd. ICRA A1+ 1.76% TVS Credit Services Ltd. CRISIL A1+ 1.51% Aditya Birla Finance Ltd. ICRA A1+ 1.26% Infina Finance Pvt. Ltd. CRISIL A1+ 1.21% Clix Capital Services Pvt. Ltd. CARE A1+ 1.00% Tata Projects Ltd. FITCH A1+ 1.00% The Ramco Cements Ltd. ICRA A1+ 1.00% BASF India Ltd. CRISIL A1+ 1.00% RSPL Ltd. CRISIL A1+ 1.00% Mosaic India Pvt. Ltd. ICRA A1+ 1.00% LIC Housing Finance Ltd. CRISIL A1+ 1.00% Fullerton India Credit Co. Ltd. ICRA A1+ 0.97% Standard Chartered Investment & Loan (India) Ltd. CRISIL A1+ 0.96% Jyothy Laboratories Ltd. CARE A1+ 0.75% Sun Pharma Laboratories Ltd. ICRA A1+ 0.75% Jagran Prakashan Ltd. CRISIL A1+ 0.70% TV Sundram Iyengar and Sons Pvt. Ltd. ICRA A1+ 0.50%
Notes:1. Different plans shall have different expense structure. The performance details provided herein are of ICICI Prudential Money Market Fund.2. The scheme is currently managed and . Mr. has been managing this fund since . Total Schemes managed Rahul Goswami Nikhil Kabra Rahul Goswami Oct 2013by the Fund Manager . Refer annexure from page no. 99 for performance of other schemes currently managed by .is 11 (9 are jointly managed) Rahul GoswamiMr. has been managing this fund since Aug 2016. Total Schemes managed by the Fund Manager . Refer annexure from Nikhil Kabra is 2 (2 are jointly managed)page no. 99 for performance of other schemes currently managed by . Nikhil Kabra3. Date of inception: 08-Mar-06.4. Past performance may or may not be sustained in future and the same may not necessarily provide the basis for comparison with other investment.5. Load is not considered for computation of returns.6. In case, the start/end date of the concerned period is a nonbusiness date (NBD), the NAV of the previous date is considered for computation of returns. The NAV per unit shown in the table is as on the start date of the said period
Scheme
1 Year T Bill (Additional Benchmark)
CAGR (%)
Crisil Liquid Fund Index (Benchmark)
Since inception
CurrentValue of
Investment of Rs. 10000
CAGR (%)
Current Value of
Investment of Rs. 10000
1 Year 3 Year 5 Year
CAGR (%)
Current Value of
Investment of Rs. 10000
CAGR (%)
Current Value of
Investment of Rs. 10000
Particulars 7 Days 15 Days 30 Days
NAV (Rs.) Per Unit (as on October 31,2017 : 232.9567) 232.6787
23295.67
23172.90
20431.73
232.3582 231.6740 218.3563 186.5931 156.6783 100.00
6.23
6.06
2.51
6.27
6.20
3.83
6.32
6.29
5.34
6.69
6.71
5.91
10668.65
10670.80
10591.35
7.67
7.57
7.30
12484.74
12449.99
12356.67
8.25
8.17
7.23
14868.47
14809.92
14179.16
7.52
7.48
6.32
108.14%
11.84%
-19.98%
-40% -20% 0% 20% 40% 60% 80% 100% 120%
AAA and Equivalent
Sovereign Securities
CBLO & Current Assets
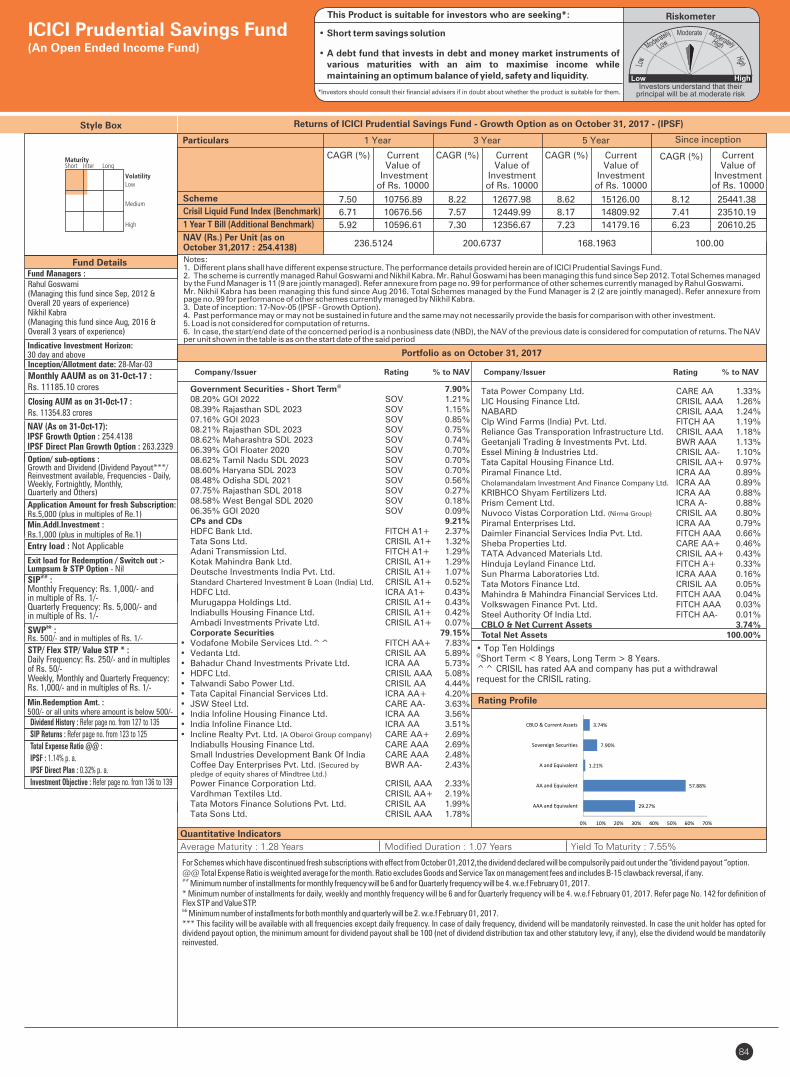
84
Rating Profile
Fund Details
Portfolio as on October 31, 2017
Quantitative Indicators
Style Box
Fund Managers :Rahul Goswami (Managing this fund since Sep, 2012 & Overall 20 years of experience)Nikhil Kabra(Managing this fund since Aug, 2016 & Overall 3 years of experience)
Indicative Investment Horizon:30 day and above
Monthly AAUM as on 31-Oct-17 : Rs. 11185.10 crores
Closing AUM as on 31-Oct-17 : Rs. 11354.83 crores
NAV (As on 31-Oct-17):IPSF Growth Option : 254.4138IPSF Direct Plan Growth Option : 263.2329
Option/ sub-options :Growth and Dividend (Dividend Payout***/Reinvestment available, Frequencies - Daily, Weekly, Fortnightly, Monthly, Quarterly and Others)
Application Amount for fresh Subscription:Rs.5,000 (plus in multiples of Re.1)Min.Addl.Investment :Rs.1,000 (plus in multiples of Re.1)
Exit load for Redemption / Switch out :-Lumpsum & STP Option - Nil
##SIP :Monthly Frequency: Rs. 1,000/- and in multiple of Rs. 1/-Quarterly Frequency: Rs. 5,000/- and in multiple of Rs. 1/-
&&SWP :Rs. 500/- and in multiples of Rs. 1/-
STP/ Flex STP/ Value STP * :Daily Frequency: Rs. 250/- and in multiples of Rs. 50/-Weekly, Monthly and Quarterly Frequency: Rs. 1,000/- and in multiples of Rs. 1/-
Min.Redemption Amt. :500/- or all units where amount is below 500/-
Company/Issuer Rating % to NAV
• Top Ten Holdings@Short Term < 8 Years, Long Term > 8 Years.^^ CRISIL has rated AA and company has put a withdrawal request for the CRISIL rating.
For Schemes which have discontinued fresh subscriptions with effect from October 01,2012,the dividend declared will be compulsorily paid out under the “dividend payout “option.@@ Total Expense Ratio is weighted average for the month. Ratio excludes Goods and Service Tax on management fees and includes B-15 clawback reversal, if any.##
Minimum number of installments for monthly frequency will be 6 and for Quarterly frequency will be 4. w.e.f February 01, 2017.* Minimum number of installments for daily, weekly and monthly frequency will be 6 and for Quarterly frequency will be 4. w.e.f February 01, 2017. Refer page No. 142 for definition of Flex STP and Value STP.&&
Minimum number of installments for both monthly and quarterly will be 2. w.e.f February 01, 2017.*** This facility will be available with all frequencies except daily frequency. In case of daily frequency, dividend will be mandatorily reinvested. In case the unit holder has opted for dividend payout option, the minimum amount for dividend payout shall be 100 (net of dividend distribution tax and other statutory levy, if any), else the dividend would be mandatorily reinvested.
Returns of ICICI Prudential Savings Fund - Growth Option as on - (IPSF)October 31, 2017
Average Maturity : 1.28 Years Modified Duration : 1.07 Years Yield To Maturity : 7.55%
ICICI Prudential Savings Fund(An Open Ended Income Fund)
Inception/Allotment date: 28-Mar-03
Entry load : Not Applicable
RiskometerThis Product is suitable for investors who are seeking*:
• Short term savings solution
• A debt fund that invests in debt and money market instruments of various maturities with an aim to maximise income while maintaining an optimum balance of yield, safety and liquidity.
*Investors should consult their financial advisers if in doubt about whether the product is suitable for them.
Company/Issuer Rating % to NAV
Dividend History : Refer page no. from 127 to 135
SIP Returns : Refer page no. from 123 to 125
Total Expense Ratio @@ :
IPSF : 1.14% p. a.
IPSF Direct Plan : 0.32% p. a.
Investment Objective : Refer page no. from 136 to 139
Notes:1. Different plans shall have different expense structure. The performance details provided herein are of ICICI Prudential Savings Fund.2. The scheme is currently managed and . Mr. has been managing this fund since . Total Schemes managed Rahul Goswami Nikhil Kabra Rahul Goswami Sep 2012by the Fund Manager . Refer annexure from page no. 99 for performance of other schemes currently managed by .is 11 (9 are jointly managed) Rahul GoswamiMr. has been managing this fund since Aug 2016. Total Schemes managed by the Fund Manager . Refer annexure from Nikhil Kabra is 2 (2 are jointly managed)page no. 99 for performance of other schemes currently managed by . Nikhil Kabra3. Date of inception: 17-Nov-05 (IPSF - Growth Option).4. Past performance may or may not be sustained in future and the same may not necessarily provide the basis for comparison with other investment.5. Load is not considered for computation of returns.6. In case, the start/end date of the concerned period is a nonbusiness date (NBD), the NAV of the previous date is considered for computation of returns. The NAV per unit shown in the table is as on the start date of the said period
Scheme
1 Year T Bill (Additional Benchmark)
NAV (Rs.) Per Unit (as onOctober 31,2017 : 254.4138)
CAGR (%)
100.00
Crisil Liquid Fund Index (Benchmark)
Since inception
CurrentValue of
Investment of Rs. 10000
CAGR (%) Current Value of
Investment of Rs. 10000
1 Year 3 Year 5 Year
CAGR (%) Current Value of
Investment of Rs. 10000
CAGR (%) Current Value of
Investment of Rs. 10000
236.5124 200.6737 168.1963
Particulars
7.50 10756.89 8.22 12677.98 8.62 15126.00 8.12 25441.38
6.71 10676.56 7.57 12449.99 8.17 14809.92 7.41 23510.19
5.92 10596.61 7.30 12356.67 7.23 14179.16 6.23 20610.25
29.27%
57.88%
1.21%
7.90%
3.74%
0% 10% 20% 30% 40% 50% 60% 70%
AAA and Equivalent
AA and Equivalent
A and Equivalent
Sovereign Securities
CBLO & Current Assets
@ Government Securities - Short Term 7.90% 08.20% GOI 2022 SOV 1.21% 08.39% Rajasthan SDL 2023 SOV 1.15% 07.16% GOI 2023 SOV 0.85% 08.21% Rajasthan SDL 2023 SOV 0.75% 08.62% Maharashtra SDL 2023 SOV 0.74% 06.39% GOI Floater 2020 SOV 0.70% 08.62% Tamil Nadu SDL 2023 SOV 0.70% 08.60% Haryana SDL 2023 SOV 0.70% 08.48% Odisha SDL 2021 SOV 0.56% 07.75% Rajasthan SDL 2018 SOV 0.27% 08.58% West Bengal SDL 2020 SOV 0.18% 06.35% GOI 2020 SOV 0.09% CPs and CDs 9.21% HDFC Bank Ltd. FITCH A1+ 2.37% Tata Sons Ltd. CRISIL A1+ 1.32% Adani Transmission Ltd. FITCH A1+ 1.29% Kotak Mahindra Bank Ltd. CRISIL A1+ 1.29% Deutsche Investments India Pvt. Ltd. CRISIL A1+ 1.07% Standard Chartered Investment & Loan (India) Ltd. CRISIL A1+ 0.52% HDFC Ltd. ICRA A1+ 0.43% Murugappa Holdings Ltd. CRISIL A1+ 0.43% Indiabulls Housing Finance Ltd. CRISIL A1+ 0.42% Ambadi Investments Private Ltd. CRISIL A1+ 0.07% Corporate Securities 79.15%• Vodafone Mobile Services Ltd.^^ FITCH AA+ 7.83%• Vedanta Ltd. CRISIL AA 5.89%• Bahadur Chand Investments Private Ltd. ICRA AA 5.73%• HDFC Ltd. CRISIL AAA 5.08%• Talwandi Sabo Power Ltd. CRISIL AA 4.44%• Tata Capital Financial Services Ltd. ICRA AA+ 4.20%• JSW Steel Ltd. CARE AA- 3.63%• India Infoline Housing Finance Ltd. ICRA AA 3.56%• India Infoline Finance Ltd. ICRA AA 3.51%• Incline Realty Pvt. Ltd. (A Oberoi Group company) CARE AA+ 2.69% Indiabulls Housing Finance Ltd. CARE AAA 2.69% Small Industries Development Bank Of India CARE AAA 2.48% Coffee Day Enterprises Pvt. Ltd. (Secured by BWR AA- 2.43% pledge of equity shares of Mindtree Ltd.)
Power Finance Corporation Ltd. CRISIL AAA 2.33% Vardhman Textiles Ltd. CRISIL AA+ 2.19% Tata Motors Finance Solutions Pvt. Ltd. CRISIL AA 1.99% Tata Sons Ltd. CRISIL AAA 1.78%
Tata Power Company Ltd. CARE AA 1.33% LIC Housing Finance Ltd. CRISIL AAA 1.26% NABARD CRISIL AAA 1.24% Clp Wind Farms (India) Pvt. Ltd. FITCH AA 1.19% Reliance Gas Transporation Infrastructure Ltd. CRISIL AAA 1.18% Geetanjali Trading & Investments Pvt. Ltd. BWR AAA 1.13% Essel Mining & Industries Ltd. CRISIL AA- 1.10% Tata Capital Housing Finance Ltd. CRISIL AA+ 0.97% Piramal Finance Ltd. ICRA AA 0.89% Cholamandalam Investment And Finance Company Ltd. ICRA AA 0.89% KRIBHCO Shyam Fertilizers Ltd. ICRA AA 0.88% Prism Cement Ltd. ICRA A- 0.88% Nuvoco Vistas Corporation Ltd. (Nirma Group) CRISIL AA 0.80% Piramal Enterprises Ltd. ICRA AA 0.79% Daimler Financial Services India Pvt. Ltd. FITCH AAA 0.66% Sheba Properties Ltd. CARE AA+ 0.46% TATA Advanced Materials Ltd. CRISIL AA+ 0.43% Hinduja Leyland Finance Ltd. FITCH A+ 0.33% Sun Pharma Laboratories Ltd. ICRA AAA 0.16% Tata Motors Finance Ltd. CRISIL AA 0.05% Mahindra & Mahindra Financial Services Ltd. FITCH AAA 0.04% Volkswagen Finance Pvt. Ltd. FITCH AAA 0.03% Steel Authority Of India Ltd. FITCH AA- 0.01% CBLO & Net Current Assets 3.74% Total Net Assets 100.00%
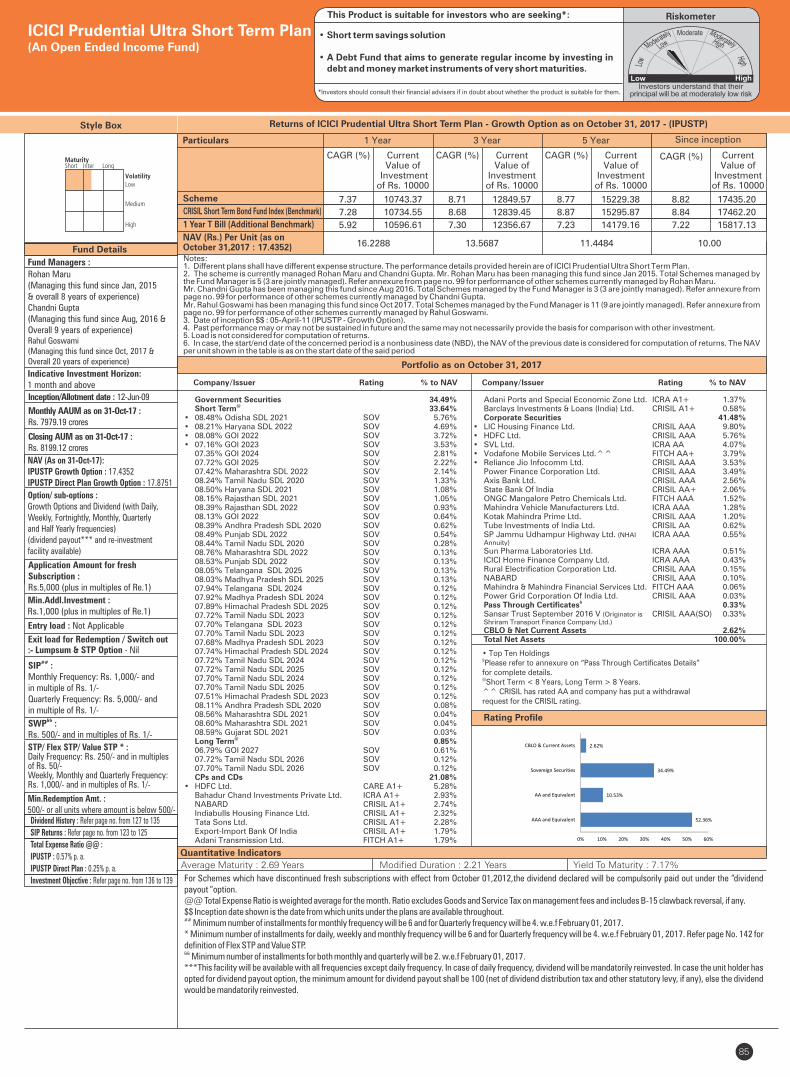
85
Portfolio as on October 31, 2017
Quantitative Indicators
Fund Details
Style Box
Company/Issuer Rating % to NAV
For Schemes which have discontinued fresh subscriptions with effect from October 01,2012,the dividend declared will be compulsorily paid out under the “dividend payout “option.@@ Total Expense Ratio is weighted average for the month. Ratio excludes Goods and Service Tax on management fees and includes B-15 clawback reversal, if any.$$ Inception date shown is the date from which units under the plans are available throughout.## Minimum number of installments for monthly frequency will be 6 and for Quarterly frequency will be 4. w.e.f February 01, 2017.* Minimum number of installments for daily, weekly and monthly frequency will be 6 and for Quarterly frequency will be 4. w.e.f February 01, 2017. Refer page No. 142 for definition of Flex STP and Value STP.&& Minimum number of installments for both monthly and quarterly will be 2. w.e.f February 01, 2017.***This facility will be available with all frequencies except daily frequency. In case of daily frequency, dividend will be mandatorily reinvested. In case the unit holder has opted for dividend payout option, the minimum amount for dividend payout shall be 100 (net of dividend distribution tax and other statutory levy, if any), else the dividend would be mandatorily reinvested.
Fund Managers :
Rohan Maru(Managing this fund since Jan, 2015& overall 8 years of experience)Chandni Gupta(Managing this fund since Aug, 2016 &Overall 9 years of experience)Rahul Goswami (Managing this fund since Oct, 2017 & Overall 20 years of experience)
Indicative Investment Horizon:1 month and above
Inception/Allotment date : 12-Jun-09
Monthly AAUM as on 31-Oct-17 : Rs. 7979.19 crores
Closing AUM as on 31-Oct-17 : Rs. 8199.12 crores
NAV (As on 31-Oct-17):IPUSTP Growth Option : 17.4352IPUSTP Direct Plan Growth Option : 17.8751
Option/ sub-options :Growth Options and Dividend (with Daily, Weekly, Fortnightly, Monthly, Quarterly and Half Yearly frequencies)(dividend payout*** and re-investment facility available)
Application Amount for freshSubscription :Rs.5,000 (plus in multiples of Re.1)
Min.Addl.Investment :Rs.1,000 (plus in multiples of Re.1)
Exit load for Redemption / Switch out:- Lumpsum & STP Option - Nil
##SIP :Monthly Frequency: Rs. 1,000/- and in multiple of Rs. 1/-Quarterly Frequency: Rs. 5,000/- and in multiple of Rs. 1/-
&&SWP :Rs. 500/- and in multiples of Rs. 1/-
STP/ Flex STP/ Value STP * :Daily Frequency: Rs. 250/- and in multiples of Rs. 50/-Weekly, Monthly and Quarterly Frequency: Rs. 1,000/- and in multiples of Rs. 1/-
Min.Redemption Amt. :500/- or all units where amount is below 500/-
• Top Ten Holdings&Please refer to annexure on “Pass Through Certificates Details”for complete details.@Short Term < 8 Years, Long Term > 8 Years.
^^ CRISIL has rated AA and company has put a withdrawal request for the CRISIL rating.
Returns of ICICI Prudential Ultra Short Term Plan - Growth Option as on - (IPUSTP)October 31, 2017
Average Maturity : 2.69 Years Modified Duration : 2.21 Years Yield To Maturity : 7.17%
ICICI Prudential Ultra Short Term Plan(An Open Ended Income Fund)
Entry load : Not Applicable
RiskometerThis Product is suitable for investors who are seeking*:
• Short term savings solution
• A Debt Fund that aims to generate regular income by investing in debt and money market instruments of very short maturities.
*Investors should consult their financial advisers if in doubt about whether the product is suitable for them.
Company/Issuer Rating % to NAV
Dividend History : Refer page no. from 127 to 135
SIP Returns : Refer page no. from 123 to 125
Total Expense Ratio @@ :
IPUSTP : 0.57% p. a.
IPUSTP Direct Plan : 0.25% p. a.
Investment Objective : Refer page no. from 136 to 139
Rating Profile
Notes:1. Different plans shall have different expense structure. The performance details provided herein are of ICICI Prudential Ultra Short Term Plan.2. The scheme is currently managed and Chandni Gupta. Mr. has been managing this fund since . Total Schemes managed by Rohan Maru Rohan Maru Jan 2015the Fund Manager . Refer annexure from page no. 99 for performance of other schemes currently managed by .is 5 (3 are jointly managed) Rohan MaruMr. Chandni Gupta has been managing this fund since Aug 2016. Total Schemes managed by the Fund Manager . Refer annexure from is 3 (3 are jointly managed)page no. 99 for performance of other schemes currently managed by Chandni Gupta. Mr. has been managing this fund since . Total Schemes managed by the Fund Manager . Refer annexure from Rahul Goswami Oct 2017 is 11 (9 are jointly managed)page no. 99 for performance of other schemes currently managed by . Rahul Goswami3. Date of inception $$ : 05-April-11 (IPUSTP - Growth Option).4. Past performance may or may not be sustained in future and the same may not necessarily provide the basis for comparison with other investment.5. Load is not considered for computation of returns.6. In case, the start/end date of the concerned period is a nonbusiness date (NBD), the NAV of the previous date is considered for computation of returns. The NAV per unit shown in the table is as on the start date of the said period
Scheme
1 Year T Bill (Additional Benchmark)
NAV (Rs.) Per Unit (as onOctober 31,2017 : 17.4352)
CAGR (%)
10.00
CRISIL Short Term Bond Fund Index (Benchmark)
Since inception
CurrentValue of
Investment of Rs. 10000
CAGR (%) Current Value of
Investment of Rs. 10000
1 Year 3 Year 5 Year
CAGR (%) Current Value of
Investment of Rs. 10000
CAGR (%) Current Value of
Investment of Rs. 10000
16.2288 13.5687 11.4484
Particulars
7.37 10743.37 8.71 12849.57 8.77 15229.38 8.82 17435.20
7.28 10734.55 8.68 12839.45 8.87 15295.87 8.84 17462.20
5.92 10596.61 7.30 12356.67 7.23 14179.16 7.22 15817.13
Government Securities 34.49%@
Short Term 33.64%• 08.48% Odisha SDL 2021 SOV 5.76%• 08.21% Haryana SDL 2022 SOV 4.69%• 08.08% GOI 2022 SOV 3.72%• 07.16% GOI 2023 SOV 3.53% 07.35% GOI 2024 SOV 2.81% 07.72% GOI 2025 SOV 2.22% 07.42% Maharashtra SDL 2022 SOV 2.14% 08.24% Tamil Nadu SDL 2020 SOV 1.33% 08.50% Haryana SDL 2021 SOV 1.08% 08.15% Rajasthan SDL 2021 SOV 1.05% 08.39% Rajasthan SDL 2022 SOV 0.93% 08.13% GOI 2022 SOV 0.64% 08.39% Andhra Pradesh SDL 2020 SOV 0.62% 08.49% Punjab SDL 2022 SOV 0.54% 08.44% Tamil Nadu SDL 2020 SOV 0.28% 08.76% Maharashtra SDL 2022 SOV 0.13% 08.53% Punjab SDL 2022 SOV 0.13% 08.05% Telangana SDL 2025 SOV 0.13% 08.03% Madhya Pradesh SDL 2025 SOV 0.13% 07.94% Telangana SDL 2024 SOV 0.12% 07.92% Madhya Pradesh SDL 2024 SOV 0.12% 07.89% Himachal Pradesh SDL 2025 SOV 0.12% 07.72% Tamil Nadu SDL 2023 SOV 0.12% 07.70% Telangana SDL 2023 SOV 0.12% 07.70% Tamil Nadu SDL 2023 SOV 0.12% 07.68% Madhya Pradesh SDL 2023 SOV 0.12% 07.74% Himachal Pradesh SDL 2024 SOV 0.12% 07.72% Tamil Nadu SDL 2024 SOV 0.12% 07.72% Tamil Nadu SDL 2025 SOV 0.12% 07.70% Tamil Nadu SDL 2024 SOV 0.12% 07.70% Tamil Nadu SDL 2025 SOV 0.12% 07.51% Himachal Pradesh SDL 2023 SOV 0.12% 08.11% Andhra Pradesh SDL 2020 SOV 0.08% 08.56% Maharashtra SDL 2021 SOV 0.04% 08.60% Maharashtra SDL 2021 SOV 0.04% 08.59% Gujarat SDL 2021 SOV 0.03%
@ Long Term 0.85% 06.79% GOI 2027 SOV 0.61% 07.72% Tamil Nadu SDL 2026 SOV 0.12% 07.70% Tamil Nadu SDL 2026 SOV 0.12% CPs and CDs 21.08%• HDFC Ltd. CARE A1+ 5.28% Bahadur Chand Investments Private Ltd. ICRA A1+ 2.93% NABARD CRISIL A1+ 2.74% Indiabulls Housing Finance Ltd. CRISIL A1+ 2.32% Tata Sons Ltd. CRISIL A1+ 2.28% Export-Import Bank Of India CRISIL A1+ 1.79% Adani Transmission Ltd. FITCH A1+ 1.79%
Adani Ports and Special Economic Zone Ltd. ICRA A1+ 1.37% Barclays Investments & Loans (India) Ltd. CRISIL A1+ 0.58% Corporate Securities 41.48%• LIC Housing Finance Ltd. CRISIL AAA 9.80%• HDFC Ltd. CRISIL AAA 5.76%• SVL Ltd. ICRA AA 4.07%• Vodafone Mobile Services Ltd.^^ FITCH AA+ 3.79%• Reliance Jio Infocomm Ltd. CRISIL AAA 3.53% Power Finance Corporation Ltd. CRISIL AAA 3.49% Axis Bank Ltd. CRISIL AAA 2.56% State Bank Of India CRISIL AA+ 2.06% ONGC Mangalore Petro Chemicals Ltd. FITCH AAA 1.52% Mahindra Vehicle Manufacturers Ltd. ICRA AAA 1.28% Kotak Mahindra Prime Ltd. CRISIL AAA 1.20% Tube Investments of India Ltd. CRISIL AA 0.62% SP Jammu Udhampur Highway Ltd. (NHAI ICRA AAA 0.55% Annuity)
Sun Pharma Laboratories Ltd. ICRA AAA 0.51% ICICI Home Finance Company Ltd. ICRA AAA 0.43% Rural Electrification Corporation Ltd. CRISIL AAA 0.15% NABARD CRISIL AAA 0.10% Mahindra & Mahindra Financial Services Ltd. FITCH AAA 0.06% Power Grid Corporation Of India Ltd. CRISIL AAA 0.03%
& Pass Through Certificates 0.33% Sansar Trust September 2016 V (Originator is CRISIL AAA(SO) 0.33% Shriram Transport Finance Company Ltd.) CBLO & Net Current Assets 2.62% Total Net Assets 100.00%
52.36%
10.53%
34.49%
2.62%
0% 10% 20% 30% 40% 50% 60%
AAA and Equivalent
AA and Equivalent
Sovereign Securities
CBLO & Current Assets
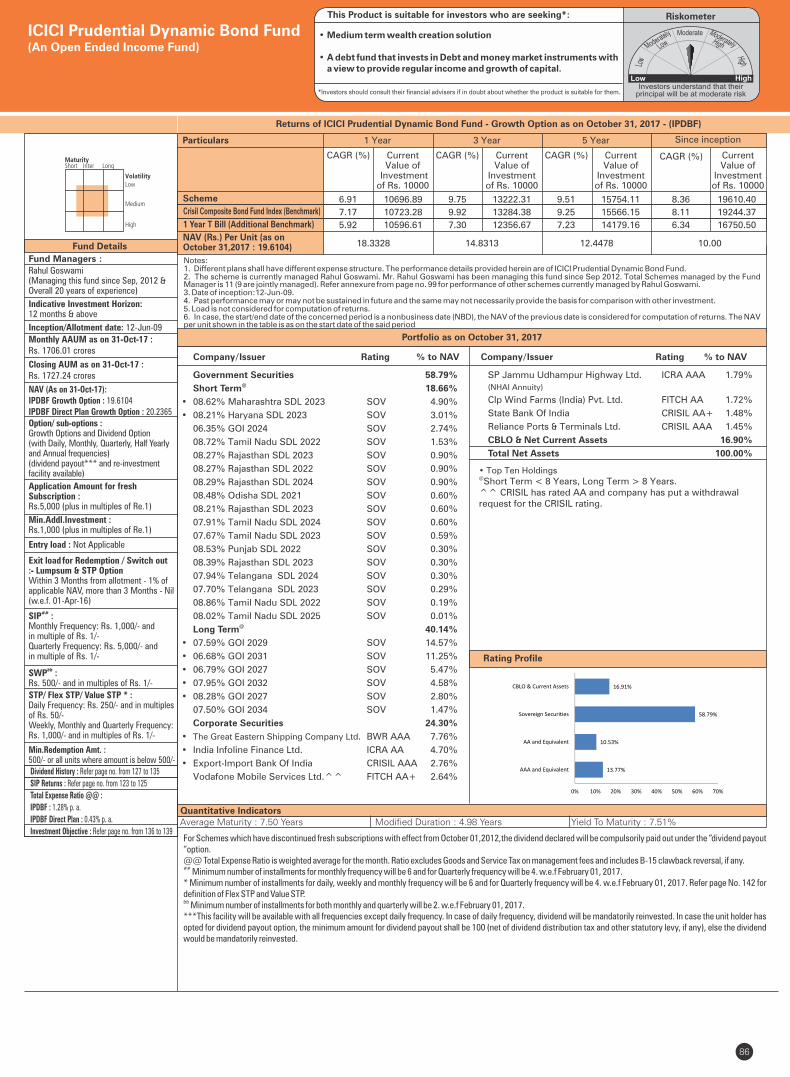
86
Fund Details
Rating Profile
Quantitative Indicators
Portfolio as on October 31, 2017
• Top Ten Holdings@Short Term < 8 Years, Long Term > 8 Years.^^ CRISIL has rated AA and company has put a withdrawal request for the CRISIL rating.
Company/Issuer % to NAVRating
Fund Managers :
Rahul Goswami (Managing this fund since Sep, 2012 & Overall 20 years of experience)
Indicative Investment Horizon:12 months & above
Inception/Allotment date: 12-Jun-09
Monthly AAUM as on 31-Oct-17 : Rs. 1706.01 crores
Closing AUM as on 31-Oct-17 : Rs. 1727.24 crores
NAV (As on 31-Oct-17):IPDBF Growth Option : 19.6104IPDBF Direct Plan Growth Option : 20.2365Option/ sub-options :Growth Options and Dividend Option(with Daily, Monthly, Quarterly, Half Yearly and Annual frequencies)(dividend payout*** and re-investment facility available)
Application Amount for freshSubscription :Rs.5,000 (plus in multiples of Re.1)
Min.Addl.Investment :Rs.1,000 (plus in multiples of Re.1)
Exit load for Redemption / Switch out:- Lumpsum & STP OptionWithin 3 Months from allotment - 1% ofapplicable NAV, more than 3 Months - Nil (w.e.f. 01-Apr-16)
##SIP :Monthly Frequency: Rs. 1,000/- and in multiple of Rs. 1/-Quarterly Frequency: Rs. 5,000/- and in multiple of Rs. 1/-
&&SWP :Rs. 500/- and in multiples of Rs. 1/-
STP/ Flex STP/ Value STP * :Daily Frequency: Rs. 250/- and in multiples of Rs. 50/-Weekly, Monthly and Quarterly Frequency: Rs. 1,000/- and in multiples of Rs. 1/-
Min.Redemption Amt. :500/- or all units where amount is below 500/-
For Schemes which have discontinued fresh subscriptions with effect from October 01,2012,the dividend declared will be compulsorily paid out under the “dividend payout “option.
@@ Total Expense Ratio is weighted average for the month. Ratio excludes Goods and Service Tax on management fees and includes B-15 clawback reversal, if any.## Minimum number of installments for monthly frequency will be 6 and for Quarterly frequency will be 4. w.e.f February 01, 2017.* Minimum number of installments for daily, weekly and monthly frequency will be 6 and for Quarterly frequency will be 4. w.e.f February 01, 2017. Refer page No. 142 for definition of Flex STP and Value STP.&& Minimum number of installments for both monthly and quarterly will be 2. w.e.f February 01, 2017.***This facility will be available with all frequencies except daily frequency. In case of daily frequency, dividend will be mandatorily reinvested. In case the unit holder has opted for dividend payout option, the minimum amount for dividend payout shall be 100 (net of dividend distribution tax and other statutory levy, if any), else the dividend would be mandatorily reinvested.
Government Securities 58.79%@ Short Term 18.66%
• 08.62% Maharashtra SDL 2023 SOV 4.90%
• 08.21% Haryana SDL 2023 SOV 3.01%
06.35% GOI 2024 SOV 2.74%
08.72% Tamil Nadu SDL 2022 SOV 1.53%
08.27% Rajasthan SDL 2023 SOV 0.90%
08.27% Rajasthan SDL 2022 SOV 0.90%
08.29% Rajasthan SDL 2024 SOV 0.90%
08.48% Odisha SDL 2021 SOV 0.60%
08.21% Rajasthan SDL 2023 SOV 0.60%
07.91% Tamil Nadu SDL 2024 SOV 0.60%
07.67% Tamil Nadu SDL 2023 SOV 0.59%
08.53% Punjab SDL 2022 SOV 0.30%
08.39% Rajasthan SDL 2023 SOV 0.30%
07.94% Telangana SDL 2024 SOV 0.30%
07.70% Telangana SDL 2023 SOV 0.29%
08.86% Tamil Nadu SDL 2022 SOV 0.19%
08.02% Tamil Nadu SDL 2025 SOV 0.01%@ Long Term 40.14%
• 07.59% GOI 2029 SOV 14.57%
• 06.68% GOI 2031 SOV 11.25%
• 06.79% GOI 2027 SOV 5.47%
• 07.95% GOI 2032 SOV 4.58%
• 08.28% GOI 2027 SOV 2.80%
07.50% GOI 2034 SOV 1.47%
Corporate Securities 24.30%
• The Great Eastern Shipping Company Ltd. BWR AAA 7.76%
• India Infoline Finance Ltd. ICRA AA 4.70%
• Export-Import Bank Of India CRISIL AAA 2.76%
Vodafone Mobile Services Ltd.^^ FITCH AA+ 2.64%
Returns of ICICI Prudential Dynamic Bond Fund - Growth Option as on - (IPDBF)October 31, 2017
Average Maturity : 7.50 Years Modified Duration : 4.98 Years Yield To Maturity : 7.51%
ICICI Prudential Dynamic Bond Fund(An Open Ended Income Fund)
Entry load : Not Applicable
RiskometerThis Product is suitable for investors who are seeking*:
• Medium term wealth creation solution
• A debt fund that invests in Debt and money market instruments with a view to provide regular income and growth of capital.
*Investors should consult their financial advisers if in doubt about whether the product is suitable for them.
Dividend History : Refer page no. from 127 to 135
SIP Returns : Refer page no. from 123 to 125
Total Expense Ratio @@ :
IPDBF : 1.28% p. a.
IPDBF Direct Plan : 0.43% p. a.
Investment Objective : Refer page no. from 136 to 139
Company/Issuer % to NAVRating
SP Jammu Udhampur Highway Ltd. ICRA AAA 1.79%
(NHAI Annuity)
Clp Wind Farms (India) Pvt. Ltd. FITCH AA 1.72%
State Bank Of India CRISIL AA+ 1.48%
Reliance Ports & Terminals Ltd. CRISIL AAA 1.45%
CBLO & Net Current Assets 16.90%
Total Net Assets 100.00%
Notes:1. Different plans shall have different expense structure. The performance details provided herein are of ICICI Prudential Dynamic Bond Fund.2. The scheme is currently managed . Mr. has been managing this fund since . Total Schemes managed by the Fund Rahul Goswami Rahul Goswami Sep 2012Manager . Refer annexure from page no. 99 for performance of other schemes currently managed by .is 11 (9 are jointly managed) Rahul Goswami3. Date of inception:12-Jun-09.4. Past performance may or may not be sustained in future and the same may not necessarily provide the basis for comparison with other investment.5. Load is not considered for computation of returns.6. In case, the start/end date of the concerned period is a nonbusiness date (NBD), the NAV of the previous date is considered for computation of returns. The NAV per unit shown in the table is as on the start date of the said period
Scheme
1 Year T Bill (Additional Benchmark)
NAV (Rs.) Per Unit (as on October 31,2017 : 19.6104)
CAGR (%)
10.00
Crisil Composite Bond Fund Index (Benchmark)
Since inception
CurrentValue of
Investment of Rs. 10000
CAGR (%) Current Value of
Investment of Rs. 10000
1 Year 3 Year 5 Year
CAGR (%) Current Value of
Investment of Rs. 10000
CAGR (%) Current Value of
Investment of Rs. 10000
18.3328 14.8313 12.4478
Particulars
6.91 10696.89 9.75 13222.31 9.51 15754.11 8.36 19610.40
7.17 10723.28 9.92 13284.38 9.25 15566.15 8.11 19244.37
5.92 10596.61 7.30 12356.67 7.23 14179.16 6.34 16750.50
13.77%
10.53%
58.79%
16.91%
0% 10% 20% 30% 40% 50% 60% 70%
AAA and Equivalent
AA and Equivalent
Sovereign Securities
CBLO & Current Assets
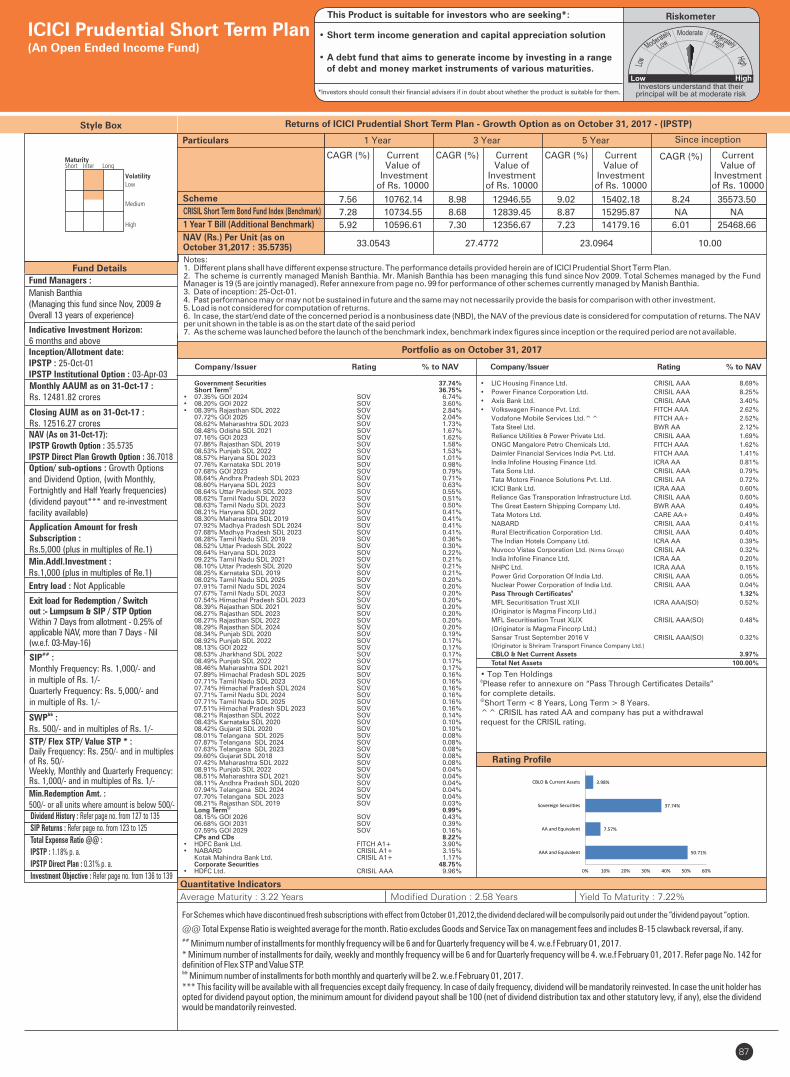
87
Fund Details
Portfolio as on October 31, 2017
Rating Profile
Quantitative Indicators
Style Box
Company/Issuer Rating % to NAV
Fund Managers :
Manish Banthia (Managing this fund since Nov, 2009 & Overall 13 years of experience)
Indicative Investment Horizon:6 months and aboveInception/Allotment date:IPSTP : 25-Oct-01IPSTP Institutional Option : 03-Apr-03Monthly AAUM as on 31-Oct-17 :Rs. 12481.82 crores
Closing AUM as on 31-Oct-17 : Rs. 12516.27 croresNAV (As on 31-Oct-17):IPSTP Growth Option : 35.5735IPSTP Direct Plan Growth Option : 36.7018Option/ sub-options : Growth Optionsand Dividend Option, (with Monthly, Fortnightly and Half Yearly frequencies)(dividend payout*** and re-investment facility available)
Application Amount for freshSubscription :Rs.5,000 (plus in multiples of Re.1)
Min.Addl.Investment :Rs.1,000 (plus in multiples of Re.1)
Entry load : Not Applicable
Exit load for Redemption / Switchout :- Lumpsum & SIP / STP OptionWithin 7 Days from allotment - 0.25% ofapplicable NAV, more than 7 Days - Nil(w.e.f. 03-May-16)
##SIP :Monthly Frequency: Rs. 1,000/- and in multiple of Rs. 1/-Quarterly Frequency: Rs. 5,000/- and in multiple of Rs. 1/-
&&SWP :Rs. 500/- and in multiples of Rs. 1/-
STP/ Flex STP/ Value STP * :Daily Frequency: Rs. 250/- and in multiples of Rs. 50/-Weekly, Monthly and Quarterly Frequency: Rs. 1,000/- and in multiples of Rs. 1/-
Min.Redemption Amt. :500/- or all units where amount is below 500/-
For Schemes which have discontinued fresh subscriptions with effect from October 01,2012,the dividend declared will be compulsorily paid out under the “dividend payout “option.
@@ Total Expense Ratio is weighted average for the month. Ratio excludes Goods and Service Tax on management fees and includes B-15 clawback reversal, if any.## Minimum number of installments for monthly frequency will be 6 and for Quarterly frequency will be 4. w.e.f February 01, 2017.* Minimum number of installments for daily, weekly and monthly frequency will be 6 and for Quarterly frequency will be 4. w.e.f February 01, 2017. Refer page No. 142 for definition of Flex STP and Value STP.&& Minimum number of installments for both monthly and quarterly will be 2. w.e.f February 01, 2017.*** This facility will be available with all frequencies except daily frequency. In case of daily frequency, dividend will be mandatorily reinvested. In case the unit holder has opted for dividend payout option, the minimum amount for dividend payout shall be 100 (net of dividend distribution tax and other statutory levy, if any), else the dividend would be mandatorily reinvested.
• Top Ten Holdings&Please refer to annexure on “Pass Through Certificates Details” for complete details.@Short Term < 8 Years, Long Term > 8 Years.
^^ CRISIL has rated AA and company has put a withdrawal request for the CRISIL rating.
Returns of ICICI Prudential Short Term Plan - Growth Option as on - (IPSTP)October 31, 2017
Average Maturity : 3.22 Years Modified Duration : 2.58 Years Yield To Maturity : 7.22%
Company/Issuer Rating % to NAV
Government Securities 37.74%@
Short Term 36.75%• 07.35% GOI 2024 SOV 6.74%• 08.20% GOI 2022 SOV 3.60%• 08.39% Rajasthan SDL 2022 SOV 2.84% 07.72% GOI 2025 SOV 2.04% 08.62% Maharashtra SDL 2023 SOV 1.73% 08.48% Odisha SDL 2021 SOV 1.67% 07.16% GOI 2023 SOV 1.62% 07.86% Rajasthan SDL 2019 SOV 1.58% 08.53% Punjab SDL 2022 SOV 1.53% 08.57% Haryana SDL 2023 SOV 1.01% 07.76% Karnataka SDL 2019 SOV 0.98% 07.68% GOI 2023 SOV 0.79% 08.64% Andhra Pradesh SDL 2023 SOV 0.71% 08.60% Haryana SDL 2023 SOV 0.63% 08.64% Uttar Pradesh SDL 2023 SOV 0.55% 08.62% Tamil Nadu SDL 2023 SOV 0.51% 08.63% Tamil Nadu SDL 2023 SOV 0.50% 08.21% Haryana SDL 2022 SOV 0.41% 08.30% Maharashtra SDL 2019 SOV 0.41% 07.92% Madhya Pradesh SDL 2024 SOV 0.41% 07.68% Madhya Pradesh SDL 2023 SOV 0.41% 08.28% Tamil Nadu SDL 2019 SOV 0.36% 08.52% Uttar Pradesh SDL 2022 SOV 0.30% 08.64% Haryana SDL 2023 SOV 0.22% 09.22% Tamil Nadu SDL 2021 SOV 0.21% 08.10% Uttar Pradesh SDL 2020 SOV 0.21% 08.25% Karnataka SDL 2019 SOV 0.21% 08.02% Tamil Nadu SDL 2025 SOV 0.20% 07.91% Tamil Nadu SDL 2024 SOV 0.20% 07.67% Tamil Nadu SDL 2023 SOV 0.20% 07.54% Himachal Pradesh SDL 2023 SOV 0.20% 08.39% Rajasthan SDL 2021 SOV 0.20% 08.27% Rajasthan SDL 2023 SOV 0.20% 08.27% Rajasthan SDL 2022 SOV 0.20% 08.29% Rajasthan SDL 2024 SOV 0.20% 08.34% Punjab SDL 2020 SOV 0.19% 08.92% Punjab SDL 2022 SOV 0.17% 08.13% GOI 2022 SOV 0.17% 08.53% Jharkhand SDL 2022 SOV 0.17% 08.49% Punjab SDL 2022 SOV 0.17% 08.46% Maharashtra SDL 2021 SOV 0.17% 07.89% Himachal Pradesh SDL 2025 SOV 0.16% 07.71% Tamil Nadu SDL 2023 SOV 0.16% 07.74% Himachal Pradesh SDL 2024 SOV 0.16% 07.71% Tamil Nadu SDL 2024 SOV 0.16% 07.71% Tamil Nadu SDL 2025 SOV 0.16% 07.51% Himachal Pradesh SDL 2023 SOV 0.16% 08.21% Rajasthan SDL 2022 SOV 0.14% 08.43% Karnataka SDL 2020 SOV 0.10% 08.42% Gujarat SDL 2020 SOV 0.10% 08.01% Telangana SDL 2025 SOV 0.08% 07.87% Telangana SDL 2024 SOV 0.08% 07.63% Telangana SDL 2023 SOV 0.08% 09.60% Gujarat SDL 2018 SOV 0.08% 07.42% Maharashtra SDL 2022 SOV 0.08% 08.91% Punjab SDL 2022 SOV 0.04% 08.51% Maharashtra SDL 2021 SOV 0.04% 08.11% Andhra Pradesh SDL 2020 SOV 0.04% 07.94% Telangana SDL 2024 SOV 0.04% 07.70% Telangana SDL 2023 SOV 0.04% 08.21% Rajasthan SDL 2019 SOV 0.03%
@ Long Term 0.99% 08.15% GOI 2026 SOV 0.43% 06.68% GOI 2031 SOV 0.39% 07.59% GOI 2029 SOV 0.16% CPs and CDs 8.22%• HDFC Bank Ltd. FITCH A1+ 3.90%• NABARD CRISIL A1+ 3.15% Kotak Mahindra Bank Ltd. CRISIL A1+ 1.17% Corporate Securities 48.75%• HDFC Ltd. CRISIL AAA 9.96%
• LIC Housing Finance Ltd. CRISIL AAA 8.69%
• Power Finance Corporation Ltd. CRISIL AAA 8.25%
• Axis Bank Ltd. CRISIL AAA 3.40%
• Volkswagen Finance Pvt. Ltd. FITCH AAA 2.62%
Vodafone Mobile Services Ltd.^^ FITCH AA+ 2.52%
Tata Steel Ltd. BWR AA 2.12%
Reliance Utilities & Power Private Ltd. CRISIL AAA 1.69%
ONGC Mangalore Petro Chemicals Ltd. FITCH AAA 1.62%
Daimler Financial Services India Pvt. Ltd. FITCH AAA 1.41%
India Infoline Housing Finance Ltd. ICRA AA 0.81%
Tata Sons Ltd. CRISIL AAA 0.79%
Tata Motors Finance Solutions Pvt. Ltd. CRISIL AA 0.72%
ICICI Bank Ltd. ICRA AAA 0.60%
Reliance Gas Transporation Infrastructure Ltd. CRISIL AAA 0.60%
The Great Eastern Shipping Company Ltd. BWR AAA 0.49%
Tata Motors Ltd. CARE AA+ 0.49%
NABARD CRISIL AAA 0.41%
Rural Electrification Corporation Ltd. CRISIL AAA 0.40%
The Indian Hotels Company Ltd. ICRA AA 0.39%
Nuvoco Vistas Corporation Ltd. (Nirma Group) CRISIL AA 0.32%
India Infoline Finance Ltd. ICRA AA 0.20%
NHPC Ltd. ICRA AAA 0.15%
Power Grid Corporation Of India Ltd. CRISIL AAA 0.05%
Nuclear Power Corporation of India Ltd. CRISIL AAA 0.04%& Pass Through Certificates 1.32%
MFL Securitisation Trust XLII ICRA AAA(SO) 0.52%
(Originator is Magma Fincorp Ltd.)
MFL Securitisation Trust XLIX CRISIL AAA(SO) 0.48%
(Originator is Magma Fincorp Ltd.)
Sansar Trust September 2016 V CRISIL AAA(SO) 0.32% (Originator is Shriram Transport Finance Company Ltd.)
CBLO & Net Current Assets 3.97%
Total Net Assets 100.00%
ICICI Prudential Short Term Plan(An Open Ended Income Fund)
RiskometerThis Product is suitable for investors who are seeking*:
• Short term income generation and capital appreciation solution
• A debt fund that aims to generate income by investing in a range of debt and money market instruments of various maturities.
*Investors should consult their financial advisers if in doubt about whether the product is suitable for them.
Dividend History : Refer page no. from 127 to 135
SIP Returns : Refer page no. from 123 to 125
Total Expense Ratio @@ :
: 1.18% p. a.IPSTP
IPSTP Direct Plan : 0.31% p. a.
Investment Objective : Refer page no. from 136 to 139
Notes:1. Different plans shall have different expense structure. The performance details provided herein are of ICICI Prudential Short Term Plan.2. The scheme is currently managed Manish Banthia. Mr. Manish Banthia has been managing this fund since . Total Schemes managed by the Fund Nov 2009Manager . Refer annexure from page no. 99 for performance of other schemes currently managed by Manish Banthia. is 19 (5 are jointly managed) 3. Date of inception: 25-Oct-01.4. Past performance may or may not be sustained in future and the same may not necessarily provide the basis for comparison with other investment.5. Load is not considered for computation of returns.6. In case, the start/end date of the concerned period is a nonbusiness date (NBD), the NAV of the previous date is considered for computation of returns. The NAV per unit shown in the table is as on the start date of the said period7. As the scheme was launched before the launch of the benchmark index, benchmark index figures since inception or the required period are not available.
Scheme
1 Year T Bill (Additional Benchmark)
NAV (Rs.) Per Unit (as on October 31,2017 : 35.5735)
CAGR (%)
10.00
CRISIL Short Term Bond Fund Index (Benchmark)
Since inception
CurrentValue of
Investment of Rs. 10000
CAGR (%) Current Value of
Investment of Rs. 10000
1 Year 3 Year 5 Year
CAGR (%) Current Value of
Investment of Rs. 10000
CAGR (%) Current Value of
Investment of Rs. 10000
33.0543 27.4772 23.0964
Particulars
7.56 10762.14 8.98 12946.55 9.02 15402.18 8.24 35573.50
7.28 10734.55 8.68 12839.45 8.87 15295.87 NA NA
5.92 10596.61 7.30 12356.67 7.23 14179.16 6.01 25468.66
50.71%
7.57%
37.74%
3.98%
0% 10% 20% 30% 40% 50% 60%
AAA and Equivalent
AA and Equivalent
Sovereign Securities
CBLO & Current Assets
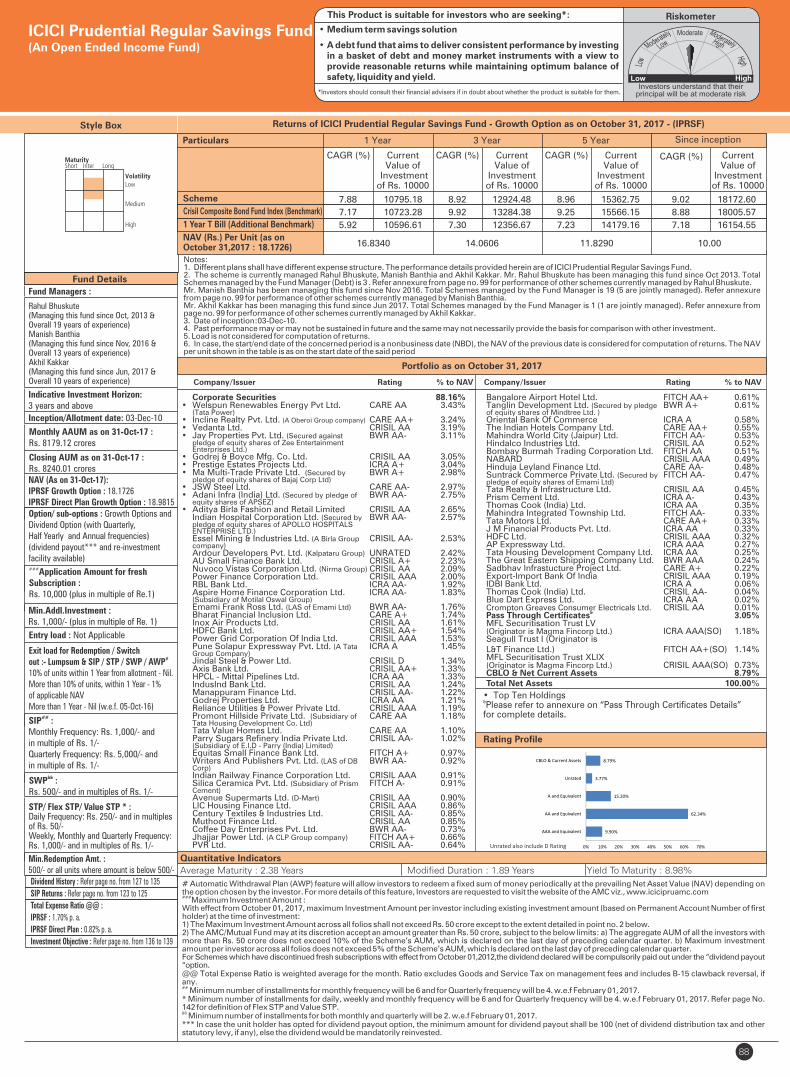
88
Fund Details
Portfolio as on October 31, 2017
Quantitative Indicators
Company/Issuer Rating % to NAV
Style Box
Fund Managers :
Rahul Bhuskute (Managing this fund since Oct, 2013 & Overall 19 years of experience)Manish Banthia(Managing this fund since Nov, 2016 & Overall 13 years of experience)Akhil Kakkar (Managing this fund since Jun, 2017 & Overall 10 years of experience)
Indicative Investment Horizon:3 years and above
Inception/Allotment date: 03-Dec-10
Monthly AAUM as on 31-Oct-17 : Rs. 8179.12 crores
Closing AUM as on 31-Oct-17 : Rs. 8240.01 croresNAV (As on 31-Oct-17):IPRSF Growth Option : 18.1726IPRSF Direct Plan Growth Option : 18.9815Option/ sub-options : Growth Options and Dividend Option (with Quarterly, Half Yearly and Annual frequencies)(dividend payout*** and re-investment facility available)###Application Amount for freshSubscription :Rs. 10,000 (plus in multiple of Re.1)
Min.Addl.Investment :Rs. 1,000/- (plus in multiple of Re. 1)
Exit load for Redemption / Switchout :- Lumpsum & SIP / STP / SWP #/ AWP10% of units within 1 Year from allotment - Nil.More than 10% of units, within 1 Year - 1% of applicable NAVMore than 1 Year - Nil (w.e.f. 05-Oct-16)
##SIP :Monthly Frequency: Rs. 1,000/- and in multiple of Rs. 1/-Quarterly Frequency: Rs. 5,000/- and in multiple of Rs. 1/-
&&SWP :Rs. 500/- and in multiples of Rs. 1/-
STP/ Flex STP/ Value STP * :Daily Frequency: Rs. 250/- and in multiples of Rs. 50/-Weekly, Monthly and Quarterly Frequency: Rs. 1,000/- and in multiples of Rs. 1/-
Min.Redemption Amt. :500/- or all units where amount is below 500/-
Returns of ICICI Prudential Regular Savings Fund - Growth Option as on - (IPRSF) October 31, 2017
Average Maturity : 2.38 Years Modified Duration : 1.89 Years Yield To Maturity : 8.98%
ICICI Prudential Regular Savings Fund(An Open Ended Income Fund)
# Automatic Withdrawal Plan (AWP) feature will allow investors to redeem a fixed sum of money periodically at the prevailing Net Asset Value (NAV) depending on the option chosen by the investor. For more details of this feature, Investors are requested to visit the website of the AMC viz., www.icicipruamc.com###Maximum Investment Amount :With effect from October 01, 2017, maximum Investment Amount per investor including existing investment amount (based on Permanent Account Number of first holder) at the time of investment:1) The Maximum Investment Amount across all folios shall not exceed Rs. 50 crore except to the extent detailed in point no. 2 below.2) The AMC/Mutual Fund may at its discretion accept an amount greater than Rs. 50 crore, subject to the below limits: a) The aggregate AUM of all the investors with more than Rs. 50 crore does not exceed 10% of the Scheme’s AUM, which is declared on the last day of preceding calendar quarter. b) Maximum investment amount per investor across all folios does not exceed 5% of the Scheme’s AUM, which is declared on the last day of preceding calendar quarter.For Schemes which have discontinued fresh subscriptions with effect from October 01,2012,the dividend declared will be compulsorily paid out under the “dividend payout “option.@@ Total Expense Ratio is weighted average for the month. Ratio excludes Goods and Service Tax on management fees and includes B-15 clawback reversal, if any.## Minimum number of installments for monthly frequency will be 6 and for Quarterly frequency will be 4. w.e.f February 01, 2017.* Minimum number of installments for daily, weekly and monthly frequency will be 6 and for Quarterly frequency will be 4. w.e.f February 01, 2017. Refer page No. 142 for definition of Flex STP and Value STP.&& Minimum number of installments for both monthly and quarterly will be 2. w.e.f February 01, 2017.*** In case the unit holder has opted for dividend payout option, the minimum amount for dividend payout shall be 100 (net of dividend distribution tax and other statutory levy, if any), else the dividend would be mandatorily reinvested.
• Top Ten Holdings&Please refer to annexure on “Pass Through Certificates Details” for complete details.
Company/Issuer Rating % to NAV
Entry load : Not Applicable
RiskometerThis Product is suitable for investors who are seeking*:
• Medium term savings solution
• A debt fund that aims to deliver consistent performance by investing in a basket of debt and money market instruments with a view to provide reasonable returns while maintaining optimum balance of safety, liquidity and yield.
*Investors should consult their financial advisers if in doubt about whether the product is suitable for them.
Rating Profile
Unrated also include D Rating
Dividend History : Refer page no. from 127 to 135
SIP Returns : Refer page no. from 123 to 125
Total Expense Ratio @@ :
IPRSF : 1.70% p. a.
IPRSF Direct Plan : 0.82% p. a.
Investment Objective : Refer page no. from 136 to 139
Notes:1. Different plans shall have different expense structure. The performance details provided herein are of ICICI Prudential Regular Savings Fund.2. The scheme is currently managed Manish Banthia and Akhil Kakkar. Mr. has been managing this fund since 3. Total Rahul Bhuskute, Rahul Bhuskute Oct 201Schemes managed by the Fund Manager . Refer annexure from page no. 99 for performance of other schemes currently managed by .(Debt) is 3 Rahul BhuskuteMr. Manish Banthia has been managing this fund since . Total Schemes managed by the Fund Manager . Refer annexure Nov 2016 is 19 (5 are jointly managed)from page no. 99 for performance of other schemes currently managed by Manish Banthia. Mr. Akhil Kakkar has been managing this fund since 7. Total Schemes managed by the Fund Manager . Refer annexure from Jun 201 is 1 (1 are jointly managed)page no. 99 for performance of other schemes currently managed by Akhil Kakkar. 3. Date of inception:03-Dec-10.4. Past performance may or may not be sustained in future and the same may not necessarily provide the basis for comparison with other investment.5. Load is not considered for computation of returns.6. In case, the start/end date of the concerned period is a nonbusiness date (NBD), the NAV of the previous date is considered for computation of returns. The NAV per unit shown in the table is as on the start date of the said period
Scheme
1 Year T Bill (Additional Benchmark)
NAV (Rs.) Per Unit (as on October 31,2017 : 18.1726)
CAGR (%)
10.00
Crisil Composite Bond Fund Index (Benchmark)
Since inception
CurrentValue of
Investment of Rs. 10000
CAGR (%) Current Value of
Investment of Rs. 10000
1 Year 3 Year 5 Year
CAGR (%) Current Value of
Investment of Rs. 10000
CAGR (%) Current Value of
Investment of Rs. 10000
16.8340 14.0606 11.8290
Particulars
7.88 10795.18 8.92 12924.48 8.96 15362.75 9.02 18172.60
7.17 10723.28 9.92 13284.38 9.25 15566.15 8.88 18005.57
5.92 10596.61 7.30 12356.67 7.23 14179.16 7.18 16154.55
9.90%
62.34%
15.20%
3.77%
8.79%
0% 10% 20% 30% 40% 50% 60% 70%
AAA and Equivalent
AA and Equivalent
A and Equivalent
Unrated
CBLO & Current Assets
Corporate Securities 88.16%• Welspun Renewables Energy Pvt Ltd. CARE AA 3.43% (Tata Power)• Incline Realty Pvt. Ltd. (A Oberoi Group company) CARE AA+ 3.24%• Vedanta Ltd. CRISIL AA 3.19%• Jay Properties Pvt. Ltd. (Secured against BWR AA- 3.11% pledge of equity shares of Zee Entertainment Enterprises Ltd.) • Godrej & Boyce Mfg. Co. Ltd. CRISIL AA 3.05%• Prestige Estates Projects Ltd. ICRA A+ 3.04%• Ma Multi-Trade Private Ltd. (Secured by BWR A+ 2.98% pledge of equity shares of Bajaj Corp Ltd)• JSW Steel Ltd. CARE AA- 2.97%• Adani Infra (India) Ltd. (Secured by pledge of BWR AA- 2.75% equity shares of APSEZ)• Aditya Birla Fashion and Retail Limited CRISIL AA 2.65% Indian Hospital Corporation Ltd. (Secured by BWR AA- 2.57% pledge of equity shares of APOLLO HOSPITALS ENTERPRISE LTD.) Essel Mining & Industries Ltd. (A Birla Group CRISIL AA- 2.53% company) Ardour Developers Pvt. Ltd. (Kalpataru Group) UNRATED 2.42% AU Small Finance Bank Ltd. CRISIL A+ 2.23% Nuvoco Vistas Corporation Ltd. (Nirma Group) CRISIL AA 2.09% Power Finance Corporation Ltd. CRISIL AAA 2.00% RBL Bank Ltd. ICRA AA- 1.92% Aspire Home Finance Corporation Ltd. ICRA AA- 1.83% (Subsidiary of Motilal Oswal Group) Emami Frank Ross Ltd. (LAS of Emami Ltd) BWR AA- 1.76% Bharat Financial Inclusion Ltd. CARE A+ 1.74% Inox Air Products Ltd. CRISIL AA 1.61% HDFC Bank Ltd. CRISIL AA+ 1.54% Power Grid Corporation Of India Ltd. CRISIL AAA 1.53% Pune Solapur Expressway Pvt. Ltd. (A Tata ICRA A 1.45% Group Company) Jindal Steel & Power Ltd. CRISIL D 1.34% Axis Bank Ltd. CRISIL AA+ 1.33% HPCL - Mittal Pipelines Ltd. ICRA AA 1.33% IndusInd Bank Ltd. CRISIL AA 1.24% Manappuram Finance Ltd. CRISIL AA- 1.22% Godrej Properties Ltd. ICRA AA 1.21% Reliance Utilities & Power Private Ltd. CRISIL AAA 1.19% Promont Hillside Private Ltd. (Subsidiary of CARE AA 1.18% Tata Housing Development Co. Ltd) Tata Value Homes Ltd. CARE AA 1.10% Parry Sugars Refinery India Private Ltd. CRISIL AA- 1.02% (Subsidiary of E.I.D - Parry (India) Limited) Equitas Small Finance Bank Ltd. FITCH A+ 0.97% Writers And Publishers Pvt. Ltd. (LAS of DB BWR AA- 0.92% Corp) Indian Railway Finance Corporation Ltd. CRISIL AAA 0.91% Silica Ceramica Pvt. Ltd. (Subsidiary of Prism FITCH A- 0.91% Cement) Avenue Supermarts Ltd. (D-Mart) CRISIL AA 0.90% LIC Housing Finance Ltd. CRISIL AAA 0.86% Century Textiles & Industries Ltd. CRISIL AA- 0.85% Muthoot Finance Ltd. CRISIL AA 0.85% Coffee Day Enterprises Pvt. Ltd. BWR AA- 0.73% Jhajjar Power Ltd. (A CLP Group company) FITCH AA+ 0.66% PVR Ltd. CRISIL AA- 0.64%
Bangalore Airport Hotel Ltd. FITCH AA+ 0.61% Tanglin Development Ltd. (Secured by pledge BWR A+ 0.61% of equity shares of Mindtree Ltd. ) Oriental Bank Of Commerce ICRA A 0.58% The Indian Hotels Company Ltd. CARE AA+ 0.55% Mahindra World City (Jaipur) Ltd. FITCH AA- 0.53% Hindalco Industries Ltd. CRISIL AA 0.52% Bombay Burmah Trading Corporation Ltd. FITCH AA 0.51% NABARD CRISIL AAA 0.49% Hinduja Leyland Finance Ltd. CARE AA- 0.48% Suntrack Commerce Private Ltd. (Secured by FITCH AA- 0.47% pledge of equity shares of Emami Ltd) Tata Realty & Infrastructure Ltd. CRISIL AA 0.45% Prism Cement Ltd. ICRA A- 0.43% Thomas Cook (India) Ltd. ICRA AA 0.35% Mahindra Integrated Township Ltd. FITCH AA- 0.33% Tata Motors Ltd. CARE AA+ 0.33% J M Financial Products Pvt. Ltd. ICRA AA 0.33% HDFC Ltd. CRISIL AAA 0.32% AP Expressway Ltd. ICRA AAA 0.27% Tata Housing Development Company Ltd. ICRA AA 0.25% The Great Eastern Shipping Company Ltd. BWR AAA 0.24% Sadbhav Infrastucture Project Ltd. CARE A+ 0.22% Export-Import Bank Of India CRISIL AAA 0.19% IDBI Bank Ltd. ICRA A 0.06% Thomas Cook (India) Ltd. CRISIL AA- 0.04% Blue Dart Express Ltd. ICRA AA 0.02% Crompton Greaves Consumer Electricals Ltd. CRISIL AA 0.01%
& Pass Through Certificates 3.05% MFL Securitisation Trust LV (Originator is Magma Fincorp Ltd.) ICRA AAA(SO) 1.18% Seagull Trust I (Originator is L&T Finance Ltd.) FITCH AA+(SO) 1.14% MFL Securitisation Trust XLIX (Originator is Magma Fincorp Ltd.) CRISIL AAA(SO) 0.73% CBLO & Net Current Assets 8.79% Total Net Assets 100.00%
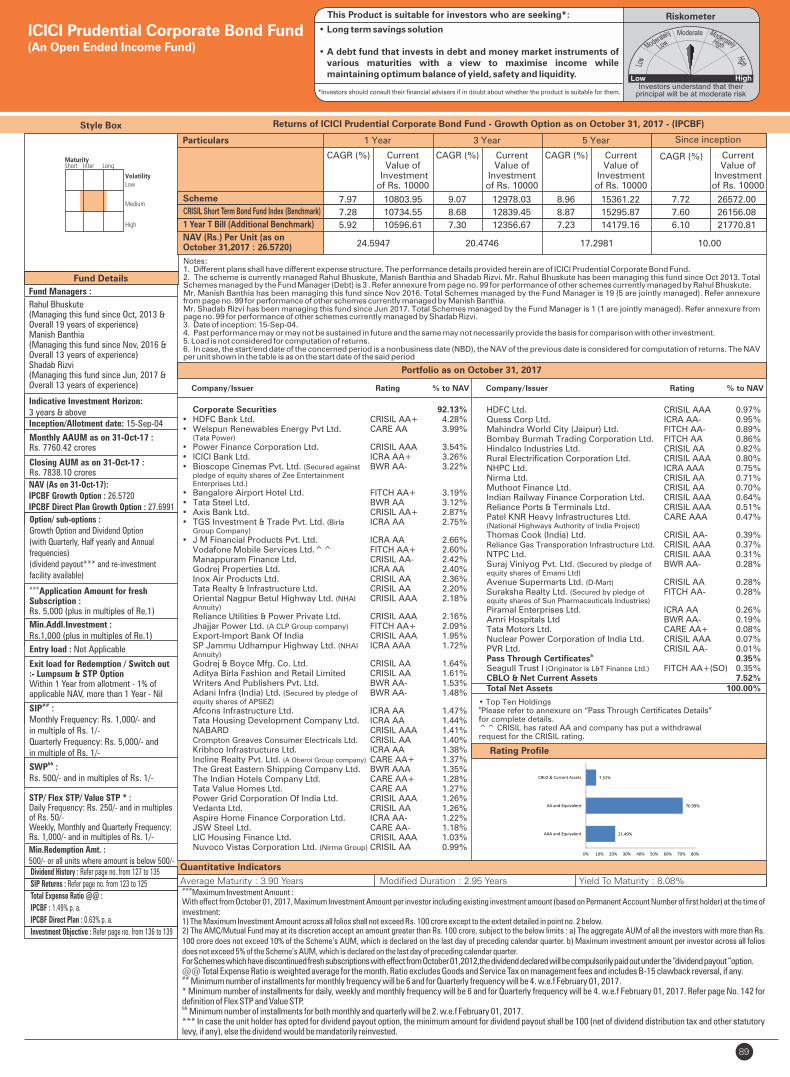
89
Fund Details
Rating Profile
Portfolio as on October 31, 2017
Quantitative Indicators
Company/Issuer Rating % to NAV
Fund Managers :
Rahul Bhuskute (Managing this fund since Oct, 2013 & Overall 19 years of experience)Manish Banthia(Managing this fund since Nov, 2016 & Overall 13 years of experience)Shadab Rizvi(Managing this fund since Jun, 2017 & Overall 13 years of experience)
Indicative Investment Horizon:3 years & aboveInception/Allotment date: 15-Sep-04
Monthly AAUM as on 31-Oct-17 :Rs. 7760.42 crores
Closing AUM as on 31-Oct-17 :Rs. 7838.10 crores
Option/ sub-options :Growth Option and Dividend Option (with Quarterly, Half yearly and Annual frequencies)(dividend payout*** and re-investment facility available)###Application Amount for freshSubscription :Rs. 5,000 (plus in multiples of Re.1)
Exit load for Redemption / Switch out:- Lumpsum & STP OptionWithin 1 Year from allotment - 1% ofapplicable NAV, more than 1 Year - Nil
##SIP :Monthly Frequency: Rs. 1,000/- and in multiple of Rs. 1/-Quarterly Frequency: Rs. 5,000/- and in multiple of Rs. 1/-
STP/ Flex STP/ Value STP * :Daily Frequency: Rs. 250/- and in multiples of Rs. 50/-Weekly, Monthly and Quarterly Frequency: Rs. 1,000/- and in multiples of Rs. 1/-
Min.Redemption Amt. :500/- or all units where amount is below 500/-
###Maximum Investment Amount :
With effect from October 01, 2017, Maximum Investment Amount per investor including existing investment amount (based on Permanent Account Number of first holder) at the time of investment:1) The Maximum Investment Amount across all folios shall not exceed Rs. 100 crore except to the extent detailed in point no. 2 below.2) The AMC/Mutual Fund may at its discretion accept an amount greater than Rs. 100 crore, subject to the below limits : a) The aggregate AUM of all the investors with more than Rs. 100 crore does not exceed 10% of the Scheme’s AUM, which is declared on the last day of preceding calendar quarter. b) Maximum investment amount per investor across all folios does not exceed 5% of the Scheme’s AUM, which is declared on the last day of preceding calendar quarter.For Schemes which have discontinued fresh subscriptions with effect from October 01,2012,the dividend declared will be compulsorily paid out under the “dividend payout “option.@@ Total Expense Ratio is weighted average for the month. Ratio excludes Goods and Service Tax on management fees and includes B-15 clawback reversal, if any.## Minimum number of installments for monthly frequency will be 6 and for Quarterly frequency will be 4. w.e.f February 01, 2017.* Minimum number of installments for daily, weekly and monthly frequency will be 6 and for Quarterly frequency will be 4. w.e.f February 01, 2017. Refer page No. 142 for definition of Flex STP and Value STP.&& Minimum number of installments for both monthly and quarterly will be 2. w.e.f February 01, 2017.*** In case the unit holder has opted for dividend payout option, the minimum amount for dividend payout shall be 100 (net of dividend distribution tax and other statutory levy, if any), else the dividend would be mandatorily reinvested.
Style Box Returns of ICICI Prudential Corporate Bond Fund - Growth Option as on - (IPCBF)October 31, 2017
NAV (As on 31-Oct-17):IPCBF Growth Option : 26.5720IPCBF Direct Plan Growth Option : 27.6991
Average Maturity : 3.90 Years Modified Duration : 2.95 Years Yield To Maturity : 8.08%
Min.Addl.Investment :Rs.1,000 (plus in multiples of Re.1)
• Top Ten Holdings&Please refer to annexure on “Pass Through Certificates Details”
for complete details.^^ CRISIL has rated AA and company has put a withdrawal request for the CRISIL rating.
ICICI Prudential Corporate Bond Fund(An Open Ended Income Fund)
Entry load : Not Applicable
RiskometerThis Product is suitable for investors who are seeking*:
• Long term savings solution
• A debt fund that invests in debt and money market instruments of various maturities with a view to maximise income while maintaining optimum balance of yield, safety and liquidity.
*Investors should consult their financial advisers if in doubt about whether the product is suitable for them.
Company/Issuer Rating % to NAV
Dividend History : Refer page no. from 127 to 135
SIP Returns : Refer page no. from 123 to 125
Total Expense Ratio @@ :
IPCBF : 1.49% p. a.
IPCBF Direct Plan : 0.63% p. a.
Investment Objective : Refer page no. from 136 to 139
&&SWP :Rs. 500/- and in multiples of Rs. 1/-
Notes:1. Different plans shall have different expense structure. The performance details provided herein are of ICICI Prudential Corporate Bond Fund.2. The scheme is currently managed Manish Banthia and Shadab Rizvi. Mr. has been managing this fund since 3. Total Rahul Bhuskute, Rahul Bhuskute Oct 201Schemes managed by the Fund Manager . Refer annexure from page no. 99 for performance of other schemes currently managed by .(Debt) is 3 Rahul BhuskuteMr. Manish Banthia has been managing this fund since . Total Schemes managed by the Fund Manager . Refer annexure Nov 2016 is 19 (5 are jointly managed)from page no. 99 for performance of other schemes currently managed by Manish Banthia. Mr. Shadab Rizvi has been managing this fund since 7. Total Schemes managed by the Fund Manager . Refer annexure from Jun 201 is 1 (1 are jointly managed)page no. 99 for performance of other schemes currently managed by Shadab Rizvi. 3. Date of inception: 15-Sep-04.4. Past performance may or may not be sustained in future and the same may not necessarily provide the basis for comparison with other investment.5. Load is not considered for computation of returns.6. In case, the start/end date of the concerned period is a nonbusiness date (NBD), the NAV of the previous date is considered for computation of returns. The NAV per unit shown in the table is as on the start date of the said period
Scheme
1 Year T Bill (Additional Benchmark)
NAV (Rs.) Per Unit (as onOctober 31,2017 : 26.5720)
CAGR (%)
10.00
CRISIL Short Term Bond Fund Index (Benchmark)
Since inception
CurrentValue of
Investment of Rs. 10000
CAGR (%) Current Value of
Investment of Rs. 10000
1 Year 3 Year 5 Year
CAGR (%) Current Value of
Investment of Rs. 10000
CAGR (%) Current Value of
Investment of Rs. 10000
24.5947 20.4746 17.2981
Particulars
7.97 10803.95 9.07 12978.03 8.96 15361.22 7.72 26572.00
7.28 10734.55 8.68 12839.45 8.87 15295.87 7.60 26156.08
5.92 10596.61 7.30 12356.67 7.23 14179.16 6.10 21770.81
21.49%
70.99%
7.52%
0% 10% 20% 30% 40% 50% 60% 70% 80%
AAA and Equivalent
AA and Equivalent
CBLO & Current Assets
Corporate Securities 92.13%• HDFC Bank Ltd. CRISIL AA+ 4.28%• Welspun Renewables Energy Pvt Ltd. CARE AA 3.99% (Tata Power)
• Power Finance Corporation Ltd. CRISIL AAA 3.54%• ICICI Bank Ltd. ICRA AA+ 3.26%• Bioscope Cinemas Pvt. Ltd. (Secured against BWR AA- 3.22% pledge of equity shares of Zee Entertainment Enterprises Ltd.)
• Bangalore Airport Hotel Ltd. FITCH AA+ 3.19%• Tata Steel Ltd. BWR AA 3.12%• Axis Bank Ltd. CRISIL AA+ 2.87%• TGS Investment & Trade Pvt. Ltd. (Birla ICRA AA 2.75% Group Company)
• J M Financial Products Pvt. Ltd. ICRA AA 2.66% Vodafone Mobile Services Ltd.^^ FITCH AA+ 2.60% Manappuram Finance Ltd. CRISIL AA- 2.42% Godrej Properties Ltd. ICRA AA 2.40% Inox Air Products Ltd. CRISIL AA 2.36% Tata Realty & Infrastructure Ltd. CRISIL AA 2.20% Oriental Nagpur Betul Highway Ltd. (NHAI CRISIL AAA 2.18% Annuity)
Reliance Utilities & Power Private Ltd. CRISIL AAA 2.16% Jhajjar Power Ltd. (A CLP Group company) FITCH AA+ 2.09% Export-Import Bank Of India CRISIL AAA 1.95% SP Jammu Udhampur Highway Ltd. (NHAI ICRA AAA 1.72% Annuity)
Godrej & Boyce Mfg. Co. Ltd. CRISIL AA 1.64% Aditya Birla Fashion and Retail Limited CRISIL AA 1.61% Writers And Publishers Pvt. Ltd. BWR AA- 1.53% Adani Infra (India) Ltd. (Secured by pledge of BWR AA- 1.48% equity shares of APSEZ)
Afcons Infrastructure Ltd. ICRA AA 1.47% Tata Housing Development Company Ltd. ICRA AA 1.44% NABARD CRISIL AAA 1.41% Crompton Greaves Consumer Electricals Ltd. CRISIL AA 1.40% Kribhco Infrastructure Ltd. ICRA AA 1.38% Incline Realty Pvt. Ltd. (A Oberoi Group company) CARE AA+ 1.37% The Great Eastern Shipping Company Ltd. BWR AAA 1.35% The Indian Hotels Company Ltd. CARE AA+ 1.28% Tata Value Homes Ltd. CARE AA 1.27% Power Grid Corporation Of India Ltd. CRISIL AAA 1.26% Vedanta Ltd. CRISIL AA 1.26% Aspire Home Finance Corporation Ltd. ICRA AA- 1.22% JSW Steel Ltd. CARE AA- 1.18% LIC Housing Finance Ltd. CRISIL AAA 1.03% Nuvoco Vistas Corporation Ltd. (Nirma Group) CRISIL AA 0.99%
HDFC Ltd. CRISIL AAA 0.97% Quess Corp Ltd. ICRA AA- 0.95% Mahindra World City (Jaipur) Ltd. FITCH AA- 0.89% Bombay Burmah Trading Corporation Ltd. FITCH AA 0.86% Hindalco Industries Ltd. CRISIL AA 0.82% Rural Electrification Corporation Ltd. CRISIL AAA 0.80% NHPC Ltd. ICRA AAA 0.75% Nirma Ltd. CRISIL AA 0.71% Muthoot Finance Ltd. CRISIL AA 0.70% Indian Railway Finance Corporation Ltd. CRISIL AAA 0.64% Reliance Ports & Terminals Ltd. CRISIL AAA 0.51% Patel KNR Heavy Infrastructures Ltd. CARE AAA 0.47% (National Highways Authority of India Project)
Thomas Cook (India) Ltd. CRISIL AA- 0.39% Reliance Gas Transporation Infrastructure Ltd. CRISIL AAA 0.37% NTPC Ltd. CRISIL AAA 0.31% Suraj Viniyog Pvt. Ltd. (Secured by pledge of BWR AA- 0.28% equity shares of Emami Ltd)
Avenue Supermarts Ltd. (D-Mart) CRISIL AA 0.28% Suraksha Realty Ltd. (Secured by pledge of FITCH AA- 0.28% equity shares of Sun Pharmaceuticals Industries)
Piramal Enterprises Ltd. ICRA AA 0.26% Amri Hospitals Ltd BWR AA- 0.19% Tata Motors Ltd. CARE AA+ 0.08% Nuclear Power Corporation of India Ltd. CRISIL AAA 0.07% PVR Ltd. CRISIL AA- 0.01%
& Pass Through Certificates 0.35% Seagull Trust I (Originator is L&T Finance Ltd.) FITCH AA+(SO) 0.35% CBLO & Net Current Assets 7.52% Total Net Assets 100.00%
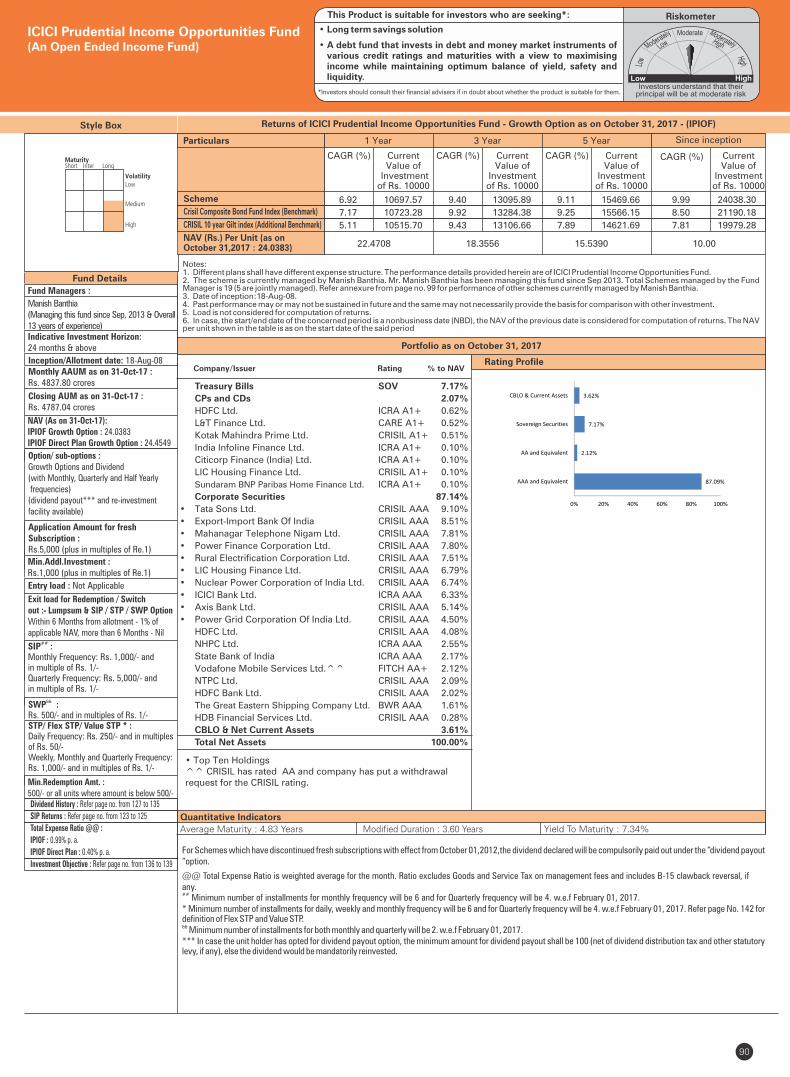
90
Fund Details
Rating Profile
Portfolio as on October 31, 2017
Quantitative Indicators
For Schemes which have discontinued fresh subscriptions with effect from October 01,2012,the dividend declared will be compulsorily paid out under the “dividend payout “option.
@@ Total Expense Ratio is weighted average for the month. Ratio excludes Goods and Service Tax on management fees and includes B-15 clawback reversal, if any.## Minimum number of installments for monthly frequency will be 6 and for Quarterly frequency will be 4. w.e.f February 01, 2017.* Minimum number of installments for daily, weekly and monthly frequency will be 6 and for Quarterly frequency will be 4. w.e.f February 01, 2017. Refer page No. 142 for definition of Flex STP and Value STP.&& Minimum number of installments for both monthly and quarterly will be 2. w.e.f February 01, 2017.*** In case the unit holder has opted for dividend payout option, the minimum amount for dividend payout shall be 100 (net of dividend distribution tax and other statutory levy, if any), else the dividend would be mandatorily reinvested.
Style Box
Fund Managers :
Manish Banthia(Managing this fund since Sep, 2013 & Overall13 years of experience)Indicative Investment Horizon:24 months & above
Inception/Allotment date: 18-Aug-08Monthly AAUM as on 31-Oct-17 : Rs. 4837.80 crores
Closing AUM as on 31-Oct-17 : Rs. 4787.04 crores
NAV (As on 31-Oct-17):IPIOF Growth Option : 24.0383IPIOF Direct Plan Growth Option : 24.4549
Application Amount for freshSubscription :Rs.5,000 (plus in multiples of Re.1)
Min.Addl.Investment :Rs.1,000 (plus in multiples of Re.1)
Exit load for Redemption / Switchout :- Lumpsum & SIP / STP / SWP OptionWithin 6 Months from allotment - 1% ofapplicable NAV, more than 6 Months - Nil
SIP :##
Monthly Frequency: Rs. 1,000/- and in multiple of Rs. 1/-Quarterly Frequency: Rs. 5,000/- and in multiple of Rs. 1/-
&&SWP :Rs. 500/- and in multiples of Rs. 1/-STP/ Flex STP/ Value STP * :Daily Frequency: Rs. 250/- and in multiples of Rs. 50/-Weekly, Monthly and Quarterly Frequency: Rs. 1,000/- and in multiples of Rs. 1/-
Min.Redemption Amt. :500/- or all units where amount is below 500/-
Option/ sub-options :Growth Options and Dividend (with Monthly, Quarterly and Half Yearly frequencies)(dividend payout*** and re-investment facility available)
Company/Issuer Rating % to NAV
Treasury Bills SOV 7.17%
CPs and CDs 2.07%
HDFC Ltd. ICRA A1+ 0.62%
L&T Finance Ltd. CARE A1+ 0.52%
Kotak Mahindra Prime Ltd. CRISIL A1+ 0.51%
India Infoline Finance Ltd. ICRA A1+ 0.10%
Citicorp Finance (India) Ltd. ICRA A1+ 0.10%
LIC Housing Finance Ltd. CRISIL A1+ 0.10%
Sundaram BNP Paribas Home Finance Ltd. ICRA A1+ 0.10%
Corporate Securities 87.14%
• Tata Sons Ltd. CRISIL AAA 9.10%
• Export-Import Bank Of India CRISIL AAA 8.51%
• Mahanagar Telephone Nigam Ltd. CRISIL AAA 7.81%
• Power Finance Corporation Ltd. CRISIL AAA 7.80%
• Rural Electrification Corporation Ltd. CRISIL AAA 7.51%
• LIC Housing Finance Ltd. CRISIL AAA 6.79%
• Nuclear Power Corporation of India Ltd. CRISIL AAA 6.74%
• ICICI Bank Ltd. ICRA AAA 6.33%
• Axis Bank Ltd. CRISIL AAA 5.14%
• Power Grid Corporation Of India Ltd. CRISIL AAA 4.50%
HDFC Ltd. CRISIL AAA 4.08%
NHPC Ltd. ICRA AAA 2.55%
State Bank of India ICRA AAA 2.17%
Vodafone Mobile Services Ltd.^^ FITCH AA+ 2.12%
NTPC Ltd. CRISIL AAA 2.09%
HDFC Bank Ltd. CRISIL AAA 2.02%
The Great Eastern Shipping Company Ltd. BWR AAA 1.61%
HDB Financial Services Ltd. CRISIL AAA 0.28%
CBLO & Net Current Assets 3.61%
Total Net Assets 100.00%
Returns of ICICI Prudential Income Opportunities Fund - Growth Option as on - (IPIOF)October 31, 2017
• Top Ten Holdings^^ CRISIL has rated AA and company has put a withdrawal request for the CRISIL rating.
Average Maturity : 4.83 Years Modified Duration : 3.60 Years Yield To Maturity : 7.34%
ICICI Prudential Income Opportunities Fund(An Open Ended Income Fund)
Entry load : Not Applicable
RiskometerThis Product is suitable for investors who are seeking*:
• Long term savings solution
• A debt fund that invests in debt and money market instruments of various credit ratings and maturities with a view to maximising income while maintaining optimum balance of yield, safety and liquidity.
*Investors should consult their financial advisers if in doubt about whether the product is suitable for them.
Dividend History : Refer page no. from 127 to 135
SIP Returns : Refer page no. from 123 to 125
Total Expense Ratio @@ :
IPIOF : 0.99% p. a.
IPIOF Direct Plan : 0.40% p. a.
Investment Objective : Refer page no. from 136 to 139
Notes:1. Different plans shall have different expense structure. The performance details provided herein are of ICICI Prudential Income Opportunities Fund.2. The scheme is currently managed by Manish Banthia. Mr. has been managing this fund since . Total Schemes managed by the Fund Manish Banthia Sep 2013Manager . Refer annexure from page no. 99 for performance of other schemes currently managed by . is 19 (5 are jointly managed) Manish Banthia3. Date of inception:18-Aug-08.4. Past performance may or may not be sustained in future and the same may not necessarily provide the basis for comparison with other investment.5. Load is not considered for computation of returns.6. In case, the start/end date of the concerned period is a nonbusiness date (NBD), the NAV of the previous date is considered for computation of returns. The NAV per unit shown in the table is as on the start date of the said period
Scheme
CRISIL 10 year Gilt index (Additional Benchmark)
NAV (Rs.) Per Unit (as on October 31,2017 : 24.0383)
CAGR (%)
10.00
Crisil Composite Bond Fund Index (Benchmark)
Since inception
CurrentValue of
Investment of Rs. 10000
CAGR (%) Current Value of
Investment of Rs. 10000
1 Year 3 Year 5 Year
CAGR (%) Current Value of
Investment of Rs. 10000
CAGR (%) Current Value of
Investment of Rs. 10000
22.4708 18.3556 15.5390
Particulars
6.92 10697.57 9.40 13095.89 9.11 15469.66 9.99 24038.30
7.17 10723.28 9.92 13284.38 9.25 15566.15 8.50 21190.18
5.11 10515.70 9.43 13106.66 7.89 14621.69 7.81 19979.28
87.09%
2.12%
7.17%
3.62%
0% 20% 40% 60% 80% 100%
AAA and Equivalent
AA and Equivalent
Sovereign Securities
CBLO & Current Assets
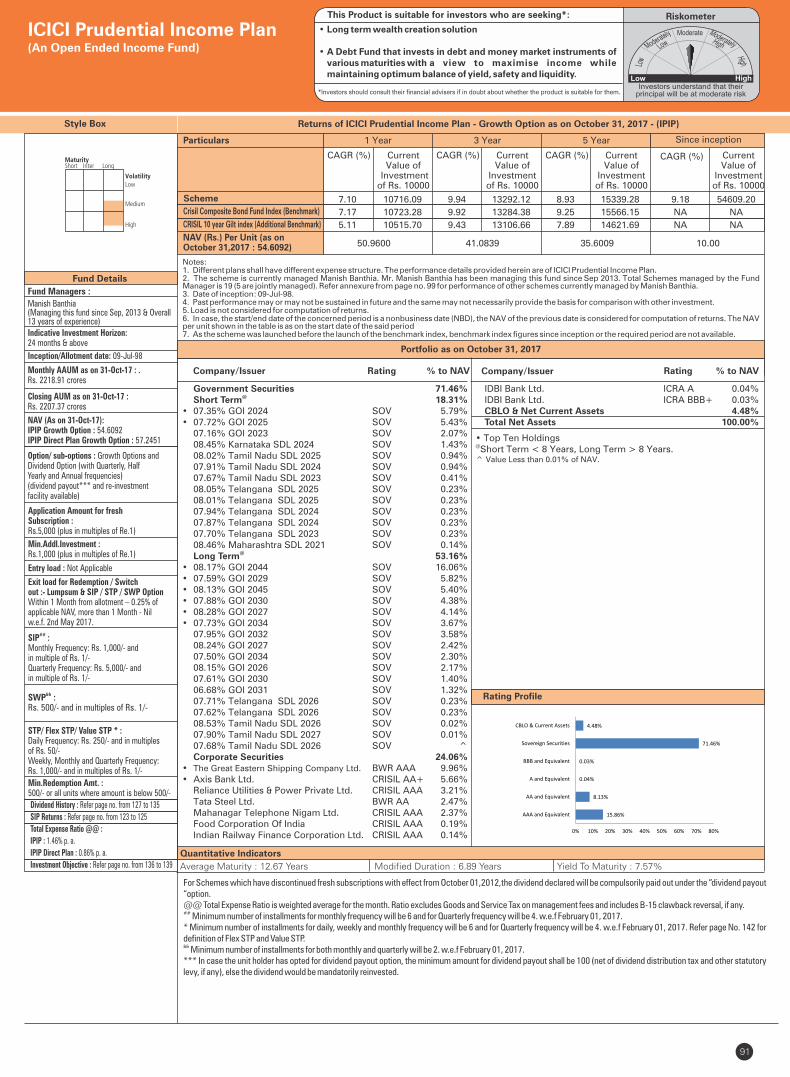
91
Style Box
Rating Profile
Portfolio as on October 31, 2017
Fund Details
Quantitative Indicators
Company/Issuer % to NAVRating
• Top Ten Holdings@Short Term < 8 Years, Long Term > 8 Years.^ Value Less than 0.01% of NAV.
For Schemes which have discontinued fresh subscriptions with effect from October 01,2012,the dividend declared will be compulsorily paid out under the “dividend payout “option.@@ Total Expense Ratio is weighted average for the month. Ratio excludes Goods and Service Tax on management fees and includes B-15 clawback reversal, if any.## Minimum number of installments for monthly frequency will be 6 and for Quarterly frequency will be 4. w.e.f February 01, 2017.* Minimum number of installments for daily, weekly and monthly frequency will be 6 and for Quarterly frequency will be 4. w.e.f February 01, 2017. Refer page No. 142 for definition of Flex STP and Value STP.&& Minimum number of installments for both monthly and quarterly will be 2. w.e.f February 01, 2017.*** In case the unit holder has opted for dividend payout option, the minimum amount for dividend payout shall be 100 (net of dividend distribution tax and other statutory levy, if any), else the dividend would be mandatorily reinvested.
Fund Managers :
Manish Banthia(Managing this fund since Sep, 2013 & Overall13 years of experience)Indicative Investment Horizon:24 months & above
Inception/Allotment date: 09-Jul-98
Monthly AAUM as on 31-Oct-17 : .Rs. 2218.91 crores
Closing AUM as on 31-Oct-17 :Rs. 2207.37 crores
NAV (As on 31-Oct-17):IPIP Growth Option : 54.6092IPIP Direct Plan Growth Option : 57.2451
Option/ sub-options : Growth Options andDividend Option (with Quarterly, HalfYearly and Annual frequencies)(dividend payout*** and re-investmentfacility available)
Application Amount for freshSubscription :Rs.5,000 (plus in multiples of Re.1)
Min.Addl.Investment :Rs.1,000 (plus in multiples of Re.1)
Exit load for Redemption / Switchout :- Lumpsum & SIP / STP / SWP OptionWithin 1 Month from allotment – 0.25% of applicable NAV, more than 1 Month - Nilw.e.f. 2nd May 2017.
##SIP :Monthly Frequency: Rs. 1,000/- and in multiple of Rs. 1/-Quarterly Frequency: Rs. 5,000/- and in multiple of Rs. 1/-
&&SWP :Rs. 500/- and in multiples of Rs. 1/-
STP/ Flex STP/ Value STP * :Daily Frequency: Rs. 250/- and in multiples of Rs. 50/-Weekly, Monthly and Quarterly Frequency: Rs. 1,000/- and in multiples of Rs. 1/-
Min.Redemption Amt. :500/- or all units where amount is below 500/-
Government Securities 71.46%@ Short Term 18.31%
• 07.35% GOI 2024 SOV 5.79%• 07.72% GOI 2025 SOV 5.43% 07.16% GOI 2023 SOV 2.07% 08.45% Karnataka SDL 2024 SOV 1.43% 08.02% Tamil Nadu SDL 2025 SOV 0.94% 07.91% Tamil Nadu SDL 2024 SOV 0.94% 07.67% Tamil Nadu SDL 2023 SOV 0.41% 08.05% Telangana SDL 2025 SOV 0.23% 08.01% Telangana SDL 2025 SOV 0.23% 07.94% Telangana SDL 2024 SOV 0.23% 07.87% Telangana SDL 2024 SOV 0.23% 07.70% Telangana SDL 2023 SOV 0.23% 08.46% Maharashtra SDL 2021 SOV 0.14%
@ Long Term 53.16%• 08.17% GOI 2044 SOV 16.06%• 07.59% GOI 2029 SOV 5.82%• 08.13% GOI 2045 SOV 5.40%• 07.88% GOI 2030 SOV 4.38%• 08.28% GOI 2027 SOV 4.14%• 07.73% GOI 2034 SOV 3.67% 07.95% GOI 2032 SOV 3.58% 08.24% GOI 2027 SOV 2.42% 07.50% GOI 2034 SOV 2.30% 08.15% GOI 2026 SOV 2.17% 07.61% GOI 2030 SOV 1.40% 06.68% GOI 2031 SOV 1.32% 07.71% Telangana SDL 2026 SOV 0.23% 07.62% Telangana SDL 2026 SOV 0.23% 08.53% Tamil Nadu SDL 2026 SOV 0.02% 07.90% Tamil Nadu SDL 2027 SOV 0.01% 07.68% Tamil Nadu SDL 2026 SOV ^ Corporate Securities 24.06%• The Great Eastern Shipping Company Ltd. BWR AAA 9.96%• Axis Bank Ltd. CRISIL AA+ 5.66% Reliance Utilities & Power Private Ltd. CRISIL AAA 3.21% Tata Steel Ltd. BWR AA 2.47% Mahanagar Telephone Nigam Ltd. CRISIL AAA 2.37% Food Corporation Of India CRISIL AAA 0.19% Indian Railway Finance Corporation Ltd. CRISIL AAA 0.14%
Returns of ICICI Prudential Income Plan - Growth Option as on - (IPIP)October 31, 2017
Average Maturity : 12.67 Years Modified Duration : 6.89 Years Yield To Maturity : 7.57%
ICICI Prudential Income Plan(An Open Ended Income Fund)
Entry load : Not Applicable
RiskometerThis Product is suitable for investors who are seeking*:
• Long term wealth creation solution
• A Debt Fund that invests in debt and money market instruments of various maturities with a view to maximise income while maintaining optimum balance of yield, safety and liquidity.
*Investors should consult their financial advisers if in doubt about whether the product is suitable for them.
Dividend History : Refer page no. from 127 to 135
SIP Returns : Refer page no. from 123 to 125
Total Expense Ratio @@ :
IPIP : 1.46% p. a.
IPIP Direct Plan : 0.86% p. a.
Investment Objective : Refer page no. from 136 to 139
IDBI Bank Ltd. ICRA A 0.04% IDBI Bank Ltd. ICRA BBB+ 0.03% CBLO & Net Current Assets 4.48% Total Net Assets 100.00%
Company/Issuer % to NAVRating
Notes:1. Different plans shall have different expense structure. The performance details provided herein are of ICICI Prudential Income Plan.2. The scheme is currently managed Manish Banthia. Mr. Manish Banthia has been managing this fund since . Total Schemes managed by the Fund Sep 2013Manager . Refer annexure from page no. 99 for performance of other schemes currently managed by Manish Banthia. is 19 (5 are jointly managed) 3. Date of inception: 09-Jul-98.4. Past performance may or may not be sustained in future and the same may not necessarily provide the basis for comparison with other investment.5. Load is not considered for computation of returns.6. In case, the start/end date of the concerned period is a nonbusiness date (NBD), the NAV of the previous date is considered for computation of returns. The NAV per unit shown in the table is as on the start date of the said period7. As the scheme was launched before the launch of the benchmark index, benchmark index figures since inception or the required period are not available.
Scheme
CRISIL 10 year Gilt index (Additional Benchmark)
NAV (Rs.) Per Unit (as onOctober 31,2017 : 54.6092)
CAGR (%)
10.00
Crisil Composite Bond Fund Index (Benchmark)
Since inception
CurrentValue of
Investment of Rs. 10000
CAGR (%) Current Value of
Investment of Rs. 10000
1 Year 3 Year 5 Year
CAGR (%) Current Value of
Investment of Rs. 10000
CAGR (%) Current Value of
Investment of Rs. 10000
50.9600 41.0839 35.6009
Particulars
7.10 10716.09 9.94 13292.12 8.93 15339.28 9.18 54609.20
7.17 10723.28 9.92 13284.38 9.25 15566.15 NA NA
5.11 10515.70 9.43 13106.66 7.89 14621.69 NA NA
15.86%
8.13%
0.04%
0.03%
71.46%
4.48%
0% 10% 20% 30% 40% 50% 60% 70% 80%
AAA and Equivalent
AA and Equivalent
A and Equivalent
BBB and Equivalent
Sovereign Securities
CBLO & Current Assets
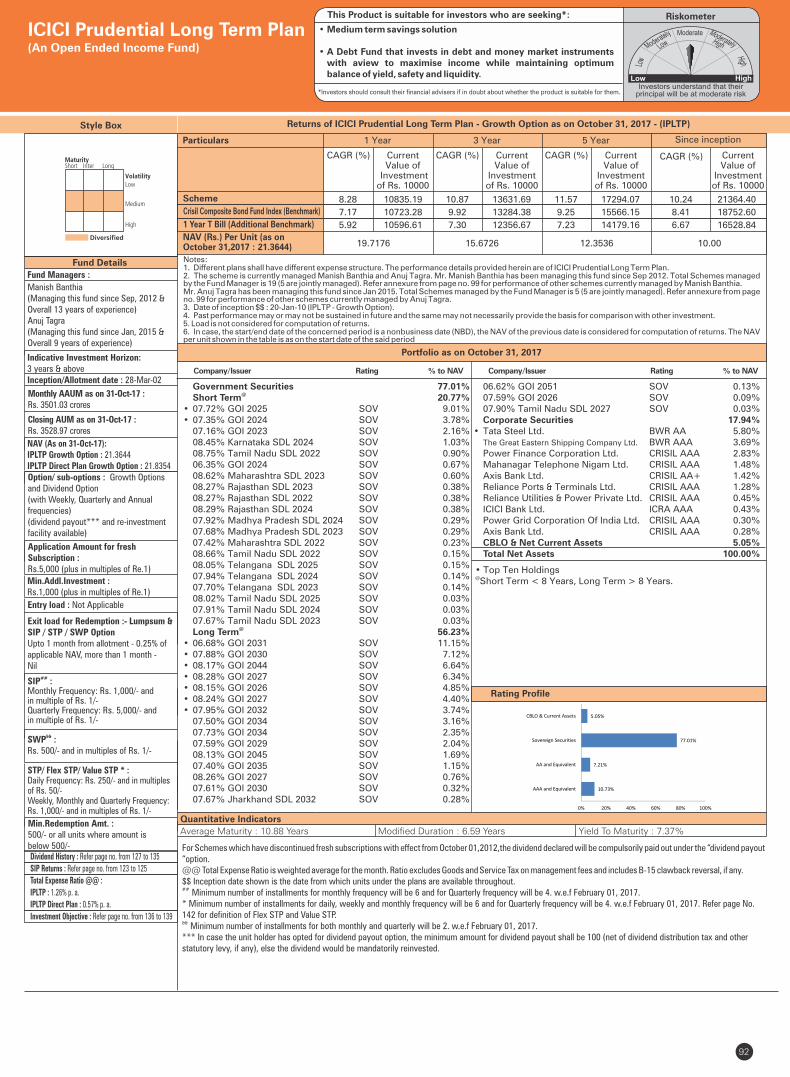
06.62% GOI 2051 SOV 0.13% 07.59% GOI 2026 SOV 0.09% 07.90% Tamil Nadu SDL 2027 SOV 0.03% Corporate Securities 17.94%• Tata Steel Ltd. BWR AA 5.80% The Great Eastern Shipping Company Ltd. BWR AAA 3.69% Power Finance Corporation Ltd. CRISIL AAA 2.83% Mahanagar Telephone Nigam Ltd. CRISIL AAA 1.48% Axis Bank Ltd. CRISIL AA+ 1.42% Reliance Ports & Terminals Ltd. CRISIL AAA 1.28% Reliance Utilities & Power Private Ltd. CRISIL AAA 0.45% ICICI Bank Ltd. ICRA AAA 0.43% Power Grid Corporation Of India Ltd. CRISIL AAA 0.30% Axis Bank Ltd. CRISIL AAA 0.28% CBLO & Net Current Assets 5.05% Total Net Assets 100.00%
Rating Profile
Quantitative Indicators
Fund Details
Portfolio as on October 31, 2017
Style Box
Company/Issuer Rating % to NAV
Fund Managers :
Manish Banthia (Managing this fund since Sep, 2012 & Overall 13 years of experience)Anuj Tagra(Managing this fund since Jan, 2015 & Overall 9 years of experience)
Indicative Investment Horizon:3 years & aboveInception/Allotment date : 28-Mar-02
Monthly AAUM as on 31-Oct-17 : Rs. 3501.03 crores
Closing AUM as on 31-Oct-17 : Rs. 3528.97 crores
NAV (As on 31-Oct-17):IPLTP Growth Option : 21.3644IPLTP Direct Plan Growth Option : 21.8354Option/ sub-options : Growth Options and Dividend Option (with Weekly, Quarterly and Annual frequencies)(dividend payout*** and re-investment facility available)
Application Amount for freshSubscription :Rs.5,000 (plus in multiples of Re.1)
Min.Addl.Investment :Rs.1,000 (plus in multiples of Re.1)
Exit load for Redemption :- Lumpsum &SIP / STP / SWP OptionUpto 1 month from allotment - 0.25% ofapplicable NAV, more than 1 month -Nil
##SIP :Monthly Frequency: Rs. 1,000/- and in multiple of Rs. 1/-Quarterly Frequency: Rs. 5,000/- and in multiple of Rs. 1/-
&&SWP :Rs. 500/- and in multiples of Rs. 1/-
STP/ Flex STP/ Value STP * :Daily Frequency: Rs. 250/- and in multiples of Rs. 50/-Weekly, Monthly and Quarterly Frequency: Rs. 1,000/- and in multiples of Rs. 1/-
Min.Redemption Amt. :500/- or all units where amount is below 500/-
92
For Schemes which have discontinued fresh subscriptions with effect from October 01,2012,the dividend declared will be compulsorily paid out under the “dividend payout “option.@@ Total Expense Ratio is weighted average for the month. Ratio excludes Goods and Service Tax on management fees and includes B-15 clawback reversal, if any.$$ Inception date shown is the date from which units under the plans are available throughout.## Minimum number of installments for monthly frequency will be 6 and for Quarterly frequency will be 4. w.e.f February 01, 2017.* Minimum number of installments for daily, weekly and monthly frequency will be 6 and for Quarterly frequency will be 4. w.e.f February 01, 2017. Refer page No. 142 for definition of Flex STP and Value STP.&& Minimum number of installments for both monthly and quarterly will be 2. w.e.f February 01, 2017.*** In case the unit holder has opted for dividend payout option, the minimum amount for dividend payout shall be 100 (net of dividend distribution tax and other statutory levy, if any), else the dividend would be mandatorily reinvested.
Returns of ICICI Prudential Long Term Plan - Growth Option as on - (IPLTP)October 31, 2017
Average Maturity : 10.88 Years Modified Duration : 6.59 Years Yield To Maturity : 7.37%
• Top Ten Holdings@Short Term < 8 Years, Long Term > 8 Years.
ICICI Prudential Long Term Plan(An Open Ended Income Fund)
Entry load : Not Applicable
RiskometerThis Product is suitable for investors who are seeking*:
• Medium term savings solution
• A Debt Fund that invests in debt and money market instruments with aview to maximise income while maintaining optimum balance of yield, safety and liquidity.
*Investors should consult their financial advisers if in doubt about whether the product is suitable for them.
Government Securities 77.01%@ Short Term 20.77%
• 07.72% GOI 2025 SOV 9.01%• 07.35% GOI 2024 SOV 3.78% 07.16% GOI 2023 SOV 2.16% 08.45% Karnataka SDL 2024 SOV 1.03% 08.75% Tamil Nadu SDL 2022 SOV 0.90% 06.35% GOI 2024 SOV 0.67% 08.62% Maharashtra SDL 2023 SOV 0.60% 08.27% Rajasthan SDL 2023 SOV 0.38% 08.27% Rajasthan SDL 2022 SOV 0.38% 08.29% Rajasthan SDL 2024 SOV 0.38% 07.92% Madhya Pradesh SDL 2024 SOV 0.29% 07.68% Madhya Pradesh SDL 2023 SOV 0.29% 07.42% Maharashtra SDL 2022 SOV 0.23% 08.66% Tamil Nadu SDL 2022 SOV 0.15% 08.05% Telangana SDL 2025 SOV 0.15% 07.94% Telangana SDL 2024 SOV 0.14% 07.70% Telangana SDL 2023 SOV 0.14% 08.02% Tamil Nadu SDL 2025 SOV 0.03% 07.91% Tamil Nadu SDL 2024 SOV 0.03% 07.67% Tamil Nadu SDL 2023 SOV 0.03%
@ Long Term 56.23%• 06.68% GOI 2031 SOV 11.15%• 07.88% GOI 2030 SOV 7.12%• 08.17% GOI 2044 SOV 6.64%• 08.28% GOI 2027 SOV 6.34%• 08.15% GOI 2026 SOV 4.85%• 08.24% GOI 2027 SOV 4.40%• 07.95% GOI 2032 SOV 3.74% 07.50% GOI 2034 SOV 3.16% 07.73% GOI 2034 SOV 2.35% 07.59% GOI 2029 SOV 2.04% 08.13% GOI 2045 SOV 1.69% 07.40% GOI 2035 SOV 1.15% 08.26% GOI 2027 SOV 0.76% 07.61% GOI 2030 SOV 0.32% 07.67% Jharkhand SDL 2032 SOV 0.28%
Dividend History : Refer page no. from 127 to 135
SIP Returns : Refer page no. from 123 to 125
Total Expense Ratio @@ :
IPLTP : 1.26% p. a.
IPLTP Direct Plan : 0.57% p. a.
Investment Objective : Refer page no. from 136 to 139
Company/Issuer Rating % to NAV
Notes:1. Different plans shall have different expense structure. The performance details provided herein are of ICICI Prudential Long Term Plan.2. The scheme is currently managed Manish Banthia and . Mr. Manish Banthia has been managing this fund since 2. Total Schemes managed Anuj Tagra Sep 201by the Fund Manager . Refer annexure from page no. 99 for performance of other schemes currently managed by Manish Banthia. is 19 (5 are jointly managed) Mr. has been managing this fund since 5. Total Schemes managed by the Fund Manager . Refer annexure from page Anuj Tagra Jan 201 is 5 (5 are jointly managed)no. 99 for performance of other schemes currently managed by . Anuj Tagra3. Date of inception $$ : 20-Jan-10 (IPLTP - Growth Option).4. Past performance may or may not be sustained in future and the same may not necessarily provide the basis for comparison with other investment.5. Load is not considered for computation of returns.6. In case, the start/end date of the concerned period is a nonbusiness date (NBD), the NAV of the previous date is considered for computation of returns. The NAV per unit shown in the table is as on the start date of the said period
Scheme
1 Year T Bill (Additional Benchmark)
NAV (Rs.) Per Unit (as onOctober 31,2017 : 21.3644)
CAGR (%)
10.00
Crisil Composite Bond Fund Index (Benchmark)
Since inception
CurrentValue of
Investment of Rs. 10000
CAGR (%) Current Value of
Investment of Rs. 10000
1 Year 3 Year 5 Year
CAGR (%) Current Value of
Investment of Rs. 10000
CAGR (%) Current Value of
Investment of Rs. 10000
19.7176 15.6726 12.3536
Particulars
8.28 10835.19 10.87 13631.69 11.57 17294.07 10.24 21364.40
7.17 10723.28 9.92 13284.38 9.25 15566.15 8.41 18752.60
5.92 10596.61 7.30 12356.67 7.23 14179.16 6.67 16528.84
10.73%
7.21%
77.01%
5.05%
0% 20% 40% 60% 80% 100%
AAA and Equivalent
AA and Equivalent
Sovereign Securities
CBLO & Current Assets
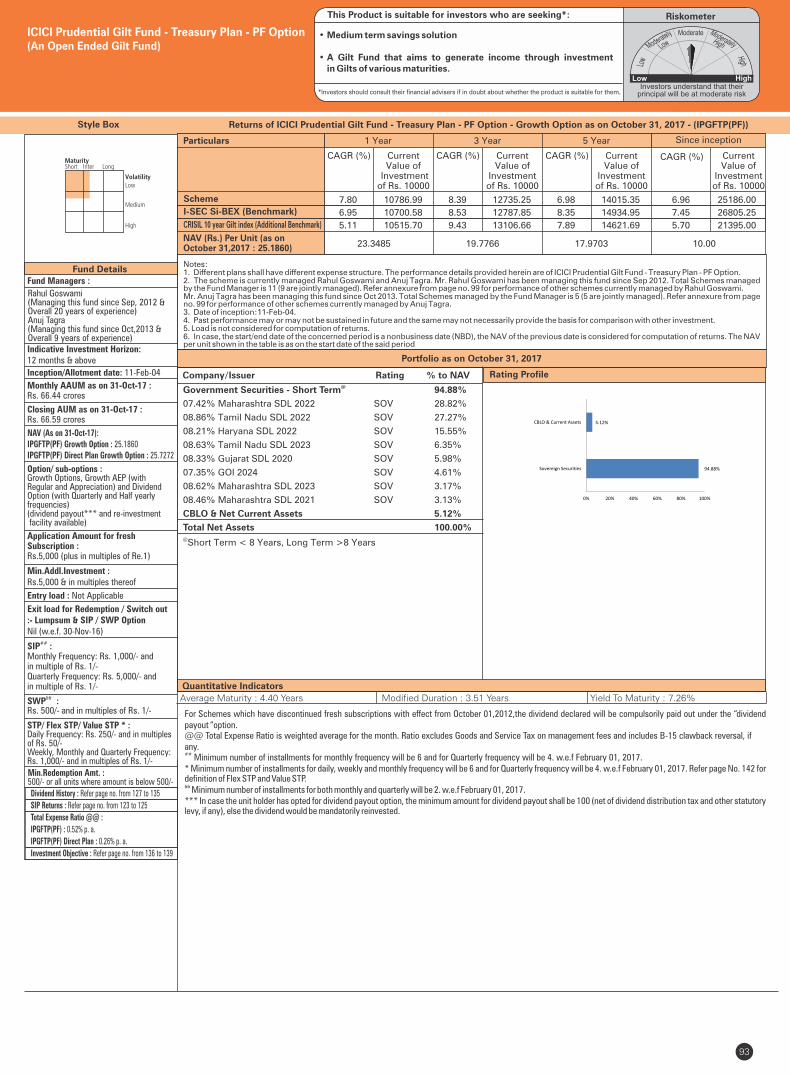
@Government Securities - Short Term 94.88%
07.42% Maharashtra SDL 2022 SOV 28.82%
08.86% Tamil Nadu SDL 2022 SOV 27.27%
08.21% Haryana SDL 2022 SOV 15.55%
08.63% Tamil Nadu SDL 2023 SOV 6.35%
08.33% Gujarat SDL 2020 SOV 5.98%
07.35% GOI 2024 SOV 4.61%
08.62% Maharashtra SDL 2023 SOV 3.17%
08.46% Maharashtra SDL 2021 SOV 3.13%
CBLO & Net Current Assets 5.12%
Total Net Assets 100.00%
Style Box
Fund Details
Portfolio as on October 31, 2017
Company/Issuer % to NAVRating
Quantitative Indicators
For Schemes which have discontinued fresh subscriptions with effect from October 01,2012,the dividend declared will be compulsorily paid out under the “dividend payout “option.@@ Total Expense Ratio is weighted average for the month. Ratio excludes Goods and Service Tax on management fees and includes B-15 clawback reversal, if any.## Minimum number of installments for monthly frequency will be 6 and for Quarterly frequency will be 4. w.e.f February 01, 2017.* Minimum number of installments for daily, weekly and monthly frequency will be 6 and for Quarterly frequency will be 4. w.e.f February 01, 2017. Refer page No. 142 for definition of Flex STP and Value STP.&& Minimum number of installments for both monthly and quarterly will be 2. w.e.f February 01, 2017.*** In case the unit holder has opted for dividend payout option, the minimum amount for dividend payout shall be 100 (net of dividend distribution tax and other statutory levy, if any), else the dividend would be mandatorily reinvested.
Fund Managers :
Rahul Goswami (Managing this fund since Sep, 2012 & Overall 20 years of experience)Anuj Tagra (Managing this fund since Oct,2013 & Overall 9 years of experience)Indicative Investment Horizon:12 months & above
Inception/Allotment date: 11-Feb-04
Monthly AAUM as on 31-Oct-17 : Rs. 66.44 crores
Closing AUM as on 31-Oct-17 : Rs. 66.59 crores
NAV (As on 31-Oct-17):IPGFTP(PF) Growth Option : 25.1860IPGFTP(PF) Direct Plan Growth Option : 25.7272
Option/ sub-options :Growth Options, Growth AEP (withRegular and Appreciation) and Dividend Option (with Quarterly and Half yearly frequencies)(dividend payout*** and re-investment facility available)
Application Amount for freshSubscription :Rs.5,000 (plus in multiples of Re.1)
Min.Addl.Investment :Rs.5,000 & in multiples thereof
Exit load for Redemption / Switch out:- Lumpsum & SIP / SWP OptionNil (w.e.f. 30-Nov-16)
SIP :##
Monthly Frequency: Rs. 1,000/- and in multiple of Rs. 1/-Quarterly Frequency: Rs. 5,000/- and in multiple of Rs. 1/-
&&SWP :Rs. 500/- and in multiples of Rs. 1/-
STP/ Flex STP/ Value STP * :Daily Frequency: Rs. 250/- and in multiples of Rs. 50/-Weekly, Monthly and Quarterly Frequency: Rs. 1,000/- and in multiples of Rs. 1/-
Min.Redemption Amt. :500/- or all units where amount is below 500/-
93
Returns of ICICI Prudential Gilt Fund - Treasury Plan - PF Option - Growth Option as on - (IPGFTP(PF))October 31, 2017
Average Maturity : 4.40 Years Modified Duration : 3.51 Years Yield To Maturity : 7.26%
@Short Term < 8 Years, Long Term >8 Years
HIGH RISK(BROWN)
ICICI Prudential Gilt Fund - Treasury Plan - PF Option(An Open Ended Gilt Fund)
Rating Profile
Entry load : Not Applicable
RiskometerThis Product is suitable for investors who are seeking*:
• Medium term savings solution
• A Gilt Fund that aims to generate income through investment in Gilts of various maturities.
*Investors should consult their financial advisers if in doubt about whether the product is suitable for them.
Dividend History : Refer page no. from 127 to 135
SIP Returns : Refer page no. from 123 to 125
Total Expense Ratio @@ :
IPGFTP(PF) : 0.52% p. a.
IPGFTP(PF) Direct Plan : 0.26% p. a.
Investment Objective : Refer page no. from 136 to 139
Notes:1. Different plans shall have different expense structure. The performance details provided herein are of ICICI Prudential Gilt Fund - Treasury Plan - PF Option.2. The scheme is currently managed and . Mr. has been managing this fund since . Total Schemes managed Rahul Goswami Anuj Tagra Rahul Goswami Sep 2012by the Fund Manager . Refer annexure from page no. 99 for performance of other schemes currently managed by .is 11 (9 are jointly managed) Rahul GoswamiMr. Anuj Tagra has been managing this fund since . Total Schemes managed by the Fund Manager . Refer annexure from page Oct 2013 is 5 (5 are jointly managed)no. 99 for performance of other schemes currently managed by Anuj Tagra.3. Date of inception:11-Feb-04.4. Past performance may or may not be sustained in future and the same may not necessarily provide the basis for comparison with other investment.5. Load is not considered for computation of returns.6. In case, the start/end date of the concerned period is a nonbusiness date (NBD), the NAV of the previous date is considered for computation of returns. The NAV per unit shown in the table is as on the start date of the said period
Scheme
CRISIL 10 year Gilt index (Additional Benchmark)
NAV (Rs.) Per Unit (as onOctober 31,2017 : 25.1860)
CAGR (%)
10.00
I-SEC Si-BEX (Benchmark)
Since inception
CurrentValue of
Investment of Rs. 10000
CAGR (%) Current Value of
Investment of Rs. 10000
1 Year 3 Year 5 Year
CAGR (%) Current Value of
Investment of Rs. 10000
CAGR (%) Current Value of
Investment of Rs. 10000
23.3485 19.7766 17.9703
Particulars
7.80 10786.99 8.39 12735.25 6.98 14015.35 6.96 25186.00
6.95 10700.58 8.53 12787.85 8.35 14934.95 7.45 26805.25
5.11 10515.70 9.43 13106.66 7.89 14621.69 5.70 21395.00
94.88%
5.12%
0% 20% 40% 60% 80% 100%
Sovereign Securities
CBLO & Current Assets
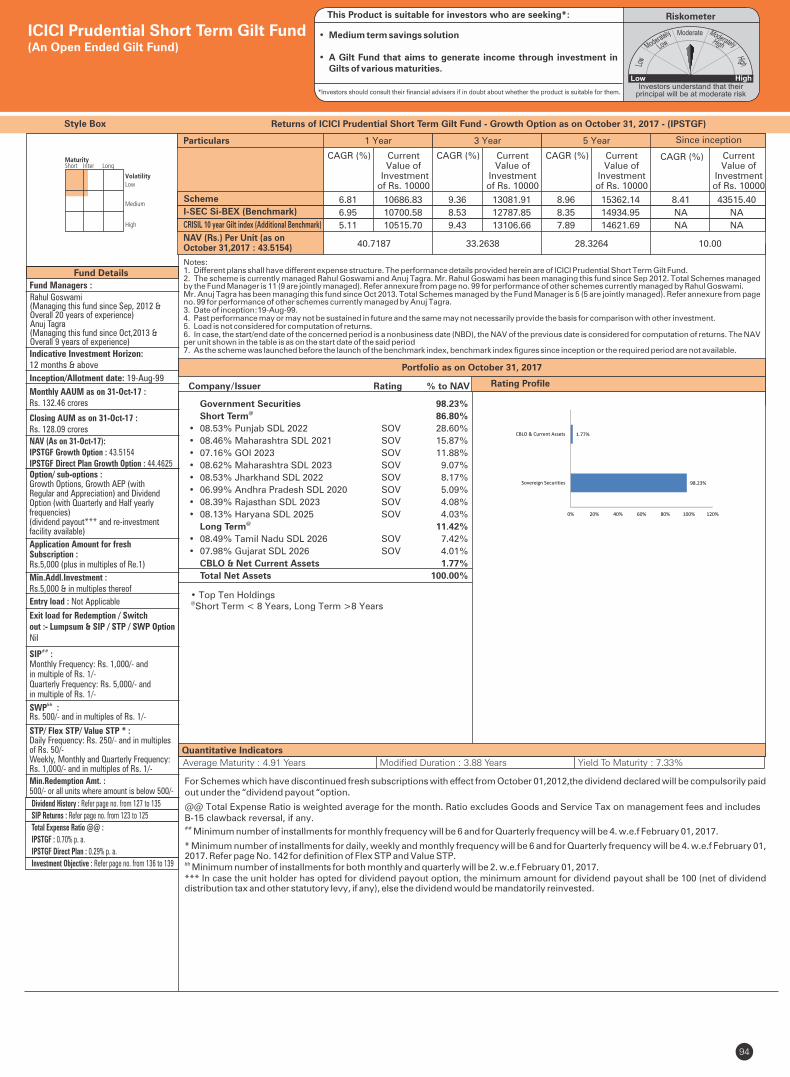
94
Style Box
Fund Details
Quantitative Indicators
Portfolio as on October 31, 2017
Company/Issuer % to NAVRating
Fund Managers :
Rahul Goswami (Managing this fund since Sep, 2012 & Overall 20 years of experience) Anuj Tagra (Managing this fund since Oct,2013 & Overall 9 years of experience)
Indicative Investment Horizon:12 months & above
Inception/Allotment date: 19-Aug-99
Monthly AAUM as on 31-Oct-17 : Rs. 132.46 crores
Closing AUM as on 31-Oct-17 : Rs. 128.09 crores
NAV (As on 31-Oct-17):IPSTGF Growth Option : 43.5154IPSTGF Direct Plan Growth Option : 44.4625Option/ sub-options :Growth Options, Growth AEP (withRegular and Appreciation) and Dividend Option (with Quarterly and Half yearly frequencies)(dividend payout*** and re-investment facility available)
Application Amount for freshSubscription :Rs.5,000 (plus in multiples of Re.1)
Min.Addl.Investment :Rs.5,000 & in multiples thereof
Exit load for Redemption / Switchout :- Lumpsum & SIP / STP / SWP OptionNil
SIP :##
Monthly Frequency: Rs. 1,000/- and in multiple of Rs. 1/-Quarterly Frequency: Rs. 5,000/- and in multiple of Rs. 1/-
&&SWP :Rs. 500/- and in multiples of Rs. 1/-
STP/ Flex STP/ Value STP * :Daily Frequency: Rs. 250/- and in multiples of Rs. 50/-Weekly, Monthly and Quarterly Frequency: Rs. 1,000/- and in multiples of Rs. 1/-
Min.Redemption Amt. :500/- or all units where amount is below 500/-
For Schemes which have discontinued fresh subscriptions with effect from October 01,2012,the dividend declared will be compulsorily paid out under the “dividend payout “option.
@@ Total Expense Ratio is weighted average for the month. Ratio excludes Goods and Service Tax on management fees and includes B-15 clawback reversal, if any.## Minimum number of installments for monthly frequency will be 6 and for Quarterly frequency will be 4. w.e.f February 01, 2017.
* Minimum number of installments for daily, weekly and monthly frequency will be 6 and for Quarterly frequency will be 4. w.e.f February 01, 2017. Refer page No. 142 for definition of Flex STP and Value STP.&& Minimum number of installments for both monthly and quarterly will be 2. w.e.f February 01, 2017.*** In case the unit holder has opted for dividend payout option, the minimum amount for dividend payout shall be 100 (net of dividend distribution tax and other statutory levy, if any), else the dividend would be mandatorily reinvested.
Government Securities 98.23%@ Short Term 86.80%
• 08.53% Punjab SDL 2022 SOV 28.60%
• 08.46% Maharashtra SDL 2021 SOV 15.87%
• 07.16% GOI 2023 SOV 11.88%
• 08.62% Maharashtra SDL 2023 SOV 9.07%
• 08.53% Jharkhand SDL 2022 SOV 8.17%
• 06.99% Andhra Pradesh SDL 2020 SOV 5.09%
• 08.39% Rajasthan SDL 2023 SOV 4.08%
• 08.13% Haryana SDL 2025 SOV 4.03%@ Long Term 11.42%
• 08.49% Tamil Nadu SDL 2026 SOV 7.42%
• 07.98% Gujarat SDL 2026 SOV 4.01%
CBLO & Net Current Assets 1.77%
Total Net Assets 100.00%
Rating Profile
Returns of ICICI Prudential Short Term Gilt Fund - Growth Option as on - (IPSTGF)October 31, 2017
Average Maturity : 4.91 Years Modified Duration : 3.88 Years Yield To Maturity : 7.33%
• Top Ten HoldingsShort Term < 8 Years, Long Term >8 Years@
ICICI Prudential Short Term Gilt Fund(An Open Ended Gilt Fund)
Entry load : Not Applicable
RiskometerThis Product is suitable for investors who are seeking*:
• Medium term savings solution
• A Gilt Fund that aims to generate income through investment in Gilts of various maturities.
*Investors should consult their financial advisers if in doubt about whether the product is suitable for them.
Dividend History : Refer page no. from 127 to 135
SIP Returns : Refer page no. from 123 to 125
Total Expense Ratio @@ :
IPSTGF : 0.70% p. a.
IPSTGF Direct Plan : 0.29% p. a.
Investment Objective : Refer page no. from 136 to 139
Notes:1. Different plans shall have different expense structure. The performance details provided herein are of ICICI Prudential Short Term Gilt Fund.2. The scheme is currently managed and . Mr. has been managing this fund since . Total Schemes managed Rahul Goswami Anuj Tagra Rahul Goswami Sep 2012by the Fund Manager . Refer annexure from page no. 99 for performance of other schemes currently managed by .is 11 (9 are jointly managed) Rahul GoswamiMr. Anuj Tagra has been managing this fund since . Total Schemes managed by the Fund Manager . Refer annexure from page Oct 2013 is 5 (5 are jointly managed)no. 99 for performance of other schemes currently managed by Anuj Tagra.3. Date of inception:19-Aug-99.4. Past performance may or may not be sustained in future and the same may not necessarily provide the basis for comparison with other investment.5. Load is not considered for computation of returns.6. In case, the start/end date of the concerned period is a nonbusiness date (NBD), the NAV of the previous date is considered for computation of returns. The NAV per unit shown in the table is as on the start date of the said period7. As the scheme was launched before the launch of the benchmark index, benchmark index figures since inception or the required period are not available.
Scheme
CRISIL 10 year Gilt index (Additional Benchmark)
NAV (Rs.) Per Unit (as on October 31,2017 : 43.5154)
CAGR (%)
10.00
I-SEC Si-BEX (Benchmark)
Since inception
CurrentValue of
Investment of Rs. 10000
CAGR (%) Current Value of
Investment of Rs. 10000
1 Year 3 Year 5 Year
CAGR (%) Current Value of
Investment of Rs. 10000
CAGR (%) Current Value of
Investment of Rs. 10000
40.7187 33.2638 28.3264
Particulars
6.81 10686.83 9.36 13081.91 8.96 15362.14 8.41 43515.40
6.95 10700.58 8.53 12787.85 8.35 14934.95 NA NA
5.11 10515.70 9.43 13106.66 7.89 14621.69 NA NA
98.23%
1.77%
0% 20% 40% 60% 80% 100% 120%
Sovereign Securities
CBLO & Current Assets
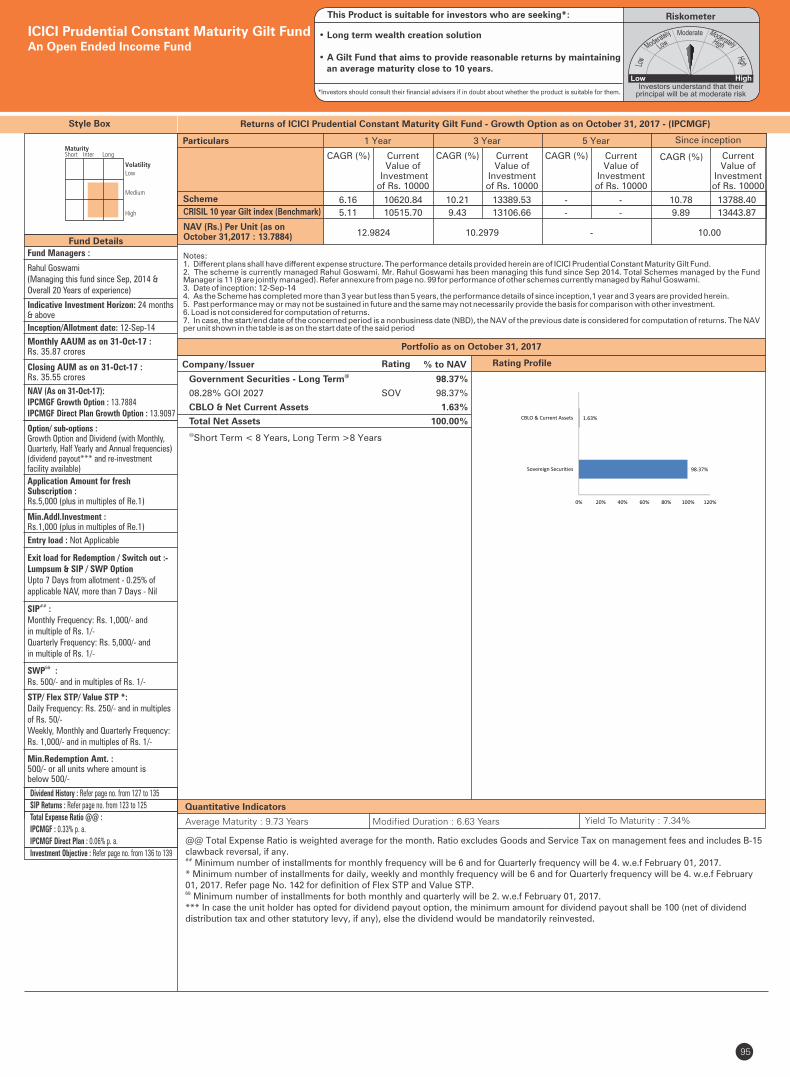
Style Box
Fund Managers :
Rahul Goswami(Managing this fund since Sep, 2014 &Overall 20 Years of experience)
Indicative Investment Horizon: 24 months & above
Inception/Allotment date: 12-Sep-14
&&SWP :Rs. 500/- and in multiples of Rs. 1/-
SIP :##
Monthly Frequency: Rs. 1,000/- and in multiple of Rs. 1/-Quarterly Frequency: Rs. 5,000/- and in multiple of Rs. 1/-
NAV (As on 31-Oct-17):IPCMGF Growth Option : 13.7884IPCMGF Direct Plan Growth Option : 13.9097
Option/ sub-options :Growth Option and Dividend (with Monthly, Quarterly, Half Yearly and Annual frequencies)(dividend payout*** and re-investment facility available)
Application Amount for freshSubscription :Rs.5,000 (plus in multiples of Re.1)
Min.Addl.Investment :Rs.1,000 (plus in multiples of Re.1)
Exit load for Redemption / Switch out :- Lumpsum & SIP / SWP OptionUpto 7 Days from allotment - 0.25% ofapplicable NAV, more than 7 Days - Nil
95
Fund Details
Returns of ICICI Prudential Constant Maturity Gilt Fund - Growth Option as on - (IPCMGF)October 31, 2017
Quantitative Indicators
Average Maturity : 9.73 Years Modified Duration : 6.63 Years Yield To Maturity : 7.34%
Monthly AAUM as on 31-Oct-17 : Rs. 35.87 crores
Closing AUM as on 31-Oct-17 : Rs. 35.55 crores
ICICI Prudential Constant Maturity Gilt FundAn Open Ended Income Fund
Company/Issuer % to NAVRating Rating Profile@Government Securities - Long Term 98.37%
08.28% GOI 2027 SOV 98.37%
CBLO & Net Current Assets 1.63%
Total Net Assets 100.00%
@Short Term < 8 Years, Long Term >8 Years
Portfolio as on October 31, 2017
Entry load : Not Applicable
RiskometerThis Product is suitable for investors who are seeking*:
• Long term wealth creation solution
• A Gilt Fund that aims to provide reasonable returns by maintaining an average maturity close to 10 years.
*Investors should consult their financial advisers if in doubt about whether the product is suitable for them.
Min.Redemption Amt. :500/- or all units where amount isbelow 500/-
Dividend History : Refer page no. from 127 to 135
SIP Returns : Refer page no. from 123 to 125
Total Expense Ratio @@ :
IPCMGF : 0.33% p. a.
IPCMGF Direct Plan : 0.06% p. a.
Investment Objective : Refer page no. from 136 to 139
@@ Total Expense Ratio is weighted average for the month. Ratio excludes Goods and Service Tax on management fees and includes B-15 clawback reversal, if any.## Minimum number of installments for monthly frequency will be 6 and for Quarterly frequency will be 4. w.e.f February 01, 2017.* Minimum number of installments for daily, weekly and monthly frequency will be 6 and for Quarterly frequency will be 4. w.e.f February 01, 2017. Refer page No. 142 for definition of Flex STP and Value STP.&& Minimum number of installments for both monthly and quarterly will be 2. w.e.f February 01, 2017.*** In case the unit holder has opted for dividend payout option, the minimum amount for dividend payout shall be 100 (net of dividend distribution tax and other statutory levy, if any), else the dividend would be mandatorily reinvested.
STP/ Flex STP/ Value STP *:Daily Frequency: Rs. 250/- and in multiples of Rs. 50/-Weekly, Monthly and Quarterly Frequency: Rs. 1,000/- and in multiples of Rs. 1/-
Notes:1. Different plans shall have different expense structure. The performance details provided herein are of ICICI Prudential Constant Maturity Gilt Fund.2. The scheme is currently managed . Mr. has been managing this fund since 4. Total Schemes managed by the Fund Rahul Goswami Rahul Goswami Sep 201Manager . Refer annexure from page no. 99 for performance of other schemes currently managed by .is 11 (9 are jointly managed) Rahul Goswami3. Date of inception: 12-Sep-144. As the Scheme has completed more than 3 year but less than 5 years, the performance details of since inception,1 year and 3 years are provided herein.5. Past performance may or may not be sustained in future and the same may not necessarily provide the basis for comparison with other investment.6. Load is not considered for computation of returns.7. In case, the start/end date of the concerned period is a nonbusiness date (NBD), the NAV of the previous date is considered for computation of returns. The NAV per unit shown in the table is as on the start date of the said period
Scheme
NAV (Rs.) Per Unit (as on October 31,2017 : 13.7884)
CAGR (%)
10.00
CRISIL 10 year Gilt index (Benchmark)
Since inception
CurrentValue of
Investment of Rs. 10000
CAGR (%) Current Value of
Investment of Rs. 10000
1 Year 3 Year 5 Year
CAGR (%) Current Value of
Investment of Rs. 10000
CAGR (%) Current Value of
Investment of Rs. 10000
12.9824 10.2979 -
Particulars
6.16 10620.84 10.21 13389.53 - - 10.78 13788.40
5.11 10515.70 9.43 13106.66 - - 9.89 13443.87
98.37%
1.63%
0% 20% 40% 60% 80% 100% 120%
Sovereign Securities
CBLO & Current Assets
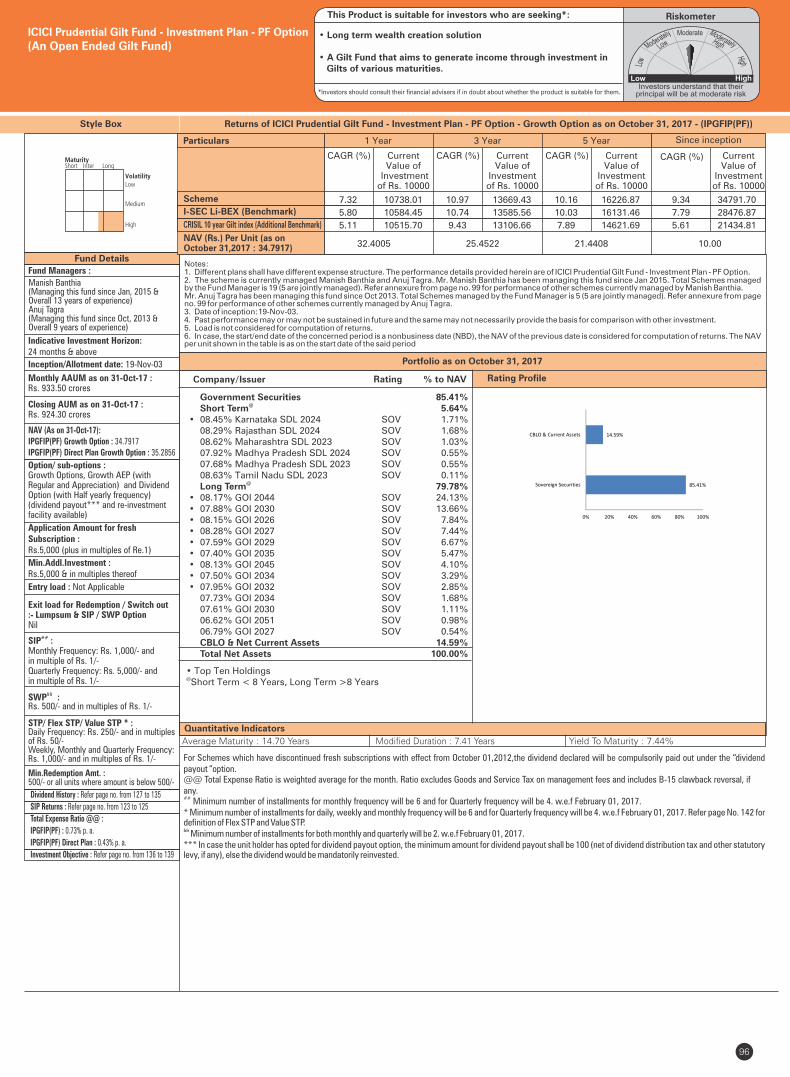
96
Style Box
Portfolio as on October 31, 2017
Quantitative Indicators
For Schemes which have discontinued fresh subscriptions with effect from October 01,2012,the dividend declared will be compulsorily paid out under the “dividend payout “option.@@ Total Expense Ratio is weighted average for the month. Ratio excludes Goods and Service Tax on management fees and includes B-15 clawback reversal, if any.## Minimum number of installments for monthly frequency will be 6 and for Quarterly frequency will be 4. w.e.f February 01, 2017.* Minimum number of installments for daily, weekly and monthly frequency will be 6 and for Quarterly frequency will be 4. w.e.f February 01, 2017. Refer page No. 142 for definition of Flex STP and Value STP.&& Minimum number of installments for both monthly and quarterly will be 2. w.e.f February 01, 2017.*** In case the unit holder has opted for dividend payout option, the minimum amount for dividend payout shall be 100 (net of dividend distribution tax and other statutory levy, if any), else the dividend would be mandatorily reinvested.
Fund Managers :
Fund Details
Manish Banthia(Managing this fund since Jan, 2015 & Overall 13 years of experience)Anuj Tagra(Managing this fund since Oct, 2013 & Overall 9 years of experience)
Indicative Investment Horizon:24 months & above
Inception/Allotment date: 19-Nov-03
Monthly AAUM as on 31-Oct-17 : Rs. 933.50 crores
Closing AUM as on 31-Oct-17 : Rs. 924.30 crores
NAV (As on 31-Oct-17):IPGFIP(PF) Growth Option : 34.7917IPGFIP(PF) Direct Plan Growth Option : 35.2856
Option/ sub-options :Growth Options, Growth AEP (withRegular and Appreciation) and Dividend Option (with Half yearly frequency)(dividend payout*** and re-investment facility available)
Application Amount for freshSubscription :Rs.5,000 (plus in multiples of Re.1)
Min.Addl.Investment :Rs.5,000 & in multiples thereof
Exit load for Redemption / Switch out:- Lumpsum & SIP / SWP OptionNil
SIP :##
Monthly Frequency: Rs. 1,000/- and in multiple of Rs. 1/-Quarterly Frequency: Rs. 5,000/- and in multiple of Rs. 1/-
&&SWP :Rs. 500/- and in multiples of Rs. 1/-
STP/ Flex STP/ Value STP * :Daily Frequency: Rs. 250/- and in multiples of Rs. 50/-Weekly, Monthly and Quarterly Frequency: Rs. 1,000/- and in multiples of Rs. 1/-
Min.Redemption Amt. :500/- or all units where amount is below 500/-
Rating Profile
Returns of ICICI Prudential Gilt Fund - Investment Plan - PF Option - Growth Option as on - (IPGFIP(PF))October 31, 2017
Average Maturity : 14.70 Years Modified Duration : 7.41 Years Yield To Maturity : 7.44%
• Top Ten Holdings@Short Term < 8 Years, Long Term >8 Years
ICICI Prudential Gilt Fund - Investment Plan - PF Option
(An Open Ended Gilt Fund)
Entry load : Not Applicable
RiskometerThis Product is suitable for investors who are seeking*:
• Long term wealth creation solution
• A Gilt Fund that aims to generate income through investment in Gilts of various maturities.
*Investors should consult their financial advisers if in doubt about whether the product is suitable for them.
Government Securities 85.41%@ Short Term 5.64%
• 08.45% Karnataka SDL 2024 SOV 1.71% 08.29% Rajasthan SDL 2024 SOV 1.68% 08.62% Maharashtra SDL 2023 SOV 1.03% 07.92% Madhya Pradesh SDL 2024 SOV 0.55% 07.68% Madhya Pradesh SDL 2023 SOV 0.55% 08.63% Tamil Nadu SDL 2023 SOV 0.11%
@ Long Term 79.78%• 08.17% GOI 2044 SOV 24.13%• 07.88% GOI 2030 SOV 13.66%• 08.15% GOI 2026 SOV 7.84%• 08.28% GOI 2027 SOV 7.44%• 07.59% GOI 2029 SOV 6.67%• 07.40% GOI 2035 SOV 5.47%• 08.13% GOI 2045 SOV 4.10%• 07.50% GOI 2034 SOV 3.29%• 07.95% GOI 2032 SOV 2.85% 07.73% GOI 2034 SOV 1.68% 07.61% GOI 2030 SOV 1.11% 06.62% GOI 2051 SOV 0.98% 06.79% GOI 2027 SOV 0.54% CBLO & Net Current Assets 14.59% Total Net Assets 100.00%
Company/Issuer % to NAVRating
Dividend History : Refer page no. from 127 to 135
SIP Returns : Refer page no. from 123 to 125
Total Expense Ratio @@ :
IPGFIP(PF) : 0.73% p. a.
IPGFIP(PF) Direct Plan : 0.43% p. a.
Investment Objective : Refer page no. from 136 to 139
Notes:1. Different plans shall have different expense structure. The performance details provided herein are of ICICI Prudential Gilt Fund - Investment Plan - PF Option.2. The scheme is currently managed Manish Banthia and . Mr. Manish Banthia has been managing this fund since . Total Schemes managed Anuj Tagra Jan 2015by the Fund Manager . Refer annexure from page no. 99 for performance of other schemes currently managed by Manish Banthia. is 19 (5 are jointly managed) Mr. has been managing this fund since . Total Schemes managed by the Fund Manager . Refer annexure from page Anuj Tagra Oct 2013 is 5 (5 are jointly managed)no. 99 for performance of other schemes currently managed by . Anuj Tagra3. Date of inception:19-Nov-03.4. Past performance may or may not be sustained in future and the same may not necessarily provide the basis for comparison with other investment.5. Load is not considered for computation of returns.6. In case, the start/end date of the concerned period is a nonbusiness date (NBD), the NAV of the previous date is considered for computation of returns. The NAV per unit shown in the table is as on the start date of the said period
Scheme
CRISIL 10 year Gilt index (Additional Benchmark)
NAV (Rs.) Per Unit (as on October 31,2017 : 34.7917)
CAGR (%)
10.00
I-SEC Li-BEX (Benchmark)
Since inception
CurrentValue of
Investment of Rs. 10000
CAGR (%) Current Value of
Investment of Rs. 10000
1 Year 3 Year 5 Year
CAGR (%) Current Value of
Investment of Rs. 10000
CAGR (%) Current Value of
Investment of Rs. 10000
32.4005 25.4522 21.4408
Particulars
7.32 10738.01 10.97 13669.43 10.16 16226.87 9.34 34791.70
5.80 10584.45 10.74 13585.56 10.03 16131.46 7.79 28476.87
5.11 10515.70 9.43 13106.66 7.89 14621.69 5.61 21434.81
85.41%
14.59%
0% 20% 40% 60% 80% 100%
Sovereign Securities
CBLO & Current Assets
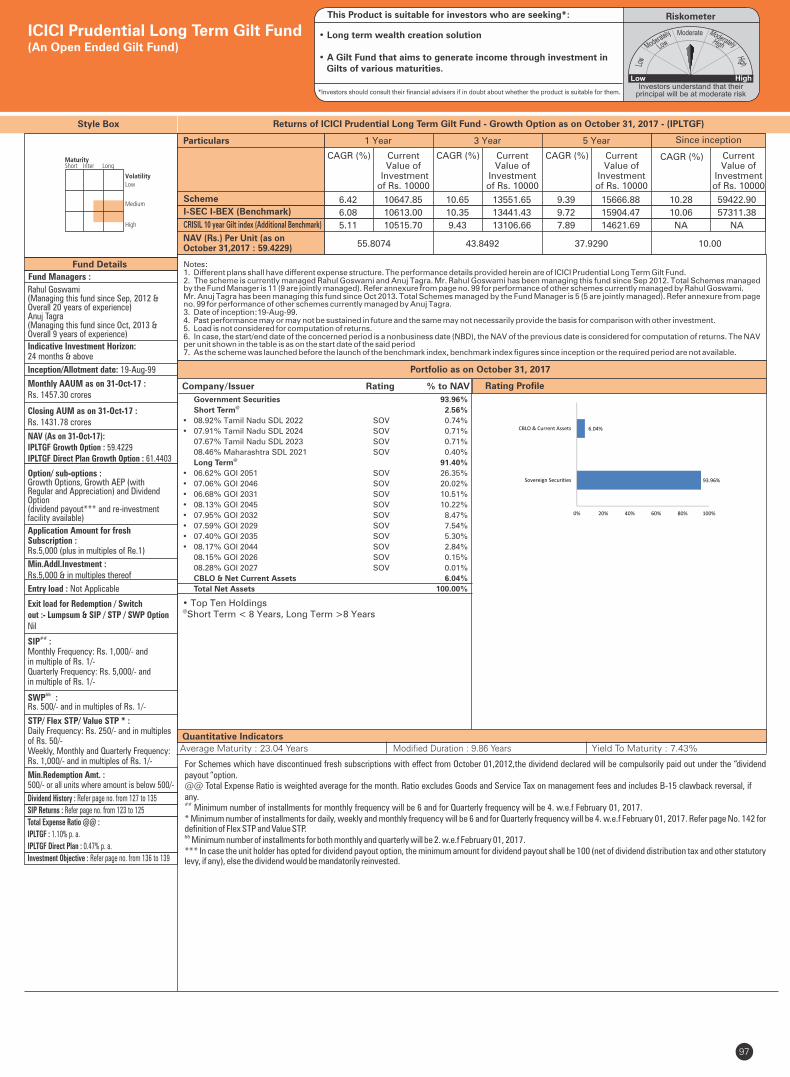
97
Style Box
Fund Details
Rating Profile
Quantitative Indicators
Portfolio as on October 31, 2017
Company/Issuer % to NAVRating
For Schemes which have discontinued fresh subscriptions with effect from October 01,2012,the dividend declared will be compulsorily paid out under the “dividend payout “option.@@ Total Expense Ratio is weighted average for the month. Ratio excludes Goods and Service Tax on management fees and includes B-15 clawback reversal, if any.## Minimum number of installments for monthly frequency will be 6 and for Quarterly frequency will be 4. w.e.f February 01, 2017.* Minimum number of installments for daily, weekly and monthly frequency will be 6 and for Quarterly frequency will be 4. w.e.f February 01, 2017. Refer page No. 142 for definition of Flex STP and Value STP.&& Minimum number of installments for both monthly and quarterly will be 2. w.e.f February 01, 2017.*** In case the unit holder has opted for dividend payout option, the minimum amount for dividend payout shall be 100 (net of dividend distribution tax and other statutory levy, if any), else the dividend would be mandatorily reinvested.
Fund Managers :
Rahul Goswami (Managing this fund since Sep, 2012 & Overall 20 years of experience)Anuj Tagra (Managing this fund since Oct, 2013 & Overall 9 years of experience)
Indicative Investment Horizon:24 months & above
Inception/Allotment date: 19-Aug-99
Monthly AAUM as on 31-Oct-17 :Rs. 1457.30 crores
Closing AUM as on 31-Oct-17 : Rs. 1431.78 crores
NAV (As on 31-Oct-17):IPLTGF Growth Option : 59.4229IPLTGF Direct Plan Growth Option : 61.4403
Option/ sub-options :Growth Options, Growth AEP (withRegular and Appreciation) and Dividend Option(dividend payout*** and re-investment facility available)
Application Amount for freshSubscription :Rs.5,000 (plus in multiples of Re.1)
Min.Addl.Investment :Rs.5,000 & in multiples thereof
Exit load for Redemption / Switchout :- Lumpsum & SIP / STP / SWP OptionNil
SIP :##
Monthly Frequency: Rs. 1,000/- and in multiple of Rs. 1/-Quarterly Frequency: Rs. 5,000/- and in multiple of Rs. 1/-
&&SWP :Rs. 500/- and in multiples of Rs. 1/-
STP/ Flex STP/ Value STP * :Daily Frequency: Rs. 250/- and in multiples of Rs. 50/-Weekly, Monthly and Quarterly Frequency: Rs. 1,000/- and in multiples of Rs. 1/-
Min.Redemption Amt. :500/- or all units where amount is below 500/-
Government Securities 93.96%@ Short Term 2.56%
• 08.92% Tamil Nadu SDL 2022 SOV 0.74%
• 07.91% Tamil Nadu SDL 2024 SOV 0.71%
07.67% Tamil Nadu SDL 2023 SOV 0.71%
08.46% Maharashtra SDL 2021 SOV 0.40%@ Long Term 91.40%
• 06.62% GOI 2051 SOV 26.35%
• 07.06% GOI 2046 SOV 20.02%
• 06.68% GOI 2031 SOV 10.51%
• 08.13% GOI 2045 SOV 10.22%
• 07.95% GOI 2032 SOV 8.47%
• 07.59% GOI 2029 SOV 7.54%
• 07.40% GOI 2035 SOV 5.30%
• 08.17% GOI 2044 SOV 2.84%
08.15% GOI 2026 SOV 0.15%
08.28% GOI 2027 SOV 0.01%
CBLO & Net Current Assets 6.04%
Total Net Assets 100.00%
Returns of ICICI Prudential Long Term Gilt Fund - Growth Option as on - (IPLTGF)October 31, 2017
Average Maturity : 23.04 Years Modified Duration : 9.86 Years Yield To Maturity : 7.43%
• Top Ten Holdings@Short Term < 8 Years, Long Term >8 Years
ICICI Prudential Long Term Gilt Fund(An Open Ended Gilt Fund)
Entry load : Not Applicable
RiskometerThis Product is suitable for investors who are seeking*:
• Long term wealth creation solution
• A Gilt Fund that aims to generate income through investment in Gilts of various maturities.
*Investors should consult their financial advisers if in doubt about whether the product is suitable for them.
Dividend History : Refer page no. from 127 to 135
SIP Returns : Refer page no. from 123 to 125
Total Expense Ratio @@ :
IPLTGF : 1.10% p. a.
IPLTGF Direct Plan : 0.47% p. a.
Investment Objective : Refer page no. from 136 to 139
Notes:1. Different plans shall have different expense structure. The performance details provided herein are of ICICI Prudential Long Term Gilt Fund.2. The scheme is currently managed and . Mr. has been managing this fund since . Total Schemes managed Rahul Goswami Anuj Tagra Rahul Goswami Sep 2012by the Fund Manager . Refer annexure from page no. 99 for performance of other schemes currently managed by .is 11 (9 are jointly managed) Rahul GoswamiMr. Anuj Tagra has been managing this fund since . Total Schemes managed by the Fund Manager . Refer annexure from page Oct 2013 is 5 (5 are jointly managed)no. 99 for performance of other schemes currently managed by Anuj Tagra.3. Date of inception:19-Aug-99.4. Past performance may or may not be sustained in future and the same may not necessarily provide the basis for comparison with other investment.5. Load is not considered for computation of returns.6. In case, the start/end date of the concerned period is a nonbusiness date (NBD), the NAV of the previous date is considered for computation of returns. The NAV per unit shown in the table is as on the start date of the said period7. As the scheme was launched before the launch of the benchmark index, benchmark index figures since inception or the required period are not available.
Scheme
CRISIL 10 year Gilt index (Additional Benchmark)
NAV (Rs.) Per Unit (as onOctober 31,2017 : 59.4229)
CAGR (%)
10.00
I-SEC I-BEX (Benchmark)
Since inception
CurrentValue of
Investment of Rs. 10000
CAGR (%) Current Value of
Investment of Rs. 10000
1 Year 3 Year 5 Year
CAGR (%) Current Value of
Investment of Rs. 10000
CAGR (%) Current Value of
Investment of Rs. 10000
55.8074 43.8492 37.9290
Particulars
6.42 10647.85 10.65 13551.65 9.39 15666.88 10.28 59422.90
6.08 10613.00 10.35 13441.43 9.72 15904.47 10.06 57311.38
5.11 10515.70 9.43 13106.66 7.89 14621.69 NA NA
93.96%
6.04%
0% 20% 40% 60% 80% 100%
Sovereign Securities
CBLO & Current Assets
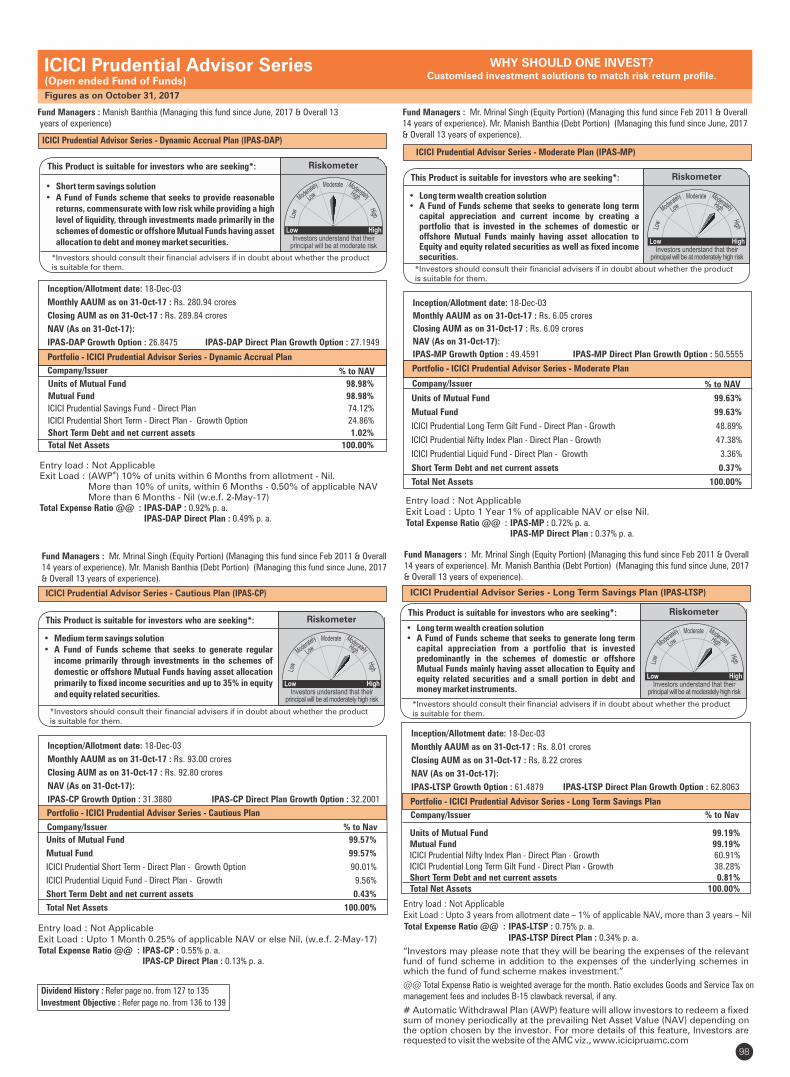
Fund Managers : Manish Banthia (Managing this fund since June, 2017 & Overall 13 years of experience)
ICICI Prudential Advisor Series - Dynamic Accrual Plan (IPAS-DAP)
Inception/Allotment date: 18-Dec-03
Monthly AAUM as on 31-Oct-17 : Rs. 280.94 crores
Closing AUM as on 31-Oct-17 : Rs. 289.84 crores
NAV (As on 31-Oct-17):
IPAS-DAP Growth Option : 26.8475 IPAS-DAP Direct Plan Growth Option : 27.1949
Portfolio - ICICI Prudential Advisor Series - Dynamic Accrual Plan
Company/Issuer % to NAV
Inception/Allotment date: 18-Dec-03
Monthly AAUM as on 31-Oct-17 : Rs. 6.05 crores
Closing AUM as on 31-Oct-17 : Rs. 6.09 crores
NAV (As on 31-Oct-17):
IPAS-MP Growth Option : 49.4591 IPAS-MP Direct Plan Growth Option : 50.5555
Portfolio - ICICI Prudential Advisor Series - Moderate Plan
Company/Issuer
Entry load : Not ApplicableExit Load : Upto 1 Year 1% of applicable NAV or else Nil.Total Expense Ratio @@ : IPAS-MP : 0.72% p. a. IPAS-MP Direct Plan : 0.37% p. a.
Entry load : Not Applicable#Exit Load : (AWP ) 10% of units within 6 Months from allotment - Nil.
More than 10% of units, within 6 Months - 0.50% of applicable NAV More than 6 Months - Nil (w.e.f. 2-May-17) Total Expense Ratio @@ : IPAS-DAP : 0.92% p. a. IPAS-DAP Direct Plan : 0.49% p. a.
Entry load : Not ApplicableExit Load : Upto 3 years from allotment date – 1% of applicable NAV, more than 3 years – Nil
ICICI Prudential Advisor Series(Open ended Fund of Funds)
WHY SHOULD ONE INVEST?Customised investment solutions to match risk return profile.
ICICI Prudential Advisor Series - Moderate Plan (IPAS-MP)
Figures as on October 31, 2017
% to NAVUnits of Mutual Fund 98.98%
Mutual Fund 98.98%
ICICI Prudential Savings Fund - Direct Plan 74.12%
ICICI Prudential Short Term - Direct Plan - Growth Option 24.86%
Short Term Debt and net current assets 1.02%
Total Net Assets 100.00%
Units of Mutual Fund 99.63%
Mutual Fund 99.63%
ICICI Prudential Long Term Gilt Fund - Direct Plan - Growth 48.89%
ICICI Prudential Nifty Index Plan - Direct Plan - Growth 47.38%
ICICI Prudential Liquid Fund - Direct Plan - Growth 3.36%
Short Term Debt and net current assets 0.37%
Total Net Assets 100.00%
“Investors may please note that they will be bearing the expenses of the relevantfund of fund scheme in addition to the expenses of the underlying schemes inwhich the fund of fund scheme makes investment.”
98
This Product is suitable for investors who are seeking*:
• Short term savings solution• A Fund of Funds scheme that seeks to provide reasonable
returns, commensurate with low risk while providing a high level of liquidity, through investments made primarily in the schemes of domestic or offshore Mutual Funds having asset allocation to debt and money market securities.
*Investors should consult their financial advisers if in doubt about whether the productis suitable for them.
Riskometer
This Product is suitable for investors who are seeking*:
• Long term wealth creation solution• A Fund of Funds scheme that seeks to generate long term
capital appreciation and current income by creating a portfolio that is invested in the schemes of domestic or offshore Mutual Funds mainly having asset allocation to Equity and equity related securities as well as fixed income securities.
*Investors should consult their financial advisers if in doubt about whether the productis suitable for them.
Riskometer
ICICI Prudential Advisor Series - Cautious Plan (IPAS-CP)
Inception/Allotment date: 18-Dec-03
Monthly AAUM as on 31-Oct-17 : Rs. 93.00 crores
Closing AUM as on 31-Oct-17 : Rs. 92.80 crores
NAV (As on 31-Oct-17):
IPAS-CP Growth Option : 31.3880 IPAS-CP Direct Plan Growth Option : 32.2001
Portfolio - ICICI Prudential Advisor Series - Cautious Plan
Company/Issuer % to Nav
Entry load : Not ApplicableExit Load : Upto 1 Month 0.25% of applicable NAV or else Nil. (w.e.f. 2-May-17) Total Expense Ratio @@ : IPAS-CP : 0.55% p. a. IPAS-CP Direct Plan : 0.13% p. a.
Units of Mutual Fund 99.57%
Mutual Fund 99.57%
ICICI Prudential Short Term - Direct Plan - Growth Option 90.01%
ICICI Prudential Liquid Fund - Direct Plan - Growth 9.56%
Short Term Debt and net current assets 0.43%
Total Net Assets 100.00%
This Product is suitable for investors who are seeking*:
• Medium term savings solution• A Fund of Funds scheme that seeks to generate regular
income primarily through investments in the schemes of domestic or offshore Mutual Funds having asset allocation primarily to fixed income securities and up to 35% in equity and equity related securities.
Riskometer
*Investors should consult their financial advisers if in doubt about whether the productis suitable for them.
ICICI Prudential Advisor Series - Long Term Savings Plan (IPAS-LTSP)
Inception/Allotment date: 18-Dec-03
Monthly AAUM as on 31-Oct-17 : Rs. 8.01 crores
Closing AUM as on 31-Oct-17 : Rs. 8.22 crores
NAV (As on 31-Oct-17):
IPAS-LTSP Growth Option : 61.4879 IPAS-LTSP Direct Plan Growth Option : 62.8063
Company/Issuer % to Nav
Portfolio - ICICI Prudential Advisor Series - Long Term Savings Plan
Units of Mutual Fund 99.19%Mutual Fund 99.19%ICICI Prudential Nifty Index Plan - Direct Plan - Growth 60.91%ICICI Prudential Long Term Gilt Fund - Direct Plan - Growth 38.28%Short Term Debt and net current assets 0.81%Total Net Assets 100.00%
This Product is suitable for investors who are seeking*:
• Long term wealth creation solution• A Fund of Funds scheme that seeks to generate long term
capital appreciation from a portfolio that is invested predominantly in the schemes of domestic or offshore Mutual Funds mainly having asset allocation to Equity and equity related securities and a small portion in debt and money market instruments.
Riskometer
*Investors should consult their financial advisers if in doubt about whether the productis suitable for them.
Dividend History : Refer page no. from 127 to 135
Investment Objective : Refer page no. from 136 to 139
Total Expense Ratio @@ : IPAS-LTSP : 0.75% p. a. IPAS-LTSP Direct Plan : 0.34% p. a.
@@ Total Expense Ratio is weighted average for the month. Ratio excludes Goods and Service Tax on management fees and includes B-15 clawback reversal, if any.
# Automatic Withdrawal Plan (AWP) feature will allow investors to redeem a fixed sum of money periodically at the prevailing Net Asset Value (NAV) depending on the option chosen by the investor. For more details of this feature, Investors are requested to visit the website of the AMC viz., www.icicipruamc.com
Fund Managers : Mr. Mrinal Singh (Equity Portion) (Managing this fund since Feb 2011 & Overall 14 years of experience). Mr. Manish Banthia (Debt Portion) (Managing this fund since June, 2017 & Overall 13 years of experience).
Fund Managers : Mr. Mrinal Singh (Equity Portion) (Managing this fund since Feb 2011 & Overall 14 years of experience). Mr. Manish Banthia (Debt Portion) (Managing this fund since June, 2017 & Overall 13 years of experience).
Fund Managers : Mr. Mrinal Singh (Equity Portion) (Managing this fund since Feb 2011 & Overall 14 years of experience). Mr. Manish Banthia (Debt Portion) (Managing this fund since June, 2017 & Overall 13 years of experience).
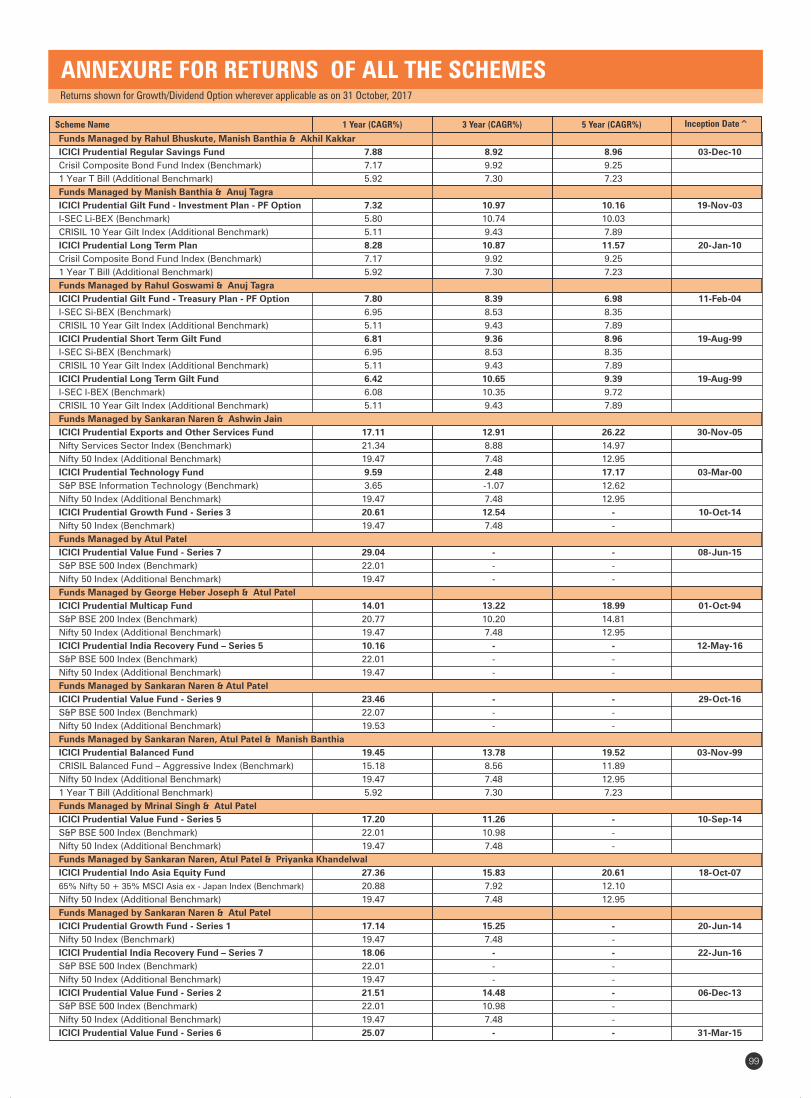
ANNEXURE FOR RETURNS OF ALL THE SCHEMESReturns shown for Growth/Dividend Option wherever applicable as on 31 October, 2017
Scheme Name Inception Date^
99
1 Year (CAGR%) 3 Year (CAGR%) 5 Year (CAGR%)
Funds Managed by Rahul Bhuskute, Manish Banthia & Akhil Kakkar
ICICI Prudential Regular Savings Fund 7.88 8.92 8.96 03-Dec-10
Crisil Composite Bond Fund Index (Benchmark) 7.17 9.92 9.25
1 Year T Bill (Additional Benchmark) 5.92 7.30 7.23
Funds Managed by Manish Banthia & Anuj Tagra
ICICI Prudential Gilt Fund - Investment Plan - PF Option 7.32 10.97 10.16 19-Nov-03
I-SEC Li-BEX (Benchmark) 5.80 10.74 10.03
CRISIL 10 Year Gilt Index (Additional Benchmark) 5.11 9.43 7.89
ICICI Prudential Long Term Plan 8.28 10.87 11.57 20-Jan-10
Crisil Composite Bond Fund Index (Benchmark) 7.17 9.92 9.25
1 Year T Bill (Additional Benchmark) 5.92 7.30 7.23
Funds Managed by Rahul Goswami & Anuj Tagra
ICICI Prudential Gilt Fund - Treasury Plan - PF Option 7.80 8.39 6.98 11-Feb-04
I-SEC Si-BEX (Benchmark) 6.95 8.53 8.35
CRISIL 10 Year Gilt Index (Additional Benchmark) 5.11 9.43 7.89
ICICI Prudential Short Term Gilt Fund 6.81 9.36 8.96 19-Aug-99
I-SEC Si-BEX (Benchmark) 6.95 8.53 8.35
CRISIL 10 Year Gilt Index (Additional Benchmark) 5.11 9.43 7.89
ICICI Prudential Long Term Gilt Fund 6.42 10.65 9.39 19-Aug-99
I-SEC I-BEX (Benchmark) 6.08 10.35 9.72
CRISIL 10 Year Gilt Index (Additional Benchmark) 5.11 9.43 7.89
Funds Managed by Sankaran Naren & Ashwin Jain
ICICI Prudential Exports and Other Services Fund 17.11 12.91 26.22 30-Nov-05
Nifty Services Sector Index (Benchmark) 21.34 8.88 14.97
Nifty 50 Index (Additional Benchmark) 19.47 7.48 12.95
ICICI Prudential Technology Fund 9.59 2.48 17.17 03-Mar-00
S&P BSE Information Technology (Benchmark) 3.65 -1.07 12.62
Nifty 50 Index (Additional Benchmark) 19.47 7.48 12.95
ICICI Prudential Growth Fund - Series 3 20.61 12.54 - 10-Oct-14
Nifty 50 Index (Benchmark) 19.47 7.48 -
Funds Managed by Atul Patel
ICICI Prudential Value Fund - Series 7 29.04 - - 08-Jun-15
S&P BSE 500 Index (Benchmark) 22.01 - -
Nifty 50 Index (Additional Benchmark) 19.47 - -
Funds Managed by George Heber Joseph & Atul Patel
ICICI Prudential Multicap Fund 14.01 13.22 18.99 01-Oct-94
S&P BSE 200 Index (Benchmark) 20.77 10.20 14.81
Nifty 50 Index (Additional Benchmark) 19.47 7.48 12.95
ICICI Prudential India Recovery Fund – Series 5 10.16 - - 12-May-16
S&P BSE 500 Index (Benchmark) 22.01 - -
Nifty 50 Index (Additional Benchmark) 19.47 - -
Funds Managed by Sankaran Naren & Atul Patel
ICICI Prudential Value Fund - Series 9 23.46 - - 29-Oct-16
S&P BSE 500 Index (Benchmark) 22.07 - -
Nifty 50 Index (Additional Benchmark) 19.53 - -
Funds Managed by Sankaran Naren, Atul Patel & Manish Banthia
ICICI Prudential Balanced Fund 19.45 13.78 19.52 03-Nov-99
CRISIL Balanced Fund – Aggressive Index (Benchmark) 15.18 8.56 11.89
Nifty 50 Index (Additional Benchmark) 19.47 7.48 12.95
1 Year T Bill (Additional Benchmark) 5.92 7.30 7.23
Funds Managed by Mrinal Singh & Atul Patel
ICICI Prudential Value Fund - Series 5 17.20 11.26 - 10-Sep-14
S&P BSE 500 Index (Benchmark) 22.01 10.98 -
Nifty 50 Index (Additional Benchmark) 19.47 7.48 -
Funds Managed by Sankaran Naren, Atul Patel & Priyanka Khandelwal
ICICI Prudential Indo Asia Equity Fund 27.36 15.83 20.61 18-Oct-07
65% Nifty 50 + 35% MSCI Asia ex - Japan Index (Benchmark) 20.88 7.92 12.10
Nifty 50 Index (Additional Benchmark) 19.47 7.48 12.95
Funds Managed by Sankaran Naren & Atul Patel
ICICI Prudential Growth Fund - Series 1 17.14 15.25 - 20-Jun-14
Nifty 50 Index (Benchmark) 19.47 7.48 -
ICICI Prudential India Recovery Fund – Series 7 18.06 - - 22-Jun-16
S&P BSE 500 Index (Benchmark) 22.01 - -
Nifty 50 Index (Additional Benchmark) 19.47 - -
ICICI Prudential Value Fund - Series 2 21.51 14.48 - 06-Dec-13
S&P BSE 500 Index (Benchmark) 22.01 10.98 -
Nifty 50 Index (Additional Benchmark) 19.47 7.48 -
ICICI Prudential Value Fund - Series 6 25.07 - - 31-Mar-15
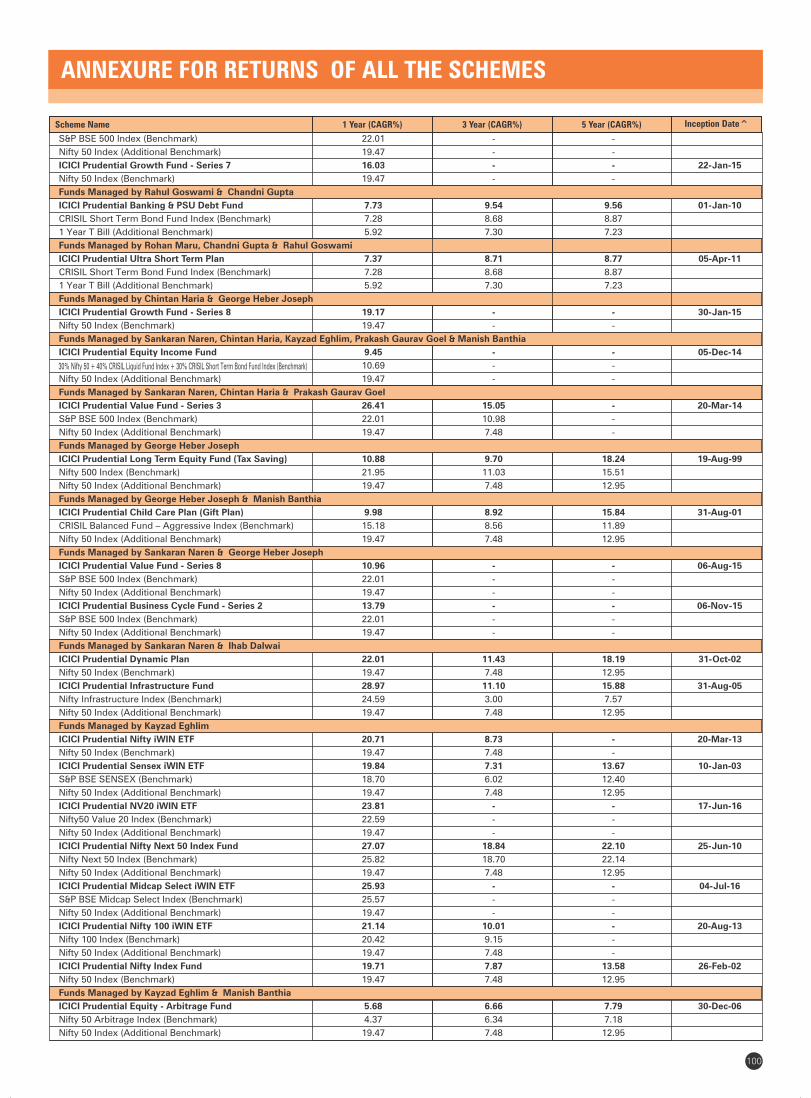
ANNEXURE FOR RETURNS OF ALL THE SCHEMES
Scheme Name Inception Date^
100
1 Year (CAGR%) 3 Year (CAGR%) 5 Year (CAGR%)
30% Nifty 50 + 40% CRISIL Liquid Fund Index + 30% CRISIL Short Term Bond Fund Index (Benchmark)
S&P BSE 500 Index (Benchmark) 22.01 - -
Nifty 50 Index (Additional Benchmark) 19.47 - -
ICICI Prudential Growth Fund - Series 7 16.03 - - 22-Jan-15
Nifty 50 Index (Benchmark) 19.47 - -
Funds Managed by Rahul Goswami & Chandni Gupta
ICICI Prudential Banking & PSU Debt Fund 7.73 9.54 9.56 01-Jan-10
CRISIL Short Term Bond Fund Index (Benchmark) 7.28 8.68 8.87
1 Year T Bill (Additional Benchmark) 5.92 7.30 7.23
Funds Managed by Rohan Maru, Chandni Gupta & Rahul Goswami
ICICI Prudential Ultra Short Term Plan 7.37 8.71 8.77 05-Apr-11
CRISIL Short Term Bond Fund Index (Benchmark) 7.28 8.68 8.87
1 Year T Bill (Additional Benchmark) 5.92 7.30 7.23
Funds Managed by Chintan Haria & George Heber Joseph
ICICI Prudential Growth Fund - Series 8 19.17 - - 30-Jan-15
Nifty 50 Index (Benchmark) 19.47 - -
Funds Managed by Sankaran Naren, Chintan Haria, Kayzad Eghlim, Prakash Gaurav Goel & Manish Banthia
ICICI Prudential Equity Income Fund 9.45 - - 05-Dec-14
10.69 - -
Nifty 50 Index (Additional Benchmark) 19.47 - -
Funds Managed by Sankaran Naren, Chintan Haria & Prakash Gaurav Goel
ICICI Prudential Value Fund - Series 3 26.41 15.05 - 20-Mar-14
S&P BSE 500 Index (Benchmark) 22.01 10.98 -
Nifty 50 Index (Additional Benchmark) 19.47 7.48 -
Funds Managed by George Heber Joseph
ICICI Prudential Long Term Equity Fund (Tax Saving) 10.88 9.70 18.24 19-Aug-99
Nifty 500 Index (Benchmark) 21.95 11.03 15.51
Nifty 50 Index (Additional Benchmark) 19.47 7.48 12.95
Funds Managed by George Heber Joseph & Manish Banthia
ICICI Prudential Child Care Plan (Gift Plan) 9.98 8.92 15.84 31-Aug-01
CRISIL Balanced Fund – Aggressive Index (Benchmark) 15.18 8.56 11.89
Nifty 50 Index (Additional Benchmark) 19.47 7.48 12.95
Funds Managed by Sankaran Naren & George Heber Joseph
ICICI Prudential Value Fund - Series 8 10.96 - - 06-Aug-15
S&P BSE 500 Index (Benchmark) 22.01 - -
Nifty 50 Index (Additional Benchmark) 19.47 - -
ICICI Prudential Business Cycle Fund - Series 2 13.79 - - 06-Nov-15
S&P BSE 500 Index (Benchmark) 22.01 - -
Nifty 50 Index (Additional Benchmark) 19.47 - -
Funds Managed by Sankaran Naren & Ihab Dalwai
ICICI Prudential Dynamic Plan 22.01 11.43 18.19 31-Oct-02
Nifty 50 Index (Benchmark) 19.47 7.48 12.95
ICICI Prudential Infrastructure Fund 28.97 11.10 15.88 31-Aug-05
Nifty Infrastructure Index (Benchmark) 24.59 3.00 7.57
Nifty 50 Index (Additional Benchmark) 19.47 7.48 12.95
Funds Managed by Kayzad Eghlim
ICICI Prudential Nifty iWIN ETF 20.71 8.73 - 20-Mar-13
Nifty 50 Index (Benchmark) 19.47 7.48 -
ICICI Prudential Sensex iWIN ETF 19.84 7.31 13.67 10-Jan-03
S&P BSE SENSEX (Benchmark) 18.70 6.02 12.40
Nifty 50 Index (Additional Benchmark) 19.47 7.48 12.95
ICICI Prudential NV20 iWIN ETF 23.81 - - 17-Jun-16
Nifty50 Value 20 Index (Benchmark) 22.59 - -
Nifty 50 Index (Additional Benchmark) 19.47 - -
ICICI Prudential Nifty Next 50 Index Fund 27.07 18.84 22.10 25-Jun-10
Nifty Next 50 Index (Benchmark) 25.82 18.70 22.14
Nifty 50 Index (Additional Benchmark) 19.47 7.48 12.95
ICICI Prudential Midcap Select iWIN ETF 25.93 - - 04-Jul-16
S&P BSE Midcap Select Index (Benchmark) 25.57 - -
Nifty 50 Index (Additional Benchmark) 19.47 - -
ICICI Prudential Nifty 100 iWIN ETF 21.14 10.01 - 20-Aug-13
Nifty 100 Index (Benchmark) 20.42 9.15 -
Nifty 50 Index (Additional Benchmark) 19.47 7.48 -
ICICI Prudential Nifty Index Fund 19.71 7.87 13.58 26-Feb-02
Nifty 50 Index (Benchmark) 19.47 7.48 12.95
Funds Managed by Kayzad Eghlim & Manish Banthia
ICICI Prudential Equity - Arbitrage Fund 5.68 6.66 7.79 30-Dec-06
Nifty 50 Arbitrage Index (Benchmark) 4.37 6.34 7.18
Nifty 50 Index (Additional Benchmark) 19.47 7.48 12.95
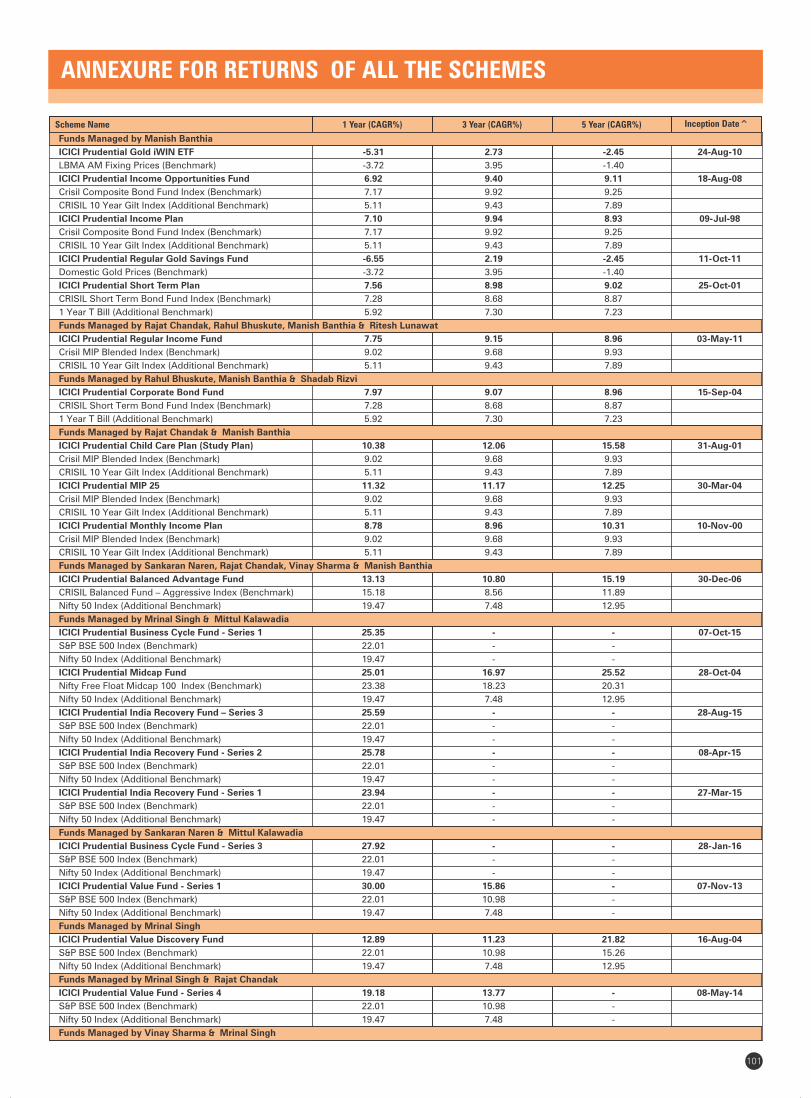
ANNEXURE FOR RETURNS OF ALL THE SCHEMES
Scheme Name Inception Date^
101
1 Year (CAGR%) 3 Year (CAGR%) 5 Year (CAGR%)
Funds Managed by Manish Banthia
ICICI Prudential Gold iWIN ETF -5.31 2.73 -2.45 24-Aug-10
LBMA AM Fixing Prices (Benchmark) -3.72 3.95 -1.40
ICICI Prudential Income Opportunities Fund 6.92 9.40 9.11 18-Aug-08
Crisil Composite Bond Fund Index (Benchmark) 7.17 9.92 9.25
CRISIL 10 Year Gilt Index (Additional Benchmark) 5.11 9.43 7.89
ICICI Prudential Income Plan 7.10 9.94 8.93 09-Jul-98
Crisil Composite Bond Fund Index (Benchmark) 7.17 9.92 9.25
CRISIL 10 Year Gilt Index (Additional Benchmark) 5.11 9.43 7.89
ICICI Prudential Regular Gold Savings Fund -6.55 2.19 -2.45 11-Oct-11
Domestic Gold Prices (Benchmark) -3.72 3.95 -1.40
ICICI Prudential Short Term Plan 7.56 8.98 9.02 25-Oct-01
CRISIL Short Term Bond Fund Index (Benchmark) 7.28 8.68 8.87
1 Year T Bill (Additional Benchmark) 5.92 7.30 7.23
Funds Managed by Rajat Chandak, Rahul Bhuskute, Manish Banthia & Ritesh Lunawat
ICICI Prudential Regular Income Fund 7.75 9.15 8.96 03-May-11
Crisil MIP Blended Index (Benchmark) 9.02 9.68 9.93
CRISIL 10 Year Gilt Index (Additional Benchmark) 5.11 9.43 7.89
Funds Managed by Rahul Bhuskute, Manish Banthia & Shadab Rizvi
ICICI Prudential Corporate Bond Fund 7.97 9.07 8.96 15-Sep-04
CRISIL Short Term Bond Fund Index (Benchmark) 7.28 8.68 8.87
1 Year T Bill (Additional Benchmark) 5.92 7.30 7.23
Funds Managed by Rajat Chandak & Manish Banthia
ICICI Prudential Child Care Plan (Study Plan) 10.38 12.06 15.58 31-Aug-01
Crisil MIP Blended Index (Benchmark) 9.02 9.68 9.93
CRISIL 10 Year Gilt Index (Additional Benchmark) 5.11 9.43 7.89
ICICI Prudential MIP 25 11.32 11.17 12.25 30-Mar-04
Crisil MIP Blended Index (Benchmark) 9.02 9.68 9.93
CRISIL 10 Year Gilt Index (Additional Benchmark) 5.11 9.43 7.89
ICICI Prudential Monthly Income Plan 8.78 8.96 10.31 10-Nov-00
Crisil MIP Blended Index (Benchmark) 9.02 9.68 9.93
CRISIL 10 Year Gilt Index (Additional Benchmark) 5.11 9.43 7.89
Funds Managed by Sankaran Naren, Rajat Chandak, Vinay Sharma & Manish Banthia
ICICI Prudential Balanced Advantage Fund 13.13 10.80 15.19 30-Dec-06
CRISIL Balanced Fund – Aggressive Index (Benchmark) 15.18 8.56 11.89
Nifty 50 Index (Additional Benchmark) 19.47 7.48 12.95
Funds Managed by Mrinal Singh & Mittul Kalawadia
ICICI Prudential Business Cycle Fund - Series 1 25.35 - - 07-Oct-15
S&P BSE 500 Index (Benchmark) 22.01 - -
Nifty 50 Index (Additional Benchmark) 19.47 - -
ICICI Prudential Midcap Fund 25.01 16.97 25.52 28-Oct-04
Nifty Free Float Midcap 100 Index (Benchmark) 23.38 18.23 20.31
Nifty 50 Index (Additional Benchmark) 19.47 7.48 12.95
ICICI Prudential India Recovery Fund – Series 3 25.59 - - 28-Aug-15
S&P BSE 500 Index (Benchmark) 22.01 - -
Nifty 50 Index (Additional Benchmark) 19.47 - -
ICICI Prudential India Recovery Fund - Series 2 25.78 - - 08-Apr-15
S&P BSE 500 Index (Benchmark) 22.01 - -
Nifty 50 Index (Additional Benchmark) 19.47 - -
ICICI Prudential India Recovery Fund - Series 1 23.94 - - 27-Mar-15
S&P BSE 500 Index (Benchmark) 22.01 - -
Nifty 50 Index (Additional Benchmark) 19.47 - -
Funds Managed by Sankaran Naren & Mittul Kalawadia
ICICI Prudential Business Cycle Fund - Series 3 27.92 - - 28-Jan-16
S&P BSE 500 Index (Benchmark) 22.01 - -
Nifty 50 Index (Additional Benchmark) 19.47 - -
ICICI Prudential Value Fund - Series 1 30.00 15.86 - 07-Nov-13
S&P BSE 500 Index (Benchmark) 22.01 10.98 -
Nifty 50 Index (Additional Benchmark) 19.47 7.48 -
Funds Managed by Mrinal Singh
ICICI Prudential Value Discovery Fund 12.89 11.23 21.82 16-Aug-04
S&P BSE 500 Index (Benchmark) 22.01 10.98 15.26
Nifty 50 Index (Additional Benchmark) 19.47 7.48 12.95
Funds Managed by Mrinal Singh & Rajat Chandak
ICICI Prudential Value Fund - Series 4 19.18 13.77 - 08-May-14
S&P BSE 500 Index (Benchmark) 22.01 10.98 -
Nifty 50 Index (Additional Benchmark) 19.47 7.48 -
Funds Managed by Vinay Sharma & Mrinal Singh
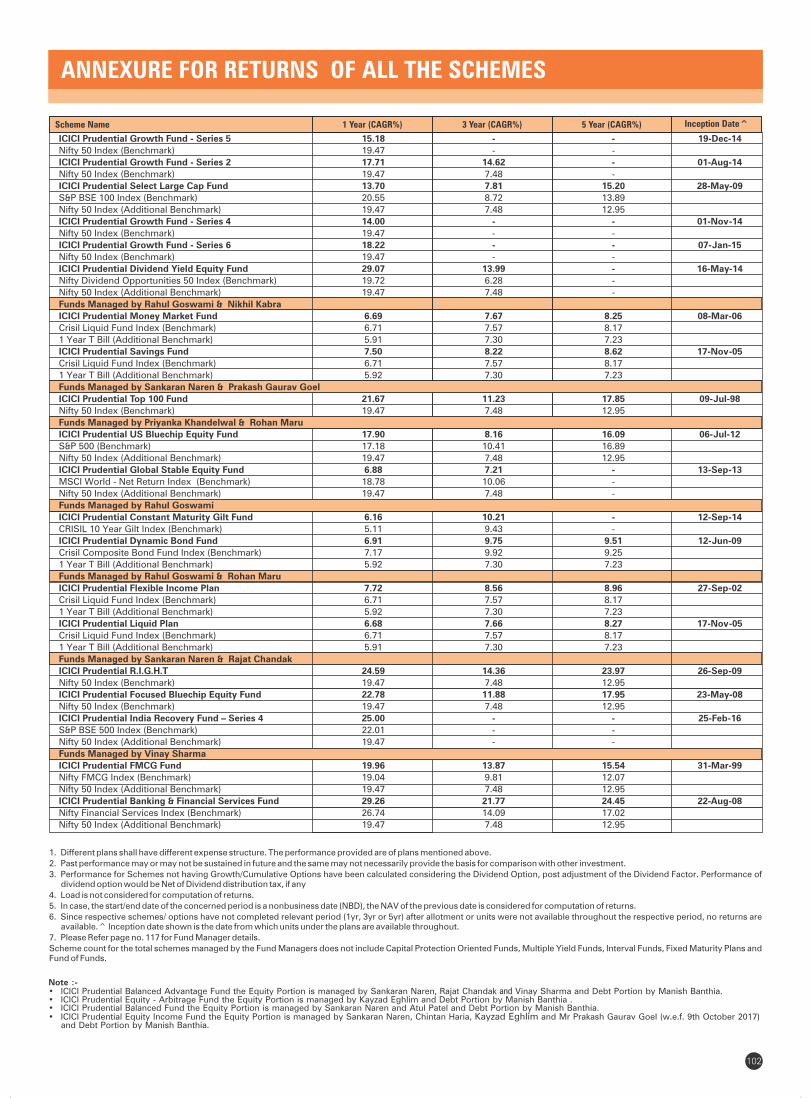
ANNEXURE FOR RETURNS OF ALL THE SCHEMES
Scheme Name 1 Year (CAGR%) 3 Year (CAGR%) 5 Year (CAGR%) Inception Date^
102
1. Different plans shall have different expense structure. The performance provided are of plans mentioned above.
2. Past performance may or may not be sustained in future and the same may not necessarily provide the basis for comparison with other investment.
3. Performance for Schemes not having Growth/Cumulative Options have been calculated considering the Dividend Option, post adjustment of the Dividend Factor. Performance of dividend option would be Net of Dividend distribution tax, if any
4. Load is not considered for computation of returns.
5. In case, the start/end date of the concerned period is a nonbusiness date (NBD), the NAV of the previous date is considered for computation of returns.
6. Since respective schemes/ options have not completed relevant period (1yr, 3yr or 5yr) after allotment or units were not available throughout the respective period, no returns are available.^ Inception date shown is the date from which units under the plans are available throughout.
7. Please Refer page no. 117 for Fund Manager details.
Scheme count for the total schemes managed by the Fund Managers does not include Capital Protection Oriented Funds, Multiple Yield Funds, Interval Funds, Fixed Maturity Plans and Fund of Funds.
Note :-• ICICI Prudential Balanced Advantage Fund the Equity Portion is managed by Sankaran Naren, Rajat Chandak and Vinay Sharma and Debt Portion by Manish Banthia.• ICICI Prudential Equity - Arbitrage Fund the Equity Portion is managed by Kayzad Eghlim and Debt Portion by Manish Banthia .• ICICI Prudential Balanced Fund the Equity Portion is managed by Sankaran Naren and Atul Patel and Debt Portion by Manish Banthia.• ICICI Prudential Equity Income Fund the Equity Portion is managed by Sankaran Naren, Chintan Haria, and Mr Prakash Gaurav Goel (w.e.f. 9th October 2017) Kayzad Eghlim and Debt Portion by Manish Banthia.
ICICI Prudential Growth Fund - Series 5 15.18 - - 19-Dec-14
Nifty 50 Index (Benchmark) 19.47 - -
ICICI Prudential Growth Fund - Series 2 17.71 14.62 - 01-Aug-14
Nifty 50 Index (Benchmark) 19.47 7.48 -
ICICI Prudential Select Large Cap Fund 13.70 7.81 15.20 28-May-09
S&P BSE 100 Index (Benchmark) 20.55 8.72 13.89
Nifty 50 Index (Additional Benchmark) 19.47 7.48 12.95
ICICI Prudential Growth Fund - Series 4 14.00 - - 01-Nov-14
Nifty 50 Index (Benchmark) 19.47 - -
ICICI Prudential Growth Fund - Series 6 18.22 - - 07-Jan-15
Nifty 50 Index (Benchmark) 19.47 - -
ICICI Prudential Dividend Yield Equity Fund 29.07 13.99 - 16-May-14
Nifty Dividend Opportunities 50 Index (Benchmark) 19.72 6.28 -
Nifty 50 Index (Additional Benchmark) 19.47 7.48 -
Funds Managed by Rahul Goswami & Nikhil Kabra
ICICI Prudential Money Market Fund 6.69 7.67 8.25 08-Mar-06
Crisil Liquid Fund Index (Benchmark) 6.71 7.57 8.17
1 Year T Bill (Additional Benchmark) 5.91 7.30 7.23
ICICI Prudential Savings Fund 7.50 8.22 8.62 17-Nov-05
Crisil Liquid Fund Index (Benchmark) 6.71 7.57 8.17
1 Year T Bill (Additional Benchmark) 5.92 7.30 7.23
Funds Managed by Sankaran Naren & Prakash Gaurav Goel
ICICI Prudential Top 100 Fund 21.67 11.23 17.85 09-Jul-98
Nifty 50 Index (Benchmark) 19.47 7.48 12.95
Funds Managed by Priyanka Khandelwal & Rohan Maru
ICICI Prudential US Bluechip Equity Fund 17.90 8.16 16.09 06-Jul-12
S&P 500 (Benchmark) 17.18 10.41 16.89
Nifty 50 Index (Additional Benchmark) 19.47 7.48 12.95
ICICI Prudential Global Stable Equity Fund 6.88 7.21 - 13-Sep-13
MSCI World - Net Return Index (Benchmark) 18.78 10.06 -
Nifty 50 Index (Additional Benchmark) 19.47 7.48 -
Funds Managed by Rahul Goswami
ICICI Prudential Constant Maturity Gilt Fund 6.16 10.21 - 12-Sep-14
CRISIL 10 Year Gilt Index (Benchmark) 5.11 9.43 -
ICICI Prudential Dynamic Bond Fund 6.91 9.75 9.51 12-Jun-09
Crisil Composite Bond Fund Index (Benchmark) 7.17 9.92 9.25
1 Year T Bill (Additional Benchmark) 5.92 7.30 7.23
Funds Managed by Rahul Goswami & Rohan Maru
ICICI Prudential Flexible Income Plan 7.72 8.56 8.96 27-Sep-02
Crisil Liquid Fund Index (Benchmark) 6.71 7.57 8.17
1 Year T Bill (Additional Benchmark) 5.92 7.30 7.23
ICICI Prudential Liquid Plan 6.68 7.66 8.27 17-Nov-05
Crisil Liquid Fund Index (Benchmark) 6.71 7.57 8.17
1 Year T Bill (Additional Benchmark) 5.91 7.30 7.23
Funds Managed by Sankaran Naren & Rajat Chandak
ICICI Prudential R.I.G.H.T 24.59 14.36 23.97 26-Sep-09
Nifty 50 Index (Benchmark) 19.47 7.48 12.95
ICICI Prudential Focused Bluechip Equity Fund 22.78 11.88 17.95 23-May-08
Nifty 50 Index (Benchmark) 19.47 7.48 12.95
ICICI Prudential India Recovery Fund – Series 4 25.00 - - 25-Feb-16
S&P BSE 500 Index (Benchmark) 22.01 - -
Nifty 50 Index (Additional Benchmark) 19.47 - -
Funds Managed by Vinay Sharma
ICICI Prudential FMCG Fund 19.96 13.87 15.54 31-Mar-99
Nifty FMCG Index (Benchmark) 19.04 9.81 12.07
Nifty 50 Index (Additional Benchmark) 19.47 7.48 12.95
ICICI Prudential Banking & Financial Services Fund 29.26 21.77 24.45 22-Aug-08
Nifty Financial Services Index (Benchmark) 26.74 14.09 17.02
Nifty 50 Index (Additional Benchmark) 19.47 7.48 12.95

ANNEXURE FOR RETURNS OF ALL THE SCHEMES
CRISIL 10 year Gilt index start date is 1-sep-01.
* The existing Crisil Balanced Fund Index has been renamed to Crisil Balanced Fund - Aggressive Index' w.e.f. 4th April 2016 as per 'Crisil Indices- Annual Criteria Review-2016.# The Nifty Midcap 100 Index has been renamed to Nifty Free Float Midcap 100 with effect from 01 April 2016 as per NSE circular dated 28 March 2016
With effect from June 01, 2017, the benchmark of ICICI Prudential Banking & Financial Services Fund has been changed from S&P BSE BANKEX to NIFTY Financial Services Index.
• ICICI Prudential Child Care Plan (Study Plan) the Equity Portion is managed by Rajat Chandak and Debt Portion by Manish Banthia.• ICICI Prudential MIP 25 the Equity Portion is managed by Rajat Chandak and Debt Portion by Manish Banthia.• ICICI Prudential Monthly Income Plan the Equity Portion is managed by Rajat Chandak and Debt Portion by Manish Banthia.• ICICI Prudential Regular Income Fund the Equity Portion is managed by Rajat Chandak and Debt Portion by Rahul Bhuskute, Manish Banthia & Ritesh Lunawat.• ICICI Prudential Child Care Plan (Gift Plan) the Equity Portion is managed by George Heber Joseph and Debt Portion by Manish Banthia.• ICICI Prudential Indo Asia Equity Fund the India Portion is managed by Sankaran Naren & Atul Patel and Asia Portion by Priyanka Khandelwal.• ICICI Prudential US Bluechip Equity Fund the US Portion is managed by Priyanka Khandelwal & India Debt Portion is managed by Rohan Maru.
103
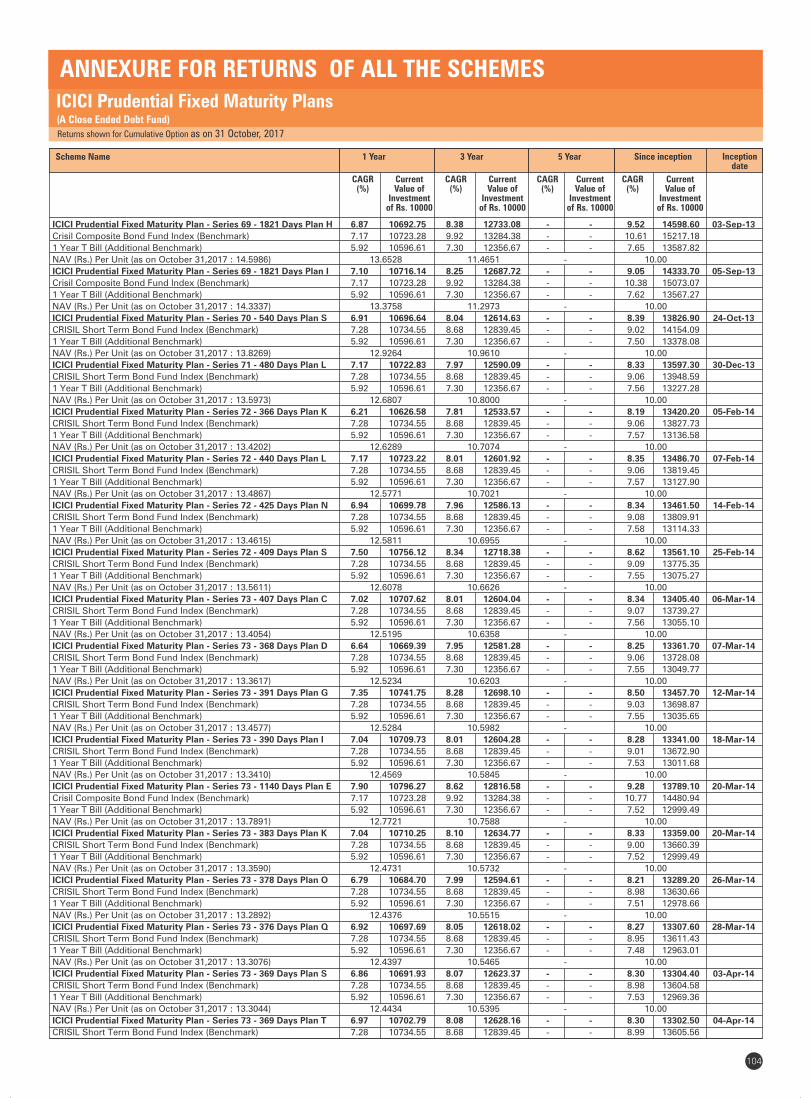
1 Year
CAGR (%)
Current Value of
Investment of Rs. 10000
Scheme Name 3 Year
CAGR (%)
Current Value of
Investment of Rs. 10000
5 Year
CAGR (%)
Current Value of
Investment of Rs. 10000
Since inception
CAGR (%)
Current Value of
Investment of Rs. 10000
Inception date
104
ICICI Prudential Fixed Maturity Plans
Returns shown for Cumulative Option as on 31 October, 2017
(A Close Ended Debt Fund)
ANNEXURE FOR RETURNS OF ALL THE SCHEMES
ICICI Prudential Fixed Maturity Plan - Series 69 - 1821 Days Plan H 6.87 10692.75 8.38 12733.08 - - 9.52 14598.60 03-Sep-13
Crisil Composite Bond Fund Index (Benchmark) 7.17 10723.28 9.92 13284.38 - - 10.61 15217.18
1 Year T Bill (Additional Benchmark) 5.92 10596.61 7.30 12356.67 - - 7.65 13587.82
NAV (Rs.) Per Unit (as on October 31,2017 : 14.5986) 13.6528 11.4651 - 10.00
ICICI Prudential Fixed Maturity Plan - Series 69 - 1821 Days Plan I 7.10 10716.14 8.25 12687.72 - - 9.05 14333.70 05-Sep-13
Crisil Composite Bond Fund Index (Benchmark) 7.17 10723.28 9.92 13284.38 - - 10.38 15073.07
1 Year T Bill (Additional Benchmark) 5.92 10596.61 7.30 12356.67 - - 7.62 13567.27
NAV (Rs.) Per Unit (as on October 31,2017 : 14.3337) 13.3758 11.2973 - 10.00
ICICI Prudential Fixed Maturity Plan - Series 70 - 540 Days Plan S 6.91 10696.64 8.04 12614.63 - - 8.39 13826.90 24-Oct-13
CRISIL Short Term Bond Fund Index (Benchmark) 7.28 10734.55 8.68 12839.45 - - 9.02 14154.09
1 Year T Bill (Additional Benchmark) 5.92 10596.61 7.30 12356.67 - - 7.50 13378.08
NAV (Rs.) Per Unit (as on October 31,2017 : 13.8269) 12.9264 10.9610 - 10.00
ICICI Prudential Fixed Maturity Plan - Series 71 - 480 Days Plan L 7.17 10722.83 7.97 12590.09 - - 8.33 13597.30 30-Dec-13
CRISIL Short Term Bond Fund Index (Benchmark) 7.28 10734.55 8.68 12839.45 - - 9.06 13948.59
1 Year T Bill (Additional Benchmark) 5.92 10596.61 7.30 12356.67 - - 7.56 13227.28
NAV (Rs.) Per Unit (as on October 31,2017 : 13.5973) 12.6807 10.8000 - 10.00
ICICI Prudential Fixed Maturity Plan - Series 72 - 366 Days Plan K 6.21 10626.58 7.81 12533.57 - - 8.19 13420.20 05-Feb-14
CRISIL Short Term Bond Fund Index (Benchmark) 7.28 10734.55 8.68 12839.45 - - 9.06 13827.73
1 Year T Bill (Additional Benchmark) 5.92 10596.61 7.30 12356.67 - - 7.57 13136.58
NAV (Rs.) Per Unit (as on October 31,2017 : 13.4202) 12.6289 10.7074 - 10.00
ICICI Prudential Fixed Maturity Plan - Series 72 - 440 Days Plan L 7.17 10723.22 8.01 12601.92 - - 8.35 13486.70 07-Feb-14
CRISIL Short Term Bond Fund Index (Benchmark) 7.28 10734.55 8.68 12839.45 - - 9.06 13819.45
1 Year T Bill (Additional Benchmark) 5.92 10596.61 7.30 12356.67 - - 7.57 13127.90
NAV (Rs.) Per Unit (as on October 31,2017 : 13.4867) 12.5771 10.7021 - 10.00
ICICI Prudential Fixed Maturity Plan - Series 72 - 425 Days Plan N 6.94 10699.78 7.96 12586.13 - - 8.34 13461.50 14-Feb-14
CRISIL Short Term Bond Fund Index (Benchmark) 7.28 10734.55 8.68 12839.45 - - 9.08 13809.91
1 Year T Bill (Additional Benchmark) 5.92 10596.61 7.30 12356.67 - - 7.58 13114.33
NAV (Rs.) Per Unit (as on October 31,2017 : 13.4615) 12.5811 10.6955 - 10.00
ICICI Prudential Fixed Maturity Plan - Series 72 - 409 Days Plan S 7.50 10756.12 8.34 12718.38 - - 8.62 13561.10 25-Feb-14
CRISIL Short Term Bond Fund Index (Benchmark) 7.28 10734.55 8.68 12839.45 - - 9.09 13775.35
1 Year T Bill (Additional Benchmark) 5.92 10596.61 7.30 12356.67 - - 7.55 13075.27
NAV (Rs.) Per Unit (as on October 31,2017 : 13.5611) 12.6078 10.6626 - 10.00
ICICI Prudential Fixed Maturity Plan - Series 73 - 407 Days Plan C 7.02 10707.62 8.01 12604.04 - - 8.34 13405.40 06-Mar-14
CRISIL Short Term Bond Fund Index (Benchmark) 7.28 10734.55 8.68 12839.45 - - 9.07 13739.27
1 Year T Bill (Additional Benchmark) 5.92 10596.61 7.30 12356.67 - - 7.56 13055.10
NAV (Rs.) Per Unit (as on October 31,2017 : 13.4054) 12.5195 10.6358 - 10.00
ICICI Prudential Fixed Maturity Plan - Series 73 - 368 Days Plan D 6.64 10669.39 7.95 12581.28 - - 8.25 13361.70 07-Mar-14
CRISIL Short Term Bond Fund Index (Benchmark) 7.28 10734.55 8.68 12839.45 - - 9.06 13728.08
1 Year T Bill (Additional Benchmark) 5.92 10596.61 7.30 12356.67 - - 7.55 13049.77
NAV (Rs.) Per Unit (as on October 31,2017 : 13.3617) 12.5234 10.6203 - 10.00
ICICI Prudential Fixed Maturity Plan - Series 73 - 391 Days Plan G 7.35 10741.75 8.28 12698.10 - - 8.50 13457.70 12-Mar-14
CRISIL Short Term Bond Fund Index (Benchmark) 7.28 10734.55 8.68 12839.45 - - 9.03 13698.87
1 Year T Bill (Additional Benchmark) 5.92 10596.61 7.30 12356.67 - - 7.55 13035.65
NAV (Rs.) Per Unit (as on October 31,2017 : 13.4577) 12.5284 10.5982 - 10.00
ICICI Prudential Fixed Maturity Plan - Series 73 - 390 Days Plan I 7.04 10709.73 8.01 12604.28 - - 8.28 13341.00 18-Mar-14
CRISIL Short Term Bond Fund Index (Benchmark) 7.28 10734.55 8.68 12839.45 - - 9.01 13672.90
1 Year T Bill (Additional Benchmark) 5.92 10596.61 7.30 12356.67 - - 7.53 13011.68
NAV (Rs.) Per Unit (as on October 31,2017 : 13.3410) 12.4569 10.5845 - 10.00
ICICI Prudential Fixed Maturity Plan - Series 73 - 1140 Days Plan E 7.90 10796.27 8.62 12816.58 - - 9.28 13789.10 20-Mar-14
Crisil Composite Bond Fund Index (Benchmark) 7.17 10723.28 9.92 13284.38 - - 10.77 14480.94
1 Year T Bill (Additional Benchmark) 5.92 10596.61 7.30 12356.67 - - 7.52 12999.49
NAV (Rs.) Per Unit (as on October 31,2017 : 13.7891) 12.7721 10.7588 - 10.00
ICICI Prudential Fixed Maturity Plan - Series 73 - 383 Days Plan K 7.04 10710.25 8.10 12634.77 - - 8.33 13359.00 20-Mar-14
CRISIL Short Term Bond Fund Index (Benchmark) 7.28 10734.55 8.68 12839.45 - - 9.00 13660.39
1 Year T Bill (Additional Benchmark) 5.92 10596.61 7.30 12356.67 - - 7.52 12999.49
NAV (Rs.) Per Unit (as on October 31,2017 : 13.3590) 12.4731 10.5732 - 10.00
ICICI Prudential Fixed Maturity Plan - Series 73 - 378 Days Plan O 6.79 10684.70 7.99 12594.61 - - 8.21 13289.20 26-Mar-14
CRISIL Short Term Bond Fund Index (Benchmark) 7.28 10734.55 8.68 12839.45 - - 8.98 13630.66
1 Year T Bill (Additional Benchmark) 5.92 10596.61 7.30 12356.67 - - 7.51 12978.66
NAV (Rs.) Per Unit (as on October 31,2017 : 13.2892) 12.4376 10.5515 - 10.00
ICICI Prudential Fixed Maturity Plan - Series 73 - 376 Days Plan Q 6.92 10697.69 8.05 12618.02 - - 8.27 13307.60 28-Mar-14
CRISIL Short Term Bond Fund Index (Benchmark) 7.28 10734.55 8.68 12839.45 - - 8.95 13611.43
1 Year T Bill (Additional Benchmark) 5.92 10596.61 7.30 12356.67 - - 7.48 12963.01
NAV (Rs.) Per Unit (as on October 31,2017 : 13.3076) 12.4397 10.5465 - 10.00
ICICI Prudential Fixed Maturity Plan - Series 73 - 369 Days Plan S 6.86 10691.93 8.07 12623.37 - - 8.30 13304.40 03-Apr-14
CRISIL Short Term Bond Fund Index (Benchmark) 7.28 10734.55 8.68 12839.45 - - 8.98 13604.58
1 Year T Bill (Additional Benchmark) 5.92 10596.61 7.30 12356.67 - - 7.53 12969.36
NAV (Rs.) Per Unit (as on October 31,2017 : 13.3044) 12.4434 10.5395 - 10.00
ICICI Prudential Fixed Maturity Plan - Series 73 - 369 Days Plan T 6.97 10702.79 8.08 12628.16 - - 8.30 13302.50 04-Apr-14
CRISIL Short Term Bond Fund Index (Benchmark) 7.28 10734.55 8.68 12839.45 - - 8.99 13605.56
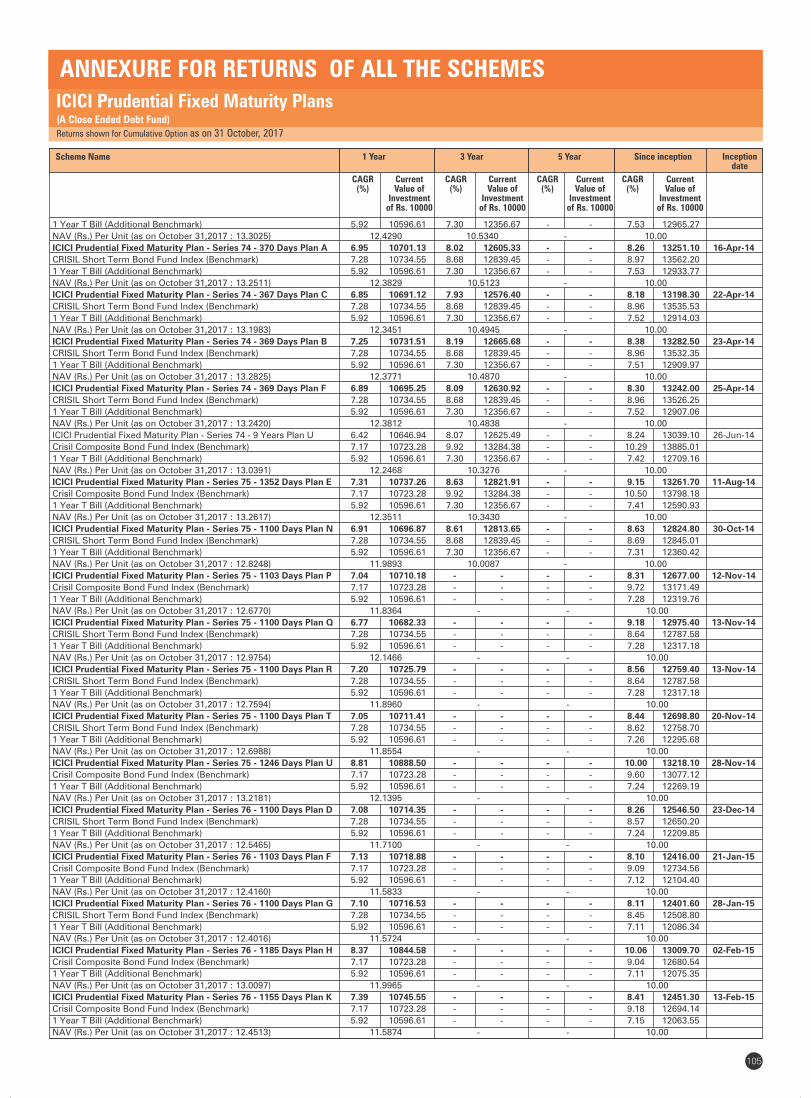
1 Year
CAGR (%)
Current Value of
Investment of Rs. 10000
Scheme Name 3 Year
CAGR (%)
Current Value of
Investment of Rs. 10000
5 Year
CAGR (%)
Current Value of
Investment of Rs. 10000
Since inception
CAGR (%)
Current Value of
Investment of Rs. 10000
Inception date
105
ICICI Prudential Fixed Maturity Plans(A Close Ended Debt Fund)
Returns shown for Cumulative Option as on 31 October, 2017
ANNEXURE FOR RETURNS OF ALL THE SCHEMES
1 Year T Bill (Additional Benchmark) 5.92 10596.61 7.30 12356.67 - - 7.53 12965.27
NAV (Rs.) Per Unit (as on October 31,2017 : 13.3025) 12.4290 10.5340 - 10.00
ICICI Prudential Fixed Maturity Plan - Series 74 - 370 Days Plan A 6.95 10701.13 8.02 12605.33 - - 8.26 13251.10 16-Apr-14
CRISIL Short Term Bond Fund Index (Benchmark) 7.28 10734.55 8.68 12839.45 - - 8.97 13562.20
1 Year T Bill (Additional Benchmark) 5.92 10596.61 7.30 12356.67 - - 7.53 12933.77
NAV (Rs.) Per Unit (as on October 31,2017 : 13.2511) 12.3829 10.5123 - 10.00
ICICI Prudential Fixed Maturity Plan - Series 74 - 367 Days Plan C 6.85 10691.12 7.93 12576.40 - - 8.18 13198.30 22-Apr-14
CRISIL Short Term Bond Fund Index (Benchmark) 7.28 10734.55 8.68 12839.45 - - 8.96 13535.53
1 Year T Bill (Additional Benchmark) 5.92 10596.61 7.30 12356.67 - - 7.52 12914.03
NAV (Rs.) Per Unit (as on October 31,2017 : 13.1983) 12.3451 10.4945 - 10.00
ICICI Prudential Fixed Maturity Plan - Series 74 - 369 Days Plan B 7.25 10731.51 8.19 12665.68 - - 8.38 13282.50 23-Apr-14
CRISIL Short Term Bond Fund Index (Benchmark) 7.28 10734.55 8.68 12839.45 - - 8.96 13532.35
1 Year T Bill (Additional Benchmark) 5.92 10596.61 7.30 12356.67 - - 7.51 12909.97
NAV (Rs.) Per Unit (as on October 31,2017 : 13.2825) 12.3771 10.4870 - 10.00
ICICI Prudential Fixed Maturity Plan - Series 74 - 369 Days Plan F 6.89 10695.25 8.09 12630.92 - - 8.30 13242.00 25-Apr-14
CRISIL Short Term Bond Fund Index (Benchmark) 7.28 10734.55 8.68 12839.45 - - 8.96 13526.25
1 Year T Bill (Additional Benchmark) 5.92 10596.61 7.30 12356.67 - - 7.52 12907.06
NAV (Rs.) Per Unit (as on October 31,2017 : 13.2420) 12.3812 10.4838 - 10.00
ICICI Prudential Fixed Maturity Plan - Series 74 - 9 Years Plan U 6.42 10646.94 8.07 12625.49 - - 8.24 13039.10 26-Jun-14
Crisil Composite Bond Fund Index (Benchmark) 7.17 10723.28 9.92 13284.38 - - 10.29 13885.01
1 Year T Bill (Additional Benchmark) 5.92 10596.61 7.30 12356.67 - - 7.42 12709.16
NAV (Rs.) Per Unit (as on October 31,2017 : 13.0391) 12.2468 10.3276 - 10.00
ICICI Prudential Fixed Maturity Plan - Series 75 - 1352 Days Plan E 7.31 10737.26 8.63 12821.91 - - 9.15 13261.70 11-Aug-14
Crisil Composite Bond Fund Index (Benchmark) 7.17 10723.28 9.92 13284.38 - - 10.50 13798.18
1 Year T Bill (Additional Benchmark) 5.92 10596.61 7.30 12356.67 - - 7.41 12590.93
NAV (Rs.) Per Unit (as on October 31,2017 : 13.2617) 12.3511 10.3430 - 10.00
ICICI Prudential Fixed Maturity Plan - Series 75 - 1100 Days Plan N 6.91 10696.87 8.61 12813.65 - - 8.63 12824.80 30-Oct-14
CRISIL Short Term Bond Fund Index (Benchmark) 7.28 10734.55 8.68 12839.45 - - 8.69 12845.01
1 Year T Bill (Additional Benchmark) 5.92 10596.61 7.30 12356.67 - - 7.31 12360.42
NAV (Rs.) Per Unit (as on October 31,2017 : 12.8248) 11.9893 10.0087 - 10.00
ICICI Prudential Fixed Maturity Plan - Series 75 - 1103 Days Plan P 7.04 10710.18 - - - - 8.31 12677.00 12-Nov-14
Crisil Composite Bond Fund Index (Benchmark) 7.17 10723.28 - - - - 9.72 13171.49
1 Year T Bill (Additional Benchmark) 5.92 10596.61 - - - - 7.28 12319.76
NAV (Rs.) Per Unit (as on October 31,2017 : 12.6770) 11.8364 - - 10.00
ICICI Prudential Fixed Maturity Plan - Series 75 - 1100 Days Plan Q 6.77 10682.33 - - - - 9.18 12975.40 13-Nov-14
CRISIL Short Term Bond Fund Index (Benchmark) 7.28 10734.55 - - - - 8.64 12787.58
1 Year T Bill (Additional Benchmark) 5.92 10596.61 - - - - 7.28 12317.18
NAV (Rs.) Per Unit (as on October 31,2017 : 12.9754) 12.1466 - - 10.00
ICICI Prudential Fixed Maturity Plan - Series 75 - 1100 Days Plan R 7.20 10725.79 - - - - 8.56 12759.40 13-Nov-14
CRISIL Short Term Bond Fund Index (Benchmark) 7.28 10734.55 - - - - 8.64 12787.58
1 Year T Bill (Additional Benchmark) 5.92 10596.61 - - - - 7.28 12317.18
NAV (Rs.) Per Unit (as on October 31,2017 : 12.7594) 11.8960 - - 10.00
ICICI Prudential Fixed Maturity Plan - Series 75 - 1100 Days Plan T 7.05 10711.41 - - - - 8.44 12698.80 20-Nov-14
CRISIL Short Term Bond Fund Index (Benchmark) 7.28 10734.55 - - - - 8.62 12758.70
1 Year T Bill (Additional Benchmark) 5.92 10596.61 - - - - 7.26 12295.68
NAV (Rs.) Per Unit (as on October 31,2017 : 12.6988) 11.8554 - - 10.00
ICICI Prudential Fixed Maturity Plan - Series 75 - 1246 Days Plan U 8.81 10888.50 - - - - 10.00 13218.10 28-Nov-14
Crisil Composite Bond Fund Index (Benchmark) 7.17 10723.28 - - - - 9.60 13077.12
1 Year T Bill (Additional Benchmark) 5.92 10596.61 - - - - 7.24 12269.19
NAV (Rs.) Per Unit (as on October 31,2017 : 13.2181) 12.1395 - - 10.00
ICICI Prudential Fixed Maturity Plan - Series 76 - 1100 Days Plan D 7.08 10714.35 - - - - 8.26 12546.50 23-Dec-14
CRISIL Short Term Bond Fund Index (Benchmark) 7.28 10734.55 - - - - 8.57 12650.20
1 Year T Bill (Additional Benchmark) 5.92 10596.61 - - - - 7.24 12209.85
NAV (Rs.) Per Unit (as on October 31,2017 : 12.5465) 11.7100 - - 10.00
ICICI Prudential Fixed Maturity Plan - Series 76 - 1103 Days Plan F 7.13 10718.88 - - - - 8.10 12416.00 21-Jan-15
Crisil Composite Bond Fund Index (Benchmark) 7.17 10723.28 - - - - 9.09 12734.56
1 Year T Bill (Additional Benchmark) 5.92 10596.61 - - - - 7.12 12104.40
NAV (Rs.) Per Unit (as on October 31,2017 : 12.4160) 11.5833 - - 10.00
ICICI Prudential Fixed Maturity Plan - Series 76 - 1100 Days Plan G 7.10 10716.53 - - - - 8.11 12401.60 28-Jan-15
CRISIL Short Term Bond Fund Index (Benchmark) 7.28 10734.55 - - - - 8.45 12508.80
1 Year T Bill (Additional Benchmark) 5.92 10596.61 - - - - 7.11 12086.34
NAV (Rs.) Per Unit (as on October 31,2017 : 12.4016) 11.5724 - - 10.00
ICICI Prudential Fixed Maturity Plan - Series 76 - 1185 Days Plan H 8.37 10844.58 - - - - 10.06 13009.70 02-Feb-15
Crisil Composite Bond Fund Index (Benchmark) 7.17 10723.28 - - - - 9.04 12680.54
1 Year T Bill (Additional Benchmark) 5.92 10596.61 - - - - 7.11 12075.35
NAV (Rs.) Per Unit (as on October 31,2017 : 13.0097) 11.9965 - - 10.00
ICICI Prudential Fixed Maturity Plan - Series 76 - 1155 Days Plan K 7.39 10745.55 - - - - 8.41 12451.30 13-Feb-15
Crisil Composite Bond Fund Index (Benchmark) 7.17 10723.28 - - - - 9.18 12694.14
1 Year T Bill (Additional Benchmark) 5.92 10596.61 - - - - 7.15 12063.55
NAV (Rs.) Per Unit (as on October 31,2017 : 12.4513) 11.5874 - - 10.00
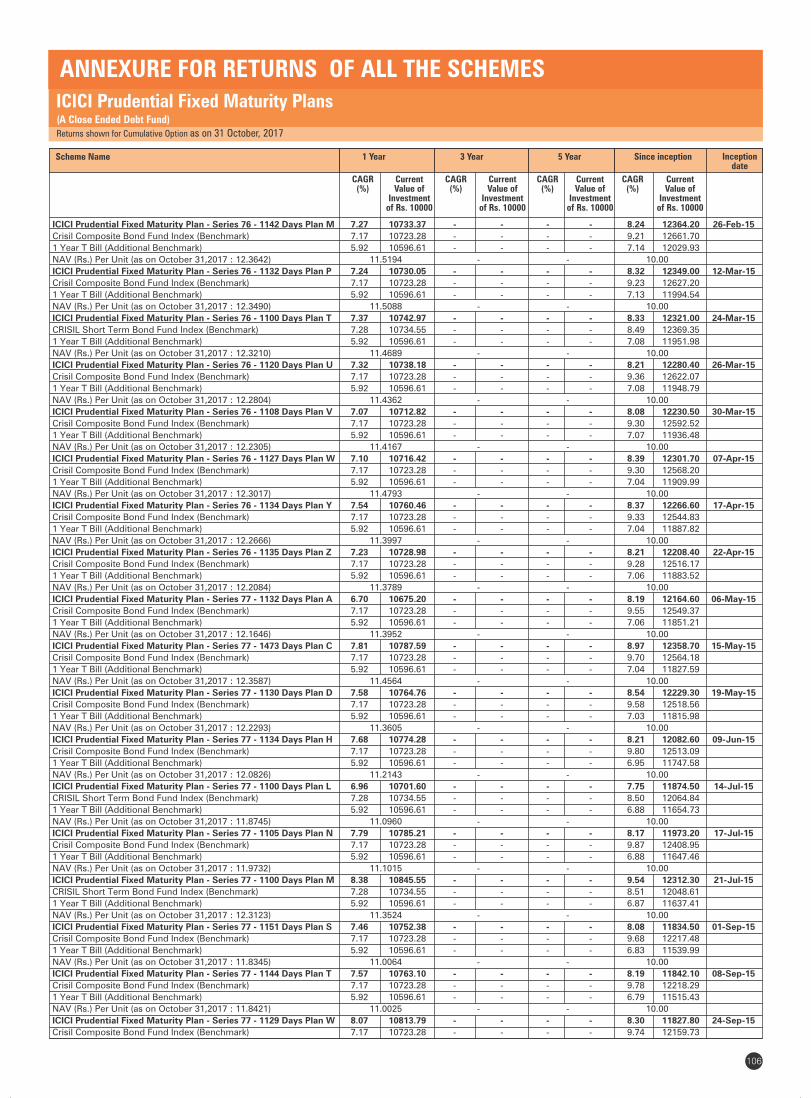
1 Year
CAGR (%)
Current Value of
Investment of Rs. 10000
Scheme Name 3 Year
CAGR (%)
Current Value of
Investment of Rs. 10000
5 Year
CAGR (%)
Current Value of
Investment of Rs. 10000
Since inception
CAGR (%)
Current Value of
Investment of Rs. 10000
Inception date
106
ICICI Prudential Fixed Maturity Plans(A Close Ended Debt Fund)
Returns shown for Cumulative Option as on 31 October, 2017
ANNEXURE FOR RETURNS OF ALL THE SCHEMES
ICICI Prudential Fixed Maturity Plan - Series 76 - 1142 Days Plan M 7.27 10733.37 - - - - 8.24 12364.20 26-Feb-15
Crisil Composite Bond Fund Index (Benchmark) 7.17 10723.28 - - - - 9.21 12661.70
1 Year T Bill (Additional Benchmark) 5.92 10596.61 - - - - 7.14 12029.93
NAV (Rs.) Per Unit (as on October 31,2017 : 12.3642) 11.5194 - - 10.00
ICICI Prudential Fixed Maturity Plan - Series 76 - 1132 Days Plan P 7.24 10730.05 - - - - 8.32 12349.00 12-Mar-15
Crisil Composite Bond Fund Index (Benchmark) 7.17 10723.28 - - - - 9.23 12627.20
1 Year T Bill (Additional Benchmark) 5.92 10596.61 - - - - 7.13 11994.54
NAV (Rs.) Per Unit (as on October 31,2017 : 12.3490) 11.5088 - - 10.00
ICICI Prudential Fixed Maturity Plan - Series 76 - 1100 Days Plan T 7.37 10742.97 - - - - 8.33 12321.00 24-Mar-15
CRISIL Short Term Bond Fund Index (Benchmark) 7.28 10734.55 - - - - 8.49 12369.35
1 Year T Bill (Additional Benchmark) 5.92 10596.61 - - - - 7.08 11951.98
NAV (Rs.) Per Unit (as on October 31,2017 : 12.3210) 11.4689 - - 10.00
ICICI Prudential Fixed Maturity Plan - Series 76 - 1120 Days Plan U 7.32 10738.18 - - - - 8.21 12280.40 26-Mar-15
Crisil Composite Bond Fund Index (Benchmark) 7.17 10723.28 - - - - 9.36 12622.07
1 Year T Bill (Additional Benchmark) 5.92 10596.61 - - - - 7.08 11948.79
NAV (Rs.) Per Unit (as on October 31,2017 : 12.2804) 11.4362 - - 10.00
ICICI Prudential Fixed Maturity Plan - Series 76 - 1108 Days Plan V 7.07 10712.82 - - - - 8.08 12230.50 30-Mar-15
Crisil Composite Bond Fund Index (Benchmark) 7.17 10723.28 - - - - 9.30 12592.52
1 Year T Bill (Additional Benchmark) 5.92 10596.61 - - - - 7.07 11936.48
NAV (Rs.) Per Unit (as on October 31,2017 : 12.2305) 11.4167 - - 10.00
ICICI Prudential Fixed Maturity Plan - Series 76 - 1127 Days Plan W 7.10 10716.42 - - - - 8.39 12301.70 07-Apr-15
Crisil Composite Bond Fund Index (Benchmark) 7.17 10723.28 - - - - 9.30 12568.20
1 Year T Bill (Additional Benchmark) 5.92 10596.61 - - - - 7.04 11909.99
NAV (Rs.) Per Unit (as on October 31,2017 : 12.3017) 11.4793 - - 10.00
ICICI Prudential Fixed Maturity Plan - Series 76 - 1134 Days Plan Y 7.54 10760.46 - - - - 8.37 12266.60 17-Apr-15
Crisil Composite Bond Fund Index (Benchmark) 7.17 10723.28 - - - - 9.33 12544.83
1 Year T Bill (Additional Benchmark) 5.92 10596.61 - - - - 7.04 11887.82
NAV (Rs.) Per Unit (as on October 31,2017 : 12.2666) 11.3997 - - 10.00
ICICI Prudential Fixed Maturity Plan - Series 76 - 1135 Days Plan Z 7.23 10728.98 - - - - 8.21 12208.40 22-Apr-15
Crisil Composite Bond Fund Index (Benchmark) 7.17 10723.28 - - - - 9.28 12516.17
1 Year T Bill (Additional Benchmark) 5.92 10596.61 - - - - 7.06 11883.52
NAV (Rs.) Per Unit (as on October 31,2017 : 12.2084) 11.3789 - - 10.00
ICICI Prudential Fixed Maturity Plan - Series 77 - 1132 Days Plan A 6.70 10675.20 - - - - 8.19 12164.60 06-May-15
Crisil Composite Bond Fund Index (Benchmark) 7.17 10723.28 - - - - 9.55 12549.37
1 Year T Bill (Additional Benchmark) 5.92 10596.61 - - - - 7.06 11851.21
NAV (Rs.) Per Unit (as on October 31,2017 : 12.1646) 11.3952 - - 10.00
ICICI Prudential Fixed Maturity Plan - Series 77 - 1473 Days Plan C 7.81 10787.59 - - - - 8.97 12358.70 15-May-15
Crisil Composite Bond Fund Index (Benchmark) 7.17 10723.28 - - - - 9.70 12564.18
1 Year T Bill (Additional Benchmark) 5.92 10596.61 - - - - 7.04 11827.59
NAV (Rs.) Per Unit (as on October 31,2017 : 12.3587) 11.4564 - - 10.00
ICICI Prudential Fixed Maturity Plan - Series 77 - 1130 Days Plan D 7.58 10764.76 - - - - 8.54 12229.30 19-May-15
Crisil Composite Bond Fund Index (Benchmark) 7.17 10723.28 - - - - 9.58 12518.56
1 Year T Bill (Additional Benchmark) 5.92 10596.61 - - - - 7.03 11815.98
NAV (Rs.) Per Unit (as on October 31,2017 : 12.2293) 11.3605 - - 10.00
ICICI Prudential Fixed Maturity Plan - Series 77 - 1134 Days Plan H 7.68 10774.28 - - - - 8.21 12082.60 09-Jun-15
Crisil Composite Bond Fund Index (Benchmark) 7.17 10723.28 - - - - 9.80 12513.09
1 Year T Bill (Additional Benchmark) 5.92 10596.61 - - - - 6.95 11747.58
NAV (Rs.) Per Unit (as on October 31,2017 : 12.0826) 11.2143 - - 10.00
ICICI Prudential Fixed Maturity Plan - Series 77 - 1100 Days Plan L 6.96 10701.60 - - - - 7.75 11874.50 14-Jul-15
CRISIL Short Term Bond Fund Index (Benchmark) 7.28 10734.55 - - - - 8.50 12064.84
1 Year T Bill (Additional Benchmark) 5.92 10596.61 - - - - 6.88 11654.73
NAV (Rs.) Per Unit (as on October 31,2017 : 11.8745) 11.0960 - - 10.00
ICICI Prudential Fixed Maturity Plan - Series 77 - 1105 Days Plan N 7.79 10785.21 - - - - 8.17 11973.20 17-Jul-15
Crisil Composite Bond Fund Index (Benchmark) 7.17 10723.28 - - - - 9.87 12408.95
1 Year T Bill (Additional Benchmark) 5.92 10596.61 - - - - 6.88 11647.46
NAV (Rs.) Per Unit (as on October 31,2017 : 11.9732) 11.1015 - - 10.00
ICICI Prudential Fixed Maturity Plan - Series 77 - 1100 Days Plan M 8.38 10845.55 - - - - 9.54 12312.30 21-Jul-15
CRISIL Short Term Bond Fund Index (Benchmark) 7.28 10734.55 - - - - 8.51 12048.61
1 Year T Bill (Additional Benchmark) 5.92 10596.61 - - - - 6.87 11637.41
NAV (Rs.) Per Unit (as on October 31,2017 : 12.3123) 11.3524 - - 10.00
ICICI Prudential Fixed Maturity Plan - Series 77 - 1151 Days Plan S 7.46 10752.38 - - - - 8.08 11834.50 01-Sep-15
Crisil Composite Bond Fund Index (Benchmark) 7.17 10723.28 - - - - 9.68 12217.48
1 Year T Bill (Additional Benchmark) 5.92 10596.61 - - - - 6.83 11539.99
NAV (Rs.) Per Unit (as on October 31,2017 : 11.8345) 11.0064 - - 10.00
ICICI Prudential Fixed Maturity Plan - Series 77 - 1144 Days Plan T 7.57 10763.10 - - - - 8.19 11842.10 08-Sep-15
Crisil Composite Bond Fund Index (Benchmark) 7.17 10723.28 - - - - 9.78 12218.29
1 Year T Bill (Additional Benchmark) 5.92 10596.61 - - - - 6.79 11515.43
NAV (Rs.) Per Unit (as on October 31,2017 : 11.8421) 11.0025 - - 10.00
ICICI Prudential Fixed Maturity Plan - Series 77 - 1129 Days Plan W 8.07 10813.79 - - - - 8.30 11827.80 24-Sep-15
Crisil Composite Bond Fund Index (Benchmark) 7.17 10723.28 - - - - 9.74 12159.73
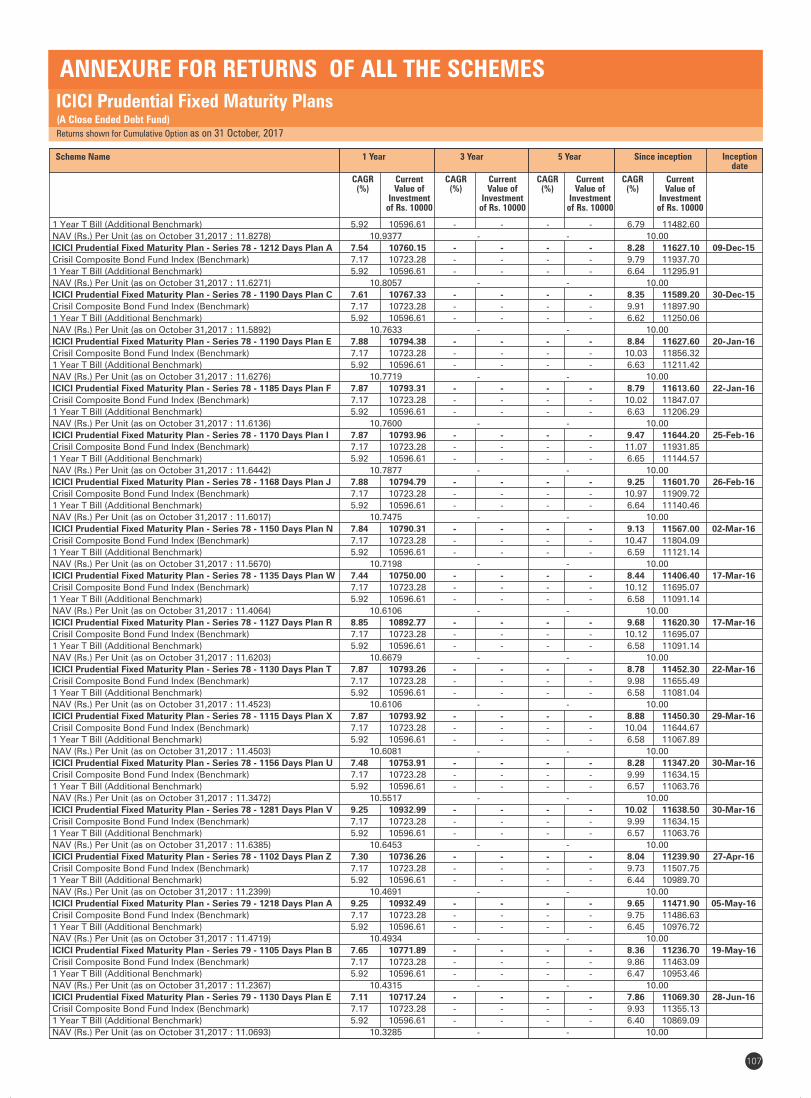
1 Year
CAGR (%)
Current Value of
Investment of Rs. 10000
Scheme Name 3 Year
CAGR (%)
Current Value of
Investment of Rs. 10000
5 Year
CAGR (%)
Current Value of
Investment of Rs. 10000
Since inception
CAGR (%)
Current Value of
Investment of Rs. 10000
Inception date
ICICI Prudential Fixed Maturity Plans(A Close Ended Debt Fund)
Returns shown for Cumulative Option as on 31 October, 2017
ANNEXURE FOR RETURNS OF ALL THE SCHEMES
107
1 Year T Bill (Additional Benchmark) 5.92 10596.61 - - - - 6.79 11482.60
NAV (Rs.) Per Unit (as on October 31,2017 : 11.8278) 10.9377 - - 10.00
ICICI Prudential Fixed Maturity Plan - Series 78 - 1212 Days Plan A 7.54 10760.15 - - - - 8.28 11627.10 09-Dec-15
Crisil Composite Bond Fund Index (Benchmark) 7.17 10723.28 - - - - 9.79 11937.70
1 Year T Bill (Additional Benchmark) 5.92 10596.61 - - - - 6.64 11295.91
NAV (Rs.) Per Unit (as on October 31,2017 : 11.6271) 10.8057 - - 10.00
ICICI Prudential Fixed Maturity Plan - Series 78 - 1190 Days Plan C 7.61 10767.33 - - - - 8.35 11589.20 30-Dec-15
Crisil Composite Bond Fund Index (Benchmark) 7.17 10723.28 - - - - 9.91 11897.90
1 Year T Bill (Additional Benchmark) 5.92 10596.61 - - - - 6.62 11250.06
NAV (Rs.) Per Unit (as on October 31,2017 : 11.5892) 10.7633 - - 10.00
ICICI Prudential Fixed Maturity Plan - Series 78 - 1190 Days Plan E 7.88 10794.38 - - - - 8.84 11627.60 20-Jan-16
Crisil Composite Bond Fund Index (Benchmark) 7.17 10723.28 - - - - 10.03 11856.32
1 Year T Bill (Additional Benchmark) 5.92 10596.61 - - - - 6.63 11211.42
NAV (Rs.) Per Unit (as on October 31,2017 : 11.6276) 10.7719 - - 10.00
ICICI Prudential Fixed Maturity Plan - Series 78 - 1185 Days Plan F 7.87 10793.31 - - - - 8.79 11613.60 22-Jan-16
Crisil Composite Bond Fund Index (Benchmark) 7.17 10723.28 - - - - 10.02 11847.07
1 Year T Bill (Additional Benchmark) 5.92 10596.61 - - - - 6.63 11206.29
NAV (Rs.) Per Unit (as on October 31,2017 : 11.6136) 10.7600 - - 10.00
ICICI Prudential Fixed Maturity Plan - Series 78 - 1170 Days Plan I 7.87 10793.96 - - - - 9.47 11644.20 25-Feb-16
Crisil Composite Bond Fund Index (Benchmark) 7.17 10723.28 - - - - 11.07 11931.85
1 Year T Bill (Additional Benchmark) 5.92 10596.61 - - - - 6.65 11144.57
NAV (Rs.) Per Unit (as on October 31,2017 : 11.6442) 10.7877 - - 10.00
ICICI Prudential Fixed Maturity Plan - Series 78 - 1168 Days Plan J 7.88 10794.79 - - - - 9.25 11601.70 26-Feb-16
Crisil Composite Bond Fund Index (Benchmark) 7.17 10723.28 - - - - 10.97 11909.72
1 Year T Bill (Additional Benchmark) 5.92 10596.61 - - - - 6.64 11140.46
NAV (Rs.) Per Unit (as on October 31,2017 : 11.6017) 10.7475 - - 10.00
ICICI Prudential Fixed Maturity Plan - Series 78 - 1150 Days Plan N 7.84 10790.31 - - - - 9.13 11567.00 02-Mar-16
Crisil Composite Bond Fund Index (Benchmark) 7.17 10723.28 - - - - 10.47 11804.09
1 Year T Bill (Additional Benchmark) 5.92 10596.61 - - - - 6.59 11121.14
NAV (Rs.) Per Unit (as on October 31,2017 : 11.5670) 10.7198 - - 10.00
ICICI Prudential Fixed Maturity Plan - Series 78 - 1135 Days Plan W 7.44 10750.00 - - - - 8.44 11406.40 17-Mar-16
Crisil Composite Bond Fund Index (Benchmark) 7.17 10723.28 - - - - 10.12 11695.07
1 Year T Bill (Additional Benchmark) 5.92 10596.61 - - - - 6.58 11091.14
NAV (Rs.) Per Unit (as on October 31,2017 : 11.4064) 10.6106 - - 10.00
ICICI Prudential Fixed Maturity Plan - Series 78 - 1127 Days Plan R 8.85 10892.77 - - - - 9.68 11620.30 17-Mar-16
Crisil Composite Bond Fund Index (Benchmark) 7.17 10723.28 - - - - 10.12 11695.07
1 Year T Bill (Additional Benchmark) 5.92 10596.61 - - - - 6.58 11091.14
NAV (Rs.) Per Unit (as on October 31,2017 : 11.6203) 10.6679 - - 10.00
ICICI Prudential Fixed Maturity Plan - Series 78 - 1130 Days Plan T 7.87 10793.26 - - - - 8.78 11452.30 22-Mar-16
Crisil Composite Bond Fund Index (Benchmark) 7.17 10723.28 - - - - 9.98 11655.49
1 Year T Bill (Additional Benchmark) 5.92 10596.61 - - - - 6.58 11081.04
NAV (Rs.) Per Unit (as on October 31,2017 : 11.4523) 10.6106 - - 10.00
ICICI Prudential Fixed Maturity Plan - Series 78 - 1115 Days Plan X 7.87 10793.92 - - - - 8.88 11450.30 29-Mar-16
Crisil Composite Bond Fund Index (Benchmark) 7.17 10723.28 - - - - 10.04 11644.67
1 Year T Bill (Additional Benchmark) 5.92 10596.61 - - - - 6.58 11067.89
NAV (Rs.) Per Unit (as on October 31,2017 : 11.4503) 10.6081 - - 10.00
ICICI Prudential Fixed Maturity Plan - Series 78 - 1156 Days Plan U 7.48 10753.91 - - - - 8.28 11347.20 30-Mar-16
Crisil Composite Bond Fund Index (Benchmark) 7.17 10723.28 - - - - 9.99 11634.15
1 Year T Bill (Additional Benchmark) 5.92 10596.61 - - - - 6.57 11063.76
NAV (Rs.) Per Unit (as on October 31,2017 : 11.3472) 10.5517 - - 10.00
ICICI Prudential Fixed Maturity Plan - Series 78 - 1281 Days Plan V 9.25 10932.99 - - - - 10.02 11638.50 30-Mar-16
Crisil Composite Bond Fund Index (Benchmark) 7.17 10723.28 - - - - 9.99 11634.15
1 Year T Bill (Additional Benchmark) 5.92 10596.61 - - - - 6.57 11063.76
NAV (Rs.) Per Unit (as on October 31,2017 : 11.6385) 10.6453 - - 10.00
ICICI Prudential Fixed Maturity Plan - Series 78 - 1102 Days Plan Z 7.30 10736.26 - - - - 8.04 11239.90 27-Apr-16
Crisil Composite Bond Fund Index (Benchmark) 7.17 10723.28 - - - - 9.73 11507.75
1 Year T Bill (Additional Benchmark) 5.92 10596.61 - - - - 6.44 10989.70
NAV (Rs.) Per Unit (as on October 31,2017 : 11.2399) 10.4691 - - 10.00
ICICI Prudential Fixed Maturity Plan - Series 79 - 1218 Days Plan A 9.25 10932.49 - - - - 9.65 11471.90 05-May-16
Crisil Composite Bond Fund Index (Benchmark) 7.17 10723.28 - - - - 9.75 11486.63
1 Year T Bill (Additional Benchmark) 5.92 10596.61 - - - - 6.45 10976.72
NAV (Rs.) Per Unit (as on October 31,2017 : 11.4719) 10.4934 - - 10.00
ICICI Prudential Fixed Maturity Plan - Series 79 - 1105 Days Plan B 7.65 10771.89 - - - - 8.36 11236.70 19-May-16
Crisil Composite Bond Fund Index (Benchmark) 7.17 10723.28 - - - - 9.86 11463.09
1 Year T Bill (Additional Benchmark) 5.92 10596.61 - - - - 6.47 10953.46
NAV (Rs.) Per Unit (as on October 31,2017 : 11.2367) 10.4315 - - 10.00
ICICI Prudential Fixed Maturity Plan - Series 79 - 1130 Days Plan E 7.11 10717.24 - - - - 7.86 11069.30 28-Jun-16
Crisil Composite Bond Fund Index (Benchmark) 7.17 10723.28 - - - - 9.93 11355.13
1 Year T Bill (Additional Benchmark) 5.92 10596.61 - - - - 6.40 10869.09
NAV (Rs.) Per Unit (as on October 31,2017 : 11.0693) 10.3285 - - 10.00
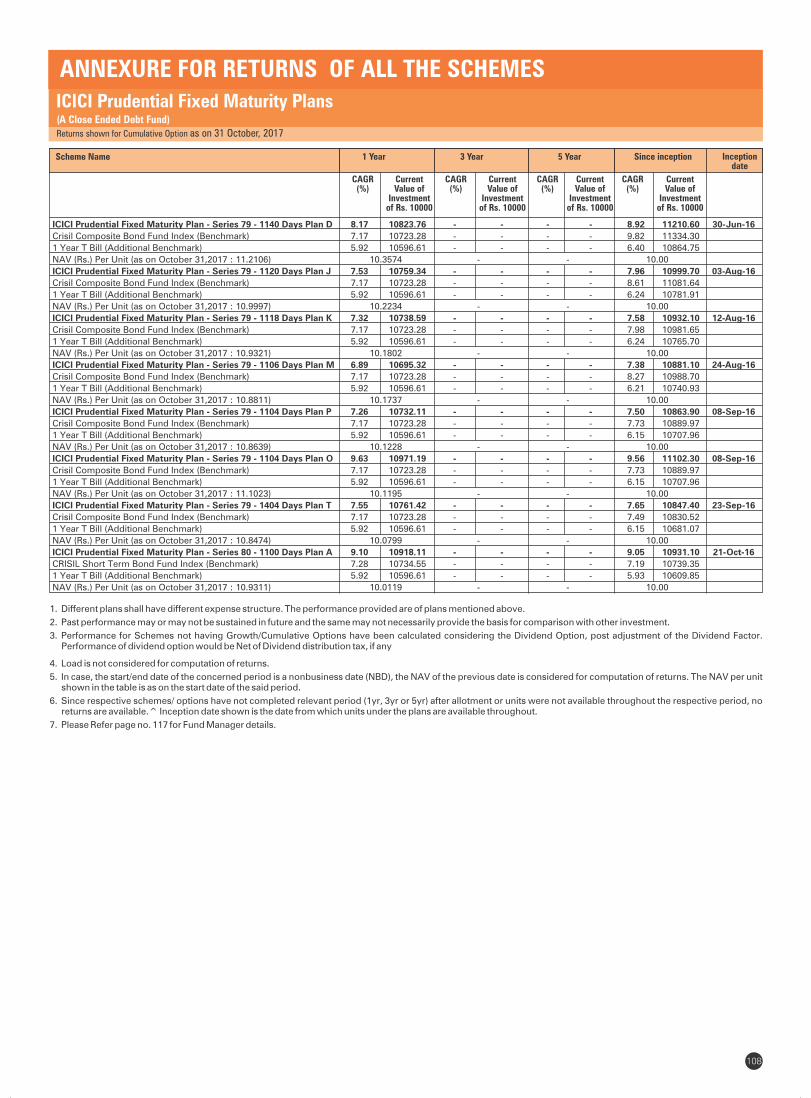
1 Year
CAGR (%)
Current Value of
Investment of Rs. 10000
Scheme Name 3 Year
CAGR (%)
Current Value of
Investment of Rs. 10000
5 Year
CAGR (%)
Current Value of
Investment of Rs. 10000
Since inception
CAGR (%)
Current Value of
Investment of Rs. 10000
Inception date
ICICI Prudential Fixed Maturity Plans(A Close Ended Debt Fund)
Returns shown for Cumulative Option as on 31 October, 2017
ANNEXURE FOR RETURNS OF ALL THE SCHEMES
108
ICICI Prudential Fixed Maturity Plan - Series 79 - 1140 Days Plan D 8.17 10823.76 - - - - 8.92 11210.60 30-Jun-16
Crisil Composite Bond Fund Index (Benchmark) 7.17 10723.28 - - - - 9.82 11334.30
1 Year T Bill (Additional Benchmark) 5.92 10596.61 - - - - 6.40 10864.75
NAV (Rs.) Per Unit (as on October 31,2017 : 11.2106) 10.3574 - - 10.00
ICICI Prudential Fixed Maturity Plan - Series 79 - 1120 Days Plan J 7.53 10759.34 - - - - 7.96 10999.70 03-Aug-16
Crisil Composite Bond Fund Index (Benchmark) 7.17 10723.28 - - - - 8.61 11081.64
1 Year T Bill (Additional Benchmark) 5.92 10596.61 - - - - 6.24 10781.91
NAV (Rs.) Per Unit (as on October 31,2017 : 10.9997) 10.2234 - - 10.00
ICICI Prudential Fixed Maturity Plan - Series 79 - 1118 Days Plan K 7.32 10738.59 - - - - 7.58 10932.10 12-Aug-16
Crisil Composite Bond Fund Index (Benchmark) 7.17 10723.28 - - - - 7.98 10981.65
1 Year T Bill (Additional Benchmark) 5.92 10596.61 - - - - 6.24 10765.70
NAV (Rs.) Per Unit (as on October 31,2017 : 10.9321) 10.1802 - - 10.00
ICICI Prudential Fixed Maturity Plan - Series 79 - 1106 Days Plan M 6.89 10695.32 - - - - 7.38 10881.10 24-Aug-16
Crisil Composite Bond Fund Index (Benchmark) 7.17 10723.28 - - - - 8.27 10988.70
1 Year T Bill (Additional Benchmark) 5.92 10596.61 - - - - 6.21 10740.93
NAV (Rs.) Per Unit (as on October 31,2017 : 10.8811) 10.1737 - - 10.00
ICICI Prudential Fixed Maturity Plan - Series 79 - 1104 Days Plan P 7.26 10732.11 - - - - 7.50 10863.90 08-Sep-16
Crisil Composite Bond Fund Index (Benchmark) 7.17 10723.28 - - - - 7.73 10889.97
1 Year T Bill (Additional Benchmark) 5.92 10596.61 - - - - 6.15 10707.96
NAV (Rs.) Per Unit (as on October 31,2017 : 10.8639) 10.1228 - - 10.00
ICICI Prudential Fixed Maturity Plan - Series 79 - 1104 Days Plan O 9.63 10971.19 - - - - 9.56 11102.30 08-Sep-16
Crisil Composite Bond Fund Index (Benchmark) 7.17 10723.28 - - - - 7.73 10889.97
1 Year T Bill (Additional Benchmark) 5.92 10596.61 - - - - 6.15 10707.96
NAV (Rs.) Per Unit (as on October 31,2017 : 11.1023) 10.1195 - - 10.00
ICICI Prudential Fixed Maturity Plan - Series 79 - 1404 Days Plan T 7.55 10761.42 - - - - 7.65 10847.40 23-Sep-16
Crisil Composite Bond Fund Index (Benchmark) 7.17 10723.28 - - - - 7.49 10830.52
1 Year T Bill (Additional Benchmark) 5.92 10596.61 - - - - 6.15 10681.07
NAV (Rs.) Per Unit (as on October 31,2017 : 10.8474) 10.0799 - - 10.00
ICICI Prudential Fixed Maturity Plan - Series 80 - 1100 Days Plan A 9.10 10918.11 - - - - 9.05 10931.10 21-Oct-16
CRISIL Short Term Bond Fund Index (Benchmark) 7.28 10734.55 - - - - 7.19 10739.35
1 Year T Bill (Additional Benchmark) 5.92 10596.61 - - - - 5.93 10609.85
NAV (Rs.) Per Unit (as on October 31,2017 : 10.9311) 10.0119 - - 10.00
1. Different plans shall have different expense structure. The performance provided are of plans mentioned above.
2. Past performance may or may not be sustained in future and the same may not necessarily provide the basis for comparison with other investment.
3. Performance for Schemes not having Growth/Cumulative Options have been calculated considering the Dividend Option, post adjustment of the Dividend Factor. Performance of dividend option would be Net of Dividend distribution tax, if any
4. Load is not considered for computation of returns.
5. In case, the start/end date of the concerned period is a nonbusiness date (NBD), the NAV of the previous date is considered for computation of returns. The NAV per unit shown in the table is as on the start date of the said period.
6. Since respective schemes/ options have not completed relevant period (1yr, 3yr or 5yr) after allotment or units were not available throughout the respective period, no returns are available.^ Inception date shown is the date from which units under the plans are available throughout.
7. Please Refer page no. 117 for Fund Manager details.
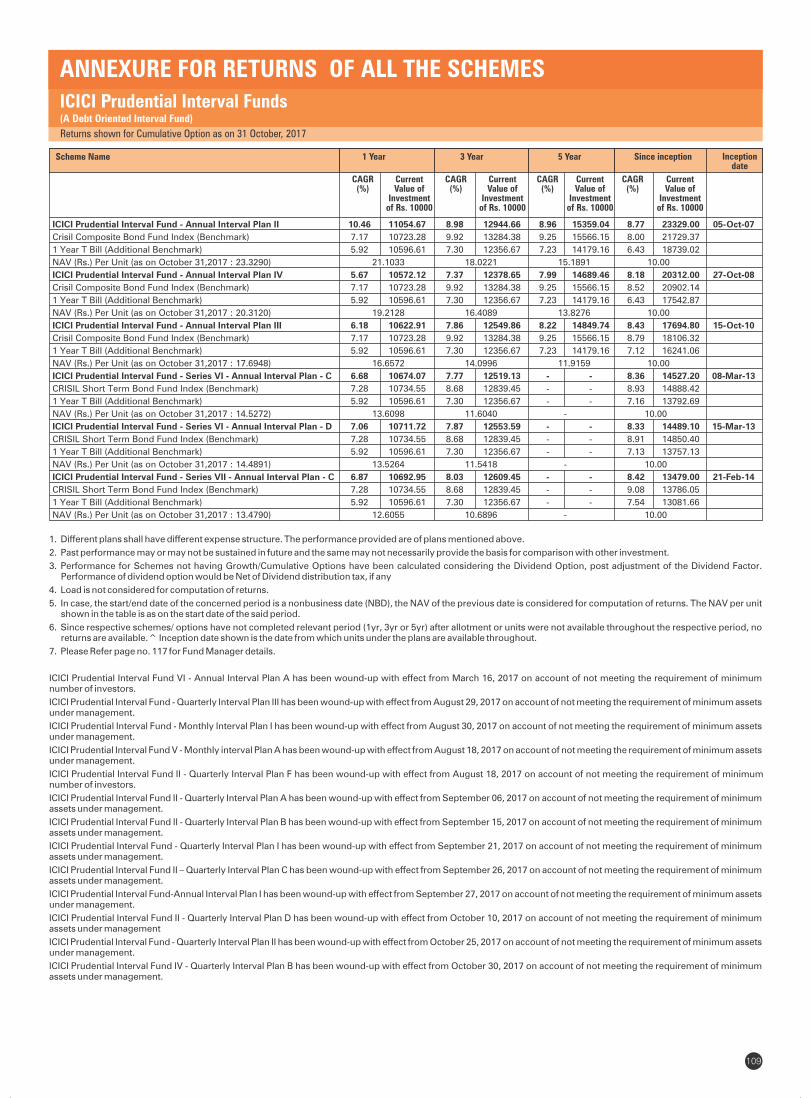
109
ICICI Prudential Interval Funds(A Debt Oriented Interval Fund)
Returns shown for Cumulative Option as on 31 October, 2017
ANNEXURE FOR RETURNS OF ALL THE SCHEMES
1 Year
CAGR (%)
Current Value of
Investment of Rs. 10000
Scheme Name 3 Year
CAGR (%)
Current Value of
Investment of Rs. 10000
5 Year
CAGR (%)
Current Value of
Investment of Rs. 10000
Since inception
CAGR (%)
Current Value of
Investment of Rs. 10000
Inception date
ICICI Prudential Interval Fund - Annual Interval Plan II 10.46 11054.67 8.98 12944.66 8.96 15359.04 8.77 23329.00 05-Oct-07
Crisil Composite Bond Fund Index (Benchmark) 7.17 10723.28 9.92 13284.38 9.25 15566.15 8.00 21729.37
1 Year T Bill (Additional Benchmark) 5.92 10596.61 7.30 12356.67 7.23 14179.16 6.43 18739.02
NAV (Rs.) Per Unit (as on October 31,2017 : 23.3290) 21.1033 18.0221 15.1891 10.00
ICICI Prudential Interval Fund - Annual Interval Plan IV 5.67 10572.12 7.37 12378.65 7.99 14689.46 8.18 20312.00 27-Oct-08
Crisil Composite Bond Fund Index (Benchmark) 7.17 10723.28 9.92 13284.38 9.25 15566.15 8.52 20902.14
1 Year T Bill (Additional Benchmark) 5.92 10596.61 7.30 12356.67 7.23 14179.16 6.43 17542.87
NAV (Rs.) Per Unit (as on October 31,2017 : 20.3120) 19.2128 16.4089 13.8276 10.00
ICICI Prudential Interval Fund - Annual Interval Plan III 6.18 10622.91 7.86 12549.86 8.22 14849.74 8.43 17694.80 15-Oct-10
Crisil Composite Bond Fund Index (Benchmark) 7.17 10723.28 9.92 13284.38 9.25 15566.15 8.79 18106.32
1 Year T Bill (Additional Benchmark) 5.92 10596.61 7.30 12356.67 7.23 14179.16 7.12 16241.06
NAV (Rs.) Per Unit (as on October 31,2017 : 17.6948) 16.6572 14.0996 11.9159 10.00
ICICI Prudential Interval Fund - Series VI - Annual Interval Plan - C 6.68 10674.07 7.77 12519.13 - - 8.36 14527.20 08-Mar-13
CRISIL Short Term Bond Fund Index (Benchmark) 7.28 10734.55 8.68 12839.45 - - 8.93 14888.42
1 Year T Bill (Additional Benchmark) 5.92 10596.61 7.30 12356.67 - - 7.16 13792.69
NAV (Rs.) Per Unit (as on October 31,2017 : 14.5272) 13.6098 11.6040 - 10.00
ICICI Prudential Interval Fund - Series VI - Annual Interval Plan - D 7.06 10711.72 7.87 12553.59 - - 8.33 14489.10 15-Mar-13
CRISIL Short Term Bond Fund Index (Benchmark) 7.28 10734.55 8.68 12839.45 - - 8.91 14850.40
1 Year T Bill (Additional Benchmark) 5.92 10596.61 7.30 12356.67 - - 7.13 13757.13
NAV (Rs.) Per Unit (as on October 31,2017 : 14.4891) 13.5264 11.5418 - 10.00
ICICI Prudential Interval Fund - Series VII - Annual Interval Plan - C 6.87 10692.95 8.03 12609.45 - - 8.42 13479.00 21-Feb-14
CRISIL Short Term Bond Fund Index (Benchmark) 7.28 10734.55 8.68 12839.45 - - 9.08 13786.05
1 Year T Bill (Additional Benchmark) 5.92 10596.61 7.30 12356.67 - - 7.54 13081.66
NAV (Rs.) Per Unit (as on October 31,2017 : 13.4790) 12.6055 10.6896 - 10.00
1. Different plans shall have different expense structure. The performance provided are of plans mentioned above.
2. Past performance may or may not be sustained in future and the same may not necessarily provide the basis for comparison with other investment.
3. Performance for Schemes not having Growth/Cumulative Options have been calculated considering the Dividend Option, post adjustment of the Dividend Factor. Performance of dividend option would be Net of Dividend distribution tax, if any
4. Load is not considered for computation of returns.
5. In case, the start/end date of the concerned period is a nonbusiness date (NBD), the NAV of the previous date is considered for computation of returns. The NAV per unit shown in the table is as on the start date of the said period.
6. Since respective schemes/ options have not completed relevant period (1yr, 3yr or 5yr) after allotment or units were not available throughout the respective period, no returns are available.^ Inception date shown is the date from which units under the plans are available throughout.
7. Please Refer page no. 117 for Fund Manager details.
ICICI Prudential Interval Fund VI - Annual Interval Plan A has been wound-up with effect from March 16, 2017 on account of not meeting the requirement of minimum number of investors.
ICICI Prudential Interval Fund - Quarterly Interval Plan III has been wound-up with effect from August 29, 2017 on account of not meeting the requirement of minimum assets under management.
ICICI Prudential Interval Fund - Monthly Interval Plan I has been wound-up with effect from August 30, 2017 on account of not meeting the requirement of minimum assets under management.
ICICI Prudential Interval Fund V - Monthly interval Plan A has been wound-up with effect from August 18, 2017 on account of not meeting the requirement of minimum assets under management.
ICICI Prudential Interval Fund II - Quarterly Interval Plan F has been wound-up with effect from August 18, 2017 on account of not meeting the requirement of minimum number of investors.
ICICI Prudential Interval Fund II - Quarterly Interval Plan A has been wound-up with effect from September 06, 2017 on account of not meeting the requirement of minimum assets under management.
ICICI Prudential Interval Fund II - Quarterly Interval Plan B has been wound-up with effect from September 15, 2017 on account of not meeting the requirement of minimum assets under management.
ICICI Prudential Interval Fund - Quarterly Interval Plan I has been wound-up with effect from September 21, 2017 on account of not meeting the requirement of minimum assets under management.
ICICI Prudential Interval Fund II – Quarterly Interval Plan C has been wound-up with effect from September 26, 2017 on account of not meeting the requirement of minimum assets under management.
ICICI Prudential Interval Fund-Annual Interval Plan I has been wound-up with effect from September 27, 2017 on account of not meeting the requirement of minimum assets under management.
ICICI Prudential Interval Fund II - Quarterly Interval Plan D has been wound-up with effect from October 10, 2017 on account of not meeting the requirement of minimum assets under management
ICICI Prudential Interval Fund - Quarterly Interval Plan II has been wound-up with effect from October 25, 2017 on account of not meeting the requirement of minimum assets under management.
ICICI Prudential Interval Fund IV - Quarterly Interval Plan B has been wound-up with effect from October 30, 2017 on account of not meeting the requirement of minimum assets under management.
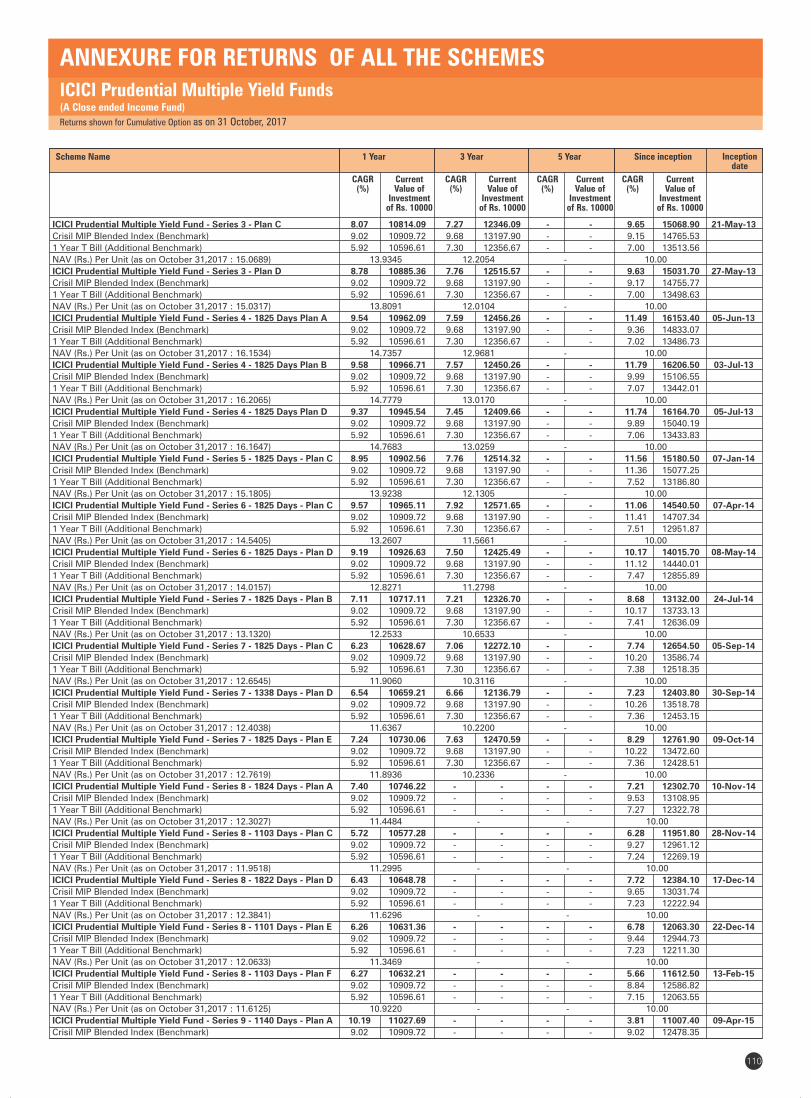
110
Returns shown for Cumulative Option as on 31 October, 2017
ICICI Prudential Multiple Yield Funds(A Close ended Income Fund)
ANNEXURE FOR RETURNS OF ALL THE SCHEMES
1 Year
CAGR (%)
Current Value of
Investment of Rs. 10000
Scheme Name 3 Year
CAGR (%)
Current Value of
Investment of Rs. 10000
5 Year
CAGR (%)
Current Value of
Investment of Rs. 10000
Since inception
CAGR (%)
Current Value of
Investment of Rs. 10000
Inception date
ICICI Prudential Multiple Yield Fund - Series 3 - Plan C 8.07 10814.09 7.27 12346.09 - - 9.65 15068.90 21-May-13
Crisil MIP Blended Index (Benchmark) 9.02 10909.72 9.68 13197.90 - - 9.15 14765.53
1 Year T Bill (Additional Benchmark) 5.92 10596.61 7.30 12356.67 - - 7.00 13513.56
NAV (Rs.) Per Unit (as on October 31,2017 : 15.0689) 13.9345 12.2054 - 10.00
ICICI Prudential Multiple Yield Fund - Series 3 - Plan D 8.78 10885.36 7.76 12515.57 - - 9.63 15031.70 27-May-13
Crisil MIP Blended Index (Benchmark) 9.02 10909.72 9.68 13197.90 - - 9.17 14755.77
1 Year T Bill (Additional Benchmark) 5.92 10596.61 7.30 12356.67 - - 7.00 13498.63
NAV (Rs.) Per Unit (as on October 31,2017 : 15.0317) 13.8091 12.0104 - 10.00
ICICI Prudential Multiple Yield Fund - Series 4 - 1825 Days Plan A 9.54 10962.09 7.59 12456.26 - - 11.49 16153.40 05-Jun-13
Crisil MIP Blended Index (Benchmark) 9.02 10909.72 9.68 13197.90 - - 9.36 14833.07
1 Year T Bill (Additional Benchmark) 5.92 10596.61 7.30 12356.67 - - 7.02 13486.73
NAV (Rs.) Per Unit (as on October 31,2017 : 16.1534) 14.7357 12.9681 - 10.00
ICICI Prudential Multiple Yield Fund - Series 4 - 1825 Days Plan B 9.58 10966.71 7.57 12450.26 - - 11.79 16206.50 03-Jul-13
Crisil MIP Blended Index (Benchmark) 9.02 10909.72 9.68 13197.90 - - 9.99 15106.55
1 Year T Bill (Additional Benchmark) 5.92 10596.61 7.30 12356.67 - - 7.07 13442.01
NAV (Rs.) Per Unit (as on October 31,2017 : 16.2065) 14.7779 13.0170 - 10.00
ICICI Prudential Multiple Yield Fund - Series 4 - 1825 Days Plan D 9.37 10945.54 7.45 12409.66 - - 11.74 16164.70 05-Jul-13
Crisil MIP Blended Index (Benchmark) 9.02 10909.72 9.68 13197.90 - - 9.89 15040.19
1 Year T Bill (Additional Benchmark) 5.92 10596.61 7.30 12356.67 - - 7.06 13433.83
NAV (Rs.) Per Unit (as on October 31,2017 : 16.1647) 14.7683 13.0259 - 10.00
ICICI Prudential Multiple Yield Fund - Series 5 - 1825 Days - Plan C 8.95 10902.56 7.76 12514.32 - - 11.56 15180.50 07-Jan-14
Crisil MIP Blended Index (Benchmark) 9.02 10909.72 9.68 13197.90 - - 11.36 15077.25
1 Year T Bill (Additional Benchmark) 5.92 10596.61 7.30 12356.67 - - 7.52 13186.80
NAV (Rs.) Per Unit (as on October 31,2017 : 15.1805) 13.9238 12.1305 - 10.00
ICICI Prudential Multiple Yield Fund - Series 6 - 1825 Days - Plan C 9.57 10965.11 7.92 12571.65 - - 11.06 14540.50 07-Apr-14
Crisil MIP Blended Index (Benchmark) 9.02 10909.72 9.68 13197.90 - - 11.41 14707.34
1 Year T Bill (Additional Benchmark) 5.92 10596.61 7.30 12356.67 - - 7.51 12951.87
NAV (Rs.) Per Unit (as on October 31,2017 : 14.5405) 13.2607 11.5661 - 10.00
ICICI Prudential Multiple Yield Fund - Series 6 - 1825 Days - Plan D 9.19 10926.63 7.50 12425.49 - - 10.17 14015.70 08-May-14
Crisil MIP Blended Index (Benchmark) 9.02 10909.72 9.68 13197.90 - - 11.12 14440.01
1 Year T Bill (Additional Benchmark) 5.92 10596.61 7.30 12356.67 - - 7.47 12855.89
NAV (Rs.) Per Unit (as on October 31,2017 : 14.0157) 12.8271 11.2798 - 10.00
ICICI Prudential Multiple Yield Fund - Series 7 - 1825 Days - Plan B 7.11 10717.11 7.21 12326.70 - - 8.68 13132.00 24-Jul-14
Crisil MIP Blended Index (Benchmark) 9.02 10909.72 9.68 13197.90 - - 10.17 13733.13
1 Year T Bill (Additional Benchmark) 5.92 10596.61 7.30 12356.67 - - 7.41 12636.09
NAV (Rs.) Per Unit (as on October 31,2017 : 13.1320) 12.2533 10.6533 - 10.00
ICICI Prudential Multiple Yield Fund - Series 7 - 1825 Days - Plan C 6.23 10628.67 7.06 12272.10 - - 7.74 12654.50 05-Sep-14
Crisil MIP Blended Index (Benchmark) 9.02 10909.72 9.68 13197.90 - - 10.20 13586.74
1 Year T Bill (Additional Benchmark) 5.92 10596.61 7.30 12356.67 - - 7.38 12518.35
NAV (Rs.) Per Unit (as on October 31,2017 : 12.6545) 11.9060 10.3116 - 10.00
ICICI Prudential Multiple Yield Fund - Series 7 - 1338 Days - Plan D 6.54 10659.21 6.66 12136.79 - - 7.23 12403.80 30-Sep-14
Crisil MIP Blended Index (Benchmark) 9.02 10909.72 9.68 13197.90 - - 10.26 13518.78
1 Year T Bill (Additional Benchmark) 5.92 10596.61 7.30 12356.67 - - 7.36 12453.15
NAV (Rs.) Per Unit (as on October 31,2017 : 12.4038) 11.6367 10.2200 - 10.00
ICICI Prudential Multiple Yield Fund - Series 7 - 1825 Days - Plan E 7.24 10730.06 7.63 12470.59 - - 8.29 12761.90 09-Oct-14
Crisil MIP Blended Index (Benchmark) 9.02 10909.72 9.68 13197.90 - - 10.22 13472.60
1 Year T Bill (Additional Benchmark) 5.92 10596.61 7.30 12356.67 - - 7.36 12428.51
NAV (Rs.) Per Unit (as on October 31,2017 : 12.7619) 11.8936 10.2336 - 10.00
ICICI Prudential Multiple Yield Fund - Series 8 - 1824 Days - Plan A 7.40 10746.22 - - - - 7.21 12302.70 10-Nov-14
Crisil MIP Blended Index (Benchmark) 9.02 10909.72 - - - - 9.53 13108.95
1 Year T Bill (Additional Benchmark) 5.92 10596.61 - - - - 7.27 12322.78
NAV (Rs.) Per Unit (as on October 31,2017 : 12.3027) 11.4484 - - 10.00
ICICI Prudential Multiple Yield Fund - Series 8 - 1103 Days - Plan C 5.72 10577.28 - - - - 6.28 11951.80 28-Nov-14
Crisil MIP Blended Index (Benchmark) 9.02 10909.72 - - - - 9.27 12961.12
1 Year T Bill (Additional Benchmark) 5.92 10596.61 - - - - 7.24 12269.19
NAV (Rs.) Per Unit (as on October 31,2017 : 11.9518) 11.2995 - - 10.00
ICICI Prudential Multiple Yield Fund - Series 8 - 1822 Days - Plan D 6.43 10648.78 - - - - 7.72 12384.10 17-Dec-14
Crisil MIP Blended Index (Benchmark) 9.02 10909.72 - - - - 9.65 13031.74
1 Year T Bill (Additional Benchmark) 5.92 10596.61 - - - - 7.23 12222.94
NAV (Rs.) Per Unit (as on October 31,2017 : 12.3841) 11.6296 - - 10.00
ICICI Prudential Multiple Yield Fund - Series 8 - 1101 Days - Plan E 6.26 10631.36 - - - - 6.78 12063.30 22-Dec-14
Crisil MIP Blended Index (Benchmark) 9.02 10909.72 - - - - 9.44 12944.73
1 Year T Bill (Additional Benchmark) 5.92 10596.61 - - - - 7.23 12211.30
NAV (Rs.) Per Unit (as on October 31,2017 : 12.0633) 11.3469 - - 10.00
ICICI Prudential Multiple Yield Fund - Series 8 - 1103 Days - Plan F 6.27 10632.21 - - - - 5.66 11612.50 13-Feb-15
Crisil MIP Blended Index (Benchmark) 9.02 10909.72 - - - - 8.84 12586.82
1 Year T Bill (Additional Benchmark) 5.92 10596.61 - - - - 7.15 12063.55
NAV (Rs.) Per Unit (as on October 31,2017 : 11.6125) 10.9220 - - 10.00
ICICI Prudential Multiple Yield Fund - Series 9 - 1140 Days - Plan A 10.19 11027.69 - - - - 3.81 11007.40 09-Apr-15
Crisil MIP Blended Index (Benchmark) 9.02 10909.72 - - - - 9.02 12478.35
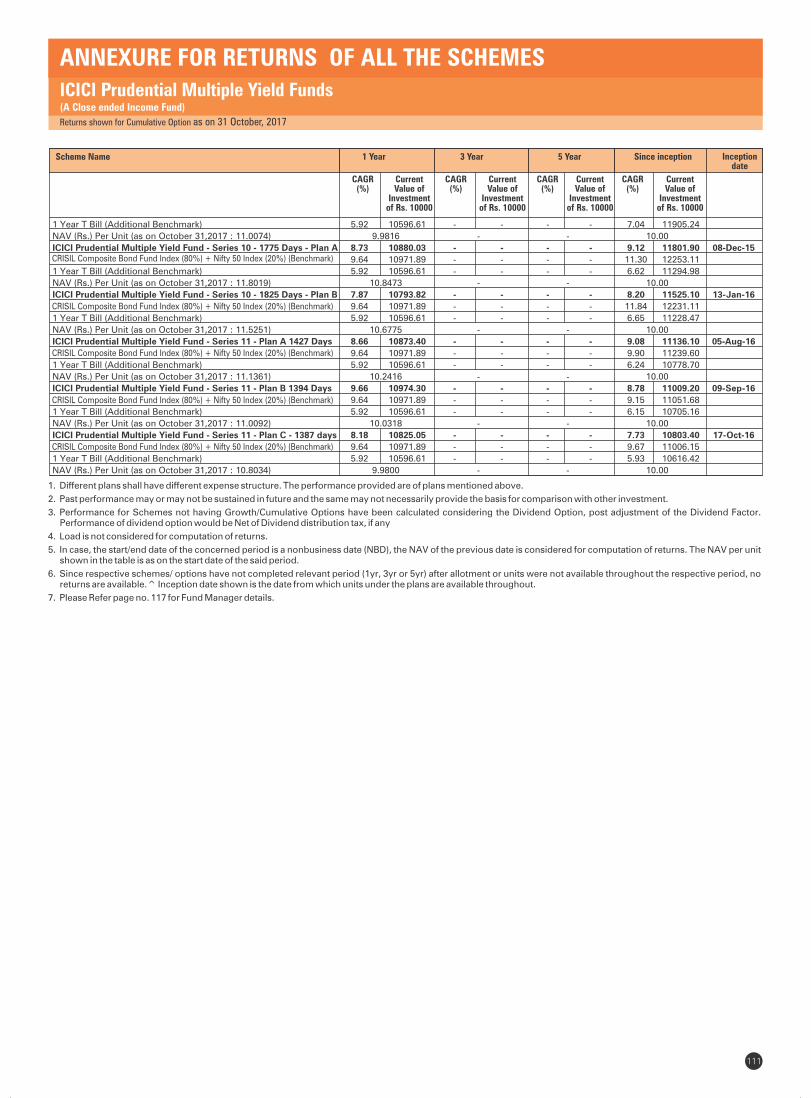
111
ICICI Prudential Multiple Yield Funds(A Close ended Income Fund)
Returns shown for Cumulative Option as on 31 October, 2017
ANNEXURE FOR RETURNS OF ALL THE SCHEMES
1 Year
CAGR (%)
Current Value of
Investment of Rs. 10000
Scheme Name 3 Year
CAGR (%)
Current Value of
Investment of Rs. 10000
5 Year
CAGR (%)
Current Value of
Investment of Rs. 10000
Since inception
CAGR (%)
Current Value of
Investment of Rs. 10000
Inception date
1 Year T Bill (Additional Benchmark) 5.92 10596.61 - - - - 7.04 11905.24
NAV (Rs.) Per Unit (as on October 31,2017 : 11.0074) 9.9816 - - 10.00
ICICI Prudential Multiple Yield Fund - Series 10 - 1775 Days - Plan A 8.73 10880.03 - - - - 9.12 11801.90 08-Dec-15
9.64 10971.89 - - - - 11.30 12253.11
1 Year T Bill (Additional Benchmark) 5.92 10596.61 - - - - 6.62 11294.98
NAV (Rs.) Per Unit (as on October 31,2017 : 11.8019) 10.8473 - - 10.00
ICICI Prudential Multiple Yield Fund - Series 10 - 1825 Days - Plan B 7.87 10793.82 - - - - 8.20 11525.10 13-Jan-16
9.64 10971.89 - - - - 11.84 12231.11
1 Year T Bill (Additional Benchmark) 5.92 10596.61 - - - - 6.65 11228.47
NAV (Rs.) Per Unit (as on October 31,2017 : 11.5251) 10.6775 - - 10.00
ICICI Prudential Multiple Yield Fund - Series 11 - Plan A 1427 Days 8.66 10873.40 - - - - 9.08 11136.10 05-Aug-16
9.64 10971.89 - - - - 9.90 11239.60
1 Year T Bill (Additional Benchmark) 5.92 10596.61 - - - - 6.24 10778.70
NAV (Rs.) Per Unit (as on October 31,2017 : 11.1361) 10.2416 - - 10.00
ICICI Prudential Multiple Yield Fund - Series 11 - Plan B 1394 Days 9.66 10974.30 - - - - 8.78 11009.20 09-Sep-16
9.64 10971.89 - - - - 9.15 11051.68
1 Year T Bill (Additional Benchmark) 5.92 10596.61 - - - - 6.15 10705.16
NAV (Rs.) Per Unit (as on October 31,2017 : 11.0092) 10.0318 - - 10.00
ICICI Prudential Multiple Yield Fund - Series 11 - Plan C - 1387 days 8.18 10825.05 - - - - 7.73 10803.40 17-Oct-16
9.64 10971.89 - - - - 9.67 11006.15
1 Year T Bill (Additional Benchmark) 5.92 10596.61 - - - - 5.93 10616.42
NAV (Rs.) Per Unit (as on October 31,2017 : 10.8034) 9.9800 - - 10.00
1. Different plans shall have different expense structure. The performance provided are of plans mentioned above.
2. Past performance may or may not be sustained in future and the same may not necessarily provide the basis for comparison with other investment.
3. Performance for Schemes not having Growth/Cumulative Options have been calculated considering the Dividend Option, post adjustment of the Dividend Factor. Performance of dividend option would be Net of Dividend distribution tax, if any
4. Load is not considered for computation of returns.
5. In case, the start/end date of the concerned period is a nonbusiness date (NBD), the NAV of the previous date is considered for computation of returns. The NAV per unit shown in the table is as on the start date of the said period.
6. Since respective schemes/ options have not completed relevant period (1yr, 3yr or 5yr) after allotment or units were not available throughout the respective period, no returns are available.^ Inception date shown is the date from which units under the plans are available throughout.
7. Please Refer page no. 117 for Fund Manager details.
CRISIL Composite Bond Fund Index (80%) + Nifty 50 Index (20%) (Benchmark)
CRISIL Composite Bond Fund Index (80%) + Nifty 50 Index (20%) (Benchmark)
CRISIL Composite Bond Fund Index (80%) + Nifty 50 Index (20%) (Benchmark)
CRISIL Composite Bond Fund Index (80%) + Nifty 50 Index (20%) (Benchmark)
CRISIL Composite Bond Fund Index (80%) + Nifty 50 Index (20%) (Benchmark)
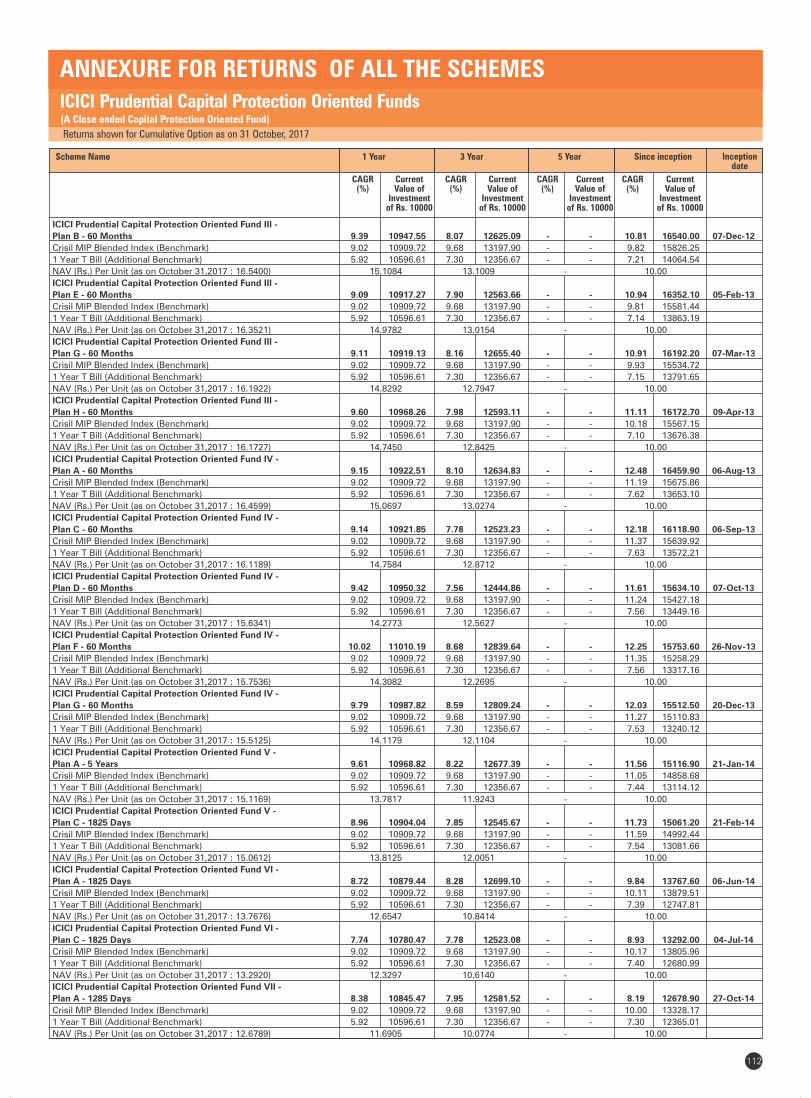
112
ICICI Prudential Capital Protection Oriented Funds(A Close ended Capital Protection Oriented Fund)
Returns shown for Cumulative Option as on 31 October, 2017
ANNEXURE FOR RETURNS OF ALL THE SCHEMES
1 Year
CAGR (%)
Current Value of
Investment of Rs. 10000
Scheme Name 3 Year
CAGR (%)
Current Value of
Investment of Rs. 10000
5 Year
CAGR (%)
Current Value of
Investment of Rs. 10000
Since inception
CAGR (%)
Current Value of
Investment of Rs. 10000
Inception date
ICICI Prudential Capital Protection Oriented Fund III -
Plan B - 60 Months 9.39 10947.55 8.07 12625.09 - - 10.81 16540.00 07-Dec-12
Crisil MIP Blended Index (Benchmark) 9.02 10909.72 9.68 13197.90 - - 9.82 15826.25
1 Year T Bill (Additional Benchmark) 5.92 10596.61 7.30 12356.67 - - 7.21 14064.54
NAV (Rs.) Per Unit (as on October 31,2017 : 16.5400) 15.1084 13.1009 - 10.00
ICICI Prudential Capital Protection Oriented Fund III -
Plan E - 60 Months 9.09 10917.27 7.90 12563.66 - - 10.94 16352.10 05-Feb-13
Crisil MIP Blended Index (Benchmark) 9.02 10909.72 9.68 13197.90 - - 9.81 15581.44
1 Year T Bill (Additional Benchmark) 5.92 10596.61 7.30 12356.67 - - 7.14 13863.19
NAV (Rs.) Per Unit (as on October 31,2017 : 16.3521) 14.9782 13.0154 - 10.00
ICICI Prudential Capital Protection Oriented Fund III -
Plan G - 60 Months 9.11 10919.13 8.16 12655.40 - - 10.91 16192.20 07-Mar-13
Crisil MIP Blended Index (Benchmark) 9.02 10909.72 9.68 13197.90 - - 9.93 15534.72
1 Year T Bill (Additional Benchmark) 5.92 10596.61 7.30 12356.67 - - 7.15 13791.65
NAV (Rs.) Per Unit (as on October 31,2017 : 16.1922) 14.8292 12.7947 - 10.00
ICICI Prudential Capital Protection Oriented Fund III -
Plan H - 60 Months 9.60 10968.26 7.98 12593.11 - - 11.11 16172.70 09-Apr-13
Crisil MIP Blended Index (Benchmark) 9.02 10909.72 9.68 13197.90 - - 10.18 15567.15
1 Year T Bill (Additional Benchmark) 5.92 10596.61 7.30 12356.67 - - 7.10 13676.38
NAV (Rs.) Per Unit (as on October 31,2017 : 16.1727) 14.7450 12.8425 - 10.00
ICICI Prudential Capital Protection Oriented Fund IV -
Plan A - 60 Months 9.15 10922.51 8.10 12634.83 - - 12.48 16459.90 06-Aug-13
Crisil MIP Blended Index (Benchmark) 9.02 10909.72 9.68 13197.90 - - 11.19 15675.86
1 Year T Bill (Additional Benchmark) 5.92 10596.61 7.30 12356.67 - - 7.62 13653.10
NAV (Rs.) Per Unit (as on October 31,2017 : 16.4599) 15.0697 13.0274 - 10.00
ICICI Prudential Capital Protection Oriented Fund IV -
Plan C - 60 Months 9.14 10921.85 7.78 12523.23 - - 12.18 16118.90 06-Sep-13
Crisil MIP Blended Index (Benchmark) 9.02 10909.72 9.68 13197.90 - - 11.37 15639.92
1 Year T Bill (Additional Benchmark) 5.92 10596.61 7.30 12356.67 - - 7.63 13572.21
NAV (Rs.) Per Unit (as on October 31,2017 : 16.1189) 14.7584 12.8712 - 10.00
ICICI Prudential Capital Protection Oriented Fund IV -
Plan D - 60 Months 9.42 10950.32 7.56 12444.86 - - 11.61 15634.10 07-Oct-13
Crisil MIP Blended Index (Benchmark) 9.02 10909.72 9.68 13197.90 - - 11.24 15427.18
1 Year T Bill (Additional Benchmark) 5.92 10596.61 7.30 12356.67 - - 7.56 13449.16
NAV (Rs.) Per Unit (as on October 31,2017 : 15.6341) 14.2773 12.5627 - 10.00
ICICI Prudential Capital Protection Oriented Fund IV -
Plan F - 60 Months 10.02 11010.19 8.68 12839.64 - - 12.25 15753.60 26-Nov-13
Crisil MIP Blended Index (Benchmark) 9.02 10909.72 9.68 13197.90 - - 11.35 15258.29
1 Year T Bill (Additional Benchmark) 5.92 10596.61 7.30 12356.67 - - 7.56 13317.16
NAV (Rs.) Per Unit (as on October 31,2017 : 15.7536) 14.3082 12.2695 - 10.00
ICICI Prudential Capital Protection Oriented Fund IV -
Plan G - 60 Months 9.79 10987.82 8.59 12809.24 - - 12.03 15512.50 20-Dec-13
Crisil MIP Blended Index (Benchmark) 9.02 10909.72 9.68 13197.90 - - 11.27 15110.83
1 Year T Bill (Additional Benchmark) 5.92 10596.61 7.30 12356.67 - - 7.53 13240.12
NAV (Rs.) Per Unit (as on October 31,2017 : 15.5125) 14.1179 12.1104 - 10.00
ICICI Prudential Capital Protection Oriented Fund V -
Plan A - 5 Years 9.61 10968.82 8.22 12677.39 - - 11.56 15116.90 21-Jan-14
Crisil MIP Blended Index (Benchmark) 9.02 10909.72 9.68 13197.90 - - 11.05 14858.68
1 Year T Bill (Additional Benchmark) 5.92 10596.61 7.30 12356.67 - - 7.44 13114.12
NAV (Rs.) Per Unit (as on October 31,2017 : 15.1169) 13.7817 11.9243 - 10.00
ICICI Prudential Capital Protection Oriented Fund V -
Plan C - 1825 Days 8.96 10904.04 7.85 12545.67 - - 11.73 15061.20 21-Feb-14
Crisil MIP Blended Index (Benchmark) 9.02 10909.72 9.68 13197.90 - - 11.59 14992.44
1 Year T Bill (Additional Benchmark) 5.92 10596.61 7.30 12356.67 - - 7.54 13081.66
NAV (Rs.) Per Unit (as on October 31,2017 : 15.0612) 13.8125 12.0051 - 10.00
ICICI Prudential Capital Protection Oriented Fund VI -
Plan A - 1825 Days 8.72 10879.44 8.28 12699.10 - - 9.84 13767.60 06-Jun-14
Crisil MIP Blended Index (Benchmark) 9.02 10909.72 9.68 13197.90 - - 10.11 13879.51
1 Year T Bill (Additional Benchmark) 5.92 10596.61 7.30 12356.67 - - 7.39 12747.81
NAV (Rs.) Per Unit (as on October 31,2017 : 13.7676) 12.6547 10.8414 - 10.00
ICICI Prudential Capital Protection Oriented Fund VI -
Plan C - 1825 Days 7.74 10780.47 7.78 12523.08 - - 8.93 13292.00 04-Jul-14
Crisil MIP Blended Index (Benchmark) 9.02 10909.72 9.68 13197.90 - - 10.17 13805.96
1 Year T Bill (Additional Benchmark) 5.92 10596.61 7.30 12356.67 - - 7.40 12680.99
NAV (Rs.) Per Unit (as on October 31,2017 : 13.2920) 12.3297 10.6140 - 10.00
ICICI Prudential Capital Protection Oriented Fund VII -
Plan A - 1285 Days 8.38 10845.47 7.95 12581.52 - - 8.19 12678.90 27-Oct-14
Crisil MIP Blended Index (Benchmark) 9.02 10909.72 9.68 13197.90 - - 10.00 13328.17
1 Year T Bill (Additional Benchmark) 5.92 10596.61 7.30 12356.67 - - 7.30 12365.01
NAV (Rs.) Per Unit (as on October 31,2017 : 12.6789) 11.6905 10.0774 - 10.00
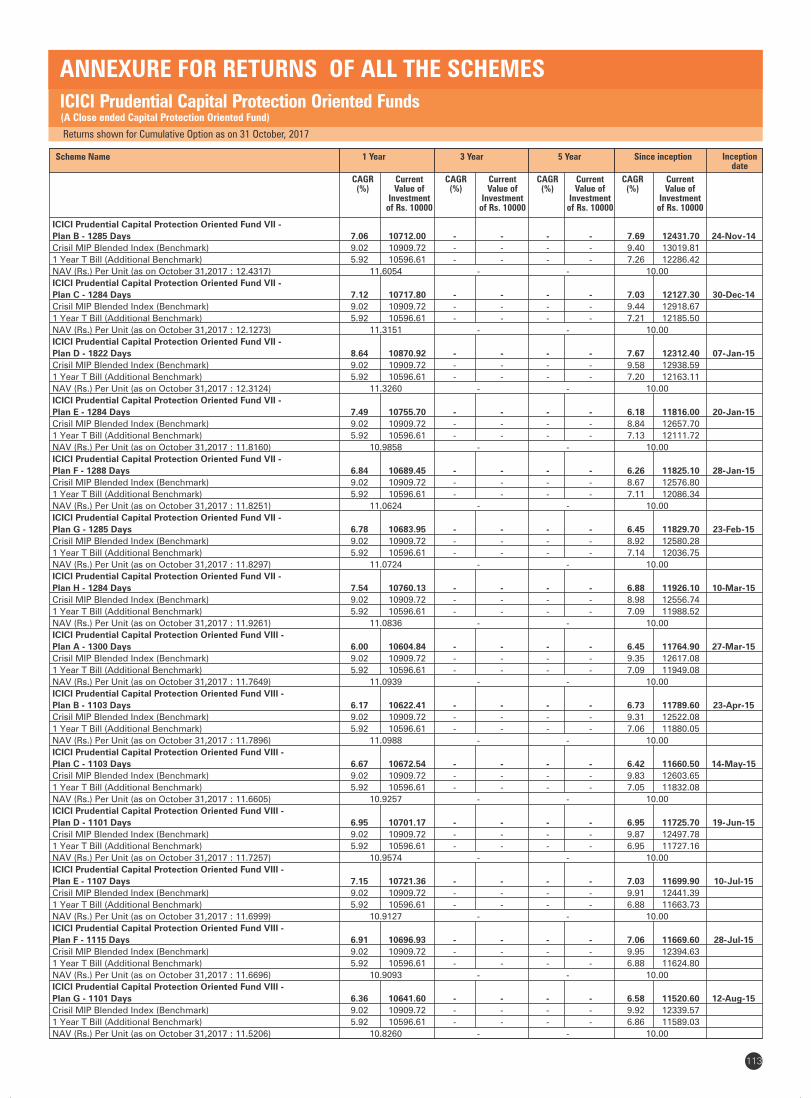
113
ICICI Prudential Capital Protection Oriented Funds (A Close ended Capital Protection Oriented Fund)
Returns shown for Cumulative Option as on 31 October, 2017
ANNEXURE FOR RETURNS OF ALL THE SCHEMES
1 Year
CAGR (%)
Current Value of
Investment of Rs. 10000
Scheme Name 3 Year
CAGR (%)
Current Value of
Investment of Rs. 10000
5 Year
CAGR (%)
Current Value of
Investment of Rs. 10000
Since inception
CAGR (%)
Current Value of
Investment of Rs. 10000
Inception date
ICICI Prudential Capital Protection Oriented Fund VII -
Plan B - 1285 Days 7.06 10712.00 - - - - 7.69 12431.70 24-Nov-14
Crisil MIP Blended Index (Benchmark) 9.02 10909.72 - - - - 9.40 13019.81
1 Year T Bill (Additional Benchmark) 5.92 10596.61 - - - - 7.26 12286.42
NAV (Rs.) Per Unit (as on October 31,2017 : 12.4317) 11.6054 - - 10.00
ICICI Prudential Capital Protection Oriented Fund VII -
Plan C - 1284 Days 7.12 10717.80 - - - - 7.03 12127.30 30-Dec-14
Crisil MIP Blended Index (Benchmark) 9.02 10909.72 - - - - 9.44 12918.67
1 Year T Bill (Additional Benchmark) 5.92 10596.61 - - - - 7.21 12185.50
NAV (Rs.) Per Unit (as on October 31,2017 : 12.1273) 11.3151 - - 10.00
ICICI Prudential Capital Protection Oriented Fund VII -
Plan D - 1822 Days 8.64 10870.92 - - - - 7.67 12312.40 07-Jan-15
Crisil MIP Blended Index (Benchmark) 9.02 10909.72 - - - - 9.58 12938.59
1 Year T Bill (Additional Benchmark) 5.92 10596.61 - - - - 7.20 12163.11
NAV (Rs.) Per Unit (as on October 31,2017 : 12.3124) 11.3260 - - 10.00
ICICI Prudential Capital Protection Oriented Fund VII -
Plan E - 1284 Days 7.49 10755.70 - - - - 6.18 11816.00 20-Jan-15
Crisil MIP Blended Index (Benchmark) 9.02 10909.72 - - - - 8.84 12657.70
1 Year T Bill (Additional Benchmark) 5.92 10596.61 - - - - 7.13 12111.72
NAV (Rs.) Per Unit (as on October 31,2017 : 11.8160) 10.9858 - - 10.00
ICICI Prudential Capital Protection Oriented Fund VII -
Plan F - 1288 Days 6.84 10689.45 - - - - 6.26 11825.10 28-Jan-15
Crisil MIP Blended Index (Benchmark) 9.02 10909.72 - - - - 8.67 12576.80
1 Year T Bill (Additional Benchmark) 5.92 10596.61 - - - - 7.11 12086.34
NAV (Rs.) Per Unit (as on October 31,2017 : 11.8251) 11.0624 - - 10.00
ICICI Prudential Capital Protection Oriented Fund VII -
Plan G - 1285 Days 6.78 10683.95 - - - - 6.45 11829.70 23-Feb-15
Crisil MIP Blended Index (Benchmark) 9.02 10909.72 - - - - 8.92 12580.28
1 Year T Bill (Additional Benchmark) 5.92 10596.61 - - - - 7.14 12036.75
NAV (Rs.) Per Unit (as on October 31,2017 : 11.8297) 11.0724 - - 10.00
ICICI Prudential Capital Protection Oriented Fund VII -
Plan H - 1284 Days 7.54 10760.13 - - - - 6.88 11926.10 10-Mar-15
Crisil MIP Blended Index (Benchmark) 9.02 10909.72 - - - - 8.98 12556.74
1 Year T Bill (Additional Benchmark) 5.92 10596.61 - - - - 7.09 11988.52
NAV (Rs.) Per Unit (as on October 31,2017 : 11.9261) 11.0836 - - 10.00
ICICI Prudential Capital Protection Oriented Fund VIII -
Plan A - 1300 Days 6.00 10604.84 - - - - 6.45 11764.90 27-Mar-15
Crisil MIP Blended Index (Benchmark) 9.02 10909.72 - - - - 9.35 12617.08
1 Year T Bill (Additional Benchmark) 5.92 10596.61 - - - - 7.09 11949.08
NAV (Rs.) Per Unit (as on October 31,2017 : 11.7649) 11.0939 - - 10.00
ICICI Prudential Capital Protection Oriented Fund VIII -
Plan B - 1103 Days 6.17 10622.41 - - - - 6.73 11789.60 23-Apr-15
Crisil MIP Blended Index (Benchmark) 9.02 10909.72 - - - - 9.31 12522.08
1 Year T Bill (Additional Benchmark) 5.92 10596.61 - - - - 7.06 11880.05
NAV (Rs.) Per Unit (as on October 31,2017 : 11.7896) 11.0988 - - 10.00
ICICI Prudential Capital Protection Oriented Fund VIII -
Plan C - 1103 Days 6.67 10672.54 - - - - 6.42 11660.50 14-May-15
Crisil MIP Blended Index (Benchmark) 9.02 10909.72 - - - - 9.83 12603.65
1 Year T Bill (Additional Benchmark) 5.92 10596.61 - - - - 7.05 11832.08
NAV (Rs.) Per Unit (as on October 31,2017 : 11.6605) 10.9257 - - 10.00
ICICI Prudential Capital Protection Oriented Fund VIII -
Plan D - 1101 Days 6.95 10701.17 - - - - 6.95 11725.70 19-Jun-15
Crisil MIP Blended Index (Benchmark) 9.02 10909.72 - - - - 9.87 12497.78
1 Year T Bill (Additional Benchmark) 5.92 10596.61 - - - - 6.95 11727.16
NAV (Rs.) Per Unit (as on October 31,2017 : 11.7257) 10.9574 - - 10.00
ICICI Prudential Capital Protection Oriented Fund VIII -
Plan E - 1107 Days 7.15 10721.36 - - - - 7.03 11699.90 10-Jul-15
Crisil MIP Blended Index (Benchmark) 9.02 10909.72 - - - - 9.91 12441.39
1 Year T Bill (Additional Benchmark) 5.92 10596.61 - - - - 6.88 11663.73
NAV (Rs.) Per Unit (as on October 31,2017 : 11.6999) 10.9127 - - 10.00
ICICI Prudential Capital Protection Oriented Fund VIII -
Plan F - 1115 Days 6.91 10696.93 - - - - 7.06 11669.60 28-Jul-15
Crisil MIP Blended Index (Benchmark) 9.02 10909.72 - - - - 9.95 12394.63
1 Year T Bill (Additional Benchmark) 5.92 10596.61 - - - - 6.88 11624.80
NAV (Rs.) Per Unit (as on October 31,2017 : 11.6696) 10.9093 - - 10.00
ICICI Prudential Capital Protection Oriented Fund VIII -
Plan G - 1101 Days 6.36 10641.60 - - - - 6.58 11520.60 12-Aug-15
Crisil MIP Blended Index (Benchmark) 9.02 10909.72 - - - - 9.92 12339.57
1 Year T Bill (Additional Benchmark) 5.92 10596.61 - - - - 6.86 11589.03
NAV (Rs.) Per Unit (as on October 31,2017 : 11.5206) 10.8260 - - 10.00
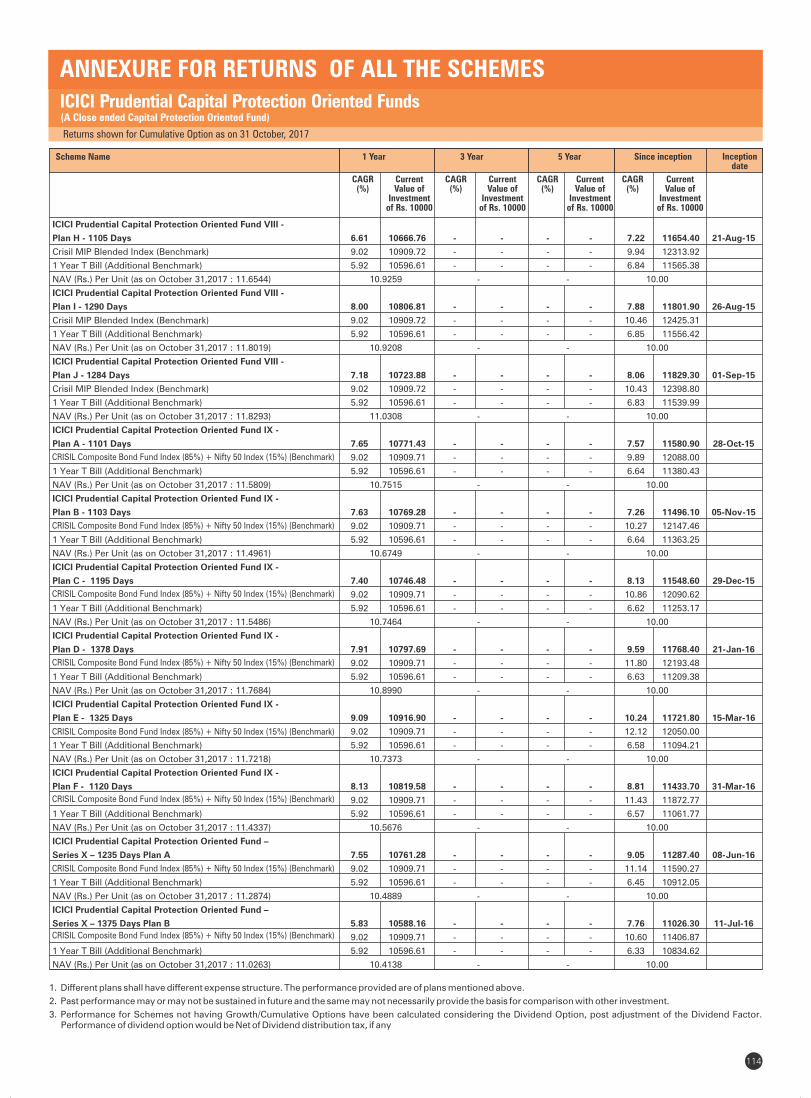
ICICI Prudential Capital Protection Oriented Funds (A Close ended Capital Protection Oriented Fund)
Returns shown for Cumulative Option as on 31 October, 2017
ANNEXURE FOR RETURNS OF ALL THE SCHEMES
114
1 Year
CAGR (%)
Current Value of
Investment of Rs. 10000
Scheme Name 3 Year
CAGR (%)
Current Value of
Investment of Rs. 10000
5 Year
CAGR (%)
Current Value of
Investment of Rs. 10000
Since inception
CAGR (%)
Current Value of
Investment of Rs. 10000
Inception date
1. Different plans shall have different expense structure. The performance provided are of plans mentioned above.
2. Past performance may or may not be sustained in future and the same may not necessarily provide the basis for comparison with other investment.
3. Performance for Schemes not having Growth/Cumulative Options have been calculated considering the Dividend Option, post adjustment of the Dividend Factor. Performance of dividend option would be Net of Dividend distribution tax, if any
ICICI Prudential Capital Protection Oriented Fund VIII -
Plan H - 1105 Days 6.61 10666.76 - - - - 7.22 11654.40 21-Aug-15
Crisil MIP Blended Index (Benchmark) 9.02 10909.72 - - - - 9.94 12313.92
1 Year T Bill (Additional Benchmark) 5.92 10596.61 - - - - 6.84 11565.38
NAV (Rs.) Per Unit (as on October 31,2017 : 11.6544) 10.9259 - - 10.00
ICICI Prudential Capital Protection Oriented Fund VIII -
Plan I - 1290 Days 8.00 10806.81 - - - - 7.88 11801.90 26-Aug-15
Crisil MIP Blended Index (Benchmark) 9.02 10909.72 - - - - 10.46 12425.31
1 Year T Bill (Additional Benchmark) 5.92 10596.61 - - - - 6.85 11556.42
NAV (Rs.) Per Unit (as on October 31,2017 : 11.8019) 10.9208 - - 10.00
ICICI Prudential Capital Protection Oriented Fund VIII -
Plan J - 1284 Days 7.18 10723.88 - - - - 8.06 11829.30 01-Sep-15
Crisil MIP Blended Index (Benchmark) 9.02 10909.72 - - - - 10.43 12398.80
1 Year T Bill (Additional Benchmark) 5.92 10596.61 - - - - 6.83 11539.99
NAV (Rs.) Per Unit (as on October 31,2017 : 11.8293) 11.0308 - - 10.00
ICICI Prudential Capital Protection Oriented Fund IX -
Plan A - 1101 Days 7.65 10771.43 - - - - 7.57 11580.90 28-Oct-15
9.02 10909.71 - - - - 9.89 12088.00
1 Year T Bill (Additional Benchmark) 5.92 10596.61 - - - - 6.64 11380.43
NAV (Rs.) Per Unit (as on October 31,2017 : 11.5809) 10.7515 - - 10.00
ICICI Prudential Capital Protection Oriented Fund IX -
Plan B - 1103 Days 7.63 10769.28 - - - - 7.26 11496.10 05-Nov-15
9.02 10909.71 - - - - 10.27 12147.46
1 Year T Bill (Additional Benchmark) 5.92 10596.61 - - - - 6.64 11363.25
NAV (Rs.) Per Unit (as on October 31,2017 : 11.4961) 10.6749 - - 10.00
ICICI Prudential Capital Protection Oriented Fund IX -
Plan C - 1195 Days 7.40 10746.48 - - - - 8.13 11548.60 29-Dec-15
9.02 10909.71 - - - - 10.86 12090.62
1 Year T Bill (Additional Benchmark) 5.92 10596.61 - - - - 6.62 11253.17
NAV (Rs.) Per Unit (as on October 31,2017 : 11.5486) 10.7464 - - 10.00
ICICI Prudential Capital Protection Oriented Fund IX -
Plan D - 1378 Days 7.91 10797.69 - - - - 9.59 11768.40 21-Jan-16
9.02 10909.71 - - - - 11.80 12193.48
1 Year T Bill (Additional Benchmark) 5.92 10596.61 - - - - 6.63 11209.38
NAV (Rs.) Per Unit (as on October 31,2017 : 11.7684) 10.8990 - - 10.00
ICICI Prudential Capital Protection Oriented Fund IX -
Plan E - 1325 Days 9.09 10916.90 - - - - 10.24 11721.80 15-Mar-16
9.02 10909.71 - - - - 12.12 12050.00
1 Year T Bill (Additional Benchmark) 5.92 10596.61 - - - - 6.58 11094.21
NAV (Rs.) Per Unit (as on October 31,2017 : 11.7218) 10.7373 - - 10.00
ICICI Prudential Capital Protection Oriented Fund IX -
Plan F - 1120 Days 8.13 10819.58 - - - - 8.81 11433.70 31-Mar-16
9.02 10909.71 - - - - 11.43 11872.77
1 Year T Bill (Additional Benchmark) 5.92 10596.61 - - - - 6.57 11061.77
NAV (Rs.) Per Unit (as on October 31,2017 : 11.4337) 10.5676 - - 10.00
ICICI Prudential Capital Protection Oriented Fund –
Series X – 1235 Days Plan A 7.55 10761.28 - - - - 9.05 11287.40 08-Jun-16
9.02 10909.71 - - - - 11.14 11590.27
1 Year T Bill (Additional Benchmark) 5.92 10596.61 - - - - 6.45 10912.05
NAV (Rs.) Per Unit (as on October 31,2017 : 11.2874) 10.4889 - - 10.00
ICICI Prudential Capital Protection Oriented Fund –
Series X – 1375 Days Plan B 5.83 10588.16 - - - - 7.76 11026.30 11-Jul-16
9.02 10909.71 - - - - 10.60 11406.87
1 Year T Bill (Additional Benchmark) 5.92 10596.61 - - - - 6.33 10834.62
NAV (Rs.) Per Unit (as on October 31,2017 : 11.0263) 10.4138 - - 10.00
CRISIL Composite Bond Fund Index (85%) + Nifty 50 Index (15%) (Benchmark)
CRISIL Composite Bond Fund Index (85%) + Nifty 50 Index (15%) (Benchmark)
CRISIL Composite Bond Fund Index (85%) + Nifty 50 Index (15%) (Benchmark)
CRISIL Composite Bond Fund Index (85%) + Nifty 50 Index (15%) (Benchmark)
CRISIL Composite Bond Fund Index (85%) + Nifty 50 Index (15%) (Benchmark)
CRISIL Composite Bond Fund Index (85%) + Nifty 50 Index (15%) (Benchmark)
CRISIL Composite Bond Fund Index (85%) + Nifty 50 Index (15%) (Benchmark)
CRISIL Composite Bond Fund Index (85%) + Nifty 50 Index (15%) (Benchmark)

ICICI Prudential Capital Protection Oriented Funds (A Close ended Capital Protection Oriented Fund)
Returns shown for Cumulative Option
ANNEXURE FOR RETURNS OF ALL THE SCHEMES
115
Returns shown for Cumulative Option as on 31 October, 2017
4. Load is not considered for computation of returns.
5. In case, the start/end date of the concerned period is a nonbusiness date (NBD), the NAV of the previous date is considered for computation of returns. The NAV per unit shown in the table is as on the start date of the said period.
6. Since respective schemes/ options have not completed relevant period (1yr, 3yr or 5yr) after allotment or units were not available throughout the respective period, no returns are available.^ Inception date shown is the date from which units under the plans are available throughout.
7. Please Refer page no. 117 for Fund Manager details.
“The Scheme offered is “oriented towards protection of capital” and “not with guaranteed returns”.The orientation towards protection of the capital originates from the portfolio structure of the Scheme and not from any bank guarantee, insurance cover etc. The ability of the portfolio to meet capital protection on maturity to the investors can be impacted in certain circumstances including changes in government policies, interest rate movements in the market, credit defaults by bonds, expenses, reinvestment risk and risk associated with trading volumes, liquidity and settlement systems in equity and debt markets. Accordingly, investors may lose part or all of their investment (including original amount invested) in the Scheme. No guarantee or assurance, express or implied, is given that investors will receive the capital protected value at maturity or any other returns. Investors in the Scheme are not being offered any guaranteed / assured returns.”
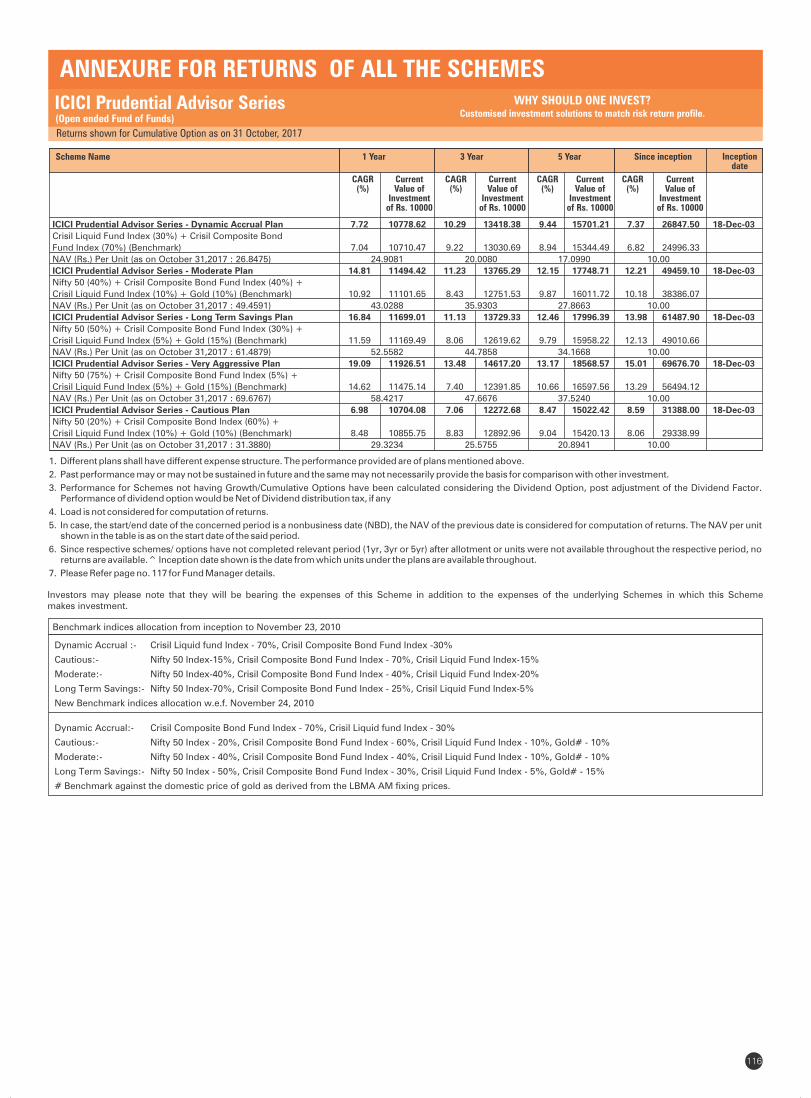
Returns shown for Cumulative Option as on 31 October, 2017
ICICI Prudential Advisor Series(Open ended Fund of Funds)
WHY SHOULD ONE INVEST?Customised investment solutions to match risk return profile.
ANNEXURE FOR RETURNS OF ALL THE SCHEMES
116
1 Year
CAGR (%)
Current Value of
Investment of Rs. 10000
Scheme Name 3 Year
CAGR (%)
Current Value of
Investment of Rs. 10000
5 Year
CAGR (%)
Current Value of
Investment of Rs. 10000
Since inception
CAGR (%)
Current Value of
Investment of Rs. 10000
Inception date
ICICI Prudential Advisor Series - Dynamic Accrual Plan 7.72 10778.62 10.29 13418.38 9.44 15701.21 7.37 26847.50 18-Dec-03
Crisil Liquid Fund Index (30%) + Crisil Composite Bond
Fund Index (70%) (Benchmark) 7.04 10710.47 9.22 13030.69 8.94 15344.49 6.82 24996.33
NAV (Rs.) Per Unit (as on October 31,2017 : 26.8475) 24.9081 20.0080 17.0990 10.00
ICICI Prudential Advisor Series - Moderate Plan 14.81 11494.42 11.23 13765.29 12.15 17748.71 12.21 49459.10 18-Dec-03
Nifty 50 (40%) + Crisil Composite Bond Fund Index (40%) +
Crisil Liquid Fund Index (10%) + Gold (10%) (Benchmark) 10.92 11101.65 8.43 12751.53 9.87 16011.72 10.18 38386.07
NAV (Rs.) Per Unit (as on October 31,2017 : 49.4591) 43.0288 35.9303 27.8663 10.00
ICICI Prudential Advisor Series - Long Term Savings Plan 16.84 11699.01 11.13 13729.33 12.46 17996.39 13.98 61487.90 18-Dec-03
Nifty 50 (50%) + Crisil Composite Bond Fund Index (30%) +
Crisil Liquid Fund Index (5%) + Gold (15%) (Benchmark) 11.59 11169.49 8.06 12619.62 9.79 15958.22 12.13 49010.66
NAV (Rs.) Per Unit (as on October 31,2017 : 61.4879) 52.5582 44.7858 34.1668 10.00
ICICI Prudential Advisor Series - Very Aggressive Plan 19.09 11926.51 13.48 14617.20 13.17 18568.57 15.01 69676.70 18-Dec-03
Nifty 50 (75%) + Crisil Composite Bond Fund Index (5%) +
Crisil Liquid Fund Index (5%) + Gold (15%) (Benchmark) 14.62 11475.14 7.40 12391.85 10.66 16597.56 13.29 56494.12
NAV (Rs.) Per Unit (as on October 31,2017 : 69.6767) 58.4217 47.6676 37.5240 10.00
ICICI Prudential Advisor Series - Cautious Plan 6.98 10704.08 7.06 12272.68 8.47 15022.42 8.59 31388.00 18-Dec-03
Nifty 50 (20%) + Crisil Composite Bond Index (60%) +
Crisil Liquid Fund Index (10%) + Gold (10%) (Benchmark) 8.48 10855.75 8.83 12892.96 9.04 15420.13 8.06 29338.99
NAV (Rs.) Per Unit (as on October 31,2017 : 31.3880) 29.3234 25.5755 20.8941 10.00
1. Different plans shall have different expense structure. The performance provided are of plans mentioned above.
2. Past performance may or may not be sustained in future and the same may not necessarily provide the basis for comparison with other investment.
3. Performance for Schemes not having Growth/Cumulative Options have been calculated considering the Dividend Option, post adjustment of the Dividend Factor. Performance of dividend option would be Net of Dividend distribution tax, if any
4. Load is not considered for computation of returns.
5. In case, the start/end date of the concerned period is a nonbusiness date (NBD), the NAV of the previous date is considered for computation of returns. The NAV per unit shown in the table is as on the start date of the said period.
6. Since respective schemes/ options have not completed relevant period (1yr, 3yr or 5yr) after allotment or units were not available throughout the respective period, no returns are available.^ Inception date shown is the date from which units under the plans are available throughout.
7. Please Refer page no. 117 for Fund Manager details.
Benchmark indices allocation from inception to November 23, 2010
Investors may please note that they will be bearing the expenses of this Scheme in addition to the expenses of the underlying Schemes in which this Scheme makes investment.
Dynamic Accrual :- Crisil Liquid fund Index - 70%, Crisil Composite Bond Fund Index -30%
Cautious:- Nifty 50 Index-15%, Crisil Composite Bond Fund Index - 70%, Crisil Liquid Fund Index-15%
Moderate:- Nifty 50 Index-40%, Crisil Composite Bond Fund Index - 40%, Crisil Liquid Fund Index-20%
Long Term Savings:- Nifty 50 Index-70%, Crisil Composite Bond Fund Index - 25%, Crisil Liquid Fund Index-5%
New Benchmark indices allocation w.e.f. November 24, 2010
Dynamic Accrual:- Crisil Composite Bond Fund Index - 70%, Crisil Liquid fund Index - 30%
Cautious:- Nifty 50 Index - 20%, Crisil Composite Bond Fund Index - 60%, Crisil Liquid Fund Index - 10%, Gold# - 10%
Moderate:- Nifty 50 Index - 40%, Crisil Composite Bond Fund Index - 40%, Crisil Liquid Fund Index - 10%, Gold# - 10%
Long Term Savings:- Nifty 50 Index - 50%, Crisil Composite Bond Fund Index - 30%, Crisil Liquid Fund Index - 5%, Gold# - 15%
# Benchmark against the domestic price of gold as derived from the LBMA AM fixing prices.
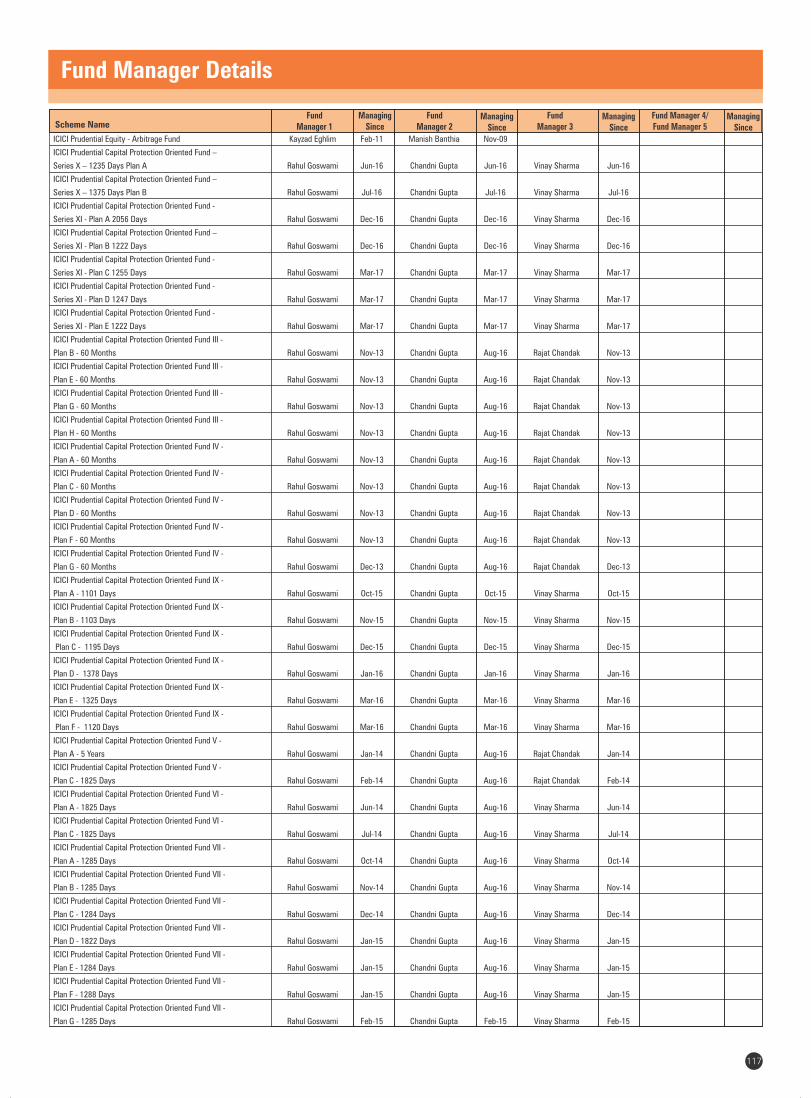
Fund Manager Details
117
Scheme NameFund
Manager 1Managing
SinceFund
Manager 2Managing
Since
Fund Manager 3
Managing Since
Fund Manager 4/Fund Manager 5
Managing Since
ICICI Prudential Equity - Arbitrage Fund Kayzad Eghlim Feb-11 Manish Banthia Nov-09
ICICI Prudential Capital Protection Oriented Fund –
Series X – 1235 Days Plan A Rahul Goswami Jun-16 Chandni Gupta Jun-16 Vinay Sharma Jun-16
ICICI Prudential Capital Protection Oriented Fund –
Series X – 1375 Days Plan B Rahul Goswami Jul-16 Chandni Gupta Jul-16 Vinay Sharma Jul-16
ICICI Prudential Capital Protection Oriented Fund -
Series XI - Plan A 2056 Days Rahul Goswami Dec-16 Chandni Gupta Dec-16 Vinay Sharma Dec-16
ICICI Prudential Capital Protection Oriented Fund –
Series XI - Plan B 1222 Days Rahul Goswami Dec-16 Chandni Gupta Dec-16 Vinay Sharma Dec-16
ICICI Prudential Capital Protection Oriented Fund -
Series XI - Plan C 1255 Days Rahul Goswami Mar-17 Chandni Gupta Mar-17 Vinay Sharma Mar-17
ICICI Prudential Capital Protection Oriented Fund -
Series XI - Plan D 1247 Days Rahul Goswami Mar-17 Chandni Gupta Mar-17 Vinay Sharma Mar-17
ICICI Prudential Capital Protection Oriented Fund -
Series XI - Plan E 1222 Days Rahul Goswami Mar-17 Chandni Gupta Mar-17 Vinay Sharma Mar-17
ICICI Prudential Capital Protection Oriented Fund III -
Plan B - 60 Months Rahul Goswami Nov-13 Chandni Gupta Aug-16 Rajat Chandak Nov-13
ICICI Prudential Capital Protection Oriented Fund III -
Plan E - 60 Months Rahul Goswami Nov-13 Chandni Gupta Aug-16 Rajat Chandak Nov-13
ICICI Prudential Capital Protection Oriented Fund III -
Plan G - 60 Months Rahul Goswami Nov-13 Chandni Gupta Aug-16 Rajat Chandak Nov-13
ICICI Prudential Capital Protection Oriented Fund III -
Plan H - 60 Months Rahul Goswami Nov-13 Chandni Gupta Aug-16 Rajat Chandak Nov-13
ICICI Prudential Capital Protection Oriented Fund IV -
Plan A - 60 Months Rahul Goswami Nov-13 Chandni Gupta Aug-16 Rajat Chandak Nov-13
ICICI Prudential Capital Protection Oriented Fund IV -
Plan C - 60 Months Rahul Goswami Nov-13 Chandni Gupta Aug-16 Rajat Chandak Nov-13
ICICI Prudential Capital Protection Oriented Fund IV -
Plan D - 60 Months Rahul Goswami Nov-13 Chandni Gupta Aug-16 Rajat Chandak Nov-13
ICICI Prudential Capital Protection Oriented Fund IV -
Plan F - 60 Months Rahul Goswami Nov-13 Chandni Gupta Aug-16 Rajat Chandak Nov-13
ICICI Prudential Capital Protection Oriented Fund IV -
Plan G - 60 Months Rahul Goswami Dec-13 Chandni Gupta Aug-16 Rajat Chandak Dec-13
ICICI Prudential Capital Protection Oriented Fund IX -
Plan A - 1101 Days Rahul Goswami Oct-15 Chandni Gupta Oct-15 Vinay Sharma Oct-15
ICICI Prudential Capital Protection Oriented Fund IX -
Plan B - 1103 Days Rahul Goswami Nov-15 Chandni Gupta Nov-15 Vinay Sharma Nov-15
ICICI Prudential Capital Protection Oriented Fund IX -
Plan C - 1195 Days Rahul Goswami Dec-15 Chandni Gupta Dec-15 Vinay Sharma Dec-15
ICICI Prudential Capital Protection Oriented Fund IX -
Plan D - 1378 Days Rahul Goswami Jan-16 Chandni Gupta Jan-16 Vinay Sharma Jan-16
ICICI Prudential Capital Protection Oriented Fund IX -
Plan E - 1325 Days Rahul Goswami Mar-16 Chandni Gupta Mar-16 Vinay Sharma Mar-16
ICICI Prudential Capital Protection Oriented Fund IX -
Plan F - 1120 Days Rahul Goswami Mar-16 Chandni Gupta Mar-16 Vinay Sharma Mar-16
ICICI Prudential Capital Protection Oriented Fund V -
Plan A - 5 Years Rahul Goswami Jan-14 Chandni Gupta Aug-16 Rajat Chandak Jan-14
ICICI Prudential Capital Protection Oriented Fund V -
Plan C - 1825 Days Rahul Goswami Feb-14 Chandni Gupta Aug-16 Rajat Chandak Feb-14
ICICI Prudential Capital Protection Oriented Fund VI -
Plan A - 1825 Days Rahul Goswami Jun-14 Chandni Gupta Aug-16 Vinay Sharma Jun-14
ICICI Prudential Capital Protection Oriented Fund VI -
Plan C - 1825 Days Rahul Goswami Jul-14 Chandni Gupta Aug-16 Vinay Sharma Jul-14
ICICI Prudential Capital Protection Oriented Fund VII -
Plan A - 1285 Days Rahul Goswami Oct-14 Chandni Gupta Aug-16 Vinay Sharma Oct-14
ICICI Prudential Capital Protection Oriented Fund VII -
Plan B - 1285 Days Rahul Goswami Nov-14 Chandni Gupta Aug-16 Vinay Sharma Nov-14
ICICI Prudential Capital Protection Oriented Fund VII -
Plan C - 1284 Days Rahul Goswami Dec-14 Chandni Gupta Aug-16 Vinay Sharma Dec-14
ICICI Prudential Capital Protection Oriented Fund VII -
Plan D - 1822 Days Rahul Goswami Jan-15 Chandni Gupta Aug-16 Vinay Sharma Jan-15
ICICI Prudential Capital Protection Oriented Fund VII -
Plan E - 1284 Days Rahul Goswami Jan-15 Chandni Gupta Aug-16 Vinay Sharma Jan-15
ICICI Prudential Capital Protection Oriented Fund VII -
Plan F - 1288 Days Rahul Goswami Jan-15 Chandni Gupta Aug-16 Vinay Sharma Jan-15
ICICI Prudential Capital Protection Oriented Fund VII -
Plan G - 1285 Days Rahul Goswami Feb-15 Chandni Gupta Feb-15 Vinay Sharma Feb-15
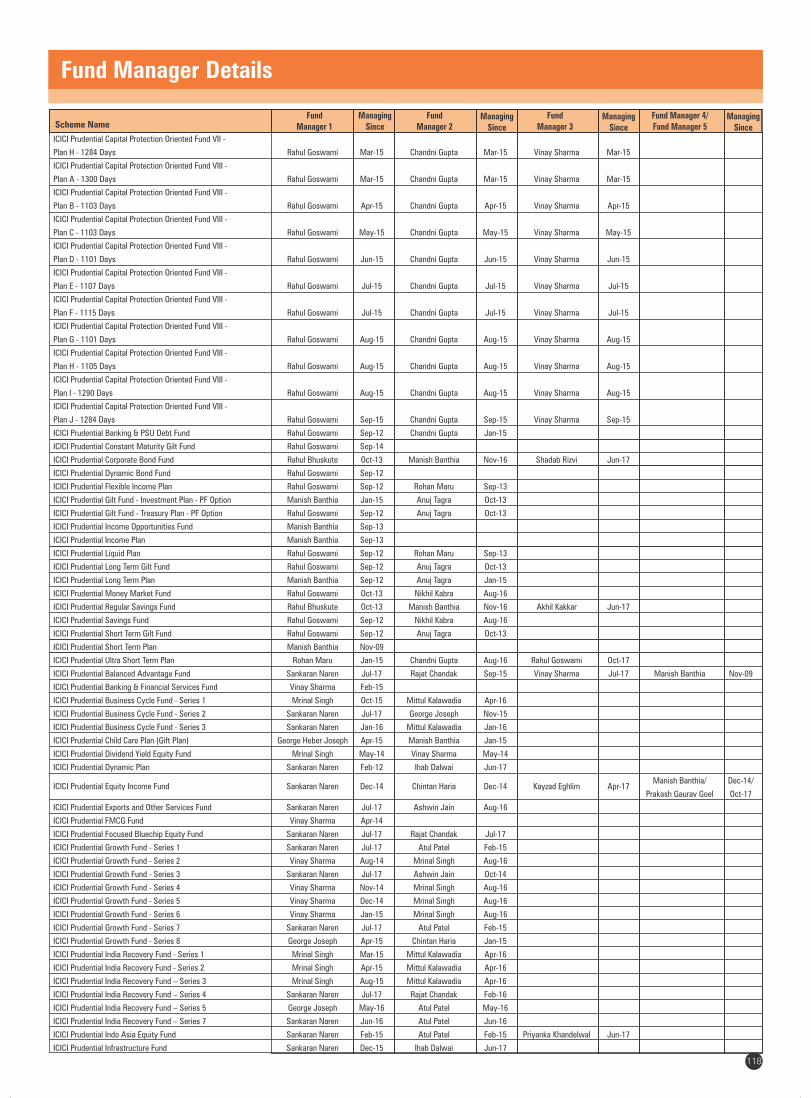
Scheme NameFund
Manager 1Managing
SinceFund
Manager 2Managing
Since
Fund Manager 3
Managing Since
Fund Manager 4/Fund Manager 5
Managing Since
ICICI Prudential Capital Protection Oriented Fund VII -
Plan H - 1284 Days Rahul Goswami Mar-15 Chandni Gupta Mar-15 Vinay Sharma Mar-15
ICICI Prudential Capital Protection Oriented Fund VIII -
Plan A - 1300 Days Rahul Goswami Mar-15 Chandni Gupta Mar-15 Vinay Sharma Mar-15
ICICI Prudential Capital Protection Oriented Fund VIII -
Plan B - 1103 Days Rahul Goswami Apr-15 Chandni Gupta Apr-15 Vinay Sharma Apr-15
ICICI Prudential Capital Protection Oriented Fund VIII -
Plan C - 1103 Days Rahul Goswami May-15 Chandni Gupta May-15 Vinay Sharma May-15
ICICI Prudential Capital Protection Oriented Fund VIII -
Plan D - 1101 Days Rahul Goswami Jun-15 Chandni Gupta Jun-15 Vinay Sharma Jun-15
ICICI Prudential Capital Protection Oriented Fund VIII -
Plan E - 1107 Days Rahul Goswami Jul-15 Chandni Gupta Jul-15 Vinay Sharma Jul-15
ICICI Prudential Capital Protection Oriented Fund VIII -
Plan F - 1115 Days Rahul Goswami Jul-15 Chandni Gupta Jul-15 Vinay Sharma Jul-15
ICICI Prudential Capital Protection Oriented Fund VIII -
Plan G - 1101 Days Rahul Goswami Aug-15 Chandni Gupta Aug-15 Vinay Sharma Aug-15
ICICI Prudential Capital Protection Oriented Fund VIII -
Plan H - 1105 Days Rahul Goswami Aug-15 Chandni Gupta Aug-15 Vinay Sharma Aug-15
ICICI Prudential Capital Protection Oriented Fund VIII -
Plan I - 1290 Days Rahul Goswami Aug-15 Chandni Gupta Aug-15 Vinay Sharma Aug-15
ICICI Prudential Capital Protection Oriented Fund VIII -
Plan J - 1284 Days Rahul Goswami Sep-15 Chandni Gupta Sep-15 Vinay Sharma Sep-15
ICICI Prudential Banking & PSU Debt Fund Rahul Goswami Sep-12 Chandni Gupta Jan-15
ICICI Prudential Constant Maturity Gilt Fund Rahul Goswami Sep-14
ICICI Prudential Corporate Bond Fund Rahul Bhuskute Oct-13 Manish Banthia Nov-16 Shadab Rizvi Jun-17
ICICI Prudential Dynamic Bond Fund Rahul Goswami Sep-12
ICICI Prudential Flexible Income Plan Rahul Goswami Sep-12 Rohan Maru Sep-13
ICICI Prudential Gilt Fund - Investment Plan - PF Option Manish Banthia Jan-15 Anuj Tagra Oct-13
ICICI Prudential Gilt Fund - Treasury Plan - PF Option Rahul Goswami Sep-12 Anuj Tagra Oct-13
ICICI Prudential Income Opportunities Fund Manish Banthia Sep-13
ICICI Prudential Income Plan Manish Banthia Sep-13
ICICI Prudential Liquid Plan Rahul Goswami Sep-12 Rohan Maru Sep-13
ICICI Prudential Long Term Gilt Fund Rahul Goswami Sep-12 Anuj Tagra Oct-13
ICICI Prudential Long Term Plan Manish Banthia Sep-12 Anuj Tagra Jan-15
ICICI Prudential Money Market Fund Rahul Goswami Oct-13 Nikhil Kabra Aug-16
ICICI Prudential Regular Savings Fund Rahul Bhuskute Oct-13 Manish Banthia Nov-16 Akhil Kakkar Jun-17
ICICI Prudential Savings Fund Rahul Goswami Sep-12 Nikhil Kabra Aug-16
ICICI Prudential Short Term Gilt Fund Rahul Goswami Sep-12 Anuj Tagra Oct-13
ICICI Prudential Short Term Plan Manish Banthia Nov-09
ICICI Prudential Ultra Short Term Plan Rohan Maru Jan-15 Chandni Gupta Aug-16 Rahul Goswami Oct-17
ICICI Prudential Balanced Advantage Fund Sankaran Naren Jul-17 Rajat Chandak Sep-15 Vinay Sharma Jul-17 Manish Banthia Nov-09
ICICI Prudential Banking & Financial Services Fund Vinay Sharma Feb-15
ICICI Prudential Business Cycle Fund - Series 1 Mrinal Singh Oct-15 Mittul Kalawadia Apr-16
ICICI Prudential Business Cycle Fund - Series 2 Sankaran Naren Jul-17 George Joseph Nov-15
ICICI Prudential Business Cycle Fund - Series 3 Sankaran Naren Jan-16 Mittul Kalawadia Jan-16
ICICI Prudential Child Care Plan (Gift Plan) George Heber Joseph Apr-15 Manish Banthia Jan-15
ICICI Prudential Dividend Yield Equity Fund Mrinal Singh May-14 Vinay Sharma May-14
ICICI Prudential Dynamic Plan Sankaran Naren Feb-12 Ihab Dalwai Jun-17
Manish Banthia/ Dec-14/ICICI Prudential Equity Income Fund Sankaran Naren Dec-14 Chintan Haria Dec-14 Kayzad Eghlim Apr-17 Prakash Gaurav Goel Oct-17
ICICI Prudential Exports and Other Services Fund Sankaran Naren Jul-17 Ashwin Jain Aug-16
ICICI Prudential FMCG Fund Vinay Sharma Apr-14
ICICI Prudential Focused Bluechip Equity Fund Sankaran Naren Jul-17 Rajat Chandak Jul-17
ICICI Prudential Growth Fund - Series 1 Sankaran Naren Jul-17 Atul Patel Feb-15
ICICI Prudential Growth Fund - Series 2 Vinay Sharma Aug-14 Mrinal Singh Aug-16
ICICI Prudential Growth Fund - Series 3 Sankaran Naren Jul-17 Ashwin Jain Oct-14
ICICI Prudential Growth Fund - Series 4 Vinay Sharma Nov-14 Mrinal Singh Aug-16
ICICI Prudential Growth Fund - Series 5 Vinay Sharma Dec-14 Mrinal Singh Aug-16
ICICI Prudential Growth Fund - Series 6 Vinay Sharma Jan-15 Mrinal Singh Aug-16
ICICI Prudential Growth Fund - Series 7 Sankaran Naren Jul-17 Atul Patel Feb-15
ICICI Prudential Growth Fund - Series 8 George Joseph Apr-15 Chintan Haria Jan-15
ICICI Prudential India Recovery Fund - Series 1 Mrinal Singh Mar-15 Mittul Kalawadia Apr-16
ICICI Prudential India Recovery Fund - Series 2 Mrinal Singh Apr-15 Mittul Kalawadia Apr-16
ICICI Prudential India Recovery Fund – Series 3 Mrinal Singh Aug-15 Mittul Kalawadia Apr-16
ICICI Prudential India Recovery Fund – Series 4 Sankaran Naren Jul-17 Rajat Chandak Feb-16
ICICI Prudential India Recovery Fund – Series 5 George Joseph May-16 Atul Patel May-16
ICICI Prudential India Recovery Fund – Series 7 Sankaran Naren Jun-16 Atul Patel Jun-16
ICICI Prudential Indo Asia Equity Fund Sankaran Naren Feb-15 Atul Patel Feb-15 Priyanka Khandelwal Jun-17
ICICI Prudential Infrastructure Fund Sankaran Naren Dec-15 Ihab Dalwai Jun-17
Fund Manager Details
118
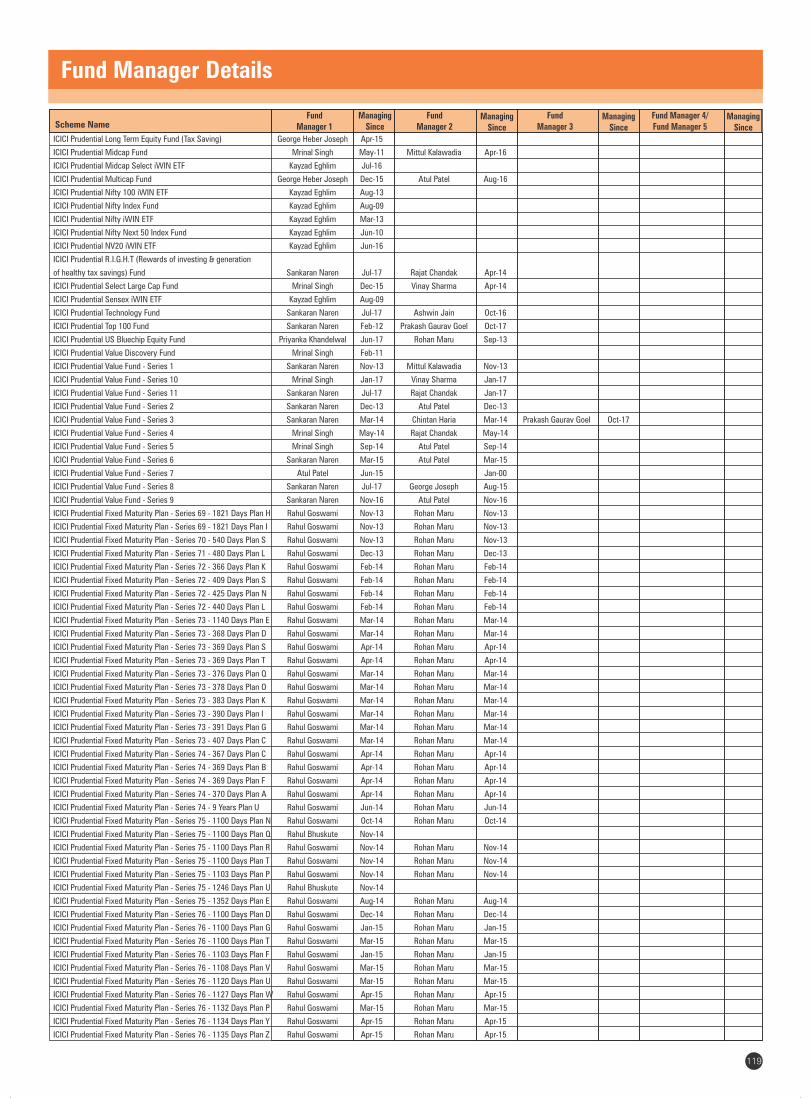
Scheme NameFund
Manager 1Managing
SinceFund
Manager 2Managing
Since
Fund Manager 3
Managing Since
Fund Manager 4/Fund Manager 5
Managing Since
Fund Manager Details
119
ICICI Prudential Long Term Equity Fund (Tax Saving) George Heber Joseph Apr-15
ICICI Prudential Midcap Fund Mrinal Singh May-11 Mittul Kalawadia Apr-16
ICICI Prudential Midcap Select iWIN ETF Kayzad Eghlim Jul-16
ICICI Prudential Multicap Fund George Heber Joseph Dec-15 Atul Patel Aug-16
ICICI Prudential Nifty 100 iWIN ETF Kayzad Eghlim Aug-13
ICICI Prudential Nifty Index Fund Kayzad Eghlim Aug-09
ICICI Prudential Nifty iWIN ETF Kayzad Eghlim Mar-13
ICICI Prudential Nifty Next 50 Index Fund Kayzad Eghlim Jun-10
ICICI Prudential NV20 iWIN ETF Kayzad Eghlim Jun-16
ICICI Prudential R.I.G.H.T (Rewards of investing & generation
of healthy tax savings) Fund Sankaran Naren Jul-17 Rajat Chandak Apr-14
ICICI Prudential Select Large Cap Fund Mrinal Singh Dec-15 Vinay Sharma Apr-14
ICICI Prudential Sensex iWIN ETF Kayzad Eghlim Aug-09
ICICI Prudential Technology Fund Sankaran Naren Jul-17 Ashwin Jain Oct-16
ICICI Prudential Top 100 Fund Sankaran Naren Feb-12 Prakash Gaurav Goel Oct-17
ICICI Prudential US Bluechip Equity Fund Priyanka Khandelwal Jun-17 Rohan Maru Sep-13
ICICI Prudential Value Discovery Fund Mrinal Singh Feb-11
ICICI Prudential Value Fund - Series 1 Sankaran Naren Nov-13 Mittul Kalawadia Nov-13
ICICI Prudential Value Fund - Series 10 Mrinal Singh Jan-17 Vinay Sharma Jan-17
ICICI Prudential Value Fund - Series 11 Sankaran Naren Jul-17 Rajat Chandak Jan-17
ICICI Prudential Value Fund - Series 2 Sankaran Naren Dec-13 Atul Patel Dec-13
ICICI Prudential Value Fund - Series 3 Sankaran Naren Mar-14 Chintan Haria Mar-14 Prakash Gaurav Goel Oct-17
ICICI Prudential Value Fund - Series 4 Mrinal Singh May-14 Rajat Chandak May-14
ICICI Prudential Value Fund - Series 5 Mrinal Singh Sep-14 Atul Patel Sep-14
ICICI Prudential Value Fund - Series 6 Sankaran Naren Mar-15 Atul Patel Mar-15
ICICI Prudential Value Fund - Series 7 Atul Patel Jun-15 Jan-00
ICICI Prudential Value Fund - Series 8 Sankaran Naren Jul-17 George Joseph Aug-15
ICICI Prudential Value Fund - Series 9 Sankaran Naren Nov-16 Atul Patel Nov-16
ICICI Prudential Fixed Maturity Plan - Series 69 - 1821 Days Plan H Rahul Goswami Nov-13 Rohan Maru Nov-13
ICICI Prudential Fixed Maturity Plan - Series 69 - 1821 Days Plan I Rahul Goswami Nov-13 Rohan Maru Nov-13
ICICI Prudential Fixed Maturity Plan - Series 70 - 540 Days Plan S Rahul Goswami Nov-13 Rohan Maru Nov-13
ICICI Prudential Fixed Maturity Plan - Series 71 - 480 Days Plan L Rahul Goswami Dec-13 Rohan Maru Dec-13
ICICI Prudential Fixed Maturity Plan - Series 72 - 366 Days Plan K Rahul Goswami Feb-14 Rohan Maru Feb-14
ICICI Prudential Fixed Maturity Plan - Series 72 - 409 Days Plan S Rahul Goswami Feb-14 Rohan Maru Feb-14
ICICI Prudential Fixed Maturity Plan - Series 72 - 425 Days Plan N Rahul Goswami Feb-14 Rohan Maru Feb-14
ICICI Prudential Fixed Maturity Plan - Series 72 - 440 Days Plan L Rahul Goswami Feb-14 Rohan Maru Feb-14
ICICI Prudential Fixed Maturity Plan - Series 73 - 1140 Days Plan E Rahul Goswami Mar-14 Rohan Maru Mar-14
ICICI Prudential Fixed Maturity Plan - Series 73 - 368 Days Plan D Rahul Goswami Mar-14 Rohan Maru Mar-14
ICICI Prudential Fixed Maturity Plan - Series 73 - 369 Days Plan S Rahul Goswami Apr-14 Rohan Maru Apr-14
ICICI Prudential Fixed Maturity Plan - Series 73 - 369 Days Plan T Rahul Goswami Apr-14 Rohan Maru Apr-14
ICICI Prudential Fixed Maturity Plan - Series 73 - 376 Days Plan Q Rahul Goswami Mar-14 Rohan Maru Mar-14
ICICI Prudential Fixed Maturity Plan - Series 73 - 378 Days Plan O Rahul Goswami Mar-14 Rohan Maru Mar-14
ICICI Prudential Fixed Maturity Plan - Series 73 - 383 Days Plan K Rahul Goswami Mar-14 Rohan Maru Mar-14
ICICI Prudential Fixed Maturity Plan - Series 73 - 390 Days Plan I Rahul Goswami Mar-14 Rohan Maru Mar-14
ICICI Prudential Fixed Maturity Plan - Series 73 - 391 Days Plan G Rahul Goswami Mar-14 Rohan Maru Mar-14
ICICI Prudential Fixed Maturity Plan - Series 73 - 407 Days Plan C Rahul Goswami Mar-14 Rohan Maru Mar-14
ICICI Prudential Fixed Maturity Plan - Series 74 - 367 Days Plan C Rahul Goswami Apr-14 Rohan Maru Apr-14
ICICI Prudential Fixed Maturity Plan - Series 74 - 369 Days Plan B Rahul Goswami Apr-14 Rohan Maru Apr-14
ICICI Prudential Fixed Maturity Plan - Series 74 - 369 Days Plan F Rahul Goswami Apr-14 Rohan Maru Apr-14
ICICI Prudential Fixed Maturity Plan - Series 74 - 370 Days Plan A Rahul Goswami Apr-14 Rohan Maru Apr-14
ICICI Prudential Fixed Maturity Plan - Series 74 - 9 Years Plan U Rahul Goswami Jun-14 Rohan Maru Jun-14
ICICI Prudential Fixed Maturity Plan - Series 75 - 1100 Days Plan N Rahul Goswami Oct-14 Rohan Maru Oct-14
ICICI Prudential Fixed Maturity Plan - Series 75 - 1100 Days Plan Q Rahul Bhuskute Nov-14
ICICI Prudential Fixed Maturity Plan - Series 75 - 1100 Days Plan R Rahul Goswami Nov-14 Rohan Maru Nov-14
ICICI Prudential Fixed Maturity Plan - Series 75 - 1100 Days Plan T Rahul Goswami Nov-14 Rohan Maru Nov-14
ICICI Prudential Fixed Maturity Plan - Series 75 - 1103 Days Plan P Rahul Goswami Nov-14 Rohan Maru Nov-14
ICICI Prudential Fixed Maturity Plan - Series 75 - 1246 Days Plan U Rahul Bhuskute Nov-14
ICICI Prudential Fixed Maturity Plan - Series 75 - 1352 Days Plan E Rahul Goswami Aug-14 Rohan Maru Aug-14
ICICI Prudential Fixed Maturity Plan - Series 76 - 1100 Days Plan D Rahul Goswami Dec-14 Rohan Maru Dec-14
ICICI Prudential Fixed Maturity Plan - Series 76 - 1100 Days Plan G Rahul Goswami Jan-15 Rohan Maru Jan-15
ICICI Prudential Fixed Maturity Plan - Series 76 - 1100 Days Plan T Rahul Goswami Mar-15 Rohan Maru Mar-15
ICICI Prudential Fixed Maturity Plan - Series 76 - 1103 Days Plan F Rahul Goswami Jan-15 Rohan Maru Jan-15
ICICI Prudential Fixed Maturity Plan - Series 76 - 1108 Days Plan V Rahul Goswami Mar-15 Rohan Maru Mar-15
ICICI Prudential Fixed Maturity Plan - Series 76 - 1120 Days Plan U Rahul Goswami Mar-15 Rohan Maru Mar-15
ICICI Prudential Fixed Maturity Plan - Series 76 - 1127 Days Plan W Rahul Goswami Apr-15 Rohan Maru Apr-15
ICICI Prudential Fixed Maturity Plan - Series 76 - 1132 Days Plan P Rahul Goswami Mar-15 Rohan Maru Mar-15
ICICI Prudential Fixed Maturity Plan - Series 76 - 1134 Days Plan Y Rahul Goswami Apr-15 Rohan Maru Apr-15
ICICI Prudential Fixed Maturity Plan - Series 76 - 1135 Days Plan Z Rahul Goswami Apr-15 Rohan Maru Apr-15
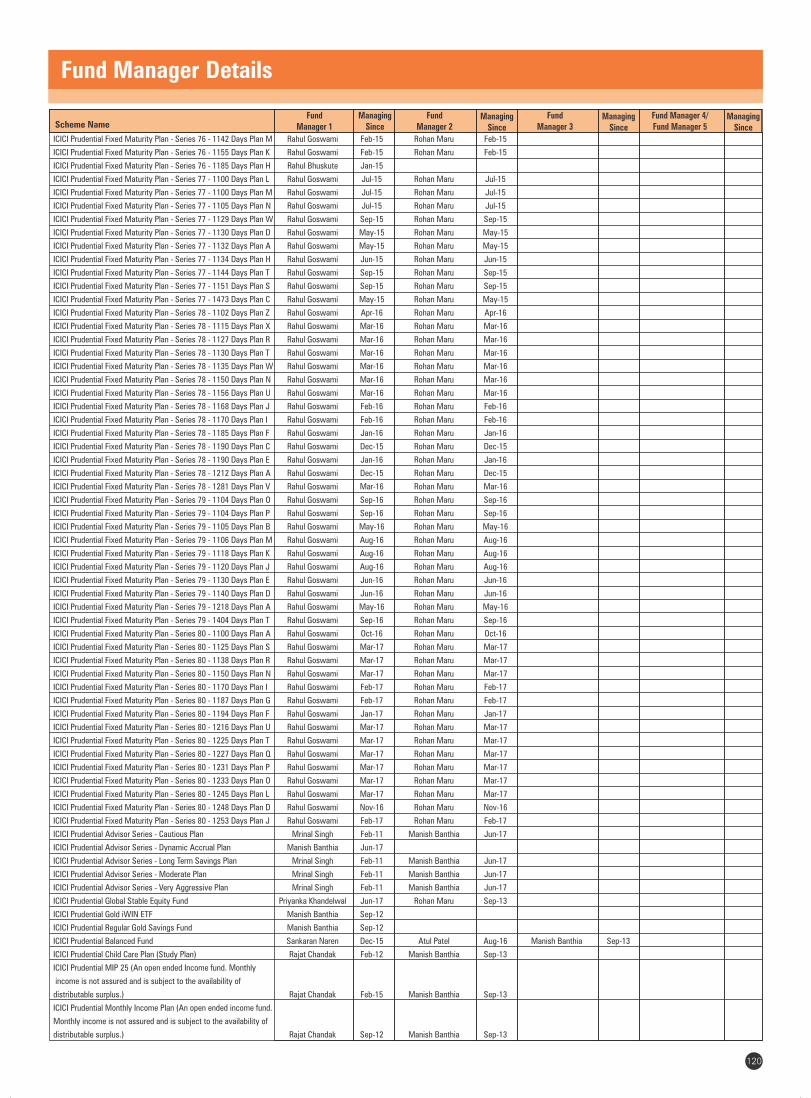
Scheme NameFund
Manager 1Managing
SinceFund
Manager 2Managing
Since
Fund Manager 3
Managing Since
Fund Manager 4/Fund Manager 5
Managing Since
ICICI Prudential Fixed Maturity Plan - Series 76 - 1142 Days Plan M Rahul Goswami Feb-15 Rohan Maru Feb-15
ICICI Prudential Fixed Maturity Plan - Series 76 - 1155 Days Plan K Rahul Goswami Feb-15 Rohan Maru Feb-15
ICICI Prudential Fixed Maturity Plan - Series 76 - 1185 Days Plan H Rahul Bhuskute Jan-15
ICICI Prudential Fixed Maturity Plan - Series 77 - 1100 Days Plan L Rahul Goswami Jul-15 Rohan Maru Jul-15
ICICI Prudential Fixed Maturity Plan - Series 77 - 1100 Days Plan M Rahul Goswami Jul-15 Rohan Maru Jul-15
ICICI Prudential Fixed Maturity Plan - Series 77 - 1105 Days Plan N Rahul Goswami Jul-15 Rohan Maru Jul-15
ICICI Prudential Fixed Maturity Plan - Series 77 - 1129 Days Plan W Rahul Goswami Sep-15 Rohan Maru Sep-15
ICICI Prudential Fixed Maturity Plan - Series 77 - 1130 Days Plan D Rahul Goswami May-15 Rohan Maru May-15
ICICI Prudential Fixed Maturity Plan - Series 77 - 1132 Days Plan A Rahul Goswami May-15 Rohan Maru May-15
ICICI Prudential Fixed Maturity Plan - Series 77 - 1134 Days Plan H Rahul Goswami Jun-15 Rohan Maru Jun-15
ICICI Prudential Fixed Maturity Plan - Series 77 - 1144 Days Plan T Rahul Goswami Sep-15 Rohan Maru Sep-15
ICICI Prudential Fixed Maturity Plan - Series 77 - 1151 Days Plan S Rahul Goswami Sep-15 Rohan Maru Sep-15
ICICI Prudential Fixed Maturity Plan - Series 77 - 1473 Days Plan C Rahul Goswami May-15 Rohan Maru May-15
ICICI Prudential Fixed Maturity Plan - Series 78 - 1102 Days Plan Z Rahul Goswami Apr-16 Rohan Maru Apr-16
ICICI Prudential Fixed Maturity Plan - Series 78 - 1115 Days Plan X Rahul Goswami Mar-16 Rohan Maru Mar-16
ICICI Prudential Fixed Maturity Plan - Series 78 - 1127 Days Plan R Rahul Goswami Mar-16 Rohan Maru Mar-16
ICICI Prudential Fixed Maturity Plan - Series 78 - 1130 Days Plan T Rahul Goswami Mar-16 Rohan Maru Mar-16
ICICI Prudential Fixed Maturity Plan - Series 78 - 1135 Days Plan W Rahul Goswami Mar-16 Rohan Maru Mar-16
ICICI Prudential Fixed Maturity Plan - Series 78 - 1150 Days Plan N Rahul Goswami Mar-16 Rohan Maru Mar-16
ICICI Prudential Fixed Maturity Plan - Series 78 - 1156 Days Plan U Rahul Goswami Mar-16 Rohan Maru Mar-16
ICICI Prudential Fixed Maturity Plan - Series 78 - 1168 Days Plan J Rahul Goswami Feb-16 Rohan Maru Feb-16
ICICI Prudential Fixed Maturity Plan - Series 78 - 1170 Days Plan I Rahul Goswami Feb-16 Rohan Maru Feb-16
ICICI Prudential Fixed Maturity Plan - Series 78 - 1185 Days Plan F Rahul Goswami Jan-16 Rohan Maru Jan-16
ICICI Prudential Fixed Maturity Plan - Series 78 - 1190 Days Plan C Rahul Goswami Dec-15 Rohan Maru Dec-15
ICICI Prudential Fixed Maturity Plan - Series 78 - 1190 Days Plan E Rahul Goswami Jan-16 Rohan Maru Jan-16
ICICI Prudential Fixed Maturity Plan - Series 78 - 1212 Days Plan A Rahul Goswami Dec-15 Rohan Maru Dec-15
ICICI Prudential Fixed Maturity Plan - Series 78 - 1281 Days Plan V Rahul Goswami Mar-16 Rohan Maru Mar-16
ICICI Prudential Fixed Maturity Plan - Series 79 - 1104 Days Plan O Rahul Goswami Sep-16 Rohan Maru Sep-16
ICICI Prudential Fixed Maturity Plan - Series 79 - 1104 Days Plan P Rahul Goswami Sep-16 Rohan Maru Sep-16
ICICI Prudential Fixed Maturity Plan - Series 79 - 1105 Days Plan B Rahul Goswami May-16 Rohan Maru May-16
ICICI Prudential Fixed Maturity Plan - Series 79 - 1106 Days Plan M Rahul Goswami Aug-16 Rohan Maru Aug-16
ICICI Prudential Fixed Maturity Plan - Series 79 - 1118 Days Plan K Rahul Goswami Aug-16 Rohan Maru Aug-16
ICICI Prudential Fixed Maturity Plan - Series 79 - 1120 Days Plan J Rahul Goswami Aug-16 Rohan Maru Aug-16
ICICI Prudential Fixed Maturity Plan - Series 79 - 1130 Days Plan E Rahul Goswami Jun-16 Rohan Maru Jun-16
ICICI Prudential Fixed Maturity Plan - Series 79 - 1140 Days Plan D Rahul Goswami Jun-16 Rohan Maru Jun-16
ICICI Prudential Fixed Maturity Plan - Series 79 - 1218 Days Plan A Rahul Goswami May-16 Rohan Maru May-16
ICICI Prudential Fixed Maturity Plan - Series 79 - 1404 Days Plan T Rahul Goswami Sep-16 Rohan Maru Sep-16
ICICI Prudential Fixed Maturity Plan - Series 80 - 1100 Days Plan A Rahul Goswami Oct-16 Rohan Maru Oct-16
ICICI Prudential Fixed Maturity Plan - Series 80 - 1125 Days Plan S Rahul Goswami Mar-17 Rohan Maru Mar-17
ICICI Prudential Fixed Maturity Plan - Series 80 - 1138 Days Plan R Rahul Goswami Mar-17 Rohan Maru Mar-17
ICICI Prudential Fixed Maturity Plan - Series 80 - 1150 Days Plan N Rahul Goswami Mar-17 Rohan Maru Mar-17
ICICI Prudential Fixed Maturity Plan - Series 80 - 1170 Days Plan I Rahul Goswami Feb-17 Rohan Maru Feb-17
ICICI Prudential Fixed Maturity Plan - Series 80 - 1187 Days Plan G Rahul Goswami Feb-17 Rohan Maru Feb-17
ICICI Prudential Fixed Maturity Plan - Series 80 - 1194 Days Plan F Rahul Goswami Jan-17 Rohan Maru Jan-17
ICICI Prudential Fixed Maturity Plan - Series 80 - 1216 Days Plan U Rahul Goswami Mar-17 Rohan Maru Mar-17
ICICI Prudential Fixed Maturity Plan - Series 80 - 1225 Days Plan T Rahul Goswami Mar-17 Rohan Maru Mar-17
ICICI Prudential Fixed Maturity Plan - Series 80 - 1227 Days Plan Q Rahul Goswami Mar-17 Rohan Maru Mar-17
ICICI Prudential Fixed Maturity Plan - Series 80 - 1231 Days Plan P Rahul Goswami Mar-17 Rohan Maru Mar-17
ICICI Prudential Fixed Maturity Plan - Series 80 - 1233 Days Plan O Rahul Goswami Mar-17 Rohan Maru Mar-17
ICICI Prudential Fixed Maturity Plan - Series 80 - 1245 Days Plan L Rahul Goswami Mar-17 Rohan Maru Mar-17
ICICI Prudential Fixed Maturity Plan - Series 80 - 1248 Days Plan D Rahul Goswami Nov-16 Rohan Maru Nov-16
ICICI Prudential Fixed Maturity Plan - Series 80 - 1253 Days Plan J Rahul Goswami Feb-17 Rohan Maru Feb-17
ICICI Prudential Advisor Series - Cautious Plan Mrinal Singh Feb-11 Manish Banthia Jun-17
ICICI Prudential Advisor Series - Dynamic Accrual Plan Manish Banthia Jun-17
ICICI Prudential Advisor Series - Long Term Savings Plan Mrinal Singh Feb-11 Manish Banthia Jun-17
ICICI Prudential Advisor Series - Moderate Plan Mrinal Singh Feb-11 Manish Banthia Jun-17
ICICI Prudential Advisor Series - Very Aggressive Plan Mrinal Singh Feb-11 Manish Banthia Jun-17
ICICI Prudential Global Stable Equity Fund Priyanka Khandelwal Jun-17 Rohan Maru Sep-13
ICICI Prudential Gold iWIN ETF Manish Banthia Sep-12
ICICI Prudential Regular Gold Savings Fund Manish Banthia Sep-12
ICICI Prudential Balanced Fund Sankaran Naren Dec-15 Atul Patel Aug-16 Manish Banthia Sep-13
ICICI Prudential Child Care Plan (Study Plan) Rajat Chandak Feb-12 Manish Banthia Sep-13
ICICI Prudential MIP 25 (An open ended Income fund. Monthly
income is not assured and is subject to the availability of
distributable surplus.) Rajat Chandak Feb-15 Manish Banthia Sep-13
ICICI Prudential Monthly Income Plan (An open ended income fund.
Monthly income is not assured and is subject to the availability of
distributable surplus.) Rajat Chandak Sep-12 Manish Banthia Sep-13
Fund Manager Details
120
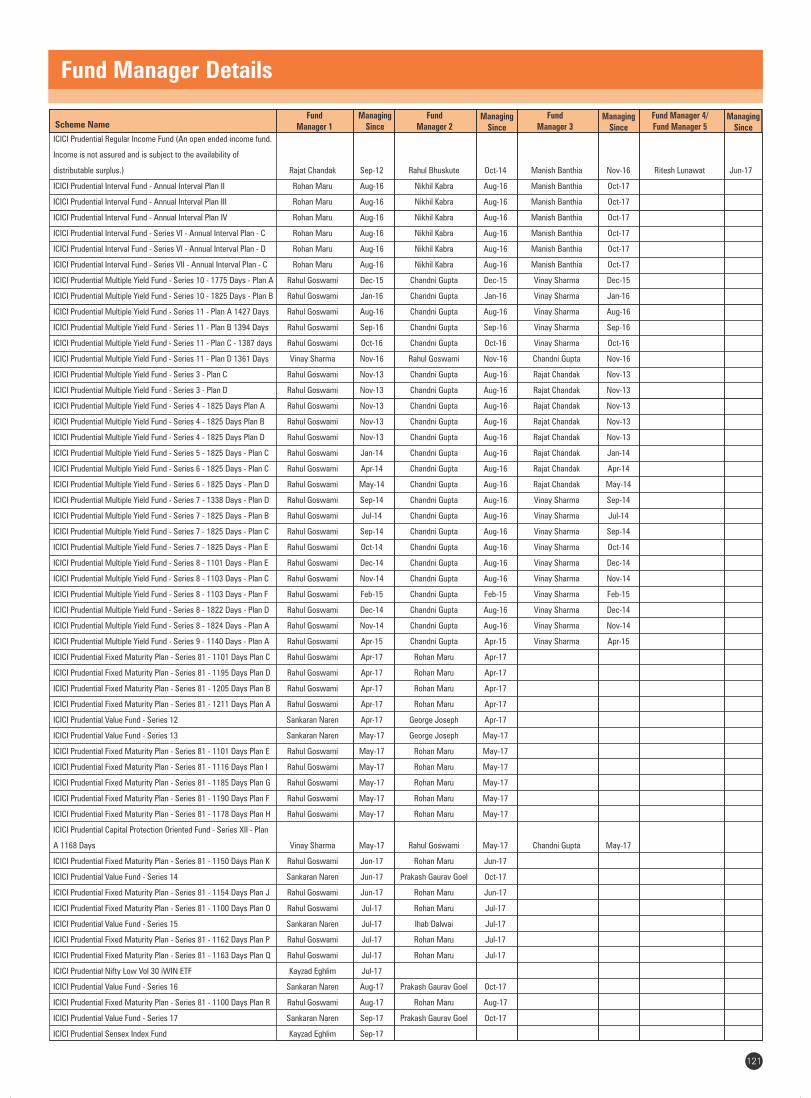
Scheme NameFund
Manager 1Managing
SinceFund
Manager 2Managing
Since
Fund Manager 3
Managing Since
Fund Manager 4/Fund Manager 5
Managing Since
Fund Manager Details
121
ICICI Prudential Regular Income Fund (An open ended income fund.
Income is not assured and is subject to the availability of
distributable surplus.) Rajat Chandak Sep-12 Rahul Bhuskute Oct-14 Manish Banthia Nov-16 Ritesh Lunawat Jun-17
ICICI Prudential Interval Fund - Annual Interval Plan II Rohan Maru Aug-16 Nikhil Kabra Aug-16 Manish Banthia Oct-17
ICICI Prudential Interval Fund - Annual Interval Plan III Rohan Maru Aug-16 Nikhil Kabra Aug-16 Manish Banthia Oct-17
ICICI Prudential Interval Fund - Annual Interval Plan IV Rohan Maru Aug-16 Nikhil Kabra Aug-16 Manish Banthia Oct-17
ICICI Prudential Interval Fund - Series VI - Annual Interval Plan - C Rohan Maru Aug-16 Nikhil Kabra Aug-16 Manish Banthia Oct-17
ICICI Prudential Interval Fund - Series VI - Annual Interval Plan - D Rohan Maru Aug-16 Nikhil Kabra Aug-16 Manish Banthia Oct-17
ICICI Prudential Interval Fund - Series VII - Annual Interval Plan - C Rohan Maru Aug-16 Nikhil Kabra Aug-16 Manish Banthia Oct-17
ICICI Prudential Multiple Yield Fund - Series 10 - 1775 Days - Plan A Rahul Goswami Dec-15 Chandni Gupta Dec-15 Vinay Sharma Dec-15
ICICI Prudential Multiple Yield Fund - Series 10 - 1825 Days - Plan B Rahul Goswami Jan-16 Chandni Gupta Jan-16 Vinay Sharma Jan-16
ICICI Prudential Multiple Yield Fund - Series 11 - Plan A 1427 Days Rahul Goswami Aug-16 Chandni Gupta Aug-16 Vinay Sharma Aug-16
ICICI Prudential Multiple Yield Fund - Series 11 - Plan B 1394 Days Rahul Goswami Sep-16 Chandni Gupta Sep-16 Vinay Sharma Sep-16
ICICI Prudential Multiple Yield Fund - Series 11 - Plan C - 1387 days Rahul Goswami Oct-16 Chandni Gupta Oct-16 Vinay Sharma Oct-16
ICICI Prudential Multiple Yield Fund - Series 11 - Plan D 1361 Days Vinay Sharma Nov-16 Rahul Goswami Nov-16 Chandni Gupta Nov-16
ICICI Prudential Multiple Yield Fund - Series 3 - Plan C Rahul Goswami Nov-13 Chandni Gupta Aug-16 Rajat Chandak Nov-13
ICICI Prudential Multiple Yield Fund - Series 3 - Plan D Rahul Goswami Nov-13 Chandni Gupta Aug-16 Rajat Chandak Nov-13
ICICI Prudential Multiple Yield Fund - Series 4 - 1825 Days Plan A Rahul Goswami Nov-13 Chandni Gupta Aug-16 Rajat Chandak Nov-13
ICICI Prudential Multiple Yield Fund - Series 4 - 1825 Days Plan B Rahul Goswami Nov-13 Chandni Gupta Aug-16 Rajat Chandak Nov-13
ICICI Prudential Multiple Yield Fund - Series 4 - 1825 Days Plan D Rahul Goswami Nov-13 Chandni Gupta Aug-16 Rajat Chandak Nov-13
ICICI Prudential Multiple Yield Fund - Series 5 - 1825 Days - Plan C Rahul Goswami Jan-14 Chandni Gupta Aug-16 Rajat Chandak Jan-14
ICICI Prudential Multiple Yield Fund - Series 6 - 1825 Days - Plan C Rahul Goswami Apr-14 Chandni Gupta Aug-16 Rajat Chandak Apr-14
ICICI Prudential Multiple Yield Fund - Series 6 - 1825 Days - Plan D Rahul Goswami May-14 Chandni Gupta Aug-16 Rajat Chandak May-14
ICICI Prudential Multiple Yield Fund - Series 7 - 1338 Days - Plan D Rahul Goswami Sep-14 Chandni Gupta Aug-16 Vinay Sharma Sep-14
ICICI Prudential Multiple Yield Fund - Series 7 - 1825 Days - Plan B Rahul Goswami Jul-14 Chandni Gupta Aug-16 Vinay Sharma Jul-14
ICICI Prudential Multiple Yield Fund - Series 7 - 1825 Days - Plan C Rahul Goswami Sep-14 Chandni Gupta Aug-16 Vinay Sharma Sep-14
ICICI Prudential Multiple Yield Fund - Series 7 - 1825 Days - Plan E Rahul Goswami Oct-14 Chandni Gupta Aug-16 Vinay Sharma Oct-14
ICICI Prudential Multiple Yield Fund - Series 8 - 1101 Days - Plan E Rahul Goswami Dec-14 Chandni Gupta Aug-16 Vinay Sharma Dec-14
ICICI Prudential Multiple Yield Fund - Series 8 - 1103 Days - Plan C Rahul Goswami Nov-14 Chandni Gupta Aug-16 Vinay Sharma Nov-14
ICICI Prudential Multiple Yield Fund - Series 8 - 1103 Days - Plan F Rahul Goswami Feb-15 Chandni Gupta Feb-15 Vinay Sharma Feb-15
ICICI Prudential Multiple Yield Fund - Series 8 - 1822 Days - Plan D Rahul Goswami Dec-14 Chandni Gupta Aug-16 Vinay Sharma Dec-14
ICICI Prudential Multiple Yield Fund - Series 8 - 1824 Days - Plan A Rahul Goswami Nov-14 Chandni Gupta Aug-16 Vinay Sharma Nov-14
ICICI Prudential Multiple Yield Fund - Series 9 - 1140 Days - Plan A Rahul Goswami Apr-15 Chandni Gupta Apr-15 Vinay Sharma Apr-15
ICICI Prudential Fixed Maturity Plan - Series 81 - 1101 Days Plan C Rahul Goswami Apr-17 Rohan Maru Apr-17
ICICI Prudential Fixed Maturity Plan - Series 81 - 1195 Days Plan D Rahul Goswami Apr-17 Rohan Maru Apr-17
ICICI Prudential Fixed Maturity Plan - Series 81 - 1205 Days Plan B Rahul Goswami Apr-17 Rohan Maru Apr-17
ICICI Prudential Fixed Maturity Plan - Series 81 - 1211 Days Plan A Rahul Goswami Apr-17 Rohan Maru Apr-17
ICICI Prudential Value Fund - Series 12 Sankaran Naren Apr-17 George Joseph Apr-17
ICICI Prudential Value Fund - Series 13 Sankaran Naren May-17 George Joseph May-17
ICICI Prudential Fixed Maturity Plan - Series 81 - 1101 Days Plan E Rahul Goswami May-17 Rohan Maru May-17
ICICI Prudential Fixed Maturity Plan - Series 81 - 1116 Days Plan I Rahul Goswami May-17 Rohan Maru May-17
ICICI Prudential Fixed Maturity Plan - Series 81 - 1185 Days Plan G Rahul Goswami May-17 Rohan Maru May-17
ICICI Prudential Fixed Maturity Plan - Series 81 - 1190 Days Plan F Rahul Goswami May-17 Rohan Maru May-17
ICICI Prudential Fixed Maturity Plan - Series 81 - 1178 Days Plan H Rahul Goswami May-17 Rohan Maru May-17
ICICI Prudential Capital Protection Oriented Fund - Series XII - Plan
A 1168 Days Vinay Sharma May-17 Rahul Goswami May-17 Chandni Gupta May-17
ICICI Prudential Fixed Maturity Plan - Series 81 - 1150 Days Plan K Rahul Goswami Jun-17 Rohan Maru Jun-17
ICICI Prudential Value Fund - Series 14 Sankaran Naren Jun-17 Prakash Gaurav Goel Oct-17
ICICI Prudential Fixed Maturity Plan - Series 81 - 1154 Days Plan J Rahul Goswami Jun-17 Rohan Maru Jun-17
ICICI Prudential Fixed Maturity Plan - Series 81 - 1100 Days Plan O Rahul Goswami Jul-17 Rohan Maru Jul-17
ICICI Prudential Value Fund - Series 15 Sankaran Naren Jul-17 Ihab Dalwai Jul-17
ICICI Prudential Fixed Maturity Plan - Series 81 - 1162 Days Plan P Rahul Goswami Jul-17 Rohan Maru Jul-17
ICICI Prudential Fixed Maturity Plan - Series 81 - 1163 Days Plan Q Rahul Goswami Jul-17 Rohan Maru Jul-17
ICICI Prudential Nifty Low Vol 30 iWIN ETF Kayzad Eghlim Jul-17
ICICI Prudential Value Fund - Series 16 Sankaran Naren Aug-17 Prakash Gaurav Goel Oct-17
ICICI Prudential Fixed Maturity Plan - Series 81 - 1100 Days Plan R Rahul Goswami Aug-17 Rohan Maru Aug-17
ICICI Prudential Value Fund - Series 17 Sankaran Naren Sep-17 Prakash Gaurav Goel Oct-17
ICICI Prudential Sensex Index Fund Kayzad Eghlim Sep-17

Scheme NameFund
Manager 1Managing
SinceFund
Manager 2Managing
Since
Fund Manager 3
Managing Since
Fund Manager 4/Fund Manager 5
Managing Since
ICICI Prudential Capital Protection Oriented Fund - Series XII -
Plan C 1270 Days Vinay Sharma Oct-17 Rahul Goswami Oct-17 Chandni Gupta Oct-17
ICICI Prudential Fixed Maturity Plan - Series 81 - 1100 Days Plan W Rahul Goswami Oct-17 Rohan Maru Oct-17
ICICI Prudential Value Fund - Series 18 Sankaran Naren Oct-17
Fund Manager Details
122
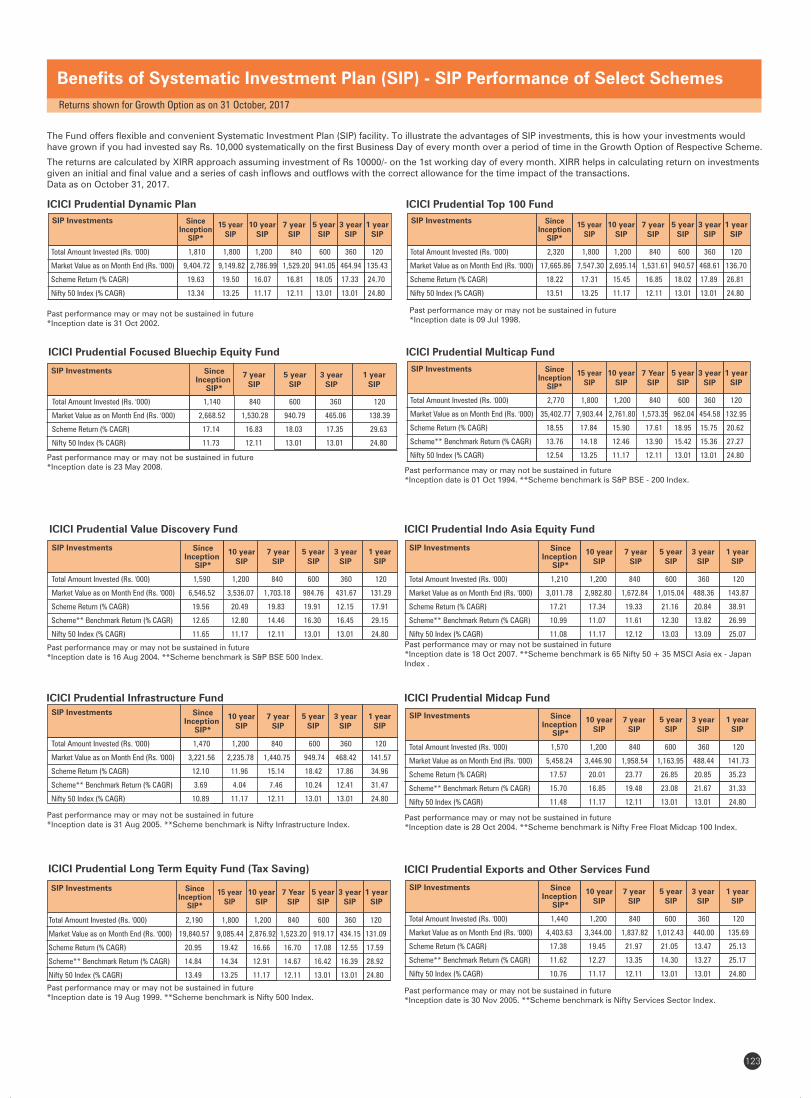
ICICI Prudential Multicap Fund
Past performance may or may not be sustained in future*Inception date is 01 Oct 1994. **Scheme benchmark is S&P BSE - 200 Index.
10 year SIP
5 year SIP
3 year SIP
1 year SIP
Since Inception
SIP*
SIP Investments15 year
SIP7 Year
SIP
Total Amount Invested (Rs. '000) 2,770 1,800 1,200 840 600 360 120
Market Value as on Month End (Rs. '000) 35,402.77 7,903.44 2,761.80 1,573.35 962.04 454.58 132.95
Scheme Return (% CAGR) 18.55 17.84 15.90 17.61 18.95 15.75 20.62
Scheme** Benchmark Return (% CAGR) 13.76 14.18 12.46 13.90 15.42 15.36 27.27
Nifty 50 Index (% CAGR) 12.54 13.25 11.17 12.11 13.01 13.01 24.80
123
Benefits of Systematic Investment Plan (SIP) - SIP Performance of Select Schemes
Past performance may or may not be sustained in future*Inception date is 18 Oct 2007. **Scheme benchmark is 65 Nifty 50 + 35 MSCI Asia ex - JapanIndex .
ICICI Prudential Indo Asia Equity Fund
Past performance may or may not be sustained in future*Inception date is 30 Nov 2005. **Scheme benchmark is Nifty Services Sector Index.
ICICI Prudential Exports and Other Services Fund
10 year SIP
5 year SIP
3 year SIP
1 year SIP
SIP Investments Since Inception
SIP*
7 yearSIP
Total Amount Invested (Rs. '000) 1,440 1,200 840 600 360 120
Market Value as on Month End (Rs. '000) 4,403.63 3,344.00 1,837.82 1,012.43 440.00 135.69
Scheme Return (% CAGR) 17.38 19.45 21.97 21.05 13.47 25.13
Scheme** Benchmark Return (% CAGR) 11.62 12.27 13.35 14.30 13.27 25.17
Nifty 50 Index (% CAGR) 10.76 11.17 12.11 13.01 13.01 24.80
The Fund offers flexible and convenient Systematic Investment Plan (SIP) facility. To illustrate the advantages of SIP investments, this is how your investments wouldhave grown if you had invested say Rs. 10,000 systematically on the first Business Day of every month over a period of time in the Growth Option of Respective Scheme.
The returns are calculated by XIRR approach assuming investment of Rs 10000/- on the 1st working day of every month. XIRR helps in calculating return on investmentsgiven an initial and final value and a series of cash inflows and outflows with the correct allowance for the time impact of the transactions.Data as on October 31, 2017.
ICICI Prudential Focused Bluechip Equity Fund
Past performance may or may not be sustained in future*Inception date is 23 May 2008.
SIP Investments Since Inception
SIP*
5 year SIP
3 year SIP
1 year SIP
7 year SIP
Total Amount Invested (Rs. '000) 1,140 840 600 360 120
Market Value as on Month End (Rs. '000) 2,668.52 1,530.28 940.79 465.06 138.39
Scheme Return (% CAGR) 17.14 16.83 18.03 17.35 29.63
Nifty 50 Index (% CAGR) 11.73 12.11 13.01 13.01 24.80
ICICI Prudential Value Discovery Fund
Past performance may or may not be sustained in future*Inception date is 16 Aug 2004. **Scheme benchmark is S&P BSE 500 Index.
10 year SIP
5 year SIP
3 year SIP
1 year SIP
SIP Investments Since Inception
SIP*
7 yearSIP
Total Amount Invested (Rs. '000) 1,590 1,200 840 600 360 120
Market Value as on Month End (Rs. '000) 6,546.52 3,536.07 1,703.18 984.76 431.67 131.29
Scheme Return (% CAGR) 19.56 20.49 19.83 19.91 12.15 17.91
Scheme** Benchmark Return (% CAGR) 12.65 12.80 14.46 16.30 16.45 29.15
Nifty 50 Index (% CAGR) 11.65 11.17 12.11 13.01 13.01 24.80
ICICI Prudential Top 100 Fund
Past performance may or may not be sustained in future*Inception date is 09 Jul 1998.
10 year SIP
5 year SIP
3 year SIP
1 year SIP
Since Inception
SIP*
SIP Investments15 year
SIP7 year
SIP
Total Amount Invested (Rs. '000) 2,320 1,800 1,200 840 600 360 120
Market Value as on Month End (Rs. '000) 17,665.86 7,547.30 2,695.14 1,531.61 940.57 468.61 136.70
Scheme Return (% CAGR) 18.22 17.31 15.45 16.85 18.02 17.89 26.81
Nifty 50 Index (% CAGR) 13.51 13.25 11.17 12.11 13.01 13.01 24.80
Past performance may or may not be sustained in future*Inception date is 31 Oct 2002.
Past performance may or may not be sustained in future*Inception date is 28 Oct 2004. **Scheme benchmark is Nifty Free Float Midcap 100 Index.
ICICI Prudential Midcap Fund
10 year SIP
5 year SIP
3 year SIP
1 year SIP
SIP Investments Since Inception
SIP*
7 yearSIP
Total Amount Invested (Rs. '000) 1,570 1,200 840 600 360 120
Market Value as on Month End (Rs. '000) 5,458.24 3,446.90 1,958.54 1,163.95 488.44 141.73
Scheme Return (% CAGR) 17.57 20.01 23.77 26.85 20.85 35.23
Scheme** Benchmark Return (% CAGR) 15.70 16.85 19.48 23.08 21.67 31.33
Nifty 50 Index (% CAGR) 11.48 11.17 12.11 13.01 13.01 24.80
Past performance may or may not be sustained in future*Inception date is 31 Aug 2005. **Scheme benchmark is Nifty Infrastructure Index.
ICICI Prudential Infrastructure Fund
10 year SIP
5 year SIP
3 year SIP
1 year SIP
SIP Investments Since Inception
SIP*
7 yearSIP
Total Amount Invested (Rs. '000) 1,470 1,200 840 600 360 120
Market Value as on Month End (Rs. '000) 3,221.56 2,235.78 1,440.75 949.74 468.42 141.57
Scheme Return (% CAGR) 12.10 11.96 15.14 18.42 17.86 34.96
Scheme** Benchmark Return (% CAGR) 3.69 4.04 7.46 10.24 12.41 31.47
Nifty 50 Index (% CAGR) 10.89 11.17 12.11 13.01 13.01 24.80
ICICI Prudential Long Term Equity Fund (Tax Saving)
Past performance may or may not be sustained in future*Inception date is 19 Aug 1999. **Scheme benchmark is Nifty 500 Index.
10 year SIP
5 year SIP
3 year SIP
1 year SIP
Since Inception
SIP*
SIP Investments15 year
SIP7 Year
SIP
Total Amount Invested (Rs. '000) 2,190 1,800 1,200 840 600 360 120
Market Value as on Month End (Rs. '000) 19,840.57 9,085.44 2,876.92 1,523.20 919.17 434.15 131.09
Scheme Return (% CAGR) 20.95 19.42 16.66 16.70 17.08 12.55 17.59
Scheme** Benchmark Return (% CAGR) 14.84 14.34 12.91 14.67 16.42 16.39 28.92
Nifty 50 Index (% CAGR) 13.49 13.25 11.17 12.11 13.01 13.01 24.80
Returns shown for Growth Option as on 31 October, 2017
ICICI Prudential Dynamic Plan
10 year SIP
5 year SIP
3 year SIP
1 year SIP
Since Inception
SIP*
SIP Investments15 year
SIP7 year
SIP
Total Amount Invested (Rs. '000) 1,810 1,800 1,200 840 600 360 120
Market Value as on Month End (Rs. '000) 9,404.72 9,149.82 2,786.99 1,529.20 941.05 464.94 135.43
Scheme Return (% CAGR) 19.63 19.50 16.07 16.81 18.05 17.33 24.70
Nifty 50 Index (% CAGR) 13.34 13.25 11.17 12.11 13.01 13.01 24.80
10 year SIP
5 year SIP
3 year SIP
1 year SIP
SIP Investments Since Inception
SIP*
7 yearSIP
Total Amount Invested (Rs. '000) 1,210 1,200 840 600 360 120
Market Value as on Month End (Rs. '000) 3,011.78 2,982.80 1,672.84 1,015.04 488.36 143.87
Scheme Return (% CAGR) 17.21 17.34 19.33 21.16 20.84 38.91
Scheme** Benchmark Return (% CAGR) 10.99 11.07 11.61 12.30 13.82 26.99
Nifty 50 Index (% CAGR) 11.08 11.17 12.12 13.03 13.09 25.07
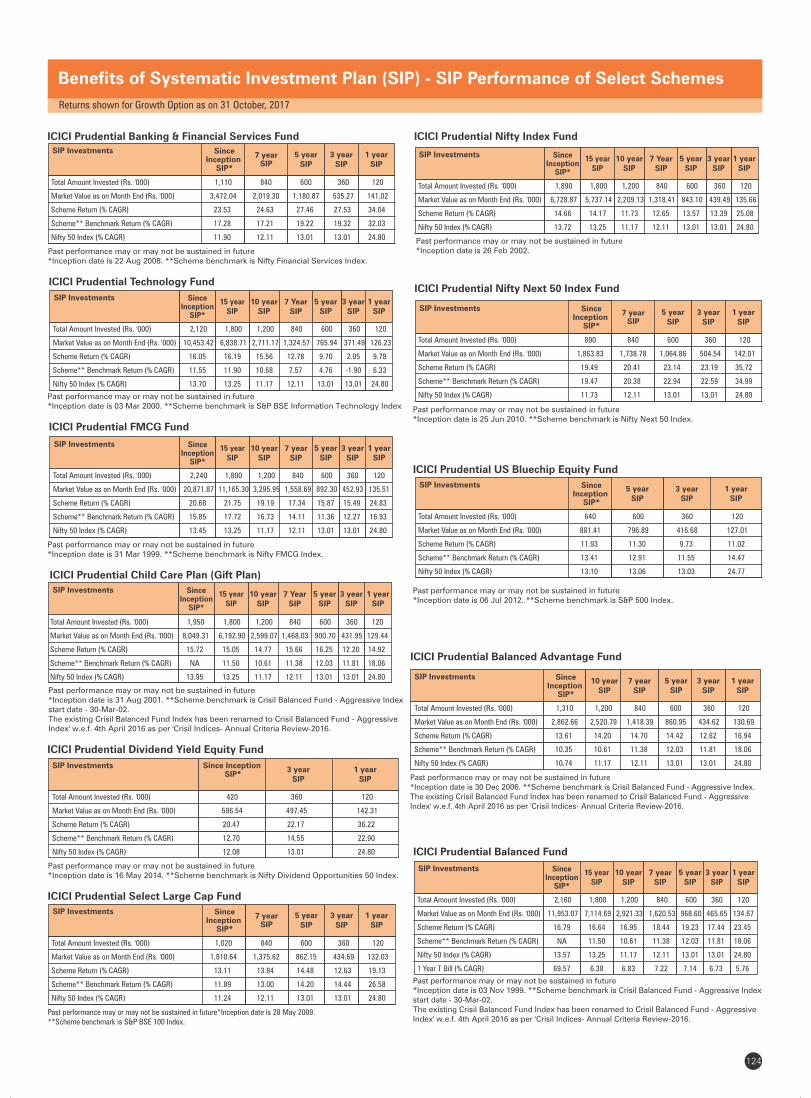
124
Benefits of Systematic Investment Plan (SIP) - SIP Performance of Select Schemes
ICICI Prudential Nifty Next 50 Index Fund
Past performance may or may not be sustained in future*Inception date is 25 Jun 2010. **Scheme benchmark is Nifty Next 50 Index.
ICICI Prudential US Bluechip Equity Fund
Past performance may or may not be sustained in future*Inception date is 06 Jul 2012. **Scheme benchmark is S&P 500 Index.
ICICI Prudential Banking & Financial Services Fund
Past performance may or may not be sustained in future*Inception date is 22 Aug 2008. **Scheme benchmark is .Nifty Financial Services Index
7 year SIP
SIP Investments5 year
SIP3 year
SIP1 year
SIP
Since Inception
SIP*
Total Amount Invested (Rs. '000) 1,110 840 600 360 120
Market Value as on Month End (Rs. '000) 3,472.04 2,019.30 1,180.87 535.27 141.02
Scheme Return (% CAGR) 23.53 24.63 27.46 27.53 34.04
Scheme** Benchmark Return (% CAGR) 17.28 17.21 19.22 19.32 32.03
Nifty 50 Index (% CAGR) 11.90 12.11 13.01 13.01 24.80
ICICI Prudential Technology Fund
Past performance may or may not be sustained in future*Inception date is 03 Mar 2000. **Scheme benchmark is S&P BSE Information Technology Index
10 year SIP
5 year SIP
3 year SIP
1 year SIP
Since Inception
SIP*
SIP Investments15 year
SIP7 Year
SIP
Total Amount Invested (Rs. '000) 2,120 1,800 1,200 840 600 360 120
Market Value as on Month End (Rs. '000) 10,453.42 6,838.71 2,711.17 1,324.57 765.94 371.49 126.23
Scheme Return (% CAGR) 16.05 16.19 15.56 12.78 9.70 2.05 9.78
Scheme** Benchmark Return (% CAGR) 11.55 11.90 10.68 7.57 4.76 -1.90 6.33
Nifty 50 Index (% CAGR) 13.70 13.25 11.17 12.11 13.01 13.01 24.80
ICICI Prudential FMCG Fund
Past performance may or may not be sustained in future*Inception date is 31 Mar 1999. **Scheme benchmark is Nifty FMCG Index.
10 year SIP
5 year SIP
3 year SIP
1 year SIP
Since Inception
SIP*
SIP Investments15 year
SIP7 year
SIP
Total Amount Invested (Rs. '000) 2,240 1,800 1,200 840 600 360 120
Market Value as on Month End (Rs. '000) 20,871.87 11,165.30 3,295.95 1,558.69 892.30 452.93 135.51
Scheme Return (% CAGR) 20.68 21.75 19.19 17.34 15.87 15.49 24.83
Scheme** Benchmark Return (% CAGR) 15.85 17.72 16.73 14.11 11.36 12.27 16.93
Nifty 50 Index (% CAGR) 13.45 13.25 11.17 12.11 13.01 13.01 24.80
ICICI Prudential Dividend Yield Equity Fund
Past performance may or may not be sustained in future*Inception date is 16 May 2014. **Scheme benchmark is Nifty Dividend Opportunities 50 Index.
Past performance may or may not be sustained in future*Inception date is 26 Feb 2002.
ICICI Prudential Nifty Index Fund
Past performance may or may not be sustained in future*Inception date is 28 May 2009. **Scheme benchmark is S&P BSE 100 Index.
ICICI Prudential Select Large Cap Fund
7 year SIP
SIP Investments5 year
SIP3 year
SIP1 year
SIP
Since Inception
SIP*
Total Amount Invested (Rs. '000) 1,020 840 600 360 120
Market Value as on Month End (Rs. '000) 1,810.64 1,375.62 862.15 434.69 132.03
Scheme Return (% CAGR) 13.11 13.84 14.48 12.63 19.13
Scheme** Benchmark Return (% CAGR) 11.89 13.00 14.20 14.44 26.58
Nifty 50 Index (% CAGR) 11.24 12.11 13.01 13.01 24.80
ICICI Prudential Balanced Fund
Past performance may or may not be sustained in future*Inception date is 03 Nov 1999. **Scheme benchmark is Crisil Balanced Fund - Index Aggressivestart date - 30-Mar-02.The existing Crisil Balanced Fund Index has been renamed to Crisil Balanced Fund - Aggressive Index' w.e.f. 4th April 2016 as per 'Crisil Indices- Annual Criteria Review-2016.
10 year SIP
5 year SIP
3 year SIP
1 year SIP
Since Inception
SIP*
SIP Investments15 year
SIP7 year
SIP
Total Amount Invested (Rs. '000) 2,160 1,800 1,200 840 600 360 120
Market Value as on Month End (Rs. '000) 11,953.07 7,114.69 2,921.33 1,620.53 968.60 465.65 134.67
Scheme Return (% CAGR) 16.79 16.64 16.95 18.44 19.23 17.44 23.45
Scheme** Benchmark Return (% CAGR) NA 11.50 10.61 11.38 12.03 11.81 18.06
Nifty 50 Index (% CAGR) 13.57 13.25 11.17 12.11 13.01 13.01 24.80
1 Year T Bill (% CAGR) 69.57 6.38 6.83 7.22 7.14 6.73 5.76
ICICI Prudential Balanced Advantage Fund
Past performance may or may not be sustained in future*Inception date is 30 Dec 2006. **Scheme benchmark is Crisil Balanced Fund - Aggressive Index.The existing Crisil Balanced Fund Index has been renamed to Crisil Balanced Fund - Aggressive Index' w.e.f. 4th April 2016 as per 'Crisil Indices- Annual Criteria Review-2016.
10 year SIP
5 year SIP
3 year SIP
1 year SIP
SIP Investments Since Inception
SIP*
7 yearSIP
Total Amount Invested (Rs. '000) 1,310 1,200 840 600 360 120
Market Value as on Month End (Rs. '000) 2,862.66 2,520.79 1,418.39 860.95 434.62 130.69
Scheme Return (% CAGR) 13.61 14.20 14.70 14.42 12.62 16.94
Scheme** Benchmark Return (% CAGR) 10.35 10.61 11.38 12.03 11.81 18.06
Nifty 50 Index (% CAGR) 10.74 11.17 12.11 13.01 13.01 24.80
ICICI Prudential Child Care Plan (Gift Plan)
Past performance may or may not be sustained in future*Inception date is 31 Aug 2001. **Scheme benchmark is Crisil Balanced Fund - Index Aggressivestart date - 30-Mar-02.The existing Crisil Balanced Fund Index has been renamed to Crisil Balanced Fund - Aggressive Index' w.e.f. 4th April 2016 as per 'Crisil Indices- Annual Criteria Review-2016.
10 year SIP
5 year SIP
3 year SIP
1 year SIP
Since Inception
SIP*
SIP Investments15 year
SIP7 Year
SIP
Total Amount Invested (Rs. '000) 1,950 1,800 1,200 840 600 360 120
Market Value as on Month End (Rs. '000) 8,049.31 6,192.90 2,599.07 1,468.03 900.70 431.95 129.44
Scheme Return (% CAGR) 15.72 15.05 14.77 15.66 16.25 12.20 14.92
Scheme** Benchmark Return (% CAGR) NA 11.50 10.61 11.38 12.03 11.81 18.06
Nifty 50 Index (% CAGR) 13.95 13.25 11.17 12.11 13.01 13.01 24.80
10 year SIP
5 year SIP
3 year SIP
1 year SIP
Since Inception
SIP*
SIP Investments15 year
SIP7 Year
SIP
Total Amount Invested (Rs. '000) 1,890 1,800 1,200 840 600 360 120
Market Value as on Month End (Rs. '000) 6,728.87 5,737.14 2,209.13 1,318.41 843.10 439.49 135.66
Scheme Return (% CAGR) 14.66 14.17 11.73 12.65 13.57 13.39 25.08
Nifty 50 Index (% CAGR) 13.72 13.25 11.17 12.11 13.01 13.01 24.80
SIP Investments Since Inception SIP*
3 year SIP
1 year SIP
Total Amount Invested (Rs. '000) 420 360 120
Market Value as on Month End (Rs. '000) 596.54 497.45 142.31
Scheme Return (% CAGR) 20.47 22.17 36.22
Scheme** Benchmark Return (% CAGR) 12.70 14.55 22.90
Nifty 50 Index (% CAGR) 12.08 13.01 24.80
Returns shown for Growth Option as on 31 October, 2017
7 year SIP
SIP Investments5 year
SIP3 year
SIP1 year
SIP
Since Inception
SIP*
Total Amount Invested (Rs. '000) 890 840 600 360 120
Market Value as on Month End (Rs. '000) 1,863.83 1,738.78 1,064.86 504.54 142.01
Scheme Return (% CAGR) 19.49 20.41 23.14 23.19 35.72
Scheme** Benchmark Return (% CAGR) 19.47 20.38 22.94 22.59 34.99
Nifty 50 Index (% CAGR) 11.73 12.11 13.01 13.01 24.80
SIP Investments5 year
SIP3 year
SIP1 year
SIP
Since Inception
SIP*
Total Amount Invested (Rs. '000) 640 600 360 120
Market Value as on Month End (Rs. '000) 881.41 796.89 416.68 127.01
Scheme Return (% CAGR) 11.93 11.30 9.73 11.02
Scheme** Benchmark Return (% CAGR) 13.41 12.91 11.55 14.47
Nifty 50 Index (% CAGR) 13.10 13.06 13.03 24.77
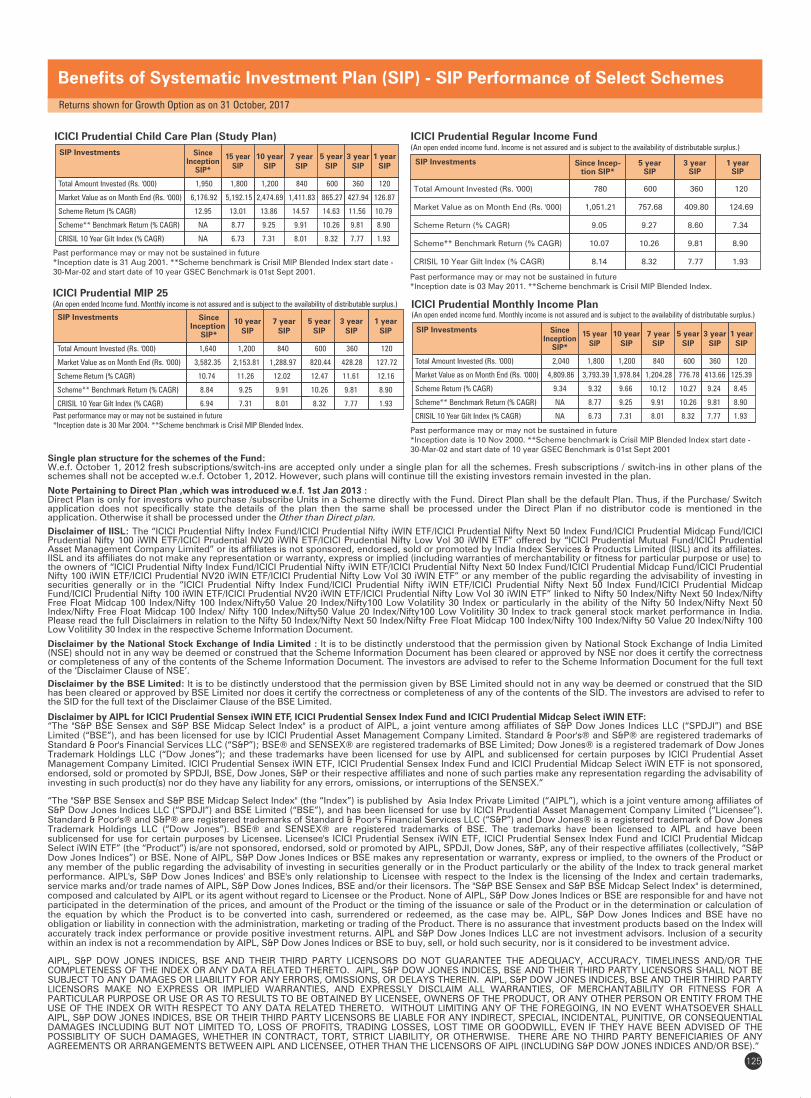
125
Benefits of Systematic Investment Plan (SIP) - SIP Performance of Select Schemes
ICICI Prudential Child Care Plan (Study Plan)
Past performance may or may not be sustained in future*Inception date is 31 Aug 2001. **Scheme benchmark is Crisil MIP Blended Index start date -30-Mar-02 and start date of 10 year GSEC Benchmark is 01st Sept 2001.
Disclaimer of IISL: The “ICICI Prudential Nifty Index Fund/ICICI Prudential Nifty iWIN ETF/ICICI Prudential Nifty Next 50 Index Fund/ICICI Prudential Midcap Fund/ICICI Prudential Nifty 100 iWIN ETF/ICICI Prudential NV20 iWIN ETF/ICICI Prudential Nifty Low Vol 30 iWIN ETF” offered by “ICICI Prudential Mutual Fund/ICICI Prudential Asset Management Company Limited” or its affiliates is not sponsored, endorsed, sold or promoted by India Index Services & Products Limited (IISL) and its affiliates. IISL and its affiliates do not make any representation or warranty, express or implied (including warranties of merchantability or fitness for particular purpose or use) to the owners of “ICICI Prudential Nifty Index Fund/ICICI Prudential Nifty iWIN ETF/ICICI Prudential Nifty Next 50 Index Fund/ICICI Prudential Midcap Fund/ICICI Prudential Nifty 100 iWIN ETF/ICICI Prudential NV20 iWIN ETF/ICICI Prudential Nifty Low Vol 30 iWIN ETF” or any member of the public regarding the advisability of investing in securities generally or in the ”ICICI Prudential Nifty Index Fund/ICICI Prudential Nifty iWIN ETF/ICICI Prudential Nifty Next 50 Index Fund/ICICI Prudential Midcap Fund/ICICI Prudential Nifty 100 iWIN ETF/ICICI Prudential NV20 iWIN ETF/ICICI Prudential Nifty Low Vol 30 iWIN ETF” linked to Nifty 50 Index/Nifty Next 50 Index/Nifty Free Float Midcap 100 Index/Nifty 100 Index/Nifty50 Value 20 Index/Nifty100 Low Volatility 30 Index or particularly in the ability of the Nifty 50 Index/Nifty Next 50 Index/Nifty Free Float Midcap 100 Index/ Nifty 100 Index/Nifty50 Value 20 Index/Nifty100 Low Volitility 30 Index to track general stock market performance in India. Please read the full Disclaimers in relation to the Nifty 50 Index/Nifty Next 50 Index/Nifty Free Float Midcap 100 Index/Nifty 100 Index/Nifty 50 Value 20 Index/Nifty 100 Low Volitility 30 Index in the respective Scheme Information Document.
Disclaimer by the National Stock Exchange of India Limited : It is to be distinctly understood that the permission given by National Stock Exchange of India Limited (NSE) should not in any way be deemed or construed that the Scheme Information Document has been cleared or approved by NSE nor does it certify the correctness or completeness of any of the contents of the Scheme Information Document. The investors are advised to refer to the Scheme Information Document for the full text of the ‘Disclaimer Clause of NSE’.
Disclaimer by the BSE Limited: It is to be distinctly understood that the permission given by BSE Limited should not in any way be deemed or construed that the SID has been cleared or approved by BSE Limited nor does it certify the correctness or completeness of any of the contents of the SID. The investors are advised to refer to the SID for the full text of the Disclaimer Clause of the BSE Limited.
Disclaimer by AIPL for ICICI Prudential Sensex iWIN ETF, ICICI Prudential Sensex Index Fund and ICICI Prudential Midcap Select iWIN ETF:“The "S&P BSE Sensex and S&P BSE Midcap Select Index" is a product of AIPL, a joint venture among affiliates of S&P Dow Jones Indices LLC (“SPDJI”) and BSE Limited (“BSE”), and has been licensed for use by ICICI Prudential Asset Management Company Limited. Standard & Poor's® and S&P® are registered trademarks of Standard & Poor's Financial Services LLC (“S&P”); BSE® and SENSEX® are registered trademarks of BSE Limited; Dow Jones® is a registered trademark of Dow Jones Trademark Holdings LLC (“Dow Jones”); and these trademarks have been licensed for use by AIPL and sublicensed for certain purposes by ICICI Prudential Asset Management Company Limited. ICICI Prudential Sensex iWIN ETF, ICICI Prudential Sensex Index Fund and ICICI Prudential Midcap Select iWIN ETF is not sponsored, endorsed, sold or promoted by SPDJI, BSE, Dow Jones, S&P or their respective affiliates and none of such parties make any representation regarding the advisability of investing in such product(s) nor do they have any liability for any errors, omissions, or interruptions of the SENSEX.”
“The "S&P BSE Sensex and S&P BSE Midcap Select Index" (the “Index”) is published by Asia Index Private Limited (“AIPL”), which is a joint venture among affiliates of S&P Dow Jones Indices LLC (“SPDJI”) and BSE Limited (“BSE”), and has been licensed for use by ICICI Prudential Asset Management Company Limited (“Licensee”). Standard & Poor's® and S&P® are registered trademarks of Standard & Poor's Financial Services LLC (“S&P”) and Dow Jones® is a registered trademark of Dow Jones Trademark Holdings LLC (“Dow Jones”). BSE® and SENSEX® are registered trademarks of BSE. The trademarks have been licensed to AIPL and have been sublicensed for use for certain purposes by Licensee. Licensee's ICICI Prudential Sensex iWIN ETF, ICICI Prudential Sensex Index Fund and ICICI Prudential Midcap Select iWIN ETF” (the “Product”) is/are not sponsored, endorsed, sold or promoted by AIPL, SPDJI, Dow Jones, S&P, any of their respective affiliates (collectively, “S&P Dow Jones Indices”) or BSE. None of AIPL, S&P Dow Jones Indices or BSE makes any representation or warranty, express or implied, to the owners of the Product or any member of the public regarding the advisability of investing in securities generally or in the Product particularly or the ability of the Index to track general market performance. AIPL's, S&P Dow Jones Indices' and BSE's only relationship to Licensee with respect to the Index is the licensing of the Index and certain trademarks, service marks and/or trade names of AIPL, S&P Dow Jones Indices, BSE and/or their licensors. The "S&P BSE Sensex and S&P BSE Midcap Select Index" is determined, composed and calculated by AIPL or its agent without regard to Licensee or the Product. None of AIPL, S&P Dow Jones Indices or BSE are responsible for and have not participated in the determination of the prices, and amount of the Product or the timing of the issuance or sale of the Product or in the determination or calculation of the equation by which the Product is to be converted into cash, surrendered or redeemed, as the case may be. AIPL, S&P Dow Jones Indices and BSE have no obligation or liability in connection with the administration, marketing or trading of the Product. There is no assurance that investment products based on the Index will accurately track index performance or provide positive investment returns. AIPL and S&P Dow Jones Indices LLC are not investment advisors. Inclusion of a security within an index is not a recommendation by AIPL, S&P Dow Jones Indices or BSE to buy, sell, or hold such security, nor is it considered to be investment advice.
AIPL, S&P DOW JONES INDICES, BSE AND THEIR THIRD PARTY LICENSORS DO NOT GUARANTEE THE ADEQUACY, ACCURACY, TIMELINESS AND/OR THE COMPLETENESS OF THE INDEX OR ANY DATA RELATED THERETO. AIPL, S&P DOW JONES INDICES, BSE AND THEIR THIRD PARTY LICENSORS SHALL NOT BE SUBJECT TO ANY DAMAGES OR LIABILITY FOR ANY ERRORS, OMISSIONS, OR DELAYS THEREIN. AIPL, S&P DOW JONES INDICES, BSE AND THEIR THIRD PARTY LICENSORS MAKE NO EXPRESS OR IMPLIED WARRANTIES, AND EXPRESSLY DISCLAIM ALL WARRANTIES, OF MERCHANTABILITY OR FITNESS FOR A PARTICULAR PURPOSE OR USE OR AS TO RESULTS TO BE OBTAINED BY LICENSEE, OWNERS OF THE PRODUCT, OR ANY OTHER PERSON OR ENTITY FROM THE USE OF THE INDEX OR WITH RESPECT TO ANY DATA RELATED THERETO. WITHOUT LIMITING ANY OF THE FOREGOING, IN NO EVENT WHATSOEVER SHALL AIPL, S&P DOW JONES INDICES, BSE OR THEIR THIRD PARTY LICENSORS BE LIABLE FOR ANY INDIRECT, SPECIAL, INCIDENTAL, PUNITIVE, OR CONSEQUENTIAL DAMAGES INCLUDING BUT NOT LIMITED TO, LOSS OF PROFITS, TRADING LOSSES, LOST TIME OR GOODWILL, EVEN IF THEY HAVE BEEN ADVISED OF THE POSSIBLITY OF SUCH DAMAGES, WHETHER IN CONTRACT, TORT, STRICT LIABILITY, OR OTHERWISE. THERE ARE NO THIRD PARTY BENEFICIARIES OF ANY AGREEMENTS OR ARRANGEMENTS BETWEEN AIPL AND LICENSEE, OTHER THAN THE LICENSORS OF AIPL (INCLUDING S&P DOW JONES INDICES AND/OR BSE).”
Single plan structure for the schemes of the Fund:W.e.f. October 1, 2012 fresh subscriptions/switch-ins are accepted only under a single plan for all the schemes. Fresh subscriptions / switch-ins in other plans of the schemes shall not be accepted w.e.f. October 1, 2012. However, such plans will continue till the existing investors remain invested in the plan.
Note Pertaining to Direct Plan ,which was introduced w.e.f. 1st Jan 2013 :Direct Plan is only for investors who purchase /subscribe Units in a Scheme directly with the Fund. Direct Plan shall be the default Plan. Thus, if the Purchase/ Switch application does not specifically state the details of the plan then the same shall be processed under the Direct Plan if no distributor code is mentioned in the application. Otherwise it shall be processed under the Other than Direct plan.
10 year SIP
5 year SIP
3 year SIP
1 year SIP
Since Inception
SIP*
SIP Investments15 year
SIP7 year
SIP
Total Amount Invested (Rs. '000) 1,950 1,800 1,200 840 600 360 120
Market Value as on Month End (Rs. '000) 6,176.92 5,192.15 2,474.69 1,411.83 865.27 427.94 126.87
Scheme Return (% CAGR) 12.95 13.01 13.86 14.57 14.63 11.56 10.79
Scheme** Benchmark Return (% CAGR) NA 8.77 9.25 9.91 10.26 9.81 8.90
CRISIL 10 Year Gilt Index (% CAGR) NA 6.73 7.31 8.01 8.32 7.77 1.93
10 year SIP
5 year SIP
3 year SIP
1 year SIP
SIP Investments Since Inception
SIP*
7 yearSIP
Total Amount Invested (Rs. '000) 1,640 1,200 840 600 360 120
Market Value as on Month End (Rs. '000) 3,582.35 2,153.81 1,288.97 820.44 428.28 127.72
Scheme Return (% CAGR) 10.74 11.26 12.02 12.47 11.61 12.16
Scheme** Benchmark Return (% CAGR) 8.84 9.25 9.91 10.26 9.81 8.90
CRISIL 10 Year Gilt Index (% CAGR) 6.94 7.31 8.01 8.32 7.77 1.93
Past performance may or may not be sustained in future*Inception date is 30 Mar 2004. **Scheme benchmark is Crisil MIP Blended Index.
ICICI Prudential MIP 25(An open ended Income fund. Monthly income is not assured and is subject to the availability of distributable surplus.) ICICI Prudential Monthly Income Plan
(An open ended income fund. Monthly income is not assured and is subject to the availability of distributable surplus.)
Past performance may or may not be sustained in future*Inception date is 10 Nov 2000. **Scheme benchmark is Crisil MIP Blended Index start date -30-Mar-02 and start date of 10 year GSEC Benchmark is 01st Sept 2001
10 year SIP
5 year SIP
3 year SIP
1 year SIP
Since Inception
SIP*
SIP Investments15 year
SIP7 year
SIP
Total Amount Invested (Rs. '000) 2,040 1,800 1,200 840 600 360 120
Market Value as on Month End (Rs. '000) 4,809.86 3,793.39 1,978.84 1,204.28 776.78 413.66 125.39
Scheme Return (% CAGR) 9.34 9.32 9.66 10.12 10.27 9.24 8.45
Scheme** Benchmark Return (% CAGR) NA 8.77 9.25 9.91 10.26 9.81 8.90
CRISIL 10 Year Gilt Index (% CAGR) NA 6.73 7.31 8.01 8.32 7.77 1.93
ICICI Prudential Regular Income Fund(An open ended income fund. Income is not assured and is subject to the availability of distributable surplus.)
Past performance may or may not be sustained in future*Inception date is 03 May 2011. **Scheme benchmark is Crisil MIP Blended Index.
SIP Investments Since Incep-tion SIP*
5 yearSIP
3 yearSIP
1 yearSIP
Total Amount Invested (Rs. '000) 780 600 360 120
Market Value as on Month End (Rs. '000) 1,051.21 757.68 409.80 124.69
Scheme Return (% CAGR) 9.05 9.27 8.60 7.34
Scheme** Benchmark Return (% CAGR) 10.07 10.26 9.81 8.90
CRISIL 10 Year Gilt Index (% CAGR) 8.14 8.32 7.77 1.93
Returns shown for Growth Option as on 31 October, 2017
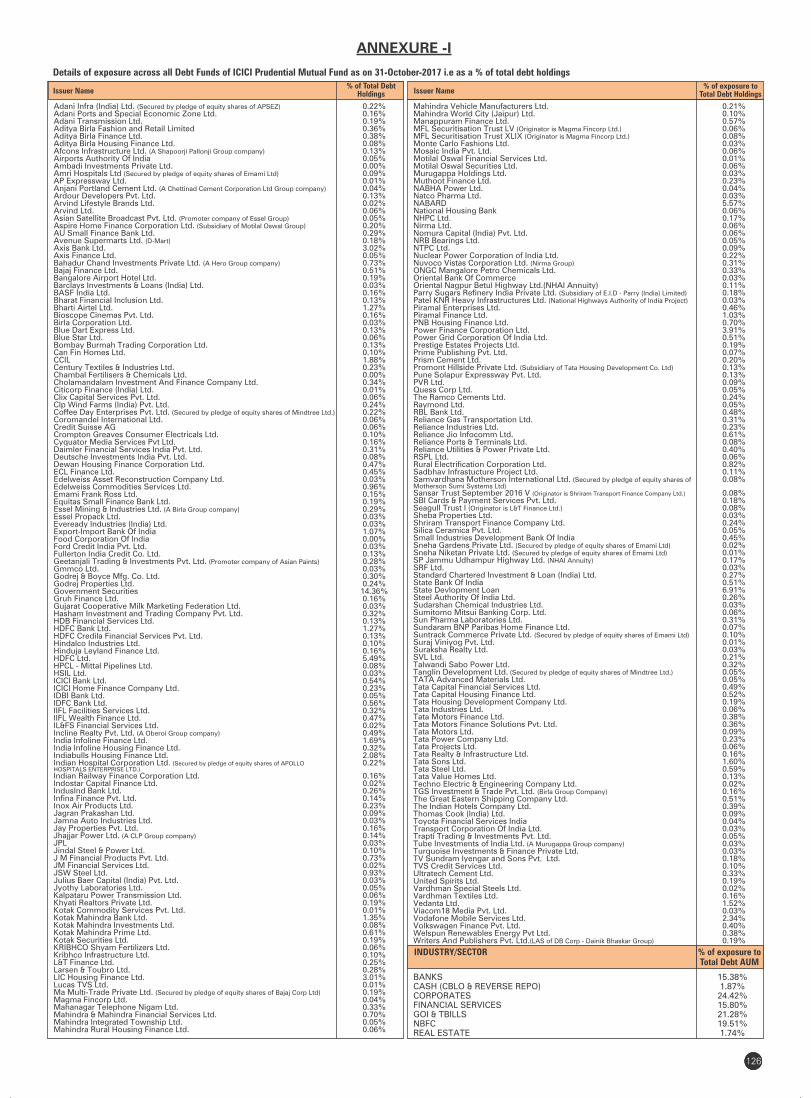
6979126
ANNEXURE -I
% of exposure to Total Debt HoldingsIssuer Name
Details of exposure across all Debt Funds of ICICI Prudential Mutual Fund as on 31-October-2017 i.e as a % of total debt holdings
Mahindra Vehicle Manufacturers Ltd. 0.21%Mahindra World City (Jaipur) Ltd. 0.10%Manappuram Finance Ltd. 0.57%MFL Securitisation Trust LV (Originator is Magma Fincorp Ltd.) 0.06%MFL Securitisation Trust XLIX (Originator is Magma Fincorp Ltd.) 0.08%Monte Carlo Fashions Ltd. 0.03%Mosaic India Pvt. Ltd. 0.06%Motilal Oswal Financial Services Ltd. 0.01%Motilal Oswal Securities Ltd. 0.06%Murugappa Holdings Ltd. 0.03%Muthoot Finance Ltd. 0.23%NABHA Power Ltd. 0.04%Natco Pharma Ltd. 0.03%NABARD 5.57%National Housing Bank 0.06%NHPC Ltd. 0.17%Nirma Ltd. 0.06%Nomura Capital (India) Pvt. Ltd. 0.06%NRB Bearings Ltd. 0.05%NTPC Ltd. 0.09%Nuclear Power Corporation of India Ltd. 0.22%Nuvoco Vistas Corporation Ltd. (Nirma Group) 0.31%ONGC Mangalore Petro Chemicals Ltd. 0.33%Oriental Bank Of Commerce 0.03%Oriental Nagpur Betul Highway Ltd.(NHAI Annuity) 0.11%Parry Sugars Refinery India Private Ltd. (Subsidiary of E.I.D - Parry (India) Limited) 0.18%Patel KNR Heavy Infrastructures Ltd. (National Highways Authority of India Project) 0.03%Piramal Enterprises Ltd. 0.46%Piramal Finance Ltd. 1.03%PNB Housing Finance Ltd. 0.70%Power Finance Corporation Ltd. 3.91%Power Grid Corporation Of India Ltd. 0.51%Prestige Estates Projects Ltd. 0.19%Prime Publishing Pvt. Ltd. 0.07%Prism Cement Ltd. 0.20%Promont Hillside Private Ltd. (Subsidiary of Tata Housing Development Co. Ltd) 0.13%Pune Solapur Expressway Pvt. Ltd. 0.13%PVR Ltd. 0.09%Quess Corp Ltd. 0.05%The Ramco Cements Ltd. 0.24%Raymond Ltd. 0.05%RBL Bank Ltd. 0.48%Reliance Gas Transportation Ltd. 0.31%Reliance Industries Ltd. 0.23%Reliance Jio Infocomm Ltd. 0.61%Reliance Ports & Terminals Ltd. 0.08%Reliance Utilities & Power Private Ltd. 0.40%RSPL Ltd. 0.06%Rural Electrification Corporation Ltd. 0.82%Sadbhav Infrastucture Project Ltd. 0.11%Samvardhana Motherson International Ltd. (Secured by pledge of equity shares of 0.08%Motherson Sumi Systems Ltd) Sansar Trust September 2016 V (Originator is Shriram Transport Finance Company Ltd.) 0.08%SBI Cards & Payment Services Pvt. Ltd. 0.18%Seagull Trust I (Originator is L&T Finance Ltd.) 0.08%Sheba Properties Ltd. 0.03%Shriram Transport Finance Company Ltd. 0.24%Silica Ceramica Pvt. Ltd. 0.05%Small Industries Development Bank Of India 0.45%Sneha Gardens Private Ltd. (Secured by pledge of equity shares of Emami Ltd) 0.02%Sneha Niketan Private Ltd. (Secured by pledge of equity shares of Emami Ltd) 0.01%SP Jammu Udhampur Highway Ltd. (NHAI Annuity) 0.17%SRF Ltd. 0.03%Standard Chartered Investment & Loan (India) Ltd. 0.27%State Bank Of India 0.51%State Devlopment Loan 6.91%Steel Authority Of India Ltd. 0.26%Sudarshan Chemical Industries Ltd. 0.03%Sumitomo Mitsui Banking Corp. Ltd. 0.06%Sun Pharma Laboratories Ltd. 0.31%Sundaram BNP Paribas Home Finance Ltd. 0.07%Suntrack Commerce Private Ltd. (Secured by pledge of equity shares of Emami Ltd) 0.10%Suraj Viniyog Pvt. Ltd. 0.01%Suraksha Realty Ltd. 0.03%SVL Ltd. 0.21%Talwandi Sabo Power Ltd. 0.32%Tanglin Development Ltd. (Secured by pledge of equity shares of Mindtree Ltd.) 0.05%TATA Advanced Materials Ltd. 0.05%Tata Capital Financial Services Ltd. 0.49%Tata Capital Housing Finance Ltd. 0.52%Tata Housing Development Company Ltd. 0.19%Tata Industries Ltd. 0.06%Tata Motors Finance Ltd. 0.38%Tata Motors Finance Solutions Pvt. Ltd. 0.36%Tata Motors Ltd. 0.09%Tata Power Company Ltd. 0.23%Tata Projects Ltd. 0.06%Tata Realty & Infrastructure Ltd. 0.16%Tata Sons Ltd. 1.60%Tata Steel Ltd. 0.59%Tata Value Homes Ltd. 0.13%Techno Electric & Engineering Company Ltd. 0.02%TGS Investment & Trade Pvt. Ltd. (Birla Group Company) 0.16%The Great Eastern Shipping Company Ltd. 0.51%The Indian Hotels Company Ltd. 0.39%Thomas Cook (India) Ltd. 0.09%Toyota Financial Services India 0.04%Transport Corporation Of India Ltd. 0.03%Trapti Trading & Investments Pvt. Ltd. 0.05%Tube Investments of India Ltd. (A Murugappa Group company) 0.03%Turquoise Investments & Finance Private Ltd. 0.03%TV Sundram Iyengar and Sons Pvt. Ltd. 0.18%TVS Credit Services Ltd. 0.10%Ultratech Cement Ltd. 0.33%United Spirits Ltd. 0.19%Vardhman Special Steels Ltd. 0.02%Vardhman Textiles Ltd. 0.16%Vedanta Ltd. 1.52%Viacom18 Media Pvt. Ltd. 0.03%Vodafone Mobile Services Ltd. 2.34%Volkswagen Finance Pvt. Ltd. 0.40%Welspun Renewables Energy Pvt Ltd. 0.38%Writers And Publishers Pvt. Ltd.(LAS of DB Corp - Dainik Bhaskar Group) 0.19%
INDUSTRY/SECTOR % of exposure to Total Debt AUM
BANKS 15.38%CASH (CBLO & REVERSE REPO) 1.87%CORPORATES 24.42%FINANCIAL SERVICES 15.80%GOI & TBILLS 21.28%NBFC 19.51%REAL ESTATE 1.74%
Adani Infra (India) Ltd. (Secured by pledge of equity shares of APSEZ) 0.22%Adani Ports and Special Economic Zone Ltd. 0.16%Adani Transmission Ltd. 0.19%Aditya Birla Fashion and Retail Limited 0.36%Aditya Birla Finance Ltd. 0.38%Aditya Birla Housing Finance Ltd. 0.08%Afcons Infrastructure Ltd. (A Shapoorji Pallonji Group company) 0.13%Airports Authority Of India 0.05%Ambadi Investments Private Ltd. 0.00%Amri Hospitals Ltd (Secured by pledge of equity shares of Emami Ltd) 0.09%AP Expressway Ltd. 0.01%Anjani Portland Cement Ltd. (A Chettinad Cement Corporation Ltd Group company) 0.04%Ardour Developers Pvt. Ltd. 0.13%Arvind Lifestyle Brands Ltd. 0.02%Arvind Ltd. 0.06%Asian Satellite Broadcast Pvt. Ltd. (Promoter company of Essel Group) 0.05%Aspire Home Finance Corporation Ltd. (Subsidiary of Motilal Oswal Group) 0.20%AU Small Finance Bank Ltd. 0.29%Avenue Supermarts Ltd. (D-Mart) 0.18%Axis Bank Ltd. 3.02%Axis Finance Ltd. 0.05%Bahadur Chand Investments Private Ltd. (A Hero Group company) 0.73%Bajaj Finance Ltd. 0.51%Bangalore Airport Hotel Ltd. 0.19%Barclays Investments & Loans (India) Ltd. 0.03%BASF India Ltd. 0.16%Bharat Financial Inclusion Ltd. 0.13%Bharti Airtel Ltd. 1.27%Bioscope Cinemas Pvt. Ltd. 0.16%Birla Corporation Ltd. 0.03%Blue Dart Express Ltd. 0.13%Blue Star Ltd. 0.06%Bombay Burmah Trading Corporation Ltd. 0.13%Can Fin Homes Ltd. 0.10%CCIL 1.88%Century Textiles & Industries Ltd. 0.23%Chambal Fertilisers & Chemicals Ltd. 0.00%Cholamandalam Investment And Finance Company Ltd. 0.34%Citicorp Finance (India) Ltd. 0.01%Clix Capital Services Pvt. Ltd. 0.06%Clp Wind Farms (India) Pvt. Ltd. 0.24%Coffee Day Enterprises Pvt. Ltd. (Secured by pledge of equity shares of Mindtree Ltd.) 0.22%Coromandel International Ltd. 0.06%Credit Suisse AG 0.06%Crompton Greaves Consumer Electricals Ltd. 0.10%Cyquator Media Services Pvt Ltd. 0.16%Daimler Financial Services India Pvt. Ltd. 0.31%Deutsche Investments India Pvt. Ltd. 0.08%Dewan Housing Finance Corporation Ltd. 0.47%ECL Finance Ltd. 0.45%Edelweiss Asset Reconstruction Company Ltd. 0.03%Edelweiss Commodities Services Ltd. 0.96%Emami Frank Ross Ltd. 0.15%Equitas Small Finance Bank Ltd. 0.19%Essel Mining & Industries Ltd. (A Birla Group company) 0.29%Essel Propack Ltd. 0.03%Eveready Industries (India) Ltd. 0.03%Export-Import Bank Of India 1.07%Food Corporation Of India 0.00%Ford Credit India Pvt. Ltd. 0.03%Fullerton India Credit Co. Ltd. 0.13%Geetanjali Trading & Investments Pvt. Ltd. (Promoter company of Asian Paints) 0.28%Gmmco Ltd. 0.03%Godrej & Boyce Mfg. Co. Ltd. 0.30%Godrej Properties Ltd. 0.24%Government Securities 14.36%Gruh Finance Ltd. 0.16%Gujarat Cooperative Milk Marketing Federation Ltd. 0.03%Hasham Investment and Trading Company Pvt. Ltd. 0.32%HDB Financial Services Ltd. 0.13%HDFC Bank Ltd. 1.27%HDFC Credila Financial Services Pvt. Ltd. 0.13%Hindalco Industries Ltd. 0.10%Hinduja Leyland Finance Ltd. 0.16%HDFC Ltd. 5.49%HPCL - Mittal Pipelines Ltd. 0.08%HSIL Ltd. 0.03%ICICI Bank Ltd. 0.54%ICICI Home Finance Company Ltd. 0.23%IDBI Bank Ltd. 0.05%IDFC Bank Ltd. 0.56%IIFL Facilities Services Ltd. 0.32%IIFL Wealth Finance Ltd. 0.47%IL&FS Financial Services Ltd. 0.02%Incline Realty Pvt. Ltd. (A Oberoi Group company) 0.49%India Infoline Finance Ltd. 1.69%India Infoline Housing Finance Ltd. 0.32%Indiabulls Housing Finance Ltd. 2.08%Indian Hospital Corporation Ltd. (Secured by pledge of equity shares of APOLLO 0.22%HOSPITALS ENTERPRISE LTD.)Indian Railway Finance Corporation Ltd. 0.16%Indostar Capital Finance Ltd. 0.02%IndusInd Bank Ltd. 0.26%Infina Finance Pvt. Ltd. 0.14%Inox Air Products Ltd. 0.23%Jagran Prakashan Ltd. 0.09%Jamna Auto Industries Ltd. 0.03%Jay Properties Pvt. Ltd. 0.16%Jhajjar Power Ltd. (A CLP Group company) 0.14%JPL 0.03%Jindal Steel & Power Ltd. 0.10%J M Financial Products Pvt. Ltd. 0.73%JM Financial Services Ltd. 0.02%JSW Steel Ltd. 0.93%Julius Baer Capital (India) Pvt. Ltd. 0.03%Jyothy Laboratories Ltd. 0.05%Kalpataru Power Transmission Ltd. 0.06%Khyati Realtors Private Ltd. 0.19%Kotak Commodity Services Pvt. Ltd. 0.01%Kotak Mahindra Bank Ltd. 1.35%Kotak Mahindra Investments Ltd. 0.08%Kotak Mahindra Prime Ltd. 0.61%Kotak Securities Ltd. 0.19%KRIBHCO Shyam Fertilizers Ltd. 0.06%Kribhco Infrastructure Ltd. 0.10%L&T Finance Ltd. 0.25%Larsen & Toubro Ltd. 0.28%LIC Housing Finance Ltd. 3.01%Lucas TVS Ltd. 0.01%Ma Multi-Trade Private Ltd. (Secured by pledge of equity shares of Bajaj Corp Ltd) 0.19%Magma Fincorp Ltd. 0.04%Mahanagar Telephone Nigam Ltd. 0.33%Mahindra & Mahindra Financial Services Ltd. 0.70%Mahindra Integrated Township Ltd. 0.05%Mahindra Rural Housing Finance Ltd. 0.06%
Issuer Name% of Total Debt
Holdings
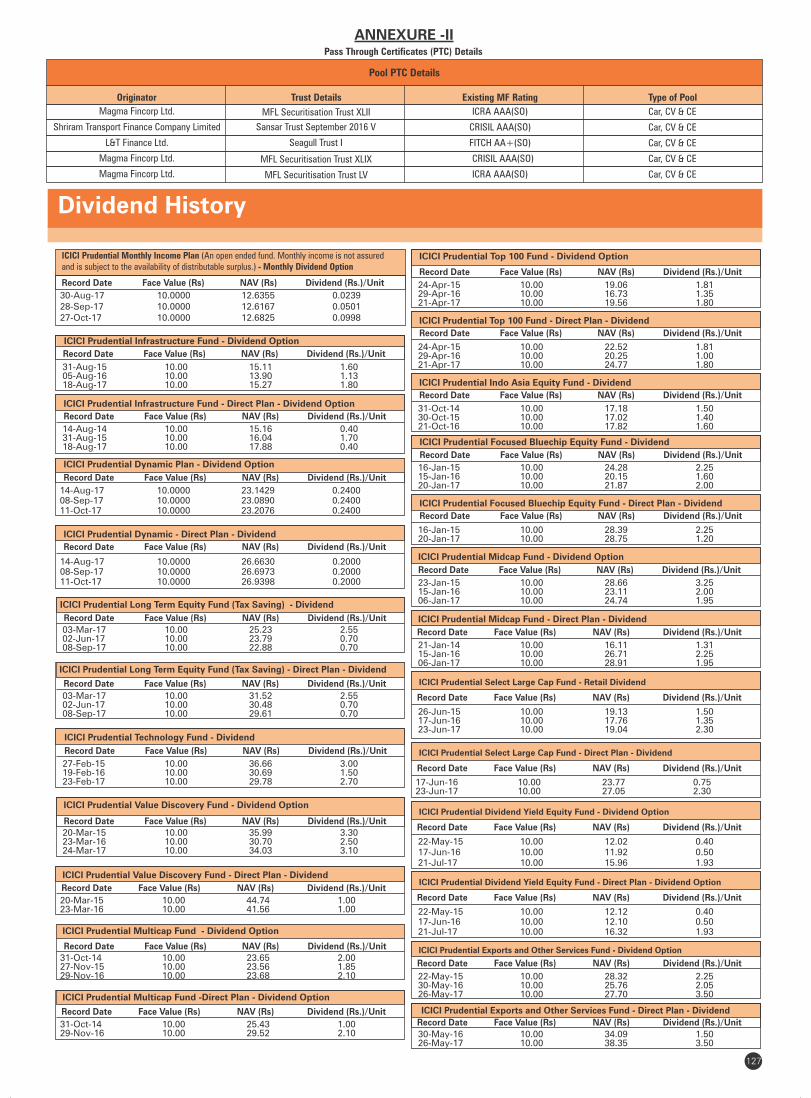
ICICI Prudential Value Discovery Fund - Dividend Option
Record Date Face Value (Rs) NAV (Rs) Dividend (Rs.)/Unit20-Mar-15 10.00 35.99 3.3023-Mar-16 10.00 30.70 2.5024-Mar-17 10.00 34.03 3.10
ICICI Prudential Value Discovery Fund - Direct Plan - Dividend
Record Date Face Value (Rs) NAV (Rs) Dividend (Rs.)/Unit
20-Mar-15 10.00 44.74 1.0023-Mar-16 10.00 41.56 1.00
Record Date Face Value (Rs) NAV (Rs) Dividend (Rs.)/Unit
ICICI Prudential Multicap Fund - Dividend Option
31-Oct-14 10.00 23.65 2.0027-Nov-15 10.00 23.56 1.8529-Nov-16 10.00 23.68 2.10
ICICI Prudential Multicap Fund -Direct Plan - Dividend Option
Record Date Face Value (Rs) NAV (Rs) Dividend (Rs.)/Unit
31-Oct-14 10.00 25.43 1.0029-Nov-16 10.00 29.52 2.10
ICICI Prudential Focused Bluechip Equity Fund - Dividend
Record Date Face Value (Rs) NAV (Rs) Dividend (Rs.)/Unit
16-Jan-15 10.00 24.28 2.2515-Jan-16 10.00 20.15 1.6020-Jan-17 10.00 21.87 2.00
ICICI Prudential Focused Bluechip Equity Fund - Direct Plan - Dividend
Record Date Face Value (Rs) NAV (Rs) Dividend (Rs.)/Unit
16-Jan-15 10.00 28.39 2.2520-Jan-17 10.00 28.75 1.20
ICICI Prudential Midcap Fund - Dividend Option
Record Date Face Value (Rs) NAV (Rs) Dividend (Rs.)/Unit
23-Jan-15 10.00 28.66 3.2515-Jan-16 10.00 23.11 2.0006-Jan-17 10.00 24.74 1.95
ICICI Prudential Midcap Fund - Direct Plan - Dividend
Record Date Face Value (Rs) NAV (Rs) Dividend (Rs.)/Unit
21-Jan-14 10.00 16.11 1.3115-Jan-16 10.00 26.71 2.2506-Jan-17 10.00 28.91 1.95
ICICI Prudential Select Large Cap Fund - Retail Dividend
Record Date Face Value (Rs) NAV (Rs) Dividend (Rs.)/Unit
26-Jun-15 10.00 19.13 1.5017-Jun-16 10.00 17.76 1.3523-Jun-17 10.00 19.04 2.30
ICICI Prudential Select Large Cap Fund - Direct Plan - Dividend
Record Date Face Value (Rs) NAV (Rs) Dividend (Rs.)/Unit
17-Jun-16 10.00 23.77 0.7523-Jun-17 10.00 27.05 2.30
ICICI Prudential Top 100 Fund - Dividend Option
Record Date Face Value (Rs) NAV (Rs) Dividend (Rs.)/Unit
24-Apr-15 10.00 19.06 1.8129-Apr-16 10.00 16.73 1.3521-Apr-17 10.00 19.56 1.80
ICICI Prudential Top 100 Fund - Direct Plan - Dividend
Record Date Face Value (Rs) NAV (Rs) Dividend (Rs.)/Unit
24-Apr-15 10.00 22.52 1.8129-Apr-16 10.00 20.25 1.0021-Apr-17 10.00 24.77 1.80
127
Dividend History
ICICI Prudential Technology Fund - Dividend
Record Date Face Value (Rs) NAV (Rs) Dividend (Rs.)/Unit
27-Feb-15 10.00 36.66 3.0019-Feb-16 10.00 30.69 1.5023-Feb-17 10.00 29.78 2.70
ICICI Prudential Indo Asia Equity Fund - Dividend
Record Date Face Value (Rs) NAV (Rs) Dividend (Rs.)/Unit
31-Oct-14 10.00 17.18 1.5030-Oct-15 10.00 17.02 1.4021-Oct-16 10.00 17.82 1.60
ICICI Prudential Dividend Yield Equity Fund - Dividend Option
Record Date Face Value (Rs) NAV (Rs) Dividend (Rs.)/Unit
22-May-15 10.00 12.02 0.4017-Jun-16 10.00 11.92 0.5021-Jul-17 10.00 15.96 1.93
ICICI Prudential Dividend Yield Equity Fund - Direct Plan - Dividend Option
Record Date Face Value (Rs) NAV (Rs) Dividend (Rs.)/Unit
22-May-15 10.00 12.12 0.4017-Jun-16 10.00 12.10 0.5021-Jul-17 10.00 16.32 1.93
ICICI Prudential Exports and Other Services Fund - Dividend Option
Record Date Face Value (Rs) NAV (Rs) Dividend (Rs.)/Unit
22-May-15 10.00 28.32 2.2530-May-16 10.00 25.76 2.0526-May-17 10.00 27.70 3.50
ICICI Prudential Exports and Other Services Fund - Direct Plan - Dividend
Record Date Face Value (Rs) NAV (Rs) Dividend (Rs.)/Unit
30-May-16 10.00 34.09 1.5026-May-17 10.00 38.35 3.50
ICICI Prudential Long Term Equity Fund (Tax Saving) - Dividend
Record Date Face Value (Rs) NAV (Rs) Dividend (Rs.)/Unit
03-Mar-17 10.00 25.23 2.5502-Jun-17 10.00 23.79 0.7008-Sep-17 10.00 22.88 0.70
Record Date Face Value (Rs) NAV (Rs) Dividend (Rs.)/Unit
ICICI Prudential Long Term Equity Fund (Tax Saving) - Direct Plan - Dividend
03-Mar-17 10.00 31.52 2.5502-Jun-17 10.00 30.48 0.7008-Sep-17 10.00 29.61 0.70
ICICI Prudential Dynamic Plan - Dividend Option
Record Date Face Value (Rs) NAV (Rs) Dividend (Rs.)/Unit
14-Aug-17 10.0000 23.1429 0.240008-Sep-17 10.0000 23.0890 0.240011-Oct-17 10.0000 23.2076 0.2400
ICICI Prudential Dynamic - Direct Plan - Dividend
Record Date Face Value (Rs) NAV (Rs) Dividend (Rs.)/Unit
14-Aug-17 10.0000 26.6630 0.200008-Sep-17 10.0000 26.6973 0.200011-Oct-17 10.0000 26.9398 0.2000
Record Date Face Value (Rs) NAV (Rs) Dividend (Rs.)/Unit
ICICI Prudential Monthly Income Plan (An open ended fund. Monthly income is not assured and is subject to the availability of distributable surplus.) - Monthly Dividend Option
30-Aug-17 10.0000 12.6355 0.023928-Sep-17 10.0000 12.6167 0.050127-Oct-17 10.0000 12.6825 0.0998
ICICI Prudential Infrastructure Fund - Dividend Option
Record Date Face Value (Rs) NAV (Rs) Dividend (Rs.)/Unit
31-Aug-15 10.00 15.11 1.6005-Aug-16 10.00 13.90 1.1318-Aug-17 10.00 15.27 1.80
ICICI Prudential Infrastructure Fund - Direct Plan - Dividend Option
Record Date Face Value (Rs) NAV (Rs) Dividend (Rs.)/Unit
14-Aug-14 10.00 15.16 0.4031-Aug-15 10.00 16.04 1.7018-Aug-17 10.00 17.88 0.40
ANNEXURE -IIPass Through Certificates (PTC) Details
Pool PTC Details
Originator
Magma Fincorp Ltd.
Trust Details
MFL Securitisation Trust XLII
Existing MF Rating
ICRA AAA(SO)
Type of Pool
Car, CV & CE
Shriram Transport Finance Company Limited CRISIL AAA(SO)Sansar Trust September 2016 V Car, CV & CE
L&T Finance Ltd. FITCH AA+(SO)Seagull Trust I Car, CV & CE
Magma Fincorp Ltd. MFL Securitisation Trust XLIX CRISIL AAA(SO) Car, CV & CE
Magma Fincorp Ltd. MFL Securitisation Trust LV ICRA AAA(SO) Car, CV & CE
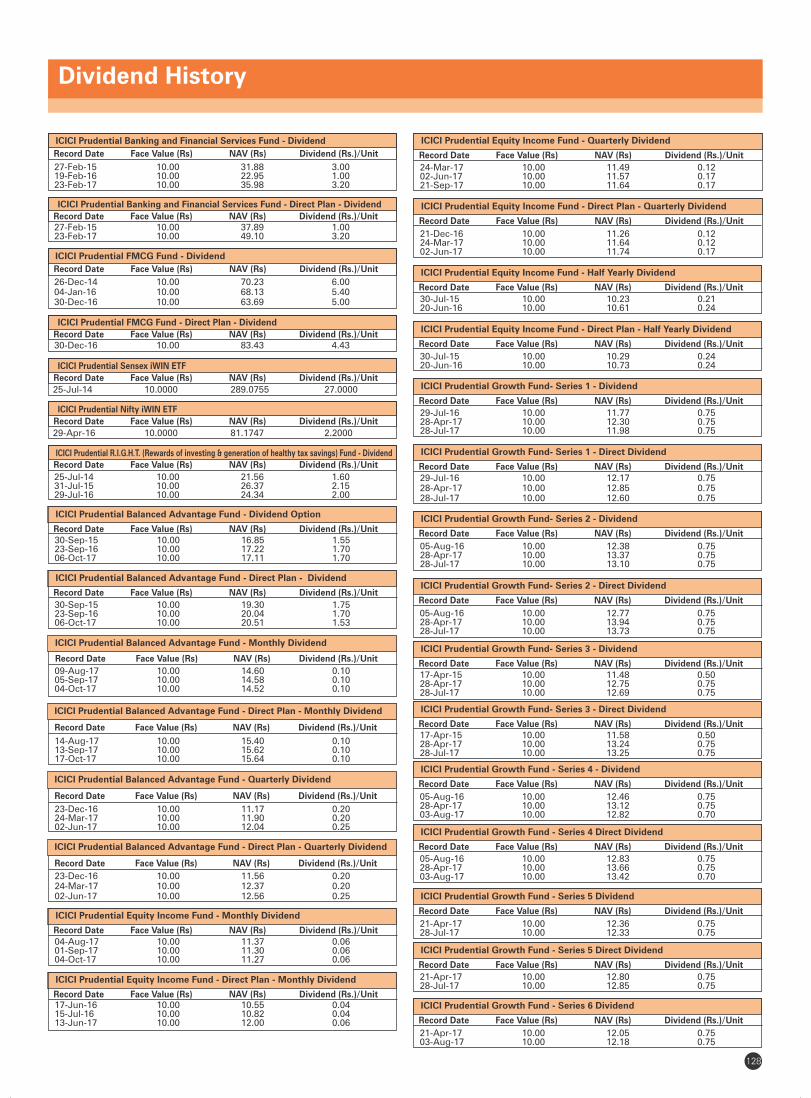
ICICI Prudential Balanced Advantage Fund - Dividend Option
Record Date Face Value (Rs) NAV (Rs) Dividend (Rs.)/Unit30-Sep-15 10.00 16.85 1.5523-Sep-16 10.00 17.22 1.7006-Oct-17 10.00 17.11 1.70
ICICI Prudential Balanced Advantage Fund - Direct Plan - Dividend
Record Date Face Value (Rs) NAV (Rs) Dividend (Rs.)/Unit
30-Sep-15 10.00 19.30 1.7523-Sep-16 10.00 20.04 1.7006-Oct-17 10.00 20.51 1.53
ICICI Prudential Balanced Advantage Fund - Monthly Dividend
Record Date Face Value (Rs) NAV (Rs) Dividend (Rs.)/Unit
09-Aug-17 10.00 14.60 0.1005-Sep-17 10.00 14.58 0.1004-Oct-17 10.00 14.52 0.10
ICICI Prudential Balanced Advantage Fund - Direct Plan - Monthly Dividend
Record Date Face Value (Rs) NAV (Rs) Dividend (Rs.)/Unit
14-Aug-17 10.00 15.40 0.1013-Sep-17 10.00 15.62 0.1017-Oct-17 10.00 15.64 0.10
ICICI Prudential Balanced Advantage Fund - Quarterly Dividend
Record Date Face Value (Rs) NAV (Rs) Dividend (Rs.)/Unit
23-Dec-16 10.00 11.17 0.2024-Mar-17 10.00 11.90 0.2002-Jun-17 10.00 12.04 0.25
ICICI Prudential Balanced Advantage Fund - Direct Plan - Quarterly Dividend
Record Date Face Value (Rs) NAV (Rs) Dividend (Rs.)/Unit
23-Dec-16 10.00 11.56 0.2024-Mar-17 10.00 12.37 0.2002-Jun-17 10.00 12.56 0.25
Dividend History
ICICI Prudential Banking and Financial Services Fund - Dividend
Record Date Face Value (Rs) NAV (Rs) Dividend (Rs.)/Unit
27-Feb-15 10.00 31.88 3.0019-Feb-16 10.00 22.95 1.0023-Feb-17 10.00 35.98 3.20
ICICI Prudential Banking and Financial Services Fund - Direct Plan - Dividend
Record Date Face Value (Rs) NAV (Rs) Dividend (Rs.)/Unit27-Feb-15 10.00 37.89 1.0023-Feb-17 10.00 49.10 3.20
ICICI Prudential FMCG Fund - Dividend
Record Date Face Value (Rs) NAV (Rs) Dividend (Rs.)/Unit
26-Dec-14 10.00 70.23 6.0004-Jan-16 10.00 68.13 5.4030-Dec-16 10.00 63.69 5.00
ICICI Prudential Growth Fund- Series 1 - Dividend
Record Date Face Value (Rs) NAV (Rs) Dividend (Rs.)/Unit
29-Jul-16 10.00 11.77 0.7528-Apr-17 10.00 12.30 0.7528-Jul-17 10.00 11.98 0.75
ICICI Prudential Growth Fund- Series 1 - Direct Dividend
Record Date Face Value (Rs) NAV (Rs) Dividend (Rs.)/Unit29-Jul-16 10.00 12.17 0.7528-Apr-17 10.00 12.85 0.7528-Jul-17 10.00 12.60 0.75
ICICI Prudential Growth Fund- Series 2 - Dividend
Record Date Face Value (Rs) NAV (Rs) Dividend (Rs.)/Unit
05-Aug-16 10.00 12.38 0.7528-Apr-17 10.00 13.37 0.7528-Jul-17 10.00 13.10 0.75
ICICI Prudential R.I.G.H.T. (Rewards of investing & generation of healthy tax savings) Fund - Dividend
Record Date Face Value (Rs) NAV (Rs) Dividend (Rs.)/Unit
25-Jul-14 10.00 21.56 1.6031-Jul-15 10.00 26.37 2.1529-Jul-16 10.00 24.34 2.00
ICICI Prudential Sensex iWIN ETF
Record Date Face Value (Rs) NAV (Rs) Dividend (Rs.)/Unit
25-Jul-14 10.0000 289.0755 27.0000
ICICI Prudential Nifty iWIN ETF
Record Date Face Value (Rs) NAV (Rs) Dividend (Rs.)/Unit
29-Apr-16 10.0000 81.1747 2.2000
ICICI Prudential Growth Fund- Series 2 - Direct Dividend
Record Date Face Value (Rs) NAV (Rs) Dividend (Rs.)/Unit
05-Aug-16 10.00 12.77 0.7528-Apr-17 10.00 13.94 0.7528-Jul-17 10.00 13.73 0.75
ICICI Prudential Growth Fund- Series 3 - Dividend
Record Date Face Value (Rs) NAV (Rs) Dividend (Rs.)/Unit17-Apr-15 10.00 11.48 0.5028-Apr-17 10.00 12.75 0.7528-Jul-17 10.00 12.69 0.75
ICICI Prudential Growth Fund- Series 3 - Direct Dividend
Record Date Face Value (Rs) NAV (Rs) Dividend (Rs.)/Unit17-Apr-15 10.00 11.58 0.5028-Apr-17 10.00 13.24 0.7528-Jul-17 10.00 13.25 0.75
ICICI Prudential Growth Fund - Series 4 - Dividend
Record Date Face Value (Rs) NAV (Rs) Dividend (Rs.)/Unit
05-Aug-16 10.00 12.46 0.7528-Apr-17 10.00 13.12 0.7503-Aug-17 10.00 12.82 0.70
ICICI Prudential Growth Fund - Series 4 Direct Dividend
Record Date Face Value (Rs) NAV (Rs) Dividend (Rs.)/Unit
05-Aug-16 10.00 12.83 0.7528-Apr-17 10.00 13.66 0.7503-Aug-17 10.00 13.42 0.70
ICICI Prudential FMCG Fund - Direct Plan - Dividend
Record Date Face Value (Rs) NAV (Rs) Dividend (Rs.)/Unit30-Dec-16 10.00 83.43 4.43
ICICI Prudential Growth Fund - Series 5 Dividend
Record Date Face Value (Rs) NAV (Rs) Dividend (Rs.)/Unit
21-Apr-17 10.00 12.36 0.7528-Jul-17 10.00 12.33 0.75
128
ICICI Prudential Growth Fund - Series 5 Direct Dividend
Record Date Face Value (Rs) NAV (Rs) Dividend (Rs.)/Unit
21-Apr-17 10.00 12.80 0.7528-Jul-17 10.00 12.85 0.75
ICICI Prudential Growth Fund - Series 6 Dividend
Record Date Face Value (Rs) NAV (Rs) Dividend (Rs.)/Unit
21-Apr-17 10.00 12.05 0.7503-Aug-17 10.00 12.18 0.75
ICICI Prudential Equity Income Fund - Monthly Dividend
Record Date Face Value (Rs) NAV (Rs) Dividend (Rs.)/Unit04-Aug-17 10.00 11.37 0.0601-Sep-17 10.00 11.30 0.0604-Oct-17 10.00 11.27 0.06
ICICI Prudential Equity Income Fund - Direct Plan - Monthly Dividend
Record Date Face Value (Rs) NAV (Rs) Dividend (Rs.)/Unit17-Jun-16 10.00 10.55 0.0415-Jul-16 10.00 10.82 0.0413-Jun-17 10.00 12.00 0.06
ICICI Prudential Equity Income Fund - Direct Plan - Half Yearly Dividend
Record Date Face Value (Rs) NAV (Rs) Dividend (Rs.)/Unit
30-Jul-15 10.00 10.29 0.2420-Jun-16 10.00 10.73 0.24
ICICI Prudential Equity Income Fund - Quarterly Dividend
Record Date Face Value (Rs) NAV (Rs) Dividend (Rs.)/Unit
24-Mar-17 10.00 11.49 0.1202-Jun-17 10.00 11.57 0.1721-Sep-17 10.00 11.64 0.17
ICICI Prudential Equity Income Fund - Direct Plan - Quarterly Dividend
Record Date Face Value (Rs) NAV (Rs) Dividend (Rs.)/Unit
21-Dec-16 10.00 11.26 0.1224-Mar-17 10.00 11.64 0.1202-Jun-17 10.00 11.74 0.17
ICICI Prudential Equity Income Fund - Half Yearly Dividend
Record Date Face Value (Rs) NAV (Rs) Dividend (Rs.)/Unit
30-Jul-15 10.00 10.23 0.2120-Jun-16 10.00 10.61 0.24
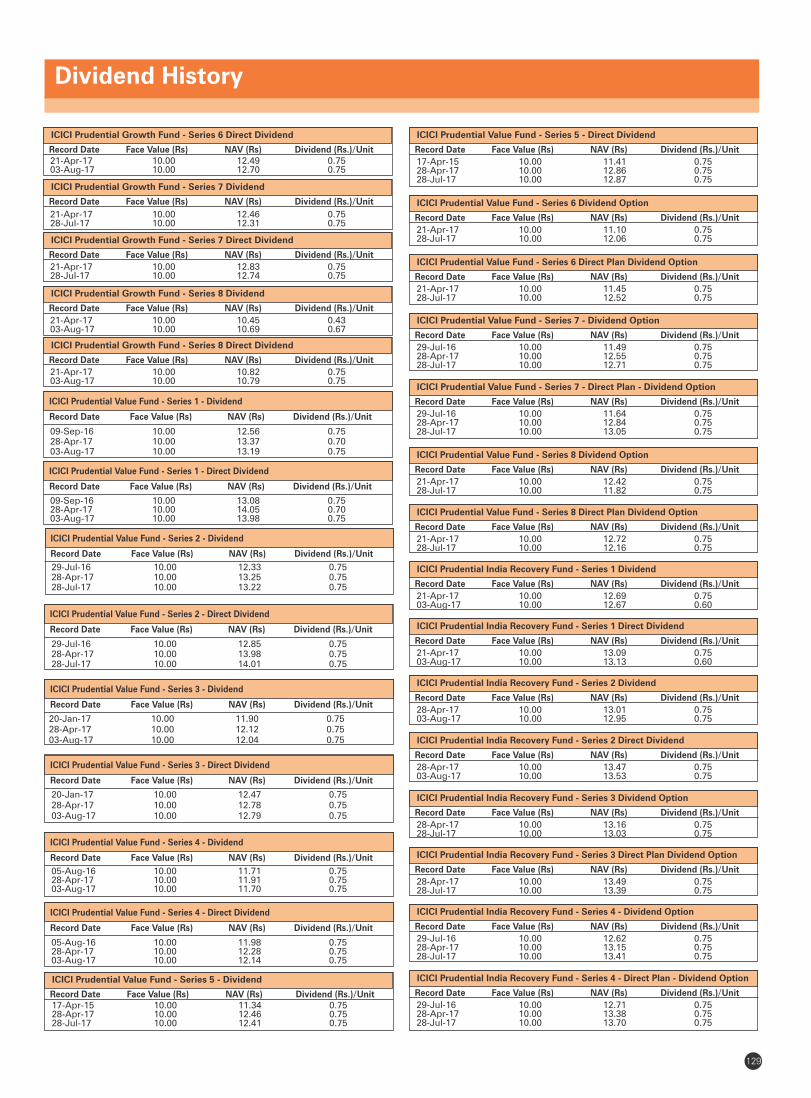
ICICI Prudential Value Fund - Series 1 - Direct Dividend
Record Date Face Value (Rs) NAV (Rs) Dividend (Rs.)/Unit
09-Sep-16 10.00 13.08 0.7528-Apr-17 10.00 14.05 0.7003-Aug-17 10.00 13.98 0.75
ICICI Prudential Value Fund - Series 1 - Dividend
Record Date Face Value (Rs) NAV (Rs) Dividend (Rs.)/Unit
09-Sep-16 10.00 12.56 0.7528-Apr-17 10.00 13.37 0.7003-Aug-17 10.00 13.19 0.75
ICICI Prudential Growth Fund - Series 6 Direct Dividend
Record Date Face Value (Rs) NAV (Rs) Dividend (Rs.)/Unit21-Apr-17 10.00 12.49 0.7503-Aug-17 10.00 12.70 0.75
ICICI Prudential Growth Fund - Series 7 Dividend
Record Date Face Value (Rs) NAV (Rs) Dividend (Rs.)/Unit
21-Apr-17 10.00 12.46 0.7528-Jul-17 10.00 12.31 0.75
ICICI Prudential Growth Fund - Series 7 Direct Dividend
Record Date Face Value (Rs) NAV (Rs) Dividend (Rs.)/Unit
21-Apr-17 10.00 12.83 0.7528-Jul-17 10.00 12.74 0.75
ICICI Prudential Growth Fund - Series 8 Dividend
Record Date Face Value (Rs) NAV (Rs) Dividend (Rs.)/Unit
21-Apr-17 10.00 10.45 0.4303-Aug-17 10.00 10.69 0.67
ICICI Prudential Growth Fund - Series 8 Direct Dividend
Record Date Face Value (Rs) NAV (Rs) Dividend (Rs.)/Unit
21-Apr-17 10.00 10.82 0.7503-Aug-17 10.00 10.79 0.75
ICICI Prudential Value Fund - Series 2 - Dividend
Record Date Face Value (Rs) NAV (Rs) Dividend (Rs.)/Unit
29-Jul-16 10.00 12.33 0.7528-Apr-17 10.00 13.25 0.7528-Jul-17 10.00 13.22 0.75
ICICI Prudential Value Fund - Series 2 - Direct Dividend
Record Date Face Value (Rs) NAV (Rs) Dividend (Rs.)/Unit
29-Jul-16 10.00 12.85 0.7528-Apr-17 10.00 13.98 0.7528-Jul-17 10.00 14.01 0.75
ICICI Prudential Value Fund - Series 3 - Dividend
Record Date Face Value (Rs) NAV (Rs) Dividend (Rs.)/Unit
20-Jan-17 10.00 11.90 0.7528-Apr-17 10.00 12.12 0.7503-Aug-17 10.00 12.04 0.75
ICICI Prudential Value Fund - Series 3 - Direct Dividend
Record Date Face Value (Rs) NAV (Rs) Dividend (Rs.)/Unit
20-Jan-17 10.00 12.47 0.7528-Apr-17 10.00 12.78 0.7503-Aug-17 10.00 12.79 0.75
ICICI Prudential Value Fund - Series 4 - Dividend
Record Date Face Value (Rs) NAV (Rs) Dividend (Rs.)/Unit
05-Aug-16 10.00 11.71 0.7528-Apr-17 10.00 11.91 0.7503-Aug-17 10.00 11.70 0.75
ICICI Prudential Value Fund - Series 4 - Direct Dividend
Record Date Face Value (Rs) NAV (Rs) Dividend (Rs.)/Unit
05-Aug-16 10.00 11.98 0.7528-Apr-17 10.00 12.28 0.7503-Aug-17 10.00 12.14 0.75
ICICI Prudential Value Fund - Series 5 - Dividend
Record Date Face Value (Rs) NAV (Rs) Dividend (Rs.)/Unit17-Apr-15 10.00 11.34 0.7528-Apr-17 10.00 12.46 0.7528-Jul-17 10.00 12.41 0.75
ICICI Prudential Value Fund - Series 5 - Direct Dividend
Record Date Face Value (Rs) NAV (Rs) Dividend (Rs.)/Unit
17-Apr-15 10.00 11.41 0.7528-Apr-17 10.00 12.86 0.7528-Jul-17 10.00 12.87 0.75
ICICI Prudential Value Fund - Series 6 Direct Plan Dividend Option
Record Date Face Value (Rs) NAV (Rs) Dividend (Rs.)/Unit
21-Apr-17 10.00 11.45 0.7528-Jul-17 10.00 12.52 0.75
ICICI Prudential Value Fund - Series 6 Dividend Option
Record Date Face Value (Rs) NAV (Rs) Dividend (Rs.)/Unit
21-Apr-17 10.00 11.10 0.7528-Jul-17 10.00 12.06 0.75
ICICI Prudential Value Fund - Series 7 - Dividend Option
Record Date Face Value (Rs) NAV (Rs) Dividend (Rs.)/Unit
29-Jul-16 10.00 11.49 0.7528-Apr-17 10.00 12.55 0.7528-Jul-17 10.00 12.71 0.75
ICICI Prudential Value Fund - Series 7 - Direct Plan - Dividend Option
Record Date Face Value (Rs) NAV (Rs) Dividend (Rs.)/Unit
29-Jul-16 10.00 11.64 0.7528-Apr-17 10.00 12.84 0.7528-Jul-17 10.00 13.05 0.75
ICICI Prudential India Recovery Fund - Series 1 Dividend
Record Date Face Value (Rs) NAV (Rs) Dividend (Rs.)/Unit
21-Apr-17 10.00 12.69 0.7503-Aug-17 10.00 12.67 0.60
ICICI Prudential Value Fund - Series 8 Direct Plan Dividend Option
Record Date Face Value (Rs) NAV (Rs) Dividend (Rs.)/Unit
21-Apr-17 10.00 12.72 0.7528-Jul-17 10.00 12.16 0.75
ICICI Prudential Value Fund - Series 8 Dividend Option
Record Date Face Value (Rs) NAV (Rs) Dividend (Rs.)/Unit
21-Apr-17 10.00 12.42 0.7528-Jul-17 10.00 11.82 0.75
ICICI Prudential India Recovery Fund - Series 1 Direct Dividend
Record Date Face Value (Rs) NAV (Rs) Dividend (Rs.)/Unit
21-Apr-17 10.00 13.09 0.7503-Aug-17 10.00 13.13 0.60
ICICI Prudential India Recovery Fund - Series 2 Dividend
Record Date Face Value (Rs) NAV (Rs) Dividend (Rs.)/Unit
28-Apr-17 10.00 13.01 0.7503-Aug-17 10.00 12.95 0.75
ICICI Prudential India Recovery Fund - Series 4 - Dividend Option
Record Date Face Value (Rs) NAV (Rs) Dividend (Rs.)/Unit
29-Jul-16 10.00 12.62 0.7528-Apr-17 10.00 13.15 0.7528-Jul-17 10.00 13.41 0.75
ICICI Prudential India Recovery Fund - Series 2 Direct Dividend
Record Date Face Value (Rs) NAV (Rs) Dividend (Rs.)/Unit
28-Apr-17 10.00 13.47 0.7503-Aug-17 10.00 13.53 0.75
ICICI Prudential India Recovery Fund - Series 3 Direct Plan Dividend Option
Record Date Face Value (Rs) NAV (Rs) Dividend (Rs.)/Unit
28-Apr-17 10.00 13.49 0.7528-Jul-17 10.00 13.39 0.75
ICICI Prudential India Recovery Fund - Series 3 Dividend Option
Record Date Face Value (Rs) NAV (Rs) Dividend (Rs.)/Unit
28-Apr-17 10.00 13.16 0.7528-Jul-17 10.00 13.03 0.75
ICICI Prudential India Recovery Fund - Series 4 - Direct Plan - Dividend Option
Record Date Face Value (Rs) NAV (Rs) Dividend (Rs.)/Unit
29-Jul-16 10.00 12.71 0.7528-Apr-17 10.00 13.38 0.7528-Jul-17 10.00 13.70 0.75
Dividend History
129
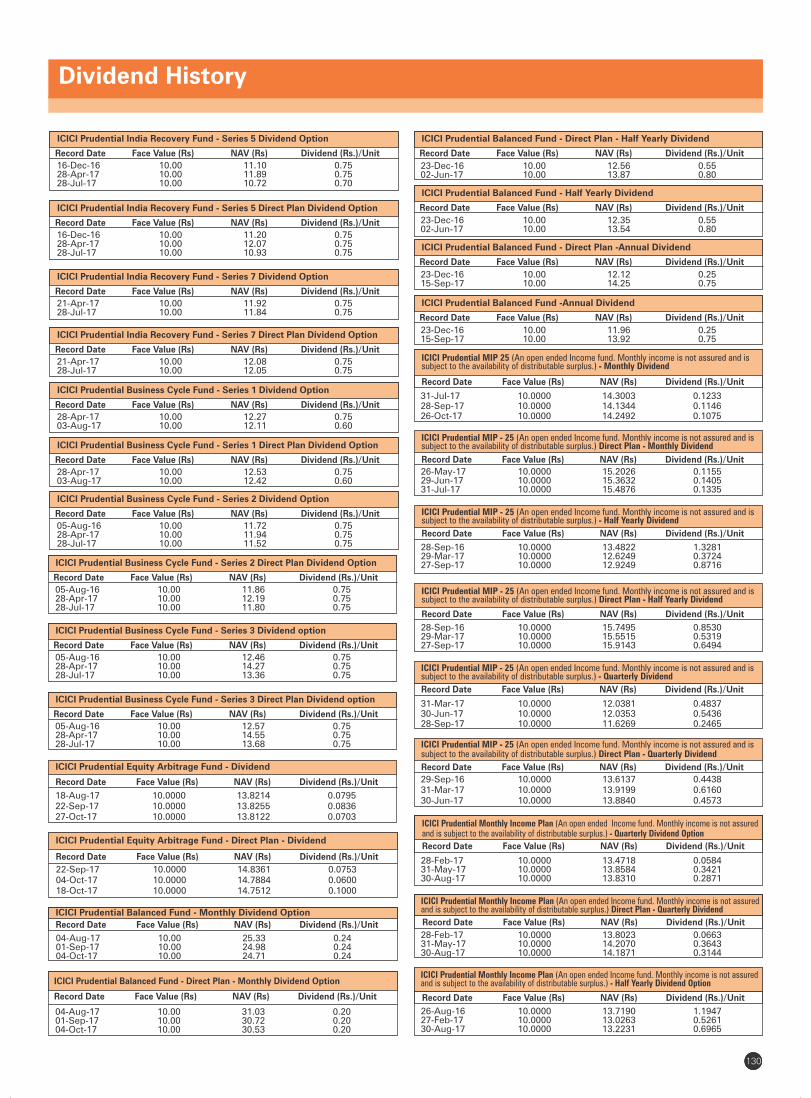
Dividend History
6979130
ICICI Prudential Equity Arbitrage Fund - Direct Plan - Dividend
Record Date Face Value (Rs) NAV (Rs) Dividend (Rs.)/Unit
22-Sep-17 10.0000 14.8361 0.075304-Oct-17 10.0000 14.7884 0.060018-Oct-17 10.0000 14.7512 0.1000
ICICI Prudential Equity Arbitrage Fund - Dividend
Record Date Face Value (Rs) NAV (Rs) Dividend (Rs.)/Unit
18-Aug-17 10.0000 13.8214 0.079522-Sep-17 10.0000 13.8255 0.083627-Oct-17 10.0000 13.8122 0.0703
ICICI Prudential Business Cycle Fund - Series 2 Direct Plan Dividend Option
Record Date Face Value (Rs) NAV (Rs) Dividend (Rs.)/Unit
05-Aug-16 10.00 11.86 0.7528-Apr-17 10.00 12.19 0.7528-Jul-17 10.00 11.80 0.75
ICICI Prudential Business Cycle Fund - Series 2 Dividend Option
Record Date Face Value (Rs) NAV (Rs) Dividend (Rs.)/Unit
05-Aug-16 10.00 11.72 0.7528-Apr-17 10.00 11.94 0.7528-Jul-17 10.00 11.52 0.75
ICICI Prudential Business Cycle Fund - Series 3 Direct Plan Dividend option
Record Date Face Value (Rs) NAV (Rs) Dividend (Rs.)/Unit
05-Aug-16 10.00 12.57 0.7528-Apr-17 10.00 14.55 0.7528-Jul-17 10.00 13.68 0.75
ICICI Prudential Business Cycle Fund - Series 3 Dividend option
Record Date Face Value (Rs) NAV (Rs) Dividend (Rs.)/Unit
05-Aug-16 10.00 12.46 0.7528-Apr-17 10.00 14.27 0.7528-Jul-17 10.00 13.36 0.75
ICICI Prudential Business Cycle Fund - Series 1 Direct Plan Dividend Option
Record Date Face Value (Rs) NAV (Rs) Dividend (Rs.)/Unit
28-Apr-17 10.00 12.53 0.7503-Aug-17 10.00 12.42 0.60
ICICI Prudential Business Cycle Fund - Series 1 Dividend Option
Record Date Face Value (Rs) NAV (Rs) Dividend (Rs.)/Unit
28-Apr-17 10.00 12.27 0.7503-Aug-17 10.00 12.11 0.60
ICICI Prudential India Recovery Fund - Series 7 Direct Plan Dividend Option
Record Date Face Value (Rs) NAV (Rs) Dividend (Rs.)/Unit
21-Apr-17 10.00 12.08 0.7528-Jul-17 10.00 12.05 0.75
ICICI Prudential India Recovery Fund - Series 7 Dividend Option
Record Date Face Value (Rs) NAV (Rs) Dividend (Rs.)/Unit
21-Apr-17 10.00 11.92 0.7528-Jul-17 10.00 11.84 0.75
ICICI Prudential Balanced Fund - Monthly Dividend Option
Record Date Face Value (Rs) NAV (Rs) Dividend (Rs.)/Unit
04-Aug-17 10.00 25.33 0.2401-Sep-17 10.00 24.98 0.2404-Oct-17 10.00 24.71 0.24
ICICI Prudential Balanced Fund - Direct Plan - Monthly Dividend Option
Record Date Face Value (Rs) NAV (Rs) Dividend (Rs.)/Unit
04-Aug-17 10.00 31.03 0.2001-Sep-17 10.00 30.72 0.2004-Oct-17 10.00 30.53 0.20
ICICI Prudential Balanced Fund - Direct Plan - Half Yearly Dividend
Record Date Face Value (Rs) NAV (Rs) Dividend (Rs.)/Unit
23-Dec-16 10.00 12.56 0.5502-Jun-17 10.00 13.87 0.80
ICICI Prudential Balanced Fund - Half Yearly Dividend
Record Date Face Value (Rs) NAV (Rs) Dividend (Rs.)/Unit
23-Dec-16 10.00 12.35 0.5502-Jun-17 10.00 13.54 0.80
ICICI Prudential Balanced Fund - Direct Plan -Annual Dividend
Record Date Face Value (Rs) NAV (Rs) Dividend (Rs.)/Unit
23-Dec-16 10.00 12.12 0.2515-Sep-17 10.00 14.25 0.75
ICICI Prudential Balanced Fund -Annual Dividend
Record Date Face Value (Rs) NAV (Rs) Dividend (Rs.)/Unit
23-Dec-16 10.00 11.96 0.2515-Sep-17 10.00 13.92 0.75
ICICI Prudential MIP - 25 (An open ended Income fund. Monthly income is not assured and is subject to the availability of distributable surplus.) Direct Plan - Monthly Dividend
Record Date Face Value (Rs) NAV (Rs) Dividend (Rs.)/Unit
26-May-17 10.0000 15.2026 0.115529-Jun-17 10.0000 15.3632 0.140531-Jul-17 10.0000 15.4876 0.1335
ICICI Prudential MIP - 25 (An open ended Income fund. Monthly income is not assured and is subject to the availability of distributable surplus.) - Half Yearly Dividend
Record Date Face Value (Rs) NAV (Rs) Dividend (Rs.)/Unit
28-Sep-16 10.0000 13.4822 1.328129-Mar-17 10.0000 12.6249 0.372427-Sep-17 10.0000 12.9249 0.8716
ICICI Prudential MIP 25 (An open ended Income fund. Monthly income is not assured and issubject to the availability of distributable surplus.) - Monthly Dividend
Record Date Face Value (Rs) NAV (Rs) Dividend (Rs.)/Unit
31-Jul-17 10.0000 14.3003 0.123328-Sep-17 10.0000 14.1344 0.114626-Oct-17 10.0000 14.2492 0.1075
ICICI Prudential MIP - 25 (An open ended Income fund. Monthly income is not assured and is subject to the availability of distributable surplus.) Direct Plan - Half Yearly Dividend
Record Date Face Value (Rs) NAV (Rs) Dividend (Rs.)/Unit
28-Sep-16 10.0000 15.7495 0.853029-Mar-17 10.0000 15.5515 0.531927-Sep-17 10.0000 15.9143 0.6494
ICICI Prudential MIP - 25 (An open ended Income fund. Monthly income is not assured and is subject to the availability of distributable surplus.) - Quarterly Dividend
Record Date Face Value (Rs) NAV (Rs) Dividend (Rs.)/Unit
31-Mar-17 10.0000 12.0381 0.483730-Jun-17 10.0000 12.0353 0.543628-Sep-17 10.0000 11.6269 0.2465
ICICI Prudential MIP - 25 (An open ended Income fund. Monthly income is not assured and is subject to the availability of distributable surplus.) Direct Plan - Quarterly Dividend
Record Date Face Value (Rs) NAV (Rs) Dividend (Rs.)/Unit
29-Sep-16 10.0000 13.6137 0.443831-Mar-17 10.0000 13.9199 0.616030-Jun-17 10.0000 13.8840 0.4573
ICICI Prudential Monthly Income Plan (An open ended Income fund. Monthly income is not assured and is subject to the availability of distributable surplus.) - Quarterly Dividend Option
Record Date Face Value (Rs) NAV (Rs) Dividend (Rs.)/Unit
28-Feb-17 10.0000 13.4718 0.058431-May-17 10.0000 13.8584 0.342130-Aug-17 10.0000 13.8310 0.2871
ICICI Prudential Monthly Income Plan (An open ended Income fund. Monthly income is not assured and is subject to the availability of distributable surplus.) Direct Plan - Quarterly Dividend
Record Date Face Value (Rs) NAV (Rs) Dividend (Rs.)/Unit
28-Feb-17 10.0000 13.8023 0.066331-May-17 10.0000 14.2070 0.364330-Aug-17 10.0000 14.1871 0.3144
ICICI Prudential Monthly Income Plan (An open ended Income fund. Monthly income is not assured and is subject to the availability of distributable surplus.) - Half Yearly Dividend Option
Record Date Face Value (Rs) NAV (Rs) Dividend (Rs.)/Unit
26-Aug-16 10.0000 13.7190 1.194727-Feb-17 10.0000 13.0263 0.526130-Aug-17 10.0000 13.2231 0.6965
ICICI Prudential India Recovery Fund - Series 5 Direct Plan Dividend Option
Record Date Face Value (Rs) NAV (Rs) Dividend (Rs.)/Unit
16-Dec-16 10.00 11.20 0.7528-Apr-17 10.00 12.07 0.7528-Jul-17 10.00 10.93 0.75
ICICI Prudential India Recovery Fund - Series 5 Dividend Option
Record Date Face Value (Rs) NAV (Rs) Dividend (Rs.)/Unit
16-Dec-16 10.00 11.10 0.7528-Apr-17 10.00 11.89 0.7528-Jul-17 10.00 10.72 0.70
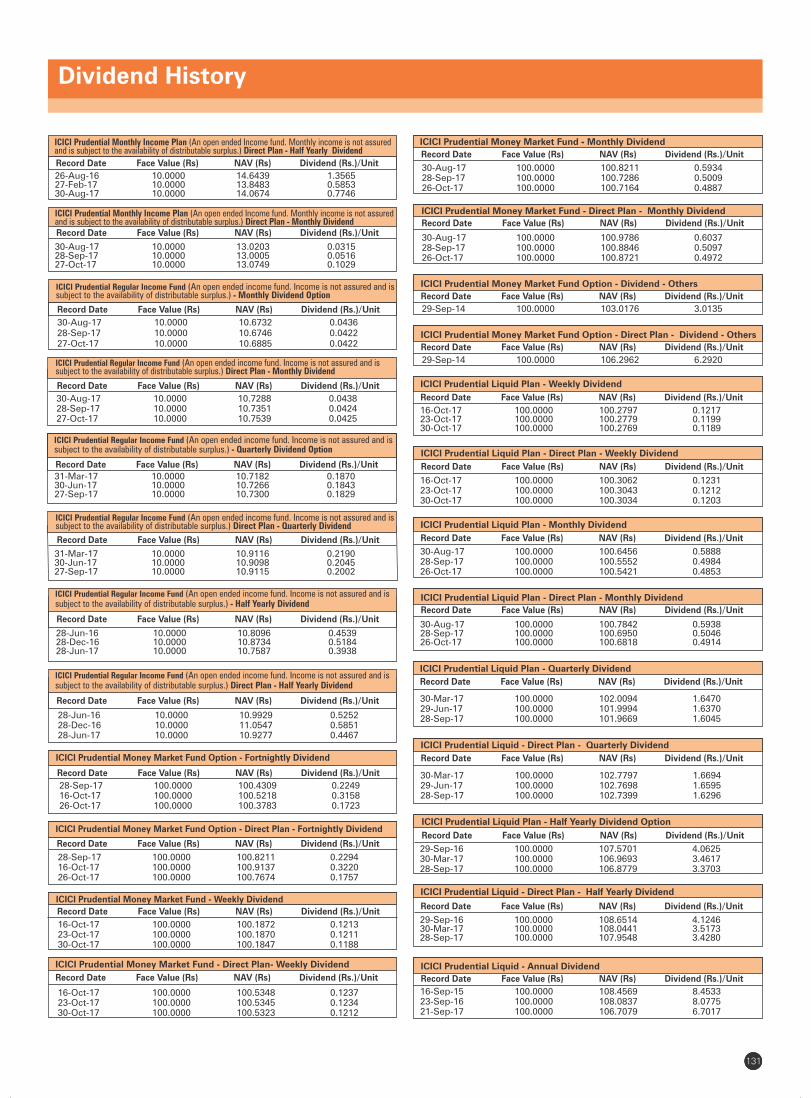
Dividend History
6979131
ICICI Prudential Liquid Plan - Weekly Dividend
Record Date Face Value (Rs) NAV (Rs) Dividend (Rs.)/Unit
16-Oct-17 100.0000 100.2797 0.121723-Oct-17 100.0000 100.2779 0.119930-Oct-17 100.0000 100.2769 0.1189
ICICI Prudential Liquid Plan - Direct Plan - Weekly Dividend
Record Date Face Value (Rs) NAV (Rs) Dividend (Rs.)/Unit
16-Oct-17 100.0000 100.3062 0.123123-Oct-17 100.0000 100.3043 0.121230-Oct-17 100.0000 100.3034 0.1203
ICICI Prudential Liquid Plan - Monthly Dividend
Record Date Face Value (Rs) NAV (Rs) Dividend (Rs.)/Unit
30-Aug-17 100.0000 100.6456 0.588828-Sep-17 100.0000 100.5552 0.498426-Oct-17 100.0000 100.5421 0.4853
ICICI Prudential Liquid Plan - Direct Plan - Monthly Dividend
Record Date Face Value (Rs) NAV (Rs) Dividend (Rs.)/Unit
30-Aug-17 100.0000 100.7842 0.593828-Sep-17 100.0000 100.6950 0.504626-Oct-17 100.0000 100.6818 0.4914
ICICI Prudential Liquid Plan - Quarterly Dividend
Record Date Face Value (Rs) NAV (Rs) Dividend (Rs.)/Unit
30-Mar-17 100.0000 102.0094 1.647029-Jun-17 100.0000 101.9994 1.637028-Sep-17 100.0000 101.9669 1.6045
ICICI Prudential Liquid - Direct Plan - Quarterly Dividend
Record Date Face Value (Rs) NAV (Rs) Dividend (Rs.)/Unit
30-Mar-17 100.0000 102.7797 1.669429-Jun-17 100.0000 102.7698 1.659528-Sep-17 100.0000 102.7399 1.6296
ICICI Prudential Liquid Plan - Half Yearly Dividend Option
Record Date Face Value (Rs) NAV (Rs) Dividend (Rs.)/Unit
29-Sep-16 100.0000 107.5701 4.062530-Mar-17 100.0000 106.9693 3.461728-Sep-17 100.0000 106.8779 3.3703
ICICI Prudential Liquid - Direct Plan - Half Yearly Dividend
Record Date Face Value (Rs) NAV (Rs) Dividend (Rs.)/Unit
29-Sep-16 100.0000 108.6514 4.124630-Mar-17 100.0000 108.0441 3.517328-Sep-17 100.0000 107.9548 3.4280
ICICI Prudential Liquid - Annual Dividend
Record Date Face Value (Rs) NAV (Rs) Dividend (Rs.)/Unit
16-Sep-15 100.0000 108.4569 8.453323-Sep-16 100.0000 108.0837 8.077521-Sep-17 100.0000 106.7079 6.7017
ICICI Prudential Regular Income Fund (An open ended income fund. Income is not assured and is subject to the availability of distributable surplus.) Direct Plan - Monthly Dividend
Record Date Face Value (Rs) NAV (Rs) Dividend (Rs.)/Unit
30-Aug-17 10.0000 10.7288 0.043828-Sep-17 10.0000 10.7351 0.042427-Oct-17 10.0000 10.7539 0.0425
ICICI Prudential Regular Income Fund (An open ended income fund. Income is not assured and is subject to the availability of distributable surplus.) - Quarterly Dividend Option
Record Date Face Value (Rs) NAV (Rs) Dividend (Rs.)/Unit
31-Mar-17 10.0000 10.7182 0.187030-Jun-17 10.0000 10.7266 0.184327-Sep-17 10.0000 10.7300 0.1829
ICICI Prudential Regular Income Fund (An open ended income fund. Income is not assured and is subject to the availability of distributable surplus.) Direct Plan - Quarterly Dividend
Record Date Face Value (Rs) NAV (Rs) Dividend (Rs.)/Unit
31-Mar-17 10.0000 10.9116 0.219030-Jun-17 10.0000 10.9098 0.204527-Sep-17 10.0000 10.9115 0.2002
Record Date Face Value (Rs) NAV (Rs) Dividend (Rs.)/Unit
ICICI Prudential Monthly Income Plan (An open ended Income fund. Monthly income is not assured and is subject to the availability of distributable surplus.) Direct Plan - Half Yearly Dividend
26-Aug-16 10.0000 14.6439 1.356527-Feb-17 10.0000 13.8483 0.585330-Aug-17 10.0000 14.0674 0.7746
Record Date Face Value (Rs) NAV (Rs) Dividend (Rs.)/Unit
ICICI Prudential Monthly Income Plan (An open ended Income fund. Monthly income is not assured and is subject to the availability of distributable surplus.) Direct Plan - Monthly Dividend
30-Aug-17 10.0000 13.0203 0.031528-Sep-17 10.0000 13.0005 0.051627-Oct-17 10.0000 13.0749 0.1029
ICICI Prudential Regular Income Fund (An open ended income fund. Income is not assured and is subject to the availability of distributable surplus.) - Monthly Dividend Option
Record Date Face Value (Rs) NAV (Rs) Dividend (Rs.)/Unit
30-Aug-17 10.0000 10.6732 0.043628-Sep-17 10.0000 10.6746 0.042227-Oct-17 10.0000 10.6885 0.0422
Record Date Face Value (Rs) NAV (Rs) Dividend (Rs.)/Unit
ICICI Prudential Money Market Fund - Weekly Dividend
16-Oct-17 100.0000 100.1872 0.121323-Oct-17 100.0000 100.1870 0.121130-Oct-17 100.0000 100.1847 0.1188
ICICI Prudential Money Market Fund - Direct Plan- Weekly Dividend
Record Date Face Value (Rs) NAV (Rs) Dividend (Rs.)/Unit
16-Oct-17 100.0000 100.5348 0.123723-Oct-17 100.0000 100.5345 0.123430-Oct-17 100.0000 100.5323 0.1212
ICICI Prudential Money Market Fund Option - Direct Plan - Dividend - Others
Record Date Face Value (Rs) NAV (Rs) Dividend (Rs.)/Unit
29-Sep-14 100.0000 106.2962 6.2920
ICICI Prudential Money Market Fund Option - Dividend - Others
Record Date Face Value (Rs) NAV (Rs) Dividend (Rs.)/Unit
29-Sep-14 100.0000 103.0176 3.0135
ICICI Prudential Money Market Fund - Monthly Dividend -
Record Date Face Value (Rs) NAV (Rs) Dividend (Rs.)/Unit
30-Aug-17 100.0000 100.8211 0.593428-Sep-17 100.0000 100.7286 0.500926-Oct-17 100.0000 100.7164 0.4887
ICICI Prudential Money Market Fund - Direct Plan - Monthly Dividend
Record Date Face Value (Rs) NAV (Rs) Dividend (Rs.)/Unit
30-Aug-17 100.0000 100.9786 0.603728-Sep-17 100.0000 100.8846 0.509726-Oct-17 100.0000 100.8721 0.4972
Record Date Face Value (Rs) NAV (Rs) Dividend (Rs.)/Unit
ICICI Prudential Money Market Fund Option - Fortnightly Dividend
28-Sep-17 100.0000 100.4309 0.224916-Oct-17 100.0000 100.5218 0.315826-Oct-17 100.0000 100.3783 0.1723
Record Date Face Value (Rs) NAV (Rs) Dividend (Rs.)/Unit
ICICI Prudential Money Market Fund Option - Direct Plan - Fortnightly Dividend
28-Sep-17 100.0000 100.8211 0.229416-Oct-17 100.0000 100.9137 0.322026-Oct-17 100.0000 100.7674 0.1757
Record Date Face Value (Rs) NAV (Rs) Dividend (Rs.)/Unit
ICICI Prudential Regular Income Fund (An open ended income fund. Income is not assured and is subject to the availability of distributable surplus.) - Half Yearly Dividend
28-Jun-16 10.0000 10.8096 0.453928-Dec-16 10.0000 10.8734 0.518428-Jun-17 10.0000 10.7587 0.3938
Record Date Face Value (Rs) NAV (Rs) Dividend (Rs.)/Unit
ICICI Prudential Regular Income Fund (An open ended income fund. Income is not assured and is subject to the availability of distributable surplus.) Direct Plan - Half Yearly Dividend
28-Jun-16 10.0000 10.9929 0.525228-Dec-16 10.0000 11.0547 0.585128-Jun-17 10.0000 10.9277 0.4467
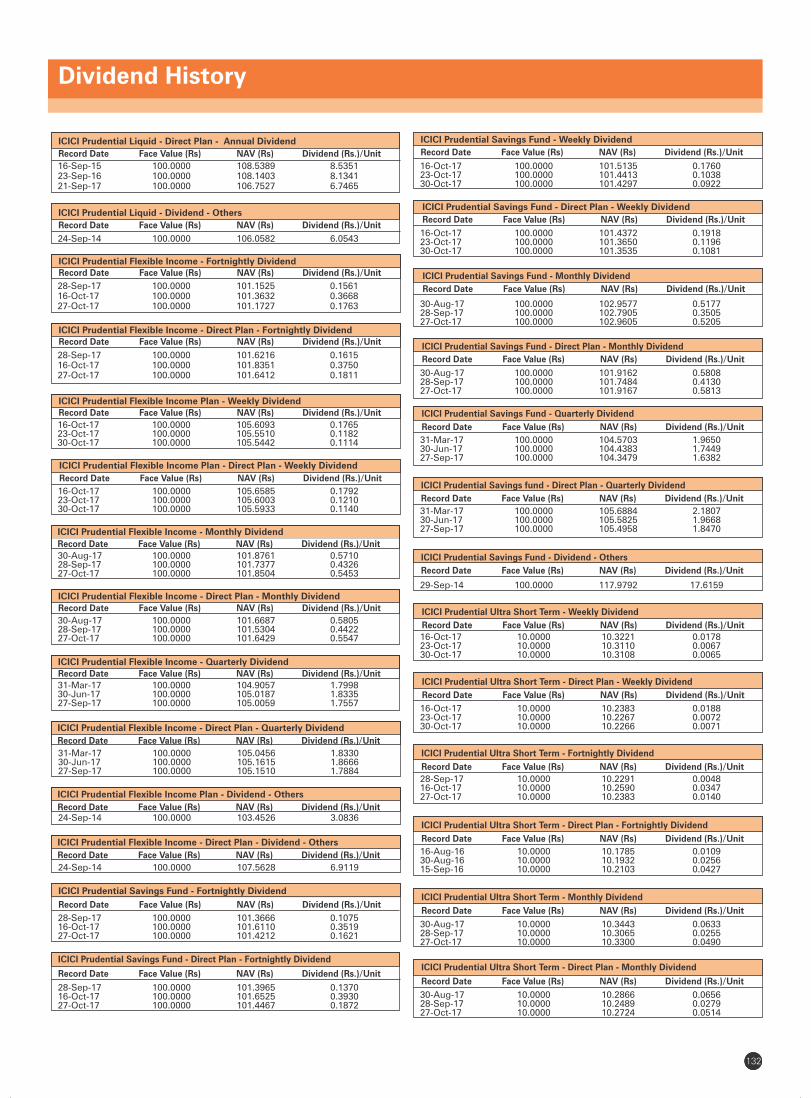
ICICI Prudential Liquid - Dividend - Others
Record Date Face Value (Rs) NAV (Rs) Dividend (Rs.)/Unit
24-Sep-14 100.0000 106.0582 6.0543
ICICI Prudential Flexible Income - Fortnightly DividendRecord Date Face Value (Rs) NAV (Rs) Dividend (Rs.)/Unit
28-Sep-17 100.0000 101.1525 0.156116-Oct-17 100.0000 101.3632 0.366827-Oct-17 100.0000 101.1727 0.1763
ICICI Prudential Flexible Income - Direct Plan - Fortnightly DividendRecord Date Face Value (Rs) NAV (Rs) Dividend (Rs.)/Unit
28-Sep-17 100.0000 101.6216 0.161516-Oct-17 100.0000 101.8351 0.375027-Oct-17 100.0000 101.6412 0.1811
ICICI Prudential Liquid - Direct Plan - Annual Dividend
Record Date Face Value (Rs) NAV (Rs) Dividend (Rs.)/Unit
16-Sep-15 100.0000 108.5389 8.535123-Sep-16 100.0000 108.1403 8.134121-Sep-17 100.0000 106.7527 6.7465
Dividend History
6979132
ICICI Prudential Flexible Income Plan - Dividend - Others
Record Date Face Value (Rs) NAV (Rs) Dividend (Rs.)/Unit24-Sep-14 100.0000 103.4526 3.0836
ICICI Prudential Flexible Income - Direct Plan - Dividend - Others
Record Date Face Value (Rs) NAV (Rs) Dividend (Rs.)/Unit
24-Sep-14 100.0000 107.5628 6.9119
ICICI Prudential Flexible Income Plan - Direct Plan - Weekly Dividend
Record Date Face Value (Rs) NAV (Rs) Dividend (Rs.)/Unit
16-Oct-17 100.0000 105.6585 0.179223-Oct-17 100.0000 105.6003 0.121030-Oct-17 100.0000 105.5933 0.1140
ICICI Prudential Flexible Income - Monthly Dividend
Record Date Face Value (Rs) NAV (Rs) Dividend (Rs.)/Unit
30-Aug-17 100.0000 101.8761 0.571028-Sep-17 100.0000 101.7377 0.432627-Oct-17 100.0000 101.8504 0.5453
ICICI Prudential Flexible Income - Direct Plan - Monthly Dividend
Record Date Face Value (Rs) NAV (Rs) Dividend (Rs.)/Unit
30-Aug-17 100.0000 101.6687 0.580528-Sep-17 100.0000 101.5304 0.442227-Oct-17 100.0000 101.6429 0.5547
ICICI Prudential Flexible Income - Quarterly Dividend
Record Date Face Value (Rs) NAV (Rs) Dividend (Rs.)/Unit
31-Mar-17 100.0000 104.9057 1.799830-Jun-17 100.0000 105.0187 1.833527-Sep-17 100.0000 105.0059 1.7557
ICICI Prudential Flexible Income - Direct Plan - Quarterly Dividend
Record Date Face Value (Rs) NAV (Rs) Dividend (Rs.)/Unit
31-Mar-17 100.0000 105.0456 1.833030-Jun-17 100.0000 105.1615 1.866627-Sep-17 100.0000 105.1510 1.7884
ICICI Prudential Flexible Income Plan - Weekly DividendRecord Date Face Value (Rs) NAV (Rs) Dividend (Rs.)/Unit
16-Oct-17 100.0000 105.6093 0.176523-Oct-17 100.0000 105.5510 0.118230-Oct-17 100.0000 105.5442 0.1114
ICICI Prudential Savings Fund - Fortnightly Dividend
Record Date Face Value (Rs) NAV (Rs) Dividend (Rs.)/Unit
28-Sep-17 100.0000 101.3666 0.107516-Oct-17 100.0000 101.6110 0.351927-Oct-17 100.0000 101.4212 0.1621
ICICI Prudential Savings Fund - Direct Plan - Fortnightly Dividend
Record Date Face Value (Rs) NAV (Rs) Dividend (Rs.)/Unit
28-Sep-17 100.0000 101.3965 0.137016-Oct-17 100.0000 101.6525 0.393027-Oct-17 100.0000 101.4467 0.1872
ICICI Prudential Savings Fund - Weekly Dividend
Record Date Face Value (Rs) NAV (Rs) Dividend (Rs.)/Unit
16-Oct-17 100.0000 101.5135 0.176023-Oct-17 100.0000 101.4413 0.103830-Oct-17 100.0000 101.4297 0.0922
ICICI Prudential Savings Fund - Direct Plan - Weekly Dividend
Record Date Face Value (Rs) NAV (Rs) Dividend (Rs.)/Unit
16-Oct-17 100.0000 101.4372 0.191823-Oct-17 100.0000 101.3650 0.119630-Oct-17 100.0000 101.3535 0.1081
ICICI Prudential Savings Fund - Monthly Dividend
Record Date Face Value (Rs) NAV (Rs) Dividend (Rs.)/Unit
30-Aug-17 100.0000 102.9577 0.517728-Sep-17 100.0000 102.7905 0.350527-Oct-17 100.0000 102.9605 0.5205
ICICI Prudential Savings Fund - Direct Plan - Monthly Dividend
Record Date Face Value (Rs) NAV (Rs) Dividend (Rs.)/Unit
30-Aug-17 100.0000 101.9162 0.580828-Sep-17 100.0000 101.7484 0.413027-Oct-17 100.0000 101.9167 0.5813
ICICI Prudential Savings Fund - Quarterly Dividend
Record Date Face Value (Rs) NAV (Rs) Dividend (Rs.)/Unit
31-Mar-17 100.0000 104.5703 1.965030-Jun-17 100.0000 104.4383 1.744927-Sep-17 100.0000 104.3479 1.6382
ICICI Prudential Savings fund - Direct Plan - Quarterly Dividend
Record Date Face Value (Rs) NAV (Rs) Dividend (Rs.)/Unit
31-Mar-17 100.0000 105.6884 2.180730-Jun-17 100.0000 105.5825 1.966827-Sep-17 100.0000 105.4958 1.8470
ICICI Prudential Savings Fund - Dividend - Others
Record Date Face Value (Rs) NAV (Rs) Dividend (Rs.)/Unit
29-Sep-14 100.0000 117.9792 17.6159
ICICI Prudential Ultra Short Term - Weekly Dividend
Record Date Face Value (Rs) NAV (Rs) Dividend (Rs.)/Unit
16-Oct-17 10.0000 10.3221 0.017823-Oct-17 10.0000 10.3110 0.006730-Oct-17 10.0000 10.3108 0.0065
ICICI Prudential Ultra Short Term - Direct Plan - Weekly Dividend
Record Date Face Value (Rs) NAV (Rs) Dividend (Rs.)/Unit
16-Oct-17 10.0000 10.2383 0.018823-Oct-17 10.0000 10.2267 0.007230-Oct-17 10.0000 10.2266 0.0071
ICICI Prudential Ultra Short Term - Fortnightly Dividend
Record Date Face Value (Rs) NAV (Rs) Dividend (Rs.)/Unit
28-Sep-17 10.0000 10.2291 0.004816-Oct-17 10.0000 10.2590 0.034727-Oct-17 10.0000 10.2383 0.0140
ICICI Prudential Ultra Short Term - Direct Plan - Fortnightly Dividend
Record Date Face Value (Rs) NAV (Rs) Dividend (Rs.)/Unit
16-Aug-16 10.0000 10.1785 0.010930-Aug-16 10.0000 10.1932 0.025615-Sep-16 10.0000 10.2103 0.0427
ICICI Prudential Ultra Short Term - Monthly Dividend
Record Date Face Value (Rs) NAV (Rs) Dividend (Rs.)/Unit
30-Aug-17 10.0000 10.3443 0.063328-Sep-17 10.0000 10.3065 0.025527-Oct-17 10.0000 10.3300 0.0490
ICICI Prudential Ultra Short Term - Direct Plan - Monthly Dividend
Record Date Face Value (Rs) NAV (Rs) Dividend (Rs.)/Unit
30-Aug-17 10.0000 10.2866 0.065628-Sep-17 10.0000 10.2489 0.027927-Oct-17 10.0000 10.2724 0.0514
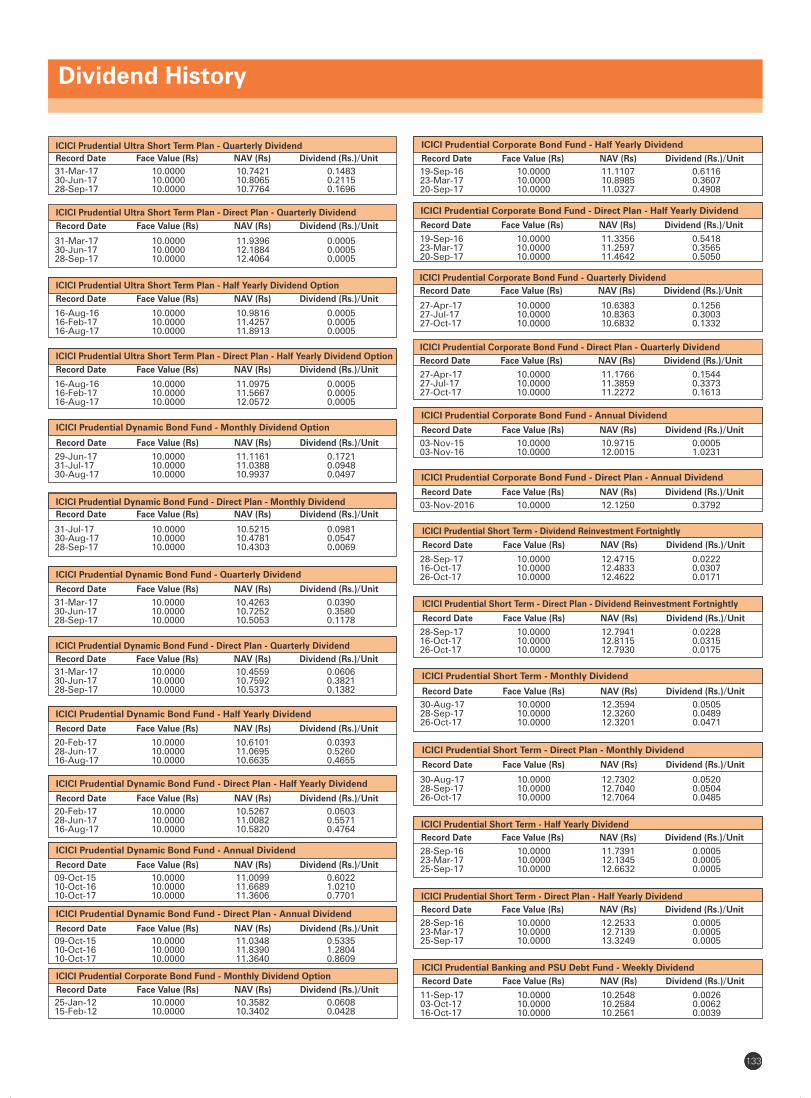
Dividend History
ICICI Prudential Banking and PSU Debt Fund - Weekly Dividend
Record Date Face Value (Rs) NAV (Rs) Dividend (Rs.)/Unit
11-Sep-17 10.0000 10.2548 0.002603-Oct-17 10.0000 10.2584 0.006216-Oct-17 10.0000 10.2561 0.0039
ICICI Prudential Short Term - Direct Plan - Dividend Reinvestment Fortnightly
Record Date Face Value (Rs) NAV (Rs) Dividend (Rs.)/Unit
28-Sep-17 10.0000 12.7941 0.022816-Oct-17 10.0000 12.8115 0.031526-Oct-17 10.0000 12.7930 0.0175
ICICI Prudential Short Term - Monthly Dividend
Record Date Face Value (Rs) NAV (Rs) Dividend (Rs.)/Unit
30-Aug-17 10.0000 12.3594 0.050528-Sep-17 10.0000 12.3260 0.048926-Oct-17 10.0000 12.3201 0.0471
ICICI Prudential Short Term - Direct Plan - Monthly Dividend
Record Date Face Value (Rs) NAV (Rs) Dividend (Rs.)/Unit
30-Aug-17 10.0000 12.7302 0.052028-Sep-17 10.0000 12.7040 0.050426-Oct-17 10.0000 12.7064 0.0485
ICICI Prudential Short Term - Half Yearly Dividend
Record Date Face Value (Rs) NAV (Rs) Dividend (Rs.)/Unit
28-Sep-16 10.0000 11.7391 0.000523-Mar-17 10.0000 12.1345 0.000525-Sep-17 10.0000 12.6632 0.0005
ICICI Prudential Short Term - Direct Plan - Half Yearly Dividend
Record Date Face Value (Rs) NAV (Rs) Dividend (Rs.)/Unit
28-Sep-16 10.0000 12.2533 0.000523-Mar-17 10.0000 12.7139 0.000525-Sep-17 10.0000 13.3249 0.0005
ICICI Prudential Short Term - Dividend Reinvestment Fortnightly
Record Date Face Value (Rs) NAV (Rs) Dividend (Rs.)/Unit
28-Sep-17 10.0000 12.4715 0.022216-Oct-17 10.0000 12.4833 0.030726-Oct-17 10.0000 12.4622 0.0171
ICICI Prudential Corporate Bond Fund - Direct Plan - Annual Dividend
Record Date Face Value (Rs) NAV (Rs) Dividend (Rs.)/Unit
03-Nov-2016 10.0000 12.1250 0.3792
ICICI Prudential Dynamic Bond Fund - Direct Plan - Annual Dividend
Record Date Face Value (Rs) NAV (Rs) Dividend (Rs.)/Unit
09-Oct-15 10.0000 11.0348 0.533510-Oct-16 10.0000 11.8390 1.280410-Oct-17 10.0000 11.3640 0.8609
ICICI Prudential Corporate Bond Fund - Monthly Dividend Option
Record Date Face Value (Rs) NAV (Rs) Dividend (Rs.)/Unit
25-Jan-12 10.0000 10.3582 0.060815-Feb-12 10.0000 10.3402 0.0428
ICICI Prudential Corporate Bond Fund - Annual Dividend
Record Date Face Value (Rs) NAV (Rs) Dividend (Rs.)/Unit
03-Nov-15 10.0000 10.9715 0.000503-Nov-16 10.0000 12.0015 1.0231
ICICI Prudential Corporate Bond Fund - Half Yearly Dividend
Record Date Face Value (Rs) NAV (Rs) Dividend (Rs.)/Unit
19-Sep-16 10.0000 11.1107 0.611623-Mar-17 10.0000 10.8985 0.360720-Sep-17 10.0000 11.0327 0.4908
ICICI Prudential Corporate Bond Fund - Direct Plan - Half Yearly Dividend
Record Date Face Value (Rs) NAV (Rs) Dividend (Rs.)/Unit
19-Sep-16 10.0000 11.3356 0.541823-Mar-17 10.0000 11.2597 0.356520-Sep-17 10.0000 11.4642 0.5050
ICICI Prudential Corporate Bond Fund - Quarterly Dividend
Record Date Face Value (Rs) NAV (Rs) Dividend (Rs.)/Unit
27-Apr-17 10.0000 10.6383 0.125627-Jul-17 10.0000 10.8363 0.300327-Oct-17 10.0000 10.6832 0.1332
ICICI Prudential Corporate Bond Fund - Direct Plan - Quarterly Dividend
Record Date Face Value (Rs) NAV (Rs) Dividend (Rs.)/Unit
27-Apr-17 10.0000 11.1766 0.154427-Jul-17 10.0000 11.3859 0.337327-Oct-17 10.0000 11.2272 0.1613
ICICI Prudential Dynamic Bond Fund - Annual Dividend
Record Date Face Value (Rs) NAV (Rs) Dividend (Rs.)/Unit
09-Oct-15 10.0000 11.0099 0.602210-Oct-16 10.0000 11.6689 1.021010-Oct-17 10.0000 11.3606 0.7701
ICICI Prudential Dynamic Bond Fund - Quarterly Dividend
Record Date Face Value (Rs) NAV (Rs) Dividend (Rs.)/Unit
31-Mar-17 10.0000 10.4263 0.039030-Jun-17 10.0000 10.7252 0.358028-Sep-17 10.0000 10.5053 0.1178
ICICI Prudential Dynamic Bond Fund - Direct Plan - Quarterly Dividend
Record Date Face Value (Rs) NAV (Rs) Dividend (Rs.)/Unit
31-Mar-17 10.0000 10.4559 0.060630-Jun-17 10.0000 10.7592 0.382128-Sep-17 10.0000 10.5373 0.1382
ICICI Prudential Dynamic Bond Fund - Half Yearly Dividend
Record Date Face Value (Rs) NAV (Rs) Dividend (Rs.)/Unit
20-Feb-17 10.0000 10.6101 0.039328-Jun-17 10.0000 11.0695 0.526016-Aug-17 10.0000 10.6635 0.4655
ICICI Prudential Dynamic Bond Fund - Direct Plan - Half Yearly Dividend
Record Date Face Value (Rs) NAV (Rs) Dividend (Rs.)/Unit
20-Feb-17 10.0000 10.5267 0.050328-Jun-17 10.0000 11.0082 0.557116-Aug-17 10.0000 10.5820 0.4764
ICICI Prudential Dynamic Bond Fund - Direct Plan - Monthly Dividend
Record Date Face Value (Rs) NAV (Rs) Dividend (Rs.)/Unit
31-Jul-17 10.0000 10.5215 0.098130-Aug-17 10.0000 10.4781 0.054728-Sep-17 10.0000 10.4303 0.0069
ICICI Prudential Dynamic Bond Fund - Monthly Dividend Option
Record Date Face Value (Rs) NAV (Rs) Dividend (Rs.)/Unit
29-Jun-17 10.0000 11.1161 0.172131-Jul-17 10.0000 11.0388 0.094830-Aug-17 10.0000 10.9937 0.0497
ICICI Prudential Ultra Short Term Plan - Quarterly Dividend
Record Date Face Value (Rs) NAV (Rs) Dividend (Rs.)/Unit
31-Mar-17 10.0000 10.7421 0.148330-Jun-17 10.0000 10.8065 0.211528-Sep-17 10.0000 10.7764 0.1696
ICICI Prudential Ultra Short Term Plan - Direct Plan - Quarterly Dividend
Record Date Face Value (Rs) NAV (Rs) Dividend (Rs.)/Unit
31-Mar-17 10.0000 11.9396 0.000530-Jun-17 10.0000 12.1884 0.000528-Sep-17 10.0000 12.4064 0.0005
ICICI Prudential Ultra Short Term Plan - Half Yearly Dividend Option
Record Date Face Value (Rs) NAV (Rs) Dividend (Rs.)/Unit
16-Aug-16 10.0000 10.9816 0.000516-Feb-17 10.0000 11.4257 0.000516-Aug-17 10.0000 11.8913 0.0005
ICICI Prudential Ultra Short Term Plan - Direct Plan - Half Yearly Dividend Option
Record Date Face Value (Rs) NAV (Rs) Dividend (Rs.)/Unit
16-Aug-16 10.0000 11.0975 0.000516-Feb-17 10.0000 11.5667 0.000516-Aug-17 10.0000 12.0572 0.0005
6979133
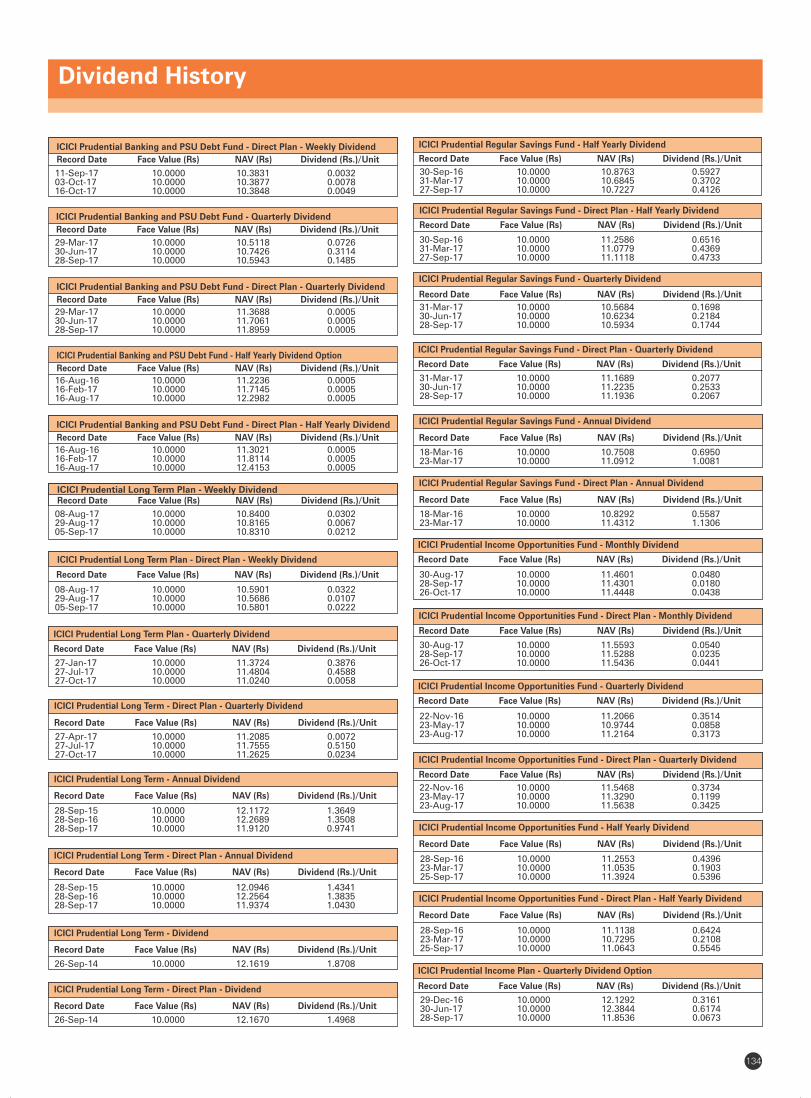
Dividend History
134
ICICI Prudential Income Opportunities Fund - Direct Plan - Monthly Dividend
Record Date Face Value (Rs) NAV (Rs) Dividend (Rs.)/Unit
30-Aug-17 10.0000 11.5593 0.054028-Sep-17 10.0000 11.5288 0.023526-Oct-17 10.0000 11.5436 0.0441
Record Date Face Value (Rs) NAV (Rs) Dividend (Rs.)/Unit
ICICI Prudential Income Opportunities Fund - Quarterly Dividend
22-Nov-16 10.0000 11.2066 0.351423-May-17 10.0000 10.9744 0.085823-Aug-17 10.0000 11.2164 0.3173
Record Date Face Value (Rs) NAV (Rs) Dividend (Rs.)/Unit
ICICI Prudential Income Opportunities Fund - Direct Plan - Quarterly Dividend
22-Nov-16 10.0000 11.5468 0.373423-May-17 10.0000 11.3290 0.119923-Aug-17 10.0000 11.5638 0.3425
ICICI Prudential Income Opportunities Fund - Half Yearly Dividend
Record Date Face Value (Rs) NAV (Rs) Dividend (Rs.)/Unit
28-Sep-16 10.0000 11.2553 0.439623-Mar-17 10.0000 11.0535 0.190325-Sep-17 10.0000 11.3924 0.5396
Record Date Face Value (Rs) NAV (Rs) Dividend (Rs.)/Unit
ICICI Prudential Income Opportunities Fund - Monthly Dividend
30-Aug-17 10.0000 11.4601 0.048028-Sep-17 10.0000 11.4301 0.018026-Oct-17 10.0000 11.4448 0.0438
ICICI Prudential Income Opportunities Fund - Direct Plan - Half Yearly Dividend
Record Date Face Value (Rs) NAV (Rs) Dividend (Rs.)/Unit
28-Sep-16 10.0000 11.1138 0.642423-Mar-17 10.0000 10.7295 0.210825-Sep-17 10.0000 11.0643 0.5545
ICICI Prudential Income Plan - Quarterly Dividend Option
Record Date Face Value (Rs) NAV (Rs) Dividend (Rs.)/Unit
29-Dec-16 10.0000 12.1292 0.316130-Jun-17 10.0000 12.3844 0.617428-Sep-17 10.0000 11.8536 0.0673
ICICI Prudential Regular Savings Fund - Direct Plan - Annual Dividend
Record Date Face Value (Rs) NAV (Rs) Dividend (Rs.)/Unit
18-Mar-16 10.0000 10.8292 0.558723-Mar-17 10.0000 11.4312 1.1306
ICICI Prudential Long Term Plan - Weekly DividendRecord Date Face Value (Rs) NAV (Rs) Dividend (Rs.)/Unit
08-Aug-17 10.0000 10.8400 0.030229-Aug-17 10.0000 10.8165 0.006705-Sep-17 10.0000 10.8310 0.0212
ICICI Prudential Long Term - Annual Dividend
Record Date Face Value (Rs) NAV (Rs) Dividend (Rs.)/Unit
28-Sep-15 10.0000 12.1172 1.364928-Sep-16 10.0000 12.2689 1.350828-Sep-17 10.0000 11.9120 0.9741
ICICI Prudential Long Term - Direct Plan - Quarterly Dividend
Record Date Face Value (Rs) NAV (Rs) Dividend (Rs.)/Unit
27-Apr-17 10.0000 11.2085 0.007227-Jul-17 10.0000 11.7555 0.515027-Oct-17 10.0000 11.2625 0.0234
ICICI Prudential Long Term Plan - Quarterly Dividend
Record Date Face Value (Rs) NAV (Rs) Dividend (Rs.)/Unit
27-Jan-17 10.0000 11.3724 0.387627-Jul-17 10.0000 11.4804 0.458827-Oct-17 10.0000 11.0240 0.0058
ICICI Prudential Long Term Plan - Direct Plan - Weekly Dividend
Record Date Face Value (Rs) NAV (Rs) Dividend (Rs.)/Unit
08-Aug-17 10.0000 10.5901 0.032229-Aug-17 10.0000 10.5686 0.010705-Sep-17 10.0000 10.5801 0.0222
ICICI Prudential Long Term - Direct Plan - Annual Dividend
Record Date Face Value (Rs) NAV (Rs) Dividend (Rs.)/Unit
28-Sep-15 10.0000 12.0946 1.434128-Sep-16 10.0000 12.2564 1.383528-Sep-17 10.0000 11.9374 1.0430
ICICI Prudential Long Term - Dividend
Record Date Face Value (Rs) NAV (Rs) Dividend (Rs.)/Unit
26-Sep-14 10.0000 12.1619 1.8708
ICICI Prudential Long Term - Direct Plan - Dividend
Record Date Face Value (Rs) NAV (Rs) Dividend (Rs.)/Unit
26-Sep-14 10.0000 12.1670 1.4968
Record Date Face Value (Rs) NAV (Rs) Dividend (Rs.)/Unit
ICICI Prudential Regular Savings Fund - Quarterly Dividend
31-Mar-17 10.0000 10.5684 0.169830-Jun-17 10.0000 10.6234 0.218428-Sep-17 10.0000 10.5934 0.1744
Record Date Face Value (Rs) NAV (Rs) Dividend (Rs.)/Unit
ICICI Prudential Regular Savings Fund - Direct Plan - Quarterly Dividend
31-Mar-17 10.0000 11.1689 0.207730-Jun-17 10.0000 11.2235 0.253328-Sep-17 10.0000 11.1936 0.2067
ICICI Prudential Regular Savings Fund - Annual Dividend
Record Date Face Value (Rs) NAV (Rs) Dividend (Rs.)/Unit
18-Mar-16 10.0000 10.7508 0.695023-Mar-17 10.0000 11.0912 1.0081
Record Date Face Value (Rs) NAV (Rs) Dividend (Rs.)/Unit
ICICI Prudential Regular Savings Fund - Half Yearly Dividend
30-Sep-16 10.0000 10.8763 0.592731-Mar-17 10.0000 10.6845 0.370227-Sep-17 10.0000 10.7227 0.4126
Record Date Face Value (Rs) NAV (Rs) Dividend (Rs.)/Unit
ICICI Prudential Regular Savings Fund - Direct Plan - Half Yearly Dividend
30-Sep-16 10.0000 11.2586 0.651631-Mar-17 10.0000 11.0779 0.436927-Sep-17 10.0000 11.1118 0.4733
ICICI Prudential Banking and PSU Debt Fund - Direct Plan - Half Yearly Dividend
Record Date Face Value (Rs) NAV (Rs) Dividend (Rs.)/Unit
16-Aug-16 10.0000 11.3021 0.000516-Feb-17 10.0000 11.8114 0.000516-Aug-17 10.0000 12.4153 0.0005
ICICI Prudential Banking and PSU Debt Fund - Direct Plan - Quarterly Dividend
Record Date Face Value (Rs) NAV (Rs) Dividend (Rs.)/Unit
29-Mar-17 10.0000 11.3688 0.000530-Jun-17 10.0000 11.7061 0.000528-Sep-17 10.0000 11.8959 0.0005
ICICI Prudential Banking and PSU Debt Fund - Half Yearly Dividend Option
Record Date Face Value (Rs) NAV (Rs) Dividend (Rs.)/Unit
16-Aug-16 10.0000 11.2236 0.000516-Feb-17 10.0000 11.7145 0.000516-Aug-17 10.0000 12.2982 0.0005
ICICI Prudential Banking and PSU Debt Fund - Direct Plan - Weekly Dividend
Record Date Face Value (Rs) NAV (Rs) Dividend (Rs.)/Unit
11-Sep-17 10.0000 10.3831 0.003203-Oct-17 10.0000 10.3877 0.007816-Oct-17 10.0000 10.3848 0.0049
ICICI Prudential Banking and PSU Debt Fund - Quarterly Dividend
Record Date Face Value (Rs) NAV (Rs) Dividend (Rs.)/Unit
29-Mar-17 10.0000 10.5118 0.072630-Jun-17 10.0000 10.7426 0.311428-Sep-17 10.0000 10.5943 0.1485
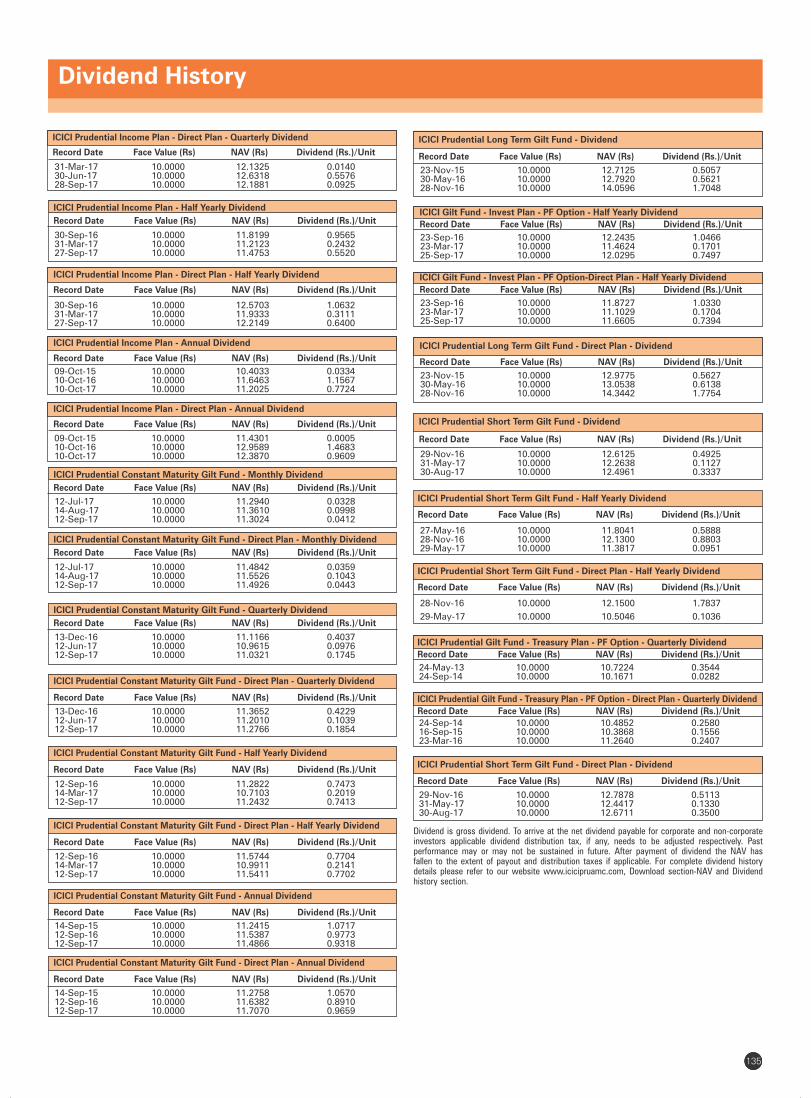
Dividend History
6979135
Dividend is gross dividend. To arrive at the net dividend payable for corporate and non-corporate investors applicable dividend distribution tax, if any, needs to be adjusted respectively. Past performance may or may not be sustained in future. After payment of dividend the NAV has fallen to the extent of payout and distribution taxes if applicable. For complete dividend history details please refer to our website www.icicipruamc.com, Download section-NAV and Dividend history section.
ICICI Prudential Short Term Gilt Fund - Direct Plan - Dividend
Record Date Face Value (Rs) NAV (Rs) Dividend (Rs.)/Unit
29-Nov-16 10.0000 12.7878 0.511331-May-17 10.0000 12.4417 0.133030-Aug-17 10.0000 12.6711 0.3500
ICICI Prudential Short Term Gilt Fund - Half Yearly Dividend
Record Date Face Value (Rs) NAV (Rs) Dividend (Rs.)/Unit
27-May-16 10.0000 11.8041 0.588828-Nov-16 10.0000 12.1300 0.880329-May-17 10.0000 11.3817 0.0951
ICICI Prudential Short Term Gilt Fund - Direct Plan - Half Yearly Dividend
Record Date Face Value (Rs) NAV (Rs) Dividend (Rs.)/Unit
28-Nov-16 10.0000 12.1500 1.7837
29-May-17 10.0000 10.5046 0.1036
ICICI Prudential Gilt Fund - Treasury Plan - PF Option - Quarterly Dividend
Record Date Face Value (Rs) NAV (Rs) Dividend (Rs.)/Unit
24-May-13 10.0000 10.7224 0.354424-Sep-14 10.0000 10.1671 0.0282
ICICI Prudential Gilt Fund - Treasury Plan - PF Option - Direct Plan - Quarterly Dividend
Record Date Face Value (Rs) NAV (Rs) Dividend (Rs.)/Unit
24-Sep-14 10.0000 10.4852 0.258016-Sep-15 10.0000 10.3868 0.155623-Mar-16 10.0000 11.2640 0.2407
ICICI Prudential Constant Maturity Gilt Fund - Direct Plan - Annual Dividend
Record Date Face Value (Rs) NAV (Rs) Dividend (Rs.)/Unit
14-Sep-15 10.0000 11.2758 1.057012-Sep-16 10.0000 11.6382 0.891012-Sep-17 10.0000 11.7070 0.9659
ICICI Prudential Constant Maturity Gilt Fund - Annual Dividend
Record Date Face Value (Rs) NAV (Rs) Dividend (Rs.)/Unit
14-Sep-15 10.0000 11.2415 1.071712-Sep-16 10.0000 11.5387 0.977312-Sep-17 10.0000 11.4866 0.9318
ICICI Prudential Constant Maturity Gilt Fund - Monthly Dividend
Record Date Face Value (Rs) NAV (Rs) Dividend (Rs.)/Unit
12-Jul-17 10.0000 11.2940 0.032814-Aug-17 10.0000 11.3610 0.099812-Sep-17 10.0000 11.3024 0.0412
ICICI Prudential Constant Maturity Gilt Fund - Direct Plan - Monthly Dividend
Record Date Face Value (Rs) NAV (Rs) Dividend (Rs.)/Unit
12-Jul-17 10.0000 11.4842 0.035914-Aug-17 10.0000 11.5526 0.104312-Sep-17 10.0000 11.4926 0.0443
ICICI Prudential Constant Maturity Gilt Fund - Quarterly Dividend
Record Date Face Value (Rs) NAV (Rs) Dividend (Rs.)/Unit
13-Dec-16 10.0000 11.1166 0.403712-Jun-17 10.0000 10.9615 0.097612-Sep-17 10.0000 11.0321 0.1745
ICICI Prudential Constant Maturity Gilt Fund - Direct Plan - Half Yearly Dividend
Record Date Face Value (Rs) NAV (Rs) Dividend (Rs.)/Unit
12-Sep-16 10.0000 11.5744 0.770414-Mar-17 10.0000 10.9911 0.214112-Sep-17 10.0000 11.5411 0.7702
ICICI Prudential Constant Maturity Gilt Fund - Half Yearly Dividend
Record Date Face Value (Rs) NAV (Rs) Dividend (Rs.)/Unit
12-Sep-16 10.0000 11.2822 0.747314-Mar-17 10.0000 10.7103 0.201912-Sep-17 10.0000 11.2432 0.7413
ICICI Prudential Constant Maturity Gilt Fund - Direct Plan - Quarterly Dividend
Record Date Face Value (Rs) NAV (Rs) Dividend (Rs.)/Unit
13-Dec-16 10.0000 11.3652 0.422912-Jun-17 10.0000 11.2010 0.103912-Sep-17 10.0000 11.2766 0.1854
ICICI Prudential Long Term Gilt Fund - Direct Plan - Dividend
Record Date Face Value (Rs) NAV (Rs) Dividend (Rs.)/Unit
23-Nov-15 10.0000 12.9775 0.562730-May-16 10.0000 13.0538 0.613828-Nov-16 10.0000 14.3442 1.7754
ICICI Prudential Short Term Gilt Fund - Dividend
Record Date Face Value (Rs) NAV (Rs) Dividend (Rs.)/Unit
29-Nov-16 10.0000 12.6125 0.492531-May-17 10.0000 12.2638 0.112730-Aug-17 10.0000 12.4961 0.3337
23-Sep-16 10.0000 11.8727 1.033023-Mar-17 10.0000 11.1029 0.170425-Sep-17 10.0000 11.6605 0.7394
ICICI Gilt Fund - Invest Plan - PF Option-Direct Plan - Half Yearly Dividend
Record Date Face Value (Rs) NAV (Rs) Dividend (Rs.)/Unit
ICICI Prudential Long Term Gilt Fund - Dividend
Record Date Face Value (Rs) NAV (Rs) Dividend (Rs.)/Unit
23-Nov-15 10.0000 12.7125 0.505730-May-16 10.0000 12.7920 0.562128-Nov-16 10.0000 14.0596 1.7048
ICICI Gilt Fund - Invest Plan - PF Option - Half Yearly Dividend
Record Date Face Value (Rs) NAV (Rs) Dividend (Rs.)/Unit
23-Sep-16 10.0000 12.2435 1.046623-Mar-17 10.0000 11.4624 0.170125-Sep-17 10.0000 12.0295 0.7497
ICICI Prudential Income Plan - Annual Dividend
Record Date Face Value (Rs) NAV (Rs) Dividend (Rs.)/Unit
09-Oct-15 10.0000 10.4033 0.033410-Oct-16 10.0000 11.6463 1.156710-Oct-17 10.0000 11.2025 0.7724
ICICI Prudential Income Plan - Direct Plan - Annual Dividend Record Date Face Value (Rs) NAV (Rs) Dividend (Rs.)/Unit
09-Oct-15 10.0000 11.4301 0.000510-Oct-16 10.0000 12.9589 1.468310-Oct-17 10.0000 12.3870 0.9609
ICICI Prudential Income Plan - Direct Plan - Quarterly Dividend
Record Date Face Value (Rs) NAV (Rs) Dividend (Rs.)/Unit
31-Mar-17 10.0000 12.1325 0.014030-Jun-17 10.0000 12.6318 0.557628-Sep-17 10.0000 12.1881 0.0925
ICICI Prudential Income Plan - Half Yearly Dividend
Record Date Face Value (Rs) NAV (Rs) Dividend (Rs.)/Unit
30-Sep-16 10.0000 11.8199 0.956531-Mar-17 10.0000 11.2123 0.243227-Sep-17 10.0000 11.4753 0.5520
ICICI Prudential Income Plan - Direct Plan - Half Yearly Dividend
Record Date Face Value (Rs) NAV (Rs) Dividend (Rs.)/Unit
30-Sep-16 10.0000 12.5703 1.063231-Mar-17 10.0000 11.9333 0.311127-Sep-17 10.0000 12.2149 0.6400
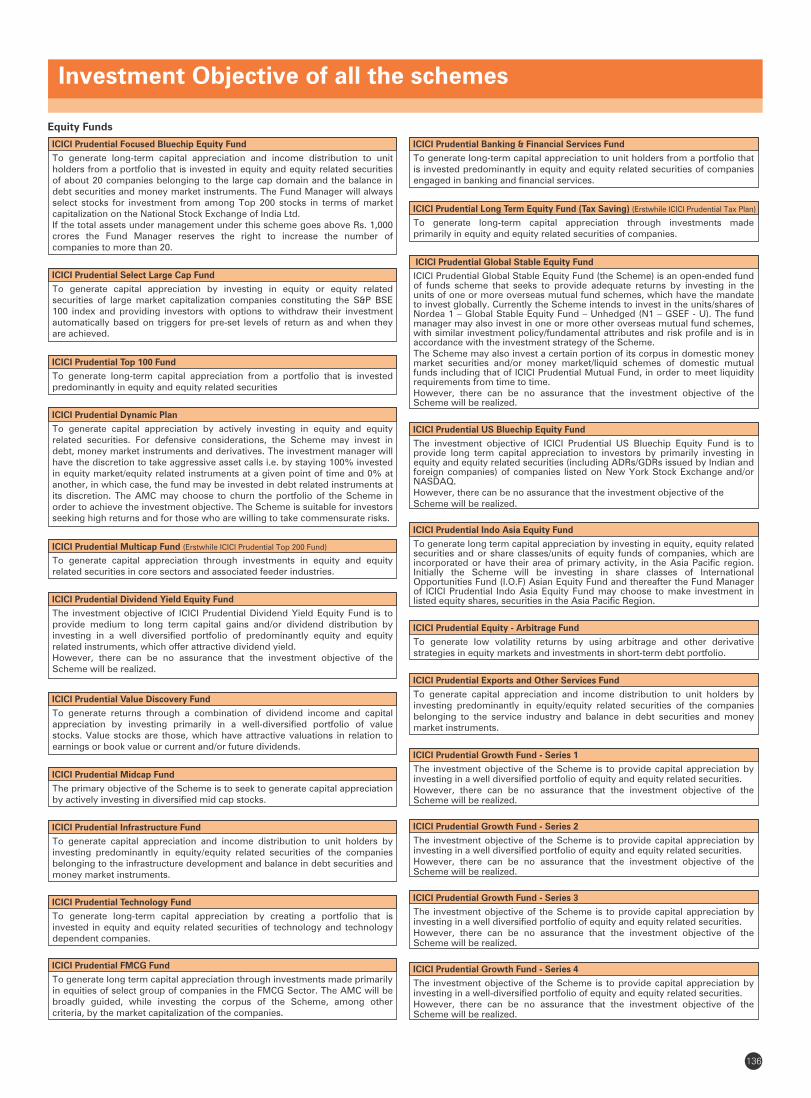
Investment Objective of all the schemes
ICICI Prudential Focused Bluechip Equity Fund
To generate long-term capital appreciation and income distribution to unit holders from a portfolio that is invested in equity and equity related securities of about 20 companies belonging to the large cap domain and the balance in debt securities and money market instruments. The Fund Manager will always select stocks for investment from among Top 200 stocks in terms of market capitalization on the National Stock Exchange of India Ltd. If the total assets under management under this scheme goes above Rs. 1,000 crores the Fund Manager reserves the right to increase the number of companies to more than 20.
ICICI Prudential Select Large Cap Fund
To generate capital appreciation by investing in equity or equity related securities of large market capitalization companies constituting the S&P BSE 100 index and providing investors with options to withdraw their investment automatically based on triggers for pre-set levels of return as and when they are achieved.
ICICI Prudential Top 100 Fund
To generate long-term capital appreciation from a portfolio that is invested predominantly in equity and equity related securities
ICICI Prudential Dynamic Plan
To generate capital appreciation by actively investing in equity and equity related securities. For defensive considerations, the Scheme may invest in debt, money market instruments and derivatives. The investment manager will have the discretion to take aggressive asset calls i.e. by staying 100% invested in equity market/equity related instruments at a given point of time and 0% at another, in which case, the fund may be invested in debt related instruments at its discretion. The AMC may choose to churn the portfolio of the Scheme in order to achieve the investment objective. The Scheme is suitable for investors seeking high returns and for those who are willing to take commensurate risks.
ICICI Prudential Multicap Fund (Erstwhile ICICI Prudential Top 200 Fund)
To generate capital appreciation through investments in equity and equity related securities in core sectors and associated feeder industries.
ICICI Prudential Dividend Yield Equity Fund
The investment objective of ICICI Prudential Dividend Yield Equity Fund is to provide medium to long term capital gains and/or dividend distribution by investing in a well diversified portfolio of predominantly equity and equity related instruments, which offer attractive dividend yield. However, there can be no assurance that the investment objective of the Scheme will be realized.
ICICI Prudential Value Discovery Fund
To generate returns through a combination of dividend income and capital appreciation by investing primarily in a well-diversified portfolio of value stocks. Value stocks are those, which have attractive valuations in relation to earnings or book value or current and/or future dividends.
ICICI Prudential Midcap Fund
The primary objective of the Scheme is to seek to generate capital appreciation by actively investing in diversified mid cap stocks.
ICICI Prudential Infrastructure Fund
To generate capital appreciation and income distribution to unit holders by investing predominantly in equity/equity related securities of the companies belonging to the infrastructure development and balance in debt securities and money market instruments.
ICICI Prudential Technology Fund
To generate long-term capital appreciation by creating a portfolio that is invested in equity and equity related securities of technology and technology dependent companies.
ICICI Prudential FMCG Fund
To generate long term capital appreciation through investments made primarily in equities of select group of companies in the FMCG Sector. The AMC will be broadly guided, while investing the corpus of the Scheme, among other criteria, by the market capitalization of the companies.
ICICI Prudential Banking & Financial Services Fund
To generate long-term capital appreciation to unit holders from a portfolio that is invested predominantly in equity and equity related securities of companies engaged in banking and financial services.
ICICI Prudential Long Term Equity Fund (Tax Saving) (Erstwhile ICICI Prudential Tax Plan)
To generate long-term capital appreciation through investments made primarily in equity and equity related securities of companies.
ICICI Prudential US Bluechip Equity Fund
The investment objective of ICICI Prudential US Bluechip Equity Fund is to provide long term capital appreciation to investors by primarily investing in equity and equity related securities (including ADRs/GDRs issued by Indian and foreign companies) of companies listed on New York Stock Exchange and/or NASDAQ. However, there can be no assurance that the investment objective of theScheme will be realized.
ICICI Prudential Equity - Arbitrage Fund
To generate low volatility returns by using arbitrage and other derivative strategies in equity markets and investments in short-term debt portfolio.
ICICI Prudential Exports and Other Services Fund
To generate capital appreciation and income distribution to unit holders by investing predominantly in equity/equity related securities of the companies belonging to the service industry and balance in debt securities and money market instruments.
Equity Funds
ICICI Prudential Global Stable Equity Fund
ICICI Prudential Global Stable Equity Fund (the Scheme) is an open-ended fund of funds scheme that seeks to provide adequate returns by investing in the units of one or more overseas mutual fund schemes, which have the mandate to invest globally. Currently the Scheme intends to invest in the units/shares of Nordea 1 – Global Stable Equity Fund – Unhedged (N1 – GSEF - U). The fund manager may also invest in one or more other overseas mutual fund schemes, with similar investment policy/fundamental attributes and risk profile and is in accordance with the investment strategy of the Scheme. The Scheme may also invest a certain portion of its corpus in domestic money market securities and/or money market/liquid schemes of domestic mutual funds including that of ICICI Prudential Mutual Fund, in order to meet liquidity requirements from time to time. However, there can be no assurance that the investment objective of the Scheme will be realized.
ICICI Prudential Indo Asia Equity Fund
To generate long term capital appreciation by investing in equity, equity related securities and or share classes/units of equity funds of companies, which are incorporated or have their area of primary activity, in the Asia Pacific region. Initially the Scheme will be investing in share classes of International Opportunities Fund (I.O.F) Asian Equity Fund and thereafter the Fund Manager of ICICI Prudential Indo Asia Equity Fund may choose to make investment in listed equity shares, securities in the Asia Pacific Region.
ICICI Prudential Growth Fund - Series 1
The investment objective of the Scheme is to provide capital appreciation by investing in a well diversified portfolio of equity and equity related securities.However, there can be no assurance that the investment objective of the Scheme will be realized.
ICICI Prudential Growth Fund - Series 2
The investment objective of the Scheme is to provide capital appreciation by investing in a well diversified portfolio of equity and equity related securities.However, there can be no assurance that the investment objective of the Scheme will be realized.
ICICI Prudential Growth Fund - Series 3
The investment objective of the Scheme is to provide capital appreciation by investing in a well diversified portfolio of equity and equity related securities.However, there can be no assurance that the investment objective of the Scheme will be realized.
136
ICICI Prudential Growth Fund - Series 4
The investment objective of the Scheme is to provide capital appreciation by investing in a well-diversified portfolio of equity and equity related securities. However, there can be no assurance that the investment objective of the Scheme will be realized.
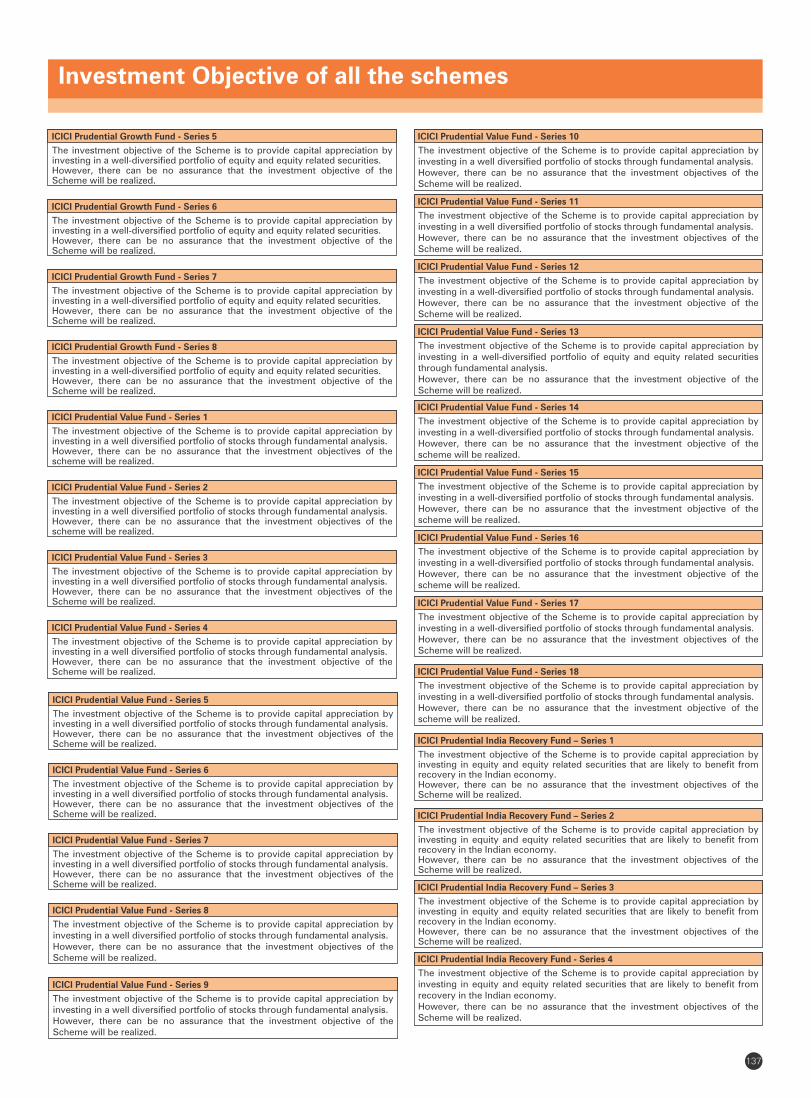
Investment Objective of all the schemes
ICICI Prudential Value Fund - Series 1
The investment objective of the Scheme is to provide capital appreciation by investing in a well diversified portfolio of stocks through fundamental analysis.However, there can be no assurance that the investment objectives of the scheme will be realized.
ICICI Prudential Value Fund - Series 2
The investment objective of the Scheme is to provide capital appreciation by investing in a well diversified portfolio of stocks through fundamental analysis.However, there can be no assurance that the investment objectives of the scheme will be realized.
ICICI Prudential Value Fund - Series 3
The investment objective of the Scheme is to provide capital appreciation by investing in a well diversified portfolio of stocks through fundamental analysis.However, there can be no assurance that the investment objectives of the Scheme will be realized.
ICICI Prudential Growth Fund - Series 8
The investment objective of the Scheme is to provide capital appreciation by investing in a well-diversified portfolio of equity and equity related securities. However, there can be no assurance that the investment objective of the Scheme will be realized.
ICICI Prudential Value Fund - Series 5
The investment objective of the Scheme is to provide capital appreciation by investing in a well diversified portfolio of stocks through fundamental analysis.However, there can be no assurance that the investment objectives of the Scheme will be realized.
ICICI Prudential Value Fund - Series 6
The investment objective of the Scheme is to provide capital appreciation by investing in a well diversified portfolio of stocks through fundamental analysis. However, there can be no assurance that the investment objectives of the Scheme will be realized.
ICICI Prudential Value Fund - Series 7
The investment objective of the Scheme is to provide capital appreciation by investing in a well diversified portfolio of stocks through fundamental analysis. However, there can be no assurance that the investment objectives of the Scheme will be realized.
ICICI Prudential Value Fund - Series 8
The investment objective of the Scheme is to provide capital appreciation by investing in a well diversified portfolio of stocks through fundamental analysis.However, there can be no assurance that the investment objectives of the Scheme will be realized.
ICICI Prudential Value Fund - Series 4
The investment objective of the Scheme is to provide capital appreciation by investing in a well diversified portfolio of stocks through fundamental analysis.However, there can be no assurance that the investment objective of the Scheme will be realized.
ICICI Prudential Growth Fund - Series 6
The investment objective of the Scheme is to provide capital appreciation by investing in a well-diversified portfolio of equity and equity related securities. However, there can be no assurance that the investment objective of the Scheme will be realized.
ICICI Prudential Growth Fund - Series 7
The investment objective of the Scheme is to provide capital appreciation by investing in a well-diversified portfolio of equity and equity related securities. However, there can be no assurance that the investment objective of the Scheme will be realized.
ICICI Prudential Growth Fund - Series 5
The investment objective of the Scheme is to provide capital appreciation by investing in a well-diversified portfolio of equity and equity related securities. However, there can be no assurance that the investment objective of the Scheme will be realized.
ICICI Prudential India Recovery Fund – Series 3
The investment objective of the Scheme is to provide capital appreciation by investing in equity and equity related securities that are likely to benefit from recovery in the Indian economy.However, there can be no assurance that the investment objectives of the Scheme will be realized.
ICICI Prudential India Recovery Fund – Series 2
The investment objective of the Scheme is to provide capital appreciation by investing in equity and equity related securities that are likely to benefit from recovery in the Indian economy. However, there can be no assurance that the investment objectives of the Scheme will be realized.
ICICI Prudential India Recovery Fund – Series 1
The investment objective of the Scheme is to provide capital appreciation by investing in equity and equity related securities that are likely to benefit from recovery in the Indian economy. However, there can be no assurance that the investment objectives of the Scheme will be realized.
ICICI Prudential India Recovery Fund - Series 4
The investment objective of the Scheme is to provide capital appreciation by investing in equity and equity related securities that are likely to benefit from recovery in the Indian economy.However, there can be no assurance that the investment objectives of the Scheme will be realized.
137
ICICI Prudential Value Fund - Series 9
The investment objective of the Scheme is to provide capital appreciation by investing in a well diversified portfolio of stocks through fundamental analysis.However, there can be no assurance that the investment objective of the Scheme will be realized.
ICICI Prudential Value Fund - Series 10
The investment objective of the Scheme is to provide capital appreciation by investing in a well diversified portfolio of stocks through fundamental analysis.However, there can be no assurance that the investment objectives of the Scheme will be realized.
ICICI Prudential Value Fund - Series 11
The investment objective of the Scheme is to provide capital appreciation by investing in a well diversified portfolio of stocks through fundamental analysis.However, there can be no assurance that the investment objectives of the Scheme will be realized.
ICICI Prudential Value Fund - Series 12
The investment objective of the Scheme is to provide capital appreciation by investing in a well-diversified portfolio of stocks through fundamental analysis.However, there can be no assurance that the investment objective of the Scheme will be realized.
ICICI Prudential Value Fund - Series 13
The investment objective of the Scheme is to provide capital appreciation by investing in a well-diversified portfolio of equity and equity related securities through fundamental analysis.However, there can be no assurance that the investment objective of the Scheme will be realized.
ICICI Prudential Value Fund - Series 14
The investment objective of the Scheme is to provide capital appreciation by investing in a well-diversified portfolio of stocks through fundamental analysis.However, there can be no assurance that the investment objective of the scheme will be realized.
ICICI Prudential Value Fund - Series 15
The investment objective of the Scheme is to provide capital appreciation by investing in a well-diversified portfolio of stocks through fundamental analysis.However, there can be no assurance that the investment objective of the scheme will be realized.
ICICI Prudential Value Fund - Series 16
The investment objective of the Scheme is to provide capital appreciation by investing in a well-diversified portfolio of stocks through fundamental analysis.However, there can be no assurance that the investment objective of the scheme will be realized.
ICICI Prudential Value Fund - Series 17
The investment objective of the Scheme is to provide capital appreciation by investing in a well-diversified portfolio of stocks through fundamental analysis.However, there can be no assurance that the investment objectives of the Scheme will be realized.
ICICI Prudential Value Fund - Series 18
The investment objective of the Scheme is to provide capital appreciation by investing in a well-diversified portfolio of stocks through fundamental analysis. However, there can be no assurance that the investment objective of the scheme will be realized.
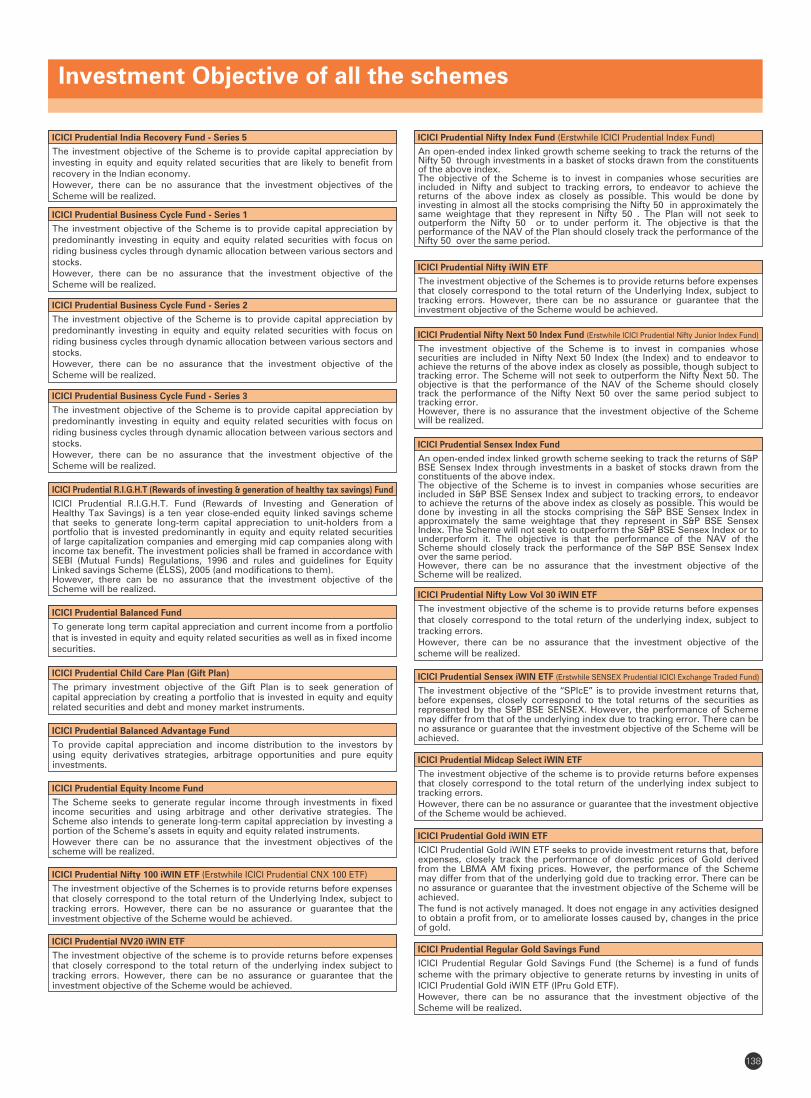
138
Investment Objective of all the schemes
ICICI Prudential Nifty Index Fund (Erstwhile ICICI Prudential Index Fund)
An open-ended index linked growth scheme seeking to track the returns of the Nifty 50 through investments in a basket of stocks drawn from the constituents of the above index. The objective of the Scheme is to invest in companies whose securities are included in Nifty and subject to tracking errors, to endeavor to achieve the returns of the above index as closely as possible. This would be done by investing in almost all the stocks comprising the Nifty 50 in approximately the same weightage that they represent in Nifty 50 . The Plan will not seek to outperform the Nifty 50 or to under perform it. The objective is that the performance of the NAV of the Plan should closely track the performance of the Nifty 50 over the same period.
ICICI Prudential Nifty 100 iWIN ETF (Erstwhile ICICI Prudential CNX 100 ETF)
The investment objective of the Schemes is to provide returns before expenses that closely correspond to the total return of the Underlying Index, subject to tracking errors. However, there can be no assurance or guarantee that the investment objective of the Scheme would be achieved.
ICICI Prudential Equity Income Fund
The Scheme seeks to generate regular income through investments in fixed income securities and using arbitrage and other derivative strategies. The Scheme also intends to generate long-term capital appreciation by investing a portion of the Scheme’s assets in equity and equity related instruments. However there can be no assurance that the investment objectives of the scheme will be realized.
ICICI Prudential Balanced Advantage Fund
To provide capital appreciation and income distribution to the investors by using equity derivatives strategies, arbitrage opportunities and pure equity investments.
ICICI Prudential NV20 iWIN ETF
The investment objective of the scheme is to provide returns before expenses that closely correspond to the total return of the underlying index subject to tracking errors. However, there can be no assurance or guarantee that the investment objective of the Scheme would be achieved.
ICICI Prudential Balanced Fund
To generate long term capital appreciation and current income from a portfolio that is invested in equity and equity related securities as well as in fixed income securities.
ICICI Prudential Child Care Plan (Gift Plan)
The primary investment objective of the Gift Plan is to seek generation of capital appreciation by creating a portfolio that is invested in equity and equity related securities and debt and money market instruments.
ICICI Prudential R.I.G.H.T (Rewards of investing & generation of healthy tax savings) Fund
ICICI Prudential R.I.G.H.T. Fund (Rewards of Investing and Generation of Healthy Tax Savings) is a ten year close-ended equity linked savings scheme that seeks to generate long-term capital appreciation to unit-holders from a portfolio that is invested predominantly in equity and equity related securities of large capitalization companies and emerging mid cap companies along with income tax benefit. The investment policies shall be framed in accordance with SEBI (Mutual Funds) Regulations, 1996 and rules and guidelines for Equity Linked savings Scheme (ELSS), 2005 (and modifications to them).However, there can be no assurance that the investment objective of the Scheme will be realized.
ICICI Prudential Business Cycle Fund - Series 3
The investment objective of the Scheme is to provide capital appreciation by predominantly investing in equity and equity related securities with focus on riding business cycles through dynamic allocation between various sectors and stocks.However, there can be no assurance that the investment objective of the Scheme will be realized.
ICICI Prudential Business Cycle Fund - Series 2
The investment objective of the Scheme is to provide capital appreciation by predominantly investing in equity and equity related securities with focus on riding business cycles through dynamic allocation between various sectors and stocks.However, there can be no assurance that the investment objective of the Scheme will be realized.
ICICI Prudential Business Cycle Fund - Series 1
The investment objective of the Scheme is to provide capital appreciation by predominantly investing in equity and equity related securities with focus on riding business cycles through dynamic allocation between various sectors and stocks.However, there can be no assurance that the investment objective of the Scheme will be realized.
ICICI Prudential Nifty iWIN ETF
The investment objective of the Schemes is to provide returns before expenses that closely correspond to the total return of the Underlying Index, subject to tracking errors. However, there can be no assurance or guarantee that the investment objective of the Scheme would be achieved.
ICICI Prudential Nifty Next 50 Index Fund (Erstwhile ICICI Prudential Nifty Junior Index Fund)
The investment objective of the Scheme is to invest in companies whose securities are included in Nifty Next 50 Index (the Index) and to endeavor to achieve the returns of the above index as closely as possible, though subject to tracking error. The Scheme will not seek to outperform the Nifty Next 50. The objective is that the performance of the NAV of the Scheme should closely track the performance of the Nifty Next 50 over the same period subject to tracking error. However, there is no assurance that the investment objective of the Scheme will be realized.
ICICI Prudential Regular Gold Savings Fund
ICICI Prudential Regular Gold Savings Fund (the Scheme) is a fund of funds scheme with the primary objective to generate returns by investing in units of ICICI Prudential Gold iWIN ETF (IPru Gold ETF). However, there can be no assurance that the investment objective of the Scheme will be realized.
ICICI Prudential Gold iWIN ETF
ICICI Prudential Gold iWIN ETF seeks to provide investment returns that, before expenses, closely track the performance of domestic prices of Gold derived from the LBMA AM fixing prices. However, the performance of the Scheme may differ from that of the underlying gold due to tracking error. There can be no assurance or guarantee that the investment objective of the Scheme will be achieved. The fund is not actively managed. It does not engage in any activities designed to obtain a profit from, or to ameliorate losses caused by, changes in the price of gold.
ICICI Prudential Midcap Select iWIN ETF
The investment objective of the scheme is to provide returns before expenses that closely correspond to the total return of the underlying index subject to tracking errors.However, there can be no assurance or guarantee that the investment objective of the Scheme would be achieved.
ICICI Prudential Sensex iWIN ETF (Erstwhile SENSEX Prudential ICICI Exchange Traded Fund)
The investment objective of the “SPIcE” is to provide investment returns that, before expenses, closely correspond to the total returns of the securities as represented by the S&P BSE SENSEX. However, the performance of Scheme may differ from that of the underlying index due to tracking error. There can be no assurance or guarantee that the investment objective of the Scheme will be achieved.
ICICI Prudential Nifty Low Vol 30 iWIN ETF
The investment objective of the scheme is to provide returns before expenses that closely correspond to the total return of the underlying index, subject to tracking errors.However, there can be no assurance that the investment objective of the scheme will be realized.
ICICI Prudential Sensex Index Fund
An open-ended index linked growth scheme seeking to track the returns of S&P BSE Sensex Index through investments in a basket of stocks drawn from the constituents of the above index.The objective of the Scheme is to invest in companies whose securities are included in S&P BSE Sensex Index and subject to tracking errors, to endeavor to achieve the returns of the above index as closely as possible. This would be done by investing in all the stocks comprising the S&P BSE Sensex Index in approximately the same weightage that they represent in S&P BSE Sensex Index. The Scheme will not seek to outperform the S&P BSE Sensex Index or to underperform it. The objective is that the performance of the NAV of the Scheme should closely track the performance of the S&P BSE Sensex Index over the same period. However, there can be no assurance that the investment objective of the Scheme will be realized.
ICICI Prudential India Recovery Fund - Series 5
The investment objective of the Scheme is to provide capital appreciation by investing in equity and equity related securities that are likely to benefit from recovery in the Indian economy.However, there can be no assurance that the investment objectives of the Scheme will be realized.
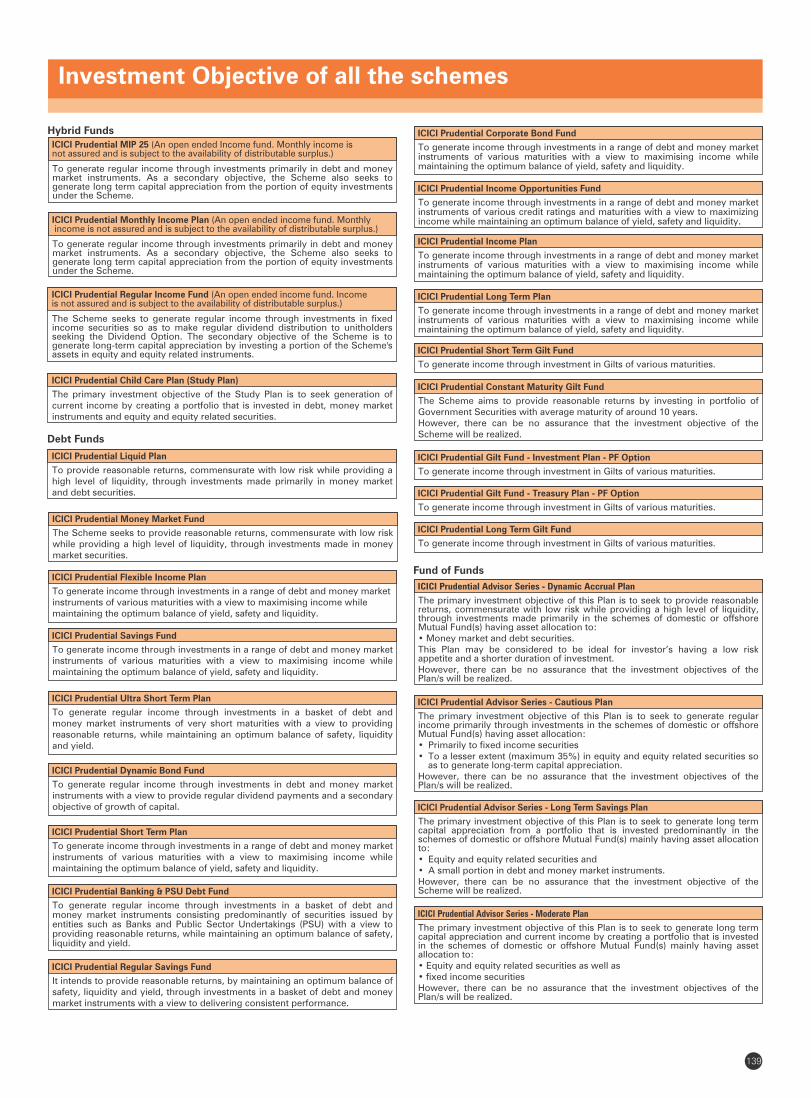
Investment Objective of all the schemes
139
ICICI Prudential Advisor Series - Long Term Savings Plan
The primary investment objective of this Plan is to seek to generate long term capital appreciation from a portfolio that is invested predominantly in the schemes of domestic or offshore Mutual Fund(s) mainly having asset allocation to: • Equity and equity related securities and • A small portion in debt and money market instruments. However, there can be no assurance that the investment objective of the Scheme will be realized.
ICICI Prudential Advisor Series - Cautious Plan
The primary investment objective of this Plan is to seek to generate regular income primarily through investments in the schemes of domestic or offshore Mutual Fund(s) having asset allocation: • Primarily to fixed income securities • To a lesser extent (maximum 35%) in equity and equity related securities so
as to generate long-term capital appreciation. However, there can be no assurance that the investment objectives of the Plan/s will be realized.
ICICI Prudential Advisor Series - Moderate Plan
The primary investment objective of this Plan is to seek to generate long term capital appreciation and current income by creating a portfolio that is invested in the schemes of domestic or offshore Mutual Fund(s) mainly having asset allocation to: • Equity and equity related securities as well as • fixed income securities However, there can be no assurance that the investment objectives of the Plan/s will be realized.
ICICI Prudential Long Term Gilt Fund
To generate income through investment in Gilts of various maturities.
ICICI Prudential Gilt Fund - Treasury Plan - PF Option
To generate income through investment in Gilts of various maturities.
Fund of Funds
ICICI Prudential Advisor Series - Dynamic Accrual Plan
The primary investment objective of this Plan is to seek to provide reasonable returns, commensurate with low risk while providing a high level of liquidity, through investments made primarily in the schemes of domestic or offshore Mutual Fund(s) having asset allocation to: • Money market and debt securities.This Plan may be considered to be ideal for investor’s having a low risk appetite and a shorter duration of investment. However, there can be no assurance that the investment objectives of the Plan/s will be realized.
ICICI Prudential Gilt Fund - Investment Plan - PF Option
To generate income through investment in Gilts of various maturities.
ICICI Prudential Constant Maturity Gilt Fund
The Scheme aims to provide reasonable returns by investing in portfolio of Government Securities with average maturity of around 10 years. However, there can be no assurance that the investment objective of the Scheme will be realized.
ICICI Prudential Long Term Plan
To generate income through investments in a range of debt and money market instruments of various maturities with a view to maximising income while maintaining the optimum balance of yield, safety and liquidity.
ICICI Prudential Short Term Gilt Fund
To generate income through investment in Gilts of various maturities.
ICICI Prudential Income Plan
To generate income through investments in a range of debt and money market instruments of various maturities with a view to maximising income while maintaining the optimum balance of yield, safety and liquidity.
ICICI Prudential Corporate Bond Fund
To generate income through investments in a range of debt and money market instruments of various maturities with a view to maximising income while maintaining the optimum balance of yield, safety and liquidity.
ICICI Prudential Income Opportunities Fund
To generate income through investments in a range of debt and money market instruments of various credit ratings and maturities with a view to maximizing income while maintaining an optimum balance of yield, safety and liquidity.
ICICI Prudential Child Care Plan (Study Plan)
The primary investment objective of the Study Plan is to seek generation of current income by creating a portfolio that is invested in debt, money market instruments and equity and equity related securities.
ICICI Prudential Regular Income Fund (An open ended income fund. Incomeis not assured and is subject to the availability of distributable surplus.)
The Scheme seeks to generate regular income through investments in fixed income securities so as to make regular dividend distribution to unitholders seeking the Dividend Option. The secondary objective of the Scheme is to generate long-term capital appreciation by investing a portion of the Scheme's assets in equity and equity related instruments.
ICICI Prudential Short Term Plan
To generate income through investments in a range of debt and money market instruments of various maturities with a view to maximising income while maintaining the optimum balance of yield, safety and liquidity.
ICICI Prudential Banking & PSU Debt Fund
To generate regular income through investments in a basket of debt and money market instruments consisting predominantly of securities issued by entities such as Banks and Public Sector Undertakings (PSU) with a view to providing reasonable returns, while maintaining an optimum balance of safety, liquidity and yield.
ICICI Prudential Regular Savings Fund
It intends to provide reasonable returns, by maintaining an optimum balance of safety, liquidity and yield, through investments in a basket of debt and money market instruments with a view to delivering consistent performance.
ICICI Prudential Dynamic Bond Fund
To generate regular income through investments in debt and money market instruments with a view to provide regular dividend payments and a secondary objective of growth of capital.
ICICI Prudential Ultra Short Term Plan
To generate regular income through investments in a basket of debt and money market instruments of very short maturities with a view to providing reasonable returns, while maintaining an optimum balance of safety, liquidity and yield.
Debt Funds
ICICI Prudential Liquid Plan
To provide reasonable returns, commensurate with low risk while providing a high level of liquidity, through investments made primarily in money market and debt securities.
ICICI Prudential Money Market Fund
The Scheme seeks to provide reasonable returns, commensurate with low risk while providing a high level of liquidity, through investments made in money market securities.
ICICI Prudential Savings Fund
To generate income through investments in a range of debt and money market instruments of various maturities with a view to maximising income while maintaining the optimum balance of yield, safety and liquidity.
ICICI Prudential Flexible Income Plan
To generate income through investments in a range of debt and money marketinstruments of various maturities with a view to maximising income whilemaintaining the optimum balance of yield, safety and liquidity.
ICICI Prudential Monthly Income Plan (An open ended income fund. Monthly income is not assured and is subject to the availability of distributable surplus.)
To generate regular income through investments primarily in debt and money market instruments. As a secondary objective, the Scheme also seeks to generate long term capital appreciation from the portion of equity investments under the Scheme.
ICICI Prudential MIP 25 (An open ended Income fund. Monthly income isnot assured and is subject to the availability of distributable surplus.)
To generate regular income through investments primarily in debt and money market instruments. As a secondary objective, the Scheme also seeks to generate long term capital appreciation from the portion of equity investments under the Scheme.
Hybrid Funds
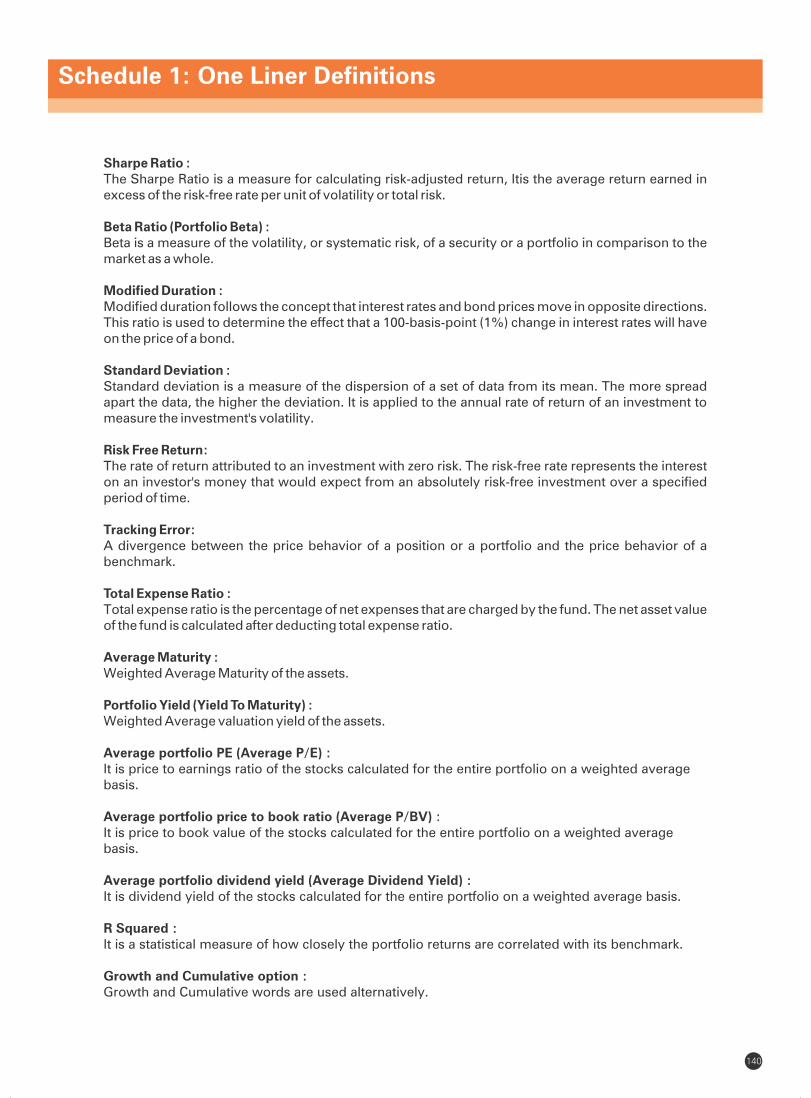
Schedule 1: One Liner Definitions
Sharpe Ratio :The Sharpe Ratio is a measure for calculating risk-adjusted return, Itis the average return earned in excess of the risk-free rate per unit of volatility or total risk.
Beta Ratio (Portfolio Beta) :Beta is a measure of the volatility, or systematic risk, of a security or a portfolio in comparison to the market as a whole.
Modified Duration :Modified duration follows the concept that interest rates and bond prices move in opposite directions. This ratio is used to determine the effect that a 100-basis-point (1%) change in interest rates will have on the price of a bond.
Standard Deviation :Standard deviation is a measure of the dispersion of a set of data from its mean. The more spread apart the data, the higher the deviation. It is applied to the annual rate of return of an investment to measure the investment's volatility.
Risk Free Return:The rate of return attributed to an investment with zero risk. The risk-free rate represents the interest on an investor's money that would expect from an absolutely risk-free investment over a specified period of time.
Tracking Error:A divergence between the price behavior of a position or a portfolio and the price behavior of a benchmark.
Total Expense Ratio : Total expense ratio is the percentage of net expenses that are charged by the fund. The net asset value of the fund is calculated after deducting total expense ratio.
Average Maturity : Weighted Average Maturity of the assets.
Portfolio Yield (Yield To Maturity) : Weighted Average valuation yield of the assets.
Average portfolio PE (Average P/E) :It is price to earnings ratio of the stocks calculated for the entire portfolio on a weighted average basis.
Average portfolio price to book ratio (Average P/BV) : It is price to book value of the stocks calculated for the entire portfolio on a weighted average basis.
Average portfolio dividend yield (Average Dividend Yield) :It is dividend yield of the stocks calculated for the entire portfolio on a weighted average basis.
R Squared : It is a statistical measure of how closely the portfolio returns are correlated with its benchmark.
Growth and Cumulative option :Growth and Cumulative words are used alternatively.
140
Schedule 2: How To Read Factsheet
Fund Manager :An employee of the asset management company such as a mutual fund or life insurer, who manages investments of the scheme. He is usually part of a larger team of fund managers and research analysts.
Application Amount for Fresh Subscription :This is the minimum investment amount for a new investor in a mutual fund scheme.
Minimum Additional Amount :This is the minimum investment amount for an existing investor in a mutual fund scheme.
Yield to Maturity :The Yield to Maturity or the YTM is the rate of return anticipated on a bond if held until maturity. YTM is expressed as an annual rate. The YTM factors in the bond's current market price, par value, coupon interest rate and time to maturity.
SIP :SIP or systematic investment plan works on the principle of making periodic investments of a fixed sum. It works similar to a recurring bank deposit. For instance, an investor may opt for an SIP that invests Rs 500 every 15th of the month in an equity fund for a period of three years.
NAV :The NAV or the net asset value is the total asset value per unit of the mutual fund after deducting all related and permissible expenses. The NAV is calculated at the end of every business day. It is the value at which the investor enters or exits the mutual fund.
Benchmark :A group of securities, usually a market index, whose performance is used as a standard or benchmark to measure investment performance of mutual funds, among other investments. Some typical benchmarks include the Nifty, Sensex, BSE200, BSE500, 10-Year Gsec.
Entry Load :A mutual fund may have a sales charge or load at the time of entry and/or exit to compensate the distributor/agent. Entry load is charged at the time an investor purchases the units of a mutual fund. The entry load is added to the prevailing NAV at the time of investment. For instance, if the NAV is Rs. 100 and the entry load is 1 %, the investor will enter the fund at Rs. 101. Note: SEBI, vide circular dated June 30, 2009 has abolished entry load and mandated that the upfront commission to distributors will be paid by the investor directly to the distributor, based on his assessment of various factors including the service rendered by the distributor.
Exit Load :Exit load is charged at the time an investor redeems the units of a mutual fund. The exit loadis reduced from the prevailing NAV at the time of redemption. The investor will receiveredemption proceed at net value of NAV less Exit Load. For instance if the NAV is Rs.100and the exit load is 1%, the investor will receive Rs.99
Modified Duration :Modified duration is the price sensitivity and the percentage change in price for a unit change in yield.
Standard Deviation :Standard deviation is a statistical measure of the range of an investment's performance. When a mutual fund has a high standard deviation, its means its range of performance is wide, implying greater volatility.
Sharpe Ratio :The Sharpe Ratio, named after its founder, the Nobel Laureate William Sharpe, is a measure of risk-adjusted returns. It is calculated using standard deviation and excess return to determine reward per unit of risk.
141
Beta Ratio (Portfolio Beta) :Beta is a measure of an investment's volatility vis-a-vis the market. Beta of less than 1 means that the security will be less volatile than the market. A beta of greater than 1 implies that the security's price will be more volatile than the market.
Average portfolio PE (Average P/E) :It is price to earnings ratio of the stocks calculated for the entire portfolio on a weighted average basis.
Average portfolio price to book ratio (Average P/BV) : It is price to book value of the stocks calculated for the entire portfolio on a weighted average basis.
Average portfolio dividend yield (Average Dividend Yield) :It is dividend yield of the stocks calculated for the entire portfolio on a weighted average basis.
Net Equity : Net equity level is the net equity exposure percentage adjusted for any derivative positions in stocks or index for hedging or rebalancing purpose.
R Squared : It is a statistical measure of how closely the portfolio returns are correlated with its benchmark.
AUM :AUM or assets under management refers to the recent / updated cumulative market value of investments managed by a mutual fund or any investment firm.
Holdings :The holdings or the portfolio is a mutual fund's latest or updated reported statement of investments/securities. These are usually displayed in terms of percentage to net assets or the rupee value or both. The objective is to give investors an idea of where their money is being invested by the fund manager.
Nature of Scheme :The investment objective and underlying investments determine the nature of the mutual fund scheme. For instance, a mutual fund that aims at generating capital appreciation by investing in stock markets is an equity fund or growth fund. Likewise, a mutual fund that aims at capital preservation by investing in debt markets is a debt fund or income fund. Each of these categories may have sub-categories.
Rating Profile :Mutual funds invest in securities after evaluating their creditworthiness as disclosed by the ratings. A depiction of the mutual fund in various investments based on their ratings becomes the rating profile of the fund. Typically, this is a feature of debt funds.
Value STP : The ICICI Prudential Value STP is an innovation over the regular STP that enables you to take advantage of market fluctuations; you buy more units when the Net Asset Value (NAV) of your selected scheme falls and lesser units when the NAV rises. The Value STP helps you reach your targeted value for every transfer date, by adding or removing funds from your selected scheme.
Flex STP :ICICI Prudential Transfer Plan (“Flex STP”) is a facility wherein unit holder(s) of designated open-ended Scheme(s) of ICICI Prudential Mutual Fund can opt to transfer variable amount(s) linked to value of investments under Flex STP on the date of transfer at pre-determined intervals from designated open ended Scheme(s) of ICICI Prudential Mutual Fund [hereinafter referred to as “Transferor Scheme”] to the growth option of designated open-ended Scheme(s) of ICICI Prudential Mutual Fund [hereinafter referred to as “Transferee Scheme”].
142

ICICI Prudential Mutual Fund Corporate Office
ONE BKC, A - Wing, 13th Floor, Bandra-Kurla Complex, Mumbai 400 051, India.
Tel: 022 - 26525000 Fax: 022 - 26528100, website: www.icicipruamc.com, email id: [email protected]
Statutory Details & Risk Factors
Mutual Fund investments are subject to market risks, read all scheme related documents carefully.
Disclaimer: In the preparation of the material contained in this document, the Asset Management Company (AMC) has used information that is publicly available, including information developed in-house. Some of the material used in the document may have been obtained from members/persons other than the AMC and/or its affiliates and which may have been made available to the AMC and/or to its affiliates. Information gathered and material used in this document is believed to be from reliable sources. The AMC however does not warrant the accuracy, reasonableness and / or completeness of any information. We have included statements / opinions / recommendations in this document, which contain words, or phrases such as “will”, “expect”, “should”, “believe” and similar expressions or variations of such expressions that are “forward looking statements”. Actual results may differ materially from those suggested by the forward looking statements due to risk or uncertainties associated with our expectations with respect to, but not limited to, exposure to market risks, general economic and political conditions in India and other countries globally, which have an impact on our services and / or investments, the monetary and interest policies of India, inflation, deflation, unanticipated turbulence in interest rates, foreign exchange rates, equity prices or other rates or prices etc.
The AMC (including its affiliates), the Mutual Fund, the trust and any of its officers, directors, personnel and employees, shall not be liable for any loss, damage of any nature, including but not limited to direct, indirect, punitive, special, exemplary, consequential, as also any loss of profit in any way arising from the use of this material in any manner. The recipient alone shall be fully responsible/are liable for any decision taken on this material.
143

Related Documents