The Managed Forest Law & Property Tax Revenues for Townships: Mark Rickenbach, Associate Professor and Extension Specialist Department of Forest Ecology and Management University of Wisconsin-Madison/Extension Luke Saunders, Forest Economist Division of Forestry Wisconsin Department of Natural Resources A Study of Enrollment Shifts & Local Impacts

Welcome message from author
This document is posted to help you gain knowledge. Please leave a comment to let me know what you think about it! Share it to your friends and learn new things together.
Transcript

The Managed Forest Law & Property Tax Revenues for Townships:
Mark Rickenbach, Associate Professor and Extension Specialist Department of Forest Ecology and Management University of Wisconsin-Madison/Extension
Luke Saunders, Forest Economist Division of Forestry Wisconsin Department of Natural Resources
A Study of Enrollment Shifts & Local Impacts

ExEcuTivE SuMMaRy
AckNoWLEDgEMENtS
Funding for this study was provided by the USDA cooperative State Research, Education, and Extension Service, and the Wisconsin Department of Natural Resources. We received thoughtful comments and suggestions from Richard Barrows, tricia knoot, kate Lawton, Rick olin, and Richard Stadelman.
We would like to recognize carol Nielsen (DNR), kathy Nelson (DNR), and Dan Huegel (DoR) for their insights and time related to data preparation and checking. Peter crump and Nick keuler (both UW-Madison) provided computation and statistical support, respectively.
We also thank Ray guries and Dave Marcouiller, who provided critical peer review of the research presented in this publication; Paul DeLong and Robert Mather for comments on an earlier draft of this manuscript; and Arlen Albrecht, Steve Deller, and Dan Huegel for peer review of this publication. the UWEX Environmental Resource center handled publication, layout, design, and production.
the Managed Forest Law (MFL) is a deferred property tax program that provides an
incentive to private landowners to sustainably manage their forests and woodlands.
When land is enrolled in the MFL, annual property taxes are reduced. Until the freezing
of shared revenues1 for counties and municipalities in 2004, these aids essentially
made up any differences in local revenues that might occur due to increases in tax-
exempt property. the purpose of this study was to investigate the effects of shifting
MFL enrollments on township property tax revenues, and how these effects relate to
other property tax metrics.
our study analyzed the effects of hypothetical one-time shifts
in MFL enrollment on mill rates for 1,234 townships. While
not estimates of real change, this analysis provides a general
sense of how enrollments might alter township revenues. key
findings are twofold:
1. the overall mill rate change for a 20% increase in MFL
enrollment was +0.019 mills – or $ 1.90 per $100,000 of
assessed value – with most townships between 0 and
0.1 mills.
2. those townships with greater area in Agricultural Forest
Use classification (“Ag-Forest”) and lower tax base
per capita tended to see a greater impacts when MFL
enrollments changed.
our findings indicate that changing MFL enrollments are
related to mill rate change, but for most townships the
1 Shared revenues have been replaced by county and municipal aids; however, as the time period covered by this analysis spans both programs, we will use “shared revenues” to refer to both. See Olin (2007a) for more information.
The Managed Forest Law & Property Tax Revenues for Townships:A Study of Enrollment Shifts & Local Impacts
2

change is relatively small. Its presence now, but not in the past reflects the capping
of aids to counties and municipalities. School districts, on the other hand, should
not be affected given that state school equalization aid (“school aids”) calculations
remain dynamic.
that some townships are more sensitive than others reflects, in our opinion, a matter
of timing. Ag-Forest went into affect after the freezing of shared revenue. Existing
public lands, and much of MFL and Agricultural Use Valuation (“Ag-Use”) lands were
accounted for under previous dynamic revenue sharing and current payment reflect
these land classifications as they stood in 2003. the same is not true for Ag-Forest,
which started in 2004. Property taxes were reduced on Ag-Forest lands, but there were
no offsets back to municipalities through shared revenues. Ag-Forest does not provide
any in-lieu-of payments such as the fees and taxes associated with the MFL, but does
reflect local land values (which the MFL does not).
overall, forestland is a small portion (< 2.5%) of
Wisconsin’s total equalized value (i.e., property tax
base). However, at the local level, recent changes
related to property taxes and shared revenues can
have disproportional impact. Without dynamic revenue
sharing, some municipalities and counties will see tax
shifts from forest and agricultural classifications to
other land use classes (e.g., commercial, residential),
greater reliance on other revenue sources (e.g., fees, local sale taxes), and/or
commensurate reductions in services. New dollars are unlikely, so one alternative
might be to allow for some form of dynamic revenue sharing that does not exceed
the current total statewide caps, but could change for individual units of government.
Another option would be to set MFL acreage fees at local or regional levels as
opposed to on a statewide basis.
3

Wisconsin’s Managed Forest Law (MFL) is a deferred property tax program that provides an
incentive to private landowners across the state to sustainably manage their forests or woodlands.
When land is enrolled in the MFL, annual property taxes for the landowner are reduced. In 2007, the
average property tax on forestland was approximately $32 per acre. Enrolling land in the MFL
would have reduced this tax burden to, at most, just under $6 per acre (excluding any severance tax
for harvesting timber). This, in turn, implies that local tax revenues to towns, counties, and school
districts would be also reduced. Historically, the State used shared revenues to rebalance local
revenues so that the net effect of deferential tax programs would be zero or close to it. Past studies
indicate that this rebalancing generally worked (Rosner & Barrows 1976; Barrows & Rosner 1984;
Huegel 2000) until shared revenues for municipalities were frozen at 2003 levels in 2004 (Olin
2007a). Around the same time, MFL enrollments continued to increase and the State created a new
property tax classification, Agricultural Forest Classification (“Ag-Forest”), that provided tax relief
to landowners with woodlands adjacent to their agricultural land.
These changes, taken together, fundamentally changed how the MFL and other special property
treatments interact with local revenue. Indeed, the reason for this study reflects these changes and
their potential impacts. From some perspectives there is concern that further MFL enrollments
decrease the tax revenues available to towns and counties and/or shift the tax burden to other
landowners. Others believe that the MFL is being unfairly criticized as forests and woodlands provide
an array of important public benefits, including timber and recreation, and account for a very small
share of all equalized value in the state. The purpose of this study was to begin to understand the
relationship between changing MFL enrollments and township property tax revenues. This
publication shares our findings toward a better understanding of and fostering a dialogue about the
MFL and the relationship between different property tax programs and shared revenues. In doing
so, it speaks to the fundamental relationships between the state and local units of government.
Some readers will be quite familiar with the MFL or particular aspects
of it; however, we also suspect that others will have little knowledge of
it. To provide a common starting point, we will briefly review the program,
its importance and history. We will also place the MFL in the context of
property taxation as a whole. With the MFL in perspective, we then
inTRoducTion
4

describe our data and their analysis, followed by the study findings. In the findings, we emphasize
those characteristics associated with townships that are atypical in terms of MFL enrollment and
projected mill rate (i.e., property tax rate) change. We conclude with a synthesis of the findings and
offer recommendations for both policymakers and others to consider in moving forward.
MFL: a PRiMER1
The Managed Forest Law (Wis. Statutes 77.80) was enacted in 1986…
to encourage the management of private forest lands for the production of future forest crops for commercial use through sound forestry practices, recognizing the objectives of individual property owners, compatible recreational uses, watershed protection, development of wildlife habitat and accessibility of private property to the public for recreational purposes.
To meet this goal, a property tax deferral program was created. Instead of annual property taxes,
MFL participants pay an annual per acre “open” acreage fee. “Open” MFL lands are those that allow
the public access for hunting, fishing, hiking, sight-seeing, and cross-country skiing. Landowners
can opt to close up to 160 acres of their enrolled land to public access to which a higher per acre
fee (i.e., “closed” acreage fee) applies. Landowners, particularly those with small landholdings,
1 This is not a comprehensive review of the MFL. Those seeking additional information on the program and its requirements should visit the DNR’s MFL webpage at www.dnr.state.wi.us/forestry/ftax/mfl.htm
Fee Provision Current Annual Rate or Fee
Government recipient 2006-2007 average payment per MFL acreDNR Municipality County
Acreage Share $ 1.46/acre 80% 20% $0.89
closure Fee $ 5.82/acre 100% $0.98
State contribution $ 0.20/acre 80% 20% $0.20
Yield tax* 5%/harvest 80% 20% $0.57
Non-compliance Fee* $ 250 80% 20% Not available
Withdrawal Fee $ 300 100% Not available
Withdrawal tax* Highly variable 80% 20% $1.25
Initial Average Forest Land tax Rate $24.82
total MFL Payments, Aids $0.98 $2.33 $0.58 $3.89
Net Average tax Base Reduction
$20.93
Table 1. Current Managed Forest Law fee structure and disbursement with statewide average data for 2006-07 (the year used in this analysis)
*Fee provisions reflect changes in MFL due to 2004 Wisconsin Act 228.
5

often choose to close all or some of their land. When commercially valuable timber is harvested
from MFL lands, participants are required to pay a yield tax (roughly 5% of the timber’s value).
Participants enroll their land for either 25 or 50 years, with payment of withdrawal taxes and fees
for early withdrawal from the program. The various fees, taxes, and payments are collected and
distributed among towns, counties, and the DNR in specified ways (Table 1).
Each order, the term used by the DNR to describe an individual MFL entry, must meet certain
ownership size and forest productivity standards. Moreover, each order must have either a
DNR-approved management plan or, in the case of the state’s largest private landowners, a
cooperative management agreement. Management plans outline intended forest practices over the
term of the order (i.e., either 25 or 50 years) and include both recommended and mandatory
practices. Failure to complete mandatory practices can result in removal from the MFL. Until the
recent past (2005), DNR service foresters prepared almost all management plans. Since then
private sector foresters (i.e., “certified plan writers”) provide plan writing services for which the
landowners pay a market-driven fee. The plans, though, must be approved by the DNR.
Sustainable timber production is the primary focus of the MFL as noted above, but it also provides
other benefits and values that people and communities derive from forests. Perhaps the most
important of these other benefits is that the program keeps forests as forests, thus reducing
conversion to other uses that can fragment the forest. This combination of sustainable forest
management and land protection further promote other benefits including clean air, clean water,
wildlife habitat, carbon sequestration, recreational opportunities, and biodiversity. 39% of MFL
lands is open for public non-motorized recreation, including hunting. Closed lands also provide
recreational opportunities for the landowners and those they allow on their land. In the broader
sense, MFL lands contribute to a local visual aesthetic that supports local tourism – particularly in
Northern Wisconsin (Marcouiller & Mace 1999). Protection of environmental outcomes are
incorporated in the MFL: Best Management Practices for Water Quality (BMPs) – practices that
mitigate logging’s effects on lakes, streams, rivers, and wetlands – are required. These practices
are only voluntary on non-MFL private lands.
Taken as a whole, the MFL provides a sustainable supply of wood fiber for the forest industry, while
also advancing many other public benefits such as improved water quality, wildlife habitat, clean
air, and recreation opportunities to name a few. In recognition of these multiple benefits, nearly all
MFL lands are covered by third-party forest certification through the American Tree Farm System,
the Forest Stewardship Council, and/or the Sustainable Forestry Initiative. Forest certification is
6

similar to a “Good Housekeeping Seal of Approval” or an “organic
label” that indicates that the forestlands are well managed in a way
that meets multiple environmental and social goals.
MFL & LocaL PRoPERTy TaxES
Property taxes play a critical role in local government financing.
Townships have lower per capita expenses than counties ($449 vs. $1,186, 2005 statewide averages),
but counties provide far more services – some of which are mandated (e.g., health and human
services). Townships, though, receive a greater percentage of their revenue (43.1% in 2005) from
taxes than do counties (29.4%) (Olin 2007b). School districts are, by far, the largest recipients of
property tax revenue. However, this study assumes, for reasons discussed below, that schools are
not affected by changing MFL enrollments.1
Given the importance of property tax to local communities, any program that reduces property
taxes for a particular land use could potentially reduce revenue to local governments or shift the
tax burden to others. If such a reduction or shift is present, it is also important to consider its
impacts on a community. In the past, research has demonstrated that the MFL has had no real
effect on revenues to counties, school districts, or municipalities. Shared revenues generally covered
any lost property tax revenues (Barrows & Rosner 1984; Huegel 2000). As noted earlier, shared
revenues to municipalities and counties were frozen at 2003 levels in 2004 (Olin 2007a). In essence,
municipalities and counties are receiving the same amount of money they did in 2004 regardless of
changes that, prior to that year, might have altered their portion of shared revenue. School aids,
though, remain dynamic and continue to be adjusted for various preferential property tax programs.
For this reason and data limitations, we did not include school districts in this study.
For townships and counties, though, the assumption of “no net effect” of the MFL, or any other
preferential property tax treatment (e.g., Ag Use, Ag-Forest), is likely no longer true. In this study,
we test this assumption and estimate the effect of different hypothetical shifts in MFL enrollment
on local tax rates (i.e., mill rates). We also investigate how townships that are particularly sensitive
to changing MFL enrollments differ from other, less sensitive townships.
1 For a more in-depth discussion of local government finance in Wisconsin, please refer to Olin (2007a, 2007b), Reschovsky (2002), or Huegel (2000).
7

We studied the relationship between the MFL and township property tax revenue by estimating
how hypothetical one-time shifts in MFL enrollment might change mill rate for nearly all townships
in Wisconsin. It is important to note that our calculations do not estimate real changes in mill rate
or other property tax related values! We make simplifying assumptions and apply our analysis to a
single fiscal year for which complete data exist (2006-07). As a result, our study speaks to the
relationship between changes in MFL enrollments and mill rates, in a general way. As such, our
findings do not discuss individual townships, but consider how townships with different character-
istics fair under changing MFL enrollments. With this in mind, our methods entailed two
components1: (1) scenario development and (2) data analysis.
ScEnaRio dEvELoPMEnT
We created four scenarios to estimate how fixed percentage shifts (i.e., -20% -10%, +10% and +20%)
in MFL enrollment might effect township mill rates. Basically, we enrolled or withdrew MFL acres
and then estimated a new mill rate given existing tax formulas and realistic assumptions. While all
the data sources, calculations, and assumptions are detailed elsewhere (Saunders 2008), we
summarize key aspects below. Chief among these are accounting for the acreage shifts, changing
MFL payments and land valuation, and estimating the “new” mill rate.
/ Acres In, Acres Out
We compiled 2006-07 data from both the DNR and DOR for 1,234 townships2. Villages and cities
were excluded from the analysis as they comprise a very small portion of all MFL acres and our
analysis was intended to compare across similar units of governments. Based on these data we
implemented four scenarios based on the local MFL enrollments present in each township for fiscal
year 2006-07. By transferring land into or out of the MFL, acres needed to be withdrawn or added to
a different land category. For this analysis, all transfers were removed from or added to the “Other
Forest” category. This was a simplifying assumption as more complex transfers (e.g., shifts across
residential, commercial, etc.) were beyond the scope of this study. Transfers under each scenario
were also subject to MFL enrollment constraints and recent legislative changes (Wisconsin Act 228).
Notably, we consider only changes to the MFL and not to the Forest Crop Law (FCL).
1 The full description of the methods is presented in Saunders (2008).2 This does not include all townships; see Saunders (2008) for details.
STudy METHodS
8

/ MFL Payments
By statute, 80% of MFL payments are remitted to townships and other municipalities with the
remaining 20% going to counties (see Table 1). Using the acreage shifts, we estimated the increase
or decrease in MFL payments for each scenario. In doing so, though, we made three assumptions to
simplify the calculations and data acquisition.
1. We did not include the Withdrawal Tax as revenue back to townships when we removed
acres from the MFL (Scenarios -10% and -20%). The withdrawal tax is highly variable and
depends on parcel specific data, and as such are difficult to estimate. In addition, it is a
one-time payment and not a continuing source of revenue. Withdrawals of long-enrolled MFL
lands can result in a substantial windfall, but this is outside the scope of this study. The
Withdrawal Fee ($300) is remitted to the DNR and does not affect payments to localities.
2. We did not include the payment of non-compliance fee ($250 per non-compliance) to
townships for landowners who fail to complete mandatory practices. DNR foresters certify
to the town chair when a non-compliance fee may be assessed against an MFL landowner.
The local municipality sends the bill for the non-compliance fee directly to the landowner
and receives the money. Unpaid non-compliance fees may be placed on a landowner’s
annual property tax bill as a special charge.
3. We estimated increases and decreases in Yield Tax payment based on the 2006-07 statewide
average of 57¢ per acre. Yield Tax payment are prone to fluctuate from year to year,
especially at the township level. For example, a township might received $1,000 in one year
and $5,000 the next, due to the timing of timber harvests in the township. Using the
statewide average balances out the highs and lows.
9

/ Revaluation
Removing acres from the MFL and shifting them into the Other Forest category required us to
estimate their value when returned to the tax base. To do this, we estimated the likely value of MFL
land in townships using the equalized value of the Other Forest and Ag-Forest categories. We used
equalized values as opposed to assessed values as the former have been normalized to allow for
comparison across all townships present in the study (Huegel 2000). We estimated the average
equalized value of forestland per acre by calculating the weighted average for the Other Forest and
Ag-Forest categories in a given township1. In this calculation, actual 2006-07 Ag-Forest equalized
value was doubled since these lands are taxed at 50% of their value. The total acres removed from
the MFL were multiplied by our average equalized value of forestland per acre and that amount
was added to the township’s tax base.
/ Change in Mill Rate
The mill rate calculation is straightforward:
Mill rate change, the measure used in this study, is determined by the relative change in the
numerator (levy) and denominator (total equalized value) of this equation. A shift in MFL enrollments
is likely to cause changes in both total equalized value (e.g., due to loss/gain in Other Forest land to
tax base) and the levy (e.g., due to change in MFL payments), thus shifting the mill rate (Rosner &
Barrows, 1976). Both levy and total equalized value change under our scenarios and the new mill
rate is calculated as follows.
Our levy estimates for each Scenario are the actual 2006-07 levy minus the change in MFL
payments between the actual 2006-07 value and that estimated for each Scenario. In doing this, we
assume that townships do not change their level of services. Our levy estimates are negatively
1 These calculations reflect 70.57 Adjustments that are legislatively defined adjustments necessary to correct for errors in prior years’ assessments. These adjustments are particularly relevant to this study given the creation of the Agricultural Forest land classification in 2004, which has been subject to many 70.57 adjustments due to its newness, changes that took place in its second year, and logistical issues with aligning local assessments with actual Agricultural Forest acreage in order to comply with DOR deadlines. See Saunders (2008) for additional details.
mill rate = levy
total equalized value
new mill rate = levy - change in MFL payments
total equalized value + change in Other Forest equalized value
10

correlated with the percentage shift: More MFL acres means higher MFL payments to the township,
which lowers the township’s levy.
A township’s total equalized value also changes under our Scenarios. Our estimates of total
equalized value are the actual 2006-07 values plus the change in total equalized value, which
reflects the changes in Other Forest acres caused by the Scenarios. As MFL enrollment increases,
total equalized value is reduced. Lower equalized value means there is a smaller tax base.
Since our analysis depends on the change in mill rate, we subtract the estimated new mill rate for a
given Scenario from the actual mill rate of 2006-07. This change in mill rate is our proxy for assessing
the relationship between MFL enrollment and local tax revenue.
11
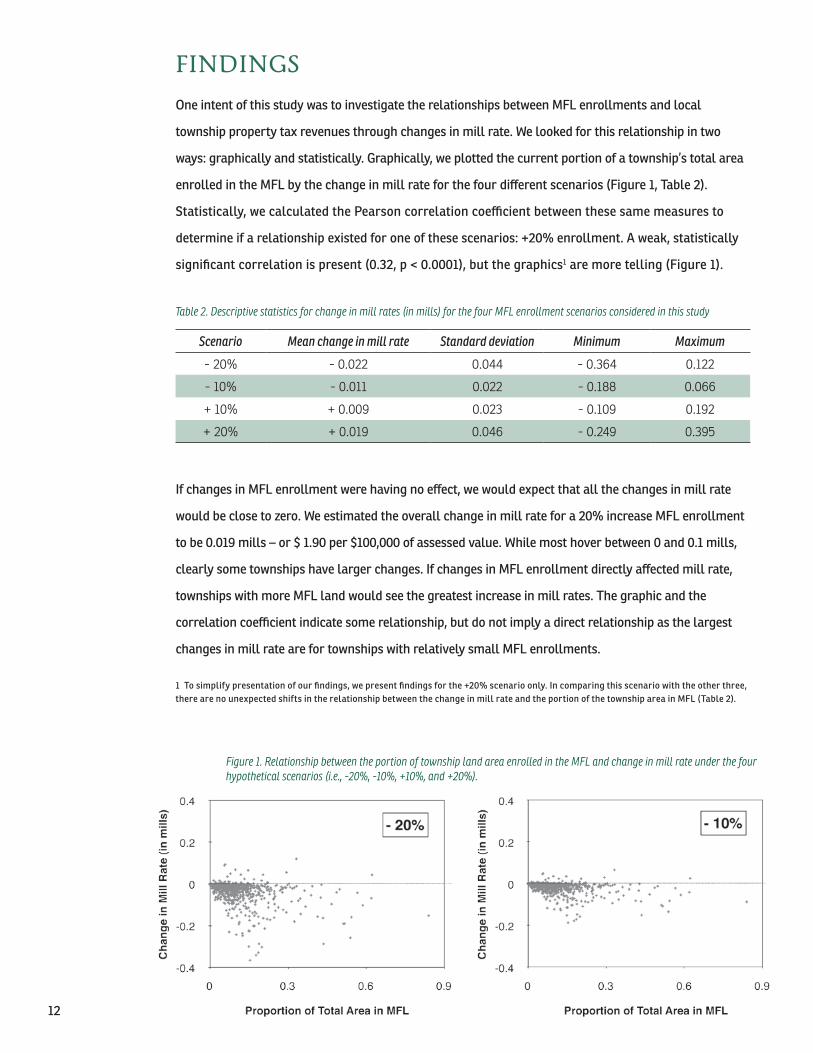
One intent of this study was to investigate the relationships between MFL enrollments and local
township property tax revenues through changes in mill rate. We looked for this relationship in two
ways: graphically and statistically. Graphically, we plotted the current portion of a township’s total area
enrolled in the MFL by the change in mill rate for the four different scenarios (Figure 1, Table 2).
Statistically, we calculated the Pearson correlation coefficient between these same measures to
determine if a relationship existed for one of these scenarios: +20% enrollment. A weak, statistically
significant correlation is present (0.32, p < 0.0001), but the graphics1 are more telling (Figure 1).
If changes in MFL enrollment were having no effect, we would expect that all the changes in mill rate
would be close to zero. We estimated the overall change in mill rate for a 20% increase MFL enrollment
to be 0.019 mills – or $ 1.90 per $100,000 of assessed value. While most hover between 0 and 0.1 mills,
clearly some townships have larger changes. If changes in MFL enrollment directly affected mill rate,
townships with more MFL land would see the greatest increase in mill rates. The graphic and the
correlation coefficient indicate some relationship, but do not imply a direct relationship as the largest
changes in mill rate are for townships with relatively small MFL enrollments.
1 To simplify presentation of our findings, we present findings for the +20% scenario only. In comparing this scenario with the other three, there are no unexpected shifts in the relationship between the change in mill rate and the portion of the township area in MFL (Table 2).
FindingS
Scenario Mean change in mill rate Standard deviation Minimum Maximum
- 20% - 0.022 0.044 - 0.364 0.122
- 10% - 0.011 0.022 - 0.188 0.066
+ 10% + 0.009 0.023 - 0.109 0.192
+ 20% + 0.019 0.046 - 0.249 0.395
Table 2. Descriptive statistics for change in mill rates (in mills) for the four MFL enrollment scenarios considered in this study
Figure 1. Relationship between the portion of township land area enrolled in the MFL and change in mill rate under the four hypothetical scenarios (i.e., -20%, -10%, +10%, and +20%).
12

Past studies (e.g., Rosner & Barrows 1976, Barrows & Rosner 1984)
have relied on selecting and analyzing communities that might be
more or less sensitive to shifting program enrollment. We did
something similar, but applied it to all the townships in the study as
opposed to selecting case examples. To do this, we identified four
quadrants that segregate townships by MFL enrollment and estimated
change in mill rate. For change in mill rate, we separated those with
the top 5% change (0.097 mills or more) from the remaining 95%
(Figure 2, horizontal line). Realizing that townships with high MFL
enrollment might differ from those with less, we also separated the
top 5% of townships by portion of land area enrolled in the MFL
(22.6% or more) from the other 95% (Figure 2, vertical line). These
two lines create four quadrants on which all subsequent analysis is performed (Figure 2, Table 3).
Although differences between any two quadrants may be interesting, we focus our attention on the
differences between those townships with similar portions of MFL enrollments, but with different
sensitivities to enrollment change (i.e., I vs II and III vs IV in Figure 2). This allows us to analyze how
Quadrant N Portion of town in MFL
Mean mill rate change
(in mills)
Change in town-purpose property tax ($200,000
value property)
I. typical enrollment & sensitivity 1,125 6.0% 0.011 $ 2.20
II. typical enrollment & high sensitivity 47 14.2% 0.179 $ 35.80
III. High enrollment & typical sensitivity 47 34.5% 0.012 $ 2.40
IV. High enrollment & sensitivity 15 37.7% 0.162 $ 32.40
ALL toWNS 1,234 7.7% 0.019 $ 3.80
Table 3. Descriptive statistics for the Quadrants in the +20% MFL enrollment
Figure 2. Relationship between the portion of township land area enrolled in the MFL and change in mill rate under the +20% scenarios and showing the four quadrants that are the basis for analysis.
13

other factors identified in past research might be useful in understanding what is going on. These
other factors include other tax-exempt lands (i.e., Ag-Use, Ag-Forest, and public lands), tax base
per capita, and shared revenue. All data are for the 2006-07 state fiscal year.
Testing for differences among quadrants was a two-step process. We first applied a statistical test
(i.e., unbalanced analysis of variance [ANOVA]) to determine if at least one of the four quadrant
means for a given factor was different from the other three. If this first test was significant1, we then
applied a second test that indicated which quadrant means were different from each other for that
same factor (i.e., pairwise comparisons using Bonferroni test). For each factor, we report the test
results and briefly describe them. Please note that in some cases, a significant ANOVA test may not
always result in significant pairwise comparison, particularly when the test’s p-value (i.e., measure
of significance) is very close to the designated cut off. For simplicity, we will refer to quadrants
using either their Roman numerals or brief descriptions described in Table 3.
agRicuLTuRaL uSE vaLuE cLaSSiFicaTion
The MFL is not the only land use in Wisconsin that receives special property tax treatment. In 1995,
the state created the Agricultural Use Value Classification for productive agricultural land (1995
Wisconsin Act 27). In 2006-07, the average portion of the study townships in Ag-Use was 41.7%. The
ANOVA test for this factor was significant (i.e., the mean portion of land in Ag-Use for at least one
quadrant was different from the rest) (Table 4). However, the subsequent pairwise comparisons for
1 All statistical tests are conducted with = 0.05
Proportion of total town area inAg-Use Ag-Forest Public Lands
overall mean 41.7% 6.8% 14.4%p-value* < 0.0001 < 0.0001 0.0990
Quadrant**
I. typical enrollment & sensitivity 43.1%A 6.8%A
II. typical enrollment & high sensitivity 50.6%A 11.7%B
III. High enrollment & typical sensitivity 8.8%B 3.8%c
IV. High enrollment & sensitivity 15.1%B 5.0%A, c
* P-value is for unbalanced ANoVA that tests for at least one difference between quadrant means. Bold value is significant at = 0.05.** Quadrant means are presented when ANoVA is significant. Means with different superscripts (A, B, c) are statistically different from each other.
Table 4. Results of unbalanced ANOVA and subsequent pairwise comparisons by Quadrants for different land use classifications in a town.
14

quadrant means indicated only intuitive differences. The two typical MFL enrollment quadrants
(i.e., I and II) were statistically different from the two high MFL enrollment ones (i.e., III and IV), but
there was no difference within the enrollment categories (i.e., typical versus high sensitivity).
This finding suggests that a greater proportion of land in Ag-Use makes townships sensitive to MFL
enrollment changes. However, it does not shed light on why some townships within the same
enrollment quadrants are more or less sensitive in their response to shifts in MFL enrollment.
agRicuLTuRaL FoREST cLaSSiFicaTion
Agricultural Forest Classification yields perhaps the most compelling finding of this study. Ag-Forest
was created in 2004 to provide tax relief to landowners of woodlands adjacent to agricultural lands
for whom property taxes on those woodlands were skyrocketing. For lands in Ag-Forest, property
taxes are reduced to 50% of their value as Other Forest land. The ANOVA test was significant and
subsequent pairwise comparisons between quadrants yielded more useful insights than those for
Ag-Use. Those townships with typical MFL enrollment and high sensitivity had a greater portion of
their land area (11.7%) in Ag-Forest than did all other quadrants (Table 4). Notably, for quadrants
with typical MFL enrollments (i.e., I & II) highly sensitive townships had nearly twice as much land
in Ag-Forest than those with typical sensitivity (11.7% vs 6.8%). As we discuss further below, Ag-Forest
provides useful insights for understanding the interplay between MFL enrollment and changes in
mill rate as shown in the scatter plots where quadrant II (i.e., typical MFL enrollment, high sensitivity)
has some of the highest mill rate increases (Figure 2).
PuBLic LandS
If public lands are present in a township, these lands are not on the property tax rolls1. On average,
townships have 14.4% of their land area in public lands. The ANOVA test for differences among
quadrants was not significant (Table 4). This is consistent with past research in Wisconsin (Rosner &
Barrows 1976; Barrows & Rosner 1984; Huegel 2000). We attribute this finding to the fact that since
freezing state revenue formulas, public land acreage statewide has changed very little, and until
2004 any lost tax base was largely offset by payments from shared revenues.
1 Most public lands do provide payments in lieu of taxes to local governments; however, these are not consider in this analysis except as they are incorporated in shared revenues.
15

Tax BaSE PER caPiTa
Tax base per capita is a commonly accepted measure of property wealth (Rosner & Barrows 1976).
Those townships with higher tax base per capita are generally expected to be less sensitive to
increases in tax-exempt or special tax treatments such as the MFL. We used total equalized value as
our measure of tax base. The mean total equalized value per capita for all townships was $105,000,
but the ANOVA test indicated there was at least one difference among quadrants (Table 5).
Subsequent comparisons between quadrants found that typical townships (Quadrant I) had the
same mean value as the overall mean. Notably, those townships with high enrollment and typical
sensitivity had the highest tax base per capita at $151,800. We believe that this is due to large
numbers of second homes in these townships that contribute to the tax base, but not to population.
Townships with typical enrollment, but high sensitivity had the lowest tax base per capita at $69,200.
Those townships with high enrollment and high sensitivity had a mean of $92,200, and spanned the
three other categories likely due to high variability among townships in this quadrant.
Tax base per capita Shared revenue
overall mean $105,000 $48,900
p-value1 0.0001 0.0419
Quadrant2
I. typical enrollment & sensitivity $ 105,000A $ 50,400
II. typical enrollment & high sensitivity $ 69,200B $ 32,900
III. High enrollment & typical sensitivity $ 151,800c $ 32,600
IV. High enrollment & sensitivity $ 92,200A,B,c $ 35,9001 P-value is for unbalanced ANoVA that tests for at least one difference between quadrant means. Bold value is significant at = 0.05.
2 Quadrant means are presented when ANoVA is significant. Means with different superscripts (A, B, c) are statistically different from each other.
Table 5. Results of unbalanced ANOVA and subsequent pairwise comparisons by Quadrants for tax base per capita and shared revenue received.
16

2006-07 SHaREd REvEnuES
As noted previously, shared revenues to local municipalities and counties were frozen at 2003
levels. In 2006-07, the average shared revenue received by all townships was $48,900. The ANOVA
test was significant , but was very close to the study’s threshold for statistical significance
(p = 0.0419; Table 5). This significance, though, did not translate into subsequent significant
differences among quadrants. Townships with typical enrollment and sensitivity received, on
average, the highest amount of shared revenue ($50,400) with the remaining quadrants receiving
between $32,600 and $35,900. This implies that the actual shared revenues a township received is
unrelated to its sensitivity to shifts in MFL enrollment, and likely reflects the fact that shared
revenues are no longer adjusted to changing land use classifications.
17
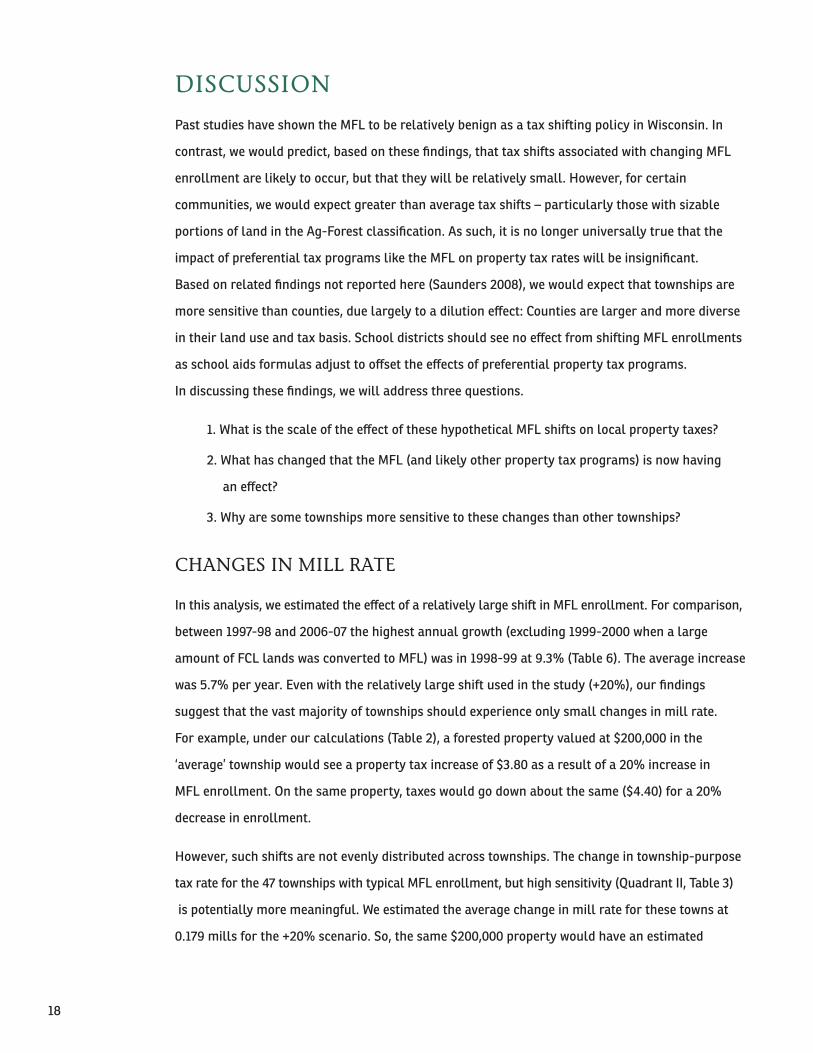
Past studies have shown the MFL to be relatively benign as a tax shifting policy in Wisconsin. In
contrast, we would predict, based on these findings, that tax shifts associated with changing MFL
enrollment are likely to occur, but that they will be relatively small. However, for certain
communities, we would expect greater than average tax shifts – particularly those with sizable
portions of land in the Ag-Forest classification. As such, it is no longer universally true that the
impact of preferential tax programs like the MFL on property tax rates will be insignificant.
Based on related findings not reported here (Saunders 2008), we would expect that townships are
more sensitive than counties, due largely to a dilution effect: Counties are larger and more diverse
in their land use and tax basis. School districts should see no effect from shifting MFL enrollments
as school aids formulas adjust to offset the effects of preferential property tax programs.
In discussing these findings, we will address three questions.
1. What is the scale of the effect of these hypothetical MFL shifts on local property taxes?
2. What has changed that the MFL (and likely other property tax programs) is now having
an effect?
3. Why are some townships more sensitive to these changes than other townships?
cHangES in MiLL RaTE
In this analysis, we estimated the effect of a relatively large shift in MFL enrollment. For comparison,
between 1997-98 and 2006-07 the highest annual growth (excluding 1999-2000 when a large
amount of FCL lands was converted to MFL) was in 1998-99 at 9.3% (Table 6). The average increase
was 5.7% per year. Even with the relatively large shift used in the study (+20%), our findings
suggest that the vast majority of townships should experience only small changes in mill rate.
For example, under our calculations (Table 2), a forested property valued at $200,000 in the
‘average’ township would see a property tax increase of $3.80 as a result of a 20% increase in
MFL enrollment. On the same property, taxes would go down about the same ($4.40) for a 20%
decrease in enrollment.
However, such shifts are not evenly distributed across townships. The change in township-purpose
tax rate for the 47 townships with typical MFL enrollment, but high sensitivity (Quadrant II, Table 3)
is potentially more meaningful. We estimated the average change in mill rate for these towns at
0.179 mills for the +20% scenario. So, the same $200,000 property would have an estimated
diScuSSion
18

increase1 of $35.80. Continuing this example, if we assume that this same township (i.e., typical
MFL enrollment, high sensitivity) originally had the statewide average mill rate for townships:
$2.11 per $1,000 equalized value, the original township-purpose tax for this property was $422.
Under a scenario that increased MFL enrollment by 20%, the township-purpose taxes paid on that
property would increase to $458, an increase of 8.5% over the 2006-07 rate2. At the same time, our
hypothetical 20% increase found 175 townships with decreasing mill rates. Taken together, our
results demonstrate a relationship between MFL enrollment and changes in mill rates, which is not
distributed evenly across all townships.
SHaREd REvEnuES: PaST & PRESEnT
What happened so that special property tax treatments such as the MFL now interact with local tax
rates when in the past they did not (Huegel 2000)? Until 2004, shared revenues did a fairly good job
of balancing the effects of the special property tax treatments (e.g., MFL, Ag-Use). In 2004, though,
Act 109 froze shared revenues at their 2003 level. In addition, the legislature created a new program,
Ag-Forest valuation. The late 1990s and early 2000s were also a time of substantial increases in
1 We would expect a similar decrease for a comparable decrease in MFL enrollment based on Figure 1, but we did not directly calculate this.2 Whether the county-purpose taxes paid would change would depend on MFL enrollments shifts for the county as a whole, and was beyond the scope of this study.
Year Total MFL acres Annual % growth
1997 1,284,700 NA
1998 1,403,475 9.3%
1999 2,006,030 42.9%*
2000 2,026,981 1.0%
2001 2,079,062 2.6%
2002 2,231,154 7.3%
2003 2,417,023 8.3%
2004 2,629,513 8.8%
2005 2,784,889 5.9%
2006 2,843,447 2.1%
* A sizable portion of Forest crop Law (FcL) enrolled lands was transferred to the MFL in 1999, accounting for the large annual growth in MFL acres in that year.
Table 6. Actual annual growth in MFL from 1997 through 2006 (data from DOR).
19

forest land values. As landowners sought lower property taxes through Ag-Forest and MFL,
municipalities and counties saw their tax bases lowered. Under dynamic shared revenue,
municipalities and counties with Ag-Forest and MFL would likely have seen increases in their shared
revenues roughly corresponding to their reduced tax base, but this is no longer happening.
In 2004, the legislature also changed the way MFL fees and taxes were distributed – increasing
payments to municipalities and counties. It is unclear to what extent these changes offset the loss
of shared revenues, but our analysis suggests that they do lessen the impact for townships. However,
this “lessening” depends on the size of the effect, which can be large. Given that the effect varies
across townships with different land use characteristics (e.g., Ag-Use, Ag-Forest) and is not strongly
correlated with MFL enrollment, it is safe to conclude that MFL enrollment is not the only factor
affecting local tax revenues.
coMPounding FacToRS
We examined three different classes of tax-exempt or discounted property; 1) Ag-Use, 2) Ag-Forest,
and 3) public lands. All three basically reduce the local tax base. These reductions and those from
the MFL can only be offset if changes occur in aid and/or in-lieu payments (e.g. acreage fees and
Yield Taxes with the MFL, or increased state aids as occurred prior to 2004). Of the preferential
property tax treatments for private lands, only the MFL contributes any payments in lieu of taxes to
offset the loss in tax base1. If changing MFL enrollments affect mill rates, so should shifts in other
programs that reduce the tax base such as the three other considered in this study. Our findings
show that there was no significant difference among quadrants by public lands, but there were
differences by Ag-Use and Ag-Forest.
Differences by Ag-Use, though, were as one might expect. Those townships with typical MFL
enrollments (i.e., quadrants I and II) differed from those townships with high MFL enrollment, but
there was no difference by sensitivity. This was not true for Ag-Forest, where those townships with
typical enrollment, but high sensitivity had much higher portions of their land in Ag-Forest (11.7%
versus 3.8-6.8% for the other three; Table 4). These townships are also those that are most affected
by MFL enrollment changes based on our analysis (0.179 mills versus 0.011-0.162 mills; Table 3,
Figure 2). This differential effect reflects the interaction between freezing shared revenues and the
creation of the Ag-Forest classification. Ag-Forest did not exist in the last year of dynamic shared
revenues (2003). By 2006, enrollment in Ag-Forest grew to over 2 million acres (Figure 3). On these
1 However, from Table 1, we can see that even these payments do not offset the equalized value lost when land in enrolled in the MFL.
20

lands, property taxes were only half of their equalized value. This is far different from the MFL,
public, and Ag-Use lands that until 2004 were accounted for in dynamic revenue sharing. In addition,
these same townships (typical MFL enrollment, but high sensitivity), also have lower tax bases per
capita (Table 5) than other townships which may further limit revenue growth.
Figure 3. Statewide distribution of “private forest” area across different land classifications (i.e., Managed Forest Law (MFL), Forest Crop Law (FCL), Woodland Crop Law (WCL), Agricultural-Forest Classification (Ag-Forest), and Forestland from 1997-98 to 2006-07.
21

Without dynamic revenue sharing (as is present for school districts), any special property tax
treatment that reduces equalized value will either reduce municipal and county revenues or require
redistribution to other types of land and/or non-property tax revenue sources. Given other caps on
local spending and the unpopularity of new fees and taxes, increasing revenue may be difficult.
Given our assumptions and the limits of our analysis, we cannot pin point which townships might be
most affected. However, this study gives some insights into the effects: they are relatively small
overall, but some places are more affected than others.
In the larger picture, forestland is a small portion of Wisconsin’s total property tax base. Land
classified as Forest and Ag-Forest made up only 1.7% and 0.5% of Wisconsin’s 2006 total equalized
value, respectively. Residential property, in contrast, comprised 72.6% (DOR 2007). This makes
intuitive sense as MFL and other types of forestland often require fewer local services (e.g., police,
social services, etc.) than do other property classifications. In addition, MFL lands, given the
requirement of active management, will likely contribute back to the local economy through the
sale of timber. However, when evaluated locally, it becomes apparent that recent overlapping
changes – in land use, land values, and property tax legislation – have combined to affect tax rates.
Moreover, it is possible that some ‘competing’ preferential taxation treatment, such as the
Ag-Forest, may have at least as much effect as the MFL on changes in local property tax rates for
some rural townships.
Comparing Ag-Forest and the MFL is useful in that they represent two alternative approaches to
property tax incentives. The MFL imposes a statewide fee scale (i.e., open, closed, etc.) based on
statewide averages. It also imposes a yield tax when timber harvesting occurs. As a result, someone
in one place pays the same as someone in another regardless of the local equalized value or services
provided. Ag-Forest, on the other hand, reduces the equalized value – determined locally – by a
fixed percentage. As result, the property taxes collected still reflects local land values. Alternatively,
the MFL provides various in lieu payments that provide some offset for reduced property taxes
(e.g., yield tax, state contribution, etc.), while Ag-Forest does not. Whether one is “better” is beyond
the scope of this study and likely shifts given one’s perspective on property taxes, forests, and
farmland.
Without dynamic revenue sharing, some municipalities and counties will see tax shifts from forest
and agricultural classifications to other land use classes (e.g., commercial, residential), greater
reliance on other revenue sources (e.g., fees, local sale taxes), and/or commensurate reductions in
concLuSionS & iMPLicaTionS
22

services. Without new dollars, one option might be to allow shared revenues to readjust as they
did in the past. The difficulty with this approach is that in rebalancing there would be those towns
and counties that would see reductions in shared revenue payments after a period of relative
stability. Another option might be to allow MFL acreage share and closure fees to be set as a
proportion of local equalized values, thus having payments fluctuate with local value. Similarly,
Ag-Forest (or other special treatments) might institute in lieu of payments such as the MFL yield
tax. What the actual impacts of these or other options might be are not clear and would require
additional study. For example, reducing the benefits of any property tax incentive program will
reduce enrollments, which might have unintended consequences. Anecdotal information suggests
that the MFL and its relative stability are an important consideration for wood products firms
located in the state. If the MFL changes substantially and landowners respond by withdrawal or
choosing not to re-enroll, wood products firms may assess their operations in Wisconsin differently.
As another example, rebalancing current shared revenues could encourage municipalities and
counties to accelerate land use change – either attempting to maximize their access to shared
revenues (e.g., lots of MFL enrollment) or their equalized value to ensure high property tax
revenues. Neither is necessarily a viable trajectory.
Of course, from the local perspective and from that of some stakeholders (e.g., forestry, agricultural),
reinstating dynamic and growing shared revenue would be the preferred alternative. However, that
would exert incredible pressure on the state budget. There is no easy solution, but we believe that
ad hoc, program specific fixes (e.g., change the MFL to…) will not address the root challenges and
only distort impacts. More study and thought are required. We focused on townships, but some
options just described will affect school districts, and other units of governments (i.e., counties, villages,
cities). Any solutions must consider the likely effects (and their equity) to all units of government
(i.e., local and state) and the services they provide, and taxpayers. As such, we believe that a
comprehensive review of property taxation (to which this study contributes) is needed toward just
as comprehensive reform.
23

Barrows, R. & Rosner, M. (1984). The Effect of Public Land on Property Taxes. Madison, Wis: University of Wisconsin-Extension, Cooperative Extension Service.
Huegel, D. (2000). Public lands and property taxes. Madison, WI: Wisconsin Department of Revenue, Division of Research and Analysis.
Marcouiller, D.W. & Mace, T. (1999). Forests and regional development: Economic impacts of woodland use for recreation and timber in Wisconsin. Madison, WI: University of Wisconsin- Extension Cooperative Extension Service G3694.
Olin, R. (2007a). Shared revenue program (county and municipal aid and utility aid) . Madison, WI: Wisconsin Legislative Fiscal Bureau Informational Paper #18.
Olin, R. (2007b). Municipal and county finance. Madison, WI: Wisconsin Legislative Fiscal Bureau Informational Paper #16.
Reschovsky, A. (2002). Wisconsin’s local government finance: A policy primer. Madison, WI: University of Wisconsin-Madison La Follette School of Public Affairs.
Rosner, M.H. & Barrows, R.L. (1976). Public Land, Tax-Exempt Land, and Property Taxes. Madison, WI: University of Wisconsin-Madison College of Agricultural and Life Sciences.
Saunders, L. (2008). Wisconsin’s Managed Forest Law and its Interactions with Local Government Revenue. Madison, WI: University of Wisconsin-Madison Department of Forest and Wildlife Ecology Masters’ Thesis.
REFEREncES
The Managed Forest Law & Property Tax Revenues for Townships:
© 2009 by the Board of Regents of the university of Wisconsin System. university of Wisconsin-Extension is an EEo/affirmative action employer and provides equal opportunities in employment and programming, including Title ix and ada requirements.
graphic Design by Jennifer Lach, UW-Extension Environmental Resources center. Photos by Jeffrey J. Strobel, chad cook and Mark Rickenbach.
Mark Rickenbach, Associate Professor and Extension Specialist Department of Forest Ecology and Management University of Wisconsin-Madison/Extension
Luke Saunders, Forest Economist Division of Forestry Wisconsin Department of Natural Resources
A Study of Enrollment Shifts & Local Impacts
Luke was graduate research assistant in the department of Forest and Wildlife Ecology at the university of Wisconsin-Madison when this study was conducted.
uWEx Publication gWQ52
dnR Publication PuB-FR-432 2009
Related Documents