The Malleability of Personality Traits in Adolescence Rosemary Elkins School of Economics, The University of Sydney Sonja Kassenboehmer Centre for Health Economics (Monash Business School), Monash University Stefanie Schurer School of Economics, The University of Sydney A more recent version of this paper was published as Elkins R, Kassenboehmer S and Schurer S. (2017) The Stability of Personality Traits in Adolescence and Young Adulthood. Journal of Economic Psychology, 60, 37-52 No. 2016-20 September 2016

Welcome message from author
This document is posted to help you gain knowledge. Please leave a comment to let me know what you think about it! Share it to your friends and learn new things together.
Transcript

The Malleability of Personality Traits in Adolescence
Rosemary Elkins School of Economics, The University of Sydney
Sonja Kassenboehmer Centre for Health Economics (Monash Business School), Monash University
Stefanie Schurer School of Economics, The University of Sydney
A more recent version of this paper was published as Elkins R, Kassenboehmer S and Schurer S. (2017) The Stability of Personality Traits in Adolescence and Young Adulthood. Journal of Economic Psychology, 60, 37-52
No. 2016-20September 2016

NON-TECHNICAL SUMMARY
Personality traits have been shown to predict success in areas such as employment, health, social
relationships, and educational attainment. A fundamental assumption in economic decision-making
models is that these personality traits are stable over time and do not change in response to life
experiences. However, these assumptions have rarely been convincingly tested, especially during
adolescence and young adulthood—a critical period of development characterised by dramatic
physical and psychosocial changes.
We want to understand how personality traits evolve over this developmentally interesting period, and
the degree to which personality traits respond to life experiences. This will help us to understand the
value of targeted interventions to shape those non-cognitive skills that are important for positive life
outcomes, such as healthy habits and academic success. For example, should schools and universities
focus on developing non-cognitive skills of their students? Are such investments worthwhile even into
young adulthood when personality is thought to have stabilised?
We focus on the classic ‘Big-Five’ personality traits (conscientiousness, extraversion, openness to
experience, emotional stability, and extraversion) as well as a trait called ‘locus of control’, which
measures how much a person feels they have control over the outcomes in their life. We use large
samples of individuals aged between 15 and 24 from the Household Income and Labour Dynamics in
Australia (HILDA) Survey.
We first observe how the personality traits of our sample change on average over an eight-year period
and how reliable these shifts are. Most personality traits show small and unreliable changes, with two
exceptions. Over the eight-year period, respondents became more conscientious and openness to
experience shows an interesting pattern of change that differs by gender.
Next, we estimated the degree to which a number of life experiences, both positive (e.g. improvement
in finances) and adverse (e.g. death of a close friend), shaped the personality of our sample. Overall,
we find very little evidence that one-off life events systematically influence personality. However,
respondents affected by long-term health problems tended to have a more external locus of control (in
other words, they tended to believe they had less control over the outcomes in their life), and were less
agreeable compared to the rest of the sample.
Finally, we examined how economically meaningful the observed personality changes were, by
calculating the ‘marginal probability effect’ of graduating from university. The average increase in
conscientiousness that we observe over the adolescent period implies a 7% rise in the probability of
obtaining a university degree, which is equivalent to a $7,800 increase in lifetime earnings, although
there are important differences between men and women.
These results are important for benchmarking the effectiveness of interventions designed to boost
non-cognitive skills in adolescence, and give a more nuanced understanding of the assumptions
underlying economic models of decision making.

ABOUT THE AUTHORS
Rosemary Elkins is a Research Assistant at the University of Sydney School of Economics. As
an undergraduate, she studied psychology at the University of Queensland, focussing on
developmental and evolutionary psychology in her Honours research. Since completing her
Master of Economics (Econometrics) at the University of Sydney in 2015, she has worked
under the supervision of Dr Stefanie Schurer. Her research focus is health policy analysis and
non-cognitive skill development. She has a particular interest in research topics that are
policy-focussed and that lie at the intersection between the fields of psychology and
economics. Email: [email protected].
Sonja C. Kassenboehmer is a research fellow at the Centre for Health Economics at Monash
University. Her research focuses on individual well-being (wages, wealth, life satisfaction,
mental health) in the labor market context and on non-cognitive skills and labor market
outcomes. Her articles can be found in such journals as the Economic Journal, Industrial and
Labour Relations Review, Journal of Economic Behaviour and Organization, Economics Letters,
Economic Record and Education Economics. Email: [email protected].
Stefanie Schurer is a Senior Lecturer in the School of Economics at The University of Sydney.
Her main research interest is the Economics of Human Development. Most of her current
research projects explore the evolution of skills, preferences, and health over the life course
and the role that parents and the public sector play in determining these skills. From 2014 to
2016 she will be in a research-only position funded by an ARC Discovery Early Career Research
Award (DECRA) titled "Exceptional upward mobility against all odds: Non-cognitive skills and
early-childhood disadvantage". Email: [email protected].
ACKNOWLEDGEMENTS: The authors acknowledge financial support from an Australian
Research Council Early Career Discovery Program Grant (DE140100463), Australian Research
Council Centre of Excellence for Children and Families over the Life Course (project number
CE140100027) and Monash University (Faculty Grant, Monash Business School). The authors
would like to thank Felix Leung for valuable research assistance.
DISCLAIMER: The content of this Working Paper does not necessarily reflect the views and opinions of the Life
Course Centre. Responsibility for any information and views expressed in this Working Paper lies entirely with the
author(s).
(ARC Centre of Excellence for Children and Families over the Life Course)
Institute for Social Science Research, The University of Queensland (administration node)
UQ Long Pocket Precinct, Indooroopilly, Qld 4068, Telephone: +61 7 334 67477
Email: [email protected], Web: www.lifecoursecentre.org.au

Abstract
Models of economic decision-making usually assume that personality is stable over time. We
assess the validity of this assumption in adolescence and young adulthood using nationally
representative panel data from Australia. Our study shows that mean changes in personality
traits are moderate because most individuals do not change their scores in a statistically
reliable way during adolescence and young adulthood, or changes occur in equal proportions
in opposite directions. The largest changes over an eight-year window are found for
conscientiousness. Its average increase implies a 7% rise in the probability of obtaining a
university degree – equivalent to a $7,800 net increase in lifetime earnings. Youth also reduce
on average their external locus-of-control and extraversion, and increase their agreeableness
and emotional stability. Important gender differences emerge for changes in openness to
experience with increases in this trait over time for males and decreases for females.
Moreover, an examination of the extent to which personality responds to personal or
environmental shocks indicates that intra-individual trait changes are not systematically
predicted by one-off life events. However, the experience of repeated health problems
increases external control perceptions and reduces agreeableness – altering the normal
maturation process of the two traits; we demonstrate that the size of this effect is
economically meaningful.
Keywords: Non-cognitive skills; big five personality traits; locus of control; stability;
adolescence; life events

1
1. IntroductionPersonality traits are an important component of human capital. Often referred to as life or
non-cognitive skills, they comprise a great variety of traits that have positive or negative
productivity effects in school, in the labor market, at the workplace, and in social
relationships (see Almlund et al., 2011 for an overview). Traditionally, personality
psychologists have assumed that personality traits are a stable component of human capital.
Children were assumed to be endowed with a temperament from birth, which was thought to
mature almost deterministically into a stable portfolio of behavioural styles and patterns of
thought in adulthood (Costa and McCrae, 1988; McCrae and Costa, 1994). These
assumptions of stability and deterministic evolution have been criticized in the past decade
(see Roberts et al., 2009). Many empirical studies have since shown that most people
experience increases in their levels of conscientiousness, agreeableness, and emotional
stability between adolescence and young adulthood (e.g. Bleidorn et al. 2013, Hopwood et al.
2011), especially during the process of increased social responsibilities (Roberts et al. 2006).
What is less well understood is whether personality changes stochastically, as a
response to personal or environmental shocks. The question is, are there systematic
deviations from underlying baseline personality traits as a response to shocks or can
personality traits be completely reversed? An oft-cited case is Phineas Gage, a patient who
experienced dramatic changes in his personality following a severe brain injury resulting
from a work accident (Damasio et al., 2005). A small empirical literature has explored the
role of more common life events or ongoing life experiences in explaining personality
change, demonstrating that personality-type reversal observed in patient Gage is certainly not
the norm (Schurer et al., 2015, Cobb-Clark and Schurer, 2012; 2013; Lüdtke et al., 2011;
Specht et al., 2011; 2013).
Even more so, recent work by Cobb-Clark and Schurer (2012, 2013) showed for high-
quality Australian personality data that over shorter time-periods of half a decade, both the
Big-Five personality traits and locus-of-control, two of the most widely researched
personality inventories, are surprisingly stable. Focussing on a working-age population of
ages 25 to 60, they find that trait reversal is not common, and observed trait changes cannot
be meaningfully predicted by individual or aggregated life events. Although personality traits
are not perfectly stable, they can be assumed reasonably fixed and exogenous to most of
income-, health-, and family-related shocks. They conclude that most of the time-varying
characteristics in personality change may be attributable to measurement error.

2
In this article we built on Cobb-Clark and Schurer (2012, 2013) by exploring the
malleability of the Big-Five personality traits and locus-of-control during the sensitive period
of adolescence. Our data allow us to follow over eight years the lives of over 770 adolescents
and young adults aged between 15 and 24 years at baseline assessment. With the analysis, we
will answer the following questions: (1) What are the mean-level changes in personality of
adolescents over an eight-year window?; (2) How many individuals change in a statistically
reliable way, and how many increase or decrease their traits in a significant way?; (3) Are
there important gender differences in personality change?; (4) Which life events – positive or
negative – predict changes in personality traits? and (5) Are the observed changes in any way
economically meaningful?
To conduct the analysis, we use nationally-representative panel data from the
Household, Income, and Labour Dynamics in Australia (HILDA) survey. HILDA has the
advantage that it has three waves of high-quality, consistently measured personality traits in
addition to annually-collected measures of a number of positive (e.g. promoted at work) and
negative (e.g. unemployment) life events. These life-events data are particularly useful given
that some of them may drive what psychologists refer to as ‘non-normative’ changes in
personality, changes that occur to most people in the same way during specific periods of the
life course (McCrae et al., 2000). Moreover, many of these events are outside individuals’
control (e.g. death of a spouse) and thus can be used to capture the important, exogenous
shocks that Seligman (1975) suggests may cause helplessness. We use these life-events data
to gain important insights into the determinants of individuals’ personality change.
We establish that most of the Big-Five personality traits and external locus-of-control
show small to moderate malleability between adolescence and young adulthood. Over an
eight-year window, youth reduce on average their external locus-of-control, and extraversion,
but increase their conscientiousness, agreeableness and emotional stability. Yet, mean
population changes for most of these traits do not exceed 0.15 standard deviations. The
reason for small mean-changes is that 75-85% of individuals do not change their scores in a
statistically reliable way, and for those who do, some decrease and others increase their self-
assessments. The exception is youth conscientiousness, which increases for men and women
by 0.36 standard deviations. The average increase in conscientiousness implies a 5% and
10% increase in the probability of having obtained a university degree – equivalent to a
$6,000 and $12,000 net increase in lifetime earnings – for women and men, respectively.
Intra-individual changes are not predicted by one-off life events. However, the
experience of persistent health problems is significantly associated with an increase in

3
external control tendencies by 0.31 standard deviations and a decrease in agreeableness by
0.23 standard deviations. These effects are economically meaningful as they are equivalent in
magnitude to the treatment effects of education initiatives on personality development (for a
summary see Schurer, 2016). We conclude that conscientiousness in particular – often
referred to as a proxy for executive function (Kern et al., 2009) – evolves strongly between
adolescence and young adulthood, and persistent health problems partially offset the
maturation process of locus of control and agreeableness.
Our results contribute to the literature in two important ways. First, our findings can
be used to benchmark the effectiveness of education programs aimed at boosting life skills
during adolescence (Schurer, 2016 for a review of such outcomes). Second, our findings
demonstrate that – if at all – personality traits in adolescence are not specifically malleable
with respect to shocks, with the exception of consistent effects of ongoing health effects that
have not been demonstrated in the literature before.
The remainder of the paper is as follows: In Section 2 we review the literature on
what is known about mean-level and intra-individual changes in personality. Section 3
describes the HILDA data. In Section 4 we describe the estimation strategy and present our
results. We discuss our findings and contributions to the literature in Section 5.
2. Literature Review
Personality is generally viewed in the economics literature as an alternative skill set that is
reflected in economically-relevant outcomes and decisions in areas such as employment,
educational attainment, and health (Almlund et al., 2011). This conceptualisation of
personality as a set of skills motivates the incorporation of such constructs into economic
decision-making models – a development which enriches our understanding, firstly, of the
complex manner in which personality drives human capital investments and returns, and
secondly, of the value of investing in the enhancement of traits that are important for
producing positive outcomes (Borghans et al., 2008; Heckman et al., 2006). These models
fundamentally assume that such traits are stable and determined exogenously. The validity of
this assumption may be subject to particular scrutiny during the life stages of adolescence and
young adulthood, given that it is a period characterised by dramatic physical and
psychosocial changes including puberty, the development of mature relationships, education
and vocational decisions, and embarking on important social roles and associated adult
responsibilities (Arnett, 2000; Robins et al., 2001). Indeed, it is not only the transition from

4
childhood to adulthood, but also from dependence to independence (Klimstra et al., 2009). In
this section we briefly define the five-factor model of personality and locus-of-control, their
relevance to a range of economically-relevant life outcomes, and the available empirical
evidence about the stability of these constructs during adolescence and young adulthood.
The five-factor personality structure is generally accepted by psychologists as a
meaningful and reliable mechanism for describing and understanding human differences
(Goldberg, 1992, 1993). According to the Dictionary of Psychology of the American
Psychological Association (2007), these five dimensions include: Openness to experience (or
intellect), which is the tendency to be open to new aesthetic, cultural, or intellectual
experiences; conscientiousness, the tendency to be organized, responsible, and hardworking;
extraversion, defined as an orientation of one’s interests and energies toward the outer world
of people and things rather than the inner world of subjective experience, and characterized
by positive affect and sociability; agreeableness, which is the tendency to act in a
cooperative, unselfish manner; and finally, neuroticism, a chronic level of emotional
instability and proneness to psychological distress.
An extensive array of literature has demonstrated the importance of the Big-Five and
locus-of-control both in terms of their value to employers and in terms of the labour market
returns to those who possess certain traits. Higher scores on scales of openness to experience
and extraversion are associated with higher earnings, whilst neuroticism and agreeableness
are negatively associated with earnings and may impair academic performance (Chamorro-
Premuzic and Furnham, 2003; Fletcher, 2013; Gensowski, 2014; Heineck and Anger, 2010;
Mueller and Plug, 2006; Nyhus and Pons, 2005). Conscientiousness is frequently credited as
a super-trait that is associated with better health behaviours, academic performance
(Chamorro-Premuzic and Furnham, 2003; Furnham et al., 2003; Kappe and van der Flier,
2012; Noftle and Robins, 2007; Trapmann et al., 2007) and higher wages at the beginning of
young people’s careers (Fletcher, 2013; Nyhus and Pons, 2005). Agreeableness is closely
related to economic preferences such as reciprocity and altruism (Becker et al. 2012), or
prosociality (Hilbig et al. 2014), and thus has high social benefits.
Although not part of the Big-Five personality inventory, locus-of-control is another
widely researched personality trait that describes a person’s generalised expectancy about the
degree of control they possess over the events and outcomes in their life (Rotter, 1966). An
individual with a tendency to attribute life’s outcomes to their own actions is considered to be
internally controlled – they believe that they will benefit from payoffs to their investments of
effort; in contrast, someone who tends to attribute life’s outcomes to factors outside their

5
control (such as chance or luck), is considered to have an external locus-of-control (Gatz and
Karel, 1993).
Locus-of-control has been the focus of extensive empirical research examining its role
in important health, educational, and labour market outcomes (Cobb-Clark, 2015; Adolfsson,
et al., 2005; Andrisani, 1977; Coleman and DeLeire, 2003; Findley and Cooper, 1983;
Heckman et al., 2006). For example, people who are more internally-controlled earn higher
wages (Heineck and Anger, 2010), have higher workplace satisfaction and motivation (Ng et
al., 2006), and cope more effectively in the face of health shocks (Schurer, 2016) or
unemployment (Caliendo et al., 2015, McGee 2015). Of particular importance to the
adolescent and young-adulthood period of development, the locus-of-control construct is
related to human and health capital investment decisions, success in educational pursuits and
academic performance (Cobb-Clark et al., 2014; Barón and Cobb-Clark, 2010; Coleman and
DeLeire, 2003). Indeed, research has suggested that locus-of-control (and self-esteem) can be
just as important as cognitive skills in predicting such outcomes (Heckman et al., 2006),
reinforcing efforts to account for such constructs in models of human capital.
Though little doubt exists regarding the importance of personality constructs to a vast
array of individual outcomes, not enough is known about the stability of these traits over the
lifecycle, particularly during the developmentally interesting period of adolescence. This lack
of concrete knowledge is problematic because researchers often rely fundamentally on the
assumption that such traits are not just stable over time but also that they are determined
exogenously and therefore not subject to influence by the very outcomes they are often
employed to predict. If we incorrectly assume stability and exogeneity of traits over time, our
models may be subject to bias from reverse causality or simultaneity (Cobb-Clark and
Schurer, 2013).
Psychologists have typically relied on a number of different strategies for evaluating
the consistency of personality traits. Measures of mean-level consistency have been
employed to detect increases or decreases in the average personality score of a group of
people, and is used to study normative changes that occur as a result of typical maturational
or social processes (Roberts et al., 2006). Rank-order consistency, on the other hand, is about
the relative position of peoples’ personality scores over time; a high rank-order consistency
implies that individuals maintain the same relative position to one another over time in their
personality traits (Roberts and Delvecchio, 2000). Mean-level consistency and rank-order
consistency are such that one can exist without the other, with normative change often
characterised by the coexistence of both mean-level changes and stable rank-order (Klimstra

6
et al., 2009). A third and less examined method of evaluating stability is intra-individual
consistency, which is focussed on how traits change within an individual over time. Even if a
trait is mean-level consistent over time, this tells us nothing about how each individual within
the group might be shifting in their traits; for example, if some individuals are increasing on a
trait whilst others are decreasing, this offsetting effect may be largely obscured in group-level
analyses (Cobb-Clark and Schurer, 2013; De Fruyt et al., 2006).
The influential early work by psychologists arguing that personality develops
throughout adolescence and remains relatively stable from age 30 onwards (Costa and
McCrae, 1988; McCrae and Costa, 1994) has been challenged by more recent evidence
suggesting that that mean-level personality changes may occur in samples up until the age of
50 or later (Mroczek and Spiro, 2003; Roberts and Mroczek, 2008; Roberts et al., 2006).
In general, evidence pointing toward patterns of “stability and change” tend to
characterise much of the personality development literature for the adolescent and young
adulthood life stage (Blonigen et al., 2008; De Fruyt et al., 2006; Pullmann et al., 2006;
Robins et al., 2001; Stein et al., 1986). Although there is a lot of heterogeneity across
findings, there is general agreement that individuals tend to demonstrate personality changes
most strongly before they reach working age beyond which they become more consistent
(Cobb-Clark and Schurer, 2012, 2013; Lüdtke et al. , 2011; Pullmann et al., 2006; Specht et
al., 2011), and that the nature of these changes is toward increasing levels of agreeableness,
conscientiousness, and emotional stability (Bleidorn et al., 2013; Roberts et al., 2006; Soto et
al., 2011). Bleidorn et al. (2013) found evidence that such changes were culturally universal,
but also that personality maturity occurred earlier in those cultures with earlier onset of adult
responsibilities. Hopwood et al. (2011) found that twin samples showed particularly salient
intra-individual changes between the ages of 17 and 24, and that these changes continued
until the end of the 20s.
Sex differences in age-related personality maturation are frequently described in such
studies (Branje, 2007; Klimstra et al., 2009; Soto et al., 2011). In one example, Klimstra et al.
found that adolescents demonstrated mean-level increases in agreeableness and emotional
stability, though girls matured earlier than boys. Studies specifically investigating age-related
changes in locus-of-control over the adolescent period are sparse and have also produced
heterogeneous results. Some report that young people become more internally-controlled
over time (Chubb et al., 1997), whilst others suggest that locus-of-control is relatively stable
over the adolescent period (Kulas, 1996).

7
Although these studies tell us about typical patterns of personality maturation over
time, they provide little information about the capacity for personality to respond to
environmental factors or life experiences; in fact, few empirical studies have investigated this
topic convincingly for either the Big-Five traits or locus-of-control. A very recent literature
has emerged on the effectiveness of the education sector in boosting personality traits of
young people (see Schurer, 2016 for a review). One German study exploited a high school
reform that increased learning intensity in an effort to identify whether schooling had a causal
impact on personality change (Dahmann and Anger, 2014). As predicted by the authors, the
reform made individuals more extraverted and neurotic. Another German study tracked 2,000
students over a four-year period from high school to university, vocational training, and work
(Lüdtke et al., 2011), showing that adolescents in vocational training increase their
conscientiousness more, and their agreeableness less, than adolescents who go to university.
Schurer et al. (2015) find no significant difference in the development of conscientiousness
over eight years between university students and adolescents in alternative occupational
pathways, but find a significantly weaker decrease in extraversion for college students.
Other social institutions may also impact on the personality of a whole cohort. A
series of studies on US school children showed that those born between the 1950s and 1990s
increasingly became more anxious and neurotic through a general decline in social
connectedness, measured by divorce rates and crime (Twenge, 2000). China’s One-Child
Policy (OCP) made children born just after the OCP’s introduction in 1979 less
conscientious, more neurotic, and less optimistic relative to children born just before
(Cameron et al., 2013). Macroeconomic conditions are also likely to affect a cohorts’
personality traits; for example, a recent study indicated that young people in the US who
enter the labour market in recessions exhibit fewer narcissistic traits (Bianchi, 2014).
Unemployment was shown to significantly affect personality traits over a four-year period,
such that agreeableness, conscientiousness and openness declined relative to those who were
reemployed (Boyce et al., 2015).
Our study contributes to this literature by investigating the malleability of the Big-
Five personality traits and locus-of-control of a nationally representative sample of Australian
adolescents and young adults between 15 and 24 years of age at baseline in the sensitive
period of adolescence over a time window of eight years. More specifically, we analyse the
contribution of a range of life events – some of them which lie outside individuals’ control
(e.g. death of a spouse, financial shocks) - on changes in personality.

8
3. DataWe conduct our analysis using individual-level data from the nationally representative
Household Income and Labour Dynamics in Australia (HILDA) survey. The HILDA is a
household-based panel survey that began in 2001 with 19,914 individuals from 7,682
households (Summerfield et al., 2014). In 2011 (wave 11), the sample was topped up with a
further 2,153 households and 5,477 individuals. Data is collected annually from all household
members aged 15 and older through face-to-face interviews and self-completion
questionnaires covering a diverse range of social, health, education and economic topics. A
broad set of standard topics are administered annually whilst others rotate periodically every
couple of waves.
3.1.Five Factor Model
HILDA respondents were administered an inventory designed to elicit measures of the Big-
Five personality traits in 2005, 2009, and 2013 (waves 5, 9 and 13, respectively). We thus
restrict our Big-Five sample to those respondents who a) were between 15 and 24 years of
age in 2005 (the Big-Five base year), b) were interviewed in each wave between 2005 and
2013, and c) completed the Big-Five inventory for all three waves in which it was
administered (2005, 2009, and 2013). Of the 2,348 individuals who were aged between 15
and 24 in 2005, only 55% (1,279) were interviewed through to wave 13 – and of these, the
770 respondents who provided complete information for the Big-Five items for all three
waves resulted in our final sample.
The Big-Five personality traits of respondents were measured using a 36-item
personality inventory based on Goldberg (1992) and Saucier’s (1994) trait descriptive
adjective approach. The inventory was included as part of the HILDA self-completion
questionnaire in relevant waves. Respondents are asked to indicate by self-report the degree
to which each of 36 adjectives describe them, on a scale from 1 (“not at all”) to 7 (“very
well”). The adjectives include (see Table A1 for a list):
• Extroversion – talkative, bashful (reversed), quiet (reversed), shy (reversed), lively,
and extroverted.
• Agreeableness – sympathetic, kind, cooperative, and warm.
• Conscientiousness – orderly, systematic, inefficient (reversed), sloppy (reversed),
disorganised (reversed), and efficient.

9
• Emotional stability – envious (reversed), moody (reversed), touchy (reversed), jealous
(reversed), temperamental (reversed), and fretful (reversed).
• Openness to experience – deep, philosophical, creative, intellectual, complex,
imaginative.
Following testing for item reliability and principal components factor analysis, eight items
are discarded on the basis that their reliability is low or their highest loading is not on the
expected factor (see Losoncz, 2009). Thus, the Big-Five personality dimensions
(agreeableness, conscientiousness, emotional stability, extraversion, and openness to
experience) are derived from a total of 28 trait descriptive adjective items, and are considered
to represent personality “at the broadest level of abstraction” (John and Srivastana, 2001).
The five dimensions have a very high internal consistency in terms of identifying one
underlying factor, with Cronbach alphas ranging between 0.75 (openness to experience) and
0.79 (emotional stability). Previous evidence has suggested that the personality of adolescents
can be meaningfully understood through the Big-Five framework, and also that self-report is
a valid and reliable strategy by which to elicit Big-Five traits in this age group (De Fruyt et
al., 2006; Soto et al., 2011).
3.2. Locus-of-control
Data on locus-of-control was collected in 2003, 2004, 2007, and 2011 (waves 3, 4, 7 and 11,
respectively) as part of the self-completion component of the HILDA survey. In a similar
fashion to the Big-Five sample, our locus-of-control sample was thus restricted those who a)
were between 15 and 24 years of age in 2003 (the locus-of-control base year), b) were
interviewed in each wave between 2003 and 2011, and c) provided complete information on
the locus-of-control measures for waves 3, 7, and 11. Of the 2,178 individuals aged between
15 and 24 in wave 3, only 50% (1,090) were interviewed through to wave 11 – of these, we
have complete information on the locus-of-control measures for our final sample of 777
respondents.
In HILDA, respondents’ locus-of-control is elicited using the seven-item Psychological
Coping Resources inventory, which is one component of Pearlin and Schooler's (1978)
Mastery Module. Mastery measures the degree to which a person believes that the outcomes
in their life are under their control. Respondents were asked to indicate by self-report the
extent to which each of seven statements is true of them on a scale of 1 (“strongly disagree”)
to 7 (“strongly disagree”). The seven items are: (a) I have little control over the things that

10
happen to me; (b) There is really no way I can solve some of the problems I have; (c) There is
little I can do to change many of the important things in my life; (d) I often feel helpless in
dealing with the problems of life; (e) Sometimes I feel that I am being pushed around in life
(f) What happens to me in the future mostly depends on me; and (g) I can do just about
anything I really set my mind to do. The seven items have very high internal consistency in
measuring one underlying factor, with a Cronbach alpha of 0.85 (see Table A1 in the
Appendix for individual items and alpha estimates).
Factor analysis suggests that the items load onto two factors, which are generally
interpreted as external (items (a) to (e)) and internal ((f) and (g)) attribution tendencies.
Someone with an internal attribution style has a tendency to believe that life’s outcomes are
attributable to their actions; in other words, they believe they have a lot of control over what
happens to them. A person with external control beliefs, on the other hand, tends to attribute
outcomes in their life to factors outside their control. We create a combined locus-of-control
scale that is increasing in external control tendencies by subtracting the person’s internal
score (the sum of items (f) and (g)) from their external score (the sum of items (a) to (e)) and
adding 16 (Cobb-Clark and Schurer, 2013; Pearlin and Schooler, 1978). Our locus-of-control
scale thus ranges from 7 (completely internal) to 49 (completely external).
4. Estimation Results The aim of our paper is to analyse personality trait stability over the developmentally
interesting periods of adolescence and young adulthood, focussing on the Big-Five taxonomy
and locus-of-control. Here we present our results on: (1) mean-level trait stability over an
eight-year period; (2) variation in trait stability across age and sex; (3) the degree to which
the Big-Five and locus-of-control are responsive to important life events experienced by
individuals; and (4) whether the observed changes are economically meaningful.
4.1. How stable are the Big-Five traits and locus-of-control during adolescence and young
adulthood?
We first examine the degree of stability in personality over adolescence and young adulthood
by calculating the overall mean-level consistency of traits over an eight-year period. Mean-
level consistency measures the degree to which a group increases or decreases on average in
a particular trait over time, and provides a method by which to detect normative changes that
may be driven by typical maturational and social processes (Caspi and Roberts, 1999). We
11
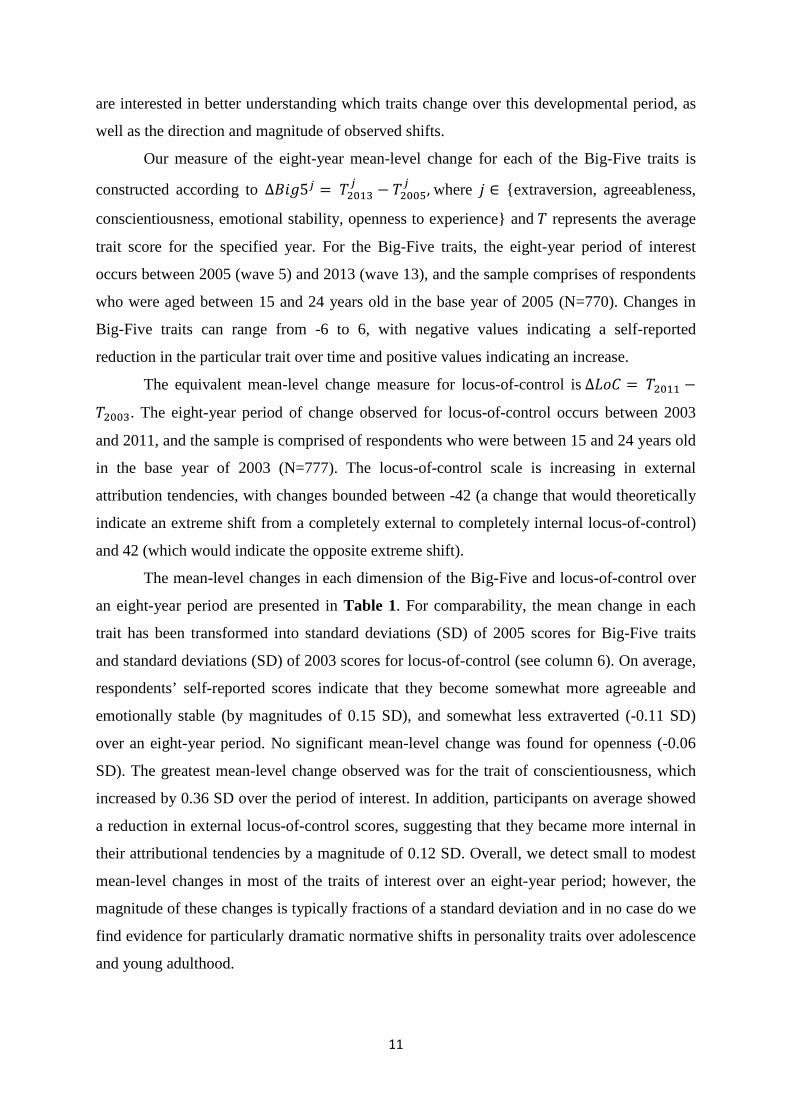
are interested in better understanding which traits change over this developmental period, as
well as the direction and magnitude of observed shifts.
Our measure of the eight-year mean-level change for each of the Big-Five traits is
constructed according to ∆𝐵𝑖𝑔5𝑗 = 𝑇2013𝑗 − 𝑇2005
𝑗 , where 𝑗 ∈ {extraversion, agreeableness,
conscientiousness, emotional stability, openness to experience} and 𝑇 represents the average
trait score for the specified year. For the Big-Five traits, the eight-year period of interest
occurs between 2005 (wave 5) and 2013 (wave 13), and the sample comprises of respondents
who were aged between 15 and 24 years old in the base year of 2005 (N=770). Changes in
Big-Five traits can range from -6 to 6, with negative values indicating a self-reported
reduction in the particular trait over time and positive values indicating an increase.
The equivalent mean-level change measure for locus-of-control is ∆𝐿𝑜𝐶 = 𝑇2011 −
𝑇2003. The eight-year period of change observed for locus-of-control occurs between 2003
and 2011, and the sample is comprised of respondents who were between 15 and 24 years old
in the base year of 2003 (N=777). The locus-of-control scale is increasing in external
attribution tendencies, with changes bounded between -42 (a change that would theoretically
indicate an extreme shift from a completely external to completely internal locus-of-control)
and 42 (which would indicate the opposite extreme shift).
The mean-level changes in each dimension of the Big-Five and locus-of-control over
an eight-year period are presented in Table 1. For comparability, the mean change in each
trait has been transformed into standard deviations (SD) of 2005 scores for Big-Five traits
and standard deviations (SD) of 2003 scores for locus-of-control (see column 6). On average,
respondents’ self-reported scores indicate that they become somewhat more agreeable and
emotionally stable (by magnitudes of 0.15 SD), and somewhat less extraverted (-0.11 SD)
over an eight-year period. No significant mean-level change was found for openness (-0.06
SD). The greatest mean-level change observed was for the trait of conscientiousness, which
increased by 0.36 SD over the period of interest. In addition, participants on average showed
a reduction in external locus-of-control scores, suggesting that they became more internal in
their attributional tendencies by a magnitude of 0.12 SD. Overall, we detect small to modest
mean-level changes in most of the traits of interest over an eight-year period; however, the
magnitude of these changes is typically fractions of a standard deviation and in no case do we
find evidence for particularly dramatic normative shifts in personality traits over adolescence
and young adulthood.

12
Table 1 Mean-level change over an eight-year period between 2005 and 2013 for Big-Five traits and between 2003 and 2011 for locus-of-control Personality trait N Mean
change (SD)
Min Max Est. change in SDs of base year score
Agreeableness 770 0.13 (0.92)
-3 3.25 0.15**
Conscientiousness 770 0.36 (0.97)
-2.5 3.8 0.36**
Emotional stability 770 0.16 (1.07)
-3.2 4.3 0.15**
Extraversion 770 -0.12 (0.92)
-3.5 3.5 -0.11**
Openness to experience 770 -0.06 (0.99)
-3.5 3.5 -0.06
External locus-of-control
777 -0.86 (8.16)
-28 26 -0.12**
Note: The original Big-Five scores are bound between 1 (low) and 7 (high) in 2005 and 2013, which are averaged scores across four (agreeableness) to six (conscientiousness) items. The original external locus of control scores are bound between 7 (low=internal) and 49 (high=external) in 2003 and 2011. Statistical significance levels: + p<0.10, * p<0.05, ** p<0.01.
4.2. Are the observed mean-level changes reliable?
One reason why we find only small changes in personality traits is that some individuals
increase while others decrease their traits, thus neutralizing any observed changes. To
understand the proportion of respondents who increased or decreased in their personality
traits in a statistically reliable way, we calculated a Reliable Change Index (RCI; Jacobson
and Truax, 1991) for each individual in the sample, on each trait of interest. The RCI
compares the individual’s change score to the spread of scores that would be expected in a
benchmark population where no true change occurs (that is, the change distribution expected
from measurement error alone).
Equation (1) describes the construction of the Reliable Change Index (RCI) using
personality scores for trait j from both period 1 and 2, Cronbach’s 𝛼𝑗, and the spread of
change in personality across the two time periods that would be expected if no actual change
had occurred (σΔPj). The latter is usually approximated by the spread in the personality score
in the general population (in our case - all adult groups) weighted by the reliability of the
personality measurement (𝛼𝑗), i.e. σΔPj =��2(σ𝛥𝑃𝑘)(1 − 𝛼𝑗))2.
𝑅𝐶𝐼𝑖 =𝑃𝑇𝑖,2𝑘 −𝑃𝑇𝑖,1
𝑘
��2(σ𝛥Pj)(1−𝛼𝑗))2. (1)

13
If the personality measure contains a lot of noise (small 𝛼𝑗), then large changes in personality
scores from period 1 to 2 cannot be reliably interpreted as true changes. Further, if the spread
in the general population score of personality is very large (σΔPj), which implies a large
deviation from the population norm, then any changes in personality must be very large as
well to be considered as true changes. Assuming a normal distribution of the personality
scores in the population in both time periods considered (which we find to be true in our
data), the individual change in personality scores is considered reliable if the absolute value
of the RCI is greater than 1.96; below this cut-off, it is considered unreliable. This measure
has been used previously in the literature to assess reliability in personality changes over time
(see Lüdtke et al., 2011, p. 3 for an overview of this literature).
Table 2 presents the RCI results for changes in each personality trait between 2005
and 2013 for the Big-Five, and between 2003 and 2011 for locus-of-control. The second
column gives the proportion of individuals who reliably decreased in their trait scores over
the eight-year period; the third column gives the proportion of individuals whose changes
were either zero or too small to be considered reliable; and the fourth column is the
proportion of respondents who reliably increased on the trait.
For each trait of interest, the overwhelming majority of respondents neither reliably
increased nor decreased their scores over the eight-year period. For each of the Big-Five
traits, between 16% and 20% of the sample changed their scores in either direction, with
agreeableness demonstrating the greatest degree of malleability. The proportion of those
demonstrating reliable change was larger for locus-of-control than any of the Big-Five traits
(approximately 26%). Conscientiousness was notable in that around four times more
respondents increased than decreased on the trait (13% compared to 3%). A similar but less
pronounced asymmetry was observed for agreeableness (12% increased vs. 7% decreased).
All other traits exhibited a more even distribution across increases and decreases in scores.

14
Table 2 Reliable Change Index for changes in personality over an eight-year period between 2005 and 2013 for the Big-Five traits, and between 2011 and 2003 for locus-of-control Personality trait
Decrease (%)
Unreliable (%) Increase
(%) Agreeableness
7.27
80.39
12.34
Conscientiousness
2.86
84.42
12.73 Emotional stability
7.01
83.12
9.87
Extraversion
10.39
83.38
6.23 Open. to experience
8.70
84.42
6.88
Ext. locus-of-control
14.93
73.62
11.45 Note: Reliable Change Index is calculated according to Eq. 1.
4.3.Malleability of traits by birth cohorts
We now examine how the stability of personality traits varies with age as respondents move
from adolescence to young adulthood. We can examine this pattern of change to answer
questions such as: Do personality traits tend to be unstable in adolescence and slowly
stabilise as respondents mature, or do they continue to show some propensity to change well
into young adulthood? Do female and male respondents have similar age-related trajectories?
Figures 1 (a) to (f) provide the non-parametric bivariate regression estimates of
mean-level changes in the Big-Five traits and locus-of-control by age, for both males
(illustrated in blue) and females (illustrated in red). Trait changes have been standardised
such that the mean change is zero, and values above (below) the mean level indicate increases
(decreases) on the trait of interest over an eight-year period. The magnitude of changes is thus
expressed as standard deviations of the mean trait scores reported in 2005 for the Big-Five
(see Figure 1(a) to (e)), and in 2003 for locus-of-control (see Figure 1(f)). In the figures,
dashed lines parallel to the mean changes for males and females represent the corresponding
95% confidence intervals.
Respondents who were adolescents (15-19 years old) in 2005 increased significantly
in agreeableness over an eight-year period, whilst those beyond age 20 in 2005 no longer
showed significant increases (Figure 1(a)). This pattern suggests a general trend whereby
agreeableness increases during adolescence before gradually stabilising by young adulthood.
In contrast, conscientiousness increased significantly for all age groups throughout
adolescence and young adulthood, for both sexes. Across the age groups, the average
magnitude of these increases ranges between 0.2SD and 0.5SD above 2005 levels, and
suggest that respondents continue to demonstrate significant increases in self-reported
conscientiousness well into adulthood (Figure 1(b)).

15
Figure 1 Changes in personality traits over eight years by age
a) Agreeableness b) Extraversion
c) Conscientiousness d) Openness to experience
e) Emotional stabilty f) External locus-of-control
Note: Presented are non-parametric, bivariate estimates of the relationship between mean change in personality and age. Values are standardized to have a mean of zero relative to baseline personality. Black dashed line represents no self-reported change in personality trait relative to baseline; values above mean indicate increases in the trait; values below the mean indicate reductions in the trait. Changes are represented as standard deviations of the 2005 trait level (for Big-Five traits) and 2003 trait level (for locus-of-control). Locus-of-control is increasing in external control tendencies. Dashed lines are the 95% confidence intervals corresponding to mean changes, which are represented by the solid colored lines.
-.5-.4
-.3-.2
-.10
.1.2
.3.4
.5C
hang
e in
agr
eeab
lene
ss (s
td, 2
005)
15 16 17 18 19 20 21 22 23 24Age
FemaleMale -.5
-.4-.3
-.2-.1
0.1
.2.3
.4.5
Cha
nge
in e
xtra
vers
ion
(std
, 200
5)
15 16 17 18 19 20 21 22 23 24Age
FemaleMale
-.5-.4
-.3-.2
-.10
.1.2
.3.4
.5C
hang
e in
con
scie
ntio
usne
ss (s
td, 2
005)
15 16 17 18 19 20 21 22 23 24Age
FemaleMale -.5
-.4-.3
-.2-.1
0.1
.2.3
.4.5
Cha
nge
in o
penn
ess
(std
, 200
5)
15 16 17 18 19 20 21 22 23 24Age
FemaleMale
-.5-.4
-.3-.2
-.10
.1.2
.3.4
.5C
hang
e in
em
otio
nal s
tabi
lity
(std
, 200
5)
15 16 17 18 19 20 21 22 23 24Age
FemaleMale -.5
-.4-.3
-.2-.1
0.1
.2.3
.4.5
Cha
nge
in e
xter
nal l
ocus
of c
ontro
l (S
td, 2
003)
15 16 17 18 19 20 21 22 23 24Age
FemaleMale

16
Female respondents older than age 17 in 2005 appear to become significantly more
emotionally stable over an eight-year period, a pattern that is evident well into young
adulthood (see Figure 1(c)). The average magnitude of these increases ranges from 0.1 SD to
0.2 SD and does not appear to taper off with age within the period of interest. Emotional
stability results for male respondents, however, were more erratic.
Age-related changes also suggest that female respondents become significantly less
extroverted by a magnitude of around 0.2 SD over the course of adolescence, gradually
stabilising by young adulthood (Figure 1(d)). For male respondents however, changes in
extraversion were not significant at any age, suggesting that the trait remains on average
more stable for men than women over adolescence and young adulthood.
Whilst our results on the whole indicate few age-related sex differences in personality
change over time, the Big-Five trait of openness to experience is an exception (see Figure
1(e)). Males tend to exhibit significant but declining increases in openness through
adolescence, whilst females between 17 and 23 years of age in 2005 show significant
reductions in the trait over an eight-year period. This maybe the case because during puberty
and entry into young adulthood gender roles emerge that require girls to be less open to new
experiences. Finally, respondents appear to become more internal in their locus-of-control
tendencies over an eight-year period; however, the magnitude of these age-related changes is
generally only marginally significant for either sex.
Overall, our results suggest that some significant age-related changes in personality do
occur over the period of adolescence and young adulthood. However, the magnitude of these
changes is small and, with the exception of conscientiousness, do not exceed a 0.3 SD shift in
either direction. This result is perhaps surprising, given that this developmental period is
characterized by vast changes in areas such as physical maturation, social responsibilities,
relationships, employment and education.
4.4. Intra-individual consistency: Is personality shaped by important life events?
Our results up to this point have indicated that some modest age-related personality trait
changes are evident through the period of adolescence and young adulthood. These mean-
level results, however, do not tell us anything about intra-individual change – and in fact the
mean-level changes observed may obscure larger, but offsetting, shifts in individuals’
personality traits over this developmental period.
This section describes the results of an investigation into the degree to which
personality changes are impacted by important life events. We examine whether changes in

17
our traits of interest respond to a range of experiences – some that are typically seen as
positive (e.g. an improvement in finances) and others that are considered adverse (e.g. the
death of close friend). In addition, some of the life events are perceived to be somewhat under
the control of the individual (e.g., a promotion at work), whilst others are more outside the
individual’s control (e.g. being a victim of a property crime). This latter distinction may be
particularly important for the locus-of-control trait, given previous research suggesting that
the repeated experience of uncontrolled or unanticipated events can drive a tendency for a
more external style of attribution (i.e. Goldsmith et al, 1996)
The results presented in this section are relevant to an important econometric
challenge: that personality may not only play a role in driving the behaviour and choices of
individuals, but also be endogenously shaped by, or simultaneously determined with, certain
life events and experiences. If the latter is true, and we treat personality traits as exogenous
inputs when they are in fact likely to respond endogenously to life experiences, our
estimations can suffer from bias due to simultaneity and reverse causality (Cobb-Clark and
Schurer, 2013). Examining the impact of shocks on individual personality changes can
develop our understanding of the extent to which these traits are endogenously determined,
and may challenge the assumption inherent in many economic decision-making models that
such constructs are “given”. In addition, understanding the degree to which personality is
malleable in response to experiences, especially during the adolescent period, may inform us
about the value of investing in the enhancement of those aspects of personality that are linked
to positive outcomes (e.g. successful labour market outcomes).
We investigated 27 “shocks” in total, including 21 one-off life events and six high-
intensity life events (see Appendix A2 for full description). High-intensity life events were
included to determine whether the intensity of the event matters to its effect on personality
change. We included only shocks that occurred after the baseline measure of personality.
This means we defined the shocks between 2006 (wave 6) and 2013 (wave 13) for the Big-
Five traits, and shocks that occurred between 2004 (wave 4) and 2011 (wave 11) for locus-of-
control.
To understand the impact of each shock upon changes in personality, we entered
individual trait change as the dependent variable, and estimated regressions of the form:
∆𝐵𝑖𝑔5𝑖,13/05𝑗 = 𝑆𝑖𝑘𝛾𝑗,𝑘 + 𝑿𝑖,05𝜷𝑗,𝑘 + 𝜀𝑖
𝑗,𝑘. (2)
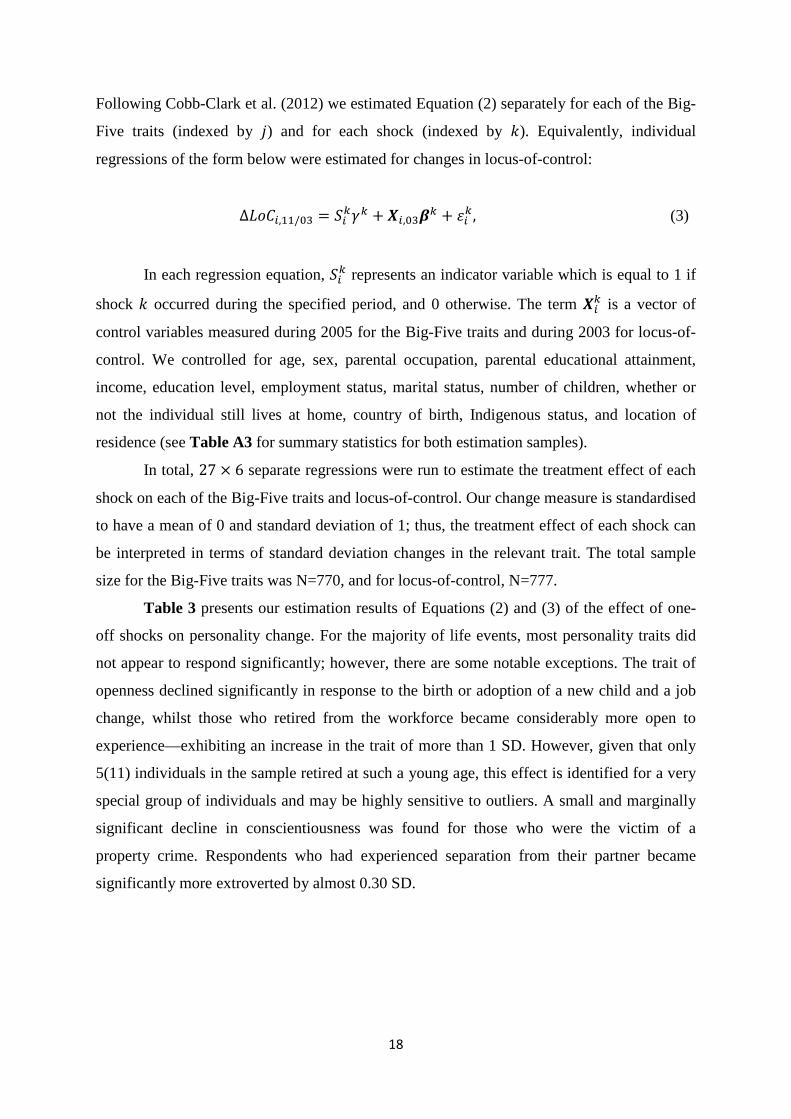
18
Following Cobb-Clark et al. (2012) we estimated Equation (2) separately for each of the Big-
Five traits (indexed by 𝑗) and for each shock (indexed by 𝑘). Equivalently, individual
regressions of the form below were estimated for changes in locus-of-control:
∆𝐿𝑜𝐶𝑖,11/03 = 𝑆𝑖𝑘𝛾𝑘 + 𝑿𝑖,03𝜷𝑘 + 𝜀𝑖𝑘, (3)
In each regression equation, 𝑆𝑖𝑘 represents an indicator variable which is equal to 1 if
shock 𝑘 occurred during the specified period, and 0 otherwise. The term 𝑿𝑖𝑘 is a vector of
control variables measured during 2005 for the Big-Five traits and during 2003 for locus-of-
control. We controlled for age, sex, parental occupation, parental educational attainment,
income, education level, employment status, marital status, number of children, whether or
not the individual still lives at home, country of birth, Indigenous status, and location of
residence (see Table A3 for summary statistics for both estimation samples).
In total, 27 × 6 separate regressions were run to estimate the treatment effect of each
shock on each of the Big-Five traits and locus-of-control. Our change measure is standardised
to have a mean of 0 and standard deviation of 1; thus, the treatment effect of each shock can
be interpreted in terms of standard deviation changes in the relevant trait. The total sample
size for the Big-Five traits was N=770, and for locus-of-control, N=777.
Table 3 presents our estimation results of Equations (2) and (3) of the effect of one-
off shocks on personality change. For the majority of life events, most personality traits did
not appear to respond significantly; however, there are some notable exceptions. The trait of
openness declined significantly in response to the birth or adoption of a new child and a job
change, whilst those who retired from the workforce became considerably more open to
experience—exhibiting an increase in the trait of more than 1 SD. However, given that only
5(11) individuals in the sample retired at such a young age, this effect is identified for a very
special group of individuals and may be highly sensitive to outliers. A small and marginally
significant decline in conscientiousness was found for those who were the victim of a
property crime. Respondents who had experienced separation from their partner became
significantly more extroverted by almost 0.30 SD.

19
Table 3 Regression results – treatment effect of one-off positive and negative shocks on Big-Five personality traits (columns 2 to 5) and locus-of-control (column 6).
Life events (N=Number of obs.)
Open.
(1)
Consc.
(2)
Extrav.
(3)
Agree.
(4)
Emot. Stab.
(5)
Ext. LOC
(6)
Birth/adoption of new child -0.230* 0.0943 -0.103 -0.0647 0.00669 -0.00415 (NBig5= 150; NLoC = 182) (0.110) (0.112) (0.113) (0.112) (0.113) (0.108) Death of a close friend 0.0480 0.145 0.143 0.110 0.312** 0.144 (NBig5= 161; NLoC = 170) (0.0937) (0.0947) (0.0956) (0.0954) (0.0949) (0.0937) Death close family member 0.133 0.0321 0.0877 0.0661 0.0296 0.0550 (NBig5= 289; NLoC = 321) (0.0847) (0.0858) (0.0865) (0.0864) (0.0865) (0.0847) Death of spouse or child -0.380 0.154 -0.257 -0.0152 0.225 0.0977 (NBig5= 9; NLoC = 11) (0.343) (0.348) (0.350) (0.350) (0.350) (0.320) Major improve. in finances -0.0133 0.0752 0.114 0.127 0.126 0.112 (NBig5= 80; NLoC = 101) (0.124) (0.126) (0.127) (0.126) (0.127) (0.112) Major worsening in finances 0.198 0.194 0.0710 0.0312 -0.302* 0.248 (NBig5= 54; NLoC = 53) (0.149) (0.151) (0.152) (0.152) (0.151) (0.147) Fired or made redundant -0.0743 -0.0767 -0.0685 -0.132 -0.00360 -0.0139 (NBig5= 143; NLoC = 129) (0.0984) (0.0995) (0.100) (0.100) (0.100) (0.103) Serious injury/illness family -0.0147 0.0870 -0.0203 -0.0903 0.0635 0.0246 (NBig5= 281; NLoC = 300) (0.0854) (0.0863) (0.0871) (0.0868) (0.0871) (0.0850) Serious personal injury/illness 0.137 -0.0064 -0.165 0.0973 0.0347 0.0377 (NBig5= 135; NLoC = 147) (0.0996) (0.101) (0.102) (0.101) (0.102) (0.0972) Family member detained jail -0.307 -0.202 0.224 -0.449* 0.188 0.0148 (NBig5= 29; NLoC = 44) (0.197) (0.199) (0.201) (0.200) (0.201) (0.162) Detained in jail 0.409 0.616 -0.126 0.258 0.276 0.0102 (NBig5= 7; NLoC = 6) (0.400) (0.405) (0.409) (0.408) (0.408) (0.421) Changed jobs -0.178+ 0.0796 0.0121 -0.0724 0.195+ -0.0302 (NBig5= 468; NLoC = 465) (0.107) (0.108) (0.109) (0.109) (0.109) (0.105) Got married -0.138 -0.0401 -0.0807 0.0768 -0.0837 0.0791 (NBig5= 170; NLoC = 179) (0.0958) (0.0971) (0.0978) (0.0976) (0.0978) (0.0966) Changed residence 0.0217 0.0638 -0.0945 0.270* -0.127 0.0547 (NBig5= 490; NLoC = 506) (0.116) (0.118) (0.119) (0.118) (0.119) (0.121) Victim of a property crime -0.0424 -0.167+ 0.107 -0.0531 -0.0453 0.0794 (NBig5= 152; NLoC = 151) (0.0949) (0.0958) (0.0967) (0.0967) (0.0968) (0.0972) Pregnancy -0.107 -0.0216 -0.0867 -0.0989 -0.0857 -0.00644 (NBig5= 192; NLoC = 213) (0.104) (0.105) (0.106) (0.105) (0.106) (0.100) Promoted at work -0.135 0.0940 -0.0242 -0.0004 0.00736 -0.0115 (NBig5= 268; NLoC = 285) (0.0882) (0.0894) (0.0902) (0.0900) (0.0901) (0.0859) Got back with spouse 0.0900 -0.0932 -0.159 0.0812 -0.0851 -0.00483 (NBig5= 32; NLoC = 37) (0.186) (0.188) (0.190) (0.189) (0.190) (0.177) Retired from the workforce 1.115* -0.423 0.126 -0.369 -0.656 0.0306 (NBig5= 5; NLoC = 11) (0.453) (0.460) (0.464) (0.463) (0.463) (0.315) Separated from partner -0.0687 -0.0896 0.297** -0.138 0.100 -0.0309 (NBig5= 154; NLoC = 156) (0.0960) (0.0971) (0.0974) (0.0977) (0.0979) (0.0947) Victim of physical violence -0.199 0.143 0.0490 -0.263+ 0.206 0.0257 (NBig5= 62; NLoC = 69) (0.138) (0.139) (0.141) (0.140) (0.140) (0.131) Note: Standard errors in parentheses: + p<0.10, * p<0.05, ** p<0.01; trait changes are standardized to mean = 0 and standard deviation = 1; effects can be interpreted as standard deviation changes in the relevant trait.

20
A significant increase in agreeableness was found in response to changing residence
(0.27 SD), whilst declines in agreeableness were observed in response to the adverse
experiences of having a close family member detained in jail (-0.45 SD), and being the victim
of physical violence (-0.26 SD), although the latter was significant only at the 10% level. The
final Big-Five trait of emotional stability increased significantly in response to the death of a
close friend (0.31 SD) and a job change (0.20 SD, marginally significant), whilst those who
experienced a major worsening in finances became significantly more emotionally unstable (-
0.30 SD).
Given the large amount of hypotheses tested, we would need to adjust the p-values of
the t-test statistics to obtain certainty that an effect is statistically significant. If we test 20
hypotheses, we would find by chance at least one effect that is statistically significant at the
five percent level. With 162 individual hypotheses, we would expect to find eight statistically
significant effects attributable to chance, which is exactly the case. Similar to Cobb-Clark and
Schurer (2012; 2013), we therefore conclude that one-off life events do not systematically
predict changes in personality. Table 4 Regression results – treatment effect of high-intensity negative life events on Big-Five personality traits (columns 2 to 6) and locus-of-control (column 6).
Life event (LE) (Number ind. with LE)
Open. To Exp.
(1)
Consc.
(2)
Extrav.
(3)
Agree.
(4)
Emot. Stab.
(5)
External LOC
(6) Unemployed 3+ yrs 0.0442 0.389 0.119 -0.205 0.325 0.197 (NBig5= 21; NLoC = 24) (0.235) (0.237) (0.240) (0.239) (0.239) (0.221) Chronic pain 4+ yrs -0.839 -0.622 -0.912+ -0.299 -0.700 -0.680 (NBig5= 5; NLoC = 6) (0.520) (0.526) (0.530) (0.530) (0.530) (0.511) Restrictive cond. 4+ yrs -0.200 0.236 -0.123 0.245 -0.654 0.261 (NBig5= 5; NLoC = 8) (0.523) (0.529) (0.534) (0.532) (0.533) (0.495) Ill/injured 2+ yrs 0.129 0.057 0.0521 0.0507 -0.105 0.252+ (NBig5= 42; NLoC = 49) (0.164) (0.166) (0.167) (0.167) (0.167) (0.152) Health condition 4+ yrs -0.048 -0.006 -0.022 -0.233+ -0.119 0.312** (NBig5= 84; NLoC = 91) (0.120) (0.121) (0.122) (0.121) (0.122) (0.115) Death 2+ family member 0.105 0.102 -0.007 0.100 0.0955 -0.124 (NBig5= 101; NLoC = 107) (0.112) (0.113) (0.114) (0.114) (0.114) (0.110)
Note: Standard errors in parentheses: + p<0.10, * p<0.05, ** p<0.01; trait changes are standardized to mean = 0 and standard deviation = 1; effects can be interpreted as standard deviation changes in the relevant trait.
It may be possible that these one-off life events have no lasting impact on the
individual’s personality assessment because individuals adapt to new situations. The overall

21
conclusion does not change when considering the effect of high-intensity shocks (see Table
4), with one important exception. Long-term experiences of health problems affect
individuals’ personality. For instance, respondents’ locus-of-control tendencies became more
external in response to the high-intensity experiences of being ill or injured for greater than
two years (0.25 SD, significant at the 10% level) and having a long-term health condition for
four or more years (0.31 SD). The experience of a long-term health condition is also
associated with a 0.23 SD decline in the trait of agreeableness (significant at the 10% level),
while four or more years living in chronic pain are significantly associated with a reduction in
extraversion of almost 1 SD (however, only 5(6) adolescents in the sample experienced such
intensive periods of chronic pain). We next consider the extent to which these changes in
personality induced by life-events are economically meaningful.
4.5.Are the observed changes in personality traits economically meaningful?
Can we judge whether the above-discussed changes are large or small? One way to express
the magnitude of the personality trait change over time has been provided in Cobb-Clark and
Schurer (2012, 2013). The authors expressed the change in personality traits observed for an
adult population over a four-year window as the implied wage equivalent. By knowing the
effects of personality traits on hourly wages – usually expressed in terms of standard
deviation change - one can calculate the hourly wage difference for the estimated standard-
deviation change in personality over four years. In our setting, this may not be the most
appropriate benchmark, since many of our sample members are not in full or meaningful
employment (because they are still in training, for example).
A more intuitive strategy is to calculate the probability effect of youth personality on
graduating from university. A university degree has a private monetary benefit over the life
course, and therefore is a desirable economic outcome. In Australia, a university degree on
average is associated with a net increase in lifetime earnings of $120,000 (Daly et al., 2015).
Once we know the marginal probability effect of a one-standard-deviation increase in each of
our personality traits -- measured in mid- to late adolescence -- on having a university degree,
this estimate can be used to calculate the equivalent increase in the probability of a university
degree for the estimated personality change observed in our sample over an eight-year
window.
Table 5 reports the marginal probability effects (MPE) of the six personality traits
(PT), measured in 2005 (Big-5) and 2007 (locus-of-control - LOC), on the probability of
having graduated from university in 2013, for a sample of individuals who are between 23

22
and 30 years of age (columns 1, 4, and 7). In our sample, 38% of women and 31% of men
have a university degree, which is representative of the national average (OECD, 2013).
Overall, the personality trait changes that we observe for women and men over an eight-year
window are not substantially boosting the probability of a university degree.
The only exception is for conscientiousness for which we find both a strong effect on
university graduation and a large, average change over eight years. For instance, a one
standard deviation increase in youth conscientiousness is associated with a 6.4 percentage
point increase in the probability of a university degree in young adulthood. This MPE
translates into an increase in the probability of obtaining a university degree of over 18%.
Given that we observed on average a significant increase in conscientiousness from
adolescence to young adulthood of 0.36 SD away from the mean of conscientiousness in
adolescence, this implies an increase in the probability of obtaining a university degree of 6.5
percent (18.3*0.36). This increase is particularly large for men (10%); we observe only half
of this effect for women (5%). Given the net increase in lifetime earnings of a university
degree in the magnitude of $120,000, the expected financial returns of an increase in
conscientiousness is $12,000 for men and $6,000 for women.
Gender heterogeneity is also found for openness to experience. Women decrease their
openness scores over an eight-year window by 0.15 SD, but a one-standard deviation increase
in openness to experience is associated with a 36% increase in the probability of a university
degree. Therefore, for women the implied reduction in the probability of obtaining a
university degree, due to a reduction in openness to experience, is equal to 5%, or a loss of
$6,000 in lifetime earnings. For the four remaining personality traits, the eight-year change in
personality implies a change in the probability of a university degree by 1 to less than 3%.
In accordance with Cobb-Clark and Schurer (2012, 2013), we therefore conclude that
although personality traits do change over an eight-year window for adolescents, the implied
changes are not economically meaningful, with the exception of conscientiousness and
openness to experience for women.

23
Table 5: Education equivalent of personality trait (PT) change. Pooled sample Female sample Male sample PT effect
uni degree MPEa
[% effect]
Mean Δ PT over 8
years SD
Equiv. percent change
uni
PT effect uni degree
MPEa [% effect]
Mean Δ PT over 8
years SD
Equiv. percent change
uni
PT effect uni degree
MPEas [% effect]
Mean Δ PT over 8
years SD
Equiv. percent
change uni
(1) (2) (3) (4) (5) (6) (7) (8) (9) External LOC -0.070*** -0.116*** 2.3 -0.067** -0.153*** 2.7 -0.088*** -0.075 2.1 (0.021) (0.040) (0.029) (0.053) (0.032) (0.060) [20.0] [17.6] [28.4] Agreeableness -0.028 0.150*** 1.2 -0.034 0.166*** 1.5 -0.031 0.129** 1.3 (0.023) (0.037) (0.032) (0.046) (0.034) (0.061) [8.0] [8.9] [10.0] Conscientiousness 0.064*** 0.355*** 6.5 0.053* 0.362*** 5.0 0.089** 0.347*** 10.0 (0.022) (0.034) (0.028) (0.043) (0.036) (0.056) [18.3] [13.9] [28.7] Emotional stab. 0.029 0.147*** 1.2 0.026 0.168*** 1.1 0.013 0.118** 0.5 (0.023) (0.036) (0.031) (0.046) (0.037) (0.058) [8.3] [6.8] [4.2] Extraversion -0.070*** -0.112*** 2.2 -0.059** -0.150*** 2.3 -0.092*** -0.060 1.8 (0.020) (0.031) (0.026) (0.040) (0.035) (0.050) [20] [16.0] [29.7] Openness to exp. 0.115*** -0.055 1.8 0.136*** -0.153*** 5.5 0.084** 0.080 2.2 (0.022) (0.034) (0.029) (0.043) (0.035) (0.055) [32.9] [35.8] [27.0] N 459 266 190 Base probability 0.35 0.38 0.31 Note: a MPE: Marginal Probability Effect calculated from a binary choice model in which the dependent variable is whether the individual has a university degree by age 30 (1=yes, 0 no) and the independent variables are Big-Five personality traits, locus of control, controls for birth-cohort indicators, family background, language background, and location of residence (Columns (1), (4), (7)). Columns (3), (6), and (9) report the equivalent percent increase in the probability of a university degree for the observed 8-year personality change in our sample. Standard errors in parentheses * p < 0.10, ** p < 0.05, *** p < 0.01

24
5. Discussion and Conclusion In this study we explored the malleability of the Big-Five personality traits and locus-of-
control from adolescence into young adulthood. Using nationally-representative, high-quality
panel data, we demonstrated that most of these traits show malleability between adolescence
and young adulthood, although mean population changes do not exceed 0.15 SD. The reason
for small mean-changes is that most individuals in our sample do not change their scores in a
statistically reliable way, and for those who do, some decrease and others increase their self-
assessments.
The most important finding is that conscientiousness, often referred to as a proxy for
executive function (Kern et al., 2009), and openness to experience, which has been linked to
crystallized intelligence (Borghans et al., 2011), are the most malleable in this sensitive time-
period. The average increase in conscientiousness implies a 5% and 10% increase in the
probability of having obtained a university degree – equivalent to a $6,000 and $12,000 net
increase in lifetime earnings – for women and men, respectively. One-off life events do not
systematically predict these changes in personality traits. Long-term health problems do
however impact on individuals’ control perceptions and agreeableness by up to 0.3 SD.
Therefore, the impact of long-term health problems on control perceptions and agreeableness
are partially offsetting a general trend in the population of decreasing external control and
increasing agreeableness.
Our results contribute to the literature in two important ways. First, our findings can
be used to benchmark the effectiveness of adolescent education programs aimed at boosting
life skills. Reviewing the empirical evidence on the role of the education sector in building
life skills during adolescence, Schurer (2016) finds that most programs, that find significant
positive impacts, are boosting life skills roughly between 0.1 SD and 0.4 SD. These effect
sizes are similar in magnitudes to the personality changes we observe during adolescence. We
therefore conclude that the effects of these education programs are reasonably large.
Second, our findings demonstrate that – if at all – personality traits in adolescence are
not specifically malleable with respect to common and less common life events that occur
only once. For instance, adolescents who have lost a close family member or a partner do not
seem to become less emotionally stable or more externally controlled, although such life
events have the characteristic of “hopelessness” as described by Seligman (1975). Our results
are in line with the findings in Cobb-Clark and Schurer (2012; 2013) who also do not find

25
any evidence that one-off life events have statistically or economically significant effects on
personality change over four years for working adults.
Our finding that long-lasting or recurring health problems are associated with a more
external locus-of-control has also been demonstrated in Cobb-Clark and Schurer (2013) for
working age women, although the effect sizes are smaller (0.2 SD). This finding is important
from a policy perspective as it implies that programs aimed at increasing health in
adolescents may have positive effects on participants’ personality over and above the obvious
health benefits later in life. Furthermore, this finding has implications for applied researchers
who seek to identify and interpret the effects of young adulthood control perceptions (or
agreeableness) on life-time outcomes: Without controlling adequately for differences in past
health, researchers cannot interpret the treatment effects of control perceptions or
agreeableness as causal.
There are some important limitations to our analysis that should be discussed. On the
one hand, we cannot overcome the problem that many adolescents in our sample drop out
over the eight-year period. This is a common problem in research on adolescents, because
adolescence is a time period of constant change and mobility. Second, for many life events,
we do not have enough observations to identify a statistically significant effect, and thus we
are likely to underestimate the impact of severe life shocks on adolescents’ personality
change. Third, and possibly most important, we cannot overcome the problem of reference
bias inherent in self-assessed personality data that may severely confound our conclusions.
West et al. (2016) have proposed that studies seeking to identify the effect of an education
intervention on personality traits, may not find any effects or even negative treatment effects,
because the subjects may lift the benchmark against which they compare themselves. This
may be an issue in our sample too, because some of the adolescents in our sample have
started their post-secondary education or training after the baseline measurement of
personality trait. However, these issues are common among all studies that aim to assess the
effect of shocks or interventions on personality development.
Contrary to most other studies, the advantage of our analysis is that personality
measures are consistently collected with the same high-quality instrument and scaling.
Furthermore, our dataset is nationally representative and we can follow individuals’
personality development over an eight-year time frame. Measures of life events are recorded
concurrently and do not suffer from recall bias. Because personality traits continue to be
measured in high-quality, longitudinal datasets, it will be possible in the future to follow
adolescents’ personality development over even longer time spans. This will enable us to

26
study more effectively and reliably the impact of repeated life-events on personality change
in the future.
References
Adolfsson, B., Andersson, I., Elofsson, S., Rössner, S., & Undén, A. L. (2005). Locus of control and weight reduction. Patient Education and Counseling, 56(1), 55–61.
Almlund, M., Lee Duckworth, A., Heckman, J.J., & Kautz, T., (2011). Personality psychology and economics. In E.A. Hanushek, S. Machin, L. Woessmann (Eds.), Handbook of the Economics of Education, vol. 4. North-Holland, Amsterdam, 1–181.
American Psychological Association (2007). APA Dictionary of Psychology. Washington, DC, American Psychological Association.
Andrisani, P. J. (1977). Internal-external attitudes, personal initiative, and the labor market experience of black and White Men. The Journal of Human Resources, 12(3), 308.
Arnett, J. J. (2000). Emerging adulthood: A theory of development from the late teens through the twenties. American Psychologist, 55(5), 469–480.
Barón, J. D., & Cobb-Clark, D. (2010). Are Young People’s Educational Outcomes Linked to their Sense of Control? IZA Discussion Paper Series No. 4907, Institute for the Study of Labor. IZA Bonn.
Becker, A., Deckers, T., Dohmen, T., Falk, A., & Kosse, F. (2012). The relationship between economic preferences and psychological personality measures. Annual Review of Economics 4, 453–478.
Bianchi, E. C. (2014). Entering adulthood in a recession tempers later narcissism. Psychological Science, 25(7), 1429–1437.
Bleidorn,W., T. A. Klimstra, J. J. A. Denissen, P. J. Rentfrow, J. Potter, & Gosling, S.D. (2013). Personality maturation around the world: A cross-cultural examination of social-investment theory. Psychological Science 24(12), 2530–2540.
Borghans, L., Duckworth, A. L., Heckman, J. J., & ter Weel, B. (2008). The economics and psychology of personality traits. The Journal of Human Resources, 43(4), 972–1059.
Borghans, L., Golsteyn, B.H.H., Heckman, J.J., & Humphries, J.E. (2011). Identification problems in personality psychology. In: Ferguson, E., Heckman, J.J., Corr, P. (Eds.), Personality and Individual Differences 51, 315–320 (Special Issue on Personality and Economics).
Boyce, C. J., Wood, A. M., Daly, M., & Sedikides, C. (2015). Personality change following unemployment. Journal of Applied Psychology, 100(4), 991–1011.
Branje, S., Vam Lieshout, C.F.M., & Gerris, R.M. (2007). Big Five personality development in adolescence and adulthood. European Journal of Personality, 21(1), 45–62.

27
Caliendo, M., Cobb-Clark, D., Uhlendorff, A., (2015). Locus of control and job search strategies.Review of Economics and Statistics. Forthcoming.
Cameron, L., Erkal, N., Gangadharan, L., & Meng, X. (2013). Little emperors: Behavioral impacts of China’s one-child policy. Science, 339(6122), 953–957.
Chamorro-Premuzic, T., & Furnham, A. (2003). Personality predicts academic performance: Evidence from two longitudinal university samples. Journal of Research in Personality, 37(4), 319–338.
Chubb, N. H., Fertman, C. I., & Ross, J. L. (1997). Adolescent self-esteem and locus of control: A longitudinal study of gender and age differences. Adolescence, 32(125), 113–129.
Cobb-Clark, D. A. (2015). Locus of control and the labor market. IZA Journal of Labor Economics, 4(1), 3.
Cobb-Clark, D. A., & Schurer, S. (2012). The stability of big-five personality traits. Economics Letters, 115(1), 11–15.
Cobb-Clark, D. A., & Schurer, S. (2013). Two economists’ musings on the stability of locus of control. Economic Journal, 123(570), 358–400.
Coleman, M., & DeLeire, T. (2003). An economic model of locus of control and the human capital investment decision. The Journal of Human Resources, 38(3), 701.
Costa, P. T., & McCrae, R. R. (1988). Personality in adulthood: A six-year longitudinal study of self-reports and spouse ratings on the NEO Personality Inventory. Journal of Personality and Social Psychology, 54(5), 853–863.
Dahmann, S., & Anger, S. (2014). The impact of education on personality: Evidence from a German high school reform. IZA Discussion Paper No. 8139, Institute for the Study of Labor. IZA Bonn.
Daly, A., Lewis, P., Corliss, M. , & Heaslip, T. (2015). The private rate of return to a university degree in Australia. Australian Journal of Education, 59(1), 97-112.
Damasio, H., Grabowski, T., Frank, R., Galaburda, A.M., & Damasio, A.R. (2005). The return of Phineas Gage: Clues about the brain from the skull of a famous patient. In: Cacioppo, J.T., Berntson, G.G. (Eds.), Social Neuroscience: Key Readings. Psychology Press, New York, NY, 21–28.
De Fruyt, F., Bartels, M., Van Leeuwen, K. G., De Clercq, B., Decuyper, M., & Mervielde, I. (2006). Five types of personality continuity in childhood and adolescence. Journal of Personality and Social Psychology, 91(3), 538–552.
Findley, M. J., & Cooper, H. M. (1983). Locus of control and academic achievement: A literature review. Journal of Personality and Social Psychology, 44(2), 419–427.
Fletcher, J.M. (2013). The effects of personality traits on adult labor market outcomes: Evidence from siblings. Journal of Economic Behavior and Organization, 89, 122–135.
Furnham, A., Chamorro-Premuzic, T., & McDougall, F. (2003). Personality, cognitive ability,

28
and beliefs about intelligence as predictors of academic performance. Learning and Individual Differences, 14(1), 49–66.
Gatz, M., & Karel, M. J. (1993). Individual change in perceived Control over 20 years. International Journal of Behavioral Development, 16(2), 305–322.
Gensowski, M. (2014). Personality, IQ, and lifetime earnings. IZA Discussion Paper No. 8235, Institute for the Study of Labor. IZA Bonn.
Goldberg, L.R. (1992). The development of markers for the big-five factor structure. Psychological Assessment, 4, 26.
Goldberg, L.R. (1993). The structure of phenotypic personality traits. American Psychologist, 48, 26–34.
Goldsmith, A. H., Veum, J.R., & Darity, W. (1996). The psychological impact of unemployment and joblessness. Journal of Socio-Economics, 15(3), 333-358.
Heckman, J. J., Stixrud, J., & Urzua, S. (2006). The effects of cognitive and noncognitive abilities on labor market outcomes and social behavior. Journal of Labor Economics, 24(3), 411-482.
Heineck, G., & Anger, S. (2010). The returns to cognitive abilities and personality traits in Germany. Labour Economics, 17, 535–546.
Hilbig, B.E., Gloeckner, A., & Zettler, I. (2014). Personality and prosocial behavior: Linking basic traits and social value orientations. Journal of Personality and Social Psychology, 107, 529–539.
Hopwood, C., M. Donnellan, D. Blonigen, R. Krueger, M. McGue, W. Iacono, & Burt, S. (2011). Genetic and environmental influences on personality trait stability and growth during the transition to adulthood: A three wave longitudinal study. Journal of Personality & Social Psychology, 100(3), 545–556.
John, O., & Srivastava, S. (2001). The Big-Five trait taxonomy: History, measurement, and theoretical perspectives. In: Pervin, L., John, O. (Eds.), Handbook of Personality: Theory and Research, second ed. Guilford Press, New York, pp. 102–138 (Chapter 4).
Kappe, R., & van der Flier, H. (2012). Predicting academic success in higher education: What’s more important than being smart? European Journal of Psychology of Education, 27(4), 605–619.
Kern, M.L., Friedman, H.S., Martin, L.R., Reynolds, C.A., & Luong, G. (2009). Conscientiousness, career success, and longevity: A lifespan analysis. Annals of Behavioral Medicine, 37, 154–163.
Klimstra, T. A., Hale, W. W., Raaijmakers, Q. A. W., Branje, S. J. T., & Meeus, W. H. (2009). Maturation of personality in adolescence. Journal of Personality and Social Psychology, 96(4), 898–912.
Kulas, H. (1996). Locus of control in adolescence: a longitudinal study. Adolescence, 31(123): 721-9.

29
Losoncz, I. (2009). Personality traits in HILDA. Australian Social Policy, 8, 169–198.
Lüdtke, O., Roberts, B. W., Trautwein, U., & Nagy, G. (2011). A random walk down university avenue: Life paths, life events, and personality trait change at the transition to university life. Journal of Personality and Social Psychology, 101(3), 620–637.
McCrae, R. R., & Costa, P. T. (1994). The stability of personality: Observations and evaluations. Current Directions in Psychological Science, 3(6), 173–175.
McGee, A., (2015). How the perception of control influences unemployed job search. Industrialand Labor Relations Review 68.
Mroczek, D. K., & Spiro, A. (2003). Modeling intraindividual change in personality traits: Findings from the normative aging study. The Journals of Gerontology Series B: Psychological Sciences and Social Sciences, 58(3), P153–P165.
Mueller, G., & Plug, E. (2006). Estimating the effects of personality on male and female earnings. Industrial and Labor Relations Review, 60, 3–22.
Ng, T. W. H., Sorensen, K. L., & Eby, L. T. (2006). Locus of control at work: A meta-analysis. Journal of Organizational Behavior, 27(8), 1057–1087.
Noftle, E. E., & Robins, R. W. (2007). Personality predictors of academic outcomes: Big five correlates of GPA and SAT scores. Journal of Personality and Social Psychology, 93(1), 116–130.
Nyhus, E. K., & Pons, E. (2005). The effects of personality on earnings. Journal of Economic Psychology, 26(3), 363–384.
OECD (2013). Education at a glance 2013: OECD Indicators. OECD Publishing, Paris.
Pullmann, H., Raudsepp, L., & Allik, J. (2006). Stability and change in adolescents’ personality: a longitudinal study. European Journal of Personality, 20(6), 447–459.
Roberts, B. W., & Delvecchio, W. F. (2000). The rank-order consistency of personality traits from childhood to old age: A quantitative review of longitudinal studies. Psychological Bulletin, 126(1), 1–1.
Roberts, B. W., & Mroczek, D. (2008). Personality trait change in adulthood, Current Directions in Psychological Science, 17(1), 31–35.
Roberts, B. W., Walton, K. E., & Viechtbauer, W. (2006). Patterns of mean-level change in personality traits across the life course: a meta-analysis of longitudinal studies. Psychological Bulletin, 132(1), 1–25.
Roberts, B. W. (2009). Back to the future: personality and assessment and personality development. Journal of Research in Personality, 43(2), 137–145.
Robins, R. W., Fraley, R. C., Roberts, B. W., & Trzesniewski, K. H. (2001). A longitudinal study of personality change in young adulthood. Journal of Personality, 69(4), 617–640.
Rotter, J. B. (1966). Generalized expectancies of internal versus external control of

30
reinforcements. Psychological Monographs, 80(1), 1–28.
Saucier, G. (1994). Mini-markers: A brief version of Goldberg’s unipolar Big-five markers. Journal of Personality Assessment, 63, 506–516.
Schurer, S. (2016), Are life skills of adolescence fixed for life? IZA World of Labor. IZA Bonn. Forthcoming.
Schurer, S., Kassenboehmer, S.C., & Leung, S. (2015), Do universities shape their students' personality?, IZA Discussion Paper No. 8874, Institute for the Study of Labor. IZA Bonn.
Seligman, M.E.P. (1975). Helplessness: On Depression, Development and Death, San Francisco, CA: W. H. Freeman.
Specht, J., Egloff, B., & Schmukle, S. C. (2011). Stability and change of personality across the life course: The impact of age and major life events on mean-level and rank-order stability of the Big Five. Journal of Personality and Social Psychology, 101(4), 862–882.
Specht, J., Egloff, B., & Schmukle, S.C. (2013). Everything under control? The effects of age, gender, and education on trajectories of perceived control in a nationally representative German sample. Developmental Psychology, 49(2), 353-364.
Stein, J., Newcomb, M., & Bentler, P. (1986). Stability and change in personality: A longitudinal study from early adolescence to young adulthood. Journal of Research in Personality, 20(3), 276–291.
Summerfield, M., Freidin, S., Hahn, M., Ittak, P., Li, N., Macalalad, N., Watson, N., Wilkins, R., & Wooden, M. (2013). Hilda User Manual–Release 12.
Trapmann, S., Hell, B., Hirn, J.-O. W., & Schuler, H. (2007). Meta-analysis of the relationship between the Big five and academic success at university. Zeitschrift Für Psychologie / Journal of Psychology, 215(2), 132–151.
Twenge, J. M. (2000). The age of anxiety? The birth cohort change in anxiety and neuroticism, 1952-1993. Journal of Personality and Social Psychology, 79(6), 1007–1021.
West, M. R., M.A. Kraft, A.S. Finn, R.E. Martin, A.L. Duckworth, C.F.O. Gabrieli, & Gabrieli, J.D.E. (2016). Promise and Paradox: Measuring Students’ Non-Cognitive Skills and the Impact of Schooling. Educational Evaluation and Policy Analysis, 38(1), 148-170.

31
APPENDIX Table A1. Within sample Cronbach’s alpha for personality traits
N*T
Sign
item-test corr
item- rest corr
avg interim covar
alpha if drop
item External locus of control
I have little control over the things that happen 2331 + 0.716 0.594 0.957 0.826 There is really no way I can solve some of the problems 2331 + 0.791 0.696 0.906 0.811 There is little I can do to change many of the 2331 + 0.769 0.672 0.936 0.815 I often feel helpless in dealing with the problems 2331 + 0.800 0.703 0.886 0.809 Sometimes I feel that I’m being pushed around 2331 + 0.767 0.652 0.903 0.817 What happens to me in the future mostly 2331 - 0.553 0.399 1.086 0.854 I can do just about anything I really set my 2331 - 0.641 0.511 1.029 0.838 Test scale
0.958 0.846
Extraversion Talkative 2310 - 0.733 0.587 0.827 0.713
Quiet 2310 + 0.825 0.703 0.702 0.677 Extroverted 2310 - 0.622 0.424 0.928 0.756 Shy 2310 + 0.809 0.678 0.720 0.684 Lively 2310 - 0.577 0.416 1.000 0.755 Bashful 2310 + 0.483 0.274 1.073 0.788 Test scale
0.875 0.767
Emotionally stable (reverse of neuroticism) Envious 2310 + 0.668 0.516 0.928 0.770 Moody 2310 + 0.746 0.594 0.823 0.751 Jealous 2310 + 0.725 0.579 0.862 0.755 Temperamental 2310 + 0.747 0.610 0.841 0.747 Fretful 2310 + 0.660 0.496 0.926 0.774 Touchy 2310 + 0.665 0.488 0.909 0.777 Test scale
0.882 0.794
Conscientiousness Orderly 2310 - 0.750 0.608 0.762 0.735
Systematic 2310 - 0.598 0.388 0.896 0.791 Inefficient 2310 + 0.690 0.539 0.830 0.752 Sloppy 2310 + 0.624 0.459 0.892 0.770 Organised 2310 + 0.785 0.644 0.709 0.724 Efficient 2310 - 0.728 0.598 0.809 0.740 Test scale
0.816 0.786
Openness to experience Deep 2310 + 0.692 0.528 0.796 0.705

32
Table A1., cont.
N*T
Sig
item-test corr
item- rest corr
avg interim covar
alpha if drop
item Philosophical 2310 + 0.719 0.541 0.748 0.700 Creative 2310 + 0.645 0.452 0.833 0.726 Imaginative 2310 + 0.690 0.528 0.801 0.705 Complex 2310 + 0.650 0.452 0.825 0.726 Intellectual 2310 + 0.610 0.445 0.891 0.727 Test scale
0.816 0.751
Agreeable Sympathetic 2310 + 0.768 0.535 0.568 0.727
Kind 2310 + 0.800 0.647 0.566 0.669 Cooperative 2310 + 0.700 0.472 0.673 0.753 Warm 2310 + 0.801 0.616 0.532 0.677 Test scale
0.585 0.763

33
Table A2: Description of one-off and aggregated self-reported life events experienced after the baseline measurement of personality traits
One-off Life Events Negative Serious personal illness or injury Serious personal illness to family member Death of spouse or child Death of close family member or relative Death of a close friend Victim of physical violence Victim of property crime Detained in jail Family member detained in jail Fired or made redundant Major worsening of finances Positive Got married Got back together with spouse Pregnancy Birth or adoption of new child Promoted at work Major improvement of finances Retired from the workforce
Aggregated Life Events
Experience of unemployment for three years or more Experience of chronic pain for four years or more Experience of a medical condition that restricted the individual for four years or more Experience of an illness or injury for at least two years Experience of a health condition for four years or more Experience of death of two or more family members

34
Table A3. Summary statistics of estimation sample Panel A. Big-Five estimation sample: Summary statistics Mean SD Min Max N Life events that occurred between 2006 and 2013 Birth/adoption of new child 0.26 0.44 0 1 584
Death of a close friend 0.27 0.45 0 1 591
Death close family member 0.49 0.50 0 1 588
Death of spouse or child 0.02 0.12 0 1 586
Major improve. In finances 0.14 0.34 0 1 587
Major worsening in finances 0.09 0.29 0 1 591
Fired or made redundant 0.24 0.43 0 1 587
Serious injury/illness family 0.48 0.50 0 1 590
Serious personal injury/illness 0.23 0.42 0 1 588
Family member detained jail 0.05 0.22 0 1 592
Detained in jail 0.01 0.11 0 1 592
Changed jobs 0.79 0.41 0 1 592
Got married 0.29 0.45 0 1 592
Changed residence 0.83 0.37 0 1 589
Victim of a property crime 0.26 0.44 0 1 590
Pregnancy 0.33 0.47 0 1 591
Promoted at work 0.47 0.50 0 1 570
Got back with spouse 0.05 0.23 0 1 591
Retired from the workforce 0.01 0.09 0 1 590
Separated from partner 0.26 0.44 0 1 591
Victim of physical violence 0.11 0.31 0 1 590 High intensity life events Unemployed 3+ yrs 0.03 0.16 0 1 770
Chronic pain 4+ yrs 0.008 0.45 0 1 589
Restrictive cond. 4+ yrs 0.01 0.34 0 1 592
Ill/injured 2+ yrs 0.07 0.26 0 1 588
Health condition 4+ yrs 0.11 0.31 0 1 769
Death 2+ family member 0.17 0.38 0 1 581 Control variables measured in 2005 Age 19.30 2.92 15 24 770 Sex=Male 0.42 0.49 0 1 770 Father's highest educational institution University (base) 498
Teachers College/College of Adv Education 0.04 0.20 0 1 498
Institute of Technology 0.03 0.18 0 1 498
Technical College/TAFE/College of Technical and Further Education
0.26 0.44 0 1 498
Employer 0.23 0.42 0 1 498
Other 0.01 0.08 0 1 498 Father completed educational qualification after leaving school 0.71 0.46 0 1 714
How much schooling father completed None (base) 740
Primary school only 0.02 0.15 0 1 740
Some, no more than year 10 0.40 0.49 0 1 740
Year 11 or equivalent 0.09 0.29 0 1 740
Year 12 or equivalent 0.49 0.50 0 1 740 Mother's highest educational institution University (base) 428
Teachers College/College of Adv Educ. 0.11 0.32 0 1 428
Institute of Technology 0.01 0.12 0 1 428

35
Technical College, TAFE, College of Techn & Further Educ. 0.28 0.45 0 1 428
Employer 0.11 0.32 0 1 428
Other 0.01 0.10 0 1 428 Mother completed educational qualification after leaving school 0.62 0.49 0 1 719
Mother’s schooling None (base) 746
Primary school only 0.02 0.13 0 1 746
Some, no more than year 10 0.34 0.47 0 1 746
Year 11 or equivalent 0.13 0.34 0 1 746
Year 12 or equivalent 0.52 0.50 0 1 746 Father's job when respondent 14yo 50.50 24.67 4.9 100 668 Mother's job when respondent 14yo 54.35 24.87 3.4 100 610 Household income 68897.52 55317.50 -478632 556212 770 Labour force status
Employed (base) 770
Unemployed 0.06 0.24 0 1 770
Not in labour force 0.23 0.42 0 1 770 Respondent’s education level
Studying degree or above 0.18 0.38 0 1 770
Studying (advanced) diploma 0.11 0.31 0 1 770
Highest education level achieved Year 11 (base) 770
Year 12 0.34 0.47 0 1 770
Certificate III/IV 0.10 0.31 0 1 770
Advanced diploma 0.03 0.18 0 1 770
Bachelor degree 0.08 0.28 0 1 770
Graduate diploma 0.01 0.09 0 1 770 Has a partner 0.21 0.41 0 1 770 Number of children 0 (base) 770
1 0.05 0.22 0 1 770
2 0.01 0.12 0 1 770
3 0.00 0.05 0 1 770
4 0.00 0.04 0 1 770 Lives at home 0.61 0.49 0 1 760 Country of birth Australia (base) 770 Main English speaking countrya 0.03 0.16 0 1 770
Other 0.06 0.24 0 1 770 Indigenous status 0.03 0.17 0 1 770 State of residence NSW (base) 770
VIC 0.25 0.43 0 1 770
QLD 0.22 0.41 0 1 770
SA 0.08 0.27 0 1 770
WA 0.09 0.28 0 1 770
TAS 0.04 0.20 0 1 770
NT 0.01 0.07 0 1 770
ACT 0.04 0.20 0 1 770 Does not live in major urban area 0.37 0.48 0 1 770 Note: aMain English speaking countries include United Kingdom, New Zealand, Canada, USA, Ireland and South Africa (HILDA codebook).

36
Panel B. Locus-of-control estimation sample: Summary statistics Mean SD Min Max N Life events that occurred between 2004 and 2011 Birth/adoption of new child 0.32 0.47 0 1 577
Death of a close friend 0.29 0.45 0 1 587
Death close family member 0.55 0.50 0 1 587
Death of spouse or child 0.02 0.13 0 1 583
Major improve. In finances 0.17 0.38 0 1 586
Major worsening in finances 0.09 0.29 0 1 587
Fired or made redundant 0.22 0.41 0 1 589
Serious injury/illness family 0.51 0.50 0 1 583
Serious personal injury/illness 0.25 0.44 0 1 583
Family member detained jail 0.07 0.26 0 1 590
Detained in jail 0.01 0.10 0 1 589
Changed jobs 0.79 0.41 0 1 589
Got married 0.30 0.46 0 1 594
Changed residence 0.86 0.35 0 1 592
Victim of a property crime 0.26 0.44 0 1 586
Pregnancy 0.36 0.48 0 1 587
Promoted at work 0.50 0.50 0 1 570
Got back with spouse 0.06 0.24 0 1 589
Retired from the workforce 0.02 0.14 0 1 590
Separated from partner 0.27 0.44 0 1 584
Victim of physical violence 0.12 0.32 0 1 588 High intensity life events Unemployed 3+ yrs 0.03 0.17 0 1 777
Chronic pain 4+ yrs 0.008 0.49 0 1 583
Restrictive cond. 4+ yrs 0.01 0.51 0 1 595
Ill/injured 2+ yrs 0.07 0.28 0 1 588
Health condition 4+ yrs 0.11 0.32 0 1 769
Death 2+ family member 0.18 0.39 0 1 581 Control variables measured in 2003 Age 19.25 2.93 15 24 777 Sex=Male 0.47 0.50 0 1 777 Father's highest educational institution University (base) 464
Teachers College/College of Adv Education 0.05 0.23 0 1 464
Institute of Technology 0.05 0.21 0 1 464
Technical College/TAFE/College of Technical and Further Education
0.28 0.45 0 1 464
Employer 0.22 0.41 0 1 464
Other 0.00 0.07 0 1 464 Father completed educational qualification after leaving school 0.66 0.47 0 1 724
How much schooling father completed None (base) 739
Primary school only 0.03 0.18 0 1 739
Some, no more than year 10 0.44 0.50 0 1 739
Year 11 or equivalent 0.09 0.29 0 1 739
Year 12 or equivalent 0.43 0.50 0 1 739 Mother's highest educational institution University (base) 400
Teachers College/College of Adv Educ. 0.11 0.32 0 1 400
Institute of Technology 0.01 0.11 0 1 400
Technical College, TAFE, College of Techn & Further Educ. 0.32 0.47 0 1 400
Employer 0.15 0.36 0 1 400

37
Other 0.01 0.11 0 1 400 Mother completed educational qualification after leaving school 0.56 0.50 0 1 731
Mother’s schooling None (base) 753
Primary school only 0.03 0.17 0 1 753
Some, no more than year 10 0.38 0.49 0 1 753
Year 11 or equivalent 0.14 0.34 0 1 753
Year 12 or equivalent 0.45 0.50 0 1 753 Father's job when respondent 14yo 48.94 24.16 4.9 100 665 Mother's job when respondent 14yo 50.14 24.44 3.4 100 575 Household income 59223.97 44707.22 -275619 462282 777 Labour force status
Employed (base) 777
Unemployed 0.08 0.28 0 1 777
Not in labour force 0.25 0.44 0 1 777 Respondent’s education level
Studying degree or above 0.16 0.37 0 1 777
Studying (advanced) diploma 0.13 0.33 0 1 777
Highest education level achieved Year 11 (base) 777
Year 12 0.34 0.47 0 1 777
Certificate III/IV 0.12 0.32 0 1 777
Advanced diploma 0.02 0.15 0 1 777
Bachelor degree 0.08 0.27 0 1 777
Graduate diploma 0.00 0.06 0 1 777 Has a partner 0.22 0.41 0 1 777 Number of children 0 (base) 777
1 0.04 0.20 0 1 777
2 0.01 0.11 0 1 777
3 0.01 0.07 0 1 777
4 0.00 0.04 0 1 777 Lives at home 0.58 0.50 0 1 771 Country of birth Australia (base) 777 Main English speaking countrya 0.03 0.16 0 1 777
Other 0.08 0.26 0 1 777 Indigenous status 0.02 0.16 0 1 777 State of residence NSW (base) 777
VIC 0.25 0.43 0 1 777
QLD 0.23 0.42 0 1 777
SA 0.08 0.28 0 1 777
WA 0.09 0.28 0 1 777
TAS 0.05 0.21 0 1 777
NT 0.01 0.09 0 1 777
ACT 0.02 0.14 0 1 777 Does not live in major urban area 0.37 0.48 0 1 777 Note: aMain English speaking countries include United Kingdom, New Zealand, Canada, USA, Ireland and South Africa (HILDA codebook).
Related Documents