Western Michigan University Western Michigan University ScholarWorks at WMU ScholarWorks at WMU Dissertations Graduate College 12-1993 The Maintenance of Statistical Process Control (SPC) with The Maintenance of Statistical Process Control (SPC) with Organizational Behavior Management (OBM) Techniques Organizational Behavior Management (OBM) Techniques Pollis Robertson Western Michigan University Follow this and additional works at: https://scholarworks.wmich.edu/dissertations Part of the Applied Behavior Analysis Commons Recommended Citation Recommended Citation Robertson, Pollis, "The Maintenance of Statistical Process Control (SPC) with Organizational Behavior Management (OBM) Techniques" (1993). Dissertations. 1884. https://scholarworks.wmich.edu/dissertations/1884 This Dissertation-Open Access is brought to you for free and open access by the Graduate College at ScholarWorks at WMU. It has been accepted for inclusion in Dissertations by an authorized administrator of ScholarWorks at WMU. For more information, please contact [email protected].

Welcome message from author
This document is posted to help you gain knowledge. Please leave a comment to let me know what you think about it! Share it to your friends and learn new things together.
Transcript

Western Michigan University Western Michigan University
ScholarWorks at WMU ScholarWorks at WMU
Dissertations Graduate College
12-1993
The Maintenance of Statistical Process Control (SPC) with The Maintenance of Statistical Process Control (SPC) with
Organizational Behavior Management (OBM) Techniques Organizational Behavior Management (OBM) Techniques
Pollis Robertson Western Michigan University
Follow this and additional works at: https://scholarworks.wmich.edu/dissertations
Part of the Applied Behavior Analysis Commons
Recommended Citation Recommended Citation Robertson, Pollis, "The Maintenance of Statistical Process Control (SPC) with Organizational Behavior Management (OBM) Techniques" (1993). Dissertations. 1884. https://scholarworks.wmich.edu/dissertations/1884
This Dissertation-Open Access is brought to you for free and open access by the Graduate College at ScholarWorks at WMU. It has been accepted for inclusion in Dissertations by an authorized administrator of ScholarWorks at WMU. For more information, please contact [email protected].

THE MAINTENANCE OF STATISTICAL PROCESS CONTROL (SPC) WITHORGANIZATIONAL BEHAVIOR MANAGEMENT (OBM) TECHNIQUES
by
Pollis Robertson
A Dissertation Submitted to the
Faculty of The Graduate College in partial fulfillment of the
requirements for the Degree of Doctor of Philosophy
Department of Psychology
Western Michigan University Kalamazoo, Michigan
December 1993
Reproduced with permission of the copyright owner. Further reproduction prohibited without permission.
THE MAINTENANCE OF STATISTICAL PROCESS CONTROL (SPC) WITHORGANIZATIONAL BEHAVIOR MANAGEMENT (OBM) TECHNIQUES
Pollis Robertson, Ph.D.
Western Michigan University, 1993
Many organizations have implemented statistical process control (SPC)
programs in response to demands in the marketplace for high-quality products that are
efficiently built. Many of these organizations have been unhappy with the difficulty
of getting their statistical process (SPC) control programs started and the long-term
economic success of these programs.
This study systematically investigated for two years various components of
statistical process control programs and attempted to enhance economic effectiveness
by buttressing SPC methods with Organizational Behavior Management (OBM)
techniques. This study was conducted in a Gray Ductile Iron Foundry that employed
87 employees.
Positive results were observed when OBM was combined with SPC methods.
AB-type group designs were employed for implementation and maintenance within
each study.
Reproduced with permission of the copyright owner. Further reproduction prohibited without permission.
INFORMATION TO USERS
This manuscript has been reproduced from the microfilm master. UM I
thesis and dissertation copies are in typewriter face, while others may be from any type of computer printer.
The quality of this reproduction is dependent upon the quality o f the copy subm itted. Broken or indistinct print, colored or poor quality illustrations and photographs, print bleedthrough, substandard margins, and improper alignment can adversely affect reproduction.
In the unlikely event that the author did not send UM I a com plete manuscript and there are missing pages, these will be noted. Also, if unauthorized copyright material had to be removed, a note will indicate the deletion.
Oversize m aterials (e.g., maps, drawings, charts) are reproduced by sectioning the original, beginning at the upper left-hand corner and continuing from left to right in equal sections with small overlaps. Each orig inal is also pho tographed in one exposure and is included in reduced form at the back of the book.
Photographs included in the original manuscript have been reproduced xerographically in this copy. H igher quality 6" x 9" black and white photographic prints are available for any photographs or illustrations appearing in this copy for an additional charge. Contact UM I directly to order.
Reproduced with permission of the copyright owner. Further reproduction prohibited without permission.
films the text directly from the original or copy submitted. Thus, some
U niversity Microfilms International A Bell & Howell Information C om pany
3 0 0 North Z e e b R oad . Ann Arbor. Ml 48106-1346 USA 313 /761 -4700 800 /521 -0600

Reproduced with permission of the copyright owner. Further reproduction prohibited without permission.
Order N um ber 9410500
The maintenance of statistical process control (SPC) w ith organizational behavior management (OBM ) techniques
Robertson, Pollis, Ph.D.
Western Michigan University, 1993
Copyright © 1993 by Robertson, Pollis. All rights reserved.
Reproduced with permission of the copyright owner. Further reproduction prohibited without permission.
300 N. ZeebRd.Ann Arbor, MI 48106

Reproduced with permission of the copyright owner. Further reproduction prohibited without permission.
Copyright by Pollis Robertson
1993
Reproduced with permission of the copyright owner. Further reproduction prohibited without permission.

ACKNOWLEDGEMENTS
I am very thankful for the support of the XYZ, INC Plant president and
management staff along with the individual members of the organization who
contributed to this project.
I would like to express my appreciation and thanks to my committee members
for the time spent assisting me on this project with expert advice and constructive
feedback.
Special thanks are extended to Dr. Dale Brethower, Dr. William Redmon, and
Mr. Eugene Hamaker for their support, encouragement, and friendship in helping me
to complete this project.
Special dedication is given to my mother, Marie, who died before the
completion of this project. I wish to express my sincere appreciation to my wife,
Gloria and my family and friends for their endurance, love and support. It is to them
that I dedicate this project.
Pollis Robertson.
ii
Reproduced with permission of the copyright owner. Further reproduction prohibited without permission.

TABLE OF CONTENTS
ACKNOWLEDGEMENTS........................................................................................ ii
LIST OF TABLES ........................................................................................ vii
LIST OF FIG U RES..................................................................................... viii
CHAPTER
I. INTRODUCTION.................................................................................... 1
The P roblem ........................................................................................... 2
Purpose and Rationale .......................................................................... 5
Combining Technologies—Statistical Process Control, Organizational Behavioral Management, and Total Performance System ..................................................................... 8
Organizational Behavioral Management (OBM) Techniques . 15
Summary ................................................................................................ 17
D. METHOD .......................................................................................... 18
S u b jec ts .................................................................................................. 18
S e ttin g .................................................................................................... 19
Dependent Variables ............................................................................ 19
Independent Variables .......................................................................... 21
Procedures ............................................................................................. 24
Special Problem s................................................................................... 25
Experimental Design ............................................................................ 28
Reproduced with permission of the copyright owner. Further reproduction prohibited without permission.
Table of Contents-Continued
CHAPTER
Experimental Phases ............................................................................ 30
Procedure for Each AB D esign ........................................................... 31
Baseline Data Collection ..................................................................... 32
QC-Circle Training Procedure.............................................................. 34
SPC Training Procedure....................................................................... 35
Management Training/Performance Feedback andPerformance Management P rocedure................................................. 36
Integration of Technologies Into a Total Performance System Procedure................................................................................................ 37
General Method for C h an g e ................................................................ 39
Job Ticket Error Correction Procedure..................................... 39
First Intervention Feedback P h a s e ............................................. 39
The Second Intervention Minus Feedback Plus Correction Procedure (Originally Designed Procedure) ........................... 40
Changes to the Second Intervention Phase .............................. 41
Time Card Correction Procedure............................................... 42
Time Card First Intervention Feedback P h a s e ....................... 42
Time Card Second Intervention Minus Feedback Plus Correction Procedure (Originally Designed Procedure) 43
Changes to the Second Intervention Phase .............................. 44
iv
Reproduced with permission of the copyright owner. Further reproduction prohibited without permission.

Table of Contents—Continued
CHAPTER
m . RESULTS ....................................................................................................... 45
Job Ticket Correction Procedure Results .......................................... 46
Time Card Correction Procedure Results .......................................... 49
Attendance Improvement Procedure R esu lts ..................................... 53
Suggestion Plan R esu lts ....................................................................... 55
Resulting Impact on Plantwide Performance F a c to rs ...................... 58
Results of Integration Effort Into a Total Performance System . . . 63
Results Summary................................................................................... 64
IV. DISCUSSION.................................................................................................. 65
Special Challenges and Problems ...................................................... 66
Subject Selection......................................................................... 66
Setting .......................................................................................... 66
Combining SPC Technology With OBM Technology Into Integrative Performance System ............................................... 68
Experimental Design .................................................................. 70
Dependent Variables .................................................................. 71
Analysis of Results Job Ticket and Time Card ................................ 75
Analysis of Attendance Improvement P la n ........................................ 80
Analysis of Economic Data Conversion for Attendance Rates . . . 81
Analysis of Key Performance Factor Results ................................... 82
v
Reproduced with permission of the copyright owner. Further reproduction prohibited without permission.

Table of Contents--Continued
Summary SPC and OBM Methods Effectiveness.............................. 83
C onclusion .............................................................................................. 84
APPENDICES
A. Protocol Clearance L e tte r................................................................................. 86
B. Items Used as Positive R einforcers................................................................ 88
C. Listing of Key Events in the Transformation Process of Combiningthe Two Technologies.................................................................................... 92
D. Sample of Job Ticket Correction Procedure C h a r ts .................................... 97
E. Attendance Improvement Plan .................................................................... 102
F. Employee Suggestion P la n ........................................................................... 107
G. Job Ticket & Time Card Correction Procedure Checksheet ................ I l l
H. Quality Control Circle Observation F o rm ................................................... 113
BIBLIOGRAPHY ............................................................................... 115
vi
Reproduced with permission of the copyright owner. Further reproduction prohibited without permission.

LIST OF TABLES
1. Listing of Key Events in the Transformation Process of Combiningthe Two Technologies ....................................................................................... 25
2. Research Design S tra teg y ................................................................................... 30
3. Productivity and Quality M easures.................................................................... 34
4. March 1992 Through March 1993 Errors on Job Tickets ....................... 48
5. March 1992 Through March 1993 Errors on Job Cards ....................... 51
6. Listing of Performance Management Projects Originally Planned,But Not Implemented in This S tudy ................................................................. 72
Reproduced with permission of the copyright owner. Further reproduction prohibited without permission.
LIST OF FIGURES
1. Brethower's (1972) Total Performance System .................................................. 9
2. Job Ticket Error R a te .......................................................................................... 47
3. Time Card Error R a te .......................................................................................... 50
4. Attendance C h a r t .................................................................................................. 56
5. Overtime % Vs. Regular Time ......................................................................... 59
6. Production Vs. Scrap ( % ) .................................................................................. 60
7. Finishing D epartm ent.......................................................................................... 61
8. Cold S e t ................................................................................................................ 62
Reproduced with permission of the copyright owner. Further reproduction prohibited without permission.
CHAPTER I
INTRODUCTION
The quest for productivity and quality has been the pursuit of many organiza
tional change researchers and management practitioners (Amsden, Amsden, & Butler,
1991; Andrasik, 1989; Bodek, 1988; Brethower, 1972; Daniels, 1989; Deming, 1982;
Gilbert, 1978; Henry & Redmon, 1990; Ingle, 1982; Ishikawa, 1980; Krigsman &
O'Brien, 1987; Mizuno, 1989; Rehg, 1986; Spanbauer , 1992; and Walton, 1990).
Organizational change researchers have often taken a systems approach to
studying ways of improving productivity and quality (Brethower, 1972 & 1982;
Eickhoff, 1991; Gilbert, 1978; Lunchsinger & Dock, 1976; and Rummler & Brache,
1990). Organizational management practitioners have also adopted the systems
approach for improving productivity and quality (Deming, 1982; Imai, 1986; Mizuno,
1989; Shingo, 1989; Shores, 1990).
The past decade has seen a revived interest from both researchers and
management practitioners in quality and productivity improvement with a correspond
ing interest in improving employee morale. There are at least three reasons why there
has been this renewed interest.
The first comes in response to increased worldwide competition, primarily
from the Japanese and other industrialized nations (Ball & McCulloch, Jr. 1990).
1
Reproduced with permission of the copyright owner. Further reproduction prohibited without permission.
The second force is that companies are realizing the importance of employee
participation to increasing organizational quality, productivity, and employee morale.
Many organizations have reported positive benefits with some components of the SPC
programs, such as Quality Control Circles or some other employee-group approaches
to worker participation/team approaches to the job (Ephross & Vassil, Federico, 1989;
1988; Ingle, 1982; Garvin, 1988; Manning & Cutis, 1988; and Quick, 1992). It is
generally accepted by most organizational researchers and business management
practitioners that some form for employee group participation is usually beneficial to
the organization when the employee group is properly developed and managed. The
third force that is related to the other two forces is change (Rummler & Brache,
1990). Rate of technology change in the business environment is a critical force that
organizations must manage and to which they must respond. The rates of political
and economical change in the United States and the rest of the world are all forces
that have directly influenced many organizations' ability to manage their resources.
The Problem
The American economy has experienced a period of slow growth that has
caused much concern (Czinkota, 1990). These practical concerns have been echoed
in the business community, the scientific community, and the government (Brethower,
1972, Deming, 1982; Gilbert, 1978; Malott & Garcia, 1987; Rummler & Brache,
1990; Thrice & Hoer, 1989). Automobile manufacturers are very worried over their
recent loss of market share to Japanese automobile manufacturers (Thrice & Hoer,
Reproduced with permission of the copyright owner. Further reproduction prohibited without permission.
1989). The United States government is also very concerned about the rapid
devaluation of the dollar in relation to the yen that contributes to the economic decay
of many of America's businesses. The reasons for the decline of many U.S. firms are
numerous. The international monetary policies and currency changes play a major
role in the ability of U.S. firms to compete and survive (Ball & McCullock, 1990;
Czinkota, 1990). In spite of the above grave issue, there are many other factors that
contribute to businesses' ability to compete that are less complicated. The scientific
community has begun to examine some of these factors.
Japanese businesses treated the idea of striving to achieve their ultimate goals
as paramount. They have coined the phase "Kaizen" which means, "continuous
improvement" (Imai, 1986). Their ultimate goal is to continuously improve
productivity and quality.
Malott and Garcia (1987) expressed concerns over how most organizations do
not achieve their ultimate goals:
And if they do not fail to survive, at least they fail to achieve their ultimate goals; and even if they do achieve some of those goals, they still fail to achieve their ultimate goals, to the extent intended. Most organizations are underachievers; most have great room for improvement, whether they are organizations in education, the human services, government, or business (p. 126).
This view is shared by many others (Brethower, 1972; Gilbert 1978; Imai,
1986). Gilbert (1978) has formulated a model for improving human competence. He
focuses on measures of the potential for improving performance (PIP). This concept
is based on the idea that there is much room for improvement in an organization or
Reproduced with permission of the copyright owner. Further reproduction prohibited without permission.

a particular work unit. One needs to identify an exemplary performer and compute
the PIP. According to Gilbert (1978):
I define exemplary performance as the worth of the historically best instance of the performance . . . Typical competence is inversely proportional to the potential for improving performance (the PEP), which is the ratio of exemplary performance to typical performance.The ratio, to be meaningful, must be stated for an identifiable accomplishment, because there is no "general quality of competence" (p. 30).
He asserts that the PIP is the opportunity for improvement in performance.
The higher the PIP, the greater is the opportunity of the organization to improve and
enhance its chances of achieving the organization's ultimate goals.
Brethower's (1972) observation of how managers' misunderstanding of the
principles governing human performance illustrates the concerns that many organiza
tional behavior researchers have:
We have often heard managers say with great feeling-and in apparent anguish—"People should do a good job because they are being paid to do a good job!” This statement reflects a high moral tone but also reflects a willingness to ignore facts: the people referred to are doing a poor job and they are being paid. Therefore, whether you like it or not, they are being paid for poor work (pp. 8).
This statement accurately reflects the true state in many underachieving
organizations. These concerns from business, organizational researchers, and
government have led many organizations to use statistical process control (SPC)
techniques to respond to the challenges of increasing organizational productivity,
quality, and employee morale. Some organizations are using organizational behavior
management (OBM) techniques, which are based on applied behavior analysis
techniques, to respond to the challenges of increasing organizational productivity,
Reproduced with permission of the copyright owner. Further reproduction prohibited without permission.

quality, and employees' morale (Brethower, 1972, 1982; Brethower, 1982; Daniels,
1991; Dillon, Kent, & Malott, 1980; Dillion & Malott, 1981; Eickhoff, 1991; Fellner
& Sulzer-Azaroff, 1986; Henry & Redmon, 1991; Krigsman & O'Brien, 1987; Malott
& Fulton, 1982; Malott & Gracia, 1987; Wilk & Redmon, 1990; and Wittkopp, et al,
1990).
Purpose and Rationale
The purpose of this research is to evaluate SPC technologies, apply organiza
tional behavior management(OBM) technology, and assess its effect on improving the
effectiveness of SPC technologies in a total performance system(TPS) organizational
environment. The need for this type of research can be viewed from three different
perspectives. First, from a practical business viewpoint, businesses are concerned
about techniques for improving organization efficiency. They are very concerned
about training costs associated with SPC and QC Circles programs (Phillips, 1991).
The need to continually improve and do more with less is today businesses' quest.
The impetus for this quest is one of survival, (Deming, 1982, and Peters, 1991). This
research could potentially help managers to identify factors that would be important
to their continual improvement efforts and suggest strategies for controlling those
factors.
The second reason for doing this type of research derives from a scientific or
academic perspective. The field of applied behavioral psychology will likely be
enhanced from this type of research where the dependent variables of interest are
Reproduced with permission of the copyright owner. Further reproduction prohibited without permission.
expressed in economic terms (i.e., dollars). This could potentially benefit future
researchers trying to design such studies in which funding agencies are concerned
about the costs versus benefits of proposed research.
Finally, the need for this research is best illustrated by the potential benefits
for sponsoring organizations and society. When organizations are cost competitive,
that is when they can produce products or services at a comparable or lower cost than
their competition, they have a much greater chance of surviving difficult economic
times or competitive threats from other businesses. This research offers the potential
for helping organizations to accomplish this goal (Czinkota, 1990; Shingo, 1989).
One effective way that the Japanese have gained their competitive cost advantage over
many U.S. firms has been by the "The Minus-Cost Principle," (Shingo, 1989):
Instead of subscribing to the facile formula
cost + profit = selling price
producers must let the market determine price, using the formula
price - cost = profit
with this approach, the only means of increasing profit is to reduce cost. In turn, the only method for cutting costs is through waste elimination. This is the foundation on which all other principles are developed (p 225).
This research offers the potential for organizations to develop skills in how to
pinpoint the desired behaviors and results (Daniels, 1989) that will lead to the
elimination of waste and increase profits.
Reproduced with permission of the copyright owner. Further reproduction prohibited without permission.
In summary, this research will potentially benefit businesses by helping to
identify factors that lead to increased efficiency. Secondly, this research will benefit
the scientific community by providing a potential model for assessing outcomes in
economic units. Finally, the sponsoring organization will benefit from its newly
acquired skills of becoming more competitive by pinpointing key behaviors and results
that lead to reducing waste and increasing the bottom line profit.
There are three problems with trying to assess the effectiveness of SPC
technologies. The first problem involves treatment training packages using SPC that
can be manipulated by the researcher. This is a problem because there is no clear
definition of Statistical Process Control technologies. In searching the published
research literature on SPC, it was discovered that some researchers referred to SPC
technologies as containing both Statistical Process Control and Quality Control Circles
techniques (Krigsman & O'Brien, 1987; Mainstone & Levi, 1987; Mawhinney, 1986;
Redmon & Dickinson, 1987) whereas others referred to Quality Control Circles only
(Ingle, 1982; Manning & Cutis, 1988; Thomas, 1982).
The second problem involves assessing the effectiveness of SPC technology
using outcome measures. This is a problem because companies which use SPC
technology have insufficient experimental controls to assess economic outcome
effectiveness. The measuring systems used in companies are not designed to assess
a training package's effectiveness in outcome terms.
Reproduced with permission of the copyright owner. Further reproduction prohibited without permission.

The third problem is one that has surfaced as the research evolved and relates
to general difficulty of conducting research in an applied setting: the difficulty of
initiating significant change in an organization via an external change agent.
These three problems will be addressed in the method section of this paper.
Combining Technologies-Statistical Process Control. Organizational Behavioral Management, and Total Performance System
The need for organizations to combine the two areas of statistical process
control (SPC) and organizational behavioral management into one total performance
system (Brethower, 1972) that is concerned about achieving the organization's ultimate
goals becomes apparent when one examines the individual components and basic
philosophies associated with the total performance system. The total performance
system can be viewed in terms of an organization interacting with its environment.
Brethower (1972) defines a total performance system as "an adaptive system compris
ing a set of components that, when operational, is sufficient to improve or maintain
the performance of the system" (p. 4). There are seven key components in a total
performance system: (1) a mission statement for the system, (2) input, (3) a
processing system, (4) output, (5) a receiving system, (6) processing system feedback,
and (7) receiving system feedback. Figure 1, shows the components of a total
performance system.
These components are related to all organizations in that all organizations have
a mission, input, processing system, output, receiving system, processing system, and
Reproduced with permission of the copyright owner. Further reproduction prohibited without permission.

9
feedback. These individual components might not be functioning properly or
efficiently, but usually all seven components exist in an organization at various levels.
(1) Mission Statement
(2) Input (5)Receiving3)ProcessingOutput
(6) Processing System Feedback(7) Receiving System Feedback
Figure 1. Brethower's (1972) Total Performance System.
Source: Brethower. D. M. (1972VA total performance system. Kalamazoo, MI:Behaviordelia (p. 7).
The mission involves the aims or goals of the organizations (Brethower, 1972;
Gilbert, 1978; and Walton, 1990). The mission varies with the type of organization
and the level in the organization at which the mission applies. An organization's
mission typically differs within the same organization across units or departments.
However, individual departments' missions or strategies' objectives must be reconciled
with organization's overall mission to assure goal alignment throughout the
organization (Gilbert, 1978 and Rummler and Brache, 1990).
Both Gilbert (1978) and Rummler and Brache (1990), present evidence that an
organization’s system typically has three interdependent levels. Gilbert's model views
these levels as policy (Institutional System), strategy (Job Systems), and tactic (Task
Systems). This model shows that the policy level sets the mission or defines
Reproduced with permission of the copyright owner. Further reproduction prohibited without permission.
accomplishments1. The strategy level defines the important accomplishments that
contribute to the mission in terms of having the most potential for improving the unit's
performance and how the accomplishments will be measured. The tactics level
involves behavior engineering to help the unit to achieve its accomplishments most
efficiently. Rummler and Brache describe the levels in simpler terms as organization
al level, process level, and job/performer level. The organizational level defines or
sets the mission. The process level defines how tasks get accomplished in the
organization. The job/performer level defines who does what task. In summary, both
models present the organization as an interdependent system with the mission being
the most important part. The differences in strategic objectives across levels and the
lack of coordination of these objectives are often sources of system subobtimization
that can be corrected when SPC is implemented properly with organizational behavior
management techniques into a total performance system.
Input to a system can be viewed as factors that are applied to the system
(Luchsinger & Dock, 1976). Input may be raw materials, people, information, and
any other factors that processing system needs to produce output. These factors can
be viewed from several perspectives. The Deming perspective would view these
factors in terms of the four M's, manpower, machine, material, and methods (Walton,
1990). Rummler and Brache (1990), define input as:
1 The word "accomplishment" is used to mean worthy performance, a result obtained by individual, unit, team or organization. The word "performance" means behavior exhibited which may contribute toward the obtainment of accomplishment (Gilbert, 1978).
Reproduced with permission of the copyright owner. Further reproduction prohibited without permission.

11
Inputs are those raw materials, forms, assignments and customer requests that cause people to perform. The input package also includes the performers' resources and the system and procedures that represent the performers; link to the Process level (p. 65).
This perspective attempts to link different levels within the system.
A processing system is the part of the organization that converts the inputs into
the output. This occurs at all three levels within the organization. The output is the
result of the transformation process that occurs during processing. Processing system
feedback is feedback on quantity and quality of outputs or on the efficiency of the
processing system. The receiving system is the user of the output from the system.
This is typically defined as the customers. Customers as defined by Walton (1990):
In quality-minded organizations, the word "customer" describes more than a relationship in which money merely changes hands. It describes the exchange of services as well. For any given enterprise, there are two sets of customers: external and internal. The external customer is the end user of a product or service. The internal customer is the person or work unit that receives the product or the service of another within the same company (p.21).
Receiving system feedback is feedback from customers about quality, quantity, and
timeliness of the system's output.
In summary, the total performance system provides the basic elements for all
organizations to reach their ultimate goals. The total performance system is not only
compatible with statistical process control but seems to have a synergistic effect when
applied with organizational behavior management techniques (Brethower and
Wittkopp, 1987; Luthans and Thompson, 1987; Redmon, 1992). Brethower and
Wittkopp presented two case analyses where persons trained in OBM technology and
Reproduced with permission of the copyright owner. Further reproduction prohibited without permission.

SPC technology worked together to solve manufacturing problems. The authors
indicated that the solutions were stronger because of the combined use of behavior
analysis and SPC approaches, but the solution was not optimized because a total
performance approach was not used. Luthans and Thompson (1987) presented a
compelling argument for the benefits of combining the technologies of Organization
Behavior Modification and Theory D (Deraing 1982). Deming's Theory D consists
of fourteen points. Luthans and Thompson (1987) did an analysis of these fourteen
points and related them to Organization Behavior Modification. This analysis resulted
in the fourteen points being divided into four major groups relating to the total
performance systems (TPS). The first group showed how three of the fourteen points
related to the mission of the organization. This is completely compatible with the
total performance system. The second group illustrated how six of the fourteen points
related to specific actions that managers should take in the system or organization to
improve individual's and team's performance. (In a TPS it would be the processing
system, the receiving system and the feedback loops.) The third group showed how
four of the fourteen points focused on organizational design issues or the macro
aspects of the organization. This grouping is compatible with a TPS and would fit
nicely into the processing system feedback loop, as well as the receiving system
feedback loop. Finally, the last grouping of the fourteen points focused on groups
outside the organization who provide input of raw materials and supplies to the
organization. This is also very much compatible with a TPS in that the inputs must
be processed by the processing system, and feedback about the inputs must be given
Reproduced with permission of the copyright owner. Further reproduction prohibited without permission.
in the processing system feedback loop and sent back to external organization. When
this type of system is in place in an organization, the raw material purchasing can be
carried out in the manner as Deming (1982) describes in his fourteen points:
End the practice of awarding business on the basis of price tag.Instead, depend on meaningful measures of quality, along with price.Eliminate suppliers that cannot qualify with statistical evidence ofquality (p. 16).
In summary, when one examines Deming's fourteen points critically and
contrasts them with a total performance system, one finds more similarities than
differences. The differences as Brethower & Wittkopp (1987, p. 86) pointed out are
"accidental rather than essential." The differences can be largely attributed to
differences in applications of the two technologies (which is likely to be a characteris
tic of the change agent or organization background) and level of skills in using either
traditional industrial engineering techniques, on which SPC is heavily based, or OBM
techniques that are based on behavior analysis techniques. Traditionally, organizations
that have used industrial engineering techniques have been manufacturing organiza
tions. SPC has been, for the most part, used in manufacturing environments. OBM
techniques have been used in a variety of environments usually under the direction of
a consultant or a change agent who was trained in behavior analysis techniques. It
appears that as the skill levels increase and individuals from one area learn about the
other area, the tendency is to use the two technologies as one total performance
system. Recently SPC has been used in the same environments as OBM techniques
and vice versa (Albrecht & Zemke, 1990; Davidow & Uttal, 1989; Lefevre, 1989;
Reproduced with permission of the copyright owner. Further reproduction prohibited without permission.
Pfadt, Cohen, Sudhalter, Romanczyk, Wheeler, 1992; Rehg, V., 1986; Rosander
1989). Individuals with skills in both areas are beginning to realize the potential
benefits of having both technologies united in a total performance system.
Lefevre (1989) cited examples of SPC use in the banking industries and the
government. Rosander (1989) presented case studies of SPC use in a variety of
nonmanufacturing settings. Pfadt et al., (1992) used SPC charting techniques to
evaluate treatment effectiveness in a clinical setting and reported that the SPC charting
techniques helped clinicians to evaluate treatment efficacy.
To summarize, OBM researchers have begun to realize the potential advantages
of combining SPC and OBM. It appears that the most recent publications are
expressing an even greater concern that OBM researchers use SPC technologies in a
broader perspective than earlier researchers (Redmon, 1992). This broader perspective
is a total performance system perspective where the entire organization is considered
at the outset starting with the mission of the organization.
If this approach were adopted, the organization's ultimate goals would be
derived from the organization's mission statement as defined by Gilbert (1978) to
mean accomplishments or purposes that define subcultures, institutions, or organi
zations. The processing system and the receiving system both would use SPC and
OBM techniques for control and feedback to the subsystems or internal customers.
Also the processing and receiving system would use both SPC and OBM techniques
for control and feedback to the external system or the external customer. When the
two technologies of OBM and SPC have been combined into a total performance
Reproduced with permission of the copyright owner. Further reproduction prohibited without permission.

system, the necessary components will be in place for the organization to achieve its
ultimate goal in the most efficient and effective way.
Organizational Behavioral Management (OBM) Techniques
Organizational behavior management technology has a solid empirical
foundation based on its use in business to improve outcome effectiveness in many
areas (Andrasik, 1989; Balcazar, Hopkins, & Suarez, 1986.) A recent study by Henry
and Redmon (1990) successfully used feedback to get machine operators to increase
behaviors related to completing SPC charting. A study done by Krigsman and
O'Brien (1987), employed a multiple baseline design to assess the outcome
effectiveness of an SPC program that used quality circles versus self-monitored
feedback at two different plant locations. The results from this study suggested that
the quality circle program was more effective over the long haul in reducing clip loss
than self-monitoring feedback at one of the research sites. The "motivational" issues
addressed in this study were significantly affected by the quality circle program but
not significantly affected by self-monitoring. The study revealed significant reductions
in both absenteeism and lost work time. A study by Wittkopp, Rowan, and Poling
(1990) used performance feedback to reduce machine operators setup time in a rubber
manufacturing company. The results were collected using a multiple-baseline design
across machines and operators. The study was effective in reducing the average
machine setup time in the intervention phase over the baseline phase.
Reproduced with permission of the copyright owner. Further reproduction prohibited without permission.

In summary, the three above studies used OBM techniques from limited rather
than a broad total organizational-wide perspective to augment the organizations' efforts
in their statistical process control programs. This limited use of OBM techniques is
an issue that concerned OBM researchers (Brethower & Wittkopp, 1987; Redmon,
1992). The propensity in most organizations is to view their organization as a total
system. This means that quality and productivity improvement efforts are viewed as
total quality management (TQM) (Redmon, 1992) or as company-wide total quality
control (Mizuno, 1989).
The need for the synthesis of SPC technology and OBM technology into a
total performance system is apparent from reviewing past events. OBM researchers
are presented with the challenge of how to expand the behavioral analysis technology
that is largely based on microfocus of individual behavior to more of a macroperspec
tive that views individual and group behavior in the total performance system. To
meet this challenge OBM researchers need to conduct research that consists of four
elements: (1) research should be done in applied industrial settings, (2) researchers
need to take a broad perspective that takes the total performance system view, (3)
researchers should consider both individual and group behaviors, and finally, (4) the
dependent variables must be practical outcomes that industrial managers are concerned
about.
Reproduced with permission of the copyright owner. Further reproduction prohibited without permission.

17
Summary
This current research attempted to address the above challenges by systemati
cally implementing SPC technologies and OBM technologies into a total performance
system (TPS). The practical concerns of industrial managers are addressed by
assessing economic outcome effectiveness by measuring individual worker and group
productivity, quality, and morale factors. The research was conducted in an industrial
setting.
In industrial settings which employ SPC technology the workers are aware of
the punitive consequences when they fail to meet productivity and quality standards.
Redmon and Dickinson (1987) pointed out that SPC programs place heavy emphasis
on antecedent factors that are part of the system and under the control of management,
and little emphasis is placed on the consequences of the workers' behaviors.
This study attempted to use OBM technology and SPC technology to help
management alter its emphasis from almost exclusive antecedent control system to a
system that considers antecedents, behaviors, and consequences from a total
performance system's perspective in applying SPC. This study was modeled after
much of the applied work that is being done in performance management by Daniels
(1990) and Rummler and Brache (1990).
Reproduced with permission of the copyright owner. Further reproduction prohibited without permission.
CHAPTER H
METHOD
Subjects
The subjects in this study consisted of 87 employees, 65 hourly workers and
12 management personnel, at a iron castings foundry. The hourly workers were all
males, with the exception of three females who worked in the Metallurgical Lab and
the office areas. The age of the hourly workers ranged from 20 to 58 years. The
management staff were all male; ages of the management staff ranged from 25 to 59
years.
Hourly workers who served as subjects were volunteers for QC-Circles
training. The hourly workers were all unionized and represented by the International
Molders and Allied Worker Union. Subjects from management personnel were those
who volunteered to participate in the QC-Circle training and the OBM Training.
The hourly workers were assigned to QC-Circle groups according to then-
assigned department, functions, and interests. For example, a worker, whose
department was the molding department and whose job was Mold Maker, might be
assigned to the Mold Makers QC-Circle if he was interested in a particular problem
on which this circle was working. The only restriction for assignment to a QC-Circle
for hourly workers was that they had to remain with the same QC-Circle during the
18
Reproduced with permission of the copyright owner. Further reproduction prohibited without permission.
entire length of the study. Management personnel were assigned to QC-Circle groups
according to their normal functional responsibilities as department supervisors. For
example, the molding department foreman was assigned to the molding department
QC-Circle for the entire period of the study.
Setting
This study occurred in XYZ, INC. (a producer of gray and ductile iron
castings). The plant size was approximately 50,000 square feet. The work
environment was very noisy, dusty, and hot. Protective clothing was required at all
times in the foundry. Hard hat, safety glasses, gloves, steel toe shoes, ear plugs, and
dust masks were standard protective clothing for most of the jobs. The lighting was
adequate for this type of work.
The machines involved in this study were So2 Core Machines, Green Sand
Core Machines, Hunter Automatic Molding machines, Squeezer Mash Plate Molding
Machines, and conventional Cope and Drag Machines. Other miscellaneous
equipment included induction melting furnaces, shake-out machines, hand grinders,
and finishing machines.
Dependent Variables
The long-term effectiveness of SPC technology and OBM technology was
assessed by measuring key indicators of the plant's productivity, quality, and morale.
The productivity and quality factors were routine measures of the plant's daily
Reproduced with permission of the copyright owner. Further reproduction prohibited without permission.
operations maintained as part of accounting, production control, and quality control
functions. The Morale factors were assessed via employee attendance and tardiness
figures and were maintained as part of the personnel or human resources department's
function. These data were converted to economic terms by the plant's financial
controller. The procedures for this conversion will be addressed in the results section
of this paper.
Other factors that were measured, which were directly related to the above
dependent variables, were reduction in job ticket error rates made by workers,
reduction in error rates on time card administration procedures, the number of
suggestions submitted by workers, and number of suggestions submitted that resulted
in cost savings. Also, the number of specific pinpointed work improvement projects
started and the economic benefit of pinpointed projects were assessed. Finally,
productivity and quality indicators for the six key areas were measured. The six key
areas were job ticket error rate across departments, time card error rate across depart
ments, individual daily attendance rate, individual suggestion submitted and
implemented, manhour per ton produced across departments, and plantwide quality
indicator of amount of scrap produced. Because of the interactive nature of a foundry
manufacturing environment, any substantial contribution from this group would likely
be positively reflected in the six key areas productivity and quality indicators.
Reproduced with permission of the copyright owner. Further reproduction prohibited without permission.

Independent Variables
21
The independent variables consisted of three training packages: Quality Control
Circle Training, Statistical Process Control Training, and Performance Management
Techniques. The first training package consisted of training commonly found in a
well-prepared Quality Control Circle training program. The training package was
modeled after the North American Suppliers Circle Activity Member Handbook, 1990.
To insure consistent contact with the independent variable, the researcher required
each QC-Circle to select a real problem in their area involving poor product quality
or poor productivity and to use the training that they received in QC-Circles to make
recommendations to management on how to solve the problem. The researcher
evaluated the team's efforts and gave feedback to the teams. To insure that the team
consistently contacted the independent variable, 15% of QC-Circle's activities were
verified by the researcher by actually checking with management to assess the quality
of the group's efforts and attendance at circles meetings. A copy of the form that the
researcher used to record circle meetings activities can be found in Appendix H.
The QC-Circle training consisted of: (a) management philosophy behind SPC,
(b) group problem-solving techniques (Brainstorm, the Deming Circle, PDCA Plan Do
Check Act, Cause-and-Effect Diagram, Graphs, Pareto Analysis, Kepner Tregnoe
Alternative Analysis), (c) how to do a cost-benefit analysis, (d) how to conduct
QC-Circles meetings, and (e) how to make QC-Circles reports to the plant's
QC-Circle steering committee.
Reproduced with permission of the copyright owner. Further reproduction prohibited without permission.

22
The second training package consisted of training in Statistical Process Control
(SPC) charting for attribute data only. Attribute charts are most appropriate types of
charts for controlling foundry-type manufacturing processes. The training included:
A. Data gathering techniques
1. Descriptive Statistics
a. Measure of central tendency: Mean, median & mode
b. Measure of variability: Range, variance, standard deviation
B. Control chart construction
1. Attribute charts only
2. Areas where charts can be used
C. Control chart interpretation
1. Statistical control
a. Special causes of variation
b. Common causes of variation
D. Process Capability
1. Six sigma limits
To assure consistency of contact with the independent variable, the data for the
control charts were collected by the operators in the department or group and were
brought to the classroom for analysis and interpretation.
The third training package consisted of providing training in Performance
Feedback techniques and Performance Management techniques. This training was
given to the operators' immediate superiors and other plant management personnel.
Reproduced with permission of the copyright owner. Further reproduction prohibited without permission.
To insure that the subjects consistently contacted the independent variable, classroom
training consisted of basic training in Performance Management techniques.
Videotaping of role-playing exercises and written Business Simulation (Education
Research, 1987) on delivering reinforcement were used to train subjects. The
researcher was able to review videotapes and give feedback to subjects. The written
Business Simulation is a self-scoring device, so subjects were able to get feedback
about how effective they were at delivering reinforcement. The researcher worked
with management to develop a list of extrinsic reinforcers that could be given to the
workers individually and as group incentives (see Appendix B). The researcher
accompanied managers on 25% of the sessions in which reinforcement and/or
feedback were delivered to the workers and/or groups. This observations occurred
during meetings with various groups. A formal assessment of management use of
reinforcement and feedback techniques was done and will be described in the results
section of the paper.
Training packages consisted of specific skill building behaviors to: (a) deliver
performance feedback in an effective manner, (b) decide on what type of reinforcer
is likely to be most effective with a particular worker or group, (c) learn how to
pinpoint desired behaviors to be reinforced, (d) learn how to measure the desired
behaviors for the group, (e) learn how to deliver performance coaching for improving
substandard workers' performance (Daniels, 1989), (f) learn how to analyze workers
performance problem from a Total Performance System perspective, and (g) learn how
Reproduced with permission of the copyright owner. Further reproduction prohibited without permission.
to calculate Potential for Improved Performance (PIP) for work groups or departments
(Gilbert, 1978).
Procedures
This study evolved as a result of a series of professional contacts and training
programs that researchers had conducted for management of the sponsoring
organization. Table 1 shows the key events that led to the research project and the
events occurring during the research. For a detailed explanation of these events see
Appendix C.
The project was first presented to the entire plant in two separate meetings to
accommodate the plant's work schedule for second shift employees. The proposed
study's purpose and procedures were explained to the employees. Copies of the
informed consent form were given to individuals to read; and if they agreed to
participate in the study, they could sign and return it to the researcher. See Appendix
A for copy of protocol clearance letter.
The training sessions were all held on site at the sponsoring organization in a
two-hour block of time once each week. Immediately after each training session, a
hot meal was catered into the plant for the participants in the training. Participants
were grouped in QC Circles training according to their assigned circle's activities and
were asked to sit together and work on class projects as a group during the training.
Reproduced with permission of the copyright owner. Further reproduction prohibited without permission.

Table 1
Listing of Key Events in the Transformation Process of Combining the Two Technologies
Time Event
March 1988 1. Initial contact with organization
September 1988 2. Provided Management by Objective
November 1988 3. Provided supervisory training in MBO
April 1989 4. Quality Control Circle training
May 1990 5. Statistical process control and quality Control problem-solving teams
April 1991 6. Refresher training in SPC and QC- Circle training
August 1991 7. Performance Management techniques
September 1991 Data Collection began
September 1991 8. Performance Management training
February 1992 9. Started pinpointing key performance
March 1992 10. Two key areas identified
June 1992 11. Area #1 reinforcement program for attendance
October 1992 12. Started a plantwide employee suggestion program
Special Problems
There are three problems with trying to assess the effectiveness of SPC
technologies that were described earlier in this paper. The first problem involves
Reproduced with permission of the copyright owner. Further reproduction prohibited without permission.
26
classifying SPC technologies into treatment training packages that could be
manipulated by the researcher. The second problem involves assessing effectiveness
of SPC technology in economic outcome measures. Finally, a problem surfaced as
the research evolved and related to the general difficulty of conducting research in an
applied setting; the difficulty in initiating significant change in an organization via
an external change agent. This problem became apparent from the following events:
1. The researcher had very limited resources as an outside researcher. The
organization's resources were strictly controlled by the organization's financial control
procedures.
2. The researcher had very limited control over personnel schedules and
assignments of personnel to different areas as would be desirable to manipulate the
research design.
3. The researcher had very limited control over many internal and external
events that could impact the outcome variables of this research.
The third problem is not a unique problem to this research project. Another
researcher cited this as a potential problem for researchers who attempt to do this type
of applied industrial research (Eickhoff, 1991):
Rarely will a small business owner or manager grant a researcher, consultant or manager the opportunity to simultaneously work on implementing change strategies in every area of the organization, and at every level of the organizational hierarchy. In addition, only few small business owners will allow a change agent to publish research about their total organizational change process as it might divulge the confidentiality regarding both their innovative strategies employed to better serve their customers and their past organizational performance results. A great deal of trust must be earned by the change agent from
Reproduced with permission of the copyright owner. Further reproduction prohibited without permission.

the small business owner in order to undertake a responsibility of such magnitude (p. 2).
To solve the first problem, the researcher followed the Deming’s Model o f SPC
which consists of two broad categories (Mainstone & Levi, 1987). The treatment
training packages were based on this model. An explanation of these packages can
be found in the independent variable section of this paper.
The second problem of assessing effectiveness of SPC technology in economic
outcome measures was solved by taking a total performance system approach and
using data from the plant's traditional accounting system to examine important
economic outcomes. The interactive nature of an applied manufacturing setting is
such that if changes are made to improve product quality this is likely to affect the
product quantity over a relatively long period of time. The workers' morale is affected
by allowing them to participate in controlling what happens to them while they are
in the work environment (Herzberg, 1966). The morale of the workers will be
reflected in their attendance and tardiness rates. It is a well-known fact that if the
workers are not present for work or if they show up late, their overall productivity and
quality will also be lower. This research measured these important economic factors
as defined in the dependent variable section of this paper to assess the effects of SPC
technology and OBM technology on the organization's economic outcome effective
ness. AB-type-group designs were used for implementation and maintenance in the
study.
Reproduced with permission of the copyright owner. Further reproduction prohibited without permission.
The third problem was partially resolved by the researcher developing a long
term close working relationship of trust with CEO of the organization and his entire
staff. See the transformation process in Table 1 for listing of events that led to this
long-term relationship. Also see Appendix D for a detailed explanation of these
events.
Experimental Design
The study began early in September of 1991. A series of AB-type designs
using within-group methodology were chosen to allow for systematically implement
ing the different training packages. The nature of the applied work environment is
such that AB-type design using within-group methodology offers the maximum
advantages. The within-group design has three of the four advantages that Kazdin
(1982) describes as the strengths that a between-group design offers for applied
research. The first is "between-group comparisons are especially useful when the
investigator is interested in comparing two or more treatments" (p. 220). Second,
between-group designs provide information about the magnitude of change between
groups that do not receive the intervention. Third, between-groups designs are very
useful for large-scale applications across different settings. Finally, between-group
designs allow for studying interaction effects of different factors in the same
experiment. Three of the four factors applied to the current research. The use of AB-
type design with within-group methodology also allows comparison of treatments..
Even though the traditional between-group design strategy compares difference
Reproduced with permission of the copyright owner. Further reproduction prohibited without permission.
treatments across groups in which one or more groups might have the treatment
withheld or a different type of treatment administered; this was not the case with this
research study. All groups received the same treatments. However, the magnitude
of change between the groups could be assessed; the relatively large size of this study
(eight groups) necessitate this type of design; and the ability to assess the interaction
affect of the treatment on the overall plant's productivity and quality indicators was
very important. Therefore, this choice of a design was most appropriate. Also, the
use of AB-type single case design in this study is very appropriate to examine
individually controllable behavior such as attendance rates and number of suggestions
each individual submitted. See Table 2 for the design strategy used in this research.
The various design strategies used in this research allowed for the maximum
manipulation of the various treatments across groups while normal plant operations
were ongoing. The workflow in a foundry manufacturing process plant, such as the
current setting, is such that individuals' effects on productivity and quality are very
difficult to measure. The productivity and quality measures are based on the man
hours required by a group to complete a particular job. Therefore, the traditional
single-subject design would not be completely feasible without the group
methodology.
Six AB-type designs using within-group methodology were employed to
measure the productivity, quality, and morale factors across departments, plantwide
in economic terms in this study. The areas were as follows: (1) job ticket error rate,
(2) time card error rate, (3) attendance improvement-hourly workers, (4) suggestions
Reproduced with permission of the copyright owner. Further reproduction prohibited without permission.

30
submitted and implemented, (5) key productivity indicators by department, and (6) key
quality indicators at the finishing department.
Table 2
Research Design Strategy
Ideal Design Practical Design Consequences(Unable to use) (Used)
Minor degree of experimental control was compromised for practical benefits that are unlikely to threaten external or internal validity (Kazdin, 1982). The most questionable threat to internal validity in this study is diffusion of treatment. The most questionable threat to external validity is multiple-treatment interference. The two threats are not serious since the purpose of the research is to assess overall effectiveness of the training packages and not to look at individual component effectiveness in isolation.
Multiple Baseline group design across departments; or, AB-type design with a reversal phase for each of the training packages. Measures dependent variables in economic units.
AB-type group design, plantwide for components of SPC and OBM interventions. Measure dependent variables in economic units.
Experimental Phases
Four experimental phases were planned for each of the AB-type-group designs.
1. Baseline Phase #1: Baseline data were collected until a stable rate of
performance was observed across groups.
Reproduced with permission of the copyright owner. Further reproduction prohibited without permission.

2. Intervention Phase #2: Feedback was given to groups about their perfor
mance.
3. Intervention Phase #3: Reinforcers were provided to increase and maintain
the desired level of performance.
4. Integration Phase #4: The integration of the components of both OBM and
SPC into a Total Performance System. This was accomplished by getting common
agreement from the mission of the organization as to what items should be important
among all levels within the organization. The efforts of each department, quality con
trol circle, task group, and individuals within the organization will be carried out
within a total performance system context with the organization mission as the
ultimate goal.
Procedure for Each AB Design
The procedures used in each of these designs were as follows:
1. Collected baseline data on the outcomes of interest in each of the
designs until a stable rate of performance was achieved for all groups in the particular
study.
2. Retrained existing QC-Circle groups and new volunteers in QC-Circle
techniques. Observed and measured performance of all groups until a stable rate of
performance was achieved.
3. Provided SPC training to all QC-Circle groups who were designated to
receive QC-Circle training. When training was completed, instructed specific
Reproduced with permission of the copyright owner. Further reproduction prohibited without permission.
QC-Circle groups to implement SPC charting (SPC groups) techniques and other
QC-Circle group not to implement SPC charting techniques (no SPC group). It was
beyond the researcher's control as to whether the groups actually implemented the
SPC. The researcher had no formal authority over the work force; he merely made
recommendations to the management. ( This did not occurred as planned)
4. Observed and measured performance of all groups until a stable rate
of performance was achieved.
5. Implemented OBM reinforcement and feedback with No-SPC group.
Observed and measured performance until a stable rate of performance was achieved.
6. Implemented OBM reinforcement and feedback with the other groups.
Observed and measured performance until a stable rate of performance was achieved.
Baseline Data Collection
Some of the outcome measures of interest in this study were already being
collected as part of the accounting and personnel record keeping systems at the plant.
For example, the plant had 102 different ways of measuring productivity. Absentee
ism and tardiness records were computerized and could be readily processed to show
individual, as well as department, totals for both absenteeism and tardiness. Quality
indicators in fact were already being collected. Data on QC-Circles effectiveness were
being compiled but not in sufficient detail to draw conclusions about effectiveness as
outlined in this study.
Reproduced with permission of the copyright owner. Further reproduction prohibited without permission.

Table 3
Productivity and Quality Measures
Item Measured Where Measured Frequency
Manhours per ton Finishing department Monthly
Cold set department Monthly
Melt department Monthly
Green sand Monthly
Core room Monthly
Maintenance Monthly
Pattern Monthly
Percentage of scrap Plantwide Monthly
Overtime as a percentage of regular time
Plantwide Monthly
The researcher and the plant personnel jointly decided to use four key areas
in the plant to measure productivity and quality. See Table 3 for examples. The
productivity measures were based on the manpower per hour to produce a unit of
output. Manhours per ton was chosen because this is a consistent way of measuring
productivity throughout the plant. The indicators for quality in fact were reflected in
the percentage of scrap generated in the various departments throughout the plant.
The lower the scrap percentage the better the department's overall quality.
Reproduced with permission of the copyright owner. Further reproduction prohibited without permission.

QC-Circle Training Procedure
All individuals who volunteered to participate in QC-Circles received the
training as outlined in the independent variable section of this paper. Forty-three
individuals volunteered to receive this training. The training procedure consisted of
the following steps:
1. Individuals were asked to form teams according to their work areas and
interests.
2. Once in teams, they were asked to sit together during the training and
to assist each other with the class projects and exercises.
3. The instructional techniques consisted of presenting concepts and
theories on QC-Circles; showing examples on how the concepts have been applied in
other settings and examples of how the concepts could be applied in the current
setting; and providing an opportunity for each team to work on a "real problem" from
its area.
4. On the final day of the training, each team was required to make a
report to the class on its class project and to present a time-and-action chart showing
what actions the team was proposing to take and the timeframe for this action.
The presentation included a cost-benefit analysis of the proposed project. Feedback
from the instructor and rest of class was given to the presenting group as to their
project's quality and practicality. Their presentations were to simulate the actual
Reproduced with permission of the copyright owner. Further reproduction prohibited without permission.

management presentations that teams would give to the plant's QC-Circle Steering
Committee when they presented an actual team project after the training.
The training occurred in two-hour blocks of time for seven weeks. The
training was held in the plant one hour before the first shift ended and one hour into
the second shift. Hot food was catered into the plant and served immediately after
the training. The workers were paid their normal hourly rate for attending the
training. The groups were instructed to keep accurate data to reflect: (a) the number
of suggestions generated during group meetings, (b) the number of suggestions result
ing in cost-saving ideas, and (c) the actual cost savings amount realized by the
department or company as a result of the group's effort.
SPC Training Procedure
This phase was designed for individuals who volunteered for both QC-Circle
training and Statistical Process Control (SPC) training. The phase consisted of
training in SPC attribute charting techniques as outlined in the Independent Variable
section of this paper. The training was designed to follow the same format as
outlined in the QC-Circle Training. There were no volunteers for this phase of the
training. However, many of the members were trained prior to this formal study using
the same procedure as described above for QC-Circle training.
Reproduced with permission of the copyright owner. Further reproduction prohibited without permission.
36
Management Training/Performance Feedback and Performance Management Procedure
The training was administered to the management personnel who volunteered
to receive training. Eleven individuals volunteered to receive this training. The
researcher encouraged all management personnel, including the president, plant
controller, plant manager, plant superintendent, management support staff, and line
foremen, to take the training. The training was conducted as outlined in the
Independent Variable section of this paper. Subjects were trained in 12 sessions, two
hours each over a three-month period. Each training session was conducted on site
at the sponsoring organization. Subjects were actively involved in group discussions
and exercises designed to get subjects to apply the training to their jobs. Subjects
were requested to pinpoint items in their areas in which they would like to use the
performance management techniques. The researcher conducted follow-up meetings
weekly with different individuals to give feedback and assess progress made on
selected pinpointed items.
During the training participants practiced the techniques in class to reinforce
the techniques that were being taught. For example, the use of positive language
when describing negative behavior of workers was considered. All pinpointed items
were agreed to be plotted using positive terms rather than negative terms. One
example was in how absenteeism was plotted. The percentage of employees present
in lieu of percentage of employees absent was chosen. Social rewards were provided
during the training and immediately after the training. Pizza and soft drinks were
Reproduced with permission of the copyright owner. Further reproduction prohibited without permission.
catered into the plant, and the upper management and the researcher would sit and
talk with the participants while eating the pizza. Subjects who completed the training
were given a personal inscribed plexiglass clipboard with a pen set that could be used
daily in the performance of their jobs and sincere thanks from the researcher and the
management for their participation in the training.
Integration of Technologies Into a Total Performance System Procedure
Individuals from a cross section of the plant and representatives from all
organization levels in the plant were asked to join a group that would be responsible
for communication and recognition issues at the plant. This group was formed and
consisted of some 12 individuals. The group named itself the "The Knights of The
Round Table." This group's main mission was to improve communication at all levels
of the organization. The group was to work on any item that would lead to improved
communication and recognition. The problem-solving procedures that were taught in
the quality control circle training were put in action. Also, the pinpointing techniques
that were taught in the performance management training were put into action to
facilitate the group's efforts. This group met on a weekly basis and functioned as a
dynamic force to facilitate and coordinate change in the plant. During the meetings
the group used the following procedure:
1. Meetings were chaired by hourly employee.
2. Written agenda was prepared in advance showing topics and responsi
bilities.
Reproduced with permission of the copyright owner. Further reproduction prohibited without permission.

3. Twenty-five percent of meetings were independently evaluated by QC
facilitator and researcher to assure reliable use of SPC problem solving techniques by
the group. The percentage agreement between the two observers was calculated using
the following formula:
Number of Agreement------------------------------------------------------ x 100Number of Agreements + Disagreement
An agreement was recorded when both observers marked the same items on the
observation form. Disagreement was recorded when the observers marked different
items on the observation form.
4. The group functioned as a communication link between the workers and
management.
The researcher introduced the Rummler and Brache (1990) techniques to interested
members of the group. Also, the concept of "Synchronous Organization"2 was
introduced to this group. The management staff was very interested in pursuing
certification to ISO 9000 Series of international quality management standard.3 The
management staff decided to pursue certification to ISO series. This is a long-term
2 Synchronous organization as used in dissertation refers to the General Motor Corporation model that is used to train its subsidiaries and suppliers in waste reduction techniques that are based on Toyota's production system.
3 ISO (International Organization of Standardization) 9000 series is a comprehensive set of five quality management system standards that was developed by a group of foreign countries mostly in Europe and has gained world-wide acceptance. Certification to ISO 9000 series of standard give assurance that the certified organization quality management system meet minimal total system quality requirements.
Reproduced with permission of the copyright owner. Further reproduction prohibited without permission.

commitment that requires more time than the length of this study. The implication
of this long-term commitment to this study will be addressed in the discussion section
of this paper.
General Method for Change
Job Ticket Error Correction Procedure
Data were collected across department and analyzed using AB-type group
design with the following procedure:
1. The supervisor collected job tickets from individual workers, verified
the accuracy of the information on job tickets, and delivered job tickets to the office
clerical staff.
2. The office clerical staff processed job tickets by entering the informa
tion into the computer.
3. If missing or incorrect information was noted at the time of processing
the ticket, the clerk was instructed to record the nature of the error using the Job-Tick-
et/Time-Card Checksheet. See Appendix G.
4. Feedback about the number or errors was not given to the supervisors
during the baseline period.
First Intervention Feedback Phase
The procedure for giving feedback was as follows:
Reproduced with permission of the copyright owner. Further reproduction prohibited without permission.

1. The clerk informed the supervisor on a daily basis about the number
and type of errors that were found while processing the job tickets.
2. The supervisor was instructed to inform the particular worker who
actually caused the error.
3. At the end of the month the researcher graphed the data and met with
the plant manager and the plant controller to discuss the results.
4. The plant manager distributed the graphed data and discussed the
results with individual supervisors.
5. The researcher held review meetings at the end of each three months
with the entire plant management staff and the clerical personnel who processed the
job tickets. The meetings served as problem solving and feedback sessions. The
clerical personnel explained the implication of the various types of errors. The
problem of too much delay in the feedback loop from the operator who made the error
to the clerk who detected the error when processing the job tickets was addressed in
each meeting. The feedback time was reduced by having the individual supervisor
check the job tickets prior to giving them to the clerk.
The Second Intervention Minus Feedback Plus Correction Procedure (Originally Designed Procedure)
The procedure consisted of the following:
1. Operator completed the job ticket and verified its correctness.
Reproduced with permission of the copyright owner. Further reproduction prohibited without permission.
2. The Supervisor collected job tickets from operators and verified job
ticket correctness and provided corrective feedback to operators if errors were
detected. The supervisor required operators to correct their original mistakes and the
supervisor delivered the corrected job tickets to the clerk for processing. If no errors
were detected, the supervisor provided verbal praise to the workers.
3. The clerk processed the job tickets and noted any errors. If errors were
detected, the clerk immediately called the responsible supervisor and asked the
supervisor to make the corrections to the job ticket prior to processing the job ticket.
4. The researcher compiled and graphed the data on a monthly basis and
gave it to the plant manager. The plant manager distributed the graphed data and
discussed the results with individual supervisors to provide feedback.
Changes to the Second Intervention Phase
The revised withdrawal-procedure consisted of:
1. Feedback was not given to the supervisors as had been in the past. The
only feedback that was given was from the clerical staff to the supervisors on an
they-thought-necessary basis.
2. The correction procedure was not implemented and the supervisors were
allow to respond as they did prior to the baseline intervention phase.
3. The researcher collected the data from the clerical staff and graphed the
data. The results of the graphed data were shared with the clerical staff supervisor
and the plant controller.
Reproduced with permission of the copyright owner. Further reproduction prohibited without permission.
42
Time Card Correction Procedure
Data were collected across department and analyzed using an AB-type group
design with the following procedure:
1. Supervisor verified the accuracy of the information on the time card.
The office clerical staff picked up time cards from the racks out in the plant.
2. The office clerical staff processed the time card by entering the data
into the computer.
3. If missing or incorrect information was noted at the time of processing
the time card, the clerk was instructed to record the nature of the error using the Job-
Ticket/Time-Card Checksheet. See Appendix G.
4. Feedback about the number of errors was not given to the supervisors
during the baseline period.
Time Card First Intervention Feedback Phase
The procedure for giving feedback was as follows:
1. The clerk informed the supervisor on a daily basis about the number
and type of errors that were discovered while processing the time cards.
2. The supervisor was instructed to inform the particular worker who
actually caused the error.
3. At the end of the month the researcher graphed the data and met with
the plant manager and the plant controller to discuss the results.
Reproduced with permission of the copyright owner. Further reproduction prohibited without permission.
4. The plant manager distributed the graphed data and discussed the
results with individual supervisors.
5. The researcher held review meetings at the end of each three months
with the entire plant management staff that included the plant controller and the
clerical personnel who processed the time cards. The meetings served as problem
solving and feedback sessions. The clerical personnel explained the implications of
the various types of errors. The problem of too much delay in the feedback loop from
the operator who made the error to the clerk who detected the error when processing
the time card was addressed in each meeting. The feedback time was reduced by
having the individual supervisor check the time cards prior to the clerk picking up
time cards from the racks and getting back to the operator who made the error or
correcting the error himself in the case of not signing a time card to authorize
overtime.
Time Card Second Intervention Minus Feedback Plus Correction Procedure (Originally Designed Procedure)
The procedure consisted of the following:
1. Operators were reinstructed on the importance of punching in and out
correctly. A written procedure was placed near each timecard rack.
2. The supervisor monitored time cards and verified time card correctness.
If no errors were observed on the time card, the supervisor placed the time card back
in the rack. If errors were observed, supervisor removed the time card from the rack
Reproduced with permission of the copyright owner. Further reproduction prohibited without permission.
and initiated corrective action with the worker. Once the error had been corrected by
the worker, the worker placed the time card back in the rack for the clerk to process.
3. The clerk processed the time card making note of any errors. If errors
were detected, the clerk immediately called the responsible supervisor and had the
supervisor make the corrections to the time card prior to processing the job ticket.
4. The researcher compiled and graphed the data on a monthly basis and
gave it to the plant manager. The plant manager distributed the graphed data and
discussed the results with individual supervisors.
Changes to the Second Intervention Phase
The revised withdrawal-procedure consisted of:
1. Feedback was not given to the supervisors as it had been in the past.
The only feedback that was given was from the clerical staff to the supervisors on an
as they-thought-necessary basis.
2. The correction procedure was not implemented and the supervisors were
allowed to respond as they did prior to the baseline intervention phase.
3. The researcher collected the data from the clerical staff and graphed the
data. The results of the graphed data were shared with the clerical staff supervisor
and the plant controller.
Reproduced with permission of the copyright owner. Further reproduction prohibited without permission.
CHAPTER m
RESULTS
The management team and the QC-Circles selected the pinpoints or key results
that they thought would be most cost effective if improvement could be made to these
items. Their selections were based on the criteria that they learned during the
performance management training. Management's three top pinpointed items were
employee attendance improvement; job ticket and time card administrative procedure
accuracy; and plantwide safety. Two of three management selected pinpoints were
included in the six AB-type designs. One of the QC-Circles, The Knights of The
Roundtable, also selected employee attendance and employee-generated suggestions
as important items to improve. Employee generated suggestions are also included in
the six AB-type designs.
The results from the six AB-type designs were mixed. The job ticket error
rate correction procedure; the time card error rate correction procedure; the attendance
improvement procedure and employee suggestion plan all had positive effects. The
key productivity indicators by department and quality indicators by department
showed mixed to insignificant effects. See Appendix D for a display of the graphed
date for the job ticket error rate correction procedure, time card error rate correction
45
Reproduced with permission of the copyright owner. Further reproduction prohibited without permission.

procedure, the key production indicators by department, and quality indicators by
department.
Job Ticket Correction Procedure Results
The results from the job ticket correction procedure are displayed in Figure 2.
The baseline period was the month of March 1992. The results of the baseline
period revealed an overall plantwide error rate of 256 errors per month. Refer to
Table 4 for a complete listing of errors on job tickets. The baseline period showed
that 120 errors were caused by special numbers being missed or incorrect; 23 errors
were caused by the part number being missed or incorrect; 78 errors were caused by
customer order numbers being missed or incorrect; 3 errors were caused by missing
quantities or pieces; and 23 were errors caused by missing job tickets.
The baseline data were also analyzed by individual supervisor's areas. The
result revealed that 3 of the 8 departments caused 83% of the errors on job tickets.
This was consistent with Pareto's principle that "80% of the problems stem from 20%
of the causes" (Walton, 1990 p. 24).
The first intervention phase consisted of providing feedback to the responsible
supervisor on the number and type of errors found on the job tickets. This phase
began in April 1992 and continued through December 1992.
The results from the first intervention phase showed a significant improvement
over the baseline phase. When viewing the results visually in Figure 2, one can see
the improvement graphically over the months by the general downward trend in the
Reproduced with permission of the copyright owner. Further reproduction prohibited without permission.
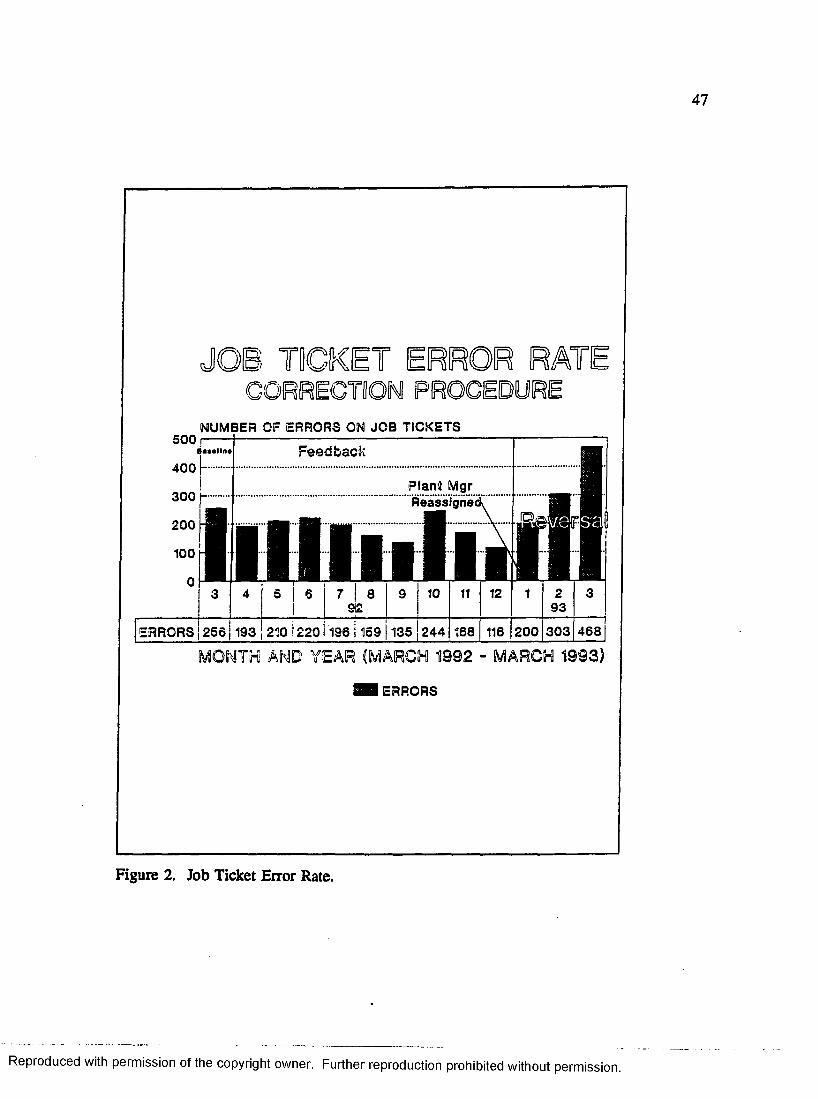
JOB TICKET ERROR RATS
500 iNUMBER OF ERRORS ON JOB TICKETS
Feedback
Plant Mgr Reassigne
ERRORS 256 193 210 ! 220 196 i 159 135 244 168 116 200 303 468
MONTH AND YEAR (MARCH 1992 - MARCH 1993)
S i ERRORS
Figure 2. Job Ticket Error Rate.
Reproduced with permission of the copyright owner. Further reproduction prohibited without permission.

Table 4
March 1992 Through March 1993 Errors on Job Tickets
Month Missing Spec. #
Incorrect Part #
Incorrect Order #
IncorrectPieces
MissingJob
Ticket
Total
March 1992 120 23 78 3 32 256
April 137 24 4 5 23 193
May 138 28 3 5 36 210
June 98 20 55 4 43 220
July 108 13 59 0 16 196
August 77 3 45 4 30 159
September 75 2 45 1 12 135
October 127 2 87 0 28 244
November 85 0 68 0 15 168
December 63 0 46 0 7 116
January1993 106 11 57 4 22 200
February 116 47 103 0 37 303
March 142 56 225 4 41 468
job ticket error rate. The baseline job ticket error rate was 256 errors for the entire
plant. The eight month's average-plant-job-ticket error rate was 190.6. The second
intervention phase was originally scheduled to consist of feedback, plus a correction
procedure that incorporated reinforcement for the supervisor and the worker when
error-free job tickets were received. However, because of changing in production
Reproduced with permission of the copyright owner. Further reproduction prohibited without permission.

schedule and other factors that the researcher could not control, the second phase was
made into a reversal phase. The feedback was not given and the proposed correction
procedure was not implemented.
The results from the reversal phase showed a marked return to the baseline
error rate. The three month's average job ticket error rate during the reversal phase
was 323 errors versus the baseline error rate of 256. The sharp increase in error rate
over the baseline rate can be explained by two factors. One, the volume of new
orders increased significantly during the reversal phase. This meant that many new
customers specifications which were unfamiliar to both management and the workers
were introduced into the system; thus, increasing the chances of errors on the job
tickets. Two, many temporary workers were hired to meet the increased demand for
production. This caused a rapid increase in the number of workers who were not
familiar with the job ticket system; thus, further increasing the chance of errors on job
tickets. The two areas will be addressed in the discussion section of this paper.
Time Card Correction Procedure Results
The results from the time card correction procedure are displayed visually in
Figure 3. The baseline period was the month of March 1992. The results of the
baseline period revealed an overall plantwide time card error rate of 434 per month.
Refer to Table 5 for a complete listing of errors on time cards. There were 215 errors
errors for not punching out at lunch; 47 errors for incorrectly punching out at lunch;
Reproduced with permission of the copyright owner. Further reproduction prohibited without permission.
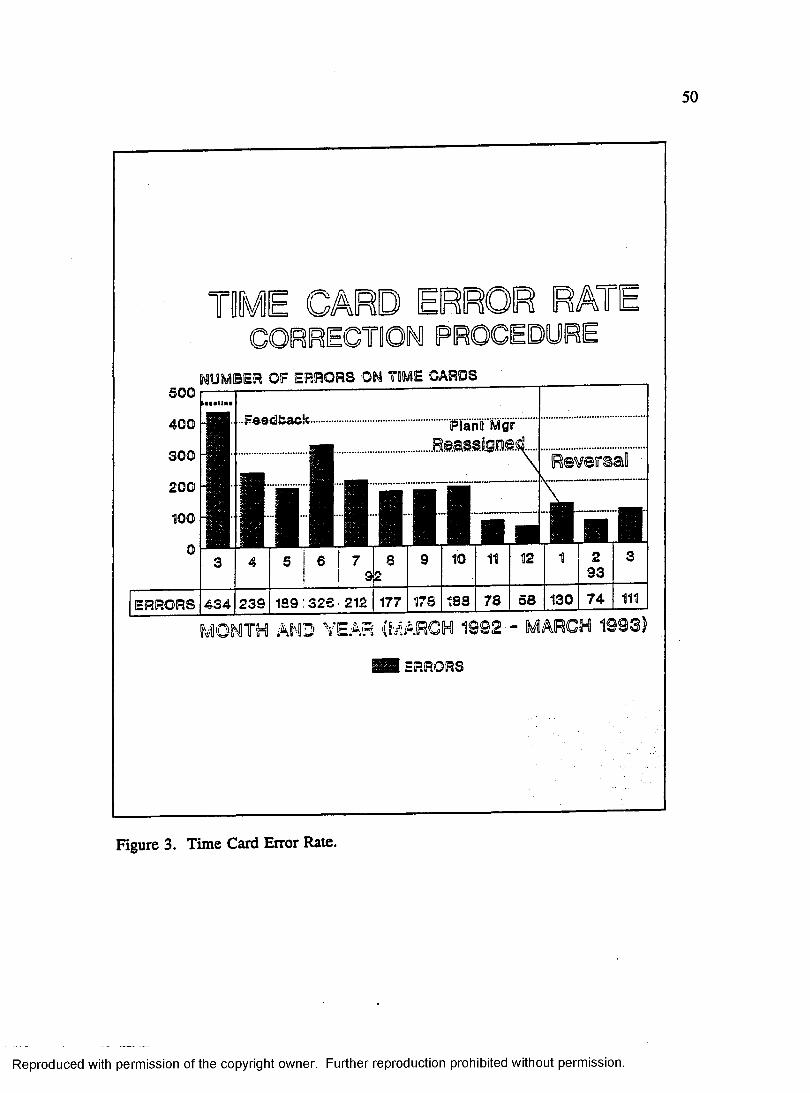
50
TIME CARD RAT
OF ERRORS OH TIME CARDS
Feedback Planf Mgr
ERRORS 434 239 1S9 :326 212 177 178 183 78 58 130 74
M ONTH AND YEAR '(MARCH 1992 - MARCH 1 9 9 3 )
ERRORS
Figure 3. Time Card Error Rate.
Reproduced with permission of the copyright owner. Further reproduction prohibited without permission.

51
Table 5
March 1992 Through March 1993 Errors on Job Cards
Month No Lunch Should Be No Lunch
OvertimeN/signed
MissingPunch
Total
March 1992 215 47 155 17 434
April 146 32 57 4 239
May 49 99 38 3 189
June 29 108 186 3 326
July 23 71 117 1 212
August 10 72 93 2 177
September 7 34 135 2 178
October 27 71 88 2 188
November 9 23 46 0 78
December 7 21 30 0 58
January 1993 18 52 52 8 130
February 9 24 40 1 74
March 4 34 70 3 111
155 overtime worked but not approved by supervisor; and 17 missed punching in or
out.
The baseline data were also analyzed by individual supervisor's area. The
results revealed that the problems existed in 7 of the 9 departments. Three
departments accounted for 58% of problem time cards. This was consistent with the
Reproduced with permission of the copyright owner. Further reproduction prohibited without permission.

Pareto's principle. The baseline average errors per day was 3.39. Another way to
express this would be to say that on the average there were three time cards each day
that had errors in each supervisor's area.
The first intervention phase consisted of providing feedback to the responsible
supervisor on the number and type of errors found on the time cards. This phase
began in April 1992 and continued through December 1992.
The results from the first intervention phase showed a significant improvement
over the baseline phase. When viewing the results visually in Figure 3, one can see
the improvement graphically over the eight months by the general downward trend in
the time card errors. The baseline time card errors was 434 errors for the entire plant.
The eight month's average plant time card errors was 198. This is significant to the
clerical staff in making their job easier and freeing them for more productive work
directly related to value added operations in their jobs. For example, in the baseline
phase on the average each department supervisor area made 3.39 mistakes on time
cards per day that the clerical staff had to take action to correct. After 8 months into
the first intervention phase, the average error rate is 1.12 mistakes per supervisor's
area.
The second intervention phase was originally scheduled to consist of feedback,
plus a correction procedure that incorporated reinforcement for the supervisor and the
worker when error free time card were received. However, because of changing in
production schedule and other factors that the researcher could not control, the second
Reproduced with permission of the copyright owner. Further reproduction prohibited without permission.

phase was made into a reversal phase. The feedback was not given and the proposed
correction procedure was not implemented.
The results from the reversal phase showed a relatively stable error rate that
was substantially below the baseline error rate. The three month average time card
error rate during the reversal phase was 105 errors versus the baseline error rate of
434. The relatively stable error rate can be explained by the fact that the feedback
system that was established still existed and has now become part of the system even
though the formal feedback mechanisms were withdrawn. The unsystematic feedback
from the clerical staff that existed in the baseline phase had been refined by the
exposure to the formalized feedback system that occurred in the first intervention
phase. This refinement along with the supervisor actions probably contributed to the
reduced error rate.
Attendance Improvement Procedure Results
The baseline phase revealed the plant's overall average attendance rate to be
96.6% (the average individual missed 8 days per year or 2 days per quarter from
work). The baseline period consisted of the data from twelve months prior to June
1992 for all the hourly employees. See Appendix E for details of the attendance
improvement procedure.
The results of the first quarter that the intervention was in effect revealed no
significant gain in overall plant average attendance. The average attendance remained
at 96.6%. There were ten individuals who had 100% attendance and received a
Reproduced with permission of the copyright owner. Further reproduction prohibited without permission.
$25.00 reward and social praise. There were ten individuals who had 98% attendance
and received a $10.00 reward and social praise. The total amount paid to the 20
individuals was $350.00.
During this particular quarter one worker had 15 days of absences or .003%
of the total plant's absences for the quarter. The significance of this will be addressed
in the discussion section of this paper.
The second quarter results revealed an increase in the plantwide average
attendance from 96.6% to 97.2%. This was significant in that it represented a 25 day
improvement over the baseline attendance rate. In economic terms, this represent a
gross dollar amount of approximately $2431.00. This amount was computed by using
the average hourly rate times the number of hours in 25 day period times 130% for
fringe benefits. This will be elaborated on in the discussion section of this paper.
There were 21 individuals who met or exceeded the 98% goal. Sixteen
individuals had 100% attendance this quarter and five individuals had 98%. Seven
individuals maintained their 100% attendance for the two quarters. Five of the
individuals from quarter-one who met or exceeded the 98% attendance goal failed in
the second quarter to maintain their attendance at 98%. There were five individuals
who failed to make the 98% goal in quarter-one but made this goal in quarter-two.
Also, there were two individuals (probationary workers, not in the union) who were
not eligible in quarter-one for the attendance rewards who achieved 100% attendance
in the second quarter.
The third quarter results showed a return to the baseline attendance rate of
Reproduced with permission of the copyright owner. Further reproduction prohibited without permission.
96.6%. There were 16 individuals who met or exceeded the 98% or better attendance
goals. There were ten individuals who had 100% attendance in the third quarter and
six individuals who had 98% attendance. This was significant when compared to the
baseline number of individuals who met or exceeded the 98% or better attendance
goal, (Refer to Figure 4.) this number was 12 and only three individuals had 100%
attendance during the baseline period.
In summary the results of the first three quarters that the attendance improve
ment plan has been in effect is very encouraging. The overall plant attendance has
increased from 96.6% to 96.8%. This is important to the XYZ's plant management
because it means that a 0.2% increase in attendance at the current employment level
results in a savings of 24.5 days. In economic terms this translates into an estimated
$2612.68 cost avoidance figure for absenteeism (24.5 days x 8 hrs per day = 19 6
hours. The average hourly rate plus fringe benefit is $13.33. 196 x 13.33 = 2612.6).
It has resulted in an overall improvement in the number of individuals who have met
the attendance goal of 98% or better. An analysis of possible reasons why the plant's
overall attendance percentage isn't higher will be addressed in the discussion section
of this paper.
Suggestion Plan Results
The initial results from the plantwide suggestion plan were very encouraging.
The first week that the plan was in effect resulted in ten suggestions from the hourly
workers. There were four additional suggestions submitted the following week. A
Reproduced with permission of the copyright owner. Further reproduction prohibited without permission.
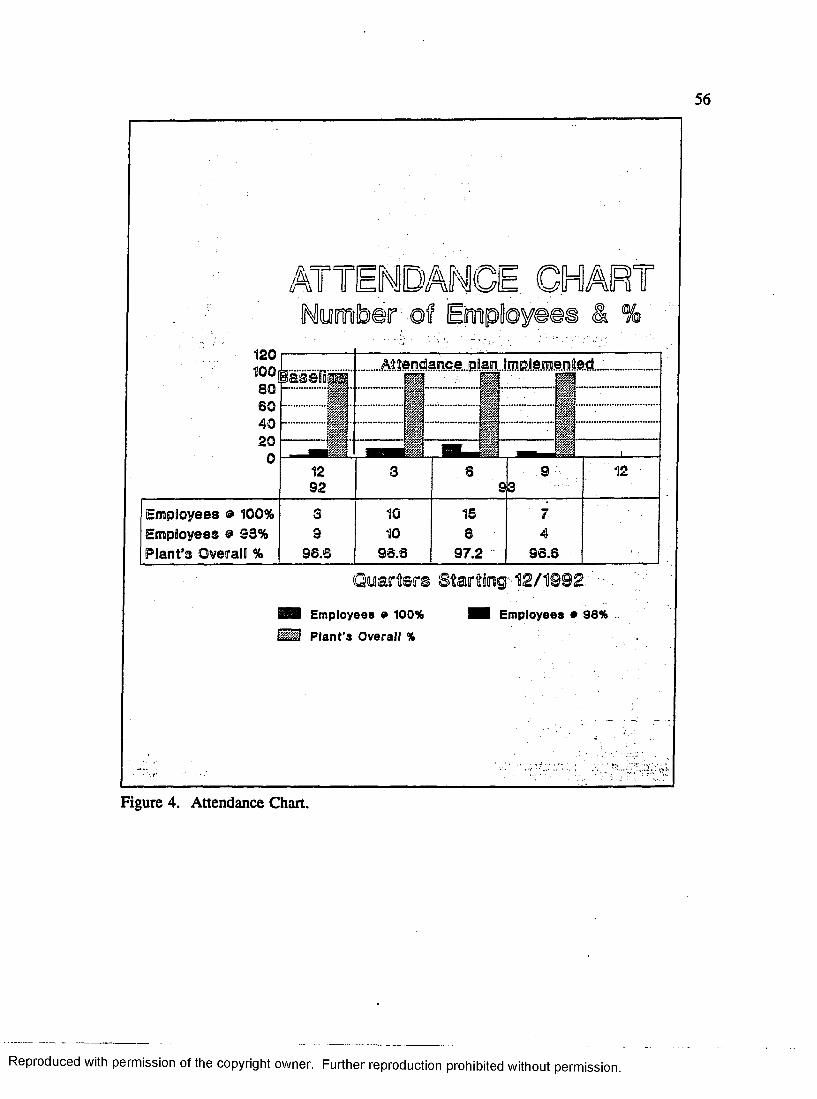
.........
l i | - ............ »WM______ mwm' p ff
01292
3 sa
. 9 .
3
I12
Employees » 100% 3 10 15 7Employees 9 93% 9 10 8 4Plant's Overall % 96.6 93.3 97.2 96.6
Q u a r te r s S ta rtin g '-1 2 /1 9 9 2
Employees 9 100% H i Employees • 98%
Figure 4. Attendance Chart.
Reproduced with permission of the copyright owner. Further reproduction prohibited without permission.
quick review of these suggestions revealed them all to be thoughtful and required the
committee's investigation for potential benefit.
Investigation revealed that the suggestions could be placed into four groups as
follows:
1. Suggestions relating to work area improvement such as safety, cleanli
ness, morale, and communication. There were six suggestion made in this area.
Three of these suggestions have been approved and are currently being worked on.
The other three suggestions are still open and being investigated.
2. Suggestions relating to product productivity and quality improvement.
There were five suggestions made in this area which pertained to work method im
provement, equipment maintenance, and machinery improvement which would impact
the product productivity and quality. Three of the suggestions have been approved
and implemented. One suggestion is still open and being investigated. The other sug
gestion was not feasible to implement because of the cost.
3. Suggestions relating to monetary rewards for implemented suggestions.
There were two suggestions made to give monetary compensation to individuals
whose suggestions resulted in significant saving to the organization. The committee
rejected the suggestions and written responses were made indicating the purpose of
suggestion plan and the types of recognition that would be given for suggestions.
4. Suggestion that conflicted with the union contract. There was one
suggestion submitted that conflicted with union contract. This suggestion dealt with
Reproduced with permission of the copyright owner. Further reproduction prohibited without permission.
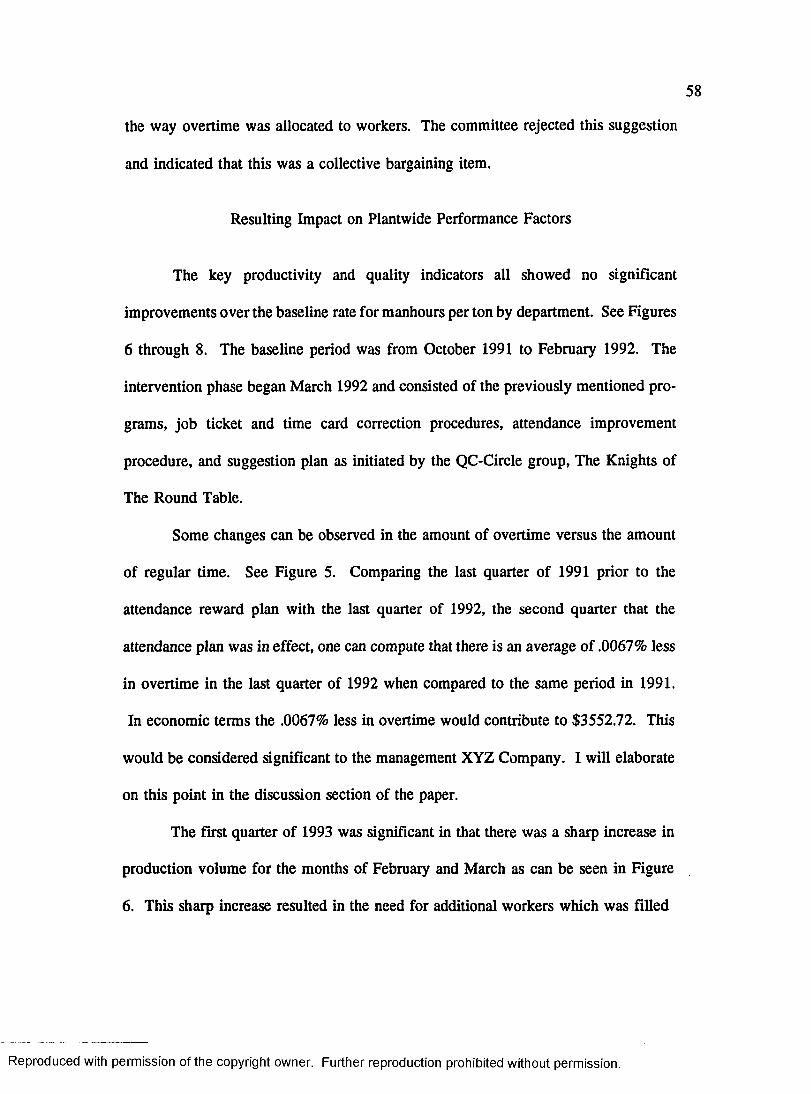
the way overtime was allocated to workers. The committee rejected this suggestion
and indicated that this was a collective bargaining item.
Resulting Impact on Plantwide Performance Factors
The key productivity and quality indicators all showed no significant
improvements over the baseline rate for manhours per ton by department. See Figures
6 through 8. The baseline period was from October 1991 to February 1992. The
intervention phase began March 1992 and consisted of the previously mentioned pro
grams, job ticket and time card correction procedures, attendance improvement
procedure, and suggestion plan as initiated by the QC-Circle group, The Knights of
The Round Table.
Some changes can be observed in the amount of overtime versus the amount
of regular time. See Figure 5. Comparing the last quarter of 1991 prior to the
attendance reward plan with the last quarter of 1992, the second quarter that the
attendance plan was in effect, one can compute that there is an average of .0067% less
in overtime in the last quarter of 1992 when compared to the same period in 1991.
In economic terms the .0067% less in overtime would contribute to $3552.72. This
would be considered significant to the management XYZ Company. I will elaborate
on this point in the discussion section of the paper.
The first quarter of 1993 was significant in that there was a sharp increase in
production volume for the months of February and March as can be seen in Figure
6. This sharp increase resulted in the need for additional workers which was filled
Reproduced with permission of the copyright owner. Further reproduction prohibited without permission.
BTIIDE!
REG H R S X 100O .T . %25025
A tt»nd*no«.prpar.* .m 20020Suggaatlon program
150 .
1100
50
93
8 9 19 8 11 9 6 S 7 7 11 8 9 11 14 15 201512110̂ 110134 !40:5^2C 124 82^13713S 14S4^37 368843 SOC £3('
M ONTH ANO YEAR
O.T. % REG H
REGO.T. %
*<V -.•.i .
Figure 5. Overtime % Vs. Regular Time.
Reproduced with permission of the copyright owner. Further reproduction prohibited without permission.

PRODUCTION VS. SC R A P 1%)
TONS PRODUCED. VS SCRAP %
GOODPROD Il02jl44 938 SCRAP 13 16 14
178fr84j20Cil02|152?33 1211 13 16 13 15
11420
16813514414717 18 16 13
(194|11
18114
19424514 15
301N1TH AMD YEAR : ■
GOODPROD SCRAP
P1
.V :'V ‘ • <> V \
Figure 6. Production Vs. Scrap (%).
Reproduced with permission of the copyright owner. Further reproduction prohibited without permission.
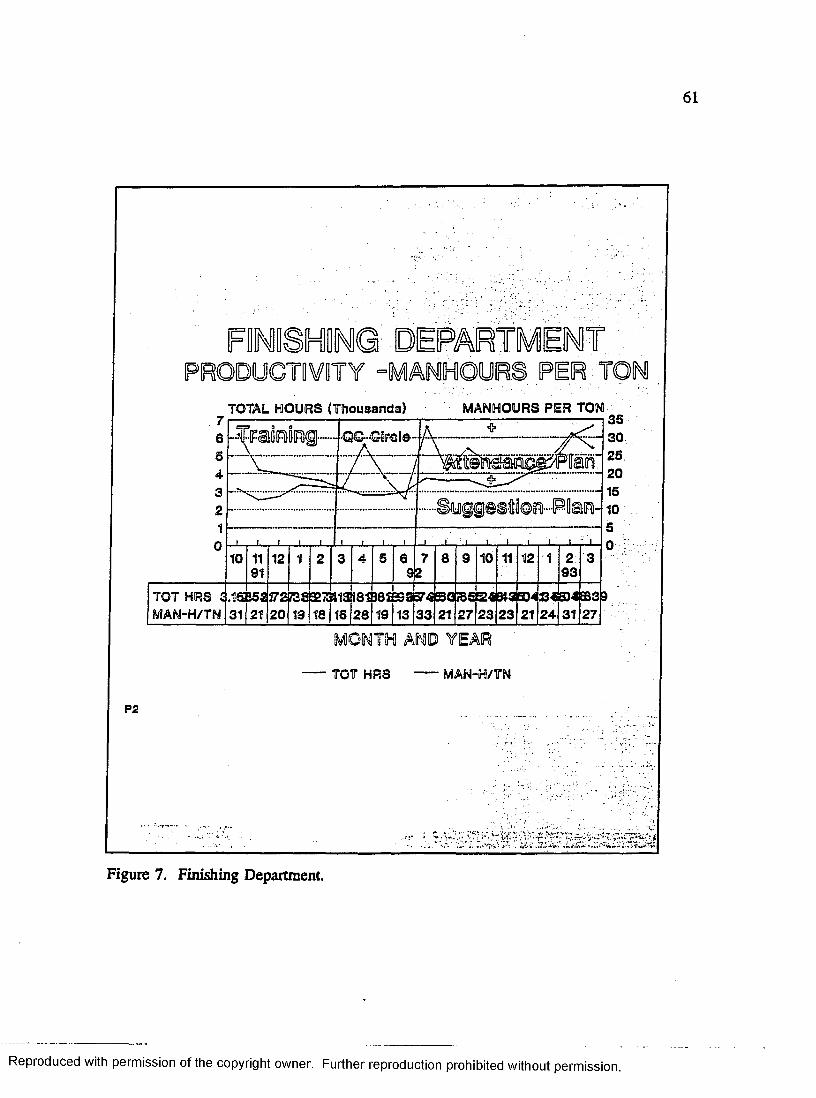
FINISHING' DEPARTMENT'PRODUCTIVITY -MANHOURS PER.-TON
TOTAL HOURS (Thousands) MANHOURS PER TON
302520
9333TOT HRS !
MAN-H/TN172j73d327»1S !81B8SSaBr4 20 19 18 18 28 19 13133
;as&p«»3E04 1 27 23 23 21 27
AND YEAR
TOT HRS MAN-H/TN
P2
- ■ *' >- ̂'■ i
Figure 7. Finishing Department.
Reproduced with permission of the copyright owner. Further reproduction prohibited without permission.

COLD SETPRODUCTIVITY -MANHOURS PER TO
140012001000800600400200
0
TOTAL HRS MANHOURS PER TON
I S S S S Z
TOT HRS 1 MAN-H/TN
....G:Q...GJmte?.- A - -
z S s z ;E E z i i Z E
3EZ
1 1
10 12 1 I 2
0074CB9CB1c88'844582351714B9793'94C 316011 9.86.2 5 | 5 5 4 9 6 3 8 5 | 7 9
I <r I
92
1 1 1 1 i 1 1 19 10 11 12 2
93825H064071
6 6 6117$5
1210864
20
MONTH AND YEAR
TOT HRS MAN-H/TN
P3
Figure 8. Cold Set.
Reproduced with permission of the copyright owner. Further reproduction prohibited without permission.

by temporary workers who were unskilled. This created some special problems for
the plant that will be addressed in the discussion section of this paper.
Results of Integration Effort Into a Total Performance System
The results of the integration effort into a total performance system were
initially very encouraging. The formation of the one large group to oversee the
intergration effort proved to be successful. The results of this group's effort produced
three significant integration plans/programs that involved the organization's mission
and individual department goals. The first integration plan was an employee
attendance improvement plan. The success of this plan has been described previously
in this paper. The second integration plan was the initiation of employee suggestion
plan. The results of the suggestion plan have been described in this paper. The third
project that this group is working on is a plantwide recognition plan for safety
behavior by individuals, departments, and plantwide. This project is still in the
planning stage. Plans are also being developed for the implementation of ISO 9000
certification process for a total quality management system.
The use of the SPC methodology and OBM methodology were observed
during the QC-Circle meetings and on other occasions when interacting with personnel
at the XYZ plant. There was a 90% interobserver agreement between the researcher
and the QC-Circle facilitator on the use of SPC problem solving techniques.
Reproduced with permission of the copyright owner. Further reproduction prohibited without permission.
64
Results Summary
In summary, the results from the time card correction procedure, job ticket
correction procedure, the attendance improvement plan, and the suggestion plan all
showed positive results. The results from the plantwide performance factors showed
mixed to insignificant results. The integration effort into a total performance system
showed some positive results with continued progress being made as will be
elaborated on in the discussion section of this paper.
Reproduced with permission of the copyright owner. Further reproduction prohibited without permission.
CHAPTER IV
DISCUSSION
The present study suggests that the maintenance of SPC technology with OBM
technology can be achieved effectively when integrated into a total organizational
wide effort that supports the organization's overall mission and key day-to-day
operational goals. The SPC technology consisted of training individuals in the use
of Attribute control charts and Quality Control Circle group problem solving
techniques based on the Deming's (1982) SPC system. The OBM technology
consisted of training the management personnel in the use of performance manage
ment technology using Daniels’ (1989) approach. The step-by-step integration of the
two technologies into a total organizational wide system was based on the concepts
put forth by Brethower’s (1972) Total Performance System; Rummler and Brache's,
(1990) Three Level Framework of Organization; General Motors Corporation
Synchronous Organization; and the International Organization of Standard (ISO) 9004
Quality Management System.
This study was significant in that it focused on four main challenges that
confront OBM researchers; (1) taking the research from the OBM lab to the actual
industrial setting, (2) adopting a broad perspective that addressed the organization as
a total performance system, (3) considered both individual and group behaviors, and
65
Reproduced with permission of the copyright owner. Further reproduction prohibited without permission.
(4) and the dependent variables in this study were all practical outcomes that the
industrial managers were concerned about.
Special Challenges and Problems
Subject Selection
Subject selection was based on those who individuals volunteered to participate
in the training and those who were normally assigned duties in the areas under study.
This method proved to be problematic in that the number of subjects who were
assigned to areas affected by the study was very dynamic and changed with
environmental factors that the study could not control.
Setting
Conducting this research in an industrial setting of a foundry was particularly
challenging for two major reasons. One, the foundry manufacturing environment is
very dynamic in that it is excessively noisy, dusty, and usually hot. The workers were
required to wear protective clothing. This made it difficult for general record keeping
and clerical functions associated with a performance management system. Two, the
sales forecast which lead to the production schedule was somewhat volatile because
of the general economic conditions of this industry. This caused major shifts in
management emphasis to respond to the economic trends and market conditions. One
response was management's ability to adjust the work force on a short-term basis by
Reproduced with permission of the copyright owner. Further reproduction prohibited without permission.
using temporary workers. When this happened, often large numbers of unskilled
workers were placed in jobs that required skills. This obviously put an extra burden
on the first-line supervisors of temporary workers to get them trained as soon as
possible. This was a particularly difficult time for the supervisor. He not only had
to train a large number of unskilled workers, but he also had to respond to an
increased production schedule. This created the typical problems associated with
manufacturing such as producing enough to meet the customer's demand, the worker
making too much scrap, and safety issues, particularly with new workers. A second
way that management responded to the shift in the economic trends was to not
replace full time skilled employees when they quit, or to redistribute their workload.
This happened with three positions in the management and professional staff. Two
of the individuals were in key positions that directly affected this study. They both
served as the Quality Control Circle Facilitator at different times. The management
individual was the plant manager who left the plant in December 1992. This appeared
to have some effect on the results of this study as will be explained shortly.
In summary, one can see that conducting research in an industrial setting is
challenging. The challenge was met by responding to the changing environment with
the most feasible means available and carefully observing changes and documenting
the results.
Reproduced with permission of the copyright owner. Further reproduction prohibited without permission.

Combining SPC Technology With OBM Technology Into Integrative Performance System
A second challenge that was met by this researcher was adopting a broad
perspective that addressed the issue of maintaining SPC technology with OBM
technology by taking an integrated systems approach. After watching the QC-Circles
lose their enthusiasm after a couple of successful projects, it became obvious that the
changes that were being made by the groups had little chance of long-term
maintenance without being integrated into the organization's mission. In an effort to
accomplish some degree of integration, one large group was formed that consisted of
individuals from all areas of the plant. The group gave itself the name "The Knights
of The Round Table." This group's mission was to work on one common problem
that everyone in the organization agreed on.
The one problem that everyone agreed on was the need for "better communica
tion and recognition of employees for their good work." This problem surfaced back
in April 1989, see Appendix C, when the researcher initially provided quality control
circle training. This issue was of such concern to the workers that it would dominate
most of the early training sessions discussion on trust between management and the
workers.
Working on the communication and recognition group was bottom-up
integration rather than top-down integration. It was the beginning of the organization-
wide integration effort. Though not the most desirable way to accomplish organization
wide integration it was the most feasible means under present conditions in the plant.
Reproduced with permission of the copyright owner. Further reproduction prohibited without permission.
A meeting was held in March 1993 with the President, the new Plant Manager, and
Controller to discuss a strategy for implementing an integrated system approach.
Agreement was made that the most feasible approach for this organization was to opt
for certification to ISO 9000 series of quality management system standard. This
decision was based on two important reasons. The first was the awareness of the need
to approach quality and productivity improvements from an overall top-down
organization wide perspective. ISO 9000 quality system requirements are very similar
to Total Quality Management (TQM) approach (Shores, 1990); and Company-wide
Total Quality Control approach, (Mizuno, 1989). The second reason was based on
factors that are being driven by the marketplace. This organization is a supplier of
products to foreign countries in which many customers prefer certified ISO 9000
suppliers over those who are not certified. Therefore, in order to compete effectively
in foreign markets, ISO 9000 certification is essential.
The pursuit of ISO 9000 certification does offer some important benefits to this
research. First, it provides the mechanism for making total system change by defining
the basic quality control management system requirements. Secondly, it would require
documented evidence that such a system does exist as part of the certification process.
Third, once certification was obtained, surveillance visits of the organization to assure
that the quality management system was being maintained would be performed by
independent outside auditors every six months. Finally, the experience gained by the
researcher in being trained to implement ISO 9000 and going through the certification
Reproduced with permission of the copyright owner. Further reproduction prohibited without permission.

process with the organization would be beneficial to furthering the field of Organiza
tion Behavior Management.
Experimental Design
The third challenge of using both group and individual behaviors was
accomplished by examining group performance variables by departments and
individual performance. Obtaining individual performance data was difficult to
accomplish because of the nature of foundry manufacturing. Most tasks were
accomplished in groups; or individual tasks were group dependent. The most common
measure of group performance was by manhour per tons of product produced by the
department. This reflected the group's effort along with other factors beyond the
group's control. This method of measuring group performance does not compromise
the validity of the study since baseline data were taken on group performance which
measured both group controllable factors and group uncontrollable factors. The use
of AB-type group design in this type of setting was most appropriate (Kazdin, 1982).
The challenge of using individual performance data was solved by examining
individual behaviors that were directly controllable by the individual with a minimal
of group influence. Individual daily behavior of getting to work on time and staying
the entire scheduled shift was measured. The number of suggestions submitted and
the quality of the suggestion was measured. Single-subject design strategies were
used to assess changes in individual performance on personal attendance and personal
suggestions submitted to management.
Reproduced with permission of the copyright owner. Further reproduction prohibited without permission.

In summary, both group performance measures and individual performance
measures using AB-type group designs and Single-Subject type designs were salient
features of this study. The nature of applied industrial research is such that one must
examine the effects of both groups and individuals behaviors on the results.
Dependent Variables
The final challenge that this study addressed was assessing the important
outcomes that concerned industrial managers. When researchers are able to link their
research to "real world" outcomes that concern society as a whole, they are meeting
an important challenge (Boehm, 1980). This was addressed by using techniques from
Gilbert (1978) and Daniels (1989) to identify important results that management
wanted to see improved. The key factors that affected productivity and quality were
originally planned to be implemented by the individual supervisors in their pinpointing
efforts. Refer to Table 6 for a listing of these items as originally planned after the
performance management training class. These items did not get implemented
because of competing demands on the supervisors' time.
Some less important items than the productivity and quality items received the
most attention in this study because they were less dependent on the individual
supervisor's times and more under the control of the researcher and the groups. The
job ticket correction procedure and time card correction procedure components of this
study were undertaken as a direct response to the concerns of the plant management.
The plant manufacturing costing system is very dependent on the accuracy of job
Reproduced with permission of the copyright owner. Further reproduction prohibited without permission.
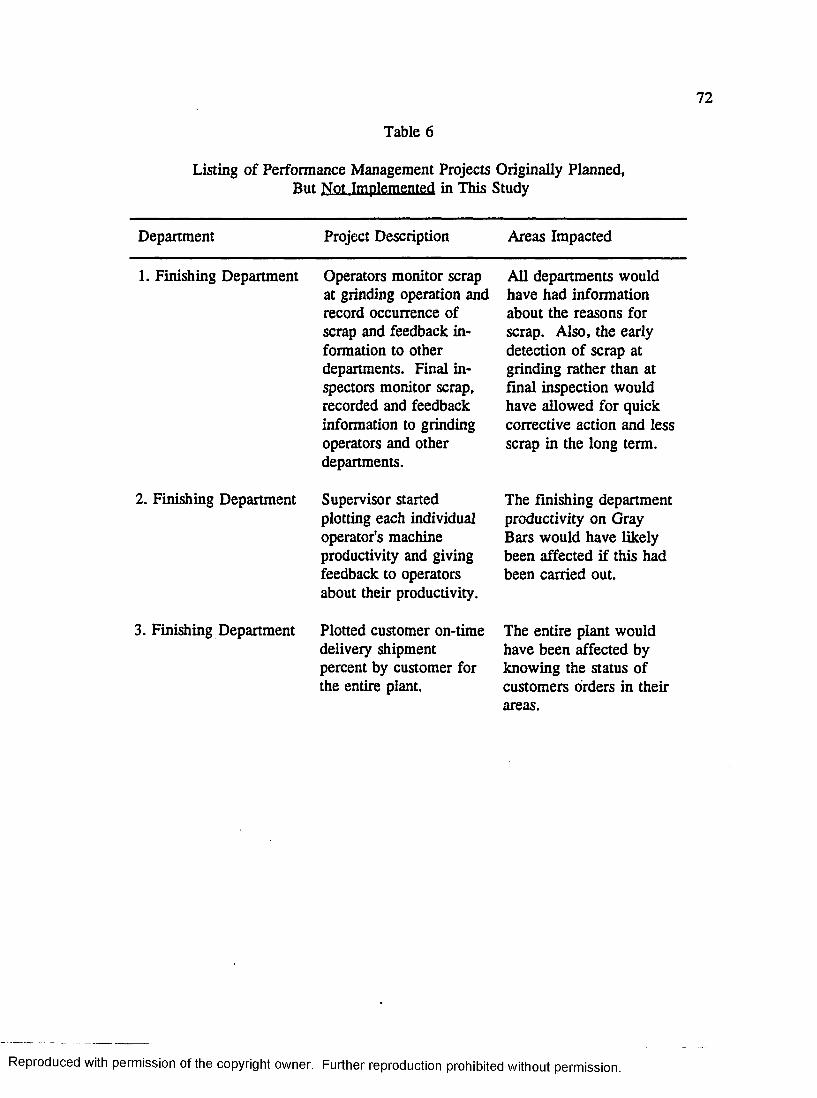
Table 6
Listing of Performance Management Projects Originally Planned, But Not Implemented in This Study
Project Description Areas ImpactedDepartment
1. Finishing Department
2. Finishing Department
3. Finishing Department
Operators monitor scrap at grinding operation and record occurrence of scrap and feedback information to other departments. Final inspectors monitor scrap, recorded and feedback information to grinding operators and other departments.
Supervisor started plotting each individual operator's machine productivity and giving feedback to operators about their productivity.
Plotted customer on-time delivery shipment percent by customer for the entire plant.
All departments would have had information about the reasons for scrap. Also, the early detection of scrap at grinding rather than at Anal inspection would have allowed for quick corrective action and less scrap in the long term.
The finishing department productivity on Gray Bars would have likely been affected if this had been carried out.
The entire plant would have been affected by knowing the status of customers orders in their areas.
Reproduced with permission of the copyright owner. Further reproduction prohibited without permission.

Table 6-Continued
Department Project Description Areas Impacted
4. Maintenance Department
5. Core Department
Monitoring repeat repairs on items that affected the plant's productivity and quality. A log was started that showed when a particular machine broke down and when it was repaired and whether this was a repeat repair.
*
Plotted the machine setup time by operator and machine and gave feedback to operators about their machine setup time versus the production standard.
All areas of the plant would have been affected by this since this would have highlighted repeat repair problem areas as well as the maintenance person who worked on the problem.
Core department productivity as measured in man hours per ton would have been affected by this project.
6. Sales Department Plotted the number of written responses by the sales department quoting potential customers versus the actual customer orders received in response to the written quotes.
Sales department would have known how effective their job quoting system was and the likelihood of receiving an order that it quoted to a customer.
ticket data. Errors in job ticket data, if not corrected prior to entering into the
computer, cause problems in customer billing, inventory control, and accuracy of the
various financial statements that are used to make decisions about the plant's
operations. Errors on the time card could lead to incorrect payroll and incorrect
payment of workers for their hours worked. Also, extra time was required by the
Reproduced with permission of the copyright owner. Further reproduction prohibited without permission.
clerical staff to contact the supervisor and get the correct information for job tickets
and time cards. This was time that could have been used for other value added
activities such as keying data into the computer, answering the telephone, and
performing general problem solving activities that need to be done on a routine basis.
The attendance improvement plan was in direct response to both management
and the workers. Management, understandably, wanted to reduce its cost associated
with absenteeism and tardiness. The workers were interesting in ways of getting
recognition for their effort to be at work everyday when the attendance policy would
allow for individuals to miss up to four days a year without incurring any negative
consequences from management. The fact that the labor contract permitted a worker
to call-in absent once every quarter without incurring any negative consequences
created a condition that was favorable for absenteeism at least one day per quarter for
each worker. The baseline attendance rate at beginning of this study was below this
rate at 96.6% attendance, or about ten days per year missed for each worker. The
four days missed per year is equivalent to 98% attendance rate. Therefore, a very
reasonable goal to establish was 98% attendance rate.
This study also addressed other outcomes that were directly related to the
plant's daily operating efficiency. Attempts were made to get workers to make
suggestions for improving the operations at the plant. It gave workers an opportunity
to submit their ideas to one central group for initial screening and feedback, assured
that the proper feedback on the suggestion and recognition would be given to the
individual who submitted the suggestion.
Reproduced with permission of the copyright owner. Further reproduction prohibited without permission.
In summary, the challenge of trying to improve important outcomes was
addressed by selecting outcomes that were identified by management and the workers
as important. The important productivity and quality factors probably would have
improved if the projects that were started by the supervisors had been completed. In
reviewing results of these key outcomes, there were important changes from the
baseline phases in the studies to the invention phases. Caution must be exercised
when examining these results because of the interactive nature of the plant's
environment.
Analysis of Results Job Ticket and Time Card
The results obtained indicated that the use of OBM technology training
packages to support SPC programs can be effective. The results indicated that even
greater effectiveness can be achieved when organizational change supports an
integrated organization-wide systems approach that aligns individual goals, group
goals, and department goals with the organization's mission and goals. The use of
OBM technology and SPC technology has a synergistic affect in aiding the researcher
to examine the "real" root cause of problems. The combining of the two technologies
has helped the researcher to pinpoint problems better and make recommendations to
the plant management.
The results of the job ticket and time card correction procedures indicated that
when OBM technology is applied to improve and maintain SPC technology significant
improvement can be made. The time card and job ticket problem was previously
Reproduced with permission of the copyright owner. Further reproduction prohibited without permission.

taken on by one of the QC-Circle groups. This group worked on these two problems
for about a year prior to the start of this study. The baseline data reflected their
efforts at improving error rates for both of these problems. The OBM intervention of
feedback and reinforcement made important improvement over the baseline result of
the QC-Circle group who used only SPC techniques.
The main differences between the two approaches were that the OBM
technique used feedback and a correction procedure that used negative reinforcement
to correct the problems and positive reinforcement procedure to get workers to
maintain the reduced error rate. Also, an integrative approach was used to get the
entire organization working on the problems. The SPC techniques used only problem
solving techniques to identify the problems and made recommendations to manage
ment as what should be done to correct the problems.
The OBM techniques once effectively applied currently with SPC techniques
changed the existing SPC techniques from largely an antecedent type correction
system (Redmon and Dickinson, 1989) to more of a antecedent-behavior-consequence
type of correction system which is much more effective at achieving and maintained
desired behaviors that led to key results (Daniels, 1989; Komaki, 1986; Komaki,
Bowman, & Desselles, 1989, and Komaki, Collins & Penn, 1982). The change to
examining key behaviors on the part of the workers and supervisors who were
involved in the processing of job tickets and time card and established clear conse
quences for their behaviors, led to significant changes in the number of errors that
were made both on job tickets and time cards.
Reproduced with permission of the copyright owner. Further reproduction prohibited without permission.

The changes, even those significant, were not totally acceptable. There are
still problems that remain with both the time card and the job ticket procedures.
These problems are what Deming, (1982) refer to as system problems that are not
controllable by the workers or the first-line supervisors but are largely under the
control of management.
An analysis of the reasons for the job ticket errors revealed that the main
problems were with two departments. One of these departments had a high turn over
rate of temporary workers that must be constantly trained. In addition to the training
requirements, the workers had a high illiteracy rate and many of the workers did not
speak or understand the English language very well. Therefore, they had problems
completing the job tickets because they could not read the customer specifications.
Many of the workers in this particular department were Spanish speaking migrant
workers. These factors contributed to the problems found on time cards and job
tickets. To correct these problems requires system changes that the management must
initiate.
An analysis of the job ticket problem associated with the second supervisor's
department revealed that problems on job tickets could be traced to two major reasons,
special number and order number. It was discovered that the operators who were
supposed to put these numbers on the job ticket had no way of knowing what those
numbers were in many instances. The supervisor had to supply the missing number.
It was discovered that the supervisor often didn't know the customer numbers and had
to contact production control, who also had problems identifying the numbers. This
Reproduced with permission of the copyright owner. Further reproduction prohibited without permission.

became more of a problem as the sales volume increased and short notice was given
to the shop floor on the job number production schedule. Also, when the sale volume
increased, as it did in the last two months of this study February and March 1993,
large number of temporary unskilled workers were brought into the plant to meet the
increased demand. Most of the workers were assigned to the finishing department,
the department with the highest job ticket error rate.
Another system problem that affected the results was the transfer of the plant
manager to corporate headquarters. This individual served as the facilitator of group
activities by coordinating meetings and arranging for needed resources. He also was
a vital communication link to the CEO at the plant. As the plant manager, he had
direct authority over all the first-line supervisors and hourly workers. In viewing the
results of the correction procedures just prior to his leaving the plant, December 1992,
and January 1993 just after he left the plant, one will observe that there is a distinct
increase in both the job ticket error rate and the time card error rate even though an
attempt was being made to implement a correction procedure along with the existing
feedback (Refer to Figures 2 & 3).
An investigation into what caused the increased error rates revealed that
feedback was not given in the absence of the previous plant manager. Also, the
correction procedure was not carried out as designed because of the increase in the
production schedule at the plant. The only feasible alternative available to the
researcher, at this point, was to treat this part of the study as a reversal phase and
observe the affect. The job ticket error rate gradually increased beyond the original
Reproduced with permission of the copyright owner. Further reproduction prohibited without permission.
baseline error rate during the reversal phase. This is explainable by the fact that the
feedback had been withdrawn and the correction procedure was not implemented. The
antecedent, the basic procedure for controlling job ticket error rate, was present.
However, consequences for behaving in ways other than specified by the job ticket
error rate procedure was now being reinforced. When the worker attempted to
complete job ticket and correct information was not known, the worker would have
to take the time to look up the information or contact the supervisor. This action
would likely be punished or extinguished because the supervisor would either not
know the information or have to take the time to look it up which added to the
supervisor's work. The supervisor would not likely have the time or take the time to
get back to the worker who initiated the job ticket in the first place. This lack of
follow-up with the worker would be considered a form of punishment to the worker
who took the time to identify a problem but no one followed up to correct it. The
consequences of ignoring the job ticket error is more positive than negative for the
supervisor when the production schedule is very high and there are a large number of
temporary unskilled workers. The supervisor is not going to get a reprimand for job
ticket errors but he will get a reprimand if he misses a production schedule deadline.
The time that supervisor spends checking on job ticket errors, diverts his attention
away from the primary job of making sure that the work is getting out as scheduled.
This is an obviously systemic problem that requires system change.
The time card error showed a slight increase in the reversal phase over the
feedback phase. This relatively stable result in contrast with the dynamic change in
Reproduced with permission of the copyright owner. Further reproduction prohibited without permission.
the job ticket error rate can be explain by the absence of any systemic problem with
the time card procedure. The consequences for following the time card correction
procedure were such that the desired behavior on the part of both the workers and
supervisors were likely to be maintained with a minimal amount of feedback. Also,
the system feedback has been established so that it can operate without the
researcher's formalized graphed data. The clerical staff has informed the individual
supervisor about particular problem time card and worker clock number.
Analysis of Attendance Improvement Plan
The baseline attendance data covered a one-year period of time. The results
of this study show the first three quarters of the intervention phase, therefore, it is
somewhat premature to draw conclusions on the success or failure of this intervention.
There are some factors that must be considered in making the final evaluation about
the effectiveness of the intervention in improving attendance. The first factor is that
the baseline attendance rate of 96.6% is slightly above the American Foundrymen's
Society, Inc. in average attendance rates for its 551 members/companies who reported
attendance data in 19914. This probably indicates that much of the work that was
done prior to this study has had an impact on the attendance rates. The second factor
is that during the baseline period the plant was in a period of economic downturn in
terms of sales and plant production schedule. The plant was on a reduced work
4Survey of wages and Economic Benefits in the Foundry Industry, January 1992. Survey report from the American Foundrymen's Society, Inc., Des Plaines, IL.
Reproduced with permission of the copyright owner. Further reproduction prohibited without permission.
schedule and some individuals were actually laid off. This is in sharp contrast with
the second and third quarters when the plant was in an economic upturn and the
production schedule had increased and the workforce had been expanded. Individuals
were asked to work overtime quite frequently. One would expect the attendance rates
to be much lower in an economic upturn than would be in an economic downturn
particularly in an environment like a foundry where the work is physically tiring and
protective clothing must be worn at all times.
The fourth quarter result will be the most important quarter of all since it is
the last quarter and it will also be the period in which individuals will be qualified for
the end of the year's attendance bonus if they maintain the goal of 98% or better
attendance.
Analysis of Economic Data Conversion for Attendance Rates
The conversion of the attendance rates to economic units of dollars was
accomplished by taking the number of workers for each quarter multiplied times the
number of days the plant was scheduled to work minus the number of days that were
missed and converting this is a percentage attendance figure. For example, using the
second quarter outcome data:
number of employees=64
days scheduled=61
days missed by employees=108
64 x 61=3904-108=3796
Reproduced with permission of the copyright owner. Further reproduction prohibited without permission.

82
3796/3904=.972(100)=97.2%
To show the actual numbers of days attendance improved in the second quarter over
the baseline rate, one would simply multiply the improved percentage rates times the
number of employees minus the days the plant was scheduled to work. For example.
97.2-96.6=.6% (Employee minus days equals number of employees times days
scheduled.) 64 x 61=3904, to convert to days saved (3904 x .006)=23.4 days
To make the final conversion to dollars requires that the cost savings associated with
an increase in attendance of 23 days be calculated. This can be done by taking
approximately 30% (fringe benefit rate) of the average hourly rates times the number
of hours in 23.4 days. Other costs are not as easily calculated but are just as real.
For example, the increased scrap percentages, rework rates, and decrease in
productivity from replaced temporary unskilled workers are all costs that are very real
to the XYZ management.
Analysis of Key Performance Factor Results
The key performance factors chosen as indices of the plant's performance were
manhours to produce a ton of product, the number of regular hours worked versus
overtime time worked, and the scrap percent versus the production level. The baseline
values for the factors included the efforts of previous Management by Objectives
(MBO), QC-Circle training, and SPC attribute chart training. This training was
conducted by the researcher as an external consultant to the XYZ Company prior to
the start of this study. (Refer to Appendix C for details.)
Reproduced with permission of the copyright owner. Further reproduction prohibited without permission.

The absence of a significant effect during the study on the key performance
factors is likely attributable to prebaseline training that was conducted. This training
was very similar to the training that was conducted during the study. Many of the
components of MBO (Drucker,1954) are quite similar to performance management
techniques. For example, in MBO the supervisors were taught to identify key goals
that were realistically achievable and measurable. In performance management the
same supervisors were taught to pinpoint key behaviors or results that they could
control and that they thought were important to their department goals. In MBO
training the supervisors were taught how to give performance appraisal interview
feedback to workers. In the performance management training, the supervisors were
taught the steps in given performance feedback to reinforce the desired behaviors and
results.
Evaluation done prior to the prebaseline training was not available for analysis.
Therefore, assessment of prebaseline training effective was not possible.
Summary SPC and OBM Methods Effectiveness
In summary, the SPC methods, as originally designed in this study, did not
occur as planned. The use of SPC charting was not done by any of the organized
QC-Circle groups. There were opportunities for the use of attribute charts in the job
ticket error correction procedure and the time card error correction procedure. The
reason that charts were not used was there was no perceived benefit that the SPC
charting could offer over what was being done with the OBM correction procedure.
Reproduced with permission of the copyright owner. Further reproduction prohibited without permission.
The additional clerical time to maintain the SPC charts was perceived to be cost
prohibitive. As a result of this training and exposure to SPC charting techniques,
SPC charting is being used by the Metallurgical Lab to control critical processes,
machine capabilities studies, and for verifying incoming raw materials from suppliers.
The use of SPC charting, even though on a very limited basis, has been very
important to the plant in attracting new customers and making bids on potential new
jobs for the plant. In many instances the potential customer will request pre-
production machine process capability studies prior to giving the plant the OK to
supply parts. The SPC skills that have been acquired as a results of this study and
other sources has given the plant an extra competitive advantage.
Conclusion
In conclusion, the results of this study have shown that SPC technologies and
OBM technologies are complementary when applied in an integrated organization-
wide effort. The study has reemphasized the difficulties of getting individuals in
industrial settings to follow through on planned interventions for an extended period
of time. This study suggests that future researchers consider designing research
studies that pose the question: "What are the behavioral factors that affect an
organization's desire to integrate its many piecemeal programs into a total performance
system for a long period of time-beyond one year?" Another important issue that
surfaced while conducting this research that future researchers may address is: "How
to measure important dependent variables that reflect productivity and quality factors
Reproduced with permission of the copyright owner. Further reproduction prohibited without permission.

in an industrial setting?" This study addressed this issue on a small scale. However,
future research should be designed so that an adequate baseline pretreatment phase is
established and controlled treatments are applied across departments. The need for
this type of research, in which important dependent variables are selected, became
obvious as this research progressed. The plant management was much more
responsive to items that they deemed important and less of a risk if the intervention
failed to produce the putative results. Productivity and quality factors are the most
important issues to industrial managers. These are high risk items to management
since a failed or adversely affected intervention could result in decreased productivity
and quality which would led to a negative impact on the bottom line profit for the
organization.
Future researchers must find a way to design research that meets both criteria
of scientific integrity and industrial practicality. Also, future research should look at
all employees of the organization not just the unionized work force.
Reproduced with permission of the copyright owner. Further reproduction prohibited without permission.
Appendix A
Protocol Clearance Letter
86
Reproduced with permission of the copyright owner. Further reproduction prohibited without permission.

W e s t e r n M ic h ig a n U n iv e r s it y
Date: May 21 ,1991
To: Pollis Robertson
From: Mary Anne Bunda, Chair
Re: HSIRB Project Number: 9 1 -0 5 -1 4
This letter will serve as confirmation that your research protocol, "The Maintenance of Statistical Process Control (SPC) with Organizational Behavior Management (OBM) Techniques" has been approved under theexempt category of review by the HSIRB. The conditions and duration of this approval are specified In thePolicies of Western Michigan University. You may now begin to implement the research as described in the approval application.
You must seek reapproval for any changes in this design. You must also seek reapproval if the project extends beyond the termination date.
The Board wishes you success in the pursuit of your research goals,
xc: Dale Brethower, Psychology
Approval Termination: May 2 1 ,1 9 9 2
Reproduced with permission of the copyright owner. Further reproduction prohibited without permission.
Appendix B
Items Used as Positive Reinforcers
88
Reproduced with permission of the copyright owner. Further reproduction prohibited without permission.
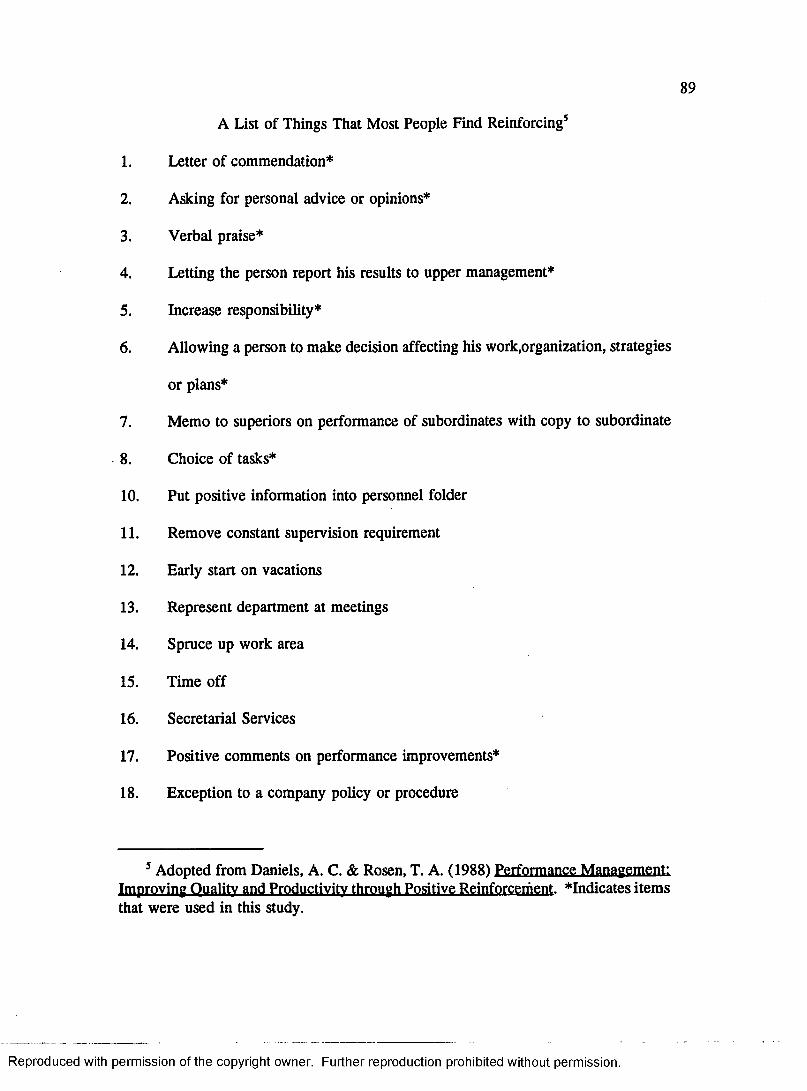
A List of Things That Most People Find Reinforcing5
1. Letter of commendation*
2. Asking for personal advice or opinions*
3. Verbal praise*
4. Letting the person report his results to upper management*
5. Increase responsibility*
6. Allowing a person to make decision affecting his work,organization, strategies
or plans*
7. Memo to superiors on performance of subordinates with copy to subordinate
8. Choice of tasks*
10. Put positive information into personnel folder
11. Remove constant supervision requirement
12. Early start on vacations
13. Represent department at meetings
14. Spruce up work area
15. Time off
16. Secretarial Services
17. Positive comments on performance improvements*
18. Exception to a company policy or procedure
5 Adopted from Daniels, A. C. & Rosen, T. A. (1988) Performance Management; Improving Quality and Productivity through Positive Reinforcement, indicates items that were used in this study.
Reproduced with permission of the copyright owner. Further reproduction prohibited without permission.
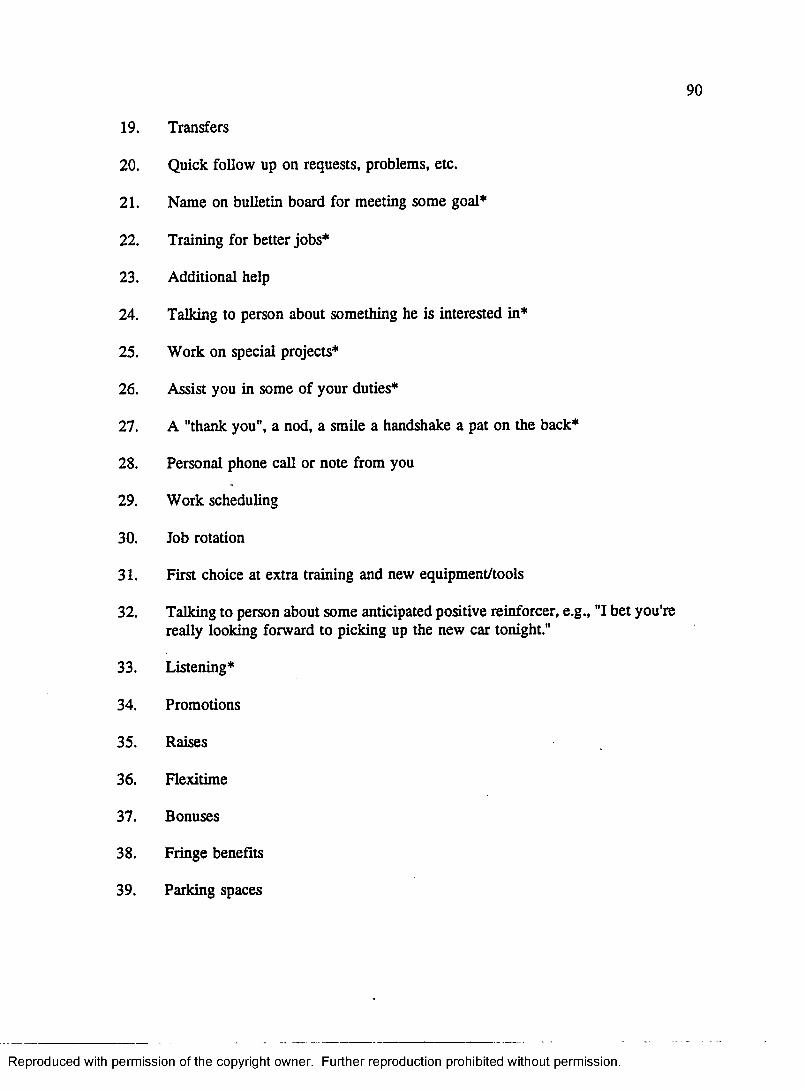
90
19. Transfers
20. Quick follow up on requests, problems, etc.
21. Name on bulletin board for meeting some goal*
22. Training for better jobs*
23. Additional help
24. Talking to person about something he is interested in*
25. Work on special projects*
26. Assist you in some of your duties*
27. A "thank you", a nod, a smile a handshake a pat on the back*
28. Personal phone call or note from you
29. Work scheduling
30. Job rotation
31. First choice at extra training and new equipment/tools
32. Talking to person about some anticipated positive reinforcer, e.g., "I bet you're really looking forward to picking up the new car tonight."
33. Listening*
34. Promotions
35. Raises
36. Flexitime
37. Bonuses
38. Fringe benefits
39. Parking spaces
Reproduced with permission of the copyright owner. Further reproduction prohibited without permission.

91
40. Car fare to work
41. Car pool using company vans
42. Cup of coffee, donuts, free use of vending machines
43. Gift certificate
44. Plaques, trophies, diplomas
45. Clothing, e.g., t-shirts, hats, jackets with special logo or insignias*
46. Free lunch, dinner for two
47. Article with special logo or insignia on it, e.g., coffee mug, pen, tie clip, pin
48. Other tangibles of small to large economic values*
Reproduced with permission of the copyright owner. Further reproduction prohibited without permission.
Appendix C
Listing of Key Events in the Transformation Process of Combining the Two Technologies
92
Reproduced with permission of the copyright owner. Further reproduction prohibited without permission.
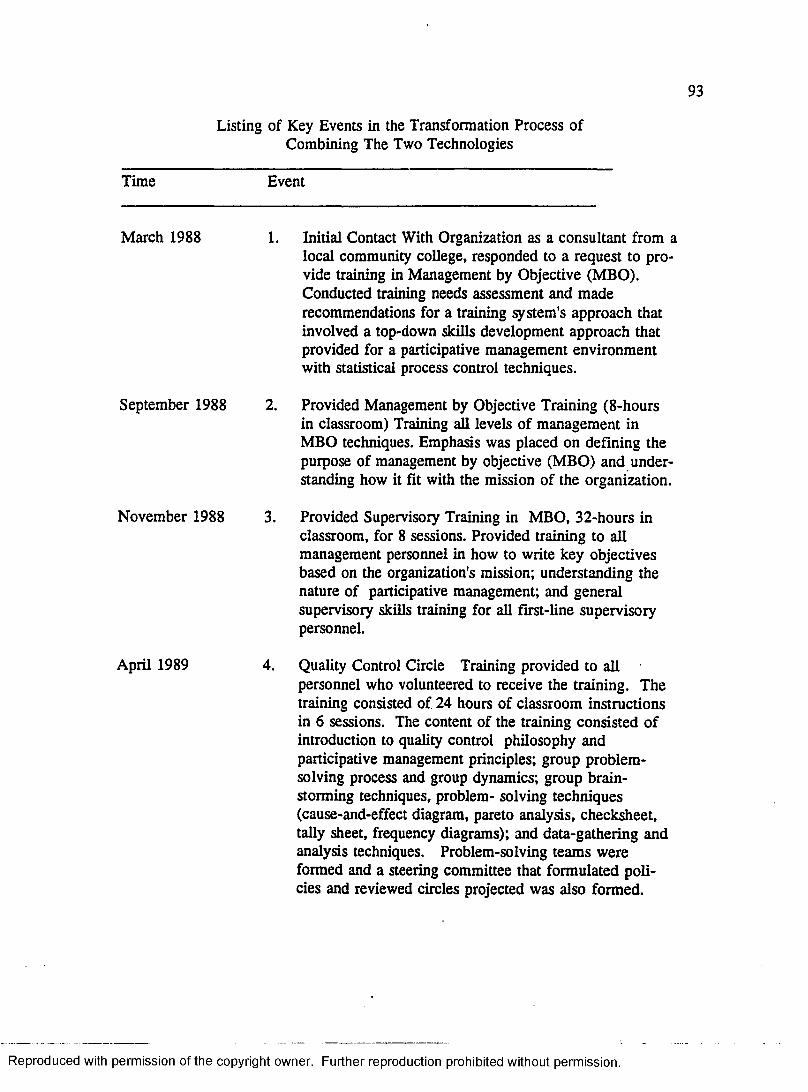
Listing of Key Events in the Transformation Process of Combining The Two Technologies
Time Event
March 1988 1.
September 1988 2.
November 1988
April 1989
Initial Contact With Organization as a consultant from a local community college, responded to a request to provide training in Management by Objective (MBO). Conducted training needs assessment and made recommendations for a training system's approach that involved a top-down skills development approach that provided for a participative management environment with statistical process control techniques.
Provided Management by Objective Training (8-hours in classroom) Training all levels of management in MBO techniques. Emphasis was placed on defining the purpose of management by objective (MBO) and understanding how it fit with the mission of the organization.
Provided Supervisory Training in MBO, 32-hours in classroom, for 8 sessions. Provided training to all management personnel in how to write key objectives based on the organization's mission; understanding the nature of participative management; and general supervisory skills training for all first-line supervisory personnel.
Quality Control Circle Training provided to all personnel who volunteered to receive the training. The training consisted of 24 hours of classroom instructions in 6 sessions. The content of the training consisted of introduction to quality control philosophy and participative management principles; group problemsolving process and group dynamics; group brainstorming techniques, problem- solving techniques (cause-and-effect diagram, pareto analysis, checksheet, tally sheet, frequency diagrams); and data-gathering and analysis techniques. Problem-solving teams were formed and a steering committee that formulated policies and reviewed circles projected was also formed.
Reproduced with permission of the copyright owner. Further reproduction prohibited without permission.
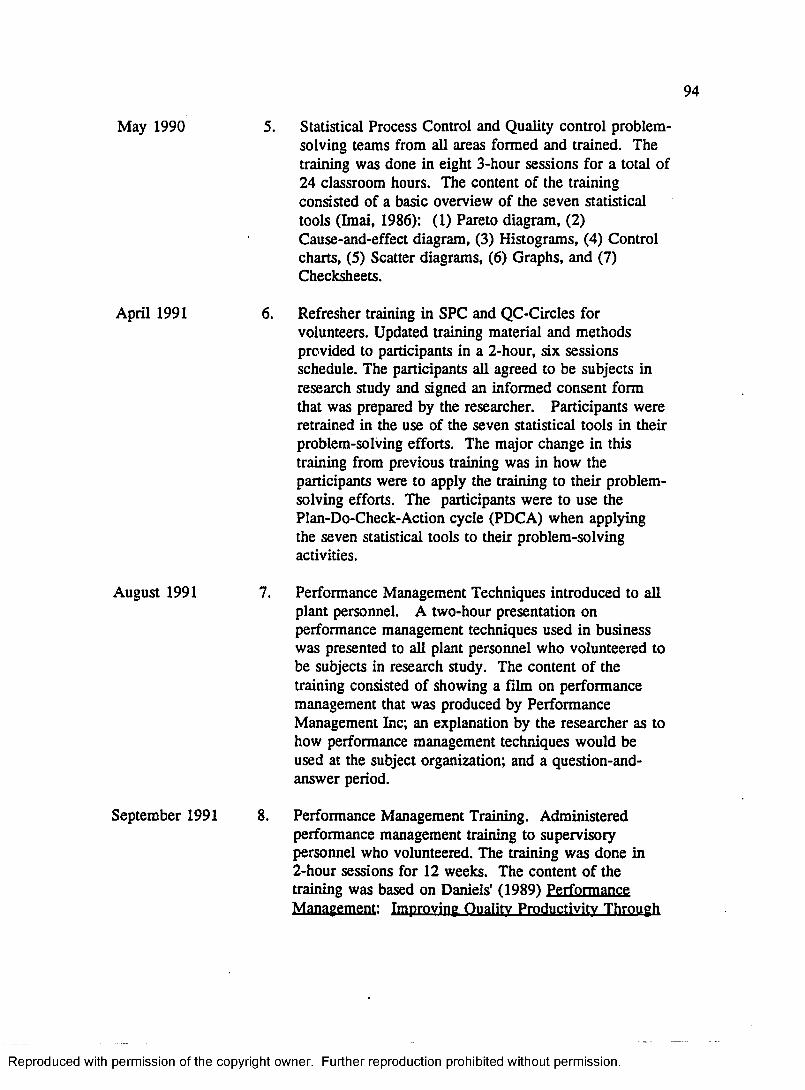
May 1990 Statistical Process Control and Quality control problemsolving teams from all areas formed and trained. The training was done in eight 3-hour sessions for a total of 24 classroom hours. The content of the training consisted of a basic overview of the seven statistical tools (Imai, 1986): (1) Pareto diagram, (2) Cause-and-effect diagram, (3) Histograms, (4) Control charts, (5) Scatter diagrams, (6) Graphs, and (7) Checksheets.
April 1991 6. Refresher training in SPC and QC-Circles for volunteers. Updated training material and methods provided to participants in a 2-hour, six sessions schedule. The participants all agreed to be subjects in research study and signed an informed consent form that was prepared by the researcher. Participants were retrained in the use of the seven statistical tools in their problem-solving efforts. The major change in this training from previous training was in how the participants were to apply the training to their problemsolving efforts. The participants were to use the Plan-Do-Check-Action cycle (PDCA) when applying the seven statistical tools to their problem-solving activities.
August 1991
September 1991 8 .
Performance Management Techniques introduced to all plant personnel. A two-hour presentation on performance management techniques used in business was presented to all plant personnel who volunteered to be subjects in research study. The content of the training consisted of showing a film on performance management that was produced by Performance Management Inc; an explanation by the researcher as to how performance management techniques would be used at the subject organization; and a question-and- answer period.
Performance Management Training. Administered performance management training to supervisory personnel who volunteered. The training was done in2-hour sessions for 12 weeks. The content of the training was based on Daniels' (1989) Performance Management: Improving Quality Productivity Through
Reproduced with permission of the copyright owner. Further reproduction prohibited without permission.
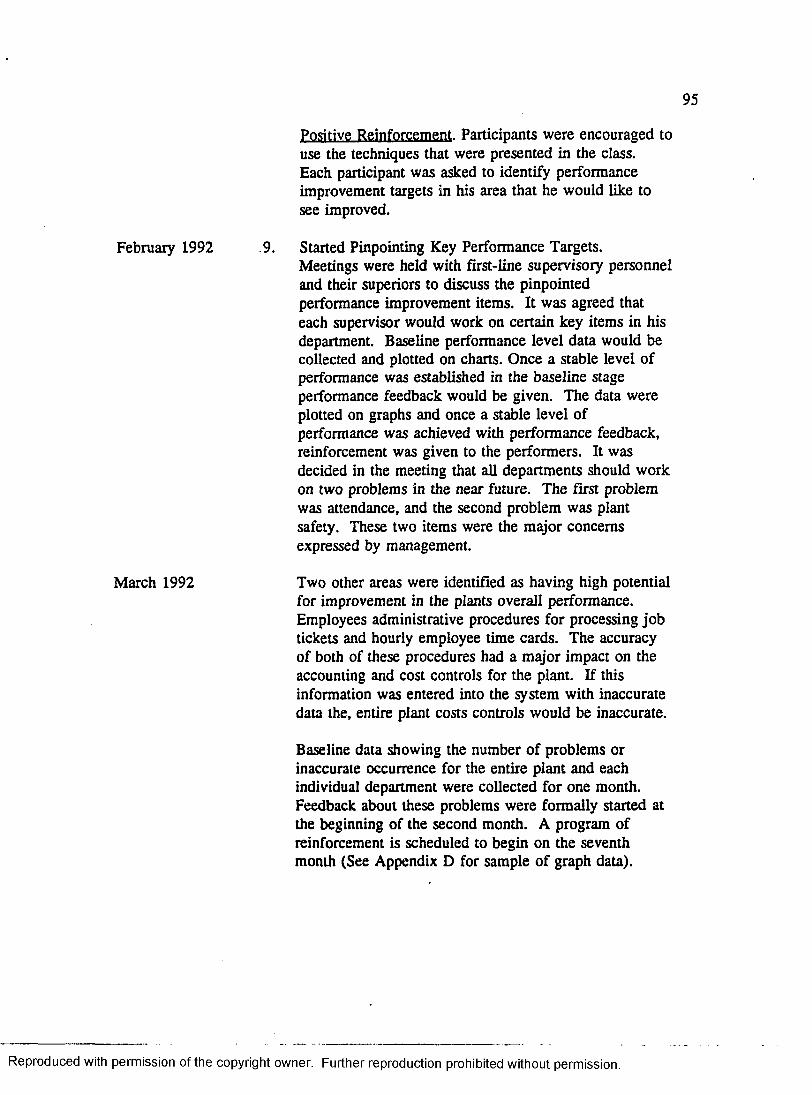
95
February 1992
March 1992
Positive Reinforcement. Participants were encouraged to use the techniques that were presented in the class.Each participant was asked to identify performance improvement targets in his area that he would like to see improved.
9. Started Pinpointing Key Performance Targets.Meetings were held with first-line supervisory personnel and their superiors to discuss the pinpointed performance improvement items. It was agreed that each supervisor would work on certain key items in his department. Baseline performance level data would be collected and plotted on charts. Once a stable level of performance was established in the baseline stage performance feedback would be given. The data were plotted on graphs and once a stable level of performance was achieved with performance feedback, reinforcement was given to the performers. It was decided in the meeting that all departments should work on two problems in the near future. The first problem was attendance, and the second problem was plant safety. These two items were the major concerns expressed by management.
Two other areas were identified as having high potential for improvement in the plants overall performance. Employees administrative procedures for processing job tickets and hourly employee time cards. The accuracy of both of these procedures had a major impact on the accounting and cost controls for the plant. If this information was entered into the system with inaccurate data the, entire plant costs controls would be inaccurate.
Baseline data showing the number of problems or inaccurate occurrence for the entire plant and each individual department were collected for one month. Feedback about these problems were formally started at the beginning of the second month. A program of reinforcement is scheduled to begin on the seventh month (See Appendix D for sample of graph data).
Reproduced with permission of the copyright owner. Further reproduction prohibited without permission.
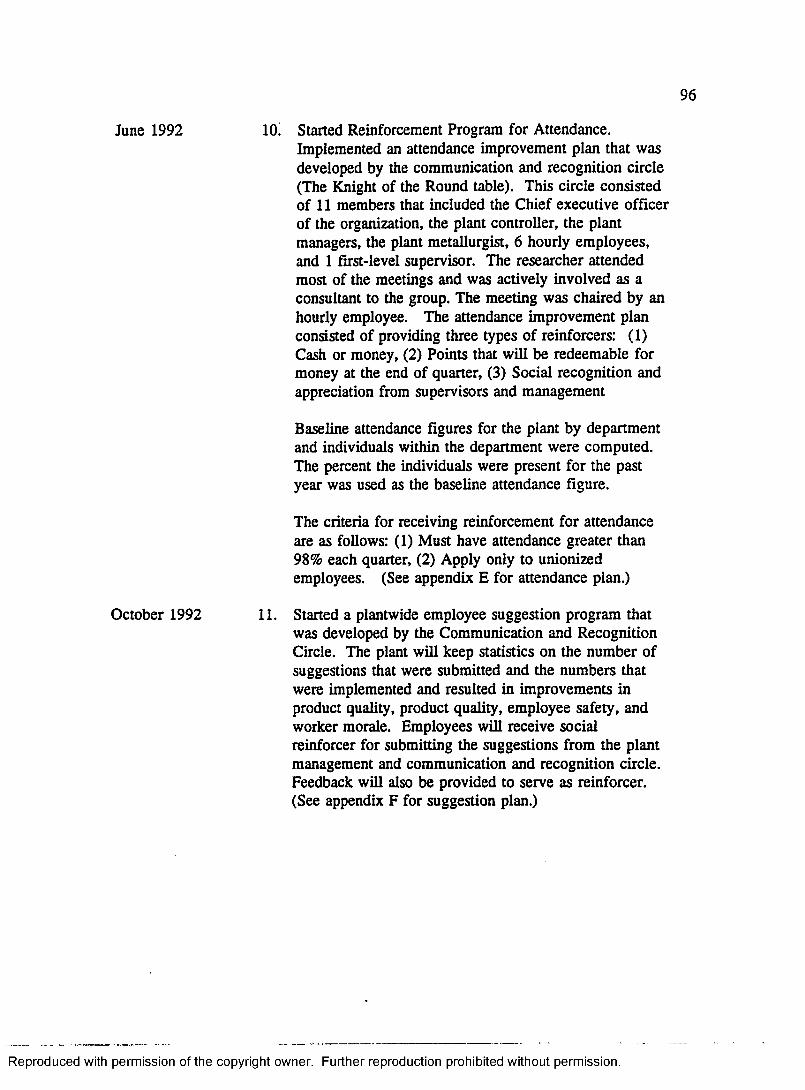
96
June 1992
October 1992
10! Started Reinforcement Program for Attendance.Implemented an attendance improvement plan that was developed by the communication and recognition circle (The Knight of the Round table). This circle consisted of 11 members that included the Chief executive officer of the organization, the plant controller, the plant managers, the plant metallurgist, 6 hourly employees, and 1 first-level supervisor. The researcher attended most of the meetings and was actively involved as a consultant to the group. The meeting was chaired by an hourly employee. The attendance improvement plan consisted of providing three types of reinforcers: (1) Cash or money, (2) Points that will be redeemable for money at the end of quarter, (3) Social recognition and appreciation from supervisors and management
Baseline attendance figures for the plant by department and individuals within the department were computed. The percent the individuals were present for the past year was used as the baseline attendance figure.
The criteria for receiving reinforcement for attendance are as follows: (1) Must have attendance greater than 98% each quarter, (2) Apply only to unionized employees. (See appendix E for attendance plan.)
11. Started a plantwide employee suggestion program that was developed by the Communication and Recognition Circle. The plant will keep statistics on the number of suggestions that were submitted and the numbers that were implemented and resulted in improvements in product quality, product quality, employee safety, and worker morale. Employees will receive social reinforcer for submitting the suggestions from the plant management and communication and recognition circle. Feedback will also be provided to serve as reinforcer. (See appendix F for suggestion plan.)
Reproduced with permission of the copyright owner. Further reproduction prohibited without permission.

Appendix D
Sample of Graphic Displayed Data
97
Reproduced with permission of the copyright owner. Further reproduction prohibited without permission.

Sample of Job Ticket Correction Procedure Charts
16 , 141210a6
; ' 4
20
Frequency
r \/ X ........... "■■ircsv*©* so?
A / v 7 \\ / \Vc_ ..p Ay j
Mar Apr May Jun Jul Aug Sep O ct Nov Dec Jan.Feb Mar
Errors 8 8 13 15 4 1 2 9 -1 2 8 . 4 6Errors/day 0.5 0.5 0.7 0.7 0.2 0.06 0.1 0.5 0.1 6.2 0.4 0.2 0.3
(Starting, March 1992)
Errors Errors/day
Reproduced with permission of the copyright owner. Further reproduction prohibited without permission.
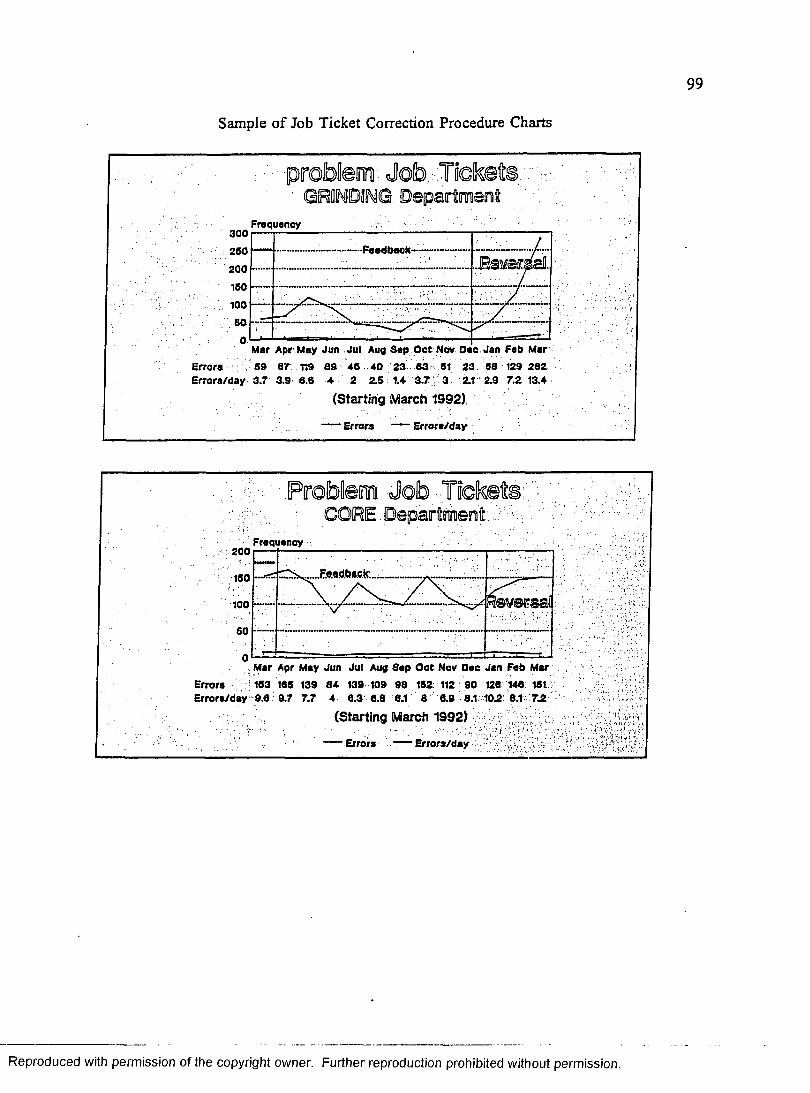
Sample of Job Ticket Correction Procedure Charts
•problem Job.?-.Tidteetfc■ GRINDING: Department
■ Frequency3 0 0
260200
160100
. 600 .'
Mar Apr May Jun Jul Aug Sap Oct Nov Oac Jan Fab MarErrora 59 e r T59 89 48 40 23 63 51 23 58 129 282Errora/day 3.7 3.9 6.6 4 2 2.5 1.4 3 .7 ; 3 2.1 2.9 7.2.13.4
(Starting March 1992);
Errors Errors/day •
• ; .Problem Job TodfeeifeGORE. Department •'
: Fraquancy200
160
100
60
0. Mar Apr May Jun Jul Aug Sap O ct Nov Doe Jan Fab Mar
Errora 163 165 139 8 4 139 109 9 8 152 112 9 0 126 146 151:Errora/day 9 .6 9 .7 7 .7 4 6 .3 6 .8 6.1 8 6 .9 8.1 10.2: 8.1 7 .2
(Starting March 1992)
Errors — Errors/day
Reproduced with permission of the copyright owner. Further reproduction prohibited without permission.
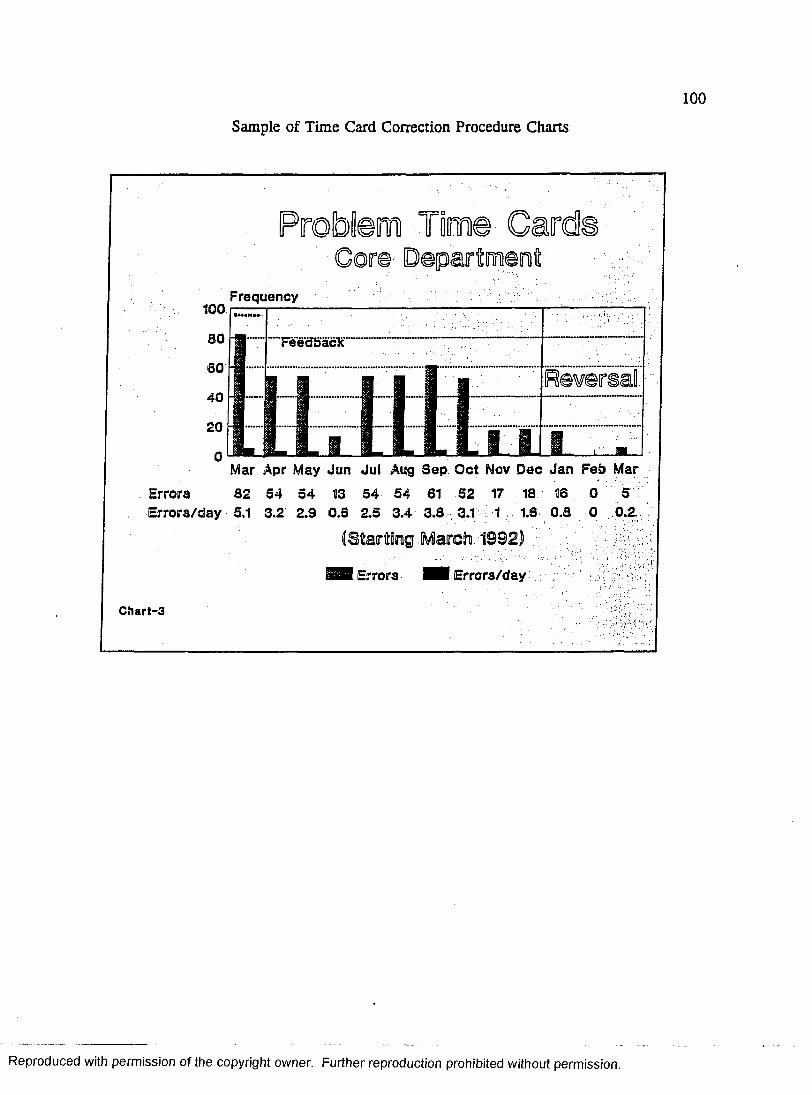
Sample of Time Card Correction Procedure Charts
Core-DepartmentFrequency
tOO ■■ --- :--- ----------
80
60
40
20
0Mar Apr May Jun Jul Aug Sep O ct Nov Dec Jan Feb M ar
Errora 82 54 54 13 5 4 54 61 52 17 18 16 0 5E rro ra /day 5.1 3 .2 2.9 0 .6 2 .5 3.4 3 .8 3.1 1 1.6 0 .8 0 0.2
(Starting :March. 1 9 9 2 ) : v .
Errora J H I E rrora/day
Chart-3
Reproduced with permission of the copyright owner. Further reproduction prohibited without permission.
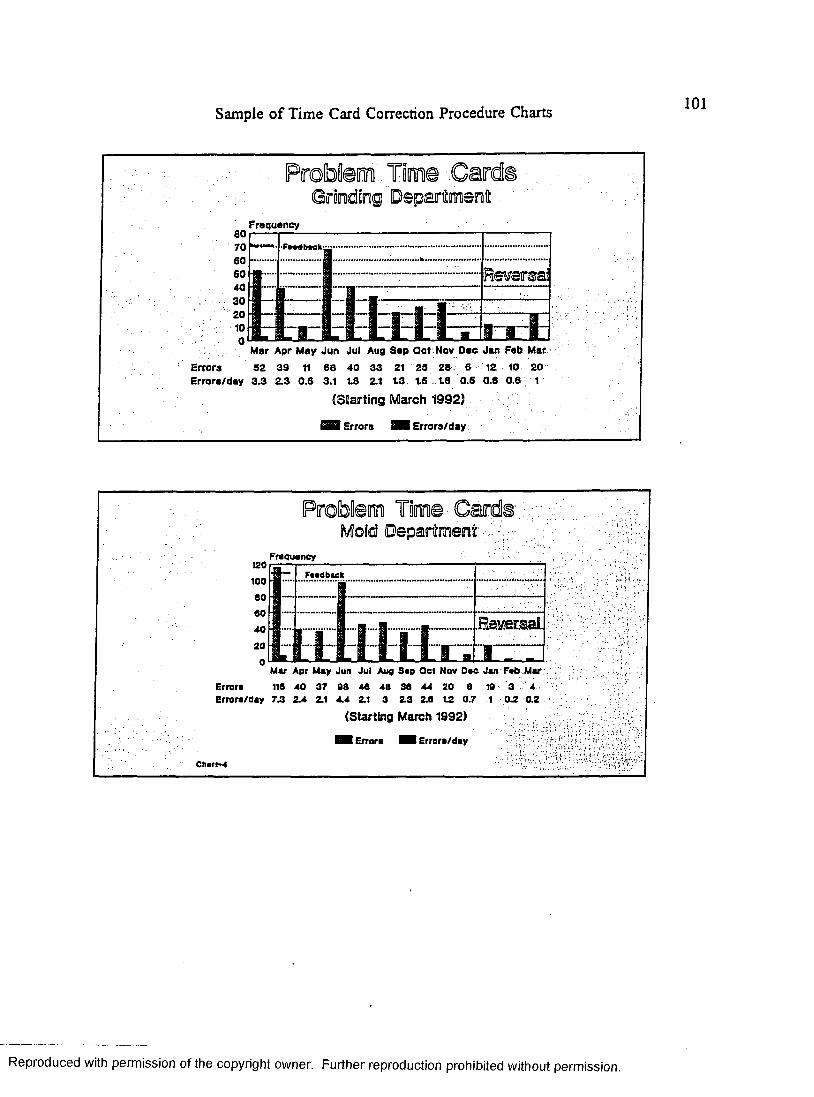
Sample of Time Card Correction Procedure Charts
m Timapartment
Frequency
nmrsat
Mar Apr May Jun Jul Aug Sep Oct Nov Dec Jan Feb MarErrora 32 39 tt 68 40 33 21 25 28 6 12 10 20Errora/day 3.3 2.3 0.8 3.1 18 2.1 13 IS 18 0.5 0.6 0.6 1
(Starting March 1992)
Errors I Errora/day
Problem Tam® CardMold D e p a r tm e n t -
Frequency120
100
80 80 40 20
0Mar Apr May Jun Jul Aug Sep Oct Nov Dee Jan Feb Mar; .
Errora 116 40 37 08 48 48 38 44 20 8 19 3 4 :Errora/day 7.3 2.4 21 4.4 21 3 23 2.8 12 0.7 1 0.2 0.2
(Starting March 1992)
1 H Errora H I Errora/day. . . I • ■ . . ■ "i , •
C h arf4
Reproduced with permission of the copyright owner. Further reproduction prohibited without permission.

Appendix E
Attendance Improvement Plan
102
Reproduced with permission of the copyright owner. Further reproduction prohibited without permission.
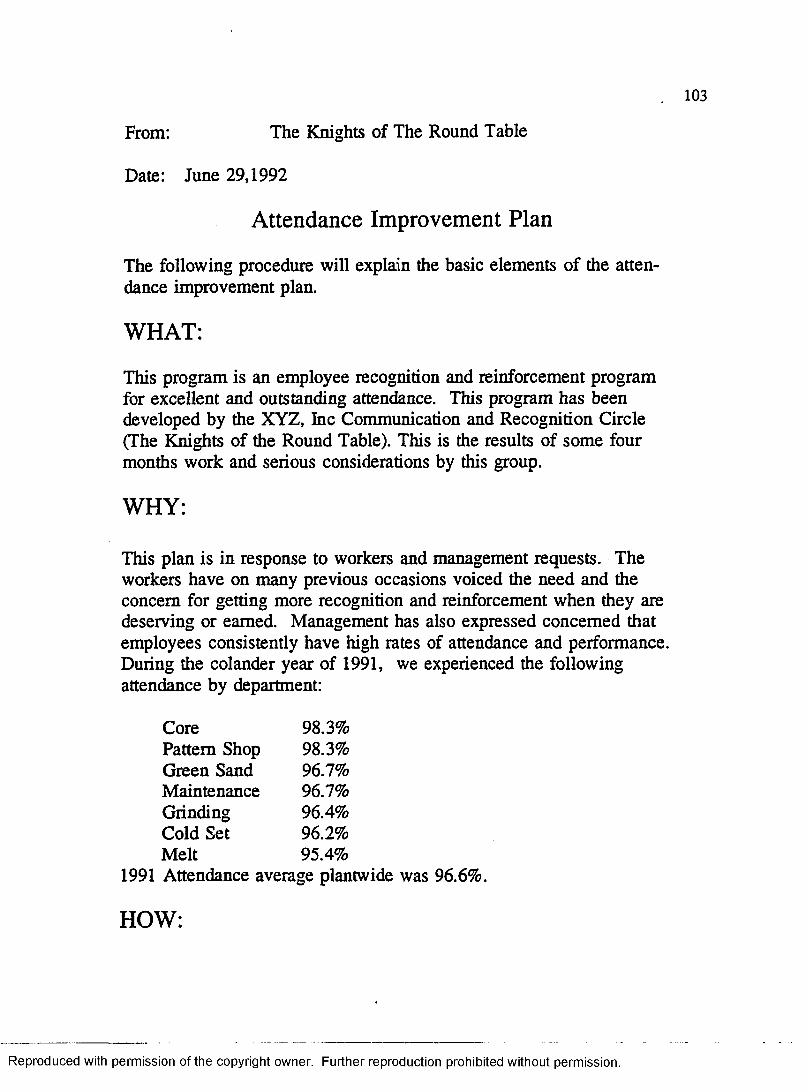
103
From: The Knights of The Round Table
Date: June 29,1992
Attendance Improvement Plan
The following procedure will explain the basic elements of the attendance improvement plan.
WHAT:
This program is an employee recognition and reinforcement program for excellent and outstanding attendance. This program has been developed by the XYZ, Inc Communication and Recognition Circle (The Knights of the Round Table). This is the results of some four months work and serious considerations by this group.
WHY:
This plan is in response to workers and management requests. The workers have on many previous occasions voiced the need and the concern for getting more recognition and reinforcement when they are deserving or earned. Management has also expressed concerned that employees consistently have high rates of attendance and performance. During the colander year of 1991, we experienced the following attendance by department:
Core 98.3%Pattern Shop 98.3%Green Sand 96.7%Maintenance 96.7%Grinding 96.4%Cold Set 96.2%Melt 95.4%
1991 Attendance average plantwide was 96.6%.
HOW:
Reproduced with permission of the copyright owner. Further reproduction prohibited without permission.
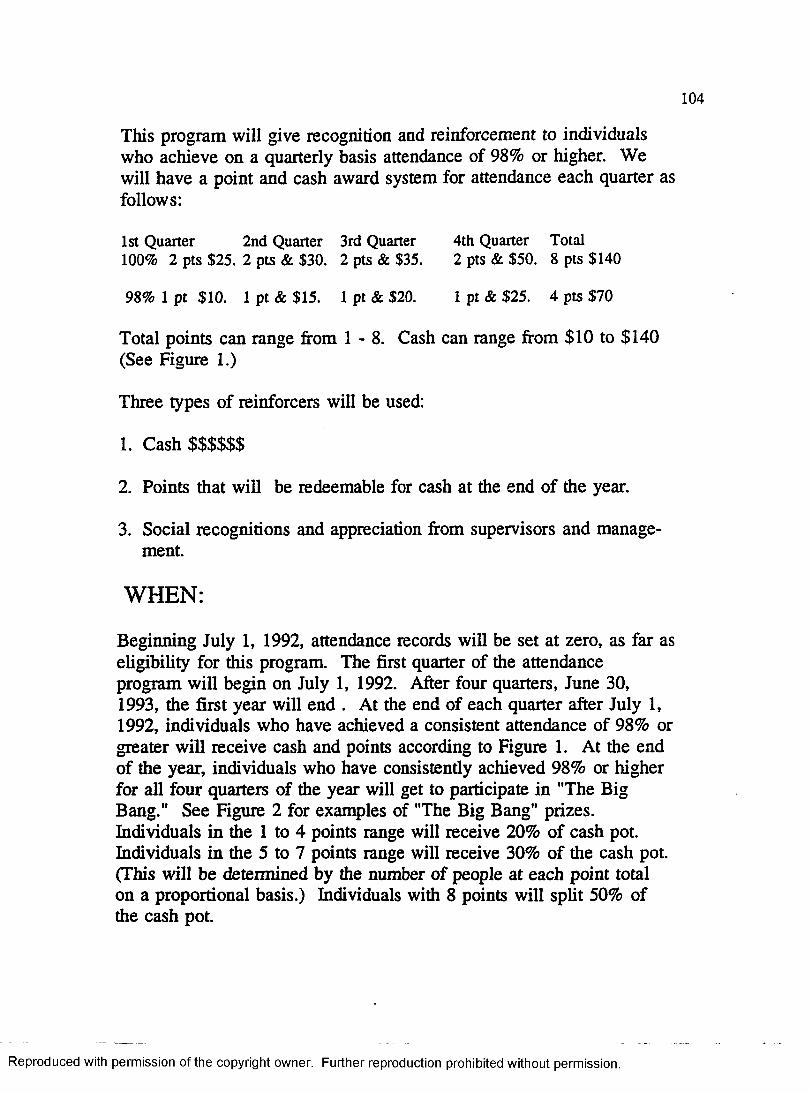
104
This program will give recognition and reinforcement to individuals who achieve on a quarterly basis attendance of 98% or higher. We will have a point and cash award system for attendance each quarter as follows:
1st Quarter 2nd Quarter 3rd Quarter 4th Quarter Total100% 2 pts $25. 2 pts & $30. 2 pts & $35. 2 pts & $50. 8 pts $140
98% 1 pt $10. 1 pt & $15. 1 pt & $20. 1 pt & $25. 4 pts $70
Total points can range from 1 - 8 . Cash can range from $10 to $140 (See Figure 1.)
Three types of reinforcers will be used:
1. Cash $$$$$$
2. Points that will be redeemable for cash at the end of the year.
3. Social recognitions and appreciation from supervisors and management.
WHEN:
Beginning July 1, 1992, attendance records will be set at zero, as far as eligibility for this program. The first quarter of the attendance program will begin on July 1, 1992. After four quarters, June 30,1993, the first year will end . At the end of each quarter after July 1, 1992, individuals who have achieved a consistent attendance of 98% or greater will receive cash and points according to Figure 1. At the end of the year, individuals who have consistently achieved 98% or higher for all four quarters of the year will get to participate in "The Big Bang." See Figure 2 for examples of "The Big Bang" prizes. Individuals in the 1 to 4 points range will receive 20% of cash pot. Individuals in the 5 to 7 points range will receive 30% of the cash pot. (This will be determined by the number of people at each point total on a proportional basis.) Individuals with 8 points will split 50% of the cash pot.
Reproduced with permission of the copyright owner. Further reproduction prohibited without permission.

WHO:
All XYZ, Inc. union employees. Employee must work 50% or more of the quarter to be eligible for points and money. Probationary people are not eligible until in the union. Once in the union, the first day of hire will be considered and all other mles apply as with other union members.
Absences are defined as follows:1. Call in days2. Excused absence3. Unexcused absence
Percentage attendance is calculated by dividing the number of days worked by the number of days scheduled to work.
Goal = 100% or zero days missed per year.98% is one day per quarter or four days per year.
Industrial accidents or workman compensation, layoff, or act of God and approved leaves of absences will not count as attendance credits either positively or negatively.
Vacation days to be counted as days worked or attendance days.
Leaving work early or tardiness will not be counted as attendance days if the individual has not been excused to do so by his supervisor. Or, if the individual receives points under the current labor contract, then the leaving early or tardiness will not count as attendance days.
Reproduced with permission of the copyright owner. Further reproduction prohibited without permission.

106
Explanation of Cash and Points for Attendance
(Qtr-1) (Qtr-2) (Qtr-3) (Qtr-4) (Year End)
NO % S Pts % S Pts % S Pts % S PtsTota1
s •
TotalPts
1 98 10 1 98 15 1 98 20 1 98 25 1 70 4
2 98 10 1 98 15 1 98 20 1 100 25 2 70 5
3 98 10 1 98 15 1 100 25 2 98 25 1 75 5
4 98 10 1 100 25 1 98 20 1 98 25 1 80 5
5 98 10 1 98 15 1 100 25 2 100 30 2 80 6
6 98 10 1 100 25 2 100 30 2 100 35 2 100 7
7 98 10 1 100 25 2 100 30 2 98 25 1 90 6
8 98 10 1 100 25 2 98 20 1 100 25 2 80 6
9 100
25 2 100 30 2 100 35 2 100 50 2 140 8
10 100
25 2 100 30 2 100 35 2 98 25 1 115 7
11 100
25 2 100 30 2 98 20 1 100 25 2 100 7
12 100
25 2 98 15 1 100 25 2 100 30 2 95 7
13 100
25 2 100 30 2 98 20 1 98 25 1 100 6
14 100
25 2 98 15 1 98 20 1 100 25 2 85 6
15 100
25 2 98 15 1 98 20 1 98 25 1 85 6
16 100
25 2 98 15 1 100 25 2 98 25 1 90 5
Reproduced with permission of the copyright owner. Further reproduction prohibited without permission.
Appendix F
Employee Suggestion Plan
107
Reproduced with permission of the copyright owner. Further reproduction prohibited without permission.

FROM: The Knights of The Round Table
108
Date: September 15, 1992
Employee Suggestion Plan
The following will explain the basic procedure for employees to make suggestions at XYZ, Inc.
WHAT:This program was developed by the Communication and Recognition Circle
(The Knights of The Round Table). This program is an additional attempt by The Knight of The Round Table to improve communication and recognition at XYZ, Inc. This is the result of this group's latest efforts to continue to try and improve the work environment, product quality and productivity at XYZ, Inc.
WHY:This suggestion plan is being implemented to get ideas from everyone as to how to improve product quality, the work environment, and productivity. In the past many employees have voiced concerns that their skills and knowledge about their job were not being called upon to solve some of the common problems at XYZ, hie. such as how to improve the work environment, product quality and productivity.
WHO:Any employee who has an idea about how to improve SAFETY, QUALITY, PRODUCTIVITY, MORALE, WORKING CONDITIONS, HOUSEKEEPING or other similar items affecting the work environment, product quality, and productivity is encouraged to submit his/her suggestion.
HOW:Write and sign suggestion on the attached suggestion form and place form in one of the suggestion boxes centrally located throughout the plant. The suggestion will be reviewed by the Communication and Recognition Circle.All suggestions must be signed to receive review and recognition. A written
Reproduced with permission of the copyright owner. Further reproduction prohibited without permission.

109
response will be made within reasonable time to each suggestion that is submitted. The response will indicate if the suggestion is feasible or not in terms of costs, time, and practicality. If the response is favorable of accepting the suggestion the approximate time for implementation will be given . An explanation of reason for delay, if the suggestion cannot be implemented immediately will also be given.Recognition from management and The Knight of The Round Table will be given to individuals who submit suggestions that receive review. Plantwide feedback will be given to show the number of suggestions submitted and the number of suggestions implemented.
WHEN:Beginning October 1, 1992 , the suggestion boxes and the forms will be in placed out in the plant.
Reproduced with permission of the copyright owner. Further reproduction prohibited without permission.

SUGGESTION FORMNAME:______
SIGNATURE:
DATE:______
IDEA/SUGGESTION:
Reproduced with permission of the copyright owner. Further reproduction prohibited without permission.

Appendix G
Job Ticket & Time Card Correction Procedure Checksheet
111
Reproduced with permission of the copyright owner. Further reproduction prohibited without permission.
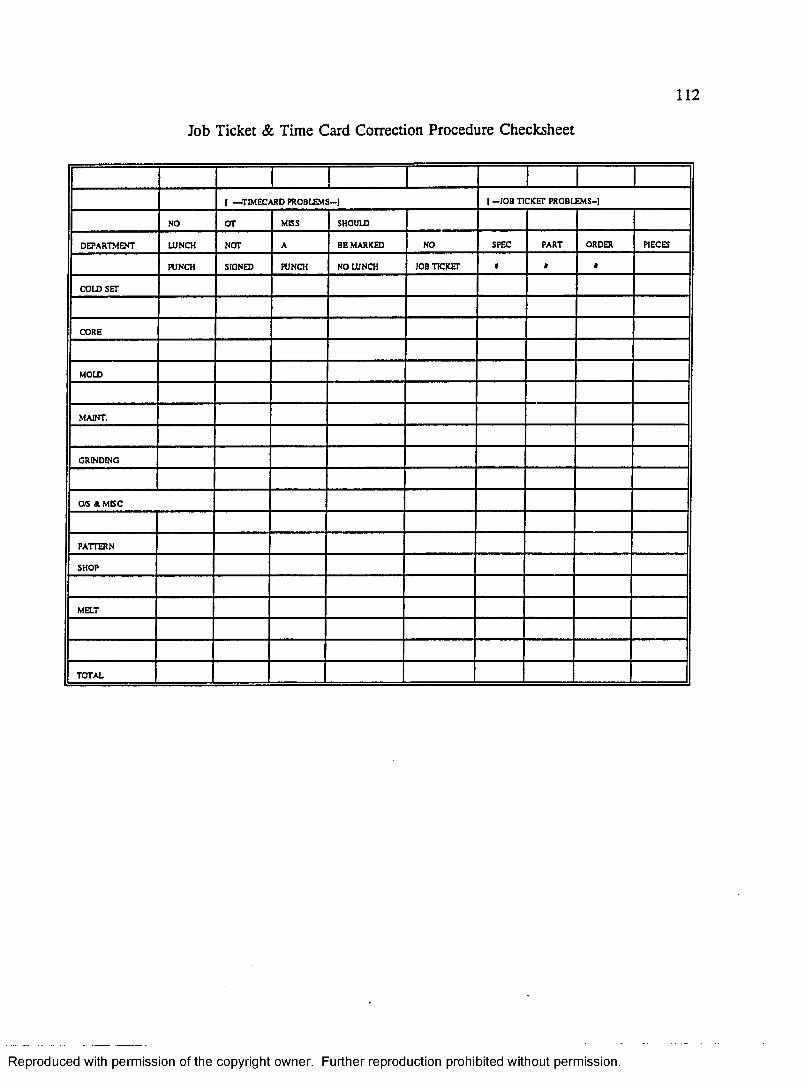
Job Ticket & Time Card Correction Procedure Checksheet
112
[ — TIMECARD PR O BLEM S-] [ - J O B TICKET PROBLEM S-]
NO o r M BS SHOULD
DEPARTMENT LUNCH NOT A BE MARKED NO SPEC PART ORDER PIECES
RTNCH SIGNED PUNCH NO LUNCH JOB TICK Er 9 9 9
COLD SET
CORE
MOLD
MAINT.
GRINDING
OS A M E C
PATTERN
SHOP
MELT
TOTAL
Reproduced with permission of the copyright owner. Further reproduction prohibited without permission.

Appendix H
Quality Control Circle Observation Form
113
Reproduced with permission of the copyright owner. Further reproduction prohibited without permission.
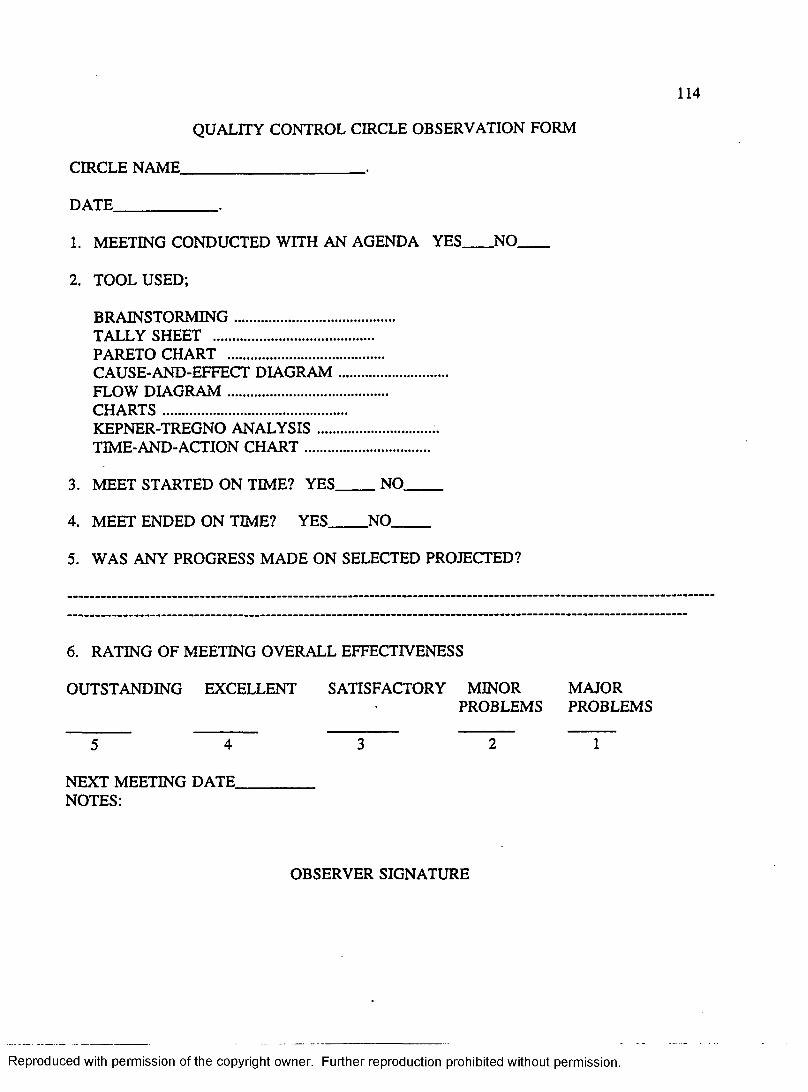
114
QUALITY CONTROL CIRCLE OBSERVATION FORM
CIRCLE NAME________________________ .
DATE_____________ .
1. MEETING CONDUCTED WITH AN AGENDA YES NO____
2. TOOL USED;
BRAINSTORMING..........................................TALLY SHEET ..........................................PARETO CHART .........................................CAUSE-AND-EFFECT DIAGRAM............................FLOW DIAGRAM ..........................................CHARTS................................................KEPNER-TREGNO ANALYSIS............................. .TIME-AND-ACTION CHART.................................
3. MEET STARTED ON TIME? YES NO_____
4. MEET ENDED ON TIME? YES NO_____
5. WAS ANY PROGRESS MADE ON SELECTED PROJECTED?
6. RATING OF MEETING OVERALL EFFECTIVENESS
OUTSTANDING EXCELLENT SATISFACTORY MINOR MAJORPROBLEMS PROBLEMS
5 4 3 2 1
NEXT MEETING DATE__________NOTES:
OBSERVER SIGNATURE
Reproduced with permission of the copyright owner. Further reproduction prohibited without permission.

BIBLIOGRAPHY
Albrecht, K & Zemke R (1990), Service America. New York, NY: Warner books.
American Foundrymen's Society, Inc. (January 1992). Survey of Wages and Economic Benefits in the Foundry Industry. (Research Rep.). Des Plaines, IL.
Amsden, D. M., Amsden, R. T. & Butler, H. E., (1991). Spc simplied for services: practical tools for continuous quality improvement. White Plains, NY: Quality Resources.
Andrasik, F. (1989). Organizational behavior modification in business settings: A methodological and content review. Journal of Organizational Behavior Management. JLQ, 59-76.
Balcazar, F., Hopkins, B. L., & Suarez, Y. (1986). A critical, objective review of performance feedback. Journal of Organizational Behavior Management. 1, 65-89.
Ball, D. A. & McCulloch, Jr, W. H. (1990). International Business introduction and essentials (4th ed.). Boston, MA: BPI Irwin.
Bodek, N. (1988). Poka-voke: Improving product quality bv preventing defects. Cambridge, MA: Productivity Press.
Boehm, V. R., (1980). Research in the "real world", - a conceptual model. Personnel Psychology. 21, 495-504.
Brethower, D. M., (1972). Behavioral analysis in business & industry. Kalamazoo, MI: Behaviordelia.
Brethower, D. M. (1982). The total performance system. In R. M. O'Brien. A. M. Dickinson, & M. P. Rosow (Eds.). Industrial Behavior Modification (pp. 350-369). New York: Pergamon Press.
Brethower, D. M. & Wittkopp, C. J. (1987). Performance engineering: Spc and total performance system. Journal of Organizational Behavior. 2, 83-103.
Czinkota, M. R., Rivoli, P., & Ronkainen, I. A. (1990). International business (2nd ed.). New York: The Dry den Press.
115
Reproduced with permission of the copyright owner. Further reproduction prohibited without permission.
Daniels, A. C. (1989). Performance management: Improvins..quaUty.. productivity. through positive reinforcement. Tucker, GA: Performance Management Publications.
Davidow, W. H. & Uttal, B. (1989). Total customer service the ultimate weapon. New York, NY: Harper Perennial.
Deming, W. E. (1982). Quality, productivity, and competitive position. Cambridge, MA: Massachusetts Institute of Technology.
Dillon, M. J., Kent, H. M., & Malott, R. W. (1980). A supervisory system for accomplishing long-range projects: An application to master's thesis research. Journal of Organizational Behavior Management. £, 33-53.
Dillon, M. J., & Malott, R. W. (1981). Supervising master's theses and doctroal dissertations. Teaching of Psychology. &, 195-202.
Drucker, P. F. (1954) The practice of management. New York: Harper and Brother.
Education Research. (1987). Reinforcement. New York: Education Research.
Eickhoff, S. M. (1991). Organizational development through the implementation of strategic plans. (Doctoral dissertation. Western Michigan University, Kalamazoo, 1992). Dissertation Abstracts International. 11. 6119-B.
Ephross, P. H. & Vasil, T. V. (1988). Groups that work: Structure and process. New York: Columbia University Press.
Federico, F. J. (1989). Six steps to quality improvement. National Productivity Review. S, 113-118.
Fellner, D. J. (1986). Occupational safety assessing the impact of adding assigned or particpative goal-setting. Journal of Organizational Behavior Management. ?(1/21.3-24.
Garvin, D. A. (1988). Managing qualitv-the strategic and competitive edge. New York: The Free Press.
Gilbert, T. F. (1978). Human competence: Engineering worthy performance. New York: McGraw-Hill Publishing Company.
Reproduced with permission of the copyright owner. Further reproduction prohibited without permission.

Henry, G. O, & Redmon, W. K. (1990). The effects of performance feedback on the implementation of a statistical process control (spc) program. Journal of Organizational Behavior Management. I I , 23-46.
Herzberg, F. (1966). Work and the nature of Man. Cleveland: World publishing.
Imai, M. (1986). Kaizen: the kev to japan's competitive success. New York, NY: Random Hourse.
Ingle, S. (1982). Quality circles master guide-increasing productivity with people power. Englewood Cliffs, NJ: Prentice-Hall.
Ishikawa, K. (1980). Guide to quality control. Asian Productivity, Tokyo: Unipup.
Kazdin, A. E. (1982). Single-Case research designs: methods for clinical and applied setting. New York: Oxford University Press.
Komaki, J. L. (1986). Toward effective supervision: An operant analysis andcomparison of managers at work. Journal of Applied Psychology. 21(2), 270-279.
Komaki, J. L., Bowman, E. D. & Desselles, M. L. (1989). Definitely not a breeze: Extending an operant model of effective supervision to teams. Journal of Applied Psyg.hQlQ.gy, 24(3), 522-529.
Komaki, J. L., Collins, R. L. & Penn, P. (1982). The role of performace antecedents and consequences in work motivation. Journal of Applied Psychology. 67(3). 334- 340.
Krigsman, N., & O'Brien, R. M. (1987). Quality circles, feedback and reinforcement: An experimental comparison and behavior analysis. Journal of Organizational Behavior Management, 2, 23-32.
Lefevre, H. L. (1989). Quality services pavs six kevs to success! Milwaukee, WI: Quality Press.
Luchsinger, V. P. & Dock, V. T. (1976). The system approach: a primer. Dubuque, IA. Kendall/Hunt Publishing Company.
Luthans, F. & Thompson, K. R, (1987). Theory d and o.b. mod.: Synergistic or opposite approaches to performance improvement? Journal of Organizational Behavior Management. 2 ,105-123.
Reproduced with permission of the copyright owner. Further reproduction prohibited without permission.

Malott, R. W. & Fulton, B. J. (1982). The structured meeting system: a procedure for improving the completion of nonrecurring tasks. Journal of Organizational Behavior Management. 3(4). 7-18.
Malott, R. W. & Garcia, M. E. (1987). A goal-directed model for the design of human performance system. Journal of Organizational Behavior Management. 2, 125-159.
Mainstone, L. E. & Levi A. S. (1987). Fundamentals of statistical process control. Journal of Organizational Behavior Management. 2, 5-20.
Manning, G. & Cutis, K. (1988). Groupstrength: Quality circles at work. Cincinnati, OH: South-Western Publishing Co.
Martin, A. W. (1988). Work Restructuring in the 1980s: The view from pews. ILR Report, 26. 6-11.
Mawhinney, T. C. (1986). Obm, spc, and theory d: A brief introduction. Journal of Organizational Behavior Management. & 89-104.
McCormick, E. J. & Ilgen, D. (1985). Industrial and organizational psychology (8th ed.). Englewood Cliffs, NJ: Prentice-Hall.
Mizuno, S. (1989). Companv-wide total quality control. Minatoku, Tokyo 107, Japan: Asian Productivity Organization.
Peters, T. (1987). Thriving on choas. New York: Knopf.
Pfadt, A., Cohen, I. L., Sudhalter, V., Romanczyk, R.G., & Wheeler, D. J. (1992). Applying statistical process control to clinical data: An illustration. Journal of Applied Behavior Analysis. 25, 552-560.
Phillips, J. J. (1991). Handbook of training evaluation and measurement methods. Houston, TX: Gulf Publishing company.
Quick, L. T. (1992). Successful team building. New York: AMACOM.
Rehg, V. (1986). Spc for white collar organizations Quality Circle Journal. 2, 36-41.
Redmon, W. K. (1992). Opportunities for applied behavior analysis in the total quality movement. Journal of Applied Behavior Analysis. 25. 545-550.
Reproduced with permission of the copyright owner. Further reproduction prohibited without permission.

119
Redmon, W. K. & Dickinson, A. M. (1987). A comparative analysis of statistical process control, theory d, and behavior analytic approaches to quality control.Journal of Organizational Behavior Management. 2, 47-65.
Rosander, A. C. (1989). The quest for quality in services. Milwaukee, WI: Quality Press.
Rummler, B.A. & Brache, A. P. (1990). Improving performance: How to manage the white space on the organizational chart. San Francisco, CA: Jossey-Bass.
Shingo, S. (1989). A study of the tovota production sytstem from an industrial engineering viewpoint. Cambridge, MA: Productivity Press.
Shores, A.R. (1990). A TOM approach to achieving manufacting excellence. WI:Quality Press.
Spanbauer, S. J. (1992). A quality system for education. Milwaukee, WI: ASQC Quality Press.
Thomas, P. C. (1982). Quality circles: How to make them work in america. New York: AMACOM.
Thrice, J. B. & Hoer, J. (1989, August 14). Shaking up Detroit: How Japanese auto plants in the U.S. are changing the big three. Business Week, pp. 74-79.
Walton, M. (1990). Deming management at work. New York: G. P. Putnam's Sons.
Wilk, L. A. & Redmon, W. K. (1990). A daily-adjusted goal-Setting and feedback procedure for improving productivity in a university admissions department.Journal of Organizational Behavior Management. l i , 55- 75.
Wittkopp, C. J. Rowan, J. F., & Poling, A. (1990). Use of feedback package to reduce machine set-up time in a manufacturing setting. Journal of Organizational Behavior Management. 11, 7 - 22.
Reproduced with permission of the copyright owner. Further reproduction prohibited without permission.
Related Documents