The Madden-Julian Oscillation and extreme precipitation in the contiguous United States Charles Jones Leila Carvalho 1 , Jon Gottschalk 2 , Wayne Higgins 2 1 University of California, Santa Barbara 2 Climate Prediction Center (CPC/NCEP)

The Madden-Julian Oscillation and extreme precipitation in the contiguous United States Charles Jones Leila Carvalho 1, Jon Gottschalk 2, Wayne Higgins.
Dec 19, 2015
Welcome message from author
This document is posted to help you gain knowledge. Please leave a comment to let me know what you think about it! Share it to your friends and learn new things together.
Transcript

The Madden-Julian Oscillation and extreme
precipitation in the contiguous United States
Charles Jones
Leila Carvalho1,
Jon Gottschalk2, Wayne Higgins2
1University of California, Santa Barbara
2Climate Prediction Center (CPC/NCEP)
2
Outline
Motivation:
Extreme precipitation (CONUS, winter)
Madden-Julian Oscillation (MJO)
Forecast skill of extreme Precipitation
Relative value of deterministic forecasts
Spatiotemporal variations in extreme
Precipitation in the CONUS and the MJO
3
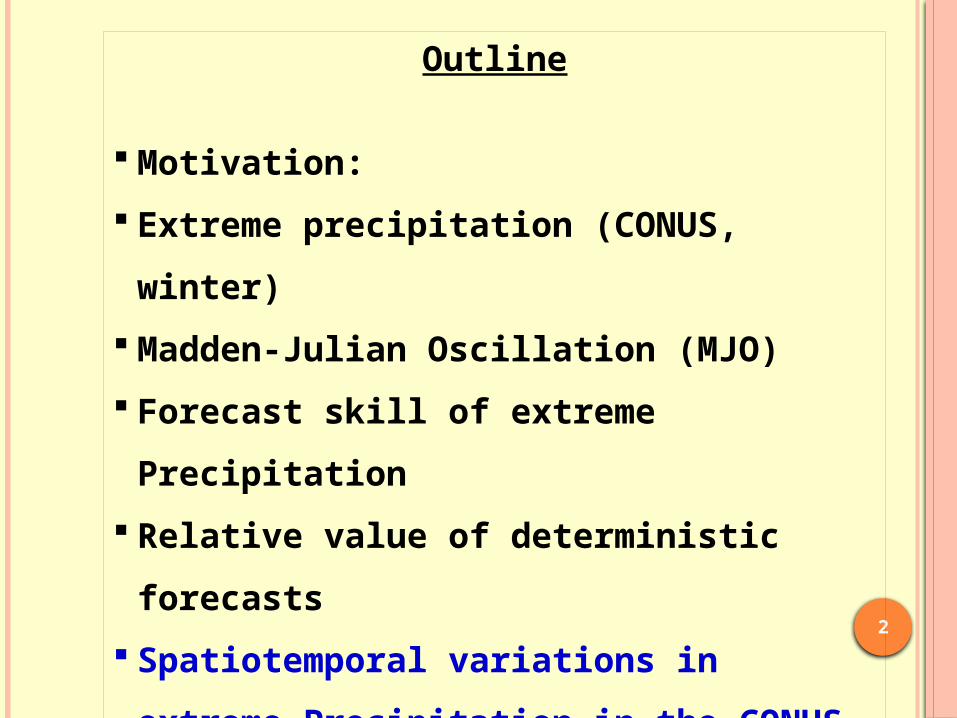
Extreme precipitation
USA

Extreme precipitation
Winter storm
Heavy snow
Snowpack
Spring/summer water

o Most important mode of tropical intraseasonal variations
o Time scales of 30 to 60 dayso Anomalies propagate
eastward along the tropical belt; phase speeds ~ 5 m s-1
o strong interaction with clouds, rain, surface winds and large-scale circulation
The Madden-Julian Oscillation
5

6
Anomalous upper level circulation (200-hPa)
Enhanced Convection in the western Pacific
Coupled Forced Rossby-Kelvin wave response
Rossby waves
-+ -
+
Midlatitude wave train
Kelvin wave -
+
Madden-Julian Oscillation (MJO) Life Cycle

7
7
Barlow et al. (2005) Jones et al. (2004)
Mo and Higgins (1998) Higgins et al (2000) Jones (2000) Bond and Vecchi (2003) Jones et al. (2004)
Carvalho et al. (2004) Liebmann et al. (2004) Jones et al. (2004)
Wheeler and Hendon (2004) Jones et al. (2004)
Jones et al. (2004)
Jones, C., D. E. Waliser, K. M. Lau, and W. Stern, 2004: Global occurrences of extreme precipitation events and the Madden-Julian Oscillation: observations and predictability. J. Climate, 17, 4575-4589.
NH winter
The MJO and Extreme Precipitation: Observations

8
Madden-Julian Oscillation (MJO): influence on forecast skill and subseasonal predictability
MJO
o Waliser, D. E., K. M. Lau, W. Stern, and C. Jones, 2003: Potential predictability of the Madden-Julian Oscillation. Bull. American Meteo. Soc., 33-50.
o Jones, C., D. E. Waliser, K. M. Lau, and W. Stern, 2004: Global occurrences of extreme precipitation events and the Madden-Julian Oscillation: observations and predictability. J. Climate, 17, 4575-4589.
o Jones, C., D. E. Waliser, K. M. Lau, and W. Stern, 2004: The Madden-Julian Oscillation and its Impact on Northern Hemisphere Weather Predictability. Mon. Wea. Rev., 132, 1462-1471.

9
Data and Methodology
Definition of extreme precipitation Observations: daily gridded precipitation over the
contiguous United States, 1 Nov-31 Mar, 1981-2008. Model:
NCEP CFS model: CMIP run (30 yrs) NCEP CFS reforecasts (version 1)
Two levels of extreme precipitation: daily total exceeds the 75th and 90th percentiles of monthly pdf.
Madden-Julian Oscillation (MJO): influence on forecast skill of extreme precipitation
Jones, C., J. Gottschalck, L. M. V. Carvalho, and W. Higgins, 2010: Influence of the Madden-Julian Oscillation on forecasts of extreme precipitation in the contiguous United States. Monthly Weather Review (In press).

10
NCEP CFS Model Reforecasts (v1)
CFS Reforecasts
IC
9-mo forecasts
IC
o 15 initial conditions per montho Forecasts out to 270 days (CFS seasonal forecast
calibration)o Analyzed: forecasts out to 4 weeks
For each forecast:o Remove mean model bias in precipitation fieldo Forecasts of extremes when precipitation exceeds
adjusted 75th or 90th percentiles o Adjustment: ratios between observations and CFS CMIP
run percentilesAnalyzed deterministic and probabilistic forecast skill

11
NCEP/NCAR reanalysis: U200, U850 intraseasonal anomalies
combined EOF
Phase diagram from PC1/PC2
MJO event has amplitude > 0.9
Phase rotates anti-clockwise
70 MJO events during 1 Nov-31 Mar, 1981-2008
(phases ~Wheeler and Hendon 2004)
Enhanced convection
Identification of MJO
12
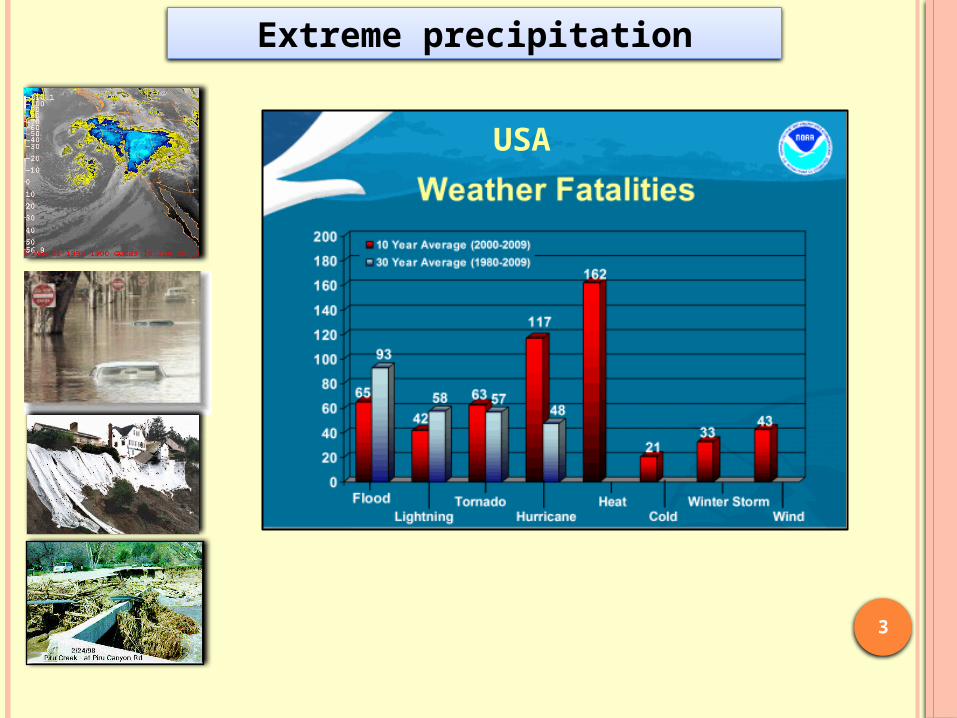
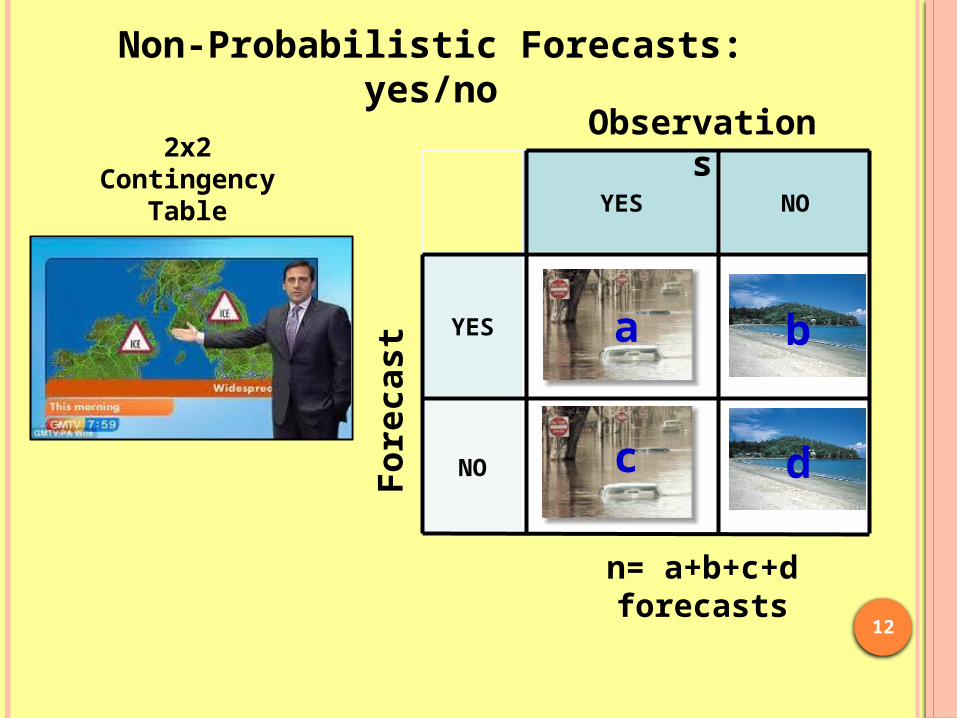
Non-Probabilistic Forecasts: yes/no
YES NO
YES a b
NO c d
Observations
Fo
rec
as
t
2x2 Contingency Table
n= a+b+c+d forecasts
a
c
b
d

13
oTwo samples: active MJO versus inactive (null)oVerification on MJO phases (≠ than MJO state in ICs)oStatistical significance: comparison of scores in active
MJO with scores from resampled inactive cases
Deterministic forecasts

14
lead times (days)
Forecast skill during active MJO90th percentile precipitation extreme
Mean Heidke skill scores (HSS) over gridpoints that are significant at 5% level relative to inactive MJO conditionsMin
Max
lead times (days)
Min
Max

Relative value of deterministic forecasts
YES NO
YES a b
NO c d
Event occurs
Ac
tio
n t
ak
en
Decision makerL= loss if event occurs
and no action takenC= cost if action taken
L 0
C C
Jones, C., L. M. V. Carvalho, J. Gottschalck and W. Higgins, 2010: The Madden-Julian Oscillation and the relative value of deterministic forecasts of extreme precipitation in the contiguous United States. J. Climate (in press)

16
Cost/loss ratio decision model
Where V is value and: o = user’s cost/loss ratio (C/L)o s = climatological base rate of the event (90th extreme)o H = hit rateo F = false alarm rate
When = s potential forecast value
Caveats: simple model, user’s actions expressed numerically, assume users are risk neutral-only concerned with long-term average expense
Evaluated here with deterministic forecasts

17
MJO
Summary: maximum value over USA: MJO x null

18
Spatiotemporal variations in extreme precipitation in the contiguous United States and
the Madden-Julian OscillationCharles Jones and Leila M. V. Carvalho
Objective: develop a probabilistic approach to spatiotemporal variations in extreme precipitation in the CONUS during and relationships with the MJO
Data and Methodology Data: NCEP CPC Unified gridded precipitation,
0.5 lat/lon, 1 Nov – 31 Mar 1979-2010 Definition of extreme precipitation: daily average
exceeds 90th percentile of monthly pdf.

19
Example of extreme precipitation

20

21
Contiguous Region of Extreme Precipitation (CREP)
CREP: regions of spatially connected gridpoints in which daily precipitation exceed the 90th percentile
Properties: mean precipitation, area, orientation, elongation, frequency of occurrence during active MJO and inactive days
Probabilities of CREPs occurrence given status of MJO, anomalies in geopotential height at 500-hPa

22
Counts of CREPS during active MJO (top) and quiescent days (bottom). Counts were assigned to centers of each CREP during 1 November-31 March, 1979-2010. Total number of CREPs: 5600. Percentages of CREPS during active and inactive MJO days are indicated in parenthesis in each panel. Maximum number of counts are indicated on the left corner of each panel.
23
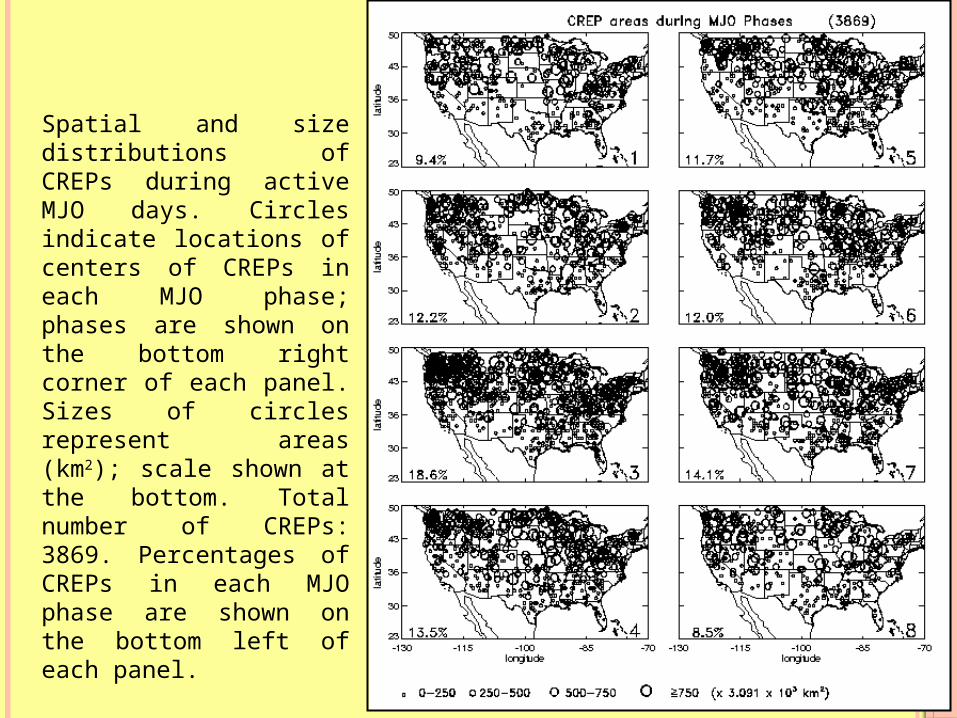
Spatial and size distributions of CREPs during active MJO days. Circles indicate locations of centers of CREPs in each MJO phase; phases are shown on the bottom right corner of each panel. Sizes of circles represent areas (km2); scale shown at the bottom. Total number of CREPs: 3869. Percentages of CREPs in each MJO phase are shown on the bottom left of each panel.

24
January 1995 case study
Dates
MJO phases
Centers of negative H500 anomalies
CREPs
Distances from center of H500 in which there is a probability Pb of occurring one or more CREPs

cost/loss ratio (C/L)
Value of forecasts of extreme precipitation
cost/loss ratio (C/L)cost/loss ratio (C/L)
Curves show value of forecasts averaged on 1-3, 5-7, 9-11 and 12-14 days lead times.
Val
ue
Val
ue
Val
ue
MJO Phase 8
MJO Phase 1
Null

2626
26
Schematic representation of eastward propagation of tropical convective anomalies associated with the Madden-Julian Oscillation, changes in the Jet Stream and precipitation events in the Pacific Northwest.
Tropical-Extratropical Interaction associated with Madden-Julian
Oscillation
Related Documents