1 The macroeconomic implications of COVID-19 pandemic and associated policies: An economy-wide analysis of Uganda Preliminary Draft: NOT FOR PUBLICATION Judith Kabajulizi Ole Boysen School of Economics, Finance and Accounting, and Centre for Financial and Corporate Integrity (CFCI), Coventry University, UK EU Joint Research Centre and School of Agriculture & Food Science and Geary Institute for Public Policy University College Dublin, Ireland [email protected] [email protected] A draft paper submitted to the 24th Annual Conference on Global Economic Analysis June 23 – 25, 2021

Welcome message from author
This document is posted to help you gain knowledge. Please leave a comment to let me know what you think about it! Share it to your friends and learn new things together.
Transcript
1
The macroeconomic implications of COVID-19 pandemic and associated policies: An
economy-wide analysis of Uganda
Preliminary Draft: NOT FOR PUBLICATION
Judith Kabajulizi Ole Boysen
School of Economics, Finance and Accounting,
and Centre for Financial and Corporate Integrity
(CFCI), Coventry University, UK
EU Joint Research Centre and School of
Agriculture & Food Science and Geary Institute
for Public Policy
University College Dublin, Ireland
A draft paper submitted to the 24th Annual Conference on Global Economic Analysis
June 23 – 25, 2021
2
Abstract
This study evaluates the economy-wide impact of Covid-19 pandemic and associated
mitigation polices in Uganda, a developing country where over 20% of its 40 million live on
less than $2 a day. Uganda instituted Covid-19 pandemic mitigating strategies ranging from
home/institutional quarantine to social distancing of entire the population where all households
reduced contact outside their household. The mitigating strategies result in economic
consequences with some sectors being affected more than others. We employ a recursive
dynamic computable general equilibrium model to evaluate the aggregate impact of Covid-19
on the Ugandan economy. Specifically, we design scenarios to mimic the impact of mortality,
morbidity and mitigating public health policies on the economy, focussing on impact channels
via labour supply, labour productivity, government health spending and remittance inflows.
Results indicate that growth in sector output declines for many of the sectors under all scenarios
except for the increase in non-tertiary rural labour scenario. The increased government health
spending induces expansion in the healthcare output but the sectors that produce the
intermediate inputs for healthcare production do not grow in tandem. This suggests the
healthcare inputs are largely imported. There is an increase export growth rates when we
assume an increase in supply of non-tertiary rural labour, suggesting that agricultural products
exported to neighbouring countries through informal channels persist even during the Covid-
19 restrictions. The sector performance results call for policymakers to revisit Uganda’s
industrial policy and reorient it towards domestic production of commodities that are
intermediate inputs to critical domestic sectors such as healthcare. Additionally, there is a need
to accelerate rural infrastructure development particularly the road network, to facilitate an
integrated rural economy induced by the shift in labour and enterprise towards rural areas. The
results on welfare effects show that a reduction in remittance inflows is predicted to generate
the most decline in welfare. The government should consider transfers to households to
mitigate the adverse effects of Covid-19 particularly for remittance recipient households.
Key words: Infectious diseases; Covid-19; Healthcare; Economic growth; Computable
General Equilibrium modelling; Uganda
(GTAP keywords: Dynamic modelling, Economic growth, Health, Africa (East))
JEL classification: D580, I130, 011
3
1. Introduction
This study aims to evaluate the economy-wide impact of Covid-19 pandemic and associated
mitigation policies. Corona virus (Covid-19), was first confirmed in Wuhan city of Hubei
province China on 3 December 2019 (Wu and McGoogan, 2020). It quickly spread to other
parts of the world and was declared a Public Health Emergency of International Concern
(PHEIC) on 11 January 2020. The lack of a known cure currently implies preventive measures
must be in place to limit infection from the disease. Data from China showed that human-to-
human transmission is the main mode of Covid-19 transmission, in both community and
hospital settings, and the transmitters may be asymptomatic or with mild symptoms (Wang et
al., 2020). Using the SIR –susceptible (S), infected (I) and recovered (R) epidemiology model,
it has been possible to understand the course of an epidemic and to plan effective control
strategies (Kermack and McKendrick, 1927). The key parameter is the reproduction number
𝑅𝑜 i.e. the average number of infected people per one contagious person: 𝑅𝑜 > 1 implies the
virus is spreading fast and rate of infection is growing exponentially. However, as people
recover the population gains immunity, eventually 𝑅𝑜 < 1 and the virus dies out1. The key
challenge for the health sector is to influence 𝑅𝑜 i.e. design measures to both contain and
suppress the virus.
The international health regulations (IHR 2005) require that countries undertake mitigation
responses within IHR provisions of risk assessment and risk communication to ensure
appropriate response globally (World Health Organization, 2008). Several countries, including
Uganda instituted variations of Covid-19 pandemic mitigating strategies ranging from case
isolation in the home, home/institutional quarantine to social distancing of entire population
where all households reduce contact outside their household. The disease and pandemic
mitigating strategies generate economic consequences including impact on travel services,
hospitality services, durables expenditure, and on the supply chain. Some sectors have been
affected more than others have; the current news reports tourism and hospitality,
aviation/airlines, automotive, consumer products, and consumer electronics among the most
affected sectors. However, the list may vary from country to country depending on, among
others, the structure of the economy.
1 If 𝑅𝑜 < 1 it implies the speed of recovery is higher than the speed of contagion, thus the virus dies out.
4
Studies that have investigated the economic impact of infectious disease pandemics tend to
focus on the direct effects of the pandemic such as illnesses, deaths, hospitalisations, and direct
effects of mitigation strategies such as cost-effectiveness analyses of vaccinations, business
losses from reduced consumption and workforce absenteeism, among others (Berry et al., 2018;
Meltzer et al., 1999; Sander et al., 2009). For example, a public risk management model was
designed to examine the economically optimal investment capacity needed to reduce the
likelihood and severity of the Ebola pandemic of 2014 (Berry et al., 2018). They defined the
economic costs to included human health expenditures, and lost productivity and commerce,
and demonstrated that it is beneficial to invest in prevention and protection by maintaining a
capital stock –hospitals, lab facilities and equipment, surveillance networks and knowledge and
human capital, which lasts for a long-term. However, the analysis focuses on the health system
while disregarding the interaction of the health sector with other sectors in the economy.
Similarly, a study estimated the economic impact of influenza pandemic mitigation strategies
taking a societal perspective to account for productivity losses due to prophylactic absenteeism
and school closure disruptions (Sander et al., 2009). However, they did not analyse the
economy-wide implications of productivity losses such as the impact on welfare.
Overall, the approach to analyse only direct effects takes a narrow focus, a partial equilibrium,
which does not capture the indirect effects of both the disease and the mitigating policies on
the wider economy. A typical partial equilibrium analysis is ill-equipped to estimate the
cascade effects resulting from certain public health policy interventions (Beutels et al., 2008).
The suggestion is to combine the information from estimated cost-effectiveness of healthcare
interventions with macroeconomic data, such as social accounting matrices in a computable
general equilibrium (CGE) model, to estimate the shocks to the whole economy of various
policy interventions.
Some studies have evaluated the economic impact of infectious disease pandemics using the
CGE modelling approach majority of which are set in developed countries. Applying a single
country static CGE model of the UK, studies evaluated the economy-wide impacts of pandemic
influenza on the UK economy (Richard D Smith et al., 2011; Richard D Smith et al., 2009).
They postulated that both the quantity and productivity of labour reduced by illness and deaths
due to the disease and that mitigation policies may reduce available labour if people are advised
to keep away from work to avoid infections. Results showed that the major loss to the economy
5
arises from the courses taken to mitigate the disease, such as school closures and prophylactic
absenteeism, which reduce labour supply to the economy. However, they do not show the
economic impact disaggregated by sectors. Sectors that are less people-oriented are likely to
have relatively lower impact when compared to the labour-intensive sectors. Nevertheless,
another study, using the single country static CGE model applied to the UK, France, Belgium
and Netherlands, with disaggregated sectors, evaluated the impact of a pandemic influenza and
obtained estimates similar to the UK study (Keogh-Brown et al., 2010; Richard D Smith et al.,
2009). These studies also indicated that the greatest concern for an episode of pandemic
influenza is the resultant mitigation policies such as school closures and prophylactic
absenteeism that lead to colossal sums of money lost in declining outputs for the economy.
The foregone studies employ a static CGE model and highlight the short-term effects; they do
not capture the long-term effects of the pandemic and mitigating factors on the economy. We
propose to overcome this shortcoming by employing a dynamic recursive CGE model. A
dynamic model is a more suitable alternative because health effects and associated policies in
the wider economy may have long-term lags. It also generates an evolution path of the
economic system from the initial to the final state, thus capturing the costs associated with the
adjustment to changes in the public health policies. We also model labour disaggregated by
skill and residence, to isolate the differential impact on labour-skill intensiveness in specific
sectors. One of the few studies evaluating developing country economies applied a static CGE
to Thailand, South Africa, and Uganda and showed sectoral impacts that differed across
countries, depicting the differences in the structure of the economies under study (Richard D.
Smith and Keogh-Brown, 2013). Furthermore, our proposed study setting in developing
countries of Africa differentiates it from the dynamic CGE model used to evaluate the
macroeconomic effects of H1N1 Influenza pandemic in Australia, a developed country
(Verikios et al., 2010).
Our study aims to examine the economy-wide impact of Covid-19 pandemic and associated
mitigation strategies on the Uganda economy using a dynamic computable general equilibrium
analytical approach. Specific objectives are threefold. First, to design model scenarios to mimic
the impact of mitigating public health policies on the economy focussing on impact channels
via labour supply, labour productivity, government health expenditure with fixed government
budget and with foreign aid for health, and remittance inflows. Second, to evaluate the
aggregate impact of Covid-19 on sector production and GDP growth, international flows via
6
imports and exports, and household welfare. Third, to recommend policy options to minimise
the impact of infectious disease pandemics in Uganda and similar low-income countries.
Our study contributes to the literature on the economy-wide impact of infectious diseases. The
proposed economy-wide analytical approach is a move from the narrow internal focus on the
health sector to wider national effects. The dynamic CGE model with highly disaggregated
sectors, households, and labour, has scarcely been applied in a macroeconomic assessment of
infectious pandemics in a developing country setting. Existence of a large informal
(unregulated) sector that is also a significant employer in Uganda, for example, has
implications for the wages structure, sector output composition as well as household income
and poverty rates in the country. The Ugandan CGE model captures these effects. This study
confers lessons to other developing countries with similar economic structure like Uganda, on
the economy wide effects of infectious disease pandemics and mitigation strategies.
2. Background
2.1 Social economic characteristics of Uganda
Uganda is a landlocked country within the Great Lakes region of East Africa. With an estimated
area of 241,550.7 square kilometres, the country is home to 44.3 million people with a per
capita income of $795 (current USD) and an age dependency ratio2 at 94% (World Bank WDI
2020). At 94%, Uganda is in the top ten countries with the highest age-dependency ratio in the
world. The urban population share stood at 24% (as of 2019) having grown rapidly in the past
twenty years as a result of gazetting new urban areas (Town Councils and Municipalities) for
newly created districts (Uganda Bureau of Statistics, 2020). Many of the Town Councils and
Municipalities in the new districts remain rural in every sense because the exercise aimed to
increase political patronage for the ruling party rather than devolving governance for improved
service delivery; there has not been any direct correlation between the newly created districts
and improved services delivery (Ayeko-Kümmeth, 2014).
2 Age dependency ratio (% of working-age population). Age dependency ratio is the ratio of dependents--
people younger than 15 or older than 64--to the working-age population--those ages 15-64. Data are shown as the
proportion of dependents per 100 working-age population (World Bank WDI, 2020).
7
The primary sector activities of agriculture, forestry and fishing are the major employers in the
economy –employing approximately 65% of the total population, although they contribute less
than a third of total GDP: 24% compared to 26.2% for industry, 43% for services and 6.8% in
taxes on products in 2019/2020 (Uganda Bureau of Statistics, 2020). Persons in paid
employment (wage and salaried workers) constitute 38.1% of total persons in employment
compared to 49.9% in “own account workers”, 6.9% in “contributing family worker”, 4.4% in
“employer” and 0.7% in “other” categories (Uganda Bureau of Statistics, 2020). Half of the
employment in the primary sector is “own account worker” and only 35.7% is “paid
employment” compared to 56.6% in services and 7.9% in industry. Overall, the informal sector
employs 84.9 percent of the population, 90% of whom are youth (10-30 years) (UBOS,
National labour force survey (2016/17)). The country’s economic structure poses a big
challenge when it comes to navigating the impact of Covid-19.
2.2 Covid-19 in Uganda
Although the first and only case of Covid-19 detected in Uganda was on 20th March 2020, the
President had issued directives for Covid-19 restrictions on the 18th March and by end March
2020 the directives had culminated into a total country lockdown. The directives included
closure of borders with some countries, travel ban for international passengers while land and
air cargo had to follow strict guidelines. Domestic travel restrictions included a dusk to dawn
curfew and a ban on public and private transport except for essential transporters such as food
trucks. Schools and all other education institutions closed and a suspension of social, cultural,
and religious gatherings of any form enforced. All business operations that were categorised as
non-essential and non-food markets closed. Covid-19 restrictions were eased in June 2020, but
schools and learning institutions remained closed and only allowed to open in January 2021 in
a staggered manner, each year group being in a face to face class for at least four weeks and
vacating before another group reports. Unfortunately, the second wave of Covid-19 that is
sweeping the country since May 2021 has forced the total closure of learning institutions again
before some of the year groups could have their turn in class, and imposed restriction on inter-
district travel while still maintaining some of the earlier directives such as the dusk to dawn
curfew.
8
3. Methodology
3.1 Model description
We examine the economic impact of the disease and associated policies using a single country
recursive dynamic computable general equilibrium (CGE) model of Uganda. A CGE model is
a set of mathematical equations specifying the economy in terms of agents –households,
firms/producers, the government, and the rest of the world. Each agent has different resources
and behaves differently from the other agents. For example, households are the consumers in
the economy, they work for firms and receive wages in return for their labour, and they spend
their wages on purchasing goods and services and save any remainder. In deciding which goods
to buy or saving to make, households choose those combinations that give them the most
satisfaction (utility) within the constraints of their budget (income). In the model, each
household allocates their disposable income to consumption by maximizing a Stone-Geary
utility function under a linear expenditure system. The firms (producers) purchase labour from
the households and combine it with capital and land (which they also buy) to produce goods
and services. Firms choose how much of a good they produce by minimising the cost of
production whilst maximising their sales because they want the biggest possible profit. The
model assumes perfectly competitive markets and constant returns to scale production
functions. The government collects taxes from wages by households and sales by firms and
then spends the money around the economy on public services such as healthcare, subsidies
and benefits.
The macroeconomic closures are defined as follows. For the government closure we assume
flexible government savings while all taxes and real government consumption are fixed.
Additionally, within the government expenditure equation, we fix the government function
(commodity consumption) demand scaling factor while the government function shares and
transfers are endogenously determined to allow for modelling the increase in the health sector
budget due to Covid-19 induced demand. To align with this government function closure, we
assume a savings driven savings-investment balance so that the households’ and enterprises’
marginal propensities to save are fixed and real investment expenditure adjusts to equal the
volume of savings available to finance it. For the external balance, foreign savings are kept
constant while the real exchange rate is flexible to clear foreign exchange markets. This closure
allows us to model an increase in aid inflows for Covid-19 interventions. In the factor markets,
labour supply is fixed, and the real wage adjusts to equate demand and supply.
9
The CGE modelling finds a solution where all these behaviours are satisfied (and optimised)
simultaneously. The solution of the model represents an economy in equilibrium. The recursive
dynamic feature implies that the within-period equilibrium for a given period forms the
baseline for the next period model run and the process continues for the entire model horizon.
In each iteration, investment of the current period is turned into capital stock of the next period
and exogenously provided factor supply and productivity growth rates determine the overall
growth of the economy.
3.2 Social accounting matrix (SAM)
A CGE model is calibrated from a social accounting matrix –a comprehensive, economy-wide
data framework representing the economy by capturing the financial value of transactions and
transfers between all economic agents in the system, for a given period. The latest Uganda
SAM for the baseline calibration is readily available (Randriamamonjy and Thurlow, 2016). It
is a Nexus SAM with 58 sectors in a 122 by 122 matrix, representing activities (entities that
carry out production) and commodities (markets for goods and non-factor services); factors of
production; the government; domestic non-government institutions (households and
enterprises) and the rest of world (external sector). The matrix columns represent payments
and rows are receipts, as in the accounting double entry format.
The Nexus SAM2013 is a one to one mapping of activities and commodities. Our value
addition is in transforming the Nexus SAM into a SAM suitable for calibrating the dynamic
CGE model to achieve the study objectives. We aggregate the N58 micro SAM into a Macro
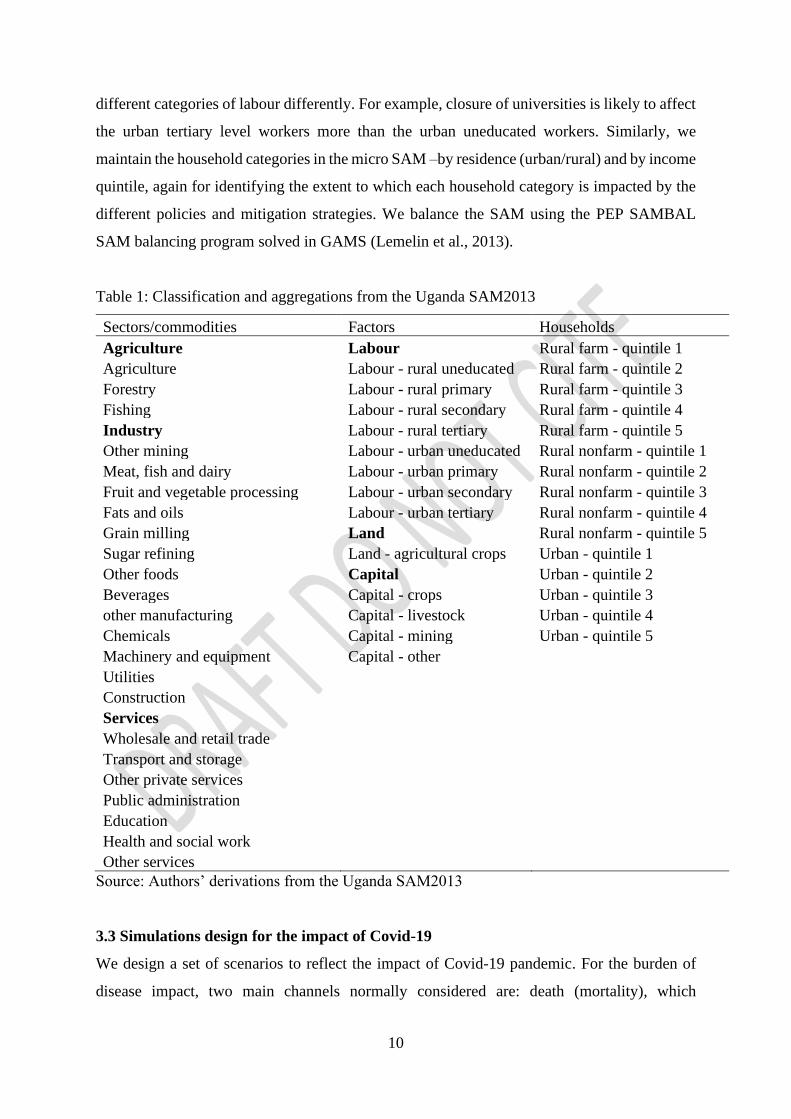
SAM as follows. The sector/commodity mapping in the micro SAM is aggregated into three
main sectors of agriculture, industry, and services, as shown in Table 1, purposefully done to
aid the analysis of targeted policy simulations. Agriculture includes food and cash crops, and
livestock farming; industry includes food processing and other manufacturing; and in services,
Other private services includes Accommodation and food services, Information and
communication, Finance and insurance, Real estate activities, and Business services while
Other services includes both public and private services not listed elsewhere.
For factors of production, we maintain the disaggregation in the micro SAM -labour
disaggregated by residence (rural/urban) and by level of education (uneducated, primary,
secondary, and tertiary). This classification is important because different policies will affect
10
different categories of labour differently. For example, closure of universities is likely to affect
the urban tertiary level workers more than the urban uneducated workers. Similarly, we
maintain the household categories in the micro SAM –by residence (urban/rural) and by income
quintile, again for identifying the extent to which each household category is impacted by the
different policies and mitigation strategies. We balance the SAM using the PEP SAMBAL
SAM balancing program solved in GAMS (Lemelin et al., 2013).
Table 1: Classification and aggregations from the Uganda SAM2013
Sectors/commodities Factors Households
Agriculture Labour Rural farm - quintile 1
Agriculture Labour - rural uneducated Rural farm - quintile 2
Forestry Labour - rural primary Rural farm - quintile 3
Fishing Labour - rural secondary Rural farm - quintile 4
Industry Labour - rural tertiary Rural farm - quintile 5
Other mining Labour - urban uneducated Rural nonfarm - quintile 1
Meat, fish and dairy Labour - urban primary Rural nonfarm - quintile 2
Fruit and vegetable processing Labour - urban secondary Rural nonfarm - quintile 3
Fats and oils Labour - urban tertiary Rural nonfarm - quintile 4
Grain milling Land Rural nonfarm - quintile 5
Sugar refining Land - agricultural crops Urban - quintile 1
Other foods Capital Urban - quintile 2
Beverages Capital - crops Urban - quintile 3
other manufacturing Capital - livestock Urban - quintile 4
Chemicals Capital - mining Urban - quintile 5
Machinery and equipment Capital - other Utilities
Construction
Services
Wholesale and retail trade
Transport and storage
Other private services
Public administration
Education
Health and social work
Other services
Source: Authors’ derivations from the Uganda SAM2013
3.3 Simulations design for the impact of Covid-19
We design a set of scenarios to reflect the impact of Covid-19 pandemic. For the burden of
disease impact, two main channels normally considered are: death (mortality), which
11
permanently removes sections of the labour force (case fatality ratio), and illness (morbidity),
which temporarily removes sections of the labour force (clinical attack rate). However, in line
with the studies alluded to in the literature section, we consider the fact that the greatest impact
of the pandemic arises from mitigation policies rather than death or illness from the disease.
For instance, according to the data record on 3rd March 2021 by Johns Hopkins University,
Uganda had only 40,395 confirmed cases and 334 deaths, with a case fatality ratio of 0.8%
translating to 0.78 deaths per 100,000 population. Similarly, Bell et al predicted Uganda to
have a low disease burden (mortality and morbidity) from Covid-19, based on the country’s
population age structure, but warned of a high risk of an increase in non-Covid-19 disease
burden as a result of prolonged lockdown and other restrictions (Bell et al., 2020). Therefore,
we concentrate on designing scenarios for the pandemic mitigation strategies both at the
domestic and international level. At the local level we consider the Presidential directives on
Covid-19 and their effect via labour supply, labour productivity and government spending on
healthcare. The directives included closure of schools, colleges and universities, closure of all
non-essential businesses and service providers, suspension of public transport, closure of
airports to passenger carriers, and closure of leisure and entertainment venues. On the
healthcare front, actions included the increase in capacity of some government hospitals to
cater for critical care and setting up case isolation centres in different parts of the country and
later on set up vaccination centres. The degree of restriction for some of the measures was
relaxed after about six months, under strict standing operating procedures (SoPs) but later
reinstated when the second wave, with the more virulent Delta variant, set in during May 2021
At the international level, we consider the impact on remittance inflows.
3.3.1 The baseline growth path: No covid-19 scenario
The baseline scenario depicts how the economy would perform in the absence of Covid-19
effects, for the period 2019 to 2030. The beginning of the model horizon is selected to coincide
with the initial year of the onset of the Covid-19 pandemic in Uganda. Additionally, the SAM
coefficients in the Nexus SAM2013, the benchmark dataset, are assumed to be consistent with
the performance of the economy as of 2019. The effects of Covid-19 pandemic and
containment policies are measured against the baseline as the benchmark. The calibrated capital
growth rate for the dynamic baseline scenario is set to 5%, to generate a GDP growth rate of
5.6%, that is consistent with the IMF Economic Outlook. The IMF growth forecast, accounting
for the Covid-19 effects, will fluctuate between 5% and 6.4% for the period 2020 to 2025, a
decline from the 7.5% growth realised in 2019, and we assumed it remains in that region up to
12
2030. This baseline GDP growth is achieved with 1% annual growth rate in labour productivity
and total factor productivity.
Aggregate government consumption expenditure and foreign savings are each set to grow at
3% per annum, taking the average growth in the trend depicted in the national accounts for the
past decade (Uganda Bureau of Statistics, 2020). The government consumption shares by
function takes the average values derived from the trend in actual expenditure share for
financial year 2015/16 to 2019/20 (Uganda Bureau of Statistics, 2020). Annual change in
labour supply is set at 4%, in line with the UN demographic model for Uganda. Growth in
remittance inflows is set 10% per annum, according to the average annual increase for the past
twenty years (Cooper et al., 2018).
3.3.2 Labour supply
Different labour types are affected differently by the lockdown policies. Whereas remote
working became quite attractive, it poses serious challenges to employers and is hardly feasible
for informal sector workers3 who are the majority in Uganda. Even for the 17.9% formal sector
workers with access to technology and capable of applying the digital tools, the proportion that
can work from home varies by sector and occupation. Many workers in retail, leisure,
construction and manufacturing can hardly work from home. Additionally, the concept of
remote working is relatively new in Uganda; it poses challenges for worker productivity
because workers are accustomed to working in proximity of their employers/supervisors, let
alone the lack of required IT equipment, slow or no internet access and intermittent electricity
supply.
Using data from the Uganda High-frequency Phone Survey on COVID-19, conducted by
Uganda Bureau of Statistics in June of 2020, a study found that 45% of adult men and 49% of
adult women did not work in the week preceding the survey, due to Covid-19 restrictions
(Mukoki et al., 2020). Additionally, a research team that was studying the economic status of
households in 21 parishes from two rural districts in Western Uganda, prior to the Covid-19
3 Persons in informal sector employment are normally in precarious employment situations, not entitled to basic
benefits such as pension/retirement fund, paid leave, medical benefits and often their employment agreement is
verbal.
13
lockdown, conducted a follow-up survey in May 20204 to establish the impact of the lockdown
on economic outcomes and wellbeing (Mahmuda and Riley, 2021). They found a 50% decline
in wage and salaried labour supplied by households, and household labour supplied to their
enterprises. However, they also found a reallocation of labour towards crop and livestock
farming and an overall increase in the time allocated to these activities by nearly 100% on the
baseline mean. This suggests the lockdown could have induced households to devote time to
farm activities both for subsistence and for income since income generating opportunities
outside the homesteads had drastically reduced. The farming labour dynamics revealed in this
survey are a typical representation of rural communities throughout the country because these
areas experience similar weather patterns and seasonality of crop and livestock farming.
We model the labour supply shock as follows. First, we assume an increase in the labour supply
in the rural-based primary activities of agriculture, forestry, and fishing. Thus, we increase the
initial rural non-tertiary labour by 50% in the first year. This increase is then reverted to 20%
in the subsequent year, and finally remains at 10% above the initial level up to 2030 (subject
to the 4% annual labour growth rate in the baseline).This scenario assumes that some workers
will be returning to their former occupations in the aftermath of Covid-19 restrictions while
some will remain in the new-found activities of farming. Second, we assume a decline in labour
supply for predominantly urban-based enterprise sector activities including wholesale and
retail, transport and storage, and other private services, largely in the informal sector. Thus, we
reduce the initial stock of urban non-tertiary labour by 80%. This reduction is then reverted to
50% in the subsequent year, then to 20% in next year, then remains at 10% below the initial
level up to 2030 (subject to the annual labour growth rate). These labour adjustments are based
on the assumption that some workers will not return to their jobs as some businesses downsized
while others went bust due to Covid-19 restrictions5 (Lakuma et al., 2020).
3.3.3 Labour productivity
The physical and mental wellbeing of workers is pertinent to their performance at work.
Wellbeing and worker productivity are inextricably linked. Mahmud and Riley (2021) also
found an increase in depression and low well-being among the respondents in the Western
4 The first easing of Lockdown restrictions started in June 2020 5 The Economic Policy Research Centre rapid survey of businesses revealed that business activity reduced by
more than 50% and 75% of the surveyed businesses laid off workers due to Covid pandemic risks and associated
restrictions (Lakuma et al 2020).
14
districts of Uganda. Additionally, disruptions in teaching and learning programs at schools and
training institutions implies that acquisition of skills is negatively impacted. This will
potentially affect progress in human capital accumulation, both in the short and medium term
(World Bank, 2021). Consequently, labour productivity levels will decline in tandem. We
therefore model a labour productivity shock in all sectors of the economy by assuming a
gradual decline, with the largest shock in the first year, which reduces in subsequent years as
people become accustomed to the new normal of living and working, thereby making necessary
adjustments. We assume the initial labour productivity declines by 10%, then this decline
reverts to 5% in the subsequent year and finally to 2.5% per year until 2030. The decline is
partly attributed to reduced population well-being, reassignment of tasks from those usually
performed e.g. the reallocation of labour to farm activities as discussed above as well as
inadequate skills acquisition due to Covid-19 disruptions.
3.3.4 Remittance inflows
Impact of reduced remittance inflows to Uganda due to Covid-19 effects in source countries.
The World Bank predicted remittances to Sub-Saharan Africa to fall and that the declining
trend would continue in subsequent years (World Bank, 2020). We assume that the declining
trend would gradually level off by 2030, following the anticipated economic recovery in
migrant host countries but may not be completely restored to pre-Covid-19 levels. Thus, we
shock the model with a reduction in remittances by 80% from the initial year, then this
reduction is reverted to 50% in the subsequent year and finally to 10% for all years up to 2030.
3.3.5 Increase in the health sector spending (fixed resource envelope)
This scenario assumes the government has a fixed resource envelope from which to fund
additional healthcare expenditure arising from Covid-19 effects. There is no taxation increase
earmarked for this additional health spending but rather, the general tax revenue follows the
same path as in the baseline. With a fixed budget, such additional spending in the health sector
is drawn from other government functions such as the public administration sector6. We assume
the health sector budget share doubles in the first year, then this increase is reverted to 50% in
2022 and finally to 30% for the years up to 2030.
6 The public administration sector in the SAM comprises of all those government functions in the national
accounts, other than health i.e Public admin = General public services, Defence, Public order, Economic affairs,
Environment, Housing and community affairs, and Social protection.
15
3.3.6 Increase in health sector budget allocation: external resources
This scenario assumes the same health sector spending increase patterns as the previous
scenario but also that the government can mobilise additional resources from external sources
for funding healthcare activities in the wake of Covid-19. Therefore, the health sector budget
share increases but additional resources are drawn from aid for health in the form of transfers
from the rest of world to government, specifically directed to the health sector. We assume that
the foreign aid flows beyond the baseline rate are deployed in the health sector according to
the Covid-19-induced priorities. Although part of the foreign aid inflow may be in the form of
concessional loans, such that they carry an implication for interest payments, the current model
does not distinguish between foreign aid inflows that are concessional loans or grants. Our
analysis is limited to assessing the Covid-19-induced health spending with increased external
resources, assuming that a positive impact could outweigh the cost of interest payments on the
economy. We thus define a health-aid multiplier while maintaining the same pattern of increase
in health spending as in the preceding simulation experiment five (i.e. where the health
spending increases in a fixed government budget).
Table 2 Summary of simulations design
Scenario Description Parameter
Base Baseline growth path
EXP1 Non-tertiary rural labour increases LFGR
EXP2 Non-tertiary urban labour declines LFGR
EXP3 Decline in labour productivity growth in all sectors FPRDGR
EXP4 Reduction in remittance inflows TRNSFRGR (H, ROW)
EXP5 Increase in government health spending (fixed budget) QGGR (GOVF)
EXP6 Increase in health spending with Foreign aid for health QGGR (GOVF)
TRNSFRGR (GOV, ROW)
4. Results and discussion
In CGE modelling, the emphasis of the simulation result is on the direction (sign) of the effect
of a shock in the economy, as opposed to the magnitude of the effect. We thus present results
as deviations from the baseline, at the intermediate and aggregate levels of the economy.
4.1 Sector performance
16
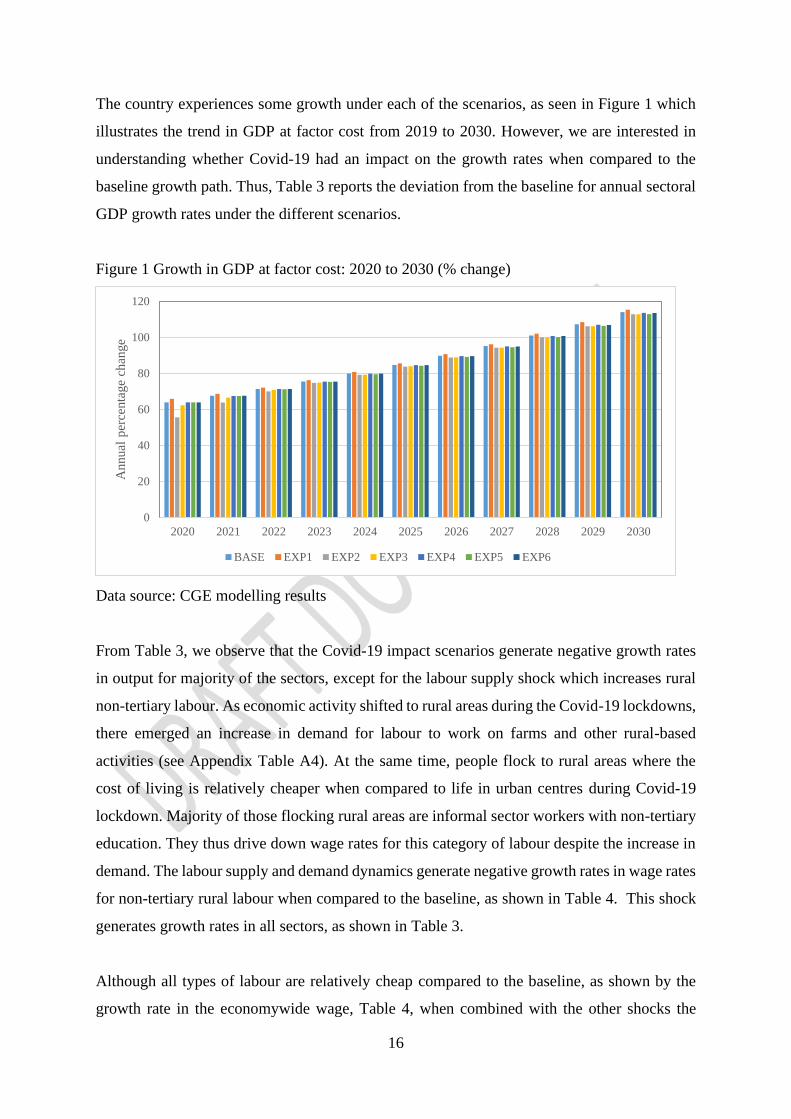
The country experiences some growth under each of the scenarios, as seen in Figure 1 which
illustrates the trend in GDP at factor cost from 2019 to 2030. However, we are interested in
understanding whether Covid-19 had an impact on the growth rates when compared to the
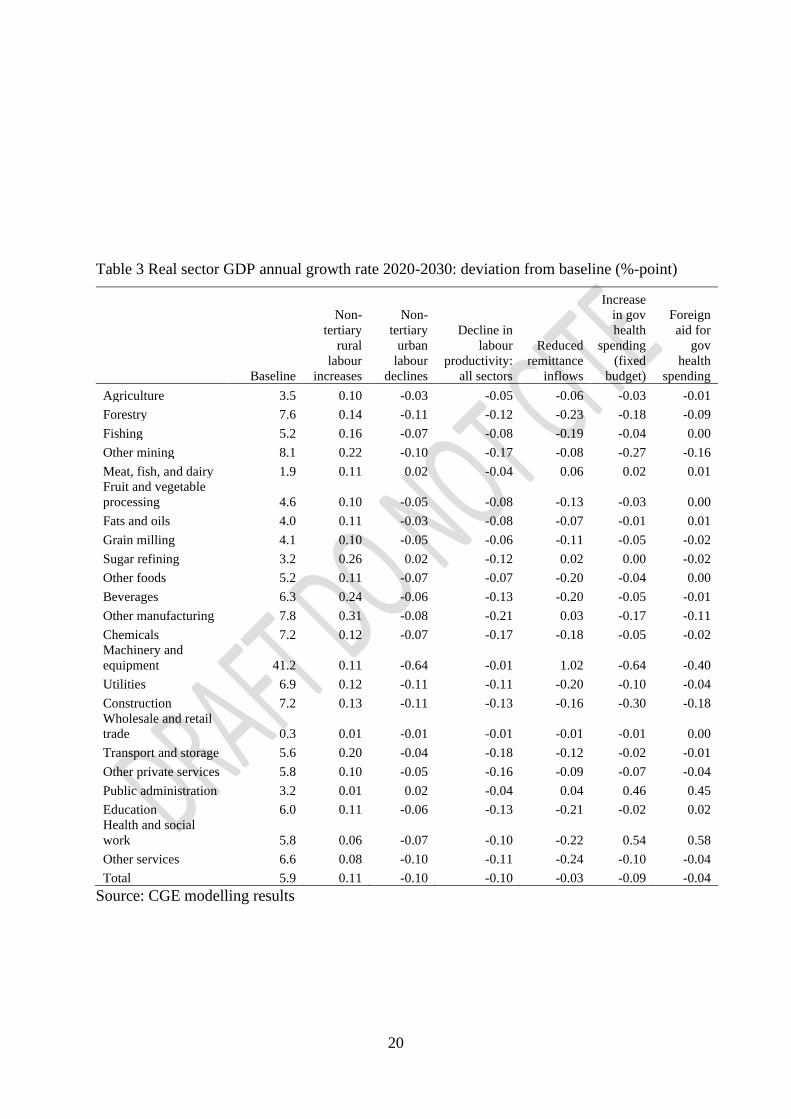
baseline growth path. Thus, Table 3 reports the deviation from the baseline for annual sectoral
GDP growth rates under the different scenarios.
Figure 1 Growth in GDP at factor cost: 2020 to 2030 (% change)
Data source: CGE modelling results
From Table 3, we observe that the Covid-19 impact scenarios generate negative growth rates
in output for majority of the sectors, except for the labour supply shock which increases rural
non-tertiary labour. As economic activity shifted to rural areas during the Covid-19 lockdowns,
there emerged an increase in demand for labour to work on farms and other rural-based
activities (see Appendix Table A4). At the same time, people flock to rural areas where the
cost of living is relatively cheaper when compared to life in urban centres during Covid-19
lockdown. Majority of those flocking rural areas are informal sector workers with non-tertiary
education. They thus drive down wage rates for this category of labour despite the increase in
demand. The labour supply and demand dynamics generate negative growth rates in wage rates
for non-tertiary rural labour when compared to the baseline, as shown in Table 4. This shock
generates growth rates in all sectors, as shown in Table 3.
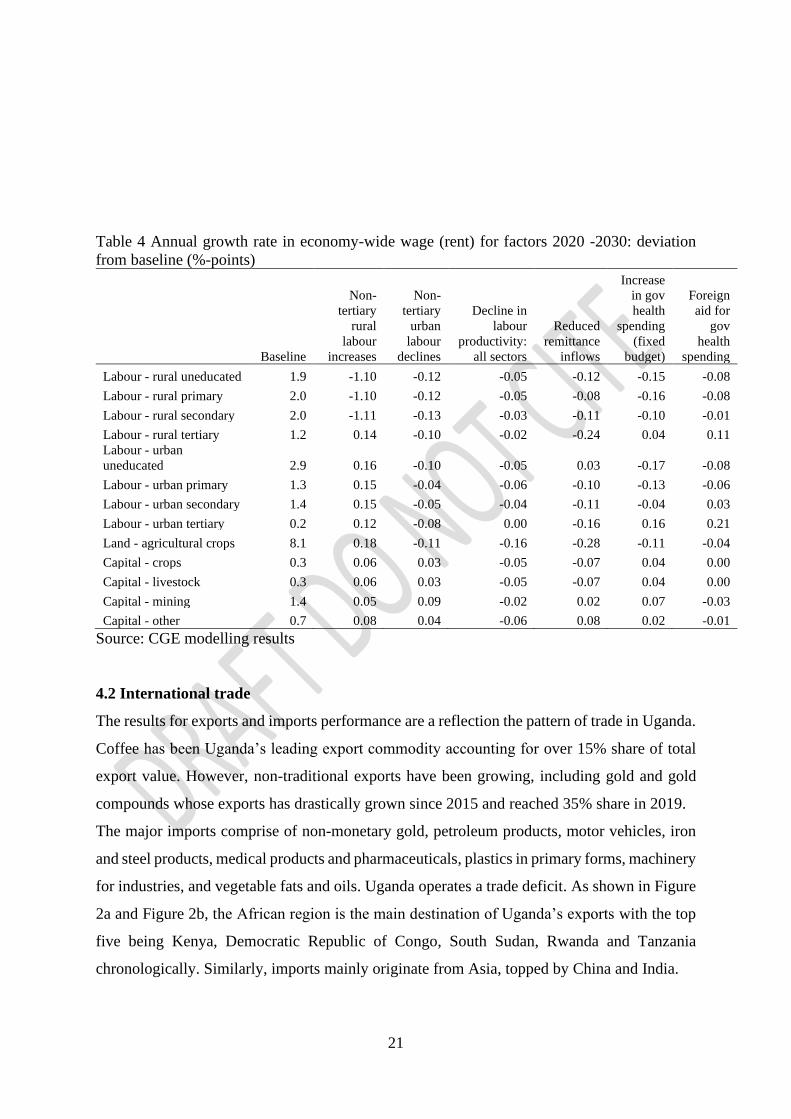
Although all types of labour are relatively cheap compared to the baseline, as shown by the
growth rate in the economywide wage, Table 4, when combined with the other shocks the
0
20
40
60
80
100
120
2020 2021 2022 2023 2024 2025 2026 2027 2028 2029 2030
Annual
per
centa
ge
chan
ge
BASE EXP1 EXP2 EXP3 EXP4 EXP5 EXP6
17
sector output growth rates shown in Table 3 suggest that availability of cheap labour alone,
particularly non-tertiary rural labour, is not sufficient to spur growth in all sectors beyond the
baseline rates. The lack of commensurate growth in sector output is partly due to the
underdeveloped physical infrastructure networks, such as poor rural road networks needed to
facilitate easy movement of goods to markets, lack of processing and storage facilities that
could preserve the abundant seasonal harvest to be sold in times of scarcity, limited rural
electrification to facilitate business activities including agricultural processing, among others.
For example, up to 90% of the transport sector is dependent on the road network yet only 3.2%
of the total road network (about 146,000km) is paved, mainly in cities and urban centres
(Ministry of Works and Transport (Uganda), 2018). Yet evidence shows that the stock of
infrastructure assets is positively associated with economic growth (Calderón and Servén,
2004) and the productivity effects of transport infrastructure tend to be higher for roads (Melo
et al., 2013). It is therefore important to augment the growth in production factors such as
labour and land, with accelerated investment in rural infrastructure, so that producers and
consumers are better integrated into national and international markets, hence generate faster
economic growth.
Additionally, when urban-non-tertiary labour supply declines, the observed negative growth in
the majority of sectors is consistent with the effect of a reduction in aggregate demand. This
is because the urban workers operate a more cash-based (monetised) economy, when compared
to their rural counterparts who survive on subsistence from their gardens, hence are a source
of regular demand for goods and services produced by all the sectors. A reduction in the growth
rate of urban labour implies a decline in their labour income and potentially declining
consumption expenditure. The cut-back in consumption expenditure implies stockpiles of
goods in retail and wholesale shops, and ultimately in the manufacturers’ warehouses.
Consequently, firms will cut back on production of more goods.
Notable among the sector performance is the machinery and equipment sector whose growth
rate rises by 1.02 percent points under the reduction in remittances scenario. This suggests that
the Covid-19-induced shift in how people live and work, potentially generates increased
demand for machinery and equipment such as electrical and computer accessories, for example
for online learning and working from home, as well as farming tools and equipment to combine
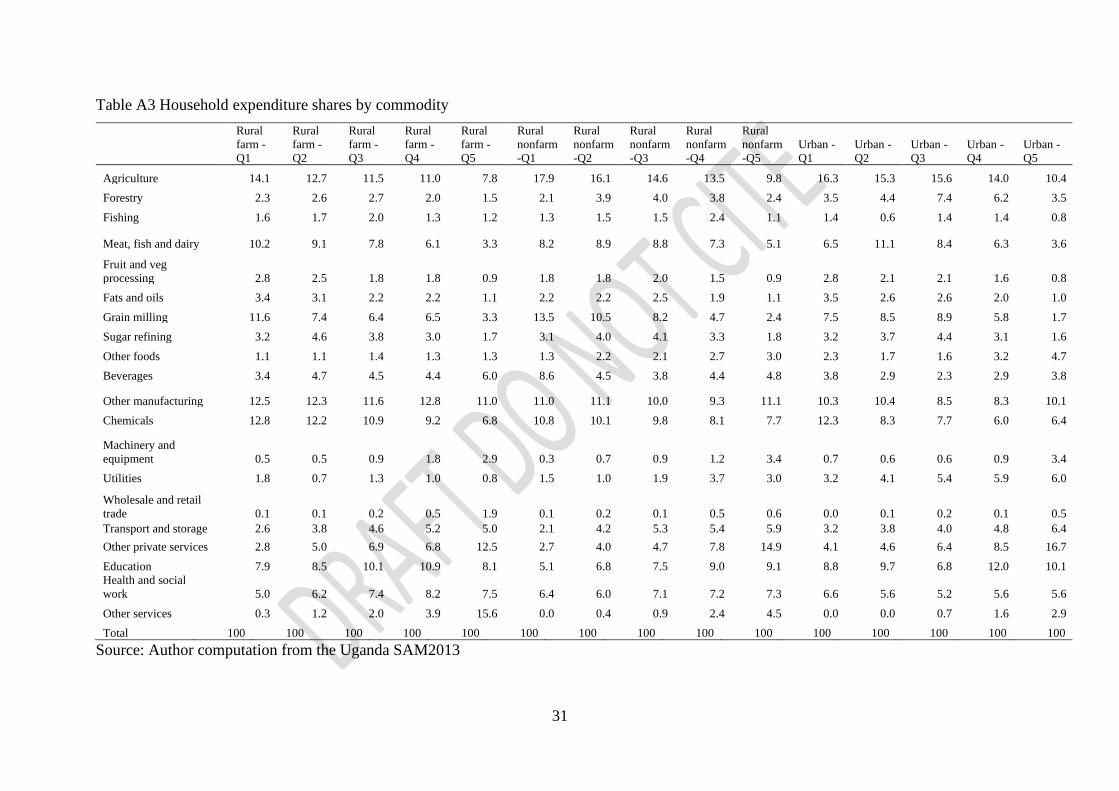
with the additional farming labour. Moreover, the biggest demanders of the machinery and
equipment commodity are households in the fifth quintile of the population with the highest
18
household incomes, in both rural and urban areas (see Appendix Table A3). These households
are more likely to purchase equipment to suit the changes in lifestyles induced by Covid-19
restrictions. The contraction in other sectors under the same scenario can be explained by the
negative impact of reduced remittances on consumption expenditure. Majority of households
that receive remittances deploy that non-labour income to immediate expenditure demands
including out-of-pocket payments for healthcare, education, and household consumption goods
(Amega, 2018; Doyle, 2015; Medina and Cardona, 2010). This implies a reduction in
remittance income reduces consumption expenditure which potentially leads to a decline in
aggregate demand. This, in turn, feeds back to the sectors that supply the goods and services,
and limits growth in output produced.
Furthermore, increasing government health spending generates a decline in growth rates for
most sectors, when compared to the baseline although some of those sectors become better off
when the source of government health funding is external resources. The decline in sector
output growth is partly due to the expanding public healthcare expenditure which reduces
resources available to other government functions. A reduction in other government functional
expenditures affects some of the sectors which are more directly interlinked with the rest of the
economy. For example, from the SAM, the public administration sector consumes 1.8% of the
construction sector commodity compared to 0.25% consumption by the health sector, and the
construction sector contributes 9.5% to GDP compared to 3.4% contribution by the health
sector.
However, an increase in public health spending implies an expansion in the production of
healthcare services since the government is both the producer and consumer of public
healthcare. This expansion would require additional healthcare production inputs such as
healthcare workers, medicines, and other health commodities. It is interesting to note however,
that even for those commodities with large intermediate input shares in the production of a unit
of healthcare, (i.e. SAM shares for other manufacturing: 0.17 and chemicals: 0.16), expanding
the health sector production does not generate commensurate growth in the domestic sectors
that could produce such commodities. This suggests that these commodities are largely
imported, which is plausible because only a small proportion of medicines and medical
commodities are produced locally in Uganda (UNIDO, 2010) and no Covid-19 vaccine is
produced in Uganda. The result demonstrates that the economy exhibits limited supply capacity
by local manufacturing sectors; they are unable to meet the demand for critical healthcare
19
production inputs commodities when the health sector expands. This calls for a reorientation
of the country’s industry policy towards manufacturing of products for which potential demand
exists such as medicines and medical commodities.
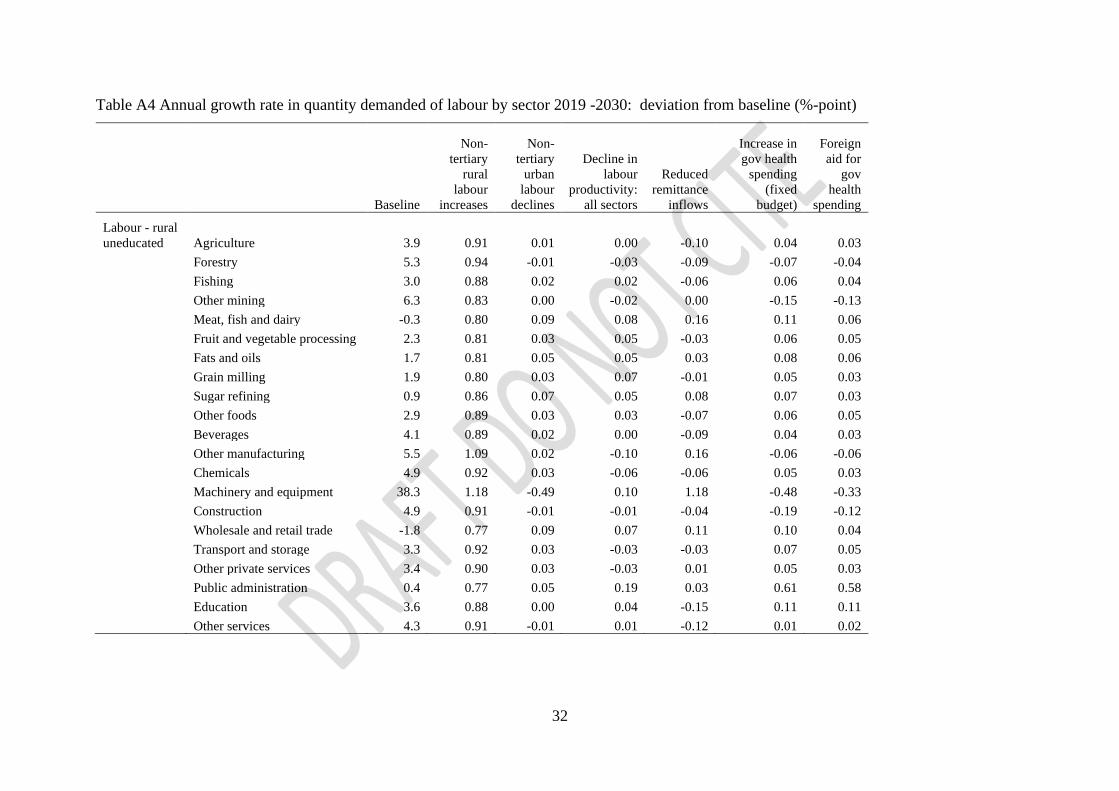
We also notice that expanding the skill-intensive health sector, through increase government
health spending, generates increased demand for skilled labour, as shown by the results for the
growth in quantity demanded of labour by sector (see Appendix Table A4). When compared
to the baseline, the health sector demand for labour grows by 0.52 and0.44 percent points for
rural and urban tertiary-labour respectively. The increased demand also generates an increase
in the wage rate for this category of labour (see Table 4) partly because healthcare labour
requires skills that take a long to acquire and therefore it is not likely to increase the pool of
healthcare workers in the short run yet there is growing demand. Overall, the health sector GDP
grows by 0.54 – 0.58 percent points while other sectors shrink or remain at baseline levels,
except for public administration. This result is consistent with the theoretical factor-bias effect
of expanding a non-tradable sector in a Heckscher-Ohlin (H-O) model of production
equilibrium, extended to incorporate health and healthcare (Kabajulizi, 2016). According to
this theory, given a fixed endowment of skilled and unskilled labour, expanding the skill-
intensive non-tradable health sector will draw more units of the available skilled labour and
some unskilled labour into the production of healthcare, resulting into a decline in the skilled
to unskilled labour ratio in the rest of the economy. Consequently, while the health sector
output expands, the output of other skill-intensive tradable sectors such as construction,
manufacturing, and machinery and equipment will decline while the tradable sectors intensive
in unskilled labour will grow slowly. The theory suggests that in settings where skilled labour
is scarce, such as Uganda, expanding the health sector may lead to a decline in overall output
because the skill intensive sectors’ output declines while that of unskilled intensity grows
slowly7.
7 This factor-bias outcome is, however, only part of the story of expanding the health sector. Expanding the health
sector output also implies more services and treatments for the sick and unable to work labour. If these are cured
and return to work, it may increase labour participation rates and labour productivity i.e. the scale effect of
increasing health sector output. The net impact on the economy will therefore depend on which outcome
dominates. In developing countries, with a high disease burden, the scale-effect tends to dominate because the
marginal return of health output (treatments) is often high. The case varies for developed countries. See Chapter
2 in Kabajulizi (2016) for a detailed discussion of the theoretical outcomes of the model.
20
Table 3 Real sector GDP annual growth rate 2020-2030: deviation from baseline (%-point)
Baseline
Non-
tertiary
rural
labour
increases
Non-
tertiary
urban
labour
declines
Decline in
labour
productivity:
all sectors
Reduced
remittance
inflows
Increase
in gov
health
spending
(fixed
budget)
Foreign
aid for
gov
health
spending
Agriculture 3.5 0.10 -0.03 -0.05 -0.06 -0.03 -0.01
Forestry 7.6 0.14 -0.11 -0.12 -0.23 -0.18 -0.09
Fishing 5.2 0.16 -0.07 -0.08 -0.19 -0.04 0.00
Other mining 8.1 0.22 -0.10 -0.17 -0.08 -0.27 -0.16
Meat, fish, and dairy 1.9 0.11 0.02 -0.04 0.06 0.02 0.01
Fruit and vegetable
processing 4.6 0.10 -0.05 -0.08 -0.13 -0.03 0.00
Fats and oils 4.0 0.11 -0.03 -0.08 -0.07 -0.01 0.01
Grain milling 4.1 0.10 -0.05 -0.06 -0.11 -0.05 -0.02
Sugar refining 3.2 0.26 0.02 -0.12 0.02 0.00 -0.02
Other foods 5.2 0.11 -0.07 -0.07 -0.20 -0.04 0.00
Beverages 6.3 0.24 -0.06 -0.13 -0.20 -0.05 -0.01
Other manufacturing 7.8 0.31 -0.08 -0.21 0.03 -0.17 -0.11
Chemicals 7.2 0.12 -0.07 -0.17 -0.18 -0.05 -0.02
Machinery and
equipment 41.2 0.11 -0.64 -0.01 1.02 -0.64 -0.40
Utilities 6.9 0.12 -0.11 -0.11 -0.20 -0.10 -0.04
Construction 7.2 0.13 -0.11 -0.13 -0.16 -0.30 -0.18
Wholesale and retail
trade 0.3 0.01 -0.01 -0.01 -0.01 -0.01 0.00
Transport and storage 5.6 0.20 -0.04 -0.18 -0.12 -0.02 -0.01
Other private services 5.8 0.10 -0.05 -0.16 -0.09 -0.07 -0.04
Public administration 3.2 0.01 0.02 -0.04 0.04 0.46 0.45
Education 6.0 0.11 -0.06 -0.13 -0.21 -0.02 0.02
Health and social
work 5.8 0.06 -0.07 -0.10 -0.22 0.54 0.58
Other services 6.6 0.08 -0.10 -0.11 -0.24 -0.10 -0.04
Total 5.9 0.11 -0.10 -0.10 -0.03 -0.09 -0.04
Source: CGE modelling results
21
Table 4 Annual growth rate in economy-wide wage (rent) for factors 2020 -2030: deviation
from baseline (%-points)
Baseline
Non-
tertiary
rural
labour
increases
Non-
tertiary
urban
labour
declines
Decline in
labour
productivity:
all sectors
Reduced
remittance
inflows
Increase
in gov
health
spending
(fixed
budget)
Foreign
aid for
gov
health
spending
Labour - rural uneducated 1.9 -1.10 -0.12 -0.05 -0.12 -0.15 -0.08
Labour - rural primary 2.0 -1.10 -0.12 -0.05 -0.08 -0.16 -0.08
Labour - rural secondary 2.0 -1.11 -0.13 -0.03 -0.11 -0.10 -0.01
Labour - rural tertiary 1.2 0.14 -0.10 -0.02 -0.24 0.04 0.11
Labour - urban
uneducated 2.9 0.16 -0.10 -0.05 0.03 -0.17 -0.08
Labour - urban primary 1.3 0.15 -0.04 -0.06 -0.10 -0.13 -0.06
Labour - urban secondary 1.4 0.15 -0.05 -0.04 -0.11 -0.04 0.03
Labour - urban tertiary 0.2 0.12 -0.08 0.00 -0.16 0.16 0.21
Land - agricultural crops 8.1 0.18 -0.11 -0.16 -0.28 -0.11 -0.04
Capital - crops 0.3 0.06 0.03 -0.05 -0.07 0.04 0.00
Capital - livestock 0.3 0.06 0.03 -0.05 -0.07 0.04 0.00
Capital - mining 1.4 0.05 0.09 -0.02 0.02 0.07 -0.03
Capital - other 0.7 0.08 0.04 -0.06 0.08 0.02 -0.01
Source: CGE modelling results
4.2 International trade
The results for exports and imports performance are a reflection the pattern of trade in Uganda.
Coffee has been Uganda’s leading export commodity accounting for over 15% share of total
export value. However, non-traditional exports have been growing, including gold and gold
compounds whose exports has drastically grown since 2015 and reached 35% share in 2019.
The major imports comprise of non-monetary gold, petroleum products, motor vehicles, iron
and steel products, medical products and pharmaceuticals, plastics in primary forms, machinery
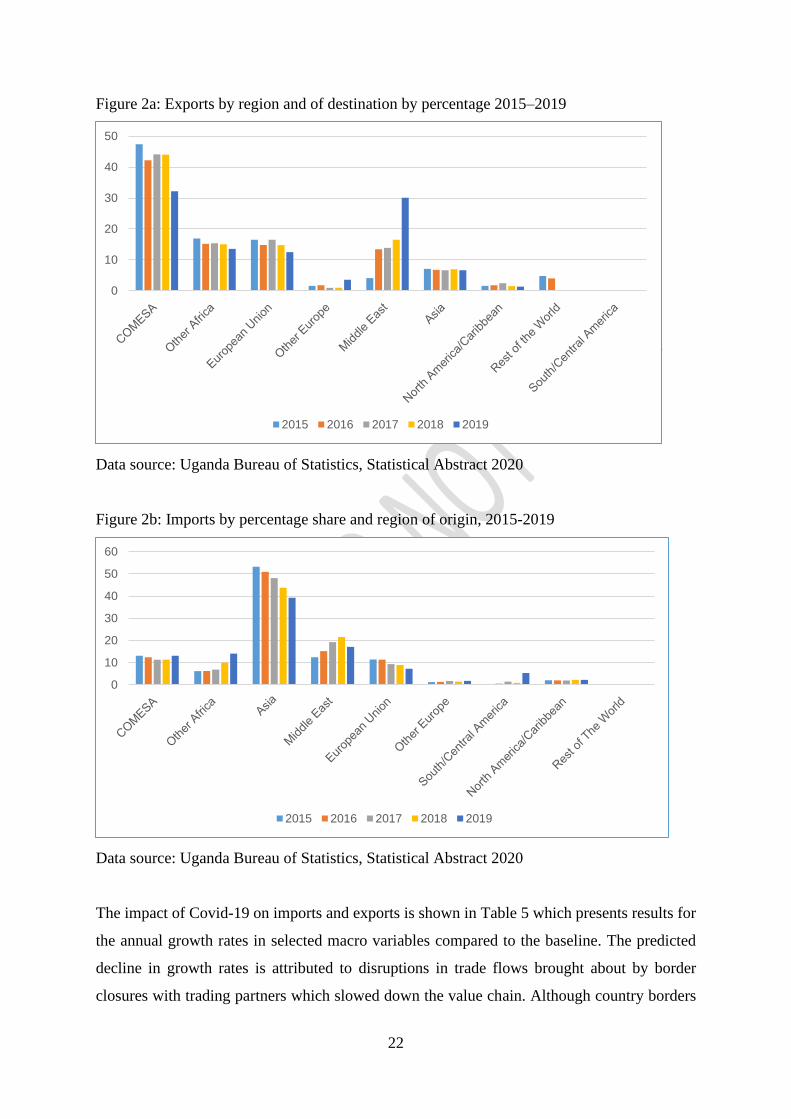
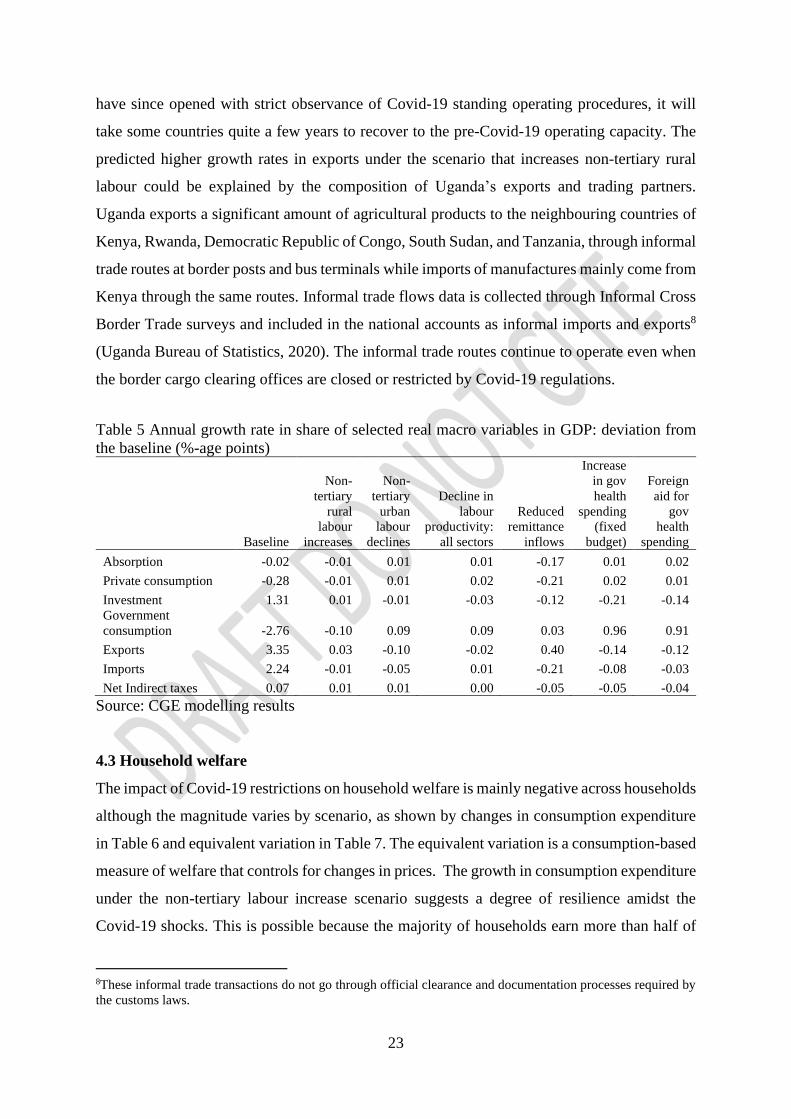
for industries, and vegetable fats and oils. Uganda operates a trade deficit. As shown in Figure
2a and Figure 2b, the African region is the main destination of Uganda’s exports with the top
five being Kenya, Democratic Republic of Congo, South Sudan, Rwanda and Tanzania
chronologically. Similarly, imports mainly originate from Asia, topped by China and India.
22
Figure 2a: Exports by region and of destination by percentage 2015–2019
Data source: Uganda Bureau of Statistics, Statistical Abstract 2020
Figure 2b: Imports by percentage share and region of origin, 2015-2019
Data source: Uganda Bureau of Statistics, Statistical Abstract 2020
The impact of Covid-19 on imports and exports is shown in Table 5 which presents results for
the annual growth rates in selected macro variables compared to the baseline. The predicted
decline in growth rates is attributed to disruptions in trade flows brought about by border
closures with trading partners which slowed down the value chain. Although country borders
0
10
20
30
40
50
2015 2016 2017 2018 2019
0
10
20
30
40
50
60
2015 2016 2017 2018 2019
23
have since opened with strict observance of Covid-19 standing operating procedures, it will
take some countries quite a few years to recover to the pre-Covid-19 operating capacity. The
predicted higher growth rates in exports under the scenario that increases non-tertiary rural
labour could be explained by the composition of Uganda’s exports and trading partners.
Uganda exports a significant amount of agricultural products to the neighbouring countries of
Kenya, Rwanda, Democratic Republic of Congo, South Sudan, and Tanzania, through informal
trade routes at border posts and bus terminals while imports of manufactures mainly come from
Kenya through the same routes. Informal trade flows data is collected through Informal Cross
Border Trade surveys and included in the national accounts as informal imports and exports8
(Uganda Bureau of Statistics, 2020). The informal trade routes continue to operate even when
the border cargo clearing offices are closed or restricted by Covid-19 regulations.
Table 5 Annual growth rate in share of selected real macro variables in GDP: deviation from
the baseline (%-age points)
Baseline
Non-
tertiary
rural
labour
increases
Non-
tertiary
urban
labour
declines
Decline in
labour
productivity:
all sectors
Reduced
remittance
inflows
Increase
in gov
health
spending
(fixed
budget)
Foreign
aid for
gov
health
spending
Absorption -0.02 -0.01 0.01 0.01 -0.17 0.01 0.02
Private consumption -0.28 -0.01 0.01 0.02 -0.21 0.02 0.01
Investment 1.31 0.01 -0.01 -0.03 -0.12 -0.21 -0.14
Government
consumption -2.76 -0.10 0.09 0.09 0.03 0.96 0.91
Exports 3.35 0.03 -0.10 -0.02 0.40 -0.14 -0.12
Imports 2.24 -0.01 -0.05 0.01 -0.21 -0.08 -0.03
Net Indirect taxes 0.07 0.01 0.01 0.00 -0.05 -0.05 -0.04
Source: CGE modelling results
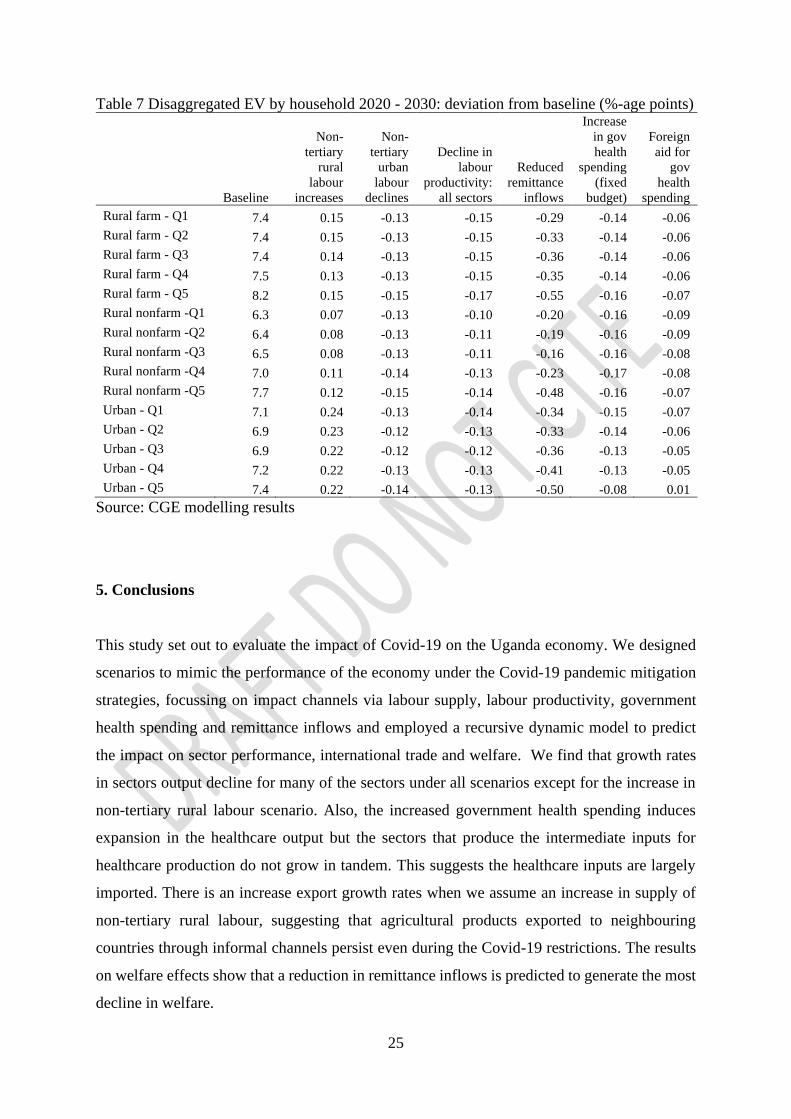
4.3 Household welfare
The impact of Covid-19 restrictions on household welfare is mainly negative across households
although the magnitude varies by scenario, as shown by changes in consumption expenditure
in Table 6 and equivalent variation in Table 7. The equivalent variation is a consumption-based
measure of welfare that controls for changes in prices. The growth in consumption expenditure
under the non-tertiary labour increase scenario suggests a degree of resilience amidst the
Covid-19 shocks. This is possible because the majority of households earn more than half of
8These informal trade transactions do not go through official clearance and documentation processes required by
the customs laws.
24
their income from the ownership of land for agricultural crops, and capital for crops and
livestock (see Appendix Table A1 and Table A2) for which activities carried out are mainly
rural based and continue to operate even during Covid-19 restrictions. Additionally, the
agricultural sector which employs more than 67% of Uganda’s total labour force, acts as a
cushion to the external shocks since individuals are able to engage in agricultural activities
during the lockdown restrictions.
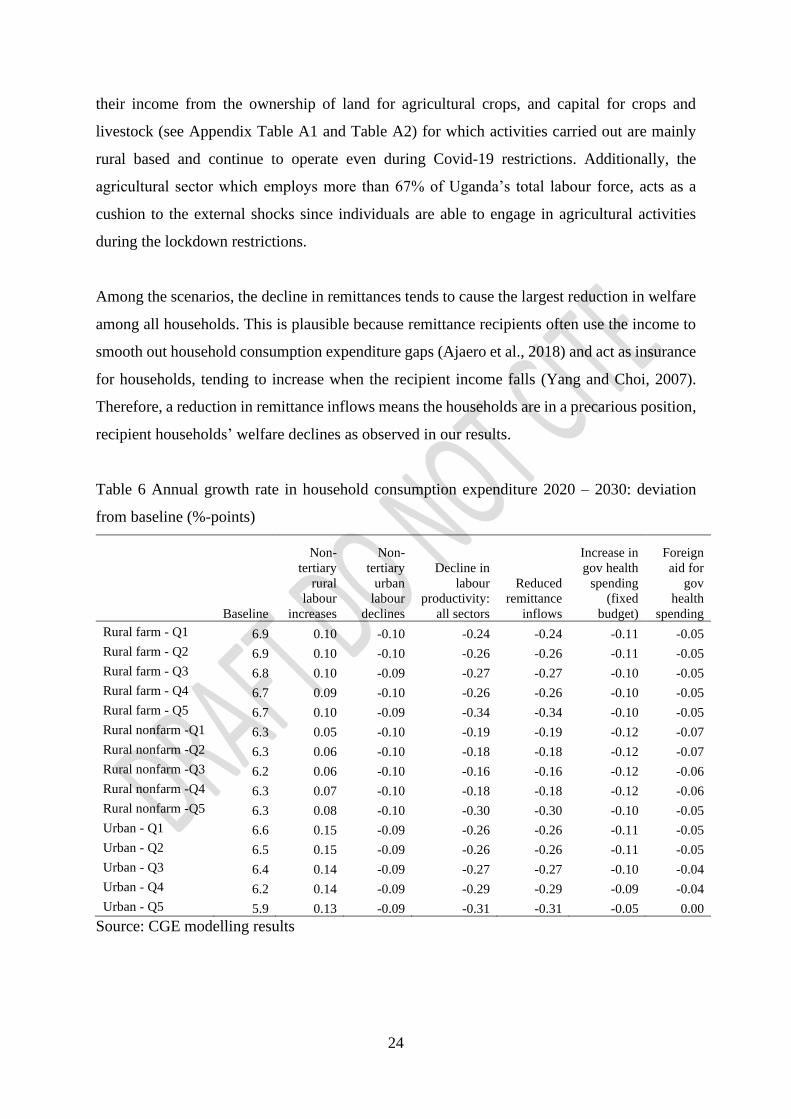
Among the scenarios, the decline in remittances tends to cause the largest reduction in welfare
among all households. This is plausible because remittance recipients often use the income to
smooth out household consumption expenditure gaps (Ajaero et al., 2018) and act as insurance
for households, tending to increase when the recipient income falls (Yang and Choi, 2007).
Therefore, a reduction in remittance inflows means the households are in a precarious position,
recipient households’ welfare declines as observed in our results.
Table 6 Annual growth rate in household consumption expenditure 2020 – 2030: deviation
from baseline (%-points)
Baseline
Non-
tertiary
rural
labour
increases
Non-
tertiary
urban
labour
declines
Decline in
labour
productivity:
all sectors
Reduced
remittance
inflows
Increase in
gov health
spending
(fixed
budget)
Foreign
aid for
gov
health
spending
Rural farm - Q1 6.9 0.10 -0.10 -0.24 -0.24 -0.11 -0.05
Rural farm - Q2 6.9 0.10 -0.10 -0.26 -0.26 -0.11 -0.05
Rural farm - Q3 6.8 0.10 -0.09 -0.27 -0.27 -0.10 -0.05
Rural farm - Q4 6.7 0.09 -0.10 -0.26 -0.26 -0.10 -0.05
Rural farm - Q5 6.7 0.10 -0.09 -0.34 -0.34 -0.10 -0.05
Rural nonfarm -Q1 6.3 0.05 -0.10 -0.19 -0.19 -0.12 -0.07
Rural nonfarm -Q2 6.3 0.06 -0.10 -0.18 -0.18 -0.12 -0.07
Rural nonfarm -Q3 6.2 0.06 -0.10 -0.16 -0.16 -0.12 -0.06
Rural nonfarm -Q4 6.3 0.07 -0.10 -0.18 -0.18 -0.12 -0.06
Rural nonfarm -Q5 6.3 0.08 -0.10 -0.30 -0.30 -0.10 -0.05
Urban - Q1 6.6 0.15 -0.09 -0.26 -0.26 -0.11 -0.05
Urban - Q2 6.5 0.15 -0.09 -0.26 -0.26 -0.11 -0.05
Urban - Q3 6.4 0.14 -0.09 -0.27 -0.27 -0.10 -0.04
Urban - Q4 6.2 0.14 -0.09 -0.29 -0.29 -0.09 -0.04
Urban - Q5 5.9 0.13 -0.09 -0.31 -0.31 -0.05 0.00
Source: CGE modelling results
25
Table 7 Disaggregated EV by household 2020 - 2030: deviation from baseline (%-age points)
Baseline
Non-
tertiary
rural
labour
increases
Non-
tertiary
urban
labour
declines
Decline in
labour
productivity:
all sectors
Reduced
remittance
inflows
Increase
in gov
health
spending
(fixed
budget)
Foreign
aid for
gov
health
spending
Rural farm - Q1 7.4 0.15 -0.13 -0.15 -0.29 -0.14 -0.06
Rural farm - Q2 7.4 0.15 -0.13 -0.15 -0.33 -0.14 -0.06
Rural farm - Q3 7.4 0.14 -0.13 -0.15 -0.36 -0.14 -0.06
Rural farm - Q4 7.5 0.13 -0.13 -0.15 -0.35 -0.14 -0.06
Rural farm - Q5 8.2 0.15 -0.15 -0.17 -0.55 -0.16 -0.07
Rural nonfarm -Q1 6.3 0.07 -0.13 -0.10 -0.20 -0.16 -0.09
Rural nonfarm -Q2 6.4 0.08 -0.13 -0.11 -0.19 -0.16 -0.09
Rural nonfarm -Q3 6.5 0.08 -0.13 -0.11 -0.16 -0.16 -0.08
Rural nonfarm -Q4 7.0 0.11 -0.14 -0.13 -0.23 -0.17 -0.08
Rural nonfarm -Q5 7.7 0.12 -0.15 -0.14 -0.48 -0.16 -0.07
Urban - Q1 7.1 0.24 -0.13 -0.14 -0.34 -0.15 -0.07
Urban - Q2 6.9 0.23 -0.12 -0.13 -0.33 -0.14 -0.06
Urban - Q3 6.9 0.22 -0.12 -0.12 -0.36 -0.13 -0.05
Urban - Q4 7.2 0.22 -0.13 -0.13 -0.41 -0.13 -0.05
Urban - Q5 7.4 0.22 -0.14 -0.13 -0.50 -0.08 0.01
Source: CGE modelling results
5. Conclusions
This study set out to evaluate the impact of Covid-19 on the Uganda economy. We designed
scenarios to mimic the performance of the economy under the Covid-19 pandemic mitigation
strategies, focussing on impact channels via labour supply, labour productivity, government
health spending and remittance inflows and employed a recursive dynamic model to predict
the impact on sector performance, international trade and welfare. We find that growth rates
in sectors output decline for many of the sectors under all scenarios except for the increase in
non-tertiary rural labour scenario. Also, the increased government health spending induces
expansion in the healthcare output but the sectors that produce the intermediate inputs for
healthcare production do not grow in tandem. This suggests the healthcare inputs are largely
imported. There is an increase export growth rates when we assume an increase in supply of
non-tertiary rural labour, suggesting that agricultural products exported to neighbouring
countries through informal channels persist even during the Covid-19 restrictions. The results
on welfare effects show that a reduction in remittance inflows is predicted to generate the most
decline in welfare.

26
These results have the following policy implications. On sector performance, they call for
policymakers to revisit Uganda’s industrial policy and reorient it towards domestic production
of commodities that are intermediate inputs to critical domestic sectors such as healthcare.
Additionally, there is a need to accelerate rural infrastructure development particularly the road
network, to facilitate an integrated rural economy induced by the shift in labour and enterprise
towards rural areas. On welfare, government should consider transfers to households to
mitigate the adverse effects of Covid-19 particularly for remittance recipient households.
27
References
Ajaero, C. K., Nzeadibe, C. T., Obisie-Nmehielle, N., et al. (2018). The linkages between
international migration, remittances and household welfare in Nigeria. Migration and
Development, 7(1), 40 - 54.
Amega, K. (2018). Remittances, education and health in Sub-Saharan Africa Cogent
Economics & Finance, 6(1), 1516488.
Ayeko-Kümmeth, J. (2014). Districts creation and its impact on local government in Uganda.
African Journal of Political Science and International Relations, 8(3), 81 - 91.
Bell, D., Hansen, K. S., Kiragga, A. N., et al. (2020). Predicting the Impact of COVID-19 and
the Potential Impact of the Public Health Response on Disease Burden in Uganda.
American Society of Tropical Medicine and Hygiene, 103(3), 1191–1197.
Berry, K., Allen, T., Horan, R. D., et al. (2018). The Economic Case for a Pandemic Fund.
EcoHealth, 15, 244–258.
Beutels, P., Edmunds, J. W., Smith, R. D. (2008). Partially Wrong? Partial Equilibrium and
the Economic Analysis of Public Health Emergencies of International Concern. Health
Economics, 17, 1317-1322.
Calderón, C., Servén, L. (2004). The Effects of Infrastructure Development on Growth and
Income Distribution. In Policy Research Working Paper; No.3400. Washington, D.C.:
World Bank.
Cooper, B., Esser, A., Peter, R. T., et al. (2018). Exploring barriers to remittances in Sub-
Saharan Africa: Remittances in Uganda. In. South Africa: Centre for Financial
Regulation & Inclusion.
Doyle, D. (2015). Remittances and Social Spending. American Political Science Review,
109(4), 785 - 802.
Kabajulizi, J. (2016). Macroeconomic implications of healthcare financing reforms: a
computable general equilibrium analysis of Uganda. (PhD), University of London,
London, UK.
Keogh-Brown, M. R., Smith, R. D., Edmunds, J. W., et al. (2010). The macroeconomic impact
of pandemic influenza: estimates from models of the United Kingdom, France, Belgium
and The Netherlands. European Journal of Health Economics, 11, 543–554.
Kermack, W., McKendrick, A. G. (1927). A contribution to the mathematical theory of
epidemics. Proc. R. Soc. Lond. 115, 700–721 (1927). Proceedings of the Royal Society
28
of London. Series A, Containing Papers of a Mathematical and Physical Character,
115(772), 700 - 721.
Lakuma, C. P., Sunday, N., Sserunjogi, B., et al. (2020). How has the COVID-19 pandemic
impacted Ugandan businesses? Results from a business climate survey. In The Uganda
Business Climate Index: Special Issue No. 01 May, 2020. Kampala, Uganda: Economic
Policy Research Centre.
Lemelin, A., Fofana, I., Cockburn, J. (2013). Balancing a Social Accounting Matrix: Theory
and application (revised edition). In: Partnership for Economic Policy (PEP).
Mahmuda, M., Riley, E. (2021). Household response to an extreme shock: Evidence on the
immediate impact of the Covid-19 lockdown on economic outcomes and well-being in
rural Uganda. World Development, 140, 105318.
Medina, C., Cardona, L. (2010). The Effects of Remittances on Household Consumption,
Education Attendance and Living Standards: the Case of Colombia. Lecturas de
Economía, 72, 11-43.
Melo, P. C., Graham, D. J., Brage-Ardao, R. (2013). The productivity of transport
infrastructure investment: A meta-analysis of empirical evidence Regional Science and
Urban Economics, 43, 695 - 706.
Meltzer, M. I., Cox, N. J., Fukuda, K. (1999). The economic impact of pandemic influenza in
the United States: Priorities for intervention. Emerging Infectious Diseases, 5(5), 659–
671.
Ministry of Works and Transport (Uganda). (2018). Annual Sector Performance Report FY
2017/18. In. Kampala, Uganda: Ministry of Works and Transport, The Republic of
Uganda.
Mukoki, J., Candia, D. A., Ssebulime, K., et al. (2020). Female Labor Force Participation under
COVID-19 Pandemic: Evidence from the first round of the Uganda High-frequency
Phone Survey on COVID-19 In: Research Square.
Randriamamonjy, J., Thurlow, J. (2016). 2013 Social Accounting Matrix for Uganda: A Nexus
Project SAM. In. Washington DC: International Food Policy Research Institute
(IFPRI).
Sander, B., Nizam, A., Jr., L. P. G., et al. (2009). Economic evaluation of influenza pandemic
mitigation strategies in the United States using a stochastic microsimulation
transmission model Value Health, 12(2), 226 - 233.
Smith, R. D., Keogh-Brown, M. R. (2013). Macroeconomic impact of a mild influenza
pandemic and associated policies in Thailand, South Africa and Uganda: a computable
29
general equilibrium analysis. Influenza and Other Respiratory Viruses, 7(6), 1400-
1408.
Smith, R. D., Keogh-Brown, M. R., Barnett, T. (2011). Estimating the economic impact of
pandemic influenza: An application of the general equilibrium model to the UK. Social
Science & Medicine, 73, 235 - 244.
Smith, R. D., Keogh-Brown, M. R., Barnett, T., et al. (2009). The economy-wide impact of
pandemic influenza on the UK: a computable general equilibrium modelling
experiment. British Medical Journal, Clinical research ed(1), 339. b4571.
Uganda Bureau of Statistics. (2020). Statistical Abstract 2020. Kampala, Uganda: Republic of
Uganda
UNIDO. (2010). Pharmaceutical Sector Profile: Uganda. In. Vienna: United Nations Industrial
Development Organization (UNIDO).
Verikios, G., McCaw, J., McVernon, J., et al. (2010). H1N1 Influenza in Australia and its
Macroeconomic Effects. In. Australia: Centre of Policy Studies (COPS), Monash
University, Australia.
Wang, Y., Wang, Y., Chen, Y., et al. (2020). Unique epidemiological and clinical features of
the emerging 2019 novel coronavirus pneumonia (COVID-19) implicate special control
measures. Journal of Medical Virology, 92, 568 - 576.
World Bank. (2020). Phase II: COVID-19 Crisis through a Migration Lens. In Migration and
Development Brief 33. Washington DC: The World Bank.
World Bank. (2021). Accumulation interrupted? Covid-19 and human capital. In The Human
Capital Index 2020 update: Human Capital in the Time of COVID-19 Washington DC:
The World Bank.
World Health Organization. (2008). International Health Regulations (2005). Second Edition.
Geneva: World Health Organization.
Wu, Z., McGoogan, J. M. (2020). Characteristics of and important lessons from the
coronavirus disease 2019 (COVID-19) outbreak in China: summary of a report of
72,314 cases from the Chinese center for disease control and prevention. American
Medical Association, 323, 1239 - 1242.
Yang, D., Choi, H. J. (2007). Are remittances insurance? Evidence from rainfall shocks in the
Philippines World Bank Economic Review, 21(2), 219-248.
30
Appendix
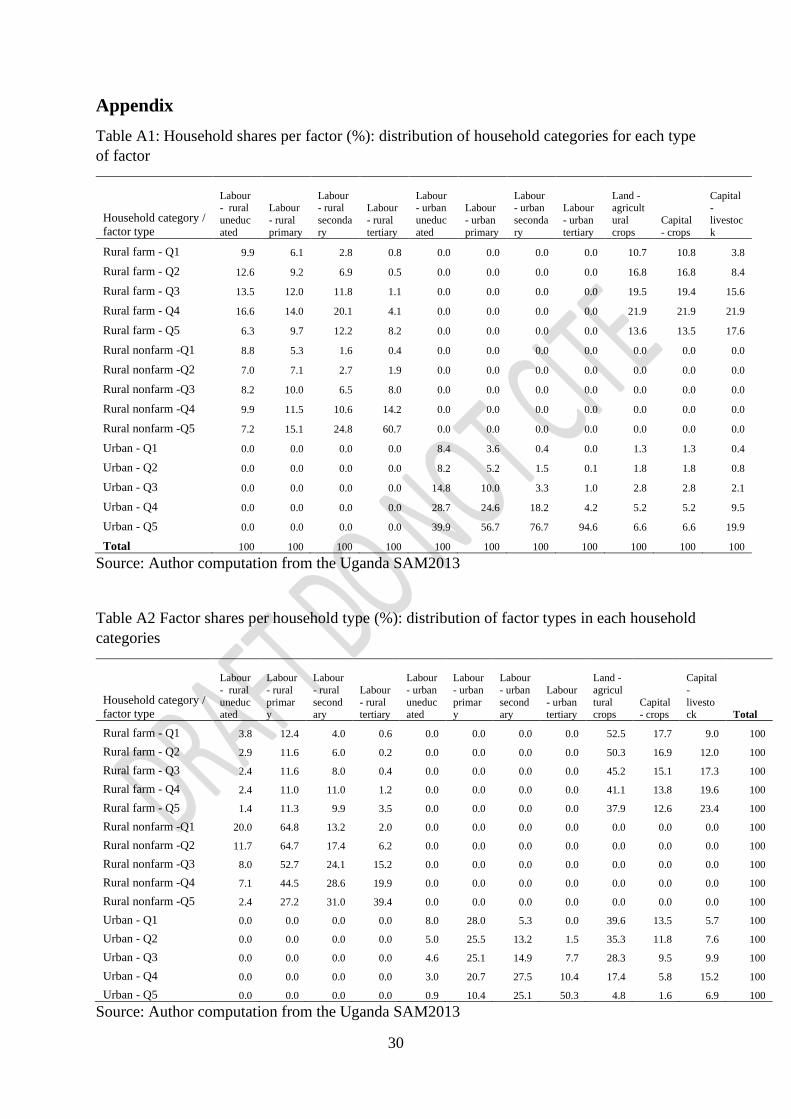
Table A1: Household shares per factor (%): distribution of household categories for each type
of factor
Household category /
factor type
Labour - rural
uneduc
ated
Labour
- rural
primary
Labour - rural
seconda
ry
Labour
- rural
tertiary
Labour - urban
uneduc
ated
Labour
- urban
primary
Labour - urban
seconda
ry
Labour
- urban
tertiary
Land - agricult
ural
crops
Capital
- crops
Capital -
livestoc
k
Rural farm - Q1 9.9 6.1 2.8 0.8 0.0 0.0 0.0 0.0 10.7 10.8 3.8
Rural farm - Q2 12.6 9.2 6.9 0.5 0.0 0.0 0.0 0.0 16.8 16.8 8.4
Rural farm - Q3 13.5 12.0 11.8 1.1 0.0 0.0 0.0 0.0 19.5 19.4 15.6
Rural farm - Q4 16.6 14.0 20.1 4.1 0.0 0.0 0.0 0.0 21.9 21.9 21.9
Rural farm - Q5 6.3 9.7 12.2 8.2 0.0 0.0 0.0 0.0 13.6 13.5 17.6
Rural nonfarm -Q1 8.8 5.3 1.6 0.4 0.0 0.0 0.0 0.0 0.0 0.0 0.0
Rural nonfarm -Q2 7.0 7.1 2.7 1.9 0.0 0.0 0.0 0.0 0.0 0.0 0.0
Rural nonfarm -Q3 8.2 10.0 6.5 8.0 0.0 0.0 0.0 0.0 0.0 0.0 0.0
Rural nonfarm -Q4 9.9 11.5 10.6 14.2 0.0 0.0 0.0 0.0 0.0 0.0 0.0
Rural nonfarm -Q5 7.2 15.1 24.8 60.7 0.0 0.0 0.0 0.0 0.0 0.0 0.0
Urban - Q1 0.0 0.0 0.0 0.0 8.4 3.6 0.4 0.0 1.3 1.3 0.4
Urban - Q2 0.0 0.0 0.0 0.0 8.2 5.2 1.5 0.1 1.8 1.8 0.8
Urban - Q3 0.0 0.0 0.0 0.0 14.8 10.0 3.3 1.0 2.8 2.8 2.1
Urban - Q4 0.0 0.0 0.0 0.0 28.7 24.6 18.2 4.2 5.2 5.2 9.5
Urban - Q5 0.0 0.0 0.0 0.0 39.9 56.7 76.7 94.6 6.6 6.6 19.9
Total 100 100 100 100 100 100 100 100 100 100 100
Source: Author computation from the Uganda SAM2013
Table A2 Factor shares per household type (%): distribution of factor types in each household
categories
Household category /
factor type
Labour
- rural
uneducated
Labour
- rural
primary
Labour
- rural
secondary
Labour
- rural tertiary
Labour
- urban
uneducated
Labour
- urban
primary
Labour
- urban
secondary
Labour
- urban tertiary
Land -
agricul
tural crops
Capital - crops
Capital
-
livestock Total
Rural farm - Q1 3.8 12.4 4.0 0.6 0.0 0.0 0.0 0.0 52.5 17.7 9.0 100
Rural farm - Q2 2.9 11.6 6.0 0.2 0.0 0.0 0.0 0.0 50.3 16.9 12.0 100
Rural farm - Q3 2.4 11.6 8.0 0.4 0.0 0.0 0.0 0.0 45.2 15.1 17.3 100
Rural farm - Q4 2.4 11.0 11.0 1.2 0.0 0.0 0.0 0.0 41.1 13.8 19.6 100
Rural farm - Q5 1.4 11.3 9.9 3.5 0.0 0.0 0.0 0.0 37.9 12.6 23.4 100
Rural nonfarm -Q1 20.0 64.8 13.2 2.0 0.0 0.0 0.0 0.0 0.0 0.0 0.0 100
Rural nonfarm -Q2 11.7 64.7 17.4 6.2 0.0 0.0 0.0 0.0 0.0 0.0 0.0 100
Rural nonfarm -Q3 8.0 52.7 24.1 15.2 0.0 0.0 0.0 0.0 0.0 0.0 0.0 100
Rural nonfarm -Q4 7.1 44.5 28.6 19.9 0.0 0.0 0.0 0.0 0.0 0.0 0.0 100
Rural nonfarm -Q5 2.4 27.2 31.0 39.4 0.0 0.0 0.0 0.0 0.0 0.0 0.0 100
Urban - Q1 0.0 0.0 0.0 0.0 8.0 28.0 5.3 0.0 39.6 13.5 5.7 100
Urban - Q2 0.0 0.0 0.0 0.0 5.0 25.5 13.2 1.5 35.3 11.8 7.6 100
Urban - Q3 0.0 0.0 0.0 0.0 4.6 25.1 14.9 7.7 28.3 9.5 9.9 100
Urban - Q4 0.0 0.0 0.0 0.0 3.0 20.7 27.5 10.4 17.4 5.8 15.2 100
Urban - Q5 0.0 0.0 0.0 0.0 0.9 10.4 25.1 50.3 4.8 1.6 6.9 100
Source: Author computation from the Uganda SAM2013
31
Table A3 Household expenditure shares by commodity
Rural
farm -
Q1
Rural
farm -
Q2
Rural
farm -
Q3
Rural
farm -
Q4
Rural
farm -
Q5
Rural
nonfarm
-Q1
Rural
nonfarm
-Q2
Rural
nonfarm
-Q3
Rural
nonfarm
-Q4
Rural
nonfarm
-Q5
Urban -
Q1
Urban -
Q2
Urban -
Q3
Urban -
Q4
Urban -
Q5
Agriculture 14.1 12.7 11.5 11.0 7.8 17.9 16.1 14.6 13.5 9.8 16.3 15.3 15.6 14.0 10.4
Forestry 2.3 2.6 2.7 2.0 1.5 2.1 3.9 4.0 3.8 2.4 3.5 4.4 7.4 6.2 3.5
Fishing 1.6 1.7 2.0 1.3 1.2 1.3 1.5 1.5 2.4 1.1 1.4 0.6 1.4 1.4 0.8
Meat, fish and dairy 10.2 9.1 7.8 6.1 3.3 8.2 8.9 8.8 7.3 5.1 6.5 11.1 8.4 6.3 3.6
Fruit and veg
processing 2.8 2.5 1.8 1.8 0.9 1.8 1.8 2.0 1.5 0.9 2.8 2.1 2.1 1.6 0.8
Fats and oils 3.4 3.1 2.2 2.2 1.1 2.2 2.2 2.5 1.9 1.1 3.5 2.6 2.6 2.0 1.0
Grain milling 11.6 7.4 6.4 6.5 3.3 13.5 10.5 8.2 4.7 2.4 7.5 8.5 8.9 5.8 1.7
Sugar refining 3.2 4.6 3.8 3.0 1.7 3.1 4.0 4.1 3.3 1.8 3.2 3.7 4.4 3.1 1.6
Other foods 1.1 1.1 1.4 1.3 1.3 1.3 2.2 2.1 2.7 3.0 2.3 1.7 1.6 3.2 4.7
Beverages 3.4 4.7 4.5 4.4 6.0 8.6 4.5 3.8 4.4 4.8 3.8 2.9 2.3 2.9 3.8
Other manufacturing 12.5 12.3 11.6 12.8 11.0 11.0 11.1 10.0 9.3 11.1 10.3 10.4 8.5 8.3 10.1
Chemicals 12.8 12.2 10.9 9.2 6.8 10.8 10.1 9.8 8.1 7.7 12.3 8.3 7.7 6.0 6.4
Machinery and
equipment 0.5 0.5 0.9 1.8 2.9 0.3 0.7 0.9 1.2 3.4 0.7 0.6 0.6 0.9 3.4
Utilities 1.8 0.7 1.3 1.0 0.8 1.5 1.0 1.9 3.7 3.0 3.2 4.1 5.4 5.9 6.0
Wholesale and retail
trade 0.1 0.1 0.2 0.5 1.9 0.1 0.2 0.1 0.5 0.6 0.0 0.1 0.2 0.1 0.5
Transport and storage 2.6 3.8 4.6 5.2 5.0 2.1 4.2 5.3 5.4 5.9 3.2 3.8 4.0 4.8 6.4
Other private services 2.8 5.0 6.9 6.8 12.5 2.7 4.0 4.7 7.8 14.9 4.1 4.6 6.4 8.5 16.7
Education 7.9 8.5 10.1 10.9 8.1 5.1 6.8 7.5 9.0 9.1 8.8 9.7 6.8 12.0 10.1
Health and social
work 5.0 6.2 7.4 8.2 7.5 6.4 6.0 7.1 7.2 7.3 6.6 5.6 5.2 5.6 5.6
Other services 0.3 1.2 2.0 3.9 15.6 0.0 0.4 0.9 2.4 4.5 0.0 0.0 0.7 1.6 2.9
Total 100 100 100 100 100 100 100 100 100 100 100 100 100 100 100
Source: Author computation from the Uganda SAM2013
32
Table A4 Annual growth rate in quantity demanded of labour by sector 2019 -2030: deviation from baseline (%-point)
Baseline
Non-
tertiary
rural
labour
increases
Non-
tertiary
urban
labour
declines
Decline in
labour
productivity:
all sectors
Reduced
remittance
inflows
Increase in
gov health
spending
(fixed
budget)
Foreign
aid for
gov
health
spending
Labour - rural
uneducated Agriculture 3.9 0.91 0.01 0.00 -0.10 0.04 0.03
Forestry 5.3 0.94 -0.01 -0.03 -0.09 -0.07 -0.04
Fishing 3.0 0.88 0.02 0.02 -0.06 0.06 0.04
Other mining 6.3 0.83 0.00 -0.02 0.00 -0.15 -0.13
Meat, fish and dairy -0.3 0.80 0.09 0.08 0.16 0.11 0.06
Fruit and vegetable processing 2.3 0.81 0.03 0.05 -0.03 0.06 0.05
Fats and oils 1.7 0.81 0.05 0.05 0.03 0.08 0.06
Grain milling 1.9 0.80 0.03 0.07 -0.01 0.05 0.03
Sugar refining 0.9 0.86 0.07 0.05 0.08 0.07 0.03
Other foods 2.9 0.89 0.03 0.03 -0.07 0.06 0.05
Beverages 4.1 0.89 0.02 0.00 -0.09 0.04 0.03
Other manufacturing 5.5 1.09 0.02 -0.10 0.16 -0.06 -0.06
Chemicals 4.9 0.92 0.03 -0.06 -0.06 0.05 0.03
Machinery and equipment 38.3 1.18 -0.49 0.10 1.18 -0.48 -0.33
Construction 4.9 0.91 -0.01 -0.01 -0.04 -0.19 -0.12
Wholesale and retail trade -1.8 0.77 0.09 0.07 0.11 0.10 0.04
Transport and storage 3.3 0.92 0.03 -0.03 -0.03 0.07 0.05
Other private services 3.4 0.90 0.03 -0.03 0.01 0.05 0.03
Public administration 0.4 0.77 0.05 0.19 0.03 0.61 0.58
Education 3.6 0.88 0.00 0.04 -0.15 0.11 0.11
Other services 4.3 0.91 -0.01 0.01 -0.12 0.01 0.02
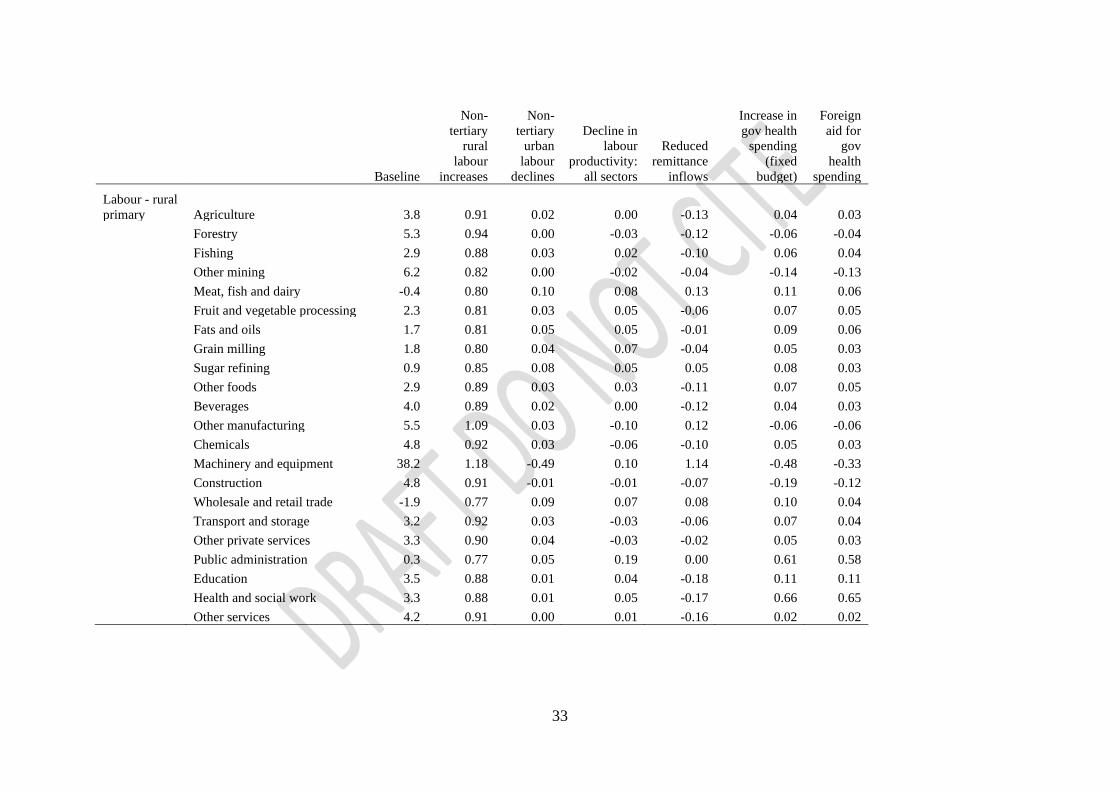
33
Baseline
Non-
tertiary
rural
labour
increases
Non-
tertiary
urban
labour
declines
Decline in
labour
productivity:
all sectors
Reduced
remittance
inflows
Increase in
gov health
spending
(fixed
budget)
Foreign
aid for
gov
health
spending
Labour - rural
primary Agriculture 3.8 0.91 0.02 0.00 -0.13 0.04 0.03
Forestry 5.3 0.94 0.00 -0.03 -0.12 -0.06 -0.04
Fishing 2.9 0.88 0.03 0.02 -0.10 0.06 0.04
Other mining 6.2 0.82 0.00 -0.02 -0.04 -0.14 -0.13
Meat, fish and dairy -0.4 0.80 0.10 0.08 0.13 0.11 0.06
Fruit and vegetable processing 2.3 0.81 0.03 0.05 -0.06 0.07 0.05
Fats and oils 1.7 0.81 0.05 0.05 -0.01 0.09 0.06
Grain milling 1.8 0.80 0.04 0.07 -0.04 0.05 0.03
Sugar refining 0.9 0.85 0.08 0.05 0.05 0.08 0.03
Other foods 2.9 0.89 0.03 0.03 -0.11 0.07 0.05
Beverages 4.0 0.89 0.02 0.00 -0.12 0.04 0.03
Other manufacturing 5.5 1.09 0.03 -0.10 0.12 -0.06 -0.06
Chemicals 4.8 0.92 0.03 -0.06 -0.10 0.05 0.03
Machinery and equipment 38.2 1.18 -0.49 0.10 1.14 -0.48 -0.33
Construction 4.8 0.91 -0.01 -0.01 -0.07 -0.19 -0.12
Wholesale and retail trade -1.9 0.77 0.09 0.07 0.08 0.10 0.04
Transport and storage 3.2 0.92 0.03 -0.03 -0.06 0.07 0.04
Other private services 3.3 0.90 0.04 -0.03 -0.02 0.05 0.03
Public administration 0.3 0.77 0.05 0.19 0.00 0.61 0.58
Education 3.5 0.88 0.01 0.04 -0.18 0.11 0.11
Health and social work 3.3 0.88 0.01 0.05 -0.17 0.66 0.65
Other services 4.2 0.91 0.00 0.01 -0.16 0.02 0.02
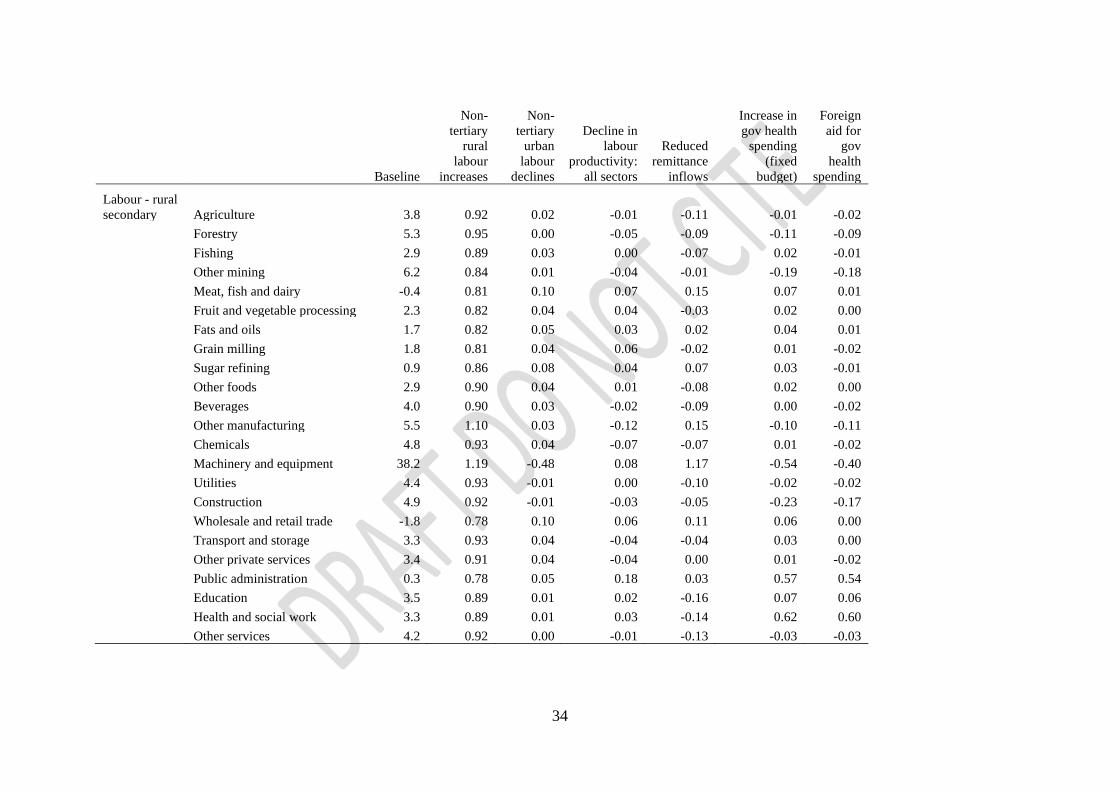
34
Baseline
Non-
tertiary
rural
labour
increases
Non-
tertiary
urban
labour
declines
Decline in
labour
productivity:
all sectors
Reduced
remittance
inflows
Increase in
gov health
spending
(fixed
budget)
Foreign
aid for
gov
health
spending
Labour - rural
secondary Agriculture 3.8 0.92 0.02 -0.01 -0.11 -0.01 -0.02
Forestry 5.3 0.95 0.00 -0.05 -0.09 -0.11 -0.09
Fishing 2.9 0.89 0.03 0.00 -0.07 0.02 -0.01
Other mining 6.2 0.84 0.01 -0.04 -0.01 -0.19 -0.18
Meat, fish and dairy -0.4 0.81 0.10 0.07 0.15 0.07 0.01
Fruit and vegetable processing 2.3 0.82 0.04 0.04 -0.03 0.02 0.00
Fats and oils 1.7 0.82 0.05 0.03 0.02 0.04 0.01
Grain milling 1.8 0.81 0.04 0.06 -0.02 0.01 -0.02
Sugar refining 0.9 0.86 0.08 0.04 0.07 0.03 -0.01
Other foods 2.9 0.90 0.04 0.01 -0.08 0.02 0.00
Beverages 4.0 0.90 0.03 -0.02 -0.09 0.00 -0.02
Other manufacturing 5.5 1.10 0.03 -0.12 0.15 -0.10 -0.11
Chemicals 4.8 0.93 0.04 -0.07 -0.07 0.01 -0.02
Machinery and equipment 38.2 1.19 -0.48 0.08 1.17 -0.54 -0.40
Utilities 4.4 0.93 -0.01 0.00 -0.10 -0.02 -0.02
Construction 4.9 0.92 -0.01 -0.03 -0.05 -0.23 -0.17
Wholesale and retail trade -1.8 0.78 0.10 0.06 0.11 0.06 0.00
Transport and storage 3.3 0.93 0.04 -0.04 -0.04 0.03 0.00
Other private services 3.4 0.91 0.04 -0.04 0.00 0.01 -0.02
Public administration 0.3 0.78 0.05 0.18 0.03 0.57 0.54
Education 3.5 0.89 0.01 0.02 -0.16 0.07 0.06
Health and social work 3.3 0.89 0.01 0.03 -0.14 0.62 0.60
Other services 4.2 0.92 0.00 -0.01 -0.13 -0.03 -0.03
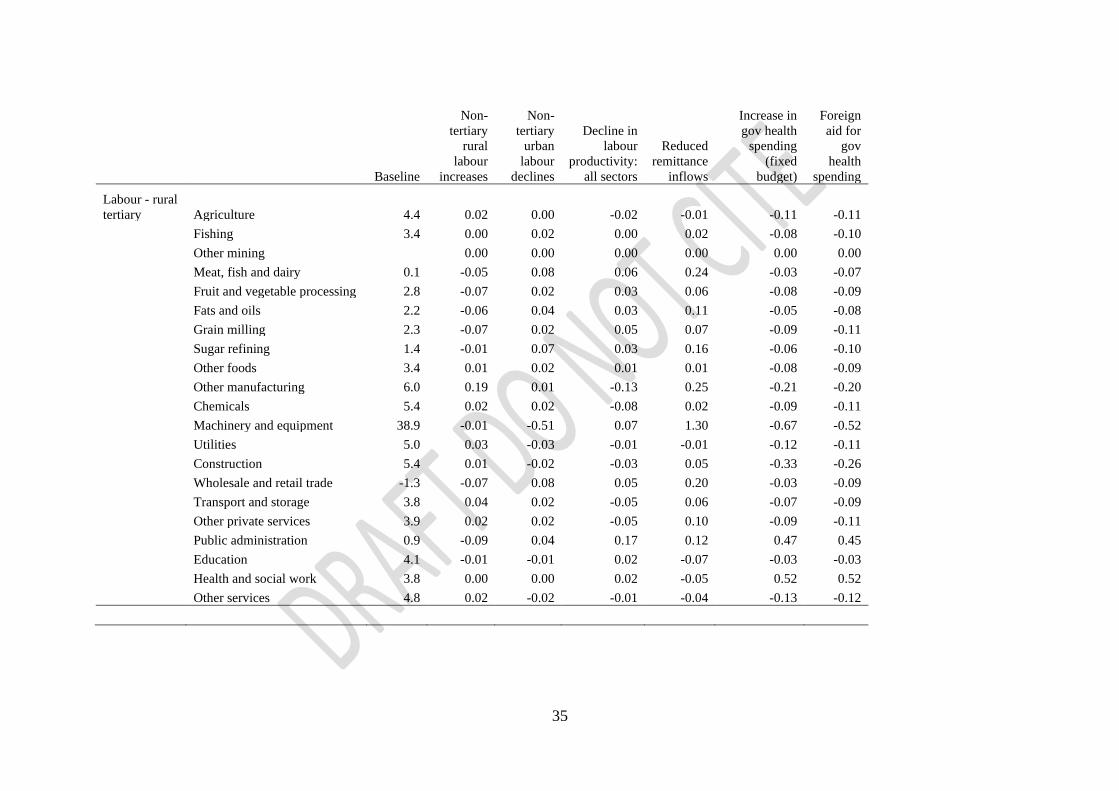
35
Baseline
Non-
tertiary
rural
labour
increases
Non-
tertiary
urban
labour
declines
Decline in
labour
productivity:
all sectors
Reduced
remittance
inflows
Increase in
gov health
spending
(fixed
budget)
Foreign
aid for
gov
health
spending
Labour - rural
tertiary Agriculture 4.4 0.02 0.00 -0.02 -0.01 -0.11 -0.11
Fishing 3.4 0.00 0.02 0.00 0.02 -0.08 -0.10
Other mining 0.00 0.00 0.00 0.00 0.00 0.00
Meat, fish and dairy 0.1 -0.05 0.08 0.06 0.24 -0.03 -0.07
Fruit and vegetable processing 2.8 -0.07 0.02 0.03 0.06 -0.08 -0.09
Fats and oils 2.2 -0.06 0.04 0.03 0.11 -0.05 -0.08
Grain milling 2.3 -0.07 0.02 0.05 0.07 -0.09 -0.11
Sugar refining 1.4 -0.01 0.07 0.03 0.16 -0.06 -0.10
Other foods 3.4 0.01 0.02 0.01 0.01 -0.08 -0.09
Other manufacturing 6.0 0.19 0.01 -0.13 0.25 -0.21 -0.20
Chemicals 5.4 0.02 0.02 -0.08 0.02 -0.09 -0.11
Machinery and equipment 38.9 -0.01 -0.51 0.07 1.30 -0.67 -0.52
Utilities 5.0 0.03 -0.03 -0.01 -0.01 -0.12 -0.11
Construction 5.4 0.01 -0.02 -0.03 0.05 -0.33 -0.26
Wholesale and retail trade -1.3 -0.07 0.08 0.05 0.20 -0.03 -0.09
Transport and storage 3.8 0.04 0.02 -0.05 0.06 -0.07 -0.09
Other private services 3.9 0.02 0.02 -0.05 0.10 -0.09 -0.11
Public administration 0.9 -0.09 0.04 0.17 0.12 0.47 0.45
Education 4.1 -0.01 -0.01 0.02 -0.07 -0.03 -0.03
Health and social work 3.8 0.00 0.00 0.02 -0.05 0.52 0.52
Other services 4.8 0.02 -0.02 -0.01 -0.04 -0.13 -0.12
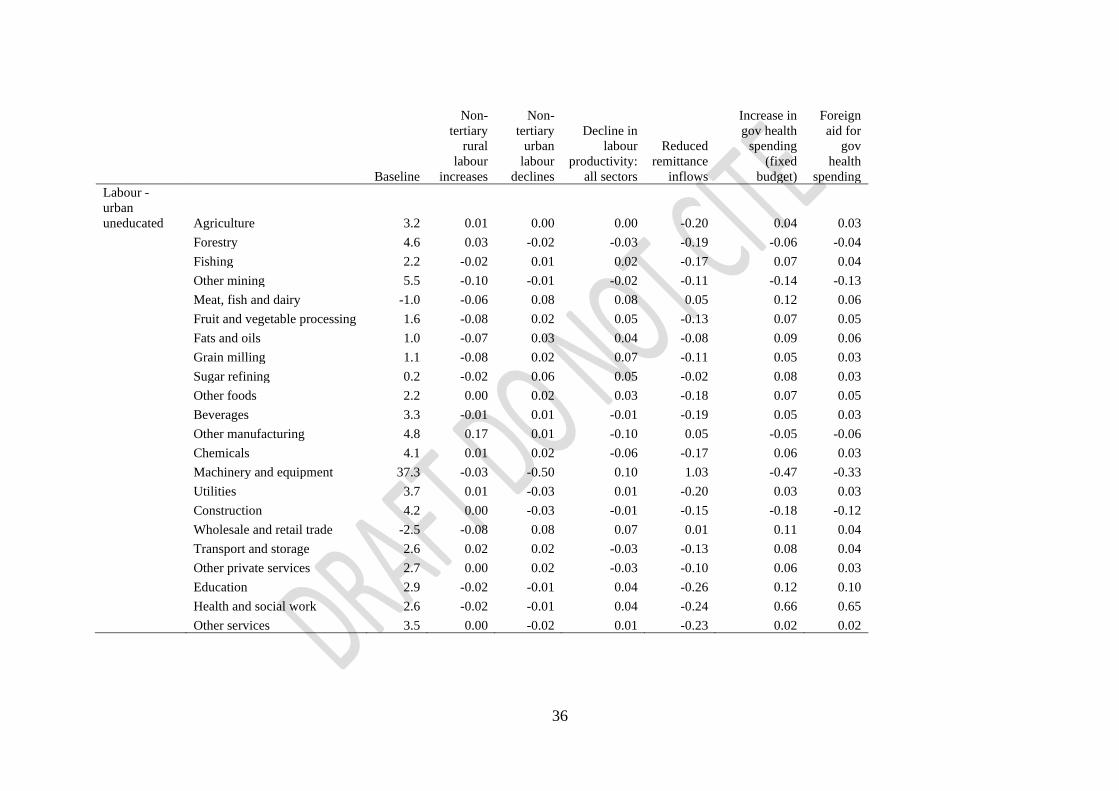
36
Baseline
Non-
tertiary
rural
labour
increases
Non-
tertiary
urban
labour
declines
Decline in
labour
productivity:
all sectors
Reduced
remittance
inflows
Increase in
gov health
spending
(fixed
budget)
Foreign
aid for
gov
health
spending
Labour -
urban
uneducated Agriculture 3.2 0.01 0.00 0.00 -0.20 0.04 0.03
Forestry 4.6 0.03 -0.02 -0.03 -0.19 -0.06 -0.04
Fishing 2.2 -0.02 0.01 0.02 -0.17 0.07 0.04
Other mining 5.5 -0.10 -0.01 -0.02 -0.11 -0.14 -0.13
Meat, fish and dairy -1.0 -0.06 0.08 0.08 0.05 0.12 0.06
Fruit and vegetable processing 1.6 -0.08 0.02 0.05 -0.13 0.07 0.05
Fats and oils 1.0 -0.07 0.03 0.04 -0.08 0.09 0.06
Grain milling 1.1 -0.08 0.02 0.07 -0.11 0.05 0.03
Sugar refining 0.2 -0.02 0.06 0.05 -0.02 0.08 0.03
Other foods 2.2 0.00 0.02 0.03 -0.18 0.07 0.05
Beverages 3.3 -0.01 0.01 -0.01 -0.19 0.05 0.03
Other manufacturing 4.8 0.17 0.01 -0.10 0.05 -0.05 -0.06
Chemicals 4.1 0.01 0.02 -0.06 -0.17 0.06 0.03
Machinery and equipment 37.3 -0.03 -0.50 0.10 1.03 -0.47 -0.33
Utilities 3.7 0.01 -0.03 0.01 -0.20 0.03 0.03
Construction 4.2 0.00 -0.03 -0.01 -0.15 -0.18 -0.12
Wholesale and retail trade -2.5 -0.08 0.08 0.07 0.01 0.11 0.04
Transport and storage 2.6 0.02 0.02 -0.03 -0.13 0.08 0.04
Other private services 2.7 0.00 0.02 -0.03 -0.10 0.06 0.03
Education 2.9 -0.02 -0.01 0.04 -0.26 0.12 0.10
Health and social work 2.6 -0.02 -0.01 0.04 -0.24 0.66 0.65
Other services 3.5 0.00 -0.02 0.01 -0.23 0.02 0.02
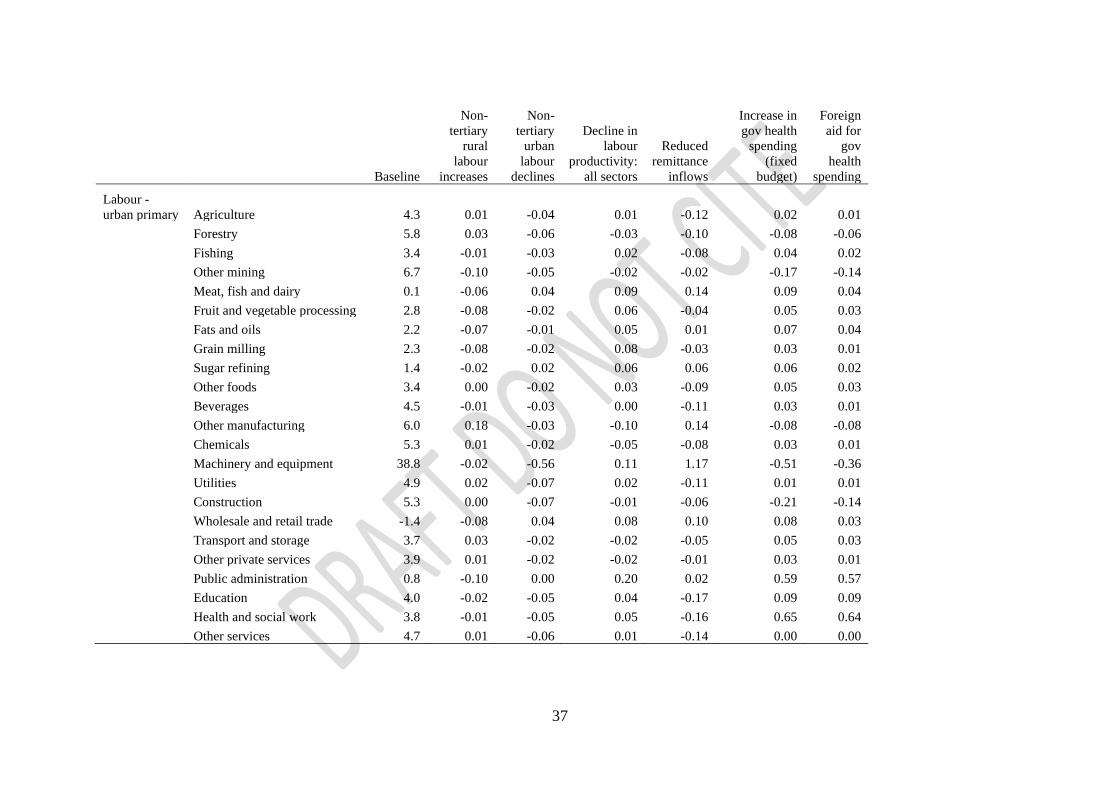
37
Baseline
Non-
tertiary
rural
labour
increases
Non-
tertiary
urban
labour
declines
Decline in
labour
productivity:
all sectors
Reduced
remittance
inflows
Increase in
gov health
spending
(fixed
budget)
Foreign
aid for
gov
health
spending
Labour -
urban primary Agriculture 4.3 0.01 -0.04 0.01 -0.12 0.02 0.01
Forestry 5.8 0.03 -0.06 -0.03 -0.10 -0.08 -0.06
Fishing 3.4 -0.01 -0.03 0.02 -0.08 0.04 0.02
Other mining 6.7 -0.10 -0.05 -0.02 -0.02 -0.17 -0.14
Meat, fish and dairy 0.1 -0.06 0.04 0.09 0.14 0.09 0.04
Fruit and vegetable processing 2.8 -0.08 -0.02 0.06 -0.04 0.05 0.03
Fats and oils 2.2 -0.07 -0.01 0.05 0.01 0.07 0.04
Grain milling 2.3 -0.08 -0.02 0.08 -0.03 0.03 0.01
Sugar refining 1.4 -0.02 0.02 0.06 0.06 0.06 0.02
Other foods 3.4 0.00 -0.02 0.03 -0.09 0.05 0.03
Beverages 4.5 -0.01 -0.03 0.00 -0.11 0.03 0.01
Other manufacturing 6.0 0.18 -0.03 -0.10 0.14 -0.08 -0.08
Chemicals 5.3 0.01 -0.02 -0.05 -0.08 0.03 0.01
Machinery and equipment 38.8 -0.02 -0.56 0.11 1.17 -0.51 -0.36
Utilities 4.9 0.02 -0.07 0.02 -0.11 0.01 0.01
Construction 5.3 0.00 -0.07 -0.01 -0.06 -0.21 -0.14
Wholesale and retail trade -1.4 -0.08 0.04 0.08 0.10 0.08 0.03
Transport and storage 3.7 0.03 -0.02 -0.02 -0.05 0.05 0.03
Other private services 3.9 0.01 -0.02 -0.02 -0.01 0.03 0.01
Public administration 0.8 -0.10 0.00 0.20 0.02 0.59 0.57
Education 4.0 -0.02 -0.05 0.04 -0.17 0.09 0.09
Health and social work 3.8 -0.01 -0.05 0.05 -0.16 0.65 0.64
Other services 4.7 0.01 -0.06 0.01 -0.14 0.00 0.00
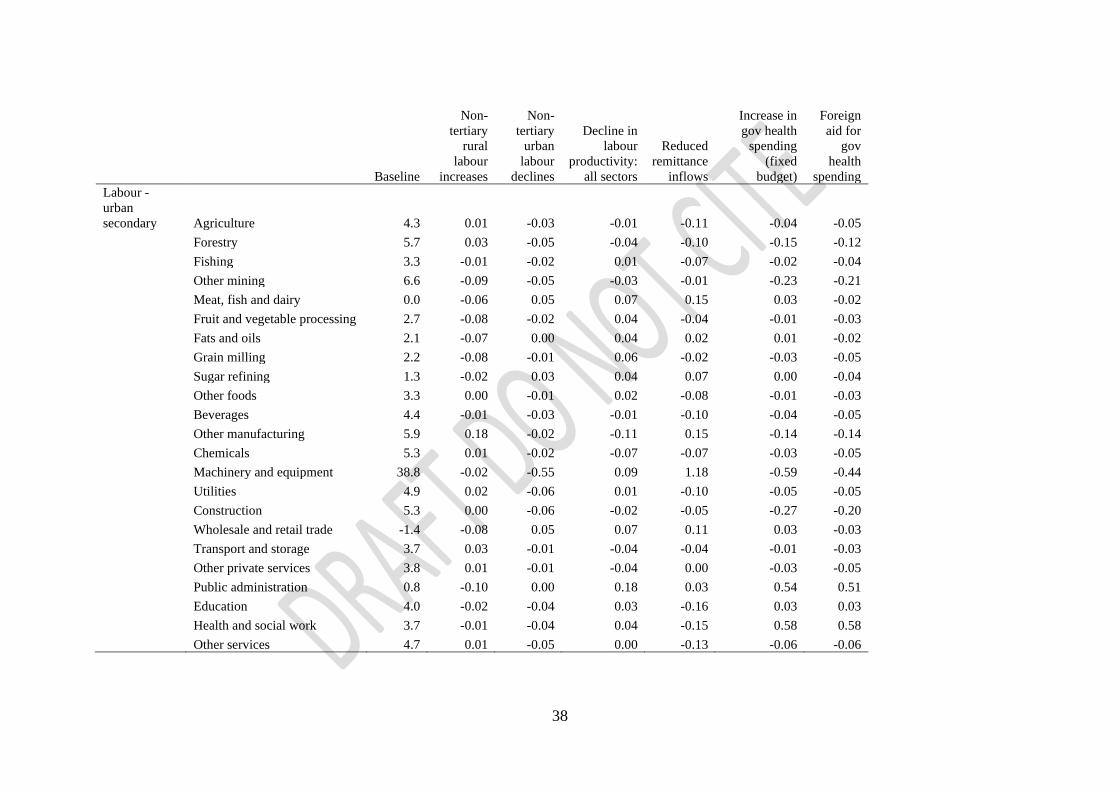
38
Baseline
Non-
tertiary
rural
labour
increases
Non-
tertiary
urban
labour
declines
Decline in
labour
productivity:
all sectors
Reduced
remittance
inflows
Increase in
gov health
spending
(fixed
budget)
Foreign
aid for
gov
health
spending
Labour -
urban
secondary Agriculture 4.3 0.01 -0.03 -0.01 -0.11 -0.04 -0.05
Forestry 5.7 0.03 -0.05 -0.04 -0.10 -0.15 -0.12
Fishing 3.3 -0.01 -0.02 0.01 -0.07 -0.02 -0.04
Other mining 6.6 -0.09 -0.05 -0.03 -0.01 -0.23 -0.21
Meat, fish and dairy 0.0 -0.06 0.05 0.07 0.15 0.03 -0.02
Fruit and vegetable processing 2.7 -0.08 -0.02 0.04 -0.04 -0.01 -0.03
Fats and oils 2.1 -0.07 0.00 0.04 0.02 0.01 -0.02
Grain milling 2.2 -0.08 -0.01 0.06 -0.02 -0.03 -0.05
Sugar refining 1.3 -0.02 0.03 0.04 0.07 0.00 -0.04
Other foods 3.3 0.00 -0.01 0.02 -0.08 -0.01 -0.03
Beverages 4.4 -0.01 -0.03 -0.01 -0.10 -0.04 -0.05
Other manufacturing 5.9 0.18 -0.02 -0.11 0.15 -0.14 -0.14
Chemicals 5.3 0.01 -0.02 -0.07 -0.07 -0.03 -0.05
Machinery and equipment 38.8 -0.02 -0.55 0.09 1.18 -0.59 -0.44
Utilities 4.9 0.02 -0.06 0.01 -0.10 -0.05 -0.05
Construction 5.3 0.00 -0.06 -0.02 -0.05 -0.27 -0.20
Wholesale and retail trade -1.4 -0.08 0.05 0.07 0.11 0.03 -0.03
Transport and storage 3.7 0.03 -0.01 -0.04 -0.04 -0.01 -0.03
Other private services 3.8 0.01 -0.01 -0.04 0.00 -0.03 -0.05
Public administration 0.8 -0.10 0.00 0.18 0.03 0.54 0.51
Education 4.0 -0.02 -0.04 0.03 -0.16 0.03 0.03
Health and social work 3.7 -0.01 -0.04 0.04 -0.15 0.58 0.58
Other services 4.7 0.01 -0.05 0.00 -0.13 -0.06 -0.06
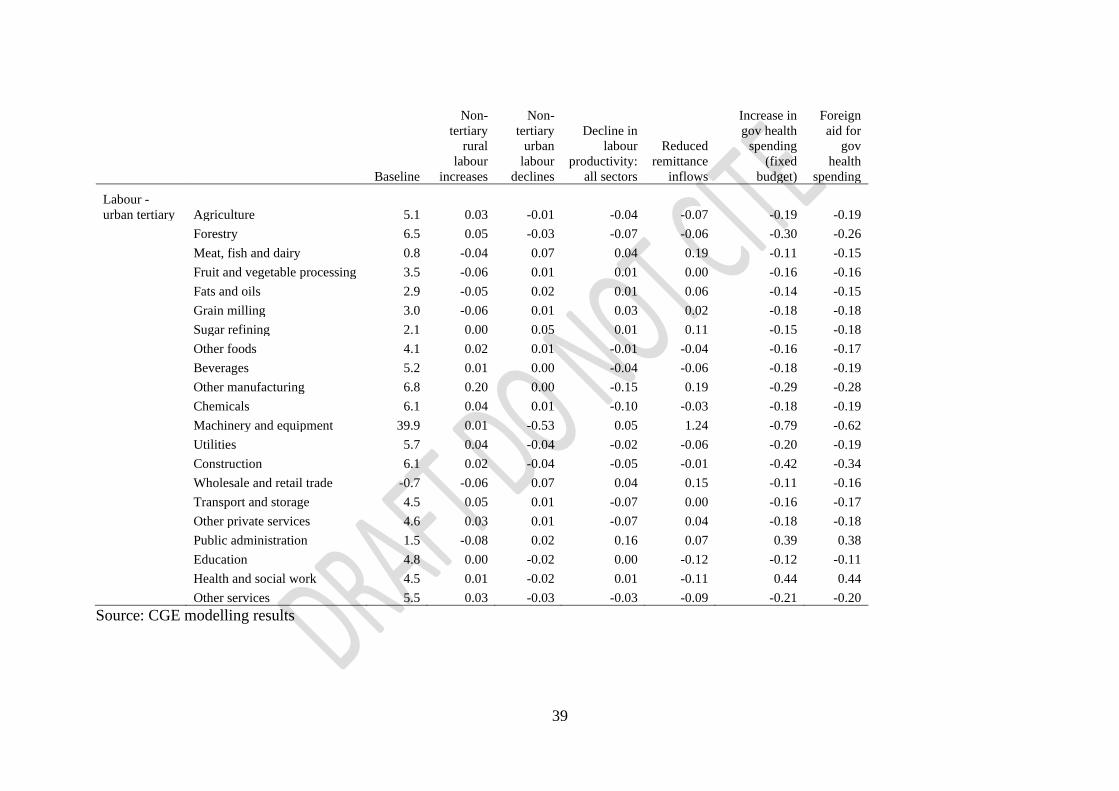
39
Baseline
Non-
tertiary
rural
labour
increases
Non-
tertiary
urban
labour
declines
Decline in
labour
productivity:
all sectors
Reduced
remittance
inflows
Increase in
gov health
spending
(fixed
budget)
Foreign
aid for
gov
health
spending
Labour -
urban tertiary Agriculture 5.1 0.03 -0.01 -0.04 -0.07 -0.19 -0.19
Forestry 6.5 0.05 -0.03 -0.07 -0.06 -0.30 -0.26
Meat, fish and dairy 0.8 -0.04 0.07 0.04 0.19 -0.11 -0.15
Fruit and vegetable processing 3.5 -0.06 0.01 0.01 0.00 -0.16 -0.16
Fats and oils 2.9 -0.05 0.02 0.01 0.06 -0.14 -0.15
Grain milling 3.0 -0.06 0.01 0.03 0.02 -0.18 -0.18
Sugar refining 2.1 0.00 0.05 0.01 0.11 -0.15 -0.18
Other foods 4.1 0.02 0.01 -0.01 -0.04 -0.16 -0.17
Beverages 5.2 0.01 0.00 -0.04 -0.06 -0.18 -0.19
Other manufacturing 6.8 0.20 0.00 -0.15 0.19 -0.29 -0.28
Chemicals 6.1 0.04 0.01 -0.10 -0.03 -0.18 -0.19
Machinery and equipment 39.9 0.01 -0.53 0.05 1.24 -0.79 -0.62
Utilities 5.7 0.04 -0.04 -0.02 -0.06 -0.20 -0.19
Construction 6.1 0.02 -0.04 -0.05 -0.01 -0.42 -0.34
Wholesale and retail trade -0.7 -0.06 0.07 0.04 0.15 -0.11 -0.16
Transport and storage 4.5 0.05 0.01 -0.07 0.00 -0.16 -0.17
Other private services 4.6 0.03 0.01 -0.07 0.04 -0.18 -0.18
Public administration 1.5 -0.08 0.02 0.16 0.07 0.39 0.38
Education 4.8 0.00 -0.02 0.00 -0.12 -0.12 -0.11
Health and social work 4.5 0.01 -0.02 0.01 -0.11 0.44 0.44
Other services 5.5 0.03 -0.03 -0.03 -0.09 -0.21 -0.20
Source: CGE modelling results

40
Related Documents