The long run performance of initial public offerings in South Africa Prabeshan Govindasamy 29645094 A research project submitted to the Gordon Institute of Business Science, University of Pretoria, in partial fulfilment of the requirements for the degree of Master of Business Administration. 10 November 2010 © University of Pretoria

Welcome message from author
This document is posted to help you gain knowledge. Please leave a comment to let me know what you think about it! Share it to your friends and learn new things together.
Transcript
The long run performance of initial public offerings in
South Africa
Prabeshan Govindasamy
29645094
A research project submitted to the Gordon Institute of Business Science,
University of Pretoria, in partial fulfilment of the requirements for the degree of
Master of Business Administration.
10 November 2010
©© UUnniivveerrssiittyy ooff PPrreettoorriiaa
The long run performance of IPOs in South Africa
i
Abstract
The current research was undertaken to determine the long run performance of
Initial Public Offerings (IPOs) listed on the Johannesburg Stock Exchange (JSE)
in South Africa. The three year abnormal returns were assessed for IPOs listed
between 1995 and 2006 comprising a sample of 229. Using the Buy and Hold
Abnormal Return (BHAR) and Cumulative Abnormal Return (CAR) methods, it
was found that the IPOs underperformed the market by 50% and 47% for BHAR
and CAR respectively. The JSE All Share Index was used as a benchmark. The
research also investigated the effect of firm size on IPO performance. The
relationship between IPO activity and performance was analysed as well as the
performance of IPOs from different sectors. Gross proceeds of the offers were
used as a proxy for firm size and it was shown that by splitting the sample into
different size groups, there were significant differences between the returns
from these groups. There was no relationship found between IPO activity and
performance using a linear regression. Using an Analysis of Variance (ANOVA)
it was determined that there were significant differences between the
performance of IPOs in the different sectors of technology, industrials, financials
and mining.
Keywords:
IPO, long run performance
©© UUnniivveerrssiittyy ooff PPrreettoorriiaa

The long run performance of IPOs in South Africa
ii
Declaration I declare that this research project is my own work. It is submitted in partial
fulfilment of the requirements for the degree of Master of Business
Administration at the Gordon Institute of Business Science, University of
Pretoria. It has not been submitted before any degree or examination in any
other University. I further declare that I have obtained the necessary
authorisation and consent to carry out this research.
____________________________ Prabeshan Govindasamy
10 November 2010
©© UUnniivveerrssiittyy ooff PPrreettoorriiaa

The long run performance of IPOs in South Africa
iii
Acknowledgements
This dissertation is the culmination of two years of theoretical and experiential
learning. In the process I have forged many new professional and personal
relationships. I would like to convey my most sincere gratitude to the following
people for making this past journey a truly memorable experience:
• My wife Natasha. Thank you for your tireless support. Without your
strength and encouragement none of this would have been possible.
• Mr. Ralph Gunn, thank you for the sage advice, motivation and
encouragement provided during my exhausting yet rewarding research
endeavour.
• Mrs. Claire Pienaar for your invaluable editing and proof reading of the
document.
• My family and friends for your patience and understanding during the
past two years.
• Denel Dynamics for the financial assistance provided.
• Mrs. Denise Wilson, my manager and mentor. Thank you for your
encouragement, support and understanding.
• The GIBS faculty, for an engaging and thought provoking academic
experience.
• My fellow students, thank you for your support and encouragement.
©© UUnniivveerrssiittyy ooff PPrreettoorriiaa

The long run performance of IPOs in South Africa
iv
TABLE OF CONTENTS
ABSTRACT ........................................................................................................ I
DECLARATION ................................................................................................. II
ACKNOWLEDGEMENTS ................................................................................. III
LIST OF FIGURES ........................................................................................... VI
LIST OF TABLES ............................................................................................ VII
1 INTRODUCTION .......................................................................................... 1
1.1 Research Title ................................................................................................................... 1
1.2 Research Problem ............................................................................................................ 1
1.3 Research Purpose ............................................................................................................ 3
2 LITERATURE REVIEW ............................................................................... 6
2.1 Long run performance ..................................................................................................... 7
2.2 The effect of size of issue on performance ................................................................. 12
2.3 The ‘hot issue’ effect ...................................................................................................... 14
2.4 Performance of IPOs in different sectors .................................................................... 17
3 RESEARCH HYPOTHESES ...................................................................... 23
3.1 Hypothesis 1 ................................................................................................................... 23
3.2 Hypothesis 2 ................................................................................................................... 24
3.3 Hypothesis 3 ................................................................................................................... 24
3.4 Hypothesis 4 ................................................................................................................... 25
4 METHODOLOGY ....................................................................................... 26
4.1 Research design ............................................................................................................. 26
4.2 Population, Sampling and Unit of Analysis ................................................................. 27
4.3 Measurement Techniques ............................................................................................. 28
©© UUnniivveerrssiittyy ooff PPrreettoorriiaa
The long run performance of IPOs in South Africa
v
5 RESULTS .................................................................................................. 36
5.1 Long run performance ................................................................................................... 36
5.2 Effect of offer size on performance .............................................................................. 39
5.3 ‘Hot Issue’ effect on performance ................................................................................ 42
5.4 Sector Performance ....................................................................................................... 45
6 DISCUSSION ............................................................................................. 51
6.1 Long run performance ................................................................................................... 51
6.2 Effect of offer size on performance .............................................................................. 56
6.3 ‘Hot Issue’ effect on performance ................................................................................ 60
6.4 Sector Performance ....................................................................................................... 66
7 CONCLUSIONS ......................................................................................... 72
7.1 Long run performance ................................................................................................... 72
7.2 Performance of different sized firms ............................................................................ 73
7.3 Relationship between BHAR and IPO activity ............................................................. 73
7.4 Difference in sector performance ................................................................................. 73
REFERENCES ................................................................................................. 76
APPENDIX A – SECTOR CATEGORIES ........................................................ 81
APPENDIX B – GDP GROWTH RATE ........................................................... 84
APPENDIX C – SAMPLE OF IPOS AND YEAR OF ISSUE............................ 85
©© UUnniivveerrssiittyy ooff PPrreettoorriiaa
The long run performance of IPOs in South Africa
vi
List of Figures Figure 1: Buy and Hold Abnormal Returns per month ...................................... 38
Figure 2: Cumulative Abnormal Returns per month ......................................... 38
Figure 3: BHAR for gross proceeds ................................................................. 39
Figure 4: BHAR for gross proceedings below R5bln ........................................ 40
Figure 5: BHAR vs. the number of listings ....................................................... 43
Figure 6: BHAR vs. the number of listings including linear trendline ................ 44
Figure 7: Calculated BHAR per sector ............................................................. 48
Figure 8: BHAR vs. CAR performance over 36 months ................................... 53
Figure 9: Sample IPOs vs. all IPOs listed ........................................................ 62
Figure 10: BHAR per year ................................................................................ 65
©© UUnniivveerrssiittyy ooff PPrreettoorriiaa
The long run performance of IPOs in South Africa
vii
List of Tables
Table 1: Summary of IPO long-run performance.............................................. 12
Table 2: Number of IPOs per year (www.jse.co.za) ......................................... 28
Table 3: Monthly returns for BHAR and CAR ................................................... 37
Table 4: BHAR for the segmented gross proceeds .......................................... 41
Table 5: ANOVA for difference in BHARs for gross proceeds .......................... 41
Table 6: BHAR per number of issues per year ................................................. 42
Table 7: Regression statistics for ‘hot issue’ effect ........................................... 44
Table 8: Long run performance per sector ....................................................... 45
Table 9: New sector groupings ......................................................................... 47
Table 10: ANOVA results for difference in means between sector BHARs ...... 49
Table 11: ANOVA results for sector BHARs (excluding Mining)....................... 50
Table 12: BHAR for gross proceeds larger than R10bln .................................. 60
©© UUnniivveerrssiittyy ooff PPrreettoorriiaa
The long run performance of IPOs in South Africa
1
1 Introduction 1.1 Research Title
The long run performance of Initial Public Offerings in South Africa.
1.2 Research Problem
Initial Public Offerings (IPOs) present potential investors with a vehicle to earn
superior returns, however the potential performance of these investments for
South African IPOs in the long run is not known. There have been numerous
studies performed on the performance of IPOs in many different markets. The
long run underperformance is a common phenomenon that has been found in
almost all of these studies, ranging in magnitude across the different markets.
The IPO is an important milestone in the life cycle of a private organisation and
it has significant consequences on the ownership structure and controlling rights
of the firm (Zheng and Li, 2008). There are a number of reasons why
companies go public, such as diversification of ownership, liquidity etc. (Bessler
and Thies, 2007). The founders have to surrender a portion of the ownership of
the organisation in exchange for equity that they can use to grow the business.
This may be a more feasible option of raising capital as opposed to increasing
debt levels.
©© UUnniivveerrssiittyy ooff PPrreettoorriiaa
The long run performance of IPOs in South Africa
2
The performances of IPOs have received an elaborate amount of attention in
the past two decades. The interest may be related to the value of IPOs for
economic growth and employment, but more often than not the focus is on the
substantial profit opportunities that they offer to investors (Bessler and Thies,
2007).
Underpricing of IPOs has been a subject of considerable academic and
practical interest, and this will continue to dominate the research directed to
IPOs (Kennedy, 2006). Underpricing can be seen as a fundamental feature of
IPOs and is existent in almost every economy. Long run performance, however,
depicts different characteristics in different countries. Ritter (1991), based on a
study of 1526 IPOs issued between 1975-1984 found that the average holding
period return to be 34.4% in three years while a control sample of similar
companies based on industry and market capitalisation returned 61.9%.
Corhay, Teo & Rad (2002) on the other hand found that for 258 IPOs issued
between 1992-1996 in Malaysia the result was the opposite with the IPOs
outperforming the market with a positive cumulative abnormal return (CAR) of
41.7% over three years from the listing day.
It is thus important to understand the long run performance of IPOs in a specific
market, not only from an investment perspective but also for the interest of the
issuer as this will give the owners an understanding of future valuation
prospects for the organisation in terms of market capitalisation.
©© UUnniivveerrssiittyy ooff PPrreettoorriiaa
The long run performance of IPOs in South Africa
3
1.3 Research Purpose
The knowledge of the potential performance of South African IPOs in the long
run may provide investors with the necessary knowledge to make informed
decisions regarding the choice of investment opportunities. The aim of this
research is thus to provide this information based on an empirical study of past
IPO performance.
The study analyses the return that can be gained from investing in IPOs over a
three year period. Most research on long run performance of IPOs consider the
period up to three years, and hence this period was considered for the current
research. The research on IPO performance in emerging markets is also limited
and the results for South Africa will therefore also contribute to this field.
The primary focus of this research is on the long run performance of IPOs in
South Africa. The results for 229 IPOs listed between 1995 and 2006 on the
main board of the Johannesburg Stock Exchange (JSE) will be analysed for 36
months after the listing. A broad benchmark in the form of the All Share Index
will be used to assess the abnormal returns from these listings.
Performance of IPOs with regard to their size, i.e. offer size, is a variable that is
used to categorize the performance of companies that are listed. The
information is readily available for investors and can be a vital factor in
determining the potential performance without having to perform an in depth
analysis into the organisation. One of the secondary objectives of this research
will thus be to determine if there is any relationship between the long run
©© UUnniivveerrssiittyy ooff PPrreettoorriiaa
li shun
li shun
The long run performance of IPOs in South Africa
4
performance of IPOs and the size of the issuing firm based on gross proceeds
from the listing.
The number of listings in a specific period (also referred to as IPO activity) is
sometimes related to the performance of IPOs. Given the sample size that
spans 12 years, the number of IPOs per year will be used as a factor to
determine if any relationship exists with the long run performance of these
listings. Therefore another sub objective of this study is to determine if there is
any relationship in South Africa between IPO activity and long run performance.
This phenomenon is referred to in the literature as the ‘hot issue’ effect which
shows a positive correlation between strong initial returns and high IPO activity
within a target period. The high initial returns are often associated with poor
long run performance (Kiymaz, 2000). The present investigation will thus aim to
verify if poor long run performance is associated with strong IPO activity.
Companies that are listed are not limited to a particular sector and usually span
across all sectors in a specific market. From an investment perspective it is also
valuable to determine if one sector differs from another with regard to the
returns from IPOs within that sector, and thus another secondary objective will
be to conclude if IPO performance differs across sectors.
©© UUnniivveerrssiittyy ooff PPrreettoorriiaa
The long run performance of IPOs in South Africa
5
To summarize, the aim of this research is to:
• Determine the long run performance (after 36 months) of IPOs in South
Africa.
• Determine if there is a correlation between the size of issue and the long
run performance of IPOs.
• Verify if there is a relationship between strong IPO activity (‘hot issue’
market) and the magnitude of long run underperformance.
• Determine if there are differences in after market returns between different
sectors.
©© UUnniivveerrssiittyy ooff PPrreettoorriiaa
The long run performance of IPOs in South Africa
6
2 Literature Review There have been numerous studies executed on the performance of IPOs.
Early research concentrated mainly on the underpricing phenomenon, however
there have also been many studies dedicated to long run performance of IPOs.
The performance of IPOs is consistent across different markets, i.e. initial
underpricing (high initial returns) and low long run performance.
The literature review will proceed by documenting the results of research aimed
at specifically determining the long run performance. This is completed to put
into context the results obtained for South Africa. As the present study is
performed from an investor’s perspective, the segregation of the vast market
needs to be considered. For this reason the literature will also address the ‘hot’
market issue. This is when a large volume of IPO activity within a predefined
time period results in high initial returns and low long run performance.
Subsequent to these results, the effect of the gross proceeds of the offer will be
reviewed from previous research. This is defined as the number of shares
issued multiplied by the offer price.
Finally, the performance of different industries or sectors from the literature will
be reviewed. The segregation of the IPO market by the above categories can
easily be achieved by information that is readily available to the potential
investor without the need for in depth research into the firm that is going public.
In order for the study to be considered complete, other factors that are used to
determine the long run performance of IPOs will be briefly discussed to indicate
©© UUnniivveerrssiittyy ooff PPrreettoorriiaa
The long run performance of IPOs in South Africa
7
the depth of information potential investors can analyse if they have the
resources available. These will not be discussed further in the present research.
2.1 Long run performance
The first significant study to measure long run performance based on return of
shares was performed by Ritter (1991) and has been cited by numerous
research papers and hence formed the benchmark for literature on IPOs. Ritter
calculated returns based on cumulative average adjusted returns (CAR) as well
as three year buy-and-hold abnormal returns (BHAR) and found that firms
substantially underperformed (29%) in the three year post issue period.
Overoptimistic investors based on fads were seen as a factor for this
underperformance, along with risk miss-measurement and bad luck.
Drobetz, Kammerman and Wälchli (2005) estimated the long run performance
of 109 Swiss IPOs from 1983 to 2000 and found that the underperformance
after three years was only about 7.5% using a broad market index as the
benchmark. It increased to 21% after four years and to 101% after ten years.
They also found that the underperformance was eliminated when a
capitalization index was used indicating that the underperformance was due to
the size of the firms which they claimed were small, and that similar sized firms
that did not issue equity performed comparably.
©© UUnniivveerrssiittyy ooff PPrreettoorriiaa
The long run performance of IPOs in South Africa
8
The long run performance of German IPOs for the period of 1977 to 1995 was
analysed by Bessler and Thies (2007) and the return was calculated as -12.7%
for a BHAR period of three years. They also found that subsequent financing
activity in the equity market after the listing had a positive effect on the
performance; however they recommended that further investigations be
performed to assess the strength of this correlation.
It is interesting to note that a similar study performed by Jaskiewicz, González,
Menéndez and Schiereck (2005) using a sample of 153 firms over the period
1990 to 2001 revealed a BHAR of -32.8% over three years.
This is not surprising, as it indicates that the performance of IPOs is sensitive to
the time that it was issued, and the various factors affecting the economy at that
time as well as the general business environment and investor sentiment. In the
same study Jaskiewicz et. al (2005) also showed that for the same period, 43
firms in Spain provided a BHAR of -36.7%.
Goergen, Khurshed and Mudambi (2007) reported on the performance of 252
IPOs that were listed on the London Stock Exchange from 1991 to 1995. The
CAR that they observed over the first 36 months was -21.3%. Other findings
from these IPOs were that there was a negative link between positive pre IPO
accounting performance and post IPO stock returns. This is surprising as one
would expect that favourable pre IPO performance would attract investors in the
long run, however it may be that this only attracts short term investments.
Goergen et. al (2007) also observed that firms with a higher degree of
multinationality showed more favourable long run returns than firms with a
©© UUnniivveerrssiittyy ooff PPrreettoorriiaa
The long run performance of IPOs in South Africa
9
lesser degree of multinationality. The performance of small firms was also found
to be different from larger firms.
Further evidence of the long run underperformance was provided for Thailand
by Vithessonthi (2008). His study reveals that a sample firm, on average,
underperforms the benchmark used by 41.7%. His sample of firms was taken
from the post Asian financial crisis era between 1999 and 2005.
Vithessonthi subdivided his sample into three subcategories based on firm size
and the study was similar to Goergen et. al. and Drobetz et. al (above) in that
he found that the group with the smallest sized firms showed the worst long
term performance results.
Cai, Liu and Mase (2008) showed that the return observed from 335 companies
listed on the Shanghai Stock Exchange and the Shenzhen Stock Exchange in
China for a BHAR period of three years was -29.6%. This was better than the
return observed by Vithessonthi for a similar period after the Asian crisis (1997-
2001).
Another study of IPOs in emerging markets was performed for India by Mayur
and Kumar (2009). They, however, implemented a different approach to other
researchers in that they only evaluated the operational performance of the
individual firms one year prior to listing, during the year of listing and two
subsequent years after listing.
Although the results they observed cannot be compared to the previous studies,
they found that the return on net assets and return on capital employed
©© UUnniivveerrssiittyy ooff PPrreettoorriiaa
The long run performance of IPOs in South Africa
10
deteriorated significantly after going public. Another finding by Mayur and
Kumar was that the firms whose owners relinquished the largest proportion of
ownership after the issue were shown to display lower levels of operational
performance as compared to other companies in the sample.
A study of the Japanese IPO market between 1998 and 2001 revealed a long
run underperformance of 18.3% based on a CAR over three years using a
sample of 433 firms (Kirkulak, 2008).
Thus far all the studies reflected on have shown underperformance. Corhay
et.al. (2002), as highlighted earlier, showed that the 258 IPOs issued between
1992 and 1996 in Malaysia outperformed the market with a substantial positive
CAR of 41.7% over three years from the listing day. The authors also suggested
that this figure was lower compared to previous studies indicating that there was
a decline in performance over the years. They also attributed this positive
performance to the fact that the Malaysian market had become more efficient
and mature showing a lower level of underpricing, which was due to the Kuala
Lumpur Stock Exchange efforts to revamp the listing requirements facilitating
greater efficiency, better corporate governance and more transparency.
This is not the only case, as was shown by Tsangarakis (2004). He estimated
that during the period from 1993 to 1997 when 108 IPOs were issued, the
adjusted return was a healthy 54.9% above the market. It must be noted that
this return was observed over a twelve month period, however all other
underperformance figures summarised above also indicated an
underperformance after the first year.
©© UUnniivveerrssiittyy ooff PPrreettoorriiaa
The long run performance of IPOs in South Africa
11
The reasons for this performance are not clear as the authors claim that
improvements were made in the regulatory IPO market; however high
underpricing was still evident, contrary to that reported by Corhay et.al., which
might suggest that after a year the IPOs were still in a lockup period and the
reversal of the initial underpricing would only occur at a later stage.
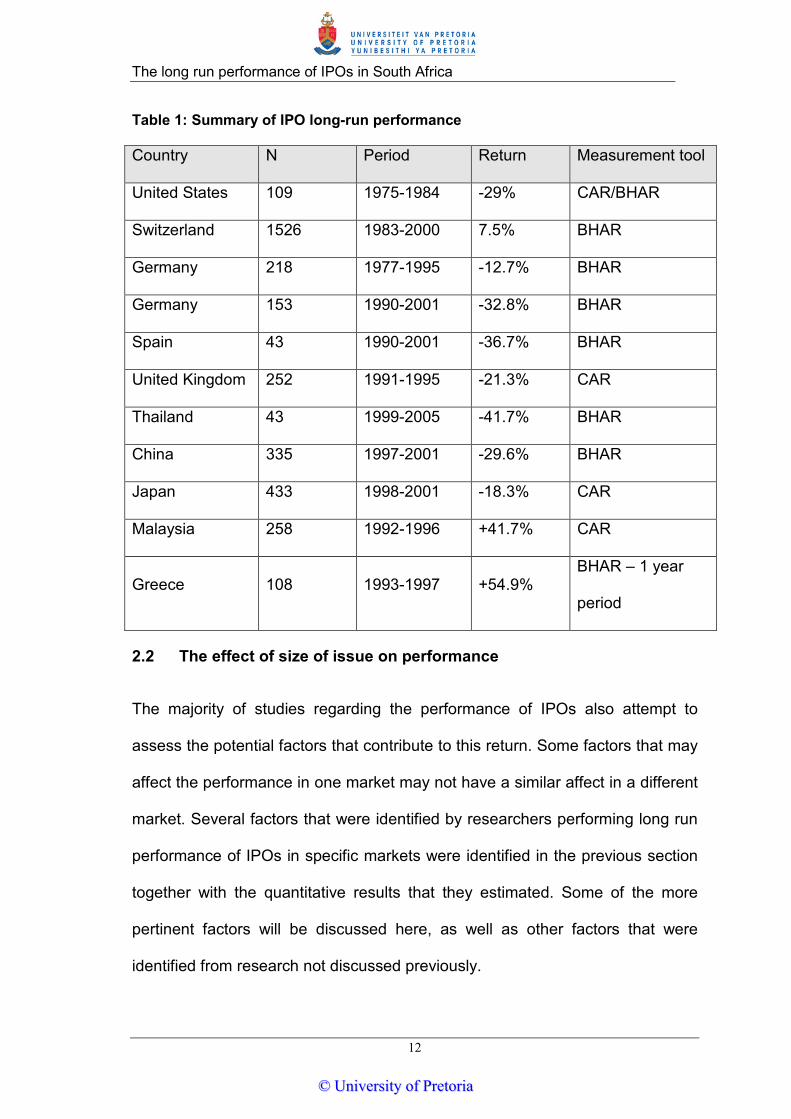
A summary of the three year performance of IPOs that was described above is
shown in Table 1. The results that were obtained from observations during the
largest sample periods are shown to have had the lowest underperformance,
with Switzerland showing a 7.5% underperformance over 17 years and
Germany 12.5% below the market over 18 years. This may suggest that
investors that require long buy and hold investments will achieve better results
than if held for a shorter time, however this argument is not viable as
investments should obviously be made on market related instruments. It is also
interesting to observe that results for Thailand, China and Japan all show
significantly different results over a similar period after the Asian crisis, with the
emerging economies of China and Thailand displaying much lower returns
compared to Japan.
©© UUnniivveerrssiittyy ooff PPrreettoorriiaa
The long run performance of IPOs in South Africa
12
Table 1: Summary of IPO long-run performance
Country N Period Return Measurement tool
United States 109 1975-1984 -29% CAR/BHAR
Switzerland 1526 1983-2000 7.5% BHAR
Germany 218 1977-1995 -12.7% BHAR
Germany 153 1990-2001 -32.8% BHAR
Spain 43 1990-2001 -36.7% BHAR
United Kingdom 252 1991-1995 -21.3% CAR
Thailand 43 1999-2005 -41.7% BHAR
China 335 1997-2001 -29.6% BHAR
Japan 433 1998-2001 -18.3% CAR
Malaysia 258 1992-1996 +41.7% CAR
Greece 108 1993-1997 +54.9% BHAR – 1 year
period
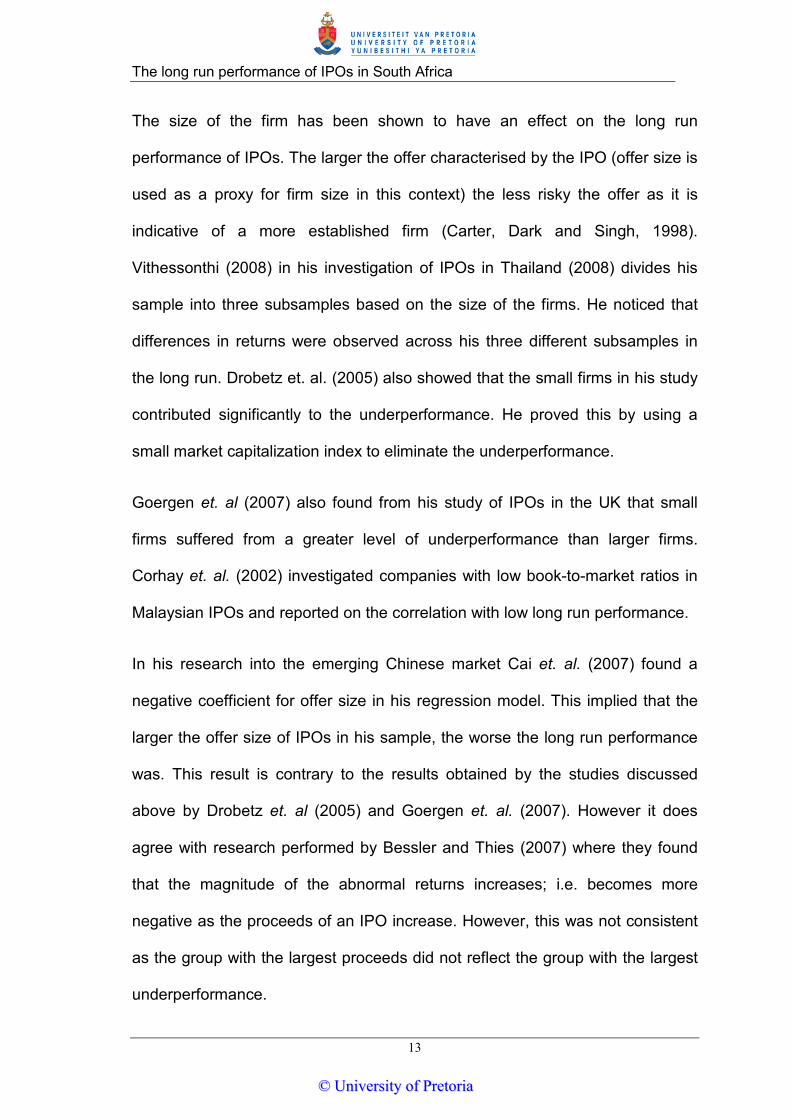
2.2 The effect of size of issue on performance
The majority of studies regarding the performance of IPOs also attempt to
assess the potential factors that contribute to this return. Some factors that may
affect the performance in one market may not have a similar affect in a different
market. Several factors that were identified by researchers performing long run
performance of IPOs in specific markets were identified in the previous section
together with the quantitative results that they estimated. Some of the more
pertinent factors will be discussed here, as well as other factors that were
identified from research not discussed previously.
©© UUnniivveerrssiittyy ooff PPrreettoorriiaa
The long run performance of IPOs in South Africa
13
The size of the firm has been shown to have an effect on the long run
performance of IPOs. The larger the offer characterised by the IPO (offer size is
used as a proxy for firm size in this context) the less risky the offer as it is
indicative of a more established firm (Carter, Dark and Singh, 1998).
Vithessonthi (2008) in his investigation of IPOs in Thailand (2008) divides his
sample into three subsamples based on the size of the firms. He noticed that
differences in returns were observed across his three different subsamples in
the long run. Drobetz et. al. (2005) also showed that the small firms in his study
contributed significantly to the underperformance. He proved this by using a
small market capitalization index to eliminate the underperformance.
Goergen et. al (2007) also found from his study of IPOs in the UK that small
firms suffered from a greater level of underperformance than larger firms.
Corhay et. al. (2002) investigated companies with low book-to-market ratios in
Malaysian IPOs and reported on the correlation with low long run performance.
In his research into the emerging Chinese market Cai et. al. (2007) found a
negative coefficient for offer size in his regression model. This implied that the
larger the offer size of IPOs in his sample, the worse the long run performance
was. This result is contrary to the results obtained by the studies discussed
above by Drobetz et. al (2005) and Goergen et. al. (2007). However it does
agree with research performed by Bessler and Thies (2007) where they found
that the magnitude of the abnormal returns increases; i.e. becomes more
negative as the proceeds of an IPO increase. However, this was not consistent
as the group with the largest proceeds did not reflect the group with the largest
underperformance.
©© UUnniivveerrssiittyy ooff PPrreettoorriiaa
The long run performance of IPOs in South Africa
14
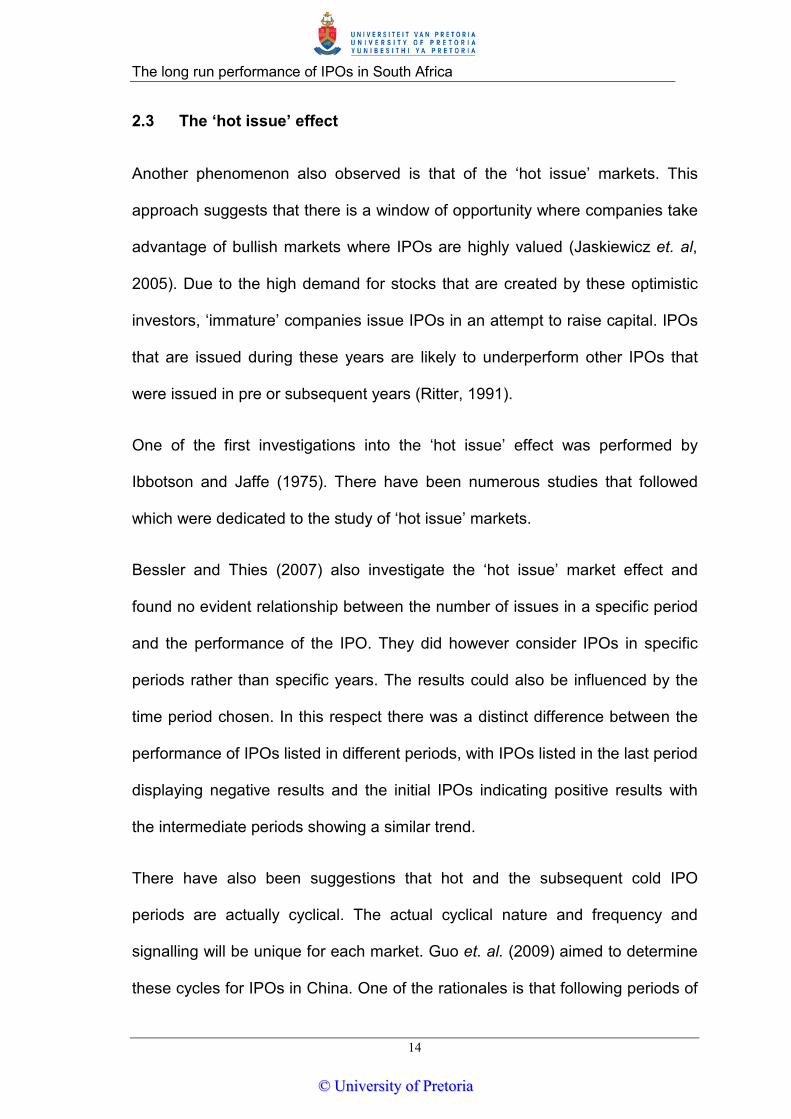
2.3 The ‘hot issue’ effect
Another phenomenon also observed is that of the ‘hot issue’ markets. This
approach suggests that there is a window of opportunity where companies take
advantage of bullish markets where IPOs are highly valued (Jaskiewicz et. al,
2005). Due to the high demand for stocks that are created by these optimistic
investors, ‘immature’ companies issue IPOs in an attempt to raise capital. IPOs
that are issued during these years are likely to underperform other IPOs that
were issued in pre or subsequent years (Ritter, 1991).
One of the first investigations into the ‘hot issue’ effect was performed by
Ibbotson and Jaffe (1975). There have been numerous studies that followed
which were dedicated to the study of ‘hot issue’ markets.
Bessler and Thies (2007) also investigate the ‘hot issue’ market effect and
found no evident relationship between the number of issues in a specific period
and the performance of the IPO. They did however consider IPOs in specific
periods rather than specific years. The results could also be influenced by the
time period chosen. In this respect there was a distinct difference between the
performance of IPOs listed in different periods, with IPOs listed in the last period
displaying negative results and the initial IPOs indicating positive results with
the intermediate periods showing a similar trend.
There have also been suggestions that hot and the subsequent cold IPO
periods are actually cyclical. The actual cyclical nature and frequency and
signalling will be unique for each market. Guo et. al. (2009) aimed to determine
these cycles for IPOs in China. One of the rationales is that following periods of
©© UUnniivveerrssiittyy ooff PPrreettoorriiaa
The long run performance of IPOs in South Africa
15
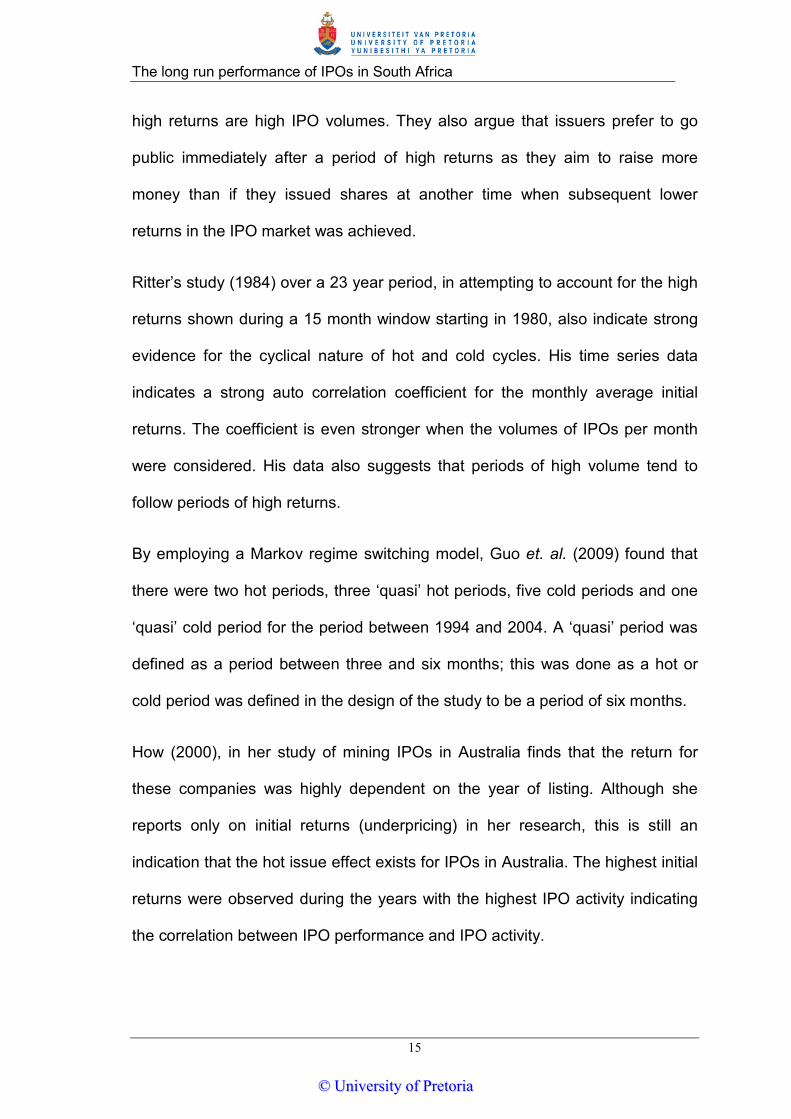
high returns are high IPO volumes. They also argue that issuers prefer to go
public immediately after a period of high returns as they aim to raise more
money than if they issued shares at another time when subsequent lower
returns in the IPO market was achieved.
Ritter’s study (1984) over a 23 year period, in attempting to account for the high
returns shown during a 15 month window starting in 1980, also indicate strong
evidence for the cyclical nature of hot and cold cycles. His time series data
indicates a strong auto correlation coefficient for the monthly average initial
returns. The coefficient is even stronger when the volumes of IPOs per month
were considered. His data also suggests that periods of high volume tend to
follow periods of high returns.
By employing a Markov regime switching model, Guo et. al. (2009) found that
there were two hot periods, three ‘quasi’ hot periods, five cold periods and one
‘quasi’ cold period for the period between 1994 and 2004. A ‘quasi’ period was
defined as a period between three and six months; this was done as a hot or
cold period was defined in the design of the study to be a period of six months.
How (2000), in her study of mining IPOs in Australia finds that the return for
these companies was highly dependent on the year of listing. Although she
reports only on initial returns (underpricing) in her research, this is still an
indication that the hot issue effect exists for IPOs in Australia. The highest initial
returns were observed during the years with the highest IPO activity indicating
the correlation between IPO performance and IPO activity.
©© UUnniivveerrssiittyy ooff PPrreettoorriiaa
The long run performance of IPOs in South Africa
16
Derrien (2005) attempted to model the pricing of IPOs in hot market conditions.
His study was pre-empted by the large volume of IPOs issued in the US in 1999
and 2000. The model uses investor sentiment after periods of high initial returns
to create a bullish market for current IPOs resulting in higher issue prices. The
combination of this public information and the private information collected
during the IPO process show that these IPOs are overpriced (in relation to the
intrinsic value of the company) and yet still show high initial returns. For this
reason, Derrien proposes that IPO issuers during hot periods are not concerned
about leaving money on the table as they know their IPOs have been
overpriced due to the prevailing favourable market conditions.
Although the reasons for ‘hot’ and ‘cold’ cycles are unclear, Alti (2005) suggests
that this phenomenon can be attributed to information spill overs. By this he
implies that information generated for a set of pioneers, makes it easier for the
valuation of followers and hence makes those IPO processes easier.
This is reiterated by Ritter (1984) (see section 2.4 below) who says that ‘hot’
markets are usually dominated by IPOs in a specific industry. Alti (2005)
explains further by implying that many firms do not necessarily go public during
‘hot’ cycles because they need funding at that time, but because they aim to
take advantage of the prevailing market conditions and thus aim to capitalise on
the sentiment by pricing their offers higher and thus leaving less money on the
table.
The inference of ‘hot’ markets by Alti (2005) is not only specific to a defined
industry in the market but also according to the pioneering IPOs to those of
©© UUnniivveerrssiittyy ooff PPrreettoorriiaa
The long run performance of IPOs in South Africa
17
emerging or new industries. The hypotheses that IPOs in new or emerging
industries outperform IPOs in established industries was investigated by Ang
and Boyer (2009) and Finkle and Lamb (2002). Their research is further
discussed in section 2.4 below.
Using a sample of IPOs between 1975 and 2000, Helwege and Liang (2004)
use a three month moving average of IPO volume to detect ‘hot’ and ‘cold’
cycles. Their research reaffirms the theory that IPOs in ‘hot’ cycles have lower
long run performance than those from ‘cold’ cycles.
They also find that IPOs of companies in ‘hot’ cycles have lower capital
expenditure, lower Research and Development ratios, are the same age at the
time of going public and do not exhibit higher sales growth or profits in the five
years after going public than cold market IPOs. There is thus no evidence that
‘hot’ cycle IPOs are more likely to be start-ups in highly innovative industries,
i.e. new or emerging industries as investigated by Ang and Boyer (2009) and
Finkle and Lamb (2002).
2.4 Performance of IPOs in different sectors
IPOs are used to allow a company to go public. Companies can be in any
industry or sector, and for this reason several researchers investigated if the
performance or returns from one sector differed from the returns of IPOs from
other sectors.
©© UUnniivveerrssiittyy ooff PPrreettoorriiaa
The long run performance of IPOs in South Africa
18
A study by Kiymaz (2000) on the listing of IPOs on the Istanbul Stock Exchange
between the years 1990 and 1996 showed differences in initial returns and after
market returns between the different sectors of Industrials, Financials and
others. Each sector was further subcategorised and analysed. He found that
initial returns were higher for the financial sector (15%) than for industrials
(11%).
He also noticed that sectors that enjoyed high initial returns showed lower
(negative) returns after three months, so the higher the initial returns the worse
was the longer term underperformance.
Another study by Ritter (1984) indicates a distinct industry effect for natural
resource IPOs in 1980 in the USA. Initial returns of 48.7% were observed for
this industry. His paper looks at the hot issue period during 1977-1982, where a
specific 15 month window period encompassed IPOs that showed an initial
48.7% return whereas the remainder of the years in his sample period only
showed returns of 16.3%.
Ritter (1984) initially proposes that this return can be attributed to unusually
large risk associated with these companies; however his research dismisses
this theory in favour of the one that supports the fact that these IPOs were
specific to one industry at that time, i.e. the natural resources industry.
Ang and Boyer (2009) look at the industry segmentation in a different way, by
not looking at different sectors, but by comparing IPOs in new industries to
those in established industries. Their argument for this is that companies in new
industries can be viewed as growth companies, and will attract investors, which
©© UUnniivveerrssiittyy ooff PPrreettoorriiaa
The long run performance of IPOs in South Africa
19
will include venture capitalists due to their promise of higher returns. This choice
was also pre-empted by the dot.com bubble, where the new industry at that
stage was internet based companies that enjoyed exceptional returns before
their inevitable demise.
Ang and Boyer (2009) reported in their research into US IPOs listed between
1970 and 2002 that IPOs in new industries provided a return of 17.5% over five
years whereas IPOs in established industries only showed a return of -10.1%.
The return for IPOs in new industries also showed positive returns from year
three to five and only the first two years indicating negative returns. The return
for IPOs in established industries were negative over all five years.
A similar study was done by Finkle and Lamb (2002). They compared the long
run aftermarket performance of IPOs in emerging industries to those in non-
emerging industries. Emerging industries during the period between 1993
and1996 included the population of biotechnology, semiconductor and internet
IPOs. Contrary to the results of Ang and Boyer (2009), Finkle and Lamb found
that the returns from emerging IPOs after a year were worse than that of non-
emerging IPOs. Performance for both industries was negative.
How (2000) performed research into the performance of 130 mining IPOs in
Australia between 1979 and 1990. Although she does not prepare a
comparable investigation between different sectors in her research, she
compares her findings to that of a previous report performed on IPO
performance of companies in the industrial sector.
©© UUnniivveerrssiittyy ooff PPrreettoorriiaa
The long run performance of IPOs in South Africa
20
Her sample of data was also collected over the same period as those from the
industrial sector study. She cites Finn and Higham (1988), who found in their
study of Australian IPOs a return of -6.5% over the first year after listing.
A three year study Lee, Taylor and Walter (1996) also found a poor long run
performance after three years. How (2000) finds that over 36 months mining
IPOs underperform the market by 36% using CAR and 20% when BHAR was
used. Thus the mining sector in Australia displayed a marked difference in
performance between the long run performance of companies listed in the
mining sector and those in the industrial sector.
The results are also similar to those reported by Kiymaz (2000) where the IPOs
that displayed poor long performance showed high initial underpricing. The
mining IPOs were more highly underpriced than the industrial IPOs.
Helwege and Liang (2004) find in their research into IPOs listed between 1975
and 2000 that those in ‘hot’ and ‘cold’ cycles are drawn from the same handful
of industries. They also find that there is more evidence of industry
concentration in ‘cold’ markets as opposed to ‘hot’ markets. They explain this
anomaly by suggesting that many industries have their ‘hot’ cycles at the same
time, and that innovations are likely to be enjoyed across industries rather than
by one specific industry only. This theory is further emphasised by the fact that
‘hot’ cycle IPOs were not dominated by start-up companies, implying weak
support of the new or emerging industries theory discussed above.
There are many other factors that have been shown to have an influence on the
long run performance of IPOs. Bessler and Thies (2007) found that there was a
©© UUnniivveerrssiittyy ooff PPrreettoorriiaa
The long run performance of IPOs in South Africa
21
positive correlation between subsequent financing activities and the future
performance of IPOs. Cai et. al. (2008) stated that Chinese companies can
manipulate the issue process with the knowledge that earnings per share prior
to listing, the decision to switch investment banks at the time of issue and the
availability of shares to foreign investors were all variables that influence the
underperformance of IPOs.
Singh and Van der Zahn (2009) found from their study of Singapore IPOs that
there was a negative association between the level of intellectual capital
disclosure and the long run returns for investors. The writers suggested that this
could be related to investors’ optimism which increased the initial underpricing
in the short run. However, as the share price was driven upward, investors were
likely to discount their shares more aggressively to correct the initial higher
mispricing.
Yip, Su and Ang (2009) found that IPOs that were backed by leading
investment banks indicated more pronounced short term price momentum and
long term price reversal (i.e. long term underperformance). However they
suggest that investors could earn above market related returns if they divest just
before the lockup period. Their study was only performed for an investment
period of one year and hence was not discussed in the previous section.
Daily, Certo & Dalton. (2005) indicated several other factors that could also
contribute to long-run performance of IPOs. For example, the Chief Executive
Officer (CEO) of the firm, who will be scrutinised with regards to his ability to
adapt to a more professional management role. The business acumen of both
©© UUnniivveerrssiittyy ooff PPrreettoorriiaa
The long run performance of IPOs in South Africa
22
the CEO and other managers will thus be tested. Firms of CEOs who are
perceived as ill equipped to make this transformation, will be seen as more risky
in terms of investment.
The proportion of equity that is retained by the CEO at the time of the IPO is
another variable and can be seen as an indicator of the confidence he has in
the organisation. The board size and composition can also be contributing
factors. The influence of venture capital on the performance of a firm is also
important. A firm that has a large proportion of venture capital funds is seen as
less of a risk as venture capitalists are seen as active investors who will tend
not to pursue uncertain investments (Daily et. al., 2005). This was not
substantiated by Wong and Wong (2008), as they did not observe any
correlation between venture-backed IPOs and performance in Hong Kong.
©© UUnniivveerrssiittyy ooff PPrreettoorriiaa
The long run performance of IPOs in South Africa
23
3 Research Hypotheses The primary aim of this research is to investigate the long run performance of
IPOs in South Africa. Following from the literature, an assessment of this
performance over a three year period will be employed as this was shown to be
a standard evaluation period. Secondary objectives include the effect of offer
size on the long run performance. The ‘hot issue’ effect will also be analysed for
its effect on after market returns. The final objective is to determine whether or
not IPOs in different sectors or different industries provide different long run
performances.
3.1 Hypothesis 1
To evaluate the long run performance, the buy and hold abnormal return
(BHAR) measurement technique as well as the cumulative abnormal return
(CAR) will be used. Both these results will be compared to a benchmark to
determine the level of performance. A BHAR and CAR of zero indicates that
there is no difference between the IPO and the benchmark. A description of the
measurement techniques as well as the relevant benchmark will be discussed
in Chapter 4.
Hypothesis 1: The CAR and BHAR for IPOs in South Africa are equal to zero.
H0: µIPO = 0
Ha: µIPO < 0, µIPO > 0
©© UUnniivveerrssiittyy ooff PPrreettoorriiaa
The long run performance of IPOs in South Africa
24
3.2 Hypothesis 2
One of the main factors affecting IPO performance which was highlighted in
section 2 was the size of the offer. Therefore the effect of offer size on long run
performance of South African IPOs will be evaluated. The gross proceeds will
be used as a proxy for firm size. A reasonable assumption for this proposition to
be feasible is that the long run underperformance exists, therefore BHAR will be
negative. The method adopted is to segment the gross proceeds into different
groups and then to determine if there are significant differences between these
groups of proceeds. This was the same approach adopted by Vithessonthi
(2008).
Hypothesis 2: Groups of different size proceeds do not provide different returns.
H0: µ1 = µ2 = µ3=...µn (where 1,2...n are the number of
groups of gross proceeds)
Ha: µ1 ≠ µ2 ≠ µ3 ≠...µn
3.3 Hypothesis 3
The prevalence of any ‘hot issue’ period is also an area of interest to investors,
as this will give them insight of the future performance on an IPO based on
when it was issued. The phenomenon can be investigated for years that display
higher than normal IPO activity. From section 2.3 it was noted that the ‘hot’
cycles produce high initial returns, however the long run performance was poor.
©© UUnniivveerrssiittyy ooff PPrreettoorriiaa
The long run performance of IPOs in South Africa
25
Hypothesis 3: There is no relationship between BHAR and IPO activity.
Model: BHAR = βo + β1X
H0: β1 = 0.
Ha: β1 ≠ 0
3.4 Hypothesis 4
The long run performance of IPOs in different sectors of a market can produce
different results. The objective here is to determine if these differences are
present for IPOs across the different sectors that exist in the South African
market.
Hypothesis 4: The long run performance of IPOs across different sectors is the
same.
H0: µsi = µsj = ...= µsn (where µsi,j = BHAR for sector i, j, i ≠ j. i,j = 1 to n, n =
number of sectors in sample)
Ha: µsi ≠ µsj ≠ ... ≠ µsn
©© UUnniivveerrssiittyy ooff PPrreettoorriiaa
The long run performance of IPOs in South Africa
26
4 Methodology 4.1 Research design
The aim of the study is to determine the long run performance of IPOs in South
Africa. The research design adopted is thus a quantitative one due to the data
analysis required. In order to determine the long run performance of IPOs,
information on share price history and that of a benchmark is required.
Information on new issues was obtained from the Johannesburg stock
Exchange (JSE). Monthly share price data was then downloaded from the
McGregor BFA website. The raw monthly return for each company was then
calculated. A broad market index in the form of the JSE All Share Index (ALSI)
was used as the benchmark to adjust the data and provide the abnormal returns
required. This is the general procedure used to estimate IPO performance and
adopted by most researchers as discussed in section 2.1 when long run
performance of IPOs was estimated.
A descriptive quantitative design was used for hypothesis 1 and a causal
quantitative design was used for hypothesis 2, 3 and 4.
To determine the long run performance, descriptive statistics were used to
determine the mean return (CAR and BHAR) and using t-statistics for the level
of significance.
An analysis of variance (ANOVA) will be used to determine if there are
differences between the performances of IPOs in groups of different gross
proceeds.
©© UUnniivveerrssiittyy ooff PPrreettoorriiaa
The long run performance of IPOs in South Africa
27
To determine if a ‘hot issue’ period exists in the sampling period, years that
indicate high IPO activity will be used to estimate if the companies that listed
during these years will show higher levels of underperformance compared to
companies listed in other years. Thus a regression analysis was used to
determine if a relationship exists.
An ANOVA will be used to assess differences in performance between different
sectors.
4.2 Population, Sampling and Unit of Analysis
4.2.1 Unit of analysis
The unit of analysis for this study is a recently listed company’s monthly closing
share price. The company had to be listed within the sampling period of the
research.
4.2.2 Population
The population consists of all IPOs that have been issued in South Africa.
4.2.3 Sample
For the purposes of this study the sample is all new listings on the main board
of the JSE from July 1995 to 2006. The end date was chosen as it will provide
the required three years of return information. The start date was chosen as this
©© UUnniivveerrssiittyy ooff PPrreettoorriiaa
The long run performance of IPOs in South Africa
28
was the period from which the All Share Index data was available. The IPOs
listed on the Alternate Exchange (AltX) of the JSE were not considered as the
AltX index data was only available for 1996. There are therefore 12 years of
data available. The initial sample from July 1995 to December 2006 contained
375 IPOs. However, due to companies delisting within the 36 months of going
public, the sample was reduced to 229 IPOs. The number of IPOs per year is
shown in Table 2.
Table 2: Number of IPOs per year (www.jse.co.za)
Year No. of new listings Year No. of new listings
1995 4 2001 8
1996 20 2002 8
1997 35 2003 6
1998 61 2004 11
1999 40 2005 11
2000 8 2006 17
4.3 Measurement Techniques
The two most important aspects in determining the performance of IPOs is the
selection of the appropriate methodology and secondly to compare these
results to an appropriate benchmark for the firm. Results obtained from previous
©© UUnniivveerrssiittyy ooff PPrreettoorriiaa
The long run performance of IPOs in South Africa
29
studies have been shown to be sensitive to both the methodology used as well
as the benchmark (Bessler and Thies, 2007).
The benchmark that was used is the All Share Index (ALSI) for companies listed
on the main board of the JSE. It was decided to use the ALSI as it provides a
simple yet robust method of assessing the abnormal returns. Using a broad
index also allows comparisons to be made across different sectors.
The BHAR and the CAR have been the most popular measurement tools used
to estimate the long run performance of IPOs. For this study an attempt will be
made to calculate both. BHAR measures a compounded return and CAR is a
summing return, however the results obtained over a shorter period are similar
as depicted by Ritter (1991).
Buy and hold returns are frequently used in modern event studies. Fama and
French (1992) caution that problems with long-term BHARs are most acute due
to the fact that such returns compound any model’s inability to accurately
describe short term returns. BHARs can lead to long-term statistically significant
abnormal performance even when none are present due to short-term
influences. Kothari and Warner (1997) also find that long-horizon buy and hold
abnormal returns are significantly right-skewed, although cumulative returns are
not. Fama (1998) and Mitchell and Stafford (2000) reiterate that CARs and time-
series regressions are less likely to yield spurious rejections of market efficiency
than BHARs by compounding single period returns at a monthly frequency. The
buy-and-hold method can magnify underperformance even if it occurs in only a
single period as a consequence of compounding single-period returns.
©© UUnniivveerrssiittyy ooff PPrreettoorriiaa

The long run performance of IPOs in South Africa
30
Therefore the main advantage of looking at BHARs is that, of our abnormal
performance measures, they most accurately simulate the effect of an event on
an investor’s portfolio (due to compounding). CARs, however, help avoid the
problems of extreme skewness introduced by BHARs and therefore are helpful
in double-checking any conclusions presented by BHARs results. Performing
both techniques also provides a test of robustness for the results obtained (Choi
and Nam, 2006). This test of robustness was therefore the motivation for using
both techniques.
Fama and French’s (1996) three factor model is a new model compared to
BHAR and CAR and is becoming popular in some studies; however Loughran
and Ritter (1995) argue that this model is the least powerful test of market
efficiency and hence will not be used in this study. The debate on the
applicability of the different models is further investigated by Moshirian, Ng and
Wu (2008) who find that BHARs, CARs and returns based on matching firms all
produce different results.
The matching firm approach may be seen as more robust model, however it is
not as widely employed in the research as in most cases it is difficult to find
firms that match those in the sample.
©© UUnniivveerrssiittyy ooff PPrreettoorriiaa

The long run performance of IPOs in South Africa
31
4.3.1 Long run performance
For the purposes of this study, it was decided that the utilisation of the BHAR
and CAR will be sufficient as it will provide a general outlook on the
performance of IPOs. A recommendation for further research will be for a
matching firm approach to be used to compare the results obtained with this
assessment.
A summary on the derivation for BHAR is given by Singh and Van Der Zahn
(2009) which is outlined below.
The holding period return (BHR) for a single stock is calculated for the period T
as follows:
BHRT, = [(1 + Ri, 1)(1 + Ri, 2) . . . (1 + Ri, T)] – 1
Which can be rewritten as:
BHRT, = [ (1 + R,
)] − 1
Where Ri,t is the return of stock i at time t and T is the time period for which the
BHR is calculated. For an equally weighted portfolio of stocks, returns are
calculated as follows:
dBHR,1 ,
©© UUnniivveerrssiittyy ooff PPrreettoorriiaa
The long run performance of IPOs in South Africa
32
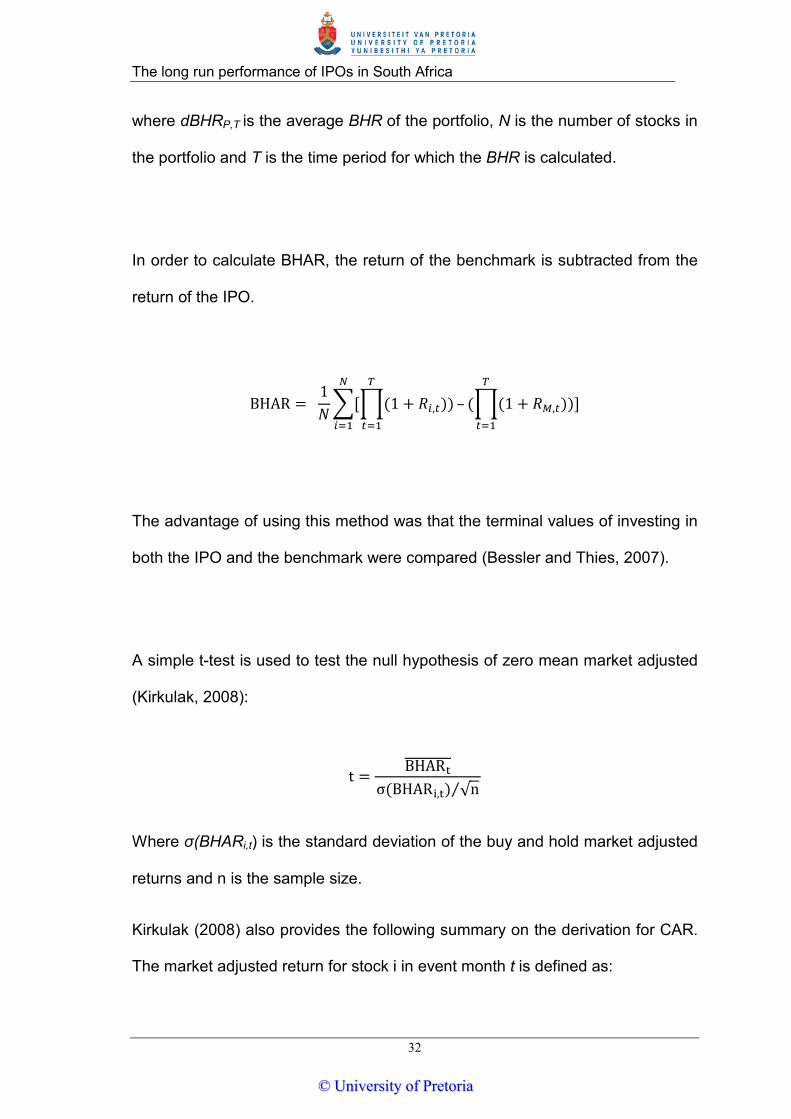
where dBHRP,T is the average BHR of the portfolio, N is the number of stocks in
the portfolio and T is the time period for which the BHR is calculated.
In order to calculate BHAR, the return of the benchmark is subtracted from the
return of the IPO.
BHAR = 1 [(1 + ,))
– ((1 + ,))]
The advantage of using this method was that the terminal values of investing in
both the IPO and the benchmark were compared (Bessler and Thies, 2007).
A simple t-test is used to test the null hypothesis of zero mean market adjusted
(Kirkulak, 2008):
t = BHAR
σ(BHAR,) √n⁄
Where σ(BHARi,t) is the standard deviation of the buy and hold market adjusted
returns and n is the sample size.
Kirkulak (2008) also provides the following summary on the derivation for CAR.
The market adjusted return for stock i in event month t is defined as:
©© UUnniivveerrssiittyy ooff PPrreettoorriiaa

The long run performance of IPOs in South Africa
33
ar, = r, − r,
The average market adjusted return on a portfolio of n stocks for event month t
is the average of the market adjusted returns:
AR = 1 ar,
The CAR from month q to month s is thus defined as:
CAR, = AR
The t-statistic for CAR in month t is computed as:
= CAR x
x var + 2 x ( − 1)x cov
Where var is the average of the cross sectional variances over 36 months of the
ari,t and cov is the first order auto covariance of the ARt series.
©© UUnniivveerrssiittyy ooff PPrreettoorriiaa
The long run performance of IPOs in South Africa
34
4.3.2 Determining the effect of offer size on performance
After the BHAR was calculated the results were used to determine the effect of
offer size on the long run performance. An ANOVA was used to determine if
differences existed between groups of different size firms.
The offer size or gross proceeds was calculated as follows:
Gross proceeds = Offer price x number of shares in issue
4.3.3 Determining the ‘hot issue’ effect on long run performance
A regression model with BHAR as the dependent variable and number of IPOs
per year as the dependent variable was used to determine if any relationship
between these variables existed.
4.3.4 Determining if different sectors provide different returns
The IPOs listed in the sample period were provided by the JSE according to the
sector that they were in. These sectors were classified on a low level and hence
were large in number, with many sectors only consisting of a few firms. The
©© UUnniivveerrssiittyy ooff PPrreettoorriiaa
The long run performance of IPOs in South Africa
35
IPOs were therefore reclassified on a higher level, thereby allowing more
companies to be grouped together so that a better comparison could be made
between the sectors. Once the IPOs were grouped according to sectors, the
BHAR for each was calculated and the difference in means was determined to
assess if there was any significant difference in long run returns between the
different sectors.
©© UUnniivveerrssiittyy ooff PPrreettoorriiaa
The long run performance of IPOs in South Africa
36
5 Results
The long run performance for the IPOs in the sample period was calculated
using BHAR and CAR. Both of these measures were only used to satisfy the
primary objective. For the secondary objectives only the BHAR variable was
used, as it was not necessary to adopt both measures to establish any
relationship between the returns and the variables in question. This was justified
by the robustness test that will be discussed later on.
5.1 Long run performance
The sample period used was for IPOs listed between 1995 and 2006. Only
those listings that provided three years of share price data was included in the
sample. Where companies were delisted within the three years, these listings
were not included in the sample.
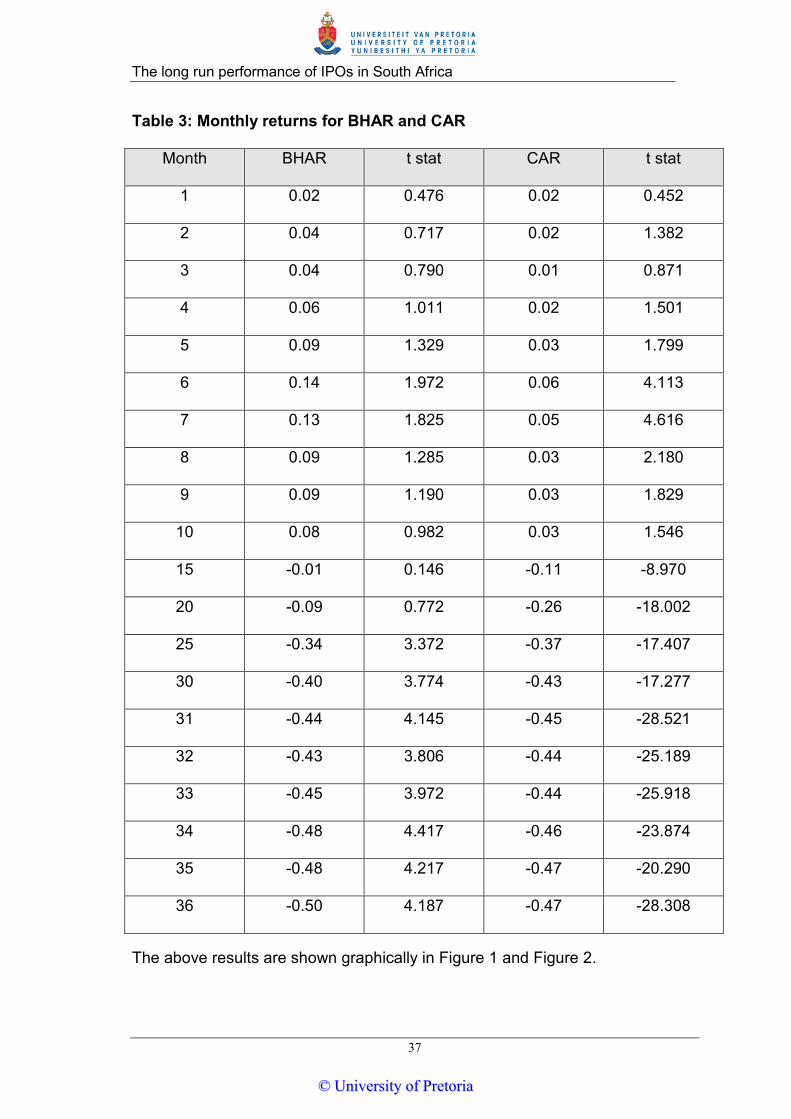
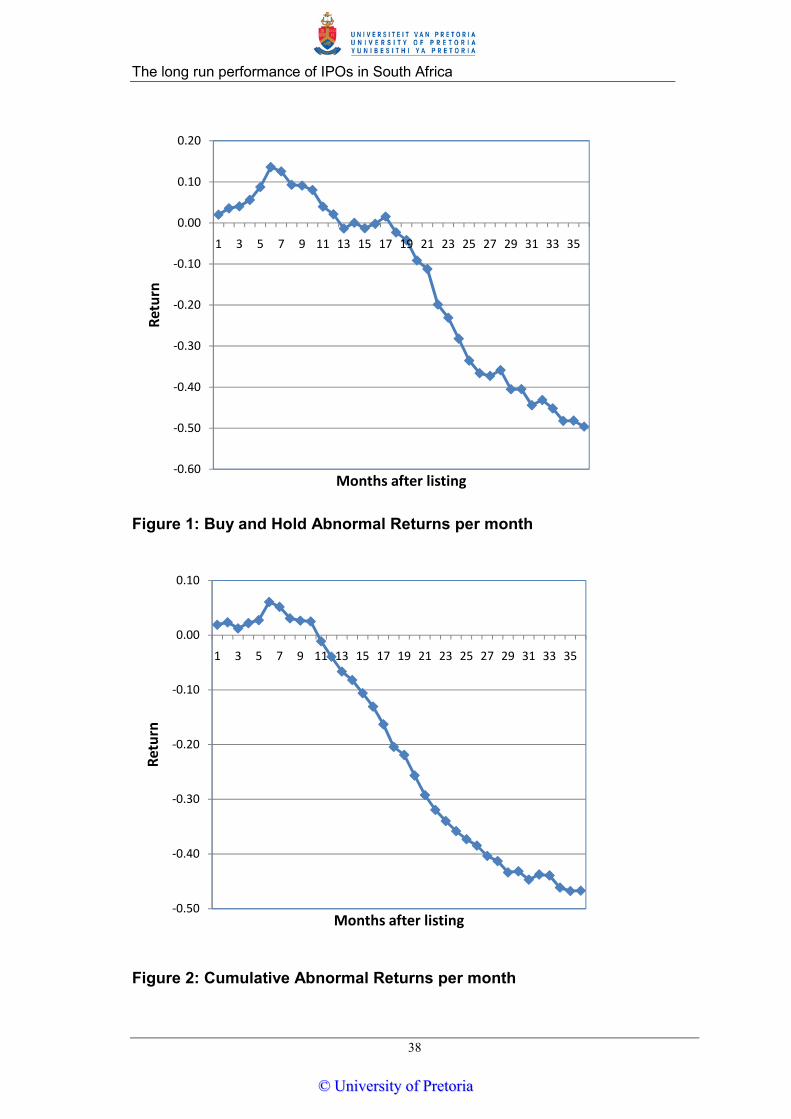
Table 3 shows the results per month for BHAR and CAR. The BHAR values
revealed below were estimated by first calculating the BHAR per month for each
company and then averaging these over the number of samples. This was done
for months 1 to 36. The CAR values were calculated in a similar way as for
BHAR, however a further step was required to cumulate the results for each
month from month 1 to 36.
©© UUnniivveerrssiittyy ooff PPrreettoorriiaa
The long run performance of IPOs in South Africa
37
Table 3: Monthly returns for BHAR and CAR
Month BHAR t stat CAR t stat
1 0.02 0.476 0.02 0.452
2 0.04 0.717 0.02 1.382
3 0.04 0.790 0.01 0.871
4 0.06 1.011 0.02 1.501
5 0.09 1.329 0.03 1.799
6 0.14 1.972 0.06 4.113
7 0.13 1.825 0.05 4.616
8 0.09 1.285 0.03 2.180
9 0.09 1.190 0.03 1.829
10 0.08 0.982 0.03 1.546
15 -0.01 0.146 -0.11 -8.970
20 -0.09 0.772 -0.26 -18.002
25 -0.34 3.372 -0.37 -17.407
30 -0.40 3.774 -0.43 -17.277
31 -0.44 4.145 -0.45 -28.521
32 -0.43 3.806 -0.44 -25.189
33 -0.45 3.972 -0.44 -25.918
34 -0.48 4.417 -0.46 -23.874
35 -0.48 4.217 -0.47 -20.290
36 -0.50 4.187 -0.47 -28.308
The above results are shown graphically in Figure 1 and Figure 2.
©© UUnniivveerrssiittyy ooff PPrreettoorriiaa
The long run performance of IPOs in South Africa
38
Figure 1: Buy and Hold Abnormal Returns per month
Figure 2: Cumulative Abnormal Returns per month
-0.60
-0.50
-0.40
-0.30
-0.20
-0.10
0.00
0.10
0.20
1 3 5 7 9 11 13 15 17 19 21 23 25 27 29 31 33 35
Retu
rn
Months after listing
-0.50
-0.40
-0.30
-0.20
-0.10
0.00
0.10
1 3 5 7 9 11 13 15 17 19 21 23 25 27 29 31 33 35
Retu
rn
Months after listing
©© UUnniivveerrssiittyy ooff PPrreettoorriiaa
The long run performance of IPOs in South Africa
39
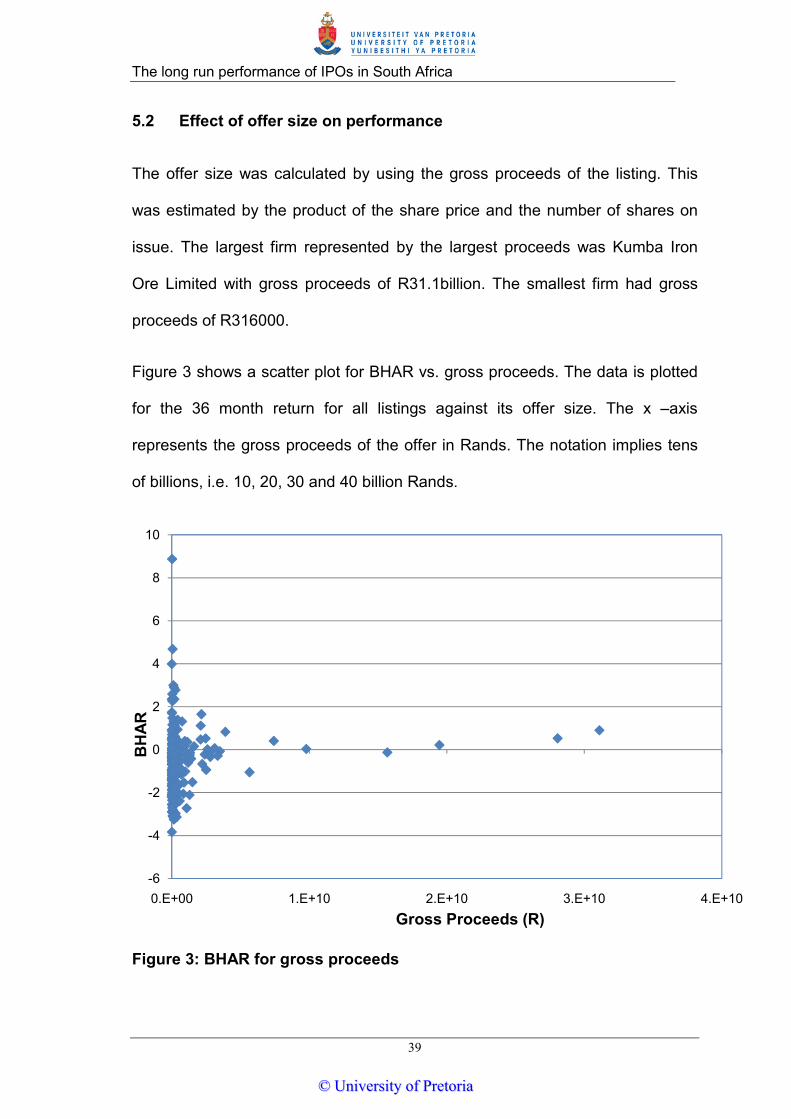
5.2 Effect of offer size on performance
The offer size was calculated by using the gross proceeds of the listing. This
was estimated by the product of the share price and the number of shares on
issue. The largest firm represented by the largest proceeds was Kumba Iron
Ore Limited with gross proceeds of R31.1billion. The smallest firm had gross
proceeds of R316000.
Figure 3 shows a scatter plot for BHAR vs. gross proceeds. The data is plotted
for the 36 month return for all listings against its offer size. The x –axis
represents the gross proceeds of the offer in Rands. The notation implies tens
of billions, i.e. 10, 20, 30 and 40 billion Rands.
Figure 3: BHAR for gross proceeds
-6
-4
-2
0
2
4
6
8
10
0.E+00 1.E+10 2.E+10 3.E+10 4.E+10
BH
AR
Gross Proceeds (R)
©© UUnniivveerrssiittyy ooff PPrreettoorriiaa
The long run performance of IPOs in South Africa
40
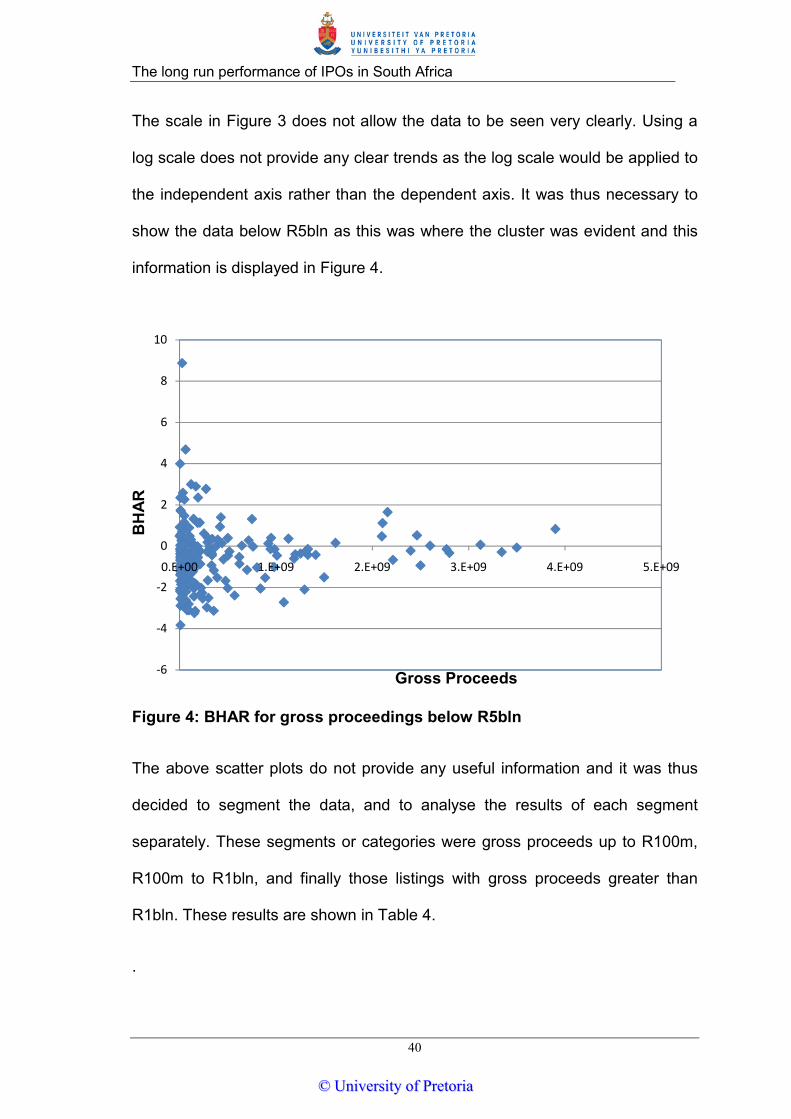
The scale in Figure 3 does not allow the data to be seen very clearly. Using a
log scale does not provide any clear trends as the log scale would be applied to
the independent axis rather than the dependent axis. It was thus necessary to
show the data below R5bln as this was where the cluster was evident and this
information is displayed in Figure 4.
Figure 4: BHAR for gross proceedings below R5bln
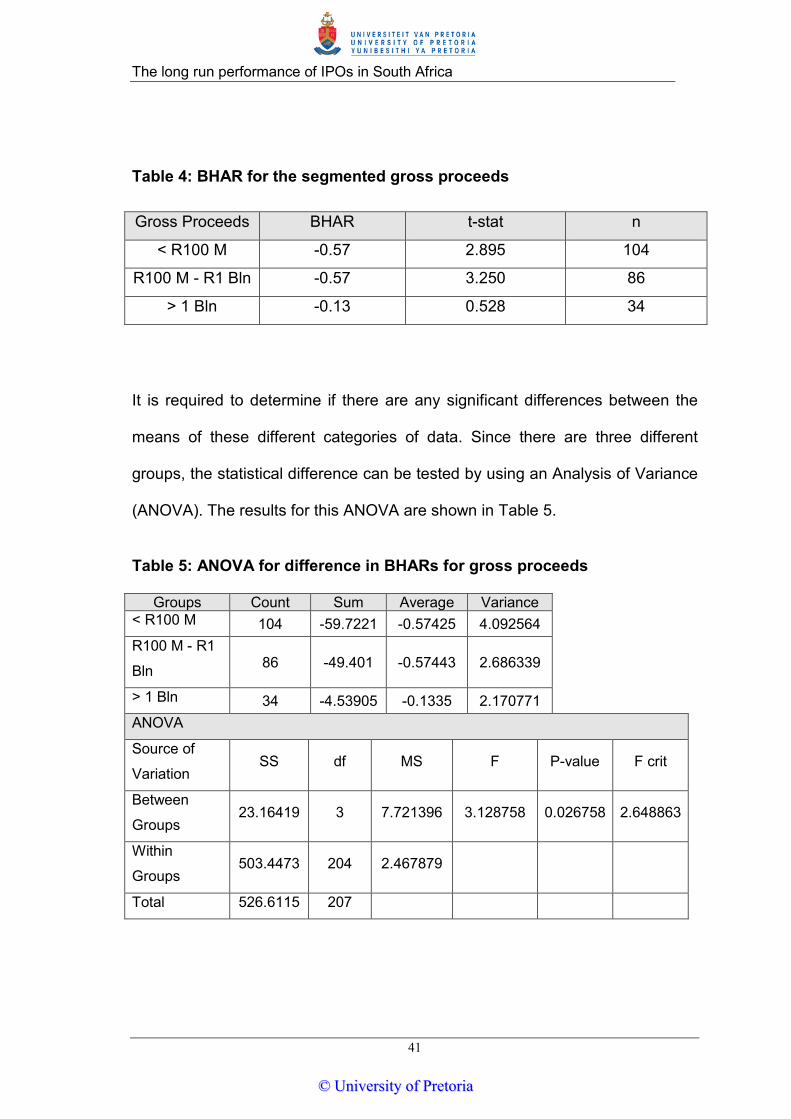
The above scatter plots do not provide any useful information and it was thus
decided to segment the data, and to analyse the results of each segment
separately. These segments or categories were gross proceeds up to R100m,
R100m to R1bln, and finally those listings with gross proceeds greater than
R1bln. These results are shown in Table 4.
.
-6
-4
-2
0
2
4
6
8
10
0.E+00 1.E+09 2.E+09 3.E+09 4.E+09 5.E+09
BH
AR
Gross Proceeds
©© UUnniivveerrssiittyy ooff PPrreettoorriiaa
The long run performance of IPOs in South Africa
41
Table 4: BHAR for the segmented gross proceeds
It is required to determine if there are any significant differences between the
means of these different categories of data. Since there are three different
groups, the statistical difference can be tested by using an Analysis of Variance
(ANOVA). The results for this ANOVA are shown in Table 5.
Table 5: ANOVA for difference in BHARs for gross proceeds
Groups Count Sum Average Variance < R100 M 104 -59.7221 -0.57425 4.092564 R100 M - R1
Bln 86 -49.401 -0.57443 2.686339
> 1 Bln 34 -4.53905 -0.1335 2.170771 ANOVA
Source of
Variation SS df MS F P-value F crit
Between
Groups 23.16419 3 7.721396 3.128758 0.026758 2.648863
Within
Groups 503.4473 204 2.467879
Total 526.6115 207
Gross Proceeds BHAR t-stat n
< R100 M -0.57 2.895 104
R100 M - R1 Bln -0.57 3.250 86
> 1 Bln -0.13 0.528 34
©© UUnniivveerrssiittyy ooff PPrreettoorriiaa
The long run performance of IPOs in South Africa
42
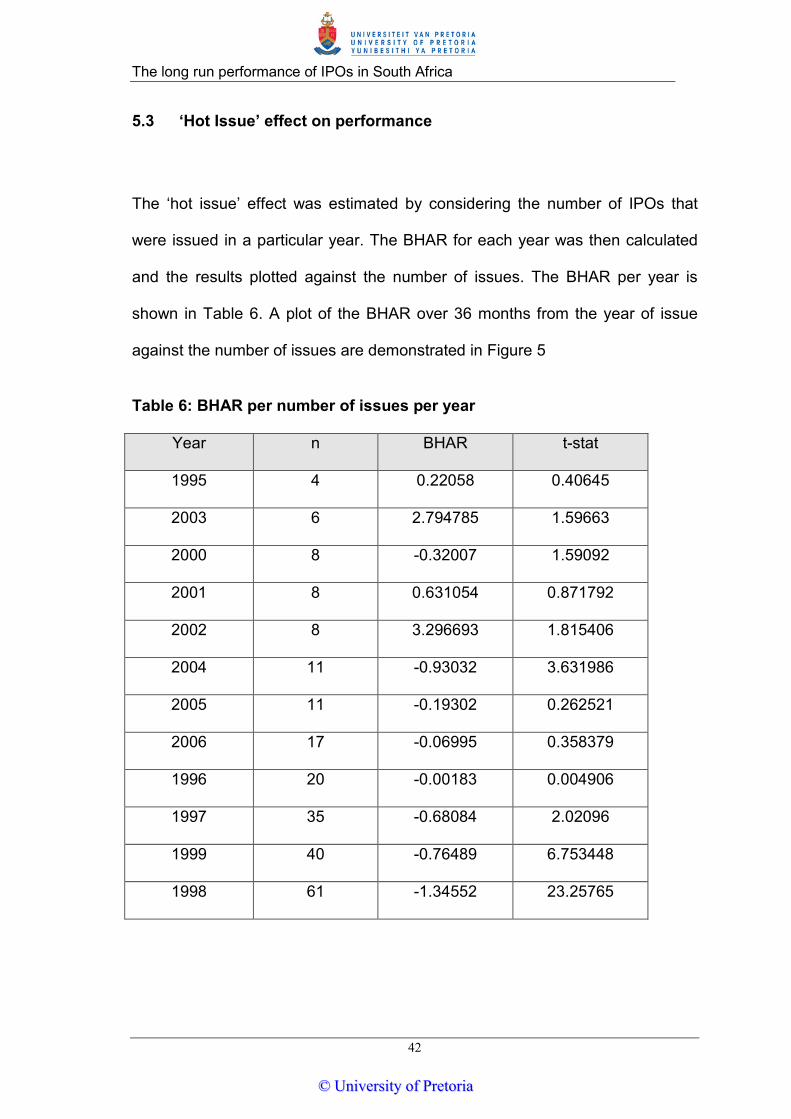
5.3 ‘Hot Issue’ effect on performance
The ‘hot issue’ effect was estimated by considering the number of IPOs that
were issued in a particular year. The BHAR for each year was then calculated
and the results plotted against the number of issues. The BHAR per year is
shown in Table 6. A plot of the BHAR over 36 months from the year of issue
against the number of issues are demonstrated in Figure 5
Table 6: BHAR per number of issues per year
Year n BHAR t-stat
1995 4 0.22058 0.40645
2003 6 2.794785 1.59663
2000 8 -0.32007 1.59092
2001 8 0.631054 0.871792
2002 8 3.296693 1.815406
2004 11 -0.93032 3.631986
2005 11 -0.19302 0.262521
2006 17 -0.06995 0.358379
1996 20 -0.00183 0.004906
1997 35 -0.68084 2.02096
1999 40 -0.76489 6.753448
1998 61 -1.34552 23.25765
©© UUnniivveerrssiittyy ooff PPrreettoorriiaa
The long run performance of IPOs in South Africa
43
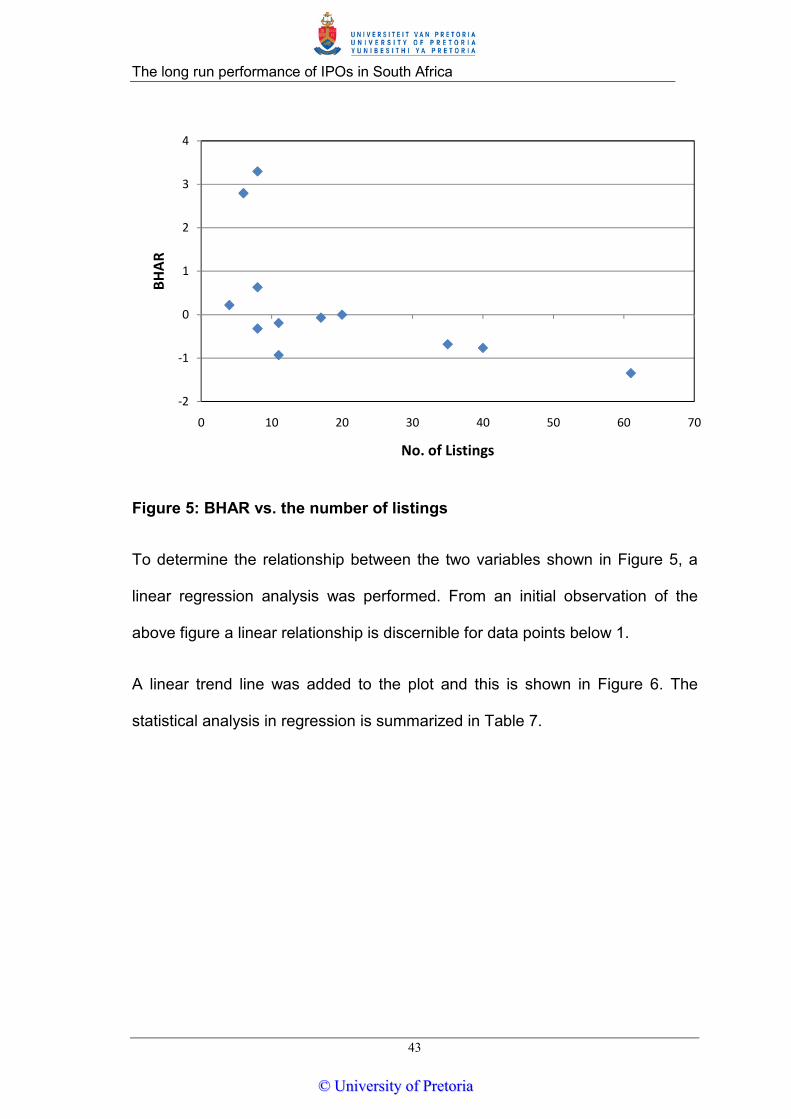
Figure 5: BHAR vs. the number of listings
To determine the relationship between the two variables shown in Figure 5, a
linear regression analysis was performed. From an initial observation of the
above figure a linear relationship is discernible for data points below 1.
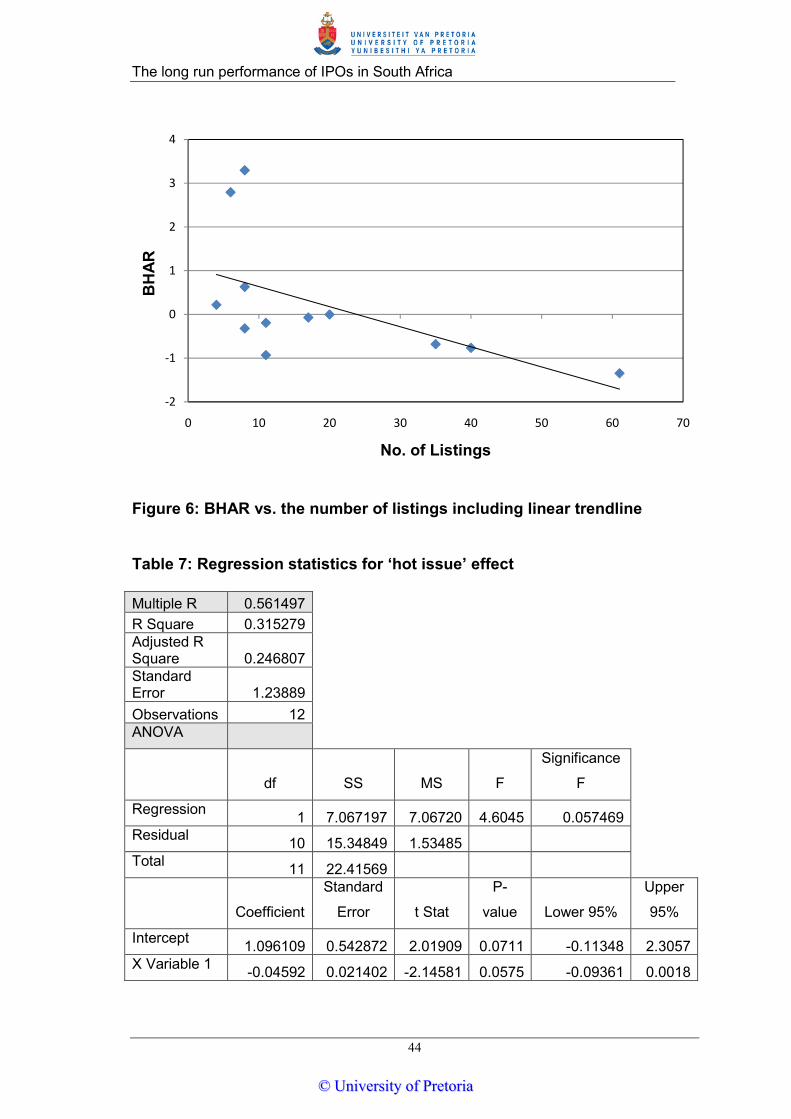
A linear trend line was added to the plot and this is shown in Figure 6. The
statistical analysis in regression is summarized in Table 7.
-2
-1
0
1
2
3
4
0 10 20 30 40 50 60 70
BHAR
No. of Listings
©© UUnniivveerrssiittyy ooff PPrreettoorriiaa
The long run performance of IPOs in South Africa
44
Figure 6: BHAR vs. the number of listings including linear trendline
Table 7: Regression statistics for ‘hot issue’ effect
Multiple R 0.561497 R Square 0.315279 Adjusted R Square 0.246807 Standard Error 1.23889 Observations 12 ANOVA
df SS MS F
Significance
F
Regression 1 7.067197 7.06720 4.6045 0.057469 Residual 10 15.34849 1.53485 Total 11 22.41569
Coefficient
Standard
Error t Stat
P-
value Lower 95%
Upper
95%
Intercept 1.096109 0.542872 2.01909 0.0711 -0.11348 2.3057 X Variable 1 -0.04592 0.021402 -2.14581 0.0575 -0.09361 0.0018
-2
-1
0
1
2
3
4
0 10 20 30 40 50 60 70
BH
AR
No. of Listings
©© UUnniivveerrssiittyy ooff PPrreettoorriiaa
The long run performance of IPOs in South Africa
45
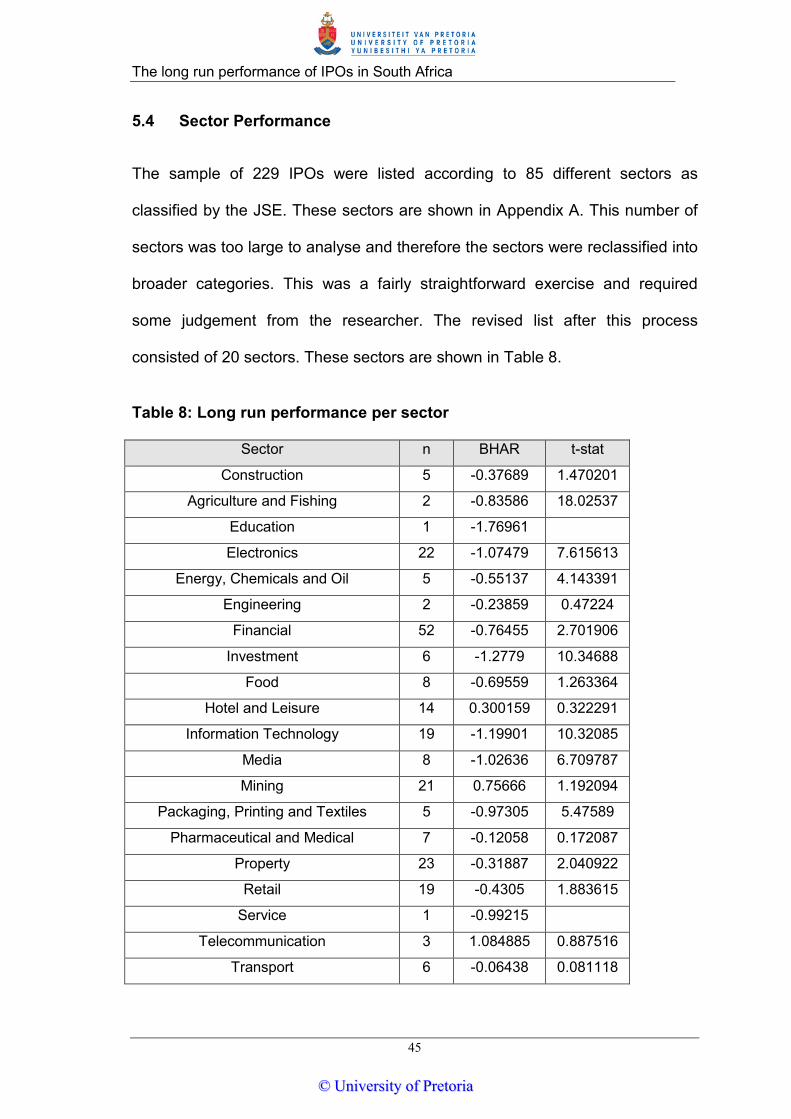
5.4 Sector Performance
The sample of 229 IPOs were listed according to 85 different sectors as
classified by the JSE. These sectors are shown in Appendix A. This number of
sectors was too large to analyse and therefore the sectors were reclassified into
broader categories. This was a fairly straightforward exercise and required
some judgement from the researcher. The revised list after this process
consisted of 20 sectors. These sectors are shown in Table 8.
Table 8: Long run performance per sector
Sector n BHAR t-stat
Construction 5 -0.37689 1.470201
Agriculture and Fishing 2 -0.83586 18.02537
Education 1 -1.76961
Electronics 22 -1.07479 7.615613
Energy, Chemicals and Oil 5 -0.55137 4.143391
Engineering 2 -0.23859 0.47224
Financial 52 -0.76455 2.701906
Investment 6 -1.2779 10.34688
Food 8 -0.69559 1.263364
Hotel and Leisure 14 0.300159 0.322291
Information Technology 19 -1.19901 10.32085
Media 8 -1.02636 6.709787
Mining 21 0.75666 1.192094
Packaging, Printing and Textiles 5 -0.97305 5.47589
Pharmaceutical and Medical 7 -0.12058 0.172087
Property 23 -0.31887 2.040922
Retail 19 -0.4305 1.883615
Service 1 -0.99215
Telecommunication 3 1.084885 0.887516
Transport 6 -0.06438 0.081118
©© UUnniivveerrssiittyy ooff PPrreettoorriiaa
The long run performance of IPOs in South Africa
46
At a first glance it can be seen that the financial sector with the highest number
of observations in the sampling period indicates a very poor return of -76%. The
mining sector depicts the opposite return with positive results of 76%. The
number of samples in the mining sector was however only 21.
As can be seen from Table 8, the number of samples per sector is insufficient to
establish any significant statistical results. It was thus decided to further group
the sectors outlined into broader sectors, which provided a higher number
samples per sector. This process resulted in the following broad sectors being
outlined: technology, industrial, financials and other. It was decided not to group
mining into any of these sectors. Firstly, mining does not fit into any of the broad
sectors, and secondly, the positive return offered by the mining sector is not
reflected by any of the other sectors and hence this positive result will be diluted
if grouped unnecessarily.
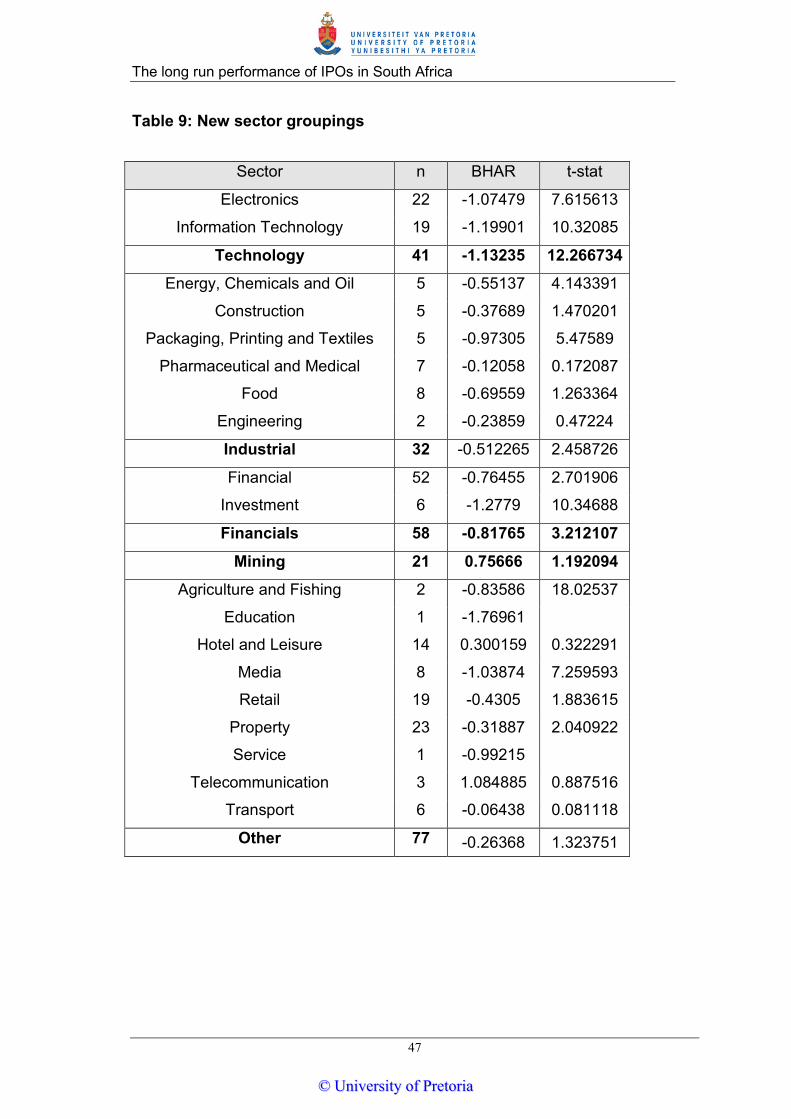
The new sectors defined above are shown in Table 9. The revised sector is
shown in bold, with the sub sectors that it encompasses listed above. A new
BHAR and t statistic was calculated for these sectors and is indicated in the
table.
©© UUnniivveerrssiittyy ooff PPrreettoorriiaa
The long run performance of IPOs in South Africa
47
Table 9: New sector groupings
Sector n BHAR t-stat
Electronics 22 -1.07479 7.615613
Information Technology 19 -1.19901 10.32085
Technology 41 -1.13235 12.266734
Energy, Chemicals and Oil 5 -0.55137 4.143391
Construction 5 -0.37689 1.470201
Packaging, Printing and Textiles 5 -0.97305 5.47589
Pharmaceutical and Medical 7 -0.12058 0.172087
Food 8 -0.69559 1.263364
Engineering 2 -0.23859 0.47224
Industrial 32 -0.512265 2.458726
Financial 52 -0.76455 2.701906
Investment 6 -1.2779 10.34688
Financials 58 -0.81765 3.212107
Mining 21 0.75666 1.192094
Agriculture and Fishing 2 -0.83586 18.02537
Education 1 -1.76961
Hotel and Leisure 14 0.300159 0.322291
Media 8 -1.03874 7.259593
Retail 19 -0.4305 1.883615
Property 23 -0.31887 2.040922
Service 1 -0.99215
Telecommunication 3 1.084885 0.887516
Transport 6 -0.06438 0.081118
Other 77 -0.26368 1.323751
©© UUnniivveerrssiittyy ooff PPrreettoorriiaa
The long run performance of IPOs in South Africa
48
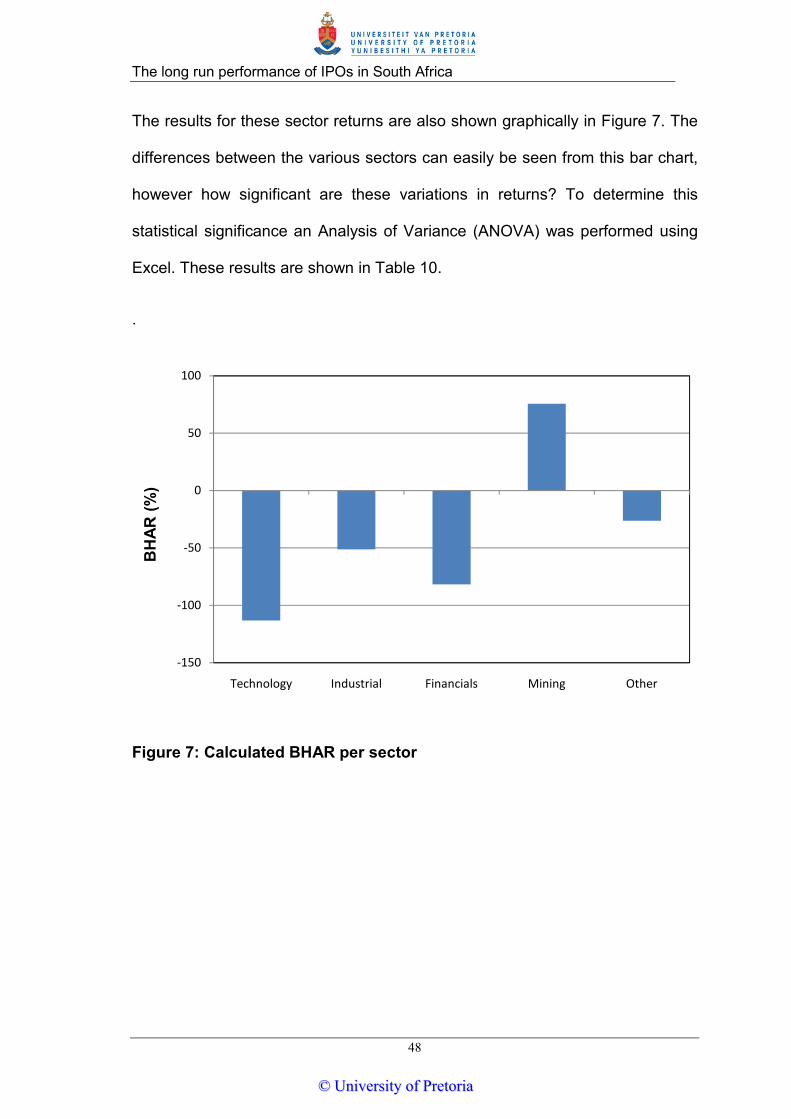
The results for these sector returns are also shown graphically in Figure 7. The
differences between the various sectors can easily be seen from this bar chart,
however how significant are these variations in returns? To determine this
statistical significance an Analysis of Variance (ANOVA) was performed using
Excel. These results are shown in Table 10.
.
Figure 7: Calculated BHAR per sector
-150
-100
-50
0
50
100
Technology Industrial Financials Mining Other
BH
AR (%
)
©© UUnniivveerrssiittyy ooff PPrreettoorriiaa
The long run performance of IPOs in South Africa
49
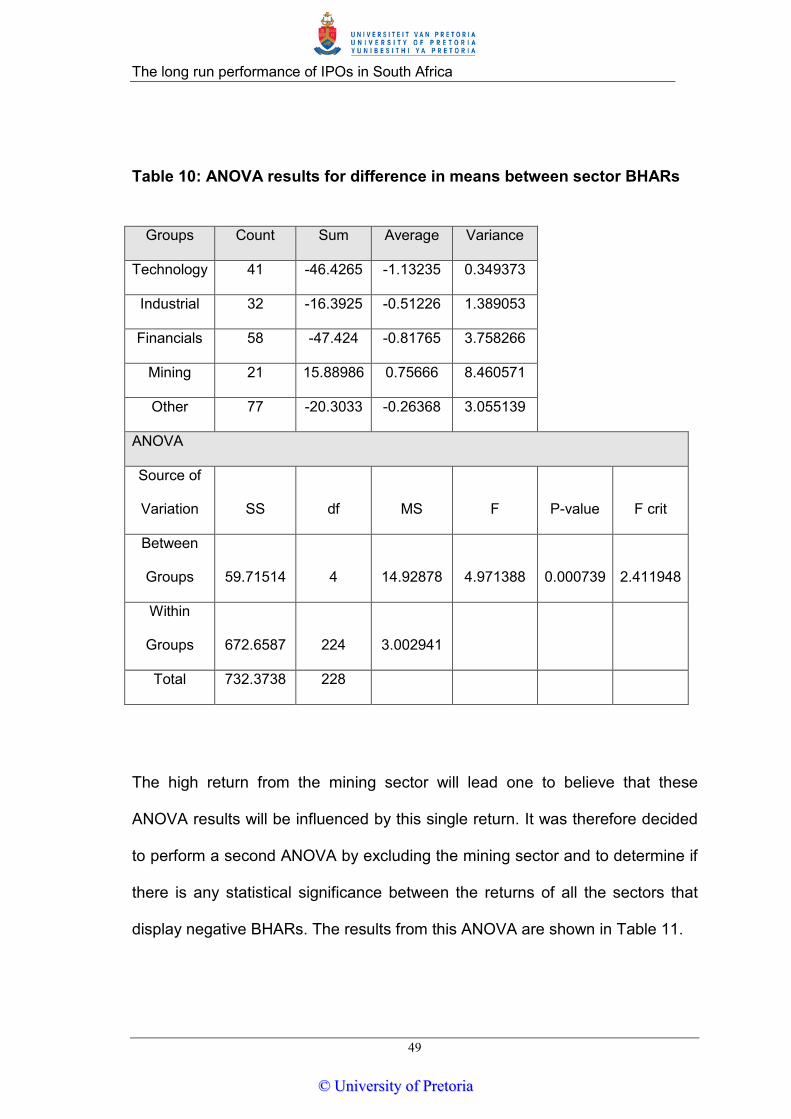
Table 10: ANOVA results for difference in means between sector BHARs
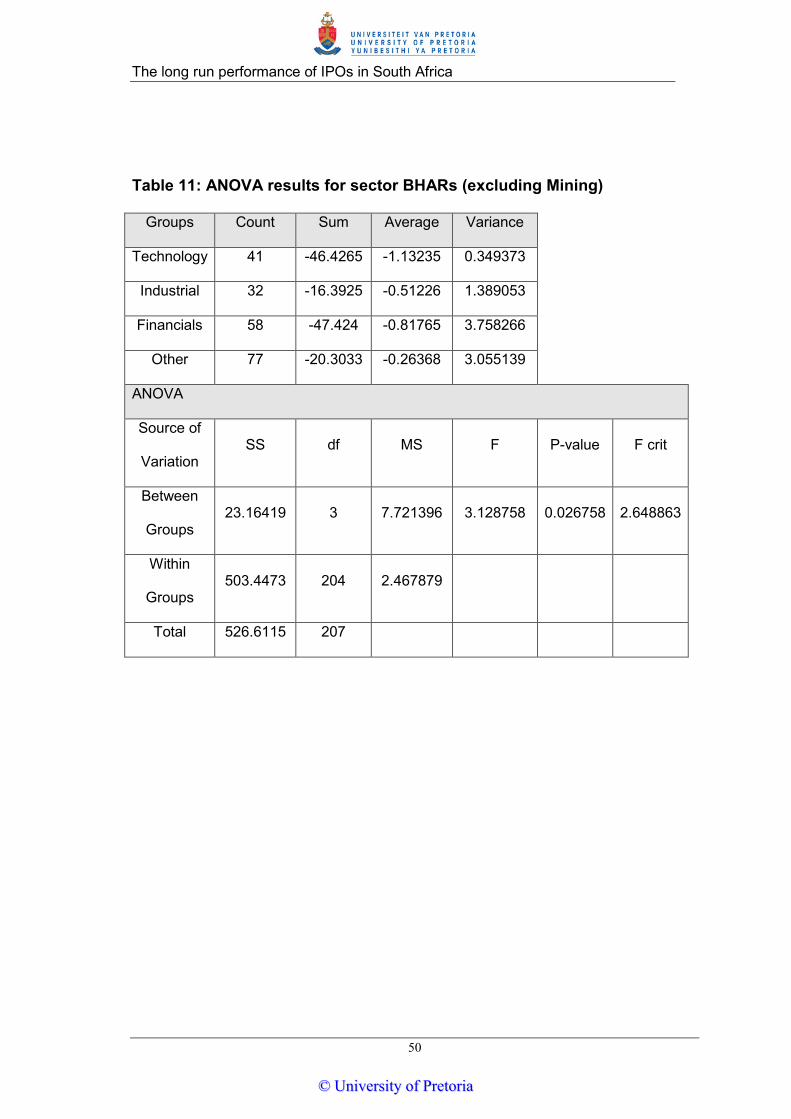
The high return from the mining sector will lead one to believe that these
ANOVA results will be influenced by this single return. It was therefore decided
to perform a second ANOVA by excluding the mining sector and to determine if
there is any statistical significance between the returns of all the sectors that
display negative BHARs. The results from this ANOVA are shown in Table 11.
Groups Count Sum Average Variance
Technology 41 -46.4265 -1.13235 0.349373
Industrial 32 -16.3925 -0.51226 1.389053
Financials 58 -47.424 -0.81765 3.758266
Mining 21 15.88986 0.75666 8.460571
Other 77 -20.3033 -0.26368 3.055139
ANOVA
Source of
Variation SS df MS F P-value F crit
Between
Groups 59.71514 4 14.92878 4.971388 0.000739 2.411948
Within
Groups 672.6587 224 3.002941
Total 732.3738 228
©© UUnniivveerrssiittyy ooff PPrreettoorriiaa
The long run performance of IPOs in South Africa
50
Table 11: ANOVA results for sector BHARs (excluding Mining)
Groups Count Sum Average Variance
Technology 41 -46.4265 -1.13235 0.349373
Industrial 32 -16.3925 -0.51226 1.389053
Financials 58 -47.424 -0.81765 3.758266
Other 77 -20.3033 -0.26368 3.055139
ANOVA
Source of
Variation SS df MS F P-value F crit
Between
Groups 23.16419 3 7.721396 3.128758 0.026758 2.648863
Within
Groups 503.4473 204 2.467879
Total 526.6115 207
©© UUnniivveerrssiittyy ooff PPrreettoorriiaa
The long run performance of IPOs in South Africa
51
6 Discussion
The results obtained in the process of meeting the objectives that were set out
in chapter 4 were presented in the previous chapter. The context of these
results within the scope of the present study as well as in meeting the
hypotheses defined earlier will now be discussed. The discussion will follow the
same sequence that the results were presented.
6.1 Long run performance
The objective for this part of the research was to determine what the actual long
run performance of IPOs in South Africa was during our sample period. The
long run performance was estimated using both the BHAR and CAR methods.
The hypothesis for this objective was the following:
H0: µIPO = 0
Ha: µIPO < 0, µIPO > 0
As a starting point we assumed the null hypothesis was zero for both BHAR and
CAR, which implied that the long run performance was the same as the broad
market index, which in this case was the JSE All Share Index (ALSI). The long
run performance is shown in Table 3 and the results for the BHAR and CAR are
shown separately in Figure 1 and Figure 2.
©© UUnniivveerrssiittyy ooff PPrreettoorriiaa
The long run performance of IPOs in South Africa
52
The results for BHAR and CAR follow a similar profile over the 36 month period.
Both measures show positive abnormal returns initially consistent with the
underpricing and high initial returns prevalent in other markets. BHAR increases
steadily to a peak of 14% after 6 months.
CAR also reaches a peak after 6 months; however it does not depict a steady
rise to the return of 6%. The return for CAR becomes negative between the
tenth and eleventh months after listing. BHAR provide positive returns for a
further month before it also becomes negative. The return ‘lingers’ around the
zero mark for a further five months, increasing twice before its steady decline.
The return again shows some volatile behaviour after 28 months. The CAR
performance shows some erratic performance for the first six months; however
it thereafter follows a steep decline.
The reasons for these differences between CAR and BHAR can be seen in the
formulas used which were described in section 4.3.1. CAR does not consider
compounding and uses the arithmetic average over the sampling period rather
than the geometric average used by BHAR. The compounding effect ensures
that BHAR is always higher than CAR (see Figure 8). It is only from month 32
that BHAR is observed to fall below CAR.
From Table 3 it can be seen that the returns for BHAR are only statistically
significant after 23 months after listing. CAR on the other hand shows significant
returns after only 12 months. This is not a concern with regards to this study as
we are primarily concerned with the performance after 36 months. These results
are very significant as the high t-statistics imply for both BHAR and CAR. The
©© UUnniivveerrssiittyy ooff PPrreettoorriiaa
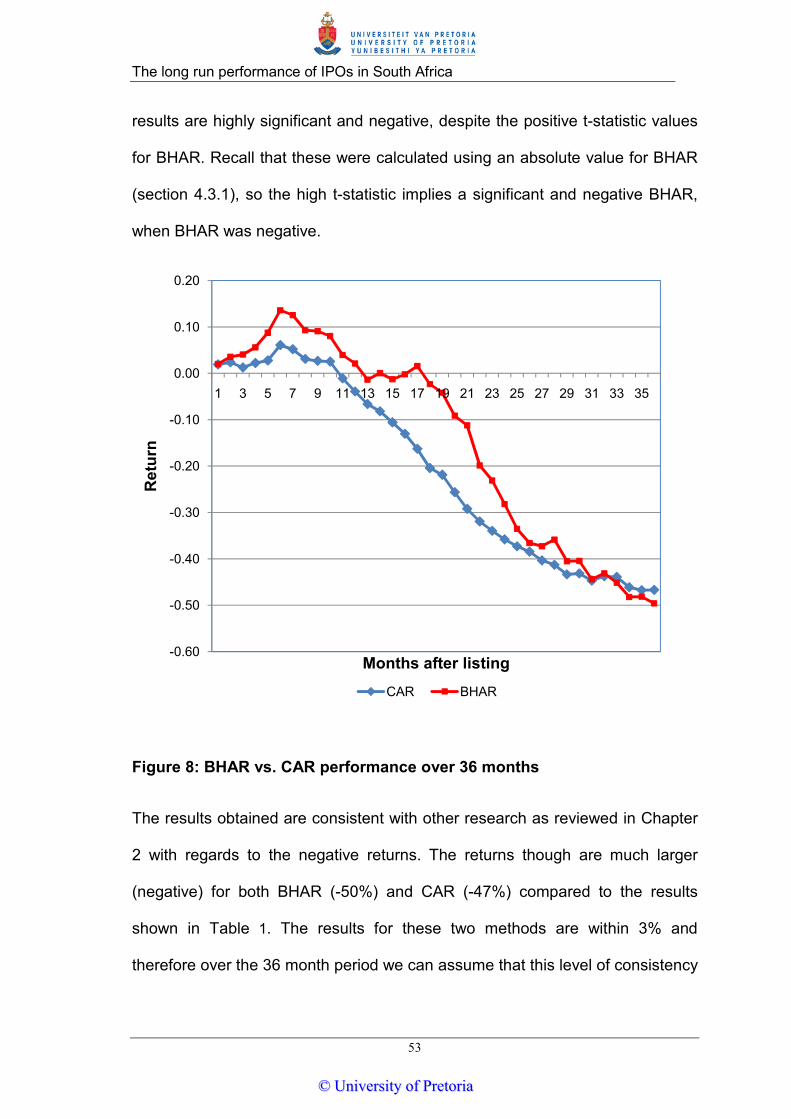
The long run performance of IPOs in South Africa
53
results are highly significant and negative, despite the positive t-statistic values
for BHAR. Recall that these were calculated using an absolute value for BHAR
(section 4.3.1), so the high t-statistic implies a significant and negative BHAR,
when BHAR was negative.
Figure 8: BHAR vs. CAR performance over 36 months
The results obtained are consistent with other research as reviewed in Chapter
2 with regards to the negative returns. The returns though are much larger
(negative) for both BHAR (-50%) and CAR (-47%) compared to the results
shown in Table 1. The results for these two methods are within 3% and
therefore over the 36 month period we can assume that this level of consistency
-0.60
-0.50
-0.40
-0.30
-0.20
-0.10
0.00
0.10
0.20
1 3 5 7 9 11 13 15 17 19 21 23 25 27 29 31 33 35
Ret
urn
Months after listingCAR BHAR
©© UUnniivveerrssiittyy ooff PPrreettoorriiaa
The long run performance of IPOs in South Africa
54
satisfies our robustness test, and BHAR can also be used with a high level of
confidence for the remainder of the research objectives.
Comparing the returns above to studies reviewed in chapter 2, the results for
Thailand come closest at -42% BHAR (Vithessonthi, 2008). These returns were
also obtained within the sampling period used for the present study, and
represent that of another emerging economy. The results of China with -30%
now look more favourable considering this group of developing countries that it
is being compared with (Cai, Liu and Mase, 2008.
In the study undertaken by Drobetz, Kammerman and Wälchli (2005), they
estimated the long run performance of 109 Swiss IPOs from 1983 to 2000 and
found that the underperformance after three years was only about 7.5%, it
increased to 21% after four years and then to 101% after ten years. Based on
this trend, the underperformance would have reached 50% after about 6 years
of listing.
It therefore took IPOs in South Africa half the time to reach a 50%
underperformance that was shown by Swiss IPOs. Of course it may not be
practical to compare results across markets as the Swiss IPOs would have
used the Swiss market as a benchmark and this study uses the South African
market. The time period is also different for both investigations.
IPO or any stock market performance is very dependent on the time period
adopted. The political, economic, social and legal environment during the
sample period of the country assessed will all have an influence on the
expected returns.
©© UUnniivveerrssiittyy ooff PPrreettoorriiaa
The long run performance of IPOs in South Africa
55
South Africa experienced mixed growth rates during the sampling period (see
Appendix B) with the period during 2000 to 2006 showing a favourable growth
rate and the period 1995 to 1999 showing a declining rate with a low of 0.5% in
1998. Despite the initial poor growth in the sample period, the poor long run
performance of IPOs over the 12 years in light of the ‘boom’ years of growth
experienced from 2000 to 2006 is still surprising.
It must also be noted that these results were derived using a broad market
index, as noted by Bessler and Thies, (2007). Results may differ if a matching
firm approach was used or if specific sector indices were adopted for each
different sector. Future research could be performed using other benchmarks or
methods and comparing the results to the present research.
The hypothesis that was defined earlier now needs to be accepted or rejected
based on the preceding analysis. The null hypothesis for the long run
performance stated that the abnormal long run performance measured by
BHAR and CAR is equal to zero. From the results it was found that both BHAR
and CAR significantly underperformed the market which was approximated with
the ALSI as a benchmark. Based on these results the null hypothesis must be
rejected. IPOs in South Africa therefore underperform the market.
There are many factors that could explain this underperformance. These were
discussed as a supplementary note in chapter 2, and included factors like board
composition and venture capital backing. A more concise study is required
where these factors need to be explored to determine its effect on the
performance of IPOs in South Africa. For such an analysis the long run
©© UUnniivveerrssiittyy ooff PPrreettoorriiaa
The long run performance of IPOs in South Africa
56
performance needs to be calculated using more specific benchmarks which
include industry or sector indices as well as a matching firm approach where
more accurate estimates of performance can be made.
6.2 Effect of offer size on performance
The offer size in terms of the gross proceeds from the listing was used as a
proxy for the size of the firm. From Figure 3 it can be seen that the majority of
listings were clustered below about R5bln, with no apparent trend visible.
Returns appear to be symmetrical about the axis implying positive and negative
returns for most of the listings.
The higher offer sizes indicate better returns, with all the offers above about
R10bln hovering on the positive return quadrant of the graph. Figure 4 shows
the returns for gross proceeds below R5bln which was identified earlier as the
area where most of the clustering of data was concentrated. From this figure it
is evident that the data is skewed more towards the negative returns which
were expected from the results discussed from section 6.1.
Due to the limited information available from these scatter plots and with no
distinct pattern evident, it was decided to segment the proceeds as shown in
Table 4.
From these results it can already be seen that the difference in returns between
the first group (<R100m) and the second group (R100m to R1bln) was the
©© UUnniivveerrssiittyy ooff PPrreettoorriiaa
The long run performance of IPOs in South Africa
57
same with a BHAR of -57%. The group of proceeds above R1bln showed a
return of -13%.
To test if there were any differences between the 3 groups of data, an ANOVA
was used. The results for the ANOVA was summarised in Table 5.
The null hypothesis defined for this objective of the study is:
H0: µ1 = µ2 = µ3 , for the three groups identified, implying that the three means
must be equal for the null hypothesis to be true.
The Alternate hypothesis is therefore:
Ha: µ1 ≠ µ2 ≠ µ3
For the hypothesis to be accepted one of the groups must be different from any
of the other two. The f-value calculated and shown in Table 5 was higher than
the f critical value. This implies that the variance between the means of the
three groups of data is larger than the average of the three variances. We can
therefore reject the null hypothesis that the means are the same and conclude
that there are significant differences at the 95% confidence level between the
different groups of gross proceeds.
This essentially suggests that firms with the larger gross proceeds provide
better returns than those of smaller sized firms. These results are similar to
those of Drobetz et. al. (2005) and Goergen et. al (2007) who also found in their
©© UUnniivveerrssiittyy ooff PPrreettoorriiaa
The long run performance of IPOs in South Africa
58
research that smaller firms had higher levels of underperformance in the long
run than did larger firms.
Vithessonthi (2008) however found for his study of IPOs in Thailand that the
segment he defined for medium sized firms (gross proceeds between 300
million and 600 million Baht) showed the best return of -23%. The small size
firm category (less than 300 million Baht) showed a return of -32%. The large
firm category (proceeds larger than 600 million Baht) generated returns that
underperformed the market by 136%. These results for an emerging market are
significantly different from the results found here.
Similar results to Vithesonthi (2008) were reported by Cai et. al. (2007) for an
evaluation of Chinese IPOs. They also found that the smaller sized firms
showed a better performance than the larger sized firms.
Although South Africa is classified as an emerging market, its financial services
sector is backed by a sound regulatory and legal framework and so compares
favourably to other developed countries. It may therefore not be reasonable to
compare IPO performance to other developed countries.
The evidence of larger sized firms producing better results than smaller firms
may suggest that investors in South Africa are risk averse and would prefer
investing in larger firms where they would expect their money to be safe. Larger
firms may also allow bulk buying from asset managers who may look to these
large organisations to hedge the risk on their portfolios.
©© UUnniivveerrssiittyy ooff PPrreettoorriiaa
The long run performance of IPOs in South Africa
59
The stronger long run performance of these larger organisations may also imply
that the initial returns are low, where investors are looking to hold on these
shares for the long run. The initial returns and long run performance should be
investigated for different size firms to determine if there are specific patterns in
the initial and aftermarket trading of these shares. This was beyond the scope
of the present research.
The group of proceeds above R1bln shows returns of -13%, which is
significantly different from the returns offered by the other two segments. It will
thus be interesting to see if there are noticeable differences within this group.
This was not done initially as it would have reduced the sub sample size, which
was already small (n = 34) and thus any inferences drawn would not have been
statistically significant.
However, having already established that there are differences between small
and large firms, it is worth performing a check to see if there are differences
within this group. In keeping with our factor of 10 principle of segmenting the
IPOs by size, the group of IPOs with proceeds of R1bln and over was further
segmented into IPOs with gross proceeds above R10bln.
These results are shown in Table 12. For gross proceeds larger than R10bln
which comprised only four firms, the returns were a healthy 37% over 36
months. Although these results are not significant, due mostly to the small
sample size, this is still something that investors should be aware of.
There may not be many of these listings in the future, so achieving a healthy
sample to draw statistical significant inferences may not be possible in the near
©© UUnniivveerrssiittyy ooff PPrreettoorriiaa
The long run performance of IPOs in South Africa
60
future. For passive investors these IPOs may be desirable as they look to beat
the market without having to actively manage their assets.
Table 12: BHAR for gross proceeds larger than R10bln
6.3 ‘Hot Issue’ effect on performance
The results for the ‘hot issue’ effect are presented in section 5.3. The ‘hot issue’
effect in essence refers to the high initial returns provided by the higher than
normal IPOs listed in a specific period. As discussed by Helwege and Liang
(2004) hot cycles are found to result in poor long run performance. Kiymaz
(2000) also show that strong initial returns are followed by poor long run
performance. This was therefore the underlying theoretical background used to
test for the relationship between strong IPO activity and long run performance.
The objective here was thus to test if the poor long run performance of IPOs got
worse with increased levels of IPO activity. The analytical approach allows a
positive return to be accepted; however following the results from section 6.1 a
positive return is unlikely.
The number of IPOs listed per specific year is shown in Table 6. The highest
number of IPOs was listed in 1998. It should be noted that these are only the
BHAR t-stat n
R1bln - R10bln -0.20098 0.711045 30
> R10 Bln 0.372607 1.313902 4
©© UUnniivveerrssiittyy ooff PPrreettoorriiaa
The long run performance of IPOs in South Africa
61
IPOs that were included in the final sample, after IPOs of companies that have
delisted before the 36 month window period were removed from the sample. It
is thus important to consider the sample IPOs to the total IPOs listed per year.
Figure 9 confirms that the omission of IPOs due to delisting within the 36 month
period did not change the trend of the graph, i.e. the number of IPOs relative to
other years remained the same. Figure 9 displays a high trend of delisting, with
the highest percentage evident in year 1995 with 69%; year 2006 was second
with 54%. Year 1995 only considered IPOs from July as this was when the All
Share data was available. There were no companies that were delisted within
the 36 month period for those IPOs that were listed in 1996 and only one
delisting for those companies that listed in 2002. The highest number of
companies delisted were from those companies listed in 1998 with 40, however
as this was also the year with the largest IPO activity (101) this delisting only
represented 40% of all the IPOs.
©© UUnniivveerrssiittyy ooff PPrreettoorriiaa
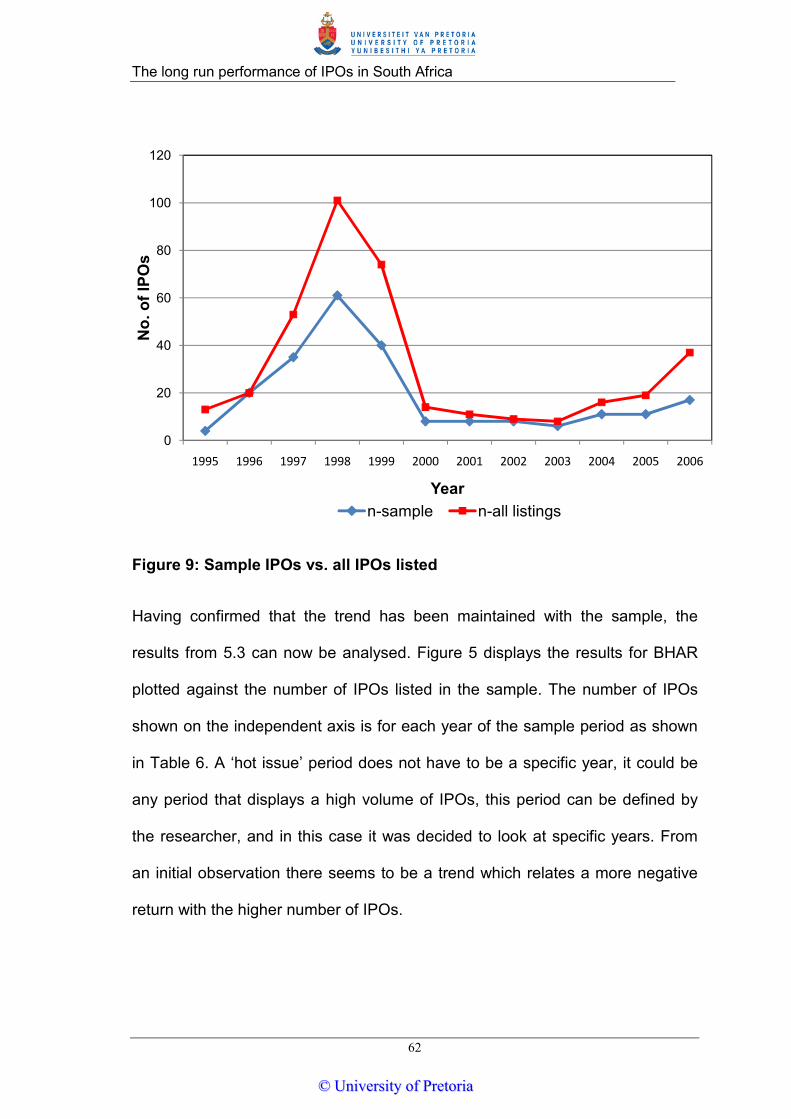
The long run performance of IPOs in South Africa
62
Figure 9: Sample IPOs vs. all IPOs listed
Having confirmed that the trend has been maintained with the sample, the
results from 5.3 can now be analysed. Figure 5 displays the results for BHAR
plotted against the number of IPOs listed in the sample. The number of IPOs
shown on the independent axis is for each year of the sample period as shown
in Table 6. A ‘hot issue’ period does not have to be a specific year, it could be
any period that displays a high volume of IPOs, this period can be defined by
the researcher, and in this case it was decided to look at specific years. From
an initial observation there seems to be a trend which relates a more negative
return with the higher number of IPOs.
0
20
40
60
80
100
120
1995 1996 1997 1998 1999 2000 2001 2002 2003 2004 2005 2006
No.
of I
POs
Yearn-sample n-all listings
©© UUnniivveerrssiittyy ooff PPrreettoorriiaa

The long run performance of IPOs in South Africa
63
A linear trend line was added to the data and a regression analysis was
performed to quantify this apparent relationship. The linear trend line is
superimposed on the data in Figure 6. The line is seen to be skewed upwards
at the lower number of IPOs and high BHAR recorded for these years. The
results of the regression analysis are shown in Table 7.
It is important at this point to recall our hypothesis:
Model: BHAR = βo + β1X (where X = number of IPOs)
H0: β1 = 0.
Ha: β1 ≠ 0
The null hypothesis states that a linear relationship does not exist between the
variables of long run performance and the number of IPOs listed. The linear
relationship is based on the model above. The coefficient of the slope must not
be equal to zero for a linear relationship to exist.
According to the results from Table 7 the model will now look like the following:
BHAR = 1.096 – 0.046X
©© UUnniivveerrssiittyy ooff PPrreettoorriiaa
The long run performance of IPOs in South Africa
64
The negative β1 implies that there is a negative relationship between BHAR and
the number of IPO, i.e.: which confirms our assumption that the greater the IPO
activity the worse the long run performance. However, it needs to be assessed
whether or not this result is significant. The p value for the slope is 0.0575 which
is greater than 0.05 (using a 95% confidence limit) we must therefore accept the
null hypothesis that β1 = 0. This is further emphasized by the R2 value of only
0.31. There is thus no significant relationship between the long run performance
of IPOs and IPO activity.
The obvious tendency when observing Figure 6 is to eliminate the two data
points that look to pull the trend line upwards. These data points may be
assumed to account for the poor regression results that have been generated.
The two outliers occur in 2002 and 2003. These high BHAR values also
represent the lowest number of IPOs listed for the corresponding years of 8 and
6 respectively. The t statistic of 1.8 and 1.6 also suggest that these BHAR
estimates are not significant.
It should also be remembered that 2002 and 2003 were the two periods that
indicated the lowest number of delisting over the subsequent 36 month period
(apart from 1996 where there was none). The one and two firm delisting in 2002
and 2003 also represents the lowest delisting ratio of 11% and 25%
respectively. The two years in question are also in the middle of our sample
period, and simply rejecting these will leave a gap in our data. The urge to reject
these outliers was therefore resisted and the current results maintained.
©© UUnniivveerrssiittyy ooff PPrreettoorriiaa
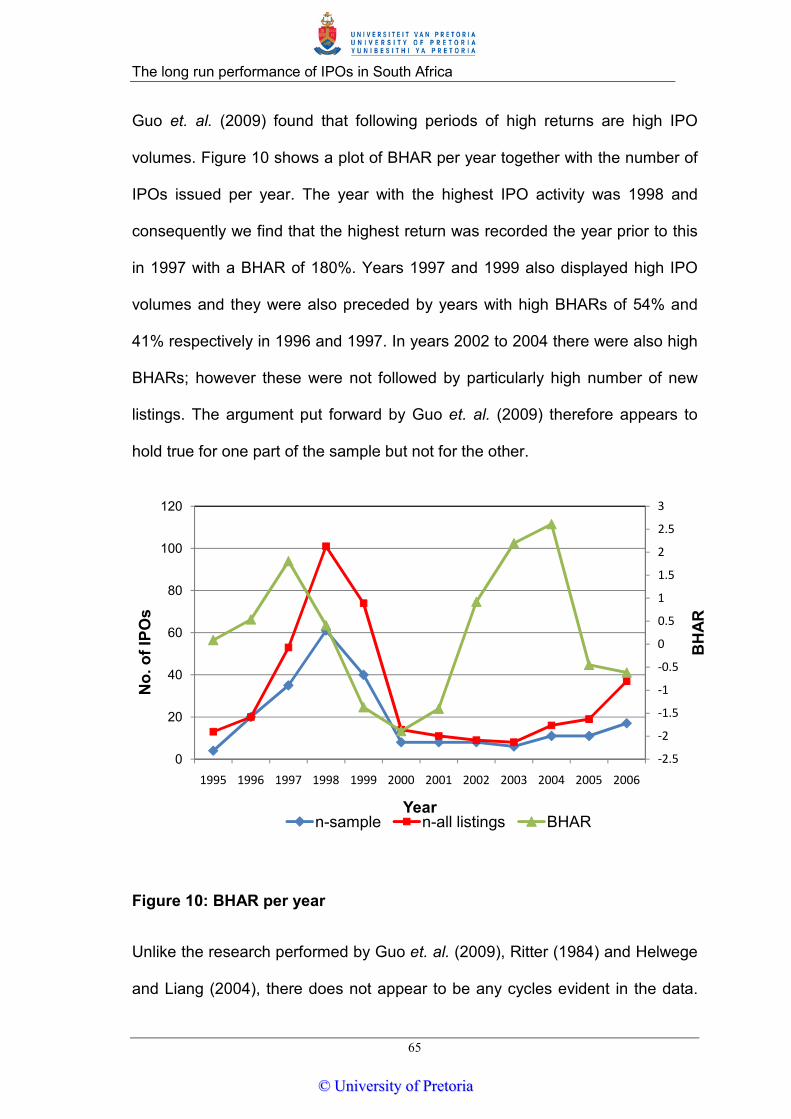
The long run performance of IPOs in South Africa
65
Guo et. al. (2009) found that following periods of high returns are high IPO
volumes. Figure 10 shows a plot of BHAR per year together with the number of
IPOs issued per year. The year with the highest IPO activity was 1998 and
consequently we find that the highest return was recorded the year prior to this
in 1997 with a BHAR of 180%. Years 1997 and 1999 also displayed high IPO
volumes and they were also preceded by years with high BHARs of 54% and
41% respectively in 1996 and 1997. In years 2002 to 2004 there were also high
BHARs; however these were not followed by particularly high number of new
listings. The argument put forward by Guo et. al. (2009) therefore appears to
hold true for one part of the sample but not for the other.
Figure 10: BHAR per year
Unlike the research performed by Guo et. al. (2009), Ritter (1984) and Helwege
and Liang (2004), there does not appear to be any cycles evident in the data.
-2.5
-2
-1.5
-1
-0.5
0
0.5
1
1.5
2
2.5
3
0
20
40
60
80
100
120
1995 1996 1997 1998 1999 2000 2001 2002 2003 2004 2005 2006
BH
AR
No.
of I
POs
Yearn-sample n-all listings BHAR
©© UUnniivveerrssiittyy ooff PPrreettoorriiaa
The long run performance of IPOs in South Africa
66
The highest IPO activity occurs in the period from 1997 to 1999. This three year
window showed particularly high IPO activity in the 12 year sample period. For
cycles to be easily identified the sample period needs to be sufficiently long
enough like those of Ritter (1984) and Helwege and Liang (2004) who
considered a 23 and 25 year period.
6.4 Sector Performance
The results for the sector analysis are presented in Table 8. The financial sector
has the highest number of observations in the sampling period; however it
indicates a poor return of -76%. The large number of IPOs in the financial sector
may be an indication of the advanced state of this sector which makes it
compare favourably to other developed markets.
For the analysis of the sector performance, adopting a broad index such as the
ALSI was ideal as it allows a fair comparison between them. This would not
have been possible if individual indices were used, or if a matching firm
approach was used, as they would not all be compared to the same benchmark,
and would render this exercise fruitless.
The mining sector depicts an opposite return to that of the financial sector with
positive results of 76%, even though the number of listings was only 21. This
may be attributed to the rich resources available in the country, especially with
regard to gold and platinum which will have the highest weighting based on the
©© UUnniivveerrssiittyy ooff PPrreettoorriiaa
The long run performance of IPOs in South Africa
67
price of these commodities. The firm with the highest offer size was also from
the mining sector: Kumba Iron Ore. This firm had gross proceeds of over
R31bln. Billiton PLC was the second largest firm with gross proceeds of over
R28 Bln.
As reported in section 5.4, the sectors were re-categorised in order to allow a
reasonable number of IPOs per sector. After this reclassification exercise, the
following sectors were defined:
• Technology
• Industrial
• Financials
• Mining
• Other
From Figure 7 it can be seen that all the sectors, except for the mining sector
show a negative return over the three year period. The BHAR shown are -113%
for financials, -51% for industrials, -82% for financials, 76% for mining and -26%
for all the other sectors that do not fall into the previous four sectors. For a list of
all subsectors that are included in the above general sectors, see Appendix A.
©© UUnniivveerrssiittyy ooff PPrreettoorriiaa
The long run performance of IPOs in South Africa
68
Recall the null hypothesis: The long run performance of IPOs across different
sectors is the same.
H0: µsi = µsj = ...= µsn (where µsi,j = BHAR for sector i, j; i
≠ j. i,j = 1 to n, n = number of
sectors in sample)
Ha: µsi ≠ µsj ≠ ... ≠ µsn
The null hypothesis tests whether the mean values for BHAR of all the sectors
are the same. Rejecting the null hypothesis will thus result in the alternate being
accepted implying that there are significant differences between the long run
performance of different sectors.
To determine if the reported BHAR values above are significant, an ANOVA
was performed. The results for this ANOVA are presented in Table 10. The
important figure to note here is the F value, and the critical F value. The critical
F value is based on a 95% confidence level. The calculated F value is higher
than the F critical value which implies that we reject our null hypothesis that all
means are equal, and we can deduce that there are significant differences
between the BHARs of different sectors.
The return from the mining sector was high compared to all the other sectors
and there may be a concern that the weighting of this value would have had an
influence on the results of the ANOVA. It was therefore decided to perform an
additional test without the results of the mining sector. These ANOVA results
©© UUnniivveerrssiittyy ooff PPrreettoorriiaa
The long run performance of IPOs in South Africa
69
are included in Table 11. These results indicate that even without the strong
positive return of the mining sector the calculated F value is still higher than the
critical F value for all the sectors which have provided negative returns. The null
hypothesis can therefore also be rejected based on the results of this ANOVA.
The results of this sector analysis may be subjective when taking into
consideration the process that was used to classify the different sectors. The re-
categorization was transparent, and information on new IPOs can easily be
compared to the five general sectors following the step shown in Appendix A. A
similar process was also followed by Kiymaz (2000) in his study of IPO
performance in Turkey. He also found that the financial sector provided initial
returns of 15% compared to industrials with 11%.
The long run performance was opposite to the initial returns, i.e.: The higher the
initial returns of the sector, the lower the long run performance. This would have
meant that the financial sector performed worse than the industrial sector in the
long run which is consistent with this study for South Africa.
The findings by Ang and Boyer (2009) and Finkle and Lamb (2002) reviewed in
section 2.4 can be compared to the current results if one has to consider the
technology sector as a new industry or emerging industry, which may be true for
the sample period, especially the first half. The industrial sector displayed the
worst results in this study, and although Finkle and Lamb (2002) found a similar
trend which was contrary to that of Ang and Boyer (2009), the magnitude of
their underperformance may not have been similar.
©© UUnniivveerrssiittyy ooff PPrreettoorriiaa
The long run performance of IPOs in South Africa
70
The results for the long run performance emphasizes that the initial returns
would have been high as investors look to reap the rewards of these new
technologies. Long run performance may have been affected by the dot.com
bubble event that occurred within the sample period of the current study. New
industries may also attract investors for short term rewards; however these may
seem riskier in the long run.
The study performed by How (2000) reports markedly different results where
the mining sector underperforms the market by 20% as opposed to the
industrial sector which only showed a 7% underperformance.
The period from 1997 to 1999 was identified as a ‘hot issue’ period as 60% of
all IPOs in the sample were listed during these years. Helwege and Liang
(2004) found that IPOs listed during periods of high IPO activity are usually
drawn from a few industries.
For the present study, the number of IPOs from the financial sector that were
listed between 1997 and 1999 was 45, which accounts for 78% of all financial
sector IPOs listed in the sample period. The majority of technology IPOs were
also listed during this period with 37 out of 41 (90%).
The remaining 40% of IPOs listed during this period comprised of the industrial
sector which was only represented with 34% of all the industrial IPOs. There
were also only six out of the 21 mining firms listed during this period. The IPOs
from all the other industries were also fairly well represented between 1997 and
1999 and accounted for 58%, the return from this sector was neither in the best
©© UUnniivveerrssiittyy ooff PPrreettoorriiaa
The long run performance of IPOs in South Africa
71
performing nor worst performing category and hence did not warrant any further
discussion.
The two sectors of technology and financials therefore dominated the ‘hot issue’
period, representing 60% of the IPOs listed between 1997 and 1999. The poor
results for this period can thus also be attributed to the overall performance of
these sectors which was shown earlier in this section to be the two worst
performing sectors.
These results therefore confirm the results obtained by Helwege and Liang
(2004), with the sectors of technology and financials dominating the ‘hot issue’
period that was recognised for this study.
The results of this section may be subjective to a certain extent as it was based
on broad categories of sectors defined for the present analysis. For a more
accurate analysis to be performed a larger sample period should be used or a
shorter test period (less than 36 months) where a larger number of IPOs are
represented per sector.
©© UUnniivveerrssiittyy ooff PPrreettoorriiaa
The long run performance of IPOs in South Africa
72
7 Conclusions
The aim of this research was to:
• Determine the long run performance (36 months) of IPOs in South Africa
• Determine if there is a correlation between the size of issue and the long
run performance of IPOs
• Verify if there is a relationship between strong IPO activity (‘hot issue’
market) and the magnitude of long run underperformance
• Determine if there are differences in after market returns between different
sectors.
The design of the research required to address the objectives above, and the
subsequent results have been presented in chapter 4 and 5. Within the scope of
this study, the following conclusions can therefore be drawn based on the
analysis discussed in the previous chapter.
7.1 Long run performance
IPOs in South Africa significantly underperformed the market. The
underperformance was 50% below the market for BHAR and 47%
underperformance for CAR.
©© UUnniivveerrssiittyy ooff PPrreettoorriiaa
The long run performance of IPOs in South Africa
73
7.2 Performance of different sized firms
There were significant differences in long run performance between different
size firms.
7.3 Relationship between BHAR and IPO activity
There was no significant linear correlation between the level of
underperformance and IPO activity.
7.4 Difference in sector performance
There are significant differences in performance of IPOs between different
sectors.
The sector with the best performance was the mining sector with a positive
76%.
©© UUnniivveerrssiittyy ooff PPrreettoorriiaa
The long run performance of IPOs in South Africa
74
Based on the above results the following IPO investment strategies are
recommended:
• Shares in larger firms (proceeds greater than R1 Bln) should be
considered over smaller or mediums firms. Firms with proceeds greater
than R10 Bln may offer positive returns.
• Investment in periods of high IPO activity should be avoided as they
produce worse. This however was not statistically proven
• Long run investment in the mining sector should be considered above
any other sector as this will produce positive returns over a 36 month buy
and hold period.
©© UUnniivveerrssiittyy ooff PPrreettoorriiaa
The long run performance of IPOs in South Africa
75
Based on the current study, the following are recommendations for future
research:
• A similar study should be performed using more specific benchmarks like
sector specific industries as well as a matching firm approach
• Factors influencing long run performance should be investigated.
• The relationship between initial returns and long run performance should
be studied.
• The influence of firm size on IPO performance should be performed
using other proxies
• The ‘hot issue’ effect should be investigated using a longer sample
period and other periods other than calendar years.
• For a more accurate sector performance analysis a larger sample period
should be considered or a shorter test period (less than 36 months)
where a larger number of IPOs are represented per sector.
©© UUnniivveerrssiittyy ooff PPrreettoorriiaa
The long run performance of IPOs in South Africa
76
References Ang, J. & Boyer, C. (2009). Performance differences between IPOs in new
industries and IPOs in established industries. Managerial Finance, 35 (7), 606-
623. doi: 10.1108/03074350910960346
Alti, A. (2005). IPO Market timing. The Review of Financial Studies, 18 (3),
1105-1138.
Bessler, W. & Thies, S. (2007). The long-run performance of initial public
offerings in Germany. Managerial Finance, 33 (6), 420-441. doi: I 0.1
108/03074350710748768
Cai, X., Liu, G. S. & Mase, B. (2008). The long run performance of initial public
offerings and its determinants: the case of China. Quantitative Financial
Accounting Review, 30, 419-432. doi: I 0.1 007/s11156-007-0064-5
Carter, R. B., Dark, F. H. & Singh, A. K. (1998). Underwriter reputation, initial
returns and the long-run performance of IPO stocks. Journal of Finance, 53,
285-311
Choi, S. D. & Nam, S. K. (2006). The long run stock performance of
privatisation IPOs. Multinational Finance Journal, 10 (3/4), 223-250.
Corhay, A., Teo, S. & Rad, A. T. (2002). The long run performance of Malaysian
Initial Public Offerings (IPOs): Value and Growth effects. Managerial Finance,
28 (2), 52-65.
©© UUnniivveerrssiittyy ooff PPrreettoorriiaa
The long run performance of IPOs in South Africa
77
Daily, C. M., Certo, S. T. & Dalton, D. R. (2005). Investment bankers and IPO
pricing: does prospectus information matter? Journal of Business Venturing, 20,
93-111.
Derrien, F. (2005). IPO pricing in ‘hot’ market conditions: Who leaves money on
the table? The Journal of Finance, 60 (1), 487-521.
Drobetz, W., Kammerman, M. & Wälchli, U. (2005). Long-run performance of
Initial Public Offerings: The evidence for Switzerland. Schmalenbach Business
Review. 57 (3), 253-275.
Fama, E. F. (1998). Market efficiency, long-term returns, and behavioural
finance. Journal of Financial Economics, 49, 283-306.
Fama, E. F. & French, K. R. (1992). The Cross-Section of Expected Stock
Returns. Journal of Finance, 47, 427-66.
Fama, E. F. & French, K. R. (1996). Multifactor explanations of asset pricing
anomalies. Journal of Finance, 51, 55-84.
Finn, F. J. & Hingham, R. (1988). The performance of unseasoned new equity
issues-cum stock exchange listings in Australia. Journal of Banking and
Finance, 12, 1-19.
Goergen, M., Khurshed. A. & Mudambi. R. (2007). The long-run performance of
UK IPOs: Can it be predicted? Managerial Finance, 33 (6), 401-419. doi: I 0.1
108/03074350710748-759
©© UUnniivveerrssiittyy ooff PPrreettoorriiaa
The long run performance of IPOs in South Africa
78
Guo, H., Brooks, R. & Shami, R. (2009). Detecting hot and cold cycles using a
Markov regime switching model – Evidence from the Chinese A-share IPO
market. International Review of Economics and Finance, 518, 1-15,
doi:10.1016/j.iref.2009.10.002
How, J. C. Y. (2000). Initial and long run performance of mining IPOs in
Australia. Australian Journal of Management, 25 (1), 95-118.
Jaskiewicz, P., González, V. M., Menéndez, S. & Schiereck, D. (2005). Long
run IPO performance analysis of German and Spanish Family-Owned
businesses. Family Business Review, 18 (3), 179-202.
Kirkulak, B. (2008). The initial and long run returns of Japanese venture capital-
backed and non venture capital-backed IPOs. International Journal of
Managerial Finance, 4 (2), 112-135. doi: I 0.1 108/17439130810864014
Kiymaz, H. (2000). The initial and aftermarket performance of IPOs in an
emerging market: evidence from Istanbul stock exchange. Journal of
Multinational Financial Management, 10, 213-227.
Kothari, S. P. & Warner, J. B. (1997). Measuring Long-Horizon Security Price
Performance. Journal of Financial Economics, 43, 301-339.
Lee, P., Taylor, S. & Walter, T. (1996). Australian IPO pricing in the short and
long run. Journal of Banking and Finance, 20, 1189-1210.
Loughran, T. & Ritter, J. R. (1995). The new issues puzzle. Journal of Finance,
50, 23-51.
©© UUnniivveerrssiittyy ooff PPrreettoorriiaa
The long run performance of IPOs in South Africa
79
Mayur, M. & Kumar, M. (2009). Ownership and performance in an emerging
market: Evidence from Indian IPO firms. The IUP Journal of Applied Finance,
15 (7), 5-23.
Mitchell, M. L. & Stafford, E. (2000). Managerial decision making and long-term
stock price performance. Journal of Business, 73, 287-329.
Moshirian, F., Ng, D. & Wu, E. (2008). Model specification and IPO
performance: New insights from Asia. Research in International Business and
Finance, 24, 62-74.
Ritter, J. R. (1984). The ‘hot issue’ market of 1980. Journal of Business, 15,
215-240.
Ritter, J. R. (1991). The long run performance of initial public offerings. Journal
of Finance, 46 (1), 3-27.
Singh, I. & Van der Zahn, J-L. W. M. (2009). Intellectual capital prospectus
disclosure and post-issue stock performance. Journal of International Capital,
10 (3), 425-450. doi: I 0.1 108/14691930910977824
Tsangarakis, N. V. (2004). The price performance of initial public offerings in
Greece. Managerial Finance, 30 (10), 26-44.
Vithessonthi, C. (2008). The long-run performance of Initial Public Offerings:
New evidence from Thailand. The Business Review, Cambridge, 10 (1), 315-
321.
©© UUnniivveerrssiittyy ooff PPrreettoorriiaa
The long run performance of IPOs in South Africa
80
Wong, A. L. K. & Wong, M. C. S. (2008). Examining the performance of venture
backed companies in the Hong Kong IPO market. The Journal of Private Equity,
11 (4), 28-42.
Yip, Y., Su, Y. & Ang, J. B. (2009). Effects of underwriters, venture capital and
industry on long term initial public offering performance. Managerial Finance, 35
(8), 700-715. doi: I 0.1 108/03074350910967240
Zheng, S. X. & Li, M. (2008). Underpricing, ownership dispersion, and
aftermarket liquidity of IPO stocks. Journal of Empirical Finance, 15, 436-454.
©© UUnniivveerrssiittyy ooff PPrreettoorriiaa

The long run performance of IPOs in South Africa
81
Appendix A – Sector Categories Table A-1: Original Sector Classification
Sector Sector Sector A-COAL Diamonds OIL INTEGRATED
A-PHARMACEUTICALS Diversified Industrial Other Mineral Extractors and Mines
INVESTMENT COMPANIES ELIGIBLE Education & Staff Packaging & Printing RETAILERS MULTI DEPARTMENT Electron & Elect Pharm & Medical A-Business Support Services Engineering Platinum A-Heavy Construction Exploration Platinum & Precious Metals A-Medical Supplies Farming & Fishing Platinum Mining A-Mining Finance Financial Services Private Equity Funds
Apparel Retailers
Fixed Line Telecommunication Services Property
Asset Managers Food Property Loan Stock Banks Food and Drug Retailers Publishing and Printing Banks & Fin Services Furn. & Household Rail, Road and Freight
Banks & Other Fin. Ser. Gambling Real Estate Holding and Development
Bev, Hotel & Leisure General Mining Redevelopment Build & Construction Gold Mining Retail Building Materials & Fixtures Hotel & Leisure Retailers Hardlines Building, Construction & Engineering Hotels Service Business Support Services Information Technology Short-Term Insurance Cash Companies Insurance Speciality Finance Chem & Oil Investment Banks Stores Cloth., Footwear & Textile Investment Services Telecommunication Coal Investment Trust Transport Computer Hardware Life Assurance Transportation Computer Services Media Travel & Tourism DCM Metal & Minerals V- Medical Equipment Development Mining Exploration VCM Development Capital Mining Holding V-Consumer Finance Development Stage Nonferrous Metals Venture Capital V-Other Financial V-Other Financial
©© UUnniivveerrssiittyy ooff PPrreettoorriiaa

The long run performance of IPOs in South Africa
82
Table A-2: New sector classification showing original sector
New Sector Original Sector Agriculture and Fishing Farming & Fishing Redevelopment Construction A-Heavy Construction Build & Construction Building Materials & Fixtures Building, Construction & Engineering Education & Training Education & Staff Elect Development Capital Electron & Elect Energy, Chem & Oil Chem & Oil Exploration OIL INTEGRATED Engineering Diversified Industrial Engineering
Financial INVESTMENT COMPANIES ELIGIBLE
Asset Managers Banks Banks & Fin Services Banks & Other Fin. Ser. Financial Services Insurance Investment Banks Investment Services Investment Trust Life Assurance Private Equity Funds Short-Term Insurance Speciality Finance V-Consumer Finance Venture Capital V-Other Financial Food A-Business Support Services Food Food and Drug Retailers Hotel & Leisure Bev, Hotel & Leisure Development Gambling Hotel & Leisure Hotels Travel & Tourism Information Technology Cash Companies Computer Hardware Computer Services DCM Development Capital Development Stage
©© UUnniivveerrssiittyy ooff PPrreettoorriiaa

The long run performance of IPOs in South Africa
83
Information Technology Investment Business Support Services Development Stage Redevelopment Media Development Capital Media Redevelopment Mining A-COAL A-Mining Finance Coal Diamonds General Mining Gold Mining Metal & Minerals Mining Exploration Mining Holding Nonferrous Metals Other Mineral Extractors and Mines Platinum Platinum & Precious Metals Platinum Mining Packaging, Printing & Textiles Cloth., Footwear & Textile Packaging & Printing Publishing and Printing Pharm & Medical A-PHARMACEUTICALS A-Medical Supplies Pharm & Medical V- Medical Equipment Property Property Property Loan Stock
Real Estate Holding and Development
Retail RETAILERS MULTI DEPARTMENT Apparel Retailers Furn. & Household Retail Retailers Hardlines Stores Service Service
Telecommunication Fixed Line Telecommunication Services
Telecommunication VCM Transport Development Capital Rail, Road and Freight Transport Transportation
©© UUnniivveerrssiittyy ooff PPrreettoorriiaa
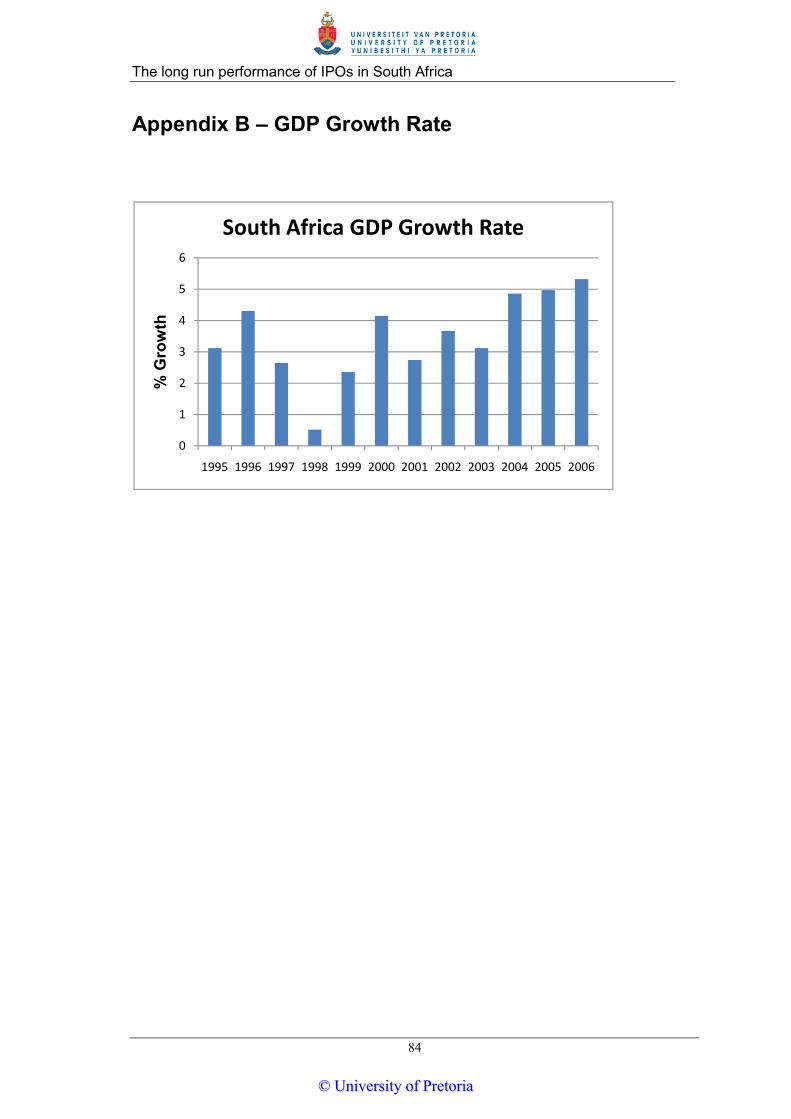
The long run performance of IPOs in South Africa
84
Appendix B – GDP Growth Rate
0
1
2
3
4
5
6
1995 1996 1997 1998 1999 2000 2001 2002 2003 2004 2005 2006
% G
row
th
South Africa GDP Growth Rate
©© UUnniivveerrssiittyy ooff PPrreettoorriiaa
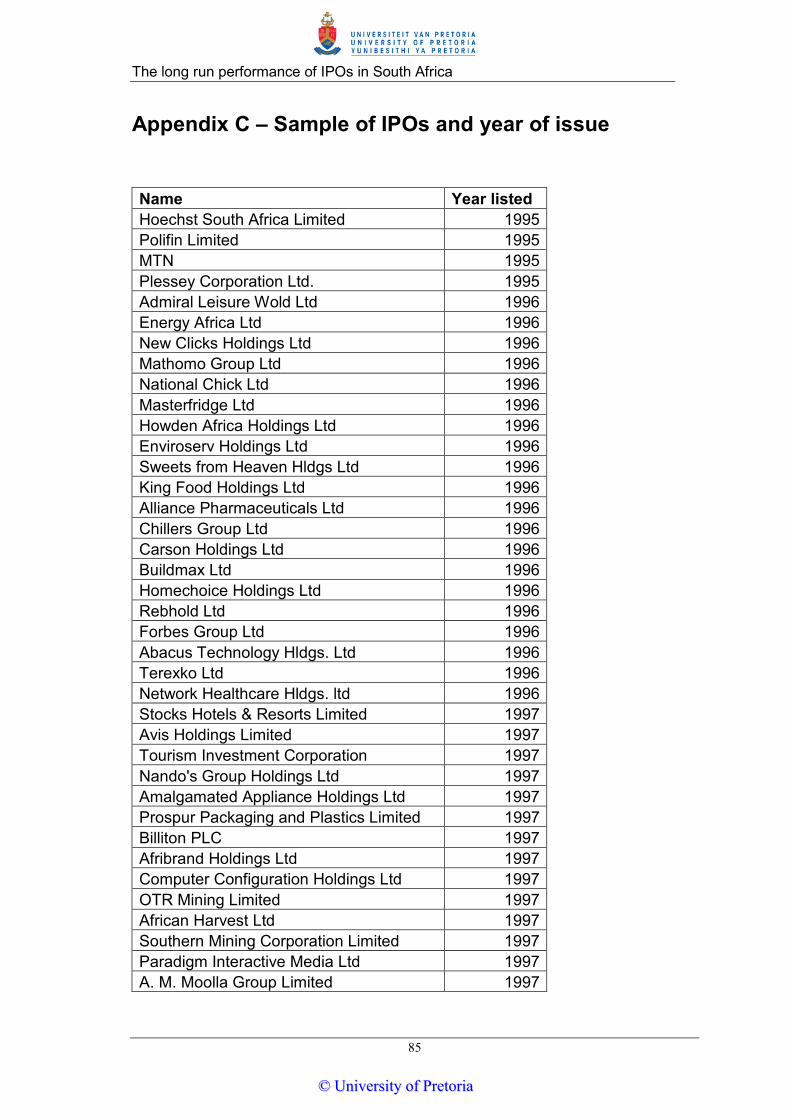
The long run performance of IPOs in South Africa
85
Appendix C – Sample of IPOs and year of issue
Name Year listed Hoechst South Africa Limited 1995 Polifin Limited 1995 MTN 1995 Plessey Corporation Ltd. 1995 Admiral Leisure Wold Ltd 1996 Energy Africa Ltd 1996 New Clicks Holdings Ltd 1996 Mathomo Group Ltd 1996 National Chick Ltd 1996 Masterfridge Ltd 1996 Howden Africa Holdings Ltd 1996 Enviroserv Holdings Ltd 1996 Sweets from Heaven Hldgs Ltd 1996 King Food Holdings Ltd 1996 Alliance Pharmaceuticals Ltd 1996 Chillers Group Ltd 1996 Carson Holdings Ltd 1996 Buildmax Ltd 1996 Homechoice Holdings Ltd 1996 Rebhold Ltd 1996 Forbes Group Ltd 1996 Abacus Technology Hldgs. Ltd 1996 Terexko Ltd 1996 Network Healthcare Hldgs. ltd 1996 Stocks Hotels & Resorts Limited 1997 Avis Holdings Limited 1997 Tourism Investment Corporation 1997 Nando's Group Holdings Ltd 1997 Amalgamated Appliance Holdings Ltd 1997 Prospur Packaging and Plastics Limited 1997 Billiton PLC 1997 Afribrand Holdings Ltd 1997 Computer Configuration Holdings Ltd 1997 OTR Mining Limited 1997 African Harvest Ltd 1997 Southern Mining Corporation Limited 1997 Paradigm Interactive Media Ltd 1997 A. M. Moolla Group Limited 1997
©© UUnniivveerrssiittyy ooff PPrreettoorriiaa
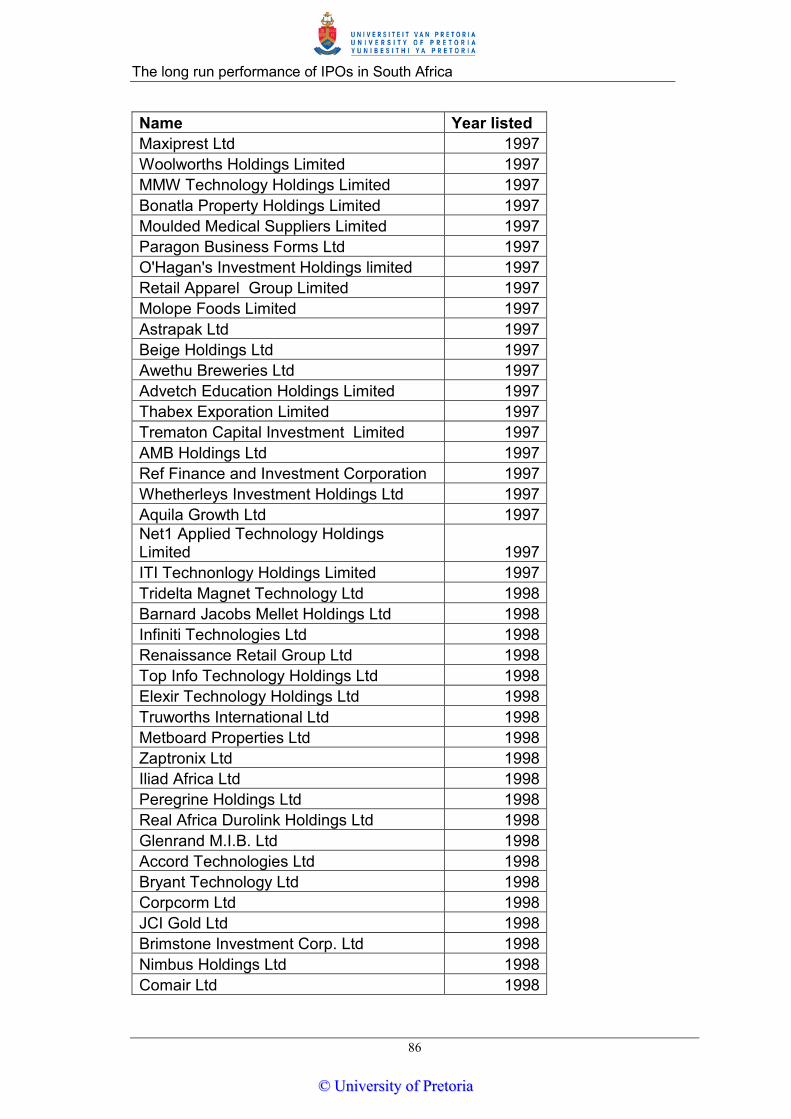
The long run performance of IPOs in South Africa
86
Name Year listed Maxiprest Ltd 1997 Woolworths Holdings Limited 1997 MMW Technology Holdings Limited 1997 Bonatla Property Holdings Limited 1997 Moulded Medical Suppliers Limited 1997 Paragon Business Forms Ltd 1997 O'Hagan's Investment Holdings limited 1997 Retail Apparel Group Limited 1997 Molope Foods Limited 1997 Astrapak Ltd 1997 Beige Holdings Ltd 1997 Awethu Breweries Ltd 1997 Advetch Education Holdings Limited 1997 Thabex Exporation Limited 1997 Trematon Capital Investment Limited 1997 AMB Holdings Ltd 1997 Ref Finance and Investment Corporation 1997 Whetherleys Investment Holdings Ltd 1997 Aquila Growth Ltd 1997 Net1 Applied Technology Holdings Limited 1997 ITI Technonlogy Holdings Limited 1997 Tridelta Magnet Technology Ltd 1998 Barnard Jacobs Mellet Holdings Ltd 1998 Infiniti Technologies Ltd 1998 Renaissance Retail Group Ltd 1998 Top Info Technology Holdings Ltd 1998 Elexir Technology Holdings Ltd 1998 Truworths International Ltd 1998 Metboard Properties Ltd 1998 Zaptronix Ltd 1998 Iliad Africa Ltd 1998 Peregrine Holdings Ltd 1998 Real Africa Durolink Holdings Ltd 1998 Glenrand M.I.B. Ltd 1998 Accord Technologies Ltd 1998 Bryant Technology Ltd 1998 Corpcorm Ltd 1998 JCI Gold Ltd 1998 Brimstone Investment Corp. Ltd 1998 Nimbus Holdings Ltd 1998 Comair Ltd 1998
©© UUnniivveerrssiittyy ooff PPrreettoorriiaa
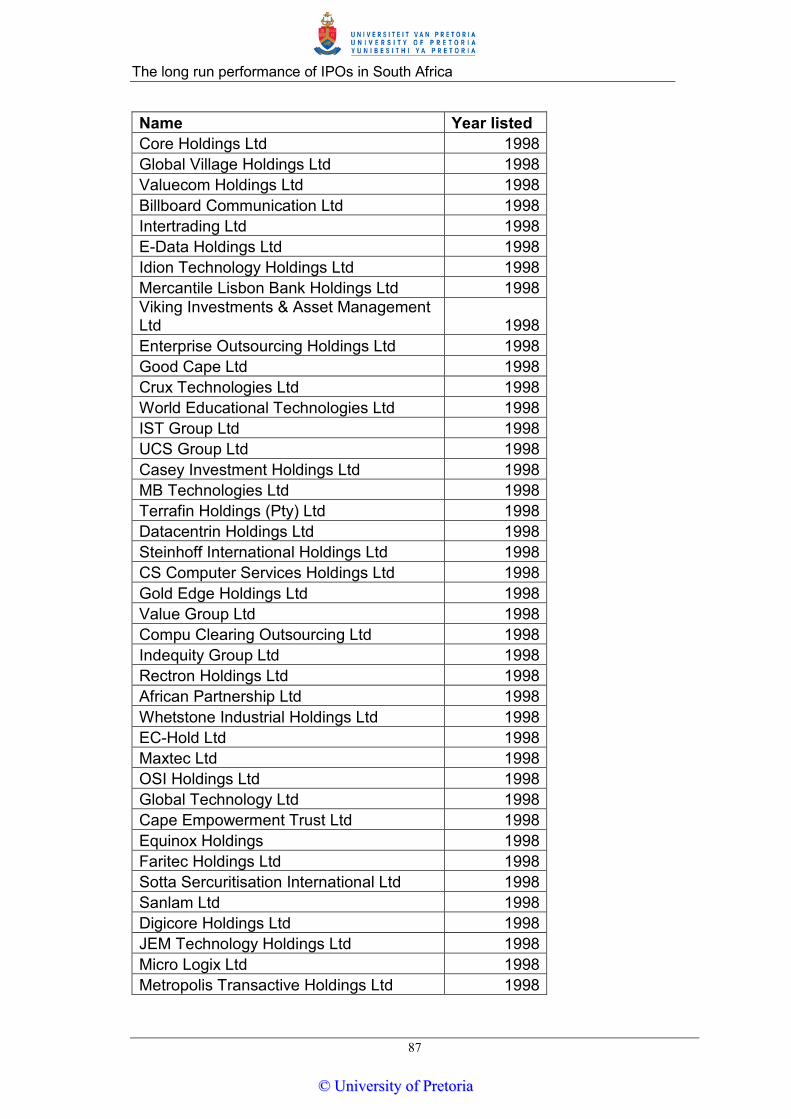
The long run performance of IPOs in South Africa
87
Name Year listed Core Holdings Ltd 1998 Global Village Holdings Ltd 1998 Valuecom Holdings Ltd 1998 Billboard Communication Ltd 1998 Intertrading Ltd 1998 E-Data Holdings Ltd 1998 Idion Technology Holdings Ltd 1998 Mercantile Lisbon Bank Holdings Ltd 1998 Viking Investments & Asset Management Ltd 1998 Enterprise Outsourcing Holdings Ltd 1998 Good Cape Ltd 1998 Crux Technologies Ltd 1998 World Educational Technologies Ltd 1998 IST Group Ltd 1998 UCS Group Ltd 1998 Casey Investment Holdings Ltd 1998 MB Technologies Ltd 1998 Terrafin Holdings (Pty) Ltd 1998 Datacentrin Holdings Ltd 1998 Steinhoff International Holdings Ltd 1998 CS Computer Services Holdings Ltd 1998 Gold Edge Holdings Ltd 1998 Value Group Ltd 1998 Compu Clearing Outsourcing Ltd 1998 Indequity Group Ltd 1998 Rectron Holdings Ltd 1998 African Partnership Ltd 1998 Whetstone Industrial Holdings Ltd 1998 EC-Hold Ltd 1998 Maxtec Ltd 1998 OSI Holdings Ltd 1998 Global Technology Ltd 1998 Cape Empowerment Trust Ltd 1998 Equinox Holdings 1998 Faritec Holdings Ltd 1998 Sotta Sercuritisation International Ltd 1998 Sanlam Ltd 1998 Digicore Holdings Ltd 1998 JEM Technology Holdings Ltd 1998 Micro Logix Ltd 1998 Metropolis Transactive Holdings Ltd 1998
©© UUnniivveerrssiittyy ooff PPrreettoorriiaa
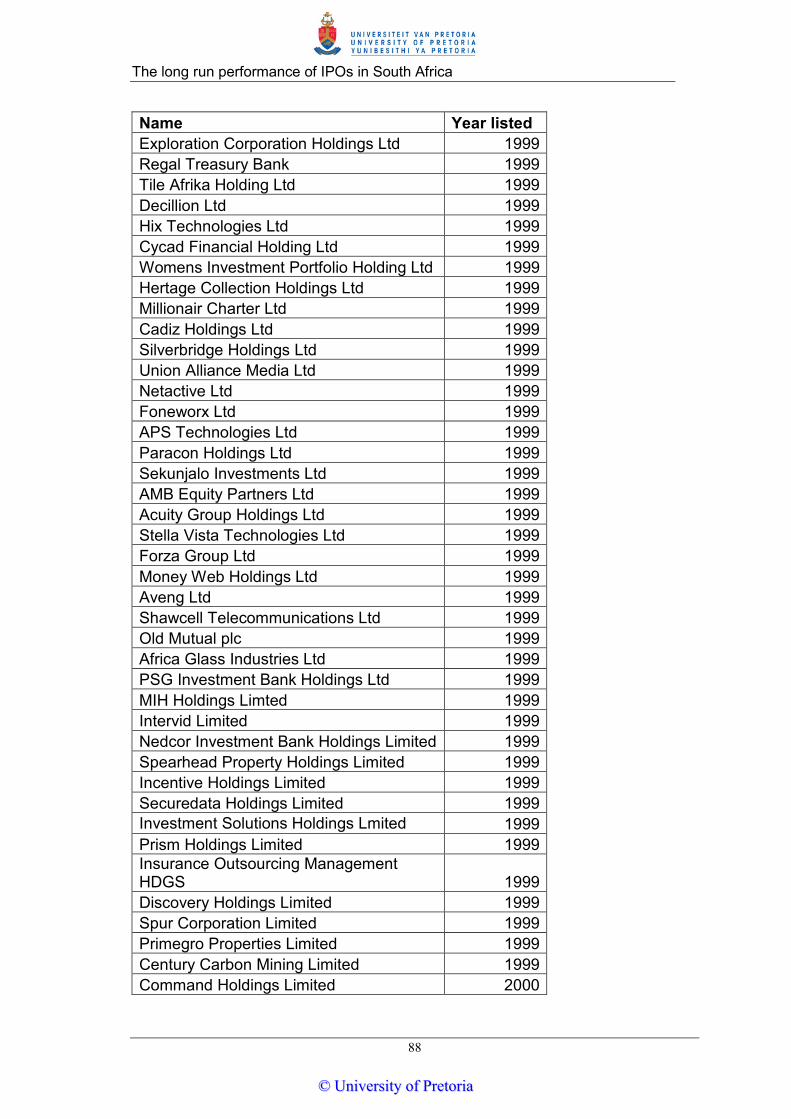
The long run performance of IPOs in South Africa
88
Name Year listed Exploration Corporation Holdings Ltd 1999 Regal Treasury Bank 1999 Tile Afrika Holding Ltd 1999 Decillion Ltd 1999 Hix Technologies Ltd 1999 Cycad Financial Holding Ltd 1999 Womens Investment Portfolio Holding Ltd 1999 Hertage Collection Holdings Ltd 1999 Millionair Charter Ltd 1999 Cadiz Holdings Ltd 1999 Silverbridge Holdings Ltd 1999 Union Alliance Media Ltd 1999 Netactive Ltd 1999 Foneworx Ltd 1999 APS Technologies Ltd 1999 Paracon Holdings Ltd 1999 Sekunjalo Investments Ltd 1999 AMB Equity Partners Ltd 1999 Acuity Group Holdings Ltd 1999 Stella Vista Technologies Ltd 1999 Forza Group Ltd 1999 Money Web Holdings Ltd 1999 Aveng Ltd 1999 Shawcell Telecommunications Ltd 1999 Old Mutual plc 1999 Africa Glass Industries Ltd 1999 PSG Investment Bank Holdings Ltd 1999 MIH Holdings Limted 1999 Intervid Limited 1999 Nedcor Investment Bank Holdings Limited 1999 Spearhead Property Holdings Limited 1999 Incentive Holdings Limited 1999 Securedata Holdings Limited 1999 Investment Solutions Holdings Lmited 1999 Prism Holdings Limited 1999 Insurance Outsourcing Management HDGS 1999 Discovery Holdings Limited 1999 Spur Corporation Limited 1999 Primegro Properties Limited 1999 Century Carbon Mining Limited 1999 Command Holdings Limited 2000
©© UUnniivveerrssiittyy ooff PPrreettoorriiaa
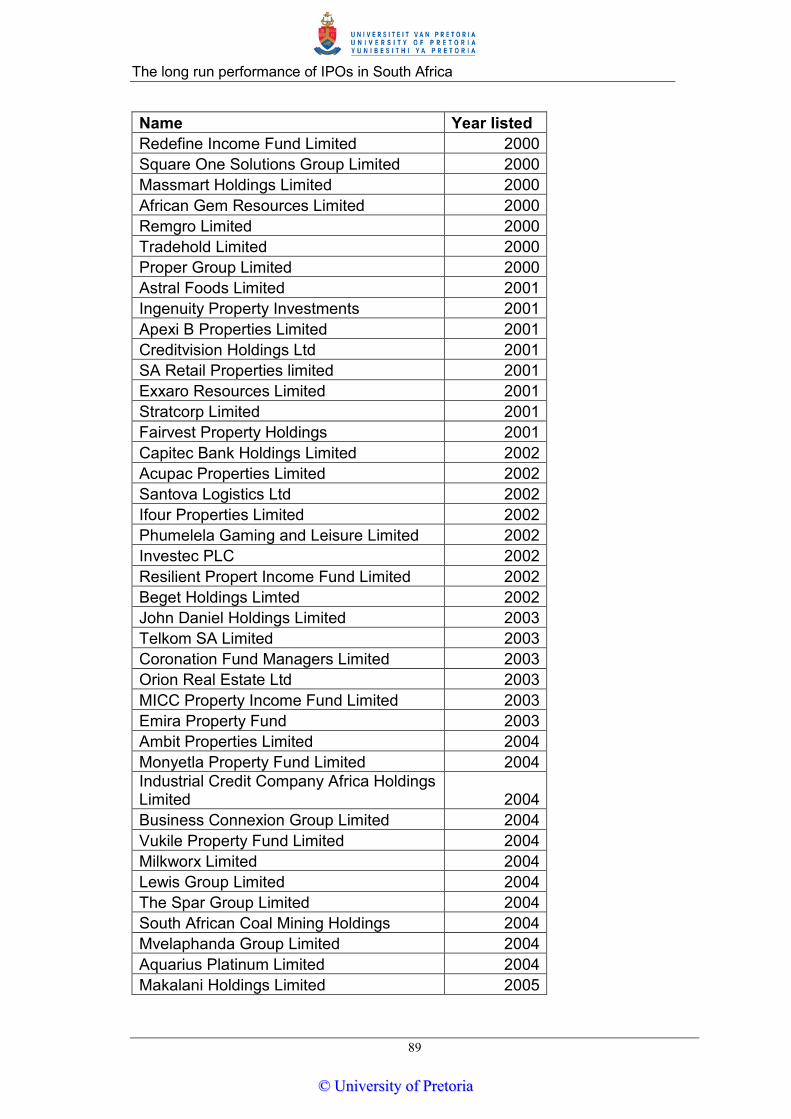
The long run performance of IPOs in South Africa
89
Name Year listed Redefine Income Fund Limited 2000 Square One Solutions Group Limited 2000 Massmart Holdings Limited 2000 African Gem Resources Limited 2000 Remgro Limited 2000 Tradehold Limited 2000 Proper Group Limited 2000 Astral Foods Limited 2001 Ingenuity Property Investments 2001 Apexi B Properties Limited 2001 Creditvision Holdings Ltd 2001 SA Retail Properties limited 2001 Exxaro Resources Limited 2001 Stratcorp Limited 2001 Fairvest Property Holdings 2001 Capitec Bank Holdings Limited 2002 Acupac Properties Limited 2002 Santova Logistics Ltd 2002 Ifour Properties Limited 2002 Phumelela Gaming and Leisure Limited 2002 Investec PLC 2002 Resilient Propert Income Fund Limited 2002 Beget Holdings Limted 2002 John Daniel Holdings Limited 2003 Telkom SA Limited 2003 Coronation Fund Managers Limited 2003 Orion Real Estate Ltd 2003 MICC Property Income Fund Limited 2003 Emira Property Fund 2003 Ambit Properties Limited 2004 Monyetla Property Fund Limited 2004 Industrial Credit Company Africa Holdings Limited 2004 Business Connexion Group Limited 2004 Vukile Property Fund Limited 2004 Milkworx Limited 2004 Lewis Group Limited 2004 The Spar Group Limited 2004 South African Coal Mining Holdings 2004 Mvelaphanda Group Limited 2004 Aquarius Platinum Limited 2004 Makalani Holdings Limited 2005
©© UUnniivveerrssiittyy ooff PPrreettoorriiaa
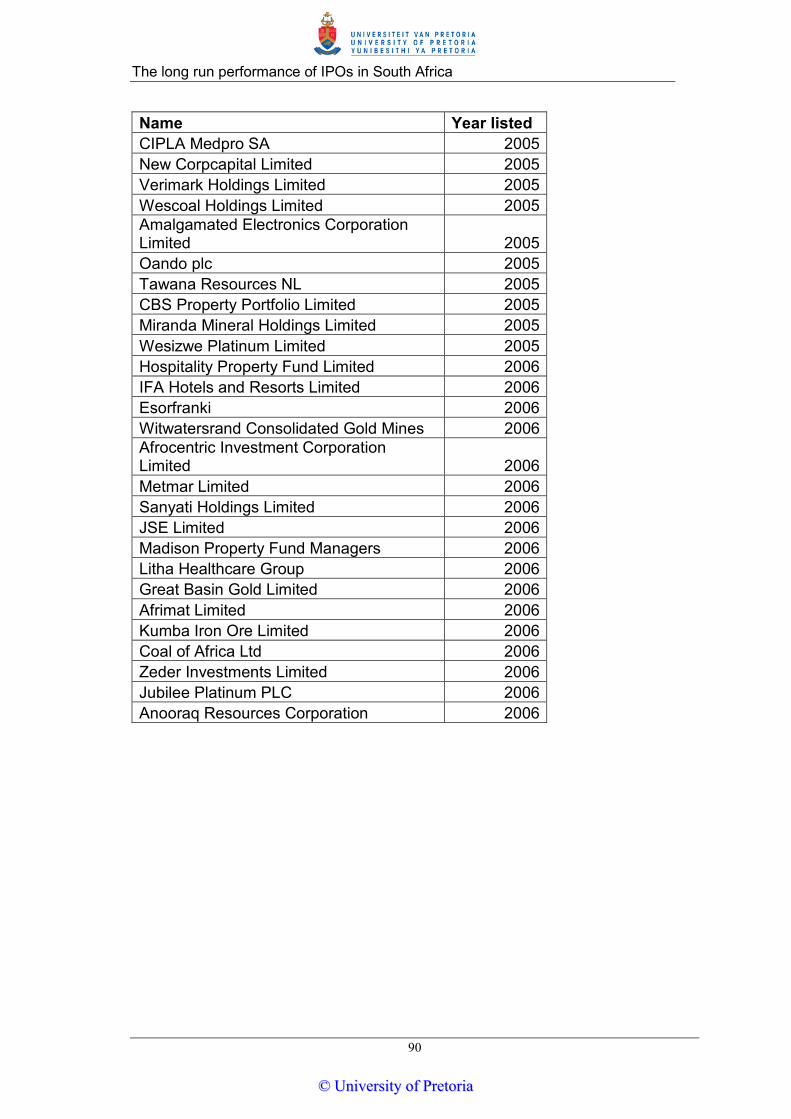
The long run performance of IPOs in South Africa
90
Name Year listed CIPLA Medpro SA 2005 New Corpcapital Limited 2005 Verimark Holdings Limited 2005 Wescoal Holdings Limited 2005 Amalgamated Electronics Corporation Limited 2005 Oando plc 2005 Tawana Resources NL 2005 CBS Property Portfolio Limited 2005 Miranda Mineral Holdings Limited 2005 Wesizwe Platinum Limited 2005 Hospitality Property Fund Limited 2006 IFA Hotels and Resorts Limited 2006 Esorfranki 2006 Witwatersrand Consolidated Gold Mines 2006 Afrocentric Investment Corporation Limited 2006 Metmar Limited 2006 Sanyati Holdings Limited 2006 JSE Limited 2006 Madison Property Fund Managers 2006 Litha Healthcare Group 2006 Great Basin Gold Limited 2006 Afrimat Limited 2006 Kumba Iron Ore Limited 2006 Coal of Africa Ltd 2006 Zeder Investments Limited 2006 Jubilee Platinum PLC 2006 Anooraq Resources Corporation 2006
©© UUnniivveerrssiittyy ooff PPrreettoorriiaa
Related Documents


