OPEN ACCESS | www.cell-stress.com 37 Cell Stress | OCTOBER 2017 | Vol. 1 No. 1 www.cell-stress.com Research Article ABSTRACT The long non-coding RNA (lncRNA) H19 represents a maternally ex- pressed and epigenetically regulated imprinted gene product and is discussed to have either tumor-promoting or tumor-suppressive actions. Recently, H19 was shown to be regulated under inflammatory conditions. Therefore, aim of this study was to determine the function of H19 in hepatocellular carcinoma (HCC), an in- flammation-associated type of tumor. In four different human HCC patient cohorts H19 was distinctly downregulated in tumor tissue compared to normal or non- tumorous adjacent tissue. We therefore determined the action of H19 in three dif- ferent human hepatoma cell lines (HepG2, Plc/Prf5, and Huh7). Clonogenicity and proliferation assays showed that H19 overexpression could suppress tumor cell survival and proliferation after treatment with either sorafenib or doxorubicin, suggesting chemosensitizing actions of H19. Since HCC displays a highly chemo- resistant tumor entity, cell lines resistant to doxorubicin or sorafenib were estab- lished. In all six chemoresistant cell lines H19 expression was significantly down- regulated. The promoter methylation of the H19 gene was significantly different in chemoresistant cell lines compared to their sensitive counterparts. Chemoresistant cells were sensitized after H19 overexpression by either increasing the cytotoxic action of doxorubicin or decreasing cell proliferation upon sorafenib treatment. An H19 knockout mouse model (H19Δ3) showed increased tumor development and tumor cell proliferation after treatment with the carcinogen diethylnitrosamine (DEN) independent of the reciprocally imprinted insulin-like growth factor 2 (IGF2). In conclusion, H19 suppresses hepatocarcinogenesis, hepatoma cell growth, and HCC chemoresistance. Thus, mimicking H19 action might be a potential target to overcome chemoresistance in future HCC therapy. The long non-coding RNA H19 suppresses carcinogenesis and chemoresistance in hepatocellular carcinoma Christina S. Schultheiss 1,§ , Stephan Laggai 1,§ , Beate Czepukojc 1 , Usama K. Hussein 1,2 , Markus List 3 , Ahmad Barghash 4 , Sascha Tierling 5 , Kevan Hosseini 1 , Nicole Golob-Schwarzl 6 , Juliane Pokorny 7 , Nina Hachenthal 1 , Marcel Schulz 3,9 , Volkhard Helms 10 , Jörn Walter 5 , Vincent Zimmer 8 , Frank Lammert 8 , Rainer M. Bohle 7 , Luisa Dandolo 11 , Johannes Haybaeck 6,12 , Alexandra K. Kiemer 1, *, Sonja M. Kessler 1,6 1 Department of Pharmacy, Pharmaceutical Biology, Saarland University, Saarbrücken, Germany. 2 Faculty of Science, Beni-Suef University, Bani Suwaif, Egypt. 3 Department for Computational Biology and Applied Algorithmics, Max Planck Institute for Informatics, Saarland Informatics Campus, Saarbrücken, Germany. 4 School of Electrical Engineering and Information Technology, German Jordanian University, Amman, Jordan. 5 Department of Genetics and Epigenetics, Saarland University, Saarbrücken, Germany. 6 Institute of Pathology, Medical University of Graz, Graz, Austria. 7 Institute of Pathology, Saarland University, Campus Homburg, Homburg (Saar), Germany. 8 Department of Medicine II, Saarland University Medical Center, Saarland University, Homburg (Saar), Germany. 9 Cluster of Excellence in Multimodal Computing and Interaction, Saarland Informatics Campus, Saarbrücken, Germany. 10 Center for Bioinformatics, Saarland University, Saarbrücken, Germany. 11 Institut Cochin, Inserm U1016, CNRS UMR 8104, Paris, France. 12 Department of Pathology, Medical Faculty, Otto-von-Guericke University Magdeburg, Magdeburg, Germany. § These authors contributed equally. * Corresponding Author: Alexandra K. Kiemer, Ph.D., Professor of Pharmaceutical Biology, Saarland University, Department of Pharmacy, Pharmaceutical Biology, Campus C2 3, 66123 Saarbrücken, Germany; E-mail: [email protected] doi: 10.15698/cst2017.10.105 Received originally: 03.04.2017; in revised form: 11.07.2017, Accepted 19.07.2017, Published 25.08.2017. Keywords: loss of imprinting, miR- 675, Ki67, ELAVL1/HuR, flow cytometry, SNuPE, Bi-PROF. Abbreviations: DEN – diethylnitrosamine, HCC – hepatocellular carcinoma, IGF – insulin-like growth factor, lncRNA – long non-coding RNA, LOI – loss of imprinting.

Welcome message from author
This document is posted to help you gain knowledge. Please leave a comment to let me know what you think about it! Share it to your friends and learn new things together.
Transcript
OPEN ACCESS | www.cell-stress.com 37 Cell Stress | OCTOBER 2017 | Vol. 1 No. 1
www.cell-stress.com
Research Article
ABSTRACT The long non-coding RNA (lncRNA) H19 represents a maternally ex-pressed and epigenetically regulated imprinted gene product and is discussed to have either tumor-promoting or tumor-suppressive actions. Recently, H19 was shown to be regulated under inflammatory conditions. Therefore, aim of this study was to determine the function of H19 in hepatocellular carcinoma (HCC), an in-flammation-associated type of tumor. In four different human HCC patient cohorts H19 was distinctly downregulated in tumor tissue compared to normal or non-tumorous adjacent tissue. We therefore determined the action of H19 in three dif-ferent human hepatoma cell lines (HepG2, Plc/Prf5, and Huh7). Clonogenicity and proliferation assays showed that H19 overexpression could suppress tumor cell survival and proliferation after treatment with either sorafenib or doxorubicin, suggesting chemosensitizing actions of H19. Since HCC displays a highly chemo-resistant tumor entity, cell lines resistant to doxorubicin or sorafenib were estab-lished. In all six chemoresistant cell lines H19 expression was significantly down-regulated. The promoter methylation of the H19 gene was significantly different in chemoresistant cell lines compared to their sensitive counterparts. Chemoresistant cells were sensitized after H19 overexpression by either increasing the cytotoxic action of doxorubicin or decreasing cell proliferation upon sorafenib treatment. An H19 knockout mouse model (H19Δ3) showed increased tumor development and tumor cell proliferation after treatment with the carcinogen diethylnitrosamine (DEN) independent of the reciprocally imprinted insulin-like growth factor 2 (IGF2). In conclusion, H19 suppresses hepatocarcinogenesis, hepatoma cell growth, and HCC chemoresistance. Thus, mimicking H19 action might be a potential target to overcome chemoresistance in future HCC therapy.
The long non-coding RNA H19 suppresses carcinogenesis and chemoresistance in hepatocellular carcinoma
Christina S. Schultheiss1,§, Stephan Laggai1,§, Beate Czepukojc1, Usama K. Hussein1,2, Markus List3, Ahmad Barghash4, Sascha Tierling5, Kevan Hosseini1, Nicole Golob-Schwarzl6, Juliane Pokorny7, Nina Hachenthal1, Marcel Schulz3,9, Volkhard Helms10, Jörn Walter5, Vincent Zimmer8, Frank Lammert8, Rainer M. Bohle7, Luisa Dandolo11, Johannes Haybaeck6,12, Alexandra K. Kiemer1,*, Sonja M. Kessler1,6
1 Department of Pharmacy, Pharmaceutical Biology, Saarland University, Saarbrücken, Germany.
2 Faculty of Science, Beni-Suef University, Bani Suwaif, Egypt.
3 Department for Computational Biology and Applied Algorithmics, Max Planck Institute for Informatics, Saarland Informatics
Campus, Saarbrücken, Germany. 4 School of Electrical Engineering and Information Technology, German Jordanian University, Amman, Jordan.
5 Department of Genetics and Epigenetics, Saarland University, Saarbrücken, Germany.
6 Institute of Pathology, Medical University of Graz, Graz, Austria.
7 Institute of Pathology, Saarland University, Campus Homburg, Homburg (Saar), Germany.
8 Department of Medicine II, Saarland University Medical Center, Saarland University, Homburg (Saar), Germany.
9 Cluster of Excellence in Multimodal Computing and Interaction, Saarland Informatics Campus, Saarbrücken, Germany.
10 Center for Bioinformatics, Saarland University, Saarbrücken, Germany.
11 Institut Cochin, Inserm U1016, CNRS UMR 8104, Paris, France.
12 Department of Pathology, Medical Faculty, Otto-von-Guericke University Magdeburg, Magdeburg, Germany.
§ These authors contributed equally.
* Corresponding Author: Alexandra K. Kiemer, Ph.D., Professor of Pharmaceutical Biology, Saarland University, Department of Pharmacy, Pharmaceutical Biology, Campus C2 3, 66123 Saarbrücken, Germany; E-mail: [email protected]
doi: 10.15698/cst2017.10.105 Received originally: 03.04.2017; in revised form: 11.07.2017, Accepted 19.07.2017, Published 25.08.2017. Keywords: loss of imprinting, miR-675, Ki67, ELAVL1/HuR, flow cytometry, SNuPE, Bi-PROF. Abbreviations: DEN – diethylnitrosamine, HCC – hepatocellular carcinoma, IGF – insulin-like growth factor, lncRNA – long non-coding RNA, LOI – loss of imprinting.
C. S. Schultheiss et al. (2017) LncRNA H19 in HCC and chemoresistance
OPEN ACCESS | www.cell-stress.com 38 Cell Stress | OCTOBER 2017 | Vol. 1 No. 1
INTRODUCTION Non-coding sequences constitute the considerably larger part of the transcribed human genome compared to cod-ing sequences since only 2% of the genome encode for proteins [1].
Recently, RNA-seq datasets were used to identify long non-coding RNAs (lncRNAs) aberrantly expressed under inflammatory conditions. The well-described lncRNA H19 (long intergenic non-protein coding RNA 8), a maternally expressed imprinted gene product, was the lncRNA with the most consistent overexpression among all conditions investigated [2]. Since cholangiocarcinoma represents a tumor type that develops under inflammatory conditions and in settings of oxidative stress, the authors investigated the role of H19 in cholangiocarcinoma cell lines and ob-served tumor-promoting and pro-inflammatory actions of
H19 [2], In contrast, H19 was found to have tumor-suppressing abilities in colorectal cancer, another inflam-mation-associated tumor entity [3], and the role of H19 in inflammation is conflicting [4, 5]. Embedded in H19's first exon is the microRNA miR-675 [6], the processing of which is negatively regulated by the mRNA binding protein ELAV like RNA binding protein 1 (ELAVL1 / HuR) [7], and has also been reported to affect cancer [8] and inflammation [4, 5, 9, 10].
Also hepatocellular carcinoma (HCC) evolves in an envi-ronment governed by metabolic and inflammatory stress as found in chronic viral hepatitis, as well as in alcoholic and non-alcoholic steatohepatitis [11]. HCC represents the second most common cause of cancer-related death worldwide [12], which is not least due to its high chemo-resistance. However, the role of H19 in HCC development, progression, and chemoresistance is still unclear. While
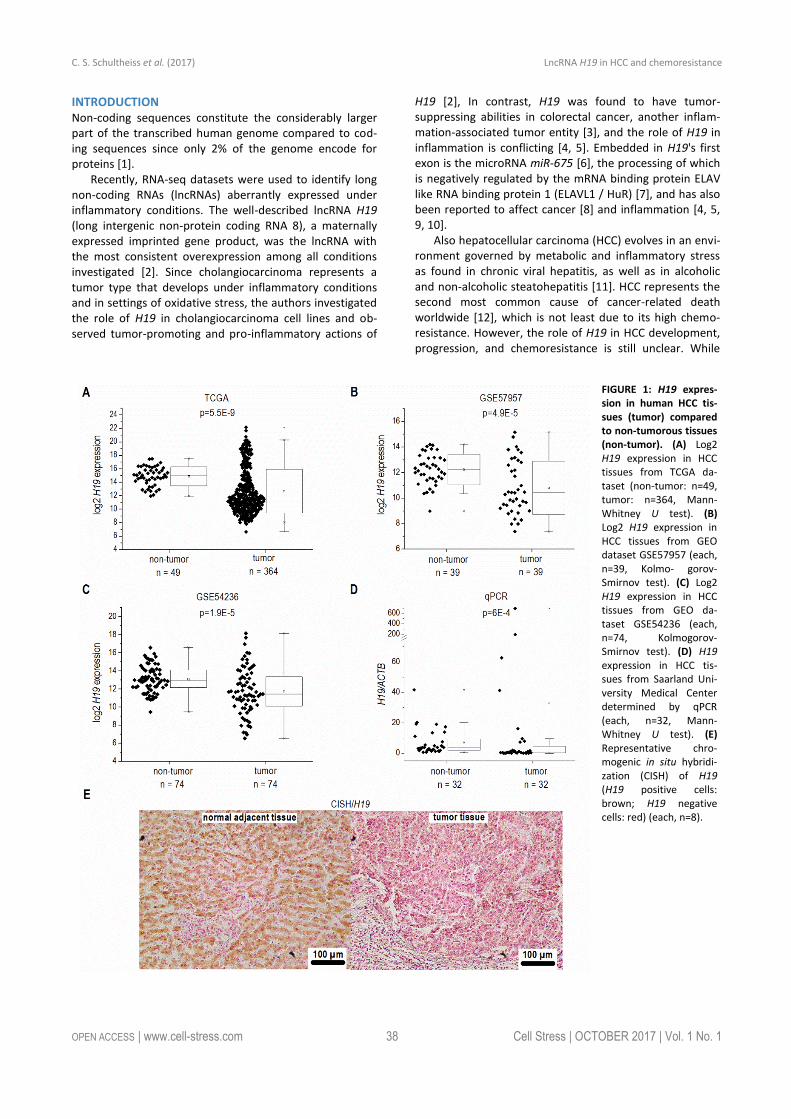
FIGURE 1: H19 expres-sion in human HCC tis-sues (tumor) compared to non-tumorous tissues (non-tumor). (A) Log2 H19 expression in HCC tissues from TCGA da-taset (non-tumor: n=49, tumor: n=364, Mann-Whitney U test). (B) Log2 H19 expression in HCC tissues from GEO dataset GSE57957 (each, n=39, Kolmo- gorov-Smirnov test). (C) Log2 H19 expression in HCC tissues from GEO da-taset GSE54236 (each, n=74, Kolmogorov-Smirnov test). (D) H19 expression in HCC tis-sues from Saarland Uni-versity Medical Center determined by qPCR (each, n=32, Mann-Whitney U test). (E) Representative chro- mogenic in situ hybridi-zation (CISH) of H19 (H19 positive cells: brown; H19 negative cells: red) (each, n=8).
C. S. Schultheiss et al. (2017) LncRNA H19 in HCC and chemoresistance
OPEN ACCESS | www.cell-stress.com 39 Cell Stress | OCTOBER 2017 | Vol. 1 No. 1
Yoshimizu et al. reported accelerated tumor development in H19 knockout mice in SV40-induced HCC [13], Matouk et al. observed an enhanced tumorigenic potential of carci-noma cells in vivo upon ectopic H19 expression [14].
Allelic expression of H19 is controlled by an imprinting control region and by a promoter, which can be differen-tially methylated [15]. Loss of imprinting (LOI), i.e. biallelic H19 expression, was reported for HCC using small sample size cohorts [16, 17]. In general, human data on H19 ex-pression in HCC should be interpreted with caution be-cause the number of samples available for the studies deal-ing with this topic was mostly rather small [16, 17].
We therefore conducted comprehensive studies using four independent patient cohorts, H19 knockout mice, and three different human hepatoma cell lines to decipher the role of H19 in HCC development, hepatoma cell growth, and chemoresistance.
RESULTS Based on recent reports suggesting H19 as an inflamma-tion-inducible lncRNA and HCC representing a disease de-veloping in an inflammatory environment, we sought to determine H19 expression in human HCC. The comparison of n=364 HCC tissues with n=49 normal liver tissues from TCGA sequencing data revealed highest H19 expression in a subgroup of HCC samples. Still, statistical analysis of all samples showed an allover decreased expression of H19 in HCC tissue (Figure 1A). Comparing H19 expression of HCC tissues only to their respective adjacent tissues, H19 ex-pression was still decreased with high statistical signifi-
cance (data not shown, p=5.28E-7). Also analysis of two microarray GEO datasets with n=39/39 (GSE57957) and n=74/74 (GSE54236) HCC tissues vs. non-tumor tissue re-vealed a distinct downregulation of H19 (Figure 1B and C) as did qPCR quantification of H19 in a previously described patient cohort (Figure 1D) [18, 19]. In situ hybridization against H19 revealed low expression of H19 in tumor tissue, but higher expression in the non-tumorous tissue adjacent to the tumor site in an additional patient cohort (Figure 1E). All cohorts comprised patients with HCC from different etiologies. q-PCR of hepatocytes, microdissected from the small subgroup of HCC samples showing high H19 expres-sion (Figure 1D) suggested that H19 was in fact overex-pressed in hepatocytes (Figure S2).
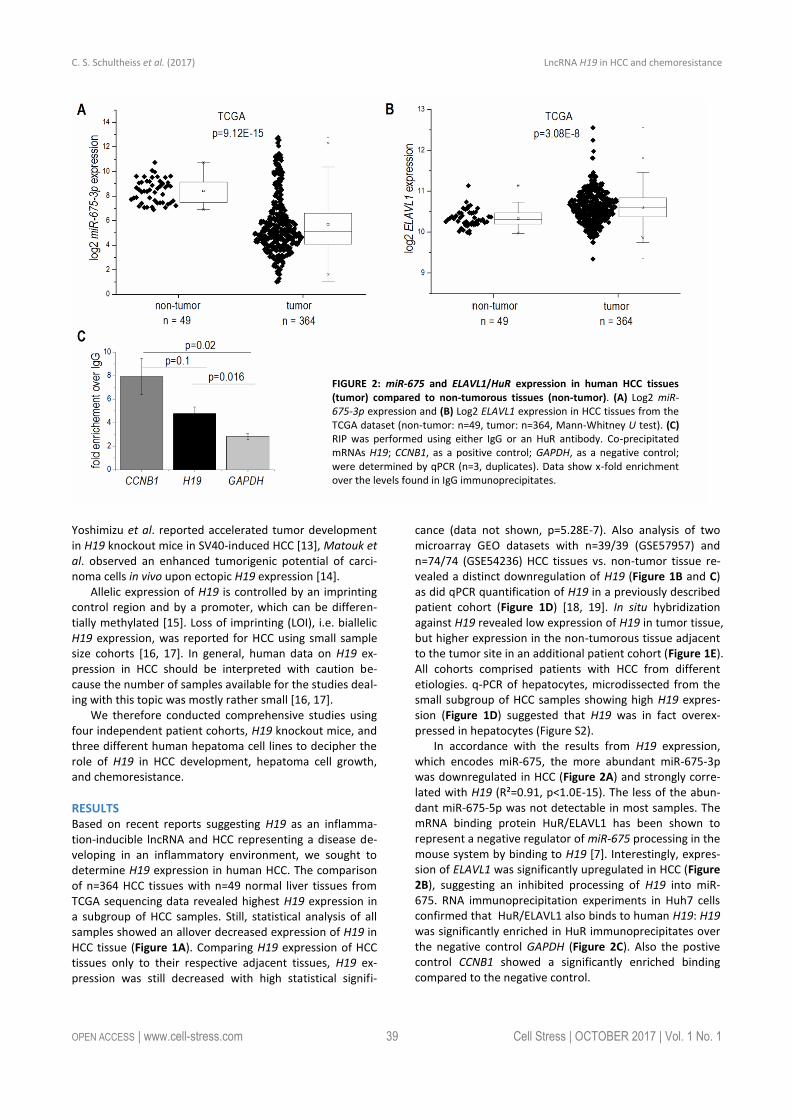
In accordance with the results from H19 expression, which encodes miR-675, the more abundant miR-675-3p was downregulated in HCC (Figure 2A) and strongly corre-lated with H19 (R²=0.91, p<1.0E-15). The less of the abun-dant miR-675-5p was not detectable in most samples. The mRNA binding protein HuR/ELAVL1 has been shown to represent a negative regulator of miR-675 processing in the mouse system by binding to H19 [7]. Interestingly, expres-sion of ELAVL1 was significantly upregulated in HCC (Figure 2B), suggesting an inhibited processing of H19 into miR-675. RNA immunoprecipitation experiments in Huh7 cells confirmed that HuR/ELAVL1 also binds to human H19: H19 was significantly enriched in HuR immunoprecipitates over the negative control GAPDH (Figure 2C). Also the postive control CCNB1 showed a significantly enriched binding compared to the negative control.
FIGURE 2: miR-675 and ELAVL1/HuR expression in human HCC tissues (tumor) compared to non-tumorous tissues (non-tumor). (A) Log2 miR-675-3p expression and (B) Log2 ELAVL1 expression in HCC tissues from the TCGA dataset (non-tumor: n=49, tumor: n=364, Mann-Whitney U test). (C) RIP was performed using either IgG or an HuR antibody. Co-precipitated mRNAs H19; CCNB1, as a positive control; GAPDH, as a negative control; were determined by qPCR (n=3, duplicates). Data show x-fold enrichment over the levels found in IgG immunoprecipitates.
C. S. Schultheiss et al. (2017) LncRNA H19 in HCC and chemoresistance
OPEN ACCESS | www.cell-stress.com 40 Cell Stress | OCTOBER 2017 | Vol. 1 No. 1
The data from independent patient cohorts showed a clear downregulation of H19 in HCC as a strongly inflam-mation-associated tumor type. This is why we investigated whether H19 expression is in fact downregulated due to an inflammatory reaction. In fact, we found a downregulation of H19 in livers from mice treated with the inflammation-inducing carcinogen DEN (n=5, 0.11 fold ± 0.04 compared to untreated animals, p=0.0508, two-sample t-test).
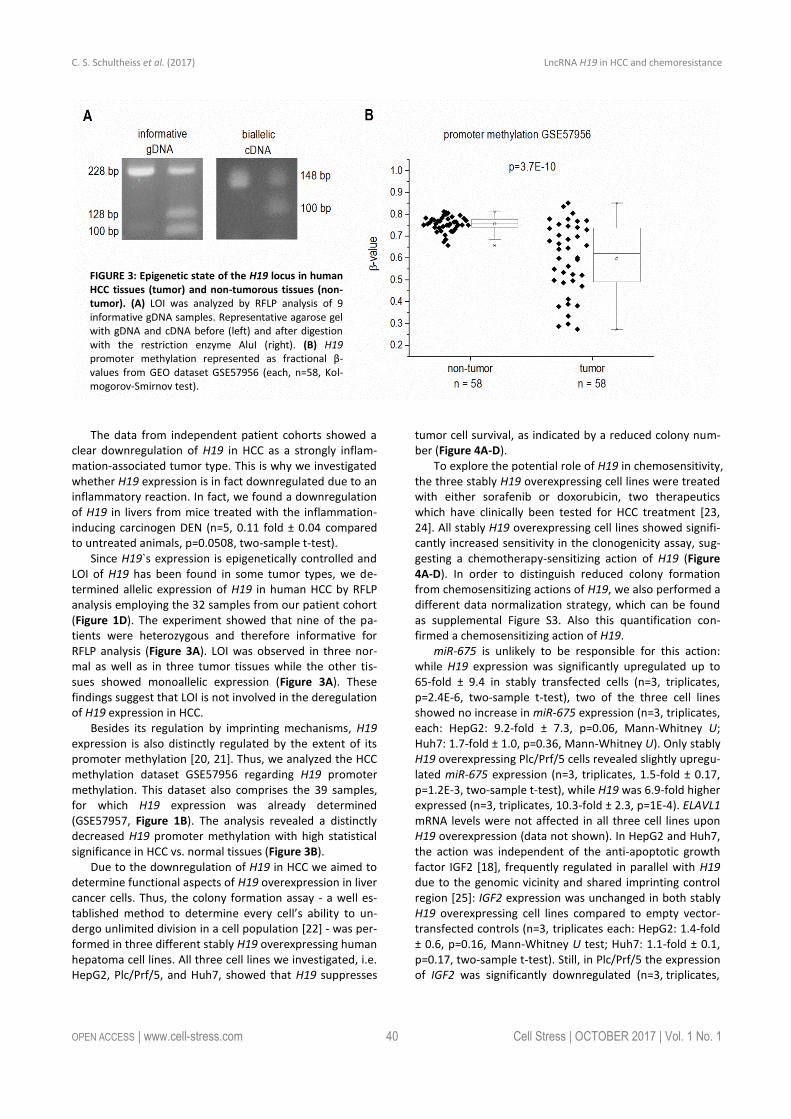
Since H19`s expression is epigenetically controlled and LOI of H19 has been found in some tumor types, we de-termined allelic expression of H19 in human HCC by RFLP analysis employing the 32 samples from our patient cohort (Figure 1D). The experiment showed that nine of the pa-tients were heterozygous and therefore informative for RFLP analysis (Figure 3A). LOI was observed in three nor-mal as well as in three tumor tissues while the other tis-sues showed monoallelic expression (Figure 3A). These findings suggest that LOI is not involved in the deregulation of H19 expression in HCC.
Besides its regulation by imprinting mechanisms, H19 expression is also distinctly regulated by the extent of its promoter methylation [20, 21]. Thus, we analyzed the HCC methylation dataset GSE57956 regarding H19 promoter methylation. This dataset also comprises the 39 samples, for which H19 expression was already determined (GSE57957, Figure 1B). The analysis revealed a distinctly decreased H19 promoter methylation with high statistical significance in HCC vs. normal tissues (Figure 3B).
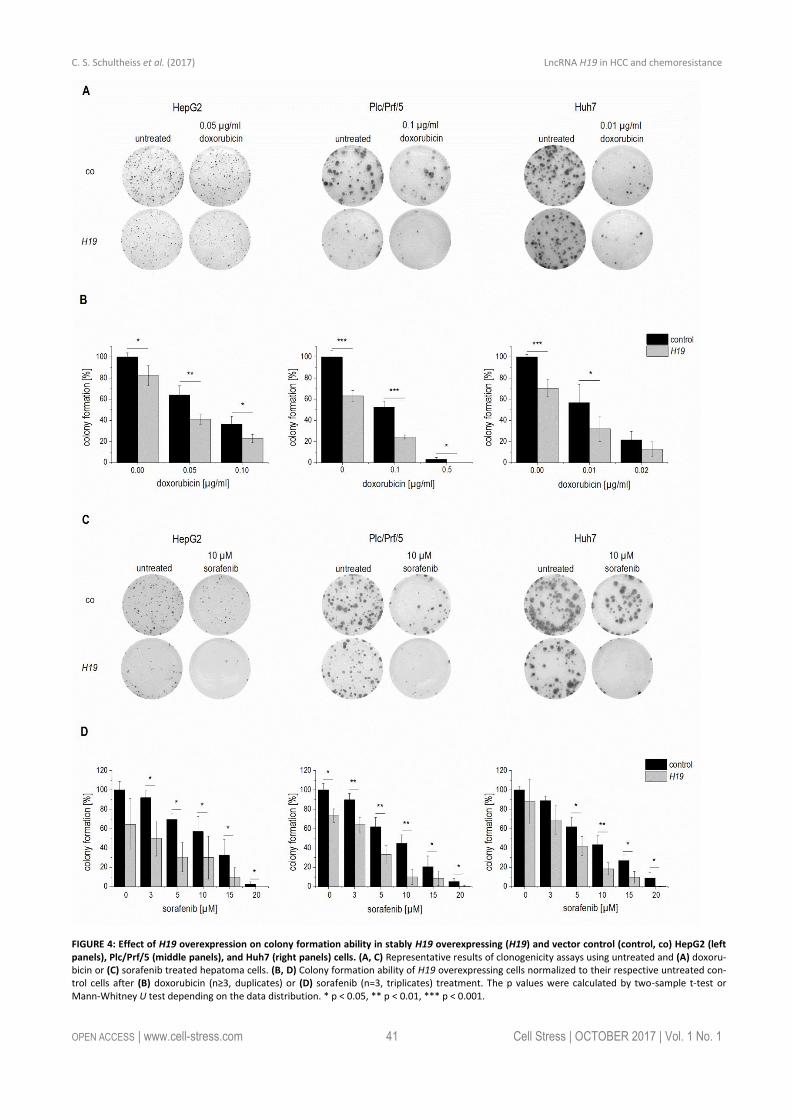
Due to the downregulation of H19 in HCC we aimed to determine functional aspects of H19 overexpression in liver cancer cells. Thus, the colony formation assay - a well es-tablished method to determine every cell’s ability to un-dergo unlimited division in a cell population [22] - was per-formed in three different stably H19 overexpressing human hepatoma cell lines. All three cell lines we investigated, i.e. HepG2, Plc/Prf/5, and Huh7, showed that H19 suppresses
tumor cell survival, as indicated by a reduced colony num-ber (Figure 4A-D).
To explore the potential role of H19 in chemosensitivity, the three stably H19 overexpressing cell lines were treated with either sorafenib or doxorubicin, two therapeutics which have clinically been tested for HCC treatment [23, 24]. All stably H19 overexpressing cell lines showed signifi-cantly increased sensitivity in the clonogenicity assay, sug-gesting a chemotherapy-sensitizing action of H19 (Figure 4A-D). In order to distinguish reduced colony formation from chemosensitizing actions of H19, we also performed a different data normalization strategy, which can be found as supplemental Figure S3. Also this quantification con-firmed a chemosensitizing action of H19.
miR-675 is unlikely to be responsible for this action: while H19 expression was significantly upregulated up to 65-fold ± 9.4 in stably transfected cells (n=3, triplicates, p=2.4E-6, two-sample t-test), two of the three cell lines showed no increase in miR-675 expression (n=3, triplicates, each: HepG2: 9.2-fold ± 7.3, p=0.06, Mann-Whitney U; Huh7: 1.7-fold ± 1.0, p=0.36, Mann-Whitney U). Only stably H19 overexpressing Plc/Prf/5 cells revealed slightly upregu-lated miR-675 expression (n=3, triplicates, 1.5-fold ± 0.17, p=1.2E-3, two-sample t-test), while H19 was 6.9-fold higher expressed (n=3, triplicates, 10.3-fold ± 2.3, p=1E-4). ELAVL1 mRNA levels were not affected in all three cell lines upon H19 overexpression (data not shown). In HepG2 and Huh7, the action was independent of the anti-apoptotic growth factor IGF2 [18], frequently regulated in parallel with H19 due to the genomic vicinity and shared imprinting control region [25]: IGF2 expression was unchanged in both stably H19 overexpressing cell lines compared to empty vector-transfected controls (n=3, triplicates each: HepG2: 1.4-fold ± 0.6, p=0.16, Mann-Whitney U test; Huh7: 1.1-fold ± 0.1, p=0.17, two-sample t-test). Still, in Plc/Prf/5 the expression of IGF2 was significantly downregulated (n=3, triplicates,
FIGURE 3: Epigenetic state of the H19 locus in human HCC tissues (tumor) and non-tumorous tissues (non-tumor). (A) LOI was analyzed by RFLP analysis of 9 informative gDNA samples. Representative agarose gel with gDNA and cDNA before (left) and after digestion with the restriction enzyme AluI (right). (B) H19 promoter methylation represented as fractional β-values from GEO dataset GSE57956 (each, n=58, Kol-mogorov-Smirnov test).
C. S. Schultheiss et al. (2017) LncRNA H19 in HCC and chemoresistance
OPEN ACCESS | www.cell-stress.com 41 Cell Stress | OCTOBER 2017 | Vol. 1 No. 1
FIGURE 4: Effect of H19 overexpression on colony formation ability in stably H19 overexpressing (H19) and vector control (control, co) HepG2 (left panels), Plc/Prf/5 (middle panels), and Huh7 (right panels) cells. (A, C) Representative results of clonogenicity assays using untreated and (A) doxoru-bicin or (C) sorafenib treated hepatoma cells. (B, D) Colony formation ability of H19 overexpressing cells normalized to their respective untreated con-trol cells after (B) doxorubicin (n≥3, duplicates) or (D) sorafenib (n=3, triplicates) treatment. The p values were calculated by two-sample t-test or Mann-Whitney U test depending on the data distribution. * p < 0.05, ** p < 0.01, *** p < 0.001.
C. S. Schultheiss et al. (2017) LncRNA H19 in HCC and chemoresistance
OPEN ACCESS | www.cell-stress.com 42 Cell Stress | OCTOBER 2017 | Vol. 1 No. 1
0.3-fold ± 0.1, p=3.9E-6, two-sample t-test). Interestingly, Plc/Prf/5 exhibited a highly increased intrinsic chemo-resistance compared to the other two cell lines.
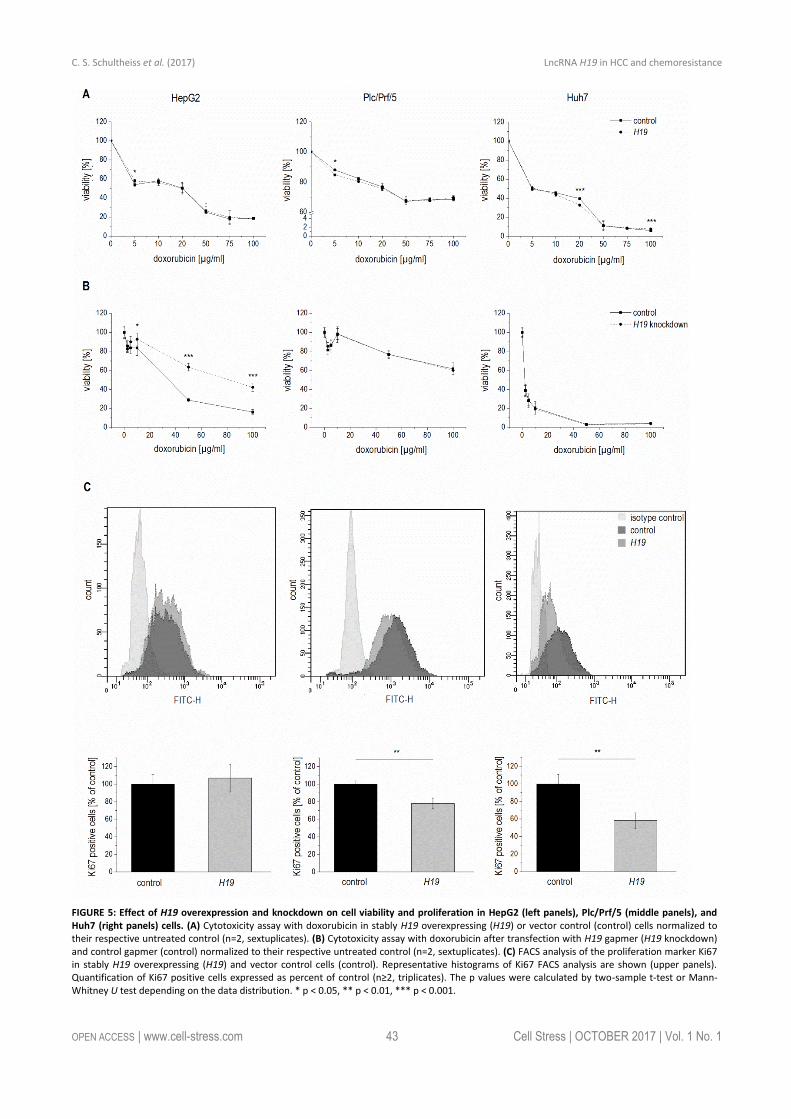
In order to determine whether H19 overexpression or knockdown directly affected cytotoxicity, cell viability was measured by MTT assay either in stably H19 overexpress-ing cells or in cells with a gapmer-facilitated H19 knock-down upon treatment with the cytotoxic agent doxorubicin. Cell viability with overexpressed or knocked down H19 was largely unchanged in Plc/Prf/5 and Huh7 cells, although a few values reached statistical significance (Figure 5A and B). Only in H19 gapmer-treated HepG2 cell viability was dis-tinctly elevated compared to gapmer control cells (Figure 5B). These heterogenous findings suggested that H19-facilitated chemosensitization in Plc/Prf/5 and Huh7 is un-likely to depend on altered cell death but might rather depend on reduced proliferative capacity.
Therefore, proliferation measurements in H19 overex-pressing cells by Ki67 staining and subsequent FACS quanti-fication were performed. Interestingly, while proliferation of HepG2 cells was unchanged in H19 overexpressing cells, H19 exhibited a significant proliferation-suppressing activi-ty in Plc/Prf/5 and Huh7 cells (Figure 5C).
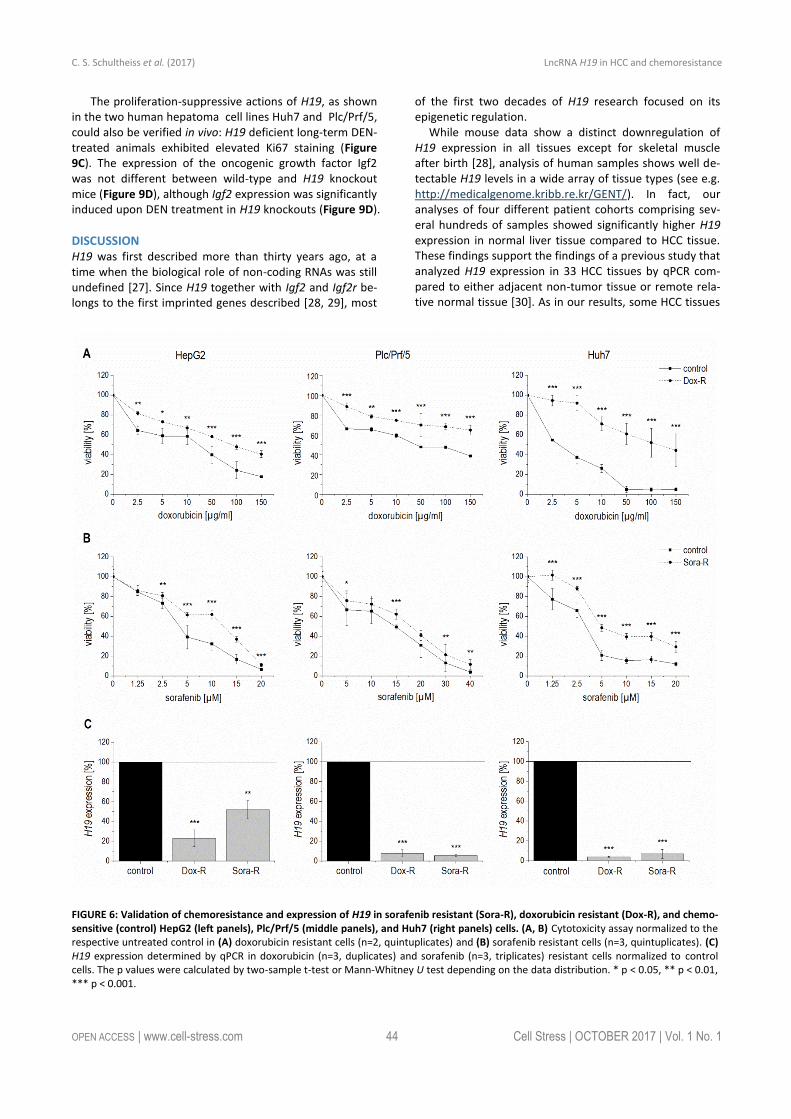
We hypothesized that a downregulation of H19 might also contribute to chemoresistance as induced by repeated treatment with chemotherapeutics. To test this hypothesis, we established doxorubicin- and sorafenib-resistant HepG2, Plc/Prf/5, and Huh7 cell lines by repeated treatment with the drugs. Their chemoresistance was confirmed by direct-ly comparing their sensitivity with non-resistant cells to-wards the drugs in a dose-response analysis (Figure 6A and B).
Quantifying H19 expression by qPCR revealed that chemoresistance was associated with strongly downregu-lated H19 expression in doxorubicin resistant cells (Figure 6C). However, miR-675 was not significantly affected in any of the doxorubicin resistant cells (n=2, duplicates, each: HepG2-Dox-R: 0.52-fold ± 0.30, p=0.11, two-sample t-test; Plc/Prf/5-Dox-R: 0.71-fold ± 0.25, p=0.20, two-sample t-test; Huh7-Dox-R: 2.13-fold ± 0.86 p=0.16, two-sample t-test). Also in sorafenib resistant cell lines H19 expression was significantly suppressed (Figure 6C).
Analysis of the multidrug resistance protein 1 (MDR1, ABCB1) showed increased expression in all doxorubicin (n=2, duplicates, each: HepG2-Dox-R: 44.2-fold ± 8.8, p=6.2E-3, two-sample t-test; Plc/Prf/5-Dox-R: 1.8-fold ± 0.2, p=3.1E-2, Mann Whitney U test; Huh7-Dox-R: 6.7-fold ± 0.4, p=2.3E-4, two-sample t-test) and sorafenib resistant (n=3, triplicates, each: HepG2-Sora-R: 4.1-fold ± 0.7, p=4.5E-5, two-sample t-test; Huh7-Sora-R: 1.5-fold ± 0.2, p=3.4E-4, two-sample t-test) cell lines except for sorafenib resistant Plc/Prf/5 cells (n=3, triplicates, Plc/Prf/5-Sora-R: 0.6-fold ± 0.1, p=2.8E-6, two-sample t-test).
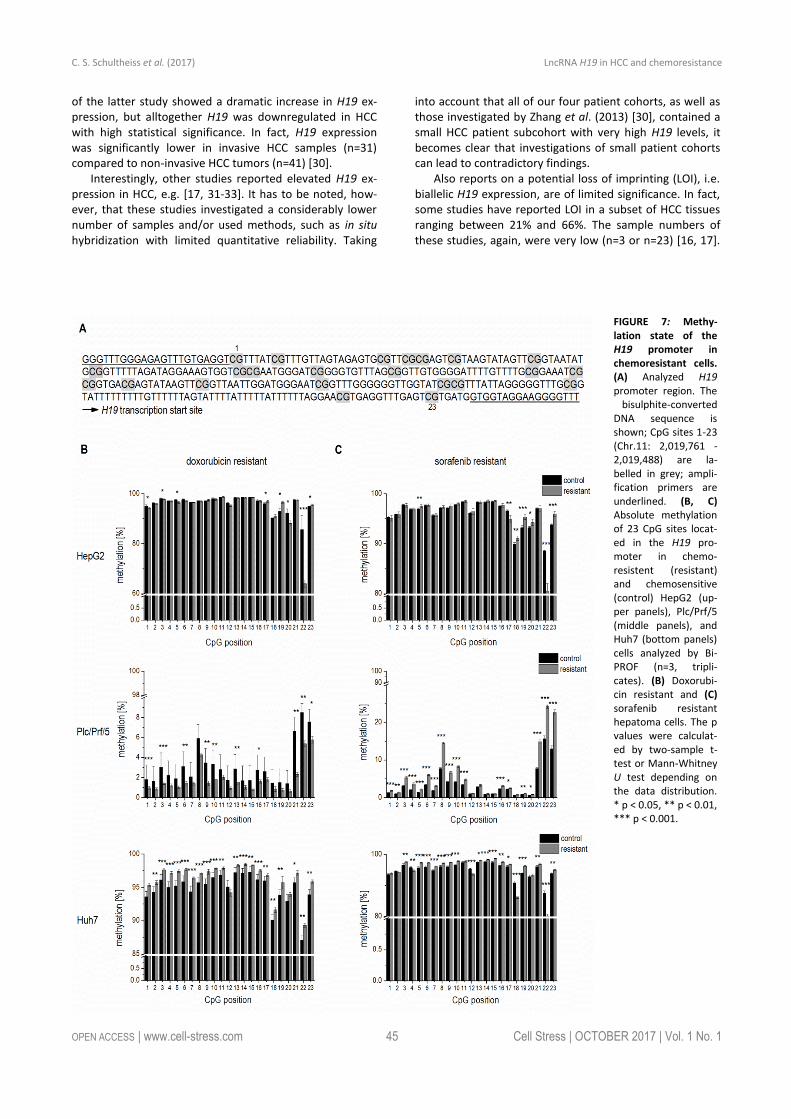
To elucidate if altered promoter methylation is again linked to changed H19 expression, the H19 promoter
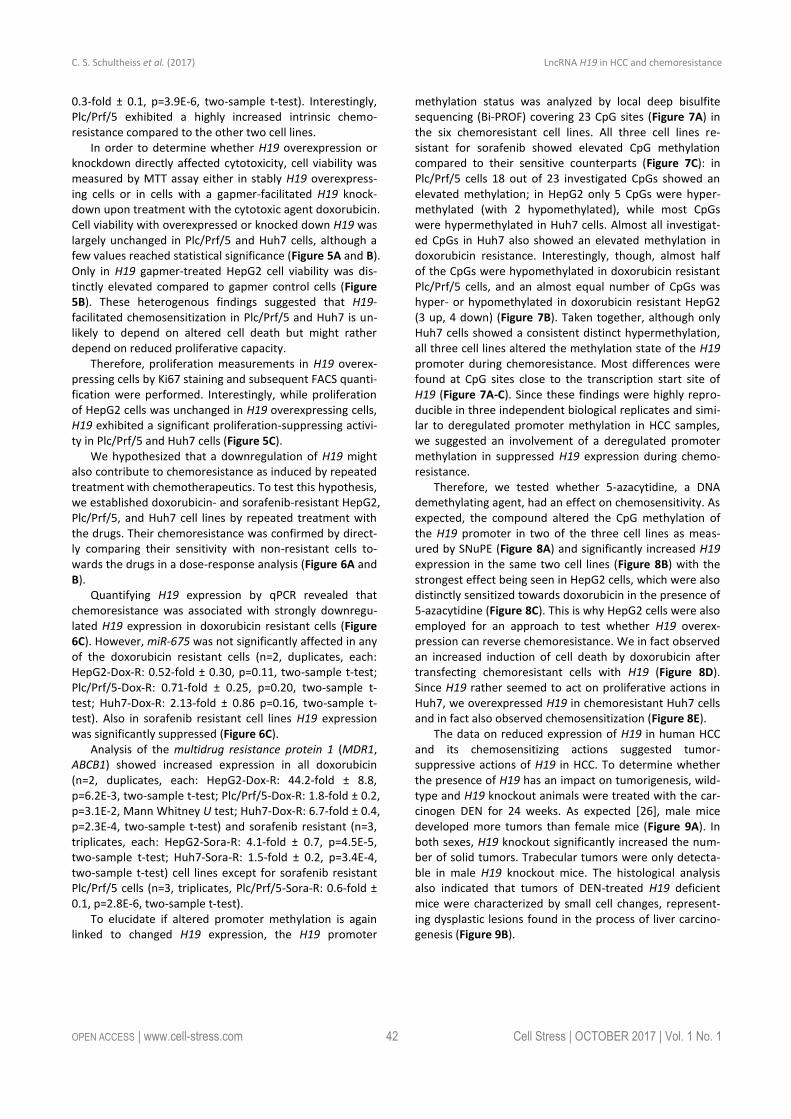
methylation status was analyzed by local deep bisulfite sequencing (Bi-PROF) covering 23 CpG sites (Figure 7A) in the six chemoresistant cell lines. All three cell lines re-sistant for sorafenib showed elevated CpG methylation compared to their sensitive counterparts (Figure 7C): in Plc/Prf/5 cells 18 out of 23 investigated CpGs showed an elevated methylation; in HepG2 only 5 CpGs were hyper-methylated (with 2 hypomethylated), while most CpGs were hypermethylated in Huh7 cells. Almost all investigat-ed CpGs in Huh7 also showed an elevated methylation in doxorubicin resistance. Interestingly, though, almost half of the CpGs were hypomethylated in doxorubicin resistant Plc/Prf/5 cells, and an almost equal number of CpGs was hyper- or hypomethylated in doxorubicin resistant HepG2 (3 up, 4 down) (Figure 7B). Taken together, although only Huh7 cells showed a consistent distinct hypermethylation, all three cell lines altered the methylation state of the H19 promoter during chemoresistance. Most differences were found at CpG sites close to the transcription start site of H19 (Figure 7A-C). Since these findings were highly repro-ducible in three independent biological replicates and simi-lar to deregulated promoter methylation in HCC samples, we suggested an involvement of a deregulated promoter methylation in suppressed H19 expression during chemo-resistance.
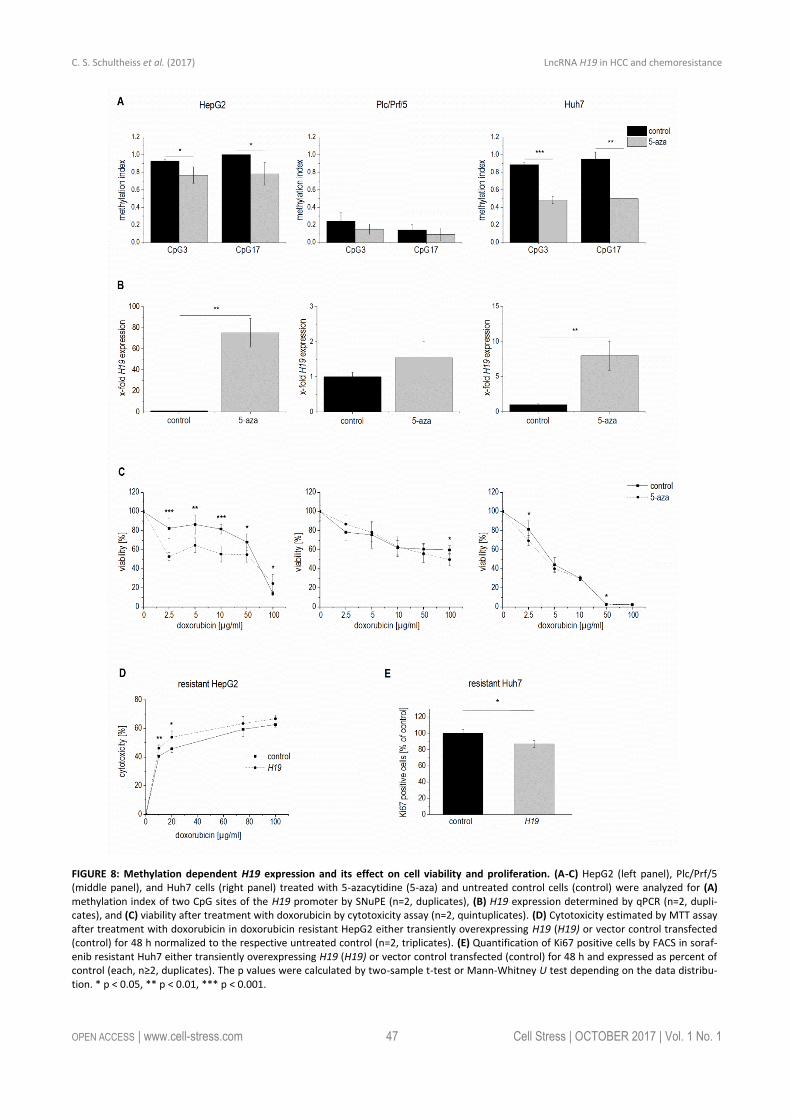
Therefore, we tested whether 5-azacytidine, a DNA demethylating agent, had an effect on chemosensitivity. As expected, the compound altered the CpG methylation of the H19 promoter in two of the three cell lines as meas-ured by SNuPE (Figure 8A) and significantly increased H19 expression in the same two cell lines (Figure 8B) with the strongest effect being seen in HepG2 cells, which were also distinctly sensitized towards doxorubicin in the presence of 5-azacytidine (Figure 8C). This is why HepG2 cells were also employed for an approach to test whether H19 overex-pression can reverse chemoresistance. We in fact observed an increased induction of cell death by doxorubicin after transfecting chemoresistant cells with H19 (Figure 8D). Since H19 rather seemed to act on proliferative actions in Huh7, we overexpressed H19 in chemoresistant Huh7 cells and in fact also observed chemosensitization (Figure 8E).
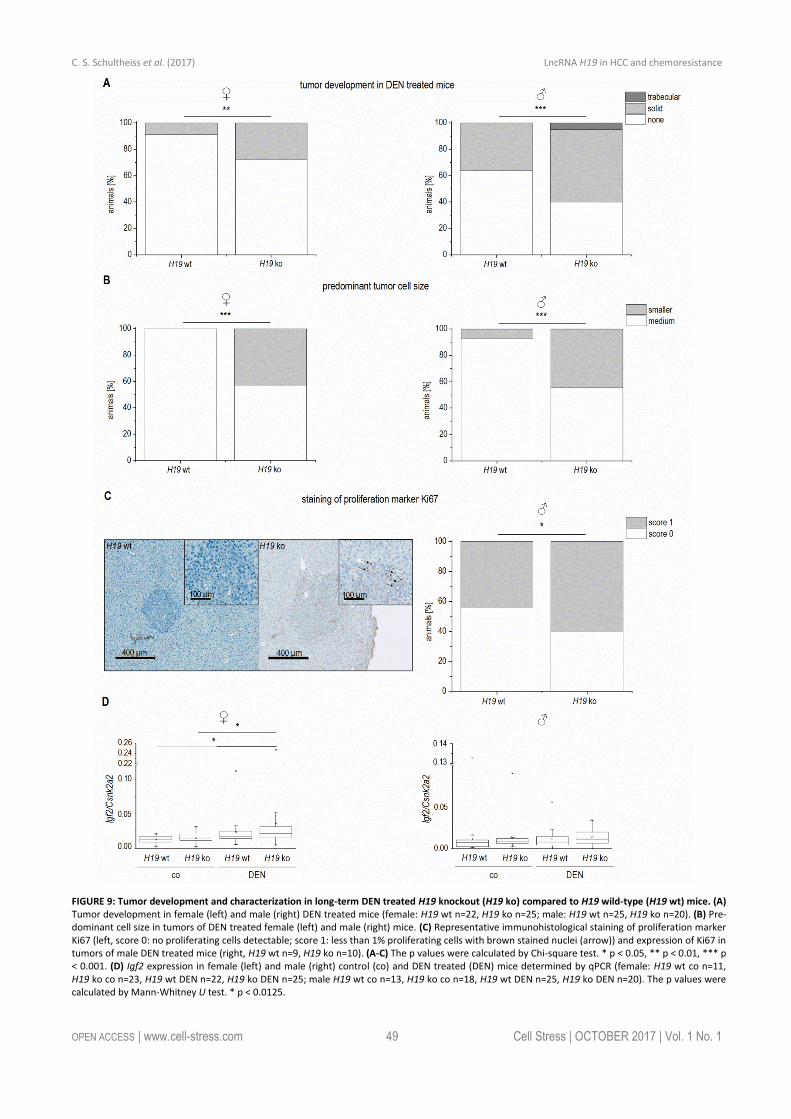
The data on reduced expression of H19 in human HCC and its chemosensitizing actions suggested tumor-suppressive actions of H19 in HCC. To determine whether the presence of H19 has an impact on tumorigenesis, wild-type and H19 knockout animals were treated with the car-cinogen DEN for 24 weeks. As expected [26], male mice developed more tumors than female mice (Figure 9A). In both sexes, H19 knockout significantly increased the num-ber of solid tumors. Trabecular tumors were only detecta-ble in male H19 knockout mice. The histological analysis also indicated that tumors of DEN-treated H19 deficient mice were characterized by small cell changes, represent-ing dysplastic lesions found in the process of liver carcino-genesis (Figure 9B).
C. S. Schultheiss et al. (2017) LncRNA H19 in HCC and chemoresistance
OPEN ACCESS | www.cell-stress.com 43 Cell Stress | OCTOBER 2017 | Vol. 1 No. 1
FIGURE 5: Effect of H19 overexpression and knockdown on cell viability and proliferation in HepG2 (left panels), Plc/Prf/5 (middle panels), and Huh7 (right panels) cells. (A) Cytotoxicity assay with doxorubicin in stably H19 overexpressing (H19) or vector control (control) cells normalized to their respective untreated control (n=2, sextuplicates). (B) Cytotoxicity assay with doxorubicin after transfection with H19 gapmer (H19 knockdown) and control gapmer (control) normalized to their respective untreated control (n=2, sextuplicates). (C) FACS analysis of the proliferation marker Ki67 in stably H19 overexpressing (H19) and vector control cells (control). Representative histograms of Ki67 FACS analysis are shown (upper panels). Quantification of Ki67 positive cells expressed as percent of control (n≥2, triplicates). The p values were calculated by two-sample t-test or Mann-Whitney U test depending on the data distribution. * p < 0.05, ** p < 0.01, *** p < 0.001.
C. S. Schultheiss et al. (2017) LncRNA H19 in HCC and chemoresistance
OPEN ACCESS | www.cell-stress.com 44 Cell Stress | OCTOBER 2017 | Vol. 1 No. 1
The proliferation-suppressive actions of H19, as shown in the two human hepatoma cell lines Huh7 and Plc/Prf/5, could also be verified in vivo: H19 deficient long-term DEN-treated animals exhibited elevated Ki67 staining (Figure 9C). The expression of the oncogenic growth factor Igf2 was not different between wild-type and H19 knockout mice (Figure 9D), although Igf2 expression was significantly induced upon DEN treatment in H19 knockouts (Figure 9D).
DISCUSSION H19 was first described more than thirty years ago, at a time when the biological role of non-coding RNAs was still undefined [27]. Since H19 together with Igf2 and Igf2r be-longs to the first imprinted genes described [28, 29], most
of the first two decades of H19 research focused on its epigenetic regulation.
While mouse data show a distinct downregulation of H19 expression in all tissues except for skeletal muscle after birth [28], analysis of human samples shows well de-tectable H19 levels in a wide array of tissue types (see e.g. http://medicalgenome.kribb.re.kr/GENT/). In fact, our analyses of four different patient cohorts comprising sev-eral hundreds of samples showed significantly higher H19 expression in normal liver tissue compared to HCC tissue. These findings support the findings of a previous study that analyzed H19 expression in 33 HCC tissues by qPCR com-pared to either adjacent non-tumor tissue or remote rela-tive normal tissue [30]. As in our results, some HCC tissues
FIGURE 6: Validation of chemoresistance and expression of H19 in sorafenib resistant (Sora-R), doxorubicin resistant (Dox-R), and chemo-sensitive (control) HepG2 (left panels), Plc/Prf/5 (middle panels), and Huh7 (right panels) cells. (A, B) Cytotoxicity assay normalized to the respective untreated control in (A) doxorubicin resistant cells (n=2, quintuplicates) and (B) sorafenib resistant cells (n=3, quintuplicates). (C) H19 expression determined by qPCR in doxorubicin (n=3, duplicates) and sorafenib (n=3, triplicates) resistant cells normalized to control cells. The p values were calculated by two-sample t-test or Mann-Whitney U test depending on the data distribution. * p < 0.05, ** p < 0.01, *** p < 0.001.
C. S. Schultheiss et al. (2017) LncRNA H19 in HCC and chemoresistance
OPEN ACCESS | www.cell-stress.com 45 Cell Stress | OCTOBER 2017 | Vol. 1 No. 1
of the latter study showed a dramatic increase in H19 ex-pression, but alltogether H19 was downregulated in HCC with high statistical significance. In fact, H19 expression was significantly lower in invasive HCC samples (n=31) compared to non-invasive HCC tumors (n=41) [30].
Interestingly, other studies reported elevated H19 ex-pression in HCC, e.g. [17, 31-33]. It has to be noted, how-ever, that these studies investigated a considerably lower number of samples and/or used methods, such as in situ hybridization with limited quantitative reliability. Taking
into account that all of our four patient cohorts, as well as those investigated by Zhang et al. (2013) [30], contained a small HCC patient subcohort with very high H19 levels, it becomes clear that investigations of small patient cohorts can lead to contradictory findings.
Also reports on a potential loss of imprinting (LOI), i.e. biallelic H19 expression, are of limited significance. In fact, some studies have reported LOI in a subset of HCC tissues ranging between 21% and 66%. The sample numbers of these studies, again, were very low (n=3 or n=23) [16, 17].
FIGURE 7: Methy- lation state of the H19 promoter in chemoresistant cells. (A) Analyzed H19 promoter region. The
bisulphite-converted DNA sequence is shown; CpG sites 1-23 (Chr.11: 2,019,761 - 2,019,488) are la- belled in grey; ampli-fication primers are underlined. (B, C) Absolute methylation of 23 CpG sites locat-ed in the H19 pro-moter in chemo-resistent (resistant) and chemosensitive (control) HepG2 (up- per panels), Plc/Prf/5 (middle panels), and Huh7 (bottom panels) cells analyzed by Bi-PROF (n=3, tripli-cates). (B) Doxorubi-cin resistant and (C) sorafenib resistant hepatoma cells. The p values were calculat-ed by two-sample t-test or Mann-Whitney U test depending on the data distribution. * p < 0.05, ** p < 0.01, *** p < 0.001.
C. S. Schultheiss et al. (2017) LncRNA H19 in HCC and chemoresistance
OPEN ACCESS | www.cell-stress.com 46 Cell Stress | OCTOBER 2017 | Vol. 1 No. 1
Our data revealed no difference in the imprinting status between normal and HCC tissue, with an equal proportion of samples exhibiting biallelic expression.
With the knowledge on a distinct regulation of H19 ex-pression by epigenetic modifications, we focused on po-tential alterations in the methylation state of the H19 pro-moter. Indeed, we observed strongly altered H19 promoter methylation in human HCC vs. normal liver tissue. While decreased promoter methylation is typically thought to be linked to elevated gene expression [34-36], a hypermethyl-ated promoter region has also been associated with in-creased expression of some genes [37, 38]. In fact, our data from a large HCC patient cohort suggested reduced pro-moter methylation correlating with reduced gene expres-sion. Since HCC and other cancer types are associated with global DNA hypomethylation [39-41], the link between H19 expression and promoter methylation remains unclear, and should be clarified in further studies. We observed the same in the investigated doxorubicin resistant Plc/Prf/5 cell line, which showed both reduced H19 expression and reduced promoter methylation compared to its chemosen-sitive counterpart. Interestingly, Plc/Prf/5 showed a much lower baseline promoter methylation compared to both HepG2 and Huh7, suggesting a differential epigenetic pro-file. Along this line, treatment of Plc/Prf/5 cells with the DNA demethylating agent 5-azacytidine neither affected H19 promoter methylation nor H19 expression.
All three sorafenib resistant cell lines as well as doxoru-bicin resistant Huh7 cells exhibited significantly elevated H19 promoter methylation and at the same time signifi-cantly reduced H19 expression compared to their respec-tive chemosensitive counterparts. These findings are in line with anti-correlated methylation of the H19 promoter and expression of H19 as found by others [20, 21]. Accordingly, treatment with the methyltransferase inhibitor 5-azacytidine reduced H19 promoter methylation in both HepG2 and Huh7 cells and significantly increased H19 ex-pression, as previously observed in other cell types [42]. Interestingly, H19 itself has been reported to increase DNMT3B-mediated cytosine methylation [43], suggesting diverse feedback processes.
Induction of H19 by 5-azacytidine in HepG2 and Huh7 cells increased their chemosensitivity. This confirms find-ings in the literature on chemosensitizing actions of the compound [44]. Chemoresistant versions of all three inves-tigated cell lines showed downregulated H19 expression. This suggested chemosensitizing actions of H19. In fact, H19 overexpression sensitized all three tested cell lines against both sorafenib and doxorubicin in clonogenicity assays. This effect seems to result from a synergistic effect of H19’s antiproliferative and chemosensitizing actions. These findings on chemosensitizing action of H19 are in contrast to a paper reporting chemoresistance induction by H19 and linking it to induction of the multidrug re-sistance protein (MDR1, ABCB1) [45]. Our investigations employing three different hepatoma cell lines could not verify these effects.
Chemosensitizing actions of H19 in our hands seemed to
differ between the different cell lines: in HepG2 cells, modulation of H19 expression rather affected cell death, whereas in Huh7 cells, H19 suppressed proliferation.
Our clonogenicity data suggest growth-suppressive ac-tions of H19 in the absence of any drug treatment. These data corroborate a hypothesis on the role of maternally expressed genes in embryonic development, already for-mulated in the early 1990s [46]. It provided a model of parental conflict, in which the females, through maternally expressed genes, balance resources allocated to current and future offspring. This notion led to the anticipation that maternally expressed genes limit growth.
Our in vivo data employing H19 knockout mice showed accelerated tumor development and more aggressive tu-mors. The literature contains two different H19 knockout mouse models. One of them, the H19Δ13 mouse, shows a distinct overgrowth phenotype [47]. This overgrowth is facilitated by a full re-expression of the adjacent Igf2 gene from the normally silent maternal allele due to the com-bined 13 kb deletion of the H19 gene and of the imprinting control region [47]. In the H19Δ3 knockout model, which we used and which only carries a 3 kb deletion of the H19 gene, only a slight re-expression of the maternal Igf2 was detected in mesodermal tissue [48]. With liver represent-ing an endodermal tissue, Igf2 expression is not increased in H19Δ3 mice as previously reported [48] and confirmed by ourselves.
In contrast to our findings Matouk et al. (2007) [14] sug-gested tumor promoting actions of H19 in a xenograft model employing Hep3B cells. Different aspects might be responsible for this discrepancy. While our model involves in vivo tumor induction, a xenograft model employs estab-lished tumor cells. So tumor-inducing actions cannot be investigated with a xenograft model. Another aspect re-lates to the role of the immune defense, since tumor growth and development are strongly controlled by the immune system and xenograft models employ immune deficient mice. In 2008, Yoshimizu and colleagues investi-gated the role of H19 and reported in fact that in vivo HCC development was accelerated in H19 knockout mice [13].
There are several papers that regard H19 as a promoter of cancer initiation and progression in a set of tumor types [8]. Interestingly, most of the H19 actions in this context have been explained by miR-675, a microRNA embedded within H19. This microRNA targets a whole array of tran-scripts, such as Igf1r, Smad1, Smad5, Cdc6, CDH-11 and -13, RB1, RUNX1, NOMO1, TGFBI, CALN1, and MITF (reviewed in [8]) and promotes cell proliferation [49]. In contrast, a recently published paper clearly showed that H19 reduces proliferation [50].
Taken together, the discrepancy of effects of H19 in the three different cell lines and the controversial literature data suggest a strong context dependency, and needs to be addressed in further studies.
While the expression of H19 was always strongly af-fected in our chemoresistance and proliferation studies, miR-675 showed minimal expression alterations. This is why we assume that in HCC it is rather H19 than miR-675,
C. S. Schultheiss et al. (2017) LncRNA H19 in HCC and chemoresistance
OPEN ACCESS | www.cell-stress.com 47 Cell Stress | OCTOBER 2017 | Vol. 1 No. 1
FIGURE 8: Methylation dependent H19 expression and its effect on cell viability and proliferation. (A-C) HepG2 (left panel), Plc/Prf/5 (middle panel), and Huh7 cells (right panel) treated with 5-azacytidine (5-aza) and untreated control cells (control) were analyzed for (A) methylation index of two CpG sites of the H19 promoter by SNuPE (n=2, duplicates), (B) H19 expression determined by qPCR (n=2, dupli-cates), and (C) viability after treatment with doxorubicin by cytotoxicity assay (n=2, quintuplicates). (D) Cytotoxicity estimated by MTT assay after treatment with doxorubicin in doxorubicin resistant HepG2 either transiently overexpressing H19 (H19) or vector control transfected (control) for 48 h normalized to the respective untreated control (n=2, triplicates). (E) Quantification of Ki67 positive cells by FACS in soraf-enib resistant Huh7 either transiently overexpressing H19 (H19) or vector control transfected (control) for 48 h and expressed as percent of control (each, n≥2, duplicates). The p values were calculated by two-sample t-test or Mann-Whitney U test depending on the data distribu-tion. * p < 0.05, ** p < 0.01, *** p < 0.001.
C. S. Schultheiss et al. (2017) LncRNA H19 in HCC and chemoresistance
OPEN ACCESS | www.cell-stress.com 48 Cell Stress | OCTOBER 2017 | Vol. 1 No. 1
which exerts biological actions. Interestingly, the mRNA binding protein HuR/ELAVL1, which has immunoregulatory potential (e.g. [51]) and suppresses the processing of H19 into miR-675 [7], is overexpressed in human HCC [52, 53], but not differentially expressed in our chemoresistant cell lines. In fact, tumor-promoting actions by HuR/ELAVL1 via the inhibition of microRNA processing in HCC have recently been reported [54].
Taken together, despite a small patient subcohort show-ing overexpressed H19, the majority of HCC tissues con-tained significantly reduced levels of this epigenetically regulated lncRNA. With its effect on HCC cancer cell growth, chemosensitivity, and carcinogenesis, H19 shows tumor-suppressive actions. Restoring H19 actions might therefore represent an interesting approach for future HCC therapy. MATERIALS AND METHODS Bioinformatic analyses TCGA data RNAseq expression data were obtained from The Cancer Ge-nome Atlas (https://cancergenome.nih.gov) via the Genomic Data Commons (https://gdc.cancer.gov), using the TCGAbi-olinks R package (v.2.2.6) [55]. The dataset comprised 364 primary solid tumor as well as 49 matched healthy liver tissue samples. For gene expression analysis, RSEM [56] normalized read counts were downloaded and log2-transformed. GEO datasets For differential gene expression analyses, 39 tumor and 39 adjacent non-tumor samples from the Total RNA Illumina Hu-manHT-12 V4.0 dataset GSE57957 were included. Similarly, differential gene expression was analyzed in dataset GSE54236 between tumor (n=74) and non-tumor (n=74) sam-ples of an Agilent-014850 Whole Human Genome Microarray 4x44K G4112F (three samples without sufficient information per group were excluded). Additionally, the methylation of the H19 promoter region 2 kb around the transcription start site was analyzed using the GSE57956 dataset of bisulfite convert-ed DNA from 58 tumors and 58 adjacent non-tumor samples hybridized to an Illumina Infinium 27k Human Methylation Beadchip (two samples without sufficient information per group were excluded). A subset of samples from GSE57956 was equal to the expression dataset GSE57957.
Clinical samples 32 human paraffin-embedded liver samples of tumor and matched non-tumorous adjacent tissue from randomly select-ed pseudonymized HCC patients who underwent liver resec-tion at the Saarland University Medical Center between 2005 and 2010 were obtained [18]. The study protocol was ap-proved by the local Ethics Committee (Kenn-Nr. 47/07). Clini-cal data were described previously [18, 19]. Microdissection and RT-PCR Tissue sections of paraffin-embedded (FFPE) tissues were mounted on nuclease and human nucleic acid free glass MembraneSlides (Leica Microsystems CMS, Wetzlar, Germany, order no. 11505189), deparaffinized and stained with hae-malaun. Laser microdissection was performed as described previously [57, 58] using a Leica LMD6000 microscope (Leica
Microsystems CMS). Laser-microdissected cells were trans-ferred into a reaction tube containing PKD buffer (Qiagen, Germany). RNA was isolated according to manufacturer’s pro-tocol “Purification of total RNA from microdissected FFPE tis-sue sections” using the RNeasy FFPE Kit (Qiagen, Hilden, Ger-many). 28 ng RNA were reverse transcribed using random primers as described [18].
RNA isolation and quantitative real-time RT-PCR (qPCR) Isolation of total RNA with QIAzol lysis reagent (Qiagen, Hilden, Germany), DNase digestion, reverse transcription of 0.5 µg RNA, and real-time RT-PCR were performed as described pre-viously [59--62]. For microRNAs the procedure was performed accordingly with minor modifications: the RNA after isopropa-nol precipitation was not washed with ethanol and reverse transcription with 2 µg RNA was performed using the miScript II RT Kit and HiSpec Buffer (Qiagen, Hilden, Germany) as rec-ommended by the manufacturer. Samples along with plasmid standard dilution series from 80 to 0.00008 attomol were run in triplicates using 5xHOT FIREPolTM Evagreen® qPCR Mix Plus (Solis BioDyne, Tartu, Estonia) in a CFX96 cycler (Bio-Rad, Munich, Germany) with specific primers (Table S1) (Eurofins Genomics, Ebersberg, Germany). The reaction conditions for the detection of mRNAs were 95°C for 15 min followed by 40 cycles of 30 s at 94°C, 30 s at primer-specific annealing tem-perature (AT listed in Table S1), and 30 s at 72°C. A melting curve from 55°C to 95°C was recorded to detect potential unintended products. For the detection of microRNAs the reaction conditions were 95°C for 15 min, followed by 40 cy-cles of 15 s at 94°C, 30 s at primer-specific annealing tempera-ture (AT listed in Table S1), and 30 s at 70°C. The human gene expression samples were normalized to actin beta (ACTB); murine samples to casein kinase 2 alpha 2 (Csnk2a2), and mi-croRNAs were normalized to RNU6B. H19 RNA immunoprecipitation Immunoprecipitation (IP) of HuR-associated RNAs from Huh7 cells, validation of IP by western blot, and qPCR for the nega-tive control GAPDH and the positive control cyclin B1 were performed as described previously [51]. Primer sequences and conditions for H19 IP qPCR (H19 IP) can be found in supple-mental Table S1. RFLP (restriction fragment length polymorphism) analysis Genomic DNA (gDNA) was isolated from paraffin-embedded tissues using the QIAamp DNA FFPE Tissue Kit (Qiagen, Hilden, Germany) according to the manufacturer’s instructions. Ge-nomic DNA was amplified to screen liver tissue samples for heterozygosity at a known AluI polymorphism at the H19 gene [63]. 9 of the 32 samples [18] were heterozygous and there-fore corresponding cDNA was tested for biallelic expression. Primer sequences used were the following: 5’-TACAACCACTGCACTACCTG-3’ (sense), 5’-TGGCCATGAAGATGGAGTCG-3’ (antisense). The PCR reaction was performed using the DyNAmo Flash SYBR® Green Master mix containing 400 nM primer, each. Amplification was per-formed in a Thermal Cycler (Px2 Thermal Cycler, Thermo Elec-tron Corporation, Schwerte, Germany). PCR products were digested for 2 h at 37°C with AluI (Fermentas, St. Leon-Rot, Germany). Detection of existence of polymorphisms and expression status was done by agarose gel electrophoresis showing three bands (228 bp, 128 bp, and 100 bp) in gDNA
C. S. Schultheiss et al. (2017) LncRNA H19 in HCC and chemoresistance
OPEN ACCESS | www.cell-stress.com 49 Cell Stress | OCTOBER 2017 | Vol. 1 No. 1
FIGURE 9: Tumor development and characterization in long-term DEN treated H19 knockout (H19 ko) compared to H19 wild-type (H19 wt) mice. (A) Tumor development in female (left) and male (right) DEN treated mice (female: H19 wt n=22, H19 ko n=25; male: H19 wt n=25, H19 ko n=20). (B) Pre-dominant cell size in tumors of DEN treated female (left) and male (right) mice. (C) Representative immunohistological staining of proliferation marker Ki67 (left, score 0: no proliferating cells detectable; score 1: less than 1% proliferating cells with brown stained nuclei (arrow)) and expression of Ki67 in tumors of male DEN treated mice (right, H19 wt n=9, H19 ko n=10). (A-C) The p values were calculated by Chi-square test. * p < 0.05, ** p < 0.01, *** p < 0.001. (D) Igf2 expression in female (left) and male (right) control (co) and DEN treated (DEN) mice determined by qPCR (female: H19 wt co n=11, H19 ko co n=23, H19 wt DEN n=22, H19 ko DEN n=25; male H19 wt co n=13, H19 ko co n=18, H19 wt DEN n=25, H19 ko DEN n=20). The p values were calculated by Mann-Whitney U test. * p < 0.0125.
C. S. Schultheiss et al. (2017) LncRNA H19 in HCC and chemoresistance
OPEN ACCESS | www.cell-stress.com 50 Cell Stress | OCTOBER 2017 | Vol. 1 No. 1
after digestion. In case of monoallelic expression, cDNA was expected to show one 148 bp band and three bands (48 bp, 100 bp, and 148 bp) in case of biallelic expression. Due to the high agarose concentration (3%), the 48 bp band was not de-tectable. Cell culture HepG2, Huh7, and Plc/Prf/5 cells were cultured in RPMI-1640 medium with 10% fetal calf serum, 1% penicillin/streptomycin, and 1% glutamine (Sigma-Aldrich, Taufkirchen, Germany) at 37°C and 5% CO2. Establishment of chemoresistant cells Doxorubicin-resistant (HepG2-Dox-R, Huh7-Dox-R, and Plc/Prf/5-Dox-R) and sorafenib-resistant (HepG2-Sora-R, Huh7-Sora-R, and Plc/Prf/5-Sora-R) cells were established by treatment with increasing concentrations of the cytostatic drugs over several months. In order to maintain the resistance, cells were treated biweekly with doxorubicin (HepG2-Dox-R: 1 µg/ml, Huh7-Dox-R: 0.2 µg/ml, and Plc/Prf/5-Dox-R: 2 µg/ml) or sorafenib (HepG2-Sora-R, Huh7-Sora-R, and Plc/Prf/5-Sora-R: 10 µM) for 24 h. Chemoresistance was confirmed by MTT assay. Stable and transient H19 overexpression Stable H19 overexpression in hepatoma cells was established by transfection with a vector (pcDNa3.1(+)_A009) containing the synthetic H19-sequence or the empty vector as control (Figure S1) (Ref. No.: 1381790, Life Technologies, California, USA) using jetPEI
TM Hepatocyte reagent (102-05N, VWR Inter-
national GmbH, Darmstadt, Germany) as recommended by the manufacturer. The final vector construct was verified by se-quencing. Resistance to geneticin (G418, Invitrogen, Darm-stadt, Germany) was conferred by the neomycin resistance gene (Neo (R)).
Transient H19 overexpression in chemoresistant cells was performed accordingly, but cells were treated with doxorubi-cin or sorafenib (HepG2-Dox-R: 2 µg/ml; Huh7-Sora-R: 2.5 µM) simultaneously with the plasmid transfection. H19 overex-pression was confirmed by qPCR. H19 knockdown H19 knockdown was performed in 96-well plates with anti-sense LNATM gapmer (Exiqon, Vedbaek, Denmark) for H19 (5’-GACTTAGTGCAAATTA-3’) or negative control A (5’-AACACGTCTATACGC-3’) (gapmer concentration per well: HepG2: 0.04 µM, Plc/Prf/5: 0.02 µM, and Huh7: 0.03 µM) us-ing INTERFERin® (Polyplus-Transfection, Illkirch, France) trans-fection reagent as recommended by the manufacturer. The negative control shows no homology to any known microRNA, lncRNA, or mRNA. H19 knockdown was confirmed by qPCR.
Cytotoxicity assay (MTT assay) Hepatoma cells were seeded into 96-well plates and treated with different concentrations of doxorubicin (Sigma-Aldrich, Taufkirchen, Germany), sorafenib (Biomol GmbH, Hamburg, Germany), or the respective solvent control. 24 h after treat-ment, medium was removed and 0.5 mg/ml MTT (3-[4,5-dimethylthiazol-2-yl]-2,5- diphenyltetrazolium bromide; thia-zolyl blue) (Sigma-Aldrich, Taufkirchen, Germany) diluted in medium was added. After 2 h incubation, the formazan crys-tals were dissolved in dimethyl sulfoxide, and the absorbance
was measured at 550 nm with 630 nm as reference wave-length in a microplate reader (Tecan Sunrise™, Tecan Group Ltd., Männedorf, Switzerland) [64, 65].
For the MTT assay after 5-azacytidine treatment, cells were treated over four days with 2 µM of the DNA-methyltransferases inhibitor 5-azacytidine (Sigma-Aldrich, Taufkirchen, Germany), which was freshly added each day.
Clonogenicity assay The hepatoma cells HepG2, Huh7, and Plc/Prf/5 were seeded into 6-well plates, allowed to attach overnight, and treated with the indicated concentrations of sorafenib or doxorubicin for another 24 h. Following the treatment, cells were washed with PBS and allowed to form colonies in complete growth medium. After 10 to 15 days, the colonies were fixed in meth-anol, stained with crystal violet, and counted. For the soraf-enib experiments colonies were counted with a clono counter software as previously described [66, 67] and for the doxoru-bicin experiments colonies were counted manually.
Ki67 staining Cells were detached from the plates using trypsin (Sigma-Aldrich, Taufkirchen, Germany) and cell staining was per-formed as described previously [51]. For intracellular staining of Ki67, cells were washed with flow cytometry buffer (FCB; PBS containing 2.5% (v/v) bovine calf serum and 0.05% (w/v) NaN3) and fixed for 10 min in 1% (w/v) paraformaldehyde in PBS, pH 7.6, followed by permeabilization in SAP (FCB with 0.2% (w/v) saponin, and blocking for 30 min in 20% FCS (v/v, diluted in SAP). Cells were incubated with Ki67 or isotype con-trol antibody (10 µl in 50 μl of FCB; BD Biosciences Heidelberg, Germany) for 15 min on ice. The cells were washed in FCB and resuspended in 1% (w/v) cold paraformaldehyde in PBS, pH 7.6. The stained cells were examined on a BD LSRFortessa™ cell analyser and results were analyzed using the FACS Diva software (BD Biosciences, Heidelberg, Germany). DNA methylation analysis DNA extraction and bisulfite conversion Genomic DNA from HepG2, Plc/Prf/5, and Huh7 cells was ex-tracted with the GenEluteTM Mammalian Genomic DNA Mini-prep Kit (Sigma-Aldrich, Taufkirchen, Germany) and bisulfite treatment of 500 ng genomic DNA was performed with the EZ DNA Methylation-Gold Kit (Zymo Research, Freiburg, Germa-ny) according to the manufacturer’s instructions. Single nucleotide primer extension (SNuPE) Amplicons were generated using a previously described proto-col [68] and region-specific primers for the H19 promoter (10 μM each): forward (5’-3’): GGGTTTGGGAGAGTTTGTGAGGT; reverse (5’-3’): AACACAAAAAACCCCTTCCTACCA. The PCR reac-tion conditions were 15 min at 95°C followed by 42 cycles of 95°C for 60 s, 57.6°C for 60 s, 72°C for 60 s, and a final 5 min extension at 72°C. The single nucleotide primer extension for two CpG sites of the H19 promoter (CpG 3 primer (5’-3’): TGTTAGTAGAGTG and CpG 17 primer (5’-3’): GTGATTAG-TATAAGTT) was performed as previously described [42]. Local deep bisulfite sequencing (Bi-PROF) For the analysis with next generation sequencing, the recom-mended adaptors were added to the primer sequences for the amplicon generation (forward (5’-3’): TCTTTCCCTACACGAC-
C. S. Schultheiss et al. (2017) LncRNA H19 in HCC and chemoresistance
OPEN ACCESS | www.cell-stress.com 51 Cell Stress | OCTOBER 2017 | Vol. 1 No. 1
GCTCTTCCGATCTGGGTTTGGGAGAGTTTGTGAGGT and reverse (5’-3’): GTGACTGGAGTTCAGAC-GTGTGCTCTTCCGATCTAACACAAAAAACC CCTTCCTACCA, an-nealing temperature 60°C). Purified PCR products were pooled in an equimolar ratio and sequenced [69] on a MiSeq instru-ment with the sequencing-by-synthesis technology (2 x 300 bp paired-end) aiming at 10,000 reads per amplicon according to the manufacturer’s protocol.
DEN mouse model All animal procedures were performed in accordance with the local animal welfare committee (36/2013, 36/2014). Mice were kept under controlled conditions regarding temperature, humidity, 12 h day/night rhythm, and food access.
For the long-term experiment, H19 knockout (H19Δ3; H19 ko) mice [48, 70] matched with wild-type (wt) littermates were intraperitoneally injected with 5 mg/kg body weight diethylnitrosamine (DEN) (Sigma-Aldrich, Taufkirchen, Germa-ny) at the age of two weeks and sacrificed 24 weeks after in-jection. Untreated mice served as control (co) (female: H19 wt co n=11, H19 ko co n=23, H19 wt DEN n=22, H19 ko DEN n=25; male H19 wt co n=13, H19 ko co n=18, H19 wt DEN n=25, H19 ko DEN n=20) [71, 72].
For the short-term experiment nine week old male mice were intraperitoneally injected with either 100 mg/kg body weight DEN or NaCl as a sham-control (each, n=5). Mice were sacrificed 48 h after the injection [72-74].
Immunohistochemistry Hematoxylin-eosin staining and immunohistological staining for the proliferation marker Ki67 on paraffin-embedded tis-sues and sample examination were performed as previously described [19, 72, 75]. Chromogenic in situ hybridization (CISH) Eight paraffin-embedded samples from HCC patients were investigated. The reseach project was authorized by the ethi-cal committee of the Medical University of Graz (Ref. Nr. 20-119 ex 08/09). CISH was performed using the miCURY LNATM microRNA ISH Optimization Kit (FFPE) (Exiqon, Vedbaek, Den-mark) according to manufacturer’s instruction. A biotin-labeled probe was used for the detection of H19 RNA (/5BioTEG/GTCCTGTAACCAAAAGTGACCG, Exiqon, Vedbaek, Denmark). A digoxin-labeled probe of scrambled RNA served as negative control (/5DigN/GTGTAACACGTCTATACGCCCA, Exiqon, Vedbaek, Denmark) and a digoxin-labeled beta-actin probe was used as positive control (/5DigN/CTCATTGTAGAAGGTGTGGTGCCA, Exiqon, Vedbaek, Denmark). All probes were used in a concentration of 40 nM. Proteinase K digestion was done for 10 min at 37°C with 15 µg/ml Proteinase K (Roche, Mannheim, Germany). The hybrid-ization step was performed at 56°C for 1 h in a slide hybridizer DakoCytomation (Dako, Hamburg, Germany). Nuclei were counterstained with Nuclear Fast Red Counterstain (Vector Laboratories, Burlingname, CA, USA).
Statistical analysis Data analysis and statistics were performed with Excel 2013 and OriginPro 8.6G (OriginLab Corporation, Northampton, USA). Values were expressed as mean ± SEM or as box plots with 25th/75th percentile boxes, geometric medians (line), means (square), and 10th/90th percentile as whiskers. Statis-tical differences were calculated using an independent two-sample t-test, Mann-Whitney U test, or Kolmogorov-Smirnov test as indicated depending on whether the data were normal-ly distributed. A chi-square test was used for the statistical analysis of tumor development and characterization in mouse livers. ACKNOWLEDGEMENTS We thank Theo Ranßweiler, Margit Gogg-Kammerer, Jas-min Kirch, Beate Schmitt, Mohamed Al-Effah, and Julia Michaely for excellent technical assistance. We thank Eva Dilly for help in animal care. The project was funded, in part, by the Else Kröner-Fresenius-Stiftung (2012_A250 to AKK and SMK), an EASL Dame Sheila Sherlock Fellowship (to SMK), a Bank Austria Visiting Scientists Programme Fellowship (to SMK), the Deutsche Krebshilfe (107751 to AKK), the Boehringer Ingelheim Fonds (to CS), the Dr. Hilmer Stiftung (to KH), and the BMBF LiSyM 031L0051 (to FL). The results upon which this publication is based were partly funded by the Federal Ministry of Education and Research under the Project Number [O1KU1216F] (to AKK). The responsibility for the content of this publication lies with the authors.
SUPPLEMENTAL MATERIAL All supplemental data for this article are available online at www.cell-stress.com.
CONFLICT OF INTEREST The authors declare that there is no conflict of interest to disclose.
COPYRIGHT © 2017 Schultheiss et al. This is an open-access article re-leased under the terms of the Creative Commons Attribu-tion (CC BY) license, which allows the unrestricted use, distribution, and reproduction in any medium, provided the original author and source are acknowledged.
Please cite this article as: Christina S. Schultheiss, Stephan Laggai, Beate Czepukojc, Usama K. Hussein, Markus List, Ahmad Barghash, Sascha Tierling, Kevan Hosseini, Nicole Golob-Schwarzl, Juliane Pokorny, Nina Hachenthal, Marcel Schulz, Volkhard Helms, Jörn Walter, Vincent Zimmer, Frank Lammert, Rainer M. Bohle, Luisa Dandolo, Johannes Haybaeck, Alexandra K. Kiemer, Sonja M. Kess-ler (2017). The long non-coding RNA H19 suppresses carcinogene-sis and chemoresistance in hepatocellular carcinoma. Cell Stress 1(1): 37-54. doi: 10.15698/cst2017.10.105
REFERENCES 1.Consortium IHGS (2004). Finishing the euchromatic sequence of the human genome. Nature 431: 931-945. doi:10.1038/nature03001
2. Wang WT, Ye H, Wei PP, Han BW, He B, Chen ZH, Chen YQ (2016). LncRNAs H19 and HULC, activated by oxidative stress, promote cell
C. S. Schultheiss et al. (2017) LncRNA H19 in HCC and chemoresistance
OPEN ACCESS | www.cell-stress.com 52 Cell Stress | OCTOBER 2017 | Vol. 1 No. 1
migration and invasion in cholangiocarcinoma through a ceRNA manner. J Hematol Oncol 9: 117. doi:10.1186/s13045-016-0348-0
3. Ohtsuka M, Ling H, Ivan C, Pichler M, Matsushita D, Goblirsch M, Stiegelbauer V, Shigeyasu K, Zhang X, Chen M, Vidhu F, Bartholomeusz GA, Toiyama Y, Kusunoki M, Doki Y, Mori M, Song S, Gunther JR, Krishnan S, Slaby O, Goel A, Ajani JA, Radovich M, Calin GA (2016). H19 Noncoding RNA, an Independent Prognostic Factor, Regulates Essential Rb-E2F and CDK8-beta-Catenin Signaling in Colorectal Cancer. EBioMedicine 13: 113-124. doi:10.1016/j.ebiom.2016.10.026
4. Li X, Wang H, Yao B, Xu W, Chen J, Zhou X (2016). lncRNA H19/miR-675 axis regulates cardiomyocyte apoptosis by targeting VDAC1 in diabetic cardiomyopathy. Sci Rep 6: 36340. doi:10.1038/srep36340
5. Chen SW, Wang PY, Liu YC, Sun L, Zhu J, Zuo S, Ma J, Li TY, Zhang JL, Chen GW, Wang X, Zhu QR, Zheng YW, Chen ZY, Yao ZH, Pan YS (2016). Effect of Long Noncoding RNA H19 Overexpression on Intestinal Barrier Function and Its Potential Role in the Pathogenesis of Ulcerative Colitis. Inflamm Bowel Dis 22: 2582-2592. doi:10.1097/MIB.0000000000000932
6. Cai X, Cullen BR (2007). The imprinted H19 noncoding RNA is a primary microRNA precursor. RNA 13: 313. doi: 10.1261/rna.351707
7. Keniry A, Oxley D, Monnier P, Kyba M, Dandolo L, Smits G, Reik W (2012). The H19 lincRNA is a developmental reservoir of miR-675 that suppresses growth and Igf1r. Nat Cell Biol 14: 659-665. doi: 10.1038/ncb2521
8. Raveh E, Matouk IJ, Gilon M, Hochberg A (2015). The H19 Long non-coding RNA in cancer initiation, progression and metastasis - a proposed unifying theory. Mol Cancer 14: 184. doi:10.1186/s12943-015-0458-2
9. Kohno T, Tsuge M, Murakami E, Hiraga N, Abe H, Miki D, Imamura M, Ochi H, Hayes CN, Chayama K (2014). Human microRNA hsa-miR-1231 suppresses hepatitis B virus replication by targeting core mRNA. J Viral Hepat 21: e89-97. doi:10.1111/jvh.12240
10. Lu TX, Sherrill JD, Wen T, Plassard AJ, Besse JA, Abonia JP, Franciosi JP, Putnam PE, Eby M, Martin LJ, Aronow BJ, Rothenberg ME (2012). MicroRNA signature in patients with eosinophilic esophagitis, reversibility with glucocorticoids, and assessment as disease biomarkers. J Allergy Clin Immunol 129: 1064-1075. doi:10.1016/j.jaci.2012.01.060
11. El-Serag HB, Rudolph KL (2007). Hepatocellular carcinoma: epidemiology and molecular carcinogenesis. Gastroenterology 132: 2557-2576. doi:10.1053/j.gastro.2007.04.061
12. Stewart BW, Wild CP (2014). World cancer report 2014. International Agency for Research on Cancer. Available at: www.iarc.fr/en/publications/books/wcr/wcr-order.php [Accessed 06.02.2014]
13. Yoshimizu T, Miroglio A, Ripoche MA, Gabory A, Vernucci M, Riccio A, Colnot S, Godard C, Terris B, Jammes H, Dandolo L (2008). The H19 locus acts in vivo as a tumor suppressor. Proc Natl Acad Sci U S A 105: 12417-12422. doi: 10.1073/pnas.0801540105
14. Matouk IJ, DeGroot N, Mezan S, Ayesh S, Abu-lail R, Hochberg A, Galun E (2007). The H19 non-coding RNA is essential for human tumor growth. PLoS One 2: e845. doi:10.1371/journal.pone.0000845
15. Gabory A, Ripoche MA, Yoshimizu T, Dandolo L (2006). The H19 gene: regulation and function of a non-coding RNA. Cytogenet Genome Res 113: 188-193. doi:10.1159/000090831
16. Kim KS, Lee YI (1997). Biallelic expression of the H19 and IGF2 genes in hepatocellular carcinoma. Cancer Lett 119: 143-148. doi: 10.1016/s0304-3835(97)00264-4
17. Wu J, Qin Y, Li B, He WZ, Sun ZL (2008). Hypomethylated and hypermethylated profiles of H19DMR are associated with the aberrant imprinting of IGF2 and H19 in human hepatocellular carcinoma. Genomics 91: 443-450. doi:10.1016/j.ygeno.2008.01.007
18. Kessler SM, Pokorny J, Zimmer V, Laggai S, Lammert F, Bohle RM, Kiemer AK (2013). IGF2 mRNA binding protein p62/IMP2-2 in hepatocellular carcinoma: antiapoptotic action is independent of IGF2/PI3K signaling. Am J of Physiol Gastrointest Liver Physiol 304: G328-G336 doi:10.1152/ajpgi.00005.2012
19. Kessler SM, Simon Y, Gemperlein K, Gianmoena K, Cadenas C, Zimmer V, Pokorny J, Barghash A, Helms V, van Rooijen N, Bohle RM, Lammert F, Hengstler JG, Mueller R, Haybaeck J, Kiemer AK (2014). Fatty acid elongation in non-alcoholic steatohepatitis and hepatocellular carcinoma. Int J Mol Sci 15: 5762-5773. doi:10.3390/ijms15045762
20. Gao ZH, Suppola S, Liu J, Heikkila P, Janne J, Voutilainen R (2002). Association of H19 promoter methylation with the expression of H19 and IGF-II genes in adrenocortical tumors. J Clin Endocrinol Metab 87: 1170-1176. doi:10.1210/jcem.87.3.8331
21. Hadji F, Boulanger MC, Guay SP, Gaudreault N, Amellah S, Mkannez G, Bouchareb R, Marchand JT, Nsaibia MJ, Guauque-Olarte S, Pibarot P, Bouchard L, Bosse Y, Mathieu P (2016). Altered DNA Methylation of Long Noncoding RNA H19 in Calcific Aortic Valve Disease Promotes Mineralization by Silencing NOTCH1. Circulation 134: 1848-1862. doi:10.1161/CIRCULATIONAHA.116.023116
22. Franken NA, Rodermond HM, Stap J, Haveman J, van Bree C (2006). Clonogenic assay of cells in vitro. Nat Protoc 1: 2315-2319. doi:10.1038/nprot.2006.339
23. Germano D, Daniele B (2014). Systemic therapy of hepatocellular carcinoma: current status and future perspectives. World J Gastroenterol 20: 3087-3099. doi:10.3748/wjg.v20.i12.3087
24. Lencioni R, Llovet JM, Han G, Tak WY, Yang J, Guglielmi A, Paik SW, Reig M, Kim do Y, Chau GY, Luca A, del Arbol LR, Leberre MA, Niu W, Nicholson K, Meinhardt G, Bruix J (2016). Sorafenib or placebo plus TACE with doxorubicin-eluting beads for intermediate stage HCC: The SPACE trial. J Hepatol 64: 1090-1098. doi:10.1016/j.jhep.2016.01.012
25. Rachmilewitz J, Goshen R, Ariel I, Schneider T, de Groot N, Hochberg A (1992). Parental imprinting of the human H19 gene. FEBS Lett 309: 25-28. doi: 10.1016/0014-5793(92)80731-u
26. Nakatani T, Roy G, Fujimoto N, Asahara T, Ito A (2001). Sex hormone dependency of diethylnitrosamine-induced liver tumors in mice and chemoprevention by leuprorelin. Jpn J Cancer Res 92: 249-256. doi:10.1111/j.1349-7006.2001.tb01089.x
27. Pachnis V, Belayew A, Tilghman SM (1984). Locus unlinked to alpha-fetoprotein under the control of the murine raf and Rif genes. Proc Natl Acad Sci U S A 81: 5523-5527. doi:10.1073/pnas.81.17.5523
28. Bartolomei MS, Zemel S, Tilghman SM (1991). Parental imprinting of the mouse H19 gene. Nature 351: 153-155. doi:10.1038/351153a0
29. Tilghman SM, Bartolomei MS, Webber AL, Brunkow ME, Saam J, Leighton PA, Pfeifer K, Zemel S (1993). Parental imprinting of the H19 and Igf2 genes in the mouse. Cold Spring Harb Symp Quant Biol 58: 287-295. doi:10.1101/SQB.1993.058.01.034
C. S. Schultheiss et al. (2017) LncRNA H19 in HCC and chemoresistance
OPEN ACCESS | www.cell-stress.com 53 Cell Stress | OCTOBER 2017 | Vol. 1 No. 1
30. Zhang L, Yang F, Yuan JH, Yuan SX, Zhou WP, Huo XS, Xu D, Bi HS, Wang F, Sun SH (2013). Epigenetic activation of the MiR-200 family contributes to H19-mediated metastasis suppression in hepatocellular carcinoma. Carcinogenesis 34: 577-586. doi:10.1093/carcin/bgs381
31. Ariel I, Miao HQ, Ji XR, Schneider T, Roll D, de Groot N, Hochberg A, Ayesh S (1998). Imprinted H19 oncofetal RNA is a candidate tumour marker for hepatocellular carcinoma. Mol Pathol 51: 21-25. doi:10.1136/mp.51.1.21
32. Fellig Y, Ariel I, Ohana P, Schachter P, Sinelnikov I, Birman T, Ayesh S, Schneider T, de Groot N, Czerniak A, Hochberg A (2005). H19 expression in hepatic metastases from a range of human carcinomas. J Clin Pathol 58: 1064-1068. doi:10.1136/jcp.2004.023648
33. Sohda T, Iwata K, Soejima H, Kamimura S, Shijo H, Yun K (1998). In situ detection of insulin-like growth factor II (IGF2) and H19 gene expression in hepatocellular carcinoma. J Hum Genet 43: 49-53. doi:10.1007/s100380050036
34. Okada H, Kimura MT, Tan D, Fujiwara K, Igarashi J, Makuuchi M, Hui AM, Tsurumaru M, Nagase H (2005). Frequent trefoil factor 3 (TFF3) overexpression and promoter hypomethylation in mouse and human hepatocellular carcinomas. Int J Oncol 26: 369-377. doi:10.3892/ijo.26.2.369
35. Kong LM, Liao CG, Chen L, Yang HS, Zhang SH, Zhang Z, Bian HJ, Xing JL, Chen ZN (2011). Promoter hypomethylation up-regulates CD147 expression through increasing Sp1 binding and associates with poor prognosis in human hepatocellular carcinoma. J Cell Mol Med 15: 1415-1428. doi:10.1111/j.1582-4934.2010.01124.x
36. Yang B, Liu Y, Zhao J, Hei K, Zhuang H, Li Q, Wei W, Chen R, Zhang N, Li Y (2017). Ectopic overexpression of filamin C scaffolds MEK1/2 and ERK1/2 to promote the progression of human hepatocellular carcinoma. Cancer Lett 388: 167-176. doi:10.1016/j.canlet.2016.11.037
37. Ding Z, Qian YB, Zhu LX, Xiong QR (2009). Promoter methylation and mRNA expression of DKK-3 and WIF-1 in hepatocellular carcinoma. World J Gastroenterol 15: 2595-2601. doi:10.3748/wjg.15.2595
38. Wagner JR, Busche S, Ge B, Kwan T, Pastinen T, Blanchette M (2014). The relationship between DNA methylation, genetic and expression inter-individual variation in untransformed human fibroblasts. Genome Biol 15: R37. doi:10.1186/gb-2014-15-2-r37
39. Kim YI, Giuliano A, Hatch KD, Schneider A, Nour MA, Dallal GE, Selhub J, Mason JB (1994). Global DNA hypomethylation increases progressively in cervical dysplasia and carcinoma. Cancer 74: 893-899. doi: 10.1002/1097-0142(19940801)74:3<893::aid-cncr2820740316>3.0.co;2-b
40. Lin CH, Hsieh SY, Sheen IS, Lee WC, Chen TC, Shyu WC, Liaw YF (2001). Genome-wide hypomethylation in hepatocellular carcinogenesis. Cancer Res 61: 4238. PMID: 11358850
41. Shen L, Fang J, Qiu D, Zhang T, Yang J, Chen S, Xiao S (1998). Correlation between DNA methylation and pathological changes in human hepatocellular carcinoma. Hepatogastroenterology 45: 1753-1759. PMID: 9840141
42. Diesel B, Ripoche N, Risch RT, Tierling S, Walter J, Kiemer AK (2012). Inflammation-induced up-regulation of TLR2 expression in human endothelial cells is independent of differential methylation in the TLR2 promoter CpG island. Innate Immun 18: 112-123. doi:10.1177/1753425910394888
43. Zhou J, Yang L, Zhong T, Mueller M, Men Y, Zhang N, Xie J, Giang K, Chung H, Sun X, Lu L, Carmichael GG, Taylor HS, Huang Y (2015). H19 lncRNA alters DNA methylation genome wide by regulating S-adenosylhomocysteine hydrolase. Nat Commun 6: 10221. doi:10.1038/ncomms10221
44. Festuccia C, Gravina GL, D'Alessandro AM, Muzi P, Millimaggi D, Dolo V, Ricevuto E, Vicentini C, Bologna M (2009). Azacitidine improves antitumor effects of docetaxel and cisplatin in aggressive prostate cancer models. Endocr Relat Cancer 16: 401-413. doi:10.1677/ERC-08-0130
45. Tsang WP, Kwok TT (2007). Riboregulator H19 induction of MDR1-associated drug resistance in human hepatocellular carcinoma cells. Oncogene 26: 4877-4881. doi:10.1038/sj.onc.1210266
46. Moore T, Haig D (1991). Genomic imprinting in mammalian development: a parental tug-of-war. Trends Genet 7: 45-49. doi:10.1016/0168-9525(91)90230-N
47. Leighton PA, Ingram RS, Eggenschwiler J, Efstratiadis A, Tilghman SM (1995). Disruption of imprinting caused by deletion of the H19 gene region in mice. Nature 375: 34-39. doi:10.1038/375034a0
48. Ripoche MA, Kress C, Poirier F, Dandolo L (1997). Deletion of the H19 transcription unit reveals the existence of a putative imprinting control element. Genes Dev 11: 1596-1604. doi:10.1101/gad.11.12.1596
49. Yu YQ, Weng J, Li SQ, Li B, Lv J (2016). MiR-675 Promotes the Growth of Hepatocellular Carcinoma Cells Through the Cdc25A Pathway. Asian Pac J Cancer Prev 17: 3881-3885. PMID:27644634
50. Martinet C, Monnier P, Louault Y, Benard M, Gabory A, Dandolo L (2016). H19 controls reactivation of the imprinted gene network during muscle regeneration. Development 143: 962-971. doi:10.1242/dev.131771
51. Hoppstadter J, Hachenthal N, Valbuena-Perez JV, Lampe S, Astanina K, Kunze MM, Bruscoli S, Riccardi C, Schmid T, Diesel B, Kiemer AK (2016). Induction of Glucocorticoid-induced Leucine Zipper (GILZ) Contributes to Anti-inflammatory Effects of the Natural Product Curcumin in Macrophages. J Biol Chem 291: 22949-22960. doi:10.1074/jbc.M116.733253
52. Vazquez-Chantada M, Fernandez-Ramos D, Embade N, Martinez-Lopez N, Varela-Rey M, Woodhoo A, Luka Z, Wagner C, Anglim PP, Finnell RH, Caballeria J, Laird-Offringa IA, Gorospe M, Lu SC, Mato JM, Martinez-Chantar ML (2010). HuR/methyl-HuR and AUF1 regulate the MAT expressed during liver proliferation, differentiation, and carcinogenesis. Gastroenterology 138: 1943-1953. doi:10.1053/j.gastro.2010.01.032
53. Zhu H, Berkova Z, Mathur R, Sehgal L, Khashab T, Tao RH, Ao X, Feng L, Sabichi AL, Blechacz B, Rashid A, Samaniego F (2015). HuR Suppresses Fas Expression and Correlates with Patient Outcome in Liver Cancer. Mol Cancer Res 13: 809-818. doi:10.1158/1541-7786.MCR-14-0241
54. Zhang LF, Lou JT, Lu MH, Gao C, Zhao S, Li B, Liang S, Li Y, Li D, Liu MF (2015). Suppression of miR-199a maturation by HuR is crucial for hypoxia-induced glycolytic switch in hepatocellular carcinoma. EMBO J 34: 2671-2685. doi:10.15252/embj.201591803
55. Colaprico A, Silva TC, Olsen C, Garofano L, Cava C, Garolini D, Sabedot TS, Malta TM, Pagnotta SM, Castiglioni I, Ceccarelli M, Bontempi G, Noushmehr H (2016). TCGAbiolinks: an R/Bioconductor package for integrative analysis of TCGA data. Nucleic Acids Res 44: e71. doi:10.1093/nar/gkv1507
C. S. Schultheiss et al. (2017) LncRNA H19 in HCC and chemoresistance
OPEN ACCESS | www.cell-stress.com 54 Cell Stress | OCTOBER 2017 | Vol. 1 No. 1
56. Li B, Dewey CN (2011). RSEM: accurate transcript quantification from RNA-Seq data with or without a reference genome. BMC Bioinformatics 12: 323. doi:10.1186/1471-2105-12-323
57. Fink L, Kinfe T, Stein MM, Ermert L, Hanze J, Kummer W, Seeger W, Bohle RM (2000). Immunostaining and laser-assisted cell picking for mRNA analysis. Lab Invest 80: 327-333. doi: 10.1038/labinvest.3780037
58. Fink L, Stahl U, Ermert L, Kummer W, Seeger W, Bohle RM (1999). Rat porphobilinogen deaminase gene: a pseudogene-free internal standard for laser-assisted cell picking. Biotechniques 26: 510-516. PMID: 10090993
59. Dembek A, Laggai S, Kessler SM, Czepukojc B, Simon Y, Kiemer AK, Hoppstädter J (2017). Hepatic interleukin-6 production is maintained during endotoxin tolerance and facilitates lipid accumulation. Immunobiology 222(6): 786-796. doi:10.1016/j.imbio.2017.01.003
60. Kessler SM, Laggai S, Van Wonterg E, Gemperlein K, Müller R, Haybaeck J, Vandenbroucke RE, Ogris M, Libert C, Kiemer AK (2016). Transient hepatic overexpression of insulin-like growth factor 2 induces free cholesterol and lipid droplet formation. Front Physiol 7: 147. doi:10.3389/fphys.2016.00147
61. Kiemer AK, Senaratne RH, Hoppstadter J, Diesel B, Riley LW, Tabeta K, Bauer S, Beutler B, Zuraw BL (2009). Attenuated activation of macrophage TLR9 by DNA from virulent mycobacteria. J Innate Immun 1: 29-45. doi:10.1159/000142731
62. Laggai S, Kessler SM, Boettcher S, Lebrun V, Gemperlein K, Lederer E, Leclercq IA, Mueller R, Hartmann RW, Haybaeck J, Kiemer AK (2014). The IGF2 mRNA binding protein p62/IGF2BP2-2 induces fatty acid elongation as a critical feature of steatosis. J Lipid Res 55: 1087-1097. doi:10.1194/jlr.M045500
63. Zhang Y, Tycko B (1992). Monoallelic expression of the human H19 gene. Nat Genet 1: 40-44. doi: 10.1038/ng0492-40
64. Astanina K, Simon Y, Cavelius C, Petry S, Kraegeloh A, Kiemer AK (2014). Superparamagnetic iron oxide nanoparticles impair endothelial integrity and inhibit nitric oxide production. Acta Biomater 10: 4896-4911. doi:10.1016/j.actbio.2014.07.027
65. Hoppstadter J, Seif M, Dembek A, Cavelius C, Huwer H, Kraegeloh A, Kiemer AK (2015). M2 polarization enhances silica nanoparticle uptake by macrophages. Front Pharmacol 6: 55. doi:10.3389/fphar.2015.00055
66. Tripathi K, Hussein UK, Anupalli R, Barnett R, Bachaboina L, Scalici J, Rocconi RP, Owen LB, Piazza GA, Palle K (2015). Allyl isothiocyanate induces replication-associated DNA damage response in NSCLC cells and sensitizes to ionizing radiation. Oncotarget 6: 5237-5252. doi:10.18632/oncotarget.3026
67. Niyazi M, Niyazi I, Belka C (2007). Counting colonies of clonogenic assays by using densitometric software. Radiat Oncol 2: 4. doi:10.1186/1748-717X-2-4
68. El-Maarri O (2004). SIRPH analysis: SNuPE with IP-RP-HPLC for quantitative measurements of DNA methylation at specific CpG sites. Methods Mol Biol 287: 195-205. doi:10.1385/1-59259-828-5:195
69. Gries J, Schumacher D, Arand J, Lutsik P, Markelova MR, Fichtner I, Walter J, Sers C, Tierling S (2013). Bi-PROF: bisulfite profiling of target regions using 454 GS FLX Titanium technology. Epigenetics 8: 765-771. doi:10.4161/epi.25242
70. Gabory A, Jammes H, Dandolo L (2010). The H19 locus: Role of an imprinted non-coding RNA in growth and development. Bioessays 32: 473. doi: 10.1002/bies.200900170
71. Kessler SM, Laggai S, Barghash A, Helms V, Kiemer AK (2014). Lipid metabolism signatures in NASH-associated HCC.--letter. Cancer Res 74: 2903-2904. doi:10.1158/0008-5472.CAN-13-2852
72. Kessler SM, Laggai S, Barghash A, Schultheiss CS, Lederer E, Artl M, Helms V, Haybaeck J, Kiemer AK (2015). IMP2/p62 induces genomic instability and an aggressive hepatocellular carcinoma phenotype. Cell Death Dis 6: e1894. doi:10.1038/cddis.2015.241
73. Park EJ, Lee JH, Yu GY, He G, Ali SR, Holzer RG, Österreicher CH, Takahashi H, Karin M (2010). Dietary and Genetic Obesity Promote Liver Inflammation and Tumorigenesis by Enhancing IL-6 and TNF Expression. Cell 140: 197. doi: 10.1016/j.cell.2009.12.052
74. Naugler WE, Sakurai T, Kim S, Maeda S, Kim K, Elsharkawy AM, Karin M (2007). Gender disparity in liver cancer due to sex differences in MyD88-dependent IL-6 production. Science 317: 121-124. doi:10.1126/science.1140485
75. Bettermann K, Mehta AK, Hofer EM, Wohlrab C, Golob-Schwarzl N, Svendova V, Schimek MG, Stumptner C, Thuringer A, Speicher MR, Lackner C, Zatloukal K, Denk H, Haybaeck J (2016). Keratin 18-deficiency results in steatohepatitis and liver tumors in old mice: A model of steatohepatitis-associated liver carcinogenesis. Oncotarget 7: 73309-73322. doi:10.18632/oncotarget.12325
Related Documents