arXiv:1307.7136v1 [astro-ph.CO] 26 Jul 2013 Draft version July 29, 2013 Preprint typeset using L A T E X style emulateapj v. 5/2/11 THE LONG LIVES OF GIANT CLUMPS AND THE BIRTH OF OUTFLOWS IN GAS-RICH GALAXIES AT HIGH REDSHIFT Fr´ ed´ eric Bournaud 1 , Valentin Perret 2 , Florent Renaud 1 , Avishai Dekel 3 , Bruce G. Elmegreen 4 , Debra M. Elmegreen 5 , Romain Teyssier 6 , Philippe Amram 2 , Emanuele Daddi 1 , Pierre-Alain Duc 1 , David Elbaz 1 , Benoit Epinat 2 , Jared M. Gabor 1 , St´ ephanie Juneau 1 , Katarina Kraljic 1 , Emeric Le Floch’ 1 Draft version July 29, 2013 ABSTRACT Star-forming disk galaxies at high redshift are often subject to violent disk instability, characterized by giant clumps whose fate is yet to be understood. The main question is whether the clumps disrupt within their dynamical timescale (≤ 50 Myr), like the molecular clouds in today’s galaxies, or whether they survive stellar feedback for more than a disk orbital time (≈ 300 Myr) in which case they can migrate inward and help building the central bulge. We present 3.5-7pc resolution AMR simulations of high-redshift disks including photo-ionization, radiation pressure, and supernovae feedback. Our modeling of radiation pressure determines the mass loading and initial velocity of winds from basic physical principles. We find that the giant clumps produce steady outflow rates comparable to and sometimes somewhat larger than their star formation rate, with velocities largely sufficient to escape galaxy. The clumps also lose mass, especially old stars, by tidal stripping, and the stellar populations contained in the clumps hence remain relatively young (≤ 200 Myr), as observed. The clumps survive gaseous outflows and stellar loss, because they are wandering in gas-rich turbulent disks from which they can re-accrete gas at high rates compensating for outflows and tidal stripping, overall keeping realistic and self-regulated gaseous and stellar masses. Our simulations produce gaseous outflows with velocities, densities and mass loading consistent with observations, and at the same time suggest that the giant clumps survive for hundreds of Myr and complete their migration to the center of high- redshift galaxies, without rapid dispersion and reformation of clumps. These long-lived clumps can be involved in inside-out evolution and thickening of the disk, spheroid growth and fueling of the central black hole. Subject headings: Galaxies: formation — Galaxies: evolution — Galaxies: high-redshift — Galaxies: structure — Galaxies: bulges 1. INTRODUCTION Massive high-redshift galaxies often have irregular morphologies dominated by giant clumps in optical imag- ing surveys (Cowie et al. 1996; Elmegreen et al. 2007), ionized gas observations (Genzel et al. 2008), and re- solved molecular gas maps (Tacconi et al. 2013). Typ- ically, a clumpy star-forming galaxy of stellar mass of a few 10 10−11 M ⊙ at redshift z ≈ 1 − 3 con- tains a handful of kpc-sized clumps containing each a few 10 8−9 M ⊙ of gas and stars (Elmegreen & Elmegreen 2005; Genzel et al. 2011). About half of the star forma- tion occurs in the giant clumps, the other half being in an apparently diffuse disk probably consisting of smaller, unresolved gas clouds (Elmegreen et al. 2009). At last half of star-forming galaxies at z> 1 in the CANDELS near-infrared imaging survey are clumpy (Mozena et al. in preparation, Guo et al. in preparation). 1 CEA, IRFU/SAp, 91191 Gif-Sur-Yvette, France 2 Aix Marseille Universit´ e, CNRS, LAM (Laboratoire d’Astrophysique de Marseille), 13388, Marseille, France 3 Center for Astrophysics and Planetary Science, Racah Insti- tute of Physics, The Hebrew University, Jerusalem 91904, Israel 4 IBM Research Division, T.J. Watson Research Center, York- town Heights, NY 10598, USA 5 Department of Physics and Astronomy, Vassar College, Poughkeepsie, NY 12604, USA 6 Institute for Theoretical Physics, University of Zurich, CH- 8057 Zurich, Switzerland From the following set of evidence, it is now widely accepted that the majority of the clumps form in- situ by gravitational instability with high characteristic Jeans mass and length (around 10 9 M ⊙ and 1 kpc, re- spectively). The host galaxies apparent shapes range from round to linear, with the respective fractions ex- pected for face-on to edge-on disks (with ≈ 1 kpc scale- heights, Elmegreen et al. 2004) and disk-like kinemat- ics with high turbulent velocity dispersions in both Hα and CO (Genzel et al. 2006; Shapiro et al. 2008; Bournaud et al. 2008; Contini et al. 2012; Daddi et al. 2010b ; Epinat et al. 2012; Tacconi et al. 2013, with perhaps some redshift evolution, Puech (2010)). The high fractions of dense molecular gas (about half of the baryonic mass, Daddi et al. 2008, 2010b, Tacconi et al. 2010) naturally explain the ocurrence of these violent instabilities and the high associated velocity dispersions required to regulate the disk at a Toomre stability param- eter Q ≈ 1 (Dekel et al. 2009b; Bournaud & Elmegreen 2009; Elmegreen & Burkert 2010) and indeed observa- tions are consistent with a dynamical state of the gas close to the Q ≈ 1 instability limit (Genzel et al. 2011). Simulations with different numerical schemes, of both idealized galaxies and galaxies in cosmological context, show the rapid development of strong turbu- lence and giant clump formation in such gas-rich galaxies (Noguchi 1999; Bournaud et al. 2007; Agertz et al. 2009; Ceverino et al. 2010; Powell et al. 2011; Martig et al.

Welcome message from author
This document is posted to help you gain knowledge. Please leave a comment to let me know what you think about it! Share it to your friends and learn new things together.
Transcript

arX
iv:1
307.
7136
v1 [
astr
o-ph
.CO
] 2
6 Ju
l 201
3Draft version July 29, 2013Preprint typeset using LATEX style emulateapj v. 5/2/11
THE LONG LIVES OF GIANT CLUMPS AND THE BIRTH OF OUTFLOWS IN GAS-RICH GALAXIES ATHIGH REDSHIFT
Frederic Bournaud1, Valentin Perret2, Florent Renaud1, Avishai Dekel3, Bruce G. Elmegreen4, Debra M.Elmegreen5, Romain Teyssier6, Philippe Amram2, Emanuele Daddi1, Pierre-Alain Duc1, David Elbaz1, Benoit
Epinat2, Jared M. Gabor1, Stephanie Juneau1, Katarina Kraljic1, Emeric Le Floch’1
Draft version July 29, 2013
ABSTRACT
Star-forming disk galaxies at high redshift are often subject to violent disk instability, characterizedby giant clumps whose fate is yet to be understood. The main question is whether the clumps disruptwithin their dynamical timescale (≤ 50Myr), like the molecular clouds in today’s galaxies, or whetherthey survive stellar feedback for more than a disk orbital time (≈ 300Myr) in which case they canmigrate inward and help building the central bulge. We present 3.5-7 pc resolution AMR simulationsof high-redshift disks including photo-ionization, radiation pressure, and supernovae feedback. Ourmodeling of radiation pressure determines the mass loading and initial velocity of winds from basicphysical principles. We find that the giant clumps produce steady outflow rates comparable to andsometimes somewhat larger than their star formation rate, with velocities largely sufficient to escapegalaxy. The clumps also lose mass, especially old stars, by tidal stripping, and the stellar populationscontained in the clumps hence remain relatively young (≤ 200Myr), as observed. The clumps survivegaseous outflows and stellar loss, because they are wandering in gas-rich turbulent disks from whichthey can re-accrete gas at high rates compensating for outflows and tidal stripping, overall keepingrealistic and self-regulated gaseous and stellar masses. Our simulations produce gaseous outflows withvelocities, densities and mass loading consistent with observations, and at the same time suggest thatthe giant clumps survive for hundreds of Myr and complete their migration to the center of high-redshift galaxies, without rapid dispersion and reformation of clumps. These long-lived clumps can beinvolved in inside-out evolution and thickening of the disk, spheroid growth and fueling of the centralblack hole.Subject headings: Galaxies: formation — Galaxies: evolution — Galaxies: high-redshift — Galaxies:
structure — Galaxies: bulges
1. INTRODUCTION
Massive high-redshift galaxies often have irregularmorphologies dominated by giant clumps in optical imag-ing surveys (Cowie et al. 1996; Elmegreen et al. 2007),ionized gas observations (Genzel et al. 2008), and re-solved molecular gas maps (Tacconi et al. 2013). Typ-ically, a clumpy star-forming galaxy of stellar massof a few 1010−11M⊙ at redshift z ≈ 1 − 3 con-tains a handful of kpc-sized clumps containing each afew 108−9M⊙ of gas and stars (Elmegreen & Elmegreen2005; Genzel et al. 2011). About half of the star forma-tion occurs in the giant clumps, the other half being inan apparently diffuse disk probably consisting of smaller,unresolved gas clouds (Elmegreen et al. 2009). At lasthalf of star-forming galaxies at z > 1 in the CANDELSnear-infrared imaging survey are clumpy (Mozena et al.in preparation, Guo et al. in preparation).
1 CEA, IRFU/SAp, 91191 Gif-Sur-Yvette, France2 Aix Marseille Universite, CNRS, LAM (Laboratoire
d’Astrophysique de Marseille), 13388, Marseille, France3 Center for Astrophysics and Planetary Science, Racah Insti-
tute of Physics, The Hebrew University, Jerusalem 91904, Israel4 IBM Research Division, T.J. Watson Research Center, York-
town Heights, NY 10598, USA5 Department of Physics and Astronomy, Vassar College,
Poughkeepsie, NY 12604, USA6 Institute for Theoretical Physics, University of Zurich, CH-
8057 Zurich, Switzerland
From the following set of evidence, it is now widelyaccepted that the majority of the clumps form in-situ by gravitational instability with high characteristicJeans mass and length (around 109 M⊙ and 1 kpc, re-spectively). The host galaxies apparent shapes rangefrom round to linear, with the respective fractions ex-pected for face-on to edge-on disks (with ≈ 1 kpc scale-heights, Elmegreen et al. 2004) and disk-like kinemat-ics with high turbulent velocity dispersions in bothHα and CO (Genzel et al. 2006; Shapiro et al. 2008;Bournaud et al. 2008; Contini et al. 2012; Daddi et al.2010b ; Epinat et al. 2012; Tacconi et al. 2013, withperhaps some redshift evolution, Puech (2010)). Thehigh fractions of dense molecular gas (about half of thebaryonic mass, Daddi et al. 2008, 2010b, Tacconi et al.2010) naturally explain the ocurrence of these violentinstabilities and the high associated velocity dispersionsrequired to regulate the disk at a Toomre stability param-eter Q ≈ 1 (Dekel et al. 2009b; Bournaud & Elmegreen2009; Elmegreen & Burkert 2010) and indeed observa-tions are consistent with a dynamical state of the gasclose to the Q ≈ 1 instability limit (Genzel et al.2011). Simulations with different numerical schemes,of both idealized galaxies and galaxies in cosmologicalcontext, show the rapid development of strong turbu-lence and giant clump formation in such gas-rich galaxies(Noguchi 1999; Bournaud et al. 2007; Agertz et al. 2009;Ceverino et al. 2010; Powell et al. 2011; Martig et al.
2
2012; Dubois et al. 2013; Hopkins et al. 2012).
The violent clump instability thickens the stellar disk(Bournaud et al. 2009) and drives an inflow towardthe nucleus at a much higher rate than spiral armsand bars (Krumholz & Burkert 2010; Bournaud et al.2011). However, other major dynamical effects dependon the life-time of the giant clumps and their abilityto survive stellar feedback. Early simulations with noor weak feedback found that the clumps retain muchof their mass or increase their mass over time, andsurvive feedback (Immeli et al. 2004; Elmegreen et al.2008, Mandelker et al. in preparation). In this casethe clumps migrate radially through dynamical fric-tion and gravitational torques in only a few 108 yr,and convey important amounts of gas and stars in-ward. This increases the general instability-driven in-flow, can rapidly (≤ 1Gyr) reshape the disk radialprofile into an exponential (Bournaud et al. 2007),form a massive classical, low-Sersic-index bulge (Noguchi1999; Elmegreen et al. 2008; Ceverino et al. 2010), andincrease the nuclear gas flows, powering bright AGNepisodes (Gabor & Bournaud 2013; Dubois et al. 2012).However, the ability of giant clumps to survive stellar
feedback for 108 yr or more has been questioned. Themomentum conveyed from young stars by photons is anefficient process to affect dense gas structures even be-fore supernovae explode (Murray et al. 2010), and thishas been suggested to rapidly disrupt the giant clumpsof high-redshift galaxies where high gas densities couldtrap the photons (Murray et al. 2011). A potential is-sue with short-lived clump scenarios is that observed gi-ant clumps need to live long-enough to accumulate theirhigh baryonic masses. Simulations with strong ad-hocradiative feedback have shown that giant clumps couldform and disrupt within 100Myr (Genel et al. 2012a;Hopkins et al. 2012), but leaving unclear whether rapidlydisrupted clumps could reform sufficiently quickly to ex-plain the high observed fraction of clumpy galaxies.Two observations have raised the possibility of a short
clump lifetime. First, outflows have been detected inthe vicinity of a few massive clumps, with outflow ratesof the order of their star formation rate (SFR) or afew times higher (Genzel et al. 2011, Newman et al.2012ab), and with high electronic temperatures suggest-ing strong pressure gradients (Lehnert et al. 2013). Sec-ond, the clumps are much fainter in near-infrared imag-ing (Elmegreen et al. 2009), indicating that their massesare relatively limited in the old stellar components,and indeed the typical ages of the stellar populationscontained in clumps are rarely larger than ≤ 200Myr(Wuyts et al. 2012). This indicates that the clumps donot disrupt as rapidly as in simulations with extreme ad-hoc feedback (Genel et al. 2012), and may be rather con-sistent with typical clump migration timescales of 200–400Myr (Bournaud et al. 2007; Dekel et al 2009b; Cev-erino et al. 2010).On the other hand, it has been proposed that a mas-
sive clump wandering in a turbulent disk may rapidlyaccrete significant amounts of gas (Dekel & Krumholz2013), which may compensate for the losses in star forma-tion and outflows and make clumps longer-lived. Even ifinitially warm, gas (re-)accreted this way should becomedense enough to cool in less than a dynamical time, hence
rapidly refueling the bound star-forming component inthe clumps (Pflamm-Altenburg & Kroupa 2009).In this paper, we present high-resolution AMR sim-
ulations of high-redshift clumpy galaxies using a new,physically-motivated modeling of stellar feedback (Sec-tion 2). We show that giant clumps produce outflows andlose aged stars by tidal stripping, but keep their mass andstar formation arte about constant over time owing tocontinuous re-accretion of gas from the surrounding disk(Section 3). The clumps in these models are long-livedand complete their migration inward until they mergewith other clumps or with the bulge, and have properties(outflow rates, star formation rates, stellar populations,contrast in optical imaged and stellar mass maps) thatappear fully consistent with observations (Section 4).
2. SIMULATIONS
2.1. Models of high-redshift disks
In the present study, we follow the detailed evolution ofgiant clumps in high-redshift galaxies, in particular theirresponse to star formation and feedback processes. Tothis aim we use “idealized” (closed-box) simulations ofsystems with global sizes, masses and gas fractions simi-lar to real galaxies at redshift two, which naturally formgiant clumps similar to the observed ones as studied bymany previous authors. The advantage of such idealizedsimulations is that the interstellar medium structure canbe resolved with a resolution a decade finer than in state-of-the-art cosmological simulations, resolving the size ofheated structures around young star clusters, and sub-structures in the giant clumps through which outflowscan propagate. These simulations model disk galaxieswith mass distributions, rotation curves and gas fractionsthat are realistic for z=1-3 galaxies, although their for-mation history at higher redshifts is not followed. Dur-ing the evolution of their giant clumps, these simulationslack the replenishment of the disk by external gas infall,which may limit the ability of the clumps to re-accretegas from the surrounding regions of the disk, thus pro-viding a lower limit to the survivability of clumps7. Asfor dynamical aspects, various studies have shown thatboth the gravity and turbulence of these galaxies arecontrolled by internal physics rather than by externalinfall (e.g., self-gravity: Elmegreen & Burkert 2010, tur-bulence: Hopkins et al. 2013; Genel et al. 2012b). Thedisk galaxy dynamics can therefore be followed quite re-liably in isolation for several hundred Myr.The fiducial high-redshift disk simulations studied
here, labelled G1, G2 and G3 and displayed in Figures 1to 3, are taken from the Mirage sample of disks andmergers presented in Perret et al. (2012a, submitted,arXiv:0768438). An additional model G’2, close to G2but using a different combination of feedback and reso-lution parameters, is also used here.The initial baryonic masses of galaxies G1 to G3 are
8.7, 3.5 and 1.4 ×10¹⁰M⊙, respectively. Their evolutionstarts with a gas fraction (gas/gas+stars) of 60%. The
7 This effect should not be major because the gas fraction de-creases slowly compared to the 400-500Myr timescale required forclump migration. In cosmological simulations, the inability to ex-plain the very high gas fractions of ≈ 50% at z ≈ 2 because of tooearly consumption into star formation at z > 3 may be a largerissue regarding the galactic reservoir of gas in which giant clumpsform and evolve (e.g., Ceverino et al. 2010).
3
disk scale-lengths are set according to the Vergani et al.(2012) scaling relations, equally compatible with otherhigh-redshift scaling relations (e.g., Dutton et al. 2011).The bulge-to-disk stellar mass ratio is 30%. The starformation model detailed below naturally leads to a re-alistic specific star formation rate of the order of oneGyr−1, realistic for the Main Sequence at redshift z ≈
1− 2 (Daddi et al. 2007; Elbaz et al. 2011; Nordon et al.2013). The evolution is followed for 1Gyr, and the aver-age gas fraction over this period is 47%. Stars and darkmatter are modeled with about one million particles each(see details in Perret et al. 2013a).The alternate model G’2 starts with initial conditions
similar to G2 except that the total mass is 17% higherand the initial gas fraction is 50%; the main difference isthe (weaker) supernovae feedback modeling as detailedbelow. It also uses a twice higher spatial resolution
2.2. AMR simulation technique
We use the Adaptive Mesh Refinement (AMR) codeRAMSES (Teyssier 2002) with a quasi-LagrangianAMR refinement methodology similar to that used foridealized galaxy simulations in Teyssier et al. (2010);Bournaud et al. (2010); Renaud et al. (2013). The gridresolution reaches 7 pc in the high-density and/or Jeans-unstable regions for our fiducial models G1 to G3. ModelG’2 uses a 3.5 pc resolution . Starting from the coarselevel, each AMR cell is refined into 23 new cells if (i) itcontains more than 25 particles, or (ii) its gas mass con-tent is larger than the “gas mass resolution” set equalto 1.5 × 10⁴M⊙, or (iii) the local thermal Jeans lengthis smaller than four times the current cell size. We alsoimpose a pressure floor to keep the Jeans length greaterthan four times the smallest cell size and avoid spuri-ous instabilities (Truelove et al. 1997, see Section 2.1 inTeyssier et al. 2010). We compute thermal evolution in-cluding atomic and fine-structure cooling assuming solarmetallicity8. Such modeling naturally leads to a multi-phase ISM, in which structures with number densities upto 105−6 cm−3 are resolved. The initial gas in the diskhas number densities of a few cm−3 so that we set theinitial temperature to 104 K, which is the typical equi-librium temperature for such moderate densities (e.g.,Bournaud et al. 2010, a lower temperature phase ap-pears mostly once denser structures arise). We preventgas cooling below 100K for better computational effi-ciency9.
2.3. Star formation and feedback
Star formation is modeled using a constant fractionǫSF = 1% of gas is converted into stars per local gravi-tational free-fall time (2% in the alternative model G’2).This type of local model explains the observed rela-tions between the surface densities of gas and star for-mation rate in a large range of objects (e.g. Elmegreen2002; Renaud et al. 2012; Krumholz et al. 2012), andwhen applied to the present simulations matches the gas
8 The metallicity of massive galaxies at redshift 1-2 is highenough for their cooling not to be strongly reduced compared tosolar metallicity (e.g., Erb et al. 2006).
9 resolved structures of a few parsecs at 1000 K are dominatedby turbulent pressure rather than thermal pressure, so the detailsof cooling below 1000 K have little net effect at the scales resolvedin our models.
consumption timescales observed for “Main Sequence”galaxies at redshift z ≃ 1−2 (see Perret et al. 2013a forthe present sample).Three stellar feedback mechanisms are included:
• HII region photo-ionization: around each stellarparticle younger than 10 Myr, the photo-ionizedregion is computed using the Stromgren sphere ap-proximation implemented by Renaud et al. (2013),the spherical approximation being justified by thefact that each HII region radius is not much largerthan the numerical resolution used here (althoughlarge non-spherical regions do form from the over-lap of smaller spherical regions around clusters ofyoung stellar particles).
• Radiation pressure from young stars is imple-mented using the Renaud et al. (2013) model.Once the available momentum in photons is com-puted for a standard IMF, we use the fact thatmost of the momentum is carried by ionizing pho-tons, and hence is acquired by the gas that is ion-ized, i.e. gas that lies in the previously calcu-lated HII regions. This allows us to determine,from physical considerations, how the available mo-mentum m × v is distributed into a mass m ofgas pushed at a velocity v: in our model, m islinked to the mass of gas that each stellar particleis able to ionize. This is an important differencecompared to other models of high-redshift diskswith momentum-driven feedback, where the windvelocity was set by the escape velocity from theclump (or galaxy) to derive the mass loading factor(Genel et al. 2012a; Hopkins et al. 2012). For thesame amount of available momentum, our modelis able to generate a higher-velocity wind compris-ing a lower mass of gas, if high-density gas cap-tures most of the momentum available from youngstars. We use a trapping parameter κ = 5 to ac-count for multiple scattering: this is rather highbut is realistic as it compensates for other sourcesof momentum that are not explicitly included, suchas (proto)-stellar winds (Krumholz & Thompson2012; Dekel & Krumholz 2013).
• Supernovae are implemented following theDubois & Teyssier (2008) method, taking intoaccount non-thermal processes as recently pro-posed by Teyssier et al. (2013). To account fornon-thermal processes, the dissipation of theinjected energy is limited to a a fixed period of2Myr, slower than thermal thermal cooling. This2Myr value is the typical turbulence dissipationtimescale expected for the sub-grid structures thatour simulations are unable to resolve (see detailsin Perret et al. 2013a). This is qualitativelyequivalent to the “delayed cooling” approachproposed by other authors to model the blastwavephase of supernovae explosions (e.g., Stinson et al.2009), but the dissipation timescale is lower herebecause of the higher resolution.
Our alternative model G’2 uses a pure thermal injec-tion for supernovae feedback without a reduced dissipa-tion rate. Hence, the supernova feedback in this model
4
is weaker than in the fiducial runs, while the photo-ionization and radiative pressure feedbacks are the same.
2.4. Selection and measurement of giant clumps
The giant clumps formed in the simulations are trackedvisually with an output frequency of 4Myr, and are an-alyzed in detail every 40Myr. We do not consider herethe clumps that undergo mergers with other clumps ofsimilar mass, to make sure that a main clump progenitorcan be unambiguously identified.For each snapshot the visually determined position of
each clump is used as an initial guess for its mass cen-ter. We compute the mass center of the baryons includedin a sphere of radius 200 pc around this initial guess,and iterate the procedure around the newly determinedposition, until the position shifts by a distance smallerthan the resolution of the simulations. Once the masscenter of the clump is found this way, we determine theclump radius and mass with the following procedure. Us-ing a radius R1 initially set to 100pc, we compute themass in the sphere of radius R1, and check the mass in asphere with twice large volume (i.e., radius 21/3 R1). Ifthe mass increase is larger than 30%, we consider that theclump material was not mostly encompassed by the ini-tial boundary, and iterate the process with an initial ra-dius R1 +100pc, until the mass converges. Convergenceis never reached at 100pc, and always reached at radius≤ 500pc, namely the clump radii range from 200 pc to500pc. These positions and radii are used for all the fol-lowing measurements: gaseous and stellar masses, massflows, star formation rate per clumps, etc. Given themethod used, clump masses are determined with an un-certainty better than 30%, the uncertainty on clump radiican be up to 100pc but only the masses are relevant inthe following study.
3. RESULTS
3.1. Short-lived gas clouds and long-lived giant clumps
In our simulations, gas clouds below a mass of a few107M⊙ are short-lived. This is also true for gas clouds inlow-redshift galaxies with the same technique (e.g. Re-naud et al. 2013). A detailed time sequence showing therapid formation and dissolution of low-mass gas clouds(not giant clumps) in our current model G2 is shown onFigure 4. Note that simulated molecular clouds in low-redshift galaxies were found to be short-lived and un-virialized even when only some of the feedback modesare included (e.g., Tasker 2011; Bournaud et al. 2010;Ceverino et al. 2012).In contrast, the giant clumps more massive than
≈ 108M⊙ remain long-lived in our simulations (Fig. 1to 3) . Such clumps form by gravitational instability inhigh-redshift disks, with high Jeans length and mass dueto the high level of turbulence 10 required to self-regulatethe disk at a Toomre parameter Q ≈ 1. Indeed theaverage value of the gas velocity dispersion11 at the diskscale-length and after two rotation periods ranges from38 km s−1 (G3) to 53 km s−1 (G1). This process of giant
10 regardless of the exact source of turbulent energy, gravity andstar formation are the main internal energy sources and saturateat a Q ≈ 1 level.
11 one-dimensional r.m.s. dispersion measured in boxes of(200 pc)3
clump formation in a turbulent medium has been studiedin many works and is not detailed again here (Noguchi1999; Immeli et al. 2004; Bournaud et al. 2007;Agertz et al. 2009; Dekel et al. 2009b; Ceverino et al.2010; Genel et al. 2012a; Hopkins et al. 2012).These giant clumps are long-lived and persist until co-
alescence with the central bulge or with another biggerclump. Most of them can be tracked in the simulationsfor 200–500Myr and sometimes up to 700Myr. We dis-play in Figure 5 a time series showing the detailed evolu-tion of a very long-lived clumps in our sample (clump 2Cfrom model G2 displayed in Fig. 2). The reason why thisclump is particularly long-lived (at least 700Myr) is thatit forms at a large radius and keeps a low-eccentricity or-bit, maximizing the timescale for inward migration bydynamical friction, while most giant clumps would reachthe central bulge within 500Myr12. As will appear in thefollowing parts, this clump does not have extreme prop-erties in terms of internal mass, size, or formation rate,and is simply used to illustrate the evolution of its masscontent on a timescale that is not limited by rapid cen-tral coalescence, as would be the case with some clumpsformed on different radii and/or on different orbits.Over their long lifetime, the mass of the giant clumps
remains relatively constant, without a major increaseor decrease over time, in spite of the gas outflows de-tailed hereafter. We show in Figure 6 the time evolu-tion of the baryonic mass of each of the clumps trackedin detail in our models: these masses, ranging from afew 108 to 2 × 10⁹M⊙ and occasionally a bit higher,and fluctuate about roughly constant values, withoutany significant global mass increase or decrease. Aswe detail in the following sections, giant clumps losemass through high-velocity gas outflows and dynami-cal escape of aged stellar populations, but also accretegas from the surrounding disk. The rate of mass ac-cretion in our simulations (detailed in Sect. 3.4) com-pensates for the losses, and is consistent with the the-oretical estimates from Dekel & Krumholz (2013) orPflamm-Altenburg & Kroupa (2009). Hence realisticfeedback does not disrupt the giant clumps on timescalesshorter than 108 yr, even when radiative pressure andnon-thermal effects in supernova bursts are included, andcontinuous capture of baryons maintains their mass highon the long term.
3.2. Gas outflows from massive clumps
The time evolution of the clump masses (Fig. 6) showsthat, in spite of being on average roughly constant, theirbaryonic mass can sometimes decrease. The detailed se-quence of clump 2C (Fig. 5) also shows that the mass anddensity of the gas in the clumps can sometimes be sig-nificantly reduced. While the reduction of the gas massalone could be the result of consumption by star forma-tion, the fact that the total baryonic mass can some-time decrease implies that gas can actually be lost bythe clumps, not just converted into stars.The giant clumps in our simulations produce gaseous
outflows. The birth and evolution of high-velocity out-flows from the clumps is illustrated in Figure 7, where thesame clump is shown after 90Myr (when it just formed)and 270Myr of evolution. At the early stage, shock fronts
12 for galaxies in the mass range studied here.
5
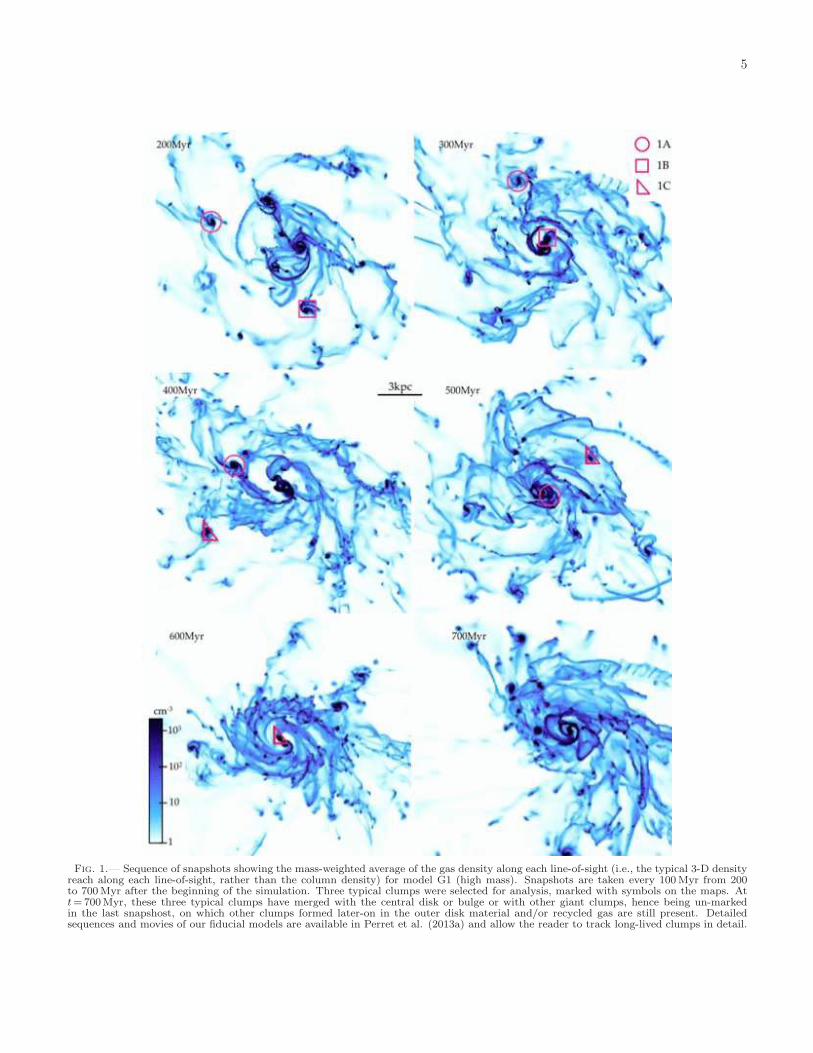
Fig. 1.— Sequence of snapshots showing the mass-weighted average of the gas density along each line-of-sight (i.e., the typical 3-D densityreach along each line-of-sight, rather than the column density) for model G1 (high mass). Snapshots are taken every 100Myr from 200to 700Myr after the beginning of the simulation. Three typical clumps were selected for analysis, marked with symbols on the maps. Att=700Myr, these three typical clumps have merged with the central disk or bulge or with other giant clumps, hence being un-markedin the last snapshost, on which other clumps formed later-on in the outer disk material and/or recycled gas are still present. Detailedsequences and movies of our fiducial models are available in Perret et al. (2013a) and allow the reader to track long-lived clumps in detail.

6
Fig. 2.— Same as Figure 1 for galaxy G2 (medium mass). Detailed sequences and movies of our fiducial models are available in Perretet al. (2013a).

7
Fig. 3.— Same as Figure 1 for galaxy G3 (low mass). Detailed sequences and movies of our fiducial models are available in Perret et al.(2013a).
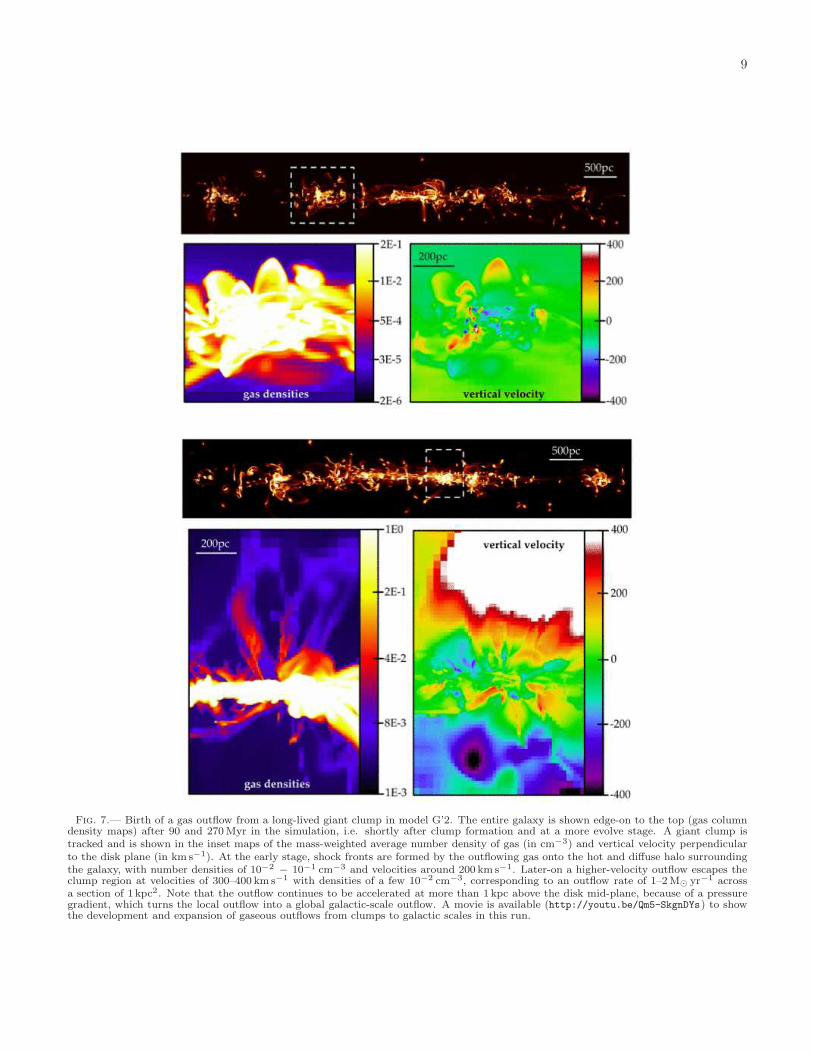
are formed by the outflowing gas onto the hot and dif-fuse halo surrounding the galaxy, with number densitiesof 10−2 − 10−1 cm−3 and velocities around 200km s−1.Later-on a higher-velocity outflow escapes the clump re-gion at velocities of 300–400km s−1 with densities of afew 10−2 cm−3, corresponding to an outflow rate of 1–2M⊙ yr−1 across a section of 1 kpc2. It is interesting tonote that the gaseous outflow (1) can largely exceed thelocal escape velocity and (2) continues to be acceleratedmore than 1 kpc above the disk mid-plane, because of apressure gradient that develops in the stead-state outflow
regime. This turns into a galactic-scale outflow, the prop-erties (rate, velocity) of which will be analyzed elsewhere(Perret et al. 2013b). A movie is available13 and showsthe formation of giant clumps followed by the develop-ment and expansion of gaseous outflows from clumps togalactic scales in model G’2.We have systematically measured the outflow rate from
each clump in two different ways: through a sphericalboundary around the clump (identical to the boundary
13 http://youtu.be/Qm5-SkgnDYs

8
Fig. 4.— Sequence detailing the continuous formation and rapid dissolution of low-mass clouds, at the middle of the time evolution ofmodel G2. The snapshot size is 0.8x1.6 kpc, and time is indicated in Myr, with one snapshot every 4Myr. A moderately dense spiral arm,free of giant clump, forms a first generation of clouds. Two of these clouds are identified with the circular and boxy shapes: they leaveonly weak and dissolving knots after 15–20Myr. Other clouds form at different locations, such as the one first indicated with the triangleat t=532, which again dissolves, leaving a lower-density knot seen at t=556 and unseen at t=600Myr.
Fig. 5.— Zoomed views of gas in the long-lived clump 2C, with an average baryonic mass of 8 × 10⁸ M⊙. The snapshots show themass-weighted average gas density, with one snapshot every 40Myr. Between the third and fourth panels (t=160-200Myr), the clumpaccretes another clump (about half its mass), which triggers an increase in its SFR, and a later increase in the local outflow rate (seeFig. 8); the clump gets a more disturbed appearance but the baryonic potential well in place rapidly re-accretes gas and the clump survivesthis local enhancement of the stellar feedback. Another such event, triggered by the accretion of surrounding diffuse gas and small clouds,occurs between the seventh and eighth panels (t=320-360Myr).
200 400 600 800 1000
time (Myr)
0
5E8
1E9
1.5E9
2E9
2.5E9
clu
mp
ba
ryo
nic
ma
ss (
so
lar
ma
sse
s)
1A
1B
1C
2A
2B
2C
3A
3B
Fig. 6.— Evolution of the baryonic (gas+stars) mass of clumpsas a function of time for the clumps tracked in the simulations.
used to measure the clump mass), and through a pair of1 kpc× 1 kpc planar boundaries positioned14 1 kpc above
14 parallel to the initial disk plane
and below the disk mid-plane. In the following we usethe latter measurement, after noticing that the formerdefinition leads to similar measurements of the outflowrates from clumps with some additional uncertainty15
(on average 23% higher, with an r.m.s. relative devia-tion between the two measurements of 37%) . The factthat these measurements yield similar results indicatesthat the outflows are significantly non-isotropic even atonly 1 kpc from the clump centers, as can be seen in theexamples of outflow velocity fields displayed in Figure 7.The typical outflow rate from the giant clumps in our
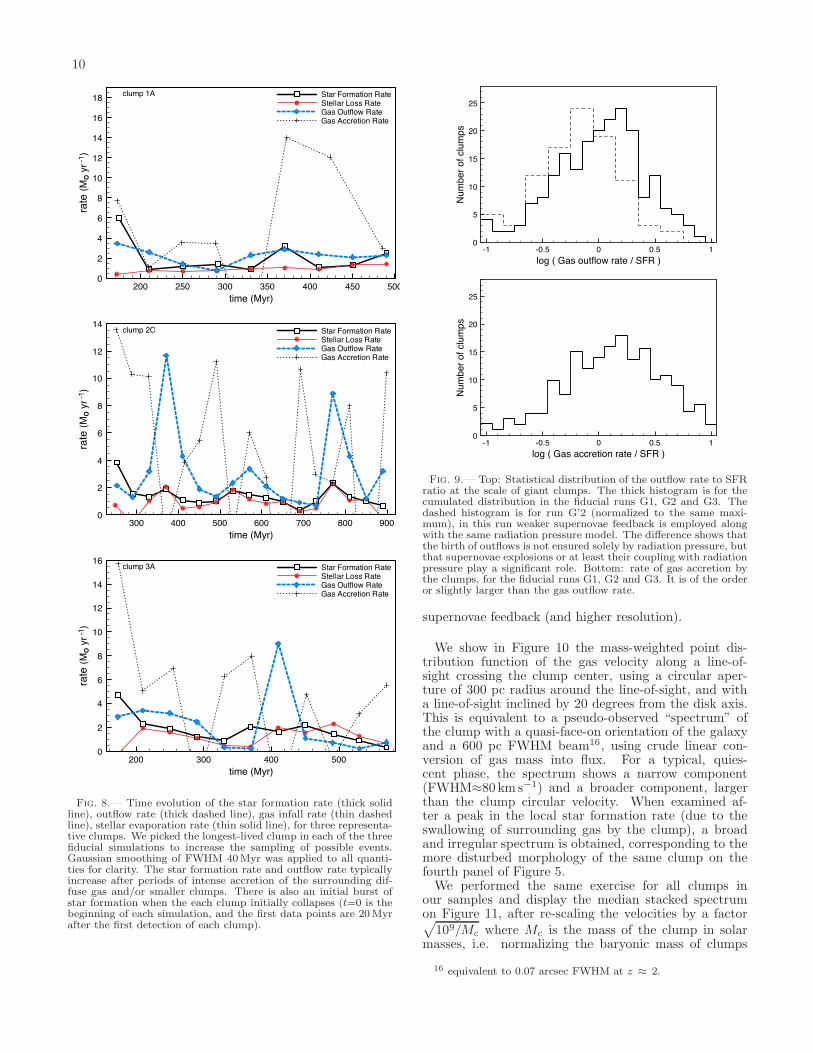
simulations is 1–4M⊙ yr−1, and up to 12M⊙ yr−1 duringshort episodes, of the order of the star formation rate ineach clump and up to a few times higher. The time evo-lution of the outflow rate is shown for three individualclumps on Figure 8. Figure 9 shows the statistical dis-tribution of the outflow rate to star formation rate ratiofor our main sample and for simulation G’2 using weaker
15 Measurements across the spherical boundary may include dif-fuse gas that passes next the clump and enters/leaves the boundary.Hence the choice of the planar boundaries above and below the diskplan ensures to capture the feedback-induced outflow.
9
Fig. 7.— Birth of a gas outflow from a long-lived giant clump in model G’2. The entire galaxy is shown edge-on to the top (gas columndensity maps) after 90 and 270Myr in the simulation, i.e. shortly after clump formation and at a more evolve stage. A giant clump istracked and is shown in the inset maps of the mass-weighted average number density of gas (in cm−3) and vertical velocity perpendicularto the disk plane (in km s−1). At the early stage, shock fronts are formed by the outflowing gas onto the hot and diffuse halo surroundingthe galaxy, with number densities of 10−2 − 10−1 cm−3 and velocities around 200 km s−1. Later-on a higher-velocity outflow escapes theclump region at velocities of 300–400 km s−1 with densities of a few 10−2 cm−3, corresponding to an outflow rate of 1–2M⊙ yr−1 acrossa section of 1 kpc2. Note that the outflow continues to be accelerated at more than 1 kpc above the disk mid-plane, because of a pressuregradient, which turns the local outflow into a global galactic-scale outflow. A movie is available (http://youtu.be/Qm5-SkgnDYs) to showthe development and expansion of gaseous outflows from clumps to galactic scales in this run.
10
200 250 300 350 400 450 500
time (Myr)
0
2
4
6
8
10
12
14
16
18 Star Formation RateStellar Loss RateGas Outflow RateGas Accretion Rate
rate
(MO y
r -1
) clump 1A
300 400 500 600 700 800 900
time (Myr)
0
2
4
6
8
10
12
14Star Formation RateStellar Loss RateGas Outflow RateGas Accretion Rate
rate
(MO y
r -1
)
clump 2C
200 300 400 500
time (Myr)
0
2
4
6
8
10
12
14
16Star Formation RateStellar Loss RateGas Outflow RateGas Accretion Rate
rate
(MO y
r -1
)
clump 3A
Fig. 8.— Time evolution of the star formation rate (thick solidline), outflow rate (thick dashed line), gas infall rate (thin dashedline), stellar evaporation rate (thin solid line), for three representa-tive clumps. We picked the longest-lived clump in each of the threefiducial simulations to increase the sampling of possible events.Gaussian smoothing of FWHM 40Myr was applied to all quanti-ties for clarity. The star formation rate and outflow rate typicallyincrease after periods of intense accretion of the surrounding dif-fuse gas and/or smaller clumps. There is also an initial burst ofstar formation when the each clump initially collapses (t=0 is thebeginning of each simulation, and the first data points are 20Myrafter the first detection of each clump).
-1 -0.5 0 0.5 1
log ( Gas outflow rate / SFR )
0
5
10
15
20
25
Nu
mb
er
of clu
mp
s
-1 -0.5 0 0.5 1
log ( Gas accretion rate / SFR )
0
5
10
15
20
25
Nu
mb
er
of clu
mp
s
Fig. 9.— Top: Statistical distribution of the outflow rate to SFRratio at the scale of giant clumps. The thick histogram is for thecumulated distribution in the fiducial runs G1, G2 and G3. Thedashed histogram is for run G’2 (normalized to the same maxi-mum), in this run weaker supernovae feedback is employed alongwith the same radiation pressure model. The difference shows thatthe birth of outflows is not ensured solely by radiation pressure, butthat supernovae explosions or at least their coupling with radiationpressure play a significant role. Bottom: rate of gas accretion bythe clumps, for the fiducial runs G1, G2 and G3. It is of the orderor slightly larger than the gas outflow rate.
supernovae feedback (and higher resolution).
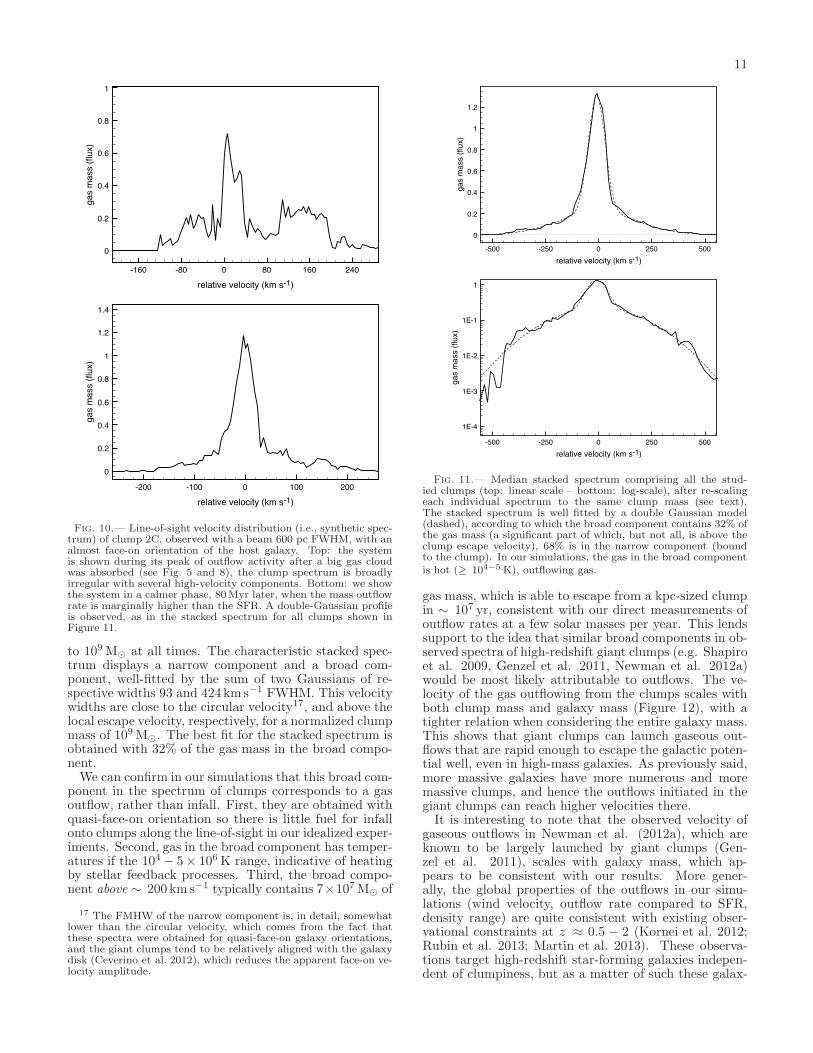
We show in Figure 10 the mass-weighted point dis-tribution function of the gas velocity along a line-of-sight crossing the clump center, using a circular aper-ture of 300 pc radius around the line-of-sight, and witha line-of-sight inclined by 20 degrees from the disk axis.This is equivalent to a pseudo-observed “spectrum” ofthe clump with a quasi-face-on orientation of the galaxyand a 600 pc FWHM beam16, using crude linear con-version of gas mass into flux. For a typical, quies-cent phase, the spectrum shows a narrow component(FWHM≈80 km s−1) and a broader component, largerthan the clump circular velocity. When examined af-ter a peak in the local star formation rate (due to theswallowing of surrounding gas by the clump), a broadand irregular spectrum is obtained, corresponding to themore disturbed morphology of the same clump on thefourth panel of Figure 5.We performed the same exercise for all clumps in
our samples and display the median stacked spectrumon Figure 11, after re-scaling the velocities by a factor√
109/Mc where Mc is the mass of the clump in solarmasses, i.e. normalizing the baryonic mass of clumps
16 equivalent to 0.07 arcsec FWHM at z ≈ 2.
11
-160 -80 0 80 160 240
0
0.2
0.4
0.6
0.8
1g
as m
ass (
flu
x)
relative velocity (km s-1)
-200 -100 0 100 200
0
0.2
0.4
0.6
0.8
1
1.2
1.4
ga
s m
ass (
flu
x)
relative velocity (km s-1)
Fig. 10.— Line-of-sight velocity distribution (i.e., synthetic spec-trum) of clump 2C, observed with a beam 600 pc FWHM, with analmost face-on orientation of the host galaxy. Top: the systemis shown during its peak of outflow activity after a big gas cloudwas absorbed (see Fig. 5 and 8), the clump spectrum is broadlyirregular with several high-velocity components. Bottom: we showthe system in a calmer phase, 80Myr later, when the mass outflowrate is marginally higher than the SFR. A double-Gaussian profileis observed, as in the stacked spectrum for all clumps shown inFigure 11.
to 109M⊙ at all times. The characteristic stacked spec-trum displays a narrow component and a broad com-ponent, well-fitted by the sum of two Gaussians of re-spective widths 93 and 424km s−1 FWHM. This velocitywidths are close to the circular velocity17, and above thelocal escape velocity, respectively, for a normalized clumpmass of 109M⊙. The best fit for the stacked spectrum isobtained with 32% of the gas mass in the broad compo-nent.We can confirm in our simulations that this broad com-
ponent in the spectrum of clumps corresponds to a gasoutflow, rather than infall. First, they are obtained withquasi-face-on orientation so there is little fuel for infallonto clumps along the line-of-sight in our idealized exper-iments. Second, gas in the broad component has temper-atures if the 104 − 5× 10⁶K range, indicative of heatingby stellar feedback processes. Third, the broad compo-nent above ∼ 200 km s−1 typically contains 7×10⁷M⊙ of
17 The FMHW of the narrow component is, in detail, somewhatlower than the circular velocity, which comes from the fact thatthese spectra were obtained for quasi-face-on galaxy orientations,and the giant clumps tend to be relatively aligned with the galaxydisk (Ceverino et al. 2012), which reduces the apparent face-on ve-locity amplitude.
-500 -250 0 250 500
0
0.2
0.4
0.6
0.8
1
1.2
ga
s m
ass (
flu
x)
relative velocity (km s-1)
-500 -250 0 250 500
1E-4
1E-3
1E-2
1E-1
1
ga
s m
ass (
flu
x)
relative velocity (km s-1)
Fig. 11.— Median stacked spectrum comprising all the stud-ied clumps (top: linear scale – bottom: log-scale), after re-scalingeach individual spectrum to the same clump mass (see text).The stacked spectrum is well fitted by a double Gaussian model(dashed), according to which the broad component contains 32% ofthe gas mass (a significant part of which, but not all, is above theclump escape velocity), 68% is in the narrow component (boundto the clump). In our simulations, the gas in the broad componentis hot (≥ 104−5 K), outflowing gas.
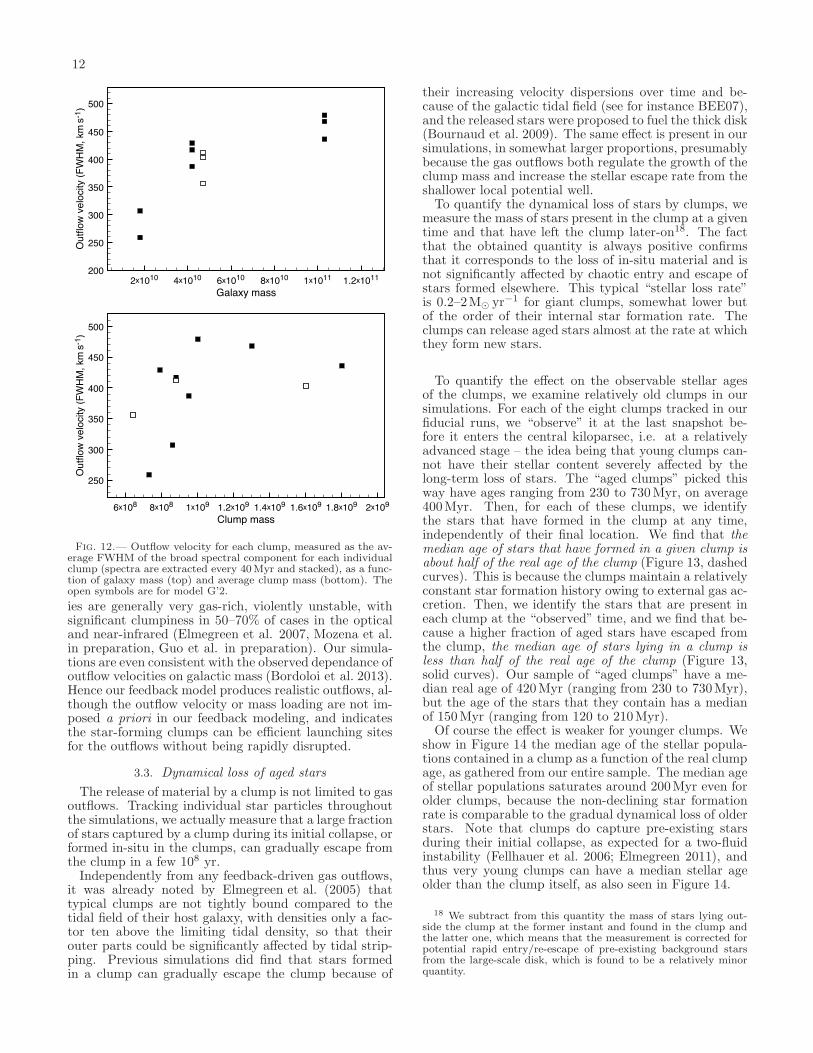
gas mass, which is able to escape from a kpc-sized clumpin ∼ 107 yr, consistent with our direct measurements ofoutflow rates at a few solar masses per year. This lendssupport to the idea that similar broad components in ob-served spectra of high-redshift giant clumps (e.g. Shapiroet al. 2009, Genzel et al. 2011, Newman et al. 2012a)would be most likely attributable to outflows. The ve-locity of the gas outflowing from the clumps scales withboth clump mass and galaxy mass (Figure 12), with atighter relation when considering the entire galaxy mass.This shows that giant clumps can launch gaseous out-flows that are rapid enough to escape the galactic poten-tial well, even in high-mass galaxies. As previously said,more massive galaxies have more numerous and moremassive clumps, and hence the outflows initiated in thegiant clumps can reach higher velocities there.It is interesting to note that the observed velocity of
gaseous outflows in Newman et al. (2012a), which areknown to be largely launched by giant clumps (Gen-zel et al. 2011), scales with galaxy mass, which ap-pears to be consistent with our results. More gener-ally, the global properties of the outflows in our simu-lations (wind velocity, outflow rate compared to SFR,density range) are quite consistent with existing obser-vational constraints at z ≈ 0.5 − 2 (Kornei et al. 2012;Rubin et al. 2013; Martin et al. 2013). These observa-tions target high-redshift star-forming galaxies indepen-dent of clumpiness, but as a matter of such these galax-
12
2x10¹⁰ 4x10¹⁰ 6x10¹⁰ 8x10¹⁰ 1x10¹¹ 1.2x10¹¹
Galaxy mass
200
250
300
350
400
450
500
Ou
tflo
w v
elo
city (
FW
HM
, km
s-1
)
6x10⁸ 8x10⁸ 1x10⁹ 1.2x10⁹ 1.4x10⁹ 1.6x10⁹ 1.8x10⁹ 2x10⁹
Clump mass
250
300
350
400
450
500
Ou
tflo
w v
elo
city (
FW
HM
, km
s-1
)
Fig. 12.— Outflow velocity for each clump, measured as the av-erage FWHM of the broad spectral component for each individualclump (spectra are extracted every 40Myr and stacked), as a func-tion of galaxy mass (top) and average clump mass (bottom). Theopen symbols are for model G’2.
ies are generally very gas-rich, violently unstable, withsignificant clumpiness in 50–70% of cases in the opticaland near-infrared (Elmegreen et al. 2007, Mozena et al.in preparation, Guo et al. in preparation). Our simula-tions are even consistent with the observed dependance ofoutflow velocities on galactic mass (Bordoloi et al. 2013).Hence our feedback model produces realistic outflows, al-though the outflow velocity or mass loading are not im-posed a priori in our feedback modeling, and indicatesthe star-forming clumps can be efficient launching sitesfor the outflows without being rapidly disrupted.
3.3. Dynamical loss of aged stars
The release of material by a clump is not limited to gasoutflows. Tracking individual star particles throughoutthe simulations, we actually measure that a large fractionof stars captured by a clump during its initial collapse, orformed in-situ in the clumps, can gradually escape fromthe clump in a few 108 yr.Independently from any feedback-driven gas outflows,
it was already noted by Elmegreen et al. (2005) thattypical clumps are not tightly bound compared to thetidal field of their host galaxy, with densities only a fac-tor ten above the limiting tidal density, so that theirouter parts could be significantly affected by tidal strip-ping. Previous simulations did find that stars formedin a clump can gradually escape the clump because of
their increasing velocity dispersions over time and be-cause of the galactic tidal field (see for instance BEE07),and the released stars were proposed to fuel the thick disk(Bournaud et al. 2009). The same effect is present in oursimulations, in somewhat larger proportions, presumablybecause the gas outflows both regulate the growth of theclump mass and increase the stellar escape rate from theshallower local potential well.To quantify the dynamical loss of stars by clumps, we
measure the mass of stars present in the clump at a giventime and that have left the clump later-on18. The factthat the obtained quantity is always positive confirmsthat it corresponds to the loss of in-situ material and isnot significantly affected by chaotic entry and escape ofstars formed elsewhere. This typical “stellar loss rate”is 0.2–2M⊙ yr−1 for giant clumps, somewhat lower butof the order of their internal star formation rate. Theclumps can release aged stars almost at the rate at whichthey form new stars.
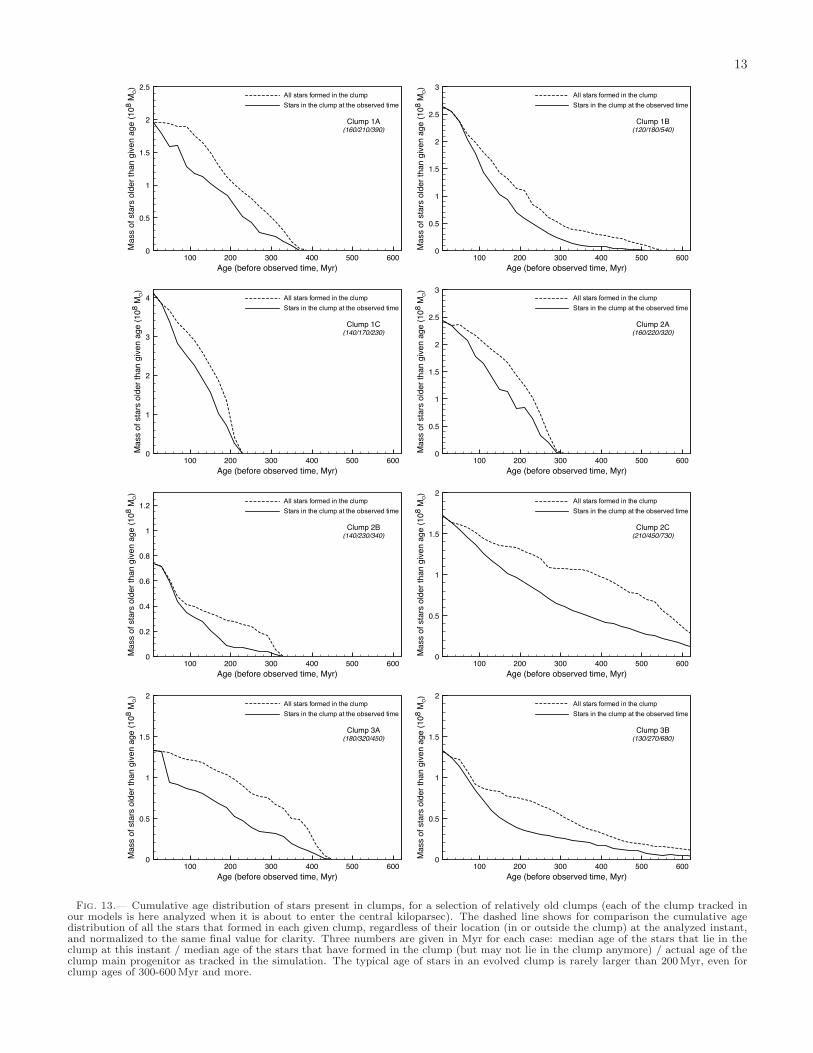
To quantify the effect on the observable stellar agesof the clumps, we examine relatively old clumps in oursimulations. For each of the eight clumps tracked in ourfiducial runs, we “observe” it at the last snapshot be-fore it enters the central kiloparsec, i.e. at a relativelyadvanced stage – the idea being that young clumps can-not have their stellar content severely affected by thelong-term loss of stars. The “aged clumps” picked thisway have ages ranging from 230 to 730Myr, on average400Myr. Then, for each of these clumps, we identifythe stars that have formed in the clump at any time,independently of their final location. We find that themedian age of stars that have formed in a given clump isabout half of the real age of the clump (Figure 13, dashedcurves). This is because the clumps maintain a relativelyconstant star formation history owing to external gas ac-cretion. Then, we identify the stars that are present ineach clump at the “observed” time, and we find that be-cause a higher fraction of aged stars have escaped fromthe clump, the median age of stars lying in a clump isless than half of the real age of the clump (Figure 13,solid curves). Our sample of “aged clumps” have a me-dian real age of 420Myr (ranging from 230 to 730Myr),but the age of the stars that they contain has a medianof 150Myr (ranging from 120 to 210Myr).Of course the effect is weaker for younger clumps. We
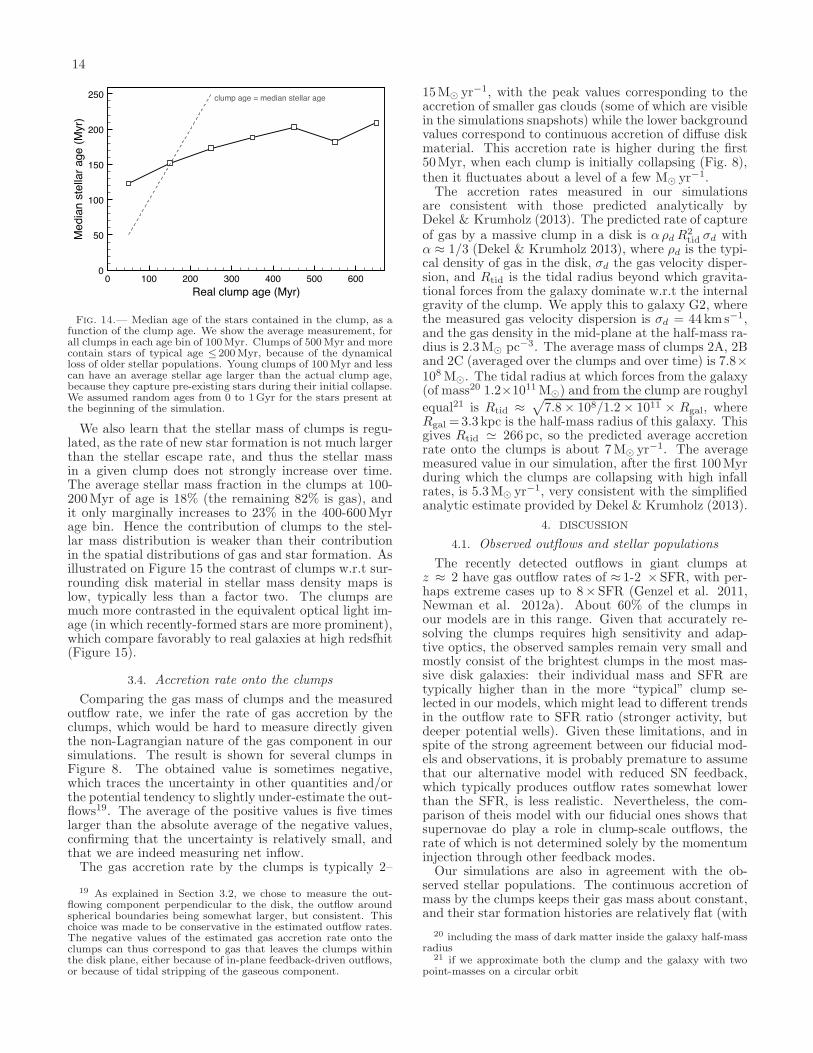
show in Figure 14 the median age of the stellar popula-tions contained in a clump as a function of the real clumpage, as gathered from our entire sample. The median ageof stellar populations saturates around 200Myr even forolder clumps, because the non-declining star formationrate is comparable to the gradual dynamical loss of olderstars. Note that clumps do capture pre-existing starsduring their initial collapse, as expected for a two-fluidinstability (Fellhauer et al. 2006; Elmegreen 2011), andthus very young clumps can have a median stellar ageolder than the clump itself, as also seen in Figure 14.
18 We subtract from this quantity the mass of stars lying out-side the clump at the former instant and found in the clump andthe latter one, which means that the measurement is corrected forpotential rapid entry/re-escape of pre-existing background starsfrom the large-scale disk, which is found to be a relatively minorquantity.
13
100 200 300 400 500 600
Age (before observed time, Myr)
0
0.5
1
1.5
2
2.5All stars formed in the clump
Stars in the clump at the observed time
Ma
ss o
f sta
rs o
lde
r th
an
giv
en
ag
e (
10
8 M
O)
Clump 1A(160/210/390)
100 200 300 400 500 600
Age (before observed time, Myr)
0
0.5
1
1.5
2
2.5
3All stars formed in the clump
Stars in the clump at the observed time
Ma
ss o
f sta
rs o
lde
r th
an
giv
en
ag
e (
10
8 M
O)
Clump 1B(120/180/540)
100 200 300 400 500 600
Age (before observed time, Myr)
0
1
2
3
4 All stars formed in the clump
Stars in the clump at the observed time
Ma
ss o
f sta
rs o
lde
r th
an
giv
en
ag
e (
10
8 M
O)
Clump 1C(140/170/230)
100 200 300 400 500 600
Age (before observed time, Myr)
0
0.5
1
1.5
2
2.5
3All stars formed in the clump
Stars in the clump at the observed time
Ma
ss o
f sta
rs o
lde
r th
an
giv
en
ag
e (
10
8 M
O)
Clump 2A(160/220/320)
100 200 300 400 500 600
Age (before observed time, Myr)
0
0.2
0.4
0.6
0.8
1
1.2All stars formed in the clump
Stars in the clump at the observed time
Ma
ss o
f sta
rs o
lde
r th
an
giv
en
ag
e (
10
8 M
O)
Clump 2B(140/230/340)
100 200 300 400 500 600
Age (before observed time, Myr)
0
0.5
1
1.5
2All stars formed in the clump
Stars in the clump at the observed time
Ma
ss o
f sta
rs o
lde
r th
an
giv
en
ag
e (
10
8 M
O)
Clump 2C(210/450/730)
100 200 300 400 500 600
Age (before observed time, Myr)
0
0.5
1
1.5
2All stars formed in the clump
Stars in the clump at the observed time
Ma
ss o
f sta
rs o
lde
r th
an
giv
en
ag
e (
10
8 M
O)
Clump 3A(180/320/450)
100 200 300 400 500 600
Age (before observed time, Myr)
0
0.5
1
1.5
2All stars formed in the clump
Stars in the clump at the observed time
Ma
ss o
f sta
rs o
lde
r th
an
giv
en
ag
e (
10
8 M
O)
Clump 3B(130/270/680)
Fig. 13.— Cumulative age distribution of stars present in clumps, for a selection of relatively old clumps (each of the clump tracked inour models is here analyzed when it is about to enter the central kiloparsec). The dashed line shows for comparison the cumulative agedistribution of all the stars that formed in each given clump, regardless of their location (in or outside the clump) at the analyzed instant,and normalized to the same final value for clarity. Three numbers are given in Myr for each case: median age of the stars that lie in theclump at this instant / median age of the stars that have formed in the clump (but may not lie in the clump anymore) / actual age of theclump main progenitor as tracked in the simulation. The typical age of stars in an evolved clump is rarely larger than 200Myr, even forclump ages of 300-600Myr and more.
14
0 100 200 300 400 500 600
Real clump age (Myr)
0
50
100
150
200
250
Me
dia
n s
tella
r a
ge
(M
yr)
clump age = median stellar age
Fig. 14.— Median age of the stars contained in the clump, as afunction of the clump age. We show the average measurement, forall clumps in each age bin of 100Myr. Clumps of 500Myr and morecontain stars of typical age ≤ 200Myr, because of the dynamicalloss of older stellar populations. Young clumps of 100Myr and lesscan have an average stellar age larger than the actual clump age,because they capture pre-existing stars during their initial collapse.We assumed random ages from 0 to 1Gyr for the stars present atthe beginning of the simulation.
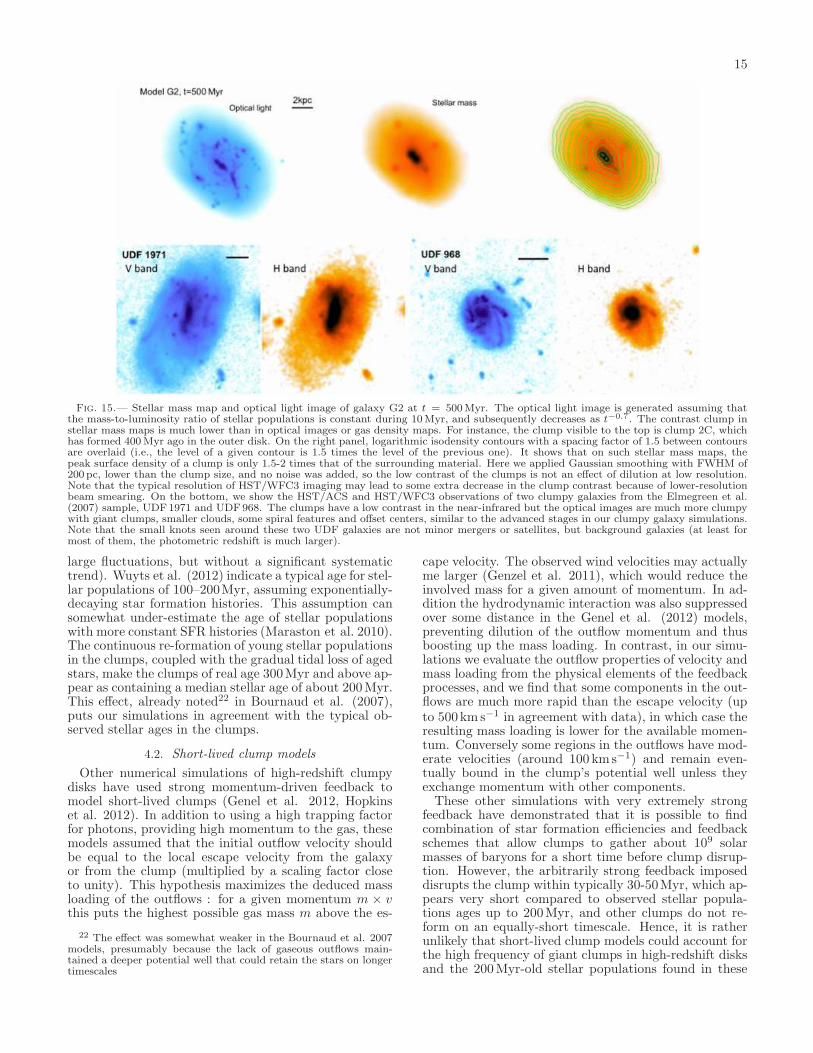
We also learn that the stellar mass of clumps is regu-lated, as the rate of new star formation is not much largerthan the stellar escape rate, and thus the stellar massin a given clump does not strongly increase over time.The average stellar mass fraction in the clumps at 100-200Myr of age is 18% (the remaining 82% is gas), andit only marginally increases to 23% in the 400-600Myrage bin. Hence the contribution of clumps to the stel-lar mass distribution is weaker than their contributionin the spatial distributions of gas and star formation. Asillustrated on Figure 15 the contrast of clumps w.r.t sur-rounding disk material in stellar mass density maps islow, typically less than a factor two. The clumps aremuch more contrasted in the equivalent optical light im-age (in which recently-formed stars are more prominent),which compare favorably to real galaxies at high redsfhit(Figure 15).
3.4. Accretion rate onto the clumps
Comparing the gas mass of clumps and the measuredoutflow rate, we infer the rate of gas accretion by theclumps, which would be hard to measure directly giventhe non-Lagrangian nature of the gas component in oursimulations. The result is shown for several clumps inFigure 8. The obtained value is sometimes negative,which traces the uncertainty in other quantities and/orthe potential tendency to slightly under-estimate the out-flows19. The average of the positive values is five timeslarger than the absolute average of the negative values,confirming that the uncertainty is relatively small, andthat we are indeed measuring net inflow.The gas accretion rate by the clumps is typically 2–
19 As explained in Section 3.2, we chose to measure the out-flowing component perpendicular to the disk, the outflow aroundspherical boundaries being somewhat larger, but consistent. Thischoice was made to be conservative in the estimated outflow rates.The negative values of the estimated gas accretion rate onto theclumps can thus correspond to gas that leaves the clumps withinthe disk plane, either because of in-plane feedback-driven outflows,or because of tidal stripping of the gaseous component.
15M⊙ yr−1, with the peak values corresponding to theaccretion of smaller gas clouds (some of which are visiblein the simulations snapshots) while the lower backgroundvalues correspond to continuous accretion of diffuse diskmaterial. This accretion rate is higher during the first50Myr, when each clump is initially collapsing (Fig. 8),then it fluctuates about a level of a few M⊙ yr−1.The accretion rates measured in our simulations
are consistent with those predicted analytically byDekel & Krumholz (2013). The predicted rate of captureof gas by a massive clump in a disk is αρd R
2tid σd with
α ≈ 1/3 (Dekel & Krumholz 2013), where ρd is the typi-cal density of gas in the disk, σd the gas velocity disper-sion, and Rtid is the tidal radius beyond which gravita-tional forces from the galaxy dominate w.r.t the internalgravity of the clump. We apply this to galaxy G2, wherethe measured gas velocity dispersion is σd = 44km s−1,and the gas density in the mid-plane at the half-mass ra-dius is 2.3M⊙ pc−3. The average mass of clumps 2A, 2Band 2C (averaged over the clumps and over time) is 7.8×10⁸M⊙. The tidal radius at which forces from the galaxy(of mass20 1.2×10¹¹M⊙) and from the clump are roughyl
equal21 is Rtid ≈√
7.8× 10⁸/1.2× 1011 × Rgal, whereRgal =3.3 kpc is the half-mass radius of this galaxy. Thisgives Rtid ≃ 266 pc, so the predicted average accretionrate onto the clumps is about 7M⊙ yr−1. The averagemeasured value in our simulation, after the first 100Myrduring which the clumps are collapsing with high infallrates, is 5.3M⊙ yr−1, very consistent with the simplifiedanalytic estimate provided by Dekel & Krumholz (2013).
4. DISCUSSION
4.1. Observed outflows and stellar populations
The recently detected outflows in giant clumps atz ≈ 2 have gas outflow rates of ≈ 1-2 ×SFR, with per-haps extreme cases up to 8×SFR (Genzel et al. 2011,Newman et al. 2012a). About 60% of the clumps inour models are in this range. Given that accurately re-solving the clumps requires high sensitivity and adap-tive optics, the observed samples remain very small andmostly consist of the brightest clumps in the most mas-sive disk galaxies: their individual mass and SFR aretypically higher than in the more “typical” clump se-lected in our models, which might lead to different trendsin the outflow rate to SFR ratio (stronger activity, butdeeper potential wells). Given these limitations, and inspite of the strong agreement between our fiducial mod-els and observations, it is probably premature to assumethat our alternative model with reduced SN feedback,which typically produces outflow rates somewhat lowerthan the SFR, is less realistic. Nevertheless, the com-parison of theis model with our fiducial ones shows thatsupernovae do play a role in clump-scale outflows, therate of which is not determined solely by the momentuminjection through other feedback modes.Our simulations are also in agreement with the ob-
served stellar populations. The continuous accretion ofmass by the clumps keeps their gas mass about constant,and their star formation histories are relatively flat (with
20 including the mass of dark matter inside the galaxy half-massradius
21 if we approximate both the clump and the galaxy with twopoint-masses on a circular orbit
15
Fig. 15.— Stellar mass map and optical light image of galaxy G2 at t = 500Myr. The optical light image is generated assuming thatthe mass-to-luminosity ratio of stellar populations is constant during 10Myr, and subsequently decreases as t−0.7. The contrast clump instellar mass maps is much lower than in optical images or gas density maps. For instance, the clump visible to the top is clump 2C, whichhas formed 400Myr ago in the outer disk. On the right panel, logarithmic isodensity contours with a spacing factor of 1.5 between contoursare overlaid (i.e., the level of a given contour is 1.5 times the level of the previous one). It shows that on such stellar mass maps, thepeak surface density of a clump is only 1.5-2 times that of the surrounding material. Here we applied Gaussian smoothing with FWHM of200 pc, lower than the clump size, and no noise was added, so the low contrast of the clumps is not an effect of dilution at low resolution.Note that the typical resolution of HST/WFC3 imaging may lead to some extra decrease in the clump contrast because of lower-resolutionbeam smearing. On the bottom, we show the HST/ACS and HST/WFC3 observations of two clumpy galaxies from the Elmegreen et al.(2007) sample, UDF1971 and UDF968. The clumps have a low contrast in the near-infrared but the optical images are much more clumpywith giant clumps, smaller clouds, some spiral features and offset centers, similar to the advanced stages in our clumpy galaxy simulations.Note that the small knots seen around these two UDF galaxies are not minor mergers or satellites, but background galaxies (at least formost of them, the photometric redshift is much larger).
large fluctuations, but without a significant systematictrend). Wuyts et al. (2012) indicate a typical age for stel-lar populations of 100–200Myr, assuming exponentially-decaying star formation histories. This assumption cansomewhat under-estimate the age of stellar populationswith more constant SFR histories (Maraston et al. 2010).The continuous re-formation of young stellar populationsin the clumps, coupled with the gradual tidal loss of agedstars, make the clumps of real age 300Myr and above ap-pear as containing a median stellar age of about 200Myr.This effect, already noted22 in Bournaud et al. (2007),puts our simulations in agreement with the typical ob-served stellar ages in the clumps.
4.2. Short-lived clump models
Other numerical simulations of high-redshift clumpydisks have used strong momentum-driven feedback tomodel short-lived clumps (Genel et al. 2012, Hopkinset al. 2012). In addition to using a high trapping factorfor photons, providing high momentum to the gas, thesemodels assumed that the initial outflow velocity shouldbe equal to the local escape velocity from the galaxyor from the clump (multiplied by a scaling factor closeto unity). This hypothesis maximizes the deduced massloading of the outflows : for a given momentum m × vthis puts the highest possible gas mass m above the es-
22 The effect was somewhat weaker in the Bournaud et al. 2007models, presumably because the lack of gaseous outflows main-tained a deeper potential well that could retain the stars on longertimescales
cape velocity. The observed wind velocities may actuallyme larger (Genzel et al. 2011), which would reduce theinvolved mass for a given amount of momentum. In ad-dition the hydrodynamic interaction was also suppressedover some distance in the Genel et al. (2012) models,preventing dilution of the outflow momentum and thusboosting up the mass loading. In contrast, in our simu-lations we evaluate the outflow properties of velocity andmass loading from the physical elements of the feedbackprocesses, and we find that some components in the out-flows are much more rapid than the escape velocity (upto 500km s−1 in agreement with data), in which case theresulting mass loading is lower for the available momen-tum. Conversely some regions in the outflows have mod-erate velocities (around 100 kms−1) and remain even-tually bound in the clump’s potential well unless theyexchange momentum with other components.These other simulations with very extremely strong
feedback have demonstrated that it is possible to findcombination of star formation efficiencies and feedbackschemes that allow clumps to gather about 109 solarmasses of baryons for a short time before clump disrup-tion. However, the arbitrarily strong feedback imposeddisrupts the clump within typically 30-50Myr, which ap-pears very short compared to observed stellar popula-tions ages up to 200Myr, and other clumps do not re-form on an equally-short timescale. Hence, it is ratherunlikely that short-lived clump models could account forthe high frequency of giant clumps in high-redshift disksand the 200Myr-old stellar populations found in these

16
clumps.
4.3. Long-lived clump models and the necessaryregulation of bulge growth
The inclusion of realistic outflows induces several inter-esting differences compared to previous long-lived clumpmodels. The baryonic mass of clumps is, on average,constant over their inward migration in the disk. Modelswithout feedback or limited to (weak) supernova feed-back found clumps whose mass was steadily increasingalong their inward migration, because of the same pro-cess of continuous mass accretion as in the present models(e.g., Noguchi 1999, Bournaud et al. 2007, see also theclump growth in the “no wind” models by Genel et al.2012). The continuous mass accretion by clumps can belargely compensated by gaseous outflows23 in our newmodels, and as a result the mass of clump when theyreach the galactic center is regulated to 0.2–2.4% (on av-erage 0.8%) of the galaxy baryonic mass in our currentsimulation sample. Furthermore the loss of aged starsand re-accretion of gas keeps much of this mass gaseous,with an average gas fraction in the clumps in our sam-ple of about two thirds, and an average stellar mass of3× 108M⊙.If a generation of clumps contains 5-10 clumps, each
conveying 3× 10⁸M⊙ of stars to the bulge in ≈ 500Myr,and three such generation spans a galaxy’s life in thez ≈ 3 − 1 range, this mechanism overall provides about7× 109M⊙ of stars to a bulge component – which wouldbe a “classical” bulge for a clump coalescence mecha-nism (Elmegreen et al. 2008). This is a rather reason-able mass for galaxies with stellar masses reaching several1010M⊙ by redshift zero. The clumps will also carry gasinward (through their migration if they are long-lived,and through the general instability-driven inflow in anycase) but if the gas preserves a significant angular mo-mentum it may form the inner regions of exponentialdisks, or a disky (pseudo-)bulge (see also Inoue & Saitoh2012). Hence there is not necessarily over-productionof bulges in such a long-lived clump model. Alterna-tively, the instability-driven inflow may grow a spheroidin which central star formation is continuously fueledwith the appearance of “blue nuggets” (Zolotov et al.in preparation, Barro et al. 2013). A detailed budget ofbulge growth and disk survival in our current clumpy diskmodels, and in similar models of high-redshift mergers,will be presented elsewhere (Perret et al. 2013b).A large fraction of observed high-redshift clumpy
galaxies are already more massive than today’s MilkyWay at z ≈ 2, and are not expected to remain disk-dominated by redshift zero. Smaller galaxies, with thetypical mass expected for a Milky Way-like progenitorat z ≈ 2, also seem clumpy in their morphology (evenperhaps down to lower redshifts Elmegreen et al. 2007;Bournaud et al. 2012), and their apparently “dispersion-dominated” kinematics are also typical for clumpy disksonce studied at high resolution (Newman et al. 2012). Itappears in our simulations that such lower-mass galax-ies tend to have somewhat lower-mass clumps. Over a1Gyr-long period, our low-mass model G3 forms only
23 Stellar loss was present in previous models, but probablyweakened by the deeper potential wells associated to the absenceof gaseous outflows
four clumps more massive24 than 4×10⁸M⊙, while twelvesuch clumps are found in the high-mass model G1. Giventhat lower-mass clouds are easily disrupted by feedback(and that the associated outflows may more easily es-cape the galactic potential well), the relative contributionto bulge growth should be weaker in low-mass galaxies.This could naturally explain the correlation between stel-lar mass and bulge fraction along the Hubble Sequence,but should be studied with physically-motivated feed-back models in full cosmological context so as to encom-pass the full duration of clumpy phases.The bulges that grow in our models, in addition
to being reasonably massive, are very gassy, becausethe clumps evolving with realistic feedback remain gas-dominated – simulations with weak supernovae-onlyfeedback produce clumps whose mass and stellar frac-tion were increasing over time. Although we defer theanalysis of the bulge properties to a subsequent paper,we here speculate that these bulges could often resem-ble pseudo-bulges, since they form as gas-rich centralmass concentrations. Relatively stochastic growth of apseudo-bulge could thus likely take place in these sys-tems. The instability-driven inflow can grow the centralSupermassive Black Hole (SMBH) in a more continuousway, as predicted in simulations and supported by thehigh AGN fraction in clump disks (Bournaud et al. 2012)and the high AGN fraction in high-redshift star-forminggalaxies in general (Mullaney et al. 2012; Juneau et al.2013). Steady SMBH feeding along with more stochastic(pseudo-)bulge growth could thus be a path to explainthe poor correlation between SMBH mass and pseudo-bulges (Kormendy et al. 2011).
4.4. Self-regulation of the clump mass
We have noted in the previous parts that when thestar formation rate of a given giant clump increases, itsoutflow rate also increases, and generally in larger pro-portions (at least when averaged over time periods of40Myr, Fig. 7). We here suggest that this response cancompensate for episodes in which the mass of a giantclumps tend to grow, for instance when a smaller clumpis swallowed. The strong subsequent ouflows can pre-vent growth of the clump mass: without this, the abilityof clumps to accrete surrounding material would increaseand their mass would continue to increase.For a star formation rate SFR=S expressed in
M⊙ yr−1, the outflow rate can be written as Sq andthe best fitting exponent in our models is found25 to beq ≈ 2.2. This is a crude description of the feedback be-havior, but it captures the fact that moderate increases inthe SFR can turn into larger increases in the outflow rate,as seen in the individual tracks on Figure 8. In a steadystate the accretion rate should be A ≈ (1+ǫescape)S+Sq
to keep the clump mass constant, where ǫescape ≈ 0.5if the fraction of stars formed in the clump that even-tually escape the clump (after a time delay of the or-der of 200Myr in our simulations, neglected here). Aclump forming in a non-turbulent medium would havea mass accretion rate equal to the Jeans mass dividedby the gravitational free-fall rate, during its initial col-
24 staying above 4× 10⁸ M⊙ for at least 40Myr25 best fit for the star formation rate and gas outflow rate aver-
aged over 40Myr time bins
17
lapse phase. This quantity is A = σ3/G. Since thegiant clumps of high-redshift galaxies move rapidly ina turbulent disk, the surrounding reservoir is continu-ously replenished at the ambient disk density, keepingthis accretion rate constant. The steady state conditionis thus (1 + ǫescape)S + Sq = σ3/G with q = 2.2. Hencea typical clump forming stars at a rate of 2M⊙ yr−1 canlive in steady state if its binding velocity dispersion is38 km s−1, which is indeed close to the measured disper-sions in our models (Section 3.1), and in the moleculargas of high-redshift galaxies. The somewhat higher dis-persions measured in the simulations (38–53km s−1) mayresult from the tidal stirring of clumps, otherwise the ex-cessive binding would lead to a steadily increasing clumpsmass. Modeling the feedback response with a power lawas done here is of course arbitrary, but the global ideais that there is a steep response where a moderate in-crease in the accretion rate and SFR can be followed bya stronger increase in the outflow rate (ass previously seein Figure 8), leading to self-regulation of the clump mass.
5. SUMMARY AND IMPLICATIONS
We have presented simulations of high-redshift clumpydisk galaxies with a new implementation of photoion-ization and radiation pressure feedback, in addition tosupernova feedback, and a physically-motivated estima-tion of the wind mass loading. Previous models had ei-ther considered only weak supernovae feedback models,or used strong feedback recipes generating high-velocityoutflows with ad-hoc high mass loading factors. Thispaper has focussed on the properties and evolution ofthe giant clumps of 108−9M⊙ typically found in thesegalaxies, and the associated birth of outflows. The mainfindings are:
• The physically-motivated model for photoioniza-tion and radiation pressure feedback from Renaudet al. (2013), used either with a simple thermalmodel for supernovae feedback or the non-thermalmodel from Teyssier et al. (2013), produces mas-sive gas outflows from the giant clumps, with out-flow rates at the scale of individual clumps of theorder of the SFR and up to ten times the SFR overthe short periods, where the SFR in a clump is 1–2M⊙ yr−1. The outflow properties are consistentwith observations. Comparison of various modelsindicate that the outflow rate is not determinedsolely by radiation pressure, but is also influencedby the energy injection from supernovae.
• The giant clumps survive for several 108 yr, un-til they migrate through torques and dynamicalfriction and coalesce centrally after a few hun-dred Myr. Their mass remains about constant inspite of the gaseous outflows. This is because theclumps are wandering in a gas-rich turbulent disk,from which they constantly accrete gas at a rateof a few M⊙ yr−1, compensating for the mass loss.Feedback-driven outflows ensure regulation of theclump mass after periods of high accretion rates.
• The continuous accretion of gas sustains long-lasting star formation histories with relatively con-stant SFR. The average age of stars in a giant
clump is significantly younger than the age of theclump itself. In addition, the stars that form ina clump gradually leave the clump through tidalstripping, and up to half of the stars formed in-situat a given time can have left the clump 200Myrlater. This preserves young stellar populations(≤ 200Myr) even in older clumps.
• Bulge growth through instability-driven inflow,clump migration and coalescence, occurs in reason-able proportions on the present long-lived clumpmodels, especially because the mass of clumpsis self-regulated. Clump migration brings stellarmass to the central bulge at an average rate of 1-10solar masses per year, over a timescale of 500Myrfor a single generation of clumps or more if cosmo-logical accretion helps to re-form clumps. This typ-ically grows a bulge of 109−10M⊙ for present-daygalaxy masses of 1010−11M⊙, which is a reasonablebulge fraction. Furthermore, given the high frac-tion of gas in the material conveyed by the clumps,a large fraction of the central mass may evolve intoa disky pseudo-bulge. As for more massive clumpygalaxies at z ∼ 2, many of them evolve into el-lipticals by z = 0 and the instability-driven andclump-driven spheroid growth may be an impor-tant ingredient in this evolution.
The observed clump properties in z = 2 galaxies (out-flows and stellar content) are fully consistent with thislong-lived clump model. Hence the clumps, even if theyrepresent a limited fraction of the total stellar mass, andmore generally the associated violent disk instability, canhave a major dynamical influence as studied in previousworks: migration to the central bulge, fueling of brightAGN phases up to the Eddington rate (Gabor & Bour-naud 2013, inside-out growth of a thick exponential stel-lar disk (Bournaud et al. 2007), and perhaps also glob-ular cluster formation (Shapiro et al. 2010) and darkmatter cusp erosion (Inoue & Saitoh 2011). Our feed-back model shows that observations of outflowing gasand young stellar populations do absolutely not implythat clumps have to be short-lived transient features.However, since the strength of stellar feedback, and inparticular the efficiency of photon trapping in the ISM,remains debated, it remains interesting to consider mod-els with extreme strong feedback (Genel et al. 2012,Hopkins et al. 2012) as a potentially viable alterna-tive26. These models differ by two aspects. First, theyassume a very efficient trapping of the photons emittedby young stars, maximizing the feedback efficiency be-yond theoretical expectations (Krumholz & Thompson2012, Dekel & Krumholz 2013). Second, they impostthe wind velocity to be equal or close to the local es-cape velocity, which maximizes the mass loading of thewinds. Using a different approach to estimate the massloading of momentum-driven winds from physical con-siderations (Renaud et al. 2013) we found here that thewind velocity can be higher, reducing the involved gas
26 eventually, unambiguous determination of the effects of pho-ton trapping would require full radiative transfer hydrodynamicsimulations with sufficient resolution to resolve the size of youngionized regions in dense gas, i.e. parsec-scale resolution
18
mass for a given amount of available momentum. Obser-vations of a radial gradient in the stellar age of clumps(Forster Schreiber et al. 2011; Guo et al. 2012) suggeststhat real clumps do live long enough to migrate radi-ally. Given that the gradient in real clump age shouldbe steeper than in stellar age (Fig. 14), these data doactually suggest lifetimes of a few 108 yr.The fact that clumps continuously lose mass and re-
accrete gas does not mean that they are permanentlydisrupted and reformed – as illustrated in our time se-ries, the clumps are persistent structures that are per-manently present with a roughly constant mass. Whena clump is analyzed at a given time and 100Myr later,it still contains about 80% of its initial baryons. Over alife-time of 300–500Myr, a typical clump will lose about50–65% of its initial baryonic mass (through gas outflowand dynamical loss of stars), and will re-accrete a compa-rable amount of gas. The clumps in unstable disks havea wave-like behavior like spiral arms in lower-redshiftgalaxies, with the interesting analogy that spiral armshave a very weak contrast in the near-infrared and instellar mass maps, and mostly contain very young stel-lar populations and unvirialized molecular clouds, but
are density waves that have propagated in the disk fortimescales of 109 yr or more, with important dynamicalimpact (e.g., Puerari et al. 2000). A noticeable differ-ence is that the timescale for mass exchange is longerfor the high-redshift giant clumps, and complete renewalof their mass content does not occur faster than clumpmigration to the galaxy center.
We are grateful to Sarah Newman and Reinhard Gen-zel for useful comments on the properties of observed out-flows. The simulations presented in the work were per-formed at the Tres Grand Centre de Calcul of CEA underGENCI allocations 2012-GEN 2192 and 2013-GEN2192,and at the LRZ SuperMUC facility under PRACE allo-cation number 50816. We acknowledge financial supportfrom the EC through an ERC grant StG-257720 (FB,FR, JMG, KK) and the CosmoComp ITN (JMG, FB).AD was supported by ISF grant 24/12, by GIF grantG-1052-104.7/2009, by a DIP grant, by NSF grant AST-1010033, and by the ICORE Program of the PBC andthe ISF grant 1829/12.
REFERENCES
Agertz, O., Teyssier, R., & Moore, B. 2009, MNRAS, 397, L64Agertz, O., Teyssier, R., & Moore, B. 2011, MNRAS, 410, 1391Barro, G., Faber, S. M., Perez-Gonzalez, P. G., et al. 2013, ApJ,
765, 104Bordoloi et al., 2013, submitted to ApJ, arXiv:1307.6553Bournaud, F., Elmegreen, B. G., & Elmegreen, D. M. 2007, ApJ,
670, 237Bournaud, F., Elmegreen, B. G., & Martig, M. 2009, ApJ, 707, L1Bournaud, F., Elmegreen, B. G., Teyssier, R., Block, D. L., &
Puerari, I. 2010, MNRAS, 409, 1088Bournaud, F., Daddi, E., Elmegreen, B. G., et al. 2008, A&A,
486, 741Bournaud, F., Dekel, A., Teyssier, R., et al. 2011, ApJ, 741, L33Bournaud, F., Juneau, S., Le Floc’h, E., et al. 2012, ApJ, 757, 81Bournaud, F., & Elmegreen, B. G. 2009, ApJ, 694, L158Bournaud, F., Juneau, S., Le Floc’h, E., et al. 2012, ApJ, 757, 81Burkert, A., Genzel, R., Bouche, N., et al. 2010, ApJ, 725, 2324Ceverino, D., Dekel, A., & Bournaud, F. 2010, MNRAS, 404, 2151Ceverino, D., Dekel, A., Mandelker, N., et al. 2012, MNRAS, 420,
3490Contini, T., Garilli, B., Le Fevre, O., et al. 2012, A&A, 539, A91Cowie, L. L., Songaila, A., Hu, E. M., & Cohen, J. G. 1996, AJ,
112, 839Daddi, E., Dickinson, M., Morrison, G., et al. 2007, ApJ, 670, 156Daddi, E., Elbaz, D., Walter, F., et al. 2010a, ApJ, 714, L118Daddi, E., Bournaud, F., Walter, F., et al. 2010b, ApJ, 713, 686Daddi, E., Dannerbauer, H., Elbaz, D., et al. 2008, ApJ, 673, L21Dekel, A., Sari, R., & Ceverino, D. 2009b, ApJ, 703, 785Dekel, A., & Krumholz, M. R. 2013, MNRAS, 432, 455Dekel, A., Birnboim, Y., Engel, G., et al. 2009a, Nature, 457, 451Dubois, Y., & Teyssier, R. 2008, A&A, 477, 79Dubois, Y., Volonteri, M., & Silk, J. 2013, arXiv:1304.4583Dubois, Y., Pichon, C., Haehnelt, M., et al. 2012, MNRAS, 423,
3616Dutton, A. A., van den Bosch, F. C., Faber, S. M., et al. 2011,
MNRAS, 410, 1660Elbaz, D., Dickinson, M., Hwang, H. S., et al. 2011, A&A, 533,
A119Elmegreen, B. G. 2002, ApJ, 577, 206Elmegreen, B. G., Elmegreen, D. M., Fernandez, M. X., &
Lemonias, J. J. 2009, ApJ, 692, 12Elmegreen, B. G., Bournaud, F., & Elmegreen, D. M. 2008, ApJ,
684, 829Elmegreen, D. M., Elmegreen, B. G., Ravindranath, S., & Coe,
D. A. 2007, ApJ, 658, 763
Elmegreen, B. G., Elmegreen, D. M., Vollbach, D. R., Foster,E. R., & Ferguson, T. E. 2005, ApJ, 634, 101
Elmegreen, D. M., Elmegreen, B. G., & Hirst, A. C. 2004, ApJ,604, L21
Elmegreen, B. G., & Burkert, A. 2010, ApJ, 712, 294Elmegreen, B. G. 2011, ApJ, 737, 10Elmegreen, B. G., & Elmegreen, D. M. 2005, ApJ, 627, 632Epinat, B., Tasca, L., Amram, P., et al. 2012, A&A, 539, A92Erb, D. K., Shapley, A. E., Pettini, M., et al. 2006, ApJ, 644, 813Fellhauer, M., Kroupa, P., & Evans, N. W. 2006, MNRAS, 372,
338Forster Schreiber, N. M., Shapley, A. E., Genzel, R., et al. 2011,
ApJ, 739, 45Gabor, J. M., & Bournaud, F. 2013, arXiv:1306.2954Genel, S., Naab, T., Genzel, R., et al. 2012a, ApJ, 745, 11Genel, S., Dekel, A., & Cacciato, M. 2012b, MNRAS, 425, 788Genzel, R., Newman, S., Jones, T., et al. 2011, ApJ, 733, 101Genzel, R., Burkert, A., Bouche, N., et al. 2008, ApJ, 687, 59Genzel, R., Tacconi, L. J., Eisenhauer, F., et al. 2006, Nature,
442, 786Guo, Y., Giavalisco, M., Ferguson, H. C., Cassata, P., &
Koekemoer, A. M. 2012, ApJ, 757, 120Hopkins, P. F., Keres, D., Murray, N., Quataert, E., & Hernquist,
L. 2012, MNRAS, 427, 968Hopkins, P. F., Keres, D., & Murray, N. 2013, MNRAS, 432, 2639Immeli, A., Samland, M., Westera, P., & Gerhard, O. 2004, ApJ,
611, 20Inoue, S., & Saitoh, T. R. 2012, MNRAS, 422, 1902Inoue, S., & Saitoh, T. R. 2011, MNRAS, 418, 2527Juneau, S., Dickinson, M., Bournaud, F., et al. 2013, ApJ, 764,
176Kartaltepe, J. S., Dickinson, M., Alexander, D. M., et al. 2012,
ApJ, 757, 23Kormendy, J., Bender, R., & Cornell, M. E. 2011, Nature, 469,
374Kornei, K. A., Shapley, A. E., Martin, C. L., et al. 2012, ApJ,
758, 135Krumholz, M., & Burkert, A. 2010, ApJ, 724, 895Krumholz, M. R., Dekel, A., & McKee, C. F. 2012, ApJ, 745, 69Krumholz, M. R., & Thompson, T. A. 2012, ApJ, 760, 155Lehnert, M. D., Le Tiran, L., Nesvadba, N. P. H., et al. 2013,
A&A, 555, A72Maraston, C., Pforr, J., Renzini, A., et al. 2010, MNRAS, 407, 830Martig, M., Bournaud, F., Croton, D. J., Dekel, A., & Teyssier,
R. 2012, ApJ, 756, 26Martin, C. L., Shapley, A. E., Coil, A. L., et al. 2013, ApJ, 770, 41

19
Mullaney, J. R., Daddi, E., Bethermin, M., et al. 2012, ApJ, 753,L30
Murray, N., Menard, B., & Thompson, T. A. 2011, ApJ, 735, 66Murray, N., Quataert, E., & Thompson, T. A. 2010, ApJ, 709, 191Newman, S. F., Genzel, R., Forster-Schreiber, N. M., et al. 2012,
ApJ, 761, 43Newman, S. F., Shapiro Griffin, K., Genzel, R., et al. 2012, ApJ,
752, 111Noguchi, M. 1999, ApJ, 514, 77Nordon, R., Lutz, D., Saintonge, A., et al. 2013, ApJ, 762, 125Perret, v. et al. 2013a, submitted to A&A, arXiv:0768438Perret, v. et al. 2013b, in preparationPflamm-Altenburg, J., & Kroupa, P. 2009, MNRAS, 397, 488Powell, L. C., Slyz, A., & Devriendt, J. 2011, MNRAS, 414, 3671Puech, M. 2010, MNRAS, 406, 535Puerari, I., Block, D. L., Elmegreen, B. G., Frogel, J. A., &
Eskridge, P. B. 2000, A&A, 359, 932Renaud, F., Kraljic, K., & Bournaud, F. 2012, ApJ, 760, L16Renaud, F., Bournaud, F., Emsellem, E., et al. 2013, submitted
to MNRAS, arXiv:1307.5639
Rubin, K. H. R., Prochaska, J. X., Koo, D. C., et al. 2013,arXiv:1307.1476
Shapiro, K. L., Genzel, R., Forster Schreiber, N. M. 2010,MNRAS, 403, L36
Shapiro, K. L., Genzel, R., Quataert, E., et al. 2009, ApJ, 701,955
Shapiro, K. L., Genzel, R., Forster Schreiber, N. M., et al. 2008,ApJ, 682, 231
Stinson, G. S., Dalcanton, J. J., Quinn, T., et al. 2009, MNRAS,395, 1455
Tacconi, L. J., Genzel, R., Neri, R., et al. 2010, Nature, 463, 781Tacconi, L. J., Neri, R., Genzel, R., et al. 2013, ApJ, 768, 74Tasker, E. J. 2011, ApJ, 730, 11Truelove, J. K., Klein, R. I., McKee, C. F., et al. 1997, ApJ, 489,
L179Teyssier, R. 2002, A&A, 385, 337Teyssier, R., Chapon, D., & Bournaud, F. 2010, ApJ, 720, L149Teyssier, R., Pontzen, A., Dubois, Y., & Read, J. I. 2013,
MNRAS, 429, 3068Vergani, D., Epinat, B., Contini, T., et al. 2012, A&A, 546, A118Wuyts, S., Forster Schreiber, N. M., Genzel, R., et al. 2012, ApJ,
753, 114
Related Documents