From World Development Indicators The Little Green Data Book Agriculture Forests and biodiversity Energy Emissions and pollution Water and sanitation Environment and health National accounting aggregates Public Disclosure Authorized Public Disclosure Authorized Public Disclosure Authorized closure Authorized

Welcome message from author
This document is posted to help you gain knowledge. Please leave a comment to let me know what you think about it! Share it to your friends and learn new things together.
Transcript
From World Development Indicators
The Little Green Data Book
Agriculture
Forests and biodiversity
Energy
Emissions and pollution
Water and sanitation
Environment and health
National accounting aggregates
Pub
lic D
iscl
osur
e A
utho
rized
Pub
lic D
iscl
osur
e A
utho
rized
Pub
lic D
iscl
osur
e A
utho
rized
Pub
lic D
iscl
osur
e A
utho
rized
wb350881
Typewritten Text
55542


2010 THE LITTLE GREENDATA BOOK

Copyright ©2010 by the International Bank for Reconstruction and Development/THE WORLD BANK
1818 H Street, N.W.Washington, D.C. 20433
U.S.A.
All rights reservedManufactured in the United States of America
First printing June 2010
ISBN: 978-0-8213-8245-5eISBN: 978-0-8213-8446-6
DOI: 10.1596/978-0-8213-8245-5SKU: 18245
The Little Green Data Book 2010 is a product of theDevelopment Data Group of the Development Economics Vice Presidency
and the Environment Department of the World Bank.
Editing, design, and layout by Communications Development Incorporated, Washington, DC. Cover design by Peter Grundy Art & Design, London, U.K.
iiiThe Little Green Data Book 2010
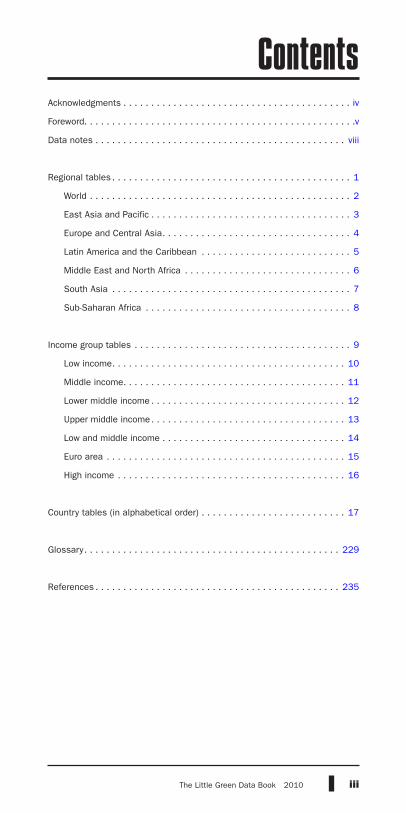
Acknowledgments . . . . . . . . . . . . . . . . . . . . . . . . . . . . . . . . . . . . . . . . . iv
Foreword. . . . . . . . . . . . . . . . . . . . . . . . . . . . . . . . . . . . . . . . . . . . . . . . .v
Data notes . . . . . . . . . . . . . . . . . . . . . . . . . . . . . . . . . . . . . . . . . . . . . viii
Regional tables . . . . . . . . . . . . . . . . . . . . . . . . . . . . . . . . . . . . . . . . . . . 1
World . . . . . . . . . . . . . . . . . . . . . . . . . . . . . . . . . . . . . . . . . . . . . . . 2
East Asia and Pacific . . . . . . . . . . . . . . . . . . . . . . . . . . . . . . . . . . . . 3
Europe and Central Asia. . . . . . . . . . . . . . . . . . . . . . . . . . . . . . . . . . 4
Latin America and the Caribbean . . . . . . . . . . . . . . . . . . . . . . . . . . . 5
Middle East and North Africa . . . . . . . . . . . . . . . . . . . . . . . . . . . . . . 6
South Asia . . . . . . . . . . . . . . . . . . . . . . . . . . . . . . . . . . . . . . . . . . . 7
Sub-Saharan Africa . . . . . . . . . . . . . . . . . . . . . . . . . . . . . . . . . . . . . 8
Income group tables . . . . . . . . . . . . . . . . . . . . . . . . . . . . . . . . . . . . . . . 9
Low income. . . . . . . . . . . . . . . . . . . . . . . . . . . . . . . . . . . . . . . . . . 10
Middle income. . . . . . . . . . . . . . . . . . . . . . . . . . . . . . . . . . . . . . . . 11
Lower middle income . . . . . . . . . . . . . . . . . . . . . . . . . . . . . . . . . . . 12
Upper middle income. . . . . . . . . . . . . . . . . . . . . . . . . . . . . . . . . . . 13
Low and middle income . . . . . . . . . . . . . . . . . . . . . . . . . . . . . . . . . 14
Euro area . . . . . . . . . . . . . . . . . . . . . . . . . . . . . . . . . . . . . . . . . . . 15
High income . . . . . . . . . . . . . . . . . . . . . . . . . . . . . . . . . . . . . . . . . 16
Country tables (in alphabetical order) . . . . . . . . . . . . . . . . . . . . . . . . . . 17
Glossary. . . . . . . . . . . . . . . . . . . . . . . . . . . . . . . . . . . . . . . . . . . . . . 229
References . . . . . . . . . . . . . . . . . . . . . . . . . . . . . . . . . . . . . . . . . . . . 235
Contents

iv 2010 The Little Green Data Book
The Little Green Data Book 2010 is based on World Development Indicators
2010 and its accompanying CD-ROM. Defining, gathering, and disseminating
international statistics is a collective effort of many people and organizations.
The indicators presented in World Development Indicators are the fruit of
decades of work at many levels, from the field workers who administer
censuses and household surveys to the committees and working parties
of the national and international statistical agencies that develop the
nomenclature, classifications, and standards fundamental to the international
statistical system. Nongovernmental organizations have also made important
contributions. We are indebted to the World Development Indicators partners,
as detailed in World Development Indicators 2010. The financial assistance
of the Government of Sweden is also gratefully acknowledged.
The Little Green Data Book 2010 is the result of close collaboration between
the staff of the Development Data Group of the Development Economics Vice
Presidency and the Environment Department of the Sustainable Development
Vice Presidency. Mehdi Akhlaghi, Jeff Brez, Lopamudra Chakraborti, Richard Fix,
Kirk Hamilton, Andreas Kopp, Alison Kwong, Glenn-Marie Lange, Roger Morier,
and Giovanni Ruta contributed to its preparation. Meta de Coquereaumont,
Christopher Trott, and Elaine Wilson of Communications Development
provided design, editing, and layout. Staff from External Affairs oversaw
publication and distribution of the book.
Acknowledgments

vThe Little Green Data Book 2010
ForewordWelcome to The Little Green Data Book 2010. Ten years ago we published the
first edition of what has come to be a key reference for many practitioners
in the environment and development field. In that 2000 edition, Kristalina
Georgieva and Shaida Badiee—then Directors of the Environment and the
Development Data Group, respectively—wrote that to achieve lasting results
in environmental management, “we need to start from a sound base of infor-
mation that helps us set priorities and measure progress.” Then, as today, we
believe that The Little Green Data Book is a step in this direction. Over the
past 10 years it has grown in presentation and outreach as its informative
value has maintained the high standards we set out to achieve.
Under the headings of agriculture, forests and biodiversity, energy, emissions
and pollution, water and sanitation, environment and health, and national
accounts aggregates, we compile 50 indicators for over 200 countries
each year. The presentation of this information allows an easy comparison
of country-level data with benchmark regional and income group values.
Combining different indicators, it is also possible to obtain more metrics
relevant to different users.
Over the past 10 years we have taken the pulse of the world’s environment,
and we have seen progress in some areas but regression in others. The
data also show wide disparities across regions. For example, urban air pol-
lution declined in most countries between 2000 and 2006 (the most recent
year for which data is available), with the greatest progress in low-income
and lower middle-income countries. But concentration levels are still nearly
three times higher in these countries than in high-income countries. We have
tracked how the world has become drier as water resources per capita have
diminished under the pressure of fast-growing population. Water availability
is below scarcity levels in the Middle East and North Africa and South Asia.
Forest cover has fallen in Latin America and the Caribbean, South Asia,
Urban air pollution, by income group, 2000 and 2006
Source: World Development Indicators data files.
0
25
50
75
100
Highincome
Uppermiddle income
Lowermiddle income
Lowincome
2000 2006Urban population-weighted particulate matter (PM10) concentration, micrograms per cubic meter

vi 2010 The Little Green Data Book
ForewordInternal freshwater resources per capita, by region, 2002 and 2008
Source: World Development Indicators data files.
0
5
10
15
20
25
30
Sub-SaharanAfrica
SouthAsia
Middle East& NorthAfrica
LatinAmerica &Caribbean
Europe& Central
Asia
East Asia& Pacific
2002 2008Thousands of cubic meters
Annual average change in forest area, by region, 2000–07
Source: World Development Indicators data files.
–50
–40
–30
–20
–10
0
10
Sub-SaharanAfrica
SouthAsia
Middle East& NorthAfrica
LatinAmerica &Caribbean
Europe& Central
Asia
East Asia& Pacific
Thousands of square kilometers
Energy from biomass products and waste, by income group, 2002 and 2007
Source: World Development Indicators data files.
0
10
20
30
40
50
Highincome
Uppermiddle income
Lowermiddle income
Lowincome
2002 2007Share of total energy use (percent)

viiThe Little Green Data Book 2010
and Sub-Saharan Africa. In developing countries the net loss of forest area
for 2000–07 is estimated at 80,000 square kilometers a year. Finally, the
lack of access to energy continues to be an important health risk factor in
the poorest countries, where nearly 50 percent of energy use comes from
biomass fuels and waste.
The Little Green Data Book also estimates adjusted net savings, which mea-
sures the annual changes in a country’s total wealth. The literature shows
that a positive adjusted net savings rate is a necessary condition—although
not a sufficient one—for sustained growth. Unfortunately, many economies
appear to be failing this practical test.
The Little Green Data Book 2010 is a knowledge resource that aids policy-
makers in using environmental data more effectively to support priority-setting
and improved development outcomes. It is a collaboration between the
Development Data Group of the Development Economics Vice Presidency
and the Environment Department of the Sustainable Development Vice
Presidency of the World Bank. As we have every year for 10 years, we wel-
come your suggestions on how to improve future editions and make them
even more useful.
Shaida Badiee James Warren Evans
Director Director
Development Data Group Environment Department

viii 2010 The Little Green Data Book
The data in this book are for the most recent year available. Regional
aggregates include data for low- and middle-income economies only.
Aggregates for regions and income groups are shown only if data are available
for 66 percent of the economies in that group.
Symbols used:
0 or 0.0 indicates zero or small enough that the number rounds to zero
at the displayed number of decimal places.
.. indicates that data are not available.
$ indicates current U.S. dollars.
Data are shown for economies with populations greater than 30,000 or for
smaller economies if they are members of the World Bank. The word country
(used interchangeably with economy) does not imply political independence
or official recognition by the World Bank but refers to any economy for which
the authorities report separate social or economic statistics.
The selection of indicators in these pages includes some that are being
used to monitor progress toward the Millennium Development Goals. For
more information about the eight goals—halving poverty and increasing
well-being by 2015—please see the other books in the World Development
Indicators 2010 family of products.
Data notes

1The Little Green Data Book 2010
The country composition of regions is based on the World Bank’s analytical
regions and may differ from common geographic usage.
East Asia and Pacific
American Samoa, Cambodia, China, Fiji, Indonesia, Kiribati, Democratic
Republic of Korea, Lao People’s Democratic Republic, Malaysia, Marshall
Islands, Federated States of Micronesia, Mongolia, Myanmar, Palau,
Papua New Guinea, Philippines, Samoa, Solomon Islands, Thailand,
Timor-Leste, Tonga, Vanuatu, Vietnam.
Europe and Central Asia
Albania, Armenia, Azerbaijan, Belarus, Bosnia and Herzegovina, Bulgaria,
Georgia, Kazakhstan, Kosovo, Kyrgyz Republic, Latvia, Lithuania, Former
Yugoslav Republic of Macedonia, Moldova, Montenegro, Poland, Romania,
Russian Federation, Serbia, Tajikistan, Turkey, Turkmenistan, Ukraine,
Uzbekistan.
Latin America and the Caribbean
Argentina, Belize, Bolivia, Brazil, Chile, Colombia, Costa Rica, Cuba,
Dominica, Dominican Republic, Ecuador, El Salvador, Grenada, Guatemala,
Guyana, Haiti, Honduras, Jamaica, Mexico, Nicaragua, Panama, Paraguay,
Peru, St. Kitts and Nevis, St. Lucia, St. Vincent and the Grenadines,
Suriname, Uruguay, Bolivarian Republic of Venezuela.
Middle East and North Africa
Algeria, Djibouti, Arab Republic of Egypt, Islamic Republic of Iran, Iraq,
Jordan, Lebanon, Libya, Morocco, Syrian Arab Republic, Tunisia, West
Bank and Gaza, Republic of Yemen.
South Asia
Afghanistan, Bangladesh, Bhutan, India, Maldives, Nepal, Pakistan,
Sri Lanka.
Sub-Saharan Africa
Angola, Benin, Botswana, Burkina Faso, Burundi, Cameroon, Cape
Verde, Central African Republic, Chad, Comoros, Democratic Republic
of the Congo, Republic of Congo, Côte d’Ivoire, Eritrea, Ethiopia, Gabon,
The Gambia, Ghana, Guinea, Guinea-Bissau, Kenya, Lesotho, Liberia,
Madagascar, Malawi, Mali, Mauritania, Mauritius, Mayotte, Mozambique,
Namibia, Niger, Nigeria, Rwanda, São Tomé and Principe, Senegal,
Seychelles, Sierra Leone, Somalia, South Africa, Sudan, Swaziland,
Tanzania, Togo, Uganda, Zambia, Zimbabwe.
Regional tables
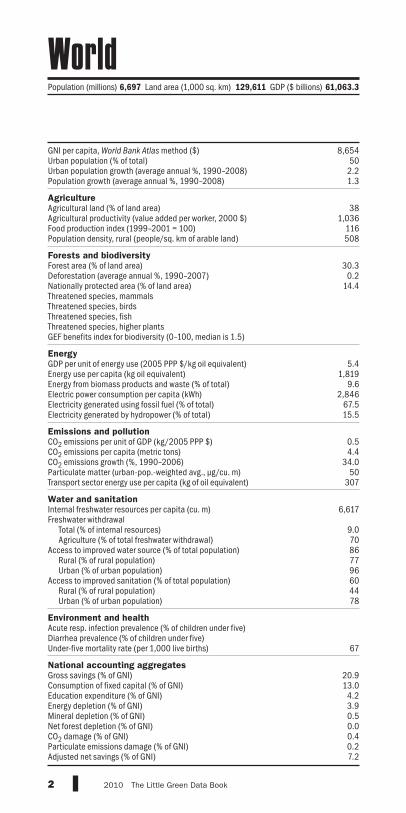
GNI per capita, World Bank Atlas method ($)Urban population (% of total)Urban population growth (average annual %, 1990–2008)Population growth (average annual %, 1990–2008) AgricultureAgricultural land (% of land area)Agricultural productivity (value added per worker, 2000 $)Food production index (1999–2001 = 100)Population density, rural (people/sq. km of arable land) Forests and biodiversityForest area (% of land area)Deforestation (average annual %, 1990–2007)Nationally protected area (% of land area)Threatened species, mammalsThreatened species, birdsThreatened species, fishThreatened species, higher plantsGEF benefits index for biodiversity (0–100, median is 1.5) EnergyGDP per unit of energy use (2005 PPP $/kg oil equivalent)Energy use per capita (kg oil equivalent)Energy from biomass products and waste (% of total)Electric power consumption per capita (kWh)Electricity generated using fossil fuel (% of total)Electricity generated by hydropower (% of total) Emissions and pollutionCO2 emissions per unit of GDP (kg/2005 PPP $)CO2 emissions per capita (metric tons)CO2 emissions growth (%, 1990–2006)Particulate matter (urban-pop.-weighted avg., μg/cu. m)Transport sector energy use per capita (kg of oil equivalent) Water and sanitationInternal freshwater resources per capita (cu. m)Freshwater withdrawal
Total (% of internal resources)Agriculture (% of total freshwater withdrawal)
Access to improved water source (% of total population)Rural (% of rural population)Urban (% of urban population)
Access to improved sanitation (% of total population)Rural (% of rural population)Urban (% of urban population)
Environment and healthAcute resp. infection prevalence (% of children under five)Diarrhea prevalence (% of children under five)Under-five mortality rate (per 1,000 live births) National accounting aggregatesGross savings (% of GNI)Consumption of fixed capital (% of GNI)Education expenditure (% of GNI)Energy depletion (% of GNI)Mineral depletion (% of GNI)Net forest depletion (% of GNI)CO2 damage (% of GNI)Particulate emissions damage (% of GNI)Adjusted net savings (% of GNI)
2 2010 The Little Green Data Book
8,654502.21.3
381,036
116508
30.30.2
14.4
5.41,819
9.62,846
67.515.5
0.54.4
34.050
307
6,617
9.070867796604478
67
20.913.04.23.90.50.00.40.27.2
Population (millions) 6,697 Land area (1,000 sq. km) 129,611 GDP ($ billions) 61,063.3
World
GNI per capita, World Bank Atlas method ($)Urban population (% of total)Urban population growth (average annual %, 1990–2008)Population growth (average annual %, 1990–2008) AgricultureAgricultural land (% of land area)Agricultural productivity (value added per worker, 2000 $)Food production index (1999–2001 = 100)Population density, rural (people/sq. km of arable land) Forests and biodiversityForest area (% of land area)Deforestation (average annual %, 1990–2007)Nationally protected area (% of land area)Threatened species, mammalsThreatened species, birdsThreatened species, fishThreatened species, higher plantsGEF benefits index for biodiversity (0–100, median is 1.5) EnergyGDP per unit of energy use (2005 PPP $/kg oil equivalent)Energy use per capita (kg oil equivalent)Energy from biomass products and waste (% of total)Electric power consumption per capita (kWh)Electricity generated using fossil fuel (% of total)Electricity generated by hydropower (% of total) Emissions and pollutionCO2 emissions per unit of GDP (kg/2005 PPP $)CO2 emissions per capita (metric tons)CO2 emissions growth (%, 1990–2006)Particulate matter (urban-pop.-weighted avg., μg/cu. m)Transport sector energy use per capita (kg of oil equivalent) Water and sanitationInternal freshwater resources per capita (cu. m)Freshwater withdrawal
Total (% of internal resources)Agriculture (% of total freshwater withdrawal)
Access to improved water source (% of total population)Rural (% of rural population)Urban (% of urban population)
Access to improved sanitation (% of total population)Rural (% of rural population)Urban (% of urban population)
Environment and healthAcute resp. infection prevalence (% of children under five)Diarrhea prevalence (% of children under five)Under-five mortality rate (per 1,000 live births) National accounting aggregatesGross savings (% of GNI)Consumption of fixed capital (% of GNI)Education expenditure (% of GNI)Energy depletion (% of GNI)Mineral depletion (% of GNI)Net forest depletion (% of GNI)CO2 damage (% of GNI)Particulate emissions damage (% of GNI)Adjusted net savings (% of GNI)
3The Little Green Data Book 2010
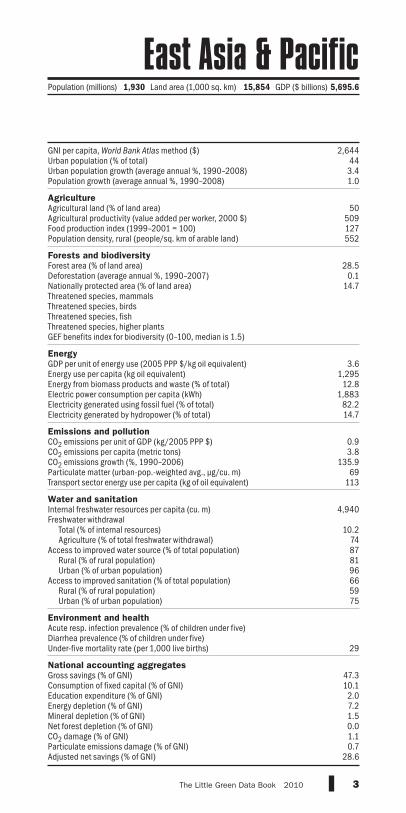
2,644443.41.0
50509127552
28.50.1
14.7
3.61,295
12.81,883
82.214.7
0.93.8
135.969
113
4,940
10.274878196665975
29
47.310.12.07.21.50.01.10.7
28.6
Population (millions) 1,930 Land area (1,000 sq. km) 15,854 GDP ($ billions) 5,695.6
East Asia & Pacific

GNI per capita, World Bank Atlas method ($)Urban population (% of total)Urban population growth (average annual %, 1990–2008)Population growth (average annual %, 1990–2008) AgricultureAgricultural land (% of land area)Agricultural productivity (value added per worker, 2000 $)Food production index (1999–2001 = 100)Population density, rural (people/sq. km of arable land) Forests and biodiversityForest area (% of land area)Deforestation (average annual %, 1990–2007)Nationally protected area (% of land area)Threatened species, mammalsThreatened species, birdsThreatened species, fishThreatened species, higher plantsGEF benefits index for biodiversity (0–100, median is 1.5) EnergyGDP per unit of energy use (2005 PPP $/kg oil equivalent)Energy use per capita (kg oil equivalent)Energy from biomass products and waste (% of total)Electric power consumption per capita (kWh)Electricity generated using fossil fuel (% of total)Electricity generated by hydropower (% of total) Emissions and pollutionCO2 emissions per unit of GDP (kg/2005 PPP $)CO2 emissions per capita (metric tons)CO2 emissions growth (%, 1990–2006)Particulate matter (urban-pop.-weighted avg., μg/cu. m)Transport sector energy use per capita (kg of oil equivalent) Water and sanitationInternal freshwater resources per capita (cu. m)Freshwater withdrawal
Total (% of internal resources)Agriculture (% of total freshwater withdrawal)
Access to improved water source (% of total population)Rural (% of rural population)Urban (% of urban population)
Access to improved sanitation (% of total population)Rural (% of rural population)Urban (% of urban population)
Environment and healthAcute resp. infection prevalence (% of children under five)Diarrhea prevalence (% of children under five)Under-five mortality rate (per 1,000 live births) National accounting aggregatesGross savings (% of GNI)Consumption of fixed capital (% of GNI)Education expenditure (% of GNI)Energy depletion (% of GNI)Mineral depletion (% of GNI)Net forest depletion (% of GNI)CO2 damage (% of GNI)Particulate emissions damage (% of GNI)Adjusted net savings (% of GNI)
4 2010 The Little Green Data Book
7,350640.20.1
282,797
113144
38.40.07.8
3.72,948
2.13,95868.916.2
0.77.3
–30.027
376
11,867
7.260958899897994
22
24.812.1
4.112.10.60.00.80.23.2
Population (millions) 443 Land area (1,000 sq. km) 23,054 GDP ($ billions) 3,872.5
Europe & Central Asia
GNI per capita, World Bank Atlas method ($)Urban population (% of total)Urban population growth (average annual %, 1990–2008)Population growth (average annual %, 1990–2008) AgricultureAgricultural land (% of land area)Agricultural productivity (value added per worker, 2000 $)Food production index (1999–2001 = 100)Population density, rural (people/sq. km of arable land) Forests and biodiversityForest area (% of land area)Deforestation (average annual %, 1990–2007)Nationally protected area (% of land area)Threatened species, mammalsThreatened species, birdsThreatened species, fishThreatened species, higher plantsGEF benefits index for biodiversity (0–100, median is 1.5) EnergyGDP per unit of energy use (2005 PPP $/kg oil equivalent)Energy use per capita (kg oil equivalent)Energy from biomass products and waste (% of total)Electric power consumption per capita (kWh)Electricity generated using fossil fuel (% of total)Electricity generated by hydropower (% of total) Emissions and pollutionCO2 emissions per unit of GDP (kg/2005 PPP $)CO2 emissions per capita (metric tons)CO2 emissions growth (%, 1990–2006)Particulate matter (urban-pop.-weighted avg., μg/cu. m)Transport sector energy use per capita (kg of oil equivalent) Water and sanitationInternal freshwater resources per capita (cu. m)Freshwater withdrawal
Total (% of internal resources)Agriculture (% of total freshwater withdrawal)
Access to improved water source (% of total population)Rural (% of rural population)Urban (% of urban population)
Access to improved sanitation (% of total population)Rural (% of rural population)Urban (% of urban population)
Environment and healthAcute resp. infection prevalence (% of children under five)Diarrhea prevalence (% of children under five)Under-five mortality rate (per 1,000 live births) National accounting aggregatesGross savings (% of GNI)Consumption of fixed capital (% of GNI)Education expenditure (% of GNI)Energy depletion (% of GNI)Mineral depletion (% of GNI)Net forest depletion (% of GNI)CO2 damage (% of GNI)Particulate emissions damage (% of GNI)Adjusted net savings (% of GNI)
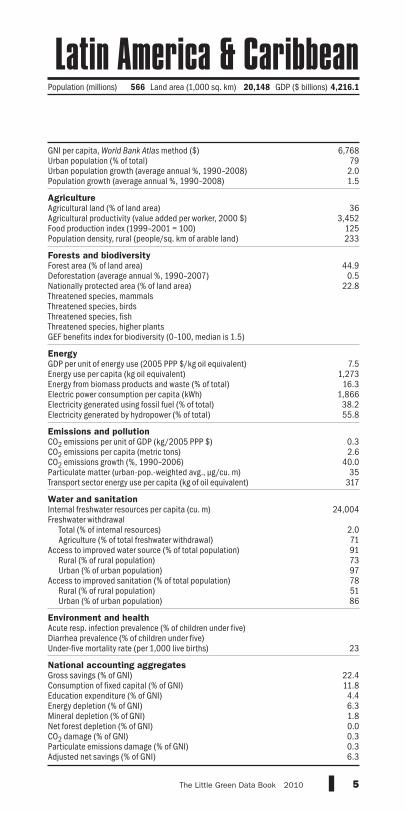
5The Little Green Data Book 2010
6,768792.01.5
363,452
125233
44.90.5
22.8
7.51,273
16.31,86638.255.8
0.32.6
40.035
317
24,004
2.071917397785186
23
22.411.84.46.31.80.00.30.36.3
Population (millions) 566 Land area (1,000 sq. km) 20,148 GDP ($ billions) 4,216.1
Latin America & Caribbean

GNI per capita, World Bank Atlas method ($)Urban population (% of total)Urban population growth (average annual %, 1990–2008)Population growth (average annual %, 1990–2008) AgricultureAgricultural land (% of land area)Agricultural productivity (value added per worker, 2000 $)Food production index (1999–2001 = 100)Population density, rural (people/sq. km of arable land) Forests and biodiversityForest area (% of land area)Deforestation (average annual %, 1990–2007)Nationally protected area (% of land area)Threatened species, mammalsThreatened species, birdsThreatened species, fishThreatened species, higher plantsGEF benefits index for biodiversity (0–100, median is 1.5) EnergyGDP per unit of energy use (2005 PPP $/kg oil equivalent)Energy use per capita (kg oil equivalent)Energy from biomass products and waste (% of total)Electric power consumption per capita (kWh)Electricity generated using fossil fuel (% of total)Electricity generated by hydropower (% of total) Emissions and pollutionCO2 emissions per unit of GDP (kg/2005 PPP $)CO2 emissions per capita (metric tons)CO2 emissions growth (%, 1990–2006)Particulate matter (urban-pop.-weighted avg., μg/cu. m)Transport sector energy use per capita (kg of oil equivalent) Water and sanitationInternal freshwater resources per capita (cu. m)Freshwater withdrawal
Total (% of internal resources)Agriculture (% of total freshwater withdrawal)
Access to improved water source (% of total population)Rural (% of rural population)Urban (% of urban population)
Access to improved sanitation (% of total population)Rural (% of rural population)Urban (% of urban population)
Environment and healthAcute resp. infection prevalence (% of children under five)Diarrhea prevalence (% of children under five)Under-five mortality rate (per 1,000 live births) National accounting aggregatesGross savings (% of GNI)Consumption of fixed capital (% of GNI)Education expenditure (% of GNI)Energy depletion (% of GNI)Mineral depletion (% of GNI)Net forest depletion (% of GNI)CO2 damage (% of GNI)Particulate emissions damage (% of GNI)Adjusted net savings (% of GNI)
6 2010 The Little Green Data Book
3,237572.62.0
232,896
120746
2.5–0.43.8
5.01,275
1.11,435
91.17.4
0.63.5
96.472
258
714
122.386888195745989
34
..10.54.4
18.61.50.10.70.4
..
Population (millions) 325 Land area (1,000 sq. km) 8,644 GDP ($ billions) 1,074.0
Middle East & North Africa
GNI per capita, World Bank Atlas method ($)Urban population (% of total)Urban population growth (average annual %, 1990–2008)Population growth (average annual %, 1990–2008) AgricultureAgricultural land (% of land area)Agricultural productivity (value added per worker, 2000 $)Food production index (1999–2001 = 100)Population density, rural (people/sq. km of arable land) Forests and biodiversityForest area (% of land area)Deforestation (average annual %, 1990–2007)Nationally protected area (% of land area)Threatened species, mammalsThreatened species, birdsThreatened species, fishThreatened species, higher plantsGEF benefits index for biodiversity (0–100, median is 1.5) EnergyGDP per unit of energy use (2005 PPP $/kg oil equivalent)Energy use per capita (kg oil equivalent)Energy from biomass products and waste (% of total)Electric power consumption per capita (kWh)Electricity generated using fossil fuel (% of total)Electricity generated by hydropower (% of total) Emissions and pollutionCO2 emissions per unit of GDP (kg/2005 PPP $)CO2 emissions per capita (metric tons)CO2 emissions growth (%, 1990–2006)Particulate matter (urban-pop.-weighted avg., μg/cu. m)Transport sector energy use per capita (kg of oil equivalent) Water and sanitationInternal freshwater resources per capita (cu. m)Freshwater withdrawal
Total (% of internal resources)Agriculture (% of total freshwater withdrawal)
Access to improved water source (% of total population)Rural (% of rural population)Urban (% of urban population)
Access to improved sanitation (% of total population)Rural (% of rural population)Urban (% of urban population)
Environment and healthAcute resp. infection prevalence (% of children under five)Diarrhea prevalence (% of children under five)Under-five mortality rate (per 1,000 live births) National accounting aggregatesGross savings (% of GNI)Consumption of fixed capital (% of GNI)Education expenditure (% of GNI)Energy depletion (% of GNI)Mineral depletion (% of GNI)Net forest depletion (% of GNI)CO2 damage (% of GNI)Particulate emissions damage (% of GNI)Adjusted net savings (% of GNI)
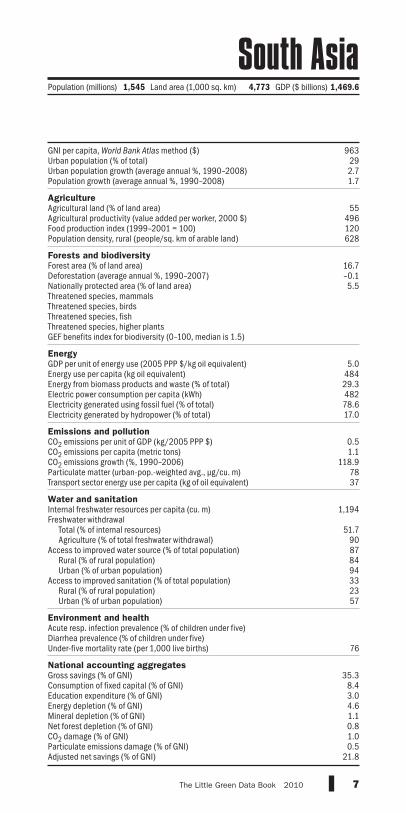
7The Little Green Data Book 2010
963292.71.7
55496120628
16.7–0.15.5
5.048429.348278.617.0
0.51.1
118.97837
1,194
51.790878494332357
76
35.38.43.04.61.10.81.00.5
21.8
Population (millions) 1,545 Land area (1,000 sq. km) 4,773 GDP ($ billions) 1,469.6
South Asia

GNI per capita, World Bank Atlas method ($)Urban population (% of total)Urban population growth (average annual %, 1990–2008)Population growth (average annual %, 1990–2008) AgricultureAgricultural land (% of land area)Agricultural productivity (value added per worker, 2000 $)Food production index (1999–2001 = 100)Population density, rural (people/sq. km of arable land) Forests and biodiversityForest area (% of land area)Deforestation (average annual %, 1990–2007)Nationally protected area (% of land area)Threatened species, mammalsThreatened species, birdsThreatened species, fishThreatened species, higher plantsGEF benefits index for biodiversity (0–100, median is 1.5) EnergyGDP per unit of energy use (2005 PPP $/kg oil equivalent)Energy use per capita (kg oil equivalent)Energy from biomass products and waste (% of total)Electric power consumption per capita (kWh)Electricity generated using fossil fuel (% of total)Electricity generated by hydropower (% of total) Emissions and pollutionCO2 emissions per unit of GDP (kg/2005 PPP $)CO2 emissions per capita (metric tons)CO2 emissions growth (%, 1990–2006)Particulate matter (urban-pop.-weighted avg., μg/cu. m)Transport sector energy use per capita (kg of oil equivalent) Water and sanitationInternal freshwater resources per capita (cu. m)Freshwater withdrawal
Total (% of internal resources)Agriculture (% of total freshwater withdrawal)
Access to improved water source (% of total population)Rural (% of rural population)Urban (% of urban population)
Access to improved sanitation (% of total population)Rural (% of rural population)Urban (% of urban population)
Environment and healthAcute resp. infection prevalence (% of children under five)Diarrhea prevalence (% of children under five)Under-five mortality rate (per 1,000 live births) National accounting aggregatesGross savings (% of GNI)Consumption of fixed capital (% of GNI)Education expenditure (% of GNI)Energy depletion (% of GNI)Mineral depletion (% of GNI)Net forest depletion (% of GNI)CO2 damage (% of GNI)Particulate emissions damage (% of GNI)Adjusted net savings (% of GNI)
8 2010 The Little Green Data Book
1,077364.02.6
45330119353
26.10.7
12.4
3.266255.855067.016.9
0.50.8
37.45361
4,829
3.287584681312442
144
16.59.03.3
14.21.30.60.60.4
–6.2
Population (millions) 819 Land area (1,000 sq. km) 23,585 GDP ($ billions) 978.1
Sub-Saharan Africa
9The Little Green Data Book 2010
For operational and analytical purposes the World Bank’s main criterion
for classifying economies is gross national income (GNI) per capita. Each
economy in The Little Green Data Book is classified as low income, middle
income, or high income. Low- and middle-income economies are sometimes
referred to as developing economies. The use of the term is convenient; it
is not intended to imply that all economies in the group are experiencing
similar development or that other economies have reached a preferred or
final stage of development. Classification by income does not necessarily
reflect development status.
Low-income economies are those with a GNI per capita of $975 or less
in 2008.
Middle-income economies are those with a GNI per capita of more than
$975 but less than $11,906. Lower-middle-income and upper-middle-income
economies are separated at a GNI per capita of $3,855.
High-income economies are those with a GNI per capita of $11,906 or
more.
Euro area includes the member states of the Economic and Monetary
Union of the European Union that have adopted the euro as their currency:
Austria, Belgium, Cyprus, Finland, France, Germany, Greece, Ireland, Italy,
Luxembourg, Malta, Netherlands, Portugal, Slovak Republic, Slovenia, and
Spain.
Income group tables

GNI per capita, World Bank Atlas method ($)Urban population (% of total)Urban population growth (average annual %, 1990–2008)Population growth (average annual %, 1990–2008) AgricultureAgricultural land (% of land area)Agricultural productivity (value added per worker, 2000 $)Food production index (1999–2001 = 100)Population density, rural (people/sq. km of arable land) Forests and biodiversityForest area (% of land area)Deforestation (average annual %, 1990–2007)Nationally protected area (% of land area)Threatened species, mammalsThreatened species, birdsThreatened species, fishThreatened species, higher plantsGEF benefits index for biodiversity (0–100, median is 1.5) EnergyGDP per unit of energy use (2005 PPP $/kg oil equivalent)Energy use per capita (kg oil equivalent)Energy from biomass products and waste (% of total)Electric power consumption per capita (kWh)Electricity generated using fossil fuel (% of total)Electricity generated by hydropower (% of total) Emissions and pollutionCO2 emissions per unit of GDP (kg/2005 PPP $)CO2 emissions per capita (metric tons)CO2 emissions growth (%, 1990–2006)Particulate matter (urban-pop.-weighted avg., μg/cu. m)Transport sector energy use per capita (kg of oil equivalent) Water and sanitationInternal freshwater resources per capita (cu. m)Freshwater withdrawal
Total (% of internal resources)Agriculture (% of total freshwater withdrawal)
Access to improved water source (% of total population)Rural (% of rural population)Urban (% of urban population)
Access to improved sanitation (% of total population)Rural (% of rural population)Urban (% of urban population)
Environment and healthAcute resp. infection prevalence (% of children under five)Diarrhea prevalence (% of children under five)Under-five mortality rate (per 1,000 live births) National accounting aggregatesGross savings (% of GNI)Consumption of fixed capital (% of GNI)Education expenditure (% of GNI)Energy depletion (% of GNI)Mineral depletion (% of GNI)Net forest depletion (% of GNI)CO2 damage (% of GNI)Particulate emissions damage (% of GNI)Adjusted net savings (% of GNI)
10 2010 The Little Green Data Book
523293.52.2
38318125666
24.70.7
11.9
3.2423
49.332441.641.9
0.40.5
–6.06537
5,004
9.488676086383352
118
25.97.93.47.81.01.00.70.3
10.7
Population (millions) 976 Land area (1,000 sq. km) 18,732 GDP ($ billions) 564.6
Low income
GNI per capita, World Bank Atlas method ($)Urban population (% of total)Urban population growth (average annual %, 1990–2008)Population growth (average annual %, 1990–2008) AgricultureAgricultural land (% of land area)Agricultural productivity (value added per worker, 2000 $)Food production index (1999–2001 = 100)Population density, rural (people/sq. km of arable land) Forests and biodiversityForest area (% of land area)Deforestation (average annual %, 1990–2007)Nationally protected area (% of land area)Threatened species, mammalsThreatened species, birdsThreatened species, fishThreatened species, higher plantsGEF benefits index for biodiversity (0–100, median is 1.5) EnergyGDP per unit of energy use (2005 PPP $/kg oil equivalent)Energy use per capita (kg oil equivalent)Energy from biomass products and waste (% of total)Electric power consumption per capita (kWh)Electricity generated using fossil fuel (% of total)Electricity generated by hydropower (% of total) Emissions and pollutionCO2 emissions per unit of GDP (kg/2005 PPP $)CO2 emissions per capita (metric tons)CO2 emissions growth (%, 1990–2006)Particulate matter (urban-pop.-weighted avg., μg/cu. m)Transport sector energy use per capita (kg of oil equivalent) Water and sanitationInternal freshwater resources per capita (cu. m)Freshwater withdrawal
Total (% of internal resources)Agriculture (% of total freshwater withdrawal)
Access to improved water source (% of total population)Rural (% of rural population)Urban (% of urban population)
Access to improved sanitation (% of total population)Rural (% of rural population)Urban (% of urban population)
Environment and healthAcute resp. infection prevalence (% of children under five)Diarrhea prevalence (% of children under five)Under-five mortality rate (per 1,000 live births) National accounting aggregatesGross savings (% of GNI)Consumption of fixed capital (% of GNI)Education expenditure (% of GNI)Energy depletion (% of GNI)Mineral depletion (% of GNI)Net forest depletion (% of GNI)CO2 damage (% of GNI)Particulate emissions damage (% of GNI)Adjusted net savings (% of GNI)
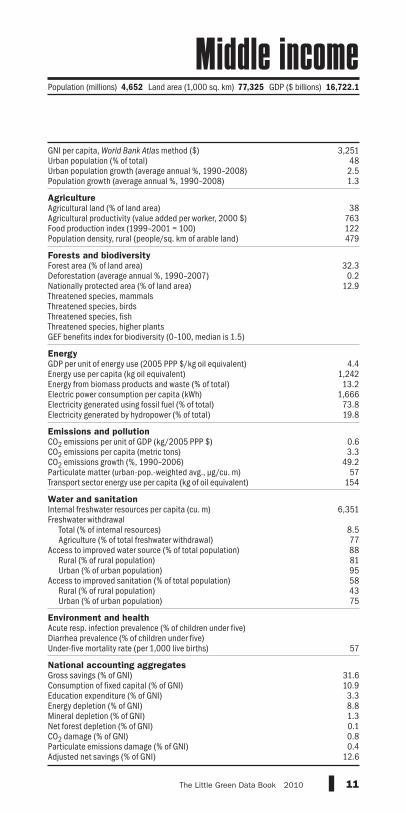
11The Little Green Data Book 2010
3,251482.51.3
38763122479
32.30.2
12.9
4.41,24213.2
1,66673.819.8
0.63.3
49.257
154
6,351
8.577888195584375
57
31.610.93.38.81.30.10.80.4
12.6
Population (millions) 4,652 Land area (1,000 sq. km) 77,325 GDP ($ billions) 16,722.1
Middle income

GNI per capita, World Bank Atlas method ($)Urban population (% of total)Urban population growth (average annual %, 1990–2008)Population growth (average annual %, 1990–2008) AgricultureAgricultural land (% of land area)Agricultural productivity (value added per worker, 2000 $)Food production index (1999–2001 = 100)Population density, rural (people/sq. km of arable land) Forests and biodiversityForest area (% of land area)Deforestation (average annual %, 1990–2007)Nationally protected area (% of land area)Threatened species, mammalsThreatened species, birdsThreatened species, fishThreatened species, higher plantsGEF benefits index for biodiversity (0–100, median is 1.5) EnergyGDP per unit of energy use (2005 PPP $/kg oil equivalent)Energy use per capita (kg oil equivalent)Energy from biomass products and waste (% of total)Electric power consumption per capita (kWh)Electricity generated using fossil fuel (% of total)Electricity generated by hydropower (% of total) Emissions and pollutionCO2 emissions per unit of GDP (kg/2005 PPP $)CO2 emissions per capita (metric tons)CO2 emissions growth (%, 1990–2006)Particulate matter (urban-pop.-weighted avg., μg/cu. m)Transport sector energy use per capita (kg of oil equivalent) Water and sanitationInternal freshwater resources per capita (cu. m)Freshwater withdrawal
Total (% of internal resources)Agriculture (% of total freshwater withdrawal)
Access to improved water source (% of total population)Rural (% of rural population)Urban (% of urban population)
Access to improved sanitation (% of total population)Rural (% of rural population)Urban (% of urban population)
Environment and healthAcute resp. infection prevalence (% of children under five)Diarrhea prevalence (% of children under five)Under-five mortality rate (per 1,000 live births) National accounting aggregatesGross savings (% of GNI)Consumption of fixed capital (% of GNI)Education expenditure (% of GNI)Energy depletion (% of GNI)Mineral depletion (% of GNI)Net forest depletion (% of GNI)CO2 damage (% of GNI)Particulate emissions damage (% of GNI)Adjusted net savings (% of GNI)
12 2010 The Little Green Data Book
2,07341
3.01.4
50589123516
24.80.2
11.2
3.91,01316.3
1,31080.015.2
0.82.8
105.76997
3,154
8.781868194524169
64
41.19.62.38.11.40.21.10.6
22.4
Population (millions) 3,703 Land area (1,000 sq. km) 31,182 GDP ($ billions) 8,277.8
Lower middle income

GNI per capita, World Bank Atlas method ($)Urban population (% of total)Urban population growth (average annual %, 1990–2008)Population growth (average annual %, 1990–2008) AgricultureAgricultural land (% of land area)Agricultural productivity (value added per worker, 2000 $)Food production index (1999–2001 = 100)Population density, rural (people/sq. km of arable land) Forests and biodiversityForest area (% of land area)Deforestation (average annual %, 1990–2007)Nationally protected area (% of land area)Threatened species, mammalsThreatened species, birdsThreatened species, fishThreatened species, higher plantsGEF benefits index for biodiversity (0–100, median is 1.5) EnergyGDP per unit of energy use (2005 PPP $/kg oil equivalent)Energy use per capita (kg oil equivalent)Energy from biomass products and waste (% of total)Electric power consumption per capita (kWh)Electricity generated using fossil fuel (% of total)Electricity generated by hydropower (% of total) Emissions and pollutionCO2 emissions per unit of GDP (kg/2005 PPP $)CO2 emissions per capita (metric tons)CO2 emissions growth (%, 1990–2006)Particulate matter (urban-pop.-weighted avg., μg/cu. m)Transport sector energy use per capita (kg of oil equivalent) Water and sanitationInternal freshwater resources per capita (cu. m)Freshwater withdrawal
Total (% of internal resources)Agriculture (% of total freshwater withdrawal)
Access to improved water source (% of total population)Rural (% of rural population)Urban (% of urban population)
Access to improved sanitation (% of total population)Rural (% of rural population)Urban (% of urban population)
Environment and healthAcute resp. infection prevalence (% of children under five)Diarrhea prevalence (% of children under five)Under-five mortality rate (per 1,000 live births) National accounting aggregatesGross savings (% of GNI)Consumption of fixed capital (% of GNI)Education expenditure (% of GNI)Energy depletion (% of GNI)Mineral depletion (% of GNI)Net forest depletion (% of GNI)CO2 damage (% of GNI)Particulate emissions damage (% of GNI)Adjusted net savings (% of GNI)
13The Little Green Data Book 2010
7,852751.51.0
303,399
120146
37.30.2
14.0
5.22,130
7.33,05263.427.5
0.55.2
–4.932
374
18,876
13.858948298826389
23
23.812.14.29.41.30.00.50.24.6
Population (millions) 949 Land area (1,000 sq. km) 46,143 GDP ($ billions) 8,442.4
Upper middle income
GNI per capita, World Bank Atlas method ($)Urban population (% of total)Urban population growth (average annual %, 1990–2008)Population growth (average annual %, 1990–2008) AgricultureAgricultural land (% of land area)Agricultural productivity (value added per worker, 2000 $)Food production index (1999–2001 = 100)Population density, rural (people/sq. km of arable land) Forests and biodiversityForest area (% of land area)Deforestation (average annual %, 1990–2007)Nationally protected area (% of land area)Threatened species, mammalsThreatened species, birdsThreatened species, fishThreatened species, higher plantsGEF benefits index for biodiversity (0–100, median is 1.5) EnergyGDP per unit of energy use (2005 PPP $/kg oil equivalent)Energy use per capita (kg oil equivalent)Energy from biomass products and waste (% of total)Electric power consumption per capita (kWh)Electricity generated using fossil fuel (% of total)Electricity generated by hydropower (% of total) Emissions and pollutionCO2 emissions per unit of GDP (kg/2005 PPP $)CO2 emissions per capita (metric tons)CO2 emissions growth (%, 1990–2006)Particulate matter (urban-pop.-weighted avg., μg/cu. m)Transport sector energy use per capita (kg of oil equivalent) Water and sanitationInternal freshwater resources per capita (cu. m)Freshwater withdrawal
Total (% of internal resources)Agriculture (% of total freshwater withdrawal)
Access to improved water source (% of total population)Rural (% of rural population)Urban (% of urban population)
Access to improved sanitation (% of total population)Rural (% of rural population)Urban (% of urban population)
Environment and healthAcute resp. infection prevalence (% of children under five)Diarrhea prevalence (% of children under five)Under-five mortality rate (per 1,000 live births) National accounting aggregatesGross savings (% of GNI)Consumption of fixed capital (% of GNI)Education expenditure (% of GNI)Energy depletion (% of GNI)Mineral depletion (% of GNI)Net forest depletion (% of GNI)CO2 damage (% of GNI)Particulate emissions damage (% of GNI)Adjusted net savings (% of GNI)
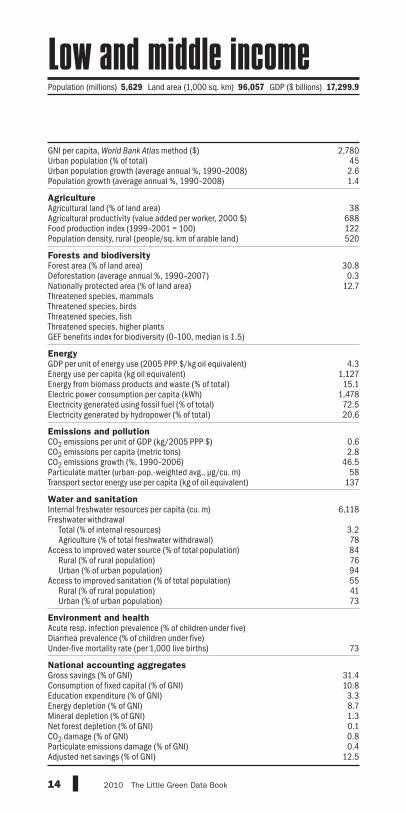
14 2010 The Little Green Data Book
2,780452.61.4
38688122520
30.80.3
12.7
4.31,12715.1
1,47872.520.6
0.62.8
46.558
137
6,118
3.278847694554173
73
31.410.83.38.71.30.10.80.4
12.5
Population (millions) 5,629 Land area (1,000 sq. km) 96,057 GDP ($ billions) 17,299.9
Low and middle income

GNI per capita, World Bank Atlas method ($)Urban population (% of total)Urban population growth (average annual %, 1990–2008)Population growth (average annual %, 1990–2008) AgricultureAgricultural land (% of land area)Agricultural productivity (value added per worker, 2000 $)Food production index (1999–2001 = 100)Population density, rural (people/sq. km of arable land) Forests and biodiversityForest area (% of land area)Deforestation (average annual %, 1990–2007)Nationally protected area (% of land area)Threatened species, mammalsThreatened species, birdsThreatened species, fishThreatened species, higher plantsGEF benefits index for biodiversity (0–100, median is 1.5) EnergyGDP per unit of energy use (2005 PPP $/kg oil equivalent)Energy use per capita (kg oil equivalent)Energy from biomass products and waste (% of total)Electric power consumption per capita (kWh)Electricity generated using fossil fuel (% of total)Electricity generated by hydropower (% of total) Emissions and pollutionCO2 emissions per unit of GDP (kg/2005 PPP $)CO2 emissions per capita (metric tons)CO2 emissions growth (%, 1990–2006)Particulate matter (urban-pop.-weighted avg., μg/cu. m)Transport sector energy use per capita (kg of oil equivalent) Water and sanitationInternal freshwater resources per capita (cu. m)Freshwater withdrawal
Total (% of internal resources)Agriculture (% of total freshwater withdrawal)
Access to improved water source (% of total population)Rural (% of rural population)Urban (% of urban population)
Access to improved sanitation (% of total population)Rural (% of rural population)Urban (% of urban population)
Environment and healthAcute resp. infection prevalence (% of children under five)Diarrhea prevalence (% of children under five)Under-five mortality rate (per 1,000 live births) National accounting aggregatesGross savings (% of GNI)Consumption of fixed capital (% of GNI)Education expenditure (% of GNI)Energy depletion (% of GNI)Mineral depletion (% of GNI)Net forest depletion (% of GNI)CO2 damage (% of GNI)Particulate emissions damage (% of GNI)Adjusted net savings (% of GNI)
15The Little Green Data Book 2010
38,839730.60.4
4623,687
94188
37.7–0.717.1
8.23,789
5.66,963
51.59.1
0.38.43.823
742
2,905
22.338
100100100
..
..
..
4
..14.04.60.30.00.00.20.1
..
Population (millions) 326 Land area (1,000 sq. km) 2,510 GDP ($ billions) 13,581.6
Euro area

GNI per capita, World Bank Atlas method ($)Urban population (% of total)Urban population growth (average annual %, 1990–2008)Population growth (average annual %, 1990–2008) AgricultureAgricultural land (% of land area)Agricultural productivity (value added per worker, 2000 $)Food production index (1999–2001 = 100)Population density, rural (people/sq. km of arable land) Forests and biodiversityForest area (% of land area)Deforestation (average annual %, 1990–2007)Nationally protected area (% of land area)Threatened species, mammalsThreatened species, birdsThreatened species, fishThreatened species, higher plantsGEF benefits index for biodiversity (0–100, median is 1.5) EnergyGDP per unit of energy use (2005 PPP $/kg oil equivalent)Energy use per capita (kg oil equivalent)Energy from biomass products and waste (% of total)Electric power consumption per capita (kWh)Electricity generated using fossil fuel (% of total)Electricity generated by hydropower (% of total) Emissions and pollutionCO2 emissions per unit of GDP (kg/2005 PPP $)CO2 emissions per capita (metric tons)CO2 emissions growth (%, 1990–2006)Particulate matter (urban-pop.-weighted avg., μg/cu. m)Transport sector energy use per capita (kg of oil equivalent) Water and sanitationInternal freshwater resources per capita (cu. m)Freshwater withdrawal
Total (% of internal resources)Agriculture (% of total freshwater withdrawal)
Access to improved water source (% of total population)Rural (% of rural population)Urban (% of urban population)
Access to improved sanitation (% of total population)Rural (% of rural population)Urban (% of urban population)
Environment and healthAcute resp. infection prevalence (% of children under five)Diarrhea prevalence (% of children under five)Under-five mortality rate (per 1,000 live births) National accounting aggregatesGross savings (% of GNI)Consumption of fixed capital (% of GNI)Education expenditure (% of GNI)Energy depletion (% of GNI)Mineral depletion (% of GNI)Net forest depletion (% of GNI)CO2 damage (% of GNI)Particulate emissions damage (% of GNI)Adjusted net savings (% of GNI)
16 2010 The Little Green Data Book
39,688781.00.7
3828,475
101341
28.9–0.119.1
6.55,321
3.79,75363.111.1
0.412.718.0
261,166
9,305
10.443
10098
10010099
100
7
18.513.8
4.62.00.20.00.20.16.8
Population (millions) 1,069 Land area (1,000 sq. km) 33,554 GDP ($ billions) 43,309.6
High income

17The Little Green Data Book 2010
China
Data for China do not include data for Hong Kong SAR, China; Macao SAR,
China; or Taiwan, China.
Cyprus
GNI and GDP data and data calculated using GNI and GDP refer to the area
controlled by the government of the Republic of Cyprus. For more information,
see World Development Indicators 2010 or data.worldbank.org.
Kosovo, Montenegro, and Serbia
Montenegro declared independence from Serbia and Montenegro on June 3,
2006. Where available, data for each country are shown separately. However,
some indicators for Serbia prior to 2006 include data for Montenegro.
Moreover, data for most indicators for Serbia from 1999 onward exclude
data for Kosovo, which in 1999 became a territory under international
administration pursuant to UN Security Council Resolution 1244 (1999).
Kosovo became a member of the World Bank on June 29, 2009, and its
data are shown where available.
Moldova
GNI and GDP data and data calculated using GNI and GDP exclude Transnistria.
For more information, see World Development Indicators 2010 or data.world-
bank.org.
Morocco
GNI and GDP data and data calculated using GNI and GDP include Former
Spanish Sahara. For more information, see World Development Indicators
2010 or data.worldbank.org.
Tanzania
GNI and GDP data and data calculated using GNI and GDP refer to mainland
Tanzania only. For more information, see World Development Indicators 2010
or data.worldbank.org.
Country tables
GNI per capita, World Bank Atlas method ($)Urban population (% of total)Urban population growth (average annual %, 1990–2008)Population growth (average annual %, 1990–2008) AgricultureAgricultural land (% of land area)Agricultural productivity (value added per worker, 2000 $)Food production index (1999–2001 = 100)Population density, rural (people/sq. km of arable land) Forests and biodiversityForest area (% of land area)Deforestation (average annual %, 1990–2007)Nationally protected area (% of land area)Threatened species, mammalsThreatened species, birdsThreatened species, fishThreatened species, higher plantsGEF benefits index for biodiversity (0–100, median is 1.5) EnergyGDP per unit of energy use (2005 PPP $/kg oil equivalent)Energy use per capita (kg oil equivalent)Energy from biomass products and waste (% of total)Electric power consumption per capita (kWh)Electricity generated using fossil fuel (% of total)Electricity generated by hydropower (% of total) Emissions and pollutionCO2 emissions per unit of GDP (kg/2005 PPP $)CO2 emissions per capita (metric tons)CO2 emissions growth (%, 1990–2006)Particulate matter (urban-pop.-weighted avg., μg/cu. m)Transport sector energy use per capita (kg of oil equivalent) Water and sanitationInternal freshwater resources per capita (cu. m)Freshwater withdrawal
Total (% of internal resources)Agriculture (% of total freshwater withdrawal)
Access to improved water source (% of total population)Rural (% of rural population)Urban (% of urban population)
Access to improved sanitation (% of total population)Rural (% of rural population)Urban (% of urban population)
Environment and healthAcute resp. infection prevalence (% of children under five)Diarrhea prevalence (% of children under five)Under-five mortality rate (per 1,000 live births) National accounting aggregatesGross savings (% of GNI)Consumption of fixed capital (% of GNI)Education expenditure (% of GNI)Energy depletion (% of GNI)Mineral depletion (% of GNI)Net forest depletion (% of GNI)CO2 damage (% of GNI)Particulate emissions damage (% of GNI)Adjusted net savings (% of GNI)
18 2010 The Little Green Data Book
Country data
South Asia
group
Low-income group
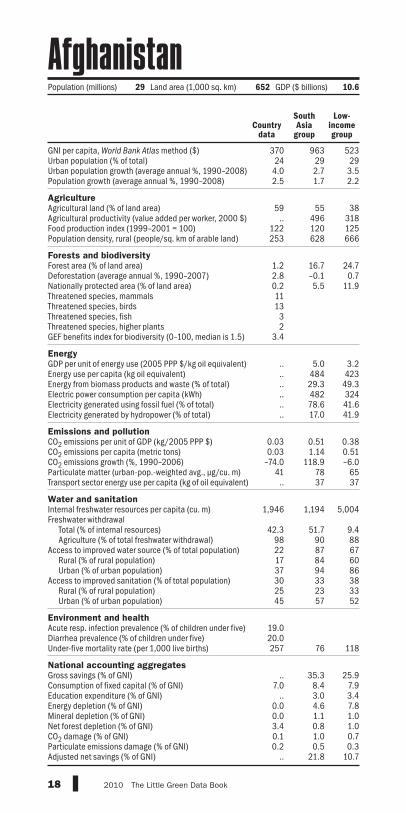
370 963 52324 29 29
4.0 2.7 3.52.5 1.7 2.2
59 55 38.. 496 318
122 120 125253 628 666
1.2 16.7 24.72.8 –0.1 0.70.2 5.5 11.91113
32
3.4
.. 5.0 3.2
.. 484 423
.. 29.3 49.3
.. 482 324
.. 78.6 41.6
.. 17.0 41.9
0.03 0.51 0.380.03 1.14 0.51
–74.0 118.9 –6.041 78 65.. 37 37
1,946 1,194 5,004
42.3 51.7 9.498 90 8822 87 6717 84 6037 94 8630 33 3825 23 3345 57 52
19.020.0257 76 118
.. 35.3 25.97.0 8.4 7.9
.. 3.0 3.40.0 4.6 7.80.0 1.1 1.03.4 0.8 1.00.1 1.0 0.70.2 0.5 0.3
.. 21.8 10.7
Population (millions) 29 Land area (1,000 sq. km) 652 GDP ($ billions) 10.6
Afghanistan
GNI per capita, World Bank Atlas method ($)Urban population (% of total)Urban population growth (average annual %, 1990–2008)Population growth (average annual %, 1990–2008) AgricultureAgricultural land (% of land area)Agricultural productivity (value added per worker, 2000 $)Food production index (1999–2001 = 100)Population density, rural (people/sq. km of arable land) Forests and biodiversityForest area (% of land area)Deforestation (average annual %, 1990–2007)Nationally protected area (% of land area)Threatened species, mammalsThreatened species, birdsThreatened species, fishThreatened species, higher plantsGEF benefits index for biodiversity (0–100, median is 1.5) EnergyGDP per unit of energy use (2005 PPP $/kg oil equivalent)Energy use per capita (kg oil equivalent)Energy from biomass products and waste (% of total)Electric power consumption per capita (kWh)Electricity generated using fossil fuel (% of total)Electricity generated by hydropower (% of total) Emissions and pollutionCO2 emissions per unit of GDP (kg/2005 PPP $)CO2 emissions per capita (metric tons)CO2 emissions growth (%, 1990–2006)Particulate matter (urban-pop.-weighted avg., μg/cu. m)Transport sector energy use per capita (kg of oil equivalent) Water and sanitationInternal freshwater resources per capita (cu. m)Freshwater withdrawal
Total (% of internal resources)Agriculture (% of total freshwater withdrawal)
Access to improved water source (% of total population)Rural (% of rural population)Urban (% of urban population)
Access to improved sanitation (% of total population)Rural (% of rural population)Urban (% of urban population)
Environment and healthAcute resp. infection prevalence (% of children under five)Diarrhea prevalence (% of children under five)Under-five mortality rate (per 1,000 live births) National accounting aggregatesGross savings (% of GNI)Consumption of fixed capital (% of GNI)Education expenditure (% of GNI)Energy depletion (% of GNI)Mineral depletion (% of GNI)Net forest depletion (% of GNI)CO2 damage (% of GNI)Particulate emissions damage (% of GNI)Adjusted net savings (% of GNI)
19The Little Green Data Book 2010
Country data
Europe & Central
Asia group
Lower middle-income group
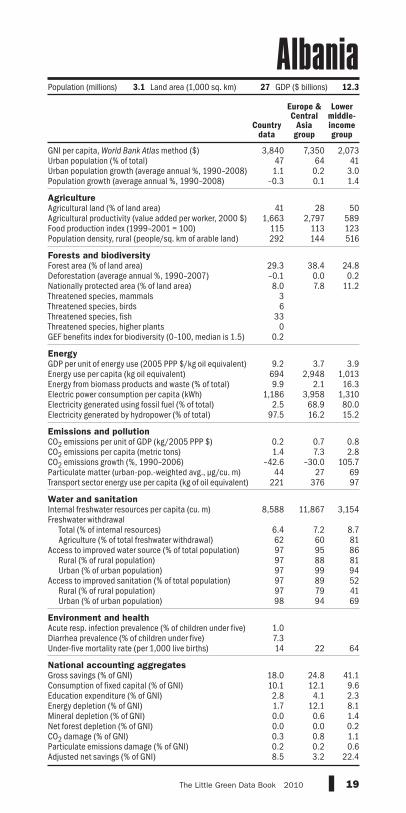
3,840 7,350 2,07347 64 411.1 0.2 3.0
–0.3 0.1 1.4
41 28 501,663 2,797 589
115 113 123292 144 516
29.3 38.4 24.8–0.1 0.0 0.28.0 7.8 11.2
36
330
0.2
9.2 3.7 3.9694 2,948 1,0139.9 2.1 16.3
1,186 3,958 1,3102.5 68.9 80.0
97.5 16.2 15.2
0.2 0.7 0.81.4 7.3 2.8
–42.6 –30.0 105.744 27 69
221 376 97
8,588 11,867 3,154
6.4 7.2 8.762 60 8197 95 8697 88 8197 99 9497 89 5297 79 4198 94 69
1.07.314 22 64
18.0 24.8 41.110.1 12.1 9.62.8 4.1 2.31.7 12.1 8.10.0 0.6 1.40.0 0.0 0.20.3 0.8 1.10.2 0.2 0.68.5 3.2 22.4
Population (millions) 3.1 Land area (1,000 sq. km) 27 GDP ($ billions) 12.3
Albania

GNI per capita, World Bank Atlas method ($)Urban population (% of total)Urban population growth (average annual %, 1990–2008)Population growth (average annual %, 1990–2008) AgricultureAgricultural land (% of land area)Agricultural productivity (value added per worker, 2000 $)Food production index (1999–2001 = 100)Population density, rural (people/sq. km of arable land) Forests and biodiversityForest area (% of land area)Deforestation (average annual %, 1990–2007)Nationally protected area (% of land area)Threatened species, mammalsThreatened species, birdsThreatened species, fishThreatened species, higher plantsGEF benefits index for biodiversity (0–100, median is 1.5) EnergyGDP per unit of energy use (2005 PPP $/kg oil equivalent)Energy use per capita (kg oil equivalent)Energy from biomass products and waste (% of total)Electric power consumption per capita (kWh)Electricity generated using fossil fuel (% of total)Electricity generated by hydropower (% of total) Emissions and pollutionCO2 emissions per unit of GDP (kg/2005 PPP $)CO2 emissions per capita (metric tons)CO2 emissions growth (%, 1990–2006)Particulate matter (urban-pop.-weighted avg., μg/cu. m)Transport sector energy use per capita (kg of oil equivalent) Water and sanitationInternal freshwater resources per capita (cu. m)Freshwater withdrawal
Total (% of internal resources)Agriculture (% of total freshwater withdrawal)
Access to improved water source (% of total population)Rural (% of rural population)Urban (% of urban population)
Access to improved sanitation (% of total population)Rural (% of rural population)Urban (% of urban population)
Environment and healthAcute resp. infection prevalence (% of children under five)Diarrhea prevalence (% of children under five)Under-five mortality rate (per 1,000 live births) National accounting aggregatesGross savings (% of GNI)Consumption of fixed capital (% of GNI)Education expenditure (% of GNI)Energy depletion (% of GNI)Mineral depletion (% of GNI)Net forest depletion (% of GNI)CO2 damage (% of GNI)Particulate emissions damage (% of GNI)Adjusted net savings (% of GNI)
20 2010 The Little Green Data Book
Country data
Middle East &
N. Africa group
Upper middle-income group
4,190 3,237 7,85265 57 753.0 2.6 1.51.7 2.0 1.0
17 23 302,305 2,896 3,399
136 120 120161 746 146
1.0 2.5 37.3–1.6 –0.4 0.25.0 3.8 14.0141123
32.9
6.7 5.0 5.21,089 1,275 2,130
0.2 1.1 7.3902 1,435 3,05299.4 91.1 63.4
0.6 7.4 27.5
0.6 0.6 0.54.0 3.5 5.2
68.2 96.4 –4.971 72 32
206 258 374
332 714 18,876
54.0 122.3 13.865 86 5885 88 9481 81 8287 95 9894 74 8287 59 6398 89 89
9.019.8
41 34 23
58.8 .. 23.810.9 10.5 12.14.5 4.4 4.2
29.9 18.6 9.40.2 1.5 1.30.1 0.1 0.00.6 0.7 0.50.2 0.4 0.2
21.4 .. 4.6
Population (millions) 34 Land area (1,000 sq. km) 2,382 GDP ($ billions) 166.5
Algeria

GNI per capita, World Bank Atlas method ($)Urban population (% of total)Urban population growth (average annual %, 1990–2008)Population growth (average annual %, 1990–2008) AgricultureAgricultural land (% of land area)Agricultural productivity (value added per worker, 2000 $)Food production index (1999–2001 = 100)Population density, rural (people/sq. km of arable land) Forests and biodiversityForest area (% of land area)Deforestation (average annual %, 1990–2007)Nationally protected area (% of land area)Threatened species, mammalsThreatened species, birdsThreatened species, fishThreatened species, higher plantsGEF benefits index for biodiversity (0–100, median is 1.5) EnergyGDP per unit of energy use (2005 PPP $/kg oil equivalent)Energy use per capita (kg oil equivalent)Energy from biomass products and waste (% of total)Electric power consumption per capita (kWh)Electricity generated using fossil fuel (% of total)Electricity generated by hydropower (% of total) Emissions and pollutionCO2 emissions per unit of GDP (kg/2005 PPP $)CO2 emissions per capita (metric tons)CO2 emissions growth (%, 1990–2006)Particulate matter (urban-pop.-weighted avg., μg/cu. m)Transport sector energy use per capita (kg of oil equivalent) Water and sanitationInternal freshwater resources per capita (cu. m)Freshwater withdrawal
Total (% of internal resources)Agriculture (% of total freshwater withdrawal)
Access to improved water source (% of total population)Rural (% of rural population)Urban (% of urban population)
Access to improved sanitation (% of total population)Rural (% of rural population)Urban (% of urban population)
Environment and healthAcute resp. infection prevalence (% of children under five)Diarrhea prevalence (% of children under five)Under-five mortality rate (per 1,000 live births) National accounting aggregatesGross savings (% of GNI)Consumption of fixed capital (% of GNI)Education expenditure (% of GNI)Energy depletion (% of GNI)Mineral depletion (% of GNI)Net forest depletion (% of GNI)CO2 damage (% of GNI)Particulate emissions damage (% of GNI)Adjusted net savings (% of GNI)
21The Little Green Data Book 2010
Country data
East Asia & Pacific
group
Upper middle-income group
.. 2,644 7,85292 44 75
.. 3.4 1.5
.. 1.0 1.0
25 50 30.. 509 3,399
128 127 120261 552 146
89.0 28.5 37.30.2 0.1 0.2
16.8 14.7 14.01881
0.3
.. 3.6 5.2
.. 1,295 2,130
.. 12.8 7.3
.. 1,883 3,052
.. 82.2 63.4
.. 14.7 27.5
.. 0.9 0.5
.. 3.8 5.2
.. 135.9 –4.9
.. 69 32
.. 113 374
.. 4,940 18,876
.. 10.2 13.8
.. 74 58
.. 87 94
.. 81 82
.. 96 98
.. 66 82
.. 59 63
.. 75 89
..
..
.. 29 23
.. 47.3 23.8
.. 10.1 12.1
.. 2.0 4.2
.. 7.2 9.4
.. 1.5 1.3
.. 0.0 0.0
.. 1.1 0.5
.. 0.7 0.2
.. 28.6 4.6
Population (thousands) 66 Land area (sq. km) 200 GDP ($ millions) ..
American Samoa

GNI per capita, World Bank Atlas method ($)Urban population (% of total)Urban population growth (average annual %, 1990–2008)Population growth (average annual %, 1990–2008) AgricultureAgricultural land (% of land area)Agricultural productivity (value added per worker, 2000 $)Food production index (1999–2001 = 100)Population density, rural (people/sq. km of arable land) Forests and biodiversityForest area (% of land area)Deforestation (average annual %, 1990–2007)Nationally protected area (% of land area)Threatened species, mammalsThreatened species, birdsThreatened species, fishThreatened species, higher plantsGEF benefits index for biodiversity (0–100, median is 1.5) EnergyGDP per unit of energy use (2005 PPP $/kg oil equivalent)Energy use per capita (kg oil equivalent)Energy from biomass products and waste (% of total)Electric power consumption per capita (kWh)Electricity generated using fossil fuel (% of total)Electricity generated by hydropower (% of total) Emissions and pollutionCO2 emissions per unit of GDP (kg/2005 PPP $)CO2 emissions per capita (metric tons)CO2 emissions growth (%, 1990–2006)Particulate matter (urban-pop.-weighted avg., μg/cu. m)Transport sector energy use per capita (kg of oil equivalent) Water and sanitationInternal freshwater resources per capita (cu. m)Freshwater withdrawal
Total (% of internal resources)Agriculture (% of total freshwater withdrawal)
Access to improved water source (% of total population)Rural (% of rural population)Urban (% of urban population)
Access to improved sanitation (% of total population)Rural (% of rural population)Urban (% of urban population)
Environment and healthAcute resp. infection prevalence (% of children under five)Diarrhea prevalence (% of children under five)Under-five mortality rate (per 1,000 live births) National accounting aggregatesGross savings (% of GNI)Consumption of fixed capital (% of GNI)Education expenditure (% of GNI)Energy depletion (% of GNI)Mineral depletion (% of GNI)Net forest depletion (% of GNI)CO2 damage (% of GNI)Particulate emissions damage (% of GNI)Adjusted net savings (% of GNI)
22 2010 The Little Green Data Book
Country data
High-income group
36,970 39,68889 78
.. 1.0
.. 0.7
55 38.. 28,475.. 101
873 341
34.0 28.90.0 –0.16.9 19.1
2020
0.0
.. 6.5
.. 5,321
.. 3.7
.. 9,753
.. 63.1
.. 11.1
.. 0.4
.. 12.7
.. 18.025 26
.. 1,166
.. 9,305
.. 10.4
.. 43100 100100 98100 100100 100100 99100 100
..
..4 7
.. 18.5
.. 13.82.2 4.6
.. 2.0
.. 0.2
.. 0.0
.. 0.2
.. 0.1
.. 6.8
Population (thousands) 84 Land area (sq. km) 470 GDP ($ millions) 3.2
Andorra

GNI per capita, World Bank Atlas method ($)Urban population (% of total)Urban population growth (average annual %, 1990–2008)Population growth (average annual %, 1990–2008) AgricultureAgricultural land (% of land area)Agricultural productivity (value added per worker, 2000 $)Food production index (1999–2001 = 100)Population density, rural (people/sq. km of arable land) Forests and biodiversityForest area (% of land area)Deforestation (average annual %, 1990–2007)Nationally protected area (% of land area)Threatened species, mammalsThreatened species, birdsThreatened species, fishThreatened species, higher plantsGEF benefits index for biodiversity (0–100, median is 1.5) EnergyGDP per unit of energy use (2005 PPP $/kg oil equivalent)Energy use per capita (kg oil equivalent)Energy from biomass products and waste (% of total)Electric power consumption per capita (kWh)Electricity generated using fossil fuel (% of total)Electricity generated by hydropower (% of total) Emissions and pollutionCO2 emissions per unit of GDP (kg/2005 PPP $)CO2 emissions per capita (metric tons)CO2 emissions growth (%, 1990–2006)Particulate matter (urban-pop.-weighted avg., μg/cu. m)Transport sector energy use per capita (kg of oil equivalent) Water and sanitationInternal freshwater resources per capita (cu. m)Freshwater withdrawal
Total (% of internal resources)Agriculture (% of total freshwater withdrawal)
Access to improved water source (% of total population)Rural (% of rural population)Urban (% of urban population)
Access to improved sanitation (% of total population)Rural (% of rural population)Urban (% of urban population)
Environment and healthAcute resp. infection prevalence (% of children under five)Diarrhea prevalence (% of children under five)Under-five mortality rate (per 1,000 live births) National accounting aggregatesGross savings (% of GNI)Consumption of fixed capital (% of GNI)Education expenditure (% of GNI)Energy depletion (% of GNI)Mineral depletion (% of GNI)Net forest depletion (% of GNI)CO2 damage (% of GNI)Particulate emissions damage (% of GNI)Adjusted net savings (% of GNI)
23The Little Green Data Book 2010
3,340 1,077 2,07357 36 41
5.3 4.0 3.02.9 2.6 1.4
46 45 50251 330 589151 119 123235 353 516
47.2 26.1 24.80.2 0.7 0.28.3 12.4 11.214182226
8.3
8.1 3.2 3.9606 662 1,01363.4 55.8 16.3185 550 1,31015.5 67.0 80.084.5 16.9 15.2
0.1 0.5 0.80.6 0.8 2.8
138.9 37.4 105.766 53 6981 61 97
8,431 4,829 3,154
0.2 3.2 8.760 87 8151 58 8639 46 8162 81 9450 31 5216 24 4179 42 69
8.028.4220 144 64
24.1 16.5 41.112.9 9.0 9.6
2.3 3.3 2.354.6 14.2 8.1
0.0 1.3 1.40.0 0.6 0.20.2 0.6 1.11.3 0.4 0.6
–42.6 –6.2 22.4
Country data
Sub-Saharan Africa group
Lower middle-income group
Population (millions) 18 Land area (1,000 sq. km) 1,247 GDP ($ billions) 84.9
Angola

GNI per capita, World Bank Atlas method ($)Urban population (% of total)Urban population growth (average annual %, 1990–2008)Population growth (average annual %, 1990–2008) AgricultureAgricultural land (% of land area)Agricultural productivity (value added per worker, 2000 $)Food production index (1999–2001 = 100)Population density, rural (people/sq. km of arable land) Forests and biodiversityForest area (% of land area)Deforestation (average annual %, 1990–2007)Nationally protected area (% of land area)Threatened species, mammalsThreatened species, birdsThreatened species, fishThreatened species, higher plantsGEF benefits index for biodiversity (0–100, median is 1.5) EnergyGDP per unit of energy use (2005 PPP $/kg oil equivalent)Energy use per capita (kg oil equivalent)Energy from biomass products and waste (% of total)Electric power consumption per capita (kWh)Electricity generated using fossil fuel (% of total)Electricity generated by hydropower (% of total) Emissions and pollutionCO2 emissions per unit of GDP (kg/2005 PPP $)CO2 emissions per capita (metric tons)CO2 emissions growth (%, 1990–2006)Particulate matter (urban-pop.-weighted avg., μg/cu. m)Transport sector energy use per capita (kg of oil equivalent) Water and sanitationInternal freshwater resources per capita (cu. m)Freshwater withdrawal
Total (% of internal resources)Agriculture (% of total freshwater withdrawal)
Access to improved water source (% of total population)Rural (% of rural population)Urban (% of urban population)
Access to improved sanitation (% of total population)Rural (% of rural population)Urban (% of urban population)
Environment and healthAcute resp. infection prevalence (% of children under five)Diarrhea prevalence (% of children under five)Under-five mortality rate (per 1,000 live births) National accounting aggregatesGross savings (% of GNI)Consumption of fixed capital (% of GNI)Education expenditure (% of GNI)Energy depletion (% of GNI)Mineral depletion (% of GNI)Net forest depletion (% of GNI)CO2 damage (% of GNI)Particulate emissions damage (% of GNI)Adjusted net savings (% of GNI)
24 2010 The Little Green Data Book
13,200 39,68830 781.0 1.01.9 0.7
30 383,290 28,475
104 101744 341
21.4 28.90.0 –0.1
10.3 19.121
144
0.7
.. 6.5
.. 5,321
.. 3.7
.. 9,753
.. 63.1
.. 11.1
0.3 0.45.0 12.7
41.5 18.012 26
.. 1,166
607 9,305
9.6 10.4.. 43
91 10089 9895 10095 10094 9998 100
..
..12 7
47.8 18.513.1 13.8
1.6 4.60.0 2.00.0 0.2
.. 0.00.3 0.2
.. 0.1
.. 6.8
Country data
High-income group
Population (thousands) 87 Land area (sq. km) 440 GDP ($ billions) 1.2
Antigua and Barbuda

GNI per capita, World Bank Atlas method ($)Urban population (% of total)Urban population growth (average annual %, 1990–2008)Population growth (average annual %, 1990–2008) AgricultureAgricultural land (% of land area)Agricultural productivity (value added per worker, 2000 $)Food production index (1999–2001 = 100)Population density, rural (people/sq. km of arable land) Forests and biodiversityForest area (% of land area)Deforestation (average annual %, 1990–2007)Nationally protected area (% of land area)Threatened species, mammalsThreatened species, birdsThreatened species, fishThreatened species, higher plantsGEF benefits index for biodiversity (0–100, median is 1.5) EnergyGDP per unit of energy use (2005 PPP $/kg oil equivalent)Energy use per capita (kg oil equivalent)Energy from biomass products and waste (% of total)Electric power consumption per capita (kWh)Electricity generated using fossil fuel (% of total)Electricity generated by hydropower (% of total) Emissions and pollutionCO2 emissions per unit of GDP (kg/2005 PPP $)CO2 emissions per capita (metric tons)CO2 emissions growth (%, 1990–2006)Particulate matter (urban-pop.-weighted avg., μg/cu. m)Transport sector energy use per capita (kg of oil equivalent) Water and sanitationInternal freshwater resources per capita (cu. m)Freshwater withdrawal
Total (% of internal resources)Agriculture (% of total freshwater withdrawal)
Access to improved water source (% of total population)Rural (% of rural population)Urban (% of urban population)
Access to improved sanitation (% of total population)Rural (% of rural population)Urban (% of urban population)
Environment and healthAcute resp. infection prevalence (% of children under five)Diarrhea prevalence (% of children under five)Under-five mortality rate (per 1,000 live births) National accounting aggregatesGross savings (% of GNI)Consumption of fixed capital (% of GNI)Education expenditure (% of GNI)Energy depletion (% of GNI)Mineral depletion (% of GNI)Net forest depletion (% of GNI)CO2 damage (% of GNI)Particulate emissions damage (% of GNI)Adjusted net savings (% of GNI)
25The Little Green Data Book 2010
7,190 6,768 7,85292 79 751.4 2.0 1.51.1 1.5 1.0
49 36 3012,050 3,452 3,399
125 125 12010 233 146
12.0 44.9 37.30.4 0.5 0.26.5 22.8 14.035493144
17.7
6.8 7.5 5.21,850 1,273 2,130
3.5 16.3 7.32,659 1,866 3,05265.9 38.2 63.426.5 55.8 27.5
0.4 0.3 0.54.4 2.6 5.2
54.1 40.0 –4.973 35 32
370 317 374
6,989 24,004 18,876
10.6 2.0 13.874 71 5896 91 9480 73 8298 97 9891 78 8283 51 6392 86 89
..
..16 23 23
25.5 22.4 23.811.8 11.8 12.14.5 4.4 4.28.6 6.3 9.40.4 1.8 1.30.0 0.0 0.00.5 0.3 0.51.1 0.3 0.27.7 6.3 4.6
Country data
Latin America & Caribbean
group
Upper middle-income group
Population (millions) 40 Land area (1,000 sq. km) 2,737 GDP ($ billions) 328.5
Argentina
GNI per capita, World Bank Atlas method ($)Urban population (% of total)Urban population growth (average annual %, 1990–2008)Population growth (average annual %, 1990–2008) AgricultureAgricultural land (% of land area)Agricultural productivity (value added per worker, 2000 $)Food production index (1999–2001 = 100)Population density, rural (people/sq. km of arable land) Forests and biodiversityForest area (% of land area)Deforestation (average annual %, 1990–2007)Nationally protected area (% of land area)Threatened species, mammalsThreatened species, birdsThreatened species, fishThreatened species, higher plantsGEF benefits index for biodiversity (0–100, median is 1.5) EnergyGDP per unit of energy use (2005 PPP $/kg oil equivalent)Energy use per capita (kg oil equivalent)Energy from biomass products and waste (% of total)Electric power consumption per capita (kWh)Electricity generated using fossil fuel (% of total)Electricity generated by hydropower (% of total) Emissions and pollutionCO2 emissions per unit of GDP (kg/2005 PPP $)CO2 emissions per capita (metric tons)CO2 emissions growth (%, 1990–2006)Particulate matter (urban-pop.-weighted avg., μg/cu. m)Transport sector energy use per capita (kg of oil equivalent) Water and sanitationInternal freshwater resources per capita (cu. m)Freshwater withdrawal
Total (% of internal resources)Agriculture (% of total freshwater withdrawal)
Access to improved water source (% of total population)Rural (% of rural population)Urban (% of urban population)
Access to improved sanitation (% of total population)Rural (% of rural population)Urban (% of urban population)
Environment and healthAcute resp. infection prevalence (% of children under five)Diarrhea prevalence (% of children under five)Under-five mortality rate (per 1,000 live births) National accounting aggregatesGross savings (% of GNI)Consumption of fixed capital (% of GNI)Education expenditure (% of GNI)Energy depletion (% of GNI)Mineral depletion (% of GNI)Net forest depletion (% of GNI)CO2 damage (% of GNI)Particulate emissions damage (% of GNI)Adjusted net savings (% of GNI)
26 2010 The Little Green Data Book
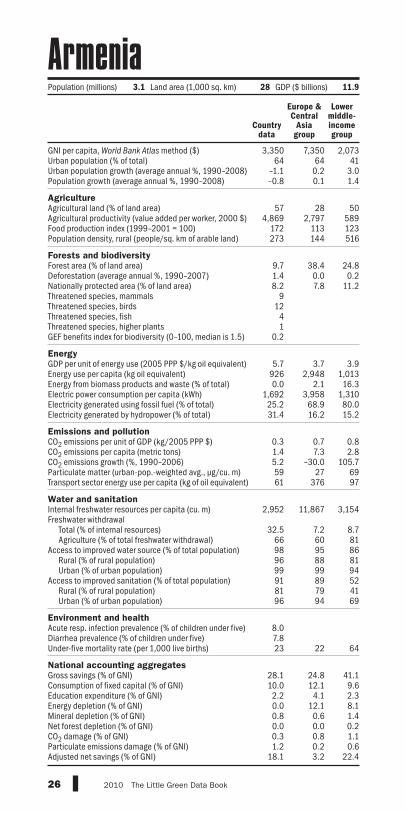
3,350 7,350 2,07364 64 41
–1.1 0.2 3.0–0.8 0.1 1.4
57 28 504,869 2,797 589
172 113 123273 144 516
9.7 38.4 24.81.4 0.0 0.28.2 7.8 11.2
912
41
0.2
5.7 3.7 3.9926 2,948 1,0130.0 2.1 16.3
1,692 3,958 1,31025.2 68.9 80.031.4 16.2 15.2
0.3 0.7 0.81.4 7.3 2.85.2 –30.0 105.759 27 6961 376 97
2,952 11,867 3,154
32.5 7.2 8.766 60 8198 95 8696 88 8199 99 9491 89 5281 79 4196 94 69
8.07.823 22 64
28.1 24.8 41.110.0 12.1 9.62.2 4.1 2.30.0 12.1 8.10.8 0.6 1.40.0 0.0 0.20.3 0.8 1.11.2 0.2 0.6
18.1 3.2 22.4
Country data
Europe & Central
Asia group
Lower middle-income group
Population (millions) 3.1 Land area (1,000 sq. km) 28 GDP ($ billions) 11.9
Armenia

GNI per capita, World Bank Atlas method ($)Urban population (% of total)Urban population growth (average annual %, 1990–2008)Population growth (average annual %, 1990–2008) AgricultureAgricultural land (% of land area)Agricultural productivity (value added per worker, 2000 $)Food production index (1999–2001 = 100)Population density, rural (people/sq. km of arable land) Forests and biodiversityForest area (% of land area)Deforestation (average annual %, 1990–2007)Nationally protected area (% of land area)Threatened species, mammalsThreatened species, birdsThreatened species, fishThreatened species, higher plantsGEF benefits index for biodiversity (0–100, median is 1.5) EnergyGDP per unit of energy use (2005 PPP $/kg oil equivalent)Energy use per capita (kg oil equivalent)Energy from biomass products and waste (% of total)Electric power consumption per capita (kWh)Electricity generated using fossil fuel (% of total)Electricity generated by hydropower (% of total) Emissions and pollutionCO2 emissions per unit of GDP (kg/2005 PPP $)CO2 emissions per capita (metric tons)CO2 emissions growth (%, 1990–2006)Particulate matter (urban-pop.-weighted avg., μg/cu. m)Transport sector energy use per capita (kg of oil equivalent) Water and sanitationInternal freshwater resources per capita (cu. m)Freshwater withdrawal
Total (% of internal resources)Agriculture (% of total freshwater withdrawal)
Access to improved water source (% of total population)Rural (% of rural population)Urban (% of urban population)
Access to improved sanitation (% of total population)Rural (% of rural population)Urban (% of urban population)
Environment and healthAcute resp. infection prevalence (% of children under five)Diarrhea prevalence (% of children under five)Under-five mortality rate (per 1,000 live births) National accounting aggregatesGross savings (% of GNI)Consumption of fixed capital (% of GNI)Education expenditure (% of GNI)Energy depletion (% of GNI)Mineral depletion (% of GNI)Net forest depletion (% of GNI)CO2 damage (% of GNI)Particulate emissions damage (% of GNI)Adjusted net savings (% of GNI)
27The Little Green Data Book 2010
.. 39,68847 78
2.4 1.02.8 0.7
11 38.. 28,475.. 101
2,775 341
2.2 28.90.0 –0.10.1 19.1
31
150
0.3
.. 6.5
.. 5,321
.. 3.7
.. 9,753
.. 63.1
.. 11.1
.. 0.422.5 12.725.5 18.0
.. 26
.. 1,166
.. 9,305
.. 10.4
.. 43100 100100 98100 100
.. 100
.. 99
.. 100
..
..
.. 7
.. 18.5
.. 13.8
.. 4.6
.. 2.0
.. 0.2
.. 0.0
.. 0.2
.. 0.1
.. 6.8
Country data
High-income group
Population (thousands) 105 Land area (sq. km) 180 GDP ($ billions) 1.9
Aruba

GNI per capita, World Bank Atlas method ($)Urban population (% of total)Urban population growth (average annual %, 1990–2008)Population growth (average annual %, 1990–2008) AgricultureAgricultural land (% of land area)Agricultural productivity (value added per worker, 2000 $)Food production index (1999–2001 = 100)Population density, rural (people/sq. km of arable land) Forests and biodiversityForest area (% of land area)Deforestation (average annual %, 1990–2007)Nationally protected area (% of land area)Threatened species, mammalsThreatened species, birdsThreatened species, fishThreatened species, higher plantsGEF benefits index for biodiversity (0–100, median is 1.5) EnergyGDP per unit of energy use (2005 PPP $/kg oil equivalent)Energy use per capita (kg oil equivalent)Energy from biomass products and waste (% of total)Electric power consumption per capita (kWh)Electricity generated using fossil fuel (% of total)Electricity generated by hydropower (% of total) Emissions and pollutionCO2 emissions per unit of GDP (kg/2005 PPP $)CO2 emissions per capita (metric tons)CO2 emissions growth (%, 1990–2006)Particulate matter (urban-pop.-weighted avg., μg/cu. m)Transport sector energy use per capita (kg of oil equivalent) Water and sanitationInternal freshwater resources per capita (cu. m)Freshwater withdrawal
Total (% of internal resources)Agriculture (% of total freshwater withdrawal)
Access to improved water source (% of total population)Rural (% of rural population)Urban (% of urban population)
Access to improved sanitation (% of total population)Rural (% of rural population)Urban (% of urban population)
Environment and healthAcute resp. infection prevalence (% of children under five)Diarrhea prevalence (% of children under five)Under-five mortality rate (per 1,000 live births) National accounting aggregatesGross savings (% of GNI)Consumption of fixed capital (% of GNI)Education expenditure (% of GNI)Energy depletion (% of GNI)Mineral depletion (% of GNI)Net forest depletion (% of GNI)CO2 damage (% of GNI)Particulate emissions damage (% of GNI)Adjusted net savings (% of GNI)
28 2010 The Little Green Data Book
40,240 39,68889 781.5 1.01.3 0.7
55 3827,375 28,475
76 1015 341
21.3 28.90.2 –0.10.1 19.157498455
87.7
6.0 6.55,888 5,321
4.3 3.711,249 9,753
92.5 63.15.7 11.1
0.5 0.418.0 12.726.9 18.0
15 261,287 1,166
23,348 9,305
4.9 10.475 43
100 100100 98100 100100 100100 99100 100
..
..6 7
32.9 18.514.7 13.85.1 4.64.1 2.03.8 0.20.0 0.00.3 0.20.0 0.1
15.0 6.8
Country data
High-income group
Population (millions) 21 Land area (1,000 sq. km) 7,682 GDP ($ billions) 1,015.2
Australia

GNI per capita, World Bank Atlas method ($)Urban population (% of total)Urban population growth (average annual %, 1990–2008)Population growth (average annual %, 1990–2008) AgricultureAgricultural land (% of land area)Agricultural productivity (value added per worker, 2000 $)Food production index (1999–2001 = 100)Population density, rural (people/sq. km of arable land) Forests and biodiversityForest area (% of land area)Deforestation (average annual %, 1990–2007)Nationally protected area (% of land area)Threatened species, mammalsThreatened species, birdsThreatened species, fishThreatened species, higher plantsGEF benefits index for biodiversity (0–100, median is 1.5) EnergyGDP per unit of energy use (2005 PPP $/kg oil equivalent)Energy use per capita (kg oil equivalent)Energy from biomass products and waste (% of total)Electric power consumption per capita (kWh)Electricity generated using fossil fuel (% of total)Electricity generated by hydropower (% of total) Emissions and pollutionCO2 emissions per unit of GDP (kg/2005 PPP $)CO2 emissions per capita (metric tons)CO2 emissions growth (%, 1990–2006)Particulate matter (urban-pop.-weighted avg., μg/cu. m)Transport sector energy use per capita (kg of oil equivalent) Water and sanitationInternal freshwater resources per capita (cu. m)Freshwater withdrawal
Total (% of internal resources)Agriculture (% of total freshwater withdrawal)
Access to improved water source (% of total population)Rural (% of rural population)Urban (% of urban population)
Access to improved sanitation (% of total population)Rural (% of rural population)Urban (% of urban population)
Environment and healthAcute resp. infection prevalence (% of children under five)Diarrhea prevalence (% of children under five)Under-five mortality rate (per 1,000 live births) National accounting aggregatesGross savings (% of GNI)Consumption of fixed capital (% of GNI)Education expenditure (% of GNI)Energy depletion (% of GNI)Mineral depletion (% of GNI)Net forest depletion (% of GNI)CO2 damage (% of GNI)Particulate emissions damage (% of GNI)Adjusted net savings (% of GNI)
29The Little Green Data Book 2010
45,900 39,68867 78
0.5 1.00.4 0.7
39 3822,651 28,475
95 101199 341
47.0 28.9–0.1 –0.128.0 19.1
4994
0.3
8.9 6.53,997 5,321
15.4 3.78,033 9,753
30.8 63.159.1 11.1
0.3 0.48.7 12.7
18.3 18.033 26
1,021 1,166
6,626 9,305
3.8 10.41 43
100 100100 98100 100100 100100 99100 100
..
..4 7
27.2 18.514.3 13.85.3 4.60.2 2.00.0 0.20.0 0.00.1 0.20.1 0.1
17.6 6.8
Country data
High-income group
Population (millions) 8.3 Land area (1,000 sq. km) 83 GDP ($ billions) 413.5
Austria
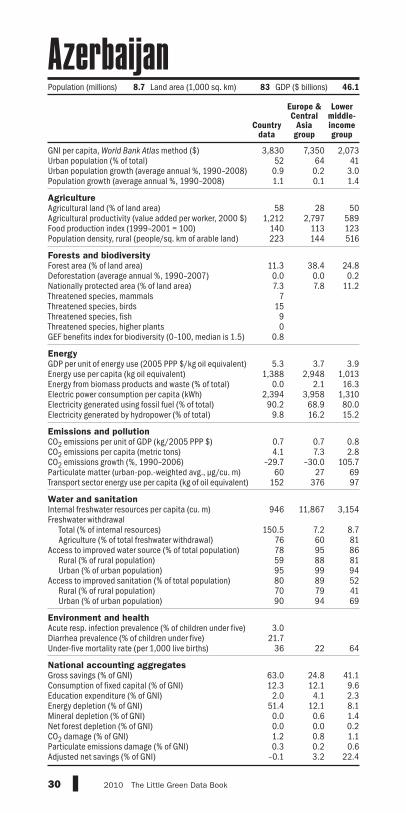
GNI per capita, World Bank Atlas method ($)Urban population (% of total)Urban population growth (average annual %, 1990–2008)Population growth (average annual %, 1990–2008) AgricultureAgricultural land (% of land area)Agricultural productivity (value added per worker, 2000 $)Food production index (1999–2001 = 100)Population density, rural (people/sq. km of arable land) Forests and biodiversityForest area (% of land area)Deforestation (average annual %, 1990–2007)Nationally protected area (% of land area)Threatened species, mammalsThreatened species, birdsThreatened species, fishThreatened species, higher plantsGEF benefits index for biodiversity (0–100, median is 1.5) EnergyGDP per unit of energy use (2005 PPP $/kg oil equivalent)Energy use per capita (kg oil equivalent)Energy from biomass products and waste (% of total)Electric power consumption per capita (kWh)Electricity generated using fossil fuel (% of total)Electricity generated by hydropower (% of total) Emissions and pollutionCO2 emissions per unit of GDP (kg/2005 PPP $)CO2 emissions per capita (metric tons)CO2 emissions growth (%, 1990–2006)Particulate matter (urban-pop.-weighted avg., μg/cu. m)Transport sector energy use per capita (kg of oil equivalent) Water and sanitationInternal freshwater resources per capita (cu. m)Freshwater withdrawal
Total (% of internal resources)Agriculture (% of total freshwater withdrawal)
Access to improved water source (% of total population)Rural (% of rural population)Urban (% of urban population)
Access to improved sanitation (% of total population)Rural (% of rural population)Urban (% of urban population)
Environment and healthAcute resp. infection prevalence (% of children under five)Diarrhea prevalence (% of children under five)Under-five mortality rate (per 1,000 live births) National accounting aggregatesGross savings (% of GNI)Consumption of fixed capital (% of GNI)Education expenditure (% of GNI)Energy depletion (% of GNI)Mineral depletion (% of GNI)Net forest depletion (% of GNI)CO2 damage (% of GNI)Particulate emissions damage (% of GNI)Adjusted net savings (% of GNI)
30 2010 The Little Green Data Book
3,830 7,350 2,07352 64 41
0.9 0.2 3.01.1 0.1 1.4
58 28 501,212 2,797 589
140 113 123223 144 516
11.3 38.4 24.80.0 0.0 0.27.3 7.8 11.2
71590
0.8
5.3 3.7 3.91,388 2,948 1,013
0.0 2.1 16.32,394 3,958 1,310
90.2 68.9 80.09.8 16.2 15.2
0.7 0.7 0.84.1 7.3 2.8
–29.7 –30.0 105.760 27 69
152 376 97
946 11,867 3,154
150.5 7.2 8.776 60 8178 95 8659 88 8195 99 9480 89 5270 79 4190 94 69
3.021.7
36 22 64
63.0 24.8 41.112.3 12.1 9.6
2.0 4.1 2.351.4 12.1 8.10.0 0.6 1.40.0 0.0 0.21.2 0.8 1.10.3 0.2 0.6
–0.1 3.2 22.4
Country data
Europe & Central
Asia group
Lower middle-income group
Population (millions) 8.7 Land area (1,000 sq. km) 83 GDP ($ billions) 46.1
Azerbaijan

GNI per capita, World Bank Atlas method ($)Urban population (% of total)Urban population growth (average annual %, 1990–2008)Population growth (average annual %, 1990–2008) AgricultureAgricultural land (% of land area)Agricultural productivity (value added per worker, 2000 $)Food production index (1999–2001 = 100)Population density, rural (people/sq. km of arable land) Forests and biodiversityForest area (% of land area)Deforestation (average annual %, 1990–2007)Nationally protected area (% of land area)Threatened species, mammalsThreatened species, birdsThreatened species, fishThreatened species, higher plantsGEF benefits index for biodiversity (0–100, median is 1.5) EnergyGDP per unit of energy use (2005 PPP $/kg oil equivalent)Energy use per capita (kg oil equivalent)Energy from biomass products and waste (% of total)Electric power consumption per capita (kWh)Electricity generated using fossil fuel (% of total)Electricity generated by hydropower (% of total) Emissions and pollutionCO2 emissions per unit of GDP (kg/2005 PPP $)CO2 emissions per capita (metric tons)CO2 emissions growth (%, 1990–2006)Particulate matter (urban-pop.-weighted avg., μg/cu. m)Transport sector energy use per capita (kg of oil equivalent) Water and sanitationInternal freshwater resources per capita (cu. m)Freshwater withdrawal
Total (% of internal resources)Agriculture (% of total freshwater withdrawal)
Access to improved water source (% of total population)Rural (% of rural population)Urban (% of urban population)
Access to improved sanitation (% of total population)Rural (% of rural population)Urban (% of urban population)
Environment and healthAcute resp. infection prevalence (% of children under five)Diarrhea prevalence (% of children under five)Under-five mortality rate (per 1,000 live births) National accounting aggregatesGross savings (% of GNI)Consumption of fixed capital (% of GNI)Education expenditure (% of GNI)Energy depletion (% of GNI)Mineral depletion (% of GNI)Net forest depletion (% of GNI)CO2 damage (% of GNI)Particulate emissions damage (% of GNI)Adjusted net savings (% of GNI)
31The Little Green Data Book 2010
Country data
High-income group
21,390 39,68884 781.8 1.01.5 0.7
1 3815,764 28,475
100 101688 341
51.4 28.90.0 –0.1
11.4 19.175
205
3.6
.. 6.5
.. 5,321
.. 3.7
.. 9,753
.. 63.1
.. 11.1
.. 0.46.5 12.79.6 18.037 26
.. 1,166
60 9,305
.. 10.4
.. 4397 10086 9898 100
100 100100 99100 100
..
..13 7
.. 18.5
.. 13.83.8 4.6
.. 2.0
.. 0.2
.. 0.0
.. 0.2
.. 0.1
.. 6.8
Population (thousands) 338 Land area (1,000 sq. km) 10 GDP ($ billions) 7.2
Bahamas, The

GNI per capita, World Bank Atlas method ($)Urban population (% of total)Urban population growth (average annual %, 1990–2008)Population growth (average annual %, 1990–2008) AgricultureAgricultural land (% of land area)Agricultural productivity (value added per worker, 2000 $)Food production index (1999–2001 = 100)Population density, rural (people/sq. km of arable land) Forests and biodiversityForest area (% of land area)Deforestation (average annual %, 1990–2007)Nationally protected area (% of land area)Threatened species, mammalsThreatened species, birdsThreatened species, fishThreatened species, higher plantsGEF benefits index for biodiversity (0–100, median is 1.5) EnergyGDP per unit of energy use (2005 PPP $/kg oil equivalent)Energy use per capita (kg oil equivalent)Energy from biomass products and waste (% of total)Electric power consumption per capita (kWh)Electricity generated using fossil fuel (% of total)Electricity generated by hydropower (% of total) Emissions and pollutionCO2 emissions per unit of GDP (kg/2005 PPP $)CO2 emissions per capita (metric tons)CO2 emissions growth (%, 1990–2006)Particulate matter (urban-pop.-weighted avg., μg/cu. m)Transport sector energy use per capita (kg of oil equivalent) Water and sanitationInternal freshwater resources per capita (cu. m)Freshwater withdrawal
Total (% of internal resources)Agriculture (% of total freshwater withdrawal)
Access to improved water source (% of total population)Rural (% of rural population)Urban (% of urban population)
Access to improved sanitation (% of total population)Rural (% of rural population)Urban (% of urban population)
Environment and healthAcute resp. infection prevalence (% of children under five)Diarrhea prevalence (% of children under five)Under-five mortality rate (per 1,000 live births) National accounting aggregatesGross savings (% of GNI)Consumption of fixed capital (% of GNI)Education expenditure (% of GNI)Energy depletion (% of GNI)Mineral depletion (% of GNI)Net forest depletion (% of GNI)CO2 damage (% of GNI)Particulate emissions damage (% of GNI)Adjusted net savings (% of GNI)
32 2010 The Little Green Data Book
Country data
High-income group
25,420 39,68889 782.5 1.02.5 0.7
14 38.. 28,475
117 1014,375 341
0.7 28.9–5.5 –0.18.4 19.1
3460
0.0
2.7 6.511,551 5,321
0.0 3.714,153 9,753100.0 63.1
0.0 11.1
1.0 0.428.6 12.779.2 18.0
68 261,243 1,166
5 9,305
8,935.0 10.445 43
.. 100
.. 98100 100
.. 100
.. 99100 100
8.38.412 7
45.4 18.56.7 13.84.4 4.6
26.4 2.00.0 0.20.0 0.00.8 0.20.2 0.1
15.6 6.8
Population (thousands) 776 Land area (sq. km) 710 GDP ($ millions) 21.9
Bahrain

GNI per capita, World Bank Atlas method ($)Urban population (% of total)Urban population growth (average annual %, 1990–2008)Population growth (average annual %, 1990–2008) AgricultureAgricultural land (% of land area)Agricultural productivity (value added per worker, 2000 $)Food production index (1999–2001 = 100)Population density, rural (people/sq. km of arable land) Forests and biodiversityForest area (% of land area)Deforestation (average annual %, 1990–2007)Nationally protected area (% of land area)Threatened species, mammalsThreatened species, birdsThreatened species, fishThreatened species, higher plantsGEF benefits index for biodiversity (0–100, median is 1.5) EnergyGDP per unit of energy use (2005 PPP $/kg oil equivalent)Energy use per capita (kg oil equivalent)Energy from biomass products and waste (% of total)Electric power consumption per capita (kWh)Electricity generated using fossil fuel (% of total)Electricity generated by hydropower (% of total) Emissions and pollutionCO2 emissions per unit of GDP (kg/2005 PPP $)CO2 emissions per capita (metric tons)CO2 emissions growth (%, 1990–2006)Particulate matter (urban-pop.-weighted avg., μg/cu. m)Transport sector energy use per capita (kg of oil equivalent) Water and sanitationInternal freshwater resources per capita (cu. m)Freshwater withdrawal
Total (% of internal resources)Agriculture (% of total freshwater withdrawal)
Access to improved water source (% of total population)Rural (% of rural population)Urban (% of urban population)
Access to improved sanitation (% of total population)Rural (% of rural population)Urban (% of urban population)
Environment and healthAcute resp. infection prevalence (% of children under five)Diarrhea prevalence (% of children under five)Under-five mortality rate (per 1,000 live births) National accounting aggregatesGross savings (% of GNI)Consumption of fixed capital (% of GNI)Education expenditure (% of GNI)Energy depletion (% of GNI)Mineral depletion (% of GNI)Net forest depletion (% of GNI)CO2 damage (% of GNI)Particulate emissions damage (% of GNI)Adjusted net savings (% of GNI)
33The Little Green Data Book 2010
Country data
South Asia
group
Low-income group
520 963 52327 29 29
3.6 2.7 3.51.8 1.7 2.2
70 55 38405 496 318117 120 125
1,452 628 666
6.7 16.7 24.70.1 –0.1 0.72.2 5.5 11.9342812121.4
7.2 5.0 3.2163 484 423
33.3 29.3 49.3144 482 324
94.3 78.6 41.65.7 17.0 41.9
0.2 0.5 0.40.3 1.1 0.5
168.0 118.9 –6.0135 78 65
10 37 37
666 1,194 5,004
75.6 51.7 9.496 90 8880 87 6778 84 6085 94 8636 33 3832 23 3348 57 52
20.86.154 76 118
33.9 35.3 25.96.8 8.4 7.92.0 3.0 3.44.0 4.6 7.80.0 1.1 1.00.6 0.8 1.00.4 1.0 0.70.4 0.5 0.3
23.7 21.8 10.7
Population (millions) 160 Land area (1,000 sq. km) 130 GDP ($ billions) 79.6
Bangladesh

GNI per capita, World Bank Atlas method ($)Urban population (% of total)Urban population growth (average annual %, 1990–2008)Population growth (average annual %, 1990–2008) AgricultureAgricultural land (% of land area)Agricultural productivity (value added per worker, 2000 $)Food production index (1999–2001 = 100)Population density, rural (people/sq. km of arable land) Forests and biodiversityForest area (% of land area)Deforestation (average annual %, 1990–2007)Nationally protected area (% of land area)Threatened species, mammalsThreatened species, birdsThreatened species, fishThreatened species, higher plantsGEF benefits index for biodiversity (0–100, median is 1.5) EnergyGDP per unit of energy use (2005 PPP $/kg oil equivalent)Energy use per capita (kg oil equivalent)Energy from biomass products and waste (% of total)Electric power consumption per capita (kWh)Electricity generated using fossil fuel (% of total)Electricity generated by hydropower (% of total) Emissions and pollutionCO2 emissions per unit of GDP (kg/2005 PPP $)CO2 emissions per capita (metric tons)CO2 emissions growth (%, 1990–2006)Particulate matter (urban-pop.-weighted avg., μg/cu. m)Transport sector energy use per capita (kg of oil equivalent) Water and sanitationInternal freshwater resources per capita (cu. m)Freshwater withdrawal
Total (% of internal resources)Agriculture (% of total freshwater withdrawal)
Access to improved water source (% of total population)Rural (% of rural population)Urban (% of urban population)
Access to improved sanitation (% of total population)Rural (% of rural population)Urban (% of urban population)
Environment and healthAcute resp. infection prevalence (% of children under five)Diarrhea prevalence (% of children under five)Under-five mortality rate (per 1,000 live births) National accounting aggregatesGross savings (% of GNI)Consumption of fixed capital (% of GNI)Education expenditure (% of GNI)Energy depletion (% of GNI)Mineral depletion (% of GNI)Net forest depletion (% of GNI)CO2 damage (% of GNI)Particulate emissions damage (% of GNI)Adjusted net savings (% of GNI)
34 2010 The Little Green Data Book
Country data
High-income group
9,330 39,68840 781.0 1.0
–0.1 0.7
44 3815,621 28,475
116 101965 341
4.0 28.90.0 –0.10.1 19.1
31
152
0.4
.. 6.5
.. 5,321
.. 3.7
.. 9,753
.. 63.1
.. 11.1
0.3 0.45.3 12.7
24.6 18.040 26
.. 1,166
314 9,305
112.5 10.4.. 43
100 100100 98100 10099 100
100 9999 100
..
..11 7
.. 18.5
.. 13.86.4 4.6
.. 2.0
.. 0.2
.. 0.0
.. 0.20.0 0.1
.. 6.8
Population (thousands) 255 Land area (sq. km) 430 GDP ($ billions) 3.7
Barbados

GNI per capita, World Bank Atlas method ($)Urban population (% of total)Urban population growth (average annual %, 1990–2008)Population growth (average annual %, 1990–2008) AgricultureAgricultural land (% of land area)Agricultural productivity (value added per worker, 2000 $)Food production index (1999–2001 = 100)Population density, rural (people/sq. km of arable land) Forests and biodiversityForest area (% of land area)Deforestation (average annual %, 1990–2007)Nationally protected area (% of land area)Threatened species, mammalsThreatened species, birdsThreatened species, fishThreatened species, higher plantsGEF benefits index for biodiversity (0–100, median is 1.5) EnergyGDP per unit of energy use (2005 PPP $/kg oil equivalent)Energy use per capita (kg oil equivalent)Energy from biomass products and waste (% of total)Electric power consumption per capita (kWh)Electricity generated using fossil fuel (% of total)Electricity generated by hydropower (% of total) Emissions and pollutionCO2 emissions per unit of GDP (kg/2005 PPP $)CO2 emissions per capita (metric tons)CO2 emissions growth (%, 1990–2006)Particulate matter (urban-pop.-weighted avg., μg/cu. m)Transport sector energy use per capita (kg of oil equivalent) Water and sanitationInternal freshwater resources per capita (cu. m)Freshwater withdrawal
Total (% of internal resources)Agriculture (% of total freshwater withdrawal)
Access to improved water source (% of total population)Rural (% of rural population)Urban (% of urban population)
Access to improved sanitation (% of total population)Rural (% of rural population)Urban (% of urban population)
Environment and healthAcute resp. infection prevalence (% of children under five)Diarrhea prevalence (% of children under five)Under-five mortality rate (per 1,000 live births) National accounting aggregatesGross savings (% of GNI)Consumption of fixed capital (% of GNI)Education expenditure (% of GNI)Energy depletion (% of GNI)Mineral depletion (% of GNI)Net forest depletion (% of GNI)CO2 damage (% of GNI)Particulate emissions damage (% of GNI)Adjusted net savings (% of GNI)
35The Little Green Data Book 2010
5,360 7,350 7,85273 64 75
0.3 0.2 1.5–0.3 0.1 1.0
44 28 304,383 2,797 3,399
139 113 12047 144 146
39.0 38.4 37.3–0.4 0.0 0.26.5 7.8 14.0
4410
0.0
3.6 3.7 5.22,891 2,948 2,130
5.2 2.1 7.33,345 3,958 3,052
99.6 68.9 63.40.1 16.2 27.5
0.7 0.7 0.57.1 7.3 5.2
–38.1 –30.0 –4.96 27 32
237 376 374
3,834 11,867 18,876
7.5 7.2 13.830 60 58
100 95 9499 88 82
100 99 9893 89 8297 79 6391 94 89
..
..13 22 23
28.4 24.8 23.811.2 12.1 12.14.9 4.1 4.21.3 12.1 9.40.0 0.6 1.30.0 0.0 0.01.1 0.8 0.50.0 0.2 0.2
19.8 3.2 4.6
Country data
Europe & Central
Asia group
Upper middle-income group
Population (millions) 9.7 Land area (1,000 sq. km) 203 GDP ($ billions) 60.3
Belarus

GNI per capita, World Bank Atlas method ($)Urban population (% of total)Urban population growth (average annual %, 1990–2008)Population growth (average annual %, 1990–2008) AgricultureAgricultural land (% of land area)Agricultural productivity (value added per worker, 2000 $)Food production index (1999–2001 = 100)Population density, rural (people/sq. km of arable land) Forests and biodiversityForest area (% of land area)Deforestation (average annual %, 1990–2007)Nationally protected area (% of land area)Threatened species, mammalsThreatened species, birdsThreatened species, fishThreatened species, higher plantsGEF benefits index for biodiversity (0–100, median is 1.5) EnergyGDP per unit of energy use (2005 PPP $/kg oil equivalent)Energy use per capita (kg oil equivalent)Energy from biomass products and waste (% of total)Electric power consumption per capita (kWh)Electricity generated using fossil fuel (% of total)Electricity generated by hydropower (% of total) Emissions and pollutionCO2 emissions per unit of GDP (kg/2005 PPP $)CO2 emissions per capita (metric tons)CO2 emissions growth (%, 1990–2006)Particulate matter (urban-pop.-weighted avg., μg/cu. m)Transport sector energy use per capita (kg of oil equivalent) Water and sanitationInternal freshwater resources per capita (cu. m)Freshwater withdrawal
Total (% of internal resources)Agriculture (% of total freshwater withdrawal)
Access to improved water source (% of total population)Rural (% of rural population)Urban (% of urban population)
Access to improved sanitation (% of total population)Rural (% of rural population)Urban (% of urban population)
Environment and healthAcute resp. infection prevalence (% of children under five)Diarrhea prevalence (% of children under five)Under-five mortality rate (per 1,000 live births) National accounting aggregatesGross savings (% of GNI)Consumption of fixed capital (% of GNI)Education expenditure (% of GNI)Energy depletion (% of GNI)Mineral depletion (% of GNI)Net forest depletion (% of GNI)CO2 damage (% of GNI)Particulate emissions damage (% of GNI)Adjusted net savings (% of GNI)
36 2010 The Little Green Data Book
44,570 39,68897 78
0.5 1.00.4 0.7
45 3837,354 28,475
48 10134 341
22.0 28.90.0 –0.13.2 19.1
3291
0.0
6.2 6.55,366 5,321
3.6 3.78,614 9,75339.4 63.1
0.4 11.1
0.3 0.410.2 12.7–0.4 18.0
22 26798 1,166
1,129 9,305
.. 10.4
.. 43
.. 100
.. 98100 100
.. 100
.. 99
.. 100
..
..5 7
.. 18.513.9 13.8
5.8 4.60.0 2.00.0 0.20.0 0.00.2 0.20.1 0.1
.. 6.8
Country data
High-income group
Population (millions) 11 Land area (1,000 sq. km) 30 GDP ($ billions) 504.2
Belgium

GNI per capita, World Bank Atlas method ($)Urban population (% of total)Urban population growth (average annual %, 1990–2008)Population growth (average annual %, 1990–2008) AgricultureAgricultural land (% of land area)Agricultural productivity (value added per worker, 2000 $)Food production index (1999–2001 = 100)Population density, rural (people/sq. km of arable land) Forests and biodiversityForest area (% of land area)Deforestation (average annual %, 1990–2007)Nationally protected area (% of land area)Threatened species, mammalsThreatened species, birdsThreatened species, fishThreatened species, higher plantsGEF benefits index for biodiversity (0–100, median is 1.5) EnergyGDP per unit of energy use (2005 PPP $/kg oil equivalent)Energy use per capita (kg oil equivalent)Energy from biomass products and waste (% of total)Electric power consumption per capita (kWh)Electricity generated using fossil fuel (% of total)Electricity generated by hydropower (% of total) Emissions and pollutionCO2 emissions per unit of GDP (kg/2005 PPP $)CO2 emissions per capita (metric tons)CO2 emissions growth (%, 1990–2006)Particulate matter (urban-pop.-weighted avg., μg/cu. m)Transport sector energy use per capita (kg of oil equivalent) Water and sanitationInternal freshwater resources per capita (cu. m)Freshwater withdrawal
Total (% of internal resources)Agriculture (% of total freshwater withdrawal)
Access to improved water source (% of total population)Rural (% of rural population)Urban (% of urban population)
Access to improved sanitation (% of total population)Rural (% of rural population)Urban (% of urban population)
Environment and healthAcute resp. infection prevalence (% of children under five)Diarrhea prevalence (% of children under five)Under-five mortality rate (per 1,000 live births) National accounting aggregatesGross savings (% of GNI)Consumption of fixed capital (% of GNI)Education expenditure (% of GNI)Energy depletion (% of GNI)Mineral depletion (% of GNI)Net forest depletion (% of GNI)CO2 damage (% of GNI)Particulate emissions damage (% of GNI)Adjusted net savings (% of GNI)
37The Little Green Data Book 2010
3,740 6,768 2,07352 79 413.4 2.0 3.03.0 1.5 1.4
7 36 504,732 3,452 589
112 125 123217 233 516
72.5 44.9 24.80.0 0.5 0.2
44.5 22.8 11.273
22301.7
.. 7.5 3.9
.. 1,273 1,013
.. 16.3 16.3
.. 1,866 1,310
.. 38.2 80.0
.. 55.8 15.2
0.4 0.3 0.82.7 2.6 2.8
162.4 40.0 105.715 35 69
.. 317 97
51,364 24,004 3,154
0.9 2.0 8.7.. 71 81
91 91 8682 73 81
100 97 9447 78 5225 51 4171 86 69
6.711.0
19 23 64
15.7 22.4 41.111.9 11.8 9.65.6 4.4 2.30.0 6.3 8.10.0 1.8 1.40.0 0.0 0.20.5 0.3 1.10.0 0.3 0.68.8 6.3 22.4
Country data
Latin America & Caribbean
group
Lower middle-income group
Population (thousands) 322 Land area (1,000 sq. km) 23 GDP ($ billions) 1.4
Belize

GNI per capita, World Bank Atlas method ($)Urban population (% of total)Urban population growth (average annual %, 1990–2008)Population growth (average annual %, 1990–2008) AgricultureAgricultural land (% of land area)Agricultural productivity (value added per worker, 2000 $)Food production index (1999–2001 = 100)Population density, rural (people/sq. km of arable land) Forests and biodiversityForest area (% of land area)Deforestation (average annual %, 1990–2007)Nationally protected area (% of land area)Threatened species, mammalsThreatened species, birdsThreatened species, fishThreatened species, higher plantsGEF benefits index for biodiversity (0–100, median is 1.5) EnergyGDP per unit of energy use (2005 PPP $/kg oil equivalent)Energy use per capita (kg oil equivalent)Energy from biomass products and waste (% of total)Electric power consumption per capita (kWh)Electricity generated using fossil fuel (% of total)Electricity generated by hydropower (% of total) Emissions and pollutionCO2 emissions per unit of GDP (kg/2005 PPP $)CO2 emissions per capita (metric tons)CO2 emissions growth (%, 1990–2006)Particulate matter (urban-pop.-weighted avg., μg/cu. m)Transport sector energy use per capita (kg of oil equivalent) Water and sanitationInternal freshwater resources per capita (cu. m)Freshwater withdrawal
Total (% of internal resources)Agriculture (% of total freshwater withdrawal)
Access to improved water source (% of total population)Rural (% of rural population)Urban (% of urban population)
Access to improved sanitation (% of total population)Rural (% of rural population)Urban (% of urban population)
Environment and healthAcute resp. infection prevalence (% of children under five)Diarrhea prevalence (% of children under five)Under-five mortality rate (per 1,000 live births) National accounting aggregatesGross savings (% of GNI)Consumption of fixed capital (% of GNI)Education expenditure (% of GNI)Energy depletion (% of GNI)Mineral depletion (% of GNI)Net forest depletion (% of GNI)CO2 damage (% of GNI)Particulate emissions damage (% of GNI)Adjusted net savings (% of GNI)
38 2010 The Little Green Data Book
700 1,077 52341 36 29
4.3 4.0 3.53.3 2.6 2.2
32 45 38661 330 318107 119 125184 353 666
20.1 26.1 24.72.3 0.7 0.7
23.2 12.4 11.9104
1514
0.2
3.9 3.2 3.2343 662 42361.5 55.8 49.3
72 550 32499.2 67.0 41.6
0.8 16.9 41.9
0.3 0.5 0.40.4 0.8 0.5
334.9 37.4 –6.046 53 6577 61 37
1,227 4,829 5,004
1.3 3.2 9.445 87 8865 58 6757 46 6078 81 8630 31 3811 24 3359 42 52
12.013.4121 144 118
.. 16.5 25.98.1 9.0 7.93.3 3.3 3.40.0 14.2 7.80.0 1.3 1.01.0 0.6 1.00.3 0.6 0.70.3 0.4 0.3
.. –6.2 10.7
Country data
Sub-Saharan Africa group
Low-income group
Population (millions) 8.7 Land area (1,000 sq. km) 111 GDP ($ billions) 6.7
Benin

GNI per capita, World Bank Atlas method ($)Urban population (% of total)Urban population growth (average annual %, 1990–2008)Population growth (average annual %, 1990–2008) AgricultureAgricultural land (% of land area)Agricultural productivity (value added per worker, 2000 $)Food production index (1999–2001 = 100)Population density, rural (people/sq. km of arable land) Forests and biodiversityForest area (% of land area)Deforestation (average annual %, 1990–2007)Nationally protected area (% of land area)Threatened species, mammalsThreatened species, birdsThreatened species, fishThreatened species, higher plantsGEF benefits index for biodiversity (0–100, median is 1.5) EnergyGDP per unit of energy use (2005 PPP $/kg oil equivalent)Energy use per capita (kg oil equivalent)Energy from biomass products and waste (% of total)Electric power consumption per capita (kWh)Electricity generated using fossil fuel (% of total)Electricity generated by hydropower (% of total) Emissions and pollutionCO2 emissions per unit of GDP (kg/2005 PPP $)CO2 emissions per capita (metric tons)CO2 emissions growth (%, 1990–2006)Particulate matter (urban-pop.-weighted avg., μg/cu. m)Transport sector energy use per capita (kg of oil equivalent) Water and sanitationInternal freshwater resources per capita (cu. m)Freshwater withdrawal
Total (% of internal resources)Agriculture (% of total freshwater withdrawal)
Access to improved water source (% of total population)Rural (% of rural population)Urban (% of urban population)
Access to improved sanitation (% of total population)Rural (% of rural population)Urban (% of urban population)
Environment and healthAcute resp. infection prevalence (% of children under five)Diarrhea prevalence (% of children under five)Under-five mortality rate (per 1,000 live births) National accounting aggregatesGross savings (% of GNI)Consumption of fixed capital (% of GNI)Education expenditure (% of GNI)Energy depletion (% of GNI)Mineral depletion (% of GNI)Net forest depletion (% of GNI)CO2 damage (% of GNI)Particulate emissions damage (% of GNI)Adjusted net savings (% of GNI)
39The Little Green Data Book 2010
.. 39,688100 780.3 1.00.3 0.7
20 38.. 28,475
96 1010 341
20.0 28.90.0 –0.1
14.4 19.141
124
1.2
.. 6.5
.. 5,321
.. 3.7
.. 9,753
.. 63.1
.. 11.1
.. 0.48.8 12.7
–5.5 18.0.. 26.. 1,166
.. 9,305
.. 10.4
.. 43
.. 100
.. 98
.. 100
.. 100
.. 99
.. 100
..
..
.. 7
.. 18.5
.. 13.8
.. 4.6
.. 2.0
.. 0.2
.. 0.0
.. 0.2
.. 0.1
.. 6.8
Country data
High-income group
Population (thousands) 64 Land area (sq. km) 50 GDP ($ billions) 5.9
Bermuda
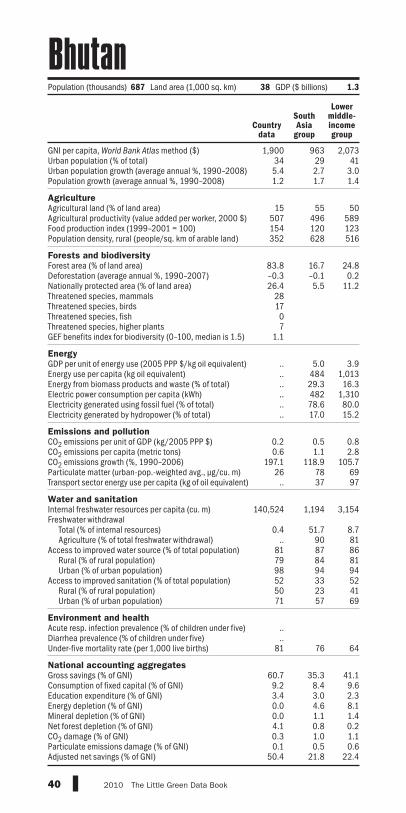
GNI per capita, World Bank Atlas method ($)Urban population (% of total)Urban population growth (average annual %, 1990–2008)Population growth (average annual %, 1990–2008) AgricultureAgricultural land (% of land area)Agricultural productivity (value added per worker, 2000 $)Food production index (1999–2001 = 100)Population density, rural (people/sq. km of arable land) Forests and biodiversityForest area (% of land area)Deforestation (average annual %, 1990–2007)Nationally protected area (% of land area)Threatened species, mammalsThreatened species, birdsThreatened species, fishThreatened species, higher plantsGEF benefits index for biodiversity (0–100, median is 1.5) EnergyGDP per unit of energy use (2005 PPP $/kg oil equivalent)Energy use per capita (kg oil equivalent)Energy from biomass products and waste (% of total)Electric power consumption per capita (kWh)Electricity generated using fossil fuel (% of total)Electricity generated by hydropower (% of total) Emissions and pollutionCO2 emissions per unit of GDP (kg/2005 PPP $)CO2 emissions per capita (metric tons)CO2 emissions growth (%, 1990–2006)Particulate matter (urban-pop.-weighted avg., μg/cu. m)Transport sector energy use per capita (kg of oil equivalent) Water and sanitationInternal freshwater resources per capita (cu. m)Freshwater withdrawal
Total (% of internal resources)Agriculture (% of total freshwater withdrawal)
Access to improved water source (% of total population)Rural (% of rural population)Urban (% of urban population)
Access to improved sanitation (% of total population)Rural (% of rural population)Urban (% of urban population)
Environment and healthAcute resp. infection prevalence (% of children under five)Diarrhea prevalence (% of children under five)Under-five mortality rate (per 1,000 live births) National accounting aggregatesGross savings (% of GNI)Consumption of fixed capital (% of GNI)Education expenditure (% of GNI)Energy depletion (% of GNI)Mineral depletion (% of GNI)Net forest depletion (% of GNI)CO2 damage (% of GNI)Particulate emissions damage (% of GNI)Adjusted net savings (% of GNI)
40 2010 The Little Green Data Book
1,900 963 2,07334 29 415.4 2.7 3.01.2 1.7 1.4
15 55 50507 496 589154 120 123352 628 516
83.8 16.7 24.8–0.3 –0.1 0.226.4 5.5 11.2
281707
1.1
.. 5.0 3.9
.. 484 1,013
.. 29.3 16.3
.. 482 1,310
.. 78.6 80.0
.. 17.0 15.2
0.2 0.5 0.80.6 1.1 2.8
197.1 118.9 105.726 78 69
.. 37 97
140,524 1,194 3,154
0.4 51.7 8.7.. 90 81
81 87 8679 84 8198 94 9452 33 5250 23 4171 57 69
..
..81 76 64
60.7 35.3 41.19.2 8.4 9.63.4 3.0 2.30.0 4.6 8.10.0 1.1 1.44.1 0.8 0.20.3 1.0 1.10.1 0.5 0.6
50.4 21.8 22.4
Country data
South Asia
group
Lower middle-income group
Population (thousands) 687 Land area (1,000 sq. km) 38 GDP ($ billions) 1.3
Bhutan

GNI per capita, World Bank Atlas method ($)Urban population (% of total)Urban population growth (average annual %, 1990–2008)Population growth (average annual %, 1990–2008) AgricultureAgricultural land (% of land area)Agricultural productivity (value added per worker, 2000 $)Food production index (1999–2001 = 100)Population density, rural (people/sq. km of arable land) Forests and biodiversityForest area (% of land area)Deforestation (average annual %, 1990–2007)Nationally protected area (% of land area)Threatened species, mammalsThreatened species, birdsThreatened species, fishThreatened species, higher plantsGEF benefits index for biodiversity (0–100, median is 1.5) EnergyGDP per unit of energy use (2005 PPP $/kg oil equivalent)Energy use per capita (kg oil equivalent)Energy from biomass products and waste (% of total)Electric power consumption per capita (kWh)Electricity generated using fossil fuel (% of total)Electricity generated by hydropower (% of total) Emissions and pollutionCO2 emissions per unit of GDP (kg/2005 PPP $)CO2 emissions per capita (metric tons)CO2 emissions growth (%, 1990–2006)Particulate matter (urban-pop.-weighted avg., μg/cu. m)Transport sector energy use per capita (kg of oil equivalent) Water and sanitationInternal freshwater resources per capita (cu. m)Freshwater withdrawal
Total (% of internal resources)Agriculture (% of total freshwater withdrawal)
Access to improved water source (% of total population)Rural (% of rural population)Urban (% of urban population)
Access to improved sanitation (% of total population)Rural (% of rural population)Urban (% of urban population)
Environment and healthAcute resp. infection prevalence (% of children under five)Diarrhea prevalence (% of children under five)Under-five mortality rate (per 1,000 live births) National accounting aggregatesGross savings (% of GNI)Consumption of fixed capital (% of GNI)Education expenditure (% of GNI)Energy depletion (% of GNI)Mineral depletion (% of GNI)Net forest depletion (% of GNI)CO2 damage (% of GNI)Particulate emissions damage (% of GNI)Adjusted net savings (% of GNI)
41The Little Green Data Book 2010
Population (millions) 9.7 Land area (1,000 sq. km) 1,083 GDP ($ billions) 16.7
Country data
Latin America & Caribbean
group
Lower middle-income group
1,460 6,768 2,07366 79 413.0 2.0 3.02.1 1.5 1.4
34 36 50721 3,452 589113 125 12392 233 516
53.7 44.9 24.80.4 0.5 0.2
21.2 22.8 11.21929
071
12.5
6.6 7.5 3.9571 1,273 1,013
14.5 16.3 16.3515 1,866 1,310
56.5 38.2 80.040.4 55.8 15.2
0.3 0.3 0.81.2 2.6 2.8
107.2 40.0 105.794 35 69
163 317 97
31,868 24,004 3,154
0.5 2.0 8.781 71 8186 91 8669 73 8196 97 9443 78 5222 51 4154 86 69
22.024.8
54 23 64
29.9 22.4 41.19.5 11.8 9.64.7 4.4 2.3
27.6 6.3 8.10.8 1.8 1.40.0 0.0 0.20.5 0.3 1.10.9 0.3 0.6
–4.7 6.3 22.4
Bolivia
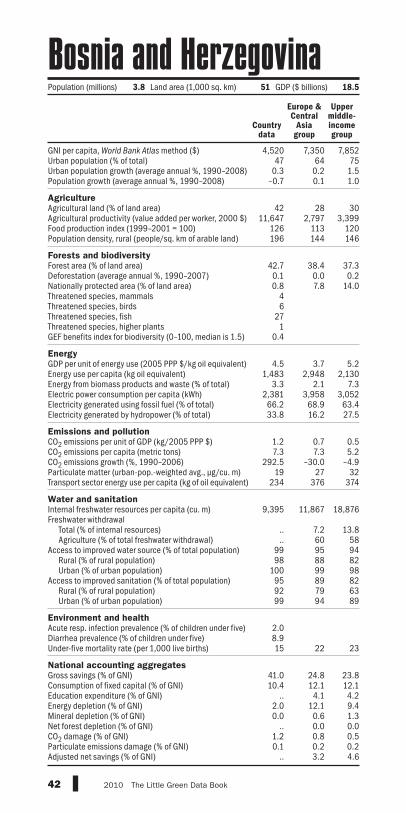
GNI per capita, World Bank Atlas method ($)Urban population (% of total)Urban population growth (average annual %, 1990–2008)Population growth (average annual %, 1990–2008) AgricultureAgricultural land (% of land area)Agricultural productivity (value added per worker, 2000 $)Food production index (1999–2001 = 100)Population density, rural (people/sq. km of arable land) Forests and biodiversityForest area (% of land area)Deforestation (average annual %, 1990–2007)Nationally protected area (% of land area)Threatened species, mammalsThreatened species, birdsThreatened species, fishThreatened species, higher plantsGEF benefits index for biodiversity (0–100, median is 1.5) EnergyGDP per unit of energy use (2005 PPP $/kg oil equivalent)Energy use per capita (kg oil equivalent)Energy from biomass products and waste (% of total)Electric power consumption per capita (kWh)Electricity generated using fossil fuel (% of total)Electricity generated by hydropower (% of total) Emissions and pollutionCO2 emissions per unit of GDP (kg/2005 PPP $)CO2 emissions per capita (metric tons)CO2 emissions growth (%, 1990–2006)Particulate matter (urban-pop.-weighted avg., μg/cu. m)Transport sector energy use per capita (kg of oil equivalent) Water and sanitationInternal freshwater resources per capita (cu. m)Freshwater withdrawal
Total (% of internal resources)Agriculture (% of total freshwater withdrawal)
Access to improved water source (% of total population)Rural (% of rural population)Urban (% of urban population)
Access to improved sanitation (% of total population)Rural (% of rural population)Urban (% of urban population)
Environment and healthAcute resp. infection prevalence (% of children under five)Diarrhea prevalence (% of children under five)Under-five mortality rate (per 1,000 live births) National accounting aggregatesGross savings (% of GNI)Consumption of fixed capital (% of GNI)Education expenditure (% of GNI)Energy depletion (% of GNI)Mineral depletion (% of GNI)Net forest depletion (% of GNI)CO2 damage (% of GNI)Particulate emissions damage (% of GNI)Adjusted net savings (% of GNI)
42 2010 The Little Green Data Book
4,520 7,350 7,85247 64 75
0.3 0.2 1.5–0.7 0.1 1.0
42 28 3011,647 2,797 3,399
126 113 120196 144 146
42.7 38.4 37.30.1 0.0 0.20.8 7.8 14.0
46
271
0.4
4.5 3.7 5.21,483 2,948 2,130
3.3 2.1 7.32,381 3,958 3,05266.2 68.9 63.433.8 16.2 27.5
1.2 0.7 0.57.3 7.3 5.2
292.5 –30.0 –4.919 27 32
234 376 374
9,395 11,867 18,876
.. 7.2 13.8
.. 60 5899 95 9498 88 82
100 99 9895 89 8292 79 6399 94 89
2.08.915 22 23
41.0 24.8 23.810.4 12.1 12.1
.. 4.1 4.22.0 12.1 9.40.0 0.6 1.3
.. 0.0 0.01.2 0.8 0.50.1 0.2 0.2
.. 3.2 4.6
Country data
Europe & Central
Asia group
Upper middle-income group
Population (millions) 3.8 Land area (1,000 sq. km) 51 GDP ($ billions) 18.5
Bosnia and Herzegovina

GNI per capita, World Bank Atlas method ($)Urban population (% of total)Urban population growth (average annual %, 1990–2008)Population growth (average annual %, 1990–2008) AgricultureAgricultural land (% of land area)Agricultural productivity (value added per worker, 2000 $)Food production index (1999–2001 = 100)Population density, rural (people/sq. km of arable land) Forests and biodiversityForest area (% of land area)Deforestation (average annual %, 1990–2007)Nationally protected area (% of land area)Threatened species, mammalsThreatened species, birdsThreatened species, fishThreatened species, higher plantsGEF benefits index for biodiversity (0–100, median is 1.5) EnergyGDP per unit of energy use (2005 PPP $/kg oil equivalent)Energy use per capita (kg oil equivalent)Energy from biomass products and waste (% of total)Electric power consumption per capita (kWh)Electricity generated using fossil fuel (% of total)Electricity generated by hydropower (% of total) Emissions and pollutionCO2 emissions per unit of GDP (kg/2005 PPP $)CO2 emissions per capita (metric tons)CO2 emissions growth (%, 1990–2006)Particulate matter (urban-pop.-weighted avg., μg/cu. m)Transport sector energy use per capita (kg of oil equivalent) Water and sanitationInternal freshwater resources per capita (cu. m)Freshwater withdrawal
Total (% of internal resources)Agriculture (% of total freshwater withdrawal)
Access to improved water source (% of total population)Rural (% of rural population)Urban (% of urban population)
Access to improved sanitation (% of total population)Rural (% of rural population)Urban (% of urban population)
Environment and healthAcute resp. infection prevalence (% of children under five)Diarrhea prevalence (% of children under five)Under-five mortality rate (per 1,000 live births) National accounting aggregatesGross savings (% of GNI)Consumption of fixed capital (% of GNI)Education expenditure (% of GNI)Energy depletion (% of GNI)Mineral depletion (% of GNI)Net forest depletion (% of GNI)CO2 damage (% of GNI)Particulate emissions damage (% of GNI)Adjusted net savings (% of GNI)
43The Little Green Data Book 2010
6,640 1,077 7,85260 36 753.9 4.0 1.52.0 2.6 1.0
46 45 30469 330 3,399111 119 120312 353 146
20.7 26.1 37.30.9 0.7 0.2
30.1 12.4 14.06720
1.4
11.6 3.2 5.21,068 662 2,130
23.1 55.8 7.31,435 550 3,052100.0 67.0 63.4
0.0 16.9 27.5
0.2 0.5 0.52.6 0.8 5.2
119.8 37.4 –4.967 53 32
286 61 374
1,268 4,829 18,876
8.1 3.2 13.841 87 5896 58 9490 46 82
100 81 9847 31 8230 24 6360 42 89
40.06.531 144 23
46.3 16.5 23.811.5 9.0 12.16.6 3.3 4.20.5 14.2 9.43.2 1.3 1.30.0 0.6 0.00.3 0.6 0.50.2 0.4 0.2
37.2 –6.2 4.6
Country data
Sub-Saharan Africa group
Upper middle-income group
Population (millions) 1.9 Land area (1,000 sq. km) 567 GDP ($ billions) 13.4
Botswana

GNI per capita, World Bank Atlas method ($)Urban population (% of total)Urban population growth (average annual %, 1990–2008)Population growth (average annual %, 1990–2008) AgricultureAgricultural land (% of land area)Agricultural productivity (value added per worker, 2000 $)Food production index (1999–2001 = 100)Population density, rural (people/sq. km of arable land) Forests and biodiversityForest area (% of land area)Deforestation (average annual %, 1990–2007)Nationally protected area (% of land area)Threatened species, mammalsThreatened species, birdsThreatened species, fishThreatened species, higher plantsGEF benefits index for biodiversity (0–100, median is 1.5) EnergyGDP per unit of energy use (2005 PPP $/kg oil equivalent)Energy use per capita (kg oil equivalent)Energy from biomass products and waste (% of total)Electric power consumption per capita (kWh)Electricity generated using fossil fuel (% of total)Electricity generated by hydropower (% of total) Emissions and pollutionCO2 emissions per unit of GDP (kg/2005 PPP $)CO2 emissions per capita (metric tons)CO2 emissions growth (%, 1990–2006)Particulate matter (urban-pop.-weighted avg., μg/cu. m)Transport sector energy use per capita (kg of oil equivalent) Water and sanitationInternal freshwater resources per capita (cu. m)Freshwater withdrawal
Total (% of internal resources)Agriculture (% of total freshwater withdrawal)
Access to improved water source (% of total population)Rural (% of rural population)Urban (% of urban population)
Access to improved sanitation (% of total population)Rural (% of rural population)Urban (% of urban population)
Environment and healthAcute resp. infection prevalence (% of children under five)Diarrhea prevalence (% of children under five)Under-five mortality rate (per 1,000 live births) National accounting aggregatesGross savings (% of GNI)Consumption of fixed capital (% of GNI)Education expenditure (% of GNI)Energy depletion (% of GNI)Mineral depletion (% of GNI)Net forest depletion (% of GNI)CO2 damage (% of GNI)Particulate emissions damage (% of GNI)Adjusted net savings (% of GNI)
44 2010 The Little Green Data Book
7,300 6,768 7,85286 79 752.1 2.0 1.51.4 1.5 1.0
31 36 303,563 3,452 3,399
131 125 12048 233 146
55.7 44.9 37.30.6 0.5 0.2
29.6 22.8 14.082
12264
382100.0
7.4 7.5 5.21,239 1,273 2,130
30.7 16.3 7.32,171 1,866 3,052
8.8 38.2 63.484.0 55.8 27.5
0.2 0.3 0.51.9 2.6 5.2
68.8 40.0 –4.923 35 32
307 317 374
28,498 24,004 18,876
1.1 2.0 13.862 71 5891 91 9458 73 8297 97 9877 78 8237 51 6384 86 89
24.013.1
22 23 23
17.5 22.4 23.811.8 11.8 12.14.8 4.4 4.22.7 6.3 9.42.3 1.8 1.30.0 0.0 0.00.2 0.3 0.50.1 0.3 0.25.2 6.3 4.6
Country data
Latin America & Caribbean
group
Upper middle-income group
Population (millions) 192 Land area (1,000 sq. km) 8,459 GDP ($ billions) 1,575.2
Brazil
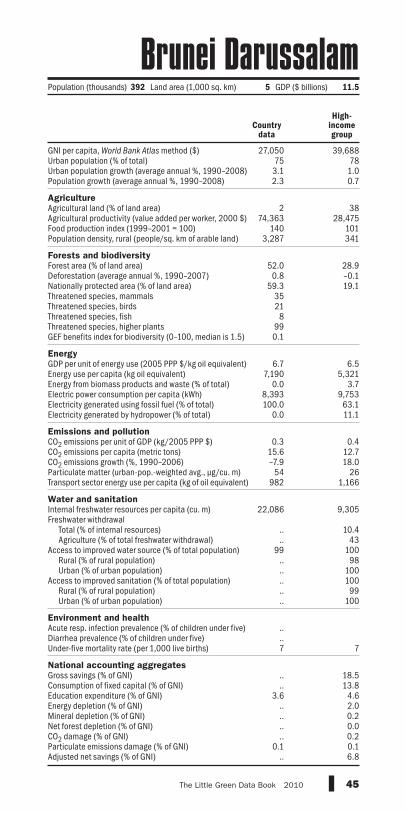
GNI per capita, World Bank Atlas method ($)Urban population (% of total)Urban population growth (average annual %, 1990–2008)Population growth (average annual %, 1990–2008) AgricultureAgricultural land (% of land area)Agricultural productivity (value added per worker, 2000 $)Food production index (1999–2001 = 100)Population density, rural (people/sq. km of arable land) Forests and biodiversityForest area (% of land area)Deforestation (average annual %, 1990–2007)Nationally protected area (% of land area)Threatened species, mammalsThreatened species, birdsThreatened species, fishThreatened species, higher plantsGEF benefits index for biodiversity (0–100, median is 1.5) EnergyGDP per unit of energy use (2005 PPP $/kg oil equivalent)Energy use per capita (kg oil equivalent)Energy from biomass products and waste (% of total)Electric power consumption per capita (kWh)Electricity generated using fossil fuel (% of total)Electricity generated by hydropower (% of total) Emissions and pollutionCO2 emissions per unit of GDP (kg/2005 PPP $)CO2 emissions per capita (metric tons)CO2 emissions growth (%, 1990–2006)Particulate matter (urban-pop.-weighted avg., μg/cu. m)Transport sector energy use per capita (kg of oil equivalent) Water and sanitationInternal freshwater resources per capita (cu. m)Freshwater withdrawal
Total (% of internal resources)Agriculture (% of total freshwater withdrawal)
Access to improved water source (% of total population)Rural (% of rural population)Urban (% of urban population)
Access to improved sanitation (% of total population)Rural (% of rural population)Urban (% of urban population)
Environment and healthAcute resp. infection prevalence (% of children under five)Diarrhea prevalence (% of children under five)Under-five mortality rate (per 1,000 live births) National accounting aggregatesGross savings (% of GNI)Consumption of fixed capital (% of GNI)Education expenditure (% of GNI)Energy depletion (% of GNI)Mineral depletion (% of GNI)Net forest depletion (% of GNI)CO2 damage (% of GNI)Particulate emissions damage (% of GNI)Adjusted net savings (% of GNI)
45The Little Green Data Book 2010
27,050 39,68875 783.1 1.02.3 0.7
2 3874,363 28,475
140 1013,287 341
52.0 28.90.8 –0.1
59.3 19.135218
990.1
6.7 6.57,190 5,321
0.0 3.78,393 9,753100.0 63.1
0.0 11.1
0.3 0.415.6 12.7–7.9 18.0
54 26982 1,166
22,086 9,305
.. 10.4
.. 4399 100
.. 98
.. 100
.. 100
.. 99
.. 100
..
..7 7
.. 18.5
.. 13.83.6 4.6
.. 2.0
.. 0.2
.. 0.0
.. 0.20.1 0.1
.. 6.8
Country data
High-income group
Population (thousands) 392 Land area (1,000 sq. km) 5 GDP ($ billions) 11.5
Brunei Darussalam

GNI per capita, World Bank Atlas method ($)Urban population (% of total)Urban population growth (average annual %, 1990–2008)Population growth (average annual %, 1990–2008) AgricultureAgricultural land (% of land area)Agricultural productivity (value added per worker, 2000 $)Food production index (1999–2001 = 100)Population density, rural (people/sq. km of arable land) Forests and biodiversityForest area (% of land area)Deforestation (average annual %, 1990–2007)Nationally protected area (% of land area)Threatened species, mammalsThreatened species, birdsThreatened species, fishThreatened species, higher plantsGEF benefits index for biodiversity (0–100, median is 1.5) EnergyGDP per unit of energy use (2005 PPP $/kg oil equivalent)Energy use per capita (kg oil equivalent)Energy from biomass products and waste (% of total)Electric power consumption per capita (kWh)Electricity generated using fossil fuel (% of total)Electricity generated by hydropower (% of total) Emissions and pollutionCO2 emissions per unit of GDP (kg/2005 PPP $)CO2 emissions per capita (metric tons)CO2 emissions growth (%, 1990–2006)Particulate matter (urban-pop.-weighted avg., μg/cu. m)Transport sector energy use per capita (kg of oil equivalent) Water and sanitationInternal freshwater resources per capita (cu. m)Freshwater withdrawal
Total (% of internal resources)Agriculture (% of total freshwater withdrawal)
Access to improved water source (% of total population)Rural (% of rural population)Urban (% of urban population)
Access to improved sanitation (% of total population)Rural (% of rural population)Urban (% of urban population)
Environment and healthAcute resp. infection prevalence (% of children under five)Diarrhea prevalence (% of children under five)Under-five mortality rate (per 1,000 live births) National accounting aggregatesGross savings (% of GNI)Consumption of fixed capital (% of GNI)Education expenditure (% of GNI)Energy depletion (% of GNI)Mineral depletion (% of GNI)Net forest depletion (% of GNI)CO2 damage (% of GNI)Particulate emissions damage (% of GNI)Adjusted net savings (% of GNI)
46 2010 The Little Green Data Book
5,490 7,350 7,85271 64 75
–0.4 0.2 1.5–0.7 0.1 1.0
47 28 306,806 2,797 3,399
72 113 12072 144 146
34.3 38.4 37.3–0.7 0.0 0.210.1 7.8 14.0
712170
0.8
3.8 3.7 5.22,641 2,948 2,130
3.7 2.1 7.34,456 3,958 3,052
59.1 68.9 63.46.7 16.2 27.5
0.7 0.7 0.56.2 7.3 5.2
–37.3 –30.0 –4.957 27 32
362 376 374
2,742 11,867 18,876
50.0 7.2 13.819 60 5899 95 9497 88 82
100 99 9899 89 8296 79 63
100 94 89
..
..11 22 23
14.1 24.8 23.811.6 12.1 12.14.1 4.1 4.21.1 12.1 9.40.8 0.6 1.30.0 0.0 0.00.9 0.8 0.50.9 0.2 0.22.9 3.2 4.6
Country data
Europe & Central
Asia group
Upper middle-income group
Population (millions) 7.6 Land area (1,000 sq. km) 109 GDP ($ billions) 49.9
Bulgaria

GNI per capita, World Bank Atlas method ($)Urban population (% of total)Urban population growth (average annual %, 1990–2008)Population growth (average annual %, 1990–2008) AgricultureAgricultural land (% of land area)Agricultural productivity (value added per worker, 2000 $)Food production index (1999–2001 = 100)Population density, rural (people/sq. km of arable land) Forests and biodiversityForest area (% of land area)Deforestation (average annual %, 1990–2007)Nationally protected area (% of land area)Threatened species, mammalsThreatened species, birdsThreatened species, fishThreatened species, higher plantsGEF benefits index for biodiversity (0–100, median is 1.5) EnergyGDP per unit of energy use (2005 PPP $/kg oil equivalent)Energy use per capita (kg oil equivalent)Energy from biomass products and waste (% of total)Electric power consumption per capita (kWh)Electricity generated using fossil fuel (% of total)Electricity generated by hydropower (% of total) Emissions and pollutionCO2 emissions per unit of GDP (kg/2005 PPP $)CO2 emissions per capita (metric tons)CO2 emissions growth (%, 1990–2006)Particulate matter (urban-pop.-weighted avg., μg/cu. m)Transport sector energy use per capita (kg of oil equivalent) Water and sanitationInternal freshwater resources per capita (cu. m)Freshwater withdrawal
Total (% of internal resources)Agriculture (% of total freshwater withdrawal)
Access to improved water source (% of total population)Rural (% of rural population)Urban (% of urban population)
Access to improved sanitation (% of total population)Rural (% of rural population)Urban (% of urban population)
Environment and healthAcute resp. infection prevalence (% of children under five)Diarrhea prevalence (% of children under five)Under-five mortality rate (per 1,000 live births) National accounting aggregatesGross savings (% of GNI)Consumption of fixed capital (% of GNI)Education expenditure (% of GNI)Energy depletion (% of GNI)Mineral depletion (% of GNI)Net forest depletion (% of GNI)CO2 damage (% of GNI)Particulate emissions damage (% of GNI)Adjusted net savings (% of GNI)
47The Little Green Data Book 2010
480 1,077 52320 36 295.0 4.0 3.53.0 2.6 2.2
41 45 38181 330 318123 119 125229 353 666
24.7 26.1 24.70.3 0.7 0.7
14.4 12.4 11.98502
0.3
.. 3.2 3.2
.. 662 423
.. 55.8 49.3
.. 550 324
.. 67.0 41.6
.. 16.9 41.9
0.05 0.46 0.380.06 0.82 0.5134.4 37.4 –6.0
84 53 65.. 61 37
849 4,829 5,004
6.4 3.2 9.486 87 8872 58 6766 46 6097 81 8613 31 38
6 24 3341 42 52
9.020.0169 144 118
.. 16.5 25.97.5 9.0 7.93.3 3.3 3.40.0 14.2 7.80.0 1.3 1.01.2 0.6 1.00.1 0.6 0.70.6 0.4 0.3
.. –6.2 10.7
Country data
Sub-Saharan Africa group
Low-income group
Population (millions) 15 Land area (1,000 sq. km) 274 GDP ($ billions) 7.9
Burkina Faso

GNI per capita, World Bank Atlas method ($)Urban population (% of total)Urban population growth (average annual %, 1990–2008)Population growth (average annual %, 1990–2008) AgricultureAgricultural land (% of land area)Agricultural productivity (value added per worker, 2000 $)Food production index (1999–2001 = 100)Population density, rural (people/sq. km of arable land) Forests and biodiversityForest area (% of land area)Deforestation (average annual %, 1990–2007)Nationally protected area (% of land area)Threatened species, mammalsThreatened species, birdsThreatened species, fishThreatened species, higher plantsGEF benefits index for biodiversity (0–100, median is 1.5) EnergyGDP per unit of energy use (2005 PPP $/kg oil equivalent)Energy use per capita (kg oil equivalent)Energy from biomass products and waste (% of total)Electric power consumption per capita (kWh)Electricity generated using fossil fuel (% of total)Electricity generated by hydropower (% of total) Emissions and pollutionCO2 emissions per unit of GDP (kg/2005 PPP $)CO2 emissions per capita (metric tons)CO2 emissions growth (%, 1990–2006)Particulate matter (urban-pop.-weighted avg., μg/cu. m)Transport sector energy use per capita (kg of oil equivalent) Water and sanitationInternal freshwater resources per capita (cu. m)Freshwater withdrawal
Total (% of internal resources)Agriculture (% of total freshwater withdrawal)
Access to improved water source (% of total population)Rural (% of rural population)Urban (% of urban population)
Access to improved sanitation (% of total population)Rural (% of rural population)Urban (% of urban population)
Environment and healthAcute resp. infection prevalence (% of children under five)Diarrhea prevalence (% of children under five)Under-five mortality rate (per 1,000 live births) National accounting aggregatesGross savings (% of GNI)Consumption of fixed capital (% of GNI)Education expenditure (% of GNI)Energy depletion (% of GNI)Mineral depletion (% of GNI)Net forest depletion (% of GNI)CO2 damage (% of GNI)Particulate emissions damage (% of GNI)Adjusted net savings (% of GNI)
48 2010 The Little Green Data Book
Country data
Sub-Saharan Africa group
Low-income group
140 1,077 52310 36 294.7 4.0 3.52.0 2.6 2.2
89 45 3870 330 318
101 119 125708 353 666
5.2 26.1 24.74.4 0.7 0.75.6 12.4 11.9
98
182
0.3
.. 3.2 3.2
.. 662 423
.. 55.8 49.3
.. 550 324
.. 67.0 41.6
.. 16.9 41.9
0.07 0.46 0.380.03 0.82 0.51
–34.9 37.4 –6.029 53 65
.. 61 37
1,283 4,829 5,004
2.9 3.2 9.477 87 8871 58 6770 46 6084 81 8641 31 3841 24 3344 42 52
13.0..
168 144 118
.. 16.5 25.95.6 9.0 7.95.1 3.3 3.40.0 14.2 7.80.6 1.3 1.0
10.9 0.6 1.00.1 0.6 0.70.1 0.4 0.3
.. –6.2 10.7
Population (millions) 8.1 Land area (1,000 sq. km) 26 GDP ($ billions) 1.2
Burundi

GNI per capita, World Bank Atlas method ($)Urban population (% of total)Urban population growth (average annual %, 1990–2008)Population growth (average annual %, 1990–2008) AgricultureAgricultural land (% of land area)Agricultural productivity (value added per worker, 2000 $)Food production index (1999–2001 = 100)Population density, rural (people/sq. km of arable land) Forests and biodiversityForest area (% of land area)Deforestation (average annual %, 1990–2007)Nationally protected area (% of land area)Threatened species, mammalsThreatened species, birdsThreatened species, fishThreatened species, higher plantsGEF benefits index for biodiversity (0–100, median is 1.5) EnergyGDP per unit of energy use (2005 PPP $/kg oil equivalent)Energy use per capita (kg oil equivalent)Energy from biomass products and waste (% of total)Electric power consumption per capita (kWh)Electricity generated using fossil fuel (% of total)Electricity generated by hydropower (% of total) Emissions and pollutionCO2 emissions per unit of GDP (kg/2005 PPP $)CO2 emissions per capita (metric tons)CO2 emissions growth (%, 1990–2006)Particulate matter (urban-pop.-weighted avg., μg/cu. m)Transport sector energy use per capita (kg of oil equivalent) Water and sanitationInternal freshwater resources per capita (cu. m)Freshwater withdrawal
Total (% of internal resources)Agriculture (% of total freshwater withdrawal)
Access to improved water source (% of total population)Rural (% of rural population)Urban (% of urban population)
Access to improved sanitation (% of total population)Rural (% of rural population)Urban (% of urban population)
Environment and healthAcute resp. infection prevalence (% of children under five)Diarrhea prevalence (% of children under five)Under-five mortality rate (per 1,000 live births) National accounting aggregatesGross savings (% of GNI)Consumption of fixed capital (% of GNI)Education expenditure (% of GNI)Energy depletion (% of GNI)Mineral depletion (% of GNI)Net forest depletion (% of GNI)CO2 damage (% of GNI)Particulate emissions damage (% of GNI)Adjusted net savings (% of GNI)
49The Little Green Data Book 2010
640 2,644 52322 44 29
5.2 3.4 3.52.3 1.0 2.2
31 50 38375 509 318165 127 125298 552 666
56.7 28.5 24.71.5 0.1 0.7
24.0 14.7 11.937251831
3.5
4.8 3.6 3.2358 1,295 42370.5 12.8 49.3
94 1,883 32495.9 82.2 41.6
3.7 14.7 41.9
0.2 0.9 0.40.3 3.8 0.5
803.3 135.9 –6.046 69 6527 113 37
8,417 4,940 5,004
3.4 10.2 9.498 74 8865 87 6761 81 6080 96 8628 66 3819 59 3362 75 52
20.018.9
90 29 118
.. 47.3 25.98.3 10.1 7.91.7 2.0 3.40.0 7.2 7.80.0 1.5 1.00.2 0.0 1.00.4 1.1 0.70.3 0.7 0.3
.. 28.6 10.7
Country data
East Asia & Pacific
group
Low-income group
Population (millions) 15 Land area (1,000 sq. km) 177 GDP ($ billions) 10.4
Cambodia
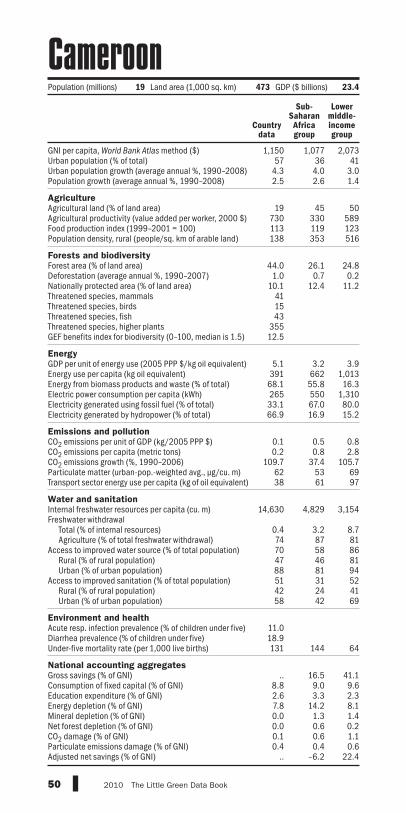
GNI per capita, World Bank Atlas method ($)Urban population (% of total)Urban population growth (average annual %, 1990–2008)Population growth (average annual %, 1990–2008) AgricultureAgricultural land (% of land area)Agricultural productivity (value added per worker, 2000 $)Food production index (1999–2001 = 100)Population density, rural (people/sq. km of arable land) Forests and biodiversityForest area (% of land area)Deforestation (average annual %, 1990–2007)Nationally protected area (% of land area)Threatened species, mammalsThreatened species, birdsThreatened species, fishThreatened species, higher plantsGEF benefits index for biodiversity (0–100, median is 1.5) EnergyGDP per unit of energy use (2005 PPP $/kg oil equivalent)Energy use per capita (kg oil equivalent)Energy from biomass products and waste (% of total)Electric power consumption per capita (kWh)Electricity generated using fossil fuel (% of total)Electricity generated by hydropower (% of total) Emissions and pollutionCO2 emissions per unit of GDP (kg/2005 PPP $)CO2 emissions per capita (metric tons)CO2 emissions growth (%, 1990–2006)Particulate matter (urban-pop.-weighted avg., μg/cu. m)Transport sector energy use per capita (kg of oil equivalent) Water and sanitationInternal freshwater resources per capita (cu. m)Freshwater withdrawal
Total (% of internal resources)Agriculture (% of total freshwater withdrawal)
Access to improved water source (% of total population)Rural (% of rural population)Urban (% of urban population)
Access to improved sanitation (% of total population)Rural (% of rural population)Urban (% of urban population)
Environment and healthAcute resp. infection prevalence (% of children under five)Diarrhea prevalence (% of children under five)Under-five mortality rate (per 1,000 live births) National accounting aggregatesGross savings (% of GNI)Consumption of fixed capital (% of GNI)Education expenditure (% of GNI)Energy depletion (% of GNI)Mineral depletion (% of GNI)Net forest depletion (% of GNI)CO2 damage (% of GNI)Particulate emissions damage (% of GNI)Adjusted net savings (% of GNI)
50 2010 The Little Green Data Book
1,150 1,077 2,07357 36 41
4.3 4.0 3.02.5 2.6 1.4
19 45 50730 330 589113 119 123138 353 516
44.0 26.1 24.81.0 0.7 0.2
10.1 12.4 11.2411543
35512.5
5.1 3.2 3.9391 662 1,013
68.1 55.8 16.3265 550 1,31033.1 67.0 80.066.9 16.9 15.2
0.1 0.5 0.80.2 0.8 2.8
109.7 37.4 105.762 53 6938 61 97
14,630 4,829 3,154
0.4 3.2 8.774 87 8170 58 8647 46 8188 81 9451 31 5242 24 4158 42 69
11.018.9131 144 64
.. 16.5 41.18.8 9.0 9.62.6 3.3 2.37.8 14.2 8.10.0 1.3 1.40.0 0.6 0.20.1 0.6 1.10.4 0.4 0.6
.. –6.2 22.4
Country data
Sub-Saharan Africa group
Lower middle-income group
Population (millions) 19 Land area (1,000 sq. km) 473 GDP ($ billions) 23.4
Cameroon

GNI per capita, World Bank Atlas method ($)Urban population (% of total)Urban population growth (average annual %, 1990–2008)Population growth (average annual %, 1990–2008) AgricultureAgricultural land (% of land area)Agricultural productivity (value added per worker, 2000 $)Food production index (1999–2001 = 100)Population density, rural (people/sq. km of arable land) Forests and biodiversityForest area (% of land area)Deforestation (average annual %, 1990–2007)Nationally protected area (% of land area)Threatened species, mammalsThreatened species, birdsThreatened species, fishThreatened species, higher plantsGEF benefits index for biodiversity (0–100, median is 1.5) EnergyGDP per unit of energy use (2005 PPP $/kg oil equivalent)Energy use per capita (kg oil equivalent)Energy from biomass products and waste (% of total)Electric power consumption per capita (kWh)Electricity generated using fossil fuel (% of total)Electricity generated by hydropower (% of total) Emissions and pollutionCO2 emissions per unit of GDP (kg/2005 PPP $)CO2 emissions per capita (metric tons)CO2 emissions growth (%, 1990–2006)Particulate matter (urban-pop.-weighted avg., μg/cu. m)Transport sector energy use per capita (kg of oil equivalent) Water and sanitationInternal freshwater resources per capita (cu. m)Freshwater withdrawal
Total (% of internal resources)Agriculture (% of total freshwater withdrawal)
Access to improved water source (% of total population)Rural (% of rural population)Urban (% of urban population)
Access to improved sanitation (% of total population)Rural (% of rural population)Urban (% of urban population)
Environment and healthAcute resp. infection prevalence (% of children under five)Diarrhea prevalence (% of children under five)Under-five mortality rate (per 1,000 live births) National accounting aggregatesGross savings (% of GNI)Consumption of fixed capital (% of GNI)Education expenditure (% of GNI)Energy depletion (% of GNI)Mineral depletion (% of GNI)Net forest depletion (% of GNI)CO2 damage (% of GNI)Particulate emissions damage (% of GNI)Adjusted net savings (% of GNI)
51The Little Green Data Book 2010
43,640 39,68880 781.3 1.01.0 0.7
7 3846,028 28,475
106 10114 341
34.1 28.90.0 –0.18.2 19.1121626
221.5
4.4 6.58,169 5,321
4.3 3.716,995 9,753
26.0 63.157.6 11.1
0.5 0.416.7 12.721.0 18.0
17 261,754 1,166
86,426 9,305
1.6 10.412 43
100 10099 98
100 100100 10099 99
100 100
..
..6 7
23.4 18.514.0 13.84.8 4.65.5 2.00.6 0.20.0 0.00.3 0.20.1 0.17.6 6.8
Country data
High-income group
Population (millions) 33 Land area (1,000 sq. km) 9,094 GDP ($ billions) 1,501.3
Canada

GNI per capita, World Bank Atlas method ($)Urban population (% of total)Urban population growth (average annual %, 1990–2008)Population growth (average annual %, 1990–2008) AgricultureAgricultural land (% of land area)Agricultural productivity (value added per worker, 2000 $)Food production index (1999–2001 = 100)Population density, rural (people/sq. km of arable land) Forests and biodiversityForest area (% of land area)Deforestation (average annual %, 1990–2007)Nationally protected area (% of land area)Threatened species, mammalsThreatened species, birdsThreatened species, fishThreatened species, higher plantsGEF benefits index for biodiversity (0–100, median is 1.5) EnergyGDP per unit of energy use (2005 PPP $/kg oil equivalent)Energy use per capita (kg oil equivalent)Energy from biomass products and waste (% of total)Electric power consumption per capita (kWh)Electricity generated using fossil fuel (% of total)Electricity generated by hydropower (% of total) Emissions and pollutionCO2 emissions per unit of GDP (kg/2005 PPP $)CO2 emissions per capita (metric tons)CO2 emissions growth (%, 1990–2006)Particulate matter (urban-pop.-weighted avg., μg/cu. m)Transport sector energy use per capita (kg of oil equivalent) Water and sanitationInternal freshwater resources per capita (cu. m)Freshwater withdrawal
Total (% of internal resources)Agriculture (% of total freshwater withdrawal)
Access to improved water source (% of total population)Rural (% of rural population)Urban (% of urban population)
Access to improved sanitation (% of total population)Rural (% of rural population)Urban (% of urban population)
Environment and healthAcute resp. infection prevalence (% of children under five)Diarrhea prevalence (% of children under five)Under-five mortality rate (per 1,000 live births) National accounting aggregatesGross savings (% of GNI)Consumption of fixed capital (% of GNI)Education expenditure (% of GNI)Energy depletion (% of GNI)Mineral depletion (% of GNI)Net forest depletion (% of GNI)CO2 damage (% of GNI)Particulate emissions damage (% of GNI)Adjusted net savings (% of GNI)
52 2010 The Little Green Data Book
2,800 1,077 2,07360 36 413.6 4.0 3.01.9 2.6 1.4
19 45 501,986 330 589
118 119 123404 353 516
21.0 26.1 24.8–2.3 0.7 0.20.0 12.4 11.2
34
182
2.4
.. 3.2 3.9
.. 662 1,013
.. 55.8 16.3
.. 550 1,310
.. 67.0 80.0
.. 16.9 15.2
0.2 0.5 0.80.6 0.8 2.8
250.0 37.4 105.7.. 53 69.. 61 97
610 4,829 3,154
.. 3.2 8.7
.. 87 81
.. 58 86
.. 46 81
.. 81 94
.. 31 52
.. 24 41
.. 42 69
..
..29 144 64
26.0 16.5 41.110.5 9.0 9.65.0 3.3 2.30.0 14.2 8.10.0 1.3 1.40.0 0.6 0.20.2 0.6 1.1
.. 0.4 0.6
.. –6.2 22.4
Population (thousands) 499 Land area (1,000 sq. km) 4 GDP ($ billions) 1.6
Country data
Sub-Saharan Africa group
Lower middle-income group
Cape Verde
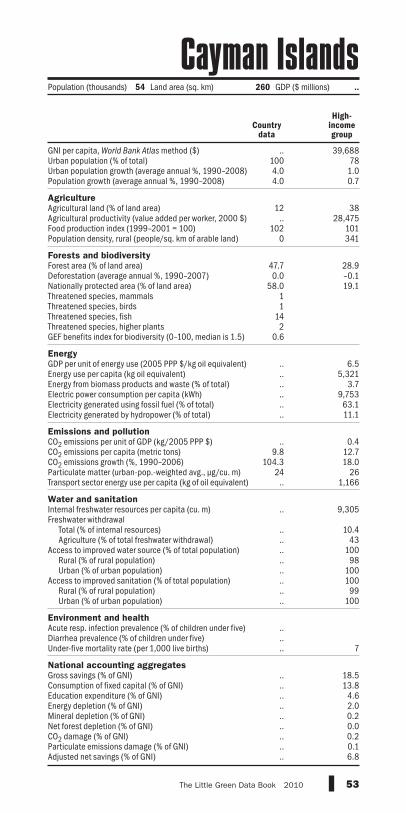
GNI per capita, World Bank Atlas method ($)Urban population (% of total)Urban population growth (average annual %, 1990–2008)Population growth (average annual %, 1990–2008) AgricultureAgricultural land (% of land area)Agricultural productivity (value added per worker, 2000 $)Food production index (1999–2001 = 100)Population density, rural (people/sq. km of arable land) Forests and biodiversityForest area (% of land area)Deforestation (average annual %, 1990–2007)Nationally protected area (% of land area)Threatened species, mammalsThreatened species, birdsThreatened species, fishThreatened species, higher plantsGEF benefits index for biodiversity (0–100, median is 1.5) EnergyGDP per unit of energy use (2005 PPP $/kg oil equivalent)Energy use per capita (kg oil equivalent)Energy from biomass products and waste (% of total)Electric power consumption per capita (kWh)Electricity generated using fossil fuel (% of total)Electricity generated by hydropower (% of total) Emissions and pollutionCO2 emissions per unit of GDP (kg/2005 PPP $)CO2 emissions per capita (metric tons)CO2 emissions growth (%, 1990–2006)Particulate matter (urban-pop.-weighted avg., μg/cu. m)Transport sector energy use per capita (kg of oil equivalent) Water and sanitationInternal freshwater resources per capita (cu. m)Freshwater withdrawal
Total (% of internal resources)Agriculture (% of total freshwater withdrawal)
Access to improved water source (% of total population)Rural (% of rural population)Urban (% of urban population)
Access to improved sanitation (% of total population)Rural (% of rural population)Urban (% of urban population)
Environment and healthAcute resp. infection prevalence (% of children under five)Diarrhea prevalence (% of children under five)Under-five mortality rate (per 1,000 live births) National accounting aggregatesGross savings (% of GNI)Consumption of fixed capital (% of GNI)Education expenditure (% of GNI)Energy depletion (% of GNI)Mineral depletion (% of GNI)Net forest depletion (% of GNI)CO2 damage (% of GNI)Particulate emissions damage (% of GNI)Adjusted net savings (% of GNI)
53The Little Green Data Book 2010
.. 39,688100 784.0 1.04.0 0.7
12 38.. 28,475
102 1010 341
47.7 28.90.0 –0.1
58.0 19.111
142
0.6
.. 6.5
.. 5,321
.. 3.7
.. 9,753
.. 63.1
.. 11.1
.. 0.49.8 12.7
104.3 18.024 26
.. 1,166
.. 9,305
.. 10.4
.. 43
.. 100
.. 98
.. 100
.. 100
.. 99
.. 100
..
..
.. 7
.. 18.5
.. 13.8
.. 4.6
.. 2.0
.. 0.2
.. 0.0
.. 0.2
.. 0.1
.. 6.8
Country data
High-income group
Population (thousands) 54 Land area (sq. km) 260 GDP ($ millions) ..
Cayman Islands

GNI per capita, World Bank Atlas method ($)Urban population (% of total)Urban population growth (average annual %, 1990–2008)Population growth (average annual %, 1990–2008) AgricultureAgricultural land (% of land area)Agricultural productivity (value added per worker, 2000 $)Food production index (1999–2001 = 100)Population density, rural (people/sq. km of arable land) Forests and biodiversityForest area (% of land area)Deforestation (average annual %, 1990–2007)Nationally protected area (% of land area)Threatened species, mammalsThreatened species, birdsThreatened species, fishThreatened species, higher plantsGEF benefits index for biodiversity (0–100, median is 1.5) EnergyGDP per unit of energy use (2005 PPP $/kg oil equivalent)Energy use per capita (kg oil equivalent)Energy from biomass products and waste (% of total)Electric power consumption per capita (kWh)Electricity generated using fossil fuel (% of total)Electricity generated by hydropower (% of total) Emissions and pollutionCO2 emissions per unit of GDP (kg/2005 PPP $)CO2 emissions per capita (metric tons)CO2 emissions growth (%, 1990–2006)Particulate matter (urban-pop.-weighted avg., μg/cu. m)Transport sector energy use per capita (kg of oil equivalent) Water and sanitationInternal freshwater resources per capita (cu. m)Freshwater withdrawal
Total (% of internal resources)Agriculture (% of total freshwater withdrawal)
Access to improved water source (% of total population)Rural (% of rural population)Urban (% of urban population)
Access to improved sanitation (% of total population)Rural (% of rural population)Urban (% of urban population)
Environment and healthAcute resp. infection prevalence (% of children under five)Diarrhea prevalence (% of children under five)Under-five mortality rate (per 1,000 live births) National accounting aggregatesGross savings (% of GNI)Consumption of fixed capital (% of GNI)Education expenditure (% of GNI)Energy depletion (% of GNI)Mineral depletion (% of GNI)Net forest depletion (% of GNI)CO2 damage (% of GNI)Particulate emissions damage (% of GNI)Adjusted net savings (% of GNI)
54 2010 The Little Green Data Book
410 1,077 52339 36 292.4 4.0 3.52.2 2.6 2.2
8 45 38409 330 318104 119 125136 353 666
36.4 26.1 24.70.1 0.7 0.7
18.2 12.4 11.9750
151.5
.. 3.2 3.2
.. 662 423
.. 55.8 49.3
.. 550 324
.. 67.0 41.6
.. 16.9 41.9
0.09 0.46 0.380.06 0.82 0.5125.9 37.4 –6.0
44 53 65.. 61 37
33,119 4,829 5,004
0.0 3.2 9.44 87 88
66 58 6751 46 6090 81 8631 31 3825 24 3340 42 52
10.026.5173 144 118
1.8 16.5 25.97.4 9.0 7.91.3 3.3 3.40.0 14.2 7.80.0 1.3 1.00.0 0.6 1.00.1 0.6 0.70.2 0.4 0.3
–4.6 –6.2 10.7
Population (millions) 4.3 Land area (1,000 sq. km) 623 GDP ($ billions) 2.0
Country data
Sub-Saharan Africa group
Low-income group
Central African Republic

GNI per capita, World Bank Atlas method ($)Urban population (% of total)Urban population growth (average annual %, 1990–2008)Population growth (average annual %, 1990–2008) AgricultureAgricultural land (% of land area)Agricultural productivity (value added per worker, 2000 $)Food production index (1999–2001 = 100)Population density, rural (people/sq. km of arable land) Forests and biodiversityForest area (% of land area)Deforestation (average annual %, 1990–2007)Nationally protected area (% of land area)Threatened species, mammalsThreatened species, birdsThreatened species, fishThreatened species, higher plantsGEF benefits index for biodiversity (0–100, median is 1.5) EnergyGDP per unit of energy use (2005 PPP $/kg oil equivalent)Energy use per capita (kg oil equivalent)Energy from biomass products and waste (% of total)Electric power consumption per capita (kWh)Electricity generated using fossil fuel (% of total)Electricity generated by hydropower (% of total) Emissions and pollutionCO2 emissions per unit of GDP (kg/2005 PPP $)CO2 emissions per capita (metric tons)CO2 emissions growth (%, 1990–2006)Particulate matter (urban-pop.-weighted avg., μg/cu. m)Transport sector energy use per capita (kg of oil equivalent) Water and sanitationInternal freshwater resources per capita (cu. m)Freshwater withdrawal
Total (% of internal resources)Agriculture (% of total freshwater withdrawal)
Access to improved water source (% of total population)Rural (% of rural population)Urban (% of urban population)
Access to improved sanitation (% of total population)Rural (% of rural population)Urban (% of urban population)
Environment and healthAcute resp. infection prevalence (% of children under five)Diarrhea prevalence (% of children under five)Under-five mortality rate (per 1,000 live births) National accounting aggregatesGross savings (% of GNI)Consumption of fixed capital (% of GNI)Education expenditure (% of GNI)Energy depletion (% of GNI)Mineral depletion (% of GNI)Net forest depletion (% of GNI)CO2 damage (% of GNI)Particulate emissions damage (% of GNI)Adjusted net savings (% of GNI)
55The Little Green Data Book 2010
540 1,077 52327 36 29
4.6 4.0 3.53.2 2.6 2.2
39 45 38220 330 318110 119 125182 353 666
9.3 26.1 24.70.6 0.7 0.79.0 12.4 11.912
702
2.2
.. 3.2 3.2
.. 662 423
.. 55.8 49.3
.. 550 324
.. 67.0 41.6
.. 16.9 41.9
0.03 0.46 0.380.04 0.82 0.51
170.0 37.4 –6.0109 53 65
.. 61 37
1,412 4,829 5,004
1.5 3.2 9.483 87 8848 58 6740 46 6071 81 869 31 384 24 33
23 42 52
9.231.2209 144 118
3.7 16.5 25.910.0 9.0 7.91.2 3.3 3.4
43.7 14.2 7.80.0 1.3 1.00.0 0.6 1.00.0 0.6 0.71.0 0.4 0.3
–49.9 –6.2 10.7
Country data
Sub-Saharan Africa group
Low-income group
Population (millions) 11 Land area (1,000 sq. km) 1,259 GDP ($ billions) 8.4
Chad
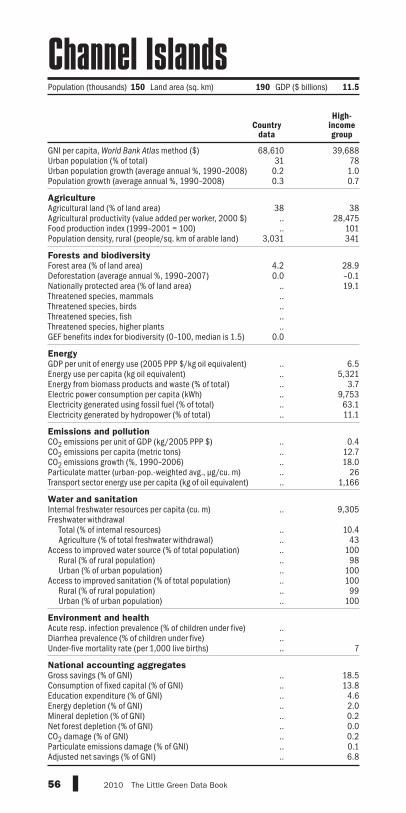
GNI per capita, World Bank Atlas method ($)Urban population (% of total)Urban population growth (average annual %, 1990–2008)Population growth (average annual %, 1990–2008) AgricultureAgricultural land (% of land area)Agricultural productivity (value added per worker, 2000 $)Food production index (1999–2001 = 100)Population density, rural (people/sq. km of arable land) Forests and biodiversityForest area (% of land area)Deforestation (average annual %, 1990–2007)Nationally protected area (% of land area)Threatened species, mammalsThreatened species, birdsThreatened species, fishThreatened species, higher plantsGEF benefits index for biodiversity (0–100, median is 1.5) EnergyGDP per unit of energy use (2005 PPP $/kg oil equivalent)Energy use per capita (kg oil equivalent)Energy from biomass products and waste (% of total)Electric power consumption per capita (kWh)Electricity generated using fossil fuel (% of total)Electricity generated by hydropower (% of total) Emissions and pollutionCO2 emissions per unit of GDP (kg/2005 PPP $)CO2 emissions per capita (metric tons)CO2 emissions growth (%, 1990–2006)Particulate matter (urban-pop.-weighted avg., μg/cu. m)Transport sector energy use per capita (kg of oil equivalent) Water and sanitationInternal freshwater resources per capita (cu. m)Freshwater withdrawal
Total (% of internal resources)Agriculture (% of total freshwater withdrawal)
Access to improved water source (% of total population)Rural (% of rural population)Urban (% of urban population)
Access to improved sanitation (% of total population)Rural (% of rural population)Urban (% of urban population)
Environment and healthAcute resp. infection prevalence (% of children under five)Diarrhea prevalence (% of children under five)Under-five mortality rate (per 1,000 live births) National accounting aggregatesGross savings (% of GNI)Consumption of fixed capital (% of GNI)Education expenditure (% of GNI)Energy depletion (% of GNI)Mineral depletion (% of GNI)Net forest depletion (% of GNI)CO2 damage (% of GNI)Particulate emissions damage (% of GNI)Adjusted net savings (% of GNI)
56 2010 The Little Green Data Book
Country data
High-income group
Population (thousands) 150 Land area (sq. km) 190 GDP ($ billions) 11.5
Channel Islands
68,610 39,68831 78
0.2 1.00.3 0.7
38 38.. 28,475.. 101
3,031 341
4.2 28.90.0 –0.1
.. 19.1
..
..
..
..0.0
.. 6.5
.. 5,321
.. 3.7
.. 9,753
.. 63.1
.. 11.1
.. 0.4
.. 12.7
.. 18.0
.. 26
.. 1,166
.. 9,305
.. 10.4
.. 43
.. 100
.. 98
.. 100
.. 100
.. 99
.. 100
..
..
.. 7
.. 18.5
.. 13.8
.. 4.6
.. 2.0
.. 0.2
.. 0.0
.. 0.2
.. 0.1
.. 6.8

GNI per capita, World Bank Atlas method ($)Urban population (% of total)Urban population growth (average annual %, 1990–2008)Population growth (average annual %, 1990–2008) AgricultureAgricultural land (% of land area)Agricultural productivity (value added per worker, 2000 $)Food production index (1999–2001 = 100)Population density, rural (people/sq. km of arable land) Forests and biodiversityForest area (% of land area)Deforestation (average annual %, 1990–2007)Nationally protected area (% of land area)Threatened species, mammalsThreatened species, birdsThreatened species, fishThreatened species, higher plantsGEF benefits index for biodiversity (0–100, median is 1.5) EnergyGDP per unit of energy use (2005 PPP $/kg oil equivalent)Energy use per capita (kg oil equivalent)Energy from biomass products and waste (% of total)Electric power consumption per capita (kWh)Electricity generated using fossil fuel (% of total)Electricity generated by hydropower (% of total) Emissions and pollutionCO2 emissions per unit of GDP (kg/2005 PPP $)CO2 emissions per capita (metric tons)CO2 emissions growth (%, 1990–2006)Particulate matter (urban-pop.-weighted avg., μg/cu. m)Transport sector energy use per capita (kg of oil equivalent) Water and sanitationInternal freshwater resources per capita (cu. m)Freshwater withdrawal
Total (% of internal resources)Agriculture (% of total freshwater withdrawal)
Access to improved water source (% of total population)Rural (% of rural population)Urban (% of urban population)
Access to improved sanitation (% of total population)Rural (% of rural population)Urban (% of urban population)
Environment and healthAcute resp. infection prevalence (% of children under five)Diarrhea prevalence (% of children under five)Under-five mortality rate (per 1,000 live births) National accounting aggregatesGross savings (% of GNI)Consumption of fixed capital (% of GNI)Education expenditure (% of GNI)Energy depletion (% of GNI)Mineral depletion (% of GNI)Net forest depletion (% of GNI)CO2 damage (% of GNI)Particulate emissions damage (% of GNI)Adjusted net savings (% of GNI)
57The Little Green Data Book 2010
9,370 6,768 7,85288 79 751.7 2.0 1.51.3 1.5 1.0
21 36 306,341 3,452 3,399
115 125 120152 233 146
21.8 44.9 37.3–0.4 0.5 0.218.8 22.8 14.0
21321840
15.3
7.1 7.5 5.21,851 1,273 2,130
15.4 16.3 7.33,318 1,866 3,05255.2 38.2 63.439.5 55.8 27.5
0.3 0.3 0.53.6 2.6 5.2
69.4 40.0 –4.948 35 32
494 317 374
53,137 24,004 18,876
1.4 2.0 13.864 71 5895 91 9472 73 8298 97 9894 78 8274 51 6397 86 89
..
..9 23 23
24.2 22.4 23.812.9 11.8 12.1
3.6 4.4 4.20.3 6.3 9.4
14.3 1.8 1.30.0 0.0 0.00.3 0.3 0.50.4 0.3 0.2
–0.4 6.3 4.6
Population (millions) 17 Land area (1,000 sq. km) 744 GDP ($ billions) 169.5
Country data
Latin America & Caribbean
group
Upper middle-income group
Chile
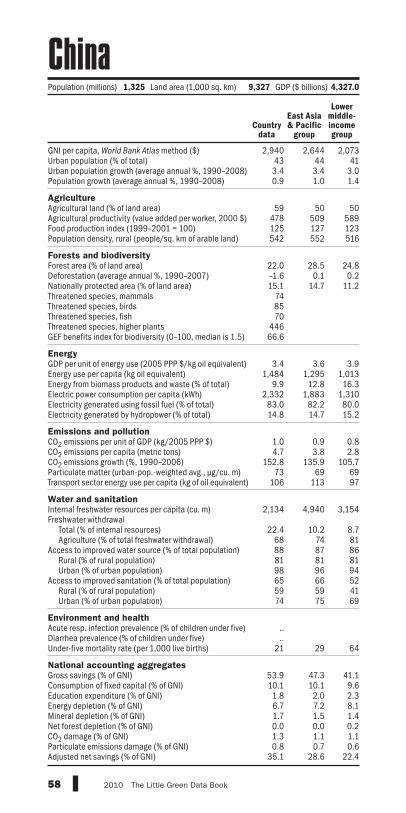
GNI per capita, World Bank Atlas method ($)Urban population (% of total)Urban population growth (average annual %, 1990–2008)Population growth (average annual %, 1990–2008) AgricultureAgricultural land (% of land area)Agricultural productivity (value added per worker, 2000 $)Food production index (1999–2001 = 100)Population density, rural (people/sq. km of arable land) Forests and biodiversityForest area (% of land area)Deforestation (average annual %, 1990–2007)Nationally protected area (% of land area)Threatened species, mammalsThreatened species, birdsThreatened species, fishThreatened species, higher plantsGEF benefits index for biodiversity (0–100, median is 1.5) EnergyGDP per unit of energy use (2005 PPP $/kg oil equivalent)Energy use per capita (kg oil equivalent)Energy from biomass products and waste (% of total)Electric power consumption per capita (kWh)Electricity generated using fossil fuel (% of total)Electricity generated by hydropower (% of total) Emissions and pollutionCO2 emissions per unit of GDP (kg/2005 PPP $)CO2 emissions per capita (metric tons)CO2 emissions growth (%, 1990–2006)Particulate matter (urban-pop.-weighted avg., μg/cu. m)Transport sector energy use per capita (kg of oil equivalent) Water and sanitationInternal freshwater resources per capita (cu. m)Freshwater withdrawal
Total (% of internal resources)Agriculture (% of total freshwater withdrawal)
Access to improved water source (% of total population)Rural (% of rural population)Urban (% of urban population)
Access to improved sanitation (% of total population)Rural (% of rural population)Urban (% of urban population)
Environment and healthAcute resp. infection prevalence (% of children under five)Diarrhea prevalence (% of children under five)Under-five mortality rate (per 1,000 live births) National accounting aggregatesGross savings (% of GNI)Consumption of fixed capital (% of GNI)Education expenditure (% of GNI)Energy depletion (% of GNI)Mineral depletion (% of GNI)Net forest depletion (% of GNI)CO2 damage (% of GNI)Particulate emissions damage (% of GNI)Adjusted net savings (% of GNI)
58 2010 The Little Green Data Book
2,940 2,644 2,07343 44 413.4 3.4 3.00.9 1.0 1.4
59 50 50478 509 589125 127 123542 552 516
22.0 28.5 24.8–1.6 0.1 0.215.1 14.7 11.2
748570
44666.6
3.4 3.6 3.91,484 1,295 1,013
9.9 12.8 16.32,332 1,883 1,310
83.0 82.2 80.014.8 14.7 15.2
1.0 0.9 0.84.7 3.8 2.8
152.8 135.9 105.773 69 69
106 113 97
2,134 4,940 3,154
22.4 10.2 8.768 74 8188 87 8681 81 8198 96 9465 66 5259 59 4174 75 69
..
..21 29 64
53.9 47.3 41.110.1 10.1 9.61.8 2.0 2.36.7 7.2 8.11.7 1.5 1.40.0 0.0 0.21.3 1.1 1.10.8 0.7 0.6
35.1 28.6 22.4
Country data
East Asia & Pacific
group
Lower middle-income group
Population (millions) 1,325 Land area (1,000 sq. km) 9,327 GDP ($ billions) 4,327.0
China

GNI per capita, World Bank Atlas method ($)Urban population (% of total)Urban population growth (average annual %, 1990–2008)Population growth (average annual %, 1990–2008) AgricultureAgricultural land (% of land area)Agricultural productivity (value added per worker, 2000 $)Food production index (1999–2001 = 100)Population density, rural (people/sq. km of arable land) Forests and biodiversityForest area (% of land area)Deforestation (average annual %, 1990–2007)Nationally protected area (% of land area)Threatened species, mammalsThreatened species, birdsThreatened species, fishThreatened species, higher plantsGEF benefits index for biodiversity (0–100, median is 1.5) EnergyGDP per unit of energy use (2005 PPP $/kg oil equivalent)Energy use per capita (kg oil equivalent)Energy from biomass products and waste (% of total)Electric power consumption per capita (kWh)Electricity generated using fossil fuel (% of total)Electricity generated by hydropower (% of total) Emissions and pollutionCO2 emissions per unit of GDP (kg/2005 PPP $)CO2 emissions per capita (metric tons)CO2 emissions growth (%, 1990–2006)Particulate matter (urban-pop.-weighted avg., μg/cu. m)Transport sector energy use per capita (kg of oil equivalent) Water and sanitationInternal freshwater resources per capita (cu. m)Freshwater withdrawal
Total (% of internal resources)Agriculture (% of total freshwater withdrawal)
Access to improved water source (% of total population)Rural (% of rural population)Urban (% of urban population)
Access to improved sanitation (% of total population)Rural (% of rural population)Urban (% of urban population)
Environment and healthAcute resp. infection prevalence (% of children under five)Diarrhea prevalence (% of children under five)Under-five mortality rate (per 1,000 live births) National accounting aggregatesGross savings (% of GNI)Consumption of fixed capital (% of GNI)Education expenditure (% of GNI)Energy depletion (% of GNI)Mineral depletion (% of GNI)Net forest depletion (% of GNI)CO2 damage (% of GNI)Particulate emissions damage (% of GNI)Adjusted net savings (% of GNI)
59The Little Green Data Book 2010
4,620 6,768 7,85275 79 75
2.2 2.0 1.51.7 1.5 1.0
38 36 303,114 3,452 3,399
98 125 120573 233 146
54.6 44.9 37.30.1 0.5 0.2
26.2 22.8 14.0528631
22351.5
12.3 7.5 5.2655 1,273 2,13015.5 16.3 7.3977 1,866 3,052
18.5 38.2 63.480.4 55.8 27.5
0.2 0.3 0.51.5 2.6 5.2
10.6 40.0 –4.922 35 32
164 317 374
47,611 24,004 18,876
0.5 2.0 13.846 71 5893 91 9477 73 8299 97 9878 78 8258 51 6385 86 89
9.613.9
20 23 23
20.2 22.4 23.811.4 11.8 12.13.6 4.4 4.2
10.0 6.3 9.40.6 1.8 1.30.0 0.0 0.00.2 0.3 0.50.1 0.3 0.21.5 6.3 4.6
Country data
Latin America & Caribbean
group
Upper middle-income group
Population (millions) 45 Land area (1,000 sq. km) 1,110 GDP ($ billions) 243.8
Colombia
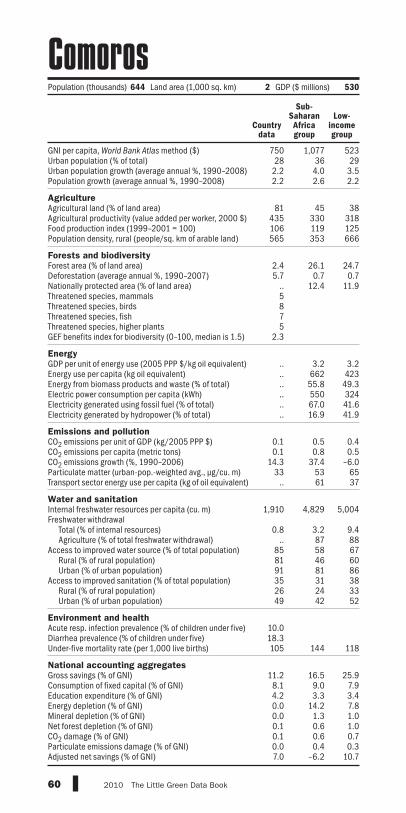
GNI per capita, World Bank Atlas method ($)Urban population (% of total)Urban population growth (average annual %, 1990–2008)Population growth (average annual %, 1990–2008) AgricultureAgricultural land (% of land area)Agricultural productivity (value added per worker, 2000 $)Food production index (1999–2001 = 100)Population density, rural (people/sq. km of arable land) Forests and biodiversityForest area (% of land area)Deforestation (average annual %, 1990–2007)Nationally protected area (% of land area)Threatened species, mammalsThreatened species, birdsThreatened species, fishThreatened species, higher plantsGEF benefits index for biodiversity (0–100, median is 1.5) EnergyGDP per unit of energy use (2005 PPP $/kg oil equivalent)Energy use per capita (kg oil equivalent)Energy from biomass products and waste (% of total)Electric power consumption per capita (kWh)Electricity generated using fossil fuel (% of total)Electricity generated by hydropower (% of total) Emissions and pollutionCO2 emissions per unit of GDP (kg/2005 PPP $)CO2 emissions per capita (metric tons)CO2 emissions growth (%, 1990–2006)Particulate matter (urban-pop.-weighted avg., μg/cu. m)Transport sector energy use per capita (kg of oil equivalent) Water and sanitationInternal freshwater resources per capita (cu. m)Freshwater withdrawal
Total (% of internal resources)Agriculture (% of total freshwater withdrawal)
Access to improved water source (% of total population)Rural (% of rural population)Urban (% of urban population)
Access to improved sanitation (% of total population)Rural (% of rural population)Urban (% of urban population)
Environment and healthAcute resp. infection prevalence (% of children under five)Diarrhea prevalence (% of children under five)Under-five mortality rate (per 1,000 live births) National accounting aggregatesGross savings (% of GNI)Consumption of fixed capital (% of GNI)Education expenditure (% of GNI)Energy depletion (% of GNI)Mineral depletion (% of GNI)Net forest depletion (% of GNI)CO2 damage (% of GNI)Particulate emissions damage (% of GNI)Adjusted net savings (% of GNI)
60 2010 The Little Green Data Book
750 1,077 52328 36 29
2.2 4.0 3.52.2 2.6 2.2
81 45 38435 330 318106 119 125565 353 666
2.4 26.1 24.75.7 0.7 0.7
.. 12.4 11.95875
2.3
.. 3.2 3.2
.. 662 423
.. 55.8 49.3
.. 550 324
.. 67.0 41.6
.. 16.9 41.9
0.1 0.5 0.40.1 0.8 0.5
14.3 37.4 –6.033 53 65
.. 61 37
1,910 4,829 5,004
0.8 3.2 9.4.. 87 88
85 58 6781 46 6091 81 8635 31 3826 24 3349 42 52
10.018.3105 144 118
11.2 16.5 25.98.1 9.0 7.94.2 3.3 3.40.0 14.2 7.80.0 1.3 1.00.1 0.6 1.00.1 0.6 0.70.0 0.4 0.37.0 –6.2 10.7
Country data
Sub-Saharan Africa group
Low-income group
Population (thousands) 644 Land area (1,000 sq. km) 2 GDP ($ millions) 530
Comoros
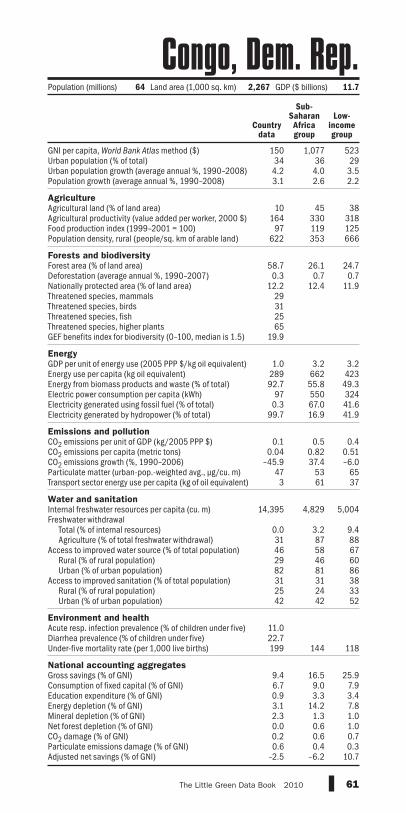
GNI per capita, World Bank Atlas method ($)Urban population (% of total)Urban population growth (average annual %, 1990–2008)Population growth (average annual %, 1990–2008) AgricultureAgricultural land (% of land area)Agricultural productivity (value added per worker, 2000 $)Food production index (1999–2001 = 100)Population density, rural (people/sq. km of arable land) Forests and biodiversityForest area (% of land area)Deforestation (average annual %, 1990–2007)Nationally protected area (% of land area)Threatened species, mammalsThreatened species, birdsThreatened species, fishThreatened species, higher plantsGEF benefits index for biodiversity (0–100, median is 1.5) EnergyGDP per unit of energy use (2005 PPP $/kg oil equivalent)Energy use per capita (kg oil equivalent)Energy from biomass products and waste (% of total)Electric power consumption per capita (kWh)Electricity generated using fossil fuel (% of total)Electricity generated by hydropower (% of total) Emissions and pollutionCO2 emissions per unit of GDP (kg/2005 PPP $)CO2 emissions per capita (metric tons)CO2 emissions growth (%, 1990–2006)Particulate matter (urban-pop.-weighted avg., μg/cu. m)Transport sector energy use per capita (kg of oil equivalent) Water and sanitationInternal freshwater resources per capita (cu. m)Freshwater withdrawal
Total (% of internal resources)Agriculture (% of total freshwater withdrawal)
Access to improved water source (% of total population)Rural (% of rural population)Urban (% of urban population)
Access to improved sanitation (% of total population)Rural (% of rural population)Urban (% of urban population)
Environment and healthAcute resp. infection prevalence (% of children under five)Diarrhea prevalence (% of children under five)Under-five mortality rate (per 1,000 live births) National accounting aggregatesGross savings (% of GNI)Consumption of fixed capital (% of GNI)Education expenditure (% of GNI)Energy depletion (% of GNI)Mineral depletion (% of GNI)Net forest depletion (% of GNI)CO2 damage (% of GNI)Particulate emissions damage (% of GNI)Adjusted net savings (% of GNI)
61The Little Green Data Book 2010
150 1,077 52334 36 294.2 4.0 3.53.1 2.6 2.2
10 45 38164 330 318
97 119 125622 353 666
58.7 26.1 24.70.3 0.7 0.7
12.2 12.4 11.929312565
19.9
1.0 3.2 3.2289 662 42392.7 55.8 49.3
97 550 3240.3 67.0 41.6
99.7 16.9 41.9
0.1 0.5 0.40.04 0.82 0.51
–45.9 37.4 –6.047 53 653 61 37
14,395 4,829 5,004
0.0 3.2 9.431 87 8846 58 6729 46 6082 81 8631 31 3825 24 3342 42 52
11.022.7199 144 118
9.4 16.5 25.96.7 9.0 7.90.9 3.3 3.43.1 14.2 7.82.3 1.3 1.00.0 0.6 1.00.2 0.6 0.70.6 0.4 0.3
–2.5 –6.2 10.7
Population (millions) 64 Land area (1,000 sq. km) 2,267 GDP ($ billions) 11.7
Country data
Sub-Saharan Africa group
Low-income group
Congo, Dem. Rep.

GNI per capita, World Bank Atlas method ($)Urban population (% of total)Urban population growth (average annual %, 1990–2008)Population growth (average annual %, 1990–2008) AgricultureAgricultural land (% of land area)Agricultural productivity (value added per worker, 2000 $)Food production index (1999–2001 = 100)Population density, rural (people/sq. km of arable land) Forests and biodiversityForest area (% of land area)Deforestation (average annual %, 1990–2007)Nationally protected area (% of land area)Threatened species, mammalsThreatened species, birdsThreatened species, fishThreatened species, higher plantsGEF benefits index for biodiversity (0–100, median is 1.5) EnergyGDP per unit of energy use (2005 PPP $/kg oil equivalent)Energy use per capita (kg oil equivalent)Energy from biomass products and waste (% of total)Electric power consumption per capita (kWh)Electricity generated using fossil fuel (% of total)Electricity generated by hydropower (% of total) Emissions and pollutionCO2 emissions per unit of GDP (kg/2005 PPP $)CO2 emissions per capita (metric tons)CO2 emissions growth (%, 1990–2006)Particulate matter (urban-pop.-weighted avg., μg/cu. m)Transport sector energy use per capita (kg of oil equivalent) Water and sanitationInternal freshwater resources per capita (cu. m)Freshwater withdrawal
Total (% of internal resources)Agriculture (% of total freshwater withdrawal)
Access to improved water source (% of total population)Rural (% of rural population)Urban (% of urban population)
Access to improved sanitation (% of total population)Rural (% of rural population)Urban (% of urban population)
Environment and healthAcute resp. infection prevalence (% of children under five)Diarrhea prevalence (% of children under five)Under-five mortality rate (per 1,000 live births) National accounting aggregatesGross savings (% of GNI)Consumption of fixed capital (% of GNI)Education expenditure (% of GNI)Energy depletion (% of GNI)Mineral depletion (% of GNI)Net forest depletion (% of GNI)CO2 damage (% of GNI)Particulate emissions damage (% of GNI)Adjusted net savings (% of GNI)
62 2010 The Little Green Data Book
1,790 1,077 2,07361 36 41
2.8 4.0 3.02.2 2.6 1.4
31 45 50.. 330 589
122 119 123280 353 516
65.7 26.1 24.80.1 0.7 0.2
10.3 12.4 11.2113
15353.6
9.9 3.2 3.9357 662 1,013
55.9 55.8 16.3135 550 1,31017.7 67.0 80.082.3 16.9 15.2
0.1 0.5 0.80.4 0.8 2.8
23.1 37.4 105.764 53 69
106 61 97
62,516 4,829 3,154
0.0 3.2 8.79 87 81
71 58 8635 46 8195 81 9420 31 5221 24 4119 42 69
..
..127 144 64
26.7 16.5 41.114.1 9.0 9.62.3 3.3 2.3
71.2 14.2 8.10.0 1.3 1.40.0 0.6 0.20.2 0.6 1.10.6 0.4 0.6
–57.1 –6.2 22.4
Country data
Sub-Saharan Africa group
Lower middle-income group
Population (millions) 3.6 Land area (1,000 sq. km) 342 GDP ($ billions) 10.7
Congo, Rep.

GNI per capita, World Bank Atlas method ($)Urban population (% of total)Urban population growth (average annual %, 1990–2008)Population growth (average annual %, 1990–2008) AgricultureAgricultural land (% of land area)Agricultural productivity (value added per worker, 2000 $)Food production index (1999–2001 = 100)Population density, rural (people/sq. km of arable land) Forests and biodiversityForest area (% of land area)Deforestation (average annual %, 1990–2007)Nationally protected area (% of land area)Threatened species, mammalsThreatened species, birdsThreatened species, fishThreatened species, higher plantsGEF benefits index for biodiversity (0–100, median is 1.5) EnergyGDP per unit of energy use (2005 PPP $/kg oil equivalent)Energy use per capita (kg oil equivalent)Energy from biomass products and waste (% of total)Electric power consumption per capita (kWh)Electricity generated using fossil fuel (% of total)Electricity generated by hydropower (% of total) Emissions and pollutionCO2 emissions per unit of GDP (kg/2005 PPP $)CO2 emissions per capita (metric tons)CO2 emissions growth (%, 1990–2006)Particulate matter (urban-pop.-weighted avg., μg/cu. m)Transport sector energy use per capita (kg of oil equivalent) Water and sanitationInternal freshwater resources per capita (cu. m)Freshwater withdrawal
Total (% of internal resources)Agriculture (% of total freshwater withdrawal)
Access to improved water source (% of total population)Rural (% of rural population)Urban (% of urban population)
Access to improved sanitation (% of total population)Rural (% of rural population)Urban (% of urban population)
Environment and healthAcute resp. infection prevalence (% of children under five)Diarrhea prevalence (% of children under five)Under-five mortality rate (per 1,000 live births) National accounting aggregatesGross savings (% of GNI)Consumption of fixed capital (% of GNI)Education expenditure (% of GNI)Energy depletion (% of GNI)Mineral depletion (% of GNI)Net forest depletion (% of GNI)CO2 damage (% of GNI)Particulate emissions damage (% of GNI)Adjusted net savings (% of GNI)
63The Little Green Data Book 2010
6,060 6,768 7,85263 79 753.4 2.0 1.52.1 1.5 1.0
54 36 305,593 3,452 3,399
122 125 120831 233 146
46.9 44.9 37.30.4 0.5 0.2
31.0 22.8 14.08
1719
1119.7
9.6 7.5 5.21,070 1,273 2,130
17.7 16.3 7.31,863 1,866 3,052
8.0 38.2 63.474.8 55.8 27.5
0.2 0.3 0.51.8 2.6 5.2
165.8 40.0 –4.936 35 32
323 317 374
25,209 24,004 18,876
2.4 2.0 13.853 71 5898 91 9496 73 8299 97 9896 78 8295 51 6396 86 89
..
..11 23 23
15.9 22.4 23.811.5 11.8 12.15.0 4.4 4.20.0 6.3 9.40.0 1.8 1.30.1 0.0 0.00.2 0.3 0.50.1 0.3 0.29.1 6.3 4.6
Country data
Latin America & Caribbean
group
Upper middle-income group
Population (millions) 4.5 Land area (1,000 sq. km) 51 GDP ($ billions) 29.7
Costa Rica
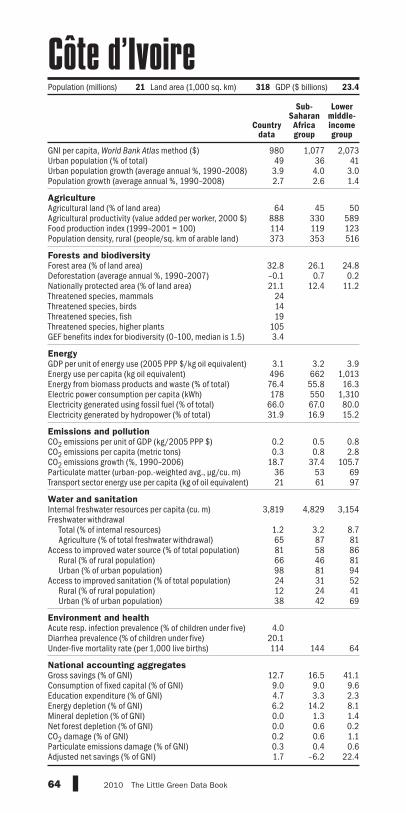
GNI per capita, World Bank Atlas method ($)Urban population (% of total)Urban population growth (average annual %, 1990–2008)Population growth (average annual %, 1990–2008) AgricultureAgricultural land (% of land area)Agricultural productivity (value added per worker, 2000 $)Food production index (1999–2001 = 100)Population density, rural (people/sq. km of arable land) Forests and biodiversityForest area (% of land area)Deforestation (average annual %, 1990–2007)Nationally protected area (% of land area)Threatened species, mammalsThreatened species, birdsThreatened species, fishThreatened species, higher plantsGEF benefits index for biodiversity (0–100, median is 1.5) EnergyGDP per unit of energy use (2005 PPP $/kg oil equivalent)Energy use per capita (kg oil equivalent)Energy from biomass products and waste (% of total)Electric power consumption per capita (kWh)Electricity generated using fossil fuel (% of total)Electricity generated by hydropower (% of total) Emissions and pollutionCO2 emissions per unit of GDP (kg/2005 PPP $)CO2 emissions per capita (metric tons)CO2 emissions growth (%, 1990–2006)Particulate matter (urban-pop.-weighted avg., μg/cu. m)Transport sector energy use per capita (kg of oil equivalent) Water and sanitationInternal freshwater resources per capita (cu. m)Freshwater withdrawal
Total (% of internal resources)Agriculture (% of total freshwater withdrawal)
Access to improved water source (% of total population)Rural (% of rural population)Urban (% of urban population)
Access to improved sanitation (% of total population)Rural (% of rural population)Urban (% of urban population)
Environment and healthAcute resp. infection prevalence (% of children under five)Diarrhea prevalence (% of children under five)Under-five mortality rate (per 1,000 live births) National accounting aggregatesGross savings (% of GNI)Consumption of fixed capital (% of GNI)Education expenditure (% of GNI)Energy depletion (% of GNI)Mineral depletion (% of GNI)Net forest depletion (% of GNI)CO2 damage (% of GNI)Particulate emissions damage (% of GNI)Adjusted net savings (% of GNI)
64 2010 The Little Green Data Book
980 1,077 2,07349 36 413.9 4.0 3.02.7 2.6 1.4
64 45 50888 330 589114 119 123373 353 516
32.8 26.1 24.8–0.1 0.7 0.221.1 12.4 11.2
241419
1053.4
3.1 3.2 3.9496 662 1,01376.4 55.8 16.3178 550 1,310
66.0 67.0 80.031.9 16.9 15.2
0.2 0.5 0.80.3 0.8 2.8
18.7 37.4 105.736 53 6921 61 97
3,819 4,829 3,154
1.2 3.2 8.765 87 8181 58 8666 46 8198 81 9424 31 5212 24 4138 42 69
4.020.1114 144 64
12.7 16.5 41.19.0 9.0 9.64.7 3.3 2.36.2 14.2 8.10.0 1.3 1.40.0 0.6 0.20.2 0.6 1.10.3 0.4 0.61.7 –6.2 22.4
Country data
Sub-Saharan Africa group
Lower middle-income group
Population (millions) 21 Land area (1,000 sq. km) 318 GDP ($ billions) 23.4
Côte d’Ivoire
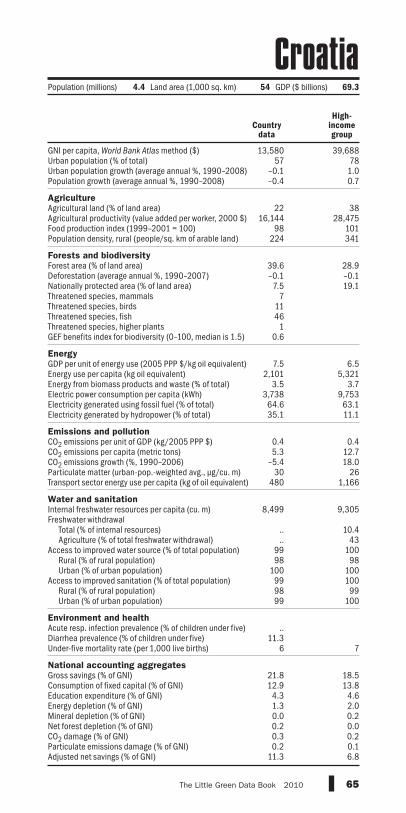
GNI per capita, World Bank Atlas method ($)Urban population (% of total)Urban population growth (average annual %, 1990–2008)Population growth (average annual %, 1990–2008) AgricultureAgricultural land (% of land area)Agricultural productivity (value added per worker, 2000 $)Food production index (1999–2001 = 100)Population density, rural (people/sq. km of arable land) Forests and biodiversityForest area (% of land area)Deforestation (average annual %, 1990–2007)Nationally protected area (% of land area)Threatened species, mammalsThreatened species, birdsThreatened species, fishThreatened species, higher plantsGEF benefits index for biodiversity (0–100, median is 1.5) EnergyGDP per unit of energy use (2005 PPP $/kg oil equivalent)Energy use per capita (kg oil equivalent)Energy from biomass products and waste (% of total)Electric power consumption per capita (kWh)Electricity generated using fossil fuel (% of total)Electricity generated by hydropower (% of total) Emissions and pollutionCO2 emissions per unit of GDP (kg/2005 PPP $)CO2 emissions per capita (metric tons)CO2 emissions growth (%, 1990–2006)Particulate matter (urban-pop.-weighted avg., μg/cu. m)Transport sector energy use per capita (kg of oil equivalent) Water and sanitationInternal freshwater resources per capita (cu. m)Freshwater withdrawal
Total (% of internal resources)Agriculture (% of total freshwater withdrawal)
Access to improved water source (% of total population)Rural (% of rural population)Urban (% of urban population)
Access to improved sanitation (% of total population)Rural (% of rural population)Urban (% of urban population)
Environment and healthAcute resp. infection prevalence (% of children under five)Diarrhea prevalence (% of children under five)Under-five mortality rate (per 1,000 live births) National accounting aggregatesGross savings (% of GNI)Consumption of fixed capital (% of GNI)Education expenditure (% of GNI)Energy depletion (% of GNI)Mineral depletion (% of GNI)Net forest depletion (% of GNI)CO2 damage (% of GNI)Particulate emissions damage (% of GNI)Adjusted net savings (% of GNI)
65The Little Green Data Book 2010
13,580 39,68857 78
–0.1 1.0–0.4 0.7
22 3816,144 28,475
98 101224 341
39.6 28.9–0.1 –0.17.5 19.1
71146
10.6
7.5 6.52,101 5,321
3.5 3.73,738 9,75364.6 63.135.1 11.1
0.4 0.45.3 12.7
–5.4 18.030 26
480 1,166
8,499 9,305
.. 10.4
.. 4399 10098 98
100 10099 10098 9999 100
..11.3
6 7
21.8 18.512.9 13.84.3 4.61.3 2.00.0 0.20.2 0.00.3 0.20.2 0.1
11.3 6.8
Country data
High-income group
Population (millions) 4.4 Land area (1,000 sq. km) 54 GDP ($ billions) 69.3
Croatia

GNI per capita, World Bank Atlas method ($)Urban population (% of total)Urban population growth (average annual %, 1990–2008)Population growth (average annual %, 1990–2008) AgricultureAgricultural land (% of land area)Agricultural productivity (value added per worker, 2000 $)Food production index (1999–2001 = 100)Population density, rural (people/sq. km of arable land) Forests and biodiversityForest area (% of land area)Deforestation (average annual %, 1990–2007)Nationally protected area (% of land area)Threatened species, mammalsThreatened species, birdsThreatened species, fishThreatened species, higher plantsGEF benefits index for biodiversity (0–100, median is 1.5) EnergyGDP per unit of energy use (2005 PPP $/kg oil equivalent)Energy use per capita (kg oil equivalent)Energy from biomass products and waste (% of total)Electric power consumption per capita (kWh)Electricity generated using fossil fuel (% of total)Electricity generated by hydropower (% of total) Emissions and pollutionCO2 emissions per unit of GDP (kg/2005 PPP $)CO2 emissions per capita (metric tons)CO2 emissions growth (%, 1990–2006)Particulate matter (urban-pop.-weighted avg., μg/cu. m)Transport sector energy use per capita (kg of oil equivalent) Water and sanitationInternal freshwater resources per capita (cu. m)Freshwater withdrawal
Total (% of internal resources)Agriculture (% of total freshwater withdrawal)
Access to improved water source (% of total population)Rural (% of rural population)Urban (% of urban population)
Access to improved sanitation (% of total population)Rural (% of rural population)Urban (% of urban population)
Environment and healthAcute resp. infection prevalence (% of children under five)Diarrhea prevalence (% of children under five)Under-five mortality rate (per 1,000 live births) National accounting aggregatesGross savings (% of GNI)Consumption of fixed capital (% of GNI)Education expenditure (% of GNI)Energy depletion (% of GNI)Mineral depletion (% of GNI)Net forest depletion (% of GNI)CO2 damage (% of GNI)Particulate emissions damage (% of GNI)Adjusted net savings (% of GNI)
66 2010 The Little Green Data Book
.. 6,768 7,85276 79 75
0.5 2.0 1.50.3 1.5 1.0
60 36 30.. 3,452 3,399
83 125 12076 233 146
25.7 44.9 37.3–1.9 0.5 0.218.8 22.8 14.0
141728
16312.5
.. 7.5 5.2884 1,273 2,13013.1 16.3 7.3
1,309 1,866 3,05297.4 38.2 63.40.7 55.8 27.5
.. 0.3 0.52.6 2.6 5.2
–11.1 40.0 –4.917 35 3227 317 374
3,402 24,004 18,876
21.5 2.0 13.869 71 5891 91 9478 73 8295 97 9898 78 8295 51 6399 86 89
..
..6 23 23
.. 22.4 23.8
.. 11.8 12.1
.. 4.4 4.2
.. 6.3 9.4
.. 1.8 1.3
.. 0.0 0.0
.. 0.3 0.5
.. 0.3 0.2
.. 6.3 4.6
Country data
Latin America & Caribbean
group
Upper middle-income group
Population (millions) 11 Land area (1,000 sq. km) 110 GDP ($ billions) ..
Cuba

GNI per capita, World Bank Atlas method ($)Urban population (% of total)Urban population growth (average annual %, 1990–2008)Population growth (average annual %, 1990–2008) AgricultureAgricultural land (% of land area)Agricultural productivity (value added per worker, 2000 $)Food production index (1999–2001 = 100)Population density, rural (people/sq. km of arable land) Forests and biodiversityForest area (% of land area)Deforestation (average annual %, 1990–2007)Nationally protected area (% of land area)Threatened species, mammalsThreatened species, birdsThreatened species, fishThreatened species, higher plantsGEF benefits index for biodiversity (0–100, median is 1.5) EnergyGDP per unit of energy use (2005 PPP $/kg oil equivalent)Energy use per capita (kg oil equivalent)Energy from biomass products and waste (% of total)Electric power consumption per capita (kWh)Electricity generated using fossil fuel (% of total)Electricity generated by hydropower (% of total) Emissions and pollutionCO2 emissions per unit of GDP (kg/2005 PPP $)CO2 emissions per capita (metric tons)CO2 emissions growth (%, 1990–2006)Particulate matter (urban-pop.-weighted avg., μg/cu. m)Transport sector energy use per capita (kg of oil equivalent) Water and sanitationInternal freshwater resources per capita (cu. m)Freshwater withdrawal
Total (% of internal resources)Agriculture (% of total freshwater withdrawal)
Access to improved water source (% of total population)Rural (% of rural population)Urban (% of urban population)
Access to improved sanitation (% of total population)Rural (% of rural population)Urban (% of urban population)
Environment and healthAcute resp. infection prevalence (% of children under five)Diarrhea prevalence (% of children under five)Under-five mortality rate (per 1,000 live births) National accounting aggregatesGross savings (% of GNI)Consumption of fixed capital (% of GNI)Education expenditure (% of GNI)Energy depletion (% of GNI)Mineral depletion (% of GNI)Net forest depletion (% of GNI)CO2 damage (% of GNI)Particulate emissions damage (% of GNI)Adjusted net savings (% of GNI)
67The Little Green Data Book 2010
26,940 39,68870 781.6 1.01.3 0.7
17 389,948 28,475
91 101225 341
18.9 28.9–0.5 –0.110.8 19.1
55
127
0.5
7.8 6.52,854 5,321
1.1 3.75,441 9,75399.9 63.1
0.0 11.1
0.4 0.49.2 12.7
67.4 18.044 26
774 1,166
914 9,305
31.6 10.4.. 43
100 100100 98100 100100 100100 99100 100
..
..4 7
5.6 18.514.4 13.86.5 4.60.0 2.00.0 0.20.0 0.00.3 0.20.3 0.1
–2.8 6.8
Population (thousands) 862 Land area (1,000 sq. km) 9 GDP ($ billions) 24.9
Country data
High-income group
Cyprus

GNI per capita, World Bank Atlas method ($)Urban population (% of total)Urban population growth (average annual %, 1990–2008)Population growth (average annual %, 1990–2008) AgricultureAgricultural land (% of land area)Agricultural productivity (value added per worker, 2000 $)Food production index (1999–2001 = 100)Population density, rural (people/sq. km of arable land) Forests and biodiversityForest area (% of land area)Deforestation (average annual %, 1990–2007)Nationally protected area (% of land area)Threatened species, mammalsThreatened species, birdsThreatened species, fishThreatened species, higher plantsGEF benefits index for biodiversity (0–100, median is 1.5) EnergyGDP per unit of energy use (2005 PPP $/kg oil equivalent)Energy use per capita (kg oil equivalent)Energy from biomass products and waste (% of total)Electric power consumption per capita (kWh)Electricity generated using fossil fuel (% of total)Electricity generated by hydropower (% of total) Emissions and pollutionCO2 emissions per unit of GDP (kg/2005 PPP $)CO2 emissions per capita (metric tons)CO2 emissions growth (%, 1990–2006)Particulate matter (urban-pop.-weighted avg., μg/cu. m)Transport sector energy use per capita (kg of oil equivalent) Water and sanitationInternal freshwater resources per capita (cu. m)Freshwater withdrawal
Total (% of internal resources)Agriculture (% of total freshwater withdrawal)
Access to improved water source (% of total population)Rural (% of rural population)Urban (% of urban population)
Access to improved sanitation (% of total population)Rural (% of rural population)Urban (% of urban population)
Environment and healthAcute resp. infection prevalence (% of children under five)Diarrhea prevalence (% of children under five)Under-five mortality rate (per 1,000 live births) National accounting aggregatesGross savings (% of GNI)Consumption of fixed capital (% of GNI)Education expenditure (% of GNI)Energy depletion (% of GNI)Mineral depletion (% of GNI)Net forest depletion (% of GNI)CO2 damage (% of GNI)Particulate emissions damage (% of GNI)Adjusted net savings (% of GNI)
68 2010 The Little Green Data Book
16,650 39,68874 78
–0.1 1.00.0 0.7
55 385,275 28,475
96 10190 341
34.3 28.9–0.1 –0.115.8 19.1
2654
0.1
5.2 6.54,428 5,321
4.6 3.76,496 9,75366.3 63.1
2.4 11.1
0.5 0.411.2 12.7
–29.4 18.021 26
612 1,166
1,272 9,305
19.6 10.42 43
100 100100 98100 10099 10098 99
100 100
..
..4 7
24.2 18.513.8 13.8
4.4 4.60.7 2.00.0 0.20.0 0.00.5 0.20.0 0.1
13.4 6.8
Country data
High-income group
Population (millions) 10 Land area (1,000 sq. km) 77 GDP ($ billions) 215.5
Czech Republic

GNI per capita, World Bank Atlas method ($)Urban population (% of total)Urban population growth (average annual %, 1990–2008)Population growth (average annual %, 1990–2008) AgricultureAgricultural land (% of land area)Agricultural productivity (value added per worker, 2000 $)Food production index (1999–2001 = 100)Population density, rural (people/sq. km of arable land) Forests and biodiversityForest area (% of land area)Deforestation (average annual %, 1990–2007)Nationally protected area (% of land area)Threatened species, mammalsThreatened species, birdsThreatened species, fishThreatened species, higher plantsGEF benefits index for biodiversity (0–100, median is 1.5) EnergyGDP per unit of energy use (2005 PPP $/kg oil equivalent)Energy use per capita (kg oil equivalent)Energy from biomass products and waste (% of total)Electric power consumption per capita (kWh)Electricity generated using fossil fuel (% of total)Electricity generated by hydropower (% of total) Emissions and pollutionCO2 emissions per unit of GDP (kg/2005 PPP $)CO2 emissions per capita (metric tons)CO2 emissions growth (%, 1990–2006)Particulate matter (urban-pop.-weighted avg., μg/cu. m)Transport sector energy use per capita (kg of oil equivalent) Water and sanitationInternal freshwater resources per capita (cu. m)Freshwater withdrawal
Total (% of internal resources)Agriculture (% of total freshwater withdrawal)
Access to improved water source (% of total population)Rural (% of rural population)Urban (% of urban population)
Access to improved sanitation (% of total population)Rural (% of rural population)Urban (% of urban population)
Environment and healthAcute resp. infection prevalence (% of children under five)Diarrhea prevalence (% of children under five)Under-five mortality rate (per 1,000 live births) National accounting aggregatesGross savings (% of GNI)Consumption of fixed capital (% of GNI)Education expenditure (% of GNI)Energy depletion (% of GNI)Mineral depletion (% of GNI)Net forest depletion (% of GNI)CO2 damage (% of GNI)Particulate emissions damage (% of GNI)Adjusted net savings (% of GNI)
69The Little Green Data Book 2010
58,800 39,68887 78
0.5 1.00.4 0.7
63 3830,492 28,475
102 10132 341
11.9 28.9–0.8 –0.15.7 19.1
22
133
0.2
9.6 6.53,598 5,321
14.8 3.76,670 9,753
71.7 63.10.1 11.1
0.3 0.49.9 12.77.0 18.019 26
854 1,166
1,099 9,305
21.2 10.443 43
100 100100 98100 100100 100100 99100 100
..
..4 7
23.6 18.514.2 13.8
7.4 4.63.0 2.00.0 0.20.0 0.00.1 0.20.0 0.1
13.7 6.8
Country data
High-income group
Population (millions) 5.5 Land area (1,000 sq. km) 42 GDP ($ billions) 341.3
Denmark

GNI per capita, World Bank Atlas method ($)Urban population (% of total)Urban population growth (average annual %, 1990–2008)Population growth (average annual %, 1990–2008) AgricultureAgricultural land (% of land area)Agricultural productivity (value added per worker, 2000 $)Food production index (1999–2001 = 100)Population density, rural (people/sq. km of arable land) Forests and biodiversityForest area (% of land area)Deforestation (average annual %, 1990–2007)Nationally protected area (% of land area)Threatened species, mammalsThreatened species, birdsThreatened species, fishThreatened species, higher plantsGEF benefits index for biodiversity (0–100, median is 1.5) EnergyGDP per unit of energy use (2005 PPP $/kg oil equivalent)Energy use per capita (kg oil equivalent)Energy from biomass products and waste (% of total)Electric power consumption per capita (kWh)Electricity generated using fossil fuel (% of total)Electricity generated by hydropower (% of total) Emissions and pollutionCO2 emissions per unit of GDP (kg/2005 PPP $)CO2 emissions per capita (metric tons)CO2 emissions growth (%, 1990–2006)Particulate matter (urban-pop.-weighted avg., μg/cu. m)Transport sector energy use per capita (kg of oil equivalent) Water and sanitationInternal freshwater resources per capita (cu. m)Freshwater withdrawal
Total (% of internal resources)Agriculture (% of total freshwater withdrawal)
Access to improved water source (% of total population)Rural (% of rural population)Urban (% of urban population)
Access to improved sanitation (% of total population)Rural (% of rural population)Urban (% of urban population)
Environment and healthAcute resp. infection prevalence (% of children under five)Diarrhea prevalence (% of children under five)Under-five mortality rate (per 1,000 live births) National accounting aggregatesGross savings (% of GNI)Consumption of fixed capital (% of GNI)Education expenditure (% of GNI)Energy depletion (% of GNI)Mineral depletion (% of GNI)Net forest depletion (% of GNI)CO2 damage (% of GNI)Particulate emissions damage (% of GNI)Adjusted net savings (% of GNI)
70 2010 The Little Green Data Book
1,130 3,237 2,07387 57 413.1 2.6 3.02.3 2.0 1.4
73 23 5080 2,896 589
153 120 1238,407 746 516
0.2 2.5 24.80.0 –0.4 0.20.0 3.8 11.2
87
142
0.5
.. 5.0 3.9
.. 1,275 1,013
.. 1.1 16.3
.. 1,435 1,310
.. 91.1 80.0
.. 7.4 15.2
0.3 0.6 0.80.6 3.5 2.8
22.0 96.4 105.745 72 69
.. 258 97
360 714 3,154
6.3 122.3 8.7.. 86 81
92 88 8654 81 8198 95 9467 74 5211 59 4176 89 69
..
..95 34 64
.. .. 41.17.8 10.5 9.63.6 4.4 2.30.0 18.6 8.10.0 1.5 1.40.0 0.1 0.20.4 0.7 1.11.2 0.4 0.6
.. .. 22.4
Country data
Middle East &
N. Africa group
Lower middle-income group
Population (thousands) 849 Land area (1,000 sq. km) 23 GDP ($ millions) 875
Djibouti

GNI per capita, World Bank Atlas method ($)Urban population (% of total)Urban population growth (average annual %, 1990–2008)Population growth (average annual %, 1990–2008) AgricultureAgricultural land (% of land area)Agricultural productivity (value added per worker, 2000 $)Food production index (1999–2001 = 100)Population density, rural (people/sq. km of arable land) Forests and biodiversityForest area (% of land area)Deforestation (average annual %, 1990–2007)Nationally protected area (% of land area)Threatened species, mammalsThreatened species, birdsThreatened species, fishThreatened species, higher plantsGEF benefits index for biodiversity (0–100, median is 1.5) EnergyGDP per unit of energy use (2005 PPP $/kg oil equivalent)Energy use per capita (kg oil equivalent)Energy from biomass products and waste (% of total)Electric power consumption per capita (kWh)Electricity generated using fossil fuel (% of total)Electricity generated by hydropower (% of total) Emissions and pollutionCO2 emissions per unit of GDP (kg/2005 PPP $)CO2 emissions per capita (metric tons)CO2 emissions growth (%, 1990–2006)Particulate matter (urban-pop.-weighted avg., μg/cu. m)Transport sector energy use per capita (kg of oil equivalent) Water and sanitationInternal freshwater resources per capita (cu. m)Freshwater withdrawal
Total (% of internal resources)Agriculture (% of total freshwater withdrawal)
Access to improved water source (% of total population)Rural (% of rural population)Urban (% of urban population)
Access to improved sanitation (% of total population)Rural (% of rural population)Urban (% of urban population)
Environment and healthAcute resp. infection prevalence (% of children under five)Diarrhea prevalence (% of children under five)Under-five mortality rate (per 1,000 live births) National accounting aggregatesGross savings (% of GNI)Consumption of fixed capital (% of GNI)Education expenditure (% of GNI)Energy depletion (% of GNI)Mineral depletion (% of GNI)Net forest depletion (% of GNI)CO2 damage (% of GNI)Particulate emissions damage (% of GNI)Adjusted net savings (% of GNI)
71The Little Green Data Book 2010
4,750 6,768 7,85274 79 75
0.6 2.0 1.50.1 1.5 1.0
31 36 306,229 3,452 3,399
99 125 120385 233 146
60.7 44.9 37.30.6 0.5 0.2
26.7 22.8 14.033
1511
0.9
.. 7.5 5.2
.. 1,273 2,130
.. 16.3 7.3
.. 1,866 3,052
.. 38.2 63.4
.. 55.8 27.5
0.2 0.3 0.51.6 2.6 5.2
100.0 40.0 –4.926 35 32
.. 317 374
.. 24,004 18,876
.. 2.0 13.8
.. 71 5897 91 9490 73 82
100 97 9884 78 8275 51 6386 86 89
..
..11 23 23
4.2 22.4 23.811.3 11.8 12.13.9 4.4 4.20.0 6.3 9.40.0 1.8 1.30.0 0.0 0.00.3 0.3 0.5
.. 0.3 0.2
.. 6.3 4.6
Country data
Latin America & Caribbean
group
Upper middle-income group
Population (thousands) 73 Land area (sq. km) 750 GDP ($ millions) 357
Dominica

GNI per capita, World Bank Atlas method ($)Urban population (% of total)Urban population growth (average annual %, 1990–2008)Population growth (average annual %, 1990–2008) AgricultureAgricultural land (% of land area)Agricultural productivity (value added per worker, 2000 $)Food production index (1999–2001 = 100)Population density, rural (people/sq. km of arable land) Forests and biodiversityForest area (% of land area)Deforestation (average annual %, 1990–2007)Nationally protected area (% of land area)Threatened species, mammalsThreatened species, birdsThreatened species, fishThreatened species, higher plantsGEF benefits index for biodiversity (0–100, median is 1.5) EnergyGDP per unit of energy use (2005 PPP $/kg oil equivalent)Energy use per capita (kg oil equivalent)Energy from biomass products and waste (% of total)Electric power consumption per capita (kWh)Electricity generated using fossil fuel (% of total)Electricity generated by hydropower (% of total) Emissions and pollutionCO2 emissions per unit of GDP (kg/2005 PPP $)CO2 emissions per capita (metric tons)CO2 emissions growth (%, 1990–2006)Particulate matter (urban-pop.-weighted avg., μg/cu. m)Transport sector energy use per capita (kg of oil equivalent) Water and sanitationInternal freshwater resources per capita (cu. m)Freshwater withdrawal
Total (% of internal resources)Agriculture (% of total freshwater withdrawal)
Access to improved water source (% of total population)Rural (% of rural population)Urban (% of urban population)
Access to improved sanitation (% of total population)Rural (% of rural population)Urban (% of urban population)
Environment and healthAcute resp. infection prevalence (% of children under five)Diarrhea prevalence (% of children under five)Under-five mortality rate (per 1,000 live births) National accounting aggregatesGross savings (% of GNI)Consumption of fixed capital (% of GNI)Education expenditure (% of GNI)Energy depletion (% of GNI)Mineral depletion (% of GNI)Net forest depletion (% of GNI)CO2 damage (% of GNI)Particulate emissions damage (% of GNI)Adjusted net savings (% of GNI)
72 2010 The Little Green Data Book
4,330 6,768 7,85269 79 752.9 2.0 1.51.7 1.5 1.0
52 36 304,053 3,452 3,399
137 125 120380 233 146
28.5 44.9 37.30.0 0.5 0.2
28.5 22.8 14.06
1415306.0
9.0 7.5 5.2804 1,273 2,13018.0 16.3 7.3
1,378 1,866 3,05290.3 38.2 63.4
9.4 55.8 27.5
0.3 0.3 0.52.1 2.6 5.2
112.7 40.0 –4.920 35 32
205 317 374
2,139 24,004 18,876
16.1 2.0 13.866 71 5895 91 9491 73 8297 97 9879 78 8274 51 6381 86 89
20.020.1
33 23 23
9.0 22.4 23.811.1 11.8 12.13.5 4.4 4.20.0 6.3 9.41.3 1.8 1.30.0 0.0 0.00.4 0.3 0.50.0 0.3 0.2
–0.3 6.3 4.6
Country data
Latin America & Caribbean
group
Upper middle-income group
Population (millions) 10.0 Land area (1,000 sq. km) 48 GDP ($ billions) 45.5
Dominican Republic

GNI per capita, World Bank Atlas method ($)Urban population (% of total)Urban population growth (average annual %, 1990–2008)Population growth (average annual %, 1990–2008) AgricultureAgricultural land (% of land area)Agricultural productivity (value added per worker, 2000 $)Food production index (1999–2001 = 100)Population density, rural (people/sq. km of arable land) Forests and biodiversityForest area (% of land area)Deforestation (average annual %, 1990–2007)Nationally protected area (% of land area)Threatened species, mammalsThreatened species, birdsThreatened species, fishThreatened species, higher plantsGEF benefits index for biodiversity (0–100, median is 1.5) EnergyGDP per unit of energy use (2005 PPP $/kg oil equivalent)Energy use per capita (kg oil equivalent)Energy from biomass products and waste (% of total)Electric power consumption per capita (kWh)Electricity generated using fossil fuel (% of total)Electricity generated by hydropower (% of total) Emissions and pollutionCO2 emissions per unit of GDP (kg/2005 PPP $)CO2 emissions per capita (metric tons)CO2 emissions growth (%, 1990–2006)Particulate matter (urban-pop.-weighted avg., μg/cu. m)Transport sector energy use per capita (kg of oil equivalent) Water and sanitationInternal freshwater resources per capita (cu. m)Freshwater withdrawal
Total (% of internal resources)Agriculture (% of total freshwater withdrawal)
Access to improved water source (% of total population)Rural (% of rural population)Urban (% of urban population)
Access to improved sanitation (% of total population)Rural (% of rural population)Urban (% of urban population)
Environment and healthAcute resp. infection prevalence (% of children under five)Diarrhea prevalence (% of children under five)Under-five mortality rate (per 1,000 live births) National accounting aggregatesGross savings (% of GNI)Consumption of fixed capital (% of GNI)Education expenditure (% of GNI)Energy depletion (% of GNI)Mineral depletion (% of GNI)Net forest depletion (% of GNI)CO2 damage (% of GNI)Particulate emissions damage (% of GNI)Adjusted net savings (% of GNI)
73The Little Green Data Book 2010
3,690 6,768 2,07366 79 412.5 2.0 3.01.5 1.5 1.4
27 36 501,972 3,452 589
112 125 123392 233 516
37.8 44.9 24.81.6 0.5 0.2
25.4 22.8 11.2436915
1,83929.3
7.9 7.5 3.9885 1,273 1,0136.2 16.3 16.3
788 1,866 1,31047.9 38.2 80.052.1 55.8 15.2
0.3 0.3 0.82.4 2.6 2.8
86.1 40.0 105.725 35 69
320 317 97
32,379 24,004 3,154
3.9 2.0 8.782 71 8195 91 8691 73 8198 97 9484 78 5272 51 4191 86 69
57.219.9
25 23 64
31.8 22.4 41.110.8 11.8 9.6
1.4 4.4 2.321.1 6.3 8.10.4 1.8 1.40.0 0.0 0.20.5 0.3 1.10.1 0.3 0.60.4 6.3 22.4
Country data
Latin America & Caribbean
group
Lower middle-income group
Population (millions) 13 Land area (1,000 sq. km) 277 GDP ($ billions) 54.7
Ecuador

GNI per capita, World Bank Atlas method ($)Urban population (% of total)Urban population growth (average annual %, 1990–2008)Population growth (average annual %, 1990–2008) AgricultureAgricultural land (% of land area)Agricultural productivity (value added per worker, 2000 $)Food production index (1999–2001 = 100)Population density, rural (people/sq. km of arable land) Forests and biodiversityForest area (% of land area)Deforestation (average annual %, 1990–2007)Nationally protected area (% of land area)Threatened species, mammalsThreatened species, birdsThreatened species, fishThreatened species, higher plantsGEF benefits index for biodiversity (0–100, median is 1.5) EnergyGDP per unit of energy use (2005 PPP $/kg oil equivalent)Energy use per capita (kg oil equivalent)Energy from biomass products and waste (% of total)Electric power consumption per capita (kWh)Electricity generated using fossil fuel (% of total)Electricity generated by hydropower (% of total) Emissions and pollutionCO2 emissions per unit of GDP (kg/2005 PPP $)CO2 emissions per capita (metric tons)CO2 emissions growth (%, 1990–2006)Particulate matter (urban-pop.-weighted avg., μg/cu. m)Transport sector energy use per capita (kg of oil equivalent) Water and sanitationInternal freshwater resources per capita (cu. m)Freshwater withdrawal
Total (% of internal resources)Agriculture (% of total freshwater withdrawal)
Access to improved water source (% of total population)Rural (% of rural population)Urban (% of urban population)
Access to improved sanitation (% of total population)Rural (% of rural population)Urban (% of urban population)
Environment and healthAcute resp. infection prevalence (% of children under five)Diarrhea prevalence (% of children under five)Under-five mortality rate (per 1,000 live births) National accounting aggregatesGross savings (% of GNI)Consumption of fixed capital (% of GNI)Education expenditure (% of GNI)Energy depletion (% of GNI)Mineral depletion (% of GNI)Net forest depletion (% of GNI)CO2 damage (% of GNI)Particulate emissions damage (% of GNI)Adjusted net savings (% of GNI)
74 2010 The Little Green Data Book
1,800 3,237 2,07343 57 411.8 2.6 3.01.9 2.0 1.4
4 23 502,839 2,896 589
115 120 1231,521 746 516
0.1 2.5 24.8–2.8 –0.4 0.27.7 3.8 11.21710242
2.9
5.7 5.0 3.9840 1,275 1,0132.2 1.1 16.3
1,384 1,435 1,31086.9 91.1 80.012.4 7.4 15.2
0.5 0.6 0.82.1 3.5 2.8
119.6 96.4 105.7119 72 69151 258 97
22 714 3,154
3794.4 122.3 8.786 86 8198 88 8698 81 8199 95 9466 74 5252 59 4185 89 69
9.018.4
23 34 64
23.5 .. 41.19.3 10.5 9.64.4 4.4 2.3
14.5 18.6 8.10.5 1.5 1.40.2 0.1 0.20.9 0.7 1.10.5 0.4 0.62.1 .. 22.4
Country data
Middle East &
N. Africa group
Lower middle-income group
Population (millions) 82 Land area (1,000 sq. km) 995 GDP ($ billions) 162.3
Egypt, Arab Rep.

GNI per capita, World Bank Atlas method ($)Urban population (% of total)Urban population growth (average annual %, 1990–2008)Population growth (average annual %, 1990–2008) AgricultureAgricultural land (% of land area)Agricultural productivity (value added per worker, 2000 $)Food production index (1999–2001 = 100)Population density, rural (people/sq. km of arable land) Forests and biodiversityForest area (% of land area)Deforestation (average annual %, 1990–2007)Nationally protected area (% of land area)Threatened species, mammalsThreatened species, birdsThreatened species, fishThreatened species, higher plantsGEF benefits index for biodiversity (0–100, median is 1.5) EnergyGDP per unit of energy use (2005 PPP $/kg oil equivalent)Energy use per capita (kg oil equivalent)Energy from biomass products and waste (% of total)Electric power consumption per capita (kWh)Electricity generated using fossil fuel (% of total)Electricity generated by hydropower (% of total) Emissions and pollutionCO2 emissions per unit of GDP (kg/2005 PPP $)CO2 emissions per capita (metric tons)CO2 emissions growth (%, 1990–2006)Particulate matter (urban-pop.-weighted avg., μg/cu. m)Transport sector energy use per capita (kg of oil equivalent) Water and sanitationInternal freshwater resources per capita (cu. m)Freshwater withdrawal
Total (% of internal resources)Agriculture (% of total freshwater withdrawal)
Access to improved water source (% of total population)Rural (% of rural population)Urban (% of urban population)
Access to improved sanitation (% of total population)Rural (% of rural population)Urban (% of urban population)
Environment and healthAcute resp. infection prevalence (% of children under five)Diarrhea prevalence (% of children under five)Under-five mortality rate (per 1,000 live births) National accounting aggregatesGross savings (% of GNI)Consumption of fixed capital (% of GNI)Education expenditure (% of GNI)Energy depletion (% of GNI)Mineral depletion (% of GNI)Net forest depletion (% of GNI)CO2 damage (% of GNI)Particulate emissions damage (% of GNI)Adjusted net savings (% of GNI)
75The Little Green Data Book 2010
3,460 6,768 2,07361 79 41
1.9 2.0 3.00.8 1.5 1.4
75 36 502,628 3,452 589
115 125 123355 233 516
13.9 44.9 24.81.5 0.5 0.21.3 22.8 11.2
537
260.9
7.7 7.5 3.9800 1,273 1,01330.7 16.3 16.3939 1,866 1,31045.7 38.2 80.030.0 55.8 15.2
0.2 0.3 0.81.1 2.6 2.8
146.8 40.0 105.733 35 69
151 317 97
2,907 24,004 3,154
7.2 2.0 8.759 71 8184 91 8668 73 8194 97 9486 78 5280 51 4190 86 69
42.019.8
18 23 64
7.9 22.4 41.110.5 11.8 9.63.3 4.4 2.30.0 6.3 8.10.0 1.8 1.40.4 0.0 0.20.2 0.3 1.10.1 0.3 0.6
–0.1 6.3 22.4
Country data
Latin America & Caribbean
group
Lower middle-income group
Population (millions) 6.1 Land area (1,000 sq. km) 21 GDP ($ billions) 22.1
El Salvador

GNI per capita, World Bank Atlas method ($)Urban population (% of total)Urban population growth (average annual %, 1990–2008)Population growth (average annual %, 1990–2008) AgricultureAgricultural land (% of land area)Agricultural productivity (value added per worker, 2000 $)Food production index (1999–2001 = 100)Population density, rural (people/sq. km of arable land) Forests and biodiversityForest area (% of land area)Deforestation (average annual %, 1990–2007)Nationally protected area (% of land area)Threatened species, mammalsThreatened species, birdsThreatened species, fishThreatened species, higher plantsGEF benefits index for biodiversity (0–100, median is 1.5) EnergyGDP per unit of energy use (2005 PPP $/kg oil equivalent)Energy use per capita (kg oil equivalent)Energy from biomass products and waste (% of total)Electric power consumption per capita (kWh)Electricity generated using fossil fuel (% of total)Electricity generated by hydropower (% of total) Emissions and pollutionCO2 emissions per unit of GDP (kg/2005 PPP $)CO2 emissions per capita (metric tons)CO2 emissions growth (%, 1990–2006)Particulate matter (urban-pop.-weighted avg., μg/cu. m)Transport sector energy use per capita (kg of oil equivalent) Water and sanitationInternal freshwater resources per capita (cu. m)Freshwater withdrawal
Total (% of internal resources)Agriculture (% of total freshwater withdrawal)
Access to improved water source (% of total population)Rural (% of rural population)Urban (% of urban population)
Access to improved sanitation (% of total population)Rural (% of rural population)Urban (% of urban population)
Environment and healthAcute resp. infection prevalence (% of children under five)Diarrhea prevalence (% of children under five)Under-five mortality rate (per 1,000 live births) National accounting aggregatesGross savings (% of GNI)Consumption of fixed capital (% of GNI)Education expenditure (% of GNI)Energy depletion (% of GNI)Mineral depletion (% of GNI)Net forest depletion (% of GNI)CO2 damage (% of GNI)Particulate emissions damage (% of GNI)Adjusted net savings (% of GNI)
76 2010 The Little Green Data Book
14,980 39,68839 78
3.8 1.03.1 0.7
12 381,025 28,475
95 101300 341
57.1 28.90.9 –0.1
18.5 19.118
513631.5
.. 6.5
.. 5,321
.. 3.7
.. 9,753
.. 63.1
.. 11.1
0.3 0.47.0 12.7
3,500.0 18.08 26.. 1,166
40,485 9,305
0.4 10.4.. 43
43 10042 9845 10051 10046 9960 100
..
..148 7
55.8 18.520.7 13.8
1.1 4.674.2 2.00.0 0.20.0 0.00.4 0.20.0 0.1
–38.4 6.8
Country data
High-income group
Population (thousands) 659 Land area (1,000 sq. km) 28 GDP ($ billions) 18.5
Equatorial Guinea

GNI per capita, World Bank Atlas method ($)Urban population (% of total)Urban population growth (average annual %, 1990–2008)Population growth (average annual %, 1990–2008) AgricultureAgricultural land (% of land area)Agricultural productivity (value added per worker, 2000 $)Food production index (1999–2001 = 100)Population density, rural (people/sq. km of arable land) Forests and biodiversityForest area (% of land area)Deforestation (average annual %, 1990–2007)Nationally protected area (% of land area)Threatened species, mammalsThreatened species, birdsThreatened species, fishThreatened species, higher plantsGEF benefits index for biodiversity (0–100, median is 1.5) EnergyGDP per unit of energy use (2005 PPP $/kg oil equivalent)Energy use per capita (kg oil equivalent)Energy from biomass products and waste (% of total)Electric power consumption per capita (kWh)Electricity generated using fossil fuel (% of total)Electricity generated by hydropower (% of total) Emissions and pollutionCO2 emissions per unit of GDP (kg/2005 PPP $)CO2 emissions per capita (metric tons)CO2 emissions growth (%, 1990–2006)Particulate matter (urban-pop.-weighted avg., μg/cu. m)Transport sector energy use per capita (kg of oil equivalent) Water and sanitationInternal freshwater resources per capita (cu. m)Freshwater withdrawal
Total (% of internal resources)Agriculture (% of total freshwater withdrawal)
Access to improved water source (% of total population)Rural (% of rural population)Urban (% of urban population)
Access to improved sanitation (% of total population)Rural (% of rural population)Urban (% of urban population)
Environment and healthAcute resp. infection prevalence (% of children under five)Diarrhea prevalence (% of children under five)Under-five mortality rate (per 1,000 live births) National accounting aggregatesGross savings (% of GNI)Consumption of fixed capital (% of GNI)Education expenditure (% of GNI)Energy depletion (% of GNI)Mineral depletion (% of GNI)Net forest depletion (% of GNI)CO2 damage (% of GNI)Particulate emissions damage (% of GNI)Adjusted net savings (% of GNI)
77The Little Green Data Book 2010
300 1,077 52321 36 29
4.0 4.0 3.52.5 2.6 2.2
75 45 38119 330 318102 119 125596 353 666
15.3 26.1 24.70.2 0.7 0.74.3 12.4 11.9
99
143
0.8
4.0 3.2 3.2151 662 423
73.5 55.8 49.3.. 550 324
99.3 67.0 41.60.0 16.9 41.9
0.2 0.5 0.40.1 0.8 0.5
.. 37.4 –6.056 53 65
8 61 37
586 4,829 5,004
20.8 3.2 9.495 87 8860 58 6757 46 6074 81 865 31 383 24 33
14 42 52
19.023.6
58 144 118
.. 16.5 25.96.9 9.0 7.91.9 3.3 3.40.0 14.2 7.80.0 1.3 1.00.8 0.6 1.00.3 0.6 0.70.3 0.4 0.3
.. –6.2 10.7
Country data
Sub-Saharan Africa group
Low-income group
Population (millions) 4.9 Land area (1,000 sq. km) 101 GDP ($ billions) 1.7
Eritrea

GNI per capita, World Bank Atlas method ($)Urban population (% of total)Urban population growth (average annual %, 1990–2008)Population growth (average annual %, 1990–2008) AgricultureAgricultural land (% of land area)Agricultural productivity (value added per worker, 2000 $)Food production index (1999–2001 = 100)Population density, rural (people/sq. km of arable land) Forests and biodiversityForest area (% of land area)Deforestation (average annual %, 1990–2007)Nationally protected area (% of land area)Threatened species, mammalsThreatened species, birdsThreatened species, fishThreatened species, higher plantsGEF benefits index for biodiversity (0–100, median is 1.5) EnergyGDP per unit of energy use (2005 PPP $/kg oil equivalent)Energy use per capita (kg oil equivalent)Energy from biomass products and waste (% of total)Electric power consumption per capita (kWh)Electricity generated using fossil fuel (% of total)Electricity generated by hydropower (% of total) Emissions and pollutionCO2 emissions per unit of GDP (kg/2005 PPP $)CO2 emissions per capita (metric tons)CO2 emissions growth (%, 1990–2006)Particulate matter (urban-pop.-weighted avg., μg/cu. m)Transport sector energy use per capita (kg of oil equivalent) Water and sanitationInternal freshwater resources per capita (cu. m)Freshwater withdrawal
Total (% of internal resources)Agriculture (% of total freshwater withdrawal)
Access to improved water source (% of total population)Rural (% of rural population)Urban (% of urban population)
Access to improved sanitation (% of total population)Rural (% of rural population)Urban (% of urban population)
Environment and healthAcute resp. infection prevalence (% of children under five)Diarrhea prevalence (% of children under five)Under-five mortality rate (per 1,000 live births) National accounting aggregatesGross savings (% of GNI)Consumption of fixed capital (% of GNI)Education expenditure (% of GNI)Energy depletion (% of GNI)Mineral depletion (% of GNI)Net forest depletion (% of GNI)CO2 damage (% of GNI)Particulate emissions damage (% of GNI)Adjusted net savings (% of GNI)
78 2010 The Little Green Data Book
14,570 39,68869 78
–1.0 1.0–0.9 0.7
19 382,940 28,475
127 10169 341
54.3 28.9–0.4 –0.146.8 19.1
1340
0.1
4.7 6.54,198 5,321
10.5 3.76,273 9,753
98.6 63.10.2 11.1
0.7 0.413.0 12.7
–37.9 18.013 26
605 1,166
9,475 9,305
1.2 10.45 43
100 10099 98
100 10095 10094 9996 100
..
..6 7
20.1 18.513.5 13.8
4.6 4.61.5 2.00.0 0.20.0 0.00.7 0.20.0 0.19.0 6.8
Country data
High-income group
Population (millions) 1.3 Land area (1,000 sq. km) 42 GDP ($ billions) 23.4
Estonia

GNI per capita, World Bank Atlas method ($)Urban population (% of total)Urban population growth (average annual %, 1990–2008)Population growth (average annual %, 1990–2008) AgricultureAgricultural land (% of land area)Agricultural productivity (value added per worker, 2000 $)Food production index (1999–2001 = 100)Population density, rural (people/sq. km of arable land) Forests and biodiversityForest area (% of land area)Deforestation (average annual %, 1990–2007)Nationally protected area (% of land area)Threatened species, mammalsThreatened species, birdsThreatened species, fishThreatened species, higher plantsGEF benefits index for biodiversity (0–100, median is 1.5) EnergyGDP per unit of energy use (2005 PPP $/kg oil equivalent)Energy use per capita (kg oil equivalent)Energy from biomass products and waste (% of total)Electric power consumption per capita (kWh)Electricity generated using fossil fuel (% of total)Electricity generated by hydropower (% of total) Emissions and pollutionCO2 emissions per unit of GDP (kg/2005 PPP $)CO2 emissions per capita (metric tons)CO2 emissions growth (%, 1990–2006)Particulate matter (urban-pop.-weighted avg., μg/cu. m)Transport sector energy use per capita (kg of oil equivalent) Water and sanitationInternal freshwater resources per capita (cu. m)Freshwater withdrawal
Total (% of internal resources)Agriculture (% of total freshwater withdrawal)
Access to improved water source (% of total population)Rural (% of rural population)Urban (% of urban population)
Access to improved sanitation (% of total population)Rural (% of rural population)Urban (% of urban population)
Environment and healthAcute resp. infection prevalence (% of children under five)Diarrhea prevalence (% of children under five)Under-five mortality rate (per 1,000 live births) National accounting aggregatesGross savings (% of GNI)Consumption of fixed capital (% of GNI)Education expenditure (% of GNI)Energy depletion (% of GNI)Mineral depletion (% of GNI)Net forest depletion (% of GNI)CO2 damage (% of GNI)Particulate emissions damage (% of GNI)Adjusted net savings (% of GNI)
79The Little Green Data Book 2010
Country data
Sub-Saharan Africa group
Low-income group
280 1,077 52317 36 29
4.5 4.0 3.52.9 2.6 2.2
35 45 38199 330 318135 119 125467 353 666
12.7 26.1 24.70.9 0.7 0.7
17.5 12.4 11.93122
2228.4
2.6 3.2 3.2290 662 423
90.2 55.8 49.340 550 3243.8 67.0 41.6
96.2 16.9 41.9
0.1 0.5 0.40.08 0.82 0.5199.0 37.4 –6.0
68 53 6515 61 37
1,551 4,829 5,004
4.6 3.2 9.494 87 8842 58 6731 46 6096 81 8611 31 388 24 33
27 42 52
12.623.6109 144 118
17.3 16.5 25.96.7 9.0 7.93.7 3.3 3.40.0 14.2 7.80.3 1.3 1.04.7 0.6 1.00.2 0.6 0.70.2 0.4 0.38.9 –6.2 10.7
Population (millions) 81 Land area (1,000 sq. km) 1,000 GDP ($ billions) 25.6
Ethiopia

GNI per capita, World Bank Atlas method ($)Urban population (% of total)Urban population growth (average annual %, 1990–2008)Population growth (average annual %, 1990–2008) AgricultureAgricultural land (% of land area)Agricultural productivity (value added per worker, 2000 $)Food production index (1999–2001 = 100)Population density, rural (people/sq. km of arable land) Forests and biodiversityForest area (% of land area)Deforestation (average annual %, 1990–2007)Nationally protected area (% of land area)Threatened species, mammalsThreatened species, birdsThreatened species, fishThreatened species, higher plantsGEF benefits index for biodiversity (0–100, median is 1.5) EnergyGDP per unit of energy use (2005 PPP $/kg oil equivalent)Energy use per capita (kg oil equivalent)Energy from biomass products and waste (% of total)Electric power consumption per capita (kWh)Electricity generated using fossil fuel (% of total)Electricity generated by hydropower (% of total) Emissions and pollutionCO2 emissions per unit of GDP (kg/2005 PPP $)CO2 emissions per capita (metric tons)CO2 emissions growth (%, 1990–2006)Particulate matter (urban-pop.-weighted avg., μg/cu. m)Transport sector energy use per capita (kg of oil equivalent) Water and sanitationInternal freshwater resources per capita (cu. m)Freshwater withdrawal
Total (% of internal resources)Agriculture (% of total freshwater withdrawal)
Access to improved water source (% of total population)Rural (% of rural population)Urban (% of urban population)
Access to improved sanitation (% of total population)Rural (% of rural population)Urban (% of urban population)
Environment and healthAcute resp. infection prevalence (% of children under five)Diarrhea prevalence (% of children under five)Under-five mortality rate (per 1,000 live births) National accounting aggregatesGross savings (% of GNI)Consumption of fixed capital (% of GNI)Education expenditure (% of GNI)Energy depletion (% of GNI)Mineral depletion (% of GNI)Net forest depletion (% of GNI)CO2 damage (% of GNI)Particulate emissions damage (% of GNI)Adjusted net savings (% of GNI)
80 2010 The Little Green Data Book
.. 39,68841 78
1.8 1.00.1 0.7
2 38.. 28,475
67 101953 341
0.1 28.90.0 –0.1
.. 19.1
..0..0
0.3
.. 6.5
.. 5,321
.. 3.7
.. 9,753
.. 63.1
.. 11.1
.. 0.414.0 12.78.8 18.014 26
.. 1,166
.. 9,305
.. 10.4
.. 43
.. 100
.. 98
.. 100
.. 100
.. 99
.. 100
..
..
.. 7
.. 18.5
.. 13.8
.. 4.6
.. 2.0
.. 0.2
.. 0.0
.. 0.2
.. 0.1
.. 6.8
Country data
High-income group
Population (thousands) 49 Land area (1,000 sq. km) 1 GDP ($ billions) 2.0
Faeroe Islands

GNI per capita, World Bank Atlas method ($)Urban population (% of total)Urban population growth (average annual %, 1990–2008)Population growth (average annual %, 1990–2008) AgricultureAgricultural land (% of land area)Agricultural productivity (value added per worker, 2000 $)Food production index (1999–2001 = 100)Population density, rural (people/sq. km of arable land) Forests and biodiversityForest area (% of land area)Deforestation (average annual %, 1990–2007)Nationally protected area (% of land area)Threatened species, mammalsThreatened species, birdsThreatened species, fishThreatened species, higher plantsGEF benefits index for biodiversity (0–100, median is 1.5) EnergyGDP per unit of energy use (2005 PPP $/kg oil equivalent)Energy use per capita (kg oil equivalent)Energy from biomass products and waste (% of total)Electric power consumption per capita (kWh)Electricity generated using fossil fuel (% of total)Electricity generated by hydropower (% of total) Emissions and pollutionCO2 emissions per unit of GDP (kg/2005 PPP $)CO2 emissions per capita (metric tons)CO2 emissions growth (%, 1990–2006)Particulate matter (urban-pop.-weighted avg., μg/cu. m)Transport sector energy use per capita (kg of oil equivalent) Water and sanitationInternal freshwater resources per capita (cu. m)Freshwater withdrawal
Total (% of internal resources)Agriculture (% of total freshwater withdrawal)
Access to improved water source (% of total population)Rural (% of rural population)Urban (% of urban population)
Access to improved sanitation (% of total population)Rural (% of rural population)Urban (% of urban population)
Environment and healthAcute resp. infection prevalence (% of children under five)Diarrhea prevalence (% of children under five)Under-five mortality rate (per 1,000 live births) National accounting aggregatesGross savings (% of GNI)Consumption of fixed capital (% of GNI)Education expenditure (% of GNI)Energy depletion (% of GNI)Mineral depletion (% of GNI)Net forest depletion (% of GNI)CO2 damage (% of GNI)Particulate emissions damage (% of GNI)Adjusted net savings (% of GNI)
81The Little Green Data Book 2010
4,010 2,644 7,85252 44 752.1 3.4 1.50.9 1.0 1.0
23 50 301,907 509 3,399
92 127 120238 552 146
54.7 28.5 37.3–0.1 0.1 0.22.2 14.7 14.0
61011663.9
.. 3.6 5.2
.. 1,295 2,130
.. 12.8 7.3
.. 1,883 3,052
.. 82.2 63.4
.. 14.7 27.5
0.4 0.9 0.51.9 3.8 5.2
96.9 135.9 –4.922 69 32
.. 113 374
34,041 4,940 18,876
0.2 10.2 13.8.. 74 58
47 87 9451 81 8243 96 9871 66 8255 59 6387 75 89
..
..18 29 23
–1.2 47.3 23.810.6 10.1 12.16.0 2.0 4.20.0 7.2 9.40.9 1.5 1.30.0 0.0 0.00.3 1.1 0.50.1 0.7 0.2
–7.1 28.6 4.6
Country data
East Asia & Pacific
group
Upper middle-income group
Population (thousands) 844 Land area (1,000 sq. km) 18 GDP ($ billions) 3.6
Fiji

GNI per capita, World Bank Atlas method ($)Urban population (% of total)Urban population growth (average annual %, 1990–2008)Population growth (average annual %, 1990–2008) AgricultureAgricultural land (% of land area)Agricultural productivity (value added per worker, 2000 $)Food production index (1999–2001 = 100)Population density, rural (people/sq. km of arable land) Forests and biodiversityForest area (% of land area)Deforestation (average annual %, 1990–2007)Nationally protected area (% of land area)Threatened species, mammalsThreatened species, birdsThreatened species, fishThreatened species, higher plantsGEF benefits index for biodiversity (0–100, median is 1.5) EnergyGDP per unit of energy use (2005 PPP $/kg oil equivalent)Energy use per capita (kg oil equivalent)Energy from biomass products and waste (% of total)Electric power consumption per capita (kWh)Electricity generated using fossil fuel (% of total)Electricity generated by hydropower (% of total) Emissions and pollutionCO2 emissions per unit of GDP (kg/2005 PPP $)CO2 emissions per capita (metric tons)CO2 emissions growth (%, 1990–2006)Particulate matter (urban-pop.-weighted avg., μg/cu. m)Transport sector energy use per capita (kg of oil equivalent) Water and sanitationInternal freshwater resources per capita (cu. m)Freshwater withdrawal
Total (% of internal resources)Agriculture (% of total freshwater withdrawal)
Access to improved water source (% of total population)Rural (% of rural population)Urban (% of urban population)
Access to improved sanitation (% of total population)Rural (% of rural population)Urban (% of urban population)
Environment and healthAcute resp. infection prevalence (% of children under five)Diarrhea prevalence (% of children under five)Under-five mortality rate (per 1,000 live births) National accounting aggregatesGross savings (% of GNI)Consumption of fixed capital (% of GNI)Education expenditure (% of GNI)Energy depletion (% of GNI)Mineral depletion (% of GNI)Net forest depletion (% of GNI)CO2 damage (% of GNI)Particulate emissions damage (% of GNI)Adjusted net savings (% of GNI)
82 2010 The Little Green Data Book
47,600 39,68863 780.5 1.00.4 0.7
8 3840,031 28,475
102 10187 341
74.0 28.9–0.1 –0.19.3 19.1
1451
0.2
4.8 6.56,895 5,321
20.1 3.717,162 9,753
31.5 63.117.4 11.1
0.4 0.412.7 12.730.8 18.0
18 26874 1,166
20,232 9,305
2.3 10.43 43
100 100100 98100 100100 100100 99100 100
..
..3 7
24.8 18.514.1 13.85.6 4.60.0 2.00.1 0.20.0 0.00.2 0.20.0 0.1
16.0 6.8
Country data
High-income group
Population (millions) 5.3 Land area (1,000 sq. km) 304 GDP ($ billions) 272.7
Finland
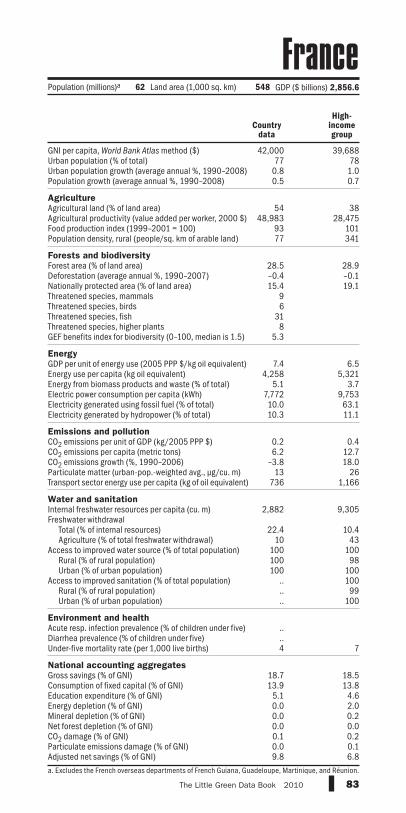
GNI per capita, World Bank Atlas method ($)Urban population (% of total)Urban population growth (average annual %, 1990–2008)Population growth (average annual %, 1990–2008) AgricultureAgricultural land (% of land area)Agricultural productivity (value added per worker, 2000 $)Food production index (1999–2001 = 100)Population density, rural (people/sq. km of arable land) Forests and biodiversityForest area (% of land area)Deforestation (average annual %, 1990–2007)Nationally protected area (% of land area)Threatened species, mammalsThreatened species, birdsThreatened species, fishThreatened species, higher plantsGEF benefits index for biodiversity (0–100, median is 1.5) EnergyGDP per unit of energy use (2005 PPP $/kg oil equivalent)Energy use per capita (kg oil equivalent)Energy from biomass products and waste (% of total)Electric power consumption per capita (kWh)Electricity generated using fossil fuel (% of total)Electricity generated by hydropower (% of total) Emissions and pollutionCO2 emissions per unit of GDP (kg/2005 PPP $)CO2 emissions per capita (metric tons)CO2 emissions growth (%, 1990–2006)Particulate matter (urban-pop.-weighted avg., μg/cu. m)Transport sector energy use per capita (kg of oil equivalent) Water and sanitationInternal freshwater resources per capita (cu. m)Freshwater withdrawal
Total (% of internal resources)Agriculture (% of total freshwater withdrawal)
Access to improved water source (% of total population)Rural (% of rural population)Urban (% of urban population)
Access to improved sanitation (% of total population)Rural (% of rural population)Urban (% of urban population)
Environment and healthAcute resp. infection prevalence (% of children under five)Diarrhea prevalence (% of children under five)Under-five mortality rate (per 1,000 live births) National accounting aggregatesGross savings (% of GNI)Consumption of fixed capital (% of GNI)Education expenditure (% of GNI)Energy depletion (% of GNI)Mineral depletion (% of GNI)Net forest depletion (% of GNI)CO2 damage (% of GNI)Particulate emissions damage (% of GNI)Adjusted net savings (% of GNI)
83The Little Green Data Book 2010
42,000 39,68877 78
0.8 1.00.5 0.7
54 3848,983 28,475
93 10177 341
28.5 28.9–0.4 –0.115.4 19.1
96
318
5.3
7.4 6.54,258 5,321
5.1 3.77,772 9,75310.0 63.110.3 11.1
0.2 0.46.2 12.7
–3.8 18.013 26
736 1,166
2,882 9,305
22.4 10.410 43
100 100100 98100 100
.. 100
.. 99
.. 100
..
..4 7
18.7 18.513.9 13.8
5.1 4.60.0 2.00.0 0.20.0 0.00.1 0.20.0 0.19.8 6.8
a. Excludes the French overseas departments of French Guiana, Guadeloupe, Martinique, and Réunion.
Population (millions)a 62 Land area (1,000 sq. km) 548 GDP ($ billions) 2,856.6
Country data
High-income group
France

GNI per capita, World Bank Atlas method ($)Urban population (% of total)Urban population growth (average annual %, 1990–2008)Population growth (average annual %, 1990–2008) AgricultureAgricultural land (% of land area)Agricultural productivity (value added per worker, 2000 $)Food production index (1999–2001 = 100)Population density, rural (people/sq. km of arable land) Forests and biodiversityForest area (% of land area)Deforestation (average annual %, 1990–2007)Nationally protected area (% of land area)Threatened species, mammalsThreatened species, birdsThreatened species, fishThreatened species, higher plantsGEF benefits index for biodiversity (0–100, median is 1.5) EnergyGDP per unit of energy use (2005 PPP $/kg oil equivalent)Energy use per capita (kg oil equivalent)Energy from biomass products and waste (% of total)Electric power consumption per capita (kWh)Electricity generated using fossil fuel (% of total)Electricity generated by hydropower (% of total) Emissions and pollutionCO2 emissions per unit of GDP (kg/2005 PPP $)CO2 emissions per capita (metric tons)CO2 emissions growth (%, 1990–2006)Particulate matter (urban-pop.-weighted avg., μg/cu. m)Transport sector energy use per capita (kg of oil equivalent) Water and sanitationInternal freshwater resources per capita (cu. m)Freshwater withdrawal
Total (% of internal resources)Agriculture (% of total freshwater withdrawal)
Access to improved water source (% of total population)Rural (% of rural population)Urban (% of urban population)
Access to improved sanitation (% of total population)Rural (% of rural population)Urban (% of urban population)
Environment and healthAcute resp. infection prevalence (% of children under five)Diarrhea prevalence (% of children under five)Under-five mortality rate (per 1,000 live births) National accounting aggregatesGross savings (% of GNI)Consumption of fixed capital (% of GNI)Education expenditure (% of GNI)Energy depletion (% of GNI)Mineral depletion (% of GNI)Net forest depletion (% of GNI)CO2 damage (% of GNI)Particulate emissions damage (% of GNI)Adjusted net savings (% of GNI)
84 2010 The Little Green Data Book
16,080 39,68852 781.3 1.01.7 0.7
12 38.. 28,475
112 1014,227 341
28.7 28.90.0 –0.11.1 19.1
1321347
4.6
.. 6.5
.. 5,321
.. 3.7
.. 9,753
.. 63.1
.. 11.1
.. 0.43.2 12.7
30.2 18.0.. 26.. 1,166
38,120 9,305
.. 10.4
.. 43100 100100 98100 100
98 10097 9999 100
..
..
.. 7
.. 18.5
.. 13.8
.. 4.6
.. 2.0
.. 0.2
.. 0.0
.. 0.2
.. 0.1
.. 6.8
Country data
High-income group
Population (thousands) 266 Land area (1,000 sq. km) 4 GDP ($ billions) 3.4
French Polynesia

GNI per capita, World Bank Atlas method ($)Urban population (% of total)Urban population growth (average annual %, 1990–2008)Population growth (average annual %, 1990–2008) AgricultureAgricultural land (% of land area)Agricultural productivity (value added per worker, 2000 $)Food production index (1999–2001 = 100)Population density, rural (people/sq. km of arable land) Forests and biodiversityForest area (% of land area)Deforestation (average annual %, 1990–2007)Nationally protected area (% of land area)Threatened species, mammalsThreatened species, birdsThreatened species, fishThreatened species, higher plantsGEF benefits index for biodiversity (0–100, median is 1.5) EnergyGDP per unit of energy use (2005 PPP $/kg oil equivalent)Energy use per capita (kg oil equivalent)Energy from biomass products and waste (% of total)Electric power consumption per capita (kWh)Electricity generated using fossil fuel (% of total)Electricity generated by hydropower (% of total) Emissions and pollutionCO2 emissions per unit of GDP (kg/2005 PPP $)CO2 emissions per capita (metric tons)CO2 emissions growth (%, 1990–2006)Particulate matter (urban-pop.-weighted avg., μg/cu. m)Transport sector energy use per capita (kg of oil equivalent) Water and sanitationInternal freshwater resources per capita (cu. m)Freshwater withdrawal
Total (% of internal resources)Agriculture (% of total freshwater withdrawal)
Access to improved water source (% of total population)Rural (% of rural population)Urban (% of urban population)
Access to improved sanitation (% of total population)Rural (% of rural population)Urban (% of urban population)
Environment and healthAcute resp. infection prevalence (% of children under five)Diarrhea prevalence (% of children under five)Under-five mortality rate (per 1,000 live births) National accounting aggregatesGross savings (% of GNI)Consumption of fixed capital (% of GNI)Education expenditure (% of GNI)Energy depletion (% of GNI)Mineral depletion (% of GNI)Net forest depletion (% of GNI)CO2 damage (% of GNI)Particulate emissions damage (% of GNI)Adjusted net savings (% of GNI)
85The Little Green Data Book 2010
7,320 1,077 7,85285 36 753.6 4.0 1.52.5 2.6 1.0
20 45 301,835 330 3,399
103 119 12068 353 146
84.4 26.1 37.30.0 0.7 0.2
16.5 12.4 14.013
521
1083.0
10.3 3.2 5.21,300 662 2,130
56.6 55.8 7.31,066 550 3,05256.2 67.0 63.443.4 16.9 27.5
0.1 0.5 0.51.5 0.8 5.2
–66.2 37.4 –4.98 53 32
117 61 374
115,340 4,829 18,876
0.1 3.2 13.842 87 5887 58 9447 46 8295 81 9836 31 8230 24 6337 42 89
13.015.7
77 144 23
48.8 16.5 23.813.9 9.0 12.1
3.1 3.3 4.234.3 14.2 9.4
0.0 1.3 1.30.0 0.6 0.00.1 0.6 0.50.0 0.4 0.23.6 –6.2 4.6
Population (millions) 1.4 Land area (1,000 sq. km) 258 GDP ($ billions) 14.5
Country data
Sub-Saharan Africa group
Upper middle-income group
Gabon
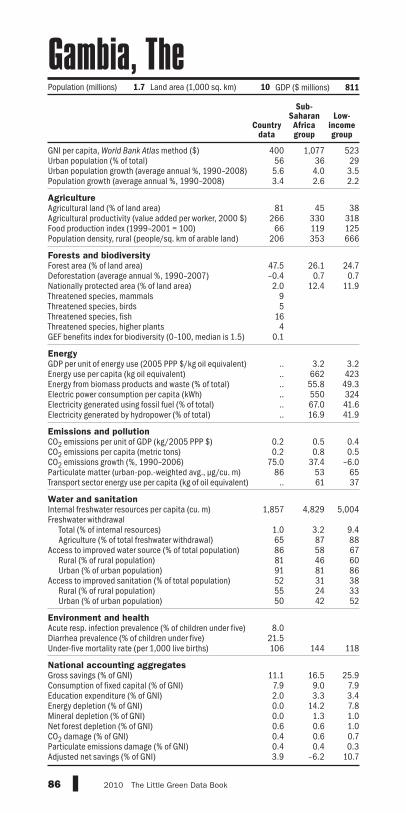
GNI per capita, World Bank Atlas method ($)Urban population (% of total)Urban population growth (average annual %, 1990–2008)Population growth (average annual %, 1990–2008) AgricultureAgricultural land (% of land area)Agricultural productivity (value added per worker, 2000 $)Food production index (1999–2001 = 100)Population density, rural (people/sq. km of arable land) Forests and biodiversityForest area (% of land area)Deforestation (average annual %, 1990–2007)Nationally protected area (% of land area)Threatened species, mammalsThreatened species, birdsThreatened species, fishThreatened species, higher plantsGEF benefits index for biodiversity (0–100, median is 1.5) EnergyGDP per unit of energy use (2005 PPP $/kg oil equivalent)Energy use per capita (kg oil equivalent)Energy from biomass products and waste (% of total)Electric power consumption per capita (kWh)Electricity generated using fossil fuel (% of total)Electricity generated by hydropower (% of total) Emissions and pollutionCO2 emissions per unit of GDP (kg/2005 PPP $)CO2 emissions per capita (metric tons)CO2 emissions growth (%, 1990–2006)Particulate matter (urban-pop.-weighted avg., μg/cu. m)Transport sector energy use per capita (kg of oil equivalent) Water and sanitationInternal freshwater resources per capita (cu. m)Freshwater withdrawal
Total (% of internal resources)Agriculture (% of total freshwater withdrawal)
Access to improved water source (% of total population)Rural (% of rural population)Urban (% of urban population)
Access to improved sanitation (% of total population)Rural (% of rural population)Urban (% of urban population)
Environment and healthAcute resp. infection prevalence (% of children under five)Diarrhea prevalence (% of children under five)Under-five mortality rate (per 1,000 live births) National accounting aggregatesGross savings (% of GNI)Consumption of fixed capital (% of GNI)Education expenditure (% of GNI)Energy depletion (% of GNI)Mineral depletion (% of GNI)Net forest depletion (% of GNI)CO2 damage (% of GNI)Particulate emissions damage (% of GNI)Adjusted net savings (% of GNI)
86 2010 The Little Green Data Book
400 1,077 52356 36 295.6 4.0 3.53.4 2.6 2.2
81 45 38266 330 318
66 119 125206 353 666
47.5 26.1 24.7–0.4 0.7 0.72.0 12.4 11.9
95
164
0.1
.. 3.2 3.2
.. 662 423
.. 55.8 49.3
.. 550 324
.. 67.0 41.6
.. 16.9 41.9
0.2 0.5 0.40.2 0.8 0.5
75.0 37.4 –6.086 53 65
.. 61 37
1,857 4,829 5,004
1.0 3.2 9.465 87 8886 58 6781 46 6091 81 8652 31 3855 24 3350 42 52
8.021.5106 144 118
11.1 16.5 25.97.9 9.0 7.92.0 3.3 3.40.0 14.2 7.80.0 1.3 1.00.6 0.6 1.00.4 0.6 0.70.4 0.4 0.33.9 –6.2 10.7
Country data
Sub-Saharan Africa group
Low-income group
Population (millions) 1.7 Land area (1,000 sq. km) 10 GDP ($ millions) 811
Gambia, The
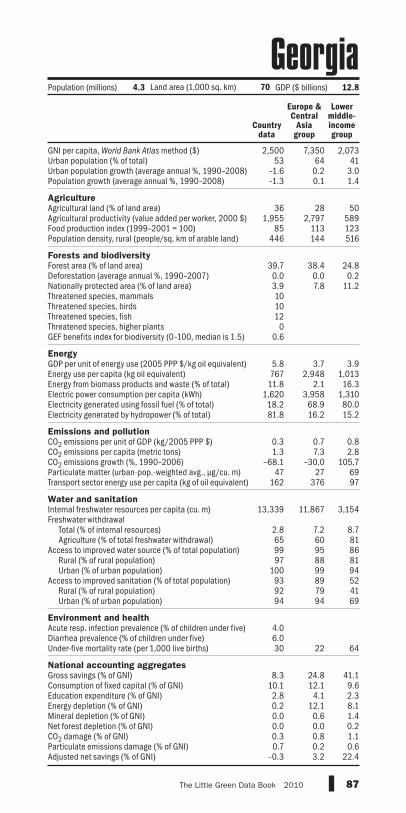
GNI per capita, World Bank Atlas method ($)Urban population (% of total)Urban population growth (average annual %, 1990–2008)Population growth (average annual %, 1990–2008) AgricultureAgricultural land (% of land area)Agricultural productivity (value added per worker, 2000 $)Food production index (1999–2001 = 100)Population density, rural (people/sq. km of arable land) Forests and biodiversityForest area (% of land area)Deforestation (average annual %, 1990–2007)Nationally protected area (% of land area)Threatened species, mammalsThreatened species, birdsThreatened species, fishThreatened species, higher plantsGEF benefits index for biodiversity (0–100, median is 1.5) EnergyGDP per unit of energy use (2005 PPP $/kg oil equivalent)Energy use per capita (kg oil equivalent)Energy from biomass products and waste (% of total)Electric power consumption per capita (kWh)Electricity generated using fossil fuel (% of total)Electricity generated by hydropower (% of total) Emissions and pollutionCO2 emissions per unit of GDP (kg/2005 PPP $)CO2 emissions per capita (metric tons)CO2 emissions growth (%, 1990–2006)Particulate matter (urban-pop.-weighted avg., μg/cu. m)Transport sector energy use per capita (kg of oil equivalent) Water and sanitationInternal freshwater resources per capita (cu. m)Freshwater withdrawal
Total (% of internal resources)Agriculture (% of total freshwater withdrawal)
Access to improved water source (% of total population)Rural (% of rural population)Urban (% of urban population)
Access to improved sanitation (% of total population)Rural (% of rural population)Urban (% of urban population)
Environment and healthAcute resp. infection prevalence (% of children under five)Diarrhea prevalence (% of children under five)Under-five mortality rate (per 1,000 live births) National accounting aggregatesGross savings (% of GNI)Consumption of fixed capital (% of GNI)Education expenditure (% of GNI)Energy depletion (% of GNI)Mineral depletion (% of GNI)Net forest depletion (% of GNI)CO2 damage (% of GNI)Particulate emissions damage (% of GNI)Adjusted net savings (% of GNI)
87The Little Green Data Book 2010
2,500 7,350 2,07353 64 41
–1.6 0.2 3.0–1.3 0.1 1.4
36 28 501,955 2,797 589
85 113 123446 144 516
39.7 38.4 24.80.0 0.0 0.23.9 7.8 11.2101012
00.6
5.8 3.7 3.9767 2,948 1,01311.8 2.1 16.3
1,620 3,958 1,31018.2 68.9 80.081.8 16.2 15.2
0.3 0.7 0.81.3 7.3 2.8
–68.1 –30.0 105.747 27 69
162 376 97
13,339 11,867 3,154
2.8 7.2 8.765 60 8199 95 8697 88 81
100 99 9493 89 5292 79 4194 94 69
4.06.030 22 64
8.3 24.8 41.110.1 12.1 9.62.8 4.1 2.30.2 12.1 8.10.0 0.6 1.40.0 0.0 0.20.3 0.8 1.10.7 0.2 0.6
–0.3 3.2 22.4
Country data
Europe & Central
Asia group
Lower middle-income group
Population (millions) 4.3 Land area (1,000 sq. km) 70 GDP ($ billions) 12.8
Georgia
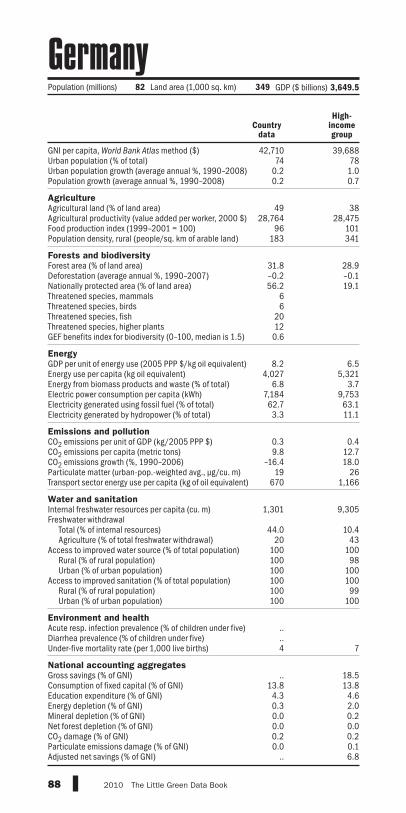
GNI per capita, World Bank Atlas method ($)Urban population (% of total)Urban population growth (average annual %, 1990–2008)Population growth (average annual %, 1990–2008) AgricultureAgricultural land (% of land area)Agricultural productivity (value added per worker, 2000 $)Food production index (1999–2001 = 100)Population density, rural (people/sq. km of arable land) Forests and biodiversityForest area (% of land area)Deforestation (average annual %, 1990–2007)Nationally protected area (% of land area)Threatened species, mammalsThreatened species, birdsThreatened species, fishThreatened species, higher plantsGEF benefits index for biodiversity (0–100, median is 1.5) EnergyGDP per unit of energy use (2005 PPP $/kg oil equivalent)Energy use per capita (kg oil equivalent)Energy from biomass products and waste (% of total)Electric power consumption per capita (kWh)Electricity generated using fossil fuel (% of total)Electricity generated by hydropower (% of total) Emissions and pollutionCO2 emissions per unit of GDP (kg/2005 PPP $)CO2 emissions per capita (metric tons)CO2 emissions growth (%, 1990–2006)Particulate matter (urban-pop.-weighted avg., μg/cu. m)Transport sector energy use per capita (kg of oil equivalent) Water and sanitationInternal freshwater resources per capita (cu. m)Freshwater withdrawal
Total (% of internal resources)Agriculture (% of total freshwater withdrawal)
Access to improved water source (% of total population)Rural (% of rural population)Urban (% of urban population)
Access to improved sanitation (% of total population)Rural (% of rural population)Urban (% of urban population)
Environment and healthAcute resp. infection prevalence (% of children under five)Diarrhea prevalence (% of children under five)Under-five mortality rate (per 1,000 live births) National accounting aggregatesGross savings (% of GNI)Consumption of fixed capital (% of GNI)Education expenditure (% of GNI)Energy depletion (% of GNI)Mineral depletion (% of GNI)Net forest depletion (% of GNI)CO2 damage (% of GNI)Particulate emissions damage (% of GNI)Adjusted net savings (% of GNI)
88 2010 The Little Green Data Book
42,710 39,68874 78
0.2 1.00.2 0.7
49 3828,764 28,475
96 101183 341
31.8 28.9–0.2 –0.156.2 19.1
66
20120.6
8.2 6.54,027 5,321
6.8 3.77,184 9,75362.7 63.13.3 11.1
0.3 0.49.8 12.7
–16.4 18.019 26
670 1,166
1,301 9,305
44.0 10.420 43
100 100100 98100 100100 100100 99100 100
..
..4 7
.. 18.513.8 13.8
4.3 4.60.3 2.00.0 0.20.0 0.00.2 0.20.0 0.1
.. 6.8
Country data
High-income group
Population (millions) 82 Land area (1,000 sq. km) 349 GDP ($ billions) 3,649.5
Germany

GNI per capita, World Bank Atlas method ($)Urban population (% of total)Urban population growth (average annual %, 1990–2008)Population growth (average annual %, 1990–2008) AgricultureAgricultural land (% of land area)Agricultural productivity (value added per worker, 2000 $)Food production index (1999–2001 = 100)Population density, rural (people/sq. km of arable land) Forests and biodiversityForest area (% of land area)Deforestation (average annual %, 1990–2007)Nationally protected area (% of land area)Threatened species, mammalsThreatened species, birdsThreatened species, fishThreatened species, higher plantsGEF benefits index for biodiversity (0–100, median is 1.5) EnergyGDP per unit of energy use (2005 PPP $/kg oil equivalent)Energy use per capita (kg oil equivalent)Energy from biomass products and waste (% of total)Electric power consumption per capita (kWh)Electricity generated using fossil fuel (% of total)Electricity generated by hydropower (% of total) Emissions and pollutionCO2 emissions per unit of GDP (kg/2005 PPP $)CO2 emissions per capita (metric tons)CO2 emissions growth (%, 1990–2006)Particulate matter (urban-pop.-weighted avg., μg/cu. m)Transport sector energy use per capita (kg of oil equivalent) Water and sanitationInternal freshwater resources per capita (cu. m)Freshwater withdrawal
Total (% of internal resources)Agriculture (% of total freshwater withdrawal)
Access to improved water source (% of total population)Rural (% of rural population)Urban (% of urban population)
Access to improved sanitation (% of total population)Rural (% of rural population)Urban (% of urban population)
Environment and healthAcute resp. infection prevalence (% of children under five)Diarrhea prevalence (% of children under five)Under-five mortality rate (per 1,000 live births) National accounting aggregatesGross savings (% of GNI)Consumption of fixed capital (% of GNI)Education expenditure (% of GNI)Energy depletion (% of GNI)Mineral depletion (% of GNI)Net forest depletion (% of GNI)CO2 damage (% of GNI)Particulate emissions damage (% of GNI)Adjusted net savings (% of GNI)
89The Little Green Data Book 2010
630 1,077 52350 36 29
4.2 4.0 3.52.5 2.6 2.2
65 45 38390 330 318124 119 125283 353 666
23.2 26.1 24.72.0 0.7 0.7
16.6 12.4 11.9178
171171.9
3.1 3.2 3.2415 662 423
64.7 55.8 49.3259 550 324
46.6 67.0 41.653.4 16.9 41.9
0.3 0.5 0.40.4 0.8 0.5
135.1 37.4 –6.034 53 6556 61 37
1,325 4,829 5,004
3.2 3.2 9.466 87 8880 58 6771 46 6090 81 8610 31 386 24 33
15 42 52
10.017.9
76 144 118
7.3 16.5 25.98.8 9.0 7.94.7 3.3 3.40.0 14.2 7.86.5 1.3 1.02.8 0.6 1.00.5 0.6 0.70.1 0.4 0.3
–6.5 –6.2 10.7
Population (millions) 23 Land area (1,000 sq. km) 228 GDP ($ billions) 16.7
Country data
Sub-Saharan Africa group
Low-income group
Ghana

GNI per capita, World Bank Atlas method ($)Urban population (% of total)Urban population growth (average annual %, 1990–2008)Population growth (average annual %, 1990–2008) AgricultureAgricultural land (% of land area)Agricultural productivity (value added per worker, 2000 $)Food production index (1999–2001 = 100)Population density, rural (people/sq. km of arable land) Forests and biodiversityForest area (% of land area)Deforestation (average annual %, 1990–2007)Nationally protected area (% of land area)Threatened species, mammalsThreatened species, birdsThreatened species, fishThreatened species, higher plantsGEF benefits index for biodiversity (0–100, median is 1.5) EnergyGDP per unit of energy use (2005 PPP $/kg oil equivalent)Energy use per capita (kg oil equivalent)Energy from biomass products and waste (% of total)Electric power consumption per capita (kWh)Electricity generated using fossil fuel (% of total)Electricity generated by hydropower (% of total) Emissions and pollutionCO2 emissions per unit of GDP (kg/2005 PPP $)CO2 emissions per capita (metric tons)CO2 emissions growth (%, 1990–2006)Particulate matter (urban-pop.-weighted avg., μg/cu. m)Transport sector energy use per capita (kg of oil equivalent) Water and sanitationInternal freshwater resources per capita (cu. m)Freshwater withdrawal
Total (% of internal resources)Agriculture (% of total freshwater withdrawal)
Access to improved water source (% of total population)Rural (% of rural population)Urban (% of urban population)
Access to improved sanitation (% of total population)Rural (% of rural population)Urban (% of urban population)
Environment and healthAcute resp. infection prevalence (% of children under five)Diarrhea prevalence (% of children under five)Under-five mortality rate (per 1,000 live births) National accounting aggregatesGross savings (% of GNI)Consumption of fixed capital (% of GNI)Education expenditure (% of GNI)Energy depletion (% of GNI)Mineral depletion (% of GNI)Net forest depletion (% of GNI)CO2 damage (% of GNI)Particulate emissions damage (% of GNI)Adjusted net savings (% of GNI)
90 2010 The Little Green Data Book
28,400 39,68861 78
0.8 1.00.6 0.7
64 387,411 28,475
87 101172 341
29.6 28.9–0.9 –0.13.4 19.110116211
2.8
9.4 6.52,875 5,321
3.7 3.75,628 9,753
92.6 63.14.1 11.1
0.3 0.48.6 12.7
32.5 18.036 26
694 1,166
5,182 9,305
13.4 10.480 43
100 10099 98
100 10098 10097 9999 100
..
..4 7
7.4 18.513.9 13.8
2.8 4.60.3 2.00.1 0.20.0 0.00.2 0.20.3 0.1
–4.8 6.8
Population (millions) 11 Land area (1,000 sq. km) 129 GDP ($ billions) 355.9
Country data
High-income group
Greece

GNI per capita, World Bank Atlas method ($)Urban population (% of total)Urban population growth (average annual %, 1990–2008)Population growth (average annual %, 1990–2008) AgricultureAgricultural land (% of land area)Agricultural productivity (value added per worker, 2000 $)Food production index (1999–2001 = 100)Population density, rural (people/sq. km of arable land) Forests and biodiversityForest area (% of land area)Deforestation (average annual %, 1990–2007)Nationally protected area (% of land area)Threatened species, mammalsThreatened species, birdsThreatened species, fishThreatened species, higher plantsGEF benefits index for biodiversity (0–100, median is 1.5) EnergyGDP per unit of energy use (2005 PPP $/kg oil equivalent)Energy use per capita (kg oil equivalent)Energy from biomass products and waste (% of total)Electric power consumption per capita (kWh)Electricity generated using fossil fuel (% of total)Electricity generated by hydropower (% of total) Emissions and pollutionCO2 emissions per unit of GDP (kg/2005 PPP $)CO2 emissions per capita (metric tons)CO2 emissions growth (%, 1990–2006)Particulate matter (urban-pop.-weighted avg., μg/cu. m)Transport sector energy use per capita (kg of oil equivalent) Water and sanitationInternal freshwater resources per capita (cu. m)Freshwater withdrawal
Total (% of internal resources)Agriculture (% of total freshwater withdrawal)
Access to improved water source (% of total population)Rural (% of rural population)Urban (% of urban population)
Access to improved sanitation (% of total population)Rural (% of rural population)Urban (% of urban population)
Environment and healthAcute resp. infection prevalence (% of children under five)Diarrhea prevalence (% of children under five)Under-five mortality rate (per 1,000 live births) National accounting aggregatesGross savings (% of GNI)Consumption of fixed capital (% of GNI)Education expenditure (% of GNI)Energy depletion (% of GNI)Mineral depletion (% of GNI)Net forest depletion (% of GNI)CO2 damage (% of GNI)Particulate emissions damage (% of GNI)Adjusted net savings (% of GNI)
91The Little Green Data Book 2010
29,740 39,68884 780.3 1.00.1 0.7
1 38.. 28,475
99 101.. 341
0.0 28.90.0 –0.1
39.7 19.16061
1.1
.. 6.5
.. 5,321
.. 3.7
.. 9,753
.. 63.1
.. 11.1
.. 0.49.9 12.71.3 18.0
.. 26
.. 1,166
10,662,187 9,305
.. 10.4
.. 43
.. 100
.. 98
.. 100
.. 100
.. 99
.. 100
..
..
.. 7
.. 18.5
.. 13.8
.. 4.6
.. 2.0
.. 0.2
.. 0.0
.. 0.2
.. 0.1
.. 6.8
Population (thousands) 56 Land area (1,000 sq. km) 410 GDP ($ billions) 2.2
Country data
High-income group
Greenland

GNI per capita, World Bank Atlas method ($)Urban population (% of total)Urban population growth (average annual %, 1990–2008)Population growth (average annual %, 1990–2008) AgricultureAgricultural land (% of land area)Agricultural productivity (value added per worker, 2000 $)Food production index (1999–2001 = 100)Population density, rural (people/sq. km of arable land) Forests and biodiversityForest area (% of land area)Deforestation (average annual %, 1990–2007)Nationally protected area (% of land area)Threatened species, mammalsThreatened species, birdsThreatened species, fishThreatened species, higher plantsGEF benefits index for biodiversity (0–100, median is 1.5) EnergyGDP per unit of energy use (2005 PPP $/kg oil equivalent)Energy use per capita (kg oil equivalent)Energy from biomass products and waste (% of total)Electric power consumption per capita (kWh)Electricity generated using fossil fuel (% of total)Electricity generated by hydropower (% of total) Emissions and pollutionCO2 emissions per unit of GDP (kg/2005 PPP $)CO2 emissions per capita (metric tons)CO2 emissions growth (%, 1990–2006)Particulate matter (urban-pop.-weighted avg., μg/cu. m)Transport sector energy use per capita (kg of oil equivalent) Water and sanitationInternal freshwater resources per capita (cu. m)Freshwater withdrawal
Total (% of internal resources)Agriculture (% of total freshwater withdrawal)
Access to improved water source (% of total population)Rural (% of rural population)Urban (% of urban population)
Access to improved sanitation (% of total population)Rural (% of rural population)Urban (% of urban population)
Environment and healthAcute resp. infection prevalence (% of children under five)Diarrhea prevalence (% of children under five)Under-five mortality rate (per 1,000 live births) National accounting aggregatesGross savings (% of GNI)Consumption of fixed capital (% of GNI)Education expenditure (% of GNI)Energy depletion (% of GNI)Mineral depletion (% of GNI)Net forest depletion (% of GNI)CO2 damage (% of GNI)Particulate emissions damage (% of GNI)Adjusted net savings (% of GNI)
92 2010 The Little Green Data Book
5,880 6,768 7,85231 79 75
0.2 2.0 1.50.4 1.5 1.0
38 36 302,415 3,452 3,399
89 125 1203,572 233 146
12.1 44.9 37.30.1 0.5 0.22.0 22.8 14.0
31
153
0.6
.. 7.5 5.2
.. 1,273 2,130
.. 16.3 7.3
.. 1,866 3,052
.. 38.2 63.4
.. 55.8 27.5
0.3 0.3 0.52.4 2.6 5.2
100.0 40.0 –4.920 35 32
.. 317 374
.. 24,004 18,876
.. 2.0 13.8
.. 71 5895 91 9493 73 8297 97 9897 78 8297 51 6396 86 89
..
..15 23 23
–13.3 22.4 23.811.7 11.8 12.15.1 4.4 4.20.0 6.3 9.40.0 1.8 1.3
.. 0.0 0.00.3 0.3 0.5
.. 0.3 0.2
.. 6.3 4.6
Country data
Latin America & Caribbean
group
Upper middle-income group
Population (thousands) 104 Land area (sq. km) 340 GDP ($ millions) 638
Grenada

GNI per capita, World Bank Atlas method ($)Urban population (% of total)Urban population growth (average annual %, 1990–2008)Population growth (average annual %, 1990–2008) AgricultureAgricultural land (% of land area)Agricultural productivity (value added per worker, 2000 $)Food production index (1999–2001 = 100)Population density, rural (people/sq. km of arable land) Forests and biodiversityForest area (% of land area)Deforestation (average annual %, 1990–2007)Nationally protected area (% of land area)Threatened species, mammalsThreatened species, birdsThreatened species, fishThreatened species, higher plantsGEF benefits index for biodiversity (0–100, median is 1.5) EnergyGDP per unit of energy use (2005 PPP $/kg oil equivalent)Energy use per capita (kg oil equivalent)Energy from biomass products and waste (% of total)Electric power consumption per capita (kWh)Electricity generated using fossil fuel (% of total)Electricity generated by hydropower (% of total) Emissions and pollutionCO2 emissions per unit of GDP (kg/2005 PPP $)CO2 emissions per capita (metric tons)CO2 emissions growth (%, 1990–2006)Particulate matter (urban-pop.-weighted avg., μg/cu. m)Transport sector energy use per capita (kg of oil equivalent) Water and sanitationInternal freshwater resources per capita (cu. m)Freshwater withdrawal
Total (% of internal resources)Agriculture (% of total freshwater withdrawal)
Access to improved water source (% of total population)Rural (% of rural population)Urban (% of urban population)
Access to improved sanitation (% of total population)Rural (% of rural population)Urban (% of urban population)
Environment and healthAcute resp. infection prevalence (% of children under five)Diarrhea prevalence (% of children under five)Under-five mortality rate (per 1,000 live births) National accounting aggregatesGross savings (% of GNI)Consumption of fixed capital (% of GNI)Education expenditure (% of GNI)Energy depletion (% of GNI)Mineral depletion (% of GNI)Net forest depletion (% of GNI)CO2 damage (% of GNI)Particulate emissions damage (% of GNI)Adjusted net savings (% of GNI)
93The Little Green Data Book 2010
.. 39,68893 781.6 1.01.5 0.7
35 38.. 28,475
108 1011,189 341
48.0 28.90.0 –0.1
20.9 19.12
1294
0.2
.. 6.5
.. 5,321
.. 3.7
.. 9,753
.. 63.1
.. 11.1
.. 0.4
.. 12.7
.. 18.0
.. 26
.. 1,166
.. 9,305
.. 10.4
.. 43100 100100 98100 10099 10098 9999 100
..
..
.. 7
.. 18.5
.. 13.8
.. 4.6
.. 2.0
.. 0.2
.. 0.0
.. 0.2
.. 0.1
.. 6.8
Country data
High-income group
Population (thousands) 176 Land area (sq. km) 540 GDP ($ millions) ..
Guam
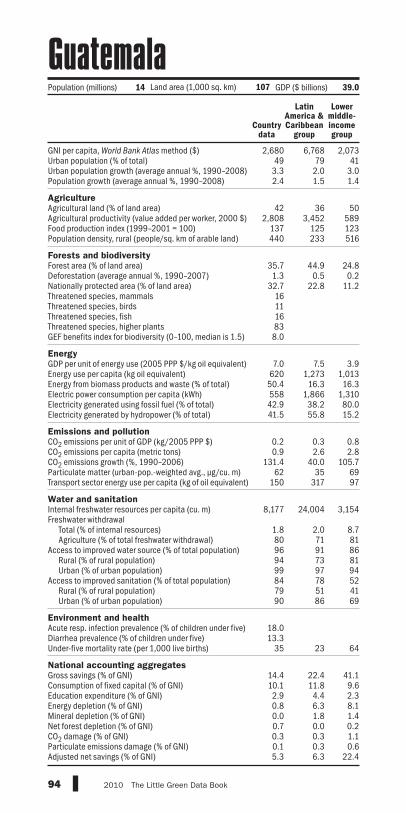
GNI per capita, World Bank Atlas method ($)Urban population (% of total)Urban population growth (average annual %, 1990–2008)Population growth (average annual %, 1990–2008) AgricultureAgricultural land (% of land area)Agricultural productivity (value added per worker, 2000 $)Food production index (1999–2001 = 100)Population density, rural (people/sq. km of arable land) Forests and biodiversityForest area (% of land area)Deforestation (average annual %, 1990–2007)Nationally protected area (% of land area)Threatened species, mammalsThreatened species, birdsThreatened species, fishThreatened species, higher plantsGEF benefits index for biodiversity (0–100, median is 1.5) EnergyGDP per unit of energy use (2005 PPP $/kg oil equivalent)Energy use per capita (kg oil equivalent)Energy from biomass products and waste (% of total)Electric power consumption per capita (kWh)Electricity generated using fossil fuel (% of total)Electricity generated by hydropower (% of total) Emissions and pollutionCO2 emissions per unit of GDP (kg/2005 PPP $)CO2 emissions per capita (metric tons)CO2 emissions growth (%, 1990–2006)Particulate matter (urban-pop.-weighted avg., μg/cu. m)Transport sector energy use per capita (kg of oil equivalent) Water and sanitationInternal freshwater resources per capita (cu. m)Freshwater withdrawal
Total (% of internal resources)Agriculture (% of total freshwater withdrawal)
Access to improved water source (% of total population)Rural (% of rural population)Urban (% of urban population)
Access to improved sanitation (% of total population)Rural (% of rural population)Urban (% of urban population)
Environment and healthAcute resp. infection prevalence (% of children under five)Diarrhea prevalence (% of children under five)Under-five mortality rate (per 1,000 live births) National accounting aggregatesGross savings (% of GNI)Consumption of fixed capital (% of GNI)Education expenditure (% of GNI)Energy depletion (% of GNI)Mineral depletion (% of GNI)Net forest depletion (% of GNI)CO2 damage (% of GNI)Particulate emissions damage (% of GNI)Adjusted net savings (% of GNI)
94 2010 The Little Green Data Book
2,680 6,768 2,07349 79 41
3.3 2.0 3.02.4 1.5 1.4
42 36 502,808 3,452 589
137 125 123440 233 516
35.7 44.9 24.81.3 0.5 0.2
32.7 22.8 11.2161116838.0
7.0 7.5 3.9620 1,273 1,01350.4 16.3 16.3558 1,866 1,31042.9 38.2 80.041.5 55.8 15.2
0.2 0.3 0.80.9 2.6 2.8
131.4 40.0 105.762 35 69
150 317 97
8,177 24,004 3,154
1.8 2.0 8.780 71 8196 91 8694 73 8199 97 9484 78 5279 51 4190 86 69
18.013.3
35 23 64
14.4 22.4 41.110.1 11.8 9.62.9 4.4 2.30.8 6.3 8.10.0 1.8 1.40.7 0.0 0.20.3 0.3 1.10.1 0.3 0.65.3 6.3 22.4
Country data
Latin America & Caribbean
group
Lower middle-income group
Population (millions) 14 Land area (1,000 sq. km) 107 GDP ($ billions) 39.0
Guatemala

GNI per capita, World Bank Atlas method ($)Urban population (% of total)Urban population growth (average annual %, 1990–2008)Population growth (average annual %, 1990–2008) AgricultureAgricultural land (% of land area)Agricultural productivity (value added per worker, 2000 $)Food production index (1999–2001 = 100)Population density, rural (people/sq. km of arable land) Forests and biodiversityForest area (% of land area)Deforestation (average annual %, 1990–2007)Nationally protected area (% of land area)Threatened species, mammalsThreatened species, birdsThreatened species, fishThreatened species, higher plantsGEF benefits index for biodiversity (0–100, median is 1.5) EnergyGDP per unit of energy use (2005 PPP $/kg oil equivalent)Energy use per capita (kg oil equivalent)Energy from biomass products and waste (% of total)Electric power consumption per capita (kWh)Electricity generated using fossil fuel (% of total)Electricity generated by hydropower (% of total) Emissions and pollutionCO2 emissions per unit of GDP (kg/2005 PPP $)CO2 emissions per capita (metric tons)CO2 emissions growth (%, 1990–2006)Particulate matter (urban-pop.-weighted avg., μg/cu. m)Transport sector energy use per capita (kg of oil equivalent) Water and sanitationInternal freshwater resources per capita (cu. m)Freshwater withdrawal
Total (% of internal resources)Agriculture (% of total freshwater withdrawal)
Access to improved water source (% of total population)Rural (% of rural population)Urban (% of urban population)
Access to improved sanitation (% of total population)Rural (% of rural population)Urban (% of urban population)
Environment and healthAcute resp. infection prevalence (% of children under five)Diarrhea prevalence (% of children under five)Under-five mortality rate (per 1,000 live births) National accounting aggregatesGross savings (% of GNI)Consumption of fixed capital (% of GNI)Education expenditure (% of GNI)Energy depletion (% of GNI)Mineral depletion (% of GNI)Net forest depletion (% of GNI)CO2 damage (% of GNI)Particulate emissions damage (% of GNI)Adjusted net savings (% of GNI)
95The Little Green Data Book 2010
350 1,077 52334 36 293.8 4.0 3.52.6 2.6 2.2
55 45 38316 330 318125 119 125289 353 666
27.1 26.1 24.70.6 0.7 0.76.6 12.4 11.9221219222.3
.. 3.2 3.2
.. 662 423
.. 55.8 49.3
.. 550 324
.. 67.0 41.6
.. 16.9 41.9
0.2 0.5 0.40.1 0.8 0.5
28.8 37.4 –6.070 53 65
.. 61 37
23,505 4,829 5,004
0.7 3.2 9.490 87 8870 58 6759 46 6091 81 8619 31 3812 24 3333 42 52
15.021.2146 144 118
2.9 16.5 25.97.7 9.0 7.92.0 3.3 3.40.0 14.2 7.85.2 1.3 1.02.6 0.6 1.00.3 0.6 0.70.5 0.4 0.3
–11.3 –6.2 10.7
Population (millions) 9.8 Land area (1,000 sq. km) 246 GDP ($ billions) 3.8
Country data
Sub-Saharan Africa group
Low-income group
Guinea

GNI per capita, World Bank Atlas method ($)Urban population (% of total)Urban population growth (average annual %, 1990–2008)Population growth (average annual %, 1990–2008) AgricultureAgricultural land (% of land area)Agricultural productivity (value added per worker, 2000 $)Food production index (1999–2001 = 100)Population density, rural (people/sq. km of arable land) Forests and biodiversityForest area (% of land area)Deforestation (average annual %, 1990–2007)Nationally protected area (% of land area)Threatened species, mammalsThreatened species, birdsThreatened species, fishThreatened species, higher plantsGEF benefits index for biodiversity (0–100, median is 1.5) EnergyGDP per unit of energy use (2005 PPP $/kg oil equivalent)Energy use per capita (kg oil equivalent)Energy from biomass products and waste (% of total)Electric power consumption per capita (kWh)Electricity generated using fossil fuel (% of total)Electricity generated by hydropower (% of total) Emissions and pollutionCO2 emissions per unit of GDP (kg/2005 PPP $)CO2 emissions per capita (metric tons)CO2 emissions growth (%, 1990–2006)Particulate matter (urban-pop.-weighted avg., μg/cu. m)Transport sector energy use per capita (kg of oil equivalent) Water and sanitationInternal freshwater resources per capita (cu. m)Freshwater withdrawal
Total (% of internal resources)Agriculture (% of total freshwater withdrawal)
Access to improved water source (% of total population)Rural (% of rural population)Urban (% of urban population)
Access to improved sanitation (% of total population)Rural (% of rural population)Urban (% of urban population)
Environment and healthAcute resp. infection prevalence (% of children under five)Diarrhea prevalence (% of children under five)Under-five mortality rate (per 1,000 live births) National accounting aggregatesGross savings (% of GNI)Consumption of fixed capital (% of GNI)Education expenditure (% of GNI)Energy depletion (% of GNI)Mineral depletion (% of GNI)Net forest depletion (% of GNI)CO2 damage (% of GNI)Particulate emissions damage (% of GNI)Adjusted net savings (% of GNI)
96 2010 The Little Green Data Book
250 1,077 52330 36 292.7 4.0 3.52.4 2.6 2.2
58 45 38320 330 318114 119 125361 353 666
73.0 26.1 24.70.5 0.7 0.7
18.2 12.4 11.9112
184
0.6
.. 3.2 3.2
.. 662 423
.. 55.8 49.3
.. 550 324
.. 67.0 41.6
.. 16.9 41.9
0.4 0.5 0.40.2 0.8 0.5
10.1 37.4 –6.072 53 65
.. 61 37
10,383 4,829 5,004
1.1 3.2 9.482 87 8857 58 6747 46 6082 81 8633 31 3826 24 3348 42 52
10.031.5195 144 118
22.4 16.5 25.96.7 9.0 7.92.3 3.3 3.40.0 14.2 7.80.0 1.3 1.00.0 0.6 1.00.5 0.6 0.70.8 0.4 0.3
16.6 –6.2 10.7
Country data
Sub-Saharan Africa group
Low-income group
Population (millions) 1.6 Land area (1,000 sq. km) 28 GDP ($ millions) 430
Guinea-Bissau
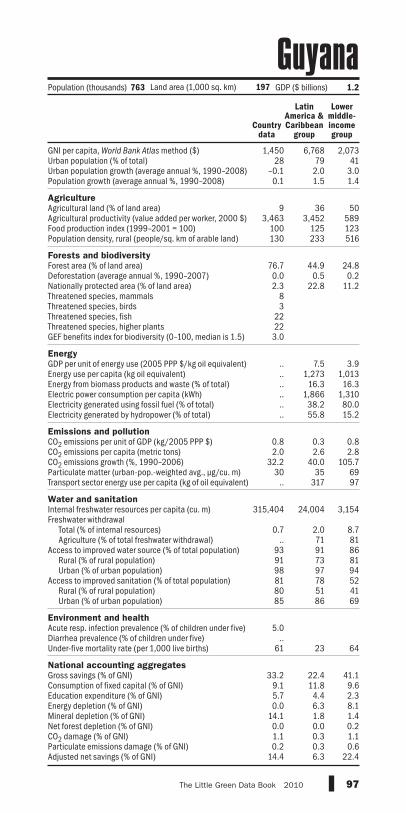
GNI per capita, World Bank Atlas method ($)Urban population (% of total)Urban population growth (average annual %, 1990–2008)Population growth (average annual %, 1990–2008) AgricultureAgricultural land (% of land area)Agricultural productivity (value added per worker, 2000 $)Food production index (1999–2001 = 100)Population density, rural (people/sq. km of arable land) Forests and biodiversityForest area (% of land area)Deforestation (average annual %, 1990–2007)Nationally protected area (% of land area)Threatened species, mammalsThreatened species, birdsThreatened species, fishThreatened species, higher plantsGEF benefits index for biodiversity (0–100, median is 1.5) EnergyGDP per unit of energy use (2005 PPP $/kg oil equivalent)Energy use per capita (kg oil equivalent)Energy from biomass products and waste (% of total)Electric power consumption per capita (kWh)Electricity generated using fossil fuel (% of total)Electricity generated by hydropower (% of total) Emissions and pollutionCO2 emissions per unit of GDP (kg/2005 PPP $)CO2 emissions per capita (metric tons)CO2 emissions growth (%, 1990–2006)Particulate matter (urban-pop.-weighted avg., μg/cu. m)Transport sector energy use per capita (kg of oil equivalent) Water and sanitationInternal freshwater resources per capita (cu. m)Freshwater withdrawal
Total (% of internal resources)Agriculture (% of total freshwater withdrawal)
Access to improved water source (% of total population)Rural (% of rural population)Urban (% of urban population)
Access to improved sanitation (% of total population)Rural (% of rural population)Urban (% of urban population)
Environment and healthAcute resp. infection prevalence (% of children under five)Diarrhea prevalence (% of children under five)Under-five mortality rate (per 1,000 live births) National accounting aggregatesGross savings (% of GNI)Consumption of fixed capital (% of GNI)Education expenditure (% of GNI)Energy depletion (% of GNI)Mineral depletion (% of GNI)Net forest depletion (% of GNI)CO2 damage (% of GNI)Particulate emissions damage (% of GNI)Adjusted net savings (% of GNI)
97The Little Green Data Book 2010
1,450 6,768 2,07328 79 41
–0.1 2.0 3.00.1 1.5 1.4
9 36 503,463 3,452 589
100 125 123130 233 516
76.7 44.9 24.80.0 0.5 0.22.3 22.8 11.2
83
22223.0
.. 7.5 3.9
.. 1,273 1,013
.. 16.3 16.3
.. 1,866 1,310
.. 38.2 80.0
.. 55.8 15.2
0.8 0.3 0.82.0 2.6 2.8
32.2 40.0 105.730 35 69
.. 317 97
315,404 24,004 3,154
0.7 2.0 8.7.. 71 81
93 91 8691 73 8198 97 9481 78 5280 51 4185 86 69
5.0..
61 23 64
33.2 22.4 41.19.1 11.8 9.65.7 4.4 2.30.0 6.3 8.1
14.1 1.8 1.40.0 0.0 0.21.1 0.3 1.10.2 0.3 0.6
14.4 6.3 22.4
Country data
Latin America & Caribbean
group
Lower middle-income group
Population (thousands) 763 Land area (1,000 sq. km) 197 GDP ($ billions) 1.2
Guyana
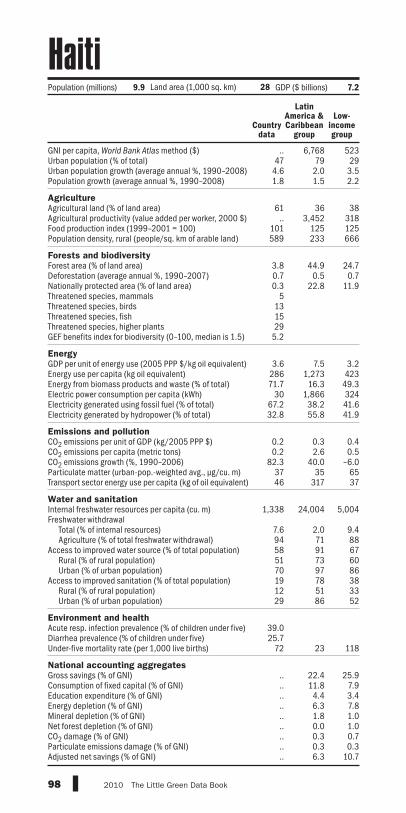
GNI per capita, World Bank Atlas method ($)Urban population (% of total)Urban population growth (average annual %, 1990–2008)Population growth (average annual %, 1990–2008) AgricultureAgricultural land (% of land area)Agricultural productivity (value added per worker, 2000 $)Food production index (1999–2001 = 100)Population density, rural (people/sq. km of arable land) Forests and biodiversityForest area (% of land area)Deforestation (average annual %, 1990–2007)Nationally protected area (% of land area)Threatened species, mammalsThreatened species, birdsThreatened species, fishThreatened species, higher plantsGEF benefits index for biodiversity (0–100, median is 1.5) EnergyGDP per unit of energy use (2005 PPP $/kg oil equivalent)Energy use per capita (kg oil equivalent)Energy from biomass products and waste (% of total)Electric power consumption per capita (kWh)Electricity generated using fossil fuel (% of total)Electricity generated by hydropower (% of total) Emissions and pollutionCO2 emissions per unit of GDP (kg/2005 PPP $)CO2 emissions per capita (metric tons)CO2 emissions growth (%, 1990–2006)Particulate matter (urban-pop.-weighted avg., μg/cu. m)Transport sector energy use per capita (kg of oil equivalent) Water and sanitationInternal freshwater resources per capita (cu. m)Freshwater withdrawal
Total (% of internal resources)Agriculture (% of total freshwater withdrawal)
Access to improved water source (% of total population)Rural (% of rural population)Urban (% of urban population)
Access to improved sanitation (% of total population)Rural (% of rural population)Urban (% of urban population)
Environment and healthAcute resp. infection prevalence (% of children under five)Diarrhea prevalence (% of children under five)Under-five mortality rate (per 1,000 live births) National accounting aggregatesGross savings (% of GNI)Consumption of fixed capital (% of GNI)Education expenditure (% of GNI)Energy depletion (% of GNI)Mineral depletion (% of GNI)Net forest depletion (% of GNI)CO2 damage (% of GNI)Particulate emissions damage (% of GNI)Adjusted net savings (% of GNI)
98 2010 The Little Green Data Book
.. 6,768 52347 79 29
4.6 2.0 3.51.8 1.5 2.2
61 36 38.. 3,452 318
101 125 125589 233 666
3.8 44.9 24.70.7 0.5 0.70.3 22.8 11.9
5131529
5.2
3.6 7.5 3.2286 1,273 42371.7 16.3 49.3
30 1,866 32467.2 38.2 41.632.8 55.8 41.9
0.2 0.3 0.40.2 2.6 0.5
82.3 40.0 –6.037 35 6546 317 37
1,338 24,004 5,004
7.6 2.0 9.494 71 8858 91 6751 73 6070 97 8619 78 3812 51 3329 86 52
39.025.7
72 23 118
.. 22.4 25.9
.. 11.8 7.9
.. 4.4 3.4
.. 6.3 7.8
.. 1.8 1.0
.. 0.0 1.0
.. 0.3 0.7
.. 0.3 0.3
.. 6.3 10.7
Country data
Latin America & Caribbean
group
Low-income group
Population (millions) 9.9 Land area (1,000 sq. km) 28 GDP ($ billions) 7.2
Haiti

GNI per capita, World Bank Atlas method ($)Urban population (% of total)Urban population growth (average annual %, 1990–2008)Population growth (average annual %, 1990–2008) AgricultureAgricultural land (% of land area)Agricultural productivity (value added per worker, 2000 $)Food production index (1999–2001 = 100)Population density, rural (people/sq. km of arable land) Forests and biodiversityForest area (% of land area)Deforestation (average annual %, 1990–2007)Nationally protected area (% of land area)Threatened species, mammalsThreatened species, birdsThreatened species, fishThreatened species, higher plantsGEF benefits index for biodiversity (0–100, median is 1.5) EnergyGDP per unit of energy use (2005 PPP $/kg oil equivalent)Energy use per capita (kg oil equivalent)Energy from biomass products and waste (% of total)Electric power consumption per capita (kWh)Electricity generated using fossil fuel (% of total)Electricity generated by hydropower (% of total) Emissions and pollutionCO2 emissions per unit of GDP (kg/2005 PPP $)CO2 emissions per capita (metric tons)CO2 emissions growth (%, 1990–2006)Particulate matter (urban-pop.-weighted avg., μg/cu. m)Transport sector energy use per capita (kg of oil equivalent) Water and sanitationInternal freshwater resources per capita (cu. m)Freshwater withdrawal
Total (% of internal resources)Agriculture (% of total freshwater withdrawal)
Access to improved water source (% of total population)Rural (% of rural population)Urban (% of urban population)
Access to improved sanitation (% of total population)Rural (% of rural population)Urban (% of urban population)
Environment and healthAcute resp. infection prevalence (% of children under five)Diarrhea prevalence (% of children under five)Under-five mortality rate (per 1,000 live births) National accounting aggregatesGross savings (% of GNI)Consumption of fixed capital (% of GNI)Education expenditure (% of GNI)Energy depletion (% of GNI)Mineral depletion (% of GNI)Net forest depletion (% of GNI)CO2 damage (% of GNI)Particulate emissions damage (% of GNI)Adjusted net savings (% of GNI)
99The Little Green Data Book 2010
1,740 6,768 2,07348 79 413.2 2.0 3.02.2 1.5 1.4
28 36 501,969 3,452 589
144 125 123353 233 516
38.7 44.9 24.83.1 0.5 0.2
21.0 22.8 11.267
191107.2
5.4 7.5 3.9661 1,273 1,01340.7 16.3 16.3692 1,866 1,31062.3 38.2 80.035.1 55.8 15.2
0.3 0.3 0.81.0 2.6 2.8
177.5 40.0 105.743 35 69
148 317 97
13,372 24,004 3,154
0.9 2.0 8.780 71 8184 91 8674 73 8195 97 9466 78 5255 51 4178 86 69
..19.3
31 23 64
21.2 22.4 41.19.5 11.8 9.63.5 4.4 2.30.0 6.3 8.11.4 1.8 1.40.0 0.0 0.20.5 0.3 1.10.2 0.3 0.6
13.1 6.3 22.4
Country data
Latin America & Caribbean
group
Lower middle-income group
Population (millions) 7.3 Land area (1,000 sq. km) 112 GDP ($ billions) 13.3
Honduras
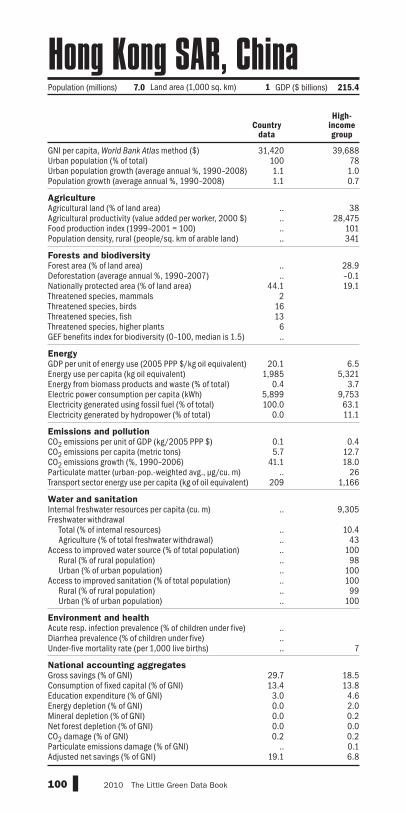
GNI per capita, World Bank Atlas method ($)Urban population (% of total)Urban population growth (average annual %, 1990–2008)Population growth (average annual %, 1990–2008) AgricultureAgricultural land (% of land area)Agricultural productivity (value added per worker, 2000 $)Food production index (1999–2001 = 100)Population density, rural (people/sq. km of arable land) Forests and biodiversityForest area (% of land area)Deforestation (average annual %, 1990–2007)Nationally protected area (% of land area)Threatened species, mammalsThreatened species, birdsThreatened species, fishThreatened species, higher plantsGEF benefits index for biodiversity (0–100, median is 1.5) EnergyGDP per unit of energy use (2005 PPP $/kg oil equivalent)Energy use per capita (kg oil equivalent)Energy from biomass products and waste (% of total)Electric power consumption per capita (kWh)Electricity generated using fossil fuel (% of total)Electricity generated by hydropower (% of total) Emissions and pollutionCO2 emissions per unit of GDP (kg/2005 PPP $)CO2 emissions per capita (metric tons)CO2 emissions growth (%, 1990–2006)Particulate matter (urban-pop.-weighted avg., μg/cu. m)Transport sector energy use per capita (kg of oil equivalent) Water and sanitationInternal freshwater resources per capita (cu. m)Freshwater withdrawal
Total (% of internal resources)Agriculture (% of total freshwater withdrawal)
Access to improved water source (% of total population)Rural (% of rural population)Urban (% of urban population)
Access to improved sanitation (% of total population)Rural (% of rural population)Urban (% of urban population)
Environment and healthAcute resp. infection prevalence (% of children under five)Diarrhea prevalence (% of children under five)Under-five mortality rate (per 1,000 live births) National accounting aggregatesGross savings (% of GNI)Consumption of fixed capital (% of GNI)Education expenditure (% of GNI)Energy depletion (% of GNI)Mineral depletion (% of GNI)Net forest depletion (% of GNI)CO2 damage (% of GNI)Particulate emissions damage (% of GNI)Adjusted net savings (% of GNI)
100 2010 The Little Green Data Book
31,420 39,688100 781.1 1.01.1 0.7
.. 38
.. 28,475
.. 101
.. 341
.. 28.9
.. –0.144.1 19.1
21613
6..
20.1 6.51,985 5,321
0.4 3.75,899 9,753100.0 63.1
0.0 11.1
0.1 0.45.7 12.7
41.1 18.0.. 26
209 1,166
.. 9,305
.. 10.4
.. 43
.. 100
.. 98
.. 100
.. 100
.. 99
.. 100
..
..
.. 7
29.7 18.513.4 13.8
3.0 4.60.0 2.00.0 0.20.0 0.00.2 0.2
.. 0.119.1 6.8
Country data
High-income group
Population (millions) 7.0 Land area (1,000 sq. km) 1 GDP ($ billions) 215.4
Hong Kong SAR, China

GNI per capita, World Bank Atlas method ($)Urban population (% of total)Urban population growth (average annual %, 1990–2008)Population growth (average annual %, 1990–2008) AgricultureAgricultural land (% of land area)Agricultural productivity (value added per worker, 2000 $)Food production index (1999–2001 = 100)Population density, rural (people/sq. km of arable land) Forests and biodiversityForest area (% of land area)Deforestation (average annual %, 1990–2007)Nationally protected area (% of land area)Threatened species, mammalsThreatened species, birdsThreatened species, fishThreatened species, higher plantsGEF benefits index for biodiversity (0–100, median is 1.5) EnergyGDP per unit of energy use (2005 PPP $/kg oil equivalent)Energy use per capita (kg oil equivalent)Energy from biomass products and waste (% of total)Electric power consumption per capita (kWh)Electricity generated using fossil fuel (% of total)Electricity generated by hydropower (% of total) Emissions and pollutionCO2 emissions per unit of GDP (kg/2005 PPP $)CO2 emissions per capita (metric tons)CO2 emissions growth (%, 1990–2006)Particulate matter (urban-pop.-weighted avg., μg/cu. m)Transport sector energy use per capita (kg of oil equivalent) Water and sanitationInternal freshwater resources per capita (cu. m)Freshwater withdrawal
Total (% of internal resources)Agriculture (% of total freshwater withdrawal)
Access to improved water source (% of total population)Rural (% of rural population)Urban (% of urban population)
Access to improved sanitation (% of total population)Rural (% of rural population)Urban (% of urban population)
Environment and healthAcute resp. infection prevalence (% of children under five)Diarrhea prevalence (% of children under five)Under-five mortality rate (per 1,000 live births) National accounting aggregatesGross savings (% of GNI)Consumption of fixed capital (% of GNI)Education expenditure (% of GNI)Energy depletion (% of GNI)Mineral depletion (% of GNI)Net forest depletion (% of GNI)CO2 damage (% of GNI)Particulate emissions damage (% of GNI)Adjusted net savings (% of GNI)
101The Little Green Data Book 2010
12,810 39,68868 780.0 1.0
–0.2 0.7
65 387,006 28,475
98 10172 341
22.4 28.9–0.6 –0.15.6 19.1
2991
0.2
6.7 6.52,658 5,321
4.9 3.73,977 9,75358.2 63.1
0.5 11.1
0.3 0.45.7 12.7
–6.9 18.019 26
440 1,166
597 9,305
127.3 10.432 43
100 100100 98100 100100 100100 99100 100
..
..7 7
15.9 18.515.1 13.85.3 4.60.8 2.00.0 0.20.0 0.00.3 0.20.0 0.15.0 6.8
Country data
High-income group
Population (millions) 10 Land area (1,000 sq. km) 90 GDP ($ billions) 154.7
Hungary

GNI per capita, World Bank Atlas method ($)Urban population (% of total)Urban population growth (average annual %, 1990–2008)Population growth (average annual %, 1990–2008) AgricultureAgricultural land (% of land area)Agricultural productivity (value added per worker, 2000 $)Food production index (1999–2001 = 100)Population density, rural (people/sq. km of arable land) Forests and biodiversityForest area (% of land area)Deforestation (average annual %, 1990–2007)Nationally protected area (% of land area)Threatened species, mammalsThreatened species, birdsThreatened species, fishThreatened species, higher plantsGEF benefits index for biodiversity (0–100, median is 1.5) EnergyGDP per unit of energy use (2005 PPP $/kg oil equivalent)Energy use per capita (kg oil equivalent)Energy from biomass products and waste (% of total)Electric power consumption per capita (kWh)Electricity generated using fossil fuel (% of total)Electricity generated by hydropower (% of total) Emissions and pollutionCO2 emissions per unit of GDP (kg/2005 PPP $)CO2 emissions per capita (metric tons)CO2 emissions growth (%, 1990–2006)Particulate matter (urban-pop.-weighted avg., μg/cu. m)Transport sector energy use per capita (kg of oil equivalent) Water and sanitationInternal freshwater resources per capita (cu. m)Freshwater withdrawal
Total (% of internal resources)Agriculture (% of total freshwater withdrawal)
Access to improved water source (% of total population)Rural (% of rural population)Urban (% of urban population)
Access to improved sanitation (% of total population)Rural (% of rural population)Urban (% of urban population)
Environment and healthAcute resp. infection prevalence (% of children under five)Diarrhea prevalence (% of children under five)Under-five mortality rate (per 1,000 live births) National accounting aggregatesGross savings (% of GNI)Consumption of fixed capital (% of GNI)Education expenditure (% of GNI)Energy depletion (% of GNI)Mineral depletion (% of GNI)Net forest depletion (% of GNI)CO2 damage (% of GNI)Particulate emissions damage (% of GNI)Adjusted net savings (% of GNI)
102 2010 The Little Green Data Book
40,450 39,68892 781.3 1.01.2 0.7
23 3853,483 28,475
106 101345 341
0.5 28.9–4.1 –0.19.3 19.1
50
120
0.7
2.3 6.515,708 5,321
0.1 3.736,853 9,753
0.0 63.170.1 11.1
0.2 0.47.3 12.77.9 18.018 26
1,011 1,166
545,631 9,305
0.1 10.4.. 43
100 100100 98100 100100 100100 99100 100
..
..3 7
.. 18.520.7 13.8
7.3 4.60.0 2.00.0 0.20.0 0.00.2 0.20.0 0.1
.. 6.8
Country data
High-income group
Population (thousands) 317 Land area (1,000 sq. km) 100 GDP ($ billions) 16.7
Iceland

GNI per capita, World Bank Atlas method ($)Urban population (% of total)Urban population growth (average annual %, 1990–2008)Population growth (average annual %, 1990–2008) AgricultureAgricultural land (% of land area)Agricultural productivity (value added per worker, 2000 $)Food production index (1999–2001 = 100)Population density, rural (people/sq. km of arable land) Forests and biodiversityForest area (% of land area)Deforestation (average annual %, 1990–2007)Nationally protected area (% of land area)Threatened species, mammalsThreatened species, birdsThreatened species, fishThreatened species, higher plantsGEF benefits index for biodiversity (0–100, median is 1.5) EnergyGDP per unit of energy use (2005 PPP $/kg oil equivalent)Energy use per capita (kg oil equivalent)Energy from biomass products and waste (% of total)Electric power consumption per capita (kWh)Electricity generated using fossil fuel (% of total)Electricity generated by hydropower (% of total) Emissions and pollutionCO2 emissions per unit of GDP (kg/2005 PPP $)CO2 emissions per capita (metric tons)CO2 emissions growth (%, 1990–2006)Particulate matter (urban-pop.-weighted avg., μg/cu. m)Transport sector energy use per capita (kg of oil equivalent) Water and sanitationInternal freshwater resources per capita (cu. m)Freshwater withdrawal
Total (% of internal resources)Agriculture (% of total freshwater withdrawal)
Access to improved water source (% of total population)Rural (% of rural population)Urban (% of urban population)
Access to improved sanitation (% of total population)Rural (% of rural population)Urban (% of urban population)
Environment and healthAcute resp. infection prevalence (% of children under five)Diarrhea prevalence (% of children under five)Under-five mortality rate (per 1,000 live births) National accounting aggregatesGross savings (% of GNI)Consumption of fixed capital (% of GNI)Education expenditure (% of GNI)Energy depletion (% of GNI)Mineral depletion (% of GNI)Net forest depletion (% of GNI)CO2 damage (% of GNI)Particulate emissions damage (% of GNI)Adjusted net savings (% of GNI)
103The Little Green Data Book 2010
1,040 963 2,07330 29 412.5 2.7 3.01.6 1.7 1.4
61 55 50476 496 589119 120 123502 628 516
22.8 16.7 24.8–0.3 –0.1 0.24.8 5.5 11.2967640
24639.9
4.9 5.0 3.9529 484 1,01327.2 29.3 16.3542 482 1,310
80.8 78.6 80.015.4 17.0 15.2
0.6 0.5 0.81.4 1.1 2.8
118.7 118.9 105.765 78 6936 37 97
1,121 1,194 3,154
51.2 51.7 8.786 90 8189 87 8686 84 8196 94 9428 33 5218 23 4152 57 69
19.019.2
69 76 64
38.2 35.3 41.18.5 8.4 9.63.2 3.0 2.34.9 4.6 8.11.4 1.1 1.40.8 0.8 0.21.2 1.0 1.10.5 0.5 0.6
24.2 21.8 22.4
Country data
South Asia
group
Lower middle-income group
Population (millions) 1,140 Land area (1,000 sq. km) 2,973 GDP ($ billions) 1,159.2
India
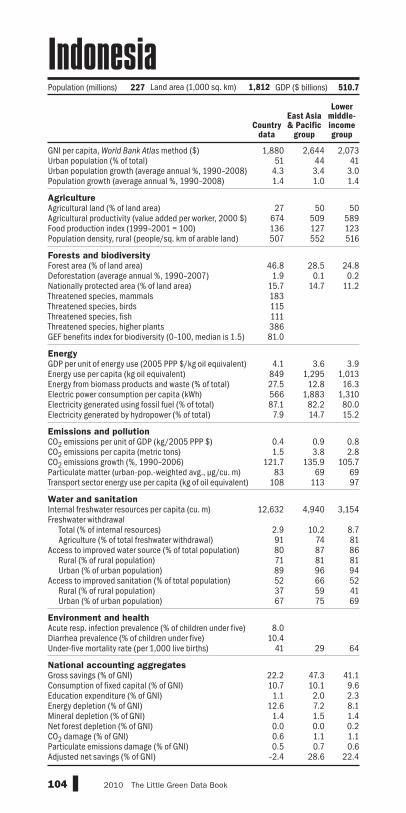
GNI per capita, World Bank Atlas method ($)Urban population (% of total)Urban population growth (average annual %, 1990–2008)Population growth (average annual %, 1990–2008) AgricultureAgricultural land (% of land area)Agricultural productivity (value added per worker, 2000 $)Food production index (1999–2001 = 100)Population density, rural (people/sq. km of arable land) Forests and biodiversityForest area (% of land area)Deforestation (average annual %, 1990–2007)Nationally protected area (% of land area)Threatened species, mammalsThreatened species, birdsThreatened species, fishThreatened species, higher plantsGEF benefits index for biodiversity (0–100, median is 1.5) EnergyGDP per unit of energy use (2005 PPP $/kg oil equivalent)Energy use per capita (kg oil equivalent)Energy from biomass products and waste (% of total)Electric power consumption per capita (kWh)Electricity generated using fossil fuel (% of total)Electricity generated by hydropower (% of total) Emissions and pollutionCO2 emissions per unit of GDP (kg/2005 PPP $)CO2 emissions per capita (metric tons)CO2 emissions growth (%, 1990–2006)Particulate matter (urban-pop.-weighted avg., μg/cu. m)Transport sector energy use per capita (kg of oil equivalent) Water and sanitationInternal freshwater resources per capita (cu. m)Freshwater withdrawal
Total (% of internal resources)Agriculture (% of total freshwater withdrawal)
Access to improved water source (% of total population)Rural (% of rural population)Urban (% of urban population)
Access to improved sanitation (% of total population)Rural (% of rural population)Urban (% of urban population)
Environment and healthAcute resp. infection prevalence (% of children under five)Diarrhea prevalence (% of children under five)Under-five mortality rate (per 1,000 live births) National accounting aggregatesGross savings (% of GNI)Consumption of fixed capital (% of GNI)Education expenditure (% of GNI)Energy depletion (% of GNI)Mineral depletion (% of GNI)Net forest depletion (% of GNI)CO2 damage (% of GNI)Particulate emissions damage (% of GNI)Adjusted net savings (% of GNI)
104 2010 The Little Green Data Book
1,880 2,644 2,07351 44 41
4.3 3.4 3.01.4 1.0 1.4
27 50 50674 509 589136 127 123507 552 516
46.8 28.5 24.81.9 0.1 0.2
15.7 14.7 11.218311511138681.0
4.1 3.6 3.9849 1,295 1,01327.5 12.8 16.3566 1,883 1,31087.1 82.2 80.07.9 14.7 15.2
0.4 0.9 0.81.5 3.8 2.8
121.7 135.9 105.783 69 69
108 113 97
12,632 4,940 3,154
2.9 10.2 8.791 74 8180 87 8671 81 8189 96 9452 66 5237 59 4167 75 69
8.010.4
41 29 64
22.2 47.3 41.110.7 10.1 9.61.1 2.0 2.3
12.6 7.2 8.11.4 1.5 1.40.0 0.0 0.20.6 1.1 1.10.5 0.7 0.6
–2.4 28.6 22.4
Country data
East Asia & Pacific
group
Lower middle-income group
Population (millions) 227 Land area (1,000 sq. km) 1,812 GDP ($ billions) 510.7
Indonesia

GNI per capita, World Bank Atlas method ($)Urban population (% of total)Urban population growth (average annual %, 1990–2008)Population growth (average annual %, 1990–2008) AgricultureAgricultural land (% of land area)Agricultural productivity (value added per worker, 2000 $)Food production index (1999–2001 = 100)Population density, rural (people/sq. km of arable land) Forests and biodiversityForest area (% of land area)Deforestation (average annual %, 1990–2007)Nationally protected area (% of land area)Threatened species, mammalsThreatened species, birdsThreatened species, fishThreatened species, higher plantsGEF benefits index for biodiversity (0–100, median is 1.5) EnergyGDP per unit of energy use (2005 PPP $/kg oil equivalent)Energy use per capita (kg oil equivalent)Energy from biomass products and waste (% of total)Electric power consumption per capita (kWh)Electricity generated using fossil fuel (% of total)Electricity generated by hydropower (% of total) Emissions and pollutionCO2 emissions per unit of GDP (kg/2005 PPP $)CO2 emissions per capita (metric tons)CO2 emissions growth (%, 1990–2006)Particulate matter (urban-pop.-weighted avg., μg/cu. m)Transport sector energy use per capita (kg of oil equivalent) Water and sanitationInternal freshwater resources per capita (cu. m)Freshwater withdrawal
Total (% of internal resources)Agriculture (% of total freshwater withdrawal)
Access to improved water source (% of total population)Rural (% of rural population)Urban (% of urban population)
Access to improved sanitation (% of total population)Rural (% of rural population)Urban (% of urban population)
Environment and healthAcute resp. infection prevalence (% of children under five)Diarrhea prevalence (% of children under five)Under-five mortality rate (per 1,000 live births) National accounting aggregatesGross savings (% of GNI)Consumption of fixed capital (% of GNI)Education expenditure (% of GNI)Energy depletion (% of GNI)Mineral depletion (% of GNI)Net forest depletion (% of GNI)CO2 damage (% of GNI)Particulate emissions damage (% of GNI)Adjusted net savings (% of GNI)
105The Little Green Data Book 2010
3,540 3,237 2,07368 57 412.6 2.6 3.01.6 2.0 1.4
30 23 503,061 2,896 589
125 120 123135 746 516
6.8 2.5 24.80.0 –0.4 0.27.0 3.8 11.21620211
7.3
4.0 5.0 3.92,604 1,275 1,013
0.5 1.1 16.32,325 1,435 1,310
91.1 91.1 80.08.8 7.4 15.2
0.7 0.6 0.86.7 3.5 2.8
105.6 96.4 105.751 72 69
497 258 97
1,809 714 3,154
72.6 122.3 8.792 86 81
.. 88 86
.. 81 8199 95 94
.. 74 52
.. 59 41
.. 89 69
24.011.3
32 34 64
.. .. 41.1
.. 10.5 9.64.2 4.4 2.3
.. 18.6 8.1
.. 1.5 1.4
.. 0.1 0.2
.. 0.7 1.10.4 0.4 0.6
.. .. 22.4
Country data
Middle East &
N. Africa group
Lower middle-income group
Population (millions) 72 Land area (1,000 sq. km) 1,629 GDP ($ billions) 286.1
Iran, Islamic Rep.

GNI per capita, World Bank Atlas method ($)Urban population (% of total)Urban population growth (average annual %, 1990–2008)Population growth (average annual %, 1990–2008) AgricultureAgricultural land (% of land area)Agricultural productivity (value added per worker, 2000 $)Food production index (1999–2001 = 100)Population density, rural (people/sq. km of arable land) Forests and biodiversityForest area (% of land area)Deforestation (average annual %, 1990–2007)Nationally protected area (% of land area)Threatened species, mammalsThreatened species, birdsThreatened species, fishThreatened species, higher plantsGEF benefits index for biodiversity (0–100, median is 1.5) EnergyGDP per unit of energy use (2005 PPP $/kg oil equivalent)Energy use per capita (kg oil equivalent)Energy from biomass products and waste (% of total)Electric power consumption per capita (kWh)Electricity generated using fossil fuel (% of total)Electricity generated by hydropower (% of total) Emissions and pollutionCO2 emissions per unit of GDP (kg/2005 PPP $)CO2 emissions per capita (metric tons)CO2 emissions growth (%, 1990–2006)Particulate matter (urban-pop.-weighted avg., μg/cu. m)Transport sector energy use per capita (kg of oil equivalent) Water and sanitationInternal freshwater resources per capita (cu. m)Freshwater withdrawal
Total (% of internal resources)Agriculture (% of total freshwater withdrawal)
Access to improved water source (% of total population)Rural (% of rural population)Urban (% of urban population)
Access to improved sanitation (% of total population)Rural (% of rural population)Urban (% of urban population)
Environment and healthAcute resp. infection prevalence (% of children under five)Diarrhea prevalence (% of children under five)Under-five mortality rate (per 1,000 live births) National accounting aggregatesGross savings (% of GNI)Consumption of fixed capital (% of GNI)Education expenditure (% of GNI)Energy depletion (% of GNI)Mineral depletion (% of GNI)Net forest depletion (% of GNI)CO2 damage (% of GNI)Particulate emissions damage (% of GNI)Adjusted net savings (% of GNI)
106 2010 The Little Green Data Book
.. 3,237 2,07367 57 412.4 2.6 3.02.7 2.0 1.4
22 23 502,261 2,896 589
95 120 123192 746 516
1.9 2.5 24.8–0.1 –0.4 0.20.0 3.8 11.21318
60
1.6
.. 5.0 3.91,105 1,275 1,013
0.1 1.1 16.31,080 1,435 1,310
98.5 91.1 80.01.5 7.4 15.2
.. 0.6 0.83.2 3.5 2.8
76.2 96.4 105.7115 72 69327 258 97
1,175 714 3,154
187.5 122.3 8.779 86 8177 88 8656 81 8188 95 9476 74 5269 59 4180 89 69
7.0..
44 34 64
.. .. 41.1
.. 10.5 9.6
.. 4.4 2.3
.. 18.6 8.1
.. 1.5 1.4
.. 0.1 0.2
.. 0.7 1.1
.. 0.4 0.6
.. .. 22.4
Country data
Middle East &
N. Africa group
Lower middle-income group
Population (millions) 31 Land area (1,000 sq. km) 437 GDP ($ billions) 12.6
Iraq

GNI per capita, World Bank Atlas method ($)Urban population (% of total)Urban population growth (average annual %, 1990–2008)Population growth (average annual %, 1990–2008) AgricultureAgricultural land (% of land area)Agricultural productivity (value added per worker, 2000 $)Food production index (1999–2001 = 100)Population density, rural (people/sq. km of arable land) Forests and biodiversityForest area (% of land area)Deforestation (average annual %, 1990–2007)Nationally protected area (% of land area)Threatened species, mammalsThreatened species, birdsThreatened species, fishThreatened species, higher plantsGEF benefits index for biodiversity (0–100, median is 1.5) EnergyGDP per unit of energy use (2005 PPP $/kg oil equivalent)Energy use per capita (kg oil equivalent)Energy from biomass products and waste (% of total)Electric power consumption per capita (kWh)Electricity generated using fossil fuel (% of total)Electricity generated by hydropower (% of total) Emissions and pollutionCO2 emissions per unit of GDP (kg/2005 PPP $)CO2 emissions per capita (metric tons)CO2 emissions growth (%, 1990–2006)Particulate matter (urban-pop.-weighted avg., μg/cu. m)Transport sector energy use per capita (kg of oil equivalent) Water and sanitationInternal freshwater resources per capita (cu. m)Freshwater withdrawal
Total (% of internal resources)Agriculture (% of total freshwater withdrawal)
Access to improved water source (% of total population)Rural (% of rural population)Urban (% of urban population)
Access to improved sanitation (% of total population)Rural (% of rural population)Urban (% of urban population)
Environment and healthAcute resp. infection prevalence (% of children under five)Diarrhea prevalence (% of children under five)Under-five mortality rate (per 1,000 live births) National accounting aggregatesGross savings (% of GNI)Consumption of fixed capital (% of GNI)Education expenditure (% of GNI)Energy depletion (% of GNI)Mineral depletion (% of GNI)Net forest depletion (% of GNI)CO2 damage (% of GNI)Particulate emissions damage (% of GNI)Adjusted net savings (% of GNI)
107The Little Green Data Book 2010
49,770 39,68861 781.7 1.01.3 0.7
62 3815,524 28,475
92 101160 341
10.1 28.9–2.7 –0.11.1 19.1
51
161
0.6
11.9 6.53,457 5,321
1.6 3.76,263 9,753
82.3 63.12.4 11.1
0.3 0.410.3 12.741.7 18.0
16 261,096 1,166
11,246 9,305
2.3 10.40 43.. 100.. 98
100 100.. 100.. 99.. 100
..
..4 7
19.7 18.517.1 13.85.2 4.60.0 2.00.0 0.20.0 0.00.1 0.20.0 0.17.5 6.8
Country data
High-income group
Population (millions) 4.4 Land area (1,000 sq. km) 69 GDP ($ billions) 267.6
Ireland

GNI per capita, World Bank Atlas method ($)Urban population (% of total)Urban population growth (average annual %, 1990–2008)Population growth (average annual %, 1990–2008) AgricultureAgricultural land (% of land area)Agricultural productivity (value added per worker, 2000 $)Food production index (1999–2001 = 100)Population density, rural (people/sq. km of arable land) Forests and biodiversityForest area (% of land area)Deforestation (average annual %, 1990–2007)Nationally protected area (% of land area)Threatened species, mammalsThreatened species, birdsThreatened species, fishThreatened species, higher plantsGEF benefits index for biodiversity (0–100, median is 1.5) EnergyGDP per unit of energy use (2005 PPP $/kg oil equivalent)Energy use per capita (kg oil equivalent)Energy from biomass products and waste (% of total)Electric power consumption per capita (kWh)Electricity generated using fossil fuel (% of total)Electricity generated by hydropower (% of total) Emissions and pollutionCO2 emissions per unit of GDP (kg/2005 PPP $)CO2 emissions per capita (metric tons)CO2 emissions growth (%, 1990–2006)Particulate matter (urban-pop.-weighted avg., μg/cu. m)Transport sector energy use per capita (kg of oil equivalent) Water and sanitationInternal freshwater resources per capita (cu. m)Freshwater withdrawal
Total (% of internal resources)Agriculture (% of total freshwater withdrawal)
Access to improved water source (% of total population)Rural (% of rural population)Urban (% of urban population)
Access to improved sanitation (% of total population)Rural (% of rural population)Urban (% of urban population)
Environment and healthAcute resp. infection prevalence (% of children under five)Diarrhea prevalence (% of children under five)Under-five mortality rate (per 1,000 live births) National accounting aggregatesGross savings (% of GNI)Consumption of fixed capital (% of GNI)Education expenditure (% of GNI)Energy depletion (% of GNI)Mineral depletion (% of GNI)Net forest depletion (% of GNI)CO2 damage (% of GNI)Particulate emissions damage (% of GNI)Adjusted net savings (% of GNI)
108 2010 The Little Green Data Book
49,310 39,68851 780.7 1.00.8 0.7
46 38.. 28,475.. 101
564 341
6.1 28.90.0 –0.1
.. 19.10030
0.0
.. 6.5
.. 5,321
.. 3.7
.. 9,753
.. 63.1
.. 11.1
.. 0.4
.. 12.7
.. 18.0
.. 26
.. 1,166
.. 9,305
.. 10.4
.. 43
.. 100
.. 98
.. 100
.. 100
.. 99
.. 100
..
..
.. 7
.. 18.5
.. 13.8
.. 4.6
.. 2.0
.. 0.2
.. 0.0
.. 0.2
.. 0.1
.. 6.8
Country data
High-income group
Population (thousands) 81 Land area (sq. km) 570 GDP ($ billions) 4.1
Isle of Man
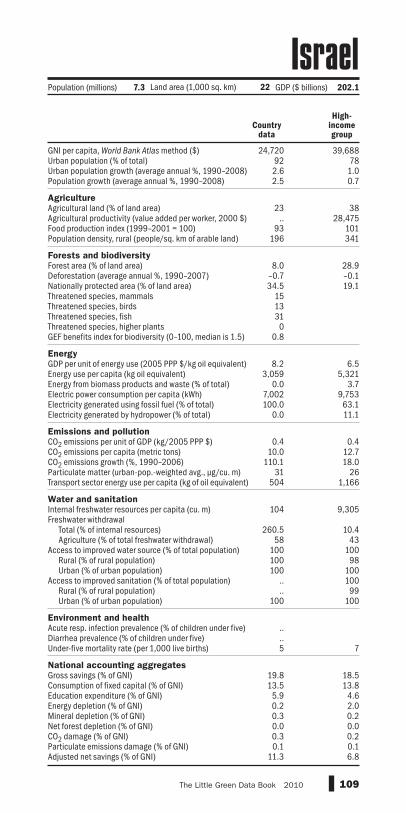
GNI per capita, World Bank Atlas method ($)Urban population (% of total)Urban population growth (average annual %, 1990–2008)Population growth (average annual %, 1990–2008) AgricultureAgricultural land (% of land area)Agricultural productivity (value added per worker, 2000 $)Food production index (1999–2001 = 100)Population density, rural (people/sq. km of arable land) Forests and biodiversityForest area (% of land area)Deforestation (average annual %, 1990–2007)Nationally protected area (% of land area)Threatened species, mammalsThreatened species, birdsThreatened species, fishThreatened species, higher plantsGEF benefits index for biodiversity (0–100, median is 1.5) EnergyGDP per unit of energy use (2005 PPP $/kg oil equivalent)Energy use per capita (kg oil equivalent)Energy from biomass products and waste (% of total)Electric power consumption per capita (kWh)Electricity generated using fossil fuel (% of total)Electricity generated by hydropower (% of total) Emissions and pollutionCO2 emissions per unit of GDP (kg/2005 PPP $)CO2 emissions per capita (metric tons)CO2 emissions growth (%, 1990–2006)Particulate matter (urban-pop.-weighted avg., μg/cu. m)Transport sector energy use per capita (kg of oil equivalent) Water and sanitationInternal freshwater resources per capita (cu. m)Freshwater withdrawal
Total (% of internal resources)Agriculture (% of total freshwater withdrawal)
Access to improved water source (% of total population)Rural (% of rural population)Urban (% of urban population)
Access to improved sanitation (% of total population)Rural (% of rural population)Urban (% of urban population)
Environment and healthAcute resp. infection prevalence (% of children under five)Diarrhea prevalence (% of children under five)Under-five mortality rate (per 1,000 live births) National accounting aggregatesGross savings (% of GNI)Consumption of fixed capital (% of GNI)Education expenditure (% of GNI)Energy depletion (% of GNI)Mineral depletion (% of GNI)Net forest depletion (% of GNI)CO2 damage (% of GNI)Particulate emissions damage (% of GNI)Adjusted net savings (% of GNI)
109The Little Green Data Book 2010
24,720 39,68892 782.6 1.02.5 0.7
23 38.. 28,475
93 101196 341
8.0 28.9–0.7 –0.134.5 19.1
1513310
0.8
8.2 6.53,059 5,321
0.0 3.77,002 9,753100.0 63.1
0.0 11.1
0.4 0.410.0 12.7
110.1 18.031 26
504 1,166
104 9,305
260.5 10.458 43
100 100100 98100 100
.. 100
.. 99100 100
..
..5 7
19.8 18.513.5 13.8
5.9 4.60.2 2.00.3 0.20.0 0.00.3 0.20.1 0.1
11.3 6.8
Population (millions) 7.3 Land area (1,000 sq. km) 22 GDP ($ billions) 202.1
Country data
High-income group
Israel
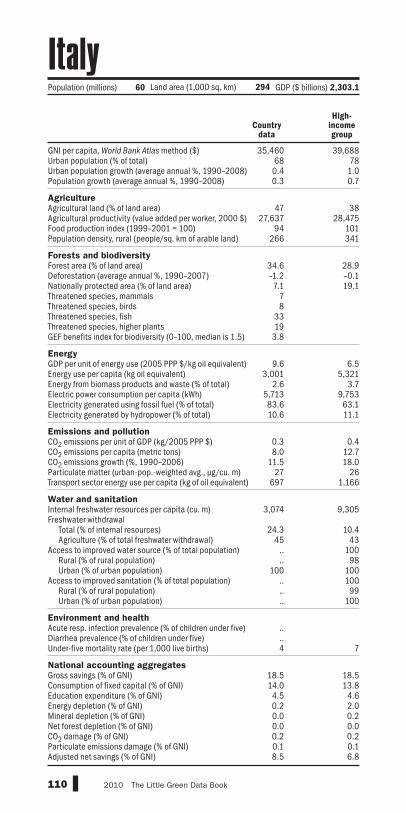
GNI per capita, World Bank Atlas method ($)Urban population (% of total)Urban population growth (average annual %, 1990–2008)Population growth (average annual %, 1990–2008) AgricultureAgricultural land (% of land area)Agricultural productivity (value added per worker, 2000 $)Food production index (1999–2001 = 100)Population density, rural (people/sq. km of arable land) Forests and biodiversityForest area (% of land area)Deforestation (average annual %, 1990–2007)Nationally protected area (% of land area)Threatened species, mammalsThreatened species, birdsThreatened species, fishThreatened species, higher plantsGEF benefits index for biodiversity (0–100, median is 1.5) EnergyGDP per unit of energy use (2005 PPP $/kg oil equivalent)Energy use per capita (kg oil equivalent)Energy from biomass products and waste (% of total)Electric power consumption per capita (kWh)Electricity generated using fossil fuel (% of total)Electricity generated by hydropower (% of total) Emissions and pollutionCO2 emissions per unit of GDP (kg/2005 PPP $)CO2 emissions per capita (metric tons)CO2 emissions growth (%, 1990–2006)Particulate matter (urban-pop.-weighted avg., μg/cu. m)Transport sector energy use per capita (kg of oil equivalent) Water and sanitationInternal freshwater resources per capita (cu. m)Freshwater withdrawal
Total (% of internal resources)Agriculture (% of total freshwater withdrawal)
Access to improved water source (% of total population)Rural (% of rural population)Urban (% of urban population)
Access to improved sanitation (% of total population)Rural (% of rural population)Urban (% of urban population)
Environment and healthAcute resp. infection prevalence (% of children under five)Diarrhea prevalence (% of children under five)Under-five mortality rate (per 1,000 live births) National accounting aggregatesGross savings (% of GNI)Consumption of fixed capital (% of GNI)Education expenditure (% of GNI)Energy depletion (% of GNI)Mineral depletion (% of GNI)Net forest depletion (% of GNI)CO2 damage (% of GNI)Particulate emissions damage (% of GNI)Adjusted net savings (% of GNI)
110 2010 The Little Green Data Book
35,460 39,68868 780.4 1.00.3 0.7
47 3827,637 28,475
94 101266 341
34.6 28.9–1.2 –0.17.1 19.1
78
3319
3.8
9.6 6.53,001 5,321
2.6 3.75,713 9,75383.6 63.110.6 11.1
0.3 0.48.0 12.7
11.5 18.027 26
697 1,166
3,074 9,305
24.3 10.445 43
.. 100
.. 98100 100
.. 100
.. 99
.. 100
..
..4 7
18.5 18.514.0 13.84.5 4.60.2 2.00.0 0.20.0 0.00.2 0.20.1 0.18.5 6.8
Population (millions) 60 Land area (1,000 sq. km) 294 GDP ($ billions) 2,303.1
Country data
High-income group
Italy

GNI per capita, World Bank Atlas method ($)Urban population (% of total)Urban population growth (average annual %, 1990–2008)Population growth (average annual %, 1990–2008) AgricultureAgricultural land (% of land area)Agricultural productivity (value added per worker, 2000 $)Food production index (1999–2001 = 100)Population density, rural (people/sq. km of arable land) Forests and biodiversityForest area (% of land area)Deforestation (average annual %, 1990–2007)Nationally protected area (% of land area)Threatened species, mammalsThreatened species, birdsThreatened species, fishThreatened species, higher plantsGEF benefits index for biodiversity (0–100, median is 1.5) EnergyGDP per unit of energy use (2005 PPP $/kg oil equivalent)Energy use per capita (kg oil equivalent)Energy from biomass products and waste (% of total)Electric power consumption per capita (kWh)Electricity generated using fossil fuel (% of total)Electricity generated by hydropower (% of total) Emissions and pollutionCO2 emissions per unit of GDP (kg/2005 PPP $)CO2 emissions per capita (metric tons)CO2 emissions growth (%, 1990–2006)Particulate matter (urban-pop.-weighted avg., μg/cu. m)Transport sector energy use per capita (kg of oil equivalent) Water and sanitationInternal freshwater resources per capita (cu. m)Freshwater withdrawal
Total (% of internal resources)Agriculture (% of total freshwater withdrawal)
Access to improved water source (% of total population)Rural (% of rural population)Urban (% of urban population)
Access to improved sanitation (% of total population)Rural (% of rural population)Urban (% of urban population)
Environment and healthAcute resp. infection prevalence (% of children under five)Diarrhea prevalence (% of children under five)Under-five mortality rate (per 1,000 live births) National accounting aggregatesGross savings (% of GNI)Consumption of fixed capital (% of GNI)Education expenditure (% of GNI)Energy depletion (% of GNI)Mineral depletion (% of GNI)Net forest depletion (% of GNI)CO2 damage (% of GNI)Particulate emissions damage (% of GNI)Adjusted net savings (% of GNI)
111The Little Green Data Book 2010
4,800 6,768 7,85253 79 751.1 2.0 1.50.7 1.5 1.0
47 36 302,459 3,452 3,399
98 125 120721 233 146
31.2 44.9 37.30.1 0.5 0.2
20.9 22.8 14.05
1015
2094.4
3.9 7.5 5.21,852 1,273 2,130
9.8 16.3 7.32,542 1,866 3,052
95.9 38.2 63.42.1 55.8 27.5
0.6 0.3 0.54.6 2.6 5.2
52.6 40.0 –4.943 35 32
373 317 374
3,514 24,004 18,876
4.4 2.0 13.849 71 5893 91 9488 73 8297 97 9883 78 8284 51 6382 86 89
3.0..
31 23 23
.. 22.4 23.811.4 11.8 12.15.3 4.4 4.20.0 6.3 9.41.3 1.8 1.30.0 0.0 0.00.6 0.3 0.50.2 0.3 0.2
.. 6.3 4.6
Country data
Latin America & Caribbean
group
Upper middle-income group
Population (millions) 2.7 Land area (1,000 sq. km) 11 GDP ($ billions) 14.6
Jamaica

GNI per capita, World Bank Atlas method ($)Urban population (% of total)Urban population growth (average annual %, 1990–2008)Population growth (average annual %, 1990–2008) AgricultureAgricultural land (% of land area)Agricultural productivity (value added per worker, 2000 $)Food production index (1999–2001 = 100)Population density, rural (people/sq. km of arable land) Forests and biodiversityForest area (% of land area)Deforestation (average annual %, 1990–2007)Nationally protected area (% of land area)Threatened species, mammalsThreatened species, birdsThreatened species, fishThreatened species, higher plantsGEF benefits index for biodiversity (0–100, median is 1.5) EnergyGDP per unit of energy use (2005 PPP $/kg oil equivalent)Energy use per capita (kg oil equivalent)Energy from biomass products and waste (% of total)Electric power consumption per capita (kWh)Electricity generated using fossil fuel (% of total)Electricity generated by hydropower (% of total) Emissions and pollutionCO2 emissions per unit of GDP (kg/2005 PPP $)CO2 emissions per capita (metric tons)CO2 emissions growth (%, 1990–2006)Particulate matter (urban-pop.-weighted avg., μg/cu. m)Transport sector energy use per capita (kg of oil equivalent) Water and sanitationInternal freshwater resources per capita (cu. m)Freshwater withdrawal
Total (% of internal resources)Agriculture (% of total freshwater withdrawal)
Access to improved water source (% of total population)Rural (% of rural population)Urban (% of urban population)
Access to improved sanitation (% of total population)Rural (% of rural population)Urban (% of urban population)
Environment and healthAcute resp. infection prevalence (% of children under five)Diarrhea prevalence (% of children under five)Under-five mortality rate (per 1,000 live births) National accounting aggregatesGross savings (% of GNI)Consumption of fixed capital (% of GNI)Education expenditure (% of GNI)Energy depletion (% of GNI)Mineral depletion (% of GNI)Net forest depletion (% of GNI)CO2 damage (% of GNI)Particulate emissions damage (% of GNI)Adjusted net savings (% of GNI)
112 2010 The Little Green Data Book
38,130 39,68866 780.5 1.00.2 0.7
13 3845,520 28,475
99 101995 341
68.2 28.90.0 –0.1
14.1 19.127404012
36.0
7.9 6.54,019 5,321
1.4 3.78,474 9,75363.2 63.1
6.6 11.1
0.3 0.410.1 12.710.3 18.0
30 26645 1,166
3,365 9,305
20.6 10.462 43
100 100100 98100 100100 100100 99100 100
..
..4 7
25.9 18.513.3 13.8
3.2 4.60.0 2.00.0 0.20.0 0.00.2 0.20.3 0.1
15.3 6.8
Country data
High-income group
Population (millions) 128 Land area (1,000 sq. km) 365 GDP ($ billions) 4,910.8
Japan

GNI per capita, World Bank Atlas method ($)Urban population (% of total)Urban population growth (average annual %, 1990–2008)Population growth (average annual %, 1990–2008) AgricultureAgricultural land (% of land area)Agricultural productivity (value added per worker, 2000 $)Food production index (1999–2001 = 100)Population density, rural (people/sq. km of arable land) Forests and biodiversityForest area (% of land area)Deforestation (average annual %, 1990–2007)Nationally protected area (% of land area)Threatened species, mammalsThreatened species, birdsThreatened species, fishThreatened species, higher plantsGEF benefits index for biodiversity (0–100, median is 1.5) EnergyGDP per unit of energy use (2005 PPP $/kg oil equivalent)Energy use per capita (kg oil equivalent)Energy from biomass products and waste (% of total)Electric power consumption per capita (kWh)Electricity generated using fossil fuel (% of total)Electricity generated by hydropower (% of total) Emissions and pollutionCO2 emissions per unit of GDP (kg/2005 PPP $)CO2 emissions per capita (metric tons)CO2 emissions growth (%, 1990–2006)Particulate matter (urban-pop.-weighted avg., μg/cu. m)Transport sector energy use per capita (kg of oil equivalent) Water and sanitationInternal freshwater resources per capita (cu. m)Freshwater withdrawal
Total (% of internal resources)Agriculture (% of total freshwater withdrawal)
Access to improved water source (% of total population)Rural (% of rural population)Urban (% of urban population)
Access to improved sanitation (% of total population)Rural (% of rural population)Urban (% of urban population)
Environment and healthAcute resp. infection prevalence (% of children under five)Diarrhea prevalence (% of children under five)Under-five mortality rate (per 1,000 live births) National accounting aggregatesGross savings (% of GNI)Consumption of fixed capital (% of GNI)Education expenditure (% of GNI)Energy depletion (% of GNI)Mineral depletion (% of GNI)Net forest depletion (% of GNI)CO2 damage (% of GNI)Particulate emissions damage (% of GNI)Adjusted net savings (% of GNI)
113The Little Green Data Book 2010
3,470 3,237 2,07378 57 41
3.9 2.6 3.03.5 2.0 1.4
11 23 502,558 2,896 589
135 120 123881 746 516
0.9 2.5 24.80.0 –0.4 0.2
10.5 3.8 11.213
8140
0.4
3.8 5.0 3.91,259 1,275 1,013
0.1 1.1 16.31,956 1,435 1,310
99.4 91.1 80.00.5 7.4 15.2
0.8 0.6 0.83.7 3.5 2.8
99.2 96.4 105.745 72 69
296 258 97
119 714 3,154
138.0 122.3 8.765 86 8198 88 8691 81 8199 95 9485 74 5271 59 4188 89 69
6.018.0
20 34 64
13.7 .. 41.19.8 10.5 9.65.6 4.4 2.30.2 18.6 8.14.5 1.5 1.40.0 0.1 0.20.8 0.7 1.10.2 0.4 0.63.6 .. 22.4
Country data
Middle East &
N. Africa group
Lower middle-income group
Population (millions) 5.9 Land area (1,000 sq. km) 88 GDP ($ billions) 21.2
Jordan

GNI per capita, World Bank Atlas method ($)Urban population (% of total)Urban population growth (average annual %, 1990–2008)Population growth (average annual %, 1990–2008) AgricultureAgricultural land (% of land area)Agricultural productivity (value added per worker, 2000 $)Food production index (1999–2001 = 100)Population density, rural (people/sq. km of arable land) Forests and biodiversityForest area (% of land area)Deforestation (average annual %, 1990–2007)Nationally protected area (% of land area)Threatened species, mammalsThreatened species, birdsThreatened species, fishThreatened species, higher plantsGEF benefits index for biodiversity (0–100, median is 1.5) EnergyGDP per unit of energy use (2005 PPP $/kg oil equivalent)Energy use per capita (kg oil equivalent)Energy from biomass products and waste (% of total)Electric power consumption per capita (kWh)Electricity generated using fossil fuel (% of total)Electricity generated by hydropower (% of total) Emissions and pollutionCO2 emissions per unit of GDP (kg/2005 PPP $)CO2 emissions per capita (metric tons)CO2 emissions growth (%, 1990–2006)Particulate matter (urban-pop.-weighted avg., μg/cu. m)Transport sector energy use per capita (kg of oil equivalent) Water and sanitationInternal freshwater resources per capita (cu. m)Freshwater withdrawal
Total (% of internal resources)Agriculture (% of total freshwater withdrawal)
Access to improved water source (% of total population)Rural (% of rural population)Urban (% of urban population)
Access to improved sanitation (% of total population)Rural (% of rural population)Urban (% of urban population)
Environment and healthAcute resp. infection prevalence (% of children under five)Diarrhea prevalence (% of children under five)Under-five mortality rate (per 1,000 live births) National accounting aggregatesGross savings (% of GNI)Consumption of fixed capital (% of GNI)Education expenditure (% of GNI)Energy depletion (% of GNI)Mineral depletion (% of GNI)Net forest depletion (% of GNI)CO2 damage (% of GNI)Particulate emissions damage (% of GNI)Adjusted net savings (% of GNI)
114 2010 The Little Green Data Book
6,160 7,350 7,85258 64 75
–0.1 0.2 1.5–0.2 0.1 1.0
77 28 301,870 2,797 3,399
137 113 12029 144 146
1.2 38.4 37.30.2 0.0 0.22.8 7.8 14.016211316
5.1
2.4 3.7 5.24,292 2,948 2,130
0.1 2.1 7.34,448 3,958 3,052
89.3 68.9 63.410.7 16.2 27.5
1.3 0.7 0.512.6 7.3 5.2
–34.4 –30.0 –4.919 27 32
284 376 374
4,871 11,867 18,876
46.4 7.2 13.882 60 5896 95 9491 88 8299 99 9897 89 8298 79 6397 94 89
3.013.4
30 22 23
46.2 24.8 23.813.5 12.1 12.1
4.4 4.1 4.231.3 12.1 9.41.8 0.6 1.30.0 0.0 0.01.4 0.8 0.50.1 0.2 0.22.5 3.2 4.6
Country data
Europe & Central
Asia group
Upper middle-income group
Population (millions) 16 Land area (1,000 sq. km) 2,700 GDP ($ billions) 133.4
Kazakhstan

GNI per capita, World Bank Atlas method ($)Urban population (% of total)Urban population growth (average annual %, 1990–2008)Population growth (average annual %, 1990–2008) AgricultureAgricultural land (% of land area)Agricultural productivity (value added per worker, 2000 $)Food production index (1999–2001 = 100)Population density, rural (people/sq. km of arable land) Forests and biodiversityForest area (% of land area)Deforestation (average annual %, 1990–2007)Nationally protected area (% of land area)Threatened species, mammalsThreatened species, birdsThreatened species, fishThreatened species, higher plantsGEF benefits index for biodiversity (0–100, median is 1.5) EnergyGDP per unit of energy use (2005 PPP $/kg oil equivalent)Energy use per capita (kg oil equivalent)Energy from biomass products and waste (% of total)Electric power consumption per capita (kWh)Electricity generated using fossil fuel (% of total)Electricity generated by hydropower (% of total) Emissions and pollutionCO2 emissions per unit of GDP (kg/2005 PPP $)CO2 emissions per capita (metric tons)CO2 emissions growth (%, 1990–2006)Particulate matter (urban-pop.-weighted avg., μg/cu. m)Transport sector energy use per capita (kg of oil equivalent) Water and sanitationInternal freshwater resources per capita (cu. m)Freshwater withdrawal
Total (% of internal resources)Agriculture (% of total freshwater withdrawal)
Access to improved water source (% of total population)Rural (% of rural population)Urban (% of urban population)
Access to improved sanitation (% of total population)Rural (% of rural population)Urban (% of urban population)
Environment and healthAcute resp. infection prevalence (% of children under five)Diarrhea prevalence (% of children under five)Under-five mortality rate (per 1,000 live births) National accounting aggregatesGross savings (% of GNI)Consumption of fixed capital (% of GNI)Education expenditure (% of GNI)Energy depletion (% of GNI)Mineral depletion (% of GNI)Net forest depletion (% of GNI)CO2 damage (% of GNI)Particulate emissions damage (% of GNI)Adjusted net savings (% of GNI)
115The Little Green Data Book 2010
730 1,077 52322 36 293.7 4.0 3.52.8 2.6 2.2
47 45 38370 330 318136 119 125571 353 666
6.1 26.1 24.70.3 0.7 0.7
12.3 12.4 11.9272771
1038.8
3.0 3.2 3.2485 662 42374.0 55.8 49.3151 550 324
28.8 67.0 41.651.4 16.9 41.9
0.2 0.5 0.40.3 0.8 0.5
108.7 37.4 –6.036 53 6550 61 37
548 4,829 5,004
13.2 3.2 9.479 87 8857 58 6749 46 6085 81 8642 31 3848 24 3319 42 52
18.017.1128 144 118
13.1 16.5 25.98.0 9.0 7.96.6 3.3 3.40.0 14.2 7.80.1 1.3 1.01.0 0.6 1.00.3 0.6 0.70.1 0.4 0.3
10.2 –6.2 10.7
Country data
Sub-Saharan Africa group
Low-income group
Population (millions) 39 Land area (1,000 sq. km) 569 GDP ($ billions) 30.4
Kenya

GNI per capita, World Bank Atlas method ($)Urban population (% of total)Urban population growth (average annual %, 1990–2008)Population growth (average annual %, 1990–2008) AgricultureAgricultural land (% of land area)Agricultural productivity (value added per worker, 2000 $)Food production index (1999–2001 = 100)Population density, rural (people/sq. km of arable land) Forests and biodiversityForest area (% of land area)Deforestation (average annual %, 1990–2007)Nationally protected area (% of land area)Threatened species, mammalsThreatened species, birdsThreatened species, fishThreatened species, higher plantsGEF benefits index for biodiversity (0–100, median is 1.5) EnergyGDP per unit of energy use (2005 PPP $/kg oil equivalent)Energy use per capita (kg oil equivalent)Energy from biomass products and waste (% of total)Electric power consumption per capita (kWh)Electricity generated using fossil fuel (% of total)Electricity generated by hydropower (% of total) Emissions and pollutionCO2 emissions per unit of GDP (kg/2005 PPP $)CO2 emissions per capita (metric tons)CO2 emissions growth (%, 1990–2006)Particulate matter (urban-pop.-weighted avg., μg/cu. m)Transport sector energy use per capita (kg of oil equivalent) Water and sanitationInternal freshwater resources per capita (cu. m)Freshwater withdrawal
Total (% of internal resources)Agriculture (% of total freshwater withdrawal)
Access to improved water source (% of total population)Rural (% of rural population)Urban (% of urban population)
Access to improved sanitation (% of total population)Rural (% of rural population)Urban (% of urban population)
Environment and healthAcute resp. infection prevalence (% of children under five)Diarrhea prevalence (% of children under five)Under-five mortality rate (per 1,000 live births) National accounting aggregatesGross savings (% of GNI)Consumption of fixed capital (% of GNI)Education expenditure (% of GNI)Energy depletion (% of GNI)Mineral depletion (% of GNI)Net forest depletion (% of GNI)CO2 damage (% of GNI)Particulate emissions damage (% of GNI)Adjusted net savings (% of GNI)
116 2010 The Little Green Data Book
2,040 2,644 2,07344 44 412.9 3.4 3.01.6 1.0 1.4
46 50 501,365 509 589
126 127 1232,673 552 516
2.7 28.5 24.80.0 0.1 0.2
55.0 14.7 11.21570
1.1
.. 3.6 3.9
.. 1,295 1,013
.. 12.8 16.3
.. 1,883 1,310
.. 82.2 80.0
.. 14.7 15.2
0.1 0.9 0.80.3 3.8 2.8
33.3 135.9 105.7.. 69 69.. 113 97
.. 4,940 3,154
.. 10.2 8.7
.. 74 8165 87 8653 81 8177 96 9433 66 5220 59 4146 75 69
..
..48 29 64
.. 47.3 41.16.0 10.1 9.6
.. 2.0 2.30.0 7.2 8.10.0 1.5 1.4
.. 0.0 0.20.1 1.1 1.1
.. 0.7 0.6
.. 28.6 22.4
Country data
East Asia & Pacific
group
Lower middle-income group
Population (thousands) 97 Land area (sq. km) 810 GDP ($ millions) 137
Kiribati
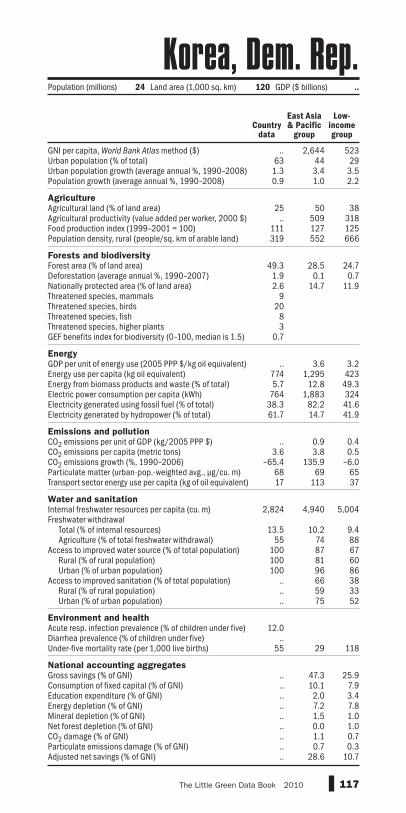
GNI per capita, World Bank Atlas method ($)Urban population (% of total)Urban population growth (average annual %, 1990–2008)Population growth (average annual %, 1990–2008) AgricultureAgricultural land (% of land area)Agricultural productivity (value added per worker, 2000 $)Food production index (1999–2001 = 100)Population density, rural (people/sq. km of arable land) Forests and biodiversityForest area (% of land area)Deforestation (average annual %, 1990–2007)Nationally protected area (% of land area)Threatened species, mammalsThreatened species, birdsThreatened species, fishThreatened species, higher plantsGEF benefits index for biodiversity (0–100, median is 1.5) EnergyGDP per unit of energy use (2005 PPP $/kg oil equivalent)Energy use per capita (kg oil equivalent)Energy from biomass products and waste (% of total)Electric power consumption per capita (kWh)Electricity generated using fossil fuel (% of total)Electricity generated by hydropower (% of total) Emissions and pollutionCO2 emissions per unit of GDP (kg/2005 PPP $)CO2 emissions per capita (metric tons)CO2 emissions growth (%, 1990–2006)Particulate matter (urban-pop.-weighted avg., μg/cu. m)Transport sector energy use per capita (kg of oil equivalent) Water and sanitationInternal freshwater resources per capita (cu. m)Freshwater withdrawal
Total (% of internal resources)Agriculture (% of total freshwater withdrawal)
Access to improved water source (% of total population)Rural (% of rural population)Urban (% of urban population)
Access to improved sanitation (% of total population)Rural (% of rural population)Urban (% of urban population)
Environment and healthAcute resp. infection prevalence (% of children under five)Diarrhea prevalence (% of children under five)Under-five mortality rate (per 1,000 live births) National accounting aggregatesGross savings (% of GNI)Consumption of fixed capital (% of GNI)Education expenditure (% of GNI)Energy depletion (% of GNI)Mineral depletion (% of GNI)Net forest depletion (% of GNI)CO2 damage (% of GNI)Particulate emissions damage (% of GNI)Adjusted net savings (% of GNI)
117The Little Green Data Book 2010
Country data
East Asia & Pacific
group
Low-income group
.. 2,644 52363 44 291.3 3.4 3.50.9 1.0 2.2
25 50 38.. 509 318
111 127 125319 552 666
49.3 28.5 24.71.9 0.1 0.72.6 14.7 11.9
920
83
0.7
.. 3.6 3.2774 1,295 4235.7 12.8 49.3
764 1,883 32438.3 82.2 41.661.7 14.7 41.9
.. 0.9 0.43.6 3.8 0.5
–65.4 135.9 –6.068 69 6517 113 37
2,824 4,940 5,004
13.5 10.2 9.455 74 88
100 87 67100 81 60100 96 86
.. 66 38
.. 59 33
.. 75 52
12.0..
55 29 118
.. 47.3 25.9
.. 10.1 7.9
.. 2.0 3.4
.. 7.2 7.8
.. 1.5 1.0
.. 0.0 1.0
.. 1.1 0.7
.. 0.7 0.3
.. 28.6 10.7
Population (millions) 24 Land area (1,000 sq. km) 120 GDP ($ billions) ..
Korea, Dem. Rep.

GNI per capita, World Bank Atlas method ($)Urban population (% of total)Urban population growth (average annual %, 1990–2008)Population growth (average annual %, 1990–2008) AgricultureAgricultural land (% of land area)Agricultural productivity (value added per worker, 2000 $)Food production index (1999–2001 = 100)Population density, rural (people/sq. km of arable land) Forests and biodiversityForest area (% of land area)Deforestation (average annual %, 1990–2007)Nationally protected area (% of land area)Threatened species, mammalsThreatened species, birdsThreatened species, fishThreatened species, higher plantsGEF benefits index for biodiversity (0–100, median is 1.5) EnergyGDP per unit of energy use (2005 PPP $/kg oil equivalent)Energy use per capita (kg oil equivalent)Energy from biomass products and waste (% of total)Electric power consumption per capita (kWh)Electricity generated using fossil fuel (% of total)Electricity generated by hydropower (% of total) Emissions and pollutionCO2 emissions per unit of GDP (kg/2005 PPP $)CO2 emissions per capita (metric tons)CO2 emissions growth (%, 1990–2006)Particulate matter (urban-pop.-weighted avg., μg/cu. m)Transport sector energy use per capita (kg of oil equivalent) Water and sanitationInternal freshwater resources per capita (cu. m)Freshwater withdrawal
Total (% of internal resources)Agriculture (% of total freshwater withdrawal)
Access to improved water source (% of total population)Rural (% of rural population)Urban (% of urban population)
Access to improved sanitation (% of total population)Rural (% of rural population)Urban (% of urban population)
Environment and healthAcute resp. infection prevalence (% of children under five)Diarrhea prevalence (% of children under five)Under-five mortality rate (per 1,000 live births) National accounting aggregatesGross savings (% of GNI)Consumption of fixed capital (% of GNI)Education expenditure (% of GNI)Energy depletion (% of GNI)Mineral depletion (% of GNI)Net forest depletion (% of GNI)CO2 damage (% of GNI)Particulate emissions damage (% of GNI)Adjusted net savings (% of GNI)
118 2010 The Little Green Data Book
21,530 39,68881 78
1.2 1.00.7 0.7
19 3815,840 28,475
96 101569 341
64.5 28.90.1 –0.14.3 19.1
930140
1.7
5.5 6.54,586 5,321
1.2 3.78,502 9,753
65.3 63.10.9 11.1
0.4 0.49.8 12.7
96.7 18.035 26
624 1,166
1,338 9,305
28.7 10.448 43
.. 100
.. 9897 100
.. 100
.. 99
.. 100
..
..5 7
30.5 18.512.6 13.83.9 4.60.0 2.00.0 0.20.0 0.00.4 0.20.3 0.1
21.1 6.8
Country data
High-income group
Population (millions) 49 Land area (1,000 sq. km) 97 GDP ($ billions) 929.1
Korea, Rep.
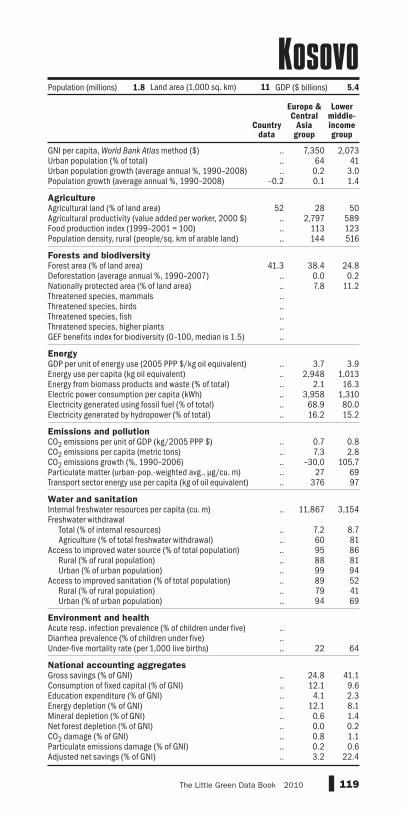
GNI per capita, World Bank Atlas method ($)Urban population (% of total)Urban population growth (average annual %, 1990–2008)Population growth (average annual %, 1990–2008) AgricultureAgricultural land (% of land area)Agricultural productivity (value added per worker, 2000 $)Food production index (1999–2001 = 100)Population density, rural (people/sq. km of arable land) Forests and biodiversityForest area (% of land area)Deforestation (average annual %, 1990–2007)Nationally protected area (% of land area)Threatened species, mammalsThreatened species, birdsThreatened species, fishThreatened species, higher plantsGEF benefits index for biodiversity (0–100, median is 1.5) EnergyGDP per unit of energy use (2005 PPP $/kg oil equivalent)Energy use per capita (kg oil equivalent)Energy from biomass products and waste (% of total)Electric power consumption per capita (kWh)Electricity generated using fossil fuel (% of total)Electricity generated by hydropower (% of total) Emissions and pollutionCO2 emissions per unit of GDP (kg/2005 PPP $)CO2 emissions per capita (metric tons)CO2 emissions growth (%, 1990–2006)Particulate matter (urban-pop.-weighted avg., μg/cu. m)Transport sector energy use per capita (kg of oil equivalent) Water and sanitationInternal freshwater resources per capita (cu. m)Freshwater withdrawal
Total (% of internal resources)Agriculture (% of total freshwater withdrawal)
Access to improved water source (% of total population)Rural (% of rural population)Urban (% of urban population)
Access to improved sanitation (% of total population)Rural (% of rural population)Urban (% of urban population)
Environment and healthAcute resp. infection prevalence (% of children under five)Diarrhea prevalence (% of children under five)Under-five mortality rate (per 1,000 live births) National accounting aggregatesGross savings (% of GNI)Consumption of fixed capital (% of GNI)Education expenditure (% of GNI)Energy depletion (% of GNI)Mineral depletion (% of GNI)Net forest depletion (% of GNI)CO2 damage (% of GNI)Particulate emissions damage (% of GNI)Adjusted net savings (% of GNI)
119The Little Green Data Book 2010
.. 7,350 2,073
.. 64 41
.. 0.2 3.0–0.2 0.1 1.4
52 28 50.. 2,797 589.. 113 123.. 144 516
41.3 38.4 24.8.. 0.0 0.2.. 7.8 11.2..........
.. 3.7 3.9
.. 2,948 1,013
.. 2.1 16.3
.. 3,958 1,310
.. 68.9 80.0
.. 16.2 15.2
.. 0.7 0.8
.. 7.3 2.8
.. –30.0 105.7
.. 27 69
.. 376 97
.. 11,867 3,154
.. 7.2 8.7
.. 60 81
.. 95 86
.. 88 81
.. 99 94
.. 89 52
.. 79 41
.. 94 69
..
..
.. 22 64
.. 24.8 41.1
.. 12.1 9.6
.. 4.1 2.3
.. 12.1 8.1
.. 0.6 1.4
.. 0.0 0.2
.. 0.8 1.1
.. 0.2 0.6
.. 3.2 22.4
Country data
Europe & Central
Asia group
Lower middle-income group
Population (millions) 1.8 Land area (1,000 sq. km) 11 GDP ($ billions) 5.4
Kosovo

GNI per capita, World Bank Atlas method ($)Urban population (% of total)Urban population growth (average annual %, 1990–2008)Population growth (average annual %, 1990–2008) AgricultureAgricultural land (% of land area)Agricultural productivity (value added per worker, 2000 $)Food production index (1999–2001 = 100)Population density, rural (people/sq. km of arable land) Forests and biodiversityForest area (% of land area)Deforestation (average annual %, 1990–2007)Nationally protected area (% of land area)Threatened species, mammalsThreatened species, birdsThreatened species, fishThreatened species, higher plantsGEF benefits index for biodiversity (0–100, median is 1.5) EnergyGDP per unit of energy use (2005 PPP $/kg oil equivalent)Energy use per capita (kg oil equivalent)Energy from biomass products and waste (% of total)Electric power consumption per capita (kWh)Electricity generated using fossil fuel (% of total)Electricity generated by hydropower (% of total) Emissions and pollutionCO2 emissions per unit of GDP (kg/2005 PPP $)CO2 emissions per capita (metric tons)CO2 emissions growth (%, 1990–2006)Particulate matter (urban-pop.-weighted avg., μg/cu. m)Transport sector energy use per capita (kg of oil equivalent) Water and sanitationInternal freshwater resources per capita (cu. m)Freshwater withdrawal
Total (% of internal resources)Agriculture (% of total freshwater withdrawal)
Access to improved water source (% of total population)Rural (% of rural population)Urban (% of urban population)
Access to improved sanitation (% of total population)Rural (% of rural population)Urban (% of urban population)
Environment and healthAcute resp. infection prevalence (% of children under five)Diarrhea prevalence (% of children under five)Under-five mortality rate (per 1,000 live births) National accounting aggregatesGross savings (% of GNI)Consumption of fixed capital (% of GNI)Education expenditure (% of GNI)Energy depletion (% of GNI)Mineral depletion (% of GNI)Net forest depletion (% of GNI)CO2 damage (% of GNI)Particulate emissions damage (% of GNI)Adjusted net savings (% of GNI)
120 2010 The Little Green Data Book
KuwaitPopulation (millions) 2.7 Land area (1,000 sq. km) 18 GDP ($ billions) 148.0
Country data
High-income group
43,930 39,68898 781.4 1.01.4 0.7
9 3814,486 28,475
130 101295 341
0.3 28.9–3.0 –0.10.8 19.1
68
100
0.1
4.8 6.59,463 5,321
0.0 3.716,198 9,753100.0 63.1
0.0 11.1
0.7 0.433.3 12.7
112.5 18.097 26
1,232 1,166
.. 9,305
.. 10.454 43
.. 100
.. 98
.. 100
.. 100
.. 99
.. 100
9.910.2
11 7
58.7 18.513.3 13.8
3.0 4.638.0 2.0
0.0 0.20.0 0.00.4 0.20.3 0.19.7 6.8

GNI per capita, World Bank Atlas method ($)Urban population (% of total)Urban population growth (average annual %, 1990–2008)Population growth (average annual %, 1990–2008) AgricultureAgricultural land (% of land area)Agricultural productivity (value added per worker, 2000 $)Food production index (1999–2001 = 100)Population density, rural (people/sq. km of arable land) Forests and biodiversityForest area (% of land area)Deforestation (average annual %, 1990–2007)Nationally protected area (% of land area)Threatened species, mammalsThreatened species, birdsThreatened species, fishThreatened species, higher plantsGEF benefits index for biodiversity (0–100, median is 1.5) EnergyGDP per unit of energy use (2005 PPP $/kg oil equivalent)Energy use per capita (kg oil equivalent)Energy from biomass products and waste (% of total)Electric power consumption per capita (kWh)Electricity generated using fossil fuel (% of total)Electricity generated by hydropower (% of total) Emissions and pollutionCO2 emissions per unit of GDP (kg/2005 PPP $)CO2 emissions per capita (metric tons)CO2 emissions growth (%, 1990–2006)Particulate matter (urban-pop.-weighted avg., μg/cu. m)Transport sector energy use per capita (kg of oil equivalent) Water and sanitationInternal freshwater resources per capita (cu. m)Freshwater withdrawal
Total (% of internal resources)Agriculture (% of total freshwater withdrawal)
Access to improved water source (% of total population)Rural (% of rural population)Urban (% of urban population)
Access to improved sanitation (% of total population)Rural (% of rural population)Urban (% of urban population)
Environment and healthAcute resp. infection prevalence (% of children under five)Diarrhea prevalence (% of children under five)Under-five mortality rate (per 1,000 live births) National accounting aggregatesGross savings (% of GNI)Consumption of fixed capital (% of GNI)Education expenditure (% of GNI)Energy depletion (% of GNI)Mineral depletion (% of GNI)Net forest depletion (% of GNI)CO2 damage (% of GNI)Particulate emissions damage (% of GNI)Adjusted net savings (% of GNI)
121The Little Green Data Book 2010
Population (millions) 53 Land area (1,000 sq. km) 192 GDP ($ billions) 5.1
Country data
Europe & Central
Asia group
Low-income group
780 7,350 52336 64 29
0.8 0.2 3.51.0 0.1 2.2
56 28 381,034 2,797 318
103 113 125261 144 666
4.6 38.4 24.7-0.3 0.0 0.73.1 7.8 11.9
612
3141.1
3.4 3.7 3.2556 2,948 4230.1 2.1 49.3
1,772 3,958 32414.1 68.9 41.685.9 16.2 41.9
0.6 0.7 0.41.1 7.3 0.5
-55.3 -30.0 -6.022 27 6580 376 37
8,873 11,867 5,004
21.7 7.2 9.494 60 8889 95 6783 88 6099 99 8693 89 3893 79 3394 94 52
4.017.6
38 22 118
14.9 24.8 25.98.5 12.1 7.95.8 4.1 3.40.7 12.1 7.80.0 0.6 1.00.0 0.0 1.01.0 0.8 0.70.2 0.2 0.3
10.4 3.2 10.7
Kyrgyz Republic
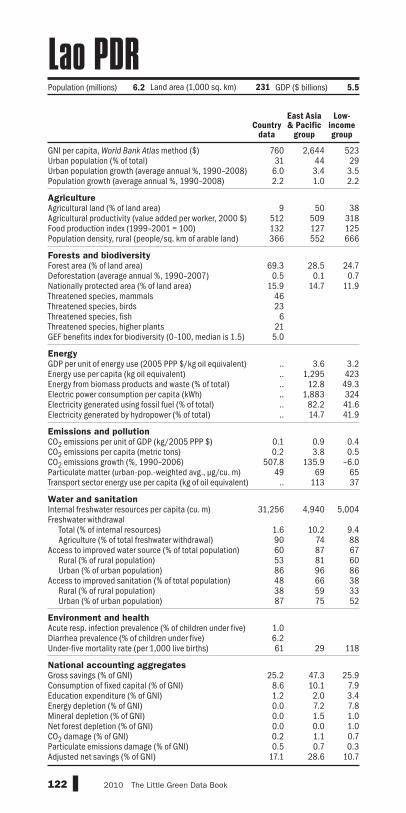
GNI per capita, World Bank Atlas method ($)Urban population (% of total)Urban population growth (average annual %, 1990–2008)Population growth (average annual %, 1990–2008) AgricultureAgricultural land (% of land area)Agricultural productivity (value added per worker, 2000 $)Food production index (1999–2001 = 100)Population density, rural (people/sq. km of arable land) Forests and biodiversityForest area (% of land area)Deforestation (average annual %, 1990–2007)Nationally protected area (% of land area)Threatened species, mammalsThreatened species, birdsThreatened species, fishThreatened species, higher plantsGEF benefits index for biodiversity (0–100, median is 1.5) EnergyGDP per unit of energy use (2005 PPP $/kg oil equivalent)Energy use per capita (kg oil equivalent)Energy from biomass products and waste (% of total)Electric power consumption per capita (kWh)Electricity generated using fossil fuel (% of total)Electricity generated by hydropower (% of total) Emissions and pollutionCO2 emissions per unit of GDP (kg/2005 PPP $)CO2 emissions per capita (metric tons)CO2 emissions growth (%, 1990–2006)Particulate matter (urban-pop.-weighted avg., μg/cu. m)Transport sector energy use per capita (kg of oil equivalent) Water and sanitationInternal freshwater resources per capita (cu. m)Freshwater withdrawal
Total (% of internal resources)Agriculture (% of total freshwater withdrawal)
Access to improved water source (% of total population)Rural (% of rural population)Urban (% of urban population)
Access to improved sanitation (% of total population)Rural (% of rural population)Urban (% of urban population)
Environment and healthAcute resp. infection prevalence (% of children under five)Diarrhea prevalence (% of children under five)Under-five mortality rate (per 1,000 live births) National accounting aggregatesGross savings (% of GNI)Consumption of fixed capital (% of GNI)Education expenditure (% of GNI)Energy depletion (% of GNI)Mineral depletion (% of GNI)Net forest depletion (% of GNI)CO2 damage (% of GNI)Particulate emissions damage (% of GNI)Adjusted net savings (% of GNI)
122 2010 The Little Green Data Book
Lao PDR
760 2,644 52331 44 29
6.0 3.4 3.52.2 1.0 2.2
9 50 38512 509 318132 127 125366 552 666
69.3 28.5 24.70.5 0.1 0.7
15.9 14.7 11.94623
621
5.0
.. 3.6 3.2
.. 1,295 423
.. 12.8 49.3
.. 1,883 324
.. 82.2 41.6
.. 14.7 41.9
0.1 0.9 0.40.2 3.8 0.5
507.8 135.9 –6.049 69 65
.. 113 37
31,256 4,940 5,004
1.6 10.2 9.490 74 8860 87 6753 81 6086 96 8648 66 3838 59 3387 75 52
1.06.261 29 118
25.2 47.3 25.98.6 10.1 7.91.2 2.0 3.40.0 7.2 7.80.0 1.5 1.00.0 0.0 1.00.2 1.1 0.70.5 0.7 0.3
17.1 28.6 10.7
Country data
East Asia & Pacific
group
Low-income group
Population (millions) 6.2 Land area (1,000 sq. km) 231 GDP ($ billions) 5.5

GNI per capita, World Bank Atlas method ($)Urban population (% of total)Urban population growth (average annual %, 1990–2008)Population growth (average annual %, 1990–2008) AgricultureAgricultural land (% of land area)Agricultural productivity (value added per worker, 2000 $)Food production index (1999–2001 = 100)Population density, rural (people/sq. km of arable land) Forests and biodiversityForest area (% of land area)Deforestation (average annual %, 1990–2007)Nationally protected area (% of land area)Threatened species, mammalsThreatened species, birdsThreatened species, fishThreatened species, higher plantsGEF benefits index for biodiversity (0–100, median is 1.5) EnergyGDP per unit of energy use (2005 PPP $/kg oil equivalent)Energy use per capita (kg oil equivalent)Energy from biomass products and waste (% of total)Electric power consumption per capita (kWh)Electricity generated using fossil fuel (% of total)Electricity generated by hydropower (% of total) Emissions and pollutionCO2 emissions per unit of GDP (kg/2005 PPP $)CO2 emissions per capita (metric tons)CO2 emissions growth (%, 1990–2006)Particulate matter (urban-pop.-weighted avg., μg/cu. m)Transport sector energy use per capita (kg of oil equivalent) Water and sanitationInternal freshwater resources per capita (cu. m)Freshwater withdrawal
Total (% of internal resources)Agriculture (% of total freshwater withdrawal)
Access to improved water source (% of total population)Rural (% of rural population)Urban (% of urban population)
Access to improved sanitation (% of total population)Rural (% of rural population)Urban (% of urban population)
Environment and healthAcute resp. infection prevalence (% of children under five)Diarrhea prevalence (% of children under five)Under-five mortality rate (per 1,000 live births) National accounting aggregatesGross savings (% of GNI)Consumption of fixed capital (% of GNI)Education expenditure (% of GNI)Energy depletion (% of GNI)Mineral depletion (% of GNI)Net forest depletion (% of GNI)CO2 damage (% of GNI)Particulate emissions damage (% of GNI)Adjusted net savings (% of GNI)
123The Little Green Data Book 2010
11,860 7,350 7,85268 64 75
–1.0 0.2 1.5–0.9 0.1 1.0
30 28 303,434 2,797 3,399
128 113 12061 144 146
47.6 38.4 37.3–0.4 0.0 0.216.4 7.8 14.0
1460
0.0
7.4 3.7 5.22,052 2,948 2,130
25.1 2.1 7.33,064 3,958 3,052
40.7 68.9 63.457.3 16.2 27.5
0.2 0.7 0.53.3 7.3 5.2
–50.4 –30.0 –4.916 27 32
551 376 374
7,355 11,867 18,876
1.8 7.2 13.813 60 5899 95 9496 88 82
100 99 9878 89 8271 79 6382 94 89
..
..9 22 23
22.3 24.8 23.812.6 12.1 12.1
5.6 4.1 4.20.0 12.1 9.40.0 0.6 1.30.2 0.0 0.00.2 0.8 0.50.0 0.2 0.2
14.8 3.2 4.6
Country data
Europe & Central
Asia group
Upper middle-income group
Population (millions) 2.3 Land area (1,000 sq. km) 62 GDP ($ billions) 33.8
Latvia

GNI per capita, World Bank Atlas method ($)Urban population (% of total)Urban population growth (average annual %, 1990–2008)Population growth (average annual %, 1990–2008) AgricultureAgricultural land (% of land area)Agricultural productivity (value added per worker, 2000 $)Food production index (1999–2001 = 100)Population density, rural (people/sq. km of arable land) Forests and biodiversityForest area (% of land area)Deforestation (average annual %, 1990–2007)Nationally protected area (% of land area)Threatened species, mammalsThreatened species, birdsThreatened species, fishThreatened species, higher plantsGEF benefits index for biodiversity (0–100, median is 1.5) EnergyGDP per unit of energy use (2005 PPP $/kg oil equivalent)Energy use per capita (kg oil equivalent)Energy from biomass products and waste (% of total)Electric power consumption per capita (kWh)Electricity generated using fossil fuel (% of total)Electricity generated by hydropower (% of total) Emissions and pollutionCO2 emissions per unit of GDP (kg/2005 PPP $)CO2 emissions per capita (metric tons)CO2 emissions growth (%, 1990–2006)Particulate matter (urban-pop.-weighted avg., μg/cu. m)Transport sector energy use per capita (kg of oil equivalent) Water and sanitationInternal freshwater resources per capita (cu. m)Freshwater withdrawal
Total (% of internal resources)Agriculture (% of total freshwater withdrawal)
Access to improved water source (% of total population)Rural (% of rural population)Urban (% of urban population)
Access to improved sanitation (% of total population)Rural (% of rural population)Urban (% of urban population)
Environment and healthAcute resp. infection prevalence (% of children under five)Diarrhea prevalence (% of children under five)Under-five mortality rate (per 1,000 live births) National accounting aggregatesGross savings (% of GNI)Consumption of fixed capital (% of GNI)Education expenditure (% of GNI)Energy depletion (% of GNI)Mineral depletion (% of GNI)Net forest depletion (% of GNI)CO2 damage (% of GNI)Particulate emissions damage (% of GNI)Adjusted net savings (% of GNI)
124 2010 The Little Green Data Book
Lebanon
6,780 3,237 7,85287 57 75
2.2 2.6 1.51.9 2.0 1.0
67 23 3031,834 2,896 3,399
104 120 120380 746 146
13.6 2.5 37.3–0.8 –0.4 0.20.4 3.8 14.0106
150
0.2
10.5 5.0 5.2959 1,275 2,1303.5 1.1 7.3
2,154 1,435 3,05293.9 91.1 63.4
6.1 7.4 27.5
0.4 0.6 0.53.7 3.5 5.2
68.5 96.4 –4.936 72 32
248 258 374
1,153 714 18,876
27.3 122.3 13.860 86 58
100 88 94100 81 82100 95 98
.. 74 82
.. 59 63100 89 89
4.019.3
13 34 23
10.2 .. 23.811.3 10.5 12.11.8 4.4 4.20.0 18.6 9.40.0 1.5 1.30.0 0.1 0.00.5 0.7 0.50.1 0.4 0.20.1 .. 4.6
Country data
Middle East &
N. Africa group
Upper middle-income group
Population (millions) 4.2 Land area (1,000 sq. km) 10 GDP ($ billions) 29.3

GNI per capita, World Bank Atlas method ($)Urban population (% of total)Urban population growth (average annual %, 1990–2008)Population growth (average annual %, 1990–2008) AgricultureAgricultural land (% of land area)Agricultural productivity (value added per worker, 2000 $)Food production index (1999–2001 = 100)Population density, rural (people/sq. km of arable land) Forests and biodiversityForest area (% of land area)Deforestation (average annual %, 1990–2007)Nationally protected area (% of land area)Threatened species, mammalsThreatened species, birdsThreatened species, fishThreatened species, higher plantsGEF benefits index for biodiversity (0–100, median is 1.5) EnergyGDP per unit of energy use (2005 PPP $/kg oil equivalent)Energy use per capita (kg oil equivalent)Energy from biomass products and waste (% of total)Electric power consumption per capita (kWh)Electricity generated using fossil fuel (% of total)Electricity generated by hydropower (% of total) Emissions and pollutionCO2 emissions per unit of GDP (kg/2005 PPP $)CO2 emissions per capita (metric tons)CO2 emissions growth (%, 1990–2006)Particulate matter (urban-pop.-weighted avg., μg/cu. m)Transport sector energy use per capita (kg of oil equivalent) Water and sanitationInternal freshwater resources per capita (cu. m)Freshwater withdrawal
Total (% of internal resources)Agriculture (% of total freshwater withdrawal)
Access to improved water source (% of total population)Rural (% of rural population)Urban (% of urban population)
Access to improved sanitation (% of total population)Rural (% of rural population)Urban (% of urban population)
Environment and healthAcute resp. infection prevalence (% of children under five)Diarrhea prevalence (% of children under five)Under-five mortality rate (per 1,000 live births) National accounting aggregatesGross savings (% of GNI)Consumption of fixed capital (% of GNI)Education expenditure (% of GNI)Energy depletion (% of GNI)Mineral depletion (% of GNI)Net forest depletion (% of GNI)CO2 damage (% of GNI)Particulate emissions damage (% of GNI)Adjusted net savings (% of GNI)
125The Little Green Data Book 2010
1,060 1,077 2,07325 36 414.7 4.0 3.01.4 2.6 1.4
76 45 50191 330 58988 119 123
510 353 516
0.3 26.1 24.8–3.1 0.7 0.20.2 12.4 11.2
2511
0.3
.. 3.2 3.9
.. 662 1,013
.. 55.8 16.3
.. 550 1,310
.. 67.0 80.0
.. 16.9 15.2
.. 0.5 0.8
.. 0.8 2.8
.. 37.4 105.741 53 69.. 61 97
2,574 4,829 3,154
1.0 3.2 8.720 87 8178 58 8674 46 8193 81 9436 31 5234 24 4143 42 69
18.7..
79 144 64
17.8 16.5 41.16.4 9.0 9.69.4 3.3 2.30.0 14.2 8.10.0 1.3 1.41.3 0.6 0.20.0 0.6 1.10.1 0.4 0.6
19.4 –6.2 22.4
Population (millions) 2.0 Land area (1,000 sq. km) 30 GDP ($ billions) 1.6
Country data
Sub-Saharan Africa group
Lower middle-income group
Lesotho
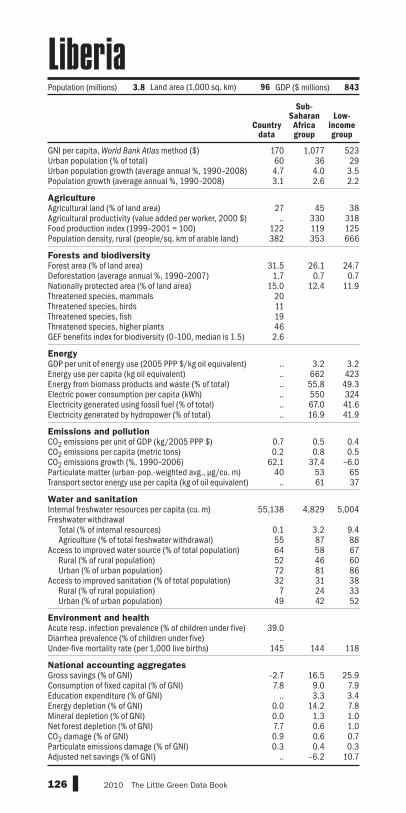
GNI per capita, World Bank Atlas method ($)Urban population (% of total)Urban population growth (average annual %, 1990–2008)Population growth (average annual %, 1990–2008) AgricultureAgricultural land (% of land area)Agricultural productivity (value added per worker, 2000 $)Food production index (1999–2001 = 100)Population density, rural (people/sq. km of arable land) Forests and biodiversityForest area (% of land area)Deforestation (average annual %, 1990–2007)Nationally protected area (% of land area)Threatened species, mammalsThreatened species, birdsThreatened species, fishThreatened species, higher plantsGEF benefits index for biodiversity (0–100, median is 1.5) EnergyGDP per unit of energy use (2005 PPP $/kg oil equivalent)Energy use per capita (kg oil equivalent)Energy from biomass products and waste (% of total)Electric power consumption per capita (kWh)Electricity generated using fossil fuel (% of total)Electricity generated by hydropower (% of total) Emissions and pollutionCO2 emissions per unit of GDP (kg/2005 PPP $)CO2 emissions per capita (metric tons)CO2 emissions growth (%, 1990–2006)Particulate matter (urban-pop.-weighted avg., μg/cu. m)Transport sector energy use per capita (kg of oil equivalent) Water and sanitationInternal freshwater resources per capita (cu. m)Freshwater withdrawal
Total (% of internal resources)Agriculture (% of total freshwater withdrawal)
Access to improved water source (% of total population)Rural (% of rural population)Urban (% of urban population)
Access to improved sanitation (% of total population)Rural (% of rural population)Urban (% of urban population)
Environment and healthAcute resp. infection prevalence (% of children under five)Diarrhea prevalence (% of children under five)Under-five mortality rate (per 1,000 live births) National accounting aggregatesGross savings (% of GNI)Consumption of fixed capital (% of GNI)Education expenditure (% of GNI)Energy depletion (% of GNI)Mineral depletion (% of GNI)Net forest depletion (% of GNI)CO2 damage (% of GNI)Particulate emissions damage (% of GNI)Adjusted net savings (% of GNI)
126 2010 The Little Green Data Book
Liberia
Country data
Sub-Saharan Africa group
Low-income group
170 1,077 52360 36 294.7 4.0 3.53.1 2.6 2.2
27 45 38.. 330 318
122 119 125382 353 666
31.5 26.1 24.71.7 0.7 0.7
15.0 12.4 11.9201119462.6
.. 3.2 3.2
.. 662 423
.. 55.8 49.3
.. 550 324
.. 67.0 41.6
.. 16.9 41.9
0.7 0.5 0.40.2 0.8 0.5
62.1 37.4 –6.040 53 65
.. 61 37
55,138 4,829 5,004
0.1 3.2 9.455 87 8864 58 6752 46 6072 81 8632 31 38
7 24 3349 42 52
39.0..
145 144 118
–2.7 16.5 25.97.8 9.0 7.9
.. 3.3 3.40.0 14.2 7.80.0 1.3 1.07.7 0.6 1.00.9 0.6 0.70.3 0.4 0.3
.. –6.2 10.7
Population (millions) 3.8 Land area (1,000 sq. km) 96 GDP ($ millions) 843

GNI per capita, World Bank Atlas method ($)Urban population (% of total)Urban population growth (average annual %, 1990–2008)Population growth (average annual %, 1990–2008) AgricultureAgricultural land (% of land area)Agricultural productivity (value added per worker, 2000 $)Food production index (1999–2001 = 100)Population density, rural (people/sq. km of arable land) Forests and biodiversityForest area (% of land area)Deforestation (average annual %, 1990–2007)Nationally protected area (% of land area)Threatened species, mammalsThreatened species, birdsThreatened species, fishThreatened species, higher plantsGEF benefits index for biodiversity (0–100, median is 1.5) EnergyGDP per unit of energy use (2005 PPP $/kg oil equivalent)Energy use per capita (kg oil equivalent)Energy from biomass products and waste (% of total)Electric power consumption per capita (kWh)Electricity generated using fossil fuel (% of total)Electricity generated by hydropower (% of total) Emissions and pollutionCO2 emissions per unit of GDP (kg/2005 PPP $)CO2 emissions per capita (metric tons)CO2 emissions growth (%, 1990–2006)Particulate matter (urban-pop.-weighted avg., μg/cu. m)Transport sector energy use per capita (kg of oil equivalent) Water and sanitationInternal freshwater resources per capita (cu. m)Freshwater withdrawal
Total (% of internal resources)Agriculture (% of total freshwater withdrawal)
Access to improved water source (% of total population)Rural (% of rural population)Urban (% of urban population)
Access to improved sanitation (% of total population)Rural (% of rural population)Urban (% of urban population)
Environment and healthAcute resp. infection prevalence (% of children under five)Diarrhea prevalence (% of children under five)Under-five mortality rate (per 1,000 live births) National accounting aggregatesGross savings (% of GNI)Consumption of fixed capital (% of GNI)Education expenditure (% of GNI)Energy depletion (% of GNI)Mineral depletion (% of GNI)Net forest depletion (% of GNI)CO2 damage (% of GNI)Particulate emissions damage (% of GNI)Adjusted net savings (% of GNI)
127The Little Green Data Book 2010
12,380 3,237 7,85278 57 75
2.2 2.6 1.52.0 2.0 1.0
9 23 30.. 2,896 3,399
101 120 12080 746 146
0.1 2.5 37.30.0 –0.4 0.20.1 3.8 14.012
4141
1.6
5.1 5.0 5.22,889 1,275 2,130
0.9 1.1 7.33,871 1,435 3,052100.0 91.1 63.4
0.0 7.4 27.5
0.6 0.6 0.59.2 3.5 5.2
37.7 96.4 –4.988 72 32
536 258 374
97 714 18,876
721.0 122.3 13.883 86 58
.. 88 94
.. 81 82
.. 95 9897 74 8296 59 6397 89 89
4.316.9
17 34 23
66.8 .. 23.812.3 10.5 12.1
.. 4.4 4.238.8 18.6 9.4
0.0 1.5 1.30.0 0.1 0.00.5 0.7 0.51.0 0.4 0.2
.. .. 4.6
Population (millions) 6.3 Land area (1,000 sq. km) 1,760 GDP ($ billions) 93.2
Country data
Middle East &
N. Africa group
Upper middle-income group
Libya

GNI per capita, World Bank Atlas method ($)Urban population (% of total)Urban population growth (average annual %, 1990–2008)Population growth (average annual %, 1990–2008) AgricultureAgricultural land (% of land area)Agricultural productivity (value added per worker, 2000 $)Food production index (1999–2001 = 100)Population density, rural (people/sq. km of arable land) Forests and biodiversityForest area (% of land area)Deforestation (average annual %, 1990–2007)Nationally protected area (% of land area)Threatened species, mammalsThreatened species, birdsThreatened species, fishThreatened species, higher plantsGEF benefits index for biodiversity (0–100, median is 1.5) EnergyGDP per unit of energy use (2005 PPP $/kg oil equivalent)Energy use per capita (kg oil equivalent)Energy from biomass products and waste (% of total)Electric power consumption per capita (kWh)Electricity generated using fossil fuel (% of total)Electricity generated by hydropower (% of total) Emissions and pollutionCO2 emissions per unit of GDP (kg/2005 PPP $)CO2 emissions per capita (metric tons)CO2 emissions growth (%, 1990–2006)Particulate matter (urban-pop.-weighted avg., μg/cu. m)Transport sector energy use per capita (kg of oil equivalent) Water and sanitationInternal freshwater resources per capita (cu. m)Freshwater withdrawal
Total (% of internal resources)Agriculture (% of total freshwater withdrawal)
Access to improved water source (% of total population)Rural (% of rural population)Urban (% of urban population)
Access to improved sanitation (% of total population)Rural (% of rural population)Urban (% of urban population)
Environment and healthAcute resp. infection prevalence (% of children under five)Diarrhea prevalence (% of children under five)Under-five mortality rate (per 1,000 live births) National accounting aggregatesGross savings (% of GNI)Consumption of fixed capital (% of GNI)Education expenditure (% of GNI)Energy depletion (% of GNI)Mineral depletion (% of GNI)Net forest depletion (% of GNI)CO2 damage (% of GNI)Particulate emissions damage (% of GNI)Adjusted net savings (% of GNI)
128 2010 The Little Green Data Book
97,990 39,68814 78
0.2 1.01.1 0.7
38 38.. 28,475
96 101756 341
43.1 28.9–0.4 –0.140.1 19.1
0000
0.0
.. 6.5
.. 5,321
.. 3.7
.. 9,753
.. 63.1
.. 11.1
.. 0.4
.. 12.7
.. 18.032 26
.. 1,166
.. 9,305
.. 10.4
.. 43
.. 100
.. 98
.. 100
.. 100
.. 99
.. 100
..
..2 7
.. 18.5
.. 13.8
.. 4.6
.. 2.0
.. 0.2
.. 0.0
.. 0.2
.. 0.1
.. 6.8
Population (thousands) 36 Land area (sq. km) 160 GDP ($ millions) 4.2
Country data
High-income group
Liechtenstein
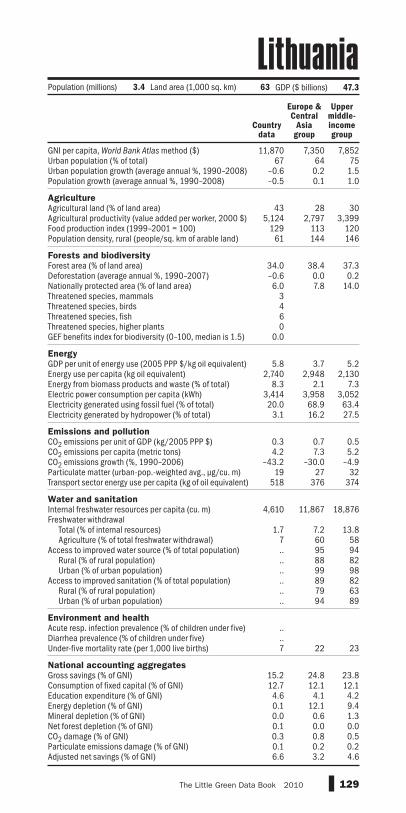
GNI per capita, World Bank Atlas method ($)Urban population (% of total)Urban population growth (average annual %, 1990–2008)Population growth (average annual %, 1990–2008) AgricultureAgricultural land (% of land area)Agricultural productivity (value added per worker, 2000 $)Food production index (1999–2001 = 100)Population density, rural (people/sq. km of arable land) Forests and biodiversityForest area (% of land area)Deforestation (average annual %, 1990–2007)Nationally protected area (% of land area)Threatened species, mammalsThreatened species, birdsThreatened species, fishThreatened species, higher plantsGEF benefits index for biodiversity (0–100, median is 1.5) EnergyGDP per unit of energy use (2005 PPP $/kg oil equivalent)Energy use per capita (kg oil equivalent)Energy from biomass products and waste (% of total)Electric power consumption per capita (kWh)Electricity generated using fossil fuel (% of total)Electricity generated by hydropower (% of total) Emissions and pollutionCO2 emissions per unit of GDP (kg/2005 PPP $)CO2 emissions per capita (metric tons)CO2 emissions growth (%, 1990–2006)Particulate matter (urban-pop.-weighted avg., μg/cu. m)Transport sector energy use per capita (kg of oil equivalent) Water and sanitationInternal freshwater resources per capita (cu. m)Freshwater withdrawal
Total (% of internal resources)Agriculture (% of total freshwater withdrawal)
Access to improved water source (% of total population)Rural (% of rural population)Urban (% of urban population)
Access to improved sanitation (% of total population)Rural (% of rural population)Urban (% of urban population)
Environment and healthAcute resp. infection prevalence (% of children under five)Diarrhea prevalence (% of children under five)Under-five mortality rate (per 1,000 live births) National accounting aggregatesGross savings (% of GNI)Consumption of fixed capital (% of GNI)Education expenditure (% of GNI)Energy depletion (% of GNI)Mineral depletion (% of GNI)Net forest depletion (% of GNI)CO2 damage (% of GNI)Particulate emissions damage (% of GNI)Adjusted net savings (% of GNI)
129The Little Green Data Book 2010
11,870 7,350 7,85267 64 75
–0.6 0.2 1.5–0.5 0.1 1.0
43 28 305,124 2,797 3,399
129 113 12061 144 146
34.0 38.4 37.3–0.6 0.0 0.26.0 7.8 14.0
3460
0.0
5.8 3.7 5.22,740 2,948 2,130
8.3 2.1 7.33,414 3,958 3,05220.0 68.9 63.4
3.1 16.2 27.5
0.3 0.7 0.54.2 7.3 5.2
–43.2 –30.0 –4.919 27 32
518 376 374
4,610 11,867 18,876
1.7 7.2 13.87 60 58.. 95 94.. 88 82.. 99 98.. 89 82.. 79 63.. 94 89
..
..7 22 23
15.2 24.8 23.812.7 12.1 12.14.6 4.1 4.20.1 12.1 9.40.0 0.6 1.30.1 0.0 0.00.3 0.8 0.50.1 0.2 0.26.6 3.2 4.6
Country data
Europe & Central
Asia group
Upper middle-income group
Population (millions) 3.4 Land area (1,000 sq. km) 63 GDP ($ billions) 47.3
Lithuania

GNI per capita, World Bank Atlas method ($)Urban population (% of total)Urban population growth (average annual %, 1990–2008)Population growth (average annual %, 1990–2008) AgricultureAgricultural land (% of land area)Agricultural productivity (value added per worker, 2000 $)Food production index (1999–2001 = 100)Population density, rural (people/sq. km of arable land) Forests and biodiversityForest area (% of land area)Deforestation (average annual %, 1990–2007)Nationally protected area (% of land area)Threatened species, mammalsThreatened species, birdsThreatened species, fishThreatened species, higher plantsGEF benefits index for biodiversity (0–100, median is 1.5) EnergyGDP per unit of energy use (2005 PPP $/kg oil equivalent)Energy use per capita (kg oil equivalent)Energy from biomass products and waste (% of total)Electric power consumption per capita (kWh)Electricity generated using fossil fuel (% of total)Electricity generated by hydropower (% of total) Emissions and pollutionCO2 emissions per unit of GDP (kg/2005 PPP $)CO2 emissions per capita (metric tons)CO2 emissions growth (%, 1990–2006)Particulate matter (urban-pop.-weighted avg., μg/cu. m)Transport sector energy use per capita (kg of oil equivalent) Water and sanitationInternal freshwater resources per capita (cu. m)Freshwater withdrawal
Total (% of internal resources)Agriculture (% of total freshwater withdrawal)
Access to improved water source (% of total population)Rural (% of rural population)Urban (% of urban population)
Access to improved sanitation (% of total population)Rural (% of rural population)Urban (% of urban population)
Environment and healthAcute resp. infection prevalence (% of children under five)Diarrhea prevalence (% of children under five)Under-five mortality rate (per 1,000 live births) National accounting aggregatesGross savings (% of GNI)Consumption of fixed capital (% of GNI)Education expenditure (% of GNI)Energy depletion (% of GNI)Mineral depletion (% of GNI)Net forest depletion (% of GNI)CO2 damage (% of GNI)Particulate emissions damage (% of GNI)Adjusted net savings (% of GNI)
130 2010 The Little Green Data Book
69,390 39,68882 781.5 1.01.4 0.7
51 3827,824 28,475
56 101137 341
33.5 28.90.0 –0.1
16.6 19.10010
0.0
8.4 6.58,790 5,321
2.3 3.716,315 9,753
90.7 63.13.4 11.1
0.3 0.423.9 12.714.1 18.0
15 264,550 1,166
2,083 9,305
.. 10.4
.. 43100 100100 98100 100100 100100 99100 100
..
..3 7
.. 18.518.7 13.8
3.7 4.60.0 2.00.0 0.20.0 0.00.2 0.20.0 0.1
.. 6.8
Country data
High-income group
Population (thousands) 489 Land area (1,000 sq. km) 3 GDP ($ billions) 53.7
Luxembourg

GNI per capita, World Bank Atlas method ($)Urban population (% of total)Urban population growth (average annual %, 1990–2008)Population growth (average annual %, 1990–2008) AgricultureAgricultural land (% of land area)Agricultural productivity (value added per worker, 2000 $)Food production index (1999–2001 = 100)Population density, rural (people/sq. km of arable land) Forests and biodiversityForest area (% of land area)Deforestation (average annual %, 1990–2007)Nationally protected area (% of land area)Threatened species, mammalsThreatened species, birdsThreatened species, fishThreatened species, higher plantsGEF benefits index for biodiversity (0–100, median is 1.5) EnergyGDP per unit of energy use (2005 PPP $/kg oil equivalent)Energy use per capita (kg oil equivalent)Energy from biomass products and waste (% of total)Electric power consumption per capita (kWh)Electricity generated using fossil fuel (% of total)Electricity generated by hydropower (% of total) Emissions and pollutionCO2 emissions per unit of GDP (kg/2005 PPP $)CO2 emissions per capita (metric tons)CO2 emissions growth (%, 1990–2006)Particulate matter (urban-pop.-weighted avg., μg/cu. m)Transport sector energy use per capita (kg of oil equivalent) Water and sanitationInternal freshwater resources per capita (cu. m)Freshwater withdrawal
Total (% of internal resources)Agriculture (% of total freshwater withdrawal)
Access to improved water source (% of total population)Rural (% of rural population)Urban (% of urban population)
Access to improved sanitation (% of total population)Rural (% of rural population)Urban (% of urban population)
Environment and healthAcute resp. infection prevalence (% of children under five)Diarrhea prevalence (% of children under five)Under-five mortality rate (per 1,000 live births) National accounting aggregatesGross savings (% of GNI)Consumption of fixed capital (% of GNI)Education expenditure (% of GNI)Energy depletion (% of GNI)Mineral depletion (% of GNI)Net forest depletion (% of GNI)CO2 damage (% of GNI)Particulate emissions damage (% of GNI)Adjusted net savings (% of GNI)
131The Little Green Data Book 2010
35,360 39,688100 781.9 1.01.9 0.7
.. 38
.. 28,475
.. 101
.. 341
.. 28.9
.. –0.1
.. 19.10460..
.. 6.5
.. 5,321
.. 3.7
.. 9,753
.. 63.1
.. 11.1
0.1 0.44.5 12.7
116.3 18.048 26
.. 1,166
.. 9,305
.. 10.4
.. 43
.. 100
.. 98
.. 100
.. 100
.. 99
.. 100
..
..
.. 7
.. 18.5
.. 13.8
.. 4.6
.. 2.0
.. 0.2
.. 0.0
.. 0.2
.. 0.1
.. 6.8
Country data
High-income group
Population (thousands) 526 Land area (sq. km) 28 GDP ($ billions) 18.6
Macao SAR, China

GNI per capita, World Bank Atlas method ($)Urban population (% of total)Urban population growth (average annual %, 1990–2008)Population growth (average annual %, 1990–2008) AgricultureAgricultural land (% of land area)Agricultural productivity (value added per worker, 2000 $)Food production index (1999–2001 = 100)Population density, rural (people/sq. km of arable land) Forests and biodiversityForest area (% of land area)Deforestation (average annual %, 1990–2007)Nationally protected area (% of land area)Threatened species, mammalsThreatened species, birdsThreatened species, fishThreatened species, higher plantsGEF benefits index for biodiversity (0–100, median is 1.5) EnergyGDP per unit of energy use (2005 PPP $/kg oil equivalent)Energy use per capita (kg oil equivalent)Energy from biomass products and waste (% of total)Electric power consumption per capita (kWh)Electricity generated using fossil fuel (% of total)Electricity generated by hydropower (% of total) Emissions and pollutionCO2 emissions per unit of GDP (kg/2005 PPP $)CO2 emissions per capita (metric tons)CO2 emissions growth (%, 1990–2006)Particulate matter (urban-pop.-weighted avg., μg/cu. m)Transport sector energy use per capita (kg of oil equivalent) Water and sanitationInternal freshwater resources per capita (cu. m)Freshwater withdrawal
Total (% of internal resources)Agriculture (% of total freshwater withdrawal)
Access to improved water source (% of total population)Rural (% of rural population)Urban (% of urban population)
Access to improved sanitation (% of total population)Rural (% of rural population)Urban (% of urban population)
Environment and healthAcute resp. infection prevalence (% of children under five)Diarrhea prevalence (% of children under five)Under-five mortality rate (per 1,000 live births) National accounting aggregatesGross savings (% of GNI)Consumption of fixed capital (% of GNI)Education expenditure (% of GNI)Energy depletion (% of GNI)Mineral depletion (% of GNI)Net forest depletion (% of GNI)CO2 damage (% of GNI)Particulate emissions damage (% of GNI)Adjusted net savings (% of GNI)
132 2010 The Little Green Data Book
4,130 7,350 7,85267 64 75
1.2 0.2 1.50.4 0.1 1.0
42 28 304,644 2,797 3,399
111 113 120159 144 146
35.6 38.4 37.30.0 0.0 0.2
.. 7.8 14.05
10140
0.2
5.3 3.7 5.21,482 2,948 2,130
4.8 2.1 7.33,780 3,958 3,05285.0 68.9 63.415.0 16.2 27.5
0.7 0.7 0.55.3 7.3 5.2
–31.8 –30.0 –4.921 27 32
193 376 374
2,647 11,867 18,876
.. 7.2 13.8
.. 60 58100 95 9499 88 82
100 99 9889 89 8281 79 6392 94 89
..
..11 22 23
16.1 24.8 23.810.8 12.1 12.14.9 4.1 4.20.0 12.1 9.40.0 0.6 1.30.1 0.0 0.01.0 0.8 0.50.1 0.2 0.29.0 3.2 4.6
Population (millions) 2.0 Land area (1,000 sq. km) 25 GDP ($ billions) 9.5
Country data
Europe & Central
Asia group
Upper middle-income group
Macedonia, FYR
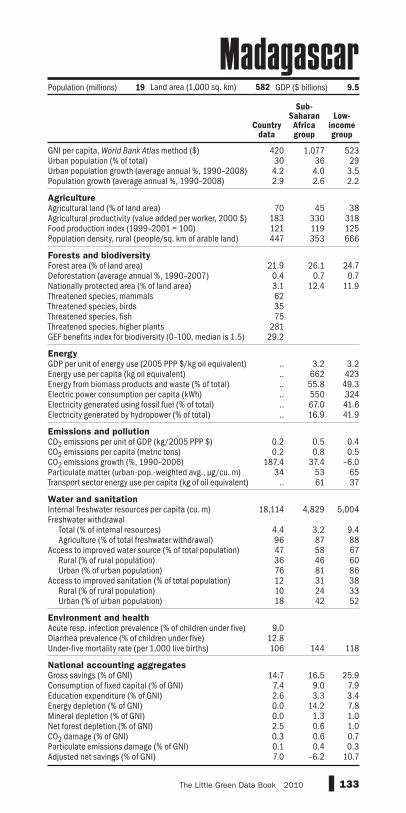
GNI per capita, World Bank Atlas method ($)Urban population (% of total)Urban population growth (average annual %, 1990–2008)Population growth (average annual %, 1990–2008) AgricultureAgricultural land (% of land area)Agricultural productivity (value added per worker, 2000 $)Food production index (1999–2001 = 100)Population density, rural (people/sq. km of arable land) Forests and biodiversityForest area (% of land area)Deforestation (average annual %, 1990–2007)Nationally protected area (% of land area)Threatened species, mammalsThreatened species, birdsThreatened species, fishThreatened species, higher plantsGEF benefits index for biodiversity (0–100, median is 1.5) EnergyGDP per unit of energy use (2005 PPP $/kg oil equivalent)Energy use per capita (kg oil equivalent)Energy from biomass products and waste (% of total)Electric power consumption per capita (kWh)Electricity generated using fossil fuel (% of total)Electricity generated by hydropower (% of total) Emissions and pollutionCO2 emissions per unit of GDP (kg/2005 PPP $)CO2 emissions per capita (metric tons)CO2 emissions growth (%, 1990–2006)Particulate matter (urban-pop.-weighted avg., μg/cu. m)Transport sector energy use per capita (kg of oil equivalent) Water and sanitationInternal freshwater resources per capita (cu. m)Freshwater withdrawal
Total (% of internal resources)Agriculture (% of total freshwater withdrawal)
Access to improved water source (% of total population)Rural (% of rural population)Urban (% of urban population)
Access to improved sanitation (% of total population)Rural (% of rural population)Urban (% of urban population)
Environment and healthAcute resp. infection prevalence (% of children under five)Diarrhea prevalence (% of children under five)Under-five mortality rate (per 1,000 live births) National accounting aggregatesGross savings (% of GNI)Consumption of fixed capital (% of GNI)Education expenditure (% of GNI)Energy depletion (% of GNI)Mineral depletion (% of GNI)Net forest depletion (% of GNI)CO2 damage (% of GNI)Particulate emissions damage (% of GNI)Adjusted net savings (% of GNI)
133The Little Green Data Book 2010
420 1,077 52330 36 29
4.2 4.0 3.52.9 2.6 2.2
70 45 38183 330 318121 119 125447 353 666
21.9 26.1 24.70.4 0.7 0.73.1 12.4 11.9623575
28129.2
.. 3.2 3.2
.. 662 423
.. 55.8 49.3
.. 550 324
.. 67.0 41.6
.. 16.9 41.9
0.2 0.5 0.40.2 0.8 0.5
187.4 37.4 –6.034 53 65
.. 61 37
18,114 4,829 5,004
4.4 3.2 9.496 87 8847 58 6736 46 6076 81 8612 31 3810 24 3318 42 52
9.012.8106 144 118
14.7 16.5 25.97.4 9.0 7.92.6 3.3 3.40.0 14.2 7.80.0 1.3 1.02.5 0.6 1.00.3 0.6 0.70.1 0.4 0.37.0 –6.2 10.7
Population (millions) 19 Land area (1,000 sq. km) 582 GDP ($ billions) 9.5
Country data
Sub-Saharan Africa group
Low-income group
Madagascar

GNI per capita, World Bank Atlas method ($)Urban population (% of total)Urban population growth (average annual %, 1990–2008)Population growth (average annual %, 1990–2008) AgricultureAgricultural land (% of land area)Agricultural productivity (value added per worker, 2000 $)Food production index (1999–2001 = 100)Population density, rural (people/sq. km of arable land) Forests and biodiversityForest area (% of land area)Deforestation (average annual %, 1990–2007)Nationally protected area (% of land area)Threatened species, mammalsThreatened species, birdsThreatened species, fishThreatened species, higher plantsGEF benefits index for biodiversity (0–100, median is 1.5) EnergyGDP per unit of energy use (2005 PPP $/kg oil equivalent)Energy use per capita (kg oil equivalent)Energy from biomass products and waste (% of total)Electric power consumption per capita (kWh)Electricity generated using fossil fuel (% of total)Electricity generated by hydropower (% of total) Emissions and pollutionCO2 emissions per unit of GDP (kg/2005 PPP $)CO2 emissions per capita (metric tons)CO2 emissions growth (%, 1990–2006)Particulate matter (urban-pop.-weighted avg., μg/cu. m)Transport sector energy use per capita (kg of oil equivalent) Water and sanitationInternal freshwater resources per capita (cu. m)Freshwater withdrawal
Total (% of internal resources)Agriculture (% of total freshwater withdrawal)
Access to improved water source (% of total population)Rural (% of rural population)Urban (% of urban population)
Access to improved sanitation (% of total population)Rural (% of rural population)Urban (% of urban population)
Environment and healthAcute resp. infection prevalence (% of children under five)Diarrhea prevalence (% of children under five)Under-five mortality rate (per 1,000 live births) National accounting aggregatesGross savings (% of GNI)Consumption of fixed capital (% of GNI)Education expenditure (% of GNI)Energy depletion (% of GNI)Mineral depletion (% of GNI)Net forest depletion (% of GNI)CO2 damage (% of GNI)Particulate emissions damage (% of GNI)Adjusted net savings (% of GNI)
134 2010 The Little Green Data Book
280 1,077 52319 36 29
5.2 4.0 3.52.5 2.6 2.2
53 45 38132 330 318142 119 125393 353 666
35.5 26.1 24.70.9 0.7 0.7
15.5 12.4 11.96
12101
143.5
.. 3.2 3.2
.. 662 423
.. 55.8 49.3
.. 550 324
.. 67.0 41.6
.. 16.9 41.9
0.1 0.5 0.40.07 0.82 0.5171.3 37.4 –6.0
33 53 65.. 61 37
1,118 4,829 5,004
6.3 3.2 9.480 87 8876 58 6772 46 6096 81 8660 31 3862 24 3351 42 52
27.017.6100 144 118
29.3 16.5 25.96.5 9.0 7.93.5 3.3 3.40.0 14.2 7.80.0 1.3 1.00.9 0.6 1.00.2 0.6 0.70.1 0.4 0.3
25.1 –6.2 10.7
Country data
Sub-Saharan Africa group
Low-income group
Population (millions) 15 Land area (1,000 sq. km) 94 GDP ($ billions) 4.3
Malawi
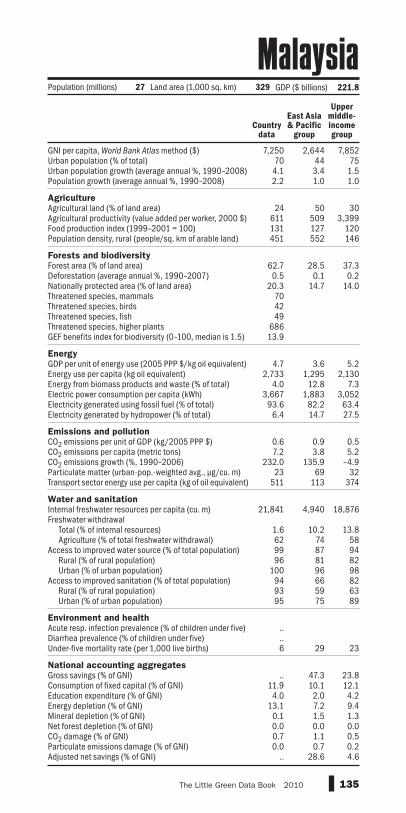
GNI per capita, World Bank Atlas method ($)Urban population (% of total)Urban population growth (average annual %, 1990–2008)Population growth (average annual %, 1990–2008) AgricultureAgricultural land (% of land area)Agricultural productivity (value added per worker, 2000 $)Food production index (1999–2001 = 100)Population density, rural (people/sq. km of arable land) Forests and biodiversityForest area (% of land area)Deforestation (average annual %, 1990–2007)Nationally protected area (% of land area)Threatened species, mammalsThreatened species, birdsThreatened species, fishThreatened species, higher plantsGEF benefits index for biodiversity (0–100, median is 1.5) EnergyGDP per unit of energy use (2005 PPP $/kg oil equivalent)Energy use per capita (kg oil equivalent)Energy from biomass products and waste (% of total)Electric power consumption per capita (kWh)Electricity generated using fossil fuel (% of total)Electricity generated by hydropower (% of total) Emissions and pollutionCO2 emissions per unit of GDP (kg/2005 PPP $)CO2 emissions per capita (metric tons)CO2 emissions growth (%, 1990–2006)Particulate matter (urban-pop.-weighted avg., μg/cu. m)Transport sector energy use per capita (kg of oil equivalent) Water and sanitationInternal freshwater resources per capita (cu. m)Freshwater withdrawal
Total (% of internal resources)Agriculture (% of total freshwater withdrawal)
Access to improved water source (% of total population)Rural (% of rural population)Urban (% of urban population)
Access to improved sanitation (% of total population)Rural (% of rural population)Urban (% of urban population)
Environment and healthAcute resp. infection prevalence (% of children under five)Diarrhea prevalence (% of children under five)Under-five mortality rate (per 1,000 live births) National accounting aggregatesGross savings (% of GNI)Consumption of fixed capital (% of GNI)Education expenditure (% of GNI)Energy depletion (% of GNI)Mineral depletion (% of GNI)Net forest depletion (% of GNI)CO2 damage (% of GNI)Particulate emissions damage (% of GNI)Adjusted net savings (% of GNI)
135The Little Green Data Book 2010
7,250 2,644 7,85270 44 754.1 3.4 1.52.2 1.0 1.0
24 50 30611 509 3,399131 127 120451 552 146
62.7 28.5 37.30.5 0.1 0.2
20.3 14.7 14.0704249
68613.9
4.7 3.6 5.22,733 1,295 2,130
4.0 12.8 7.33,667 1,883 3,052
93.6 82.2 63.46.4 14.7 27.5
0.6 0.9 0.57.2 3.8 5.2
232.0 135.9 –4.923 69 32
511 113 374
21,841 4,940 18,876
1.6 10.2 13.862 74 5899 87 9496 81 82
100 96 9894 66 8293 59 6395 75 89
..
..6 29 23
.. 47.3 23.811.9 10.1 12.14.0 2.0 4.2
13.1 7.2 9.40.1 1.5 1.30.0 0.0 0.00.7 1.1 0.50.0 0.7 0.2
.. 28.6 4.6
Country data
East Asia & Pacific
group
Upper middle-income group
Population (millions) 27 Land area (1,000 sq. km) 329 GDP ($ billions) 221.8
Malaysia

GNI per capita, World Bank Atlas method ($)Urban population (% of total)Urban population growth (average annual %, 1990–2008)Population growth (average annual %, 1990–2008) AgricultureAgricultural land (% of land area)Agricultural productivity (value added per worker, 2000 $)Food production index (1999–2001 = 100)Population density, rural (people/sq. km of arable land) Forests and biodiversityForest area (% of land area)Deforestation (average annual %, 1990–2007)Nationally protected area (% of land area)Threatened species, mammalsThreatened species, birdsThreatened species, fishThreatened species, higher plantsGEF benefits index for biodiversity (0–100, median is 1.5) EnergyGDP per unit of energy use (2005 PPP $/kg oil equivalent)Energy use per capita (kg oil equivalent)Energy from biomass products and waste (% of total)Electric power consumption per capita (kWh)Electricity generated using fossil fuel (% of total)Electricity generated by hydropower (% of total) Emissions and pollutionCO2 emissions per unit of GDP (kg/2005 PPP $)CO2 emissions per capita (metric tons)CO2 emissions growth (%, 1990–2006)Particulate matter (urban-pop.-weighted avg., μg/cu. m)Transport sector energy use per capita (kg of oil equivalent) Water and sanitationInternal freshwater resources per capita (cu. m)Freshwater withdrawal
Total (% of internal resources)Agriculture (% of total freshwater withdrawal)
Access to improved water source (% of total population)Rural (% of rural population)Urban (% of urban population)
Access to improved sanitation (% of total population)Rural (% of rural population)Urban (% of urban population)
Environment and healthAcute resp. infection prevalence (% of children under five)Diarrhea prevalence (% of children under five)Under-five mortality rate (per 1,000 live births) National accounting aggregatesGross savings (% of GNI)Consumption of fixed capital (% of GNI)Education expenditure (% of GNI)Energy depletion (% of GNI)Mineral depletion (% of GNI)Net forest depletion (% of GNI)CO2 damage (% of GNI)Particulate emissions damage (% of GNI)Adjusted net savings (% of GNI)
136 2010 The Little Green Data Book
3,640 963 2,07338 29 414.1 2.7 3.01.9 1.7 1.4
43 55 50.. 496 589
50 120 1234,771 628 516
3.0 16.7 24.80.0 –0.1 0.2
.. 5.5 11.220
120
1.4
.. 5.0 3.9
.. 484 1,013
.. 29.3 16.3
.. 482 1,310
.. 78.6 80.0
.. 17.0 15.2
0.6 0.5 0.82.9 1.1 2.8
464.3 118.9 105.732 78 69
.. 37 97
100 1,194 3,154
.. 51.7 8.7
.. 90 8183 87 8676 84 8198 94 9459 33 5242 23 41
100 57 69
22.07.928 76 64
.. 35.3 41.111.1 8.4 9.66.5 3.0 2.30.0 4.6 8.10.0 1.1 1.40.0 0.8 0.20.6 1.0 1.10.1 0.5 0.6
.. 21.8 22.4
Country data
South Asia
group
Lower middle-income group
Population (thousands) 305 Land area (sq. km) 300 GDP ($ billions) 1.3
Maldives
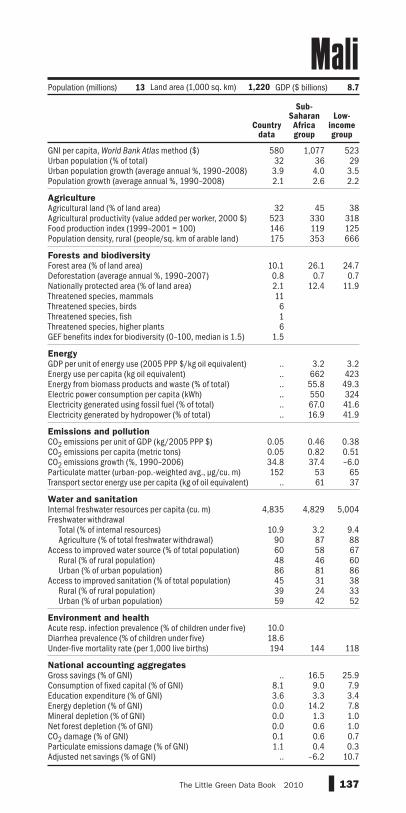
GNI per capita, World Bank Atlas method ($)Urban population (% of total)Urban population growth (average annual %, 1990–2008)Population growth (average annual %, 1990–2008) AgricultureAgricultural land (% of land area)Agricultural productivity (value added per worker, 2000 $)Food production index (1999–2001 = 100)Population density, rural (people/sq. km of arable land) Forests and biodiversityForest area (% of land area)Deforestation (average annual %, 1990–2007)Nationally protected area (% of land area)Threatened species, mammalsThreatened species, birdsThreatened species, fishThreatened species, higher plantsGEF benefits index for biodiversity (0–100, median is 1.5) EnergyGDP per unit of energy use (2005 PPP $/kg oil equivalent)Energy use per capita (kg oil equivalent)Energy from biomass products and waste (% of total)Electric power consumption per capita (kWh)Electricity generated using fossil fuel (% of total)Electricity generated by hydropower (% of total) Emissions and pollutionCO2 emissions per unit of GDP (kg/2005 PPP $)CO2 emissions per capita (metric tons)CO2 emissions growth (%, 1990–2006)Particulate matter (urban-pop.-weighted avg., μg/cu. m)Transport sector energy use per capita (kg of oil equivalent) Water and sanitationInternal freshwater resources per capita (cu. m)Freshwater withdrawal
Total (% of internal resources)Agriculture (% of total freshwater withdrawal)
Access to improved water source (% of total population)Rural (% of rural population)Urban (% of urban population)
Access to improved sanitation (% of total population)Rural (% of rural population)Urban (% of urban population)
Environment and healthAcute resp. infection prevalence (% of children under five)Diarrhea prevalence (% of children under five)Under-five mortality rate (per 1,000 live births) National accounting aggregatesGross savings (% of GNI)Consumption of fixed capital (% of GNI)Education expenditure (% of GNI)Energy depletion (% of GNI)Mineral depletion (% of GNI)Net forest depletion (% of GNI)CO2 damage (% of GNI)Particulate emissions damage (% of GNI)Adjusted net savings (% of GNI)
137The Little Green Data Book 2010
580 1,077 52332 36 29
3.9 4.0 3.52.1 2.6 2.2
32 45 38523 330 318146 119 125175 353 666
10.1 26.1 24.70.8 0.7 0.72.1 12.4 11.911616
1.5
.. 3.2 3.2
.. 662 423
.. 55.8 49.3
.. 550 324
.. 67.0 41.6
.. 16.9 41.9
0.05 0.46 0.380.05 0.82 0.5134.8 37.4 –6.0152 53 65
.. 61 37
4,835 4,829 5,004
10.9 3.2 9.490 87 8860 58 6748 46 6086 81 8645 31 3839 24 3359 42 52
10.018.6194 144 118
.. 16.5 25.98.1 9.0 7.93.6 3.3 3.40.0 14.2 7.80.0 1.3 1.00.0 0.6 1.00.1 0.6 0.71.1 0.4 0.3
.. –6.2 10.7
Population (millions) 13 Land area (1,000 sq. km) 1,220 GDP ($ billions) 8.7
Country data
Sub-Saharan Africa group
Low-income group
Mali

GNI per capita, World Bank Atlas method ($)Urban population (% of total)Urban population growth (average annual %, 1990–2008)Population growth (average annual %, 1990–2008) AgricultureAgricultural land (% of land area)Agricultural productivity (value added per worker, 2000 $)Food production index (1999–2001 = 100)Population density, rural (people/sq. km of arable land) Forests and biodiversityForest area (% of land area)Deforestation (average annual %, 1990–2007)Nationally protected area (% of land area)Threatened species, mammalsThreatened species, birdsThreatened species, fishThreatened species, higher plantsGEF benefits index for biodiversity (0–100, median is 1.5) EnergyGDP per unit of energy use (2005 PPP $/kg oil equivalent)Energy use per capita (kg oil equivalent)Energy from biomass products and waste (% of total)Electric power consumption per capita (kWh)Electricity generated using fossil fuel (% of total)Electricity generated by hydropower (% of total) Emissions and pollutionCO2 emissions per unit of GDP (kg/2005 PPP $)CO2 emissions per capita (metric tons)CO2 emissions growth (%, 1990–2006)Particulate matter (urban-pop.-weighted avg., μg/cu. m)Transport sector energy use per capita (kg of oil equivalent) Water and sanitationInternal freshwater resources per capita (cu. m)Freshwater withdrawal
Total (% of internal resources)Agriculture (% of total freshwater withdrawal)
Access to improved water source (% of total population)Rural (% of rural population)Urban (% of urban population)
Access to improved sanitation (% of total population)Rural (% of rural population)Urban (% of urban population)
Environment and healthAcute resp. infection prevalence (% of children under five)Diarrhea prevalence (% of children under five)Under-five mortality rate (per 1,000 live births) National accounting aggregatesGross savings (% of GNI)Consumption of fixed capital (% of GNI)Education expenditure (% of GNI)Energy depletion (% of GNI)Mineral depletion (% of GNI)Net forest depletion (% of GNI)CO2 damage (% of GNI)Particulate emissions damage (% of GNI)Adjusted net savings (% of GNI)
138 2010 The Little Green Data Book
16,690 39,68894 781.0 1.00.7 0.7
29 38.. 28,475
95 101305 341
0.9 28.90.0 –0.1
16.4 19.133
133
0.0
9.8 6.52,120 5,321
0.0 3.74,845 9,753100.0 63.1
0.0 11.1
0.3 0.46.3 12.7
12.8 18.0.. 26
438 1,166
123 9,305
100.0 10.4.. 43
100 100100 98100 100
.. 100
.. 99100 100
..
..6 7
.. 18.5
.. 13.8
.. 4.6
.. 2.0
.. 0.2
.. 0.0
.. 0.2
.. 0.1
.. 6.8
Country data
High-income group
Population (thousands) 412 Land area (sq. km) 320 GDP ($ billions) 7.4
Malta
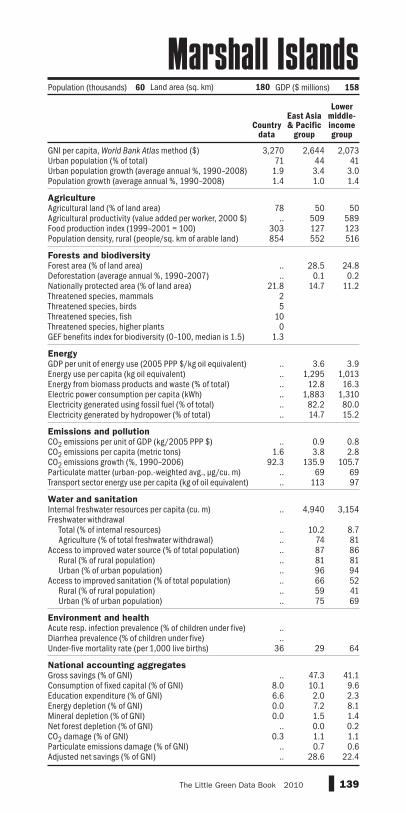
GNI per capita, World Bank Atlas method ($)Urban population (% of total)Urban population growth (average annual %, 1990–2008)Population growth (average annual %, 1990–2008) AgricultureAgricultural land (% of land area)Agricultural productivity (value added per worker, 2000 $)Food production index (1999–2001 = 100)Population density, rural (people/sq. km of arable land) Forests and biodiversityForest area (% of land area)Deforestation (average annual %, 1990–2007)Nationally protected area (% of land area)Threatened species, mammalsThreatened species, birdsThreatened species, fishThreatened species, higher plantsGEF benefits index for biodiversity (0–100, median is 1.5) EnergyGDP per unit of energy use (2005 PPP $/kg oil equivalent)Energy use per capita (kg oil equivalent)Energy from biomass products and waste (% of total)Electric power consumption per capita (kWh)Electricity generated using fossil fuel (% of total)Electricity generated by hydropower (% of total) Emissions and pollutionCO2 emissions per unit of GDP (kg/2005 PPP $)CO2 emissions per capita (metric tons)CO2 emissions growth (%, 1990–2006)Particulate matter (urban-pop.-weighted avg., μg/cu. m)Transport sector energy use per capita (kg of oil equivalent) Water and sanitationInternal freshwater resources per capita (cu. m)Freshwater withdrawal
Total (% of internal resources)Agriculture (% of total freshwater withdrawal)
Access to improved water source (% of total population)Rural (% of rural population)Urban (% of urban population)
Access to improved sanitation (% of total population)Rural (% of rural population)Urban (% of urban population)
Environment and healthAcute resp. infection prevalence (% of children under five)Diarrhea prevalence (% of children under five)Under-five mortality rate (per 1,000 live births) National accounting aggregatesGross savings (% of GNI)Consumption of fixed capital (% of GNI)Education expenditure (% of GNI)Energy depletion (% of GNI)Mineral depletion (% of GNI)Net forest depletion (% of GNI)CO2 damage (% of GNI)Particulate emissions damage (% of GNI)Adjusted net savings (% of GNI)
139The Little Green Data Book 2010
3,270 2,644 2,07371 44 41
1.9 3.4 3.01.4 1.0 1.4
78 50 50.. 509 589
303 127 123854 552 516
.. 28.5 24.8
.. 0.1 0.221.8 14.7 11.2
25
100
1.3
.. 3.6 3.9
.. 1,295 1,013
.. 12.8 16.3
.. 1,883 1,310
.. 82.2 80.0
.. 14.7 15.2
.. 0.9 0.81.6 3.8 2.8
92.3 135.9 105.7.. 69 69.. 113 97
.. 4,940 3,154
.. 10.2 8.7
.. 74 81
.. 87 86
.. 81 81
.. 96 94
.. 66 52
.. 59 41
.. 75 69
..
..36 29 64
.. 47.3 41.18.0 10.1 9.66.6 2.0 2.30.0 7.2 8.10.0 1.5 1.4
.. 0.0 0.20.3 1.1 1.1
.. 0.7 0.6
.. 28.6 22.4
Country data
East Asia & Pacific
group
Lower middle-income group
Population (thousands) 60 Land area (sq. km) 180 GDP ($ millions) 158
Marshall Islands

GNI per capita, World Bank Atlas method ($)Urban population (% of total)Urban population growth (average annual %, 1990–2008)Population growth (average annual %, 1990–2008) AgricultureAgricultural land (% of land area)Agricultural productivity (value added per worker, 2000 $)Food production index (1999–2001 = 100)Population density, rural (people/sq. km of arable land) Forests and biodiversityForest area (% of land area)Deforestation (average annual %, 1990–2007)Nationally protected area (% of land area)Threatened species, mammalsThreatened species, birdsThreatened species, fishThreatened species, higher plantsGEF benefits index for biodiversity (0–100, median is 1.5) EnergyGDP per unit of energy use (2005 PPP $/kg oil equivalent)Energy use per capita (kg oil equivalent)Energy from biomass products and waste (% of total)Electric power consumption per capita (kWh)Electricity generated using fossil fuel (% of total)Electricity generated by hydropower (% of total) Emissions and pollutionCO2 emissions per unit of GDP (kg/2005 PPP $)CO2 emissions per capita (metric tons)CO2 emissions growth (%, 1990–2006)Particulate matter (urban-pop.-weighted avg., μg/cu. m)Transport sector energy use per capita (kg of oil equivalent) Water and sanitationInternal freshwater resources per capita (cu. m)Freshwater withdrawal
Total (% of internal resources)Agriculture (% of total freshwater withdrawal)
Access to improved water source (% of total population)Rural (% of rural population)Urban (% of urban population)
Access to improved sanitation (% of total population)Rural (% of rural population)Urban (% of urban population)
Environment and healthAcute resp. infection prevalence (% of children under five)Diarrhea prevalence (% of children under five)Under-five mortality rate (per 1,000 live births) National accounting aggregatesGross savings (% of GNI)Consumption of fixed capital (% of GNI)Education expenditure (% of GNI)Energy depletion (% of GNI)Mineral depletion (% of GNI)Net forest depletion (% of GNI)CO2 damage (% of GNI)Particulate emissions damage (% of GNI)Adjusted net savings (% of GNI)
140 2010 The Little Green Data Book
840 1,077 52341 36 29
2.8 4.0 3.52.7 2.6 2.2
39 45 38424 330 318114 119 125413 353 666
0.2 26.1 24.73.0 0.7 0.70.9 12.4 11.9148
230
1.3
.. 3.2 3.2
.. 662 423
.. 55.8 49.3
.. 550 324
.. 67.0 41.6
.. 16.9 41.9
0.3 0.5 0.40.5 0.8 0.5
–37.6 37.4 –6.086 53 65
.. 61 37
127 4,829 5,004
425.0 3.2 9.488 87 8860 58 6754 46 6070 81 8624 31 3810 24 3344 42 52
10.018.3118 144 118
.. 16.5 25.9
.. 9.0 7.92.8 3.3 3.4
.. 14.2 7.8
.. 1.3 1.0
.. 0.6 1.0
.. 0.6 0.70.5 0.4 0.3
.. –6.2 10.7
Population (millions) 3.2 Land area (1,000 sq. km) 1,031 GDP ($ billions) 2.9
Country data
Sub-Saharan Africa group
Low-income group
Mauritania
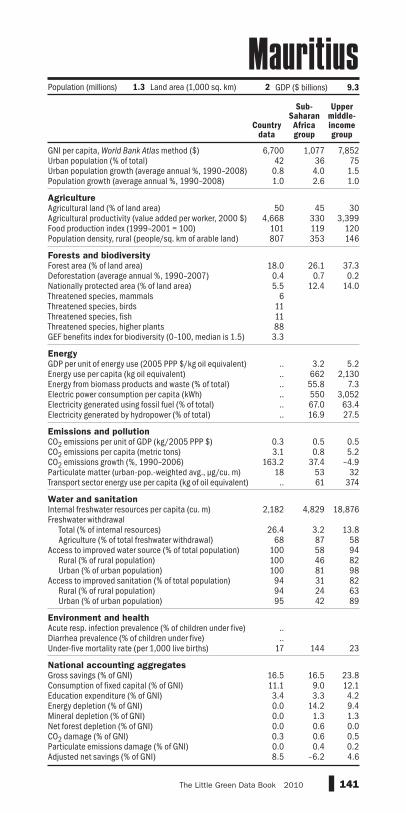
GNI per capita, World Bank Atlas method ($)Urban population (% of total)Urban population growth (average annual %, 1990–2008)Population growth (average annual %, 1990–2008) AgricultureAgricultural land (% of land area)Agricultural productivity (value added per worker, 2000 $)Food production index (1999–2001 = 100)Population density, rural (people/sq. km of arable land) Forests and biodiversityForest area (% of land area)Deforestation (average annual %, 1990–2007)Nationally protected area (% of land area)Threatened species, mammalsThreatened species, birdsThreatened species, fishThreatened species, higher plantsGEF benefits index for biodiversity (0–100, median is 1.5) EnergyGDP per unit of energy use (2005 PPP $/kg oil equivalent)Energy use per capita (kg oil equivalent)Energy from biomass products and waste (% of total)Electric power consumption per capita (kWh)Electricity generated using fossil fuel (% of total)Electricity generated by hydropower (% of total) Emissions and pollutionCO2 emissions per unit of GDP (kg/2005 PPP $)CO2 emissions per capita (metric tons)CO2 emissions growth (%, 1990–2006)Particulate matter (urban-pop.-weighted avg., μg/cu. m)Transport sector energy use per capita (kg of oil equivalent) Water and sanitationInternal freshwater resources per capita (cu. m)Freshwater withdrawal
Total (% of internal resources)Agriculture (% of total freshwater withdrawal)
Access to improved water source (% of total population)Rural (% of rural population)Urban (% of urban population)
Access to improved sanitation (% of total population)Rural (% of rural population)Urban (% of urban population)
Environment and healthAcute resp. infection prevalence (% of children under five)Diarrhea prevalence (% of children under five)Under-five mortality rate (per 1,000 live births) National accounting aggregatesGross savings (% of GNI)Consumption of fixed capital (% of GNI)Education expenditure (% of GNI)Energy depletion (% of GNI)Mineral depletion (% of GNI)Net forest depletion (% of GNI)CO2 damage (% of GNI)Particulate emissions damage (% of GNI)Adjusted net savings (% of GNI)
141The Little Green Data Book 2010
6,700 1,077 7,85242 36 75
0.8 4.0 1.51.0 2.6 1.0
50 45 304,668 330 3,399
101 119 120807 353 146
18.0 26.1 37.30.4 0.7 0.25.5 12.4 14.0
61111883.3
.. 3.2 5.2
.. 662 2,130
.. 55.8 7.3
.. 550 3,052
.. 67.0 63.4
.. 16.9 27.5
0.3 0.5 0.53.1 0.8 5.2
163.2 37.4 –4.918 53 32
.. 61 374
2,182 4,829 18,876
26.4 3.2 13.868 87 58
100 58 94100 46 82100 81 9894 31 8294 24 6395 42 89
..
..17 144 23
16.5 16.5 23.811.1 9.0 12.13.4 3.3 4.20.0 14.2 9.40.0 1.3 1.30.0 0.6 0.00.3 0.6 0.50.0 0.4 0.28.5 –6.2 4.6
Population (millions) 1.3 Land area (1,000 sq. km) 2 GDP ($ billions) 9.3
Country data
Sub-Saharan Africa group
Upper middle-income group
Mauritius
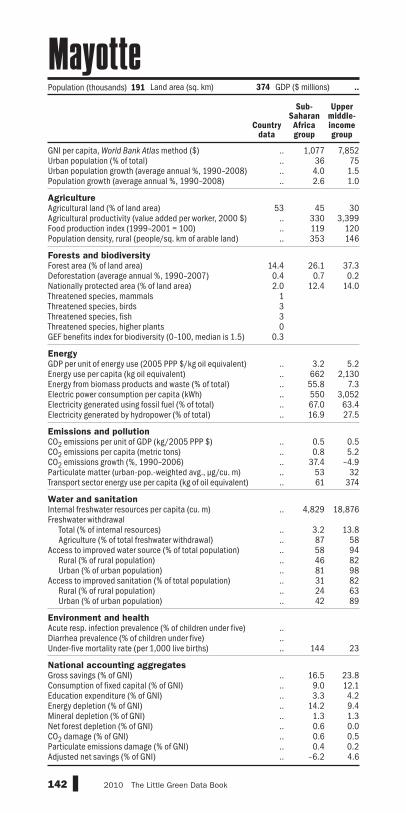
GNI per capita, World Bank Atlas method ($)Urban population (% of total)Urban population growth (average annual %, 1990–2008)Population growth (average annual %, 1990–2008) AgricultureAgricultural land (% of land area)Agricultural productivity (value added per worker, 2000 $)Food production index (1999–2001 = 100)Population density, rural (people/sq. km of arable land) Forests and biodiversityForest area (% of land area)Deforestation (average annual %, 1990–2007)Nationally protected area (% of land area)Threatened species, mammalsThreatened species, birdsThreatened species, fishThreatened species, higher plantsGEF benefits index for biodiversity (0–100, median is 1.5) EnergyGDP per unit of energy use (2005 PPP $/kg oil equivalent)Energy use per capita (kg oil equivalent)Energy from biomass products and waste (% of total)Electric power consumption per capita (kWh)Electricity generated using fossil fuel (% of total)Electricity generated by hydropower (% of total) Emissions and pollutionCO2 emissions per unit of GDP (kg/2005 PPP $)CO2 emissions per capita (metric tons)CO2 emissions growth (%, 1990–2006)Particulate matter (urban-pop.-weighted avg., μg/cu. m)Transport sector energy use per capita (kg of oil equivalent) Water and sanitationInternal freshwater resources per capita (cu. m)Freshwater withdrawal
Total (% of internal resources)Agriculture (% of total freshwater withdrawal)
Access to improved water source (% of total population)Rural (% of rural population)Urban (% of urban population)
Access to improved sanitation (% of total population)Rural (% of rural population)Urban (% of urban population)
Environment and healthAcute resp. infection prevalence (% of children under five)Diarrhea prevalence (% of children under five)Under-five mortality rate (per 1,000 live births) National accounting aggregatesGross savings (% of GNI)Consumption of fixed capital (% of GNI)Education expenditure (% of GNI)Energy depletion (% of GNI)Mineral depletion (% of GNI)Net forest depletion (% of GNI)CO2 damage (% of GNI)Particulate emissions damage (% of GNI)Adjusted net savings (% of GNI)
142 2010 The Little Green Data Book
.. 1,077 7,852
.. 36 75
.. 4.0 1.5
.. 2.6 1.0
53 45 30.. 330 3,399.. 119 120.. 353 146
14.4 26.1 37.30.4 0.7 0.22.0 12.4 14.0
1330
0.3
.. 3.2 5.2
.. 662 2,130
.. 55.8 7.3
.. 550 3,052
.. 67.0 63.4
.. 16.9 27.5
.. 0.5 0.5
.. 0.8 5.2
.. 37.4 –4.9
.. 53 32
.. 61 374
.. 4,829 18,876
.. 3.2 13.8
.. 87 58
.. 58 94
.. 46 82
.. 81 98
.. 31 82
.. 24 63
.. 42 89
..
..
.. 144 23
.. 16.5 23.8
.. 9.0 12.1
.. 3.3 4.2
.. 14.2 9.4
.. 1.3 1.3
.. 0.6 0.0
.. 0.6 0.5
.. 0.4 0.2
.. –6.2 4.6
Population (thousands) 191 Land area (sq. km) 374 GDP ($ millions) ..
Country data
Sub-Saharan Africa group
Upper middle-income group
Mayotte

GNI per capita, World Bank Atlas method ($)Urban population (% of total)Urban population growth (average annual %, 1990–2008)Population growth (average annual %, 1990–2008) AgricultureAgricultural land (% of land area)Agricultural productivity (value added per worker, 2000 $)Food production index (1999–2001 = 100)Population density, rural (people/sq. km of arable land) Forests and biodiversityForest area (% of land area)Deforestation (average annual %, 1990–2007)Nationally protected area (% of land area)Threatened species, mammalsThreatened species, birdsThreatened species, fishThreatened species, higher plantsGEF benefits index for biodiversity (0–100, median is 1.5) EnergyGDP per unit of energy use (2005 PPP $/kg oil equivalent)Energy use per capita (kg oil equivalent)Energy from biomass products and waste (% of total)Electric power consumption per capita (kWh)Electricity generated using fossil fuel (% of total)Electricity generated by hydropower (% of total) Emissions and pollutionCO2 emissions per unit of GDP (kg/2005 PPP $)CO2 emissions per capita (metric tons)CO2 emissions growth (%, 1990–2006)Particulate matter (urban-pop.-weighted avg., μg/cu. m)Transport sector energy use per capita (kg of oil equivalent) Water and sanitationInternal freshwater resources per capita (cu. m)Freshwater withdrawal
Total (% of internal resources)Agriculture (% of total freshwater withdrawal)
Access to improved water source (% of total population)Rural (% of rural population)Urban (% of urban population)
Access to improved sanitation (% of total population)Rural (% of rural population)Urban (% of urban population)
Environment and healthAcute resp. infection prevalence (% of children under five)Diarrhea prevalence (% of children under five)Under-five mortality rate (per 1,000 live births) National accounting aggregatesGross savings (% of GNI)Consumption of fixed capital (% of GNI)Education expenditure (% of GNI)Energy depletion (% of GNI)Mineral depletion (% of GNI)Net forest depletion (% of GNI)CO2 damage (% of GNI)Particulate emissions damage (% of GNI)Adjusted net savings (% of GNI)
143The Little Green Data Book 2010
9,990 6,768 7,85277 79 751.8 2.0 1.51.4 1.5 1.0
55 36 303,160 3,452 3,399
121 125 12099 233 146
32.8 44.9 37.30.5 0.5 0.28.0 22.8 14.0
10054
114261
68.7
7.6 7.5 5.21,750 1,273 2,130
4.5 16.3 7.32,036 1,866 3,052
81.3 38.2 63.410.6 55.8 27.5
0.3 0.3 0.54.2 2.6 5.2
13.4 40.0 –4.936 35 32
483 317 374
3,885 24,004 18,876
19.1 2.0 13.877 71 5895 91 9485 73 8298 97 9881 78 8248 51 6391 86 89
..9.717 23 23
25.3 22.4 23.812.0 11.8 12.14.8 4.4 4.28.2 6.3 9.40.3 1.8 1.30.0 0.0 0.00.3 0.3 0.50.3 0.3 0.29.0 6.3 4.6
Country data
Latin America & Caribbean
group
Upper middle-income group
Population (millions) 106 Land area (1,000 sq. km) 1,944 GDP ($ billions) 1,088.1
Mexico
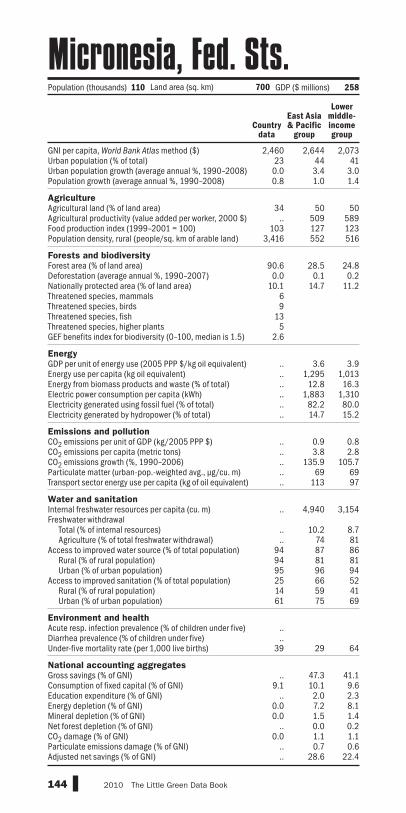
GNI per capita, World Bank Atlas method ($)Urban population (% of total)Urban population growth (average annual %, 1990–2008)Population growth (average annual %, 1990–2008) AgricultureAgricultural land (% of land area)Agricultural productivity (value added per worker, 2000 $)Food production index (1999–2001 = 100)Population density, rural (people/sq. km of arable land) Forests and biodiversityForest area (% of land area)Deforestation (average annual %, 1990–2007)Nationally protected area (% of land area)Threatened species, mammalsThreatened species, birdsThreatened species, fishThreatened species, higher plantsGEF benefits index for biodiversity (0–100, median is 1.5) EnergyGDP per unit of energy use (2005 PPP $/kg oil equivalent)Energy use per capita (kg oil equivalent)Energy from biomass products and waste (% of total)Electric power consumption per capita (kWh)Electricity generated using fossil fuel (% of total)Electricity generated by hydropower (% of total) Emissions and pollutionCO2 emissions per unit of GDP (kg/2005 PPP $)CO2 emissions per capita (metric tons)CO2 emissions growth (%, 1990–2006)Particulate matter (urban-pop.-weighted avg., μg/cu. m)Transport sector energy use per capita (kg of oil equivalent) Water and sanitationInternal freshwater resources per capita (cu. m)Freshwater withdrawal
Total (% of internal resources)Agriculture (% of total freshwater withdrawal)
Access to improved water source (% of total population)Rural (% of rural population)Urban (% of urban population)
Access to improved sanitation (% of total population)Rural (% of rural population)Urban (% of urban population)
Environment and healthAcute resp. infection prevalence (% of children under five)Diarrhea prevalence (% of children under five)Under-five mortality rate (per 1,000 live births) National accounting aggregatesGross savings (% of GNI)Consumption of fixed capital (% of GNI)Education expenditure (% of GNI)Energy depletion (% of GNI)Mineral depletion (% of GNI)Net forest depletion (% of GNI)CO2 damage (% of GNI)Particulate emissions damage (% of GNI)Adjusted net savings (% of GNI)
144 2010 The Little Green Data Book
2,460 2,644 2,07323 44 410.0 3.4 3.00.8 1.0 1.4
34 50 50.. 509 589
103 127 1233,416 552 516
90.6 28.5 24.80.0 0.1 0.2
10.1 14.7 11.269
135
2.6
.. 3.6 3.9
.. 1,295 1,013
.. 12.8 16.3
.. 1,883 1,310
.. 82.2 80.0
.. 14.7 15.2
.. 0.9 0.8
.. 3.8 2.8
.. 135.9 105.7
.. 69 69
.. 113 97
.. 4,940 3,154
.. 10.2 8.7
.. 74 8194 87 8694 81 8195 96 9425 66 5214 59 4161 75 69
..
..39 29 64
.. 47.3 41.19.1 10.1 9.6
.. 2.0 2.30.0 7.2 8.10.0 1.5 1.4
.. 0.0 0.20.0 1.1 1.1
.. 0.7 0.6
.. 28.6 22.4
Population (thousands) 110 Land area (sq. km) 700 GDP ($ millions) 258
Country data
East Asia & Pacific
group
Lower middle-income group
Micronesia, Fed. Sts.

GNI per capita, World Bank Atlas method ($)Urban population (% of total)Urban population growth (average annual %, 1990–2008)Population growth (average annual %, 1990–2008) AgricultureAgricultural land (% of land area)Agricultural productivity (value added per worker, 2000 $)Food production index (1999–2001 = 100)Population density, rural (people/sq. km of arable land) Forests and biodiversityForest area (% of land area)Deforestation (average annual %, 1990–2007)Nationally protected area (% of land area)Threatened species, mammalsThreatened species, birdsThreatened species, fishThreatened species, higher plantsGEF benefits index for biodiversity (0–100, median is 1.5) EnergyGDP per unit of energy use (2005 PPP $/kg oil equivalent)Energy use per capita (kg oil equivalent)Energy from biomass products and waste (% of total)Electric power consumption per capita (kWh)Electricity generated using fossil fuel (% of total)Electricity generated by hydropower (% of total) Emissions and pollutionCO2 emissions per unit of GDP (kg/2005 PPP $)CO2 emissions per capita (metric tons)CO2 emissions growth (%, 1990–2006)Particulate matter (urban-pop.-weighted avg., μg/cu. m)Transport sector energy use per capita (kg of oil equivalent) Water and sanitationInternal freshwater resources per capita (cu. m)Freshwater withdrawal
Total (% of internal resources)Agriculture (% of total freshwater withdrawal)
Access to improved water source (% of total population)Rural (% of rural population)Urban (% of urban population)
Access to improved sanitation (% of total population)Rural (% of rural population)Urban (% of urban population)
Environment and healthAcute resp. infection prevalence (% of children under five)Diarrhea prevalence (% of children under five)Under-five mortality rate (per 1,000 live births) National accounting aggregatesGross savings (% of GNI)Consumption of fixed capital (% of GNI)Education expenditure (% of GNI)Energy depletion (% of GNI)Mineral depletion (% of GNI)Net forest depletion (% of GNI)CO2 damage (% of GNI)Particulate emissions damage (% of GNI)Adjusted net savings (% of GNI)
145The Little Green Data Book 2010
1,500 7,350 2,07342 64 41
–1.7 0.2 3.0–1.0 0.1 1.4
75 28 501,011 2,797 589
89 113 123117 144 516
10.0 38.4 24.8–0.2 0.0 0.21.4 7.8 11.2
4990
0.0
2.7 3.7 3.9910 2,948 1,0132.3 2.1 16.3
1,319 3,958 1,31098.2 68.9 80.0
0.9 16.2 15.2
0.9 0.7 0.82.1 7.3 2.8
–66.9 –30.0 105.736 27 69
102 376 97
273 11,867 3,154
231.0 7.2 8.733 60 8190 95 8685 88 8196 99 9479 89 5273 79 4185 94 69
7.07.417 22 64
20.8 24.8 41.18.3 12.1 9.66.5 4.1 2.30.0 12.1 8.10.0 0.6 1.40.1 0.0 0.21.0 0.8 1.10.5 0.2 0.6
17.3 3.2 22.4
Country data
Europe & Central
Asia group
Lower middle-income group
Population (millions) 3.6 Land area (1,000 sq. km) 33 GDP ($ billions) 6.0
Moldova

GNI per capita, World Bank Atlas method ($)Urban population (% of total)Urban population growth (average annual %, 1990–2008)Population growth (average annual %, 1990–2008) AgricultureAgricultural land (% of land area)Agricultural productivity (value added per worker, 2000 $)Food production index (1999–2001 = 100)Population density, rural (people/sq. km of arable land) Forests and biodiversityForest area (% of land area)Deforestation (average annual %, 1990–2007)Nationally protected area (% of land area)Threatened species, mammalsThreatened species, birdsThreatened species, fishThreatened species, higher plantsGEF benefits index for biodiversity (0–100, median is 1.5) EnergyGDP per unit of energy use (2005 PPP $/kg oil equivalent)Energy use per capita (kg oil equivalent)Energy from biomass products and waste (% of total)Electric power consumption per capita (kWh)Electricity generated using fossil fuel (% of total)Electricity generated by hydropower (% of total) Emissions and pollutionCO2 emissions per unit of GDP (kg/2005 PPP $)CO2 emissions per capita (metric tons)CO2 emissions growth (%, 1990–2006)Particulate matter (urban-pop.-weighted avg., μg/cu. m)Transport sector energy use per capita (kg of oil equivalent) Water and sanitationInternal freshwater resources per capita (cu. m)Freshwater withdrawal
Total (% of internal resources)Agriculture (% of total freshwater withdrawal)
Access to improved water source (% of total population)Rural (% of rural population)Urban (% of urban population)
Access to improved sanitation (% of total population)Rural (% of rural population)Urban (% of urban population)
Environment and healthAcute resp. infection prevalence (% of children under five)Diarrhea prevalence (% of children under five)Under-five mortality rate (per 1,000 live births) National accounting aggregatesGross savings (% of GNI)Consumption of fixed capital (% of GNI)Education expenditure (% of GNI)Energy depletion (% of GNI)Mineral depletion (% of GNI)Net forest depletion (% of GNI)CO2 damage (% of GNI)Particulate emissions damage (% of GNI)Adjusted net savings (% of GNI)
146 2010 The Little Green Data Book
.. 39,688100 780.6 1.00.6 0.7
.. 38
.. 28,475
.. 101
.. 341
.. 28.9
.. –0.10.3 19.1
20
120
0.0
.. 6.5
.. 5,321
.. 3.7
.. 9,753
.. 63.1
.. 11.1
.. 0.4
.. 12.7
.. 18.0
.. 26
.. 1,166
.. 9,305
.. 10.4
.. 43
.. 100
.. 98100 100
.. 100
.. 99100 100
..
..4 7
.. 18.5
.. 13.8
.. 4.6
.. 2.0
.. 0.2
.. 0.0
.. 0.2
.. 0.1
.. 6.8
Country data
High-income group
Population (thousands) 33 Land area (sq. km) 2 GDP ($ millions) ..
Monaco
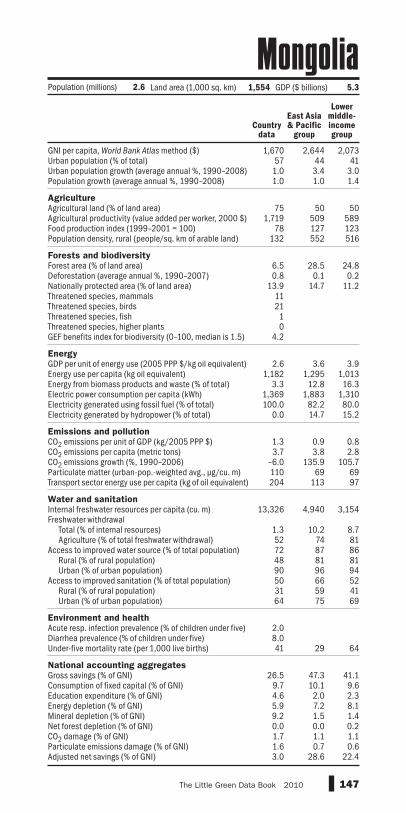
GNI per capita, World Bank Atlas method ($)Urban population (% of total)Urban population growth (average annual %, 1990–2008)Population growth (average annual %, 1990–2008) AgricultureAgricultural land (% of land area)Agricultural productivity (value added per worker, 2000 $)Food production index (1999–2001 = 100)Population density, rural (people/sq. km of arable land) Forests and biodiversityForest area (% of land area)Deforestation (average annual %, 1990–2007)Nationally protected area (% of land area)Threatened species, mammalsThreatened species, birdsThreatened species, fishThreatened species, higher plantsGEF benefits index for biodiversity (0–100, median is 1.5) EnergyGDP per unit of energy use (2005 PPP $/kg oil equivalent)Energy use per capita (kg oil equivalent)Energy from biomass products and waste (% of total)Electric power consumption per capita (kWh)Electricity generated using fossil fuel (% of total)Electricity generated by hydropower (% of total) Emissions and pollutionCO2 emissions per unit of GDP (kg/2005 PPP $)CO2 emissions per capita (metric tons)CO2 emissions growth (%, 1990–2006)Particulate matter (urban-pop.-weighted avg., μg/cu. m)Transport sector energy use per capita (kg of oil equivalent) Water and sanitationInternal freshwater resources per capita (cu. m)Freshwater withdrawal
Total (% of internal resources)Agriculture (% of total freshwater withdrawal)
Access to improved water source (% of total population)Rural (% of rural population)Urban (% of urban population)
Access to improved sanitation (% of total population)Rural (% of rural population)Urban (% of urban population)
Environment and healthAcute resp. infection prevalence (% of children under five)Diarrhea prevalence (% of children under five)Under-five mortality rate (per 1,000 live births) National accounting aggregatesGross savings (% of GNI)Consumption of fixed capital (% of GNI)Education expenditure (% of GNI)Energy depletion (% of GNI)Mineral depletion (% of GNI)Net forest depletion (% of GNI)CO2 damage (% of GNI)Particulate emissions damage (% of GNI)Adjusted net savings (% of GNI)
147The Little Green Data Book 2010
1,670 2,644 2,07357 44 41
1.0 3.4 3.01.0 1.0 1.4
75 50 501,719 509 589
78 127 123132 552 516
6.5 28.5 24.80.8 0.1 0.2
13.9 14.7 11.2112110
4.2
2.6 3.6 3.91,182 1,295 1,013
3.3 12.8 16.31,369 1,883 1,310100.0 82.2 80.0
0.0 14.7 15.2
1.3 0.9 0.83.7 3.8 2.8
–6.0 135.9 105.7110 69 69204 113 97
13,326 4,940 3,154
1.3 10.2 8.752 74 8172 87 8648 81 8190 96 9450 66 5231 59 4164 75 69
2.08.041 29 64
26.5 47.3 41.19.7 10.1 9.64.6 2.0 2.35.9 7.2 8.19.2 1.5 1.40.0 0.0 0.21.7 1.1 1.11.6 0.7 0.63.0 28.6 22.4
Population (millions) 2.6 Land area (1,000 sq. km) 1,554 GDP ($ billions) 5.3
Country data
East Asia & Pacific
group
Lower middle-income group
Mongolia
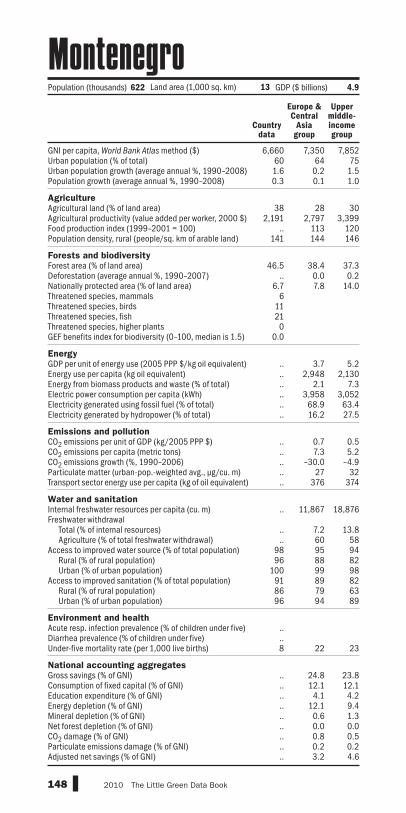
GNI per capita, World Bank Atlas method ($)Urban population (% of total)Urban population growth (average annual %, 1990–2008)Population growth (average annual %, 1990–2008) AgricultureAgricultural land (% of land area)Agricultural productivity (value added per worker, 2000 $)Food production index (1999–2001 = 100)Population density, rural (people/sq. km of arable land) Forests and biodiversityForest area (% of land area)Deforestation (average annual %, 1990–2007)Nationally protected area (% of land area)Threatened species, mammalsThreatened species, birdsThreatened species, fishThreatened species, higher plantsGEF benefits index for biodiversity (0–100, median is 1.5) EnergyGDP per unit of energy use (2005 PPP $/kg oil equivalent)Energy use per capita (kg oil equivalent)Energy from biomass products and waste (% of total)Electric power consumption per capita (kWh)Electricity generated using fossil fuel (% of total)Electricity generated by hydropower (% of total) Emissions and pollutionCO2 emissions per unit of GDP (kg/2005 PPP $)CO2 emissions per capita (metric tons)CO2 emissions growth (%, 1990–2006)Particulate matter (urban-pop.-weighted avg., μg/cu. m)Transport sector energy use per capita (kg of oil equivalent) Water and sanitationInternal freshwater resources per capita (cu. m)Freshwater withdrawal
Total (% of internal resources)Agriculture (% of total freshwater withdrawal)
Access to improved water source (% of total population)Rural (% of rural population)Urban (% of urban population)
Access to improved sanitation (% of total population)Rural (% of rural population)Urban (% of urban population)
Environment and healthAcute resp. infection prevalence (% of children under five)Diarrhea prevalence (% of children under five)Under-five mortality rate (per 1,000 live births) National accounting aggregatesGross savings (% of GNI)Consumption of fixed capital (% of GNI)Education expenditure (% of GNI)Energy depletion (% of GNI)Mineral depletion (% of GNI)Net forest depletion (% of GNI)CO2 damage (% of GNI)Particulate emissions damage (% of GNI)Adjusted net savings (% of GNI)
148 2010 The Little Green Data Book
6,660 7,350 7,85260 64 751.6 0.2 1.50.3 0.1 1.0
38 28 302,191 2,797 3,399
.. 113 120141 144 146
46.5 38.4 37.3.. 0.0 0.2
6.7 7.8 14.06
11210
0.0
.. 3.7 5.2
.. 2,948 2,130
.. 2.1 7.3
.. 3,958 3,052
.. 68.9 63.4
.. 16.2 27.5
.. 0.7 0.5
.. 7.3 5.2
.. –30.0 –4.9
.. 27 32
.. 376 374
.. 11,867 18,876
.. 7.2 13.8
.. 60 5898 95 9496 88 82
100 99 9891 89 8286 79 6396 94 89
..
..8 22 23
.. 24.8 23.8
.. 12.1 12.1
.. 4.1 4.2
.. 12.1 9.4
.. 0.6 1.3
.. 0.0 0.0
.. 0.8 0.5
.. 0.2 0.2
.. 3.2 4.6
Country data
Europe & Central
Asia group
Upper middle-income group
Population (thousands) 622 Land area (1,000 sq. km) 13 GDP ($ billions) 4.9
Montenegro

GNI per capita, World Bank Atlas method ($)Urban population (% of total)Urban population growth (average annual %, 1990–2008)Population growth (average annual %, 1990–2008) AgricultureAgricultural land (% of land area)Agricultural productivity (value added per worker, 2000 $)Food production index (1999–2001 = 100)Population density, rural (people/sq. km of arable land) Forests and biodiversityForest area (% of land area)Deforestation (average annual %, 1990–2007)Nationally protected area (% of land area)Threatened species, mammalsThreatened species, birdsThreatened species, fishThreatened species, higher plantsGEF benefits index for biodiversity (0–100, median is 1.5) EnergyGDP per unit of energy use (2005 PPP $/kg oil equivalent)Energy use per capita (kg oil equivalent)Energy from biomass products and waste (% of total)Electric power consumption per capita (kWh)Electricity generated using fossil fuel (% of total)Electricity generated by hydropower (% of total) Emissions and pollutionCO2 emissions per unit of GDP (kg/2005 PPP $)CO2 emissions per capita (metric tons)CO2 emissions growth (%, 1990–2006)Particulate matter (urban-pop.-weighted avg., μg/cu. m)Transport sector energy use per capita (kg of oil equivalent) Water and sanitationInternal freshwater resources per capita (cu. m)Freshwater withdrawal
Total (% of internal resources)Agriculture (% of total freshwater withdrawal)
Access to improved water source (% of total population)Rural (% of rural population)Urban (% of urban population)
Access to improved sanitation (% of total population)Rural (% of rural population)Urban (% of urban population)
Environment and healthAcute resp. infection prevalence (% of children under five)Diarrhea prevalence (% of children under five)Under-five mortality rate (per 1,000 live births) National accounting aggregatesGross savings (% of GNI)Consumption of fixed capital (% of GNI)Education expenditure (% of GNI)Energy depletion (% of GNI)Mineral depletion (% of GNI)Net forest depletion (% of GNI)CO2 damage (% of GNI)Particulate emissions damage (% of GNI)Adjusted net savings (% of GNI)
149The Little Green Data Book 2010
2,520 3,237 2,07356 57 412.2 2.6 3.01.3 2.0 1.4
67 23 502,148 2,896 589
119 120 123172 746 516
9.8 2.5 24.8–0.1 –0.4 0.21.2 3.8 11.21810312
3.5
8.3 5.0 3.9460 1,275 1,0133.1 1.1 16.3
707 1,435 1,31093.0 91.1 80.0
5.8 7.4 15.2
0.4 0.6 0.81.5 3.5 2.8
92.5 96.4 105.721 72 69
104 258 97
929 714 3,154
43.4 122.3 8.787 86 8183 88 8658 81 81
100 95 9472 74 5254 59 4185 89 69
12.010.4
36 34 64
31.4 .. 41.110.1 10.5 9.65.2 4.4 2.30.0 18.6 8.16.1 1.5 1.40.0 0.1 0.20.4 0.7 1.10.1 0.4 0.6
19.8 .. 22.4
Country data
Middle East &
N. Africa group
Lower middle-income group
Population (millions) 32 Land area (1,000 sq. km) 446 GDP ($ billions) 88.9
Morocco

GNI per capita, World Bank Atlas method ($)Urban population (% of total)Urban population growth (average annual %, 1990–2008)Population growth (average annual %, 1990–2008) AgricultureAgricultural land (% of land area)Agricultural productivity (value added per worker, 2000 $)Food production index (1999–2001 = 100)Population density, rural (people/sq. km of arable land) Forests and biodiversityForest area (% of land area)Deforestation (average annual %, 1990–2007)Nationally protected area (% of land area)Threatened species, mammalsThreatened species, birdsThreatened species, fishThreatened species, higher plantsGEF benefits index for biodiversity (0–100, median is 1.5) EnergyGDP per unit of energy use (2005 PPP $/kg oil equivalent)Energy use per capita (kg oil equivalent)Energy from biomass products and waste (% of total)Electric power consumption per capita (kWh)Electricity generated using fossil fuel (% of total)Electricity generated by hydropower (% of total) Emissions and pollutionCO2 emissions per unit of GDP (kg/2005 PPP $)CO2 emissions per capita (metric tons)CO2 emissions growth (%, 1990–2006)Particulate matter (urban-pop.-weighted avg., μg/cu. m)Transport sector energy use per capita (kg of oil equivalent) Water and sanitationInternal freshwater resources per capita (cu. m)Freshwater withdrawal
Total (% of internal resources)Agriculture (% of total freshwater withdrawal)
Access to improved water source (% of total population)Rural (% of rural population)Urban (% of urban population)
Access to improved sanitation (% of total population)Rural (% of rural population)Urban (% of urban population)
Environment and healthAcute resp. infection prevalence (% of children under five)Diarrhea prevalence (% of children under five)Under-five mortality rate (per 1,000 live births) National accounting aggregatesGross savings (% of GNI)Consumption of fixed capital (% of GNI)Education expenditure (% of GNI)Energy depletion (% of GNI)Mineral depletion (% of GNI)Net forest depletion (% of GNI)CO2 damage (% of GNI)Particulate emissions damage (% of GNI)Adjusted net savings (% of GNI)
150 2010 The Little Green Data Book
380 1,077 52337 36 29
5.9 4.0 3.52.8 2.6 2.2
62 45 38185 330 318
99 119 125314 353 666
24.4 26.1 24.70.3 0.7 0.7
15.7 12.4 11.9112145467.2
1.8 3.2 3.2418 662 423
80.3 55.8 49.3472 550 3240.1 67.0 41.6
99.9 16.9 41.9
0.1 0.5 0.40.10 0.82 0.51
103.7 37.4 –6.028 53 6521 61 37
4,586 4,829 5,004
0.6 3.2 9.487 87 8842 58 6726 46 6071 81 8631 31 3819 24 3353 42 52
10.020.7130 144 118
7.4 16.5 25.97.9 9.0 7.93.8 3.3 3.47.0 14.2 7.80.0 1.3 1.00.5 0.6 1.00.2 0.6 0.70.1 0.4 0.3
–4.6 –6.2 10.7
Population (millions) 22 Land area (1,000 sq. km) 786 GDP ($ billions) 9.8
Country data
Sub-Saharan Africa group
Low-income group
Mozambique

GNI per capita, World Bank Atlas method ($)Urban population (% of total)Urban population growth (average annual %, 1990–2008)Population growth (average annual %, 1990–2008) AgricultureAgricultural land (% of land area)Agricultural productivity (value added per worker, 2000 $)Food production index (1999–2001 = 100)Population density, rural (people/sq. km of arable land) Forests and biodiversityForest area (% of land area)Deforestation (average annual %, 1990–2007)Nationally protected area (% of land area)Threatened species, mammalsThreatened species, birdsThreatened species, fishThreatened species, higher plantsGEF benefits index for biodiversity (0–100, median is 1.5) EnergyGDP per unit of energy use (2005 PPP $/kg oil equivalent)Energy use per capita (kg oil equivalent)Energy from biomass products and waste (% of total)Electric power consumption per capita (kWh)Electricity generated using fossil fuel (% of total)Electricity generated by hydropower (% of total) Emissions and pollutionCO2 emissions per unit of GDP (kg/2005 PPP $)CO2 emissions per capita (metric tons)CO2 emissions growth (%, 1990–2006)Particulate matter (urban-pop.-weighted avg., μg/cu. m)Transport sector energy use per capita (kg of oil equivalent) Water and sanitationInternal freshwater resources per capita (cu. m)Freshwater withdrawal
Total (% of internal resources)Agriculture (% of total freshwater withdrawal)
Access to improved water source (% of total population)Rural (% of rural population)Urban (% of urban population)
Access to improved sanitation (% of total population)Rural (% of rural population)Urban (% of urban population)
Environment and healthAcute resp. infection prevalence (% of children under five)Diarrhea prevalence (% of children under five)Under-five mortality rate (per 1,000 live births) National accounting aggregatesGross savings (% of GNI)Consumption of fixed capital (% of GNI)Education expenditure (% of GNI)Energy depletion (% of GNI)Mineral depletion (% of GNI)Net forest depletion (% of GNI)CO2 damage (% of GNI)Particulate emissions damage (% of GNI)Adjusted net savings (% of GNI)
151The Little Green Data Book 2010
.. 2,644 52333 44 292.6 3.4 3.51.1 1.0 2.2
18 50 38.. 509 318
158 127 125316 552 666
47.9 28.5 24.71.3 0.1 0.76.7 14.7 11.945411738
10.0
.. 3.6 3.2319 1,295 423
66.3 12.8 49.394 1,883 324
46.1 82.2 41.653.9 14.7 41.9
.. 0.9 0.40.2 3.8 0.5
134.5 135.9 –6.058 69 6527 113 37
17,924 4,940 5,004
3.8 10.2 9.498 74 8880 87 6780 81 6080 96 8682 66 3881 59 3385 75 52
2.0..
98 29 118
.. 47.3 25.9
.. 10.1 7.9
.. 2.0 3.4
.. 7.2 7.8
.. 1.5 1.0
.. 0.0 1.0
.. 1.1 0.7
.. 0.7 0.3
.. 28.6 10.7
Country data
East Asia & Pacific
group
Low-income group
Population (millions) 50 Land area (1,000 sq. km) 654 GDP ($ billions) ..
Myanmar
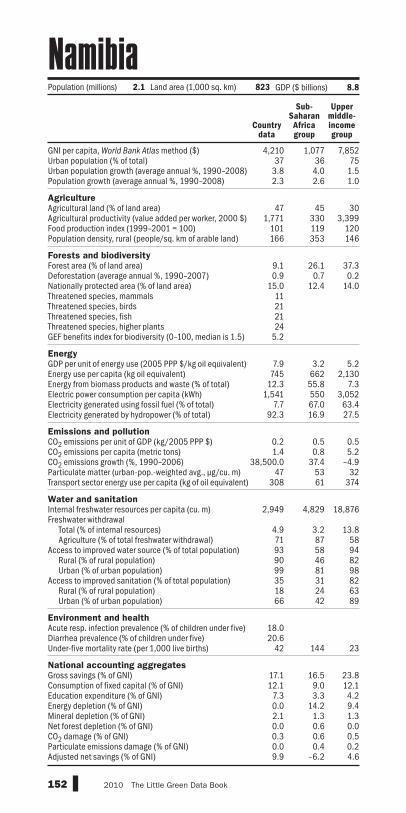
GNI per capita, World Bank Atlas method ($)Urban population (% of total)Urban population growth (average annual %, 1990–2008)Population growth (average annual %, 1990–2008) AgricultureAgricultural land (% of land area)Agricultural productivity (value added per worker, 2000 $)Food production index (1999–2001 = 100)Population density, rural (people/sq. km of arable land) Forests and biodiversityForest area (% of land area)Deforestation (average annual %, 1990–2007)Nationally protected area (% of land area)Threatened species, mammalsThreatened species, birdsThreatened species, fishThreatened species, higher plantsGEF benefits index for biodiversity (0–100, median is 1.5) EnergyGDP per unit of energy use (2005 PPP $/kg oil equivalent)Energy use per capita (kg oil equivalent)Energy from biomass products and waste (% of total)Electric power consumption per capita (kWh)Electricity generated using fossil fuel (% of total)Electricity generated by hydropower (% of total) Emissions and pollutionCO2 emissions per unit of GDP (kg/2005 PPP $)CO2 emissions per capita (metric tons)CO2 emissions growth (%, 1990–2006)Particulate matter (urban-pop.-weighted avg., μg/cu. m)Transport sector energy use per capita (kg of oil equivalent) Water and sanitationInternal freshwater resources per capita (cu. m)Freshwater withdrawal
Total (% of internal resources)Agriculture (% of total freshwater withdrawal)
Access to improved water source (% of total population)Rural (% of rural population)Urban (% of urban population)
Access to improved sanitation (% of total population)Rural (% of rural population)Urban (% of urban population)
Environment and healthAcute resp. infection prevalence (% of children under five)Diarrhea prevalence (% of children under five)Under-five mortality rate (per 1,000 live births) National accounting aggregatesGross savings (% of GNI)Consumption of fixed capital (% of GNI)Education expenditure (% of GNI)Energy depletion (% of GNI)Mineral depletion (% of GNI)Net forest depletion (% of GNI)CO2 damage (% of GNI)Particulate emissions damage (% of GNI)Adjusted net savings (% of GNI)
152 2010 The Little Green Data Book
4,210 1,077 7,85237 36 75
3.8 4.0 1.52.3 2.6 1.0
47 45 301,771 330 3,399
101 119 120166 353 146
9.1 26.1 37.30.9 0.7 0.2
15.0 12.4 14.011212124
5.2
7.9 3.2 5.2745 662 2,130
12.3 55.8 7.31,541 550 3,052
7.7 67.0 63.492.3 16.9 27.5
0.2 0.5 0.51.4 0.8 5.2
38,500.0 37.4 –4.947 53 32
308 61 374
2,949 4,829 18,876
4.9 3.2 13.871 87 5893 58 9490 46 8299 81 9835 31 8218 24 6366 42 89
18.020.6
42 144 23
17.1 16.5 23.812.1 9.0 12.1
7.3 3.3 4.20.0 14.2 9.42.1 1.3 1.30.0 0.6 0.00.3 0.6 0.50.0 0.4 0.29.9 –6.2 4.6
Country data
Sub-Saharan Africa group
Upper middle-income group
Population (millions) 2.1 Land area (1,000 sq. km) 823 GDP ($ billions) 8.8
Namibia

GNI per capita, World Bank Atlas method ($)Urban population (% of total)Urban population growth (average annual %, 1990–2008)Population growth (average annual %, 1990–2008) AgricultureAgricultural land (% of land area)Agricultural productivity (value added per worker, 2000 $)Food production index (1999–2001 = 100)Population density, rural (people/sq. km of arable land) Forests and biodiversityForest area (% of land area)Deforestation (average annual %, 1990–2007)Nationally protected area (% of land area)Threatened species, mammalsThreatened species, birdsThreatened species, fishThreatened species, higher plantsGEF benefits index for biodiversity (0–100, median is 1.5) EnergyGDP per unit of energy use (2005 PPP $/kg oil equivalent)Energy use per capita (kg oil equivalent)Energy from biomass products and waste (% of total)Electric power consumption per capita (kWh)Electricity generated using fossil fuel (% of total)Electricity generated by hydropower (% of total) Emissions and pollutionCO2 emissions per unit of GDP (kg/2005 PPP $)CO2 emissions per capita (metric tons)CO2 emissions growth (%, 1990–2006)Particulate matter (urban-pop.-weighted avg., μg/cu. m)Transport sector energy use per capita (kg of oil equivalent) Water and sanitationInternal freshwater resources per capita (cu. m)Freshwater withdrawal
Total (% of internal resources)Agriculture (% of total freshwater withdrawal)
Access to improved water source (% of total population)Rural (% of rural population)Urban (% of urban population)
Access to improved sanitation (% of total population)Rural (% of rural population)Urban (% of urban population)
Environment and healthAcute resp. infection prevalence (% of children under five)Diarrhea prevalence (% of children under five)Under-five mortality rate (per 1,000 live births) National accounting aggregatesGross savings (% of GNI)Consumption of fixed capital (% of GNI)Education expenditure (% of GNI)Energy depletion (% of GNI)Mineral depletion (% of GNI)Net forest depletion (% of GNI)CO2 damage (% of GNI)Particulate emissions damage (% of GNI)Adjusted net savings (% of GNI)
153The Little Green Data Book 2010
400 963 52317 29 29
6.0 2.7 3.52.3 1.7 2.2
29 55 38237 496 318117 120 125999 628 666
24.6 16.7 24.71.8 –0.1 0.7
16.6 5.5 11.93232
07
2.1
2.9 5.0 3.2338 484 42386.7 29.3 49.3
80 482 3240.4 78.6 41.6
99.6 17.0 41.9
0.1 0.5 0.40.1 1.1 0.5
411.0 118.9 –6.034 78 6510 37 37
7,007 1,194 5,004
5.1 51.7 9.496 90 8889 87 6788 84 6094 94 8627 33 3824 23 3345 57 52
23.027.5
51 76 118
37.5 35.3 25.97.1 8.4 7.93.4 3.0 3.40.0 4.6 7.80.0 1.1 1.03.1 0.8 1.00.2 1.0 0.70.0 0.5 0.3
30.5 21.8 10.7
Country data
South Asia
group
Low-income group
Population (millions) 29 Land area (1,000 sq. km) 143 GDP ($ billions) 12.6
Nepal

GNI per capita, World Bank Atlas method ($)Urban population (% of total)Urban population growth (average annual %, 1990–2008)Population growth (average annual %, 1990–2008) AgricultureAgricultural land (% of land area)Agricultural productivity (value added per worker, 2000 $)Food production index (1999–2001 = 100)Population density, rural (people/sq. km of arable land) Forests and biodiversityForest area (% of land area)Deforestation (average annual %, 1990–2007)Nationally protected area (% of land area)Threatened species, mammalsThreatened species, birdsThreatened species, fishThreatened species, higher plantsGEF benefits index for biodiversity (0–100, median is 1.5) EnergyGDP per unit of energy use (2005 PPP $/kg oil equivalent)Energy use per capita (kg oil equivalent)Energy from biomass products and waste (% of total)Electric power consumption per capita (kWh)Electricity generated using fossil fuel (% of total)Electricity generated by hydropower (% of total) Emissions and pollutionCO2 emissions per unit of GDP (kg/2005 PPP $)CO2 emissions per capita (metric tons)CO2 emissions growth (%, 1990–2006)Particulate matter (urban-pop.-weighted avg., μg/cu. m)Transport sector energy use per capita (kg of oil equivalent) Water and sanitationInternal freshwater resources per capita (cu. m)Freshwater withdrawal
Total (% of internal resources)Agriculture (% of total freshwater withdrawal)
Access to improved water source (% of total population)Rural (% of rural population)Urban (% of urban population)
Access to improved sanitation (% of total population)Rural (% of rural population)Urban (% of urban population)
Environment and healthAcute resp. infection prevalence (% of children under five)Diarrhea prevalence (% of children under five)Under-five mortality rate (per 1,000 live births) National accounting aggregatesGross savings (% of GNI)Consumption of fixed capital (% of GNI)Education expenditure (% of GNI)Energy depletion (% of GNI)Mineral depletion (% of GNI)Net forest depletion (% of GNI)CO2 damage (% of GNI)Particulate emissions damage (% of GNI)Adjusted net savings (% of GNI)
154 2010 The Little Green Data Book
49,340 39,68882 781.5 1.00.5 0.7
57 3840,506 28,475
92 101290 341
10.9 28.9–0.4 –0.119.8 19.1
42
110
0.2
7.6 6.54,909 5,321
3.5 3.77,097 9,75386.9 63.1
0.1 11.1
0.3 0.410.3 12.7
0.7 18.034 26
739 1,166
671 9,305
72.2 10.434 43
100 100100 98100 100100 100100 99100 100
..
..5 7
10.3 18.513.9 13.8
4.8 4.62.0 2.00.0 0.20.0 0.00.2 0.20.2 0.1
–1.2 6.8
Country data
High-income group
Population (millions) 16 Land area (1,000 sq. km) 34 GDP ($ billions) 871.0
Netherlands

GNI per capita, World Bank Atlas method ($)Urban population (% of total)Urban population growth (average annual %, 1990–2008)Population growth (average annual %, 1990–2008) AgricultureAgricultural land (% of land area)Agricultural productivity (value added per worker, 2000 $)Food production index (1999–2001 = 100)Population density, rural (people/sq. km of arable land) Forests and biodiversityForest area (% of land area)Deforestation (average annual %, 1990–2007)Nationally protected area (% of land area)Threatened species, mammalsThreatened species, birdsThreatened species, fishThreatened species, higher plantsGEF benefits index for biodiversity (0–100, median is 1.5) EnergyGDP per unit of energy use (2005 PPP $/kg oil equivalent)Energy use per capita (kg oil equivalent)Energy from biomass products and waste (% of total)Electric power consumption per capita (kWh)Electricity generated using fossil fuel (% of total)Electricity generated by hydropower (% of total) Emissions and pollutionCO2 emissions per unit of GDP (kg/2005 PPP $)CO2 emissions per capita (metric tons)CO2 emissions growth (%, 1990–2006)Particulate matter (urban-pop.-weighted avg., μg/cu. m)Transport sector energy use per capita (kg of oil equivalent) Water and sanitationInternal freshwater resources per capita (cu. m)Freshwater withdrawal
Total (% of internal resources)Agriculture (% of total freshwater withdrawal)
Access to improved water source (% of total population)Rural (% of rural population)Urban (% of urban population)
Access to improved sanitation (% of total population)Rural (% of rural population)Urban (% of urban population)
Environment and healthAcute resp. infection prevalence (% of children under five)Diarrhea prevalence (% of children under five)Under-five mortality rate (per 1,000 live births) National accounting aggregatesGross savings (% of GNI)Consumption of fixed capital (% of GNI)Education expenditure (% of GNI)Energy depletion (% of GNI)Mineral depletion (% of GNI)Net forest depletion (% of GNI)CO2 damage (% of GNI)Particulate emissions damage (% of GNI)Adjusted net savings (% of GNI)
155The Little Green Data Book 2010
.. 39,68893 780.6 1.00.1 0.7
10 38.. 28,475
115 101182 341
1.5 28.90.0 –0.17.9 19.1
41
152
0.2
.. 6.511,321 5,321
0.0 3.75,658 9,753100.0 63.1
0.0 11.1
.. 0.422.8 12.7
–30.6 18.030 26
2,202 1,166
.. 9,305
.. 10.4
.. 43
.. 100
.. 98
.. 100
.. 100
.. 99
.. 100
..
..
.. 7
.. 18.5
.. 13.8
.. 4.6
.. 2.0
.. 0.2
.. 0.0
.. 0.2
.. 0.1
.. 6.8
Population (thousands) 195 Land area (sq. km) 800 GDP ($ millions) ..
Country data
High-income group
Netherlands Antilles
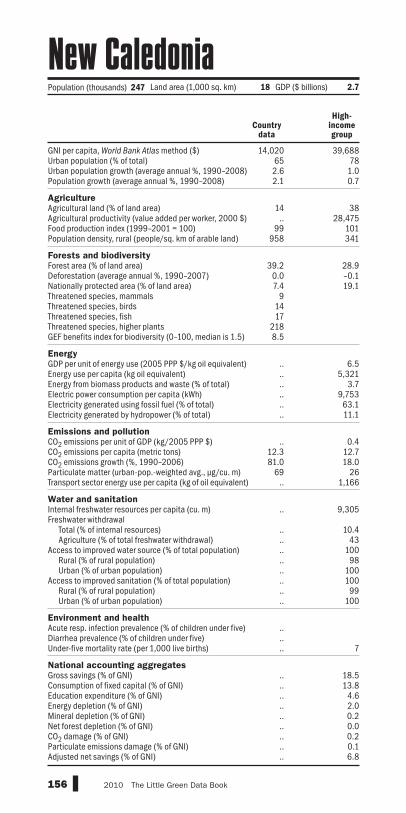
GNI per capita, World Bank Atlas method ($)Urban population (% of total)Urban population growth (average annual %, 1990–2008)Population growth (average annual %, 1990–2008) AgricultureAgricultural land (% of land area)Agricultural productivity (value added per worker, 2000 $)Food production index (1999–2001 = 100)Population density, rural (people/sq. km of arable land) Forests and biodiversityForest area (% of land area)Deforestation (average annual %, 1990–2007)Nationally protected area (% of land area)Threatened species, mammalsThreatened species, birdsThreatened species, fishThreatened species, higher plantsGEF benefits index for biodiversity (0–100, median is 1.5) EnergyGDP per unit of energy use (2005 PPP $/kg oil equivalent)Energy use per capita (kg oil equivalent)Energy from biomass products and waste (% of total)Electric power consumption per capita (kWh)Electricity generated using fossil fuel (% of total)Electricity generated by hydropower (% of total) Emissions and pollutionCO2 emissions per unit of GDP (kg/2005 PPP $)CO2 emissions per capita (metric tons)CO2 emissions growth (%, 1990–2006)Particulate matter (urban-pop.-weighted avg., μg/cu. m)Transport sector energy use per capita (kg of oil equivalent) Water and sanitationInternal freshwater resources per capita (cu. m)Freshwater withdrawal
Total (% of internal resources)Agriculture (% of total freshwater withdrawal)
Access to improved water source (% of total population)Rural (% of rural population)Urban (% of urban population)
Access to improved sanitation (% of total population)Rural (% of rural population)Urban (% of urban population)
Environment and healthAcute resp. infection prevalence (% of children under five)Diarrhea prevalence (% of children under five)Under-five mortality rate (per 1,000 live births) National accounting aggregatesGross savings (% of GNI)Consumption of fixed capital (% of GNI)Education expenditure (% of GNI)Energy depletion (% of GNI)Mineral depletion (% of GNI)Net forest depletion (% of GNI)CO2 damage (% of GNI)Particulate emissions damage (% of GNI)Adjusted net savings (% of GNI)
156 2010 The Little Green Data Book
14,020 39,68865 782.6 1.02.1 0.7
14 38.. 28,475
99 101958 341
39.2 28.90.0 –0.17.4 19.1
91417
2188.5
.. 6.5
.. 5,321
.. 3.7
.. 9,753
.. 63.1
.. 11.1
.. 0.412.3 12.781.0 18.0
69 26.. 1,166
.. 9,305
.. 10.4
.. 43
.. 100
.. 98
.. 100
.. 100
.. 99
.. 100
..
..
.. 7
.. 18.5
.. 13.8
.. 4.6
.. 2.0
.. 0.2
.. 0.0
.. 0.2
.. 0.1
.. 6.8
Population (thousands) 247 Land area (1,000 sq. km) 18 GDP ($ billions) 2.7
Country data
High-income group
New Caledonia

GNI per capita, World Bank Atlas method ($)Urban population (% of total)Urban population growth (average annual %, 1990–2008)Population growth (average annual %, 1990–2008) AgricultureAgricultural land (% of land area)Agricultural productivity (value added per worker, 2000 $)Food production index (1999–2001 = 100)Population density, rural (people/sq. km of arable land) Forests and biodiversityForest area (% of land area)Deforestation (average annual %, 1990–2007)Nationally protected area (% of land area)Threatened species, mammalsThreatened species, birdsThreatened species, fishThreatened species, higher plantsGEF benefits index for biodiversity (0–100, median is 1.5) EnergyGDP per unit of energy use (2005 PPP $/kg oil equivalent)Energy use per capita (kg oil equivalent)Energy from biomass products and waste (% of total)Electric power consumption per capita (kWh)Electricity generated using fossil fuel (% of total)Electricity generated by hydropower (% of total) Emissions and pollutionCO2 emissions per unit of GDP (kg/2005 PPP $)CO2 emissions per capita (metric tons)CO2 emissions growth (%, 1990–2006)Particulate matter (urban-pop.-weighted avg., μg/cu. m)Transport sector energy use per capita (kg of oil equivalent) Water and sanitationInternal freshwater resources per capita (cu. m)Freshwater withdrawal
Total (% of internal resources)Agriculture (% of total freshwater withdrawal)
Access to improved water source (% of total population)Rural (% of rural population)Urban (% of urban population)
Access to improved sanitation (% of total population)Rural (% of rural population)Urban (% of urban population)
Environment and healthAcute resp. infection prevalence (% of children under five)Diarrhea prevalence (% of children under five)Under-five mortality rate (per 1,000 live births) National accounting aggregatesGross savings (% of GNI)Consumption of fixed capital (% of GNI)Education expenditure (% of GNI)Energy depletion (% of GNI)Mineral depletion (% of GNI)Net forest depletion (% of GNI)CO2 damage (% of GNI)Particulate emissions damage (% of GNI)Adjusted net savings (% of GNI)
157The Little Green Data Book 2010
Population (millions) 4.3 Land area (1,000 sq. km) 268 GDP ($ billions) 129.9
Country data
High-income group
27,830 39,68887 78
1.3 1.01.2 0.7
46 3825,712 28,475
121 10166 341
31.2 28.9–0.5 –0.129.5 19.1
8691421
20.2
6.4 6.53,966 5,321
6.6 3.79,622 9,75334.5 63.153.6 11.1
0.3 0.47.3 12.7
34.1 18.014 26
1,174 1,166
77,336 9,305
0.6 10.442 43
.. 100
.. 98100 100
.. 100
.. 99
.. 100
..
..6 7
.. 18.514.5 13.86.6 4.62.3 2.00.2 0.20.0 0.00.2 0.20.0 0.1
.. 6.8
New Zealand

GNI per capita, World Bank Atlas method ($)Urban population (% of total)Urban population growth (average annual %, 1990–2008)Population growth (average annual %, 1990–2008) AgricultureAgricultural land (% of land area)Agricultural productivity (value added per worker, 2000 $)Food production index (1999–2001 = 100)Population density, rural (people/sq. km of arable land) Forests and biodiversityForest area (% of land area)Deforestation (average annual %, 1990–2007)Nationally protected area (% of land area)Threatened species, mammalsThreatened species, birdsThreatened species, fishThreatened species, higher plantsGEF benefits index for biodiversity (0–100, median is 1.5) EnergyGDP per unit of energy use (2005 PPP $/kg oil equivalent)Energy use per capita (kg oil equivalent)Energy from biomass products and waste (% of total)Electric power consumption per capita (kWh)Electricity generated using fossil fuel (% of total)Electricity generated by hydropower (% of total) Emissions and pollutionCO2 emissions per unit of GDP (kg/2005 PPP $)CO2 emissions per capita (metric tons)CO2 emissions growth (%, 1990–2006)Particulate matter (urban-pop.-weighted avg., μg/cu. m)Transport sector energy use per capita (kg of oil equivalent) Water and sanitationInternal freshwater resources per capita (cu. m)Freshwater withdrawal
Total (% of internal resources)Agriculture (% of total freshwater withdrawal)
Access to improved water source (% of total population)Rural (% of rural population)Urban (% of urban population)
Access to improved sanitation (% of total population)Rural (% of rural population)Urban (% of urban population)
Environment and healthAcute resp. infection prevalence (% of children under five)Diarrhea prevalence (% of children under five)Under-five mortality rate (per 1,000 live births) National accounting aggregatesGross savings (% of GNI)Consumption of fixed capital (% of GNI)Education expenditure (% of GNI)Energy depletion (% of GNI)Mineral depletion (% of GNI)Net forest depletion (% of GNI)CO2 damage (% of GNI)Particulate emissions damage (% of GNI)Adjusted net savings (% of GNI)
158 2010 The Little Green Data Book
1,080 6,768 2,07357 79 41
2.2 2.0 3.01.7 1.5 1.4
43 36 502,408 3,452 589
129 125 123125 233 516
41.5 44.9 24.81.6 0.5 0.2
16.9 22.8 11.259
2139
3.3
3.9 7.5 3.9621 1,273 1,01352.4 16.3 16.3446 1,866 1,31071.1 38.2 80.09.5 55.8 15.2
0.3 0.3 0.80.8 2.6 2.8
63.9 40.0 105.728 35 6997 317 97
33,912 24,004 3,154
0.7 2.0 8.783 71 8179 91 8663 73 8190 97 9448 78 5234 51 4157 86 69
31.014.0
27 23 64
.. 22.4 41.18.9 11.8 9.63.0 4.4 2.30.0 6.3 8.10.6 1.8 1.40.0 0.0 0.20.6 0.3 1.10.0 0.3 0.6
.. 6.3 22.4
Country data
Latin America & Caribbean
group
Lower middle-income group
Population (millions) 5.7 Land area (1,000 sq. km) 120 GDP ($ billions) 6.6
Nicaragua
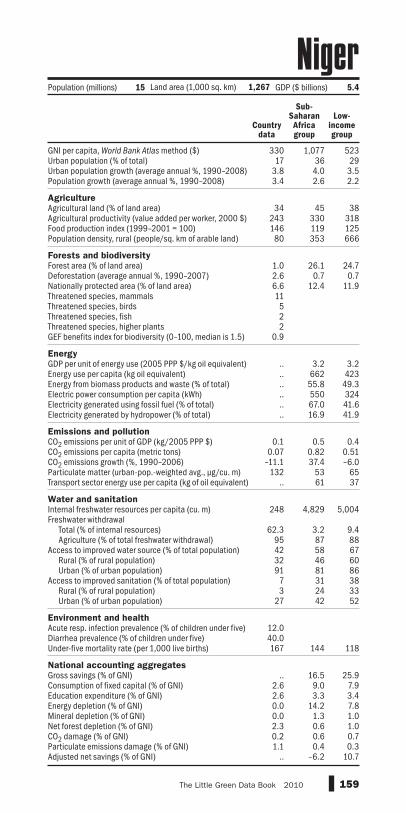
GNI per capita, World Bank Atlas method ($)Urban population (% of total)Urban population growth (average annual %, 1990–2008)Population growth (average annual %, 1990–2008) AgricultureAgricultural land (% of land area)Agricultural productivity (value added per worker, 2000 $)Food production index (1999–2001 = 100)Population density, rural (people/sq. km of arable land) Forests and biodiversityForest area (% of land area)Deforestation (average annual %, 1990–2007)Nationally protected area (% of land area)Threatened species, mammalsThreatened species, birdsThreatened species, fishThreatened species, higher plantsGEF benefits index for biodiversity (0–100, median is 1.5) EnergyGDP per unit of energy use (2005 PPP $/kg oil equivalent)Energy use per capita (kg oil equivalent)Energy from biomass products and waste (% of total)Electric power consumption per capita (kWh)Electricity generated using fossil fuel (% of total)Electricity generated by hydropower (% of total) Emissions and pollutionCO2 emissions per unit of GDP (kg/2005 PPP $)CO2 emissions per capita (metric tons)CO2 emissions growth (%, 1990–2006)Particulate matter (urban-pop.-weighted avg., μg/cu. m)Transport sector energy use per capita (kg of oil equivalent) Water and sanitationInternal freshwater resources per capita (cu. m)Freshwater withdrawal
Total (% of internal resources)Agriculture (% of total freshwater withdrawal)
Access to improved water source (% of total population)Rural (% of rural population)Urban (% of urban population)
Access to improved sanitation (% of total population)Rural (% of rural population)Urban (% of urban population)
Environment and healthAcute resp. infection prevalence (% of children under five)Diarrhea prevalence (% of children under five)Under-five mortality rate (per 1,000 live births) National accounting aggregatesGross savings (% of GNI)Consumption of fixed capital (% of GNI)Education expenditure (% of GNI)Energy depletion (% of GNI)Mineral depletion (% of GNI)Net forest depletion (% of GNI)CO2 damage (% of GNI)Particulate emissions damage (% of GNI)Adjusted net savings (% of GNI)
159The Little Green Data Book 2010
330 1,077 52317 36 29
3.8 4.0 3.53.4 2.6 2.2
34 45 38243 330 318146 119 12580 353 666
1.0 26.1 24.72.6 0.7 0.76.6 12.4 11.911522
0.9
.. 3.2 3.2
.. 662 423
.. 55.8 49.3
.. 550 324
.. 67.0 41.6
.. 16.9 41.9
0.1 0.5 0.40.07 0.82 0.51
–11.1 37.4 –6.0132 53 65
.. 61 37
248 4,829 5,004
62.3 3.2 9.495 87 8842 58 6732 46 6091 81 867 31 383 24 33
27 42 52
12.040.0167 144 118
.. 16.5 25.92.6 9.0 7.92.6 3.3 3.40.0 14.2 7.80.0 1.3 1.02.3 0.6 1.00.2 0.6 0.71.1 0.4 0.3
.. –6.2 10.7
Country data
Sub-Saharan Africa group
Low-income group
Population (millions) 15 Land area (1,000 sq. km) 1,267 GDP ($ billions) 5.4
Niger

GNI per capita, World Bank Atlas method ($)Urban population (% of total)Urban population growth (average annual %, 1990–2008)Population growth (average annual %, 1990–2008) AgricultureAgricultural land (% of land area)Agricultural productivity (value added per worker, 2000 $)Food production index (1999–2001 = 100)Population density, rural (people/sq. km of arable land) Forests and biodiversityForest area (% of land area)Deforestation (average annual %, 1990–2007)Nationally protected area (% of land area)Threatened species, mammalsThreatened species, birdsThreatened species, fishThreatened species, higher plantsGEF benefits index for biodiversity (0–100, median is 1.5) EnergyGDP per unit of energy use (2005 PPP $/kg oil equivalent)Energy use per capita (kg oil equivalent)Energy from biomass products and waste (% of total)Electric power consumption per capita (kWh)Electricity generated using fossil fuel (% of total)Electricity generated by hydropower (% of total) Emissions and pollutionCO2 emissions per unit of GDP (kg/2005 PPP $)CO2 emissions per capita (metric tons)CO2 emissions growth (%, 1990–2006)Particulate matter (urban-pop.-weighted avg., μg/cu. m)Transport sector energy use per capita (kg of oil equivalent) Water and sanitationInternal freshwater resources per capita (cu. m)Freshwater withdrawal
Total (% of internal resources)Agriculture (% of total freshwater withdrawal)
Access to improved water source (% of total population)Rural (% of rural population)Urban (% of urban population)
Access to improved sanitation (% of total population)Rural (% of rural population)Urban (% of urban population)
Environment and healthAcute resp. infection prevalence (% of children under five)Diarrhea prevalence (% of children under five)Under-five mortality rate (per 1,000 live births) National accounting aggregatesGross savings (% of GNI)Consumption of fixed capital (% of GNI)Education expenditure (% of GNI)Energy depletion (% of GNI)Mineral depletion (% of GNI)Net forest depletion (% of GNI)CO2 damage (% of GNI)Particulate emissions damage (% of GNI)Adjusted net savings (% of GNI)
160 2010 The Little Green Data Book
1,170 1,077 2,07348 36 414.2 4.0 3.02.4 2.6 1.4
86 45 50.. 330 589
119 119 123212 353 516
11.3 26.1 24.83.0 0.7 0.2
16.0 12.4 11.2271221
1716.0
2.6 3.2 3.9722 662 1,013
80.2 55.8 16.3137 550 1,31072.1 67.0 80.027.9 16.9 15.2
0.4 0.5 0.80.7 0.8 2.8
114.4 37.4 105.745 53 6950 61 97
1,496 4,829 3,154
3.6 3.2 8.769 87 8147 58 8630 46 8165 81 9430 31 5225 24 4135 42 69
10.015.3186 144 64
.. 16.5 41.11.2 9.0 9.60.9 3.3 2.3
23.8 14.2 8.10.0 1.3 1.40.2 0.6 0.20.5 0.6 1.10.5 0.4 0.6
.. –6.2 22.4
Country data
Sub-Saharan Africa group
Lower middle-income group
Population (millions) 151 Land area (1,000 sq. km) 911 GDP ($ billions) 207.1
Nigeria

GNI per capita, World Bank Atlas method ($)Urban population (% of total)Urban population growth (average annual %, 1990–2008)Population growth (average annual %, 1990–2008) AgricultureAgricultural land (% of land area)Agricultural productivity (value added per worker, 2000 $)Food production index (1999–2001 = 100)Population density, rural (people/sq. km of arable land) Forests and biodiversityForest area (% of land area)Deforestation (average annual %, 1990–2007)Nationally protected area (% of land area)Threatened species, mammalsThreatened species, birdsThreatened species, fishThreatened species, higher plantsGEF benefits index for biodiversity (0–100, median is 1.5) EnergyGDP per unit of energy use (2005 PPP $/kg oil equivalent)Energy use per capita (kg oil equivalent)Energy from biomass products and waste (% of total)Electric power consumption per capita (kWh)Electricity generated using fossil fuel (% of total)Electricity generated by hydropower (% of total) Emissions and pollutionCO2 emissions per unit of GDP (kg/2005 PPP $)CO2 emissions per capita (metric tons)CO2 emissions growth (%, 1990–2006)Particulate matter (urban-pop.-weighted avg., μg/cu. m)Transport sector energy use per capita (kg of oil equivalent) Water and sanitationInternal freshwater resources per capita (cu. m)Freshwater withdrawal
Total (% of internal resources)Agriculture (% of total freshwater withdrawal)
Access to improved water source (% of total population)Rural (% of rural population)Urban (% of urban population)
Access to improved sanitation (% of total population)Rural (% of rural population)Urban (% of urban population)
Environment and healthAcute resp. infection prevalence (% of children under five)Diarrhea prevalence (% of children under five)Under-five mortality rate (per 1,000 live births) National accounting aggregatesGross savings (% of GNI)Consumption of fixed capital (% of GNI)Education expenditure (% of GNI)Energy depletion (% of GNI)Mineral depletion (% of GNI)Net forest depletion (% of GNI)CO2 damage (% of GNI)Particulate emissions damage (% of GNI)Adjusted net savings (% of GNI)
161The Little Green Data Book 2010
.. 39,68891 78
3.8 1.03.7 0.7
7 38.. 28,475.. 101
754 341
72.2 28.90.2 –0.14.4 19.1
51495
2.2
.. 6.5
.. 5,321
.. 3.7
.. 9,753
.. 63.1
.. 11.1
.. 0.4
.. 12.7
.. 18.0
.. 26
.. 1,166
.. 9,305
.. 10.4
.. 4398 10097 9898 10094 10096 9994 100
..
..
.. 7
.. 18.5
.. 13.8
.. 4.6
.. 2.0
.. 0.2
.. 0.0
.. 0.2
.. 0.1
.. 6.8
Population (thousands) 85 Land area (sq. km) 180 GDP ($ millions) ..
Country data
High-income group
Northern Mariana Islands

GNI per capita, World Bank Atlas method ($)Urban population (% of total)Urban population growth (average annual %, 1990–2008)Population growth (average annual %, 1990–2008) AgricultureAgricultural land (% of land area)Agricultural productivity (value added per worker, 2000 $)Food production index (1999–2001 = 100)Population density, rural (people/sq. km of arable land) Forests and biodiversityForest area (% of land area)Deforestation (average annual %, 1990–2007)Nationally protected area (% of land area)Threatened species, mammalsThreatened species, birdsThreatened species, fishThreatened species, higher plantsGEF benefits index for biodiversity (0–100, median is 1.5) EnergyGDP per unit of energy use (2005 PPP $/kg oil equivalent)Energy use per capita (kg oil equivalent)Energy from biomass products and waste (% of total)Electric power consumption per capita (kWh)Electricity generated using fossil fuel (% of total)Electricity generated by hydropower (% of total) Emissions and pollutionCO2 emissions per unit of GDP (kg/2005 PPP $)CO2 emissions per capita (metric tons)CO2 emissions growth (%, 1990–2006)Particulate matter (urban-pop.-weighted avg., μg/cu. m)Transport sector energy use per capita (kg of oil equivalent) Water and sanitationInternal freshwater resources per capita (cu. m)Freshwater withdrawal
Total (% of internal resources)Agriculture (% of total freshwater withdrawal)
Access to improved water source (% of total population)Rural (% of rural population)Urban (% of urban population)
Access to improved sanitation (% of total population)Rural (% of rural population)Urban (% of urban population)
Environment and healthAcute resp. infection prevalence (% of children under five)Diarrhea prevalence (% of children under five)Under-five mortality rate (per 1,000 live births) National accounting aggregatesGross savings (% of GNI)Consumption of fixed capital (% of GNI)Education expenditure (% of GNI)Energy depletion (% of GNI)Mineral depletion (% of GNI)Net forest depletion (% of GNI)CO2 damage (% of GNI)Particulate emissions damage (% of GNI)Adjusted net savings (% of GNI)
162 2010 The Little Green Data Book
87,340 39,68877 781.1 1.00.7 0.7
3 3841,269 28,475
98 101125 341
31.0 28.9–0.2 –0.15.2 19.1
72
142
1.3
8.6 6.55,704 5,321
5.1 3.724,980 9,753
0.7 63.198.2 11.1
0.2 0.48.6 12.7
28.4 18.015 26
1,068 1,166
81,119 9,305
0.6 10.411 43
100 100100 98100 100
.. 100
.. 99
.. 100
..
..4 7
41.2 18.515.0 13.86.0 4.6
15.9 2.00.0 0.20.0 0.00.1 0.20.0 0.1
16.2 6.8
Country data
High-income group
Population (millions) 4.8 Land area (1,000 sq. km) 304 GDP ($ billions) 451.8
Norway
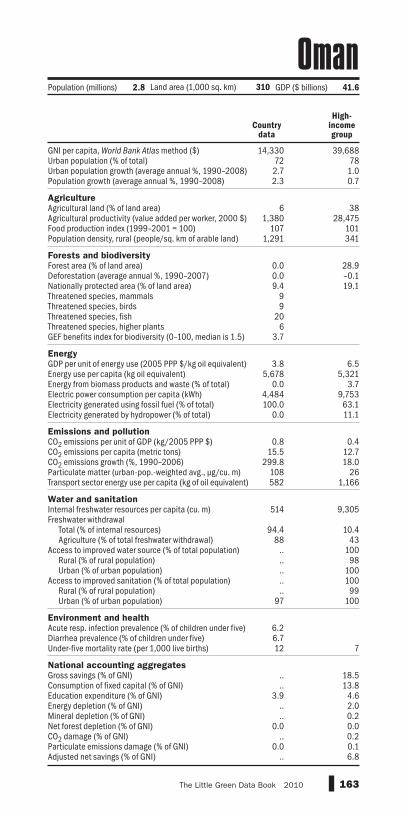
GNI per capita, World Bank Atlas method ($)Urban population (% of total)Urban population growth (average annual %, 1990–2008)Population growth (average annual %, 1990–2008) AgricultureAgricultural land (% of land area)Agricultural productivity (value added per worker, 2000 $)Food production index (1999–2001 = 100)Population density, rural (people/sq. km of arable land) Forests and biodiversityForest area (% of land area)Deforestation (average annual %, 1990–2007)Nationally protected area (% of land area)Threatened species, mammalsThreatened species, birdsThreatened species, fishThreatened species, higher plantsGEF benefits index for biodiversity (0–100, median is 1.5) EnergyGDP per unit of energy use (2005 PPP $/kg oil equivalent)Energy use per capita (kg oil equivalent)Energy from biomass products and waste (% of total)Electric power consumption per capita (kWh)Electricity generated using fossil fuel (% of total)Electricity generated by hydropower (% of total) Emissions and pollutionCO2 emissions per unit of GDP (kg/2005 PPP $)CO2 emissions per capita (metric tons)CO2 emissions growth (%, 1990–2006)Particulate matter (urban-pop.-weighted avg., μg/cu. m)Transport sector energy use per capita (kg of oil equivalent) Water and sanitationInternal freshwater resources per capita (cu. m)Freshwater withdrawal
Total (% of internal resources)Agriculture (% of total freshwater withdrawal)
Access to improved water source (% of total population)Rural (% of rural population)Urban (% of urban population)
Access to improved sanitation (% of total population)Rural (% of rural population)Urban (% of urban population)
Environment and healthAcute resp. infection prevalence (% of children under five)Diarrhea prevalence (% of children under five)Under-five mortality rate (per 1,000 live births) National accounting aggregatesGross savings (% of GNI)Consumption of fixed capital (% of GNI)Education expenditure (% of GNI)Energy depletion (% of GNI)Mineral depletion (% of GNI)Net forest depletion (% of GNI)CO2 damage (% of GNI)Particulate emissions damage (% of GNI)Adjusted net savings (% of GNI)
163The Little Green Data Book 2010
14,330 39,68872 782.7 1.02.3 0.7
6 381,380 28,475
107 1011,291 341
0.0 28.90.0 –0.19.4 19.1
99
206
3.7
3.8 6.55,678 5,321
0.0 3.74,484 9,753100.0 63.1
0.0 11.1
0.8 0.415.5 12.7
299.8 18.0108 26582 1,166
514 9,305
94.4 10.488 43
.. 100
.. 98
.. 100
.. 100
.. 9997 100
6.26.712 7
.. 18.5
.. 13.83.9 4.6
.. 2.0
.. 0.20.0 0.0
.. 0.20.0 0.1
.. 6.8
Country data
High-income group
Population (millions) 2.8 Land area (1,000 sq. km) 310 GDP ($ billions) 41.6
Oman

GNI per capita, World Bank Atlas method ($)Urban population (% of total)Urban population growth (average annual %, 1990–2008)Population growth (average annual %, 1990–2008) AgricultureAgricultural land (% of land area)Agricultural productivity (value added per worker, 2000 $)Food production index (1999–2001 = 100)Population density, rural (people/sq. km of arable land) Forests and biodiversityForest area (% of land area)Deforestation (average annual %, 1990–2007)Nationally protected area (% of land area)Threatened species, mammalsThreatened species, birdsThreatened species, fishThreatened species, higher plantsGEF benefits index for biodiversity (0–100, median is 1.5) EnergyGDP per unit of energy use (2005 PPP $/kg oil equivalent)Energy use per capita (kg oil equivalent)Energy from biomass products and waste (% of total)Electric power consumption per capita (kWh)Electricity generated using fossil fuel (% of total)Electricity generated by hydropower (% of total) Emissions and pollutionCO2 emissions per unit of GDP (kg/2005 PPP $)CO2 emissions per capita (metric tons)CO2 emissions growth (%, 1990–2006)Particulate matter (urban-pop.-weighted avg., μg/cu. m)Transport sector energy use per capita (kg of oil equivalent) Water and sanitationInternal freshwater resources per capita (cu. m)Freshwater withdrawal
Total (% of internal resources)Agriculture (% of total freshwater withdrawal)
Access to improved water source (% of total population)Rural (% of rural population)Urban (% of urban population)
Access to improved sanitation (% of total population)Rural (% of rural population)Urban (% of urban population)
Environment and healthAcute resp. infection prevalence (% of children under five)Diarrhea prevalence (% of children under five)Under-five mortality rate (per 1,000 live births) National accounting aggregatesGross savings (% of GNI)Consumption of fixed capital (% of GNI)Education expenditure (% of GNI)Energy depletion (% of GNI)Mineral depletion (% of GNI)Net forest depletion (% of GNI)CO2 damage (% of GNI)Particulate emissions damage (% of GNI)Adjusted net savings (% of GNI)
164 2010 The Little Green Data Book
950 963 2,07336 29 41
3.3 2.7 3.02.4 1.7 1.4
35 55 50908 496 589124 120 123486 628 516
2.4 16.7 24.81.9 –0.1 0.29.0 5.5 11.2232722
24.9
4.6 5.0 3.9512 484 1,013
33.9 29.3 16.3474 482 1,310
66.8 78.6 80.030.0 17.0 15.2
0.4 0.5 0.80.9 1.1 2.8
108.1 118.9 105.7120 78 6968 37 97
338 1,194 3,154
308.0 51.7 8.796 90 8190 87 8687 84 8195 94 9458 33 5240 23 4190 57 69
24.026.0
89 76 64
19.3 35.3 41.18.2 8.4 9.62.1 3.0 2.34.9 4.6 8.10.0 1.1 1.40.7 0.8 0.20.7 1.0 1.10.8 0.5 0.66.1 21.8 22.4
Country data
South Asia
group
Lower middle-income group
Population (millions) 166 Land area (1,000 sq. km) 771 GDP ($ billions) 164.5
Pakistan
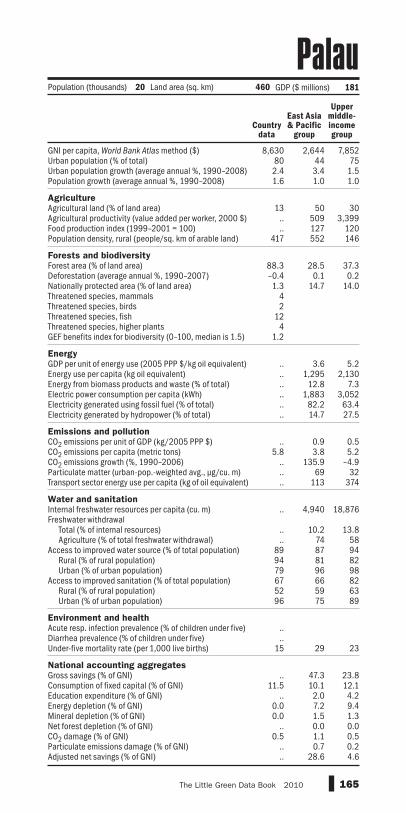
GNI per capita, World Bank Atlas method ($)Urban population (% of total)Urban population growth (average annual %, 1990–2008)Population growth (average annual %, 1990–2008) AgricultureAgricultural land (% of land area)Agricultural productivity (value added per worker, 2000 $)Food production index (1999–2001 = 100)Population density, rural (people/sq. km of arable land) Forests and biodiversityForest area (% of land area)Deforestation (average annual %, 1990–2007)Nationally protected area (% of land area)Threatened species, mammalsThreatened species, birdsThreatened species, fishThreatened species, higher plantsGEF benefits index for biodiversity (0–100, median is 1.5) EnergyGDP per unit of energy use (2005 PPP $/kg oil equivalent)Energy use per capita (kg oil equivalent)Energy from biomass products and waste (% of total)Electric power consumption per capita (kWh)Electricity generated using fossil fuel (% of total)Electricity generated by hydropower (% of total) Emissions and pollutionCO2 emissions per unit of GDP (kg/2005 PPP $)CO2 emissions per capita (metric tons)CO2 emissions growth (%, 1990–2006)Particulate matter (urban-pop.-weighted avg., μg/cu. m)Transport sector energy use per capita (kg of oil equivalent) Water and sanitationInternal freshwater resources per capita (cu. m)Freshwater withdrawal
Total (% of internal resources)Agriculture (% of total freshwater withdrawal)
Access to improved water source (% of total population)Rural (% of rural population)Urban (% of urban population)
Access to improved sanitation (% of total population)Rural (% of rural population)Urban (% of urban population)
Environment and healthAcute resp. infection prevalence (% of children under five)Diarrhea prevalence (% of children under five)Under-five mortality rate (per 1,000 live births) National accounting aggregatesGross savings (% of GNI)Consumption of fixed capital (% of GNI)Education expenditure (% of GNI)Energy depletion (% of GNI)Mineral depletion (% of GNI)Net forest depletion (% of GNI)CO2 damage (% of GNI)Particulate emissions damage (% of GNI)Adjusted net savings (% of GNI)
165The Little Green Data Book 2010
8,630 2,644 7,85280 44 752.4 3.4 1.51.6 1.0 1.0
13 50 30.. 509 3,399.. 127 120
417 552 146
88.3 28.5 37.3–0.4 0.1 0.21.3 14.7 14.0
42
124
1.2
.. 3.6 5.2
.. 1,295 2,130
.. 12.8 7.3
.. 1,883 3,052
.. 82.2 63.4
.. 14.7 27.5
.. 0.9 0.55.8 3.8 5.2
.. 135.9 –4.9
.. 69 32
.. 113 374
.. 4,940 18,876
.. 10.2 13.8
.. 74 5889 87 9494 81 8279 96 9867 66 8252 59 6396 75 89
..
..15 29 23
.. 47.3 23.811.5 10.1 12.1
.. 2.0 4.20.0 7.2 9.40.0 1.5 1.3
.. 0.0 0.00.5 1.1 0.5
.. 0.7 0.2
.. 28.6 4.6
Country data
East Asia & Pacific
group
Upper middle-income group
Population (thousands) 20 Land area (sq. km) 460 GDP ($ millions) 181
Palau

GNI per capita, World Bank Atlas method ($)Urban population (% of total)Urban population growth (average annual %, 1990–2008)Population growth (average annual %, 1990–2008) AgricultureAgricultural land (% of land area)Agricultural productivity (value added per worker, 2000 $)Food production index (1999–2001 = 100)Population density, rural (people/sq. km of arable land) Forests and biodiversityForest area (% of land area)Deforestation (average annual %, 1990–2007)Nationally protected area (% of land area)Threatened species, mammalsThreatened species, birdsThreatened species, fishThreatened species, higher plantsGEF benefits index for biodiversity (0–100, median is 1.5) EnergyGDP per unit of energy use (2005 PPP $/kg oil equivalent)Energy use per capita (kg oil equivalent)Energy from biomass products and waste (% of total)Electric power consumption per capita (kWh)Electricity generated using fossil fuel (% of total)Electricity generated by hydropower (% of total) Emissions and pollutionCO2 emissions per unit of GDP (kg/2005 PPP $)CO2 emissions per capita (metric tons)CO2 emissions growth (%, 1990–2006)Particulate matter (urban-pop.-weighted avg., μg/cu. m)Transport sector energy use per capita (kg of oil equivalent) Water and sanitationInternal freshwater resources per capita (cu. m)Freshwater withdrawal
Total (% of internal resources)Agriculture (% of total freshwater withdrawal)
Access to improved water source (% of total population)Rural (% of rural population)Urban (% of urban population)
Access to improved sanitation (% of total population)Rural (% of rural population)Urban (% of urban population)
Environment and healthAcute resp. infection prevalence (% of children under five)Diarrhea prevalence (% of children under five)Under-five mortality rate (per 1,000 live births) National accounting aggregatesGross savings (% of GNI)Consumption of fixed capital (% of GNI)Education expenditure (% of GNI)Energy depletion (% of GNI)Mineral depletion (% of GNI)Net forest depletion (% of GNI)CO2 damage (% of GNI)Particulate emissions damage (% of GNI)Adjusted net savings (% of GNI)
166 2010 The Little Green Data Book
6,690 6,768 7,85273 79 753.6 2.0 1.51.9 1.5 1.0
30 36 304,142 3,452 3,399
110 125 120168 233 146
57.7 44.9 37.30.1 0.5 0.2
28.1 22.8 14.0141719
19410.9
12.7 7.5 5.2845 1,273 2,13013.5 16.3 7.3
1,592 1,866 3,05243.1 38.2 63.456.6 55.8 27.5
0.2 0.3 0.52.0 2.6 5.2
105.0 40.0 –4.935 35 32
293 317 374
44,094 24,004 18,876
0.6 2.0 13.828 71 5892 91 9481 73 8296 97 9874 78 8263 51 6378 86 89
..12.6
23 23 23
25.9 22.4 23.811.1 11.8 12.14.4 4.4 4.20.0 6.3 9.40.0 1.8 1.30.0 0.0 0.00.3 0.3 0.50.1 0.3 0.2
18.8 6.3 4.6
Country data
Latin America & Caribbean
group
Upper middle-income group
Population (millions) 3.4 Land area (1,000 sq. km) 74 GDP ($ billions) 23.1
Panama

GNI per capita, World Bank Atlas method ($)Urban population (% of total)Urban population growth (average annual %, 1990–2008)Population growth (average annual %, 1990–2008) AgricultureAgricultural land (% of land area)Agricultural productivity (value added per worker, 2000 $)Food production index (1999–2001 = 100)Population density, rural (people/sq. km of arable land) Forests and biodiversityForest area (% of land area)Deforestation (average annual %, 1990–2007)Nationally protected area (% of land area)Threatened species, mammalsThreatened species, birdsThreatened species, fishThreatened species, higher plantsGEF benefits index for biodiversity (0–100, median is 1.5) EnergyGDP per unit of energy use (2005 PPP $/kg oil equivalent)Energy use per capita (kg oil equivalent)Energy from biomass products and waste (% of total)Electric power consumption per capita (kWh)Electricity generated using fossil fuel (% of total)Electricity generated by hydropower (% of total) Emissions and pollutionCO2 emissions per unit of GDP (kg/2005 PPP $)CO2 emissions per capita (metric tons)CO2 emissions growth (%, 1990–2006)Particulate matter (urban-pop.-weighted avg., μg/cu. m)Transport sector energy use per capita (kg of oil equivalent) Water and sanitationInternal freshwater resources per capita (cu. m)Freshwater withdrawal
Total (% of internal resources)Agriculture (% of total freshwater withdrawal)
Access to improved water source (% of total population)Rural (% of rural population)Urban (% of urban population)
Access to improved sanitation (% of total population)Rural (% of rural population)Urban (% of urban population)
Environment and healthAcute resp. infection prevalence (% of children under five)Diarrhea prevalence (% of children under five)Under-five mortality rate (per 1,000 live births) National accounting aggregatesGross savings (% of GNI)Consumption of fixed capital (% of GNI)Education expenditure (% of GNI)Energy depletion (% of GNI)Mineral depletion (% of GNI)Net forest depletion (% of GNI)CO2 damage (% of GNI)Particulate emissions damage (% of GNI)Adjusted net savings (% of GNI)
167The Little Green Data Book 2010
1,040 2,644 2,07313 44 411.6 3.4 3.02.6 1.0 1.4
2 50 50647 509 589111 127 123
2,246 552 516
64.4 28.5 24.80.5 0.1 0.29.7 14.7 11.2413638
14225.4
.. 3.6 3.9
.. 1,295 1,013
.. 12.8 16.3
.. 1,883 1,310
.. 82.2 80.0
.. 14.7 15.2
0.4 0.9 0.80.7 3.8 2.8
115.8 135.9 105.721 69 69
.. 113 97
124,716 4,940 3,154
0.0 10.2 8.71 74 81
40 87 8632 81 8188 96 9445 66 5241 59 4167 75 69
13.016.5
69 29 64
30.8 47.3 41.19.4 10.1 9.66.3 2.0 2.30.0 7.2 8.1
24.1 1.5 1.40.0 0.0 0.20.5 1.1 1.10.0 0.7 0.63.1 28.6 22.4
Country data
East Asia & Pacific
group
Lower middle-income group
Population (millions) 6.6 Land area (1,000 sq. km) 453 GDP ($ billions) 8.2
Papua New Guinea
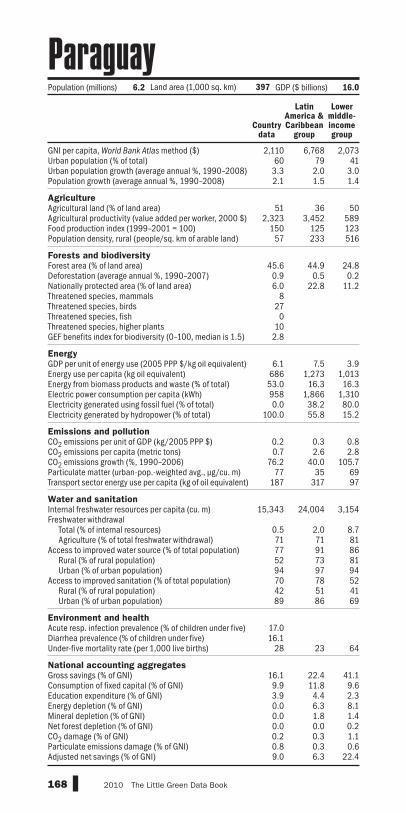
GNI per capita, World Bank Atlas method ($)Urban population (% of total)Urban population growth (average annual %, 1990–2008)Population growth (average annual %, 1990–2008) AgricultureAgricultural land (% of land area)Agricultural productivity (value added per worker, 2000 $)Food production index (1999–2001 = 100)Population density, rural (people/sq. km of arable land) Forests and biodiversityForest area (% of land area)Deforestation (average annual %, 1990–2007)Nationally protected area (% of land area)Threatened species, mammalsThreatened species, birdsThreatened species, fishThreatened species, higher plantsGEF benefits index for biodiversity (0–100, median is 1.5) EnergyGDP per unit of energy use (2005 PPP $/kg oil equivalent)Energy use per capita (kg oil equivalent)Energy from biomass products and waste (% of total)Electric power consumption per capita (kWh)Electricity generated using fossil fuel (% of total)Electricity generated by hydropower (% of total) Emissions and pollutionCO2 emissions per unit of GDP (kg/2005 PPP $)CO2 emissions per capita (metric tons)CO2 emissions growth (%, 1990–2006)Particulate matter (urban-pop.-weighted avg., μg/cu. m)Transport sector energy use per capita (kg of oil equivalent) Water and sanitationInternal freshwater resources per capita (cu. m)Freshwater withdrawal
Total (% of internal resources)Agriculture (% of total freshwater withdrawal)
Access to improved water source (% of total population)Rural (% of rural population)Urban (% of urban population)
Access to improved sanitation (% of total population)Rural (% of rural population)Urban (% of urban population)
Environment and healthAcute resp. infection prevalence (% of children under five)Diarrhea prevalence (% of children under five)Under-five mortality rate (per 1,000 live births) National accounting aggregatesGross savings (% of GNI)Consumption of fixed capital (% of GNI)Education expenditure (% of GNI)Energy depletion (% of GNI)Mineral depletion (% of GNI)Net forest depletion (% of GNI)CO2 damage (% of GNI)Particulate emissions damage (% of GNI)Adjusted net savings (% of GNI)
168 2010 The Little Green Data Book
2,110 6,768 2,07360 79 413.3 2.0 3.02.1 1.5 1.4
51 36 502,323 3,452 589
150 125 12357 233 516
45.6 44.9 24.80.9 0.5 0.26.0 22.8 11.2
8270
102.8
6.1 7.5 3.9686 1,273 1,01353.0 16.3 16.3958 1,866 1,3100.0 38.2 80.0
100.0 55.8 15.2
0.2 0.3 0.80.7 2.6 2.8
76.2 40.0 105.777 35 69
187 317 97
15,343 24,004 3,154
0.5 2.0 8.771 71 8177 91 8652 73 8194 97 9470 78 5242 51 4189 86 69
17.016.1
28 23 64
16.1 22.4 41.19.9 11.8 9.63.9 4.4 2.30.0 6.3 8.10.0 1.8 1.40.0 0.0 0.20.2 0.3 1.10.8 0.3 0.69.0 6.3 22.4
Country data
Latin America & Caribbean
group
Lower middle-income group
Population (millions) 6.2 Land area (1,000 sq. km) 397 GDP ($ billions) 16.0
Paraguay
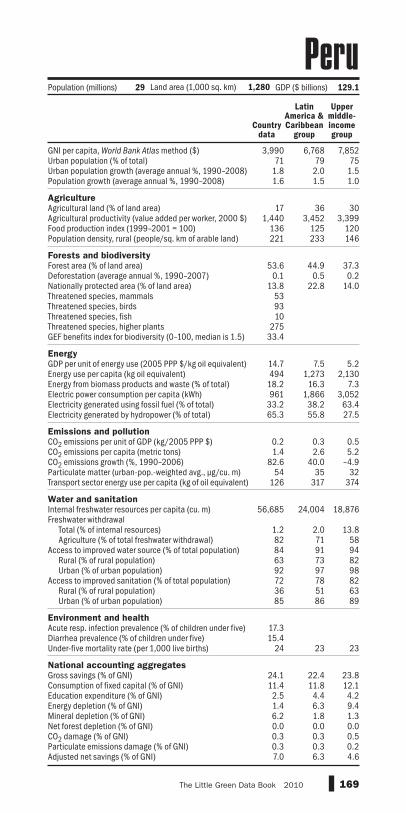
GNI per capita, World Bank Atlas method ($)Urban population (% of total)Urban population growth (average annual %, 1990–2008)Population growth (average annual %, 1990–2008) AgricultureAgricultural land (% of land area)Agricultural productivity (value added per worker, 2000 $)Food production index (1999–2001 = 100)Population density, rural (people/sq. km of arable land) Forests and biodiversityForest area (% of land area)Deforestation (average annual %, 1990–2007)Nationally protected area (% of land area)Threatened species, mammalsThreatened species, birdsThreatened species, fishThreatened species, higher plantsGEF benefits index for biodiversity (0–100, median is 1.5) EnergyGDP per unit of energy use (2005 PPP $/kg oil equivalent)Energy use per capita (kg oil equivalent)Energy from biomass products and waste (% of total)Electric power consumption per capita (kWh)Electricity generated using fossil fuel (% of total)Electricity generated by hydropower (% of total) Emissions and pollutionCO2 emissions per unit of GDP (kg/2005 PPP $)CO2 emissions per capita (metric tons)CO2 emissions growth (%, 1990–2006)Particulate matter (urban-pop.-weighted avg., μg/cu. m)Transport sector energy use per capita (kg of oil equivalent) Water and sanitationInternal freshwater resources per capita (cu. m)Freshwater withdrawal
Total (% of internal resources)Agriculture (% of total freshwater withdrawal)
Access to improved water source (% of total population)Rural (% of rural population)Urban (% of urban population)
Access to improved sanitation (% of total population)Rural (% of rural population)Urban (% of urban population)
Environment and healthAcute resp. infection prevalence (% of children under five)Diarrhea prevalence (% of children under five)Under-five mortality rate (per 1,000 live births) National accounting aggregatesGross savings (% of GNI)Consumption of fixed capital (% of GNI)Education expenditure (% of GNI)Energy depletion (% of GNI)Mineral depletion (% of GNI)Net forest depletion (% of GNI)CO2 damage (% of GNI)Particulate emissions damage (% of GNI)Adjusted net savings (% of GNI)
169The Little Green Data Book 2010
3,990 6,768 7,85271 79 75
1.8 2.0 1.51.6 1.5 1.0
17 36 301,440 3,452 3,399
136 125 120221 233 146
53.6 44.9 37.30.1 0.5 0.2
13.8 22.8 14.0539310
27533.4
14.7 7.5 5.2494 1,273 2,13018.2 16.3 7.3961 1,866 3,052
33.2 38.2 63.465.3 55.8 27.5
0.2 0.3 0.51.4 2.6 5.2
82.6 40.0 –4.954 35 32
126 317 374
56,685 24,004 18,876
1.2 2.0 13.882 71 5884 91 9463 73 8292 97 9872 78 8236 51 6385 86 89
17.315.4
24 23 23
24.1 22.4 23.811.4 11.8 12.12.5 4.4 4.21.4 6.3 9.46.2 1.8 1.30.0 0.0 0.00.3 0.3 0.50.3 0.3 0.27.0 6.3 4.6
Country data
Latin America & Caribbean
group
Upper middle-income group
Population (millions) 29 Land area (1,000 sq. km) 1,280 GDP ($ billions) 129.1
Peru
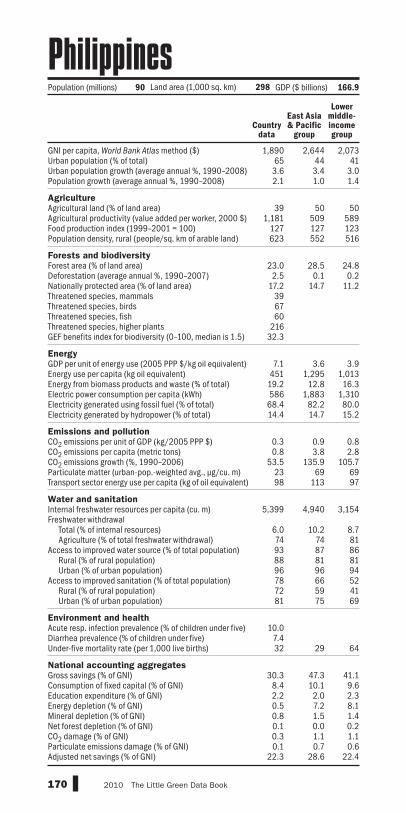
GNI per capita, World Bank Atlas method ($)Urban population (% of total)Urban population growth (average annual %, 1990–2008)Population growth (average annual %, 1990–2008) AgricultureAgricultural land (% of land area)Agricultural productivity (value added per worker, 2000 $)Food production index (1999–2001 = 100)Population density, rural (people/sq. km of arable land) Forests and biodiversityForest area (% of land area)Deforestation (average annual %, 1990–2007)Nationally protected area (% of land area)Threatened species, mammalsThreatened species, birdsThreatened species, fishThreatened species, higher plantsGEF benefits index for biodiversity (0–100, median is 1.5) EnergyGDP per unit of energy use (2005 PPP $/kg oil equivalent)Energy use per capita (kg oil equivalent)Energy from biomass products and waste (% of total)Electric power consumption per capita (kWh)Electricity generated using fossil fuel (% of total)Electricity generated by hydropower (% of total) Emissions and pollutionCO2 emissions per unit of GDP (kg/2005 PPP $)CO2 emissions per capita (metric tons)CO2 emissions growth (%, 1990–2006)Particulate matter (urban-pop.-weighted avg., μg/cu. m)Transport sector energy use per capita (kg of oil equivalent) Water and sanitationInternal freshwater resources per capita (cu. m)Freshwater withdrawal
Total (% of internal resources)Agriculture (% of total freshwater withdrawal)
Access to improved water source (% of total population)Rural (% of rural population)Urban (% of urban population)
Access to improved sanitation (% of total population)Rural (% of rural population)Urban (% of urban population)
Environment and healthAcute resp. infection prevalence (% of children under five)Diarrhea prevalence (% of children under five)Under-five mortality rate (per 1,000 live births) National accounting aggregatesGross savings (% of GNI)Consumption of fixed capital (% of GNI)Education expenditure (% of GNI)Energy depletion (% of GNI)Mineral depletion (% of GNI)Net forest depletion (% of GNI)CO2 damage (% of GNI)Particulate emissions damage (% of GNI)Adjusted net savings (% of GNI)
170 2010 The Little Green Data Book
1,890 2,644 2,07365 44 413.6 3.4 3.02.1 1.0 1.4
39 50 501,181 509 589
127 127 123623 552 516
23.0 28.5 24.82.5 0.1 0.2
17.2 14.7 11.2396760
21632.3
7.1 3.6 3.9451 1,295 1,013
19.2 12.8 16.3586 1,883 1,31068.4 82.2 80.014.4 14.7 15.2
0.3 0.9 0.80.8 3.8 2.8
53.5 135.9 105.723 69 6998 113 97
5,399 4,940 3,154
6.0 10.2 8.774 74 8193 87 8688 81 8196 96 9478 66 5272 59 4181 75 69
10.07.432 29 64
30.3 47.3 41.18.4 10.1 9.62.2 2.0 2.30.5 7.2 8.10.8 1.5 1.40.1 0.0 0.20.3 1.1 1.10.1 0.7 0.6
22.3 28.6 22.4
Population (millions) 90 Land area (1,000 sq. km) 298 GDP ($ billions) 166.9
Country data
East Asia & Pacific
group
Lower middle-income group
Philippines
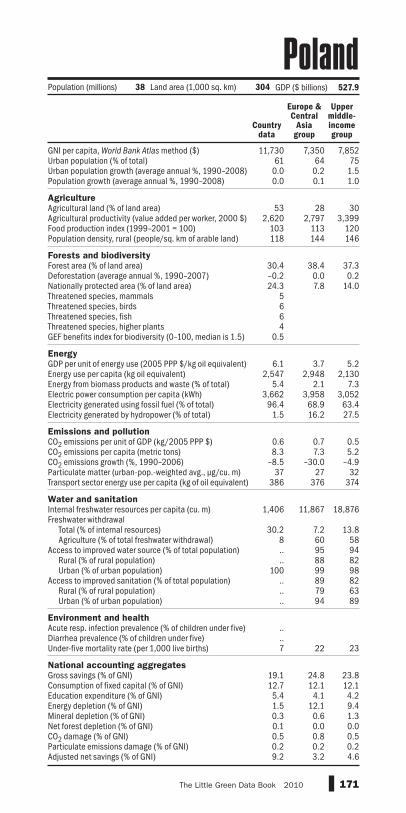
GNI per capita, World Bank Atlas method ($)Urban population (% of total)Urban population growth (average annual %, 1990–2008)Population growth (average annual %, 1990–2008) AgricultureAgricultural land (% of land area)Agricultural productivity (value added per worker, 2000 $)Food production index (1999–2001 = 100)Population density, rural (people/sq. km of arable land) Forests and biodiversityForest area (% of land area)Deforestation (average annual %, 1990–2007)Nationally protected area (% of land area)Threatened species, mammalsThreatened species, birdsThreatened species, fishThreatened species, higher plantsGEF benefits index for biodiversity (0–100, median is 1.5) EnergyGDP per unit of energy use (2005 PPP $/kg oil equivalent)Energy use per capita (kg oil equivalent)Energy from biomass products and waste (% of total)Electric power consumption per capita (kWh)Electricity generated using fossil fuel (% of total)Electricity generated by hydropower (% of total) Emissions and pollutionCO2 emissions per unit of GDP (kg/2005 PPP $)CO2 emissions per capita (metric tons)CO2 emissions growth (%, 1990–2006)Particulate matter (urban-pop.-weighted avg., μg/cu. m)Transport sector energy use per capita (kg of oil equivalent) Water and sanitationInternal freshwater resources per capita (cu. m)Freshwater withdrawal
Total (% of internal resources)Agriculture (% of total freshwater withdrawal)
Access to improved water source (% of total population)Rural (% of rural population)Urban (% of urban population)
Access to improved sanitation (% of total population)Rural (% of rural population)Urban (% of urban population)
Environment and healthAcute resp. infection prevalence (% of children under five)Diarrhea prevalence (% of children under five)Under-five mortality rate (per 1,000 live births) National accounting aggregatesGross savings (% of GNI)Consumption of fixed capital (% of GNI)Education expenditure (% of GNI)Energy depletion (% of GNI)Mineral depletion (% of GNI)Net forest depletion (% of GNI)CO2 damage (% of GNI)Particulate emissions damage (% of GNI)Adjusted net savings (% of GNI)
171The Little Green Data Book 2010
11,730 7,350 7,85261 64 75
0.0 0.2 1.50.0 0.1 1.0
53 28 302,620 2,797 3,399
103 113 120118 144 146
30.4 38.4 37.3–0.2 0.0 0.224.3 7.8 14.0
5664
0.5
6.1 3.7 5.22,547 2,948 2,130
5.4 2.1 7.33,662 3,958 3,052
96.4 68.9 63.41.5 16.2 27.5
0.6 0.7 0.58.3 7.3 5.2
–8.5 –30.0 –4.937 27 32
386 376 374
1,406 11,867 18,876
30.2 7.2 13.88 60 58.. 95 94.. 88 82
100 99 98.. 89 82.. 79 63.. 94 89
..
..7 22 23
19.1 24.8 23.812.7 12.1 12.15.4 4.1 4.21.5 12.1 9.40.3 0.6 1.30.1 0.0 0.00.5 0.8 0.50.2 0.2 0.29.2 3.2 4.6
Country data
Europe & Central
Asia group
Upper middle-income group
Population (millions) 38 Land area (1,000 sq. km) 304 GDP ($ billions) 527.9
Poland

GNI per capita, World Bank Atlas method ($)Urban population (% of total)Urban population growth (average annual %, 1990–2008)Population growth (average annual %, 1990–2008) AgricultureAgricultural land (% of land area)Agricultural productivity (value added per worker, 2000 $)Food production index (1999–2001 = 100)Population density, rural (people/sq. km of arable land) Forests and biodiversityForest area (% of land area)Deforestation (average annual %, 1990–2007)Nationally protected area (% of land area)Threatened species, mammalsThreatened species, birdsThreatened species, fishThreatened species, higher plantsGEF benefits index for biodiversity (0–100, median is 1.5) EnergyGDP per unit of energy use (2005 PPP $/kg oil equivalent)Energy use per capita (kg oil equivalent)Energy from biomass products and waste (% of total)Electric power consumption per capita (kWh)Electricity generated using fossil fuel (% of total)Electricity generated by hydropower (% of total) Emissions and pollutionCO2 emissions per unit of GDP (kg/2005 PPP $)CO2 emissions per capita (metric tons)CO2 emissions growth (%, 1990–2006)Particulate matter (urban-pop.-weighted avg., μg/cu. m)Transport sector energy use per capita (kg of oil equivalent) Water and sanitationInternal freshwater resources per capita (cu. m)Freshwater withdrawal
Total (% of internal resources)Agriculture (% of total freshwater withdrawal)
Access to improved water source (% of total population)Rural (% of rural population)Urban (% of urban population)
Access to improved sanitation (% of total population)Rural (% of rural population)Urban (% of urban population)
Environment and healthAcute resp. infection prevalence (% of children under five)Diarrhea prevalence (% of children under five)Under-five mortality rate (per 1,000 live births) National accounting aggregatesGross savings (% of GNI)Consumption of fixed capital (% of GNI)Education expenditure (% of GNI)Energy depletion (% of GNI)Mineral depletion (% of GNI)Net forest depletion (% of GNI)CO2 damage (% of GNI)Particulate emissions damage (% of GNI)Adjusted net savings (% of GNI)
172 2010 The Little Green Data Book
20,680 39,68859 781.6 1.00.4 0.7
38 386,188 28,475
96 101403 341
42.2 28.9–1.3 –0.16.6 19.1118
3816
5.5
9.0 6.52,363 5,321
12.6 3.74,860 9,753
64.8 63.121.5 11.1
0.3 0.45.7 12.7
35.2 18.023 26
600 1,166
3,582 9,305
29.6 10.478 4399 100
100 9899 10099 10098 9999 100
..
..4 7
12.6 18.513.6 13.85.3 4.60.0 2.00.1 0.20.0 0.00.2 0.20.0 0.14.1 6.8
Country data
High-income group
Population (millions) 11 Land area (1,000 sq. km) 92 GDP ($ billions) 243.5
Portugal
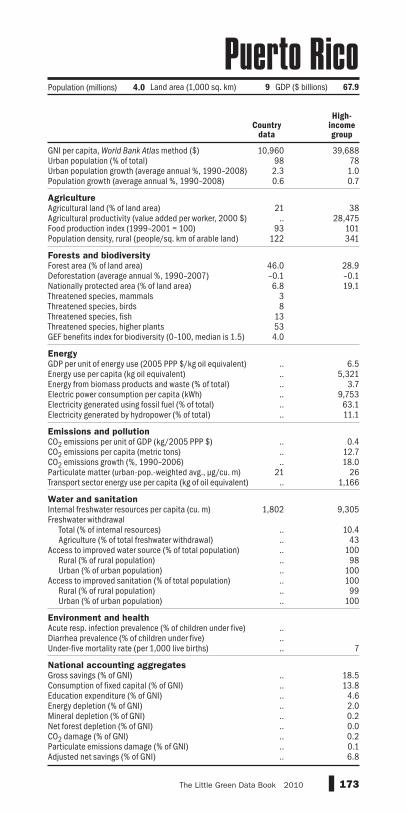
GNI per capita, World Bank Atlas method ($)Urban population (% of total)Urban population growth (average annual %, 1990–2008)Population growth (average annual %, 1990–2008) AgricultureAgricultural land (% of land area)Agricultural productivity (value added per worker, 2000 $)Food production index (1999–2001 = 100)Population density, rural (people/sq. km of arable land) Forests and biodiversityForest area (% of land area)Deforestation (average annual %, 1990–2007)Nationally protected area (% of land area)Threatened species, mammalsThreatened species, birdsThreatened species, fishThreatened species, higher plantsGEF benefits index for biodiversity (0–100, median is 1.5) EnergyGDP per unit of energy use (2005 PPP $/kg oil equivalent)Energy use per capita (kg oil equivalent)Energy from biomass products and waste (% of total)Electric power consumption per capita (kWh)Electricity generated using fossil fuel (% of total)Electricity generated by hydropower (% of total) Emissions and pollutionCO2 emissions per unit of GDP (kg/2005 PPP $)CO2 emissions per capita (metric tons)CO2 emissions growth (%, 1990–2006)Particulate matter (urban-pop.-weighted avg., μg/cu. m)Transport sector energy use per capita (kg of oil equivalent) Water and sanitationInternal freshwater resources per capita (cu. m)Freshwater withdrawal
Total (% of internal resources)Agriculture (% of total freshwater withdrawal)
Access to improved water source (% of total population)Rural (% of rural population)Urban (% of urban population)
Access to improved sanitation (% of total population)Rural (% of rural population)Urban (% of urban population)
Environment and healthAcute resp. infection prevalence (% of children under five)Diarrhea prevalence (% of children under five)Under-five mortality rate (per 1,000 live births) National accounting aggregatesGross savings (% of GNI)Consumption of fixed capital (% of GNI)Education expenditure (% of GNI)Energy depletion (% of GNI)Mineral depletion (% of GNI)Net forest depletion (% of GNI)CO2 damage (% of GNI)Particulate emissions damage (% of GNI)Adjusted net savings (% of GNI)
173The Little Green Data Book 2010
10,960 39,68898 782.3 1.00.6 0.7
21 38.. 28,475
93 101122 341
46.0 28.9–0.1 –0.16.8 19.1
38
13534.0
.. 6.5
.. 5,321
.. 3.7
.. 9,753
.. 63.1
.. 11.1
.. 0.4
.. 12.7
.. 18.021 26
.. 1,166
1,802 9,305
.. 10.4
.. 43
.. 100
.. 98
.. 100
.. 100
.. 99
.. 100
..
..
.. 7
.. 18.5
.. 13.8
.. 4.6
.. 2.0
.. 0.2
.. 0.0
.. 0.2
.. 0.1
.. 6.8
Population (millions) 4.0 Land area (1,000 sq. km) 9 GDP ($ billions) 67.9
Country data
High-income group
Puerto Rico

GNI per capita, World Bank Atlas method ($)Urban population (% of total)Urban population growth (average annual %, 1990–2008)Population growth (average annual %, 1990–2008) AgricultureAgricultural land (% of land area)Agricultural productivity (value added per worker, 2000 $)Food production index (1999–2001 = 100)Population density, rural (people/sq. km of arable land) Forests and biodiversityForest area (% of land area)Deforestation (average annual %, 1990–2007)Nationally protected area (% of land area)Threatened species, mammalsThreatened species, birdsThreatened species, fishThreatened species, higher plantsGEF benefits index for biodiversity (0–100, median is 1.5) EnergyGDP per unit of energy use (2005 PPP $/kg oil equivalent)Energy use per capita (kg oil equivalent)Energy from biomass products and waste (% of total)Electric power consumption per capita (kWh)Electricity generated using fossil fuel (% of total)Electricity generated by hydropower (% of total) Emissions and pollutionCO2 emissions per unit of GDP (kg/2005 PPP $)CO2 emissions per capita (metric tons)CO2 emissions growth (%, 1990–2006)Particulate matter (urban-pop.-weighted avg., μg/cu. m)Transport sector energy use per capita (kg of oil equivalent) Water and sanitationInternal freshwater resources per capita (cu. m)Freshwater withdrawal
Total (% of internal resources)Agriculture (% of total freshwater withdrawal)
Access to improved water source (% of total population)Rural (% of rural population)Urban (% of urban population)
Access to improved sanitation (% of total population)Rural (% of rural population)Urban (% of urban population)
Environment and healthAcute resp. infection prevalence (% of children under five)Diarrhea prevalence (% of children under five)Under-five mortality rate (per 1,000 live births) National accounting aggregatesGross savings (% of GNI)Consumption of fixed capital (% of GNI)Education expenditure (% of GNI)Energy depletion (% of GNI)Mineral depletion (% of GNI)Net forest depletion (% of GNI)CO2 damage (% of GNI)Particulate emissions damage (% of GNI)Adjusted net savings (% of GNI)
174 2010 The Little Green Data Book
.. 39,68896 78
5.8 1.05.6 0.7
6 38.. 28,475
77 101281 341
.. 28.9
.. –0.10.6 19.1
2470
0.1
3.4 6.519,504 5,321
0.0 3.712,915 9,753100.0 63.1
0.0 11.1
0.7 0.446.1 12.7
292.3 18.051 26
1,722 1,166
45 9,305
870.6 10.459 43
100 100100 98100 100100 100100 99100 100
7.88.810 7
.. 18.5
.. 13.8
.. 4.6
.. 2.0
.. 0.2
.. 0.0
.. 0.2
.. 0.1
.. 6.8
Country data
High-income group
Population (millions) 1.3 Land area (1,000 sq. km) 12 GDP ($ billions) 71.0
Qatar

GNI per capita, World Bank Atlas method ($)Urban population (% of total)Urban population growth (average annual %, 1990–2008)Population growth (average annual %, 1990–2008) AgricultureAgricultural land (% of land area)Agricultural productivity (value added per worker, 2000 $)Food production index (1999–2001 = 100)Population density, rural (people/sq. km of arable land) Forests and biodiversityForest area (% of land area)Deforestation (average annual %, 1990–2007)Nationally protected area (% of land area)Threatened species, mammalsThreatened species, birdsThreatened species, fishThreatened species, higher plantsGEF benefits index for biodiversity (0–100, median is 1.5) EnergyGDP per unit of energy use (2005 PPP $/kg oil equivalent)Energy use per capita (kg oil equivalent)Energy from biomass products and waste (% of total)Electric power consumption per capita (kWh)Electricity generated using fossil fuel (% of total)Electricity generated by hydropower (% of total) Emissions and pollutionCO2 emissions per unit of GDP (kg/2005 PPP $)CO2 emissions per capita (metric tons)CO2 emissions growth (%, 1990–2006)Particulate matter (urban-pop.-weighted avg., μg/cu. m)Transport sector energy use per capita (kg of oil equivalent) Water and sanitationInternal freshwater resources per capita (cu. m)Freshwater withdrawal
Total (% of internal resources)Agriculture (% of total freshwater withdrawal)
Access to improved water source (% of total population)Rural (% of rural population)Urban (% of urban population)
Access to improved sanitation (% of total population)Rural (% of rural population)Urban (% of urban population)
Environment and healthAcute resp. infection prevalence (% of children under five)Diarrhea prevalence (% of children under five)Under-five mortality rate (per 1,000 live births) National accounting aggregatesGross savings (% of GNI)Consumption of fixed capital (% of GNI)Education expenditure (% of GNI)Energy depletion (% of GNI)Mineral depletion (% of GNI)Net forest depletion (% of GNI)CO2 damage (% of GNI)Particulate emissions damage (% of GNI)Adjusted net savings (% of GNI)
175The Little Green Data Book 2010
8,280 7,350 7,85254 64 75
–0.3 0.2 1.5–0.4 0.1 1.0
59 28 306,952 2,797 3,399
91 113 120116 144 146
27.7 38.4 37.30.0 0.0 0.2
10.7 7.8 14.07
12161
0.7
5.6 3.7 5.21,806 2,948 2,130
8.9 2.1 7.32,452 3,958 3,052
61.6 68.9 63.425.9 16.2 27.5
0.5 0.7 0.54.6 7.3 5.2
–38.0 –30.0 –4.914 27 32
213 376 374
1,963 11,867 18,876
54.8 7.2 13.857 60 5888 95 9476 88 8299 99 9872 89 8254 79 6388 94 89
..
..14 22 23
25.0 24.8 23.811.7 12.1 12.13.4 4.1 4.22.4 12.1 9.40.1 0.6 1.30.0 0.0 0.00.4 0.8 0.50.0 0.2 0.2
13.7 3.2 4.6
Population (millions) 22 Land area (1,000 sq. km) 230 GDP ($ billions) 200.1
Country data
Europe & Central
Asia group
Upper middle-income group
Romania
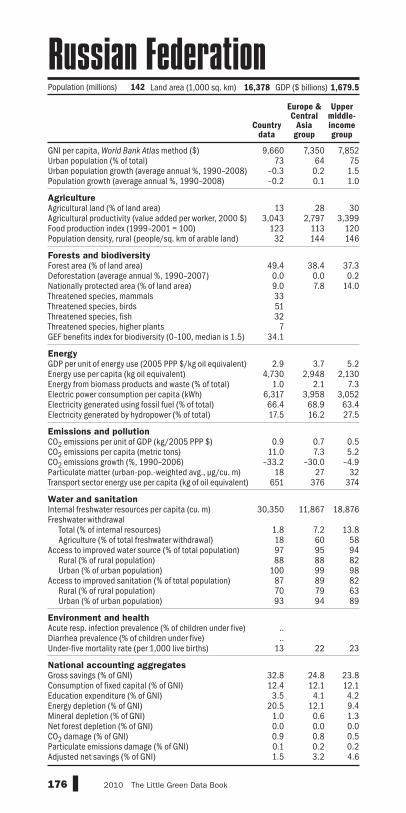
GNI per capita, World Bank Atlas method ($)Urban population (% of total)Urban population growth (average annual %, 1990–2008)Population growth (average annual %, 1990–2008) AgricultureAgricultural land (% of land area)Agricultural productivity (value added per worker, 2000 $)Food production index (1999–2001 = 100)Population density, rural (people/sq. km of arable land) Forests and biodiversityForest area (% of land area)Deforestation (average annual %, 1990–2007)Nationally protected area (% of land area)Threatened species, mammalsThreatened species, birdsThreatened species, fishThreatened species, higher plantsGEF benefits index for biodiversity (0–100, median is 1.5) EnergyGDP per unit of energy use (2005 PPP $/kg oil equivalent)Energy use per capita (kg oil equivalent)Energy from biomass products and waste (% of total)Electric power consumption per capita (kWh)Electricity generated using fossil fuel (% of total)Electricity generated by hydropower (% of total) Emissions and pollutionCO2 emissions per unit of GDP (kg/2005 PPP $)CO2 emissions per capita (metric tons)CO2 emissions growth (%, 1990–2006)Particulate matter (urban-pop.-weighted avg., μg/cu. m)Transport sector energy use per capita (kg of oil equivalent) Water and sanitationInternal freshwater resources per capita (cu. m)Freshwater withdrawal
Total (% of internal resources)Agriculture (% of total freshwater withdrawal)
Access to improved water source (% of total population)Rural (% of rural population)Urban (% of urban population)
Access to improved sanitation (% of total population)Rural (% of rural population)Urban (% of urban population)
Environment and healthAcute resp. infection prevalence (% of children under five)Diarrhea prevalence (% of children under five)Under-five mortality rate (per 1,000 live births) National accounting aggregatesGross savings (% of GNI)Consumption of fixed capital (% of GNI)Education expenditure (% of GNI)Energy depletion (% of GNI)Mineral depletion (% of GNI)Net forest depletion (% of GNI)CO2 damage (% of GNI)Particulate emissions damage (% of GNI)Adjusted net savings (% of GNI)
176 2010 The Little Green Data Book
9,660 7,350 7,85273 64 75
–0.3 0.2 1.5–0.2 0.1 1.0
13 28 303,043 2,797 3,399
123 113 12032 144 146
49.4 38.4 37.30.0 0.0 0.29.0 7.8 14.0335132
734.1
2.9 3.7 5.24,730 2,948 2,130
1.0 2.1 7.36,317 3,958 3,05266.4 68.9 63.417.5 16.2 27.5
0.9 0.7 0.511.0 7.3 5.2
–33.2 –30.0 –4.918 27 32
651 376 374
30,350 11,867 18,876
1.8 7.2 13.818 60 5897 95 9488 88 82
100 99 9887 89 8270 79 6393 94 89
..
..13 22 23
32.8 24.8 23.812.4 12.1 12.13.5 4.1 4.2
20.5 12.1 9.41.0 0.6 1.30.0 0.0 0.00.9 0.8 0.50.1 0.2 0.21.5 3.2 4.6
Country data
Europe & Central
Asia group
Upper middle-income group
Population (millions) 142 Land area (1,000 sq. km) 16,378 GDP ($ billions) 1,679.5
Russian Federation
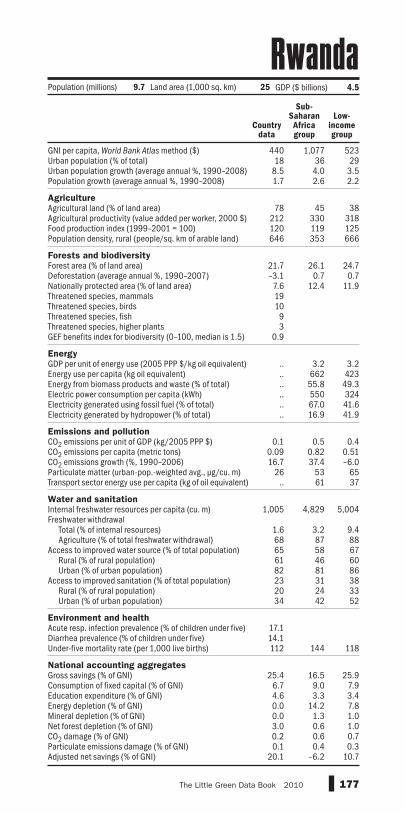
GNI per capita, World Bank Atlas method ($)Urban population (% of total)Urban population growth (average annual %, 1990–2008)Population growth (average annual %, 1990–2008) AgricultureAgricultural land (% of land area)Agricultural productivity (value added per worker, 2000 $)Food production index (1999–2001 = 100)Population density, rural (people/sq. km of arable land) Forests and biodiversityForest area (% of land area)Deforestation (average annual %, 1990–2007)Nationally protected area (% of land area)Threatened species, mammalsThreatened species, birdsThreatened species, fishThreatened species, higher plantsGEF benefits index for biodiversity (0–100, median is 1.5) EnergyGDP per unit of energy use (2005 PPP $/kg oil equivalent)Energy use per capita (kg oil equivalent)Energy from biomass products and waste (% of total)Electric power consumption per capita (kWh)Electricity generated using fossil fuel (% of total)Electricity generated by hydropower (% of total) Emissions and pollutionCO2 emissions per unit of GDP (kg/2005 PPP $)CO2 emissions per capita (metric tons)CO2 emissions growth (%, 1990–2006)Particulate matter (urban-pop.-weighted avg., μg/cu. m)Transport sector energy use per capita (kg of oil equivalent) Water and sanitationInternal freshwater resources per capita (cu. m)Freshwater withdrawal
Total (% of internal resources)Agriculture (% of total freshwater withdrawal)
Access to improved water source (% of total population)Rural (% of rural population)Urban (% of urban population)
Access to improved sanitation (% of total population)Rural (% of rural population)Urban (% of urban population)
Environment and healthAcute resp. infection prevalence (% of children under five)Diarrhea prevalence (% of children under five)Under-five mortality rate (per 1,000 live births) National accounting aggregatesGross savings (% of GNI)Consumption of fixed capital (% of GNI)Education expenditure (% of GNI)Energy depletion (% of GNI)Mineral depletion (% of GNI)Net forest depletion (% of GNI)CO2 damage (% of GNI)Particulate emissions damage (% of GNI)Adjusted net savings (% of GNI)
177The Little Green Data Book 2010
440 1,077 52318 36 29
8.5 4.0 3.51.7 2.6 2.2
78 45 38212 330 318120 119 125646 353 666
21.7 26.1 24.7–3.1 0.7 0.77.6 12.4 11.9191093
0.9
.. 3.2 3.2
.. 662 423
.. 55.8 49.3
.. 550 324
.. 67.0 41.6
.. 16.9 41.9
0.1 0.5 0.40.09 0.82 0.5116.7 37.4 –6.0
26 53 65.. 61 37
1,005 4,829 5,004
1.6 3.2 9.468 87 8865 58 6761 46 6082 81 8623 31 3820 24 3334 42 52
17.114.1112 144 118
25.4 16.5 25.96.7 9.0 7.94.6 3.3 3.40.0 14.2 7.80.0 1.3 1.03.0 0.6 1.00.2 0.6 0.70.1 0.4 0.3
20.1 –6.2 10.7
Population (millions) 9.7 Land area (1,000 sq. km) 25 GDP ($ billions) 4.5
Country data
Sub-Saharan Africa group
Low-income group
Rwanda

GNI per capita, World Bank Atlas method ($)Urban population (% of total)Urban population growth (average annual %, 1990–2008)Population growth (average annual %, 1990–2008) AgricultureAgricultural land (% of land area)Agricultural productivity (value added per worker, 2000 $)Food production index (1999–2001 = 100)Population density, rural (people/sq. km of arable land) Forests and biodiversityForest area (% of land area)Deforestation (average annual %, 1990–2007)Nationally protected area (% of land area)Threatened species, mammalsThreatened species, birdsThreatened species, fishThreatened species, higher plantsGEF benefits index for biodiversity (0–100, median is 1.5) EnergyGDP per unit of energy use (2005 PPP $/kg oil equivalent)Energy use per capita (kg oil equivalent)Energy from biomass products and waste (% of total)Electric power consumption per capita (kWh)Electricity generated using fossil fuel (% of total)Electricity generated by hydropower (% of total) Emissions and pollutionCO2 emissions per unit of GDP (kg/2005 PPP $)CO2 emissions per capita (metric tons)CO2 emissions growth (%, 1990–2006)Particulate matter (urban-pop.-weighted avg., μg/cu. m)Transport sector energy use per capita (kg of oil equivalent) Water and sanitationInternal freshwater resources per capita (cu. m)Freshwater withdrawal
Total (% of internal resources)Agriculture (% of total freshwater withdrawal)
Access to improved water source (% of total population)Rural (% of rural population)Urban (% of urban population)
Access to improved sanitation (% of total population)Rural (% of rural population)Urban (% of urban population)
Environment and healthAcute resp. infection prevalence (% of children under five)Diarrhea prevalence (% of children under five)Under-five mortality rate (per 1,000 live births) National accounting aggregatesGross savings (% of GNI)Consumption of fixed capital (% of GNI)Education expenditure (% of GNI)Energy depletion (% of GNI)Mineral depletion (% of GNI)Net forest depletion (% of GNI)CO2 damage (% of GNI)Particulate emissions damage (% of GNI)Adjusted net savings (% of GNI)
178 2010 The Little Green Data Book
2,820 2,644 2,07323 44 411.0 3.4 3.00.6 1.0 1.4
30 50 501,910 509 589
106 127 123553 552 516
60.4 28.5 24.8–1.6 0.1 0.23.6 14.7 11.2
2782
1.6
.. 3.6 3.9
.. 1,295 1,013
.. 12.8 16.3
.. 1,883 1,310
.. 82.2 80.0
.. 14.7 15.2
0.2 0.9 0.80.9 3.8 2.8
26.5 135.9 105.7.. 69 69.. 113 97
.. 4,940 3,154
.. 10.2 8.7
.. 74 8188 87 8687 81 8190 96 94
100 66 52100 59 41100 75 69
..
..26 29 64
.. 47.3 41.110.3 10.1 9.6
4.0 2.0 2.30.0 7.2 8.10.0 1.5 1.40.3 0.0 0.20.2 1.1 1.1
.. 0.7 0.6
.. 28.6 22.4
Country data
East Asia & Pacific
group
Lower middle-income group
Population (thousands) 179 Land area (1,000 sq. km) 3 GDP ($ millions) 523
Samoa

GNI per capita, World Bank Atlas method ($)Urban population (% of total)Urban population growth (average annual %, 1990–2008)Population growth (average annual %, 1990–2008) AgricultureAgricultural land (% of land area)Agricultural productivity (value added per worker, 2000 $)Food production index (1999–2001 = 100)Population density, rural (people/sq. km of arable land) Forests and biodiversityForest area (% of land area)Deforestation (average annual %, 1990–2007)Nationally protected area (% of land area)Threatened species, mammalsThreatened species, birdsThreatened species, fishThreatened species, higher plantsGEF benefits index for biodiversity (0–100, median is 1.5) EnergyGDP per unit of energy use (2005 PPP $/kg oil equivalent)Energy use per capita (kg oil equivalent)Energy from biomass products and waste (% of total)Electric power consumption per capita (kWh)Electricity generated using fossil fuel (% of total)Electricity generated by hydropower (% of total) Emissions and pollutionCO2 emissions per unit of GDP (kg/2005 PPP $)CO2 emissions per capita (metric tons)CO2 emissions growth (%, 1990–2006)Particulate matter (urban-pop.-weighted avg., μg/cu. m)Transport sector energy use per capita (kg of oil equivalent) Water and sanitationInternal freshwater resources per capita (cu. m)Freshwater withdrawal
Total (% of internal resources)Agriculture (% of total freshwater withdrawal)
Access to improved water source (% of total population)Rural (% of rural population)Urban (% of urban population)
Access to improved sanitation (% of total population)Rural (% of rural population)Urban (% of urban population)
Environment and healthAcute resp. infection prevalence (% of children under five)Diarrhea prevalence (% of children under five)Under-five mortality rate (per 1,000 live births) National accounting aggregatesGross savings (% of GNI)Consumption of fixed capital (% of GNI)Education expenditure (% of GNI)Energy depletion (% of GNI)Mineral depletion (% of GNI)Net forest depletion (% of GNI)CO2 damage (% of GNI)Particulate emissions damage (% of GNI)Adjusted net savings (% of GNI)
179The Little Green Data Book 2010
46,770 39,68894 78
.. 1.0
.. 0.7
17 38.. 28,475.. 101
178 341
1.7 28.90.0 –0.1
.. 19.10010
0.0
.. 6.5
.. 5,321
.. 3.7
.. 9,753
.. 63.1
.. 11.1
.. 0.4
.. 12.7
.. 18.09 26.. 1,166
.. 9,305
.. 10.4
.. 43
.. 100
.. 98
.. 100
.. 100
.. 99
.. 100
..
..2 7
.. 18.5
.. 13.8
.. 4.6
.. 2.0
.. 0.2
.. 0.0
.. 0.2
.. 0.1
.. 6.8
Country data
High-income group
Population (thousands) 31 Land area (sq. km) 60 GDP ($ billions) 1.7
San Marino

GNI per capita, World Bank Atlas method ($)Urban population (% of total)Urban population growth (average annual %, 1990–2008)Population growth (average annual %, 1990–2008) AgricultureAgricultural land (% of land area)Agricultural productivity (value added per worker, 2000 $)Food production index (1999–2001 = 100)Population density, rural (people/sq. km of arable land) Forests and biodiversityForest area (% of land area)Deforestation (average annual %, 1990–2007)Nationally protected area (% of land area)Threatened species, mammalsThreatened species, birdsThreatened species, fishThreatened species, higher plantsGEF benefits index for biodiversity (0–100, median is 1.5) EnergyGDP per unit of energy use (2005 PPP $/kg oil equivalent)Energy use per capita (kg oil equivalent)Energy from biomass products and waste (% of total)Electric power consumption per capita (kWh)Electricity generated using fossil fuel (% of total)Electricity generated by hydropower (% of total) Emissions and pollutionCO2 emissions per unit of GDP (kg/2005 PPP $)CO2 emissions per capita (metric tons)CO2 emissions growth (%, 1990–2006)Particulate matter (urban-pop.-weighted avg., μg/cu. m)Transport sector energy use per capita (kg of oil equivalent) Water and sanitationInternal freshwater resources per capita (cu. m)Freshwater withdrawal
Total (% of internal resources)Agriculture (% of total freshwater withdrawal)
Access to improved water source (% of total population)Rural (% of rural population)Urban (% of urban population)
Access to improved sanitation (% of total population)Rural (% of rural population)Urban (% of urban population)
Environment and healthAcute resp. infection prevalence (% of children under five)Diarrhea prevalence (% of children under five)Under-five mortality rate (per 1,000 live births) National accounting aggregatesGross savings (% of GNI)Consumption of fixed capital (% of GNI)Education expenditure (% of GNI)Energy depletion (% of GNI)Mineral depletion (% of GNI)Net forest depletion (% of GNI)CO2 damage (% of GNI)Particulate emissions damage (% of GNI)Adjusted net savings (% of GNI)
180 2010 The Little Green Data Book
1,030 1,077 2,07361 36 41
3.6 4.0 3.01.8 2.6 1.4
59 45 50.. 330 589
114 119 123705 353 516
28.5 26.1 24.80.0 0.7 0.2
.. 12.4 11.25
108
352.7
.. 3.2 3.9
.. 662 1,013
.. 55.8 16.3
.. 550 1,310
.. 67.0 80.0
.. 16.9 15.2
0.4 0.5 0.80.7 0.8 2.8
55.6 37.4 105.739 53 69
.. 61 97
13,829 4,829 3,154
.. 3.2 8.7
.. 87 8186 58 8683 46 8188 81 9424 31 5218 24 4129 42 69
5.0..
98 144 64
.. 16.5 41.18.4 9.0 9.6
.. 3.3 2.30.0 14.2 8.10.0 1.3 1.40.0 0.6 0.20.5 0.6 1.10.2 0.4 0.6
.. –6.2 22.4
Country data
Sub-Saharan Africa group
Lower middle-income group
Population (thousands) 160 Land area (1,000 sq. km) 1 GDP ($ millions) 175
São Tomé and Príncipe
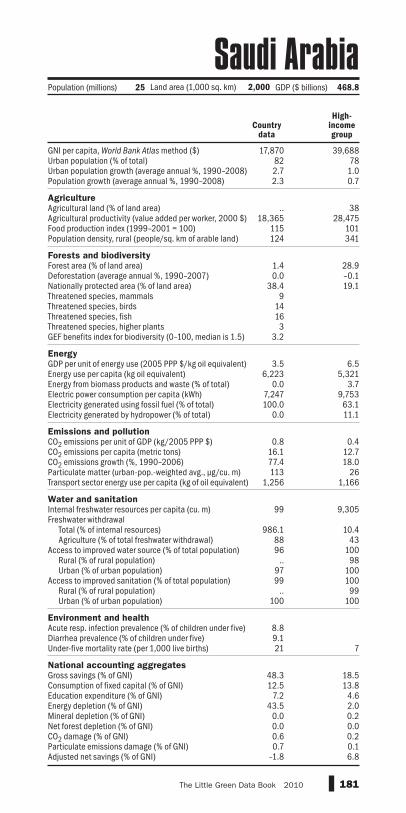
GNI per capita, World Bank Atlas method ($)Urban population (% of total)Urban population growth (average annual %, 1990–2008)Population growth (average annual %, 1990–2008) AgricultureAgricultural land (% of land area)Agricultural productivity (value added per worker, 2000 $)Food production index (1999–2001 = 100)Population density, rural (people/sq. km of arable land) Forests and biodiversityForest area (% of land area)Deforestation (average annual %, 1990–2007)Nationally protected area (% of land area)Threatened species, mammalsThreatened species, birdsThreatened species, fishThreatened species, higher plantsGEF benefits index for biodiversity (0–100, median is 1.5) EnergyGDP per unit of energy use (2005 PPP $/kg oil equivalent)Energy use per capita (kg oil equivalent)Energy from biomass products and waste (% of total)Electric power consumption per capita (kWh)Electricity generated using fossil fuel (% of total)Electricity generated by hydropower (% of total) Emissions and pollutionCO2 emissions per unit of GDP (kg/2005 PPP $)CO2 emissions per capita (metric tons)CO2 emissions growth (%, 1990–2006)Particulate matter (urban-pop.-weighted avg., μg/cu. m)Transport sector energy use per capita (kg of oil equivalent) Water and sanitationInternal freshwater resources per capita (cu. m)Freshwater withdrawal
Total (% of internal resources)Agriculture (% of total freshwater withdrawal)
Access to improved water source (% of total population)Rural (% of rural population)Urban (% of urban population)
Access to improved sanitation (% of total population)Rural (% of rural population)Urban (% of urban population)
Environment and healthAcute resp. infection prevalence (% of children under five)Diarrhea prevalence (% of children under five)Under-five mortality rate (per 1,000 live births) National accounting aggregatesGross savings (% of GNI)Consumption of fixed capital (% of GNI)Education expenditure (% of GNI)Energy depletion (% of GNI)Mineral depletion (% of GNI)Net forest depletion (% of GNI)CO2 damage (% of GNI)Particulate emissions damage (% of GNI)Adjusted net savings (% of GNI)
181The Little Green Data Book 2010
17,870 39,68882 782.7 1.02.3 0.7
.. 3818,365 28,475
115 101124 341
1.4 28.90.0 –0.1
38.4 19.19
14163
3.2
3.5 6.56,223 5,321
0.0 3.77,247 9,753100.0 63.1
0.0 11.1
0.8 0.416.1 12.777.4 18.0113 26
1,256 1,166
99 9,305
986.1 10.488 4396 100
.. 9897 10099 100
.. 99100 100
8.89.121 7
48.3 18.512.5 13.8
7.2 4.643.5 2.0
0.0 0.20.0 0.00.6 0.20.7 0.1
–1.8 6.8
Country data
High-income group
Population (millions) 25 Land area (1,000 sq. km) 2,000 GDP ($ billions) 468.8
Saudi Arabia

GNI per capita, World Bank Atlas method ($)Urban population (% of total)Urban population growth (average annual %, 1990–2008)Population growth (average annual %, 1990–2008) AgricultureAgricultural land (% of land area)Agricultural productivity (value added per worker, 2000 $)Food production index (1999–2001 = 100)Population density, rural (people/sq. km of arable land) Forests and biodiversityForest area (% of land area)Deforestation (average annual %, 1990–2007)Nationally protected area (% of land area)Threatened species, mammalsThreatened species, birdsThreatened species, fishThreatened species, higher plantsGEF benefits index for biodiversity (0–100, median is 1.5) EnergyGDP per unit of energy use (2005 PPP $/kg oil equivalent)Energy use per capita (kg oil equivalent)Energy from biomass products and waste (% of total)Electric power consumption per capita (kWh)Electricity generated using fossil fuel (% of total)Electricity generated by hydropower (% of total) Emissions and pollutionCO2 emissions per unit of GDP (kg/2005 PPP $)CO2 emissions per capita (metric tons)CO2 emissions growth (%, 1990–2006)Particulate matter (urban-pop.-weighted avg., μg/cu. m)Transport sector energy use per capita (kg of oil equivalent) Water and sanitationInternal freshwater resources per capita (cu. m)Freshwater withdrawal
Total (% of internal resources)Agriculture (% of total freshwater withdrawal)
Access to improved water source (% of total population)Rural (% of rural population)Urban (% of urban population)
Access to improved sanitation (% of total population)Rural (% of rural population)Urban (% of urban population)
Environment and healthAcute resp. infection prevalence (% of children under five)Diarrhea prevalence (% of children under five)Under-five mortality rate (per 1,000 live births) National accounting aggregatesGross savings (% of GNI)Consumption of fixed capital (% of GNI)Education expenditure (% of GNI)Energy depletion (% of GNI)Mineral depletion (% of GNI)Net forest depletion (% of GNI)CO2 damage (% of GNI)Particulate emissions damage (% of GNI)Adjusted net savings (% of GNI)
182 2010 The Little Green Data Book
Population (millions) 12 Land area (1,000 sq. km) 193 GDP ($ billions) 13.3
Country data
Sub-Saharan Africa group
Low-income group
980 1,077 52342 36 293.1 4.0 3.52.7 2.6 2.2
45 45 38202 330 318
73 119 125231 353 666
44.6 26.1 24.70.5 0.7 0.7
25.0 12.4 11.9158
287
1.0
7.3 3.2 3.2225 662 423
45.9 55.8 49.3128 550 32485.1 67.0 41.610.8 16.9 41.9
0.2 0.5 0.40.4 0.8 0.5
33.9 37.4 –6.095 53 6548 61 37
2,169 4,829 5,004
8.6 3.2 9.493 87 8877 58 6765 46 6093 81 8628 31 38
9 24 3354 42 52
7.015.1108 144 118
18.0 16.5 25.98.6 9.0 7.94.5 3.3 3.40.0 14.2 7.80.9 1.3 1.00.0 0.6 1.00.3 0.6 0.70.5 0.4 0.3
12.2 –6.2 10.7
Senegal

GNI per capita, World Bank Atlas method ($)Urban population (% of total)Urban population growth (average annual %, 1990–2008)Population growth (average annual %, 1990–2008) AgricultureAgricultural land (% of land area)Agricultural productivity (value added per worker, 2000 $)Food production index (1999–2001 = 100)Population density, rural (people/sq. km of arable land) Forests and biodiversityForest area (% of land area)Deforestation (average annual %, 1990–2007)Nationally protected area (% of land area)Threatened species, mammalsThreatened species, birdsThreatened species, fishThreatened species, higher plantsGEF benefits index for biodiversity (0–100, median is 1.5) EnergyGDP per unit of energy use (2005 PPP $/kg oil equivalent)Energy use per capita (kg oil equivalent)Energy from biomass products and waste (% of total)Electric power consumption per capita (kWh)Electricity generated using fossil fuel (% of total)Electricity generated by hydropower (% of total) Emissions and pollutionCO2 emissions per unit of GDP (kg/2005 PPP $)CO2 emissions per capita (metric tons)CO2 emissions growth (%, 1990–2006)Particulate matter (urban-pop.-weighted avg., μg/cu. m)Transport sector energy use per capita (kg of oil equivalent) Water and sanitationInternal freshwater resources per capita (cu. m)Freshwater withdrawal
Total (% of internal resources)Agriculture (% of total freshwater withdrawal)
Access to improved water source (% of total population)Rural (% of rural population)Urban (% of urban population)
Access to improved sanitation (% of total population)Rural (% of rural population)Urban (% of urban population)
Environment and healthAcute resp. infection prevalence (% of children under five)Diarrhea prevalence (% of children under five)Under-five mortality rate (per 1,000 live births) National accounting aggregatesGross savings (% of GNI)Consumption of fixed capital (% of GNI)Education expenditure (% of GNI)Energy depletion (% of GNI)Mineral depletion (% of GNI)Net forest depletion (% of GNI)CO2 damage (% of GNI)Particulate emissions damage (% of GNI)Adjusted net savings (% of GNI)
183The Little Green Data Book 2010
5,590 7,350 7,85252 64 750.0 0.2 1.5
–0.2 0.1 1.0
57 28 30.. 2,797 3,399.. 113 120
108 144 146
23.6 38.4 37.3.. 0.0 0.2
2.7 7.8 14.06
1181
0.2
4.4 3.7 5.22,141 2,948 2,130
5.1 2.1 7.34,155 3,958 3,05272.5 68.9 63.427.5 16.2 27.5
.. 0.7 0.5
.. 7.3 5.2
.. –30.0 –4.9
.. 27 32250 376 374
.. 11,867 18,876
.. 7.2 13.8
.. 60 5899 95 9498 88 8299 99 9892 89 8288 79 6396 94 89
..
..7 22 23
.. 24.8 23.8
.. 12.1 12.1
.. 4.1 4.2
.. 12.1 9.4
.. 0.6 1.3
.. 0.0 0.0
.. 0.8 0.5
.. 0.2 0.2
.. 3.2 4.6
Country data
Europe & Central
Asia group
Upper middle-income group
Population (millions) 7.4 Land area (1,000 sq. km) 88 GDP ($ billions) 50.1
Serbia

GNI per capita, World Bank Atlas method ($)Urban population (% of total)Urban population growth (average annual %, 1990–2008)Population growth (average annual %, 1990–2008) AgricultureAgricultural land (% of land area)Agricultural productivity (value added per worker, 2000 $)Food production index (1999–2001 = 100)Population density, rural (people/sq. km of arable land) Forests and biodiversityForest area (% of land area)Deforestation (average annual %, 1990–2007)Nationally protected area (% of land area)Threatened species, mammalsThreatened species, birdsThreatened species, fishThreatened species, higher plantsGEF benefits index for biodiversity (0–100, median is 1.5) EnergyGDP per unit of energy use (2005 PPP $/kg oil equivalent)Energy use per capita (kg oil equivalent)Energy from biomass products and waste (% of total)Electric power consumption per capita (kWh)Electricity generated using fossil fuel (% of total)Electricity generated by hydropower (% of total) Emissions and pollutionCO2 emissions per unit of GDP (kg/2005 PPP $)CO2 emissions per capita (metric tons)CO2 emissions growth (%, 1990–2006)Particulate matter (urban-pop.-weighted avg., μg/cu. m)Transport sector energy use per capita (kg of oil equivalent) Water and sanitationInternal freshwater resources per capita (cu. m)Freshwater withdrawal
Total (% of internal resources)Agriculture (% of total freshwater withdrawal)
Access to improved water source (% of total population)Rural (% of rural population)Urban (% of urban population)
Access to improved sanitation (% of total population)Rural (% of rural population)Urban (% of urban population)
Environment and healthAcute resp. infection prevalence (% of children under five)Diarrhea prevalence (% of children under five)Under-five mortality rate (per 1,000 live births) National accounting aggregatesGross savings (% of GNI)Consumption of fixed capital (% of GNI)Education expenditure (% of GNI)Energy depletion (% of GNI)Mineral depletion (% of GNI)Net forest depletion (% of GNI)CO2 damage (% of GNI)Particulate emissions damage (% of GNI)Adjusted net savings (% of GNI)
184 2010 The Little Green Data Book
Population (thousands) 87 Land area (sq. km) 460 GDP ($ millions) 833
Country data
Sub-Saharan Africa group
Upper middle-income group
10,220 1,077 7,85254 36 751.7 4.0 1.51.2 2.6 1.0
13 45 30652 330 3,399
89 119 1203,923 353 146
87.0 26.1 37.30.0 0.7 0.2
55.6 12.4 14.05
1014453.5
.. 3.2 5.2
.. 662 2,130
.. 55.8 7.3
.. 550 3,052
.. 67.0 63.4
.. 16.9 27.5
0.5 0.5 0.58.8 0.8 5.2
554.8 37.4 –4.9.. 53 32.. 61 374
.. 4,829 18,876
.. 3.2 13.87 87 58.. 58 94.. 46 82
100 81 98.. 31 82
100 24 63.. 42 89
..
..12 144 23
3.0 16.5 23.812.8 9.0 12.1
5.8 3.3 4.20.0 14.2 9.40.0 1.3 1.30.0 0.6 0.00.8 0.6 0.5
.. 0.4 0.2–4.8 –6.2 4.6
Seychelles

GNI per capita, World Bank Atlas method ($)Urban population (% of total)Urban population growth (average annual %, 1990–2008)Population growth (average annual %, 1990–2008) AgricultureAgricultural land (% of land area)Agricultural productivity (value added per worker, 2000 $)Food production index (1999–2001 = 100)Population density, rural (people/sq. km of arable land) Forests and biodiversityForest area (% of land area)Deforestation (average annual %, 1990–2007)Nationally protected area (% of land area)Threatened species, mammalsThreatened species, birdsThreatened species, fishThreatened species, higher plantsGEF benefits index for biodiversity (0–100, median is 1.5) EnergyGDP per unit of energy use (2005 PPP $/kg oil equivalent)Energy use per capita (kg oil equivalent)Energy from biomass products and waste (% of total)Electric power consumption per capita (kWh)Electricity generated using fossil fuel (% of total)Electricity generated by hydropower (% of total) Emissions and pollutionCO2 emissions per unit of GDP (kg/2005 PPP $)CO2 emissions per capita (metric tons)CO2 emissions growth (%, 1990–2006)Particulate matter (urban-pop.-weighted avg., μg/cu. m)Transport sector energy use per capita (kg of oil equivalent) Water and sanitationInternal freshwater resources per capita (cu. m)Freshwater withdrawal
Total (% of internal resources)Agriculture (% of total freshwater withdrawal)
Access to improved water source (% of total population)Rural (% of rural population)Urban (% of urban population)
Access to improved sanitation (% of total population)Rural (% of rural population)Urban (% of urban population)
Environment and healthAcute resp. infection prevalence (% of children under five)Diarrhea prevalence (% of children under five)Under-five mortality rate (per 1,000 live births) National accounting aggregatesGross savings (% of GNI)Consumption of fixed capital (% of GNI)Education expenditure (% of GNI)Energy depletion (% of GNI)Mineral depletion (% of GNI)Net forest depletion (% of GNI)CO2 damage (% of GNI)Particulate emissions damage (% of GNI)Adjusted net savings (% of GNI)
185The Little Green Data Book 2010
320 1,077 52338 36 292.5 4.0 3.51.7 2.6 2.2
44 45 38.. 330 318
183 119 125377 353 666
37.9 26.1 24.70.7 0.7 0.74.1 12.4 11.916101647
1.3
.. 3.2 3.2
.. 662 423
.. 55.8 49.3
.. 550 324
.. 67.0 41.6
.. 16.9 41.9
0.3 0.5 0.40.2 0.8 0.5
155.7 37.4 –6.050 53 65
.. 61 37
29,518 4,829 5,004
0.2 3.2 9.492 87 8853 58 6732 46 6083 81 8611 31 385 24 33
20 42 52
9.025.3194 144 118
5.5 16.5 25.97.0 9.0 7.93.9 3.3 3.40.0 14.2 7.80.5 1.3 1.01.5 0.6 1.00.4 0.6 0.70.8 0.4 0.3
–1.0 –6.2 10.7
Country data
Sub-Saharan Africa group
Low-income group
Population (millions) 5.6 Land area (1,000 sq. km) 72 GDP ($ billions) 2.0
Sierra Leone

GNI per capita, World Bank Atlas method ($)Urban population (% of total)Urban population growth (average annual %, 1990–2008)Population growth (average annual %, 1990–2008) AgricultureAgricultural land (% of land area)Agricultural productivity (value added per worker, 2000 $)Food production index (1999–2001 = 100)Population density, rural (people/sq. km of arable land) Forests and biodiversityForest area (% of land area)Deforestation (average annual %, 1990–2007)Nationally protected area (% of land area)Threatened species, mammalsThreatened species, birdsThreatened species, fishThreatened species, higher plantsGEF benefits index for biodiversity (0–100, median is 1.5) EnergyGDP per unit of energy use (2005 PPP $/kg oil equivalent)Energy use per capita (kg oil equivalent)Energy from biomass products and waste (% of total)Electric power consumption per capita (kWh)Electricity generated using fossil fuel (% of total)Electricity generated by hydropower (% of total) Emissions and pollutionCO2 emissions per unit of GDP (kg/2005 PPP $)CO2 emissions per capita (metric tons)CO2 emissions growth (%, 1990–2006)Particulate matter (urban-pop.-weighted avg., μg/cu. m)Transport sector energy use per capita (kg of oil equivalent) Water and sanitationInternal freshwater resources per capita (cu. m)Freshwater withdrawal
Total (% of internal resources)Agriculture (% of total freshwater withdrawal)
Access to improved water source (% of total population)Rural (% of rural population)Urban (% of urban population)
Access to improved sanitation (% of total population)Rural (% of rural population)Urban (% of urban population)
Environment and healthAcute resp. infection prevalence (% of children under five)Diarrhea prevalence (% of children under five)Under-five mortality rate (per 1,000 live births) National accounting aggregatesGross savings (% of GNI)Consumption of fixed capital (% of GNI)Education expenditure (% of GNI)Energy depletion (% of GNI)Mineral depletion (% of GNI)Net forest depletion (% of GNI)CO2 damage (% of GNI)Particulate emissions damage (% of GNI)Adjusted net savings (% of GNI)
186 2010 The Little Green Data Book
Population (millions) 4.8 Land area (1,000 sq. km) 1 GDP ($ billions) 181.9
Country data
High-income group
34,760 39,688100 782.6 1.02.6 0.7
1 3852,173 28,475
181 1010 341
3.3 28.90.0 –0.15.2 19.1121422540.1
8.1 6.55,831 5,321
0.0 3.78,514 9,753100.0 63.1
0.0 11.1
0.3 0.412.8 12.719.8 18.0
41 26535 1,166
131 9,305
.. 10.4
.. 43100 100
.. 98100 100100 100
.. 99100 100
..
..3 7
47.0 18.514.1 13.82.7 4.60.0 2.00.0 0.20.0 0.00.3 0.20.6 0.1
34.7 6.8
Singapore

GNI per capita, World Bank Atlas method ($)Urban population (% of total)Urban population growth (average annual %, 1990–2008)Population growth (average annual %, 1990–2008) AgricultureAgricultural land (% of land area)Agricultural productivity (value added per worker, 2000 $)Food production index (1999–2001 = 100)Population density, rural (people/sq. km of arable land) Forests and biodiversityForest area (% of land area)Deforestation (average annual %, 1990–2007)Nationally protected area (% of land area)Threatened species, mammalsThreatened species, birdsThreatened species, fishThreatened species, higher plantsGEF benefits index for biodiversity (0–100, median is 1.5) EnergyGDP per unit of energy use (2005 PPP $/kg oil equivalent)Energy use per capita (kg oil equivalent)Energy from biomass products and waste (% of total)Electric power consumption per capita (kWh)Electricity generated using fossil fuel (% of total)Electricity generated by hydropower (% of total) Emissions and pollutionCO2 emissions per unit of GDP (kg/2005 PPP $)CO2 emissions per capita (metric tons)CO2 emissions growth (%, 1990–2006)Particulate matter (urban-pop.-weighted avg., μg/cu. m)Transport sector energy use per capita (kg of oil equivalent) Water and sanitationInternal freshwater resources per capita (cu. m)Freshwater withdrawal
Total (% of internal resources)Agriculture (% of total freshwater withdrawal)
Access to improved water source (% of total population)Rural (% of rural population)Urban (% of urban population)
Access to improved sanitation (% of total population)Rural (% of rural population)Urban (% of urban population)
Environment and healthAcute resp. infection prevalence (% of children under five)Diarrhea prevalence (% of children under five)Under-five mortality rate (per 1,000 live births) National accounting aggregatesGross savings (% of GNI)Consumption of fixed capital (% of GNI)Education expenditure (% of GNI)Energy depletion (% of GNI)Mineral depletion (% of GNI)Net forest depletion (% of GNI)CO2 damage (% of GNI)Particulate emissions damage (% of GNI)Adjusted net savings (% of GNI)
187The Little Green Data Book 2010
16,590 39,68857 780.1 1.00.1 0.7
40 388,985 28,475
82 101171 341
40.2 28.90.0 –0.1
19.6 19.13772
0.1
5.9 6.53,307 5,321
3.5 3.75,250 9,753
27.1 63.116.0 11.1
0.4 0.46.9 12.7
–32.0 18.015 26
449 1,166
2,334 9,305
.. 10.4
.. 43100 100100 98100 100100 10099 99
100 100
..
..8 7
.. 18.513.1 13.8
3.7 4.60.1 2.00.0 0.20.4 0.00.4 0.20.0 0.1
.. 6.8
Country data
High-income group
Population (millions) 5.4 Land area (1,000 sq. km) 48 GDP ($ billions) 98.5
Slovak Republic
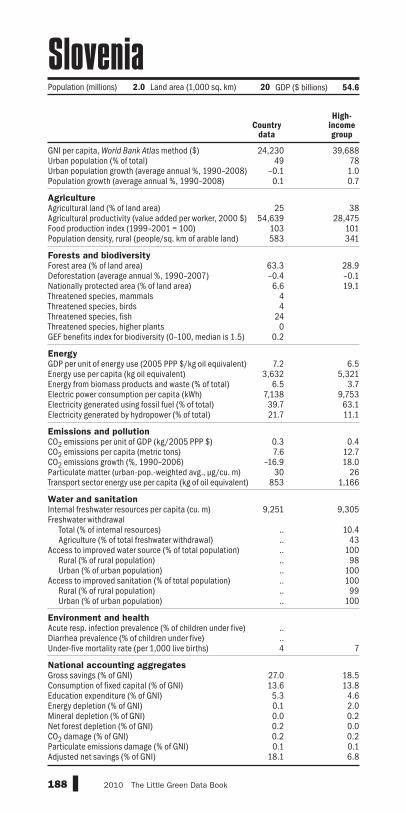
GNI per capita, World Bank Atlas method ($)Urban population (% of total)Urban population growth (average annual %, 1990–2008)Population growth (average annual %, 1990–2008) AgricultureAgricultural land (% of land area)Agricultural productivity (value added per worker, 2000 $)Food production index (1999–2001 = 100)Population density, rural (people/sq. km of arable land) Forests and biodiversityForest area (% of land area)Deforestation (average annual %, 1990–2007)Nationally protected area (% of land area)Threatened species, mammalsThreatened species, birdsThreatened species, fishThreatened species, higher plantsGEF benefits index for biodiversity (0–100, median is 1.5) EnergyGDP per unit of energy use (2005 PPP $/kg oil equivalent)Energy use per capita (kg oil equivalent)Energy from biomass products and waste (% of total)Electric power consumption per capita (kWh)Electricity generated using fossil fuel (% of total)Electricity generated by hydropower (% of total) Emissions and pollutionCO2 emissions per unit of GDP (kg/2005 PPP $)CO2 emissions per capita (metric tons)CO2 emissions growth (%, 1990–2006)Particulate matter (urban-pop.-weighted avg., μg/cu. m)Transport sector energy use per capita (kg of oil equivalent) Water and sanitationInternal freshwater resources per capita (cu. m)Freshwater withdrawal
Total (% of internal resources)Agriculture (% of total freshwater withdrawal)
Access to improved water source (% of total population)Rural (% of rural population)Urban (% of urban population)
Access to improved sanitation (% of total population)Rural (% of rural population)Urban (% of urban population)
Environment and healthAcute resp. infection prevalence (% of children under five)Diarrhea prevalence (% of children under five)Under-five mortality rate (per 1,000 live births) National accounting aggregatesGross savings (% of GNI)Consumption of fixed capital (% of GNI)Education expenditure (% of GNI)Energy depletion (% of GNI)Mineral depletion (% of GNI)Net forest depletion (% of GNI)CO2 damage (% of GNI)Particulate emissions damage (% of GNI)Adjusted net savings (% of GNI)
188 2010 The Little Green Data Book
Population (millions) 2.0 Land area (1,000 sq. km) 20 GDP ($ billions) 54.6
Country data
High-income group
24,230 39,68849 78
–0.1 1.00.1 0.7
25 3854,639 28,475
103 101583 341
63.3 28.9–0.4 –0.16.6 19.1
44
240
0.2
7.2 6.53,632 5,321
6.5 3.77,138 9,75339.7 63.121.7 11.1
0.3 0.47.6 12.7
–16.9 18.030 26
853 1,166
9,251 9,305
.. 10.4
.. 43
.. 100
.. 98
.. 100
.. 100
.. 99
.. 100
..
..4 7
27.0 18.513.6 13.85.3 4.60.1 2.00.0 0.20.2 0.00.2 0.20.1 0.1
18.1 6.8
Slovenia

GNI per capita, World Bank Atlas method ($)Urban population (% of total)Urban population growth (average annual %, 1990–2008)Population growth (average annual %, 1990–2008) AgricultureAgricultural land (% of land area)Agricultural productivity (value added per worker, 2000 $)Food production index (1999–2001 = 100)Population density, rural (people/sq. km of arable land) Forests and biodiversityForest area (% of land area)Deforestation (average annual %, 1990–2007)Nationally protected area (% of land area)Threatened species, mammalsThreatened species, birdsThreatened species, fishThreatened species, higher plantsGEF benefits index for biodiversity (0–100, median is 1.5) EnergyGDP per unit of energy use (2005 PPP $/kg oil equivalent)Energy use per capita (kg oil equivalent)Energy from biomass products and waste (% of total)Electric power consumption per capita (kWh)Electricity generated using fossil fuel (% of total)Electricity generated by hydropower (% of total) Emissions and pollutionCO2 emissions per unit of GDP (kg/2005 PPP $)CO2 emissions per capita (metric tons)CO2 emissions growth (%, 1990–2006)Particulate matter (urban-pop.-weighted avg., μg/cu. m)Transport sector energy use per capita (kg of oil equivalent) Water and sanitationInternal freshwater resources per capita (cu. m)Freshwater withdrawal
Total (% of internal resources)Agriculture (% of total freshwater withdrawal)
Access to improved water source (% of total population)Rural (% of rural population)Urban (% of urban population)
Access to improved sanitation (% of total population)Rural (% of rural population)Urban (% of urban population)
Environment and healthAcute resp. infection prevalence (% of children under five)Diarrhea prevalence (% of children under five)Under-five mortality rate (per 1,000 live births) National accounting aggregatesGross savings (% of GNI)Consumption of fixed capital (% of GNI)Education expenditure (% of GNI)Energy depletion (% of GNI)Mineral depletion (% of GNI)Net forest depletion (% of GNI)CO2 damage (% of GNI)Particulate emissions damage (% of GNI)Adjusted net savings (% of GNI)
189The Little Green Data Book 2010
1,010 2,644 2,07318 44 41
4.2 3.4 3.02.7 1.0 1.4
3 50 501,341 509 589
117 127 1232,565 552 516
74.8 28.5 24.81.6 0.1 0.20.8 14.7 11.217201216
4.4
.. 3.6 3.9
.. 1,295 1,013
.. 12.8 16.3
.. 1,883 1,310
.. 82.2 80.0
.. 14.7 15.2
0.2 0.9 0.80.4 3.8 2.8
11.4 135.9 105.737 69 69
.. 113 97
89,716 4,940 3,154
.. 10.2 8.7
.. 74 8170 87 8665 81 8194 96 9432 66 5218 59 4198 75 69
..
..36 29 64
81.2 47.3 41.110.4 10.1 9.63.8 2.0 2.30.0 7.2 8.10.0 1.5 1.4
19.4 0.0 0.20.4 1.1 1.10.1 0.7 0.6
54.7 28.6 22.4
Country data
East Asia & Pacific
group
Lower middle-income group
Population (thousands) 511 Land area (1,000 sq. km) 28 GDP ($ millions) 645
Solomon Islands
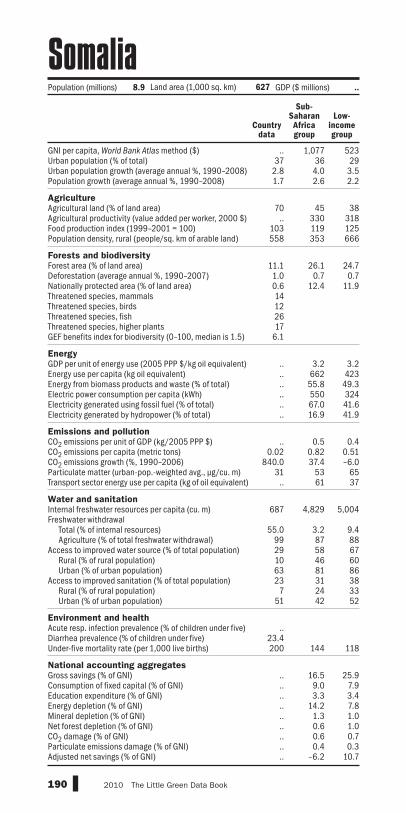
GNI per capita, World Bank Atlas method ($)Urban population (% of total)Urban population growth (average annual %, 1990–2008)Population growth (average annual %, 1990–2008) AgricultureAgricultural land (% of land area)Agricultural productivity (value added per worker, 2000 $)Food production index (1999–2001 = 100)Population density, rural (people/sq. km of arable land) Forests and biodiversityForest area (% of land area)Deforestation (average annual %, 1990–2007)Nationally protected area (% of land area)Threatened species, mammalsThreatened species, birdsThreatened species, fishThreatened species, higher plantsGEF benefits index for biodiversity (0–100, median is 1.5) EnergyGDP per unit of energy use (2005 PPP $/kg oil equivalent)Energy use per capita (kg oil equivalent)Energy from biomass products and waste (% of total)Electric power consumption per capita (kWh)Electricity generated using fossil fuel (% of total)Electricity generated by hydropower (% of total) Emissions and pollutionCO2 emissions per unit of GDP (kg/2005 PPP $)CO2 emissions per capita (metric tons)CO2 emissions growth (%, 1990–2006)Particulate matter (urban-pop.-weighted avg., μg/cu. m)Transport sector energy use per capita (kg of oil equivalent) Water and sanitationInternal freshwater resources per capita (cu. m)Freshwater withdrawal
Total (% of internal resources)Agriculture (% of total freshwater withdrawal)
Access to improved water source (% of total population)Rural (% of rural population)Urban (% of urban population)
Access to improved sanitation (% of total population)Rural (% of rural population)Urban (% of urban population)
Environment and healthAcute resp. infection prevalence (% of children under five)Diarrhea prevalence (% of children under five)Under-five mortality rate (per 1,000 live births) National accounting aggregatesGross savings (% of GNI)Consumption of fixed capital (% of GNI)Education expenditure (% of GNI)Energy depletion (% of GNI)Mineral depletion (% of GNI)Net forest depletion (% of GNI)CO2 damage (% of GNI)Particulate emissions damage (% of GNI)Adjusted net savings (% of GNI)
190 2010 The Little Green Data Book
Population (millions) 8.9 Land area (1,000 sq. km) 627 GDP ($ millions) ..
Country data
Sub-Saharan Africa group
Low-income group
.. 1,077 52337 36 29
2.8 4.0 3.51.7 2.6 2.2
70 45 38.. 330 318
103 119 125558 353 666
11.1 26.1 24.71.0 0.7 0.70.6 12.4 11.914122617
6.1
.. 3.2 3.2
.. 662 423
.. 55.8 49.3
.. 550 324
.. 67.0 41.6
.. 16.9 41.9
.. 0.5 0.40.02 0.82 0.51
840.0 37.4 –6.031 53 65
.. 61 37
687 4,829 5,004
55.0 3.2 9.499 87 8829 58 6710 46 6063 81 8623 31 38
7 24 3351 42 52
..23.4200 144 118
.. 16.5 25.9
.. 9.0 7.9
.. 3.3 3.4
.. 14.2 7.8
.. 1.3 1.0
.. 0.6 1.0
.. 0.6 0.7
.. 0.4 0.3
.. –6.2 10.7
Somalia

GNI per capita, World Bank Atlas method ($)Urban population (% of total)Urban population growth (average annual %, 1990–2008)Population growth (average annual %, 1990–2008) AgricultureAgricultural land (% of land area)Agricultural productivity (value added per worker, 2000 $)Food production index (1999–2001 = 100)Population density, rural (people/sq. km of arable land) Forests and biodiversityForest area (% of land area)Deforestation (average annual %, 1990–2007)Nationally protected area (% of land area)Threatened species, mammalsThreatened species, birdsThreatened species, fishThreatened species, higher plantsGEF benefits index for biodiversity (0–100, median is 1.5) EnergyGDP per unit of energy use (2005 PPP $/kg oil equivalent)Energy use per capita (kg oil equivalent)Energy from biomass products and waste (% of total)Electric power consumption per capita (kWh)Electricity generated using fossil fuel (% of total)Electricity generated by hydropower (% of total) Emissions and pollutionCO2 emissions per unit of GDP (kg/2005 PPP $)CO2 emissions per capita (metric tons)CO2 emissions growth (%, 1990–2006)Particulate matter (urban-pop.-weighted avg., μg/cu. m)Transport sector energy use per capita (kg of oil equivalent) Water and sanitationInternal freshwater resources per capita (cu. m)Freshwater withdrawal
Total (% of internal resources)Agriculture (% of total freshwater withdrawal)
Access to improved water source (% of total population)Rural (% of rural population)Urban (% of urban population)
Access to improved sanitation (% of total population)Rural (% of rural population)Urban (% of urban population)
Environment and healthAcute resp. infection prevalence (% of children under five)Diarrhea prevalence (% of children under five)Under-five mortality rate (per 1,000 live births) National accounting aggregatesGross savings (% of GNI)Consumption of fixed capital (% of GNI)Education expenditure (% of GNI)Energy depletion (% of GNI)Mineral depletion (% of GNI)Net forest depletion (% of GNI)CO2 damage (% of GNI)Particulate emissions damage (% of GNI)Adjusted net savings (% of GNI)
191The Little Green Data Book 2010
5,820 1,077 7,85261 36 752.7 4.0 1.51.8 2.6 1.0
82 45 303,152 330 3,399
109 119 120131 353 146
7.6 26.1 37.30.0 0.7 0.26.0 12.4 14.023356574
20.7
3.3 3.2 5.22,807 662 2,130
10.2 55.8 7.34,986 550 3,052
95.2 67.0 63.40.4 16.9 27.5
1.0 0.5 0.58.7 0.8 5.2
24.3 37.4 –4.921 53 32
334 61 374
936 4,829 18,876
27.9 3.2 13.863 87 5893 58 9482 46 82
100 81 9859 31 8249 24 6366 42 89
19.013.2
67 144 23
16.1 16.5 23.813.9 9.0 12.1
5.1 3.3 4.26.4 14.2 9.42.6 1.3 1.30.5 0.6 0.01.3 0.6 0.50.1 0.4 0.2
–3.4 –6.2 4.6
Country data
Sub-Saharan Africa group
Upper middle-income group
Population (millions) 49 Land area (1,000 sq. km) 1,214 GDP ($ billions) 276.4
South Africa

GNI per capita, World Bank Atlas method ($)Urban population (% of total)Urban population growth (average annual %, 1990–2008)Population growth (average annual %, 1990–2008) AgricultureAgricultural land (% of land area)Agricultural productivity (value added per worker, 2000 $)Food production index (1999–2001 = 100)Population density, rural (people/sq. km of arable land) Forests and biodiversityForest area (% of land area)Deforestation (average annual %, 1990–2007)Nationally protected area (% of land area)Threatened species, mammalsThreatened species, birdsThreatened species, fishThreatened species, higher plantsGEF benefits index for biodiversity (0–100, median is 1.5) EnergyGDP per unit of energy use (2005 PPP $/kg oil equivalent)Energy use per capita (kg oil equivalent)Energy from biomass products and waste (% of total)Electric power consumption per capita (kWh)Electricity generated using fossil fuel (% of total)Electricity generated by hydropower (% of total) Emissions and pollutionCO2 emissions per unit of GDP (kg/2005 PPP $)CO2 emissions per capita (metric tons)CO2 emissions growth (%, 1990–2006)Particulate matter (urban-pop.-weighted avg., μg/cu. m)Transport sector energy use per capita (kg of oil equivalent) Water and sanitationInternal freshwater resources per capita (cu. m)Freshwater withdrawal
Total (% of internal resources)Agriculture (% of total freshwater withdrawal)
Access to improved water source (% of total population)Rural (% of rural population)Urban (% of urban population)
Access to improved sanitation (% of total population)Rural (% of rural population)Urban (% of urban population)
Environment and healthAcute resp. infection prevalence (% of children under five)Diarrhea prevalence (% of children under five)Under-five mortality rate (per 1,000 live births) National accounting aggregatesGross savings (% of GNI)Consumption of fixed capital (% of GNI)Education expenditure (% of GNI)Energy depletion (% of GNI)Mineral depletion (% of GNI)Net forest depletion (% of GNI)CO2 damage (% of GNI)Particulate emissions damage (% of GNI)Adjusted net savings (% of GNI)
192 2010 The Little Green Data Book
31,930 39,68877 781.0 1.00.9 0.7
57 3819,141 28,475
99 10181 341
37.1 28.9–1.9 –0.19.5 19.116155249
6.8
8.9 6.53,208 5,321
3.7 3.76,296 9,753
61.8 63.19.2 11.1
0.3 0.48.0 12.7
53.7 18.032 26
862 1,166
2,478 9,305
32.0 10.468 43
100 100100 98100 100100 100100 99100 100
..
..4 7
20.6 18.514.0 13.83.9 4.60.0 2.00.0 0.20.0 0.00.2 0.20.2 0.1
10.1 6.8
Country data
High-income group
Population (millions) 46 Land area (1,000 sq. km) 499 GDP ($ billions) 1,604.2
Spain

GNI per capita, World Bank Atlas method ($)Urban population (% of total)Urban population growth (average annual %, 1990–2008)Population growth (average annual %, 1990–2008) AgricultureAgricultural land (% of land area)Agricultural productivity (value added per worker, 2000 $)Food production index (1999–2001 = 100)Population density, rural (people/sq. km of arable land) Forests and biodiversityForest area (% of land area)Deforestation (average annual %, 1990–2007)Nationally protected area (% of land area)Threatened species, mammalsThreatened species, birdsThreatened species, fishThreatened species, higher plantsGEF benefits index for biodiversity (0–100, median is 1.5) EnergyGDP per unit of energy use (2005 PPP $/kg oil equivalent)Energy use per capita (kg oil equivalent)Energy from biomass products and waste (% of total)Electric power consumption per capita (kWh)Electricity generated using fossil fuel (% of total)Electricity generated by hydropower (% of total) Emissions and pollutionCO2 emissions per unit of GDP (kg/2005 PPP $)CO2 emissions per capita (metric tons)CO2 emissions growth (%, 1990–2006)Particulate matter (urban-pop.-weighted avg., μg/cu. m)Transport sector energy use per capita (kg of oil equivalent) Water and sanitationInternal freshwater resources per capita (cu. m)Freshwater withdrawal
Total (% of internal resources)Agriculture (% of total freshwater withdrawal)
Access to improved water source (% of total population)Rural (% of rural population)Urban (% of urban population)
Access to improved sanitation (% of total population)Rural (% of rural population)Urban (% of urban population)
Environment and healthAcute resp. infection prevalence (% of children under five)Diarrhea prevalence (% of children under five)Under-five mortality rate (per 1,000 live births) National accounting aggregatesGross savings (% of GNI)Consumption of fixed capital (% of GNI)Education expenditure (% of GNI)Energy depletion (% of GNI)Mineral depletion (% of GNI)Net forest depletion (% of GNI)CO2 damage (% of GNI)Particulate emissions damage (% of GNI)Adjusted net savings (% of GNI)
193The Little Green Data Book 2010
1,780 963 2,07315 29 41
0.2 2.7 3.00.9 1.7 1.4
37 55 50845 496 589109 120 123
1,751 628 516
29.0 16.7 24.81.3 –0.1 0.2
20.6 5.5 11.2301331
2807.9
8.6 5.0 3.9464 484 1,01350.8 29.3 16.3417 482 1,310
59.9 78.6 80.039.9 17.0 15.2
0.2 0.5 0.80.6 1.1 2.8
214.8 118.9 105.782 78 69
107 37 97
2,499 1,194 3,154
25.2 51.7 8.795 90 8182 87 8679 84 8198 94 9486 33 5286 23 4189 57 69
..5.015 76 64
18.4 35.3 41.19.7 8.4 9.62.6 3.0 2.30.0 4.6 8.10.0 1.1 1.40.4 0.8 0.20.3 1.0 1.10.2 0.5 0.6
10.4 21.8 22.4
Country data
South Asia
group
Lower middle-income group
Population (millions) 20 Land area (1,000 sq. km) 65 GDP ($ billions) 40.6
Sri Lanka
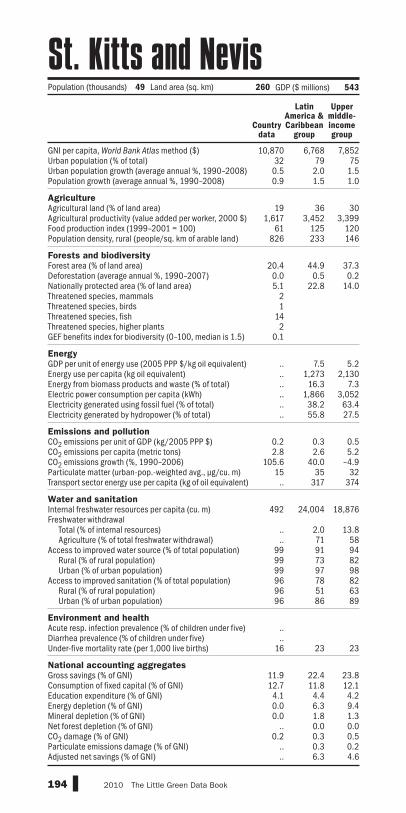
GNI per capita, World Bank Atlas method ($)Urban population (% of total)Urban population growth (average annual %, 1990–2008)Population growth (average annual %, 1990–2008) AgricultureAgricultural land (% of land area)Agricultural productivity (value added per worker, 2000 $)Food production index (1999–2001 = 100)Population density, rural (people/sq. km of arable land) Forests and biodiversityForest area (% of land area)Deforestation (average annual %, 1990–2007)Nationally protected area (% of land area)Threatened species, mammalsThreatened species, birdsThreatened species, fishThreatened species, higher plantsGEF benefits index for biodiversity (0–100, median is 1.5) EnergyGDP per unit of energy use (2005 PPP $/kg oil equivalent)Energy use per capita (kg oil equivalent)Energy from biomass products and waste (% of total)Electric power consumption per capita (kWh)Electricity generated using fossil fuel (% of total)Electricity generated by hydropower (% of total) Emissions and pollutionCO2 emissions per unit of GDP (kg/2005 PPP $)CO2 emissions per capita (metric tons)CO2 emissions growth (%, 1990–2006)Particulate matter (urban-pop.-weighted avg., μg/cu. m)Transport sector energy use per capita (kg of oil equivalent) Water and sanitationInternal freshwater resources per capita (cu. m)Freshwater withdrawal
Total (% of internal resources)Agriculture (% of total freshwater withdrawal)
Access to improved water source (% of total population)Rural (% of rural population)Urban (% of urban population)
Access to improved sanitation (% of total population)Rural (% of rural population)Urban (% of urban population)
Environment and healthAcute resp. infection prevalence (% of children under five)Diarrhea prevalence (% of children under five)Under-five mortality rate (per 1,000 live births) National accounting aggregatesGross savings (% of GNI)Consumption of fixed capital (% of GNI)Education expenditure (% of GNI)Energy depletion (% of GNI)Mineral depletion (% of GNI)Net forest depletion (% of GNI)CO2 damage (% of GNI)Particulate emissions damage (% of GNI)Adjusted net savings (% of GNI)
194 2010 The Little Green Data Book
Population (thousands) 49 Land area (sq. km) 260 GDP ($ millions) 543
Country data
Latin America & Caribbean
group
Upper middle-income group
10,870 6,768 7,85232 79 750.5 2.0 1.50.9 1.5 1.0
19 36 301,617 3,452 3,399
61 125 120826 233 146
20.4 44.9 37.30.0 0.5 0.25.1 22.8 14.0
21
142
0.1
.. 7.5 5.2
.. 1,273 2,130
.. 16.3 7.3
.. 1,866 3,052
.. 38.2 63.4
.. 55.8 27.5
0.2 0.3 0.52.8 2.6 5.2
105.6 40.0 –4.915 35 32
.. 317 374
492 24,004 18,876
.. 2.0 13.8
.. 71 5899 91 9499 73 8299 97 9896 78 8296 51 6396 86 89
..
..16 23 23
11.9 22.4 23.812.7 11.8 12.14.1 4.4 4.20.0 6.3 9.40.0 1.8 1.3
.. 0.0 0.00.2 0.3 0.5
.. 0.3 0.2
.. 6.3 4.6
St. Kitts and Nevis
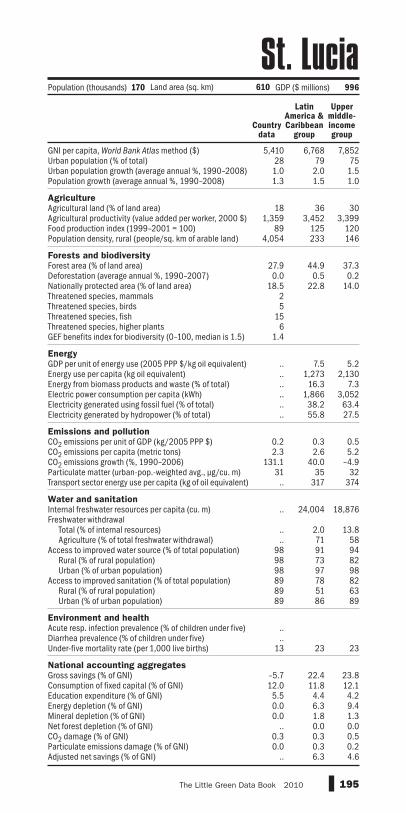
GNI per capita, World Bank Atlas method ($)Urban population (% of total)Urban population growth (average annual %, 1990–2008)Population growth (average annual %, 1990–2008) AgricultureAgricultural land (% of land area)Agricultural productivity (value added per worker, 2000 $)Food production index (1999–2001 = 100)Population density, rural (people/sq. km of arable land) Forests and biodiversityForest area (% of land area)Deforestation (average annual %, 1990–2007)Nationally protected area (% of land area)Threatened species, mammalsThreatened species, birdsThreatened species, fishThreatened species, higher plantsGEF benefits index for biodiversity (0–100, median is 1.5) EnergyGDP per unit of energy use (2005 PPP $/kg oil equivalent)Energy use per capita (kg oil equivalent)Energy from biomass products and waste (% of total)Electric power consumption per capita (kWh)Electricity generated using fossil fuel (% of total)Electricity generated by hydropower (% of total) Emissions and pollutionCO2 emissions per unit of GDP (kg/2005 PPP $)CO2 emissions per capita (metric tons)CO2 emissions growth (%, 1990–2006)Particulate matter (urban-pop.-weighted avg., μg/cu. m)Transport sector energy use per capita (kg of oil equivalent) Water and sanitationInternal freshwater resources per capita (cu. m)Freshwater withdrawal
Total (% of internal resources)Agriculture (% of total freshwater withdrawal)
Access to improved water source (% of total population)Rural (% of rural population)Urban (% of urban population)
Access to improved sanitation (% of total population)Rural (% of rural population)Urban (% of urban population)
Environment and healthAcute resp. infection prevalence (% of children under five)Diarrhea prevalence (% of children under five)Under-five mortality rate (per 1,000 live births) National accounting aggregatesGross savings (% of GNI)Consumption of fixed capital (% of GNI)Education expenditure (% of GNI)Energy depletion (% of GNI)Mineral depletion (% of GNI)Net forest depletion (% of GNI)CO2 damage (% of GNI)Particulate emissions damage (% of GNI)Adjusted net savings (% of GNI)
195The Little Green Data Book 2010
5,410 6,768 7,85228 79 751.0 2.0 1.51.3 1.5 1.0
18 36 301,359 3,452 3,399
89 125 1204,054 233 146
27.9 44.9 37.30.0 0.5 0.2
18.5 22.8 14.025
156
1.4
.. 7.5 5.2
.. 1,273 2,130
.. 16.3 7.3
.. 1,866 3,052
.. 38.2 63.4
.. 55.8 27.5
0.2 0.3 0.52.3 2.6 5.2
131.1 40.0 –4.931 35 32
.. 317 374
.. 24,004 18,876
.. 2.0 13.8
.. 71 5898 91 9498 73 8298 97 9889 78 8289 51 6389 86 89
..
..13 23 23
–5.7 22.4 23.812.0 11.8 12.15.5 4.4 4.20.0 6.3 9.40.0 1.8 1.3
.. 0.0 0.00.3 0.3 0.50.0 0.3 0.2
.. 6.3 4.6
Country data
Latin America & Caribbean
group
Upper middle-income group
Population (thousands) 170 Land area (sq. km) 610 GDP ($ millions) 996
St. Lucia

GNI per capita, World Bank Atlas method ($)Urban population (% of total)Urban population growth (average annual %, 1990–2008)Population growth (average annual %, 1990–2008) AgricultureAgricultural land (% of land area)Agricultural productivity (value added per worker, 2000 $)Food production index (1999–2001 = 100)Population density, rural (people/sq. km of arable land) Forests and biodiversityForest area (% of land area)Deforestation (average annual %, 1990–2007)Nationally protected area (% of land area)Threatened species, mammalsThreatened species, birdsThreatened species, fishThreatened species, higher plantsGEF benefits index for biodiversity (0–100, median is 1.5) EnergyGDP per unit of energy use (2005 PPP $/kg oil equivalent)Energy use per capita (kg oil equivalent)Energy from biomass products and waste (% of total)Electric power consumption per capita (kWh)Electricity generated using fossil fuel (% of total)Electricity generated by hydropower (% of total) Emissions and pollutionCO2 emissions per unit of GDP (kg/2005 PPP $)CO2 emissions per capita (metric tons)CO2 emissions growth (%, 1990–2006)Particulate matter (urban-pop.-weighted avg., μg/cu. m)Transport sector energy use per capita (kg of oil equivalent) Water and sanitationInternal freshwater resources per capita (cu. m)Freshwater withdrawal
Total (% of internal resources)Agriculture (% of total freshwater withdrawal)
Access to improved water source (% of total population)Rural (% of rural population)Urban (% of urban population)
Access to improved sanitation (% of total population)Rural (% of rural population)Urban (% of urban population)
Environment and healthAcute resp. infection prevalence (% of children under five)Diarrhea prevalence (% of children under five)Under-five mortality rate (per 1,000 live births) National accounting aggregatesGross savings (% of GNI)Consumption of fixed capital (% of GNI)Education expenditure (% of GNI)Energy depletion (% of GNI)Mineral depletion (% of GNI)Net forest depletion (% of GNI)CO2 damage (% of GNI)Particulate emissions damage (% of GNI)Adjusted net savings (% of GNI)
196 2010 The Little Green Data Book
Population (thousands) 109 Land area (sq. km) 390 GDP ($ millions) 598
Country data
Latin America & Caribbean
group
Upper middle-income group
5,050 6,768 7,85247 79 75
0.9 2.0 1.50.1 1.5 1.0
36 36 302,864 3,452 3,399
100 125 120831 233 146
27.9 44.9 37.3–0.8 0.5 0.216.3 22.8 14.0
22
164
1.0
.. 7.5 5.2
.. 1,273 2,130
.. 16.3 7.3
.. 1,866 3,052
.. 38.2 63.4
.. 55.8 27.5
0.2 0.3 0.51.8 2.6 5.2
145.5 40.0 –4.928 35 32
.. 317 374
.. 24,004 18,876
.. 2.0 13.8
.. 71 58
.. 91 9493 73 82
.. 97 98
.. 78 8296 51 63
.. 86 89
..
..13 23 23
13.6 22.4 23.811.5 11.8 12.15.8 4.4 4.20.0 6.3 9.40.0 1.8 1.30.0 0.0 0.00.3 0.3 0.50.1 0.3 0.27.6 6.3 4.6
St. Vincent & Grenadines
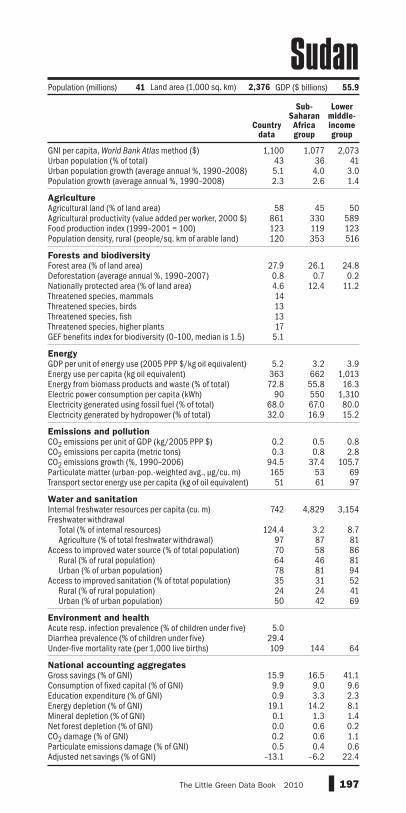
GNI per capita, World Bank Atlas method ($)Urban population (% of total)Urban population growth (average annual %, 1990–2008)Population growth (average annual %, 1990–2008) AgricultureAgricultural land (% of land area)Agricultural productivity (value added per worker, 2000 $)Food production index (1999–2001 = 100)Population density, rural (people/sq. km of arable land) Forests and biodiversityForest area (% of land area)Deforestation (average annual %, 1990–2007)Nationally protected area (% of land area)Threatened species, mammalsThreatened species, birdsThreatened species, fishThreatened species, higher plantsGEF benefits index for biodiversity (0–100, median is 1.5) EnergyGDP per unit of energy use (2005 PPP $/kg oil equivalent)Energy use per capita (kg oil equivalent)Energy from biomass products and waste (% of total)Electric power consumption per capita (kWh)Electricity generated using fossil fuel (% of total)Electricity generated by hydropower (% of total) Emissions and pollutionCO2 emissions per unit of GDP (kg/2005 PPP $)CO2 emissions per capita (metric tons)CO2 emissions growth (%, 1990–2006)Particulate matter (urban-pop.-weighted avg., μg/cu. m)Transport sector energy use per capita (kg of oil equivalent) Water and sanitationInternal freshwater resources per capita (cu. m)Freshwater withdrawal
Total (% of internal resources)Agriculture (% of total freshwater withdrawal)
Access to improved water source (% of total population)Rural (% of rural population)Urban (% of urban population)
Access to improved sanitation (% of total population)Rural (% of rural population)Urban (% of urban population)
Environment and healthAcute resp. infection prevalence (% of children under five)Diarrhea prevalence (% of children under five)Under-five mortality rate (per 1,000 live births) National accounting aggregatesGross savings (% of GNI)Consumption of fixed capital (% of GNI)Education expenditure (% of GNI)Energy depletion (% of GNI)Mineral depletion (% of GNI)Net forest depletion (% of GNI)CO2 damage (% of GNI)Particulate emissions damage (% of GNI)Adjusted net savings (% of GNI)
197The Little Green Data Book 2010
1,100 1,077 2,07343 36 415.1 4.0 3.02.3 2.6 1.4
58 45 50861 330 589123 119 123120 353 516
27.9 26.1 24.80.8 0.7 0.24.6 12.4 11.214131317
5.1
5.2 3.2 3.9363 662 1,01372.8 55.8 16.3
90 550 1,31068.0 67.0 80.032.0 16.9 15.2
0.2 0.5 0.80.3 0.8 2.8
94.5 37.4 105.7165 53 69
51 61 97
742 4,829 3,154
124.4 3.2 8.797 87 8170 58 8664 46 8178 81 9435 31 5224 24 4150 42 69
5.029.4109 144 64
15.9 16.5 41.19.9 9.0 9.60.9 3.3 2.3
19.1 14.2 8.10.1 1.3 1.40.0 0.6 0.20.2 0.6 1.10.5 0.4 0.6
–13.1 –6.2 22.4
Country data
Sub-Saharan Africa group
Lower middle-income group
Population (millions) 41 Land area (1,000 sq. km) 2,376 GDP ($ billions) 55.9
Sudan
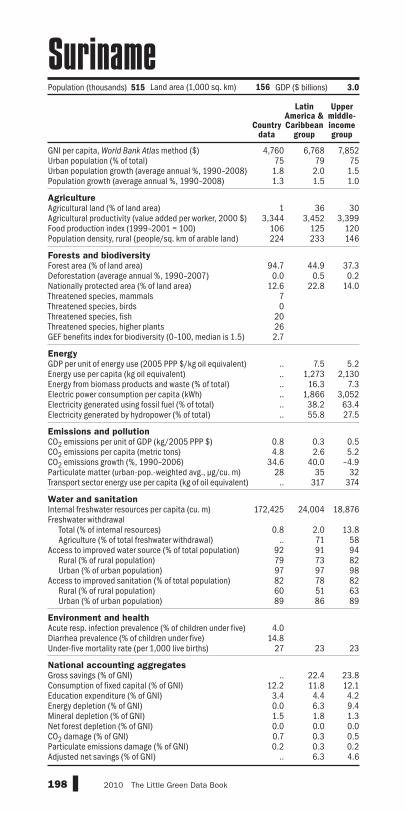
GNI per capita, World Bank Atlas method ($)Urban population (% of total)Urban population growth (average annual %, 1990–2008)Population growth (average annual %, 1990–2008) AgricultureAgricultural land (% of land area)Agricultural productivity (value added per worker, 2000 $)Food production index (1999–2001 = 100)Population density, rural (people/sq. km of arable land) Forests and biodiversityForest area (% of land area)Deforestation (average annual %, 1990–2007)Nationally protected area (% of land area)Threatened species, mammalsThreatened species, birdsThreatened species, fishThreatened species, higher plantsGEF benefits index for biodiversity (0–100, median is 1.5) EnergyGDP per unit of energy use (2005 PPP $/kg oil equivalent)Energy use per capita (kg oil equivalent)Energy from biomass products and waste (% of total)Electric power consumption per capita (kWh)Electricity generated using fossil fuel (% of total)Electricity generated by hydropower (% of total) Emissions and pollutionCO2 emissions per unit of GDP (kg/2005 PPP $)CO2 emissions per capita (metric tons)CO2 emissions growth (%, 1990–2006)Particulate matter (urban-pop.-weighted avg., μg/cu. m)Transport sector energy use per capita (kg of oil equivalent) Water and sanitationInternal freshwater resources per capita (cu. m)Freshwater withdrawal
Total (% of internal resources)Agriculture (% of total freshwater withdrawal)
Access to improved water source (% of total population)Rural (% of rural population)Urban (% of urban population)
Access to improved sanitation (% of total population)Rural (% of rural population)Urban (% of urban population)
Environment and healthAcute resp. infection prevalence (% of children under five)Diarrhea prevalence (% of children under five)Under-five mortality rate (per 1,000 live births) National accounting aggregatesGross savings (% of GNI)Consumption of fixed capital (% of GNI)Education expenditure (% of GNI)Energy depletion (% of GNI)Mineral depletion (% of GNI)Net forest depletion (% of GNI)CO2 damage (% of GNI)Particulate emissions damage (% of GNI)Adjusted net savings (% of GNI)
198 2010 The Little Green Data Book
Population (thousands) 515 Land area (1,000 sq. km) 156 GDP ($ billions) 3.0
Country data
Latin America & Caribbean
group
Upper middle-income group
4,760 6,768 7,85275 79 75
1.8 2.0 1.51.3 1.5 1.0
1 36 303,344 3,452 3,399
106 125 120224 233 146
94.7 44.9 37.30.0 0.5 0.2
12.6 22.8 14.070
20262.7
.. 7.5 5.2
.. 1,273 2,130
.. 16.3 7.3
.. 1,866 3,052
.. 38.2 63.4
.. 55.8 27.5
0.8 0.3 0.54.8 2.6 5.2
34.6 40.0 –4.928 35 32
.. 317 374
172,425 24,004 18,876
0.8 2.0 13.8.. 71 58
92 91 9479 73 8297 97 9882 78 8260 51 6389 86 89
4.014.8
27 23 23
.. 22.4 23.812.2 11.8 12.1
3.4 4.4 4.20.0 6.3 9.41.5 1.8 1.30.0 0.0 0.00.7 0.3 0.50.2 0.3 0.2
.. 6.3 4.6
Suriname

GNI per capita, World Bank Atlas method ($)Urban population (% of total)Urban population growth (average annual %, 1990–2008)Population growth (average annual %, 1990–2008) AgricultureAgricultural land (% of land area)Agricultural productivity (value added per worker, 2000 $)Food production index (1999–2001 = 100)Population density, rural (people/sq. km of arable land) Forests and biodiversityForest area (% of land area)Deforestation (average annual %, 1990–2007)Nationally protected area (% of land area)Threatened species, mammalsThreatened species, birdsThreatened species, fishThreatened species, higher plantsGEF benefits index for biodiversity (0–100, median is 1.5) EnergyGDP per unit of energy use (2005 PPP $/kg oil equivalent)Energy use per capita (kg oil equivalent)Energy from biomass products and waste (% of total)Electric power consumption per capita (kWh)Electricity generated using fossil fuel (% of total)Electricity generated by hydropower (% of total) Emissions and pollutionCO2 emissions per unit of GDP (kg/2005 PPP $)CO2 emissions per capita (metric tons)CO2 emissions growth (%, 1990–2006)Particulate matter (urban-pop.-weighted avg., μg/cu. m)Transport sector energy use per capita (kg of oil equivalent) Water and sanitationInternal freshwater resources per capita (cu. m)Freshwater withdrawal
Total (% of internal resources)Agriculture (% of total freshwater withdrawal)
Access to improved water source (% of total population)Rural (% of rural population)Urban (% of urban population)
Access to improved sanitation (% of total population)Rural (% of rural population)Urban (% of urban population)
Environment and healthAcute resp. infection prevalence (% of children under five)Diarrhea prevalence (% of children under five)Under-five mortality rate (per 1,000 live births) National accounting aggregatesGross savings (% of GNI)Consumption of fixed capital (% of GNI)Education expenditure (% of GNI)Energy depletion (% of GNI)Mineral depletion (% of GNI)Net forest depletion (% of GNI)CO2 damage (% of GNI)Particulate emissions damage (% of GNI)Adjusted net savings (% of GNI)
199The Little Green Data Book 2010
2,600 1,077 2,07325 36 412.1 4.0 3.01.7 2.6 1.4
78 45 501,127 330 589
111 119 123487 353 516
32.0 26.1 24.8–0.9 0.7 0.23.1 12.4 11.2
473
110.1
.. 3.2 3.9
.. 662 1,013
.. 55.8 16.3
.. 550 1,310
.. 67.0 80.0
.. 16.9 15.2
0.2 0.5 0.80.9 0.8 2.8
138.8 37.4 105.733 53 69
.. 61 97
2,293 4,829 3,154
39.5 3.2 8.797 87 8160 58 8651 46 8187 81 9450 31 5246 24 4164 42 69
10.0..
83 144 64
10.7 16.5 41.19.6 9.0 9.66.4 3.3 2.30.0 14.2 8.10.0 1.3 1.40.0 0.6 0.20.3 0.6 1.10.0 0.4 0.67.1 –6.2 22.4
Country data
Sub-Saharan Africa group
Lower middle-income group
Population (millions) 1.2 Land area (1,000 sq. km) 17 GDP ($ billions) 2.8
Swaziland

GNI per capita, World Bank Atlas method ($)Urban population (% of total)Urban population growth (average annual %, 1990–2008)Population growth (average annual %, 1990–2008) AgricultureAgricultural land (% of land area)Agricultural productivity (value added per worker, 2000 $)Food production index (1999–2001 = 100)Population density, rural (people/sq. km of arable land) Forests and biodiversityForest area (% of land area)Deforestation (average annual %, 1990–2007)Nationally protected area (% of land area)Threatened species, mammalsThreatened species, birdsThreatened species, fishThreatened species, higher plantsGEF benefits index for biodiversity (0–100, median is 1.5) EnergyGDP per unit of energy use (2005 PPP $/kg oil equivalent)Energy use per capita (kg oil equivalent)Energy from biomass products and waste (% of total)Electric power consumption per capita (kWh)Electricity generated using fossil fuel (% of total)Electricity generated by hydropower (% of total) Emissions and pollutionCO2 emissions per unit of GDP (kg/2005 PPP $)CO2 emissions per capita (metric tons)CO2 emissions growth (%, 1990–2006)Particulate matter (urban-pop.-weighted avg., μg/cu. m)Transport sector energy use per capita (kg of oil equivalent) Water and sanitationInternal freshwater resources per capita (cu. m)Freshwater withdrawal
Total (% of internal resources)Agriculture (% of total freshwater withdrawal)
Access to improved water source (% of total population)Rural (% of rural population)Urban (% of urban population)
Access to improved sanitation (% of total population)Rural (% of rural population)Urban (% of urban population)
Environment and healthAcute resp. infection prevalence (% of children under five)Diarrhea prevalence (% of children under five)Under-five mortality rate (per 1,000 live births) National accounting aggregatesGross savings (% of GNI)Consumption of fixed capital (% of GNI)Education expenditure (% of GNI)Energy depletion (% of GNI)Mineral depletion (% of GNI)Net forest depletion (% of GNI)CO2 damage (% of GNI)Particulate emissions damage (% of GNI)Adjusted net savings (% of GNI)
200 2010 The Little Green Data Book
Population (millions) 9.2 Land area (1,000 sq. km) 410 GDP ($ billions) 479.0
Country data
High-income group
50,910 39,68885 780.5 1.00.4 0.7
8 3845,327 28,475
100 10154 341
67.1 28.90.0 –0.1
10.4 19.113
123
0.3
6.2 6.55,512 5,321
19.6 3.715,238 9,753
2.2 63.144.5 11.1
0.2 0.45.6 12.7
–0.7 18.012 26
879 1,166
18,692 9,305
1.7 10.49 43
100 100100 98100 100100 100100 99100 100
..
..3 7
27.1 18.512.5 13.8
6.4 4.60.0 2.00.4 0.20.0 0.00.1 0.20.0 0.1
20.5 6.8
Sweden

GNI per capita, World Bank Atlas method ($)Urban population (% of total)Urban population growth (average annual %, 1990–2008)Population growth (average annual %, 1990–2008) AgricultureAgricultural land (% of land area)Agricultural productivity (value added per worker, 2000 $)Food production index (1999–2001 = 100)Population density, rural (people/sq. km of arable land) Forests and biodiversityForest area (% of land area)Deforestation (average annual %, 1990–2007)Nationally protected area (% of land area)Threatened species, mammalsThreatened species, birdsThreatened species, fishThreatened species, higher plantsGEF benefits index for biodiversity (0–100, median is 1.5) EnergyGDP per unit of energy use (2005 PPP $/kg oil equivalent)Energy use per capita (kg oil equivalent)Energy from biomass products and waste (% of total)Electric power consumption per capita (kWh)Electricity generated using fossil fuel (% of total)Electricity generated by hydropower (% of total) Emissions and pollutionCO2 emissions per unit of GDP (kg/2005 PPP $)CO2 emissions per capita (metric tons)CO2 emissions growth (%, 1990–2006)Particulate matter (urban-pop.-weighted avg., μg/cu. m)Transport sector energy use per capita (kg of oil equivalent) Water and sanitationInternal freshwater resources per capita (cu. m)Freshwater withdrawal
Total (% of internal resources)Agriculture (% of total freshwater withdrawal)
Access to improved water source (% of total population)Rural (% of rural population)Urban (% of urban population)
Access to improved sanitation (% of total population)Rural (% of rural population)Urban (% of urban population)
Environment and healthAcute resp. infection prevalence (% of children under five)Diarrhea prevalence (% of children under five)Under-five mortality rate (per 1,000 live births) National accounting aggregatesGross savings (% of GNI)Consumption of fixed capital (% of GNI)Education expenditure (% of GNI)Energy depletion (% of GNI)Mineral depletion (% of GNI)Net forest depletion (% of GNI)CO2 damage (% of GNI)Particulate emissions damage (% of GNI)Adjusted net savings (% of GNI)
201The Little Green Data Book 2010
55,510 39,68873 780.7 1.00.7 0.7
39 3823,837 28,475
103 101492 341
30.7 28.9–0.4 –0.128.6 19.1
22
113
0.2
11.0 6.53,406 5,321
8.2 3.78,164 9,753
1.4 63.153.0 11.1
0.2 0.45.6 12.7
–2.7 18.026 26
791 1,166
5,350 9,305
6.4 10.42 43
100 100100 98100 100100 100100 99100 100
..
..5 7
.. 18.513.3 13.8
4.7 4.60.0 2.00.0 0.20.0 0.00.1 0.20.1 0.1
.. 6.8
Country data
High-income group
Population (millions) 7.6 Land area (1,000 sq. km) 40 GDP ($ billions) 491.9
Switzerland

GNI per capita, World Bank Atlas method ($)Urban population (% of total)Urban population growth (average annual %, 1990–2008)Population growth (average annual %, 1990–2008) AgricultureAgricultural land (% of land area)Agricultural productivity (value added per worker, 2000 $)Food production index (1999–2001 = 100)Population density, rural (people/sq. km of arable land) Forests and biodiversityForest area (% of land area)Deforestation (average annual %, 1990–2007)Nationally protected area (% of land area)Threatened species, mammalsThreatened species, birdsThreatened species, fishThreatened species, higher plantsGEF benefits index for biodiversity (0–100, median is 1.5) EnergyGDP per unit of energy use (2005 PPP $/kg oil equivalent)Energy use per capita (kg oil equivalent)Energy from biomass products and waste (% of total)Electric power consumption per capita (kWh)Electricity generated using fossil fuel (% of total)Electricity generated by hydropower (% of total) Emissions and pollutionCO2 emissions per unit of GDP (kg/2005 PPP $)CO2 emissions per capita (metric tons)CO2 emissions growth (%, 1990–2006)Particulate matter (urban-pop.-weighted avg., μg/cu. m)Transport sector energy use per capita (kg of oil equivalent) Water and sanitationInternal freshwater resources per capita (cu. m)Freshwater withdrawal
Total (% of internal resources)Agriculture (% of total freshwater withdrawal)
Access to improved water source (% of total population)Rural (% of rural population)Urban (% of urban population)
Access to improved sanitation (% of total population)Rural (% of rural population)Urban (% of urban population)
Environment and healthAcute resp. infection prevalence (% of children under five)Diarrhea prevalence (% of children under five)Under-five mortality rate (per 1,000 live births) National accounting aggregatesGross savings (% of GNI)Consumption of fixed capital (% of GNI)Education expenditure (% of GNI)Energy depletion (% of GNI)Mineral depletion (% of GNI)Net forest depletion (% of GNI)CO2 damage (% of GNI)Particulate emissions damage (% of GNI)Adjusted net savings (% of GNI)
202 2010 The Little Green Data Book
Population (millions) 21 Land area (1,000 sq. km) 184 GDP ($ billions) 55.2
Country data
Middle East &
N. Africa group
Lower middle-income group
2,160 3,237 2,07354 57 413.2 2.6 3.02.7 2.0 1.4
76 23 504,394 2,896 589
120 120 123196 746 516
2.6 2.5 24.8–1.4 –0.4 0.20.7 3.8 11.21613270
0.9
4.2 5.0 3.9978 1,275 1,0130.0 1.1 16.3
1,469 1,435 1,31090.9 91.1 80.0
9.1 7.4 15.2
0.9 0.6 0.83.5 3.5 2.8
82.8 96.4 105.775 72 69
208 258 97
349 714 3,154
238.4 122.3 8.788 86 8189 88 8683 81 8195 95 9492 74 5288 59 4196 89 69
18.08.616 34 64
12.6 .. 41.110.1 10.5 9.62.6 4.4 2.3
17.6 18.6 8.11.1 1.5 1.40.0 0.1 0.21.1 0.7 1.10.7 0.4 0.6
–15.2 .. 22.4
Syrian Arab Republic

GNI per capita, World Bank Atlas method ($)Urban population (% of total)Urban population growth (average annual %, 1990–2008)Population growth (average annual %, 1990–2008) AgricultureAgricultural land (% of land area)Agricultural productivity (value added per worker, 2000 $)Food production index (1999–2001 = 100)Population density, rural (people/sq. km of arable land) Forests and biodiversityForest area (% of land area)Deforestation (average annual %, 1990–2007)Nationally protected area (% of land area)Threatened species, mammalsThreatened species, birdsThreatened species, fishThreatened species, higher plantsGEF benefits index for biodiversity (0–100, median is 1.5) EnergyGDP per unit of energy use (2005 PPP $/kg oil equivalent)Energy use per capita (kg oil equivalent)Energy from biomass products and waste (% of total)Electric power consumption per capita (kWh)Electricity generated using fossil fuel (% of total)Electricity generated by hydropower (% of total) Emissions and pollutionCO2 emissions per unit of GDP (kg/2005 PPP $)CO2 emissions per capita (metric tons)CO2 emissions growth (%, 1990–2006)Particulate matter (urban-pop.-weighted avg., μg/cu. m)Transport sector energy use per capita (kg of oil equivalent) Water and sanitationInternal freshwater resources per capita (cu. m)Freshwater withdrawal
Total (% of internal resources)Agriculture (% of total freshwater withdrawal)
Access to improved water source (% of total population)Rural (% of rural population)Urban (% of urban population)
Access to improved sanitation (% of total population)Rural (% of rural population)Urban (% of urban population)
Environment and healthAcute resp. infection prevalence (% of children under five)Diarrhea prevalence (% of children under five)Under-five mortality rate (per 1,000 live births) National accounting aggregatesGross savings (% of GNI)Consumption of fixed capital (% of GNI)Education expenditure (% of GNI)Energy depletion (% of GNI)Mineral depletion (% of GNI)Net forest depletion (% of GNI)CO2 damage (% of GNI)Particulate emissions damage (% of GNI)Adjusted net savings (% of GNI)
203The Little Green Data Book 2010
600 7,350 52326 64 290.4 0.2 3.51.4 0.1 2.2
33 28 38524 2,797 318166 113 125697 144 666
2.9 38.4 24.70.0 0.0 0.7
13.7 7.8 11.9898
140.7
2.9 3.7 3.2580 2,948 4230.0 2.1 49.3
2,176 3,958 3242.2 68.9 41.6
97.8 16.2 41.9
0.6 0.7 0.41.0 7.3 0.5
–73.4 –30.0 –6.050 27 65
225 376 37
9,855 11,867 5,004
18.0 7.2 9.492 60 8867 95 6758 88 6093 99 8692 89 3891 79 3395 94 52
1.020.8
64 22 118
25.5 24.8 25.98.2 12.1 7.93.2 4.1 3.40.4 12.1 7.80.0 0.6 1.00.0 0.0 1.01.1 0.8 0.70.3 0.2 0.3
18.8 3.2 10.7
Country data
Europe & Central
Asia group
Low-income group
Population (millions) 6.8 Land area (1,000 sq. km) 140 GDP ($ billions) 5.1
Tajikistan

GNI per capita, World Bank Atlas method ($)Urban population (% of total)Urban population growth (average annual %, 1990–2008)Population growth (average annual %, 1990–2008) AgricultureAgricultural land (% of land area)Agricultural productivity (value added per worker, 2000 $)Food production index (1999–2001 = 100)Population density, rural (people/sq. km of arable land) Forests and biodiversityForest area (% of land area)Deforestation (average annual %, 1990–2007)Nationally protected area (% of land area)Threatened species, mammalsThreatened species, birdsThreatened species, fishThreatened species, higher plantsGEF benefits index for biodiversity (0–100, median is 1.5) EnergyGDP per unit of energy use (2005 PPP $/kg oil equivalent)Energy use per capita (kg oil equivalent)Energy from biomass products and waste (% of total)Electric power consumption per capita (kWh)Electricity generated using fossil fuel (% of total)Electricity generated by hydropower (% of total) Emissions and pollutionCO2 emissions per unit of GDP (kg/2005 PPP $)CO2 emissions per capita (metric tons)CO2 emissions growth (%, 1990–2006)Particulate matter (urban-pop.-weighted avg., μg/cu. m)Transport sector energy use per capita (kg of oil equivalent) Water and sanitationInternal freshwater resources per capita (cu. m)Freshwater withdrawal
Total (% of internal resources)Agriculture (% of total freshwater withdrawal)
Access to improved water source (% of total population)Rural (% of rural population)Urban (% of urban population)
Access to improved sanitation (% of total population)Rural (% of rural population)Urban (% of urban population)
Environment and healthAcute resp. infection prevalence (% of children under five)Diarrhea prevalence (% of children under five)Under-five mortality rate (per 1,000 live births) National accounting aggregatesGross savings (% of GNI)Consumption of fixed capital (% of GNI)Education expenditure (% of GNI)Energy depletion (% of GNI)Mineral depletion (% of GNI)Net forest depletion (% of GNI)CO2 damage (% of GNI)Particulate emissions damage (% of GNI)Adjusted net savings (% of GNI)
204 2010 The Little Green Data Book
Population (millions) 42 Land area (1,000 sq. km) 886 GDP ($ billions) 20.5
Country data
Sub-Saharan Africa group
Low-income group
440 1,077 52326 36 29
4.5 4.0 3.52.8 2.6 2.2
39 45 38326 330 318132 119 125344 353 666
38.9 26.1 24.71.1 0.7 0.7
38.8 12.4 11.93440
13824014.8
2.5 3.2 3.2443 662 42388.6 55.8 49.3
82 550 32439.9 67.0 41.660.1 16.9 41.9
0.1 0.5 0.40.1 0.8 0.5
126.4 37.4 –6.025 53 6524 61 37
2,035 4,829 5,004
6.2 3.2 9.489 87 8855 58 6746 46 6081 81 8633 31 3834 24 3331 42 52
8.112.6104 144 118
.. 16.5 25.97.6 9.0 7.92.4 3.3 3.40.7 14.2 7.85.0 1.3 1.00.0 0.6 1.00.2 0.6 0.70.1 0.4 0.3
.. –6.2 10.7
Tanzania

GNI per capita, World Bank Atlas method ($)Urban population (% of total)Urban population growth (average annual %, 1990–2008)Population growth (average annual %, 1990–2008) AgricultureAgricultural land (% of land area)Agricultural productivity (value added per worker, 2000 $)Food production index (1999–2001 = 100)Population density, rural (people/sq. km of arable land) Forests and biodiversityForest area (% of land area)Deforestation (average annual %, 1990–2007)Nationally protected area (% of land area)Threatened species, mammalsThreatened species, birdsThreatened species, fishThreatened species, higher plantsGEF benefits index for biodiversity (0–100, median is 1.5) EnergyGDP per unit of energy use (2005 PPP $/kg oil equivalent)Energy use per capita (kg oil equivalent)Energy from biomass products and waste (% of total)Electric power consumption per capita (kWh)Electricity generated using fossil fuel (% of total)Electricity generated by hydropower (% of total) Emissions and pollutionCO2 emissions per unit of GDP (kg/2005 PPP $)CO2 emissions per capita (metric tons)CO2 emissions growth (%, 1990–2006)Particulate matter (urban-pop.-weighted avg., μg/cu. m)Transport sector energy use per capita (kg of oil equivalent) Water and sanitationInternal freshwater resources per capita (cu. m)Freshwater withdrawal
Total (% of internal resources)Agriculture (% of total freshwater withdrawal)
Access to improved water source (% of total population)Rural (% of rural population)Urban (% of urban population)
Access to improved sanitation (% of total population)Rural (% of rural population)Urban (% of urban population)
Environment and healthAcute resp. infection prevalence (% of children under five)Diarrhea prevalence (% of children under five)Under-five mortality rate (per 1,000 live births) National accounting aggregatesGross savings (% of GNI)Consumption of fixed capital (% of GNI)Education expenditure (% of GNI)Energy depletion (% of GNI)Mineral depletion (% of GNI)Net forest depletion (% of GNI)CO2 damage (% of GNI)Particulate emissions damage (% of GNI)Adjusted net savings (% of GNI)
205The Little Green Data Book 2010
3,670 2,644 2,07333 44 411.7 3.4 3.01.0 1.0 1.4
39 50 50675 509 589121 127 123295 552 516
28.2 28.5 24.80.6 0.1 0.2
20.4 14.7 11.2574450868.0
4.7 3.6 3.91,553 1,295 1,013
17.8 12.8 16.32,055 1,883 1,310
91.4 82.2 80.05.7 14.7 15.2
0.6 0.9 0.84.1 3.8 2.8
184.4 135.9 105.771 69 69
272 113 97
3,135 4,940 3,154
41.5 10.2 8.795 74 8198 87 8697 81 8199 96 9496 66 5296 59 4195 75 69
..
..14 29 64
30.7 47.3 41.110.9 10.1 9.64.8 2.0 2.35.3 7.2 8.10.0 1.5 1.40.2 0.0 0.20.8 1.1 1.10.2 0.7 0.6
18.0 28.6 22.4
Country data
East Asia & Pacific
group
Lower middle-income group
Population (millions) 67 Land area (1,000 sq. km) 511 GDP ($ billions) 272.4
Thailand

GNI per capita, World Bank Atlas method ($)Urban population (% of total)Urban population growth (average annual %, 1990–2008)Population growth (average annual %, 1990–2008) AgricultureAgricultural land (% of land area)Agricultural productivity (value added per worker, 2000 $)Food production index (1999–2001 = 100)Population density, rural (people/sq. km of arable land) Forests and biodiversityForest area (% of land area)Deforestation (average annual %, 1990–2007)Nationally protected area (% of land area)Threatened species, mammalsThreatened species, birdsThreatened species, fishThreatened species, higher plantsGEF benefits index for biodiversity (0–100, median is 1.5) EnergyGDP per unit of energy use (2005 PPP $/kg oil equivalent)Energy use per capita (kg oil equivalent)Energy from biomass products and waste (% of total)Electric power consumption per capita (kWh)Electricity generated using fossil fuel (% of total)Electricity generated by hydropower (% of total) Emissions and pollutionCO2 emissions per unit of GDP (kg/2005 PPP $)CO2 emissions per capita (metric tons)CO2 emissions growth (%, 1990–2006)Particulate matter (urban-pop.-weighted avg., μg/cu. m)Transport sector energy use per capita (kg of oil equivalent) Water and sanitationInternal freshwater resources per capita (cu. m)Freshwater withdrawal
Total (% of internal resources)Agriculture (% of total freshwater withdrawal)
Access to improved water source (% of total population)Rural (% of rural population)Urban (% of urban population)
Access to improved sanitation (% of total population)Rural (% of rural population)Urban (% of urban population)
Environment and healthAcute resp. infection prevalence (% of children under five)Diarrhea prevalence (% of children under five)Under-five mortality rate (per 1,000 live births) National accounting aggregatesGross savings (% of GNI)Consumption of fixed capital (% of GNI)Education expenditure (% of GNI)Energy depletion (% of GNI)Mineral depletion (% of GNI)Net forest depletion (% of GNI)CO2 damage (% of GNI)Particulate emissions damage (% of GNI)Adjusted net savings (% of GNI)
206 2010 The Little Green Data Book
Population (millions) 1.1 Land area (1,000 sq. km) 15 GDP ($ billions) 498
Country data
East Asia & Pacific
group
Lower middle-income group
2,460 2,644 2,07327 44 413.7 3.4 3.02.2 1.0 1.4
26 50 50.. 509 589
108 127 123458 552 516
52.2 28.5 24.81.3 0.1 0.2
14.6 14.7 11.24550
0.6
.. 3.6 3.9
.. 1,295 1,013
.. 12.8 16.3
.. 1,883 1,310
.. 82.2 80.0
.. 14.7 15.2
0.3 0.9 0.80.2 3.8 2.8
.. 135.9 105.7
.. 69 69
.. 113 97
.. 4,940 3,154
.. 10.2 8.7
.. 74 8162 87 8656 81 8177 96 9441 66 5232 59 4164 75 69
14.0..
93 29 64
.. 47.3 41.11.2 10.1 9.60.9 2.0 2.30.0 7.2 8.10.0 1.5 1.4
.. 0.0 0.20.1 1.1 1.1
.. 0.7 0.6
.. 28.6 22.4
Timor-Leste

GNI per capita, World Bank Atlas method ($)Urban population (% of total)Urban population growth (average annual %, 1990–2008)Population growth (average annual %, 1990–2008) AgricultureAgricultural land (% of land area)Agricultural productivity (value added per worker, 2000 $)Food production index (1999–2001 = 100)Population density, rural (people/sq. km of arable land) Forests and biodiversityForest area (% of land area)Deforestation (average annual %, 1990–2007)Nationally protected area (% of land area)Threatened species, mammalsThreatened species, birdsThreatened species, fishThreatened species, higher plantsGEF benefits index for biodiversity (0–100, median is 1.5) EnergyGDP per unit of energy use (2005 PPP $/kg oil equivalent)Energy use per capita (kg oil equivalent)Energy from biomass products and waste (% of total)Electric power consumption per capita (kWh)Electricity generated using fossil fuel (% of total)Electricity generated by hydropower (% of total) Emissions and pollutionCO2 emissions per unit of GDP (kg/2005 PPP $)CO2 emissions per capita (metric tons)CO2 emissions growth (%, 1990–2006)Particulate matter (urban-pop.-weighted avg., μg/cu. m)Transport sector energy use per capita (kg of oil equivalent) Water and sanitationInternal freshwater resources per capita (cu. m)Freshwater withdrawal
Total (% of internal resources)Agriculture (% of total freshwater withdrawal)
Access to improved water source (% of total population)Rural (% of rural population)Urban (% of urban population)
Access to improved sanitation (% of total population)Rural (% of rural population)Urban (% of urban population)
Environment and healthAcute resp. infection prevalence (% of children under five)Diarrhea prevalence (% of children under five)Under-five mortality rate (per 1,000 live births) National accounting aggregatesGross savings (% of GNI)Consumption of fixed capital (% of GNI)Education expenditure (% of GNI)Energy depletion (% of GNI)Mineral depletion (% of GNI)Net forest depletion (% of GNI)CO2 damage (% of GNI)Particulate emissions damage (% of GNI)Adjusted net savings (% of GNI)
207The Little Green Data Book 2010
410 1,077 52342 36 294.6 4.0 3.52.8 2.6 2.2
67 45 38394 330 318121 119 125150 353 666
6.4 26.1 24.73.9 0.7 0.7
11.1 12.4 11.9102
1610
0.3
2.0 3.2 3.2390 662 42385.1 55.8 49.3
96 550 32448.0 67.0 41.646.9 16.9 41.9
0.3 0.5 0.40.2 0.8 0.5
57.8 37.4 –6.035 53 6534 61 37
1,825 4,829 5,004
1.5 3.2 9.445 87 8859 58 6740 46 6086 81 8612 31 38
3 24 3324 42 52
9.031.1
98 144 118
.. 16.5 25.97.3 9.0 7.93.7 3.3 3.40.0 14.2 7.85.2 1.3 1.02.5 0.6 1.00.4 0.6 0.70.1 0.4 0.3
.. –6.2 10.7
Country data
Sub-Saharan Africa group
Low-income group
Population (millions) 6.5 Land area (1,000 sq. km) 54 GDP ($ billions) 2.9
Togo

GNI per capita, World Bank Atlas method ($)Urban population (% of total)Urban population growth (average annual %, 1990–2008)Population growth (average annual %, 1990–2008) AgricultureAgricultural land (% of land area)Agricultural productivity (value added per worker, 2000 $)Food production index (1999–2001 = 100)Population density, rural (people/sq. km of arable land) Forests and biodiversityForest area (% of land area)Deforestation (average annual %, 1990–2007)Nationally protected area (% of land area)Threatened species, mammalsThreatened species, birdsThreatened species, fishThreatened species, higher plantsGEF benefits index for biodiversity (0–100, median is 1.5) EnergyGDP per unit of energy use (2005 PPP $/kg oil equivalent)Energy use per capita (kg oil equivalent)Energy from biomass products and waste (% of total)Electric power consumption per capita (kWh)Electricity generated using fossil fuel (% of total)Electricity generated by hydropower (% of total) Emissions and pollutionCO2 emissions per unit of GDP (kg/2005 PPP $)CO2 emissions per capita (metric tons)CO2 emissions growth (%, 1990–2006)Particulate matter (urban-pop.-weighted avg., μg/cu. m)Transport sector energy use per capita (kg of oil equivalent) Water and sanitationInternal freshwater resources per capita (cu. m)Freshwater withdrawal
Total (% of internal resources)Agriculture (% of total freshwater withdrawal)
Access to improved water source (% of total population)Rural (% of rural population)Urban (% of urban population)
Access to improved sanitation (% of total population)Rural (% of rural population)Urban (% of urban population)
Environment and healthAcute resp. infection prevalence (% of children under five)Diarrhea prevalence (% of children under five)Under-five mortality rate (per 1,000 live births) National accounting aggregatesGross savings (% of GNI)Consumption of fixed capital (% of GNI)Education expenditure (% of GNI)Energy depletion (% of GNI)Mineral depletion (% of GNI)Net forest depletion (% of GNI)CO2 damage (% of GNI)Particulate emissions damage (% of GNI)Adjusted net savings (% of GNI)
208 2010 The Little Green Data Book
Population (thousands) 104 Land area (sq. km) 720 GDP ($ millions) 278
Country data
East Asia & Pacific
group
Lower middle-income group
2,690 2,644 2,07325 44 411.0 3.4 3.00.5 1.0 1.4
43 50 503,285 509 589
104 127 123519 552 516
5.0 28.5 24.80.0 0.1 0.2
25.5 14.7 11.22494
1.0
.. 3.6 3.9
.. 1,295 1,013
.. 12.8 16.3
.. 1,883 1,310
.. 82.2 80.0
.. 14.7 15.2
0.4 0.9 0.81.3 3.8 2.8
71.4 135.9 105.7.. 69 69.. 113 97
.. 4,940 3,154
.. 10.2 8.7
.. 74 81100 87 86100 81 81100 96 94
96 66 5296 59 4198 75 69
..
..19 29 64
1.5 47.3 41.19.5 10.1 9.63.8 2.0 2.30.0 7.2 8.10.0 1.5 1.40.0 0.0 0.20.3 1.1 1.1
.. 0.7 0.6—4.5 28.6 22.4
Tonga

GNI per capita, World Bank Atlas method ($)Urban population (% of total)Urban population growth (average annual %, 1990–2008)Population growth (average annual %, 1990–2008) AgricultureAgricultural land (% of land area)Agricultural productivity (value added per worker, 2000 $)Food production index (1999–2001 = 100)Population density, rural (people/sq. km of arable land) Forests and biodiversityForest area (% of land area)Deforestation (average annual %, 1990–2007)Nationally protected area (% of land area)Threatened species, mammalsThreatened species, birdsThreatened species, fishThreatened species, higher plantsGEF benefits index for biodiversity (0–100, median is 1.5) EnergyGDP per unit of energy use (2005 PPP $/kg oil equivalent)Energy use per capita (kg oil equivalent)Energy from biomass products and waste (% of total)Electric power consumption per capita (kWh)Electricity generated using fossil fuel (% of total)Electricity generated by hydropower (% of total) Emissions and pollutionCO2 emissions per unit of GDP (kg/2005 PPP $)CO2 emissions per capita (metric tons)CO2 emissions growth (%, 1990–2006)Particulate matter (urban-pop.-weighted avg., μg/cu. m)Transport sector energy use per capita (kg of oil equivalent) Water and sanitationInternal freshwater resources per capita (cu. m)Freshwater withdrawal
Total (% of internal resources)Agriculture (% of total freshwater withdrawal)
Access to improved water source (% of total population)Rural (% of rural population)Urban (% of urban population)
Access to improved sanitation (% of total population)Rural (% of rural population)Urban (% of urban population)
Environment and healthAcute resp. infection prevalence (% of children under five)Diarrhea prevalence (% of children under five)Under-five mortality rate (per 1,000 live births) National accounting aggregatesGross savings (% of GNI)Consumption of fixed capital (% of GNI)Education expenditure (% of GNI)Energy depletion (% of GNI)Mineral depletion (% of GNI)Net forest depletion (% of GNI)CO2 damage (% of GNI)Particulate emissions damage (% of GNI)Adjusted net savings (% of GNI)
209The Little Green Data Book 2010
16,590 39,68813 78
3.0 1.00.5 0.7
11 381,298 28,475
109 1014,629 341
43.9 28.90.3 –0.1
35.0 19.122
191
2.2
2.0 6.511,506 5,321
0.1 3.75,642 9,753
99.9 63.10.0 11.1
1.2 0.425.4 12.798.1 18.0101 26548 1,166
2,891 9,305
8.1 10.46 43
94 10093 9897 10092 10092 9992 100
3.0..
35 7
41.8 18.513.1 13.84.0 4.6
50.5 2.00.0 0.20.0 0.01.2 0.20.2 0.1
–19.2 6.8
Country data
High-income group
Population (millions) 1.3 Land area (1,000 sq. km) 5 GDP ($ billions) 24.1
Trinidad and Tobago

GNI per capita, World Bank Atlas method ($)Urban population (% of total)Urban population growth (average annual %, 1990–2008)Population growth (average annual %, 1990–2008) AgricultureAgricultural land (% of land area)Agricultural productivity (value added per worker, 2000 $)Food production index (1999–2001 = 100)Population density, rural (people/sq. km of arable land) Forests and biodiversityForest area (% of land area)Deforestation (average annual %, 1990–2007)Nationally protected area (% of land area)Threatened species, mammalsThreatened species, birdsThreatened species, fishThreatened species, higher plantsGEF benefits index for biodiversity (0–100, median is 1.5) EnergyGDP per unit of energy use (2005 PPP $/kg oil equivalent)Energy use per capita (kg oil equivalent)Energy from biomass products and waste (% of total)Electric power consumption per capita (kWh)Electricity generated using fossil fuel (% of total)Electricity generated by hydropower (% of total) Emissions and pollutionCO2 emissions per unit of GDP (kg/2005 PPP $)CO2 emissions per capita (metric tons)CO2 emissions growth (%, 1990–2006)Particulate matter (urban-pop.-weighted avg., μg/cu. m)Transport sector energy use per capita (kg of oil equivalent) Water and sanitationInternal freshwater resources per capita (cu. m)Freshwater withdrawal
Total (% of internal resources)Agriculture (% of total freshwater withdrawal)
Access to improved water source (% of total population)Rural (% of rural population)Urban (% of urban population)
Access to improved sanitation (% of total population)Rural (% of rural population)Urban (% of urban population)
Environment and healthAcute resp. infection prevalence (% of children under five)Diarrhea prevalence (% of children under five)Under-five mortality rate (per 1,000 live births) National accounting aggregatesGross savings (% of GNI)Consumption of fixed capital (% of GNI)Education expenditure (% of GNI)Energy depletion (% of GNI)Mineral depletion (% of GNI)Net forest depletion (% of GNI)CO2 damage (% of GNI)Particulate emissions damage (% of GNI)Adjusted net savings (% of GNI)
210 2010 The Little Green Data Book
Population (millions) 10 Land area (1,000 sq. km) 155 GDP ($ billions) 40.3
Country data
Middle East &
N. Africa group
Lower middle-income group
3,480 3,237 2,07367 57 412.1 2.6 3.01.3 2.0 1.4
63 23 503,497 2,896 589
118 120 123126 746 516
7.0 2.5 24.8–3.2 –0.4 0.21.5 3.8 11.2148
200
0.5
8.2 5.0 3.9864 1,275 1,01313.6 1.1 16.3
1,248 1,435 1,31099.4 91.1 80.00.3 7.4 15.2
0.3 0.6 0.82.3 3.5 2.8
74.3 96.4 105.730 72 69
156 258 97
410 714 3,154
62.9 122.3 8.782 86 8194 88 8684 81 8199 95 9485 74 5264 59 4196 89 69
9.05.821 34 64
22.6 .. 41.111.1 10.5 9.66.7 4.4 2.35.8 18.6 8.14.7 1.5 1.40.1 0.1 0.20.5 0.7 1.10.1 0.4 0.67.0 .. 22.4
Tunisia

GNI per capita, World Bank Atlas method ($)Urban population (% of total)Urban population growth (average annual %, 1990–2008)Population growth (average annual %, 1990–2008) AgricultureAgricultural land (% of land area)Agricultural productivity (value added per worker, 2000 $)Food production index (1999–2001 = 100)Population density, rural (people/sq. km of arable land) Forests and biodiversityForest area (% of land area)Deforestation (average annual %, 1990–2007)Nationally protected area (% of land area)Threatened species, mammalsThreatened species, birdsThreatened species, fishThreatened species, higher plantsGEF benefits index for biodiversity (0–100, median is 1.5) EnergyGDP per unit of energy use (2005 PPP $/kg oil equivalent)Energy use per capita (kg oil equivalent)Energy from biomass products and waste (% of total)Electric power consumption per capita (kWh)Electricity generated using fossil fuel (% of total)Electricity generated by hydropower (% of total) Emissions and pollutionCO2 emissions per unit of GDP (kg/2005 PPP $)CO2 emissions per capita (metric tons)CO2 emissions growth (%, 1990–2006)Particulate matter (urban-pop.-weighted avg., μg/cu. m)Transport sector energy use per capita (kg of oil equivalent) Water and sanitationInternal freshwater resources per capita (cu. m)Freshwater withdrawal
Total (% of internal resources)Agriculture (% of total freshwater withdrawal)
Access to improved water source (% of total population)Rural (% of rural population)Urban (% of urban population)
Access to improved sanitation (% of total population)Rural (% of rural population)Urban (% of urban population)
Environment and healthAcute resp. infection prevalence (% of children under five)Diarrhea prevalence (% of children under five)Under-five mortality rate (per 1,000 live births) National accounting aggregatesGross savings (% of GNI)Consumption of fixed capital (% of GNI)Education expenditure (% of GNI)Energy depletion (% of GNI)Mineral depletion (% of GNI)Net forest depletion (% of GNI)CO2 damage (% of GNI)Particulate emissions damage (% of GNI)Adjusted net savings (% of GNI)
211The Little Green Data Book 2010
9,020 7,350 7,85269 64 752.4 0.2 1.51.5 0.1 1.0
51 28 303,153 2,797 3,399
101 113 120106 144 146
13.3 38.4 37.3–0.3 0.0 0.21.9 7.8 14.0171560
36.2
8.7 3.7 5.21,370 2,948 2,130
5.1 2.1 7.32,238 3,958 3,052
80.9 68.9 63.418.7 16.2 27.5
0.3 0.7 0.53.7 7.3 5.2
83.8 –30.0 –4.940 27 32
219 376 374
3,109 11,867 18,876
17.7 7.2 13.874 60 5897 95 9495 88 8298 99 9888 89 8272 79 6396 94 89
29.029.7
22 22 23
17.7 24.8 23.811.8 12.1 12.1
3.7 4.1 4.20.3 12.1 9.40.1 0.6 1.30.0 0.0 0.00.3 0.8 0.50.6 0.2 0.28.3 3.2 4.6
Country data
Europe & Central
Asia group
Upper middle-income group
Population (millions) 74 Land area (1,000 sq. km) 770 GDP ($ billions) 734.9
Turkey

GNI per capita, World Bank Atlas method ($)Urban population (% of total)Urban population growth (average annual %, 1990–2008)Population growth (average annual %, 1990–2008) AgricultureAgricultural land (% of land area)Agricultural productivity (value added per worker, 2000 $)Food production index (1999–2001 = 100)Population density, rural (people/sq. km of arable land) Forests and biodiversityForest area (% of land area)Deforestation (average annual %, 1990–2007)Nationally protected area (% of land area)Threatened species, mammalsThreatened species, birdsThreatened species, fishThreatened species, higher plantsGEF benefits index for biodiversity (0–100, median is 1.5) EnergyGDP per unit of energy use (2005 PPP $/kg oil equivalent)Energy use per capita (kg oil equivalent)Energy from biomass products and waste (% of total)Electric power consumption per capita (kWh)Electricity generated using fossil fuel (% of total)Electricity generated by hydropower (% of total) Emissions and pollutionCO2 emissions per unit of GDP (kg/2005 PPP $)CO2 emissions per capita (metric tons)CO2 emissions growth (%, 1990–2006)Particulate matter (urban-pop.-weighted avg., μg/cu. m)Transport sector energy use per capita (kg of oil equivalent) Water and sanitationInternal freshwater resources per capita (cu. m)Freshwater withdrawal
Total (% of internal resources)Agriculture (% of total freshwater withdrawal)
Access to improved water source (% of total population)Rural (% of rural population)Urban (% of urban population)
Access to improved sanitation (% of total population)Rural (% of rural population)Urban (% of urban population)
Environment and healthAcute resp. infection prevalence (% of children under five)Diarrhea prevalence (% of children under five)Under-five mortality rate (per 1,000 live births) National accounting aggregatesGross savings (% of GNI)Consumption of fixed capital (% of GNI)Education expenditure (% of GNI)Energy depletion (% of GNI)Mineral depletion (% of GNI)Net forest depletion (% of GNI)CO2 damage (% of GNI)Particulate emissions damage (% of GNI)Adjusted net savings (% of GNI)
212 2010 The Little Green Data Book
Population (millions) 5.0 Land area (1,000 sq. km) 470 GDP ($ billions) 15.3
Country data
Europe & Central
Asia group
Lower middle-income group
2,840 7,350 2,07349 64 412.2 0.2 3.01.8 0.1 1.4
69 28 50305 2,797 589132 113 123139 144 516
8.8 38.4 24.80.0 0.0 0.22.6 7.8 11.2
91512
31.8
1.6 3.7 3.93,631 2,948 1,013
0.0 2.1 16.32,279 3,958 1,310100.0 68.9 80.0
0.0 16.2 15.2
1.7 0.7 0.89.0 7.3 2.8
39.3 –30.0 105.755 27 69
182 376 97
273 11,867 3,154
1812.5 7.2 8.798 60 81
.. 95 86
.. 88 81
.. 99 94
.. 89 52
.. 79 41
.. 94 69
1.03.248 22 64
32.1 24.8 41.110.9 12.1 9.6
.. 4.1 2.3133.3 12.1 8.1
0.0 0.6 1.4.. 0.0 0.2
3.1 0.8 1.10.6 0.2 0.6
.. 3.2 22.4
Turkmenistan
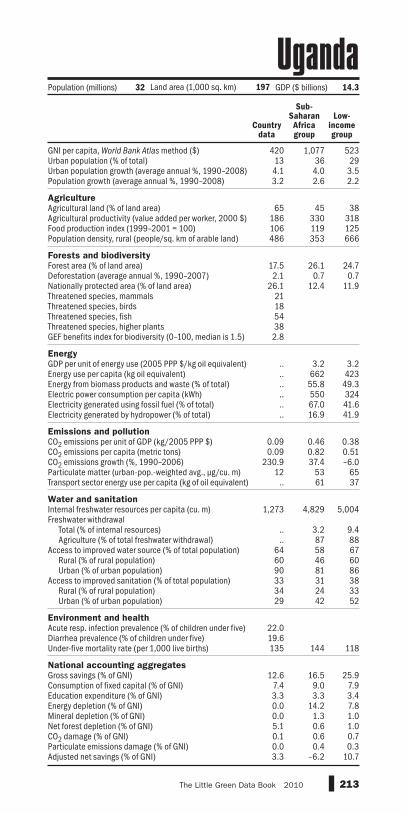
GNI per capita, World Bank Atlas method ($)Urban population (% of total)Urban population growth (average annual %, 1990–2008)Population growth (average annual %, 1990–2008) AgricultureAgricultural land (% of land area)Agricultural productivity (value added per worker, 2000 $)Food production index (1999–2001 = 100)Population density, rural (people/sq. km of arable land) Forests and biodiversityForest area (% of land area)Deforestation (average annual %, 1990–2007)Nationally protected area (% of land area)Threatened species, mammalsThreatened species, birdsThreatened species, fishThreatened species, higher plantsGEF benefits index for biodiversity (0–100, median is 1.5) EnergyGDP per unit of energy use (2005 PPP $/kg oil equivalent)Energy use per capita (kg oil equivalent)Energy from biomass products and waste (% of total)Electric power consumption per capita (kWh)Electricity generated using fossil fuel (% of total)Electricity generated by hydropower (% of total) Emissions and pollutionCO2 emissions per unit of GDP (kg/2005 PPP $)CO2 emissions per capita (metric tons)CO2 emissions growth (%, 1990–2006)Particulate matter (urban-pop.-weighted avg., μg/cu. m)Transport sector energy use per capita (kg of oil equivalent) Water and sanitationInternal freshwater resources per capita (cu. m)Freshwater withdrawal
Total (% of internal resources)Agriculture (% of total freshwater withdrawal)
Access to improved water source (% of total population)Rural (% of rural population)Urban (% of urban population)
Access to improved sanitation (% of total population)Rural (% of rural population)Urban (% of urban population)
Environment and healthAcute resp. infection prevalence (% of children under five)Diarrhea prevalence (% of children under five)Under-five mortality rate (per 1,000 live births) National accounting aggregatesGross savings (% of GNI)Consumption of fixed capital (% of GNI)Education expenditure (% of GNI)Energy depletion (% of GNI)Mineral depletion (% of GNI)Net forest depletion (% of GNI)CO2 damage (% of GNI)Particulate emissions damage (% of GNI)Adjusted net savings (% of GNI)
213The Little Green Data Book 2010
420 1,077 52313 36 294.1 4.0 3.53.2 2.6 2.2
65 45 38186 330 318106 119 125486 353 666
17.5 26.1 24.72.1 0.7 0.7
26.1 12.4 11.9211854382.8
.. 3.2 3.2
.. 662 423
.. 55.8 49.3
.. 550 324
.. 67.0 41.6
.. 16.9 41.9
0.09 0.46 0.380.09 0.82 0.51
230.9 37.4 –6.012 53 65
.. 61 37
1,273 4,829 5,004
.. 3.2 9.4
.. 87 8864 58 6760 46 6090 81 8633 31 3834 24 3329 42 52
22.019.6135 144 118
12.6 16.5 25.97.4 9.0 7.93.3 3.3 3.40.0 14.2 7.80.0 1.3 1.05.1 0.6 1.00.1 0.6 0.70.0 0.4 0.33.3 –6.2 10.7
Country data
Sub-Saharan Africa group
Low-income group
Population (millions) 32 Land area (1,000 sq. km) 197 GDP ($ billions) 14.3
Uganda

GNI per capita, World Bank Atlas method ($)Urban population (% of total)Urban population growth (average annual %, 1990–2008)Population growth (average annual %, 1990–2008) AgricultureAgricultural land (% of land area)Agricultural productivity (value added per worker, 2000 $)Food production index (1999–2001 = 100)Population density, rural (people/sq. km of arable land) Forests and biodiversityForest area (% of land area)Deforestation (average annual %, 1990–2007)Nationally protected area (% of land area)Threatened species, mammalsThreatened species, birdsThreatened species, fishThreatened species, higher plantsGEF benefits index for biodiversity (0–100, median is 1.5) EnergyGDP per unit of energy use (2005 PPP $/kg oil equivalent)Energy use per capita (kg oil equivalent)Energy from biomass products and waste (% of total)Electric power consumption per capita (kWh)Electricity generated using fossil fuel (% of total)Electricity generated by hydropower (% of total) Emissions and pollutionCO2 emissions per unit of GDP (kg/2005 PPP $)CO2 emissions per capita (metric tons)CO2 emissions growth (%, 1990–2006)Particulate matter (urban-pop.-weighted avg., μg/cu. m)Transport sector energy use per capita (kg of oil equivalent) Water and sanitationInternal freshwater resources per capita (cu. m)Freshwater withdrawal
Total (% of internal resources)Agriculture (% of total freshwater withdrawal)
Access to improved water source (% of total population)Rural (% of rural population)Urban (% of urban population)
Access to improved sanitation (% of total population)Rural (% of rural population)Urban (% of urban population)
Environment and healthAcute resp. infection prevalence (% of children under five)Diarrhea prevalence (% of children under five)Under-five mortality rate (per 1,000 live births) National accounting aggregatesGross savings (% of GNI)Consumption of fixed capital (% of GNI)Education expenditure (% of GNI)Energy depletion (% of GNI)Mineral depletion (% of GNI)Net forest depletion (% of GNI)CO2 damage (% of GNI)Particulate emissions damage (% of GNI)Adjusted net savings (% of GNI)
214 2010 The Little Green Data Book
Population (millions) 46 Land area (1,000 sq. km) 579 GDP ($ billions) 180.4
Country data
Europe & Central
Asia group
Lower middle-income group
3,210 7,350 2,07368 64 41
–0.5 0.2 3.0–0.6 0.1 1.4
71 28 502,019 2,797 589
108 113 12346 144 516
16.6 38.4 24.8–0.2 0.0 0.23.4 7.8 11.2111220
10.5
2.2 3.7 3.92,953 2,948 1,013
0.6 2.1 16.33,529 3,958 1,310
47.6 68.9 80.05.2 16.2 15.2
1.1 0.7 0.86.8 7.3 2.8
–53.7 –30.0 105.721 27 69
266 376 97
1,142 11,867 3,154
70.7 7.2 8.752 60 8197 95 8697 88 8197 99 9493 89 5283 79 4197 94 69
..
..16 22 64
20.2 24.8 41.110.5 12.1 9.65.9 4.1 2.35.3 12.1 8.10.0 0.6 1.40.0 0.0 0.21.6 0.8 1.10.2 0.2 0.68.5 3.2 22.4
Ukraine

GNI per capita, World Bank Atlas method ($)Urban population (% of total)Urban population growth (average annual %, 1990–2008)Population growth (average annual %, 1990–2008) AgricultureAgricultural land (% of land area)Agricultural productivity (value added per worker, 2000 $)Food production index (1999–2001 = 100)Population density, rural (people/sq. km of arable land) Forests and biodiversityForest area (% of land area)Deforestation (average annual %, 1990–2007)Nationally protected area (% of land area)Threatened species, mammalsThreatened species, birdsThreatened species, fishThreatened species, higher plantsGEF benefits index for biodiversity (0–100, median is 1.5) EnergyGDP per unit of energy use (2005 PPP $/kg oil equivalent)Energy use per capita (kg oil equivalent)Energy from biomass products and waste (% of total)Electric power consumption per capita (kWh)Electricity generated using fossil fuel (% of total)Electricity generated by hydropower (% of total) Emissions and pollutionCO2 emissions per unit of GDP (kg/2005 PPP $)CO2 emissions per capita (metric tons)CO2 emissions growth (%, 1990–2006)Particulate matter (urban-pop.-weighted avg., μg/cu. m)Transport sector energy use per capita (kg of oil equivalent) Water and sanitationInternal freshwater resources per capita (cu. m)Freshwater withdrawal
Total (% of internal resources)Agriculture (% of total freshwater withdrawal)
Access to improved water source (% of total population)Rural (% of rural population)Urban (% of urban population)
Access to improved sanitation (% of total population)Rural (% of rural population)Urban (% of urban population)
Environment and healthAcute resp. infection prevalence (% of children under five)Diarrhea prevalence (% of children under five)Under-five mortality rate (per 1,000 live births) National accounting aggregatesGross savings (% of GNI)Consumption of fixed capital (% of GNI)Education expenditure (% of GNI)Energy depletion (% of GNI)Mineral depletion (% of GNI)Net forest depletion (% of GNI)CO2 damage (% of GNI)Particulate emissions damage (% of GNI)Adjusted net savings (% of GNI)
215The Little Green Data Book 2010
26,360 39,68878 78
4.8 1.04.9 0.7
7 3830,334 28,475
55 1011,383 341
3.7 28.9–1.4 –0.10.3 19.1
7890
0.2
4.5 6.511,832 5,321
0.0 3.716,165 9,753100.0 63.1
0.0 11.1
0.6 0.432.9 12.7
154.6 18.0127 26
1,867 1,166
34 9,305
2,665.3 10.483 43
100 100100 98100 100
97 10095 9998 100
6.28.8
8 7
.. 18.5
.. 13.8
.. 4.6
.. 2.0
.. 0.2
.. 0.0
.. 0.2
.. 0.1
.. 6.8
Country data
High-income group
Population (millions) 4.5 Land area (1,000 sq. km) 84 GDP ($ billions) 198.7
United Arab Emirates
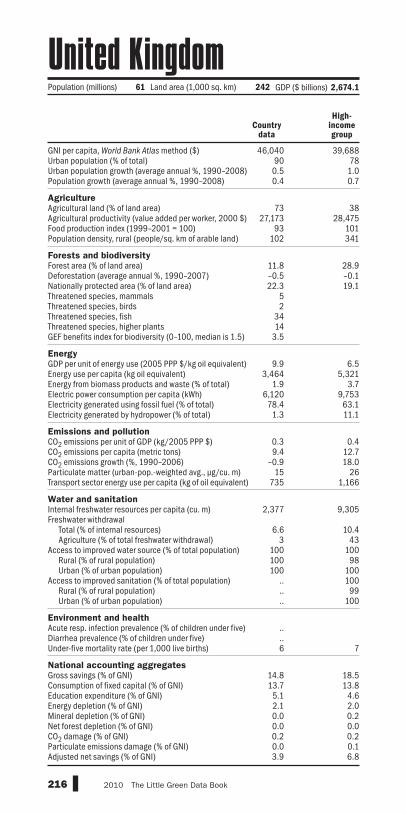
GNI per capita, World Bank Atlas method ($)Urban population (% of total)Urban population growth (average annual %, 1990–2008)Population growth (average annual %, 1990–2008) AgricultureAgricultural land (% of land area)Agricultural productivity (value added per worker, 2000 $)Food production index (1999–2001 = 100)Population density, rural (people/sq. km of arable land) Forests and biodiversityForest area (% of land area)Deforestation (average annual %, 1990–2007)Nationally protected area (% of land area)Threatened species, mammalsThreatened species, birdsThreatened species, fishThreatened species, higher plantsGEF benefits index for biodiversity (0–100, median is 1.5) EnergyGDP per unit of energy use (2005 PPP $/kg oil equivalent)Energy use per capita (kg oil equivalent)Energy from biomass products and waste (% of total)Electric power consumption per capita (kWh)Electricity generated using fossil fuel (% of total)Electricity generated by hydropower (% of total) Emissions and pollutionCO2 emissions per unit of GDP (kg/2005 PPP $)CO2 emissions per capita (metric tons)CO2 emissions growth (%, 1990–2006)Particulate matter (urban-pop.-weighted avg., μg/cu. m)Transport sector energy use per capita (kg of oil equivalent) Water and sanitationInternal freshwater resources per capita (cu. m)Freshwater withdrawal
Total (% of internal resources)Agriculture (% of total freshwater withdrawal)
Access to improved water source (% of total population)Rural (% of rural population)Urban (% of urban population)
Access to improved sanitation (% of total population)Rural (% of rural population)Urban (% of urban population)
Environment and healthAcute resp. infection prevalence (% of children under five)Diarrhea prevalence (% of children under five)Under-five mortality rate (per 1,000 live births) National accounting aggregatesGross savings (% of GNI)Consumption of fixed capital (% of GNI)Education expenditure (% of GNI)Energy depletion (% of GNI)Mineral depletion (% of GNI)Net forest depletion (% of GNI)CO2 damage (% of GNI)Particulate emissions damage (% of GNI)Adjusted net savings (% of GNI)
216 2010 The Little Green Data Book
Population (millions) 61 Land area (1,000 sq. km) 242 GDP ($ billions) 2,674.1
Country data
High-income group
46,040 39,68890 780.5 1.00.4 0.7
73 3827,173 28,475
93 101102 341
11.8 28.9–0.5 –0.122.3 19.1
52
3414
3.5
9.9 6.53,464 5,321
1.9 3.76,120 9,75378.4 63.1
1.3 11.1
0.3 0.49.4 12.7
–0.9 18.015 26
735 1,166
2,377 9,305
6.6 10.43 43
100 100100 98100 100
.. 100
.. 99
.. 100
..
..6 7
14.8 18.513.7 13.85.1 4.62.1 2.00.0 0.20.0 0.00.2 0.20.0 0.13.9 6.8
United Kingdom

GNI per capita, World Bank Atlas method ($)Urban population (% of total)Urban population growth (average annual %, 1990–2008)Population growth (average annual %, 1990–2008) AgricultureAgricultural land (% of land area)Agricultural productivity (value added per worker, 2000 $)Food production index (1999–2001 = 100)Population density, rural (people/sq. km of arable land) Forests and biodiversityForest area (% of land area)Deforestation (average annual %, 1990–2007)Nationally protected area (% of land area)Threatened species, mammalsThreatened species, birdsThreatened species, fishThreatened species, higher plantsGEF benefits index for biodiversity (0–100, median is 1.5) EnergyGDP per unit of energy use (2005 PPP $/kg oil equivalent)Energy use per capita (kg oil equivalent)Energy from biomass products and waste (% of total)Electric power consumption per capita (kWh)Electricity generated using fossil fuel (% of total)Electricity generated by hydropower (% of total) Emissions and pollutionCO2 emissions per unit of GDP (kg/2005 PPP $)CO2 emissions per capita (metric tons)CO2 emissions growth (%, 1990–2006)Particulate matter (urban-pop.-weighted avg., μg/cu. m)Transport sector energy use per capita (kg of oil equivalent) Water and sanitationInternal freshwater resources per capita (cu. m)Freshwater withdrawal
Total (% of internal resources)Agriculture (% of total freshwater withdrawal)
Access to improved water source (% of total population)Rural (% of rural population)Urban (% of urban population)
Access to improved sanitation (% of total population)Rural (% of rural population)Urban (% of urban population)
Environment and healthAcute resp. infection prevalence (% of children under five)Diarrhea prevalence (% of children under five)Under-five mortality rate (per 1,000 live births) National accounting aggregatesGross savings (% of GNI)Consumption of fixed capital (% of GNI)Education expenditure (% of GNI)Energy depletion (% of GNI)Mineral depletion (% of GNI)Net forest depletion (% of GNI)CO2 damage (% of GNI)Particulate emissions damage (% of GNI)Adjusted net savings (% of GNI)
217The Little Green Data Book 2010
46,350 39,68882 781.5 1.01.1 0.7
45 3845,418 28,475
109 10133 341
33.1 28.9–0.1 –0.127.1 19.1
3774
164244
94.2
5.5 6.57,766 5,321
3.5 3.713,652 9,753
72.0 63.15.8 11.1
0.5 0.419.3 12.718.2 18.0
21 262,110 1,166
9,293 9,305
17.1 10.441 4399 10094 98
100 100100 10099 99
100 100
..
..8 7
12.6 18.514.0 13.84.8 4.61.9 2.00.1 0.20.0 0.00.3 0.20.1 0.10.9 6.8
Country data
High-income group
Population (millions) 304 Land area (1,000 sq. km) 9,162 GDP ($ billions) 14,093.3
United States

GNI per capita, World Bank Atlas method ($)Urban population (% of total)Urban population growth (average annual %, 1990–2008)Population growth (average annual %, 1990–2008) AgricultureAgricultural land (% of land area)Agricultural productivity (value added per worker, 2000 $)Food production index (1999–2001 = 100)Population density, rural (people/sq. km of arable land) Forests and biodiversityForest area (% of land area)Deforestation (average annual %, 1990–2007)Nationally protected area (% of land area)Threatened species, mammalsThreatened species, birdsThreatened species, fishThreatened species, higher plantsGEF benefits index for biodiversity (0–100, median is 1.5) EnergyGDP per unit of energy use (2005 PPP $/kg oil equivalent)Energy use per capita (kg oil equivalent)Energy from biomass products and waste (% of total)Electric power consumption per capita (kWh)Electricity generated using fossil fuel (% of total)Electricity generated by hydropower (% of total) Emissions and pollutionCO2 emissions per unit of GDP (kg/2005 PPP $)CO2 emissions per capita (metric tons)CO2 emissions growth (%, 1990–2006)Particulate matter (urban-pop.-weighted avg., μg/cu. m)Transport sector energy use per capita (kg of oil equivalent) Water and sanitationInternal freshwater resources per capita (cu. m)Freshwater withdrawal
Total (% of internal resources)Agriculture (% of total freshwater withdrawal)
Access to improved water source (% of total population)Rural (% of rural population)Urban (% of urban population)
Access to improved sanitation (% of total population)Rural (% of rural population)Urban (% of urban population)
Environment and healthAcute resp. infection prevalence (% of children under five)Diarrhea prevalence (% of children under five)Under-five mortality rate (per 1,000 live births) National accounting aggregatesGross savings (% of GNI)Consumption of fixed capital (% of GNI)Education expenditure (% of GNI)Energy depletion (% of GNI)Mineral depletion (% of GNI)Net forest depletion (% of GNI)CO2 damage (% of GNI)Particulate emissions damage (% of GNI)Adjusted net savings (% of GNI)
218 2010 The Little Green Data Book
Population (millions) 3.3 Land area (1,000 sq. km) 175 GDP ($ billions) 32.2
Country data
Latin America & Caribbean
group
Upper middle-income group
8,260 6,768 7,85292 79 750.6 2.0 1.50.4 1.5 1.0
84 36 309,212 3,452 3,399
126 125 12019 233 146
8.8 44.9 37.3–3.2 0.5 0.20.4 22.8 14.0102428
11.2
11.4 7.5 5.2953 1,273 2,13016.4 16.3 7.3
2,197 1,866 3,05213.0 38.2 63.485.6 55.8 27.5
0.2 0.3 0.52.1 2.6 5.2
71.9 40.0 –4.9175 35 32252 317 374
17,750 24,004 18,876
5.3 2.0 13.896 71 58
100 91 94100 73 82100 97 98100 78 8299 51 63
100 86 89
..
..14 23 23
18.2 22.4 23.811.9 11.8 12.12.6 4.4 4.20.0 6.3 9.40.0 1.8 1.30.4 0.0 0.00.2 0.3 0.51.1 0.3 0.27.2 6.3 4.6
Uruguay

GNI per capita, World Bank Atlas method ($)Urban population (% of total)Urban population growth (average annual %, 1990–2008)Population growth (average annual %, 1990–2008) AgricultureAgricultural land (% of land area)Agricultural productivity (value added per worker, 2000 $)Food production index (1999–2001 = 100)Population density, rural (people/sq. km of arable land) Forests and biodiversityForest area (% of land area)Deforestation (average annual %, 1990–2007)Nationally protected area (% of land area)Threatened species, mammalsThreatened species, birdsThreatened species, fishThreatened species, higher plantsGEF benefits index for biodiversity (0–100, median is 1.5) EnergyGDP per unit of energy use (2005 PPP $/kg oil equivalent)Energy use per capita (kg oil equivalent)Energy from biomass products and waste (% of total)Electric power consumption per capita (kWh)Electricity generated using fossil fuel (% of total)Electricity generated by hydropower (% of total) Emissions and pollutionCO2 emissions per unit of GDP (kg/2005 PPP $)CO2 emissions per capita (metric tons)CO2 emissions growth (%, 1990–2006)Particulate matter (urban-pop.-weighted avg., μg/cu. m)Transport sector energy use per capita (kg of oil equivalent) Water and sanitationInternal freshwater resources per capita (cu. m)Freshwater withdrawal
Total (% of internal resources)Agriculture (% of total freshwater withdrawal)
Access to improved water source (% of total population)Rural (% of rural population)Urban (% of urban population)
Access to improved sanitation (% of total population)Rural (% of rural population)Urban (% of urban population)
Environment and healthAcute resp. infection prevalence (% of children under five)Diarrhea prevalence (% of children under five)Under-five mortality rate (per 1,000 live births) National accounting aggregatesGross savings (% of GNI)Consumption of fixed capital (% of GNI)Education expenditure (% of GNI)Energy depletion (% of GNI)Mineral depletion (% of GNI)Net forest depletion (% of GNI)CO2 damage (% of GNI)Particulate emissions damage (% of GNI)Adjusted net savings (% of GNI)
219The Little Green Data Book 2010
910 7,350 52337 64 291.1 0.2 3.51.6 0.1 2.2
63 28 382,345 2,797 318
139 113 125395 144 666
7.8 38.4 24.7–0.5 0.0 0.71.9 7.8 11.911158
151.1
1.3 3.7 3.21,812 2,948 423
0.0 2.1 49.31,658 3,958 32486.9 68.9 41.613.1 16.2 41.9
2.1 0.7 0.44.4 7.3 0.5
–10.1 –30.0 –6.055 27 65
123 376 37
608 11,867 5,004
357.0 7.2 9.493 60 8888 95 6782 88 6098 99 8696 89 3895 79 3397 94 52
0.05.338 22 118
40.5 24.8 25.98.5 12.1 7.99.4 4.1 3.4
51.1 12.1 7.80.0 0.6 1.00.0 0.0 1.04.0 0.8 0.70.4 0.2 0.3
–14.1 3.2 10.7
Country data
Europe & Central
Asia group
Low-income group
Population (millions) 27 Land area (1,000 sq. km) 425 GDP ($ billions) 27.9
Uzbekistan

GNI per capita, World Bank Atlas method ($)Urban population (% of total)Urban population growth (average annual %, 1990–2008)Population growth (average annual %, 1990–2008) AgricultureAgricultural land (% of land area)Agricultural productivity (value added per worker, 2000 $)Food production index (1999–2001 = 100)Population density, rural (people/sq. km of arable land) Forests and biodiversityForest area (% of land area)Deforestation (average annual %, 1990–2007)Nationally protected area (% of land area)Threatened species, mammalsThreatened species, birdsThreatened species, fishThreatened species, higher plantsGEF benefits index for biodiversity (0–100, median is 1.5) EnergyGDP per unit of energy use (2005 PPP $/kg oil equivalent)Energy use per capita (kg oil equivalent)Energy from biomass products and waste (% of total)Electric power consumption per capita (kWh)Electricity generated using fossil fuel (% of total)Electricity generated by hydropower (% of total) Emissions and pollutionCO2 emissions per unit of GDP (kg/2005 PPP $)CO2 emissions per capita (metric tons)CO2 emissions growth (%, 1990–2006)Particulate matter (urban-pop.-weighted avg., μg/cu. m)Transport sector energy use per capita (kg of oil equivalent) Water and sanitationInternal freshwater resources per capita (cu. m)Freshwater withdrawal
Total (% of internal resources)Agriculture (% of total freshwater withdrawal)
Access to improved water source (% of total population)Rural (% of rural population)Urban (% of urban population)
Access to improved sanitation (% of total population)Rural (% of rural population)Urban (% of urban population)
Environment and healthAcute resp. infection prevalence (% of children under five)Diarrhea prevalence (% of children under five)Under-five mortality rate (per 1,000 live births) National accounting aggregatesGross savings (% of GNI)Consumption of fixed capital (% of GNI)Education expenditure (% of GNI)Energy depletion (% of GNI)Mineral depletion (% of GNI)Net forest depletion (% of GNI)CO2 damage (% of GNI)Particulate emissions damage (% of GNI)Adjusted net savings (% of GNI)
220 2010 The Little Green Data Book
Population (thousands) 234 Land area (1,000 sq. km) 12 GDP ($ millions) 590
Country data
East Asia & Pacific
group
Lower middle-income group
1,940 2,644 2,07325 44 41
4.0 3.4 3.02.5 1.0 1.4
12 50 501,074 509 589
109 127 123863 552 516
36.1 28.5 24.80.0 0.1 0.24.5 14.7 11.2
88
11102.1
.. 3.6 3.9
.. 1,295 1,013
.. 12.8 16.3
.. 1,883 1,310
.. 82.2 80.0
.. 14.7 15.2
0.1 0.9 0.80.4 3.8 2.8
31.6 135.9 105.718 69 69
.. 113 97
.. 4,940 3,154
.. 10.2 8.7
.. 74 81
.. 87 86
.. 81 81
.. 96 94
.. 66 52
.. 59 41
.. 75 69
..
..33 29 64
.. 47.3 41.1
.. 10.1 9.65.9 2.0 2.3
.. 7.2 8.1
.. 1.5 1.4
.. 0.0 0.2
.. 1.1 1.10.0 0.7 0.6
.. 28.6 22.4
Vanuatu
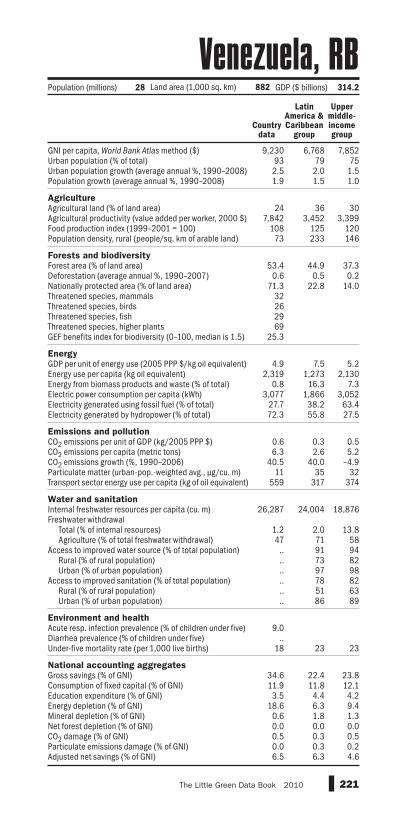
GNI per capita, World Bank Atlas method ($)Urban population (% of total)Urban population growth (average annual %, 1990–2008)Population growth (average annual %, 1990–2008) AgricultureAgricultural land (% of land area)Agricultural productivity (value added per worker, 2000 $)Food production index (1999–2001 = 100)Population density, rural (people/sq. km of arable land) Forests and biodiversityForest area (% of land area)Deforestation (average annual %, 1990–2007)Nationally protected area (% of land area)Threatened species, mammalsThreatened species, birdsThreatened species, fishThreatened species, higher plantsGEF benefits index for biodiversity (0–100, median is 1.5) EnergyGDP per unit of energy use (2005 PPP $/kg oil equivalent)Energy use per capita (kg oil equivalent)Energy from biomass products and waste (% of total)Electric power consumption per capita (kWh)Electricity generated using fossil fuel (% of total)Electricity generated by hydropower (% of total) Emissions and pollutionCO2 emissions per unit of GDP (kg/2005 PPP $)CO2 emissions per capita (metric tons)CO2 emissions growth (%, 1990–2006)Particulate matter (urban-pop.-weighted avg., μg/cu. m)Transport sector energy use per capita (kg of oil equivalent) Water and sanitationInternal freshwater resources per capita (cu. m)Freshwater withdrawal
Total (% of internal resources)Agriculture (% of total freshwater withdrawal)
Access to improved water source (% of total population)Rural (% of rural population)Urban (% of urban population)
Access to improved sanitation (% of total population)Rural (% of rural population)Urban (% of urban population)
Environment and healthAcute resp. infection prevalence (% of children under five)Diarrhea prevalence (% of children under five)Under-five mortality rate (per 1,000 live births) National accounting aggregatesGross savings (% of GNI)Consumption of fixed capital (% of GNI)Education expenditure (% of GNI)Energy depletion (% of GNI)Mineral depletion (% of GNI)Net forest depletion (% of GNI)CO2 damage (% of GNI)Particulate emissions damage (% of GNI)Adjusted net savings (% of GNI)
221The Little Green Data Book 2010
9,230 6,768 7,85293 79 752.5 2.0 1.51.9 1.5 1.0
24 36 307,842 3,452 3,399
108 125 12073 233 146
53.4 44.9 37.30.6 0.5 0.2
71.3 22.8 14.032262969
25.3
4.9 7.5 5.22,319 1,273 2,130
0.8 16.3 7.33,077 1,866 3,052
27.7 38.2 63.472.3 55.8 27.5
0.6 0.3 0.56.3 2.6 5.2
40.5 40.0 –4.911 35 32
559 317 374
26,287 24,004 18,876
1.2 2.0 13.847 71 58
.. 91 94
.. 73 82
.. 97 98
.. 78 82
.. 51 63
.. 86 89
9.0..
18 23 23
34.6 22.4 23.811.9 11.8 12.13.5 4.4 4.2
18.6 6.3 9.40.6 1.8 1.30.0 0.0 0.00.5 0.3 0.50.0 0.3 0.26.5 6.3 4.6
Country data
Latin America & Caribbean
group
Upper middle-income group
Population (millions) 28 Land area (1,000 sq. km) 882 GDP ($ billions) 314.2
Venezuela, RB

GNI per capita, World Bank Atlas method ($)Urban population (% of total)Urban population growth (average annual %, 1990–2008)Population growth (average annual %, 1990–2008) AgricultureAgricultural land (% of land area)Agricultural productivity (value added per worker, 2000 $)Food production index (1999–2001 = 100)Population density, rural (people/sq. km of arable land) Forests and biodiversityForest area (% of land area)Deforestation (average annual %, 1990–2007)Nationally protected area (% of land area)Threatened species, mammalsThreatened species, birdsThreatened species, fishThreatened species, higher plantsGEF benefits index for biodiversity (0–100, median is 1.5) EnergyGDP per unit of energy use (2005 PPP $/kg oil equivalent)Energy use per capita (kg oil equivalent)Energy from biomass products and waste (% of total)Electric power consumption per capita (kWh)Electricity generated using fossil fuel (% of total)Electricity generated by hydropower (% of total) Emissions and pollutionCO2 emissions per unit of GDP (kg/2005 PPP $)CO2 emissions per capita (metric tons)CO2 emissions growth (%, 1990–2006)Particulate matter (urban-pop.-weighted avg., μg/cu. m)Transport sector energy use per capita (kg of oil equivalent) Water and sanitationInternal freshwater resources per capita (cu. m)Freshwater withdrawal
Total (% of internal resources)Agriculture (% of total freshwater withdrawal)
Access to improved water source (% of total population)Rural (% of rural population)Urban (% of urban population)
Access to improved sanitation (% of total population)Rural (% of rural population)Urban (% of urban population)
Environment and healthAcute resp. infection prevalence (% of children under five)Diarrhea prevalence (% of children under five)Under-five mortality rate (per 1,000 live births) National accounting aggregatesGross savings (% of GNI)Consumption of fixed capital (% of GNI)Education expenditure (% of GNI)Energy depletion (% of GNI)Mineral depletion (% of GNI)Net forest depletion (% of GNI)CO2 damage (% of GNI)Particulate emissions damage (% of GNI)Adjusted net savings (% of GNI)
222 2010 The Little Green Data Book
Population (millions) 86 Land area (1,000 sq. km) 310 GDP ($ billions) 90.6
Country data
East Asia & Pacific
group
Low-income group
890 2,644 52328 44 29
3.2 3.4 3.51.5 1.0 2.2
32 50 38343 509 318127 127 125974 552 666
43.3 28.5 24.7–2.1 0.1 0.75.6 14.7 11.9543933
14712.1
3.7 3.6 3.2655 1,295 42344.0 12.8 49.3728 1,883 32457.0 82.2 41.643.0 14.7 41.9
0.6 0.9 0.41.3 3.8 0.5
395.8 135.9 –6.055 69 6592 113 37
4,304 4,940 5,004
19.5 10.2 9.468 74 8892 87 6790 81 6098 96 8665 66 3856 59 3388 75 52
20.011.3
14 29 118
30.4 47.3 25.98.8 10.1 7.92.8 2.0 3.4
12.9 7.2 7.80.3 1.5 1.00.2 0.0 1.01.0 1.1 0.70.3 0.7 0.39.7 28.6 10.7
Vietnam
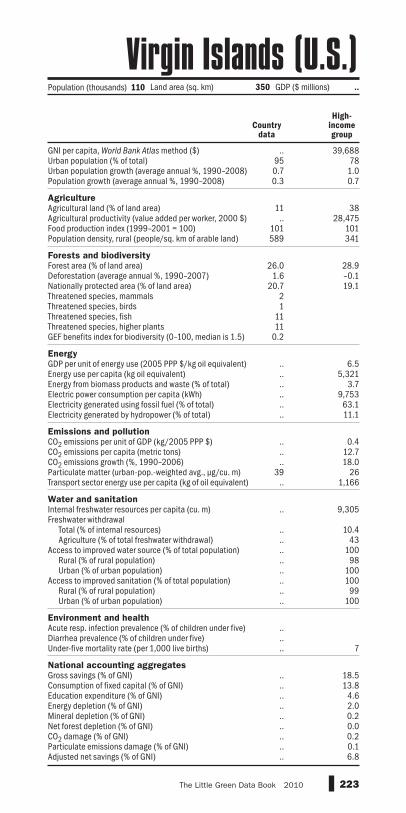
GNI per capita, World Bank Atlas method ($)Urban population (% of total)Urban population growth (average annual %, 1990–2008)Population growth (average annual %, 1990–2008) AgricultureAgricultural land (% of land area)Agricultural productivity (value added per worker, 2000 $)Food production index (1999–2001 = 100)Population density, rural (people/sq. km of arable land) Forests and biodiversityForest area (% of land area)Deforestation (average annual %, 1990–2007)Nationally protected area (% of land area)Threatened species, mammalsThreatened species, birdsThreatened species, fishThreatened species, higher plantsGEF benefits index for biodiversity (0–100, median is 1.5) EnergyGDP per unit of energy use (2005 PPP $/kg oil equivalent)Energy use per capita (kg oil equivalent)Energy from biomass products and waste (% of total)Electric power consumption per capita (kWh)Electricity generated using fossil fuel (% of total)Electricity generated by hydropower (% of total) Emissions and pollutionCO2 emissions per unit of GDP (kg/2005 PPP $)CO2 emissions per capita (metric tons)CO2 emissions growth (%, 1990–2006)Particulate matter (urban-pop.-weighted avg., μg/cu. m)Transport sector energy use per capita (kg of oil equivalent) Water and sanitationInternal freshwater resources per capita (cu. m)Freshwater withdrawal
Total (% of internal resources)Agriculture (% of total freshwater withdrawal)
Access to improved water source (% of total population)Rural (% of rural population)Urban (% of urban population)
Access to improved sanitation (% of total population)Rural (% of rural population)Urban (% of urban population)
Environment and healthAcute resp. infection prevalence (% of children under five)Diarrhea prevalence (% of children under five)Under-five mortality rate (per 1,000 live births) National accounting aggregatesGross savings (% of GNI)Consumption of fixed capital (% of GNI)Education expenditure (% of GNI)Energy depletion (% of GNI)Mineral depletion (% of GNI)Net forest depletion (% of GNI)CO2 damage (% of GNI)Particulate emissions damage (% of GNI)Adjusted net savings (% of GNI)
223The Little Green Data Book 2010
.. 39,68895 780.7 1.00.3 0.7
11 38.. 28,475
101 101589 341
26.0 28.91.6 –0.1
20.7 19.121
1111
0.2
.. 6.5
.. 5,321
.. 3.7
.. 9,753
.. 63.1
.. 11.1
.. 0.4
.. 12.7
.. 18.039 26
.. 1,166
.. 9,305
.. 10.4
.. 43
.. 100
.. 98
.. 100
.. 100
.. 99
.. 100
..
..
.. 7
.. 18.5
.. 13.8
.. 4.6
.. 2.0
.. 0.2
.. 0.0
.. 0.2
.. 0.1
.. 6.8
Country data
High-income group
Population (thousands) 110 Land area (sq. km) 350 GDP ($ millions) ..
Virgin Islands (U.S.)
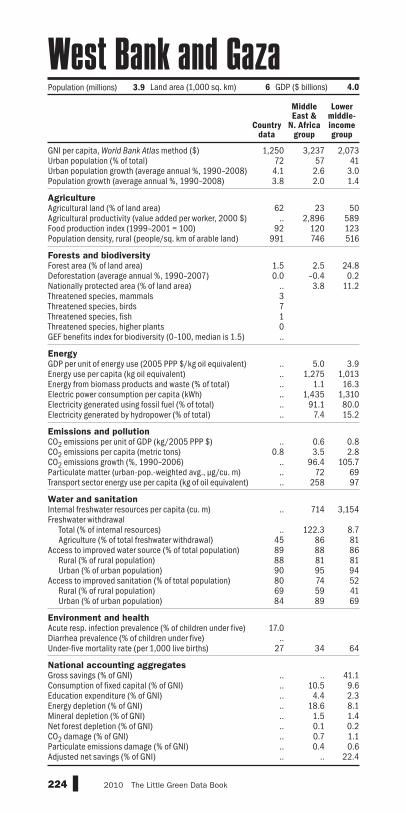
GNI per capita, World Bank Atlas method ($)Urban population (% of total)Urban population growth (average annual %, 1990–2008)Population growth (average annual %, 1990–2008) AgricultureAgricultural land (% of land area)Agricultural productivity (value added per worker, 2000 $)Food production index (1999–2001 = 100)Population density, rural (people/sq. km of arable land) Forests and biodiversityForest area (% of land area)Deforestation (average annual %, 1990–2007)Nationally protected area (% of land area)Threatened species, mammalsThreatened species, birdsThreatened species, fishThreatened species, higher plantsGEF benefits index for biodiversity (0–100, median is 1.5) EnergyGDP per unit of energy use (2005 PPP $/kg oil equivalent)Energy use per capita (kg oil equivalent)Energy from biomass products and waste (% of total)Electric power consumption per capita (kWh)Electricity generated using fossil fuel (% of total)Electricity generated by hydropower (% of total) Emissions and pollutionCO2 emissions per unit of GDP (kg/2005 PPP $)CO2 emissions per capita (metric tons)CO2 emissions growth (%, 1990–2006)Particulate matter (urban-pop.-weighted avg., μg/cu. m)Transport sector energy use per capita (kg of oil equivalent) Water and sanitationInternal freshwater resources per capita (cu. m)Freshwater withdrawal
Total (% of internal resources)Agriculture (% of total freshwater withdrawal)
Access to improved water source (% of total population)Rural (% of rural population)Urban (% of urban population)
Access to improved sanitation (% of total population)Rural (% of rural population)Urban (% of urban population)
Environment and healthAcute resp. infection prevalence (% of children under five)Diarrhea prevalence (% of children under five)Under-five mortality rate (per 1,000 live births) National accounting aggregatesGross savings (% of GNI)Consumption of fixed capital (% of GNI)Education expenditure (% of GNI)Energy depletion (% of GNI)Mineral depletion (% of GNI)Net forest depletion (% of GNI)CO2 damage (% of GNI)Particulate emissions damage (% of GNI)Adjusted net savings (% of GNI)
224 2010 The Little Green Data Book
Population (millions) 3.9 Land area (1,000 sq. km) 6 GDP ($ billions) 4.0
Country data
Middle East &
N. Africa group
Lower middle-income group
1,250 3,237 2,07372 57 414.1 2.6 3.03.8 2.0 1.4
62 23 50.. 2,896 589
92 120 123991 746 516
1.5 2.5 24.80.0 –0.4 0.2
.. 3.8 11.23710..
.. 5.0 3.9
.. 1,275 1,013
.. 1.1 16.3
.. 1,435 1,310
.. 91.1 80.0
.. 7.4 15.2
.. 0.6 0.80.8 3.5 2.8
.. 96.4 105.7
.. 72 69
.. 258 97
.. 714 3,154
.. 122.3 8.745 86 8189 88 8688 81 8190 95 9480 74 5269 59 4184 89 69
17.0..
27 34 64
.. .. 41.1
.. 10.5 9.6
.. 4.4 2.3
.. 18.6 8.1
.. 1.5 1.4
.. 0.1 0.2
.. 0.7 1.1
.. 0.4 0.6
.. .. 22.4
West Bank and Gaza

GNI per capita, World Bank Atlas method ($)Urban population (% of total)Urban population growth (average annual %, 1990–2008)Population growth (average annual %, 1990–2008) AgricultureAgricultural land (% of land area)Agricultural productivity (value added per worker, 2000 $)Food production index (1999–2001 = 100)Population density, rural (people/sq. km of arable land) Forests and biodiversityForest area (% of land area)Deforestation (average annual %, 1990–2007)Nationally protected area (% of land area)Threatened species, mammalsThreatened species, birdsThreatened species, fishThreatened species, higher plantsGEF benefits index for biodiversity (0–100, median is 1.5) EnergyGDP per unit of energy use (2005 PPP $/kg oil equivalent)Energy use per capita (kg oil equivalent)Energy from biomass products and waste (% of total)Electric power consumption per capita (kWh)Electricity generated using fossil fuel (% of total)Electricity generated by hydropower (% of total) Emissions and pollutionCO2 emissions per unit of GDP (kg/2005 PPP $)CO2 emissions per capita (metric tons)CO2 emissions growth (%, 1990–2006)Particulate matter (urban-pop.-weighted avg., μg/cu. m)Transport sector energy use per capita (kg of oil equivalent) Water and sanitationInternal freshwater resources per capita (cu. m)Freshwater withdrawal
Total (% of internal resources)Agriculture (% of total freshwater withdrawal)
Access to improved water source (% of total population)Rural (% of rural population)Urban (% of urban population)
Access to improved sanitation (% of total population)Rural (% of rural population)Urban (% of urban population)
Environment and healthAcute resp. infection prevalence (% of children under five)Diarrhea prevalence (% of children under five)Under-five mortality rate (per 1,000 live births) National accounting aggregatesGross savings (% of GNI)Consumption of fixed capital (% of GNI)Education expenditure (% of GNI)Energy depletion (% of GNI)Mineral depletion (% of GNI)Net forest depletion (% of GNI)CO2 damage (% of GNI)Particulate emissions damage (% of GNI)Adjusted net savings (% of GNI)
225The Little Green Data Book 2010
960 3,237 52331 57 29
5.6 2.6 3.53.5 2.0 2.2
45 23 38470 2,896 318128 120 125
1,133 746 666
1.0 2.5 24.70.0 –0.4 0.70.3 3.8 11.9
91318
1593.2
6.8 5.0 3.2324 1,275 4231.1 1.1 49.3
202 1,435 324100.0 91.1 41.6
0.0 7.4 41.9
0.4 0.6 0.41.0 3.5 0.5
.. 96.4 –6.0
.. 72 6584 258 37
94 714 5,004
161.9 122.3 9.490 86 8866 88 6765 81 6068 95 8646 74 3830 59 3388 89 52
24.027.5
69 34 118
.. .. 25.99.4 10.5 7.9
.. 4.4 3.422.3 18.6 7.8
0.0 1.5 1.00.0 0.1 1.00.7 0.7 0.7
.. 0.4 0.3
.. .. 10.7
Country data
Middle East &
N. Africa group
Low-income group
Population (millions) 23 Land area (1,000 sq. km) 528 GDP ($ billions) 26.6
Yemen, Rep.

GNI per capita, World Bank Atlas method ($)Urban population (% of total)Urban population growth (average annual %, 1990–2008)Population growth (average annual %, 1990–2008) AgricultureAgricultural land (% of land area)Agricultural productivity (value added per worker, 2000 $)Food production index (1999–2001 = 100)Population density, rural (people/sq. km of arable land) Forests and biodiversityForest area (% of land area)Deforestation (average annual %, 1990–2007)Nationally protected area (% of land area)Threatened species, mammalsThreatened species, birdsThreatened species, fishThreatened species, higher plantsGEF benefits index for biodiversity (0–100, median is 1.5) EnergyGDP per unit of energy use (2005 PPP $/kg oil equivalent)Energy use per capita (kg oil equivalent)Energy from biomass products and waste (% of total)Electric power consumption per capita (kWh)Electricity generated using fossil fuel (% of total)Electricity generated by hydropower (% of total) Emissions and pollutionCO2 emissions per unit of GDP (kg/2005 PPP $)CO2 emissions per capita (metric tons)CO2 emissions growth (%, 1990–2006)Particulate matter (urban-pop.-weighted avg., μg/cu. m)Transport sector energy use per capita (kg of oil equivalent) Water and sanitationInternal freshwater resources per capita (cu. m)Freshwater withdrawal
Total (% of internal resources)Agriculture (% of total freshwater withdrawal)
Access to improved water source (% of total population)Rural (% of rural population)Urban (% of urban population)
Access to improved sanitation (% of total population)Rural (% of rural population)Urban (% of urban population)
Environment and healthAcute resp. infection prevalence (% of children under five)Diarrhea prevalence (% of children under five)Under-five mortality rate (per 1,000 live births) National accounting aggregatesGross savings (% of GNI)Consumption of fixed capital (% of GNI)Education expenditure (% of GNI)Energy depletion (% of GNI)Mineral depletion (% of GNI)Net forest depletion (% of GNI)CO2 damage (% of GNI)Particulate emissions damage (% of GNI)Adjusted net savings (% of GNI)
226 2010 The Little Green Data Book
Population (millions) 13 Land area (1,000 sq. km) 743 GDP ($ billions) 14.3
950 1,077 52335 36 292.0 4.0 3.52.6 2.6 2.2
34 45 38225 330 318115 119 125152 353 666
55.9 26.1 24.71.0 0.7 0.7
41.1 12.4 11.98
12108
3.8
2.0 3.2 3.2604 662 42378.3 55.8 49.3720 550 3240.6 67.0 41.6
99.4 16.9 41.9
0.2 0.5 0.40.2 0.8 0.51.0 37.4 –6.040 53 6528 61 37
6,513 4,829 5,004
2.2 3.2 9.476 87 8858 58 6741 46 6090 81 8652 31 3851 24 3355 42 52
15.021.2148 144 118
21.4 16.5 25.99.5 9.0 7.91.3 3.3 3.40.1 14.2 7.8
13.4 1.3 1.00.0 0.6 1.00.2 0.6 0.70.3 0.4 0.3
–0.7 –6.2 10.7
Country data
Sub-Saharan Africa group
Low-income group
Zambia

GNI per capita, World Bank Atlas method ($)Urban population (% of total)Urban population growth (average annual %, 1990–2008)Population growth (average annual %, 1990–2008) AgricultureAgricultural land (% of land area)Agricultural productivity (value added per worker, 2000 $)Food production index (1999–2001 = 100)Population density, rural (people/sq. km of arable land) Forests and biodiversityForest area (% of land area)Deforestation (average annual %, 1990–2007)Nationally protected area (% of land area)Threatened species, mammalsThreatened species, birdsThreatened species, fishThreatened species, higher plantsGEF benefits index for biodiversity (0–100, median is 1.5) EnergyGDP per unit of energy use (2005 PPP $/kg oil equivalent)Energy use per capita (kg oil equivalent)Energy from biomass products and waste (% of total)Electric power consumption per capita (kWh)Electricity generated using fossil fuel (% of total)Electricity generated by hydropower (% of total) Emissions and pollutionCO2 emissions per unit of GDP (kg/2005 PPP $)CO2 emissions per capita (metric tons)CO2 emissions growth (%, 1990–2006)Particulate matter (urban-pop.-weighted avg., μg/cu. m)Transport sector energy use per capita (kg of oil equivalent) Water and sanitationInternal freshwater resources per capita (cu. m)Freshwater withdrawal
Total (% of internal resources)Agriculture (% of total freshwater withdrawal)
Access to improved water source (% of total population)Rural (% of rural population)Urban (% of urban population)
Access to improved sanitation (% of total population)Rural (% of rural population)Urban (% of urban population)
Environment and healthAcute resp. infection prevalence (% of children under five)Diarrhea prevalence (% of children under five)Under-five mortality rate (per 1,000 live births) National accounting aggregatesGross savings (% of GNI)Consumption of fixed capital (% of GNI)Education expenditure (% of GNI)Energy depletion (% of GNI)Mineral depletion (% of GNI)Net forest depletion (% of GNI)CO2 damage (% of GNI)Particulate emissions damage (% of GNI)Adjusted net savings (% of GNI)
227The Little Green Data Book 2010
360 1,077 52337 36 29
2.4 4.0 3.51.0 2.6 2.2
40 45 38239 330 318
84 119 125243 353 666
43.7 26.1 24.71.6 0.7 0.7
15.8 12.4 11.98
113
171.9
0.2 3.2 3.2759 662 423
65.0 55.8 49.3898 550 324
43.2 67.0 41.656.8 16.9 41.9
5.0 0.5 0.40.9 0.8 0.5
–33.5 37.4 –6.027 53 6531 61 37
985 4,829 5,004
34.3 3.2 9.479 87 8881 58 6772 46 6098 81 8646 31 3837 24 3363 42 52
16.013.9
96 144 118
.. 16.5 25.9
.. 9.0 7.96.9 3.3 3.4
.. 14.2 7.8
.. 1.3 1.0
.. 0.6 1.0
.. 0.6 0.70.1 0.4 0.3
.. –6.2 10.7
Country data
Sub-Saharan Africa group
Low-income group
Population (millions) 12 Land area (1,000 sq. km) 387 GDP ($ billions) 3.4
Zimbabwe


229The Little Green Data Book 2010
Access to improved sanitation is the percentage of population with
adequate access to excreta disposal facilities (private or shared, but not
public) that can effectively prevent human, animal, and insect contact with
excreta. Improved facilities range from simple but protected pit latrines to
flush toilets with a sewerage connection. To be effective, facilities must be
correctly constructed and properly maintained. (World Health Organization;
data are for 2006)
Access to improved water source is the percentage of the population
with reasonable access to an adequate amount of water from an improved
source, such as piped water into a dwelling, plot, or yard; public tap or
standpipe; tubewell or borehole; protected dug well or spring; or rainwater
collection. Unimproved sources include an unprotected dug well or spring,
cart with small tank or drum, bottled water, and tanker trucks. Reasonable
access to an adequate amount means the availability of at least 20 liters a
person a day from a source within 1 kilometer of the dwelling. (World Health
Organization; data are for 2006)
Acute respiratory infection prevalence is the percentage of children
under age five with acute respiratory infection in the two weeks prior to the
survey. (United Nations Children’s Fund; data are for the most recent year
available during 1998–2005)
Adjusted net savings equal gross savings minus consumption of fixed capi-
tal, plus education expenditures, minus energy depletion, mineral depletion,
net forest depletion, and particulate emissions and carbon dioxide damage.
(World Bank; data are for 2008)
Agricultural land is arable land, land under permanent crops, and perma-
nent pastures. Arable land includes land defined by the Food and Agriculture
Organization of the United Nations as land under temporary crops (double-
cropped areas are counted once), temporary meadows for mowing or for
pasture, land under market or kitchen gardens, and land temporarily fallow.
Land abandoned as a result of shifting cultivation is excluded. Land under
permanent crops is land cultivated with crops that occupy the land for long
periods and need not be replanted after each harvest, such as cocoa, cof-
fee, and rubber. This category includes land under flowering shrubs, fruit
trees, nut trees, and vines but excludes land under trees grown for wood
or timber. Permanent pasture is land used for five or more years for forage,
including natural and cultivated crops. (Food and Agriculture Organization;
data are for 2007)
Agricultural productivity is the ratio of agricultural value added, measured
in 2000 U.S. dollars, to the number of workers in agriculture. Agricultural
productivity is measured by value added per unit of input. Agricultural value
added includes that from forestry and fishing. Thus interpretations of land
productivity should be made with caution. (See World Bank 2010 for details;
data are for 2003–05)
Carbon dioxide (CO2) damage is estimated at $20 per ton of carbon (the
unit damage in 1995 U.S. dollars) times the number of tons of carbon emit-
ted. (World Bank estimates; data are for 2008)
Glossary

230 2010 The Little Green Data Book
Carbon dioxide (CO2) emissions growth is the cumulative percentage
change in emissions stemming from the burning of fossil fuels and the
manufacture of cement. Emissions include carbon dioxide produced during
consumption of solid, liquid, and gas fuels and gas flaring. (Carbon Dioxide
Information Analysis Center; data are for 1990–2006)
Carbon dioxide (CO2) emissions per capita are carbon dioxide emissions
divided by midyear population. (Carbon Dioxide Information Analysis Center,
World Bank, and United Nations; data are for 2006)
Carbon dioxide (CO2) emissions per unit of GDP are carbon dioxide emis-
sions in kilograms per unit of GDP in 2005 purchasing power parity (PPP)
terms. PPP GDP is gross domestic product converted to international dollars
using PPP rates. An international dollar has the same purchasing power over
GDP that a U.S. dollar has in the United States. (Carbon Dioxide Information
Analysis Center and World Bank; data are for 2006)
Consumption of fixed capital is the replacement value of capital used
up in the process of production. (United Nations; data are extrapolated to
2006 from the most recent year available)
Deforestation is the permanent conversion of natural forest area to other
uses, including shifting cultivation, permanent agriculture, ranching, settle-
ments, and infrastructure development. Deforested areas do not include
areas logged but intended for regeneration or areas degraded by fuelwood
gathering, acid precipitation, or forest fires. Negative numbers indicate an
increase in forest areas. (Food and Agriculture Organization; data are for
1990–2007)
Diarrhea prevalence is the percentage of children under age five who had
diarrhea in the two weeks prior to the survey. (United Nations Children’s Fund;
data are for the most recent year available during 1998–2005)
Education expenditure is public current operating expenditures in edu-
cation, including wages and salaries and excluding capital investments in
buildings and equipment. (United Nations; data are extrapolated to 2008
from the most recent year available)
Electricity generated using fossil fuel is use of coal, oil, and gas as
a percentage of total inputs to the generation of electricity. (International
Energy Agency; data are for 2007)
Electricity generated by hydropower is use of hydropower as a percentage
of total inputs to the generation of electricity. (International Energy Agency;
data are for 2007)
Electric power consumption per capita is the production of power plants
and combined heat and power plants, minus transmission, distribution, and
transformation losses and own use by heat and power plants plus imports
minus exports divided by midyear population. (International Energy Agency;
data are for 2007)
Glossary

231The Little Green Data Book 2010
Energy depletion is the ratio of the value of the stock of energy resources
to the remaining reserve lifetime (capped at 25 years). It covers crude oil,
natural gas, and coal. (See World Bank 2010 for details.)
Energy from biomass products and waste is energy from solid biomass,
liquid biomass, biogas, industrial waste, and municipal waste as a percentage
of total energy use. (International Energy Agency; data are for 2007)
Energy use per capita refers to apparent consumption, which is equal
to indigenous production plus imports and stock changes, minus exports
and fuels supplied to ships and aircraft engaged in international transport.
(International Energy Agency; data are for 2007)
Food production index indicates the relative level of net food production
compared with the base period 1999–2001. It covers food crops that are
considered edible and that contain nutrients. Coffee and tea are excluded
because, although edible, they have no nutritive value (See the Food and
Agriculture Organization's Production Yearbook for details; data are for
2007)
Forest area is land under natural or planted stands of trees, whether produc-
tive or not. (Food and Agriculture Organization; data are for 2007)
Freshwater withdrawal, agriculture, is withdrawals for irrigation and livestock
production as a percentage of total freshwater withdrawal. (World Resources
Institute; data are for various years; for details see World Development
Indicators 2010, Primary data documentation.)
Freshwater withdrawal, total, is total water withdrawal, excluding evapora-
tion losses from storage basins and including water from desalination plants
in countries where they are a significant source. Withdrawals can exceed
100 percent of internal renewable resources because river flows from other
countries are not included, because extraction from nonrenewable aquifers
or desalination plants is considerable, or because there is significant water
reuse. (Food and Agriculture Organization and World Resources Institute;
data are for various years; for details see World Development Indicators 2010,
Primary data documentation.)
GDP is gross domestic product and measures the total output of goods and
services for final use occurring within the domestic territory of a given country,
regardless of the allocation to domestic and foreign claims. GDP at purchaser
values (market prices) is the sum of gross value added by all resident and
nonresident producers in the economy plus any taxes and minus any subsi-
dies not included in the value of the products. It is calculated without deduc-
tions for depreciation of fabricated assets or for depletion and degradation
of natural resources. (World Bank, Organization for Economic Co-operation
and Development, and United Nations; data are for 2008)
GDP per unit of energy use is 2005 gross domestic product (GDP) in
purchasing power parity (PPP) terms per kilogram of oil equivalent of energy
use. PPP GDP is GDP converted to international dollars using PPP rates.
An international dollar has the same purchasing power over GDP that a

232 2010 The Little Green Data Book
U.S. dollar has in the United States. (International Energy Agency and World
Bank; data are for 2007)
GEF benefits index for biodiversity is a composite index of relative bio-
diversity potential for each country developed by the Global Environment
Facility, based on the species represented in each country, their threat status,
and the diversity of habitat types in each country. The index shown in the tables
has been normalized so that values run from 0 (no biodiversity potential) to
100 (maximum biodiversity potential) (World Bank; estimates are for 2008)
GNI per capita is gross national income (GNI) divided by midyear population.
GNI is gross domestic product plus net receipts of primary income (employee
compensation and property income) from abroad. GNI per capita is in current U.S.
dollars, converted using the World Bank Atlas method (see World Development
Indicators 2010, Statistical methods). (World Bank, Organization for Economic
Co-operation and Development, and United Nations; data are for 2008)
Gross savings are the difference between gross national income and
public and private consumption plus net current transfers. (World Bank,
Organization for Economic Co-operation and Development, and International
Monetary Fund; data are for 2008)
Internal freshwater resources per capita are internal renewable resources,
which include flows of rivers and groundwater from rainfall in the country
but excludes river flows from other countries, divided by midyear population.
(Refers to data reported to the Food and Agriculture Organization as of 2007)
Land area is a country’s total land area, excluding area under inland water
bodies, national claims to continental shelf, and exclusive economic zones.
In most cases the definition of inland water bodies includes major rivers and
lakes. (Food and Agriculture Organization; data are for 2007)
Mineral depletion is the ratio of the value of the stock of mineral resources
to the remaining reserve lifetime (capped at 25 years). It covers bauxite,
copper, iron, lead, nickel, phosphate, tin, gold, silver, and zinc. (See World
Bank 2010 for details.)
Nationally protected area is totally or partially protected areas of at least
1,000 hectares that are designated as national parks, natural monuments,
nature reserves or wildlife sanctuaries; protected landscapes and seascapes;
and scientific reserves. It includes World Conservation Union–protected area
categories I–VI. (World Conservation Monitoring Centre; data are for the most
recent year available)
Net forest depletion is the product of unit resource rents and the excess
of roundwood harvest over natural growth. If growth exceeds harvest, this
figure is zero. (Food and Agriculture Organization and World Bank estimates
of natural growth; data are for 2008)
Particulate emissions damage is calculated as the willingness to pay to
reduce the risk of illness and death attributable to particulate emissions.
(World Bank estimates; data are for 2007)
Glossary
233The Little Green Data Book 2010
Particulate matter is fine suspended particulates of less than 10 microns
in diameter that are capable of penetrating deep into the respiratory tract
and causing damage. The indicator is the population-weighted average of all
cities in the country with a population greater than 100,000. (World Bank
estimates; data are for 2006)
Population includes all residents who are present regardless of legal status
or citizenship except for refugees not permanently settled in the country of
asylum, who are generally considered part of the population of their country
of origin. (United Nations; data are midyear estimates for 2008)
Population density, rural, is rural population divided by arable land area.
Rural population is estimated as the difference between the total population
and urban population. (See urban population; data are for 2008)
Population growth is the exponential change in population for the period
indicated. (United Nations; data are for 1990–2008)
Threatened species, birds, are the number of species of birds classified
by the IUCN as endangered, vulnerable, rare, indeterminate, out of danger,
or insufficiently known. Birds are listed for countries included within their
breeding or wintering ranges. (World Conservation Monitoring Centre and
IUCN; data are for 2008)
Threatened species, fish, are the number of species of fish—cold-blooded
aquatic vertebrates of the superclass Pisces—classified by the IUCN as endan-
gered, vulnerable, rare, indeterminate, out of danger, or insufficiently known.
(World Conservation Monitoring Centre and IUCN; data are for 2008)
Threatened species, higher plants, are the number of native vascular plant
species classified by the IUCN as endangered, vulnerable, rare, indetermi-
nate, out of danger, or insufficiently known. (World Conservation Monitoring
Centre and IUCN; data are for 2008)
Threatened species, mammals, are the number of species of mammals—
excluding whales and porpoises—classified by the IUCN as endangered,
vulnerable, rare, indeterminate, out of danger, or insufficiently known. (World
Conservation Monitoring Centre and IUCN; data are for 2008)
Transport sector energy use per capita is the total energy consumption
in the transport sector divided by midyear population (International Energy
Agency 2009; data are for 2007).
Under-five mortality rate is the probability that a newborn baby will die
before reaching age five if subject to current age-specific mortality rates.
(United Nations and United Nations Children’s Fund; data are for 2008)
Urban population is the share of the midyear population living in areas
defined as urban in each country (United Nations; data are for 2008)
Urban population growth is the exponential change in urban population for
the period indicated. (United Nations; data are for 1990–2008)

235The Little Green Data Book 2010
CDIAC (Carbon Dioxide Information Analysis Center). 2009. Global CO2
Emissions from Fossil-Fuel Burning, Cement Manufacture, and Gas Flaring:
1751–2006. Environmental Sciences Division, Oak Ridge National
Laboratory, Tennessee, United States.
Chamon, Marcos, Paolo Mauro, and Yohei Okawa. 2008. “Mass Car Ownership
in the Emerging Market Giants.” Economic Policy 23(54): 243–96.
GTZ (German Technical Cooperation). 2009. International Fuel Prices 2009.
Eschborn, Germany: German Technical Cooperation.
IEA (International Energy Agency). 2009a. CO2 Emissions from Fuel Combustion
—Vol 2009 Release 01. Paris: International Energy Agency.
———. 2009b. Per Capita CO2 Emissions by Sector Vol 2009 Release 01.
Paris: International Energy Agency.
———. 2009c. World Energy Statistics and Balances—Energy Balances of
Non-OECD Member Countries—Extended Balances Vol 2009 Release 01.
Paris: International Energy Agency.
———. 2009d. World Energy Statistics and Balances—Energy Balances
of OECD Countries—Extended Balances Vol 2009 Release 01. Paris:
International Energy Agency.
International Road Federation. 2008. World Road Statistics 2008. Geneva:
International Road Federation.
World Bank. 2010. World Development Indicators 2010. Washington, D.C.:
World Bank.
References


AFGHANISTAN ALBANIA ALGERIA AMERICAN SAMOA ANDORRA ANGOLA ANTIGUA AND BARBUDA ARGENTINA ARMENIA ARUBA AUSTRALIA AUSTRIA AZERBAIJAN THE BAHAMAS BAHRAIN BANGLADESH BARBADOS BELARUS BELGIUM BELIZE BENIN BERMUDA BHUTAN BOLIVIA BOSNIA AND HERZEGOVINA BOTSWANA BRAZIL BRUNEI DARUSSALAM BULGARIA BURKINA FASO BURUNDI CAMBODIA CAMEROON CANADA CAPE VERDE CAYMAN ISLANDS CENTRAL AFRICAN REPUBLIC CHAD CHANNEL ISLANDS CHILE CHINA COLOMBIA COMOROS DEMOCRATIC REPUBLIC OF CONGO REPUBLIC OF CONGO COSTA RICA CÔTE D’IVOIRE CROATIA CUBA CYPRUS CZECH REPUBLIC DENMARK DJIBOUTI DOMINICA DOMINICAN REPUBLIC ECUADOR ARAB REPUBLIC OF EGYPT EL SALVADOR EQUATORIAL GUINEA ERITREA ESTONIA ETHIOPIA FAEROE ISLANDS FIJI FINLAND FRANCE FRENCH POLYNESIA GABON THE GAMBIA GEORGIA GERMANY GHANA GREECE GREENLAND GRENADA GUAM GUATEMALA GUINEA GUINEA-BISSAU GUYANA HAITI HONDURAS HONG KONG SAR, CHINA HUNGARY ICELAND INDIA INDONESIA ISLAMIC REPUBLIC OF IRAN IRAQ IRELAND ISLE OF MAN ISRAEL ITALY JAMAICA JAPAN JORDAN KAZAKHSTAN KENYA KIRIBATI DEMOCRATIC REPUBLIC OF KOREA REPUBLIC OF KOREA KOSOVO KUWAIT KYRGYZ REPUBLIC LAO PEOPLE’S DEMOCRATIC REPUBLIC LATVIA LEBANON LESOTHO LIBERIA LIBYA LIECHTENSTEIN LITHUANIA LUXEMBOURG MACAO SAR, CHINA FORMER YUGOSLAV REPUBLIC OF MACEDONIA MADAGASCAR MALAWI MALAYSIA MALDIVES MALI MALTA MARSHALL ISLANDS MAURITANIA MAURITIUS MAYOTTE MEXICO FEDERATED STATES OF MICRONESIA MOLDOVA MONACO MONGOLIA MONTENEGRO MOROCCO MOZAMBIQUE MYANMAR NAMIBIA NEPAL NETHERLANDS NETHERLANDS ANTILLES NEW CALEDONIA NEW ZEALAND NICARAGUA NIGER NIGERIA NORTHERN MARIANA ISLANDS NORWAY OMAN PAKISTAN PALAU PANAMA PAPUA NEW GUINEA PARAGUAY PERU PHILIPPINES POLAND PORTUGAL PUERTO RICO QATAR ROMANIA RUSSIAN FEDERATION RWANDA SAMOA SAN MARINO SÃO TOMÉ AND PRÍNCIPE SAUDI ARABIA SENEGAL SERBIA SEYCHELLES SIERRA LEONE SINGAPORE SLOVAK REPUBLIC SLOVENIA SOLOMON ISLANDS SOMALIA SOUTH AFRICA SPAIN SRI LANKA ST. KITTS AND NEVIS ST. LUCIA ST. VINCENT & GRENADINES SUDAN SURINAME SWAZILAND SWEDEN SWITZERLAND SYRIAN ARAB REPUBLIC TAJIKISTAN TANZANIA THAILAND TIMOR-LESTE TOGO TONGA TRINIDAD AND TOBAGO TUNISIA TURKEY TURKMENISTAN UGANDA UKRAINE UNITED ARAB EMIRATES UNITED KINGDOM UNITED STATES URUGUAY UZBEKISTAN VANUATU REPÚBLICA BOLIVIARANA DE VENEZUELA VIETNAM U.S. VIRGIN ISLANDS WEST BANK AND GAZA REPUBLIC OF YEMEN ZAMBIA ZIMBABWE
1818 H Street N.W.
Washington, D.C. 20433 USA
Telephone: 202 473 1000
Fax: 202 477 6391
Web site: www.worldbank.org
Email: [email protected]
ISBN 978-0-8213-8245-5
SKU 18245
Related Documents


