Geophys. J. Int. (2009) 178, 394–418 doi: 10.1111/j.1365-246X.2009.04155.x GJI Seismology The lithosphere and asthenosphere of the Iceland hotspot from surface waves Ingi Thorleifur Bjarnason 1 and Harro Schmeling 2 1 Institute of Earth Sciences, University of Iceland, Sturlugata 7, IS-101 Reykjav´ ık, Iceland. E-mail: [email protected] 2 Institute of Earth Sciences, J. W. Goethe University Frankfurt Altenh¨ oferallee 1, D-60438 Frankfurt am Main, Germany Accepted 2009 February 11. Received 2009 January 28; in original form 2007 June 22 SUMMARY 1-D models were calculated for the velocity of shear waves, polarized vertically (SV ) and horizontally (SH ) from dispersed Rayleigh and Love surface waves. These had been recorded in Iceland by the ICEMELT broad-band seismic network, with about half of the waves coming from near-distance earthquakes (≤1000 km). The analysis included unusually short periods, as brief as 5.0 s, and periods ranging up to 93 s. The Icelandic crust was revealed to have two basic layers: first, the upper and middle crust, which were largely detected as one layer, and second the layer of the lower crust. The half of Iceland surveyed had a weighted average crustal thickness of 25–26 km, less than previously estimated. It is under East and East Central Iceland that the crust is thickest, averaging 29–32 ± 3 km, and under the western margin of the West Fjords, 29 ± 2 km. The thinnest parts of the crust lie in West Central Iceland, 19 ± 1 km, and in the West Volcanic (or Rift) Zone, 19[+6/−1] km. This study examined how thicker crust away from the rift zone can be fitted with dynamic crust formation models. Possible explanations for different thicknesses include both crustal squeezing flow and imbalances between widths of the volcanic accretion and extensional stretching zones. The crust has highly anisotropic zones, with differences of up to 20 per cent between SV and SH velocities. Under rift zones, the lower crust is characterized by low velocities and, at depths of 8–18 km, by a channel with yet lower velocities. The lowest shear velocity in this channel is 5–9 per cent less than in the standard Icelandic velocity model. The thinnest lithosphere, 20 ± 2 km, lies under the East Central and North Volcanic Zones, where it extends up into the crust, while the thickest lithosphere is under East Iceland and the east shelf, nowhere less than 100 ± 20 km. This substantial contrast in lithosphere thickness of some 80 km occurs within a lateral distance of 100–150 km, implying an age unconformity at depth of several tens of millions of years. The thick East Iceland lithosphere may reduce or obstruct any eastward flow of the plume head. On the opposite side of the plume head, in Northwest Iceland and the West Fjords, the lithosphere is estimated to be 60 ± 10 km thick. Excepting the West Fjords and East Iceland, shear wave velocities are low in the island’s subcrustal mantle, up to 7–9 per cent below the world average according to the PREM model. This indicates a warm, partially molten mantle under much of Central Iceland and the active rift zones. There is a lateral difference of 10– 12 per cent in shear velocity between the shallowest mantle asthenosphere under Central Ice- land and under the mantle lid to each side, that is, under the West Fjords and East Iceland. In the shallowest Central Iceland mantle, V p /V s -ratios suggest near solidus temperatures and a partial melt of 2–3 per cent. This paper describes structural variations in the asthenosphere down to 75–200 km. The low-velocity zone found 100–125 km below Central Iceland and the major part of western Iceland is interpreted as the onset of mantle plume melting. Man- tle anisotropy is pronounced beneath Iceland, with SH and SV velocities differing by up to 10 per cent. The anisotropy structure is 3-D and normally reaches higher values in the as- thenosphere than in the mantle lid. The main factor determining the asthenosphere’s generally azimuthal anisotropy may be the lattice-preferred orientation (LPO) induced by flow. Based on this interpretation and the observed anisotropy, it follows that the plume head is flowing westwards at a depth of 60–110 km. The deeper, more pervasive North Atlantic flow is towards 394 C 2009 The Authors Journal compilation C 2009 RAS

Welcome message from author
This document is posted to help you gain knowledge. Please leave a comment to let me know what you think about it! Share it to your friends and learn new things together.
Transcript

Geophys. J. Int. (2009) 178, 394–418 doi: 10.1111/j.1365-246X.2009.04155.xG
JISei
smol
ogy
The lithosphere and asthenosphere of the Iceland hotspot fromsurface waves
Ingi Thorleifur Bjarnason1 and Harro Schmeling2
1Institute of Earth Sciences, University of Iceland, Sturlugata 7, IS-101 Reykjavık, Iceland. E-mail: [email protected] of Earth Sciences, J. W. Goethe University Frankfurt Altenhoferallee 1, D-60438 Frankfurt am Main, Germany
Accepted 2009 February 11. Received 2009 January 28; in original form 2007 June 22
S U M M A R Y1-D models were calculated for the velocity of shear waves, polarized vertically (SV ) andhorizontally (SH) from dispersed Rayleigh and Love surface waves. These had been recordedin Iceland by the ICEMELT broad-band seismic network, with about half of the waves comingfrom near-distance earthquakes (≤1000 km). The analysis included unusually short periods,as brief as 5.0 s, and periods ranging up to 93 s. The Icelandic crust was revealed to have twobasic layers: first, the upper and middle crust, which were largely detected as one layer, andsecond the layer of the lower crust. The half of Iceland surveyed had a weighted average crustalthickness of 25–26 km, less than previously estimated. It is under East and East Central Icelandthat the crust is thickest, averaging 29–32 ± 3 km, and under the western margin of the WestFjords, 29 ± 2 km. The thinnest parts of the crust lie in West Central Iceland, 19 ± 1 km, and inthe West Volcanic (or Rift) Zone, 19[+6/−1] km. This study examined how thicker crust awayfrom the rift zone can be fitted with dynamic crust formation models. Possible explanationsfor different thicknesses include both crustal squeezing flow and imbalances between widthsof the volcanic accretion and extensional stretching zones. The crust has highly anisotropiczones, with differences of up to 20 per cent between SV and SH velocities. Under rift zones,the lower crust is characterized by low velocities and, at depths of 8–18 km, by a channelwith yet lower velocities. The lowest shear velocity in this channel is 5–9 per cent less thanin the standard Icelandic velocity model. The thinnest lithosphere, 20 ± 2 km, lies under theEast Central and North Volcanic Zones, where it extends up into the crust, while the thickestlithosphere is under East Iceland and the east shelf, nowhere less than 100 ± 20 km. Thissubstantial contrast in lithosphere thickness of some 80 km occurs within a lateral distanceof 100–150 km, implying an age unconformity at depth of several tens of millions of years.The thick East Iceland lithosphere may reduce or obstruct any eastward flow of the plumehead. On the opposite side of the plume head, in Northwest Iceland and the West Fjords, thelithosphere is estimated to be 60 ± 10 km thick. Excepting the West Fjords and East Iceland,shear wave velocities are low in the island’s subcrustal mantle, up to 7–9 per cent below theworld average according to the PREM model. This indicates a warm, partially molten mantleunder much of Central Iceland and the active rift zones. There is a lateral difference of 10–12 per cent in shear velocity between the shallowest mantle asthenosphere under Central Ice-land and under the mantle lid to each side, that is, under the West Fjords and East Iceland.In the shallowest Central Iceland mantle, Vp/Vs-ratios suggest near solidus temperatures anda partial melt of 2–3 per cent. This paper describes structural variations in the asthenospheredown to 75–200 km. The low-velocity zone found 100–125 km below Central Iceland andthe major part of western Iceland is interpreted as the onset of mantle plume melting. Man-tle anisotropy is pronounced beneath Iceland, with SH and SV velocities differing by up to10 per cent. The anisotropy structure is 3-D and normally reaches higher values in the as-thenosphere than in the mantle lid. The main factor determining the asthenosphere’s generallyazimuthal anisotropy may be the lattice-preferred orientation (LPO) induced by flow. Basedon this interpretation and the observed anisotropy, it follows that the plume head is flowingwestwards at a depth of 60–110 km. The deeper, more pervasive North Atlantic flow is towards
394 C© 2009 The Authors
Journal compilation C© 2009 RAS
Lithosphere and asthenosphere of the Iceland hotspot 395
the northwest, leading to differential shearing. However, LPO anisotropy alone would perhapsremain under 8 per cent, without the contributing factor of systematic melt distribution.
Key words: Surface waves and free oscillations; Seismic anisotropy; Mid-ocean ridge pro-cesses; Hotspots; Crustal structure; Atlantic Ocean.
1 I N T RO D U C T I O N
The subsurface landscape of the earth’s plates, in contrast to theundersurface of icebergs, does not resemble the forms appearingabove surface. At its surface, Iceland serves as an excellent place toobserve how plates drift apart and how the resulting gaps are filledso as to form the country’s complex volcanic landscape. This paper,however, focuses downwards, on the no less complex, subsurfacelandscape of these plates and on the mass of softer but mostly solidasthenosphere on which they float.
Being situated on the Mid-Atlantic Ridge, Iceland provides aunique opportunity to study the interaction between a plume andsuch an overriding oceanic ridge. Admittedly, identifying the seis-mic anomaly beneath Iceland (Wolfe et al. 1997) with a plume hasrecently been challenged (e.g. Foulger 2002), but whether or notit is called a plume (as it is in our study), this seismically slowmantle material is commonly assumed to be anomalously hot, wetor both. Where material of these sorts rises to shallow depths nearan oceanic ridge, melt production is expected to become vigorousand anomalous (e.g. White 1997). Following this hypothesis, alongwith interpretations of seismic refraction, surface waves, and grav-ity (Darbyshire et al. 1998; Darbyshire et al. 2000a; Allen et al.2002a; Fedorova et al. 2005), the Central Iceland crust above thepostulated plume is estimated to be as thick as 41–46 km. Towardsthe northwest peninsula (the West Fjords), Moho depths decreaseto values of 28–35 km and towards the east coast (the East Fjords)to 30–35 km (Fig. 1). Foulger et al. (2003) have proposed that theIceland-type crust extending from East Greenland to the FaeroeIslands is generally ∼30 km thick, and that the Central Icelandiccrust is thicker because of current crustal production adding ontoan older fragment of the thick Icelandic type of oceanic plate.
In an earlier seismic refraction study (RRISP), Gebrande et al.(1980) charted the seismic structure of Central Iceland with consid-erable resolution and then estimated the crustal thickness as ∼10 km(thin crust). This crust was interpreted to be underlain by anomalousslow mantle with compressional velocities of only 7.0–7.4 km s−1,down to a resolved depth of ∼30 km. While this RRISP study didnot find any Moho reflections from what could be interpreted as ashallow boundary of the crust and mantle (BCM), reflections wereobserved from a thin, higher-velocity layer (7.8 km s−1) at about30 km depth. In a later analysis by Menke et al. (1996), theseRRISP data were found to be consistent with a thick crust.
For modelling this thick crust, the main constraints come fromwide-angle-reflections (WAR) in seismic refraction experimentsand from teleseismic receiver function analysis. Most Icelandic seis-mic refraction data are unreliable for determining crustal thickness,since they do not include the accompanying Pn phase, that is, thecompressional wave refracted just under the crust, and assume theWAR to be a Moho reflection. So far, most refraction experimentshave used profiles that were too short for ascertaining sub-Mohovelocities (Pn) below a relatively thick crust, that is, a crust averag-ing over 25 km thick. Even though several receiver function studieshave dealt with the BCM zone (Du & Foulger 1999; Darbyshireet al. 2000b; Du & Foulger 2001; Schlindwein 2006), their results
only agree at one location, a location in Southwest Iceland that hasa significant conversion of P-to-S at the base of the thick crust, orMoho (Schlindwein 2006).
Why the crustal thickness should decrease away from the cen-tre of the plume is difficult to explain dynamically. Assuming thatthe plume flux remains constant over a given geological period,Ruedas et al. (2004) predict equal and constant thickness on ridgeperpendicular profiles on either side of the ridge for crust formedduring this period. One potential explanation for the Icelandic crustbecoming thinner with increasing distance from the plume centrewould be time-dependent rates of magma generation. Another ex-planation might be viscous relaxation (with spreading parallel to theridge) as crust travels away from the accretion zone. However, sucha relaxation would require a significant horizontal shear flow anda highly ductile lower crust (see e.g. Buck 1991). Recent dynamicmodels by Schmeling & Marquart (2008), on the other hand, dopresent scenarios in which an anomalous crust may thicken withincreasing distance from the ridge. Moreover, Ruedas & Schmeling(2008) have explored the physical parameters of how an anomalousspreading ridge may lead to either a thinning or thickening of thecrust away from the rift zone, depending on the ratio between thewidth of the crustal accretion zone and that of the crustal defor-mation zone. Any future dynamic interpretation of the Icelandicplume–ridge interaction will demand a reliable picture of crustalthickness variations and the lithospheric structure.
This paper introduces the analysis of Icelandic seismic data. Inaddition, it attempts to identify the island’s stratification and thethickness of its crust and lithosphere, in fact revising its crustaland lithospheric structure. Asthenosphere structure is analysed to adepth of ∼200 km. Unless otherwise stated, the term ‘lithosphere’will refer to the ‘seismic lithosphere’. Although the asthenosphereacquires its characteristics through long-term rheological weaken-ing, the physical properties involved correlate well with measuredreductions in seismic velocity. Therefore, unless stated otherwise,the term ‘asthenosphere’ will mean the seismic low-velocity zonebeneath the lithosphere.
2 DATA A N D A NA LY S I S
The fundamental results of this paper, which are used in furtheranalysis to determine velocity structure, are derived from series ofLove and Rayleigh wave dispersion measurements between pairsof stations (the two-station method) within the ICEMELT broad-band seismic network (Bjarnason et al. 1996a,b) (Fig. 2). Thesurface waves were measured with identical instruments usingthree-component Wielandt-Streckeisen STS-2 broad-band seismicvelocity sensors. Data were digitized and temporarily stored on sitewith Reftek recorders. The network was installed in 1993–1995with maximum of 15 operating stations. Stations were kept oper-ational until the autumn of 1996. The surface wave sources usedare from earthquakes mostly at a regional distance in the NorthAtlantic Ocean, and approximately half are within near distancerange (≤1000 km, Fig. 1). The short distance to these sources andrather uniform oceanic paths between them and Iceland made it
C© 2009 The Authors, GJI, 178, 394–418
Journal compilation C© 2009 RAS

396 I. Th. Bjarnason and H. Schmeling
Figure 1. Examples of near distance earthquakes on the Kolbeinsey ridge and the Jan Mayen fracture zone, and their great circle paths to a subset of stationsin the ICEMELT network (triangles). Segments of the neovolcanic rift zone are the West Volcanic Zone (WVZ), the East Volcanic Zone (EVZ), the CentralVolcanic Zone (CVZ) and the North Volcanic Zone (NVZ). An unconformity is labeled with a dark grey line in East Iceland. Notice how it has a similarorientation to the east segments of the neovolcanic rift zone. Seafloor topography by Smith & Sandwell (1997).
possible to analyse the simpler waveforms to a higher frequency thannormally. The waves analysed are mostly of periods between 5.0 and60 s for Rayleigh and 5.0–40 s for Love, respectively, and reachingup to 85–93 s for both wave types along the longer paths of CentralIceland.
The average phase velocity and its bootstrap 95 per cent con-fidence interval for Love and Rayleigh, was calculated for eachperiod from 10 to 23 individual dispersion curves, depending onthe source–receiver coverage for each path. The average phase ve-locity of each period is based on a minimum of 3 and a maximum of14 values from the individual dispersion curves. Periods with fewermeasurements are discarded unless they lie as close neighbours be-tween periods with 3 or more measurements and their values forma smooth bridge on the curve (Fig. 3).
The average curve of each station pair or group of station pairswithin one region is inverted to give two one-dimensional (1-D)velocity models for that region, with separate inversion for shearwaves polarized vertically (SV) and horizontally (SH). An iterativeleast squares inversion for a 1-D shear velocity as a function of depthwas calculated with programs of Russell et al. (1988) and Herrmann(1984 –1991) to fit the observed dispersion. The shallowest crust is
laterally averaged over 20–50 km (mostly due to off great circlepaths) and the models cover approximately half of the Iceland’scrust. The mantle at 200 km depth is averaged over a 130–170 kmwide zone along the paths (1/3 of the width of the 1st Fresnel zone,as proposed by Yoshizawa & Kennett 2002). The averaging of thelonger period waves, will extend to structures under the Westfjords(WF) and Eastfjords shelves (Fig. 1). The models cover close to100 per cent of the Iceland’s mantle at 100 km depth. As the seismicstructure is interpreted with a multiple of 1-D models, 100 per centcoverage does not imply full 3-D representation. The main unmea-sured parts are along the north and south coasts, the South IcelandLowlands (SIL), and West Iceland, west of the volcanic zone (Fig. 1).Waves along northsoutherly paths, are assumed to sample a similarsubsurface geology (‘pure paths’) due to along isochronal positionof the past or present ridge segments and an 1-D velocity modelmay therefore give a better structural representation for these paths.Similarly, eastwesterly paths of this study can be assumed to be‘none-pure paths’, where average representation in 1-D model maynot correspond as well with real structure.
The surface waves in general, do not resolve a Moho as such, butin this study a change in the velocity gradient is used to define the
C© 2009 The Authors, GJI, 178, 394–418
Journal compilation C© 2009 RAS

Lithosphere and asthenosphere of the Iceland hotspot 397
Figure 2. Station coverage (triangles) of the ICEMELT broad-band seismic network in 1995, in addition to the station BORG within the Global SeismographicNetwork. The network was put up in stages from 1993 and taken down in 1996 September–October. Colour lines schematically represent two-station paths,and abbreviated code names for regions they sample: WF; Northwest Iceland (NW); West Iceland and the West Volcanic Zone (W); Central Iceland pathswith ∼E–W azimuth (CEW); Central Iceland path with ∼N–S azimuths (CNS), which is almost exclusively along the neovolcanic rift zone; East Iceland (E).Stippled lines indicate path segments with less coverage of individual dispersion curves.
BCM, together with plausible values of mantle shear velocity. Thisis a non-traditional way of defining the BCM. The justification istwofold: (i) a traditional Moho with compressional wave velocityjump of ∼1.0 km s−1 has not been clearly observed in Iceland(see Appendix), and (ii) it is well known that velocity gradient isapproximately an order or two of magnitude less in the subcrustallithospheric mantle, subsequently referred to as mantle lid, than inthe lower crust. The lower crustal shear velocity gradient measuredwith refracting body waves in Iceland is in the range 0.8–3.7 ×10⁻² s−1 (Bjarnason et al. 1993; Brandsdottir et al. 1997; Stapleset al. 1997; Darbyshire et al. 1998), compared to a gradient in thetop 25 km of the mantle lid of 0.7–9.2 × 10⁻⁴ s−1 in the globalmodels PREM and ak135 (Dziewonski & Anderson 1981; Kennettet al. 1995). The average velocity gradient of the lower crust ofIceland is used in the starting model, but the gradient of the mantlelid is assumed 7.7 × 10⁻³ s−1. The ratio of the two is 2.8 ± 0.6 inthe starting model, which is low. This is because of a significantlyhigher mantle-lid gradient in the starting model than in the globalmodels. Inversion increases this ratio to 6 ± 4 on average, puttinga sharper BCM than was in the starting model. The starting modelhas a change in velocity gradient from crustal to mantle values at28 ± 2 km depth. The inversion results determine a crust–mantlegradient change at depths of 19–32 km, so it is fair to say that thestarting model is not overly influential in fixing the crustal thicknessa priori.
The average velocity gradient of the top of the mantle lid ofthe inversion solutions is 4 ± 3 × 10⁻³ s−1, with large vari-
ance, and the velocity gradient of the lower crust is 2.5 ± 0.8 ×10⁻² s−1. It should be noted that the relatively smooth starting modelis likely to influence smoother solutions. If the BCM under Icelandis characterized by a Moho or a reduced Moho, synthetic tests showthat the inversion with the current starting model may overestimatevelocities at the bottom of the crust and gradients in the lower crust,but underestimate lid velocities. The effectiveness of the methoddesigned here to estimate crustal thickness, was tested syntheti-cally. It shows a positive correlation between the crustal thicknessof the synthetic models (hc) and the estimated thickness from theinversion solutions (he). With the limited number of test samples,linear relationship between hc and he is not statistically significant,but neither is such a relation rejected. On average the estimatedcrustal thickness (he) is 1.5–2.0 km thinner than the model thick-ness (hc). For a further description and discussion of data analysis,see Appendix.
3 T H E C RU S T
3.1 Boundary of the crust and mantle
The SH models agree usually better with the general body wavederived structure of the Icelandic crust than the SV models, exceptin the top 2–3 km of the crust. The general body wave modelis based on the standard earthquake location model of Iceland,the compressional wave SIL model (Stefansson et al. 1993), andscaled with the Vp/Vs = 1.785 ratio. The SIL model is derived
C© 2009 The Authors, GJI, 178, 394–418
Journal compilation C© 2009 RAS

398 I. Th. Bjarnason and H. Schmeling
3.0
3.5
4.0
4.5
Pha
se V
eloc
ity (
km/s
)
10 100
Period (s)
WEST
CNS
CEW
3.0
3.5
4.0
4.5
Pha
seV
eloc
ity (
km/s
)
10 100
Period (s)
WF EAST
NW
RAYLEIGH DISPERSION
Figure 3. Average dispersion curves for s measured regions of Iceland. (a) The Rayleigh wave dispersion curves are grouped by age in two graphs. The uppergraph shows the older regions WF, NW, E and the lower graph the younger regions W, CNS and CEW. See Fig. 2 for locations. For most periods the Rayleighwave phase velocities are higher in the older regions than in the younger regions. (b) Same grouping by age for the Love waves. Below the 10 s period, thephase velocities are generally higher in the older regions than in the younger regions. Boot strap 95 per cent confidence intervals are shown with vertical linesthrough the measured periods. Table 1 contains the the number of individual dispersion curves used for the averages.
from a multiple refraction experiment (Bjarnason et al. 1993) inSouthwest Iceland, and compiled for the SIL, an area of ∼4-Ma-oldcrust on average (Fig. 1). In the case of a crust with a predominanthorizontal layer cake structure with stiff and soft layers, or softjoints between layers, the deeper penetrating crustal compressionalwaves that travel mostly horizontally, are more sensitive to the fastervelocity layers. The Love waves are in the same way more sensitiveto the stiffer and velocity faster layers. Based on these assumptionswe use the SH models to define the main structural division of thecrust and the boundary between the crust and the mantle (BCM).
The uncertainty in determining crustal thickness with a changedgradient method can be high, or up to ±5 km, but is generally±2 km or less. The error bars are estimated by fitting a straight
line to the parts of the models with velocity gradient in the rangeof observed velocity gradients for the lower crust in Iceland, and asecond straight line is fitted to the models there below with lowergradient, interpreted to be the mantle. Most models have a veloc-ity gradient decrease (but also increase) within the supposed lowercrust. The BCM is selected where the SH velocity gradient de-creases by a factor of two or more and that coincides with SH and/orSV velocity >4.00 km s−1. The line fits are done on the invertedmodel and its 95 per cent confidence models. The errors consti-tute the depth range of intersection of these straight lines. Higheraccuracy is achieved in measuring these intersections when plot-ting the models in the depth range 0–100 km, rather than 0–50 kmor 0–200 km as they are presented in Figs 4 and 7, respectively.
C© 2009 The Authors, GJI, 178, 394–418
Journal compilation C© 2009 RAS

Lithosphere and asthenosphere of the Iceland hotspot 399
3.0
3.5
4.0
4.5
Pha
se V
eloc
ity (
km/s
)
10 100
Period (s)
WEST CNS
CEW
3.0
3.5
4.0
4.5
Pha
se V
eloc
ity (
km/s
)
10 100
Period (s)
WF
EAST
NW
LOVE DISPERSION
Figure 3. (Continued.)
A change in the starting model by 0.09 km s−1 (root mean squarederror defined: RMSE = [ 1
n
∑ni=1((ai − bi )2)1/2], leaves the depth
of the BCM within the error bars. As is common in geophysics,these errors have to be regarded as minimum errors, because notall of the model space is explored. The error bars for the depth ofthe lithosphere–asthenosphere boundary (LAB) are determined ina similar way, but the LAB boundary is defined with the SV models(see Section 5).
Approximately half of the onland crust of Iceland is measuredin this study, with a weighted average crustal thickness 25–26 km.The thickest crust is under East Iceland (E), 32 ± 3 km thick (SH)and slightly thinner, 29 ± 2 km thick (SH), under the WF (Figs 2,4a and f; Table 1). The thinnest crust is under the Central Icelandeast–west path (CEW) 19 ± 1 km (SH) and the West Volcanic
Zone (W) 19+6/−1 km thick (SH) with very low mantle lid veloc-ities in both provinces (Figs 4d and c). For example, in the CEWprovince the mantle lid velocities are SV = 4.08 km s−1 and SH =4.20 km s−1, which are δVSV = −0.32 km s−1 and δVSH =−0.42 km s−1 perturbations or −7.3 per cent and −9.0 per centlower than SV and SH in the top 10 km of the mantle lid in thePREM model (Fig. 5, Dziewonski & Anderson 1981). These lowmantle lid velocities under Central Iceland allow interpreting the10–15-km-thick mantle lid as a crust–mantle transition zone, inline with Kaban et al. (2002). However, near-solidus temperaturesand melt may have similar effect on the seismic velocity of mantlematerial.
Although surface waves have usually less resolution than bodywaves, it seems that they contradict the Moho interpretation of the
C© 2009 The Authors, GJI, 178, 394–418
Journal compilation C© 2009 RAS

400 I. Th. Bjarnason and H. Schmeling
0
10
20
30
40
50
Dep
th (
km)
1.5 2.0 2.5 3.0 3.5 4.0 4.5 5.0 –20 –10
Shear velocity (km/s)
SH
SV
WESTFJORDS
WF
BCM
0
10
20
30
40
50
Anisotropy (%)(a)
0
10
20
30
40
50
Dep
th (
km)
1.5 2.0 2.5 3.0 3.5 4.0 4.5 5.0
Shear velocity (km/s)
SH
SV
NORTHWEST
NW BCM
BCM
0
10
20
30
40
50
Anisotropy (%)
– –(b)
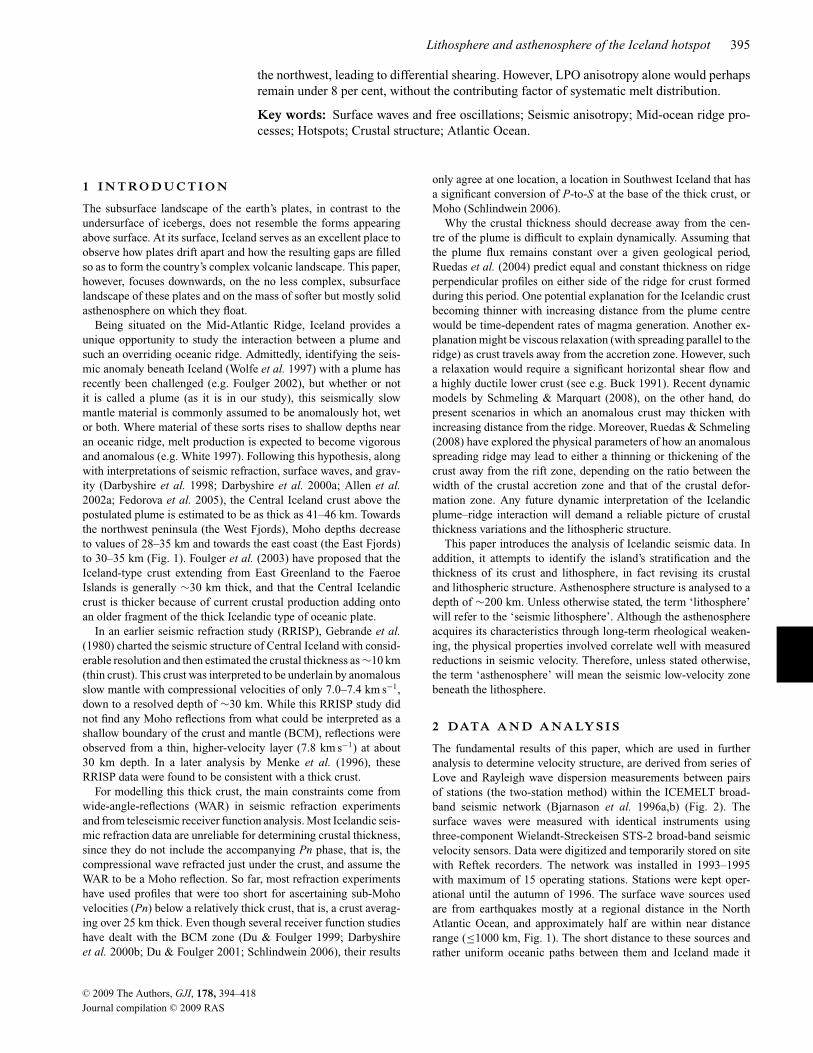
Figure 4. Velocity structure and anisotropy in top 50 km for the 6 measured provinces from west to east through Iceland (a–f). See Fig. 2 for profile locations.The inverted models are constant velocity layers, but plotted here with linear interpolation. The boundary of the crust and mantle is indicated (BCM) and thelithosphere–asthenosphere boundary (LAB) where it is shallower than 50 km. The SH and SV velocities are shown and their 95 per cent confidence range. Amodified version of the standard velocity model of Iceland (SIL model) is plotted for reference (stippled black lines). The apparent anisotropy is defined as( SH−SV
SV ) × 100 per cent.
C© 2009 The Authors, GJI, 178, 394–418
Journal compilation C© 2009 RAS
Lithosphere and asthenosphere of the Iceland hotspot 401
0
10
20
30
40
50
Dep
th (
km)
1.5 2.0 2.5 3.0 3.5 4.0 4.5 5.0
Shear velocity (km/s)
SH
SV
WEST
W BCM
LAB
0
10
20
30
40
50
Anisotropy (%)
– –(c)
0
10
20
30
40
50
Dep
th (
km)
1.5 2.0 2.5 3.0 3.5 4.0 4.5 5.0
Shear velocity (km/s)
SH
SV
CEW BCM
LAB
0
10
20
30
40
50
Anisotropy (%)
– – – –(d)
Figure 4. (Continued.)
C© 2009 The Authors, GJI, 178, 394–418
Journal compilation C© 2009 RAS

402 I. Th. Bjarnason and H. Schmeling
0
10
20
30
40
50
Dep
th (
km)
1.5 2.0 2.5 3.0 3.5 4.0 4.5 5.0
Shear velocity (km/s)
SH
SV
CNS
BCM
LAB
0
10
20
30
40
50
Anisotropy (%)
– – – –(e)
0
10
20
30
40
50
Dep
th (
km)
1.5 2.0 2.5 3.0 3.5 4.0 4.5 5.0
Shear velocity (km/s)
SH
SV
EAST
E
BCM
0
10
20
30
40
50
Anisotropy (%)
– –(f)
Figure 4. (Continued.)
C© 2009 The Authors, GJI, 178, 394–418
Journal compilation C© 2009 RAS
Lithosphere and asthenosphere of the Iceland hotspot 403
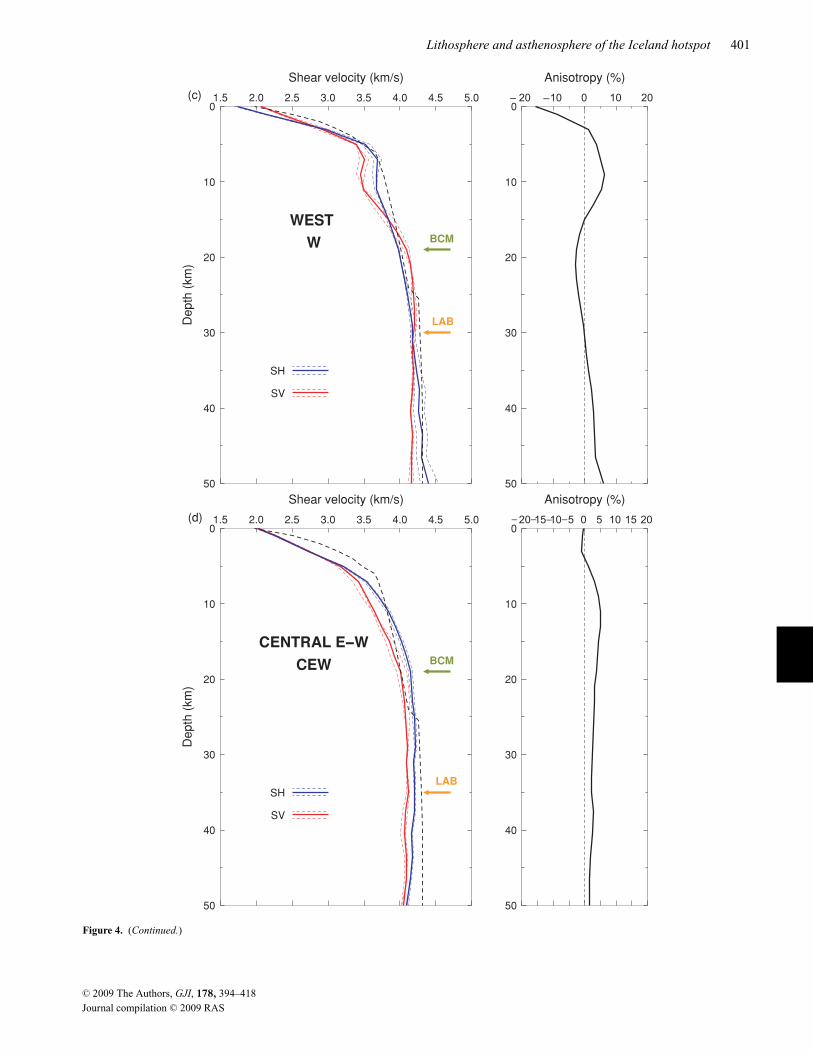
Table 1. Lithosphere and asthenosphere.
Provinces WF NW W CEW CNS E
Depth to changed δV /δz (km) 5 ± 1 7 ± 1 7 ± 1 7 ± 1 7 ± 1 7 ± 1Upper-middle crust thick. (km) 3.7 ± 0.1 6.8+0.4/−0.2 6.4+4/−0.8 8.4 ± 0.3 6.2 ± 0.1 6.7 ± 0.2Lower crust thickness (km) 25 ± 2 17 ± 5 13+1/−4 11 ± 1 23 ± 1 25 ± 3Crustal thickness (km) 29 ± 2 24 ± 5 19+6/−1 19 ± 1 29 ± 1 32 ±3Lithosphere thickness (km) 55 ± 5 65 ± 5 30 ± 3 35 ± 5 20 ± 2 >100 ± 20SH at top of mantle lid (km s−1) 4.45 4.16 3.99 4.15 4.14 4.05Mantle lid thickness (km) 26 ± 7 41 ± 10 11+4/−9 16 ± 6 0 >70 ± 20Depth to SH = 4.15 km s−1 (km) 23 ± 1 23 ± 2 28 ± 2 19 ± 2 29 ± 2 41 ± 1Depth to SV = 4.15 km s−1 (km) 33 ± 1 36 ± 5 21 ± 1 125 ± 5 80 ± 7 40 ± 1SH at 110 km depth (km s−1) n.a. 4.52 ± 0.09 4.38 ± 0.11 4.08 ± 0.10 4.23 ± 0.04 4.65 ± 0.09SV at 110 km depth (km s−1) n.a. 4.10 ± 0.01 4.11 ± 0.01 4.06 ± 0.01 4.10 ± 0.05 4.43 ± 0.14Individual Love disp. 15 12 15 11 19 18Individual Rayleigh disp. 11 10 16 16 18 23
Figure 5. The top 200 km of the PREM model of Dziewonski & Anderson (1981), and calculated anisotropy as defined in this work. The starting model 8f(stippled black line) is shown for reference.
40-km-deep wide-angle reflections (Darbyshire et al. 1998), or thatof the weak discontinuity at similar depth observed with receiverfunctions and interpreted as a gradational crustal–mantle transition(Du & Foulger 2001). Our analysis put these discontinuities into themantle. A Moho or a crust–mantle transition are always associatedwith lower velocity on top of higher velocity. At 40 km depth thesurface waves see higher velocity on top of lower velocity. Thisdifference in interpretation is not a result of the non-traditionaldefinition of BCM of this work. A correction for the structure ofthe E province that sample 1/3 of the CEW paths, would most likelystrengthen the general interpretation of the positions of the BCMand the LAB in the CEW province. The correction would increasethe velocity of the mantle lid in the depth range 19–35 km anddecrease the velocity of the asthenosphere below 35 km depth.
There are several explanations to the contrasting conclusionson the crustal thickness of Central Iceland. These include actualdifferences in seismological results, derived from similar data (Allenet al. 2002a), but they may also be due to different interpretationof dissimilar seismological data (e.g. Darbyshire et al. 1998; Du& Foulger 2001). The disparity between this work and Allen et al.(2002a) could lie in a narrower period range and quite constrainingstarting model with a priori ∼40-km-thick crust in Central Icelandof the latter. In addition, this work uses Love and Rayleigh waveswhile Allen et al. (2002a) only use the Love wave component of thesurface waves. In our view the Rayleigh waves confirm the generalstructure and interpretation of Central Iceland (Fig. 4d). Neither thedata of Du & Foulger (2001) or of Darbyshire et al. (1998) clearlyresolve well the structure of the presumed mantle lid under the
C© 2009 The Authors, GJI, 178, 394–418
Journal compilation C© 2009 RAS
404 I. Th. Bjarnason and H. Schmeling
BCM, which is very helpful in making a firm distinction betweenthe lower crust and the mantle. Data exist which we believe partiallysupports this new interpretation. By inspecting the refraction recordsection from the G-shots of Gebrande et al. (1980), a Pn-like phasewith apparent velocity of 7.6 km s−1 arrives at a cross-over distanceof 130–150 km. That suggests that the area north of Hekla and intoCentral Iceland has crustal thickness <25 km. The SIL area ∼60 kmSW of the southern edge of Central Iceland has a confirmed crustalthickness of 21–22 km (Bjarnason et al. 1993).
Judging by the crustal thicknesses of 19 km (SH) in the Wprovince and of 29 km (SH) in the WF province, it is clear thatthe NW province, that partly contains both, is not a ‘pure path’province. In fact, the NW SH model has velocity gradient change ata depth of 19 and 29 km, and both could be a candidate for the BCM(Fig. 4b). We assign an intermediate crustal thickness between thetwo values in the NW province of 24 ± 5 km, even though it is astylistic break in the method used, as there is not a gradient changeat 24 km depth.
The crustal thicknesses reported here agree well or moderatelywell with previous studies, with the exception of the new interpreta-tion of crustal thickness of west central Iceland (intersection of thenorth part of W profile and west part of CEW profile). Under EastIceland, Staples et al. (1997) determined 35-km-thick crust and Duet al. (2002) 30.5-km-thick crust on average. Under the southernpart of the W province, Bjarnason et al. (1993) determined a 21–22-km-thick crust and Du et al. (2002) a crust of 22-km thickness,but Du & Foulger (2001) determined a 29-km-thick crust under thenorth part of the W province. Du & Foulger (1999) determined thin-ner crust under the WF province, or 24.5 km thick on average, butHolbrook et al. (2001) reported a crust of 30-km thickness underthe SIGMA 1 line on the WF shelf.
It is interesting to note that at the east and west flanks of thehotspot (i.e. West- and Eastfjords and their shelves (Fig. 1), thecrust is thicker than in the central parts (Figs 4a, f and c, d). Thiscontradicts not only the seismic results of Darbyshire et al. (1998)and Du & Foulger (2001) but apparently also the numerical mod-els of crust formation above a plume centred at a spreading ridgeby Ruedas et al. (2004). That model assumed that crust is formedwithin a 60 km wide spreading and accretion zone above the plumecentre, from which it is laterally transported away at a rate corre-sponding to the plate velocity. A consequence of this geometricaland kinematic assumption is a crust having its maximum thicknessat the centre of the plume. In contrast, and in agreement with theseismic observations of this paper, more recent dynamic models(Schmeling & Marquart 2008) show that differential flow withinthe newly formed crust may be the cause of central thinning of thenewly accreted crust. In the central region crustal material is ac-creted in the central emplacement zone, but moves sideways with asomewhat higher velocity than the spreading velocity. This differ-ential, squeezing-type flow is caused by the dynamic pressure in thecentral region due to the buoyant plume pushing from below andthe accreting material pushing from above. As an example, Fig. 6bshows one of these models (plume is centred at x = 0, the model issymmetrical with respect to x = 0) in which the central part of thecrust (light blue) moves to the side upon thickening. Even thoughthe crust is thinner in the central part, resulting in lower isostatictopography relative to the flanks, hot buoyant asthenosphere anddynamic stresses due to plume flow may be strong enough in thiskind of models to produce an overall positive central topography. Inanother more kinematical approach, Ruedas & Schmeling (2008)systematically investigate the conditions leading to lateral crustalvariations near spreading centres and find that central thinning is a
consequence of an imbalance between the widths of the extensionalstretching zone, we, and the volcanic accretion zone wv. Centralthinning usually occurs if we < wv. Thus seismic observation ofa thinner central part possibly implies that crustal accretion takesplace in a wider region than the rift zones, implying that the ad-dition of magmatic material outside the rift zones is an importantcontribution to Icelandic crustal formation.
3.2 Upper and middle crust
Traditionally the crust is divided into two main layers, upperand lower crust. In Iceland the separation has been made at thedepth of the velocity contour 6.50 km s−1 for compressional waves(Palmason 1971), which also coincides approximately with a changein velocity gradient of the velocity structure (Flovenz 1980). Lately,the upper crust has been divided into two parts, upper and middlecrust (Bjarnason et al. 1993). The idea is that an ophiolite oceaniccrustal model may also apply to Iceland with the upper crust beingconstructed mostly of volcanic extrusives and the middle crust ofextrusives and sheeted dyke complexes, magma chambers and ac-cumulates. The middle crust is intermediate in seismic properties,but usually not in the centre of the crust. In line with the nomen-clature ‘extrusive’ and ‘intrusive’ crust, we propose to call the mid-dle crust ‘bitrusive’ in origin. With an average thickness of only∼5.0 km of the combined upper and middle crust (Flovenz 1980), itis beyond the resolution of the surface waves of this study to discrim-inate between them. Therefore, they are lumped together. Preferablythe division between the upper-middle crust and lower crust shouldbe made with a changed velocity gradient. However, it seems thatthe starting model for the inversion in this work is rather influentialin fixing a gradient changed at 7 km depth in most of the provinces(Table 1). Hence the 3.64 km s−1 velocity contour for SH wavesis used to define the depth to the lower crust and thickness of theupper-middle crust, and error bars correspond to the depths of thiscontour in the 95 per cent confidence models. This velocity con-tour corresponds to the compressional velocity 6.50 km s−1 and theVp/Vs = 1.785 ratio, the fixed value of the inversion. That valueis 0.5 per cent higher than the average Vp/Vs for the whole of theIcelandic crust measured so far, but very close to the average ratioof the lower crust (Palmason 1971; Menke et al. 1996; Staples et al.1997; Darbyshire et al. 1998; Tryggvason et al. 2002).
The thinnest upper-middle crust (extrusive and bitrusive) are un-der the western parts of the WF where it is only 3.7 ± 0.1 kmthick (SH in Fig. 4a). The thickest upper-middle crust is underthe CEW profile, that crosses East Iceland and the high CentralIceland, where it is 8.4 ± 0.3 km s−1 thick (SH in Fig. 4d). Us-ing compressional waves Palmason (1971) on average estimatedthe upper-middle crust to be 4.3 km thick in the WF province andHolbrook et al. (2001) estimated a 5-km-thick upper-middle crustthere, also using compressional waves, but not with good resolu-tion (Reid, private communication, 2007). Darbyshire et al. (1998)measured upper-middle crust up to 8–10 km thick under the west-ern half of the CEW profile with compressional waves. However,the Love wave dispersion in WF has a certain irregularity in thehigh frequency end that excites the inversion into extreme shallowstructure, which possibly underestimates the thickness of the upper-middle crust (Fig. 3b), and the CEW dispersion (Love) has the leasthigh frequency coverage of all the dispersion curves. Therefore,the thickness of upper-middle crustal may be more uncertain alongthese profiles than elsewhere.
In the NW province (station BLOL to WF) the upper-middle crustis 6.8+0.4/−0.2 km thick (SH in Fig. 4b). The SH model of this
C© 2009 The Authors, GJI, 178, 394–418
Journal compilation C© 2009 RAS

Lithosphere and asthenosphere of the Iceland hotspot 405
Figure 6. Comparison of the seismically derived crustal structure with a dynamic model of crust formation. (a) Summary of thicknesses of upper and middlecrust, total crust and lithosphere from the seismological models. (b) Basaltic depletion and generated crust of a numerically modelled spreading zone with1 cm yr−1 spreading rate, beneath which a plume is ascending with 10 cm yr−1 and 150 ◦K excess temperature. Melting occurs in the plume head, is extractedand fed back into the model at the top between x = 0 and 50 km to generate the crust. Time is 25 Ma after starting plume influx. Depletion values in the mantle(red) vary between 0 and 0.2 (i.e. up to 20 per cent basaltic melts are extracted in the dark red regions), blue/yellow colours represent newly formed crust, theactual colour has been varied periodically to visualize the evolution of crust formation. Note the thinning of the crust above the centre of the plume (x = 0)despite maximum crust generation rate there. Figure modified after Schmeling & Marquart (2008), where more modelling details can be found.
province is the closest to the standard earthquake location model ofIceland, the SIL model. The RMSE between the NW SH model andthe SIL model is 0.11 km s−1, assuming Vp/Vs = 1.785.
The neovolcanic zones along the W and CNS profiles, have6.4+4/−0.8 km and 6.2 ± 0.1 km thick (SH) upper-middle crustrespectively (Figs 4c and e), with mean thickness of 6.3 km (SH).This upper-middle crustal is on average 0–2.0 km thicker than thoseof refraction experiments that have crossed neovolcanic zones awayfrom central volcanoes (Zverev et al. 1980; Bjarnason et al. 1993;Brandsdottir et al. 1997; Weir et al. 2001). It does possibly indicatea higher Vp/Vs-ratio in the upper-middle crust of the neovolcaniczones than assumed in this study. In the CNS province both SV andSH velocities are low throughout the lower crust, with an extra lowvelocity channel (velocity inversion), between 8 and 18 km depth.The maximum perturbation of the SH model from the standard SILmodel in the low velocity channel is −0.206 km s−1 or −5.3 per centat 13 km depth. This is a large velocity perturbation. These SH ve-locity perturabations are similar to those observed by Allen et al.(2002a) in the same area, which they obtained from inversion ofLove waveforms. The SH velocities in the W province have alsoa low velocity channel in the depth range 8–18 km, but with lessperturbation than the CNS channel (−0.142 km s−1 or −3.7 per centat 11 km depth). The SV models for the top 15 km of the crust are
very similar in the two rift zones. That is not unexpected, due tothe similarity of the dispersion curves between the 5 and 9 s peri-ods. The maximum perturbation of the ridge SV models from thestandard model are −7.4 and −8.6 per cent at 9 and 11 km depthsin CNS and W provinces, respectively. These low velocities in thelower crust of the ridge areas need to be quantified in future studiesin terms of temperature and a possible melt.
A notable asymmetry in the thickness of the upper-middle crust isobserved between the WF (10–15 Ma) with 3.7 ± 0.1 km thick (SHin Fig. 4a) upper-middle crust and East Iceland of similar age, whereit is 6.7 ± 0.2 km thick (SH in Fig. 4f). Even though the thicknessin the WF, may have been underestimated as mentioned above,adding to this asymmetry is 0.5–1.0 km higher erosion of the lava-pile in East Iceland than in the WF (Hjartarson and Sæmundsson,private communication, 2006). The estimated upper-middle crustalthickness of East Iceland is higher than reported by previous authorswith refraction measurements: estimated ≤3.5 km by Palmason(1971), 4.0–5.0 km by MacKenzie et al. (1982) and 5.0–6.0 kmby Staples et al. (1997). However, the main difference between theEast Iceland crust compared to other parts of the crust in Iceland asobserved by surface waves, is the slow seismic velocity of the lowercrust. Only the lower crust of the CNS province has similarly lowvalues. The lower crust of the E and CNS provinces is on average
C© 2009 The Authors, GJI, 178, 394–418
Journal compilation C© 2009 RAS

406 I. Th. Bjarnason and H. Schmeling
3 per cent slower than the velocity of the lower crust in the SILmodel. Unsurprisingly, for the Central Iceland path, but surprisinglyfor the 8–15 Ma old East Iceland, as the velocity of the crust isexpected to increase with age, possibly due to the cooling andhydrothermal filling of pores. Instead of interpreting anomalousslow lower crust in East Iceland, the structure can also be interpretedas combination of double thick upper-middle crust compared tothe 5.0-km-thick upper-middle crustal average of Iceland (Flovenz1980) and slower lower crust.
The thicker upper-middle crust of East Iceland is suggested to bethe result of eastward ridge jumps of the rift system (Saemundsson,1980), where the upper-middle crust gets reburied with largeamounts of new extrusives, causing a major age unconformity. Onesuch unconformity is observed on the surface in East Iceland (Fig. 1,Johannesson & Saemundsson 1998), with ∼1.5 km erosion of theolder strata (Sæmundsson, private communication, 2006). In theEast province number of acid extrusives have been observed, pos-sibly indicating higher remelting of the crust. The relatively lowvelocity of the lower crust of East Iceland might also be explainedby a higher proportion of extrusive originated material in the lowercrust as interpreted earlier by Smallwood et al. (1998). Another ex-planation is a buried continental fragment (Bjarnason 2003; Foulger2006). For further discussion, see Section 5.
3.3 Anisotropy in the crust
The surface waves show a large anisotropic signal in the crust. Theanisotropy is here defined as ( SH−SV
SV )×100 per cent. Due to incom-plete azimuthal coverage, all anisotropy values quoted here refer toapparent anisotropy in a particular path direction, which may or maynot be a good measure of total anisotropy. Prior to this study othershave observed (i) crustal anisotropy with a horizontal fast directionin the upper crust (Menke et al. 1994; Crampin et al. 2002) or (ii)no or only a minor component of horizontal fast direction observedwith receiver functions, that average the whole crust (Du & Foulger1999; Schlindwein 2001). Menke et al. (1994) interpreted an up-per crustal anisotropy as being caused by fractures with dominantdirection along the general strike of the rift in Iceland.
In this study, the largest anisotropic signal within the crust isobserved in the top 2–3 km of the crust in the rift zones and the WFprofile in the WF. The average anisotropy in the top 2 km surfacelayer is −9 per cent in the rift zones and −15 per cent under WF(Figs 4a, c and e). These anisotropies are interpreted to be causedby vertical fractures associated with the current rifting, alignedin the strike of the rift and extending to ∼2 km depth. The highshallow anisotropy under WF is harder to interpret. As mentionedbefore, there is a considerable uncertainty in the high frequencyend along this path, making the derived shallow structure lesscertain.
One of the unexpected findings of this study is a layer withpositive anisotropy, with the strongest signal under the rift zonessurveyed, the West, North and Central Volcanic Zones (Figs 4cand e). The onset is in the midcrust, at 3–5 km depth, and extends5–8 km into the lower crust. In this layer the SH wave is on average4 per cent faster than the SV wave, with maximum anisotropy of+6 per cent. Every percent difference, is significant when looked aton this larger horizontal averaging scale. In this depth range between∼5 and 15 km, the SH structure is similar to what has previouslybeen determined by a number of refraction experiments, but the SVstructure is unexpectedly slow.
Our favoured hypothesis is that this signal is due to a horizontallayer cake of stiff and soft layers. The Love waves and the refracted
body waves are sensitive to stiff layers, as the Rayleigh waves areto soft layers. Lateral extension of these layers needs to be of theorder of 20 km. The thickness of these layers is unconstrained, butit is likely that the softer layers are thinner than the stiffer ones inline with refraction results, which do not see the softer layers. A lesslikely hypothesis is that the anisotropy is caused by an alignmentof crystal fabric, with the average horizontal fast crystallographicaxes striking 40–90 ◦ to the direction of the rift system. It is bothbecause a basaltic crust has less amount of anisotropic crystals, andsuch an alignment would ‘freeze’ in the crustal rocks and shouldbe observed outside the rift zones, as a general feature of Icelandiccrust. That is, however not the case. An obvious hypothesis wouldbe to associate the softer horizontal layers with new subsurfacehorizontal volcanic intrusions. As they drift and cool outside of thevolcanic zones, the stiffness will increase to the level of the rest ofthe rock mass, and the signal disappear. This is generally observed,except in the western part of the WF (Fig. 4a), which underminesthis as a general hypothesis. An implication of such a hypothesiswould be that a significant part of the crust is produced in themid- and lower crust along the whole rift zone, in contrast with theshallow magma chamber model, but in agreement with the crustalaccretion model of Schmeling & Marquart (2008).
Other parts of the crust are also anisotropic, but none in such asystematic way as this mentioned layer. It can be said that the westernpart of WF, appears like an exaggerated anisotropic structure of theactive rift zones, although it may be of another origin. The signalin the dispersion curves (inflection) that is causing the high SVvelocity body in the lower crust between 10 and 18 km under WF(Fig. 3a), was also observed by Du & Foulger (1999; Fig. 9 there).Schlindwein (2006) observed similarily a high velocity between∼10 and 25 km depth and velocity inversion under ∼25 km depthfrom receiver functions of events with a northerly azimuth.
A layered crustal structure, with steeply tilting layers of ∼45 ◦,will appear isotropic for surface waves. It is possible that the ob-served isotropy of the crust in East Iceland, could be partly due tosteeply tilting layers as observed by Smallwood et al. (1998). Com-pared to other provinces, which all have a significantly anisotropiccharacter, the East Iceland crust is anomalously well behaved inrespect to its isotropic character.
4 S U B C RU S TA L V p / V s - R AT I OA N D T E M P E R AT U R E E S T I M AT E S
In a number of refraction experiments in Iceland an apparent P-wave velocity of 7.8 ± 0.2 km s−1 (SD = standard deviation) hasbeen measured at 24–30 km depth (Gebrande et al. 1980; Bjarnasonet al. 1993; Menke et al. 1998). These measurements were all in thevicinity of volcanic zones or under Central Iceland. Assuming thisto be a low Pn velocity in the top of the mantle lid, and using theaverage surface wave velocity derived from SV and SH velocities of4.08 ± 0.02 km s−1 (SEM = standard error of the mean) throughoutIceland at the BCM, gives a ratio Vp/Vs = 1.91 ± 0.03 (SEM). Theratio is 1.88 ± 0.04 (SEM) when compared with the average SHvelocity alone. Allen et al. (2002a) inferred a similar high ratioof 1.92 at 35 km depth, but Menke et al. (1998) a lower ratio,1.86 ± 0.04 (SD) at the BCM. It should, however, be noted that theinferred ratio of about 1.90 is probably an upper limit, because asdiscussed in Section 2, it is likely that the inversion underestimatesthe shallowest mantle-lid S-wave velocity.
A Vp/Vs-ratio of 1.90 is about 6 per cent higher than the standardV p0/V s0-ratio of 1.792 at these depths in the mantle (e.g. ak135model of Kennett et al. 1995). Such an increase may indicate higher
C© 2009 The Authors, GJI, 178, 394–418
Journal compilation C© 2009 RAS

Lithosphere and asthenosphere of the Iceland hotspot 407
Table 2. Possible temperatures and melt parameters to explain the observed V p/V s-ratios at 30 km depth.
D φr Ref. lithosphere Water a1 (K −1) a2 (K −2) a3 a4 T (◦C) T − Tpot-corr (K)
0.20 1 per cent 20Ma (1018 ◦C) Dry 1.18E-05 1,03E-07 0.81 6,00E-03 1631 2820.30 1 per cent ” ” ” ” ” 7.20E-03 1621 313
” 3 per cent ” ” ” ” ” ” 1490 182” 2 per cent 60 Ma (531 ◦C) ” ” ” ” ” 1461 153
0.20 3 per cent ” ” ” ” ” 6,00E-03 1374 250.30 3 per cent ” ” ” ” ” 7.20E-03 1357 49
” 1 per cent 20Ma (1018 ◦C) M = 10 2.21E-05 1.59E-07 ” ” 1483 175” 3 per cent ” ” ” ” ” ” 1378 70
than normal temperatures, the presence of melt or of water, or ahigher melt depletion of mantle rock. The effect of water may bedisregarded, because upon melting within the Iceland’s astheno-sphere, the water goes into the melt phase and the mantle rock ma-trix may be regarded as dehydrated. The temperature, the amount ofmelt and the melt depletion responsible for 6 per cent Vp/Vs-ratioincrease can be estimated: Kreutzmann et al. (2004) calculated theanelastic and anharmonic effects due to an anomalous temperature�T with respect to the normal temperature of a 20 Ma referenceoceanic lithosphere on the Vp and Vs velocities for peridotite as afunction of depth. As also discussed in that paper, the presence of amelt with melt fraction φ r distributed in pockets and channels alonggrain edges also reduces Vs and Vp velocities. Following Karato &Jung (1998) Kreutzmann et al. (2004) accounted also for the effectof water by introducing a factor M which increases the mobilityof dislocations. The effect of melt depletion D (removed fractionof melt) on the Vp/Vs-ratio can be estimated for a peridotite at30 km depth using the experimental data given by Schutt & Lesher(2006). Combining these effects for a depth of 30 km, we arrive atan approximate relation
Vp
Vs= Vp0
Vs0
(1 + a1�T + a2�T 2 + a3φr + a4 D
)(1)
for which the parameters a1 and a2 are determined by quadraticregression of the temperature dependence of Vp/Vs-ratio as derivedby Kreutzmann et al. (2004), a3 is the same value as used byKreutzmann et al. (2004) and a4 is determined from analysingFigs 8 and 9 of Schutt & Lesher (2006). Given various assumptionson D, the retained melt fraction φ r (approximately 1–3 per cent, seediscussion in Schmeling 2006), dislocation mobility factor M due towater, and two reference temperature profiles of oceanic lithosphereof different ages (for which we assume the reference Vp0/Vs0 ratioof 1.79), the observed anomalous Vp/Vs-ratio of 6 per cent at 30 kmdepth can be explained by various anomalous or total temperaturesat that depth (Table 2). Here, Tpot-corr is the reference potentialtemperature which produces normal oceanic crust (Ruedas et al.2004), corrected to a depth of 30 km and for the effect of latent heatdue to melting (uncorrected: 1420 ◦C).
The M-value of 10 for wet mantle corresponds to a small watercontent (about 20 ppm H/Si). A higher water content is unlikely dueto dehydration at melting. Table 2 shows the sensitivity of tempera-ture at 30 km depth and the anomalous temperature compared to anormal oceanic asthenosphere at the same depth, corrected for theeffect of latent heat due to melting (D = 0.2 or 0.3, respectively).From the table above we favour cases with a 60 Ma reference litho-sphere because it is more likely that the global ak135 seismic modelis more representative of older lithosphere. Taking the higher de-pletion value representative of extensive volcanism and a retainedmelt fraction of 2–3 per cent we predict a temperature at 30 km ofabout 1350–1460 ◦C or an anomalous temperature T − Tpot-corr =
50–150 K. The lower values of the above temperature range corre-sponding to 3 per cent melt agrees well with the excess temperatureestimate of the Iceland plume of 135 K at 200 km depth, based ondynamic models constrained by seismic anomalies and crust gen-eration rates (Kreutzmann et al. 2004): Accounting for adiabaticcooling and heat loss due to latent heat absorbtion when melting,their plume model predicts 1386 ◦C at a depth of 30 km. It should,however, be noted, that other estimates of excess mantle tempera-tures beneath Iceland vary between 0 K (explaining the observedseismic velocity anomaly by water and/or small amounts of melt)and 300 K (explaining regional tomography, see reviews by Foulgeret al. 2001; Vinnik et al. 2005; Ruedas et al. 2007). Thus, theabove estimate based on new observation of the anomalous Vp/Vs-ratio strengthens the intermediate to high range estimates. If, on theother hand, the amount of water at 30 km depth is larger (M > 10),for example, due to incomplete dehydration by melting or due topartly solidification of wet melt, the temperature prediction wouldhave to be shifted towards smaller values. It should also be noted,that if the Vp/Vs-anomaly is smaller than 6 per cent (Vp/Vs of 1.90being an upper limit), the above estimates of excess temperatureand melt fractions would have to be reduced accordingly.
It is interesting to compare these temperatures with the temper-ature of basaltic magma of 1100–1200 ◦C as it reaches the surfacein Iceland, having remained for some time in the crust or closeto the BCM (Steinthorsson, private communication, 2006). Picritebasalt on the Reykjanes peninsula is thought to have erupted ateven higher temperature between 1280 and 1320 ◦C, originatingas partial melt (primitive magma) from ∼85 km depth accord-ing to Maaløe & Jakobsson (1980). They measured picrite meltat phase (eutectic) equilibrium at 1400 ◦C and 10 kbar pressure(∼33 km depth). This may possibly be a higher temperature thanof the solid mantle at that depth, as for example, indicated by py-rolite batch melting experiments (Green & Falloon 1998), wheremid-ocean ridge picrites are produced under pressure, correspond-ing to ∼40–65 km depths and temperatures 1345–1450 ◦C. Thusthe eruptive temperatures 1200–1300 ◦C can be regarded as a lowerbound and the 1400 ◦C as the upper bound temperature at depth of∼30 km. Based on this comparison our temperature estimate of1400 ± 50 ◦C is consistent with the upper bound of the petrologicalestimates, or in other words, the lower of our temperature estimates(1350 ◦C) fits well with the petrological constraints. We thus con-clude that the observed Vp/Vs-anomaly under Central Iceland andthe volcanic zones, predicts the higher of the partial melt concen-trations (2–3 per cent), a depletion of about 0.30 and temperatureclose to the solidus of depleted mantle at ∼30 km depth (Langmuiret al. 1992).
5 L I T H O S P H E R E
One of the purposes of this research is to the map of the lithospherethickness or the depth to the LAB. Two receiver function studies
C© 2009 The Authors, GJI, 178, 394–418
Journal compilation C© 2009 RAS
408 I. Th. Bjarnason and H. Schmeling
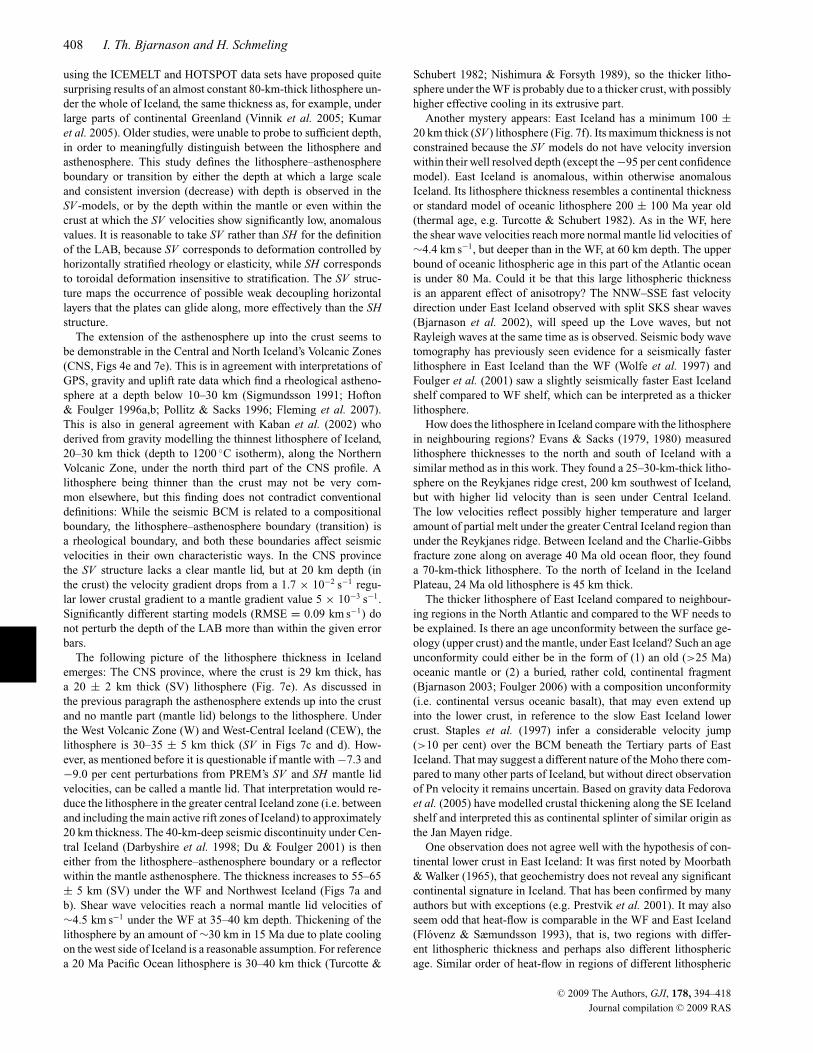
using the ICEMELT and HOTSPOT data sets have proposed quitesurprising results of an almost constant 80-km-thick lithosphere un-der the whole of Iceland, the same thickness as, for example, underlarge parts of continental Greenland (Vinnik et al. 2005; Kumaret al. 2005). Older studies, were unable to probe to sufficient depth,in order to meaningfully distinguish between the lithosphere andasthenosphere. This study defines the lithosphere–asthenosphereboundary or transition by either the depth at which a large scaleand consistent inversion (decrease) with depth is observed in theSV -models, or by the depth within the mantle or even within thecrust at which the SV velocities show significantly low, anomalousvalues. It is reasonable to take SV rather than SH for the definitionof the LAB, because SV corresponds to deformation controlled byhorizontally stratified rheology or elasticity, while SH correspondsto toroidal deformation insensitive to stratification. The SV struc-ture maps the occurrence of possible weak decoupling horizontallayers that the plates can glide along, more effectively than the SHstructure.
The extension of the asthenosphere up into the crust seems tobe demonstrable in the Central and North Iceland’s Volcanic Zones(CNS, Figs 4e and 7e). This is in agreement with interpretations ofGPS, gravity and uplift rate data which find a rheological astheno-sphere at a depth below 10–30 km (Sigmundsson 1991; Hofton& Foulger 1996a,b; Pollitz & Sacks 1996; Fleming et al. 2007).This is also in general agreement with Kaban et al. (2002) whoderived from gravity modelling the thinnest lithosphere of Iceland,20–30 km thick (depth to 1200 ◦C isotherm), along the NorthernVolcanic Zone, under the north third part of the CNS profile. Alithosphere being thinner than the crust may not be very com-mon elsewhere, but this finding does not contradict conventionaldefinitions: While the seismic BCM is related to a compositionalboundary, the lithosphere–asthenosphere boundary (transition) isa rheological boundary, and both these boundaries affect seismicvelocities in their own characteristic ways. In the CNS provincethe SV structure lacks a clear mantle lid, but at 20 km depth (inthe crust) the velocity gradient drops from a 1.7 × 10⁻² s−1 regu-lar lower crustal gradient to a mantle gradient value 5 × 10⁻³ s−1.Significantly different starting models (RMSE = 0.09 km s−1) donot perturb the depth of the LAB more than within the given errorbars.
The following picture of the lithosphere thickness in Icelandemerges: The CNS province, where the crust is 29 km thick, hasa 20 ± 2 km thick (SV) lithosphere (Fig. 7e). As discussed inthe previous paragraph the asthenosphere extends up into the crustand no mantle part (mantle lid) belongs to the lithosphere. Underthe West Volcanic Zone (W) and West-Central Iceland (CEW), thelithosphere is 30–35 ± 5 km thick (SV in Figs 7c and d). How-ever, as mentioned before it is questionable if mantle with −7.3 and−9.0 per cent perturbations from PREM’s SV and SH mantle lidvelocities, can be called a mantle lid. That interpretation would re-duce the lithosphere in the greater central Iceland zone (i.e. betweenand including the main active rift zones of Iceland) to approximately20 km thickness. The 40-km-deep seismic discontinuity under Cen-tral Iceland (Darbyshire et al. 1998; Du & Foulger 2001) is theneither from the lithosphere–asthenosphere boundary or a reflectorwithin the mantle asthenosphere. The thickness increases to 55–65± 5 km (SV) under the WF and Northwest Iceland (Figs 7a andb). Shear wave velocities reach a normal mantle lid velocities of∼4.5 km s−1 under the WF at 35–40 km depth. Thickening of thelithosphere by an amount of ∼30 km in 15 Ma due to plate coolingon the west side of Iceland is a reasonable assumption. For referencea 20 Ma Pacific Ocean lithosphere is 30–40 km thick (Turcotte &
Schubert 1982; Nishimura & Forsyth 1989), so the thicker litho-sphere under the WF is probably due to a thicker crust, with possiblyhigher effective cooling in its extrusive part.
Another mystery appears: East Iceland has a minimum 100 ±20 km thick (SV ) lithosphere (Fig. 7f). Its maximum thickness is notconstrained because the SV models do not have velocity inversionwithin their well resolved depth (except the −95 per cent confidencemodel). East Iceland is anomalous, within otherwise anomalousIceland. Its lithosphere thickness resembles a continental thicknessor standard model of oceanic lithosphere 200 ± 100 Ma year old(thermal age, e.g. Turcotte & Schubert 1982). As in the WF, herethe shear wave velocities reach more normal mantle lid velocities of∼4.4 km s−1, but deeper than in the WF, at 60 km depth. The upperbound of oceanic lithospheric age in this part of the Atlantic oceanis under 80 Ma. Could it be that this large lithospheric thicknessis an apparent effect of anisotropy? The NNW–SSE fast velocitydirection under East Iceland observed with split SKS shear waves(Bjarnason et al. 2002), will speed up the Love waves, but notRayleigh waves at the same time as is observed. Seismic body wavetomography has previously seen evidence for a seismically fasterlithosphere in East Iceland than the WF (Wolfe et al. 1997) andFoulger et al. (2001) saw a slightly seismically faster East Icelandshelf compared to WF shelf, which can be interpreted as a thickerlithosphere.
How does the lithosphere in Iceland compare with the lithospherein neighbouring regions? Evans & Sacks (1979, 1980) measuredlithosphere thicknesses to the north and south of Iceland with asimilar method as in this work. They found a 25–30-km-thick litho-sphere on the Reykjanes ridge crest, 200 km southwest of Iceland,but with higher lid velocity than is seen under Central Iceland.The low velocities reflect possibly higher temperature and largeramount of partial melt under the greater Central Iceland region thanunder the Reykjanes ridge. Between Iceland and the Charlie-Gibbsfracture zone along on average 40 Ma old ocean floor, they founda 70-km-thick lithosphere. To the north of Iceland in the IcelandPlateau, 24 Ma old lithosphere is 45 km thick.
The thicker lithosphere of East Iceland compared to neighbour-ing regions in the North Atlantic and compared to the WF needs tobe explained. Is there an age unconformity between the surface ge-ology (upper crust) and the mantle, under East Iceland? Such an ageunconformity could either be in the form of (1) an old (>25 Ma)oceanic mantle or (2) a buried, rather cold, continental fragment(Bjarnason 2003; Foulger 2006) with a composition unconformity(i.e. continental versus oceanic basalt), that may even extend upinto the lower crust, in reference to the slow East Iceland lowercrust. Staples et al. (1997) infer a considerable velocity jump(>10 per cent) over the BCM beneath the Tertiary parts of EastIceland. That may suggest a different nature of the Moho there com-pared to many other parts of Iceland, but without direct observationof Pn velocity it remains uncertain. Based on gravity data Fedorovaet al. (2005) have modelled crustal thickening along the SE Icelandshelf and interpreted this as continental splinter of similar origin asthe Jan Mayen ridge.
One observation does not agree well with the hypothesis of con-tinental lower crust in East Iceland: It was first noted by Moorbath& Walker (1965), that geochemistry does not reveal any significantcontinental signature in Iceland. That has been confirmed by manyauthors but with exceptions (e.g. Prestvik et al. 2001). It may alsoseem odd that heat-flow is comparable in the WF and East Iceland(Flovenz & Sæmundsson 1993), that is, two regions with differ-ent lithospheric thickness and perhaps also different lithosphericage. Similar order of heat-flow in regions of different lithospheric
C© 2009 The Authors, GJI, 178, 394–418
Journal compilation C© 2009 RAS

Lithosphere and asthenosphere of the Iceland hotspot 409
0
50
100
150
200
Dep
th (
km)
1.5 2.0 2.5 3.0 3.5 4.0 4.5 5.0
Shear velocity (km/s)
SH
SV
WESTFJORDS
WF
BCM
LAB
0
50
100
150
200
Anisotropy (%)
– –(a)
0
50
100
150
200
Dep
th (
km)
1.5 2.0 2.5 3.0 3.5 4.0 4.5 5.0
Shear velocity (km/s)
SH
SV
NORTHWEST
NW
BCM
LAB
0
50
100
150
200
Anisotropy (%)
– –(b)
Figure 7. Same velocity models as in Fig. 4 down to 200 km depth, with the starting model 8f (stippled black line) as a reference. Below the depth correspondingto the half wavelength of the longest period, the velocity models are plotted as stippled line only. Above the half wavelength depth, the surface waves have areasonable vertical resolution.
C© 2009 The Authors, GJI, 178, 394–418
Journal compilation C© 2009 RAS

410 I. Th. Bjarnason and H. Schmeling
0
50
100
150
200
Dep
th (
km)
1.5 2.0 2.5 3.0 3.5 4.0 4.5 5.0
Shear velocity (km/s)
SH
SV
WEST
W
BCM
LAB
0
50
100
150
200
Anisotropy (%)
– – – –(c)
0
50
100
150
200
Dep
th (
km)
1.5 2.0 2.5 3.0 3.5 4.0 4.5 5.0
Shear velocity (km/s)
SH
SV
CEW
BCM
LAB
0
50
100
150
200
Anisotropy (%)
– – – –(d)
Figure 7. (Continued.)
C© 2009 The Authors, GJI, 178, 394–418
Journal compilation C© 2009 RAS
Lithosphere and asthenosphere of the Iceland hotspot 411
0
50
100
150
200
Dep
th (
km)
1.5 2.0 2.5 3.0 3.5 4.0 4.5 5.0
Shear velocity (km/s)
SH
SV
CNS
LAB
MELTING
BCM
0
25
50
75
100
125
150
175
200
Anisotropy (%)
– – – –(e)
0
50
100
150
200
Dep
th (
km)
1.5 2.0 2.5 3.0 3.5 4.0 4.5 5.0
Shear velocity (km/s)
SH
SV
EAST
E
~LAB
BCM
0
50
100
150
200
Anisotropy (%)
– –(f)
Figure 7. (Continued.)
C© 2009 The Authors, GJI, 178, 394–418
Journal compilation C© 2009 RAS

412 I. Th. Bjarnason and H. Schmeling
thickness may be explained by an enhanced advective heat transportdue to vertical (dykes) and horizontal (sills and sideway extrusions)magma transport compared to purely conductive cooling of a plate.In other words, even a slightly higher shallow crust accretion ratein the east may outpace the lower conductive heat flow associatedwith the thicker lithosphere there. The rather recent (last ice-age)higher errosion of the East Iceland pile may also be a factor in thecomparable near-surface heatflow with the WF.
A third hypothesis (3) does not assume a large (>10 Ma) ageunconformity between the crust and the mantle. It assumes thatthere is at least 50-km-thick crust under East Iceland on top of asimilar aged mantle lid as under the WF. This idea is not supportedby many data, except that the surface waves see mantle lid velocitiesof ≥4.3 km s−1 only at depths greater than ∼50 km. A 50-km-thickcrust would contradict previous crustal thickness measurements of35 km (Staples et al. 1997; Smallwood et al. 1998), but a weaknessof them is that a Pn velocity has yet to be observed under EastIceland, and hence a clear identification of a BCM has not beenpossible. At the moment, the first hypothesis fits best: Most probablyan age unconformity exists between the crust and mantle under EastIceland. The offshore 33–43 Ma old (magnetic anomalies 13–20)oceanic mantle south of Southeast Iceland (Nunns et al. 1983),extends under East Iceland and the East Iceland shelf. On top ofthis older thicker mantle lid, lies the thickest part of the Icelandiccrust. Combined they form a thick lithosphere.
An anomalously thick East Iceland crust can be explained by theinteraction of the eastward migrating Mid-Atlantic ridge, severalridge jumps within the past 40 Ma and the varying position ofthe Iceland plume head. In a dynamic, plume-ridge model of theNorth Atlantic, Mihalffy et al. (2008) investigated the thermal anddynamical interaction of a thermal plume which is overridden by theNorth Atlantic ridge. The migrating ridge was modelled as a timedependent kinematic boundary condition according to reconstructedplate motions of the past 60 Ma. These plate motions include severalridge jumps, that is, ridge jumps were included as constraints onthe models. These boundary conditions were applied to a fullydynamical convection model into which a thermal plume has beeninjected at 660 km depth. Once the ridge approaches the plumehead, it is attracted by the ridge and deformed in a way as to followthe migrating ridge for a few tens Ma.
As an example of this kind of model, Fig. 8(a) shows the modelledplume at the present time with its head being strongly deformed,the stem tilting downward to the SSW (Mihalffy et al. 2004, andMihallfy, unpublished data). If the plume source is fixed withinthe upper part of the lower mantle, the interaction with the ridgemay lead to strongly asymmetric plume head tracks on either sideof the North Atlantic lithosphere plates. This is shown in Fig. 8(b)(Mihalffy et al. 2008), where the coloured regions depict those partsof the plates, which have been exposed to plume magmatism at thetime of their spreading history. Clearly, the magmatic plume headmaterial is rapidly transported away from the plume centre towardsthe west on the American side, while it piles up on the easternside. This accumulation on the eastern side is partly a consequenceof repeated ridge jumps towards the west (at 32 Ma) and the east(between 20 and 0 Ma, Hardarson et al. 1997), since they alwaysoccurred towards the position of the plume head. Piling up of mag-matic material of different age at the eastern side requires that thewidth of the accretional rift zones and the distance between subse-quent ridge jumps are of similar order. Inspection of the geologicalmap of Iceland shows that this is almost the case (50 km versus50–100 km, respectively).
6 A S T H E N O S P H E R E
The asthenosphere is a low velocity zone in the mantle. As describedbefore, the onset of the lithosphere–asthenosphere transition zoneis unconstrained but is below 100 ± 20 km (SV ) depth under EastIceland, is constrained at 20 ± 2 km to 35 ± 5 km (SV ) underCentral Iceland, and at 55–65 ± 5 km depth (SV ) under NorthwestIceland and the WF. The SV velocity is at minimum within theasthenosphere under Central Iceland in the depth range 40–80 km(Figs 7c–e). This zone is positioned between the West, East andNorth Volcanic Zones, that is, the greater Central Iceland region.Its north-south extend is unconstrained, but is ∼200 km in diameterin the east–west direction. It can be interpreted as a continuation ofthe plume like low velocity zone to shallower levels than has clearlybeen constrained before (Wolfe et al. 1997; Foulger et al. 2001;Allen et al. 2002b; Du & Foulger 2004). The maximum lateralanomaly of the SV velocities is 9–13 per cent between CentralIceland’s low velocity and the mantle lid velocities of the Iceland’soldest provinces in the East- and WF. This is a large variation.Foulger et al. (2001) and Allen et al. (2002b) have found lateralshear velocity anomaly in this depth range in the order of 4 per centacross Iceland. A likely consequence of this asymmetric shape of thelithosphere–asthenosphere transition zone, is asymmetric mantleflow and probably a hotter mantle in the west compared to the east.This asymmetric shape is in agreement with the asymmetric plumehead (Fig. 8a) and hotspot track (Fig. 8b) based on the dynamicmodel of Mihalffy et al. (2008).
At greater depth a common feature appears in the asthenospherelandscape under the greater central region and Northwest Iceland.It is in the form of a minimum in the shear velocity at 110 km depth.Above this minimum in central Iceland, there is an increase in the SVvelocity with higher velocity at 90 km depth, but more shallowly,the velocity falls again, giving the appearance of a double LVZ inthe asthenosphere (SV in W, CEW and CNS provinces, Figs 7c–e). Kreutzmann et al. (2004) have calculated the onset of meltingat 110–120 km under Central Iceland (Fig. 7e), based on surfacewave velocity anomaly in comparison with the sub oceanic IcelandPlateau. Perhaps the LAB at 80 km depth determined by Vinniket al. (2005) and Kumar et al. (2005) is due to seismic conversionsin this region between the double LVZ.
Kreutzmann et al. (2004) explain the increase in velocity abovethe deeper LVZ to be due to cooling of the mantle by consumptionof latent heat as it starts to melt. At ∼100 km depth, equally low SVvelocity, as under Central Iceland, are observed under NorthwestIceland, indicating a flow of the plume head in that direction. Itis likely that this minimum extends under all of the western halfof Iceland. It remains to be constrained if a narrow zone (∼20 kmthick) of the mantle could be partially molten at 100 km depth underNorthwest Iceland, an area without any active volcanism. However,neovolcanism does exist up to 170 km west of the West VolcanicZone in a linear trend along the Snaefellsnes peninsula (Fig. 2).
Based on the results of Kreutzmann et al. (2004) it can be inferredthat the whole mantle in the greater central region is partially moltenfrom the onset of melting at 110–120 km depth to ∼40 km depth,or in a 70–80 km thick melting region with a 200 km diameter.They assume that there is only a low 1 per cent partial melt onaverage in the melting zone, but as discussed before the partial meltprobably increases towards shallower parts of the mantle. At theeast edge of the central region, the LVZ extends even shallower,with partially molten mantle up to the BCM at 29 km depth. Thecalculations of Kreutzmann et al. (2004) do not apply to the crust,
C© 2009 The Authors, GJI, 178, 394–418
Journal compilation C© 2009 RAS

Lithosphere and asthenosphere of the Iceland hotspot 413
Figure 8. (a) Time-dependent convection model of plume–ridge interaction by Mihalffy et al. (2004) and P. Mihalffy (unpubl. data). The plume is visualizedas the surface of a constant anomalous temperature. The snapshot shown is taken at the present time as the plume is overridden by the spreading ridge towardsthe NW. The ridge is indicated as chain of diamonds and fracture zones labeled JMFZ (Jan Mayen), TFZ (Tjornes) and SIFZ (South Iceland). For furtherexplanations, see text. (b) Hotspot track of a successful plume–ridge interaction model by Mihalffy et al. (2008). The colours indicate those parts of the plateswhich have been exposed to plume magmatism at the times 0–20 Ma (blue), 20–40 Ma (purple) and 40–50 Ma (red) of their spreading history. With permissionof Tectonophysics.
but by inference, due to the lower solidus of the crust, partial meltmight extend somewhat further into the crust in the central-northrift.
7 A N I S O T RO P Y I N T H E M A N T L E L I DA N D T H E A S T H E N O S P H E R E
There is considerable anisotropy in the mantle under Iceland, whichwill be an important source for better understanding the state anddynamics of the mantle and the large scale plate tectonics in thispart of the North Atlantic. Several authors have reported that thereis a general environment of azimuthal anisotropy under Iceland(Bjarnason et al. 2002; Li & Detrick 2003; Pilidou et al. 2005;
Xue & Allen 2005). To constrain azimuthal anisotropy with sur-face waves, a good azimuthal coverage of paths is required. Eventhough azimuthal coverage is rather limited in this study, this is tosome extent remedied by simultaneous analysis of Rayleigh andLove waves. However, there is more to anisotropy than azimuthalvariation. Previous studies cannot, for example, constrain the modeof anisotropy called transverse isotropy (polarization anisotropy).A comprehensive view of anisotropy under Iceland will only berevealed with considerable future work.
When all these different observations are pieced together to tryto understand the underlying anisotropic structure, not all the datafit together perfectly. Large variations of the 1-D anisotropy models
C© 2009 The Authors, GJI, 178, 394–418
Journal compilation C© 2009 RAS
414 I. Th. Bjarnason and H. Schmeling
across Iceland clearly show that it is a 3-D structure (Figs 7a–f).Bjarnason et al. (2002) and Xue & Allen (2005) concluded fromshear wave splitting measurements, which give a depth averagedanisotropy, that the horizontal fast directions do not have significantdepth variation. They, however, clearly observed a lateral variationin the fast direction across Iceland, indicating 2-D structure. Thesurface waves of this work and the work of Li & Detrick (2003),point to a significant vertical variation, although there may be onelayer with the highest weight in the depth averaged anisotropy asseen by shear wave splitting. For example, the CEW province hastwo or three significant anisotropic layers in the 1-D anisotropicmodel (Fig. 7d).
In contrast to the PREM model the surface waves presented hereshow anisotropy that is relatively lower in magnitude in the mantlelid than in the asthenosphere. The PREM model has the highestanisotropy in the mantle lid, +4.0 per cent on average, decreasingto +3.0 per cent and +0.4 per cent at 100 and 200 km depths,respectively, in the asthenosphere (Fig. 5). In most parts of Icelandanisotropy is positive in the mantle lid, as in the PREM model, butboth positive and negative in the asthenosphere. With the excep-tion of the WF province, the magnitude of the average anisotropyin the mantle lid is relatively small (<±3 per cent), but reachesup to +10 per cent and −4 per cent with a large volume extentin parts of the well resolved asthenosphere under Iceland (Figs 7a,c, d and e). While interpreting the anisotropy of the mantle lid, itis also important to notice what is not observed. With positive ornear zero anisotropy in the mantle lid along all paths, except inthe W province, it is clear that there is not a horizontal fast direc-tion in the plate spreading direction. The rather mild anisotropy inthe mantle lid of Iceland is probably mainly of transverse isotropymode, suggesting horizontal layered structure, though not withlarge impedance contrast between the layers due to the moderateanisotropy.
The two modes of observation, shear wave splitting, that havemapped the azimuthal anisotropy across Iceland, and surface waves,that map the location of the highest anisotropy in amplitude andvolume in the asthenosphere, suggest that the dominant anisotropycausing the the azimuthal variation is lattice preferred orientation(LPO) of crystals, induced by differential shear in the ductile flowingasthenosphere.
In the depth range ∼30–65 km, there is a high 5–7 per cent aver-age positive anisotropy with maximum value 10 per cent in the as-thenosphere under the rift provinces W and CNS, that increases withdepth (Figs 7c and e). In the CEW province the anisotropy is alsopositive in this depth range, but less in amplitude and decreases withdepth, changing sign at 60 km depth (Fig. 7d). Transverse isotropymodel would hardly fit in this depth range in all of these provinces, atleast not a constant transverse isotropy, but neither does a commonazimuthal model. The azimuthal model that fits best qualitativelyhas approximately north–south fast direction, although not exactlyin the ridge parallel direction. It is in a reasonable agreement withLi & Detrick (2003). This direction is deduced from the ratios ofthe SH and SV velocities and theoretical calculations of, for exam-ple, Maupin (1985) for azimuthal anisotropy. The high anisotropyobserved under the ridge paths, compared to CEW that crosses onlypartly the ridge areas, is perhaps an indication of quite localizedanisotropy in the rift environment even at this considerable depth.Li & Detrick (2003) have hypothesized that ridge-parallel fast direc-tion down to 50 km depth is due to combination of a ridge-parallelalignment of melt films and channeling of hot plume material alongthe ridge axis at greater depth. Laboratory measurements indicatethat mantle flow direction may, however, be perpendicular to the
anisotropy fast direction in melt ridge environment (Holtzman et al.2003).
In the depth range 60–110 km the anisotropy of the CEW provincesupplies quite diagnostic observation. It is negative (Fig. 7d). Wheninterpreted with the positive anisotropy of CNS and W, severalmodels can be excluded. It excludes transverse isotropy and verticalcracks. Vertical cracks (e.g. melt sheets) or vertical layers wouldshow low SH velocity in all three provinces. Similarly it excludesvertical LPO fast direction in greater Central Iceland, which wouldmeasure with low SH velocity in all three provinces. That leavesapproximately ridge perpendicular fast direction (WNW–ESE) asthe preferred model. It seems likely that a stronger factor in anESE–WNW mantle flow is from a horizontal plume flow ratherthan a flow induced from the North American plate drag, becausethe effect of plate drag should extend to shallower depth. Below110 km depth the CNS and CEW have a resolvable fast directionthat is approximately between NW–SE and NNW–SSE directions,and the less well resolved anisotropy of the W province does alsoagree with this range of direction. The depth integrated shear wavesplitting of Xue & Allen (2005) in the greater central Iceland stationsoff the HOTSPOT network show mostly NW–SE fast directions orNE–SW null splitting direction. Bjarnason et al. (2002) predicted adeeper background upper mantle flow in the direction N34 ◦W underthe Iceland region. Interestingly, Pilidou et al. (2005) measured a∼1500 km wide anisotropic body in the asthenosphere extendingfrom the central East Greenland coast through the Iceland regioninto South Central Europe with approximately the predicted fastdirection of Bjarnason et al. (2002). Bjarnason et al. (2002) hadsparse splitting observations in the Central Iceland region, but wouldpredict a more northerly horizontal fast direction, due to differentialshearing between the hypothesized background flow and the NorthAmerican plate motion than observed by Xue & Allen (2005).Analysis of Li & Detrick (2003) does not penetrate to this deeperlayer.
Several authors have noted that anisotropy induced by LPO canexplain a theoretical +8 per cent maximum anisotropy in the case ofperfect fast-axis distribution in the horizontal plane in pyrolite man-tle material (Maupin & Cara 1992; Ekstrom & Dziewonski 1998;Debayle & Kennett 2000). Even a somewaht higher anisotropy canbe achieved with more unrealistic mantle model or alignment ofthe fast axes in a narrow azimuthal range. In about 15-km-thickzone in the depth range 50–75 km under the rift provinces CNSand W +8 per cent anisotropy is reached although not significant atthe 95 per cent confidence level in the W province. As it is hard toimagine near perfect fast-axis horizontal alignment for real Earth,we propose that this high positive anisotropy is a combinationof LPO and horizontal melt saturated layers. The theoretical+8 per cent maximum anisotropy is also reached in the depth rangeof 150–175 km under the CEW province. The idea of a combinationof melt and LPO does not apply there, because the 150–175 kmrange lies deeper than the melting zone of the mantle. However, atthis greater depth, the velocity models are constrained by less data.
8 C O N C LU S I O N S
Rayleigh and Love wave data have been analysed and inverted forrepresentative regions of Iceland. Using a change in the vertical seis-mic velocity gradient to define the BCM and other, more traditional,criteria to define the upper crust and the top of the asthenosphere, anew structural model of the Icelandic lithosphere and asthenospherehas been derived. These results include some unexpected new fea-tures and interpretations summarized in the following conclusions.
C© 2009 The Authors, GJI, 178, 394–418
Journal compilation C© 2009 RAS
Lithosphere and asthenosphere of the Iceland hotspot 415
(i) In contrast to previous models which proposed a crustal thick-ness of up to 40 km, our results suggest a thinner crust in CentralIceland: approximately 19 km in west Central Iceland and 29 kmalong the east Central and the North Volcanic (rift) Zones.
(ii) A pronounced thickening of the crust away from the CentralVolcanic Zone towards the northwest and east edge of the Icelandhotspot is observed. Interpreted dynamically, this thickening maybe due to differential flow (squeezing-type) within the lower crust.
(iii) An approximately 8-km-thick mid-to-lower crustalanisotropy layer is found with SV on average 4 per cent < SHunder the volcanic zones with onset at about 4 km depth. A similaranisotropy layer is found under the western most part of NorthwestIceland, but with higher average anisotropy. Our most favoured ex-planation of the observed anisotropy is a subhorizontal layer cakeof stiff and soft layers, possibly a result of mid- to lower-crustaccretion by subsurface subhorizontal volcanic intrusions.
(iv) Subcrustal Vp/Vs-ratios in Central Iceland at a depth of30 km are about 6 per cent higher than for a global reference model(ak135). Accounting for a possible Vp/Vs-ratio dependence on tem-perature, melt fraction, depletion and water, a total temperature ofabout 1350 to 1460 ◦C and 2–3 per cent melt fraction are predictedfor that depth under Central Iceland and the volcanic rift zones.
(v) The upper-middle crust (extrusive and bitrusive) is thickestin Central Iceland (8.4 km). A pronounced E–W asymmetry inupper-middle crust thicknesses is found with only 3.7 km for theWestfjord region and 6.7 km for the similarly aged East Iceland.This asymmetry might be the result of subsequent eastward ridgejumps of the rift system.
(vi) Beneath East Iceland the crust and mantle shows a pro-nounced anomaly: the lower crust has an anomalously low velocityand/or the upper-middle crust has twice the thickness compared toIceland’s average. The lithosphere has a thickness of at least 100 ±20 km. As this thickness is not compatible with a oceanic litho-sphere of same crustal age, a hypothesis is favoured where there isan age unconformity between an anomalously thick crust and anolder (33–43 Ma) mantle lid. The anomalously thick crust couldbe the result of repeated ridge jumps subsequently accumulatingvolcanic material on top of the older mantle lid.
(vii) Beneath Central Iceland and towards Northwest and WestIceland a deep low velocity zone (LVZ) is observed between 100and 125 km depth. A second shallower LVZ is observed betweenCentral and West Iceland at the depths of 30–80 km. These struc-tures may be explained by a partially molten asymmetric plumehead.
(viii) Anisotropy in the asthenosphere is a 3-D structure and isgenerally larger than in the mantle lid under Iceland. It is probablyinduced both by mantle flow and melt in the asthenosphere down to110 km depth. Approximately east–west fast direction for verticallypolarized shear waves (SV) in the depth range 60–110 km mayindicate approximately horizontal plume head flow in a westerlydirection.
In conclusion, the seismological data and their geodynamicalinterpretation lead to a new picture of the Icelandic lithosphere–asthenosphere system in terms of the Iceland plume interactingwith the migrating North-Atlantic ridge.
A C K N OW L E D G M E N T S
Thanks are due to Selwyn Sacks for good academic support dur-ing the initial stage of this research and to Arthur Snoke for as-sistance with computer programming. The work benefited fromextensive discussion with Thomas Ruedas, William Menke, Nıels
Oskarsson, Thomas Forbriger, Olafur G. Flovenz and WolfgangFriederich. Olafur G. Bjornsson, Niegel Watson and Philip Vogler,proof read and corrected the English. Excellent hospitality of JAM-STEC at Yokosuka in Japan to IB is greatly appreciated. Finallythe authors would like to express thanks to Gillian Foulger andanonymous reviewer for constructive criticism of the manuscript inprogress. Financial support by National Science Foundation (USA)(grants EAR-9316137, OCE-9402991) the Icelandic Research Cen-ter (RANNIS), the University of Iceland research fund and the Ger-man Academic Exchange Service (DAAD) is acknowledged.
R E F E R E N C E S
Allen, R.M. et al., 2002a. Plume-driven plumbing and crustal formation inIceland, J. geophys. Res., 107, doi:1029/2001JB000584.
Allen, R.M. et al., 2002b. Imaging the mantle beneath Icelandusing integrated seismological techniques, J. geophys. Res., 107,doi:1029/2001JB000595.
Bjarnason, I.Th., 2003. The lithosphere and asthenosphere of the Icelandhot spot, in: The 23rd General Assembly of the International Union ofGeodesy and Geophysics, Abstracts B, B.137, Sapporo, Japan, 30 June–11 July.
Bjarnason, I.Th., Menke, W., Flovenz, O.G. & Caress, D., 1993. Tomo-graphic image of the mid-atlantic plate boundary in Southwestern Iceland,J. geophys. Res., 98, 6607–6622.
Bjarnason, I.Th., Wolfe, C.J., Solomon, S.C. & Gudmundsson, G., 1996a.Initial results from the ICEMELT experiment: body-wave delay timesand shear-wave splitting across Iceland, Geophys. Res. Lett., 23, 459–462.
Bjarnason, I.Th., Wolfe, C.J., Solomon, S.C. & Gudmundsson, G., 1996b.Initial results from the ICEMELT experiment: body-wave delay times andshear-wave splitting across Iceland, Geophys. Res. Lett., 23, 903.
Bjarnason, I.T., Silver, P.G., Rumpker, G. & Solomon, S.C., 2002. Shearwave splitting across the Iceland hot spot: results from the ICEMELTexperiment, J. geophys. Res.,10.1029/2001JB000916.
Brandsdottir, B., Menke, W., Einarsson, P., White, R.S. & Staples, R.K.,1997. Faroe-Iceland ridge experiment 2. Crustal structure of the Kraflacentral volcano, J. geophys. Res., 102, 7867–7886.
Buck, W.R., 1991. Modes of continental lithospheric extension, J. geophys.Res., 96(B12), 20 161–20 178.
Crampin, S., Volti, T., Chastin, S., Gudmundsson, A. & Stefansson, R., 2002.Indication of high pore-fluid pressures in a seismically-active fault zone,Geophys. J. Int., 151, F1–F5.
Darbyshire, F.A., Bjarnason, I.Th., White, R.S. & Flovenz, O.G., 1998.Crustal structure above the Iceland mantle plume imaged by theICEMELT refraction profile, Geophys. J. Int., 135, 1131–1149.
Darbyshire, F.A., White, R.S. & Priestley, K.F., 2000a. Structure of the crustand uppermost mantle of Iceland from combined seismic and gravitystudy, Earth planet. Sci. Lett., 181, 409–428.
Darbyshire, F.A., Priestley, K.F., White, R.S., Stefansson, R., Gudmundsson,G.B. & Jakobsdottir, S.S., 2000b. Crustal structure of central and northernIceland from analysis of teleseismic receiver functions, Geophys. J. Int.,143, 163–184.
Debayle, E. & Kennett, B.L.N., 2000. Anisotropy in the Australasian uppermantle from Love and Rayleigh waveform inversion, Earth planet. Sci.Lett., 184, 339–351.
Du, Z.J. & Foulger, G.R., 1999. The crustal structure beneath the northwestfjords, Iceland, from receiver functions and surface waves, Geophys. J.Int., 139, 419–432.
Du, Z. & Foulger, G.R., 2001. Variation in the crustal structure across centralIceland, Geopys. J. Int., 145, 246–264.
Du, Z. & Foulger, G.R., 2004. Surface wave waveform inversion for variationin the upper mantle structure beneath Iceland, Geophys. J. Int., 157, 305–314, doi:10.1111/j.1365–246X.2004.02202.x
Du, Z. et al., 2002. Crustal structure beneath western and eastern Icelandfrom surface waves and receiver functions, Geophys. J. Int., 149, 349–363.
C© 2009 The Authors, GJI, 178, 394–418
Journal compilation C© 2009 RAS
416 I. Th. Bjarnason and H. Schmeling
Dziewonski, A.M. & Anderson, D.L., 1981. Preliminary reference Earthmodel, Phys. Earth planet. Int., 25, 297–356.
Ekstrom, G. & Dziewonski, A.M., 1998. The unique anisotropy of the Pacificupper mantle, Nature, 394(9), 168–172.
Evans, J.R. & Sacks, I.S., 1979. Deep structure of the Iceland Plateau,J. geophys. Res., 84, 6859–6866.
Evans, J.R. & Sacks, I.S., 1980. Lithospheric structure in the north Atlanticfrom observations of Love and Rayleigh waves, J. geophys. Res., 85,7175–7182.
Fedorova, T., Jacoby, W.R. & Wallner, H., 2005. Crust-mantle transition andMoho model for Iceland and surroundings from seismic, topography, andgravity data, Tectonophysics, 396, 119–140.
Flovenz, O.G., 1980. Seismic structure of the Icelandic crust above layerthree and the relation between body wave velocity and the alteration ofthe basaltic crust, J. Geophys., 47, 211–220.
Flovenz, O.G. & Sæmundsson, K., 1993. Heat flow and geothermal pro-cesses in Iceland, Tectonophysics, 22, 123–138.
Fleming, K., Martinec, Z. & Wolf, D., 2007. Glacial-isostatic adjustmentand the viscosity structure underlying the Vatnajokull Ice Cap, Iceland,Pure appl. Geophys., 164, 751–768.
Foulger, G.R., 2002. Hotspots. Plumes, or plate tectonic processes? Astron.and Geophys., 43, 6.19–6.23.
Foulger, G.R., 2006. FAST TRACK PAPER: older crust underlies Iceland,Geophys. J. Int., 165, 672–676, doi:10.1111/j.1365-246X.2006.02941.x.
Foulger, G.R. et al., 2000. The seismic anomaly beneath Iceland extendsdown to the mantle transition zone and no deeper, Geophys. J. Int., 142,F1–F5.
Foulger, G.R. et al., 2001. The seismic tomography shows that upwellingbeneath Iceland is confined to the upper mantle, Geophys. J. Int., 146,504–530.
Gebrande, H., Miller, H. & Einarsson, P., 1980. Seismic structure of Icelandalong RRISP-profile I, J. Geophys., 47, 239–249.
Green, D.H. & Fallon, T.J., 1998. Pyrolite: A Ringwood concept and itscurrent expression, in The Earths Mantle: Composition, Structure andEvolution, pp. 331–380, ed. Jackson, I.N.S., Cambridge University Press,Cambridge.
Hardarson, B.S., Fittona, J.G., Ellamb, R.M. & Pringle, M.S., 1997.Rift relocation—a geochemical and geochronological investigation ofa palaeo-rift in northwest Iceland, Earth planet. Sci. Lett., 153, 181–196,doi:10.1016/S0012-821X(97)00145-3.
Herrin, E. & Goforth, T. 1977. Phase-matched fitlers: Application to thestudy of Rayleigh waves, Bull. seism. Soc. Am., 67, 1259–1275.
Herrmann, R.B. (ed.), 1984–1991. Computer Programs in Seismology,St. Louis University, St. Luis. Available at http://www.eas.slu.edu/People/RBHerrmann/CPS330.html.
Hofton, M.A. & Foulger, G.R., 1996a. Post-rifting anelastic deformationaround the spreading plate boundary, north Iceland, 1: modeling of the1987–1992 deformation field using a viscoelastic Earth structure, J. geo-phys. Res., 101, 25 403–25 421.
Hofton, M.A. & Foulger, G.R., 1996b. Post-rifting anelastic deformationaround the spreading plate boundary, north Iceland, 2: implications of themodel derived from the 1987–1992 deformation field J. geophys. Res.,101, 25 423–25 436.
Holbrook, W.S. et al., 2001. Mantle thermal structure and active upwellingduring continental breakup in the North Atlantic, Earth planet. Sci. Lett.,190, 251–266.
Holtzman, B.K., Kohlsted, D.L., Zimmerman, M.E., Heidelback, F., Hi-rage, T. & Hustoft, J., 2003. Melt segregation and strain partitioning:implications for seismic anisotropy and mantle flow, Science, 301, 1227–1230.
Johannesson, H. & Saemundsson, K., 1998. Geological Map of Iceland,1:500.000, Tectonics, Icelandic Institute of Natural History, Reykjavık.
Kaban, M.K., Flovenz, O.G. & Palmason, G., 2002. Nature of the crust-mantle transition zone and the thermal state of the upper mantle beneathIceland from gravity modelling, Geophys. J. Int., 149, 281–299.
Kennett, B.L.N., Engdahl, E.R. & Buland, R., 1995. Constraints on seismicvelocities in the earth from travel times, Geophys. J. Int., 122, 108–124.
Karato, S. & Jung, H., 1998. Water, partial melting and the origin of the
seismic low velocity and high attenuation zone in the upper mantle. Earthplanet. Sci. Lett., 157(3–4), 193–207.
Kreutzmann, A., Schmeling, H., Junge, A., Ruedas, T., Marquart, G. &Bjarnason, I.Th., 2004. Temperature and melting of a ridge-centredplume with application to Iceland. Part II: predictions for electro-magnetic and seismic observables, Geophys. J. Int., 159, 1097–1111,doi:10.1111/j.1365-246X.2004.02397.x.
Kumar, P. et al., 2005. The lithosphere–asthenosphere boundary in theNorth-West Atlantic region [rapid communication], EPSL, 236, 249–257,doi:10.1016/j.epsl.2005.05.029.
Langmuir, C.H., Klein, E.M. & Plank, T., 1992. Petrological systematicsof mid-ocean ridge basalts: constraints on melt generation beneath oceanridges, in: Mantle Flow and Melt Generation at Mid-Ocean Ridges, edsMorgan, J.P., Blackman, D.K. & Sinton, J.M., Geophysical Monograph71, Am. Geophyp. Union.
Li, A. & Detrick, R.S., 2003. Azimuthal anisotropy and phase velocitybeneath Iceland: implication for plume-ridge interaction, Earth planet.Sci. Lett., 214, 153–165, doi:10.1016/S0012-821X(03)00382-0.
Maaløe, S. & Jakobsson, S.P., 1980. The PT relations of a primary oceanitefrom the Reykjanes peninsula, Iceland, Lithos, 13, 237–246.
MacKenzie, K., McClain, J. & Orcutt, J., 1982. Constraints on crustal struc-ture in eastern Iceland based on extremal inversion of refraction data,J. geophys. Res., 87, 6371–6382.
Maupin, V., 1985. Partial derivatives of surface wave phase velocities forflat anisotropic models, Geophys. J. R. astr. Soc., 83, 379–398.
Maupin, V. & Cara, M., 1992. Love-rayleigh wave incompatibility and pos-sible deep upper mantle anisotropy in the Iberian Peninsula, PAGEOPH,138(3), 429–444.
Menke, W., Brandsdottir, B., Jakobsdottir, S. & Stefansson, R., 1994. Seismicanisotropy in the crust at the mid-Atlantic plate boundary in south-westIceland, Geophys. J. Int., 119, 783–790.
Menke, W., Brandsottir, B., Einarsson, P. & Bjarnason, I.Th., 1996. Rein-terpretation of the RRISP-7 Iceland shear-wave profiles, Geophys. J. Int.,126, 166–172.
Menke, W., West, M., Brandsottir, B. & Sparks, D., 1998. Compressional andshear velocity structure of the lithosphere in north Iceland, Bull. seism.Soc. Am., 88, 1561–1571.
Mihalffy, P., Steinberger, B. & Schmeling, H., 2004. Plume-ridge interactionin the north Atlantic influenced by large-scale mantle flow, EGU, Nice.
Mihalffy, P., Steinberger, B. & Schmeling, H., 2008. The effect of the large-scale mantle flow field on the Iceland hotspot track. Tectonophysics, 447,5–18, doi:10.1016/j.tecto.2006.12.012.
Moorbath, S. & Walker, G.P.L., 1965. Strontium isotope investigation ofigneous rocks from Iceland, Nature, 207, 837–840.
Nishimura, C.E. & Forsyth, D.W., 1989. The anisotropic structure of theupper mantle in the Pacific, Geophys. J., 96, 203–229.
Nunns, A.G., Talwani, M., Lorentzen, G.R., Vogt, P.R., Sigurgeirsson, T.,Kristjansson, L., Larsen, H.C. & Voppel, D., 1983. Magnetic anomaliesover Iceland and surrounding seas, in Structure and Development of theGreenland-Scotland Ridge, New Methods and Concepts, pp. 661–678,eds Bott, M.H.P., Saxov, S., Talwani, M. & Thiede, J., Plenum, New York.
Nyman, D.C. & Landisman, M., 1977. The display-equalized filter forfrequency-time analysis, Bull. seism. Soc. Am., 67, 303–404.
Palmason, G., 1971. Crustal structure of Iceland from explosion seismology,Greinar Vısindafelag Isl., 40, 187 pp.
Pilidou, S., Priestley, P., Debayle, E. & Gudmundsson, O., 2005. Rayleighwave tomography in the North Atlantic: high resolution images ofthe Iceland, Azores and Eifel mantle plumes, Lithos, 79, 453–474,doi:10.1016/j.lithos.2004.09.012.
Prestvik, T., Goldberg, S., Karlsson, H. & Gronvold, K., 2001. Anomalousstrontium and lead isotope signatures in the off-rift Oræfajokull centralvolcano in south-east Iceland evidence for enriched endmember(s) of theIceland mantle plume? EPSL, 190, 211–220.
Pollitz, F.F. & Sacks, I.S., 1996. Viscosity structure beneath northeast Ice-land, J. geophys. Res., 101, 17 771–17 794.
Ruedas, T. & Schmeling, H., 2008. Kinematic models for the thickness ofoceanic crust at and near mid-oceanic spreading centers. J. geophys. Res.,113, B01402, doi:10.1029/2006JB004746.
C© 2009 The Authors, GJI, 178, 394–418
Journal compilation C© 2009 RAS
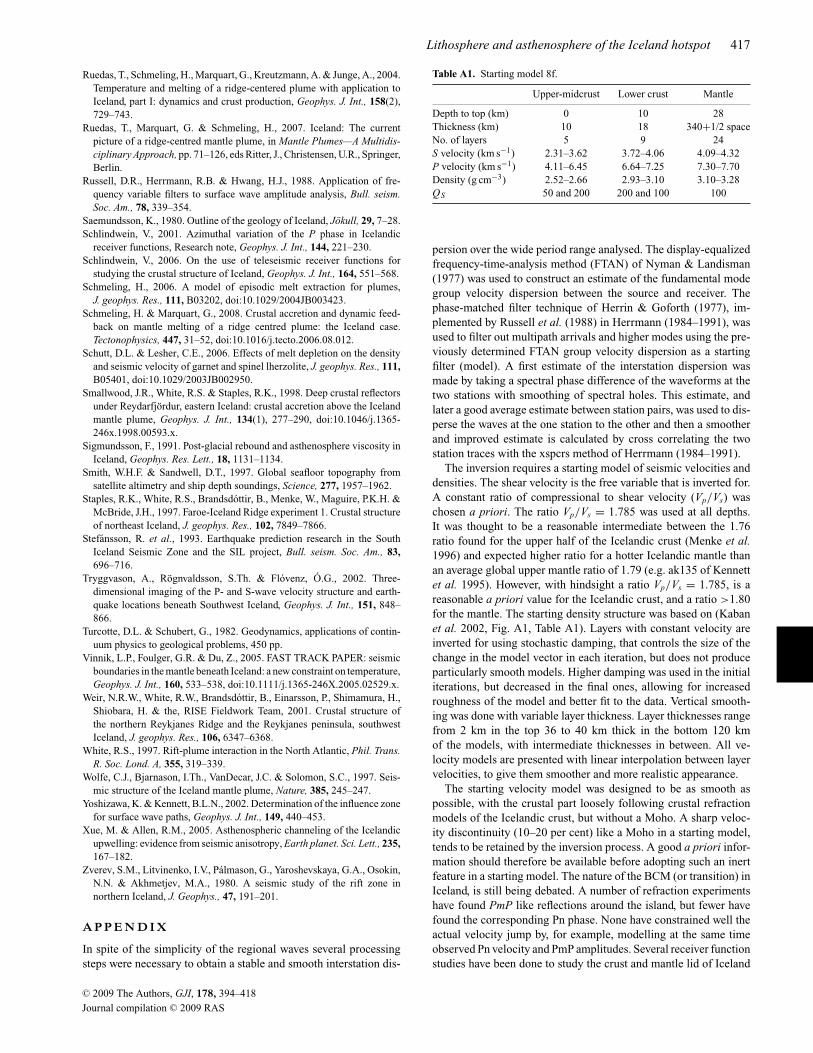
Lithosphere and asthenosphere of the Iceland hotspot 417
Ruedas, T., Schmeling, H., Marquart, G., Kreutzmann, A. & Junge, A., 2004.Temperature and melting of a ridge-centered plume with application toIceland, part I: dynamics and crust production, Geophys. J. Int., 158(2),729–743.
Ruedas, T., Marquart, G. & Schmeling, H., 2007. Iceland: The currentpicture of a ridge-centred mantle plume, in Mantle Plumes—A Multidis-ciplinary Approach, pp. 71–126, eds Ritter, J., Christensen, U.R., Springer,Berlin.
Russell, D.R., Herrmann, R.B. & Hwang, H.J., 1988. Application of fre-quency variable filters to surface wave amplitude analysis, Bull. seism.Soc. Am., 78, 339–354.
Saemundsson, K., 1980. Outline of the geology of Iceland, Jokull, 29, 7–28.Schlindwein, V., 2001. Azimuthal variation of the P phase in Icelandic
receiver functions, Research note, Geophys. J. Int., 144, 221–230.Schlindwein, V., 2006. On the use of teleseismic receiver functions for
studying the crustal structure of Iceland, Geophys. J. Int., 164, 551–568.Schmeling, H., 2006. A model of episodic melt extraction for plumes,
J. geophys. Res., 111, B03202, doi:10.1029/2004JB003423.Schmeling, H. & Marquart, G., 2008. Crustal accretion and dynamic feed-
back on mantle melting of a ridge centred plume: the Iceland case.Tectonophysics, 447, 31–52, doi:10.1016/j.tecto.2006.08.012.
Schutt, D.L. & Lesher, C.E., 2006. Effects of melt depletion on the densityand seismic velocity of garnet and spinel lherzolite, J. geophys. Res., 111,B05401, doi:10.1029/2003JB002950.
Smallwood, J.R., White, R.S. & Staples, R.K., 1998. Deep crustal reflectorsunder Reydarfjordur, eastern Iceland: crustal accretion above the Icelandmantle plume, Geophys. J. Int., 134(1), 277–290, doi:10.1046/j.1365-246x.1998.00593.x.
Sigmundsson, F., 1991. Post-glacial rebound and asthenosphere viscosity inIceland, Geophys. Res. Lett., 18, 1131–1134.
Smith, W.H.F. & Sandwell, D.T., 1997. Global seafloor topography fromsatellite altimetry and ship depth soundings, Science, 277, 1957–1962.
Staples, R.K., White, R.S., Brandsdottir, B., Menke, W., Maguire, P.K.H. &McBride, J.H., 1997. Faroe-Iceland Ridge experiment 1. Crustal structureof northeast Iceland, J. geophys. Res., 102, 7849–7866.
Stefansson, R. et al., 1993. Earthquake prediction research in the SouthIceland Seismic Zone and the SIL project, Bull. seism. Soc. Am., 83,696–716.
Tryggvason, A., Rognvaldsson, S.Th. & Flovenz, O.G., 2002. Three-dimensional imaging of the P- and S-wave velocity structure and earth-quake locations beneath Southwest Iceland, Geophys. J. Int., 151, 848–866.
Turcotte, D.L. & Schubert, G., 1982. Geodynamics, applications of contin-uum physics to geological problems, 450 pp.
Vinnik, L.P., Foulger, G.R. & Du, Z., 2005. FAST TRACK PAPER: seismicboundaries in the mantle beneath Iceland: a new constraint on temperature,Geophys. J. Int., 160, 533–538, doi:10.1111/j.1365-246X.2005.02529.x.
Weir, N.R.W., White, R.W., Brandsdottir, B., Einarsson, P., Shimamura, H.,Shiobara, H. & the, RISE Fieldwork Team, 2001. Crustal structure ofthe northern Reykjanes Ridge and the Reykjanes peninsula, southwestIceland, J. geophys. Res., 106, 6347–6368.
White, R.S., 1997. Rift-plume interaction in the North Atlantic, Phil. Trans.R. Soc. Lond. A, 355, 319–339.
Wolfe, C.J., Bjarnason, I.Th., VanDecar, J.C. & Solomon, S.C., 1997. Seis-mic structure of the Iceland mantle plume, Nature, 385, 245–247.
Yoshizawa, K. & Kennett, B.L.N., 2002. Determination of the influence zonefor surface wave paths, Geophys. J. Int., 149, 440–453.
Xue, M. & Allen, R.M., 2005. Asthenospheric channeling of the Icelandicupwelling: evidence from seismic anisotropy, Earth planet. Sci. Lett., 235,167–182.
Zverev, S.M., Litvinenko, I.V., Palmason, G., Yaroshevskaya, G.A., Osokin,N.N. & Akhmetjev, M.A., 1980. A seismic study of the rift zone innorthern Iceland, J. Geophys., 47, 191–201.
A P P E N D I X
In spite of the simplicity of the regional waves several processingsteps were necessary to obtain a stable and smooth interstation dis-
Table A1. Starting model 8f.
Upper-midcrust Lower crust Mantle
Depth to top (km) 0 10 28Thickness (km) 10 18 340+1/2 spaceNo. of layers 5 9 24S velocity (km s−1) 2.31–3.62 3.72–4.06 4.09–4.32P velocity (km s−1) 4.11–6.45 6.64–7.25 7.30–7.70Density (g cm−3) 2.52–2.66 2.93–3.10 3.10–3.28QS 50 and 200 200 and 100 100
persion over the wide period range analysed. The display-equalizedfrequency-time-analysis method (FTAN) of Nyman & Landisman(1977) was used to construct an estimate of the fundamental modegroup velocity dispersion between the source and receiver. Thephase-matched filter technique of Herrin & Goforth (1977), im-plemented by Russell et al. (1988) in Herrmann (1984–1991), wasused to filter out multipath arrivals and higher modes using the pre-viously determined FTAN group velocity dispersion as a startingfilter (model). A first estimate of the interstation dispersion wasmade by taking a spectral phase difference of the waveforms at thetwo stations with smoothing of spectral holes. This estimate, andlater a good average estimate between station pairs, was used to dis-perse the waves at the one station to the other and then a smootherand improved estimate is calculated by cross correlating the twostation traces with the xspcrs method of Herrmann (1984–1991).
The inversion requires a starting model of seismic velocities anddensities. The shear velocity is the free variable that is inverted for.A constant ratio of compressional to shear velocity (Vp/Vs) waschosen a priori. The ratio Vp/Vs = 1.785 was used at all depths.It was thought to be a reasonable intermediate between the 1.76ratio found for the upper half of the Icelandic crust (Menke et al.1996) and expected higher ratio for a hotter Icelandic mantle thanan average global upper mantle ratio of 1.79 (e.g. ak135 of Kennettet al. 1995). However, with hindsight a ratio Vp/Vs = 1.785, is areasonable a priori value for the Icelandic crust, and a ratio >1.80for the mantle. The starting density structure was based on (Kabanet al. 2002, Fig. A1, Table A1). Layers with constant velocity areinverted for using stochastic damping, that controls the size of thechange in the model vector in each iteration, but does not produceparticularly smooth models. Higher damping was used in the initialiterations, but decreased in the final ones, allowing for increasedroughness of the model and better fit to the data. Vertical smooth-ing was done with variable layer thickness. Layer thicknesses rangefrom 2 km in the top 36 to 40 km thick in the bottom 120 kmof the models, with intermediate thicknesses in between. All ve-locity models are presented with linear interpolation between layervelocities, to give them smoother and more realistic appearance.
The starting velocity model was designed to be as smooth aspossible, with the crustal part loosely following crustal refractionmodels of the Icelandic crust, but without a Moho. A sharp veloc-ity discontinuity (10–20 per cent) like a Moho in a starting model,tends to be retained by the inversion process. A good a priori infor-mation should therefore be available before adopting such an inertfeature in a starting model. The nature of the BCM (or transition) inIceland, is still being debated. A number of refraction experimentshave found PmP like reflections around the island, but fewer havefound the corresponding Pn phase. None have constrained well theactual velocity jump by, for example, modelling at the same timeobserved Pn velocity and PmP amplitudes. Several receiver functionstudies have been done to study the crust and mantle lid of Iceland
C© 2009 The Authors, GJI, 178, 394–418
Journal compilation C© 2009 RAS
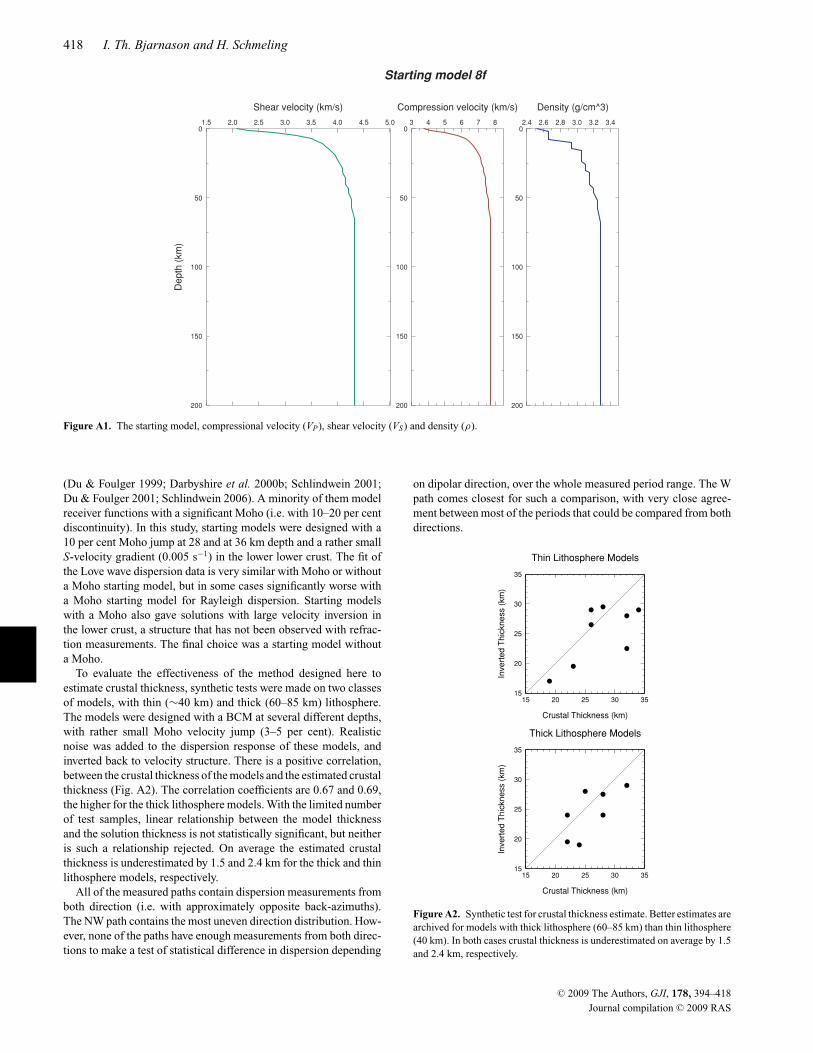
418 I. Th. Bjarnason and H. Schmeling
Figure A1. The starting model, compressional velocity (VP), shear velocity (VS) and density (ρ).
(Du & Foulger 1999; Darbyshire et al. 2000b; Schlindwein 2001;Du & Foulger 2001; Schlindwein 2006). A minority of them modelreceiver functions with a significant Moho (i.e. with 10–20 per centdiscontinuity). In this study, starting models were designed with a10 per cent Moho jump at 28 and at 36 km depth and a rather smallS-velocity gradient (0.005 s−1) in the lower lower crust. The fit ofthe Love wave dispersion data is very similar with Moho or withouta Moho starting model, but in some cases significantly worse witha Moho starting model for Rayleigh dispersion. Starting modelswith a Moho also gave solutions with large velocity inversion inthe lower crust, a structure that has not been observed with refrac-tion measurements. The final choice was a starting model withouta Moho.
To evaluate the effectiveness of the method designed here toestimate crustal thickness, synthetic tests were made on two classesof models, with thin (∼40 km) and thick (60–85 km) lithosphere.The models were designed with a BCM at several different depths,with rather small Moho velocity jump (3–5 per cent). Realisticnoise was added to the dispersion response of these models, andinverted back to velocity structure. There is a positive correlation,between the crustal thickness of the models and the estimated crustalthickness (Fig. A2). The correlation coefficients are 0.67 and 0.69,the higher for the thick lithosphere models. With the limited numberof test samples, linear relationship between the model thicknessand the solution thickness is not statistically significant, but neitheris such a relationship rejected. On average the estimated crustalthickness is underestimated by 1.5 and 2.4 km for the thick and thinlithosphere models, respectively.
All of the measured paths contain dispersion measurements fromboth direction (i.e. with approximately opposite back-azimuths).The NW path contains the most uneven direction distribution. How-ever, none of the paths have enough measurements from both direc-tions to make a test of statistical difference in dispersion depending
on dipolar direction, over the whole measured period range. The Wpath comes closest for such a comparison, with very close agree-ment between most of the periods that could be compared from bothdirections.
15
20
25
30
35
Inve
rted
Thi
ckne
ss (
km)
15 20 25 30 35
Crustal Thickness (km)
Thick Lithosphere Models
15
20
25
30
35
Inve
rted
Thi
ckne
ss (
km)
15 20 25 30 35
Crustal Thickness (km)
Thin Lithosphere Models
Figure A2. Synthetic test for crustal thickness estimate. Better estimates arearchived for models with thick lithosphere (60–85 km) than thin lithosphere(40 km). In both cases crustal thickness is underestimated on average by 1.5and 2.4 km, respectively.
C© 2009 The Authors, GJI, 178, 394–418
Journal compilation C© 2009 RAS
Related Documents


![Imaging the seismic lithosphere asthenosphere boundary of ...gachon.eri.u-tokyo.ac.jp/.../KumarKawakatsu2011G3.pdf · [1] The seismic lithosphere‐asthenosphere boundary (LAB) or](https://static.cupdf.com/doc/110x72/5f5276781da9a433875d656b/imaging-the-seismic-lithosphere-asthenosphere-boundary-of-1-the-seismic-lithosphereaasthenosphere.jpg)