THE LIFE CYCLE OF A JEAN Understanding the environmental impact of a pair of Levi’s ® 501 ® jeans Prepared for: February 4, 2016

Welcome message from author
This document is posted to help you gain knowledge. Please leave a comment to let me know what you think about it! Share it to your friends and learn new things together.
Transcript
THE LIFE CYCLE
OF A JEAN Understanding the environmental impact
of a pair of Levi’s® 501® jeans
Prepared for:
February 4, 2016
A HISTORY OF LIFE CYCLE ASSESSMENT

What is a Life Cycle Assessment?
• Systems-based, quantitative method for evaluating the environmental impact of a product
• A tool used to assess the stages and impact of a product’s entire life, from raw material extraction (cradle) to waste (grave)
• An LCA typically does not include: – Social impacts
– Economic impacts

• Allows us to focus on the most significant environmental impacts
• Informs product decisions to reduce environmental impact
• Supports engagement with external stakeholders to reduce the impact of materials and consumer care
Benefits of Life Cycle Assessment
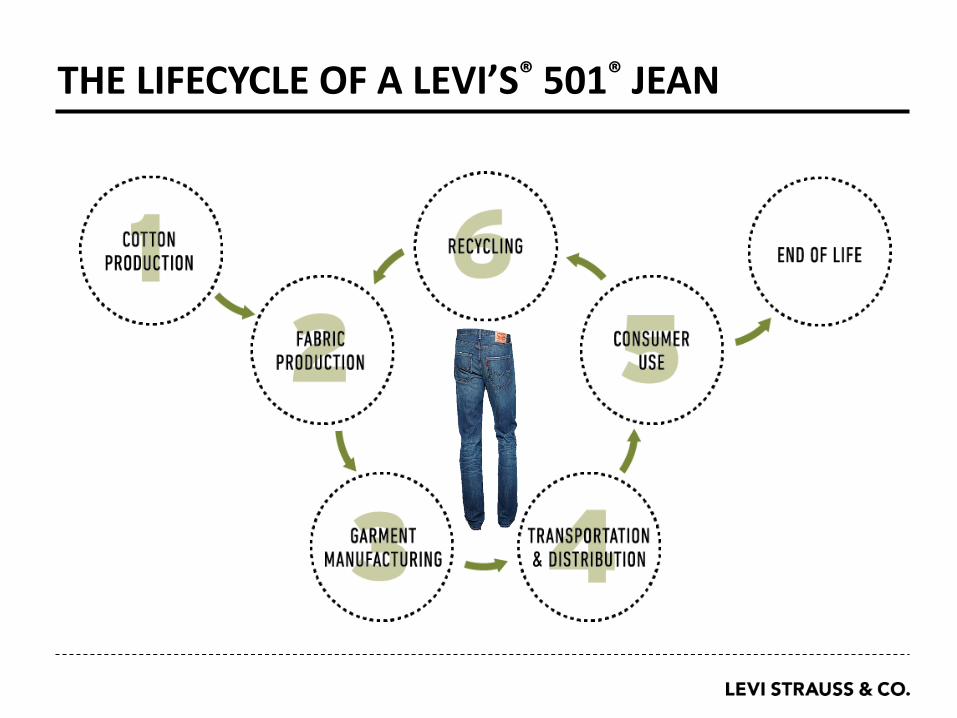
THE LIFECYCLE OF A LEVI’S® 501® JEAN

SUMMARY OF OUR FINDINGS

LEVI’S® 501® JEAN LIFECYCLE IMPACT
Climate Change: 33.4 kg CO2-e…
Water Consumed: 3,781 liters…
Eutrophication: 48.9 g PO4-e…
• 69 miles driven by the average US
car
• 246 hours of TV on a plasma big-
screen
• 3 days worth of one US household’s
total water needs
• The total amount of phosphorous
found in 1,700 tomatoes
The entire lifecycle of one pair of Levi’s® 501® jeans equates to:
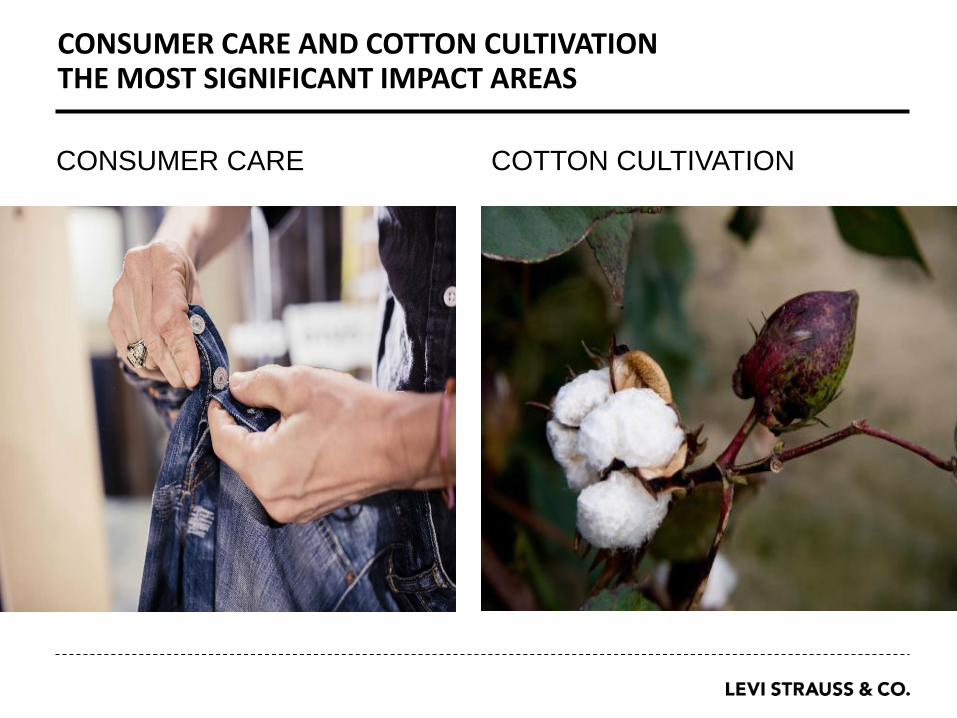
CONSUMER CARE AND COTTON CULTIVATION THE MOST SIGNIFICANT IMPACT AREAS
CONSUMER CARE COTTON CULTIVATION

LEVI’S® 501® JEANS: WATER CONSUMPTION
Fiber production, predominantly cotton, contributes by a wide margin to
water consumption.
CRADLE TO GRAVE WATER CONSUMPTION
PERCENTAGE BY PHASE
CONSUMER
CARE
23%
FIBER
68%
*END OF LIFE AND TRANSPORT, LOGISTICS, RETAIL HAVE
NEGLIGIBLE CONSUMPTION
SUNDRIES & PKGNG
2%
CUT, SEW, FINISH
1%
FABRIC
PRODUCTION
6%
CRADLE TO GRAVE WATER
CONSUMPTION
AMOUNT BY PHASE (LITERS)
FIBER FABRIC CUT,
SEW,
FINISH
SUNDRIES
& PKG
CONSUMER
CARE
2,565
236 34 77
860
9
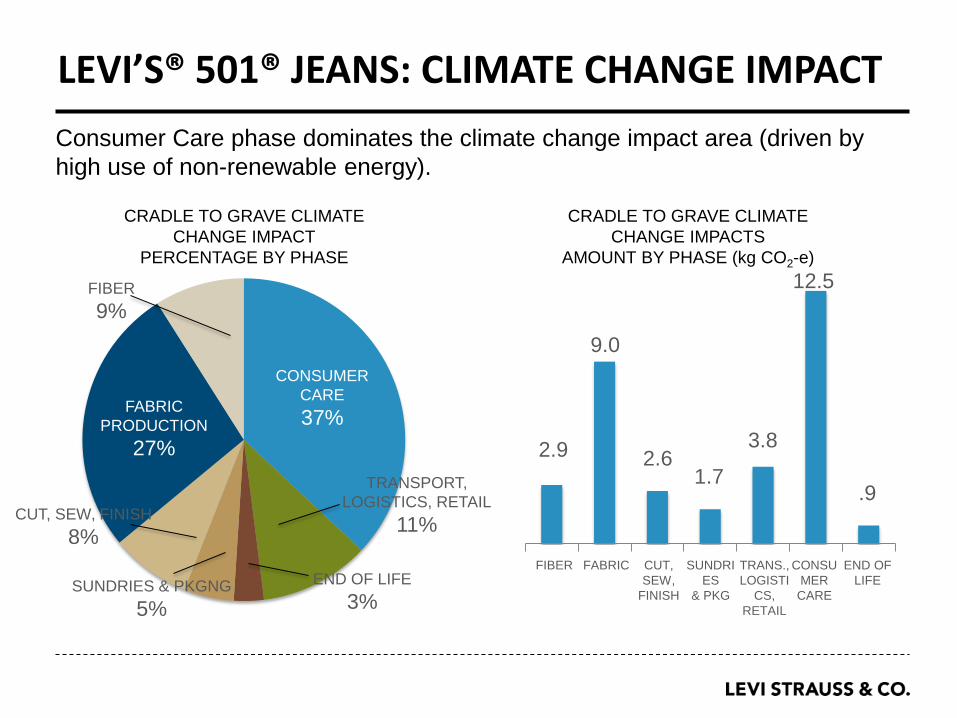
LEVI’S® 501® JEANS: CLIMATE CHANGE IMPACT
Consumer Care phase dominates the climate change impact area (driven by
high use of non-renewable energy).
CRADLE TO GRAVE CLIMATE
CHANGE IMPACT
PERCENTAGE BY PHASE
FABRIC
PRODUCTION
27%
CONSUMER
CARE
37%
TRANSPORT,
LOGISTICS, RETAIL
11%
FIBER
9%
SUNDRIES & PKGNG
5%
END OF LIFE
3%
CUT, SEW, FINISH
8%
CRADLE TO GRAVE CLIMATE
CHANGE IMPACTS
AMOUNT BY PHASE (kg CO2-e)
FIBER FABRIC CUT,
SEW,
FINISH
SUNDRI
ES
& PKG
TRANS.,
LOGISTI
CS,
RETAIL
CONSU
MER
CARE
END OF
LIFE
2.9
9.0
2.6 1.7
3.8
12.5
.9
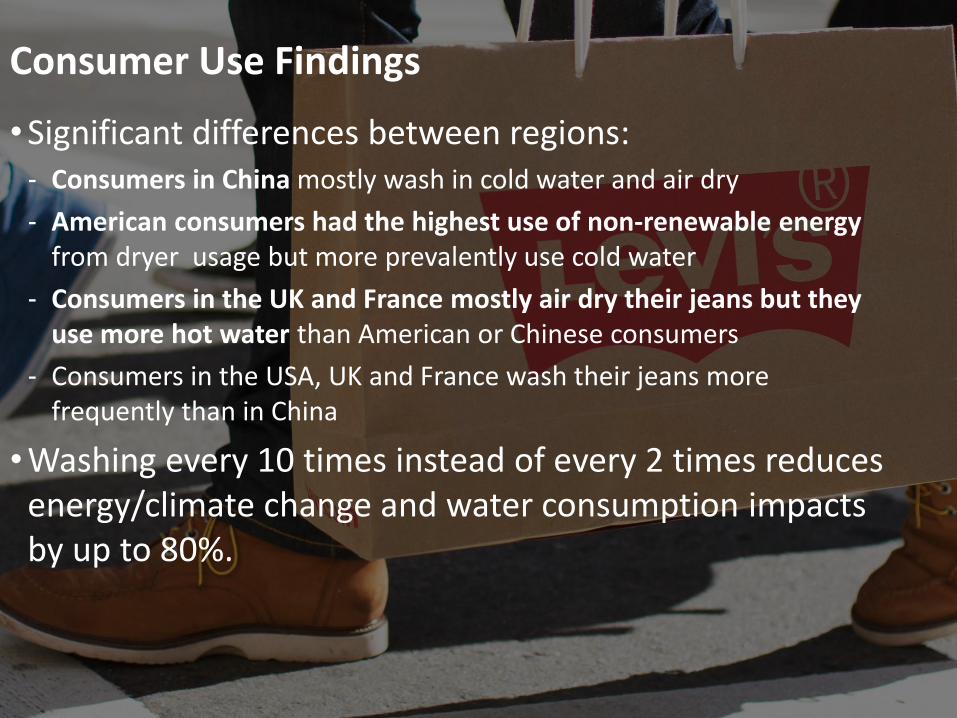
Consumer Use Findings
• Significant differences between regions: ‐ Consumers in China mostly wash in cold water and air dry
‐ American consumers had the highest use of non-renewable energy from dryer usage but more prevalently use cold water
‐ Consumers in the UK and France mostly air dry their jeans but they use more hot water than American or Chinese consumers
‐ Consumers in the USA, UK and France wash their jeans more frequently than in China
• Washing every 10 times instead of every 2 times reduces energy/climate change and water consumption impacts by up to 80%.

©2015
OUR NEXT STEPS

EDUCATE CONSUMERS & EXPAND THE BETTER COTTON INITIATIVE

The Better Cotton Initiative exists to make global cotton production better for
the people who produce it, for the environment it grows in, and better for the
sector’s future.


1 BILLION LITERS SAVED

Sustainably Produced Product
Repair
Clothing Collection Re-wear
Recycle
Circular Economy Vision
19
Better Cotton
Introduction
Prepared for
February 4, 2016

Cotton is arguably the world’s most
important natural fiber
» Nearly everyone on Earth comes into contact with
cotton on a daily basis
» Cotton production supports 250 million people’s
livelihoods (ICAC)
© Orta Anadolu

But cotton production
also has challenges
» water management
» soil depletion
» working conditions
» incorrect / over use of pesticides
© Paul Hahn for Aid by Trade Foundation.
Goal:
Transform cotton production worldwide by
developing Better Cotton as a more
sustainable mainstream commodity.
© Better Cotton Initiative
© Better Cotton Initiative
By 2020 Better Cotton is:
• 5 million farmers
• >30% of global production

Better Cotton
Global cotton production addressing the 3 pillars of sustainability
Environmental + Social + Economics
An agricultural management system:
Better
Cotton
System
6 Principles
44 Criteria
8 Indicators
Training
farmers and
verifying
practices
Physical
segregation
of Better
Cotton
(ginner level)
Enabling
supply
chain
uptake
Brand
demand as
Driver
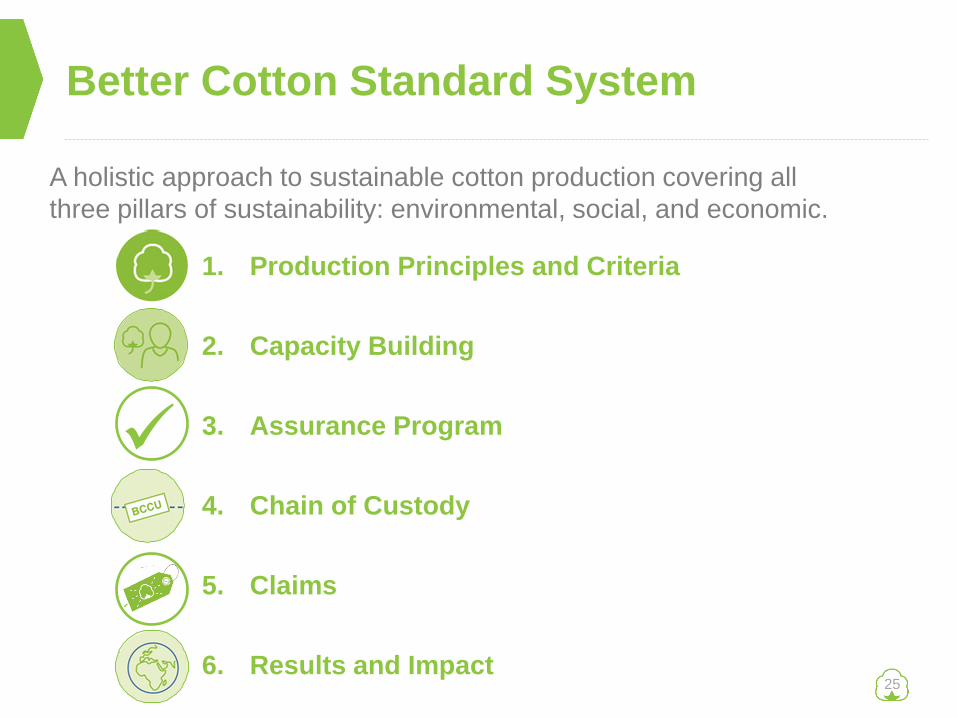
Better Cotton Standard System
25
A holistic approach to sustainable cotton production covering all
three pillars of sustainability: environmental, social, and economic.
1. Production Principles and Criteria
2. Capacity Building
3. Assurance Program
4. Chain of Custody
5. Claims
6. Results and Impact
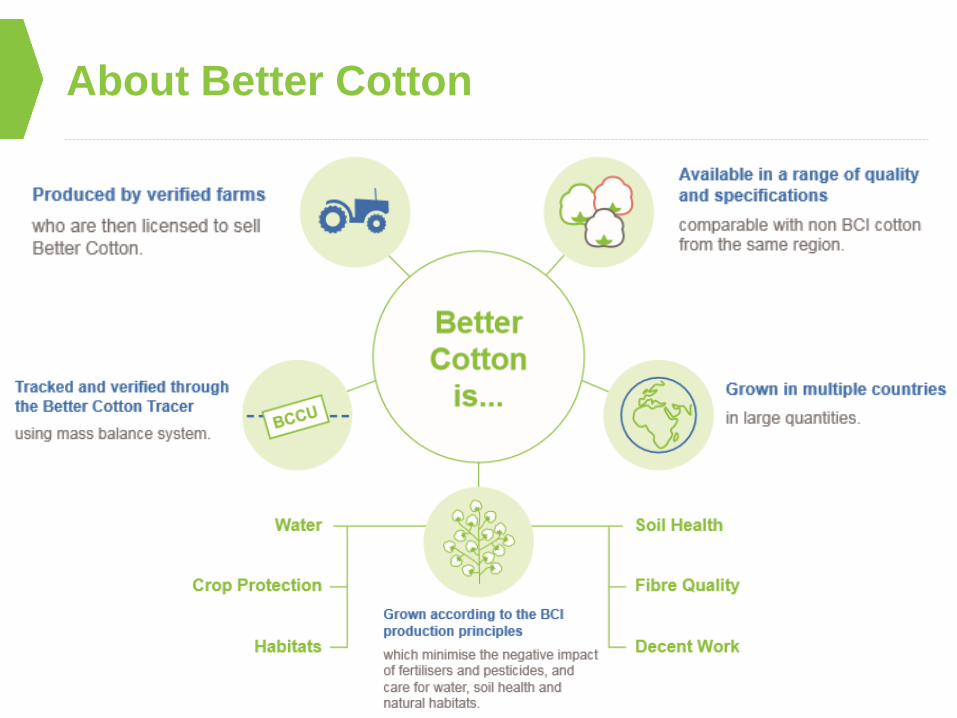
About Better Cotton
26

BCI production in 2014
27
3.7% 7.6% In 2013, Better Cotton
represented approx.
3.7% of global
production.
In 2014, Better Cotton
accounted for 7.6% of
global production.
Benchmark
agreement
Direct projects

28
Joost
Oorthuisen
Barry
Clarke
BCI Council
Civil
Society Suppliers
& Manufacturers
Producer
Organisation Retailers
& Brands Independent
1 2 3 4 5
Current BCI Council, as of 2015
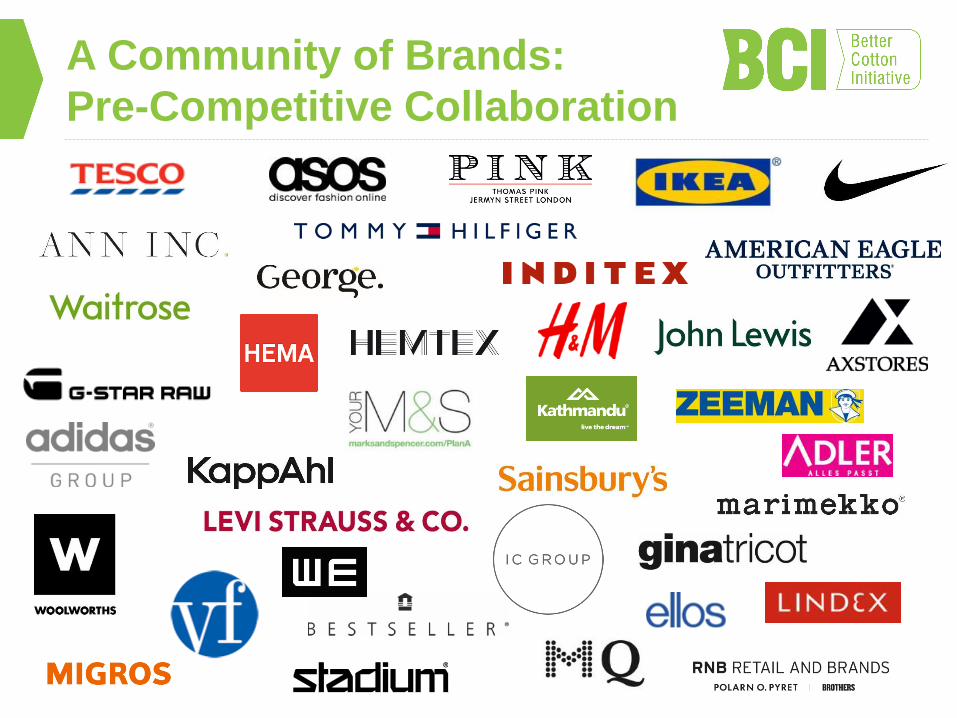
A Community of Brands:
Pre-Competitive Collaboration

30
Better Cotton is supported by
Global Brands & Retailers
74%
of cotton
will be
Better
Cotton by
2020
100%
of cotton
will be
more
sustainable
by 2020
100%
of cotton
will be
Better
Cotton by
2015
50%
of cotton
will be
more
sustainable
by 2020
100%
of cotton
will be
more
sustainable
by 2018
100%
of cotton
will be
more
sustainable
by 2020
And many others…
…

Questions?
© Better Cotton Initiative

Thank You
Daren Abney, Membership Engagement Manager
Natalie Hubbard, Senior Sustainability Specialist
© Better Cotton Initiative
Related Documents


