• • •

Welcome message from author
This document is posted to help you gain knowledge. Please leave a comment to let me know what you think about it! Share it to your friends and learn new things together.
Transcript

Durham E-Theses
The life-cycle hypothesis, �nancial planning and the
household demand for �nancial assets : an analysis of
the Malaysian experience
Sha�i, Zurina
How to cite:
Sha�i, Zurina (2007) The life-cycle hypothesis, �nancial planning and the household demand for �nancial
assets : an analysis of the Malaysian experience, Durham theses, Durham University. Available at DurhamE-Theses Online: http://etheses.dur.ac.uk/1833/
Use policy
The full-text may be used and/or reproduced, and given to third parties in any format or medium, without prior permission orcharge, for personal research or study, educational, or not-for-pro�t purposes provided that:
• a full bibliographic reference is made to the original source
• a link is made to the metadata record in Durham E-Theses
• the full-text is not changed in any way
The full-text must not be sold in any format or medium without the formal permission of the copyright holders.
Please consult the full Durham E-Theses policy for further details.

Academic Support O�ce, Durham University, University O�ce, Old Elvet, Durham DH1 3HPe-mail: [email protected] Tel: +44 0191 334 6107
http://etheses.dur.ac.uk
2

The Life-Cycle Hypothesis, Financial Planning and the Household
Demand for Financial Assets; an Analysis of the Malaysian Experience
The copyright of this thesis rests with the author or the university to which it was submitted. No quotation from it, or information derived from it may be published without the prior written consent of the author or university, and any information derived from it should be acknowledged.
By
Zurina Shafli
Thesis Submitted in Fulfilment of the Requirements For the Degree of
Doctor of Philosophy at Durham University
The School of Government and International Affairs Institute of Middle Eastern and Islamic Studies
University of Durham, UK
March 2007
0
-8 AUG 2007

ABSTRACT
The life-cycle hypothesis proposed by Modigliani and Brumberg (1954) suggests that the level of demand for financial assets is driven by the age of householders. This research examined the life- cycle effect on the level of demand savings accounts, unit trusts and shares in Malaysia. Variables such as income, wealth and a series of demographic and socio-demographic variables were also introduced in the regression models estimated. Householders' exposure to financial planning and their propensity to plan as well as the effect of the involvement of financial planners in household portfolio allocation at the level of householders' demand for financial assets are also included. The introduction to the study on households' preference for Islamic and conventional financial assets as well as their level of Syariah made our research is a novel examination of financial asset demand in this respect.
The results of this study indicate that all economic variables are significant in determining the level of demand for financial assets. Gender is the only demographic variable that is significant in the demand for all financial assets except in the regression for the demand of unit trusts. Levels of education are irrelevant for the demand for financial assets except partly in the demand for shares. Sector of employment to which householders belong serves partly to explain variations in the demand for unit trusts and saving accounts. Households' preferences to hold conventional or Islamic financial assets prevail only in the demand for saving accounts. Syariah literacy only affects the demand for saving accounts but not for the other two types of financial assets.
To further analyse the householders' portfolio selection, data from financial planners are also collected using questionnaire a method of data collection. Three of the seven planners stated that majority of their clients are have medium skills in evaluating their financial goals. Demographically, majority of financial planners reported that the age of their typical clients is between 41-50 years old with the remaining two stated that the majority of their clients are of younger age being 31 to 40 years old. Two of the planners stated that their clients' financial planning skills are poor while the remaining financial planners stated that their clients are able to evaluate their financial goals in accordance with their current financial position. In relation to Islamic financial planning, 3 out of 7 of them reported that the proportion of their clients who are engaged in Islamic financial planning totals more than 50% of client-base.
ii

DEDICATION
In memory of my father,
Shafli Omar
31 "July 1928-19'h June 2005
I am etemally grateful for his love, comfort and wisdom.
iii

ACKNOWLEDGEMENTS
I wish to express my gratitude to those who have inspired and supported me during the
course of this thesis preparation.
I would like to thank first and foremost my supervisor, Professor Rodney Wilson, for his
guidance and assistance in writing this thesis. His valuable advice, encouragement and
understanding made the whole process much easier. In addition I wish to thank Professor
Muhammad bin Muda for his support and opinions on the thesis. My gratitude also
extended to Dr. Kamil Idrus, an academician in Universiti Utara Malaysia for his
guidance on statistical matters. My study would not have been possible without the
financial support/scholarship I received from the Universiti Sains Islam Malaysia (USIM)
and Jabatan Perkhidmatan Awarn (JPA). I would like to thank these organisations for
their support.
I am grateful to the respondents for their cooperation in answering the questionnaire and interviews for this study. I regret that I can not mention everyone here. However, special
appreciation goes to the customer service manager of PN13 Jalan Tun Razak, the manager
of Bank Islam Jalan Tun Razak, the manager of customer service of Tabung Haji, staffs
of APEX securities, staffs of KN Kenanga for their assistance to let me distribute
questionnaires to their clients. Thank you to Hajjah Rohani Datuk Shahir for her
intellectual input in Islamic financial planning and her contacts on several financial
planners whom I interviewed.
My special thanks to Mr David Middleton for proofreading my thesis. His sense of
humour made the process of final editing bearable. I wish to acknowledge the generous
and helpful teaching and administrating staffs in the School of Government and
International Affairs, Durham University, staff of the Education Library at the University
of Leicester and the staff of Markfield Institute of Higher Education (MIHE).
iv

My greatest thanks are reserved for my husband, Abdullah Jones and to my mother, Romlah and my sisters and brothers. They have given me help, patience, love and
encouragement throughout my entire academic venture. Their support has meant the
world to me. For these and many other reasons I am eternally grateful. For Hylmun Izhar
from the University of Durham and Ms. Azlina Aziz from the Economic Department, the
University of Leicester who provided insights and comments and help with the statistical
matters, I am thankful. Lucy, Frances, Jean, Comelia, George and Reza provided me with
great help with my English and a joyful experience in the UK. Dr. Mohamed, Dr. Amal
Lamlilass, Mahammed, Ayman and the most adorable girl, Lina taught me on the
meaning of hard work and I am greatly indebted to them. Thanks also to my friends in
Durham, Ms. Elena, Ms. Farah Madehah, Ms. Wan Kamariah (Zulkifli), Aishah (Dr.
Aminiddin), Ms. Noraini Ibrahim, Ms. Wati (Dr. Lukman) and Ms. Zuraidah (Talib) for
being such reliable friends to me. Ms. Saadiah Maalip and her husband, Mr. Abid Kamal
gave me so much support that I cannot thank both of them enough. Finally I would also like to thank all my dear friends and colleagues wherever they are, especially to Norain,
Emilia, Fairuz, Shima, Sherina, Ms. Nadia and Ms. Norazam, whose making life during
my study not just bearable but enjoyable.
V

TABLE OF CONTENTS
ABSTRACT
DEDICATION iii
ACKNOWLEDGEMENTS iv
TABLE OF CONTENT vi
LIST OF TABLES
LIST OF FIGURES xii
GLOSSARY xiv
LIST OF ABBREVIATIONS xvi
CHAPTERS
Background of the Study 1.1. Introduction 1 1.2. Research Aims 5 1.3. Research Objectives 6 1.4. Research Questions 7 1.5. Scope of the Research 8 1.6. Outlines of the Thesis Contents 9
2. The Review on the Life Cycle Hypothesis and Demand for Financial Assets 2.1. Introduction 12 2.2. Savin gs and Wealth Accumulation 16
2.2.1. Theories of Savings 17 2.2.2. Determinants of Savings 19 2.2.3. Life Cycle Hypothesis as a Model for Savings 21
and Wealth Accumulation 2.3. Factors Affecting the Demand for Financial Assets 27
2.3.1. Economic Factors 27 2.3.2. Demographic Factors 30 2.3.3. Health Status 33 2.3.4. Institutional Effect and Market Imperfections 34 2.3.5. Demand for Financial Assets as a Condition to Demand 36
to other Types of Assets 2.3.6. The Life Cycle Effect 39
vi

2.4. Household's Portfolio Allocation and Demand for Financial Assets; 42 International and Comparative Researches 2.4.1. Japan 42 2.4.2. UK and the US 44 2.4.3. Italy, Netherlands and the US 45 2.4.4. Netherlands 47 2.4.5. Islamic Financial Asset Demand in the U. S and Malaysia 49
2.5. Conclusion 51
3. The Demand for Financial Assets in Malaysia: A Survey 3.1. Introduction 52 3.2. Financial Assets Holding in Malaysia 54
3.2.1. Transaction accounts 54 3.2.2. Certificate of Deposits 58 3.2.3. Savings Bonds 61 3.2.4. Bonds 63 3.2.5. Shares 68 3.2.6. Unit Trusts 72 3.2.7. Retirement Accounts 75 3.2.8. Life Insurance 77
3.3. Conclusion 81
4. The Review on Financial Planning, Financial Literacy and Islamic Financial Planning in Malaysia 4.1. Introduction 82 4.2. Financial Planning Industry and Financial Planning Association 83
of Malaysia (FPAM) 4.2.1. The Importance of Financial Planning Industry to the Capital and
Financial Market in Malaysia 84 4.2.2. Reasons for the Growth of Financial Planning Practice in Malaysia 89 4.2.3. Introduction to FPAM 96
4.3. Financial planners and Householders Portfolio Allocation 102 4.3.1. Financial Planning Theoretical Framework and Models for Financial
Planning 103 4.3.2. The Roles of Financial Planners in Householders 108
Portfolio Allocation 4.4. Financial Literacy and Financial Education in Malaysia 113 4.5. Syariah Literacy and Islamic Financial Planning 117 4.6. Conclusion 126
vii

5. Research Design and Methodology for the Multiple Regression Analysis 5.1. Introduction 127 5.2. Theoretical Underpinnings 127 5.3. Theoretical Framework and Hypotheses Development 130 5.4. Methodological Framework 137 5.5. Model Specification 141 5.6. Measurement and Analysis 142
5.6.1. Dependent Variables 142 5.6.2. Independent Variables 143
5.7. Data Collection Issues 149 5.7.1. Population, Sampling Frame and Sampling Method 149 5.7.2. Sample Size Estimation 151
5.8. Research Instruments, reliability and validity tests 154 5.9. Procedures for Questionnaire with Householders and Questionnaire with
Financial Planners 158 5.10. Conclusion 161
6. Determinants of The Demand for Financial Assets in Malaysia: Empirical Results and Findings 6.1. Introduction 162 6.2. Descriptive Statistics 163
6.2.1. Demographic Background 163 6.2.2. Financial Background; Income, Wealth and Net Wealth 165 6.2.3. Frequency Analysis on the Demand for Unit Trusts, 167
Shares and Savings 6.2.4. Frequency Analysis on Choice for Islamic and Conventional 175
Financial Assets, Syariah Literacy, Financial Exposures and Financial Planning
6.3. The Regression Results 182 6.3.1. The Demand for Unit Trusts 188 6.3.2. The Demand for Shares 193 6.3.3. The Demand for Saving Accounts 196
6.4. Diagnostic Test to Multiple Regression Analysis 199 6.5. Conclusion 212
7. Discussions of the Regression Results on the Demand for Financial Assets 6.1 Introduction 214 6.2 The Discussion of Results 216
6.2.1 Economic Variables: Income, Wealth and Net Wealth 221 6.2.2 The Life Cycle Hypothesis 227 6.2.3 Demographic Effect: Gender, Marital Status and Race 233 6.2.4 Socio-economic Effect: Educational Background and 239
Employment Sector 6.2.6 Risk Tolerance Level 240 6.2.7 Certified Financial Planner's Involvement 242
viii

6.2.8 Preference between Islamic and Conventional Financial Assets 244 6.2.9 Syariah Literacy 253 6.2.10 Financial Planning and Financial Literacy 254
6.3 Conclusion 261
8. Findings of the semi-structured interviews with Certified Financial Planners 8.1. Introduction 262 8.2. Findings Related to Financial Planners 265 8.3. Findings Related to Clients of Financial Planners 269 8.4. Clients' Financial Planning Expertise 273 8.5. Islamic Financial Planning 276 8.6. Conclusion 279
9. Concluding remarks, implications and recommendations 9.1. Introduction 280 9.2. Summary of Findings 280 9.3. Implications of the Findings 285 9.4. Research Limitations and Suggestions for Future Research 290 9.5. Conclusion 292
BIBLIOGRAPHY
APPENDICES
Appendix 1: Survey Results by Failaka. com: Demand for Islamic Investments in America 309
Appendix 2: Financial Education Programme in School, Colleges and Universities in the U. S. 314
Appendix 3: The Lists of Current Islamic Equity Providers as at 1P February 2006 by Failaka. com conducted by Harvard University's Islamic Financial Information Program (HIFIP) 319
Appendix 4: The Questionnaire for Households on the Demand for Financial Assets 323
Appendix 5: Full Regression Results for All Financial Assets 329 Based on Net Wealth of Respondents
Appendix 6: Pair-Wise Correlation Analysis for the Independent 338 Variables to Determine for Possible Existence of Multicollinearity
Appendix 7: A Sample of Invitation Letter to a Financial Planner and 339 His Responses to the Interview Questions
ix
LIST OF TABLES
2.1 Reasons Given by Respondents as Most Important For Their Families'
Saving Distributed by the Type of Reason
3.1 Basic Statistics on Population, GDP and GNI in Malaysia
3.2 Islamic Banking Deposit Rate for Affin Bank with Effective from
16th April 2006 to 15 th May 2006
3.3 Lists of Licensed Banking Institutions in Malaysia as at I't January 2007
3.4 An Illustration to Demonstrate the Transaction of Cash Market
and Futures Market
3.5 Size of Local Currency Bond Market
3.6 Types of Fixed Income Securities Offered by EON Bank
3.7 The Performance of Indices of Bursa Malaysia at the End of Year 2004 and 2005
3.8 Local and Foreign Funds Managed by Licensed Fund Management
Companies on December 2004 and June 2005
3.9 Top Public Sector Provident and Pension Funds (MYR billions)
3.10 Life and Non-Life Insurance Premiums in 2004
(Direct premiums written, in US millions) 3.11 Family Takaful Key Indicators from the Years 2000 until 2005
4.1 Option A of CFPTM Certification Course Offered by FPAM
4.2 Numbers of Certified Financial Planners Practicing in Various Areas
of Financial Planning
4.3 Securities Approved by Syariah Advisory Council Published
as at 20th April 2006
4.4 Islamic Financial Institutions and Conventional Institutions
Operating Islamic Windows System
5.1 The Results for Reliability Test
5.2 The Results for Validity Test
6.1 Respondent's Demographic Backgrounds
x

6.2 Respondents' Financial Position
6.3 Amount of Respondents' Financial Assets
6.4 Total Value of Unit Trust Held by the Respondents
6.5 Total Value of Shares Held by the Respondents
6.6 Total Value of Savings Held by the Respondents
6.7 Frequency and Percentage of Conventional and Islamic Unit Trusts, Shares and Savings Held by Respondents
6.8 Descriptive Statistics on Syariah Literacy, Propensity to Plan and Financial Exposures
6.9 The Frequency Distribution for Several Areas of Financial
Planning Activities
6.10 The Frequency Distribution for Respondents' Score on their
Usage of Various Source of Information on Financial Planning
6.11 Lists of Dummy Variables Included in the Regression
6.12 Model Summary for the Multiple Regressions of Unit Trusts
6.13 Coefficients and Statistics for All Variables for Regression
Containing Income, Wealth and Net Wealth for the Demand of Unit Trusts
6.14 Model Summary for the Multiple Regressions of Shares
6.15 Coefficients and Statistics for All Variables for Regression
Containing Income, Wealth and Net Wealth for the Demand of Shares
6.16 Model Summary for the Multiple Regression of Saving Accounts
6.17 Coefficients and Statistics for All Variables for Regression
Containing Income, Wealth and Net Wealth for the Demand of Saving Accounts
6.18 Results for Normality Test of Residual
7.1 Summary of the Coefficients of Variables Included in the
Regression for All Financial Assets
7.2 Lists of Appointed Fund Management Institutions by the
Malaysian Ministry of Finance
7.3 Percentage Distribution of Female Labour Force during the Year 1970-1995
xi

7.4 Burniputra Equity and Some Economic Performance for the
Year 1970,1990 and 2004
7.5 Principles of an Islamic Financial System
7.6 Islamic Banking System - Deposits by Type and Institution
7.7 Syariah-based Unit Trust Funds
7.8 List of Islamic Unit Trust Funds (Launch as at 15 October 2004)
8.2 Rate of Hourly Fees Charged by Financial Planners
8.3 Age of the Typical Client of Financial Planners
8.4 Net Worth of Financial Planners' Typical Clients
8.5 Financial Planners' Evaluation on the Level of Financial Planning Skills
of Their Typical Clients
8.6 Percentage of Financial Planners' Clients Involved in
Islamic Financial Planning
8.7 Financial Planners' Level of Understanding on Islamic Financial Planning
LIST OF FIGURES
2.1 Modigliani and Brumberg's (1954) and Tobin's (1967) Models
Of Life Cycle Hypothesis
2.2 Pie Chart Showing the Reasons for Not Having Halal Investments
5.1 Theoretical Framework of the Research
5.1 Total Value of Unit Trusts Holdings of respondents
5.2 Total Value of Shares Holdings of Respondents
5.3 Total Value of Savings of Respondents
xii
LIST OF DIAGRAMS
6.1 Scatter Plot of Regression Standardised Residual Containing Net Wealth
Against Regression Standardised Predicted Values for Log Unit Trust
6.2 Scatter Plot of Regression Standardised Residual Containing Net Wealth
Against Regression Standardised Predicted Values for Log Shares
6.3 Scatter Plot of Regression Standardised Residual Containing Net Wealth Against
Regression Standardised Predicted Values for Log Savings Accounts
6.4 Scatter Plot of Standardised Residual for Regression Containing Net Wealth Against
Log Net Wealth - Demand of Unit Trust
6.5 Scatter Plot of Standardised Residual for Regression Containing Net Wealth Against
Log Net Wealth - Demand of Shares
6.6 Normal Q-Q Plot of Stanclardised Residual for the Regression Containing Net
Wealth in the Regression of Unit Trusts
6.7 Normal Q-Q Plot of Standardised Residual for the Regression Containing Net Wealth
in the Regression of Shares
6.8 Normal Q-Q Plot of Standardised Residual for the Regression Containing Net Wealth
in the Regression of Saving Accounts
7.1 Number of Syariah-approved Securities Listed on Bursa Malaysia
8.1 Number of Years Financial Planners Operate
8.2 Numbers of Clients Currently Managed by Financial Planners
8.3 Annual Income of the Typical Clients of Participating Financial Planners
xiii

GLOSSARY
Aad : Agreement between parties involved in business transactions. Without it, transactions cannot be regarded as valid in the eyes of Islamic law.
Takaful : Islamic solution to risk management which means helping each other. Participants agree in a contract to contribute a sum of money to be put in a fund that can be used to pay other participants in need. The fund can be managed by the way of profit-sharing among participants and the manager of the fund or simply by the manager being an agent to the participants to whom the participants pay fees.
Syariah : Literally, the Syariah means the path to water- the source of life, the clear path to be followed and the path which the believer has to tread in order to obtain guidance in this world and the deliverance in the next. Technically, it means a set of norms, values and laws that govern Muslims' lives.
Bay'bithaman 'ajil : This contract refers to the sale of goods on a deferred payment basis. Equipment or goods requested by the clients are bought by the bank which subsequently sells the goods to the client at an agreed price which includes the bank's mark-up (profit). The client may be allowed to settle the payment by instalments within a pre-agreed period, or in a lump sum. It is similar to a murabahah contract, but with payment on a deferred basis.
Bay'al-Inah : Sell and buy back arrangement. The financier sells an asset to the customer on a deferred payment and then the financier immediately repurchases the asset for cash at a discount.
Istisna' :A contract for manufacturing goods. Payment received by the seller in advance for the manufactured goods to be delivered in the future. The quantity and the quality of the goods are ascertained in advance.
xiv

Mudharabah : Refers to an agreement made between a capital provider and another party (entrepreneur), to enable the entrepreneur to carry out business projects, based on a profit-sharing basis of a pre-agreed ratio. In the case of a loss, it will be borne by the provider of the funds.
Maisir : Gambling. A business transaction that involves elements of gambling is prohibited by Syariah.
Tabarru' : By definition can be referred to as a contribution, donation or offering. The instrument is used in takaful institutions where a contribution is collected from the participants to be managed by the funds.
Qada'and Qadar : Allah's will of occurrences; bad or good that shall happen to all living creatures. It is one of the six articles of faith for a Muslim.
Sukuk :A certificate of ownership of right of assets. It can be issued under many instruments such as leasing and diminishing musyarakah. By holding the certificate, the owner is entitled to the rights of owning the underlying assets such as on money receivables upon the usage of the assets. Sukuk can be traded in the secondary markets as it has an intrinsic market value that can be passed from one party to another.
Riba' : Literally means an increase or addition. Technically it denotes any increase or advantage obtained and accrued by the lender in a loan transaction without giving an equivalent counter-value or recompense in return to the borrower. In a commodity exchange, it denotes any disparity in the quantity or time of delivery.
Halal : Permissible according to Syariah
Haram : Prohibitions according to Syariah
Gharar : The root word of gharar denotes deception or ambiguity. Bay' al-gharar is an exchange in which there is an element of deception either through ignorance about the goods, the price or through faulty conditions of the goods.
Umum balwa : Activities that involve the general public
xv

Maslahah : Literally means benefit or interest. In the context of Syarlah, it can be referred to as Public interests. One of Syariah applications of this concept is the adoption of "maslahah mursalah" which means unrestricted public interest on any fatwa or ruling passed by Islamic jurists.
Musyarakah : Refers to a partnership or joint venture for a specific business. The distribution of profits will be apportioned according to an agreed ratio. In the event of losses, both parties will share the losses on the basis of their equity participation.
ABBREVIATIONS
Abbreviations Meaning
AICPA American Institute of Certified Public Accountants ASM Amanah Saham MARA BIMB Bank Islam Malaysia Berhad BNM Bank Negara Malaysia Berhad CCCS Consumer Credit Counselling Service CMP Capital Market Plan CPA Certified Public Accountants EFP Exchange Futures for Physical EPF Employee Provident Fund ETF Exchange Traded Fund FAST Fully Automated System for Tendering FPAM Financial Planning Association of Malaysia FPSB Financial Planning Standard Board GDP Gross Domestic Product GLS Generalised Least Squares GNI Gross National Income IFI Islamic Financial Institution IlMM Islamic Interbank Money Market IRA Individual Retirement Account ISO International Standardisation of Organisation KLIBOR Kuala Lumpur InterBank Offer Rate USE Kuala Lumpur Stock Exchange MARC Malaysian Rating Corporation Berhad MPT Modem Portfolio Theory MTN Medium Term Notes
xvi

MYR Malaysian Ringgit (Currency) NAPFA National Association of Personal Financial
Advisors NAV Net Asset Value NCD Negotiable Certificate of Deposits NCEE National Council on Economic Education NOW (account) Negotiable Order of Withdrawal (account) OECD Organisation of Economic Co-operation and
Development OLS Ordinary Least Squares PFP Personal Financial Planning RAM Rating Agency Malaysia Berhad RENTAS Real-Time Gross Settlement System
REIT Real Estate Investment Trust SC Securities Commission SAC Syariah Advisory Council SIPP Survey of Income and Participation SOP Standard of Practice SPSS Software Packages for Social Sciences TSR Transferable Subscription Rights UNESCO United Nations Educational, Scientific and Cultural
Organisation
xvii

CHAPTER1
BACKGROUND OF THE STUDY
1.1 Introduction
The life-cycle hypothesis developed by Modigliani and Brumberg (1954) states that
the amount of wealth owned by householders is significantly determined by their age. Householders' asset portfolio accumulation begins with insignificant assets when
they are young. Wealth and savings will then increase up to the point of the
retirement age and decrease substantially at retirement, posing an inverse U-shaped
pattern of wealth accumulation pattern.
In line with the hypothesis, Bodie et aL (1992) reported that young householders are
more flexible in terrn of their labour supply making them more susceptible to save less or even to borrow money. Information hypothesis proposed by King and Leape
(1987) supports the fact that the demand for financial assets is maximised during the
middle-age stage. As information needs time to be acquired and digested, middle-
aged households are more confident to invest more than their younger counterparts.
At retirement age, householders will have to consume their savings due to the
significant reduction in their labour income. In order to have enough savings for the
retirement purpose, they have to maximise savings during earlier periods of their
lives. The pattern of humped-shape wealth accumulation also accommodates the
prediction of a permanent income hypothesis which is sometimes called the habit
formation hypothesis; Duesenberry (1949).
The prediction of the traditional model states that the total wealth of households
peaks at middle age and start to decrease in older age. Poterba and Samwick (1997)
found that the reverse pattern applies to the demand for financial assets. Since their
a I

studies took into account both financial and non-financial assets, the difference in the
pattern of demand for both types of assets can be examined. The holding of financial
assets is higher for younger householders, reduces during the middle age and increasing again at older age. When they are younger, householders hold more of financial assets when real assets are too costly to be considered. Subsequently, when householders have enough funds to purchase their houses, they will tend to hold
fewer financial assets. On the other hand, older householders tend to hold more financial assets since these types of assets are able to meet their objectives of liquidity
during their later years. They particularly need liquid assets to replace their labour
income flow to spend on their current consumption as well as to pay for health related
expenses which may be significant in their costs.
In contrast, Jagannathan and Kocherlakota (1996) state that the age factor is not the
main factor determining the level of demand for financial assets. Investment
decisions are very much specific to an individual investor's risk and return
consideration as well their background risk such as the correlation of an individual's
income to the return on his/her investment.
The economic background of householders, especially their level of net wealth, also
significantly affects the amount of financial assets they own. Two other measures of financial ability are income and wealth. Research examining the effect of these
economic variables on the demand for financial assets has been done by, among others, King and Leape (1984), Wolff (1979), Hochguertel et al. (1997) and Modigliani and Brumberg (1954).
The marginal propensity to save of householders is not only affected by objective factors but also by subjective factors (Keynes; 1936). As marginal propensities to
save directly affect the demand for financial assets, Tin (2000) uses Keynes' insights
to examine whether changes in socio-economic conditions have a significant impact
on the demand for financial assets. His study includes factors such as age, number of
2

children, level of education, marital status, gender, and race as demographic variables
tested as factors to influence the level of asset demand.
In relation to levels of education, Hochguertel et aL (1997) found that higher
educated householders invest more in stocks than less educated people. This might be
due to the fact that they are able to tolerate a higher level of risk compared to their
less educated fellows owing to higher income and the stable nature of their income.
Again, on education, some authors suggest that educated householders tend to hold
more risky assets due to the higher level of information they possess. King and Leape
(1987) suggest that educated people have better information about various investment
opportunities so that they can manage their investment ventures better.
Ameriks et aL (2002), in their study reveal a strong relationship between financial
planning and wealth accumulation. Their survey data suggest that individuals with a
low propensity to plan are unable to monitor their spending and are unlikely to be
able to accumulate wealth. In order to devise a financial plan, householders need to
have an adequate level of financial literacy. Regular monitoring of financial activities
and a reasonable level of financial exposure are one of many aspects to be observed by householders during the process of wealth accumulation they embark.
This research will explain the variation in the demand for three types of financial
assets, namely savings accounts, unit trusts and shares using micro-data obtained from participating householders. The effect of income, wealth and net wealth will
first be tested in order to find the best regression' modelling for the demand for each
type of financial assets. Upon the establishment of the best regression for each type,
the existence of a life-cycle effect will be examined. In addition, the effect of sets of demographic variables will also be tested following the approach of Tin (2000) on
propensities to save and the demand for financial assets. Furthermore, the effect of
1 The best regression in this respect is referred to the regression model that has highest value of R- Squared.
3
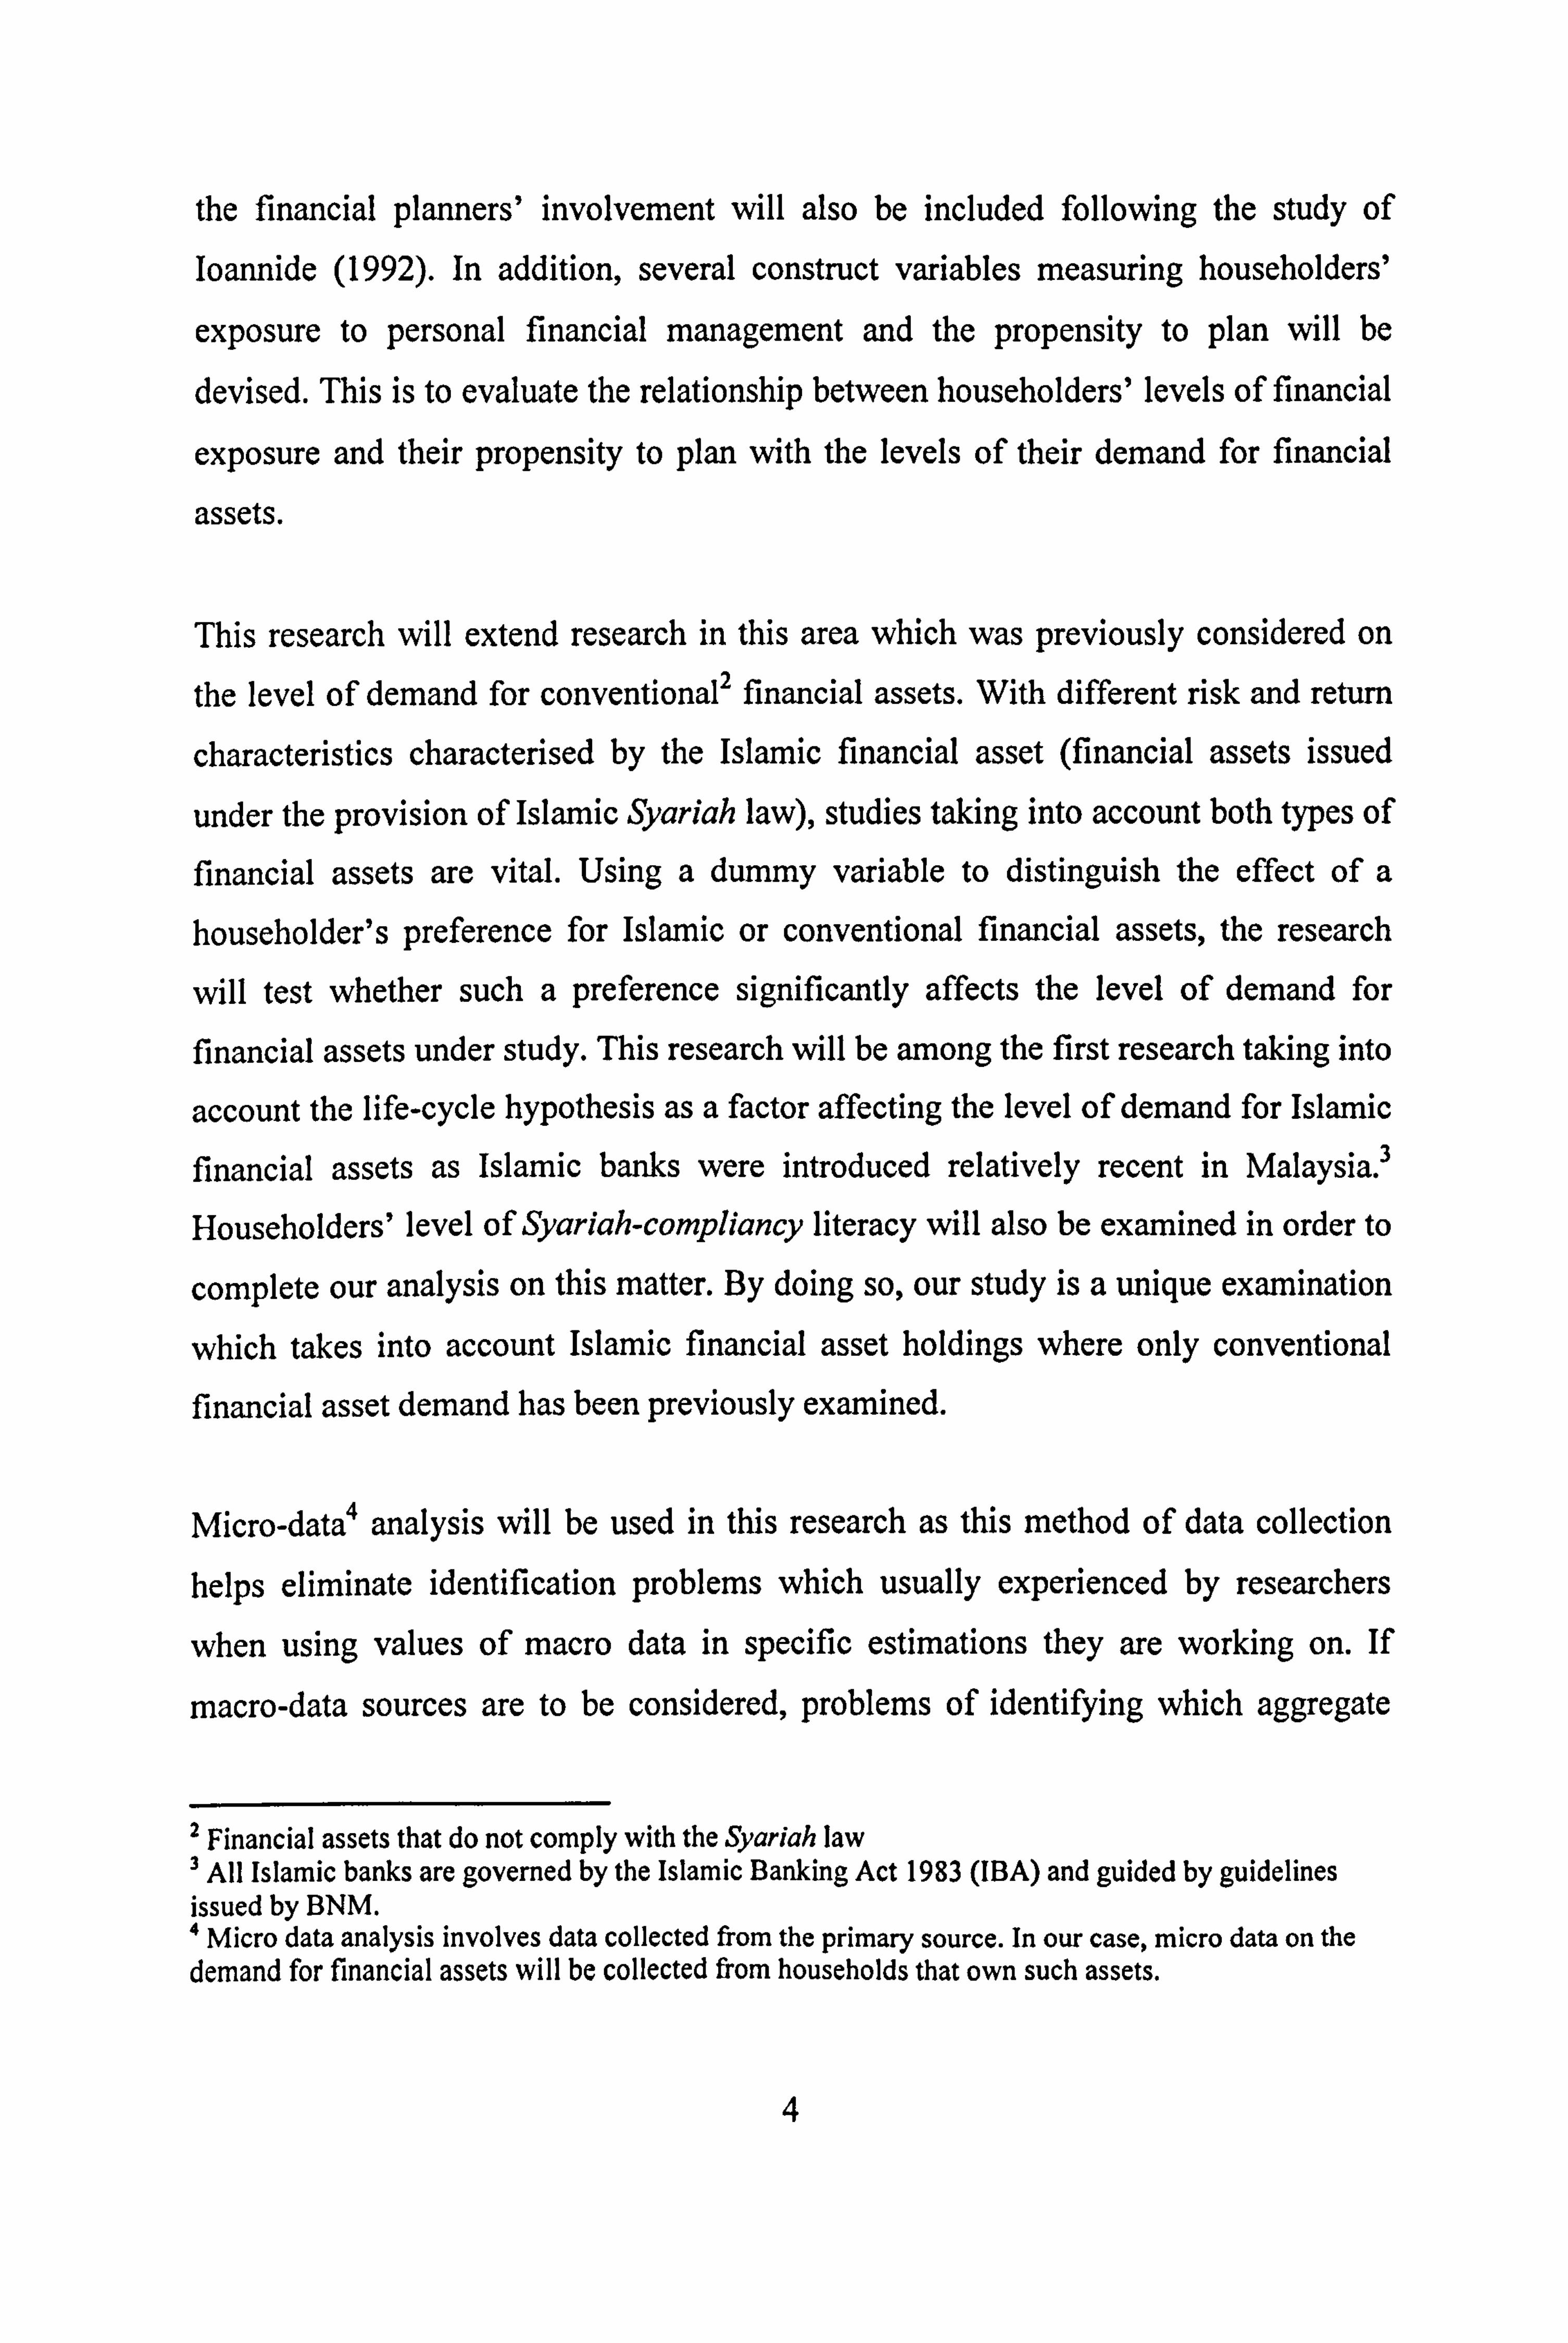
the financial planners' involvement will also be included following the study of Ioannide (1992). In addition, several construct variables measuring householders'
exposure to personal financial management and the propensity to plan will be
devised. This is to evaluate the relationship between householders' levels of financial
exposure and their propensity to plan with the levels of their demand for financial
assets.
This research will extend research in this area which was previously considered on
the level of demand for conventional2 financial assets. With different risk and return
characteristics characterised by the Islamic financial asset (financial assets issued
under the provision of Islamic Syariah law), studies taking into account both types of financial assets are vital. Using a dummy variable to distinguish the effect of a householder's preference for Islamic or conventional financial assets, the research
will test whether such a preference significantly affects the level of demand for
financial assets under study. This research will be among the first research taking into
account the life-cycle hypothesis as a factor affecting the level of demand for Islamic
financial assets as Islamic banks were introduced relatively recent in Malaysia. 3
Householders' level of Syariah-compliancy literacy will also be examined in order to
complete our analysis on this matter. By doing so, our study is a unique examination
which takes into account Islamic financial asset holdings where only conventional financial asset demand has been previously examined.
Micro-data4 analysis will be used in this research as this method of data collection
helps eliminate identification problems which usually experienced by researchers
when using values of macro data in specific estimations they are working on. If
macro-data sources are to be considered, problems of identifying which aggregate
2 Financial assets that do not comply with the Syariah law 3 All Islamic banks are governed by the Islamic Banking Act 1983 (IBA) and guided by guidelines issued by BNM. " Micro data analysis involves data collected from the primary source. In our case, micro data on the demand for financial assets will be collected from households that own such assets.
4

data are best to suite householders' demand for financial assets may occur. Identification of such data is important in order to reflect the correct data to be
assigned to income, wealth, net wealth and the amount of financial assets holding
analysed. To avoid such complication, this study collected its own primary data from
the main sources. This approach, more importantly, will lend originality to the
research in the area and contribute massively to further research.
1.2 Research Aims
The aim of the research is two-fold. The first aim is to identify and analyse sets of factors driving the variation of demand for financial assets. Identification of relevant factors affecting the level of demand for financial assets, thus, is the main aim of this
study. This research will further analyse how identified factors affect the level of demand for financial assets. In other words, the degree of effect of individual factors
can be determined by observing the value of the coefficients of the variables in the
regression model.
The second aim of the research is to examine further the issue of financial planning
and financial knowledge in Malaysian householders. As established by Ameriks et aL (2002), individuals who plan their finances are more likely to have more savings and
wealth compared to individuals who do not. Their findings motivate us to concentrate
more on the characteristics of individuals who plan extensively i. e. by hiring the
service of financial planners. By conducting interview in assembling primary data
with financial planners, other subjects will also be covered. Of concern to this
research will be information on the scope and practices of financial planners, such as
their qualifications, the range of services they offer and their fees. Particular emphasis
will be given to the level of financial knowledge of individuals engaged in financial
planning. Financial planners will be asked to rate their clients' level of financial
5

literacy such as their knowledge on financial products, risk management planning, tax
and retirement planning. The information obtained can then be used to be compared
to data obtained from householders on their level of financial literacy.
1.3 Research Objectives
a) To investigate the effect of economic factors such as income, wealth and net
wealth on the demand for financial assets; b) To ascertain whether a life-cycle effect exists for every types of financial
assets;
c) To investigate whether demographic variables have a significant effect on the
level of demand for financial assets; d) To ascertain whether the preference for conventional assets and Islamic
financial assets and their level of Syariah literacy significantly affects householders demands for financial assets;
e) To ascertain whether the difference in risk tolerance levels significantly affect
the demand for financial asset; f) To investigate whether householders' engagement or abstention significantly
affects the demand for financial assets-,
g) To study the effect of financial exposure experienced by householders on the
level of demand for financial assets; h) To study the effect of householders' propensity to plan on the level of
demand for financial assets; and
i) To examine various issues related to the practice of financial planning in
Malaysia by conducting semi-structured interviews with certified financial
planners.
6

1.4 Research Questions
In line with the first research aim, the following questions were formulated:
(1) What are the factors that affect the level of demand for financial assets?
(2) How do the following factors affect the level of demand for financial assets?
a) Income
b) Wealth
C) Net wealth d) Age of respondents
e) Gender of respondents f) Marital status of respondents
g) Race of respondents h) The level of education of respondents i) Job sector of respondents j) Race of respondents k) Risk tolerance attitude (bonds or stock preference) 1) Certified financial planner engagement
m) Preference to hold Islamic financial assets and conventional financial assets
n) Syariah literacy
0) Financial exposure
P) Propensity to plan (regularity of monitoring of personal financial matters)
7

As for the second aim of the research, semi-structured interviews conducted with
participating financial planners. Financial planners are professionals who advise their
clients on how to create financial goals according to their current financial position
and future expectations and subsequently give advice on financial instruments that
suit their clients' goal. Data obtained from the interviews summarised in suitable
forms of descriptive statistics. Among data to be collected from financial planners are
the characteristics of householders who actively manage their financial portfolios via
engagement with certified financial planners. Data on financial planners' clients such
as their financial position and their financial planning behaviour were also collected.
As financial planners are trained professionals in the area of financial assets demand
and portfolio allocation they lend us good and credible data to work on with.
1.5 Scope of the Research
Any findings of this present study, however, must be observed with cautions due to
limitations emanating from the research procedures used. The research relates to only
the analysis of financial assets demand. Certain emphasis might be placed on the
ownership of real assets such as properties (known as the substitution effect) when
households allocate their portfolios, but in this research we will not be dealing with
them.
The subjects of this study are respondents from a single geographic area in Kuala
Lumpur, the capital city of Malaysia. Although only one geographical area had been
selected, the richness and the quality of diversity of a big capital city offers a
heterogeneous set of responses which includes respondents from householders who
invest in different types of financial assets, i. e. saving accounts, shares and unit trusts,
as well as including respondents from different economic and socio-demographic
backgrounds.
8

Data of high quality often lends credibility to the findings of a research. Using the
questionnaire as a way of data collection may be imprecise to the extent that
householders may not always convey their true feelings. A low response rate is also a
concern in survey research (Fowler 1984; Sekaran 2003). To mitigate the problem,
we encouraged the respondents to answer the questions as accurately as they could by
assuring them of total confidentiality for their answers. To increase the response rate,
one of the data collection methods we adopted was to personally hand out the
questionnaires at the selected research locations so that respondents would be more inclined to fill in the questionnaires.
1.6 Outline of the Thesis Contents
The remaining chapters are organised as follows:
Chapter 2 reviews the literature on the demand for financial assets. The introduction
to the life-cycle hypothesis prediction to the level of demand for financial assets is
provided in the chapter. Selections of important factors that drive the demand for
financial assets are also recognised. Important works on the life-cycle hypothesis
performed by other researchers have been reviewed in this chapter.
Chapter 3 offers an introduction to the demand for various financial assets in
Malaysia. In this chapter, the review of the current state of demand and supply for
demand for financial assets such as transaction accounts, certificate of deposits,
saving bonds, bonds, shares, unit trusts, retirement accounts and life insurance is
provided.
9

Chapter 4 provides a review on financial planning, financial literacy and Islamic
financial planning in Malaysia. In that respect, we will write about the Financial
Planning Association of Malaysia (FPAM) and its functions. A review of the
frameworks and areas in which financial planning operates will also be provided. Finally the chapter will review aspects of financial literacy, financial education and Syariah literacy especially concerning the current development in Malaysia.
Chapter 5 consists of the research methodology including the theoretical framework,
the hypothesis development and model specification for the study. The measurement,
sampling and instrumentations and procedures of the study are also discussed in the
chapter.
Chapter 6 presents the empirical findings and results from the multiple regression
analysis. Descriptive results on important aspects of the data are provided. In
addition, reliability and validity tests as well as diagnostic tests also presented in
addition to the regression analysis.
Chapter 7 is an extension of Chapter 6. It discusses the multiple regression results on
the factors that affect the level of demand for financial assets in Malaysia especially
on the effect of age on such demand.
Chapter 8 relates directly with Chapter 4 that discusses financial planning, financial
literacy and Islamic financial planning in the light of the evidence produced from the
primary data analysis. The chapter mainly reports on the interviews with the financial
planners.
Chapter 9 is the concluding chapter. It provides the summary of the findings of this
research. In addition, how the findings from this study may contribute to the body of knowledge and other parties such as policy makers and the financial institutions that
10

offer financial products is discussed. Research limitations are also discussed with
suggestions for better research in the area which could be conducted in the future.
11

CHAPTER2
THE LIFE-CYCLE HYPOTHESIS AND DEMAND FOR FINANCIAL ASSETS: A SURVEY
2.1 Introduction
Householders save either for precautionary purposes or to prepare themselves for
retirement. Precautionary savings are usually triggered by labour income uncertainty faced by householders during their working periods. Savings for retirement, on the
other hand, will result in income smoothing during the lifetime. In other words, householders will allocate portions of their current income to be used in the future
when their income drops significantly, in order to have steady income inflow to retain
their standard lifestyle. The income smoothing behaviour among householders is a
result of the phenomenon of the life-cycle effect upon savings and wealth
accumulation.
One of the most prominent frameworks for savings and wealth accumulation was developed by Modigliani and Brumberg (1954). It states that householders
accumulate and decumulate their level of wealth in accordance to their age.
According to them, the amount of savings and wealth accumulated is insignificant
during the youth age before continuing to grow to a middle age peaking as they near
retirement. After retirement, the phase of decumulation will begin in which householders convert their capital into income flow to be used to maintain the
lifestyle that they used to have before retirement.
Among the factors that affect the amount of accumulated wealth is the portfolio
allocation, i. e. how householders manage their portfolio to give the highest returns at
their assumed level of tolerable risk. Bertaut and Mc-Cluer (2000) state that studies
on portfolio allocation are important at the national and individual level for various
12

reasons. Firstly, savings and portfolio allocation is important because the way householders allocate their funds will affect the adequacy as well as the distribution
of their retirement income. Another is that returns generated from various types of investment are different, so that they will have a different effect on the pace of wealth
accumulation. At the national level, householders' spending and saving may inspire
the tax policy formulation. Portfolio decisions also give an indication of the effect of
macro economic variables on householders' spending and saving. At the theoretical
level, portfolio decision studies provide deeper insight into theories of consumption
and saving behaviour.
The empirical literature on portfolio allocation has sought to find observable variables that explain the cross sectional differences in the portfolio allocation behaviour. Early
literature was based on static models which suggested that individuals choose their
portfolio to maximise expected utility and the risk-return pattern of available assets as in Tobin (1958) and Mossin (1969). Similar studies were later extended arriving at the development of dynamic models for wealth allocation which aim to maximise
expected lifetime utility as compared to the previous approach of maximising single
period utility. Among factors related to the maximization of lifetime expected utility
are human capital uncertainty (Heaton and Lucas, 1997), labour income flexibility
(Bodie, Merton and Samuelson, 1992), an uncertain lifetime horizon (Foldes, 2000)
and the role of incomplete portfolios (King and Leape, 1998). With the establishment
of the dynamic models for wealth accumulation, the process of portfolio allocation
and wealth accumulation will be continuously changing in response to householders'
condition which may be due to demographic, socio-economic or purely economic factors.
In the wealth accumulation studies, researchers consider only the total effect of the
wealth accumulation process aiming to maximise wealth at the end of the investment
period. In contrast, portfolio allocation studies provide answers to the problem of
choosing an efficient set of investment strategies in order to generate maximum
13
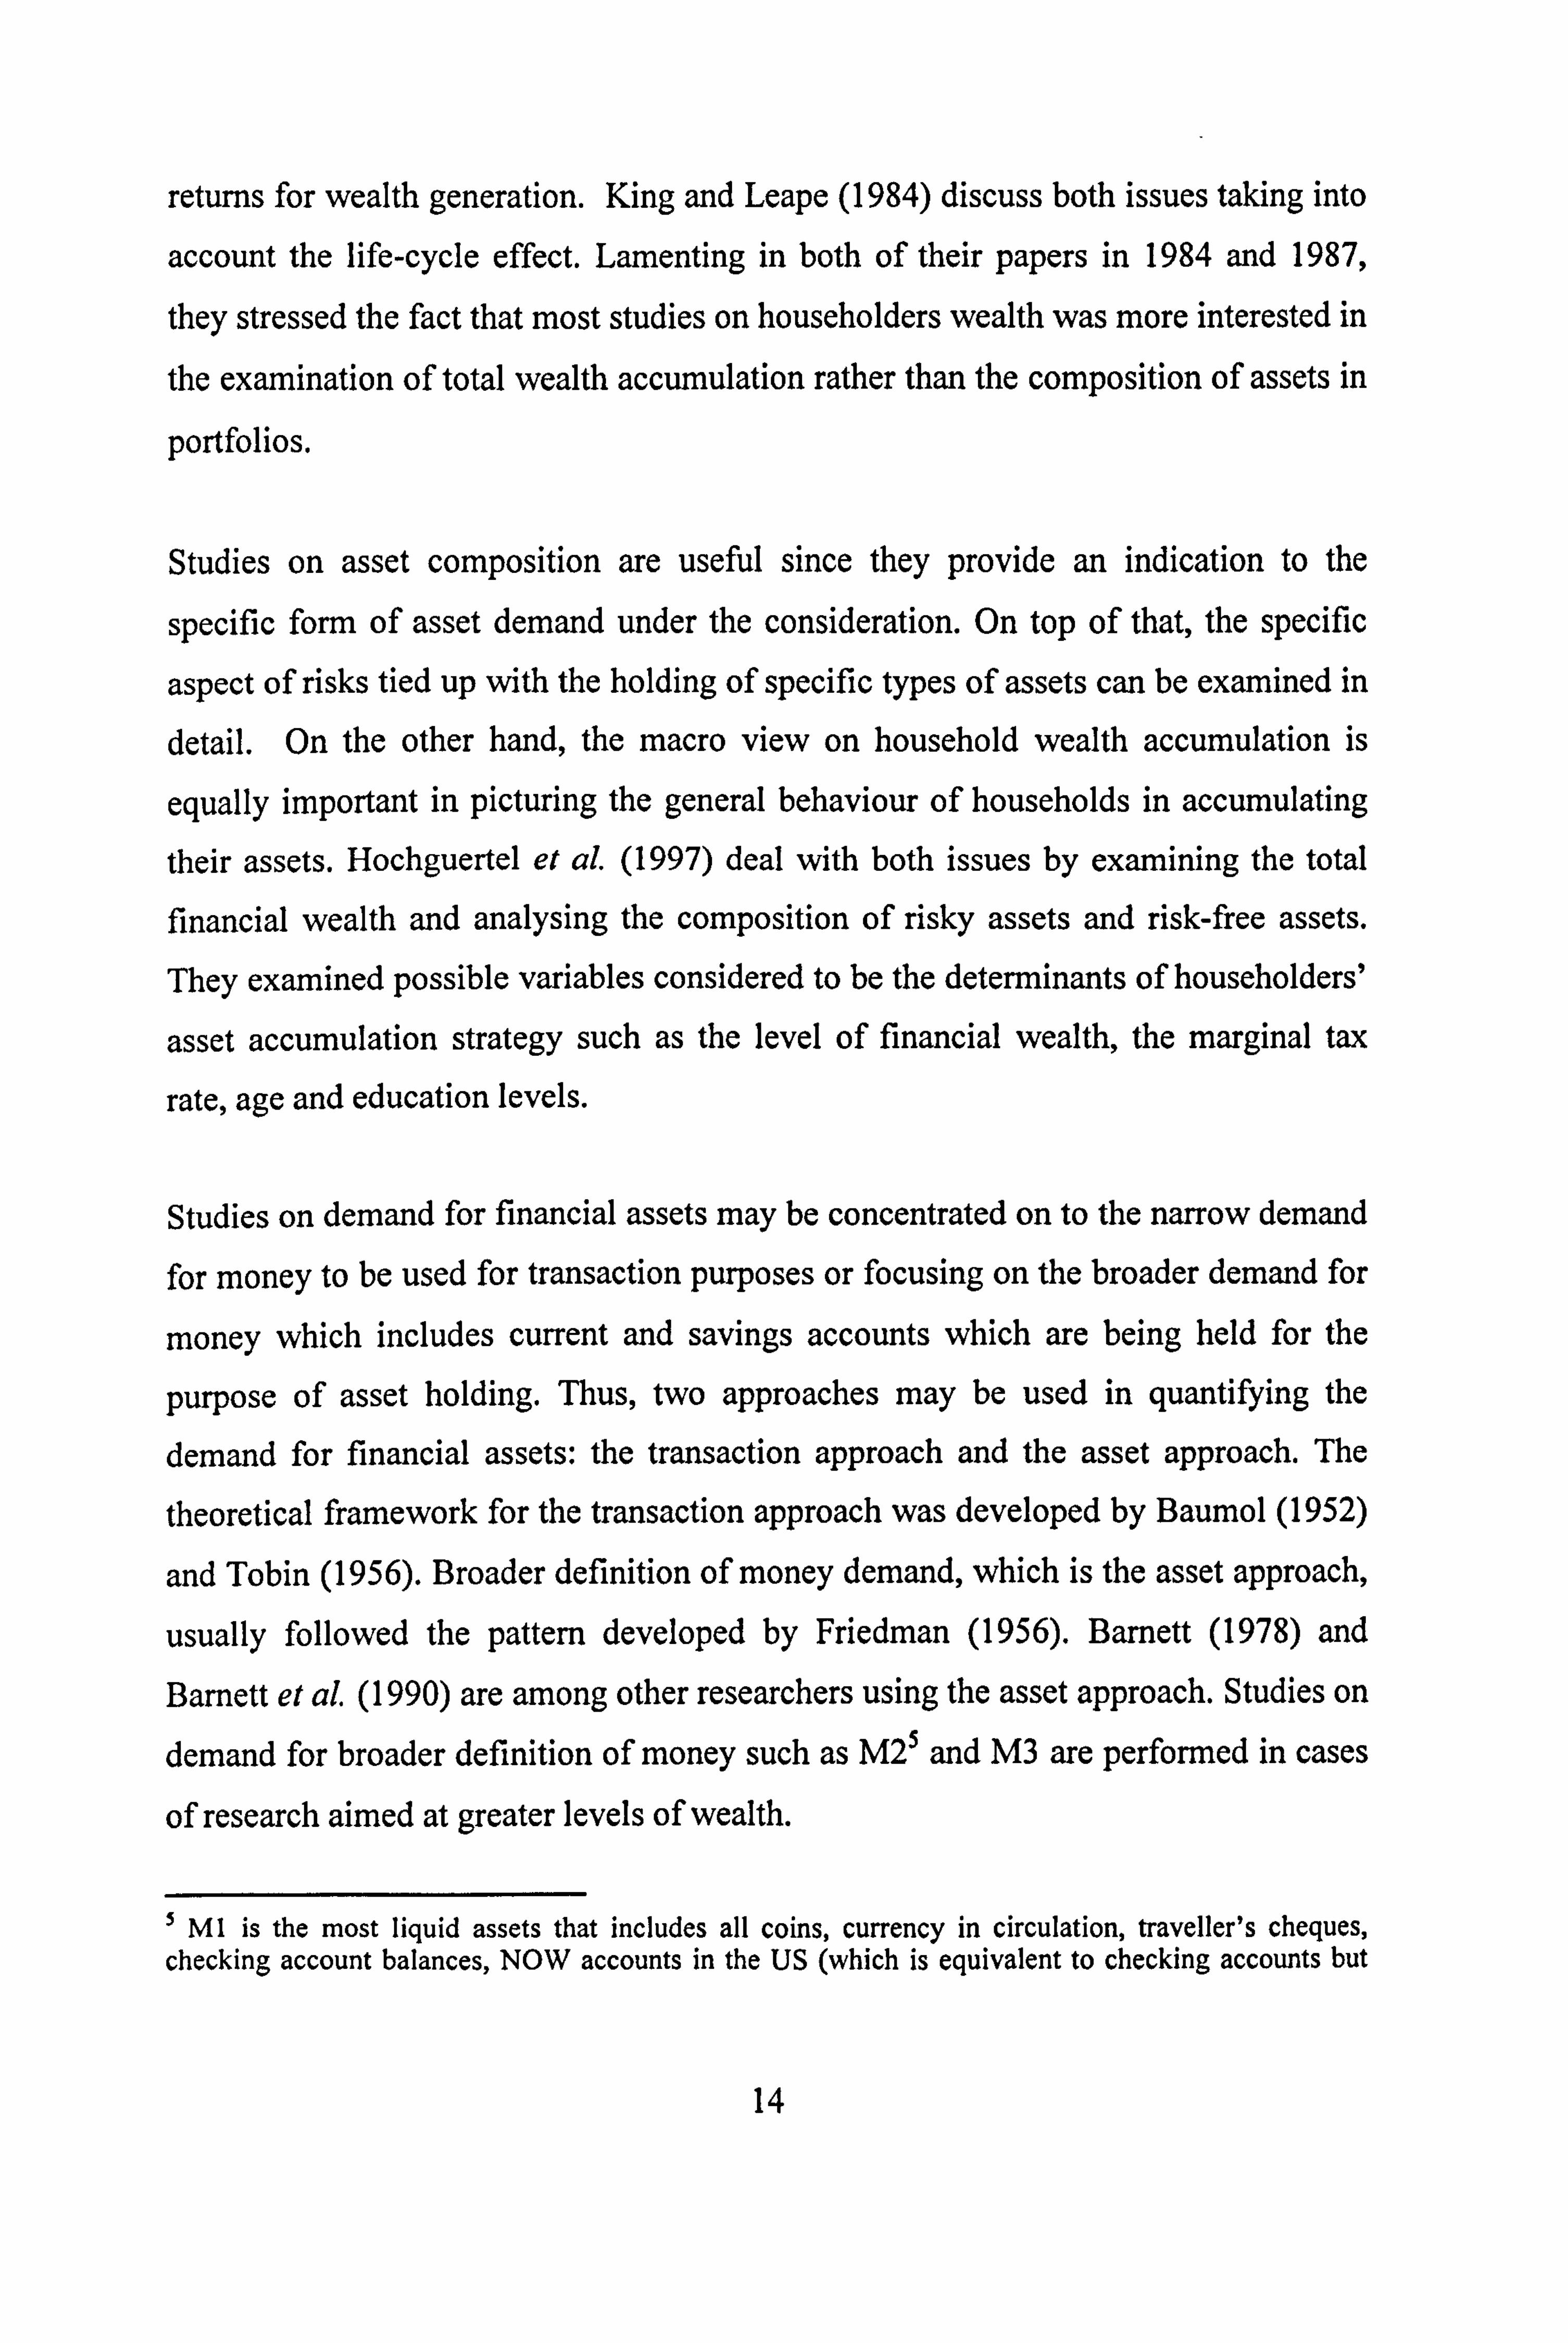
returns for wealth generation. King and Leape (1984) discuss both issues taking into
account the life-cycle effect. Lamenting in both of their papers in 1984 and 1987,
they stressed the fact that most studies on householders wealth was more interested in
the examination of total wealth accumulation rather than the composition of assets in
portfolios.
Studies on asset composition are useful since they provide an indication to the
specific form of asset demand under the consideration. On top of that, the specific
aspect of risks tied up with the holding of specific types of assets can be examined in
detail. On the other hand, the macro view on household wealth accumulation is
equally important in picturing the general behaviour of households in accumulating
their assets. Hochguertel et aL (1997) deal with both issues by examining the total
financial wealth and analysing the composition of risky assets and risk-free assets.
They examined possible variables considered to be the determinants of householders'
asset accumulation strategy such as the level of financial wealth, the marginal tax
rate, age and education levels.
Studies on demand for financial assets may be concentrated on to the narrow demand
for money to be used for transaction purposes or focusing on the broader demand for
money which includes current and savings accounts which are being held for the
purpose of asset holding. Thus, two approaches may be used in quantifying the
demand for financial assets: the transaction approach and the asset approach. The
theoretical framework for the transaction approach was developed by Baumol (1952)
and Tobin (1956). Broader definition of money demand, which is the asset approach,
usually followed the pattern developed by Friedman (1956). Barnett (1978) and
Barnett et aL (1990) are among other researchers using the asset approach. Studies on
demand for broader definition of money such as M25 and M3 are performed in cases
of research aimed at greater levels of wealth.
5 MI is the most liquid assets that includes all coins, currency in circulation, traveller's cheques, checking account balances, NOW accounts in the US (which is equivalent to checking accounts but
14

On both areas of study on demand for narrow and broad money, a small number of
studies were conducted in the past at the level of the individual or householders. This
poses problems since the macro data tend to inherit an identification problem. Usually generalisation cannot be made using macro-data since householders are heterogeneous in their expectation of return and risk both of which can affect their
portfolio allocation. In the area of study for narrow demand of money, Barnet (1997),
Cuthbertson (1997) and Mizen (1997) had called for micro foundations of aggregate
money demand to be closely examined at the micro environment level in order for
such studies not to inherit the problem of aggregate money demand. Gorman (1953)
showed that the difficulty in this assumption is that it is quite restrictive and requires the marginal propensity to save to be constant across all individuals, regardless of differences in their socio-economic characteristics.
Taking into consideration the above scenarios, this study aims to provide a useful
reference point for the demand for financial assets by Malaysian householders. It
provides an examination of the allocation process made by these householders in
relation to the demand for financial assets. Besides collecting the data on the amount
of householders' holdings of various types of financial assets, this research at the
same time collect the data pertaining to householders' demographic, socio-economic
and economic background. This will allow us to examine for possible factors driving
householders demand for financial assets. Further analysis of the effect of the life-
cycle effect on the demand for various types of financial assets is conducted by
segregating householders into several distinctive age groups.
carries interests on the balance), automatic transfer service accounts, and balances in credit unions. M2 consists of MI and savings, small time deposits, overnight repos at commercial banks and non- institutional money market accounts. M2 is a key economic indicator forecasting inflation in an economy. In addition, M3 is M2 plus large time deposits, repos of maturity greater than one day at commercial banks and institutional money market accounts.
15

This study employ the asset approach of demand for financial assets in order to be
able to reflect the broader demand for financial assets in the wealth accumulation
process. Micro-data from a questionnaires survey will be used to eliminate the
identification problem as discussed above. Further than that, following the rapid
development of Islamic financial institutions such as Islamic banks, takaful and
Islamic unit trust companies, we are interested to examine whether households are holding less, the same or more of Islamic financial assets offered by these institutions
in contrast to their conventional counterparts.
2.2 Savings and Wealth Accumulation
According to permanent income hypothesis, individuals need to maintain their
current consumption pattern during their retirement. This requires them to save a
proportion of their current income as savings. The hypothesis suggests that
individuals are used to their current level of consumption and will try to smooth their
pattern of consumption over their life-cycle. Thus, the wealth accumulation pace will be inverse U-shaped as younger individuals use a large amount of their income to
finance repayment of their education, housing consumption and other costs to settle
down. This then leaves them with the need to make up for lost time when they are in
their midlife. The highest point of savings or wealth accumulation takes place most likely among individuals' in their forties and fifties. Later individuals will use their
stock of accumulated wealth during retirement years to maintain the lifestyle they
were used to during their working years.
There are various ways that may be used by individuals in order to accumulate
wealth. Examples are to engage in investment activities such as investing in shares, bonds, unit trusts and investment linked insurance units. Current income may be used
to finance these activities although credits are possible alternatives. Another source of finance is existing savings in the hands of individuals. With limited income and
16

constraints on borrowings, savings are the most promising source of finance to
accumulate wealth.
2.2.1 Theories of savings
Savings literature for wealth accumulation consists of two major competing
propositions. One reason to save is for retirement or the life-cycle motive. The other is to protect consumption against unexpected shocks caused by income uncertainty. These savings are usually referred as to the precautionary savings.
Savings inspired by the life-cycle motive are based on the practice of individuals to
maximise their consumption lifetime utility rather than at any specific time period. Due to lifetime maximisation, a rational consumer will consume at a stable rate that
corresponds to their expected average consumption over their life-cycle. This will
result in an inverse U-shaped pattern of saving and wealth accumulation process
which peaks when individuals are in their middle age. The rationale is that younger individuals are likely to face other high financial commitments such as house
purchase and education loan payback. Thus they will save less or even engage in
borrowing activities. Individuals of retirement age, on the other hand will start to
consume their savings and wealth accumulated due to significant reduction in their
income, since they are no longer in full-time employment. In order to match their
former average consumption levels, they have to maximise their saving and wealth during their midlives. This concept is closely related to the hypothesis of habit
formation or permanent income hypothesis which was long ago proposed by
Duesenberry (1949).
The thinking which believed that life-cycle or age exert a large impact on individuals'
savings and wealth accumulation behaviour offered a promising explanation for
savings to be as low during individuals' early lives as during their retirement years. Bodie et aL (1992) proposed that the labour supply flexibility experienced by young
17

individuals induces them to save less or even borrow money. Young individuals also face higher prospects of growing their income compared to older people, although it
may be argued that income levels are not certain. The information hypothesis
proposed by King and Leape (1987), in another but related argument, proposed that
demand for financial assets is maximised during mid-working life due to the
information factor. Information seeking activities take some time so that individuals
in the middle period of life are more likely to be confident to invest compared to their
younger counterparts.
Saving and wealth accumulation, on the other hand, may be inspired by the motive of
precaution. One major and influencing work was by Carroll and Samwick (1992),
which is on the importance of the motive of precaution in savings. They found that
wealth is higher for individuals who are experiencing higher income uncertainty than
those who are not. The precautionary effect introduced by the uncertainty of labour
income in their view will significantly motivate wealth accumulation. Caballero
(1991) is more convinced in his believe that the precautionary savings motive due to
labour income uncertainty alone is responsible for more than 60% of the observed net US total stock of wealth. He argues that his prediction is robust in the presence of lifetime uncertainty regardless of whether annuity markets exist or not. He attempted
to isolate the savings produced by precautionary reasons due to labour income
uncertainty as the insurance for labour income uncertainty is often limited or does not
exist (Cagetti, 2003). This is due to a high coefficient of risk aversion and human
wealth uncertainty and lifetime uncertainty which is associated with labour income
uncertainty. Lifetime uncertainty, in addition, may possibly enhance the effect of
savings inspired by precautionary motives over those inspired by the certainty of
permanent employment. Caballero (1991) successfully proved that wealth originating from precautionary motives due to uncertain labour income accounts for more than
60% of the observed US net wealth. His results do not conflict with Skinner's (1988)
study that stated that 56% of life-cycle wealth accumulation is due to this
precautionary motive.
18

Mixed results were found in the work of Cagetti (2003). The precautionary motive of
savings was found to be significant during the early working lives of individuals who
were concerned about their life in retirement. In addition, he found that wealth
created at retirement implied by the model of precautionary savings (with uncertain labour income) is twice as high as that implied by the pure life-cycle model without
uncertainty.
In relation to theories of savings, this study examines the effect of the life-cycle or the
age effect towards a savings and wealth accumulation strategy adopted by
individuals. This is to prove or reject the 'folk's wisdom' which has been a famous
strategy of asset allocation suggested by independent financial advisors in the
industry. 6 According to majority opinions of financial planners, householders should invest in less risky assets if they are mature householders while they should be
investing in more risky assets if they are young householders.
2.2.2 Determinants of Savings
Householders save for reasons such as for precaution, liquidity, consumption and in
preparation towards retirement which is the heart of the life-cycle hypothesis. At the
regional level, Suruga and Tachibanaki (1991) tested various theories of savings on
the data set of Japanese householders. Among other theories included in their studies is the life-cycle hypothesis and permanent income hypothesis. Their primary model
was designed to measure variables possibly affecting Japanese saving. Particular
interest was concentrated on variables such as the number of family members, age of householders head, profession, home ownership status, size of residential area and income. Variables listed were derived from various theories of savings. They looked
at the age of householders' head of the family as dealt with in the life-cycle saving
6 See Jaganathan and Kocherlakota (1996) for the complete argument.
19

hypothesis and the effect of peoples professions as related to the permanent income
hypothesis. Their examination take into consideration the effect of bonus payments in
different professions involving both employees and self-employed.
Suruga and Tachibanaki (1991) used different models on savings so that they
increased the chance of finding the significant determinants for savings in developing
Asian countries. For example, income was decomposed into various sources namely
labour income, property income and transfers which could be possible determinants
of savings. Examination on these sources of income can enlighten possible determinants of savings so that we may be able to learn which income sources are
more important than others. For example, if labour income is the most significant
factor in generating personal savings, any disruptions or uncertainties associated with labour income will significantly alters the level of savings.
To illustrate the determinants for savings, Table 2.1 depicts various reasons for
savings given by the participants in the Survey of Consumer Finance by families in
the U. S. It can be observed from the table that the major reasons stated by the
respondents are retirement and liquidity, which also means precaution.
Table ZI: Reasons Given by Respondents as Most Important for Their Families'
Rnvina Dktrihnted hv the Tvne of Reason 0 Reasons (Percentage) 1992 1995 1998 2001
_ Education 9.1 10.8 11.0 10.9 _ For the family 2.6 2.7 4.1 5.1 _ Buying own home 4.0 5.1 4.4 4.2 _ Purchases 9.7 12.8 9.7 9.5 _ Retirement 19.4 23.7 33.0 32.1 - liquidity 33.9 33.0 29.8 31.2 Investments 7.6 4.2 2.0 1.0 No particular reason 1.7 0.8 1.3 1.1 When asked for a reason, reported do not save
12.0 6.8 4.9 4.9
Total 100 100 100 100 Source: "Kecent changes in us i-amny rinances: tviaence troin tne zuut ana zUU4 burvey oi Consumer Finances", Bucks, Kennickell and Moore, Federal Reserve Bulletin, 2006.
20

2.2.3 The Life-Cycle Hypothesis as a Model for Savings and Wealth
Accumulation
The concept of life-cycle savings and wealth accumulation was introduced by
Modigliani and Brumberg (1954). It suggests that the propensity to consume and the
propensity to save are different at various stages of individuals' live. In the
Modigliani and Brumberg's model, the exclusive motive for saving and wealth
accumulation is to provide sufficient resources for retirement (Wolff, 1979). Figure
2.1 illustrates the Modigliani and Brumberg model and Tobin's model (1967) which, in contrast, suggests that an individual's net worth begins at zero level then starts to
decrease to a negative level due to many commitments during young age. After that
net worth increases along with age and reduces at a certain point of time, usually during retirement age. In comparison to Modigliani and Brumberg, Tobin suggests
the possibility of householders incurring debt in their early working life due to study loan repayments, house purchase and other durables. The later model reflects reality
more, since it considers the possibility of debt occurrence among households in their
early employment period.
21

Life-Cycle Wealth Profiles I
Modigliani and Brumberg (1954)
I Age I
Ar
Tobin Model (1967)
Figure ZI: Modigliani and Brumberg's (1954) and Tobin's (1967) Models of Life
Cycle Hypothesis
Source: Wolff, Edward N. (1994)
Figure 2.1 demonstrates that householders net worth increases as their age increases
and reduces steadily after retirement. This is due to the fact that householders
consume their stock of wealth after retirement in order to maintain the lifestyle
adopted during their working period. The total level of net worth is considered in the
model and includes wealth held in the form of real and financial assets after
consideration of all financial obligations has been made.
Poterba and Samwick (1997) highlighted the point that neither model explains the
notion of portfolio allocation though they explained the total wealth holdings of
individuals. In other words, Poterba and Samwick's model does not contain any
indication on how householders allocate their assets or decide on the proportions of
their risk and risk-free assets. To be able to explain the pattern of wealth
accumulation is important because a householders' choice of asset holding
contributes to the amount of accumulated assets that had can be prepared for
22

retirement. The choice of assets held steers the rate of returns generated by the householders' investment fund. Both the Modigliani and Brumberg (1954) and the Tobin (1967) model fail to explain the distinctive characteristics of the different types
of assets: real and financial, and the differences in the degree of liquidity and rate of
returns among the various financial assets.
Due to the failure of the general life-cycle models to explain the portfolio allocation issue, Poterba and Samwick (1997) embarked on a study that provides foresight on how households may actually allocate their portfolio. Results of their study show that
the older householders prefer to have liquid assets for them to realise for consumption
purpose. Investment in real estate and business equity among these older householders reduces for the same reason. But the reduction in real asset ownership does not apply to owner occupied housing due to the fact that householders do not
actually sell them to finance the retirement. The findings are as follows (Poterba and Samwick, 1997: 24):
"One question that our results address is the degree to which the standard life cycle ftamework of asset accumulation can be applied to different
components of wealth. The life cycle model posits a hump-shaped pattern
ofasset accumulation as householders age; they accumulate assets during
their working years and spend down those assets during their retirement
years. Our results suggest that the hump- shaped pattern is not uniform
across all assets. For example, as a percentage of total assets, financial
assets show just the opposite pattern; they decline as householders age,
and then begin to increase at advanced ages. Investment in real estate and
equity. in privately-held businesses do display a hump-shaped pattern, as in the life-cycle model, but owner occupied housing does not, since there
is no evident infinancial asset ownership at older ages ".
23

Thus, the notion of an inverse U-shaped wealth accumulation pattern among households cannot be generalised to all types of assets; real and financial and among financial assets themselves. This is due to the degree of liquidity as well as the risk
and returns characteristics. The reverse pattern of real and financial assets'
ownership is evidenced in their studies. Hence, a study taking into account the
ownership of real and financial assets is important in order to understand the portfolio
allocation behaviour of householders; whether people switch to hold real assets as
against financial assets when they age or vice versa. Furthermore, other than
studying rates of ownership for financial assets (percentage of financial asset holding
to total assets), the amount of ownership of every financial asset has to be taken into
account. Alessie et aL (2000) carried out such studies to consider rates of ownership
as well the amount of different types of financial assets in Netherlands.
Various other authors write about life-cycle effects on the behaviour of householders
during wealth accumulation. More specifically, they write about how householders
allocate their wealth by investing in specific type of assets. Veceira (1999) writes on
optimal portfolio choice for long horizon investors concentrating on the non-tradable labour income as the source of funding. Bodie et aL (1992) collectively analyse the
effect of life-cycle demand for financial assets concentrating on the effect of labour
supply flexibility. Jan Tin's two-volume study (year 1998 and 2000) concentrates
exclusively on the demand for financial assets according to the life-cycle hypothesis
and the propensity to save of householders. The latter study adopts Friedman's
theory on several factors that affect households' propensity to save, which in turn
tests for the possibility of a life-cycle effect on the demand for financial assets. In
addition, King and Leape's (1987) paper is useful for further examination on householders asset allocation over the life-cycle if any researcher would like to
further examine the role of information in the life-cycle hypothesis. For further
investigation of demand of financial assets over the life-cycle, the constraint on housing consumption is worthwhile considering. Nevertheless, this issue was discussed thoroughly in the paper of Flavin and Yamashita (1998).
24

As noted earlier, Poterba and Sarnwick (1997) specifically examined the effect of householders' portfolio allocation over the life-cycle. As portfolio allocation directly
affects householders' wealth during retirement, it affects their general level of wealth
and the amount of liquid assets that they hold. Poterba and Samwick studied the increasing discretion in the hands of householders in managing their own portfolio holding. The fact enhances the importance of householders making effective choices in their portfolios. They focused both on the probability that households at different
times in their lives allocate their wealth to specific types of assets and in varying
proportions. Their study establishes the point that the life-cycle effect upon householders cannot be generalised for every type of assets. That is every financial
asset has its own pattern of increasing and later decreasing as householders age. For
example, there is some decline in the reliance on traditional bank accounts and
certificates of deposit with age. `fhe notions that older householders are simply
reluctant to invest in risky financial assets is not particularly true. In a nutshell, every financial asset has its own pattern of accumulation and decumulation as householders' ages change. Another point the authors make is that the standard life-
cycle model stating that individual wealth accumulation poses a hump-shaped pattern
to the right is not true for the holding of financial assets.
The prediction of the traditional model states that the wealth level of householders
peaks at middle age and start to decrease in older age for both financial and non- financial assets. Whilst the Poterba and Samwick model makes a distinction between
both types of assets and found that the standard pattern does not hold for financial
asset holding, they did find , on the other hand that the financial asset holding pattern
takes the reverse pattern of the standard life-cycle model. That is, the holding of financial assets is higher for younger householders, reduces during the middle age
and increases again at older age. This is because financial asset holding is simply the
complement to holding non-financial assets. At younger ages, householders held
more financial assets where real assets were too costly to be considered. As time goes
25

by, householders have enough funds to purchase a house and tend to hold fewer
financial assets. On the other hand, older householders tend to hold more financial
assets since these types of assets are able to meet their objectives of liquidity in their
old age. They particularly need liquid assets to replace their former labour income
flow to spend on their current consumption as well as to pay for health related
expenses which may be significantly costly.
In addition, Tin (1998) and Bodie et al. (1992) have offered various factors to explain
the relationship between age and asset allocation decisions. These are mostly
concerned with the demand for financial assets. Bodie et al., for example proposed
that the age related differences in the demand for financial assets were linked to the
flexibility of the labour supply of households. According to them, young householders, who have more flexibility in adjusting their labour supply compared to
older householders, hold more risky assets. This fact induces the life-cycle pattern on
their demand for financial assets.
Further analysis of the life-cycle effect has been done by authors such as Flavin and Yamashita (1998) and Bruechner (1997). They were using the mean-efficient
portfolio framework in their studies on financial assets and the constraint involved in
owner-occupied housing demand. Flavin and Yamashita (1998) showed great insight
in proving that the level of risk tolerance and attitude towards risk and returns
consideration is the same among both young and older investors when consideration
of owner-occupied housing demand was taken into account. Every rational investor is
ex-ante identical in their pattern of demand for financial assets so the life-cycle effect
actually enters the demand pattern for financial assets through the housing constraint.
So the policy makers then have to be sensitive to changes in the housing market while
at the same time be sensitive to changes in economic and demographic situations of householders is they were to promote the growth of financial asset holdings among householders.
26

This section referred to various studies dedicated to examining wealth accumulation
and allocation among householders. This study is concerned with various factors
affecting the holding of financial assets which might help us to predict factors related
to our case. By examining the studies, this study became an informed research with
the awareness of various factors which affect demand for financial assets.
2.3 Factors Affecting the Demand for Financial Assets
Various studies have been conducted predicting factors affecting the demand for asset holding. Among other variables rated important are economic factors such as income
and wealth and several demographic and socio-economic factors such as age and
education levels. More advanced research takes into account house, real estate and
pension wealth as conditional factors affecting the demand for financial assets on top
of the standard economic, demographic and socio-demographic factors. Other issues
such as the health status of householders also have been considered.
2.3.1 Economic Factors
Economic variables are the major variables in the study of asset allocation and the
demand for financial assets. Three major economic variables are current income of householders whether in form of labour income or business income, the level of
wealth, in the form of real and financial assets, and the level of net wealth, which can be defined as the difference between total assets and total liabilities.
It should be noted that expected financial wealth increases with income. It is a major determinant of consumption and the demand for real or financial assets. The income
factor has been examined in a specific manner by the introduction of human capital
and labour income theory by authors such as Bodie et aL (1992) and Heaton and Lucas (1997).
27

Beside the income generated during the employment period, existing wealth level is a
valid factor for asset demand. Existing wealth after considering total liability held
may generate demand for assets holding. One of the important research objectives of
King and Leape's 1984 paper on wealth portfolio and portfolio composition was to
measure how wealth's elasticity of demand may affect the demand for a range of
assets and liabilities. Their studies which used the micro-data from householders to
study the subject on various assets and liabilities were desirable due to the lack of
research on the demand for assets other than money demand.
In relation to wealth, Wolff (1979) also used micro data in conducting an interesting
study to examine the validity of the classical model for savings and wealth
accumulation of Modigliani and Brumberg (1954) and Tobin (1967). The classical
model states that householders start with an insignificant level of wealth and
accumulate it during their life time before starting to spend their holdings in the later
period of their lives. He found that the model cannot be generalised neither to wealthy
groups of householders which he considered to be the capitalist group nor to the
6second class labour', i. e. the very poor who do not accumulate assets except in the
form of durables. The model is only valid for middle-income class householders who
usually begin with zero or insignificant wealth and accumulate it in the course of their
employment period and decumulate it in retirements. The reason for the very rich
group of householders does not follows the classical model is due to the insignificant
effect of labour income in comparison to their existing wealth acquired through
inheritance, gifts and other sources.
Hochguertel et aL (1997) examined the total wealth of householders in Netherlands.
They categorised their choice of financial assets into risk and risk-free assets, life
insurance contracts and primary residence ownership. They found that 8% held none
of these assets above and 30% held assets in one category. 34% and 25% of them
held assets in two or three categories respectively. Only 3% held assets in all four
28

categories. In the same study, they investigated possible determinants for 'the
portfolio structure of the respective households. The portfolio structure they
examined was the choice of holding risk and/or risk-free assets. Risky assets included
were shares in domestic and foreign companies, mutual funds, options, bonds and
mortgage bonds while risk-free assets were used savings accounts including balances
in time deposit accounts, saving certificates and certificates of deposit. They proposed
variables such as levels of financial wealth, marginal tax rates, age and education levels as possible determinants. They found that the levels of financial wealth and the
marginal tax rates are major determinants for the choice of risk and risk-free assets holdings for the 3,704 households under their study. Practically this means that more
of higher income individuals prefer risk to risk-free assets. This is due to the fact that
they face higher level of marginal taxes. Their study however, does not take into
account one major component of financial assets common to the majority of householders which is retirement accounts that always form a significant portion of their total financial wealth. For example, in the case of US householders, 52.2%
held retirement accounts. This had been revealed in the 2001 Survey of Consumer
Finances. Non-inclusion of this type of financial assets might compromise their
results. However, other types of financial assets typically held by householders
figured in the framework.
Net wealth, on the other hand, may be defined as the difference between total wealth
and total liabilities. In the classical model for savings and wealth accumulation developed by Modigliani and Brumberg (1954) net worth was considered as the
reference point for the two subjects. This variable is a more powerful tool for
examining asset accumulation and allocation among householders because it reflects
the actual ability of householders to dispose resources in investment ventures because
it takes into account their obligation toward all types of liabilities such as collateral
and non-collateral liability. Net worth, hence, is a better measure than labour income
and wealth in projecting the ability of demand for the financial assets of householders.
29

2.3.2 Demographic Factors
Demographic variables are other important variables in determining the level of demand for financial assets. Keynes' (1936) concept of marginal propensity to save
and Friedman's (1956) theory of asset demand had placed a major concentration on
the effect of demographic factors in their framework. Keynes in his general theory on
employment, interest and money stated that the marginal propensity to save and
consume is influenced by a set of subjective and objective factors, and the degree to
which both sets of factors affect householders are different with divergent socio-
economic conditions. The objective quality includes sets of economic variables such
as income and wealth discussed above. As for the socio-economic variables, sets of demographic variables may be studied to quantify their effect towards behaviour on
savings as well as the demand for financial assets.
Tin (2000) considered the insights of Keynes (1936), which concentrated on both
objective and subjective factors affecting his concept of marginal propensity to save in order to examine whether changes in socio-economic conditions have a significant impact on the demand for financial assets under his analysis. The set of subjective
motives identified by Keynes includes motives of precaution, foresight, calculation, improvement, independence, enterprise, pride and avarice (Keynes, 1936: 107-109).
Studies examining the effect of demographic variables were conducted in another
related subject to savings which is the consumption level. This study was well documented in Hall and Mishkin (1982), Zeldes (1989), and Lusardi (1996) among
others. However they concentrated less on studying the effect of demographic
variables on the levels of savings, asset allocation and demand for assets by
householders.
30

Tin (2000) suggests that since the equilibrium demand for a financial asset is a function of income or wealth (which influenced by the demographic condition of an individual), changes in the demographic variables would also affect the demand for
financial assets. The study on the effect of changes in demographic variables on
income and wealth has long been established by of Keynes (1936). Tin in his 2000's
paper attempted to bridge Keynes' theory on the effect of subjective demographic
factors on income and wealth and a predicted life-cycle hypothesis, which states that
the demand for financial assets is significantly affected by the age factor. His attempt
disclosed that the demand for financial assets is not only related to wealth and the
discount factor but also related to demographic variables in which householders find
themselves. This is in line with the prediction on the theory of savings suggested by
Keynes (1936) that demographic variables enjoy a joint role with other objective factors.
Tin's (2000) study included factors such as age, the number of children, education
levels, marital status, gender, and race as demographic variables to be tested as
factors which could influence the level of asset demand. His results revealed that the
demand for financial assets increases with age and decreases with increasing numbers
of children. As for the levels of education, the coefficient is not always positive for
every type of assets under analysis. Some assets meet with lower demands by
educated people. As for marriage status, the negative coefficient to the level of
demand for most types of assets may be linked to the number of children people have.
Married couples having children will have disposable assets to invest due to
significant expenses involved with their children. It goes the same for the sex status
of householders. Men demand more of certain types of assets than women. Thus, as
far as the results for the levels of education and sex status are concerned, a
generalisation cannot be made on the level of demand for financial assets as they may
have positive or negative coefficient for different types of assets.
31

Barber and Odean (200 1) and Lott and Kenny (1999), on the other hand, found that
men and women have different attitudes towards risk. Reasons for the different types
of asset holding for both sexes may be explained by the psychological factor. For
example, women are thought to be responsible for financial matters such as paying bills and shopping. This in the end may induce women to be more frugal than men so
that in general they save more than men. Our argument above is only speculative so
that future research is needed in this area of gender related behaviour related to
demand for financial assets. If we suggest that men are earning more than women, we
may predict that men save and invest more than women do. In our opinion, the idea
suggesting that a man or woman save or invest more than their opposite sexes is not
appealing because gender alone may not be sufficient to determine the level of demand for financial assets without intervention from other factors such as income,
wealth and the education level.
In relation to education levels, a number of researchers specially designed their
studies to examine the effect of education levels on the demand for assets, and others
established a connection between householders' education levels and levels of information. Educated householders are likely to hold more risk assets such as stock, bonds and trust units owing to their attitude towards risk. For example, Hochguertel
et aL (1997) found that better educated households invest more in stocks than less
educated people. This might be due to the fact that they are able to tolerate higher
levels of risk compared to less educated people owing to the higher levels of income
that they earned. Furthermore, their income usually is more stable in relation to
income earned by less educated people. In an extension to their study on the risk
tolerance of householders, Heaton and Lucas (2000) also conducted a specific study
on the effect of labour income variability.
Some authors, however, suggest that educated householders tend to hold a greater
proportion of assets due to the higher level of information they possess. King and Leape (1987) suggest that educated people have better information about various
32

investment opportunities resulting in higher investment levels by this group of householders. Since stock and bond holdings are information consumption practice,
partly in searching for the right types of stocks and bonds in accordance with peoples desired level of risk and partly in deciding the price to pay for the assets as well as the
timing of acquisition and disposal for return maximisation. King and Leape's
evidence suggests that incomplete information is a significant determinant in deciding
the composition of householders' portfolio.
2.3.3 Health Status
The effect of health status on total wealth accumulation was conducted in Smith
(1999), Venti and Wise (2000) and Wu (2003). Recently, some researchers refined
their study to examine the effect of health status on the householders' asset allocation decision in order to explain how householders allocate their portfolios. Rosen and Wu
(2003) documented the existence of a strong relationship between health status and
portfolio decisions. They controlled the effect of level net worth, householders'
income and socio-economic variables in order to separate the effects of the variables
from the health status variable. Poor health significantly reduces the probability of
holding risky assets such as retirement accounts, bonds and stocks. However, what
the study failed to identify is how health status is related to portfolio behaviour. They
did, however predict that ill health affects the ability to increase the labour supply to
compensate for the possibility of the poor performance of risky portfolios. This is
related to the labour income flexibility arguments of Bodie et aL (1992). Another
health-related study conducted to examine the former effect on householders'
portfolio allocation decision was that of Edward (2002) which was trying to develop
a theoretical model suggesting that health status may affect portfolio allocation
through the effect on risk aversion. Applied to different sets of data, the connection
was later found inconclusive by Rosen and Wu (2003).
33

2.3.4 Institutional Effect and Market Imperfection
The major institution effect that has been thoroughly studied in the field of financial
market is the taxation effect. Without proper taxation planning by householders, an investment venture might be not worthwhile. This is because it forms part of the cost
of investment. One investment product may be taxed more heavily than others,
subject to the direction of economic objectives desired by the government. In the
subject of personal and federal taxation, Poterba and Samwick (1999) used the
marginal tax rate to study the effect of federal taxation on portfolio composition.
Market institutions create their own sets of regulations and frameworks which have
been set up in order to increase efficient operation of the market. Examples of
regulations posed by the market operators are restrictions on short selling, minimum
number of transactions to be executed, entry costs charges and exit costs charges. As
for investors, the institutional frameworks have increased the cost of holding and
monitoring specific types of assets. This usually results to inefficient levels of holdings of financial assets in investors' portfolio.
Market imperfections on the other hand are a phenomenon of market inefficiency.
Research on the capital market always assumes perfect market conditions which
seldom exist in the real world. Examples of market imperfections are borrowing and liquidity constraint and incomplete information. Young people, for example, face
liquidity constraints and so are constrained from holding risky assets (Paxson, 1990).
Incomplete information faced by investors may pose problems in the selection
process of choosing certain types of assets. Investors, most of the time, are not aware
of the conditions of risk or the possible level of returns for them to make appropriate investment decisions.
34

2.3.5 Labour Income and Labour Supply Flexibility
Bodie et al. (1992) in their study incorporating the life-cycle effect had introduced
another variable that is the labour income flexibility. This is another important factor
in determining the level of financial asset demand by households. Their model includes the human capital risk element as a basis for their labour income flexibility
element. They established that human capital is less risky than equity. Nevertheless
its value decreases with age and so will its investment in equity. Bodie et al, also
concentrated on the ability of householders to substitute labour income for asset income. They regard this as an important factor in the demand for financial assets. Their conclusion was that young people who are have a greater flexibility of labour
income hold more of risky assets compared to older householders which face less
flexibility in their labour income as they approach retirement. Concerning education,
they also added that educated householders are open to more labour supply
opportunities and face less risk of losing income due to their ability to switch jobs in
the future. This results in educated householders having more job flexibility enabling
them to take greater risk in their investments.
Heaton and Lucas (1997) included the human capital uncertainty as a possible
determinant for financial asset demand. The logic is that increased uncertainty over
the human capital element may increase the intolerance levels of householders
towards risk investing in risky assets. Heaton and Lucas (2000) further added that
entrepreneurial income risk has a significant influence on portfolio choices as well as
asset prices and labour income risks. They emphasise the importance of
entrepreneurial risk on the portfolio choice. They suggest that householders with high
proprietary business income hold less wealth in stocks than similarly wealthy householders, at a particular age profile. Their prediction is that these types of
householders have higher background risks resting in their business venture as
compared to householders in labour force who receive wages.
35

In the same development, income risk also motivates demand for financial asset holding by householders. Uninsurable income risk and future borrowing constraints
may reduce the share of risky assets (Guiso et al., 2001). Their paper contributes in
the sense that it examines the effect of income risk and borrowing constraints householders' micro-data. Micro-data studies performed by Feldstein (1976),
Mireaux and Mervyn (1987) and Leape (1984,1987) on householders portfolio
allocation do not discuss the two effects suggested by Guiso et al.
According to Guiso et aL (2001), some difficulties may arise when conducting the
analysis between the income risk effect and the lack of information on borrowing
constraints. For the first time, they measure the two variables and used micro-data on householders in order to examine their effect on portfolio choice. Their result
confirms the prediction that householders tend to hold fewer of risky assets in case
they might face income risk and borrowing constraint. The results interestingly
enforce the hindsight of Mehra and Prescott (1985) regarding their observation of
under-investment by investors in stocks regardless of premium returns offered by the
asset. They dubbed the phenomenon to as the 'equity premium puzzle'. They suggest
non-diversifiable income risk and restrictions on borrowing as possible reasons for
the existence of the phenomenon. Foldes (2000) in relation to this subject studied the
effect of the uncertain time horizon faced by householders as a factor in the demand
for assets held by householders.
2.3.6 Demand for Financial Assets as a Condition to the Demand of other Types of Assets
More advanced studies that examine the demand for financial assets incorporate the
effect of other factors as a condition for financial asset demand. Such factors include
householders' ownership of real estate, owner-occupied housing and retirement
account holdings. These studies can be regarded as more accurate since they consider
extra variables in establishing the asset demand by householders. For example,
36

Kullman and Siegel (2003) studied the role of real estate in householders' portfolio
choice. They consider real estate risk to be one of the background risks in a portfolio
choice decision. After controlling for wealth, income and real estate risk, they found
that real estate risk exposure reduces the relative holdings of stocks and other risky
financial assets. In contrast, higher mortgage balances are associated with increased
holdings of risky financial assets. From their observation, it can be inferred that richer householders which have a higher mortgage debt balance own more risky financial
assets. Looking at the behaviour of house owners and renters, they established that
house-owners hold more risky financial assets such as stocks than renters do. This
phenomenon suggests that wealthy householders are more willingly to expose
themselves towards investment risks compared to less wealthy householders.
Flavin and Yamashita (1998) revived the inclusion of owner-occupied housing in
their study of householders' asset allocation. Their study was based on the research
which had been formerly studied by Grossman and Larouq (1990). Flavin and
Yamashita studied the impact of housing ownership constraints on demand for
financial assets among householders by testing for the life-cycle effect. The ratio of
housing to net worth declines as householders accumulate wealth; the housing
constraint induces the life-cycle pattern in the portfolio shares of stocks and bonds.
Flavin and Yamashita considered owner-occupied housing holding as an asset rather
than as a form of consumption demand. Householders' portfolios are becoming more
efficient when their portfolios include houses which cater for the consumption demand for them as well as other financial assets. This is because, in Flavin and
Yamashita's model, they assume that the returns between both classes of assets are
uncorrelated.
The life-cycle effect is crystallised in their findings since young householders with
high house values to net asset ratios tend to hold less risky assets such as stocks in
order to balance their highly leveraged portfolio. Note that as age increases, the house
to net asset ratio tends to decline due to increasing wealth as the householders ages
37

although the possibility of rising property values can be anticipated. Their analysis, however, was not engineered to explain why young householders in fact held fewer
risky assets to balance their high risk portfolio instead of paying off their mortgage balance. The hindsight is that until recently there have been fewer means by which
mortgage-holders can pay off their mortgage earlier than the stipulated contract
period. The essential finding of their model is that it successfully detected that young
and older householders are actually identical in their risk preferences as well as in
their perception towards risk and the returns for different types of financial assets
after consideration of housing demand constraints. These constraints which are
actually different at different ages promote the life-cycle effect in the demand for
financial assets holding. If housing constraint is not significant or simply not important in household portfolios, the demand for financial assets would not have
been an inverse U-shaped. Flavin and Yamashita's (1998) results, thus, are different
from the research of Bodie et aL (1992) who states younger householders hold more
risky assets due to their tabour income flexibility. Their results however were
extracted in a partial equilibrium model which assumed that the expected return
vector and covariance matrix were time invariant or static. The results may be
different had it been tested using a dynamic model instead of the static model was
used.
Pollizon and Weber (2003), on the other hand, studied the subject of the efficiency of household portfolio and considered the housing demand effect. They argued that the
standard tests measuring portfolio efficiency are biased since they do not consider the
existence of illiquid wealth already existing in portfolios. They tested both the case of
treating housing as other assets such as stocks and bonds, and treating housing
ownership as a conditional element in their model. Their result showed that if housing
assets were treated in the same manner as other types of assets, household portfolios
would become less efficient with the inclusion of housing ownership. In other cases,
where housing ownerships are treated as a conditional factor to the demand for
financial assets, the condition is no longer the case. Their results, thus, support the
38

view that illiquid assets are an important factor in the determination of financial asset demand. They also found that hedging opportunities that housing ownership brings,
was not fully utilised by Italian householders with diversified portfolios. They had
formulated that returns from housing assets do have some correlation with other types
of asset holdings. This is different from the view of Flavin and Yamashita (2002),
which assumed no correlation between these two types of asset class. Pollizon and Weber's methodology considered the element of covariances between both types of
assets and introduced the element of hedging in household portfolios with house
ownership. Failure to hedge house price risks can thus be considered as an important
aspect in household portfolio management.
2.3.7 The Life-Cycle Effect
The main question that has to be asked is whether the 'folk wisdom' notion that has
been well discussed in the field of asset allocation is applicable for portfolio
allocation decisions. The age factor had been regarded by financial planners as
important in the wealth allocation of different types of assets. For example, in the
course of making the choice between investing in less risky assets, such as certificates
of deposit, and risky types of financial assets, such as stocks and bonds, the age factor
plays important part. Questions also arise on the pattern of wealth allocation between
financial assets and non-financial assets such as owner-occupied housing. Is it true
that age factor itself may affect the portfolio allocation behaviour of householders or it is merely the spill-over effects to factors which age has the effect upon them? To
make this point, consider the life-cycle effect which had been associated with the
level of information as studied by King and Leape (1987) or the contribution of the
effect of a flexible labour supply in the study by Bodie et al. (1992). Both of them
found that age was a controlling factor to their main factor than affect the level of
demand, i. e. information factor for King and Leape and labour supply flexibility for
Bodie et al. There are several other factors which can be associated with the age
39

effect such an aged householder may have possessed higher amount of wealth to be
invested as compared to a younger householder. Looking at various papers by
several other authors, the age effect seems not to be a standalone factor in the
allocation process of household portfolios.
As Jaganathan and Kocherlakota (1996) pointed out, the age factor is not the only factor which should be considered in deciding on their investment decisions since the
decision horizon is very much specific to individual investor's risk, return and
background risk consideration. No one practical formula or factor is adequate to build
a model to achieve maximum efficiency for any investment venture to be used by a
mass group of people.
In Jaganathan and Kocherlakota's (1996) study, they pointed out that financial
planners' opinion that younger investors are best to invest in stocks rather than bonds
were based on three reasons 7. One of the reasons provided by the financial planners is
that young investors have the longer time horizon for investment which may reduce
the risk of investing in stock markets. They argue that over time, stocks are less risky.
This might be due to the fact that over time, for them, fluctuations of stock prices
seems to be less volatile or flatter compared with the position of the older investor
who does not have time to wait for the volatility of the stock to smooth out and
accumulate in value. But they argued that if we are able to adjust our stock holding
over time by purchasing and selling in the short run as well as in the long run, there is
no point in saying that stocks are safer in the long run. There is however one possible
reason for householders not to adjust the level of stock holding and that is the cost of
transactions. In addition, stock holding may be adjusted in the long run making it thus
more like the short run situation. Nevertheless, investing in stocks always contains an
element of risk.
7 For example, advice given by financial planners such as Kenneth Morris, Alan Siegel and Virginia Morris in page 7,1995 edition of The Wall Street Journal Guide to Planning Your Financial Future.
40

Another reason raised by the financial planners is the target argument. They argue that younger investors with large financial obligations such as house purchases and college funds for children in the future may induce them to be actively involved in the
stock market in order to fulfil their present and future financial obligations. The
mathematical solution of Jaganathan and Kocherlakota (1996) revealed that this
argument is also not true. The reverse should apply in the situation where younger investors fear to take on massive financial obligations commitments to invest in stock
markets. They are more likely to invest in bonds markets to avoid taking risks.
The third reason is in line with the argument of Bodie et aL (1992) who stated that
younger investors have greater flexibility in labour income so they can afford to invest more in the stock markets and offset possible losses with their labour income.
Older investors are not able to do that because their labour income flexibility
diminishes as they age: they have fewer employment opportunities and less power in
wage rate negotiations. Both writers add that the case is true provided that the young
person's labour income is not so heavily correlated with the stock returns for them to be able to hedge their losses in the stock markets. If the young investor's labour
income is correlated to stock returns, then they have to invest more in bonds in order to minimise losses in line with the portfolio theory of Markowitz (1952) on the
subject of correlation between asset returns property. If returns from two assets are heavily correlated, ownership of both will reduce the benefit of portfolio diversification for the portfolio to be an efficient portfolio.
Their discussion about the subject inspired us to further examine the relationship between the ages of households and the choice of investment they should take to
maximise their portfolios' potential. We will examine on the effect of age on
portfolio allocation decision at different age of life after considering other factors
sensitive to age such as levels of wealth, education, labour market status and home
ownership.
41

2.4 Household's Portfolio Allocation and Demand for Financial Assets: International and Comparative Researches
Studies performed in different countries are important in the way that these studies
enlighten readers on the application of sets of important variables that affect the level
of demand for financial assets. In addition, studies that cater for different
environments in which asset demand is examined will enrich reader's knowledge on
asset demand. For example, in Japan, financial asset demand is often restricted by the
need for expensive house ownership. This has driven many researchers to study financial assets demand and consider the utmost importance of house ownership. This
section provides relevant literature on the subject from such countries as Japan, Italy,
the U. S, UK and Netherlands.
2.4.1 Japan
Studies on household allocation strategies adopted by the Japanese were carried out
by a number of authors such as Iwaisako (2003), Yamashita (2002) and Suruga and
Tachibanaki (199 1). Iwaisako in his study on household portfolio found that there is a
decreasing trend of Japanese household investment in stocks in general despite the
current trend of increasing ownership of this particular type of assets in the U. S and
other European countries. Further than that, he cited the issue of the life-cycle effect
of stock holding for household in Japan in order to contrast the observations made by
Ameriks and Zeldes (2001) on the existence of a life-cycle effect on stock holding in
the U. S. Ameriks and Zeldes stated that the unconditional equity shares in financial
assets have an inverse pattern according to age and peak in the late forties and fifties
for U. S householders.
lwaisako (2003) also revealed that equity in financial wealth increases with age
among young householders, peaks in their fifties and becomes constant thereafter.
This finding is consistent with other research in western countries. He stresses, on the
42

other hand, the fact that the ownership of a house especially in the form of owner-
occupied housing demand is not negligible in determining whether the financial asset
ownership of Japanese people shows the life-cycle effect. His argument is that the
housing demand for the young in Japan may form a constraint in the demand for
financial assets. He also establishes that the demand for housing is actually promoting
a hump-shaped pattern of financial asset holding for Japanese. Without a proper
consideration of the demand for housing, the true picture of whether household
demands for financial assets demonstrate the life-cycle effect cannot be determined.
This fact is well established in the work of Yamashita (2002) where he places a housing constraint on his study of financial asset demand by the Japanese. By placing
constraints on the ratio of house values to net wealth, the true measurement for
financial asset demand to follow a life-cycle effect is possible. Iwaisako and Yamashita arrive at the same findings saying that the housing demands for Japanese
households are actually the reason why the demands for financial assets indicate the
effect life-cycle. They establish that the effect of housing is in fact not negligible
when considering the life-cycle effect for financial assets holding.
One interesting reason offered by Iwaisako (2003) on the financial asset holding of Japanese households is that the Japanese high rate of savings is actually inspired by
the need for housing ownership. This reflects by the imperfect market for housing in
Japan, the volatility of the housing market and high land values. The central decision
a household has to make is whether to invest in a house. Other investment decisions
revolve around this decision. For example, a young household must save significantly to make the down payment for his house and later take on a large mortgage for it.
Due to the high leverage that he has, he is not able to take risks to invest in stock
markets which results in more funds being channelled into fairly safe and safe assets. His study is fairly comprehensive since it takes into account several data sets on Japanese household finances available in Japan. He makes use of the aggregate data from the National Survey Data, the Bank of Japan, and finally from the Nikkei Survey Data which is a micro data source which is extracted directly from the
43

Japanese households. The composition of household financial wealth analysis is done
using three sources of data. These rich data sets lend credibility to Iwaisako's
findings on the structure of demand for financial assets for Japanese households.
2.4.2 UK and the US
A comparative study between the UK and the U. S was conducted by Banks et al. (2002), in which their particular aim was to explain the difference of household
wealth distribution between the US and UK with emphasis placed on the housing and
the stock markets. They argued that both markets have to be studied in order to
understand the main features of household finances and asset allocation in both
countries. The main findings of their study were predictable with the current development of the housing market in the UK. They established that the feature of housing market in the UK which significantly dictated the differences of household
wealth allocation between both countries was the higher price volatility for housing
which acts as a consumption service and wealth allocation vehicle which results in
the young householders in the UK investing so heavily in their house that they have
less wealth to invest in financial assets. The comparative figures for financial assets for holding both countries reveal that mean and median value for UK householders
are significantly less for all age groups as compared to the US householders.
Although several complications arise during the process of comparing for differences
in both countries' householders finances and wealth allocation, they were able to
reconcile their data sets for the results to be comparable.
On the other hand, specific studies on household wealth allocation and demand for
financial assets has been done by a number of authors making use of diverse data
available in the area of consumer finances provided by number of surveys such as the
Survey of Consumer Finances and the Survey of Income and Participation. Examples
are studies conducted by Aizcorbe et al. (2003) on the recent changes in US family
finances, and by Kennickel and Starr-Mc Cluer (1997) on household savings and
44

portfolio savings over years of 1983 and 1989. Bertaut and Starr-Mc Cluer (2000)
also wrote about household portfolio in the U. S. All of these studies listed have used data from the Survey of Consumer Finances.
2.4.3 Italy, Netherlands and the US
A comparative study was conducted to explain the differences between Italy,
Netherlands and the US, which was conducted by Kapteyn and Panis (2003). They
looked at the institutional effect of pension and retirement income provision for all
three countries. Their concerns were more on the institutional differences for wealth
accumulation and portfolio composition nearing to retirement. They formulated
several hypotheses to test for the institutional differences which they had expected. Hypothesis one related to the coverage of the retirement benefit provided by each
country. With less coverage provided by the U. S pension providers, higher savings
rate were expected for householders in the U. S. Hypothesis two related to the effect
of earnings and consumption uncertainty. Householders were asked a direct question
on the level of income uncertainty they had experienced and the respondents who
claimed the highest level of income uncertainty did come from the U. S. Regarding
the consumption uncertainty, they chose out-of-pocket medical expenses to be the
proxy for the variable. Again, householders in the U. S are more likely to face larger
out-of-pocket medical expenses compared to their counterparts in the Italy and Netherlands since both European countries' pension schemes cover most of the
medical expenses to be normally incurred by householders. Furthermore,
householders in the U. S are expected to have higher rates of savings and wealth
accumulation as income and consumption uncertainty is higher than that of its
counterpart under the analysis.
Hypothesis three relates to the role of capital market imperfections. Capital market imperfections in this case are the borrowing constraint for the young householders
after considering the amount for the minimum down payment required to buy a
45

house. In the US the typical minimum down payment requirement is about 10% to
20% of the house value. In the Italy, the amount will be around 40% to 50%. The
situation is different in the Netherlands where householders may borrow up to 10
percent value of the house in order to make a house purchase. Given the facts, the
prediction is that householders in the Netherlands are less likely to save as much as
their counterparts in the US and Italy. In hypothesis four, Kapteyn and Panis (2003)
predict the level of private wealth to be a factor in portfolio composition to be which favour stock holding for the richer householders in countries under their analysis. They predict that householders in the US and Italy should hold a higher proportion of
stocks in their portfolio compared to householders in the Netherlands. But
considering the development of capital market, householders in Italy may possibly hold more stocks since its capital market is less developed than other two markets.
Around these hypotheses, they discovered several facts on household wealth
accumulation and portfolio composition. These can be found on page 33 of their
paper on the size and composition of wealth holdings in the United States, Italy and
the Netherlands. The results can be summarized as follows:
a) Americans should save more for retirement than the Dutch or the Italians;
b) Americans should save more due to more exposure to uninsurable income and
consumption risk;
c) Italians should save more due to severe borrowing constraints in their country; d) The Dutch should have relatively low stockholdings due to the low level of
private wealth; and
e) Stock-ownership in the US should be higher than in Italy because of the more highly developed capital markets in the United States
46

2.4.4 Netherlands
The study of Alessie et aL (2000) is a comprehensive one examining various aspects
of household portfolio allocation in the Netherlands. They used static and dynamic
models to look at the ownership rates of assets as well as the amount invested. The
static model was used to examine the background variables of householders in
choosing which types of assets to hold. The background variables examined were income and wealth, age, education levels, labour market status and the geographical location of householders. Due to the rich data available, they were able to further
study the subjective variables such as attitudes towards risk-taking and the degree of information available to householders on financial assets. The dynamic model was
engineered to look at the effect of previous holdings of financial assets on current
period holdings. Their study is a comprehensive one looking at different angles
relating to household asset allocation. The financial asset classes examined in this
study were risk-free assets such as transaction and savings accounts and certificates
of deposit: risky assets consisted of ownership of stocks, bonds and mutual funds, life
insurance and defined/contribution pension benefit.
They emphasised the defined contribution plan due to the fact that its use by Dutch
householders amounts to more than 50% holding to their total financial assets. This
case is comparable to the situation in Malaysia where mandatory employee
contribution to the Employee Provident Fund (EPF) forms a large share of householders' financial assets. This study may then provide a useful insight for our
study on the financial asset holdings of Malaysian householders. One particular
concern in our case is that householders are given minimal authority to manage their
account. Many are unable to optimise their contribution in EPF by investing in other investment avenues. The exception was stated in the case of householders with more
than MYR 50,000 in account 1, who can practically invest in unit trust, financial asset investment decisions cannot be exercised by Malaysian householders. In the case of
the Netherlands, beside pension plans, there are schemes that also assist householders
47

in planning their savings decisions which resemble the IRA accounts in the US which
may need the plan for financial allocation decision by the householders.
In Alessie et aL (2000), aggregate data used in their study was based on the National
Accounts 1998 Statistic Netherlands which for the first time had published a household sector in its Flow of Fund Statement. This publication reports the size and
composition of financial assets but does not include the holdings of real assets.
One observation from the Flow of Fund Statement is the increase in financial net
worth. Most financial transactions are executed by the pension funds and insurance
companies. Other than that, there is evidence of substantial changes in portfolio
composition. Funds in transaction and savings accounts increased by 22% but at a
slower rate compared to financial net worth. The same goes for certificate of deposit
funds. Investment in risky financial assets such as stocks and bonds had also increased from 22% to 25%. They also commented on the importance of defined-
benefit contribution plans to be compared with other European countries' figures.
Significant holdings are promoted by the favourable tax treatment of this type of financial asset. In addition, the National Accounts publication provides the statistics
on debt levels such as mortgage payments and short term debt.
Micro-data used in Alessie et aL (2000), on the other hand were obtained from the
Center Savings Survey (CSS). From this survey, information about households such
as age of household head, education levels, labour market status, health status and detailed information about types of income, assets and debt is collected. Questions
about economic-psychological on risk attitudes and information on financial is
collected in this survey as well. Information on various types of financial assets and Employer Sponsored Saving Plan (ESSPs) statistics are collected during this survey. Its features resemble those of IRAs in the US but are less liquid.
48

2.4.5 Islamic Financial Asset Demand in the U. S & the studies on money demand
in Malaysia
In relation to the demand for Islamic financial assets, a survey was in the US
reported and Failaka. com 8 on the descriptive aspects of the demand. Among data
collected is a demographic analysis of the respondents such as their profession, age, country of residence, level of education and income level. The demographic data
collected in this study is in line with other studies discussed earlier in the chapter. The
responses from the participants can be found in the full report of the survey in
Appendix 1. The survey indicated that the level of current investment of respondents is surprisingly low with 59% of respondents stating that they do invest while the
remaining 41% stated that they do not. It has to be noted however that investment had been defined in the American context. In this case, investment is defined as the
ownership of stocks, bonds, money market, real estate, ownership in private companies and retirement accounts such as IRA and 401(k) while the ownership of occupied housing is not considered as investment as for the survey is concerned.
Interestingly, a high percentage of respondents (38%) reported that they owned
conventional investments as opposed to only 18% who reported that they own only halal investments. 44% of the respondents, however, reported that they own a
combination of conventional and halal investments. To learn more on the motivation
of the respondents to behave in the way, the researcher asked the respondents why
they do not own halal investments. The responses obtained are shown in Figure 2.2.
8 The full report can be viewed from: hn: //www. failaka. com/Librarv/Articles/Failakaý/ý20Survey. 12d The link retrieved on I November 2006.
49
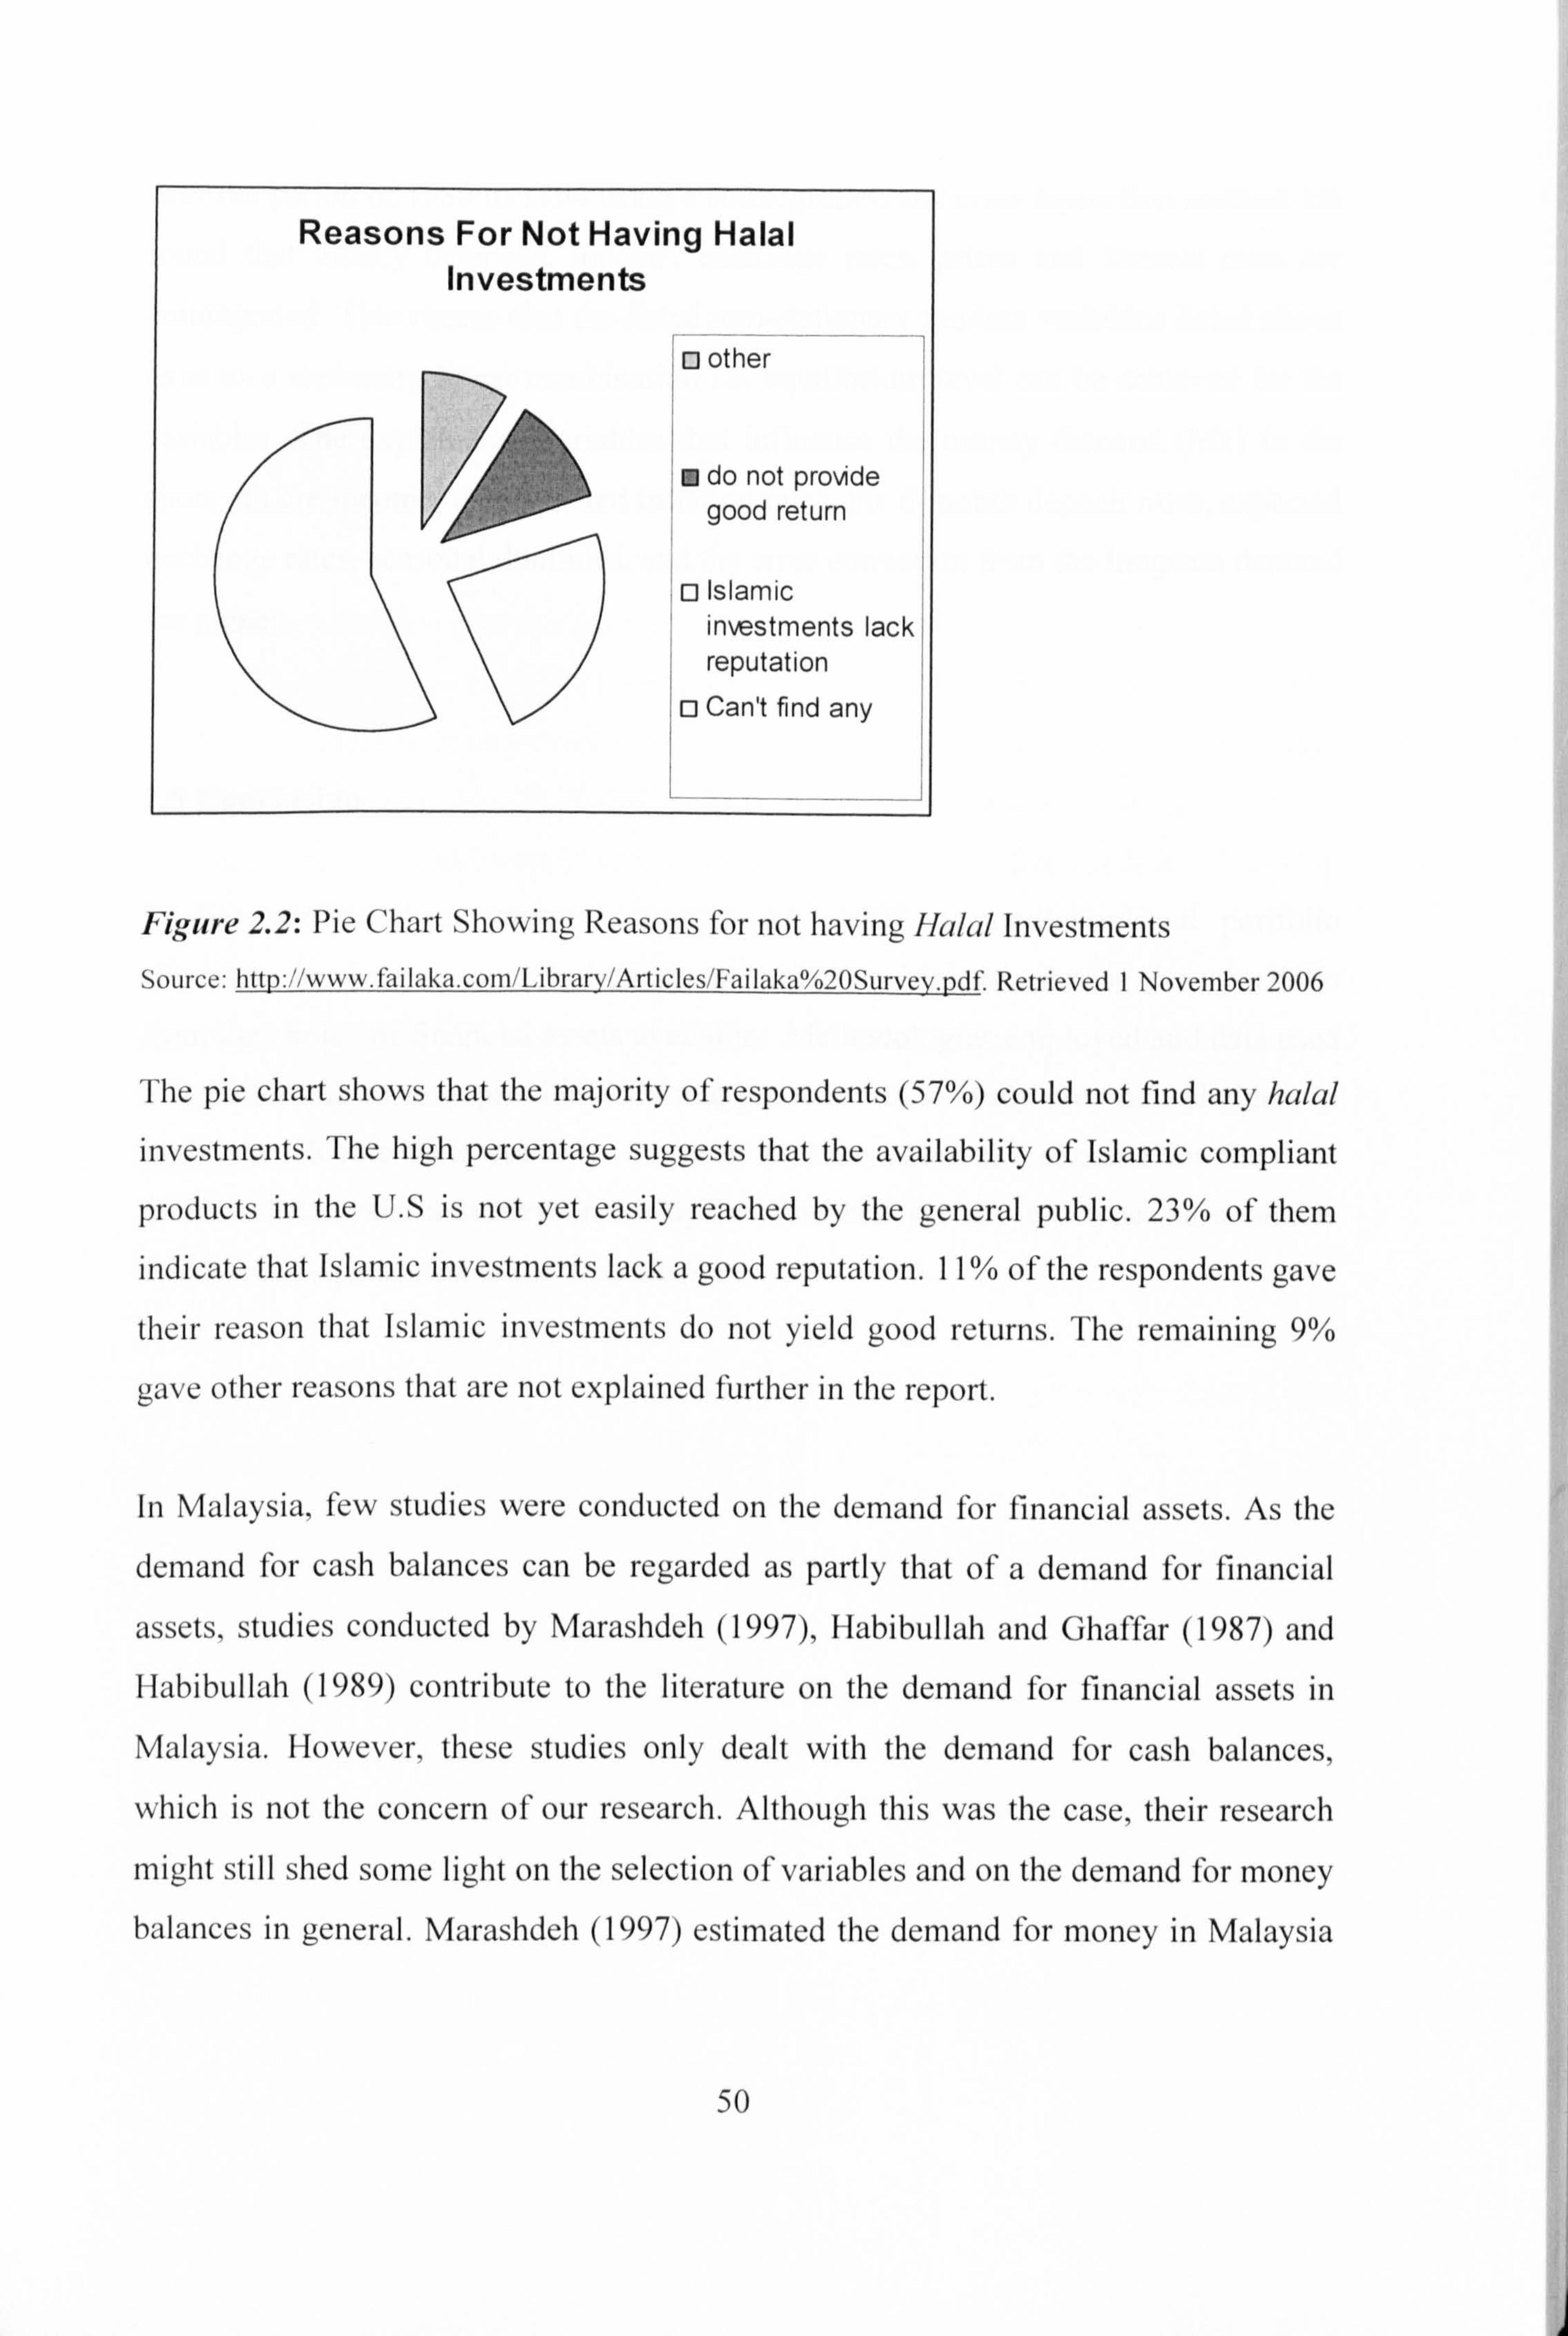
Reasons For Not Having Halal Investments
o other -,; I
m do not pro\Ade good return
Islamic investments lack; reputation
ci Can't find any
Figure 2.2: Pie Chart Showing Reasons for not having Halal Investments Source: http: //www. failaka. coin/Library/Articles/Failakaý/ý2OSurvey. pdf Retrieved I November 2006
The pie chart shows that the majority of respondents (57%) could not find any halal
investments. The high percentage suggests that the availability of Islamic compliant
products in the US is not yet easily reached by the general public. 23% of them
indicate that Islamic investments lack a good reputation. I I% of the respondents gave
their reason that Islamic investments do not yield good returns. The remaining 9%
gave other reasons that are not explained further in the report.
In Malaysia, few studies were conducted on the demand for financial assets. As the
dernand for cash balances can be rcgarded as partly that of a demand for financial
assets, studies conducted by Marashdeh (1997), Habibullah and Ghaft'ar (1987) and Ilabibullah (1989) contribute to the literature on the demand for financial assets in
Malaysia. However, these studies only dealt with the demand for cash balances,
which is not the concern of our research. Although this was the case, their research
might still shed some light on the selection of variables and on the demand for money balances in general. Marashdeh (1997) estimated the demand for money in Malaysia
50

over the period of 1980 to 1994 using a cointegration and error correction method. He
found that money balances, income, exchange rates, prices and interest rates are
cointegrated. This means that the listed non-stationary random variables listed above
exist as a stationary linear combination i. e. equilibrium level can be achieved for the
variables. The explanatory variables that influence the money demand (MI) in the
short run are income, the expected inflation rates, the 6-month deposit rates, expected
exchange rates, seasonal dummies, and the error correction from the long-run demand
for money.
2.5 Conclusion
Studies conducted in various countries on wealth accumulation and portfolio
allocation inspires us to study how householders in Malaysia devise their portfolio from the choice of financial assets available. Methodologies employed and data used in various studies may provide a starting point for us to study how householders in
Malaysia allocate their portfolio. In order to learn about the demand for financial
assets in Malaysia, a survey on Malaysian financial system and types of available
assets will be presented in the next chapter.
51

CHAPTER3
THE DEMAND FOR FINANCIAL ASSETS IN MALAYSIA: A SURVEY
3.1 Introduction
An assets acquisition process during an individual's lifetime is exercised in order to
save and accumulate wealth in preparation to reduce a later gap between expected and
actual consumption. Assets held by householders can be in the form of financial and
non-financial assets. Non-financial asset holding will usually be in the form of housing demand, motor vehicle ownership and equities in business ventures. They are long-term investments which also usually come with long-term financial
commitments. Financial asset holding, on the other hand, may well serve the purpose
of long-term investment and short-term liquidity needs. This is because choices of financial assets range from long-term, medium-term and short-term ownership. For
example, government bonds and saving bonds are usually designed to be long-term
investments with the maturity dates which can be up to a period of twenty years. For
the medium term, shares, treasury bills and unit trusts ownership may be the suitable
avenue. For short-term liquidity purposes, householders may keep savings accounts
and negotiable certificates of deposits. Both of these assets will attract income and
can be withdrawn without any penalty.
In developing countries, the depth and width of the financial and capital markets are limited in comparison to those in developed countries such as the U. S, the U. K and
Japan. A financial market can be regarded as deep if it has a high level of liquidity
while it is referred to as wide if it has an extensive range of financial products that
investors may choose from.
52

The lack of depth and width of financial markets in developing countries such as Malaysia have made householders less inclined to hold financial assets in favour of holding physical or real assets. Valverde et al., (2003) as reported in Levine (2005)
argued that financial intermediaries mobilise, pool and channel domestic savings into
productive capital and by doing so they contribute to economic growth. In addition, in a competitive banking sector, borrowing rates are higher and lending rates are lower, so the transformation of household savings into productive capital is faster.
Malaysian householders, less sophisticated at present in finance and investment
knowledge, are limiting their participation in financial assets. In developing countries
such as Malaysia, financial asset holding are to be held in the form of simple deposit
instruments such as savings and current, accounts and fewer in sophisticated investment avenues such as unit trust or equities.
Table 3.1 illustrates basic statistics on population, Gross Domestic Product (GDP),
Gross National Income (GNI) and GNI per capita of Malaysian households.
Table 3.1: Basic Statistics on Population, GDP and GNI in Malaysia
Population (in Million) 2006 26.64 Age 65 and above (%) 4.30 Between ages 15-64 63.30 Under 15 (%) 32.40 Gross Domestic Product, Current Prices (MYR Million) 2006 3rd Quarter
141,360
Gross National Income, Current Prices (MYR Million) 2006 Yd Quarter
136,432
Per Capita GNI, Current Prices (MYR) 2006 3rd Ouarter
20,434
Source: Bank Negara Malaysia (hiip: //www. bnm. pov. my/index. php? ch=l II #FinancialSector), Department of Statistics Malaysia (hn: //www. statistics. gov. my/english/frameset keystats. php). Retrieved on 50'Novcmber 2006
53

3.2 Financial Assets Holding in Malaysia
A survey on basic information about financial asset holdings in Malaysia is provided
next in the chapter, which consist of transaction accounts, certificates of deposit,
savings bonds, bonds, shares, unit trusts, retirement accounts and life insurance.
3.2.1 Transaction accounts
Transaction accounts in Malaysia consist of savings accounts and current accounts. All commercial and Islamic banks offer this type of product for their customers.
Interest rates or profit rates on savings accounts range from 0.3% to 3.00% per annum
according to the amount and type of deposit. The rate varies from one bank to another
but it is competitive. Nevertheless, one bank's rate is very similar to the others. Some
banks offer a high introductory rate of interest. The profit rates for Islamic compliant deposits are calculated differently based on the percentage of profit sharing ratio of
the bank and the customer. For example, Affin bank's profit rate for its Islamic
compliant deposits is as follows:
54

Table 3.2: Islamic Banking Deposit Rate for Affin Bank with Effective from 16'h Anril 2006 to 15th Mav 2006
Types of accounts Amount of deposits Profit Rate
" Savings Account-I Less Than MYR 1,000 Nil
( rofit sharin ratio 65 MYR 1,000 to MYR 5,000 0.25% p. a. p g 35 ff ti 1st MYR 5,001 to MYR 10,000 0.50% p. a. ) (e ec ve MYR 10,001 to MYR 50,000 1.50% p. a. December 2005)
Above MYR 50,000 1.75% p. a.
" Al Mudharabah Savings Less than RM1,000 Nil
Account-i ( Affin Tiny-
" Tycoon-i ) (profit sharing ratio 75
MYR1,000 and above 1.35% p. a.
25)
" Current Account-I 1.00% p. a. (profit sharing ratio 25 75)
" Affin Plus Account-! Below MYR 2,000.00 Nil
(profit sharing ratio 7.5 25) MYR 2,000.00 and above
1.50% p. a. (0.05%+1.45%
Source: httl2: //www. attint)anK. com. mytrates/ratesit). nim. Ketrievect xn z)epieMDer zvuo
Current accounts usually do not provide interests returns but some banks for example,
RHB Myl Account provides interest on current accounts customer's 5% withholding
of tax on deposits of more than MYR 100,000. This is an example of product
diversification practiced by banks to distinguish themselves with similar products
available in the market.
Table 3.3 lists all licensed banking institutions in Malaysia. They consist of
commercial banks, Islamic banks, finance companies, merchant banks, finance
houses, other financial institutions and money brokers.
55

Table 3.3: Lists of licensed bankin2 institutions in Malavqia nq nt 1" Tnm, n, -vm, 7 COMMERCIAL BANKS OWNERSHIP
-(FOREIGN/ LOCAL)
I ABN AMRO Bank Berhad F 2 Affin Bank Berhad L 3 Alliance Bank Malaysia Berhad L 4 AmBank (M) Berhad L 5 Bangkok Bank Berhad F 6 Bank of America Malaysia Berhad F 7 Bank of China (Malaysia) Berhad F 8 Bank of Tokyo-Mitsubishi (Malaysia) Berhad F 9 Burniputra-Commerce Bank Berhad L 10 Citibank Berhad F 11 Deutsche Bank (Malaysia) Berhad F 12 EON Bank Berhad L 13 Hong Leong Bank Berhad L _ 14 HSBC Bank Malaysia Berhad F 15 3. P. Morgan Chase Bank Berhad F
_16 Malayan Banking Berhad L
17 OCBC Bank (Malaysia) Berhad F 18 Public Bank Berhad L
_ 19 RHB Bank Berhad L 20 Southern Bank Berhad L 21 Standard Chartered Bank Malaysia Berhad F
_ 22 The Bank of Nova Scotia Berhad F 23 United Overseas Bank (Malaysia) Berhad. F
ISLAMIC BANKS 1 Bank Islam Malaysia Berhad L
- 2 Bank Muamalat Malaysia Berhad L 3 Commerce Tijari Bank Berhad L 4 Hong Leong Islamic Bank Berhad L 5 Kuwait Finance House (Malaysia) Berhad F 6 RHB Islamic Bank Berhad L
ANCE COMPANIES I
_anqan Bersatu Berhad L
MERCHANT BANKS 1 Affin Merchant Bank Berhad L 2 Alliance Merchant Bank Berhad L 3 AmMerchant Bank Berhad L
Aseambankers Malaysia Berhad L 5 Commerce International Merchant Bankers
Berhad L
6 Malaysian International Merchant Bankers Berhad L 7 Public Merchant Bank Berhad L 8 RHB Sakura Merchant Bankers Berhad L 9 Southern Investment Bank Berhad L 10 Utama Merchant Bank Berhad L
FINANCE HOUSES Abrar Discounts Berhad L
2 Affin Discount Berhad L 3 Amanah Short Deposits Berhad L 4 CIMB Discount House Berhad L
56

Table 3.3: Lists of licensed banking institutions in Malaysia as at l't January 2007 (continued)
15 KAF Discounts Berhad L
_6 Malavsia Discount Berhad L
_7 Mayban Discount Berhad L
OTHER FINANCIAL INSTITUTIONS 1 ERF Sdn. Bhd. L
_2 Pengurusan Danaharta Nasional Berhad L
MONEY BROKERS 1 Affin Moneybrokers Scln Bhd L 2 Amanah Butler Malaysia Scln Bhd F 3 First TAZ Money Brokers Scln Bhd L 4 Forex Enterprise Scln Bhd L 5 Fulton Prebon (Malaysia) Scln Bhd F 6 Harlow's (Malaysia) Scln Bhd F 7 KAF-Astley & Pearce Sdn Bhd F
_8 MGI Moneybrokers Scln Bhd F
Source: Bank Negara maiaysia Available at: hqp: //www. bnm. izov. my/index. php? ch=13&cat--bankina. Retrieved 23d April 2006
According to BNM statistics 9, the Islamic compliant demand deposit was at MYR
3,505.2 million as at October 2005 and had risen to MYR 4,236.1 million as at October 2006. In addition, Islamic compliant saving deposits were recorded at MYR
9,359.2 million and MYR 10,624.2 million during the same period referred above. These indicate a steady growth of savings by private individuals in Malaysia, as Islamic compliant deposits are concerned.
On the other hand, the conventional saving deposits for individuals was recorded at MYR 60,152.8 million as at October 2005 and MYR 62,270.6 million as at October
2006, indicating an increase of about MYR 2,000 million. 10 The figures, if compared
with the level of Islamic compliant savings, are significantly higher for both periods. This suggests that Islamic banks still have much work to do before they can compete
with conventional financial institutions on a levelled playing field.
9 Data obtained from Bank Negara Malaysia's website, available from: http-Hwww. bnm. gov. my/files/publication/msb/2006/10/pdf/ii 18.12df. Retrieved on 22 December 2006 " Statistics in this part also obtained from Bank Negara Malaysia's website. Available on: htt2: //www. bnm. gov. my/files/publication/msb/2006/10/t)df/ii 13.12df. Retrieved on22nd December 2006
57

3.2.2 Certificate of Deposits
A certificate of deposits is a type of market instrument. In Malaysia, the term
Negotiable Certificate of Deposits (NCD) is used in order to reflect the fact that this
paper money is negotiable. It is issued by banks acknowledging the deposit of a
specific sum of money for a fixed period of time which earns a fixed interest rate. An
NCD with tenure of one year or less is paid with the principal amount at maturity. As
compared to fixed deposit, certificates of deposit are negotiable and can be bought
and sold before the date of maturity. The reward for holding NCDs is that holders
have a high degree of liquidity for short-term and medium-term funds as compared to
fixed deposits. An NCD gives you the flexibility to sell the certificates at any time
without having to pay any penalty. Apart from the interest income, holders will benefit from capital appreciation from trading an NCD. ABN AMRO bank Malaysia
Berhad, for example offers NCD of MYR 500,000 per transaction.
EON Bank Berhad, on the other hand, offers Negotiable instruments of Deposits
(NiDs) that have tenure periods ranging from one month to a period of ten years. The
minimum denomination for its NIDs is MYR 100,000 and the maximum amount is
MYR 10,000,000. In addition to conventional negotiable instruments of deposit, the
EON Bank also offers Islamic compliant certificates called Negotiable Islamic Debt
Certificates which have been structured using the concept of bay' bithaman 'ajil
(deferred payment sale). Although the name suggests that the product is a debt
instrument, it simply means that the sum of money deposited by investors with the
banking institutions repayable at a specified future date at the nominal value. The
income will be in the form of profits shared among the depositors and the bank. As
the instrument is negotiable, it means that it can be further traded on the open money
market by holders at discounted prices.
58
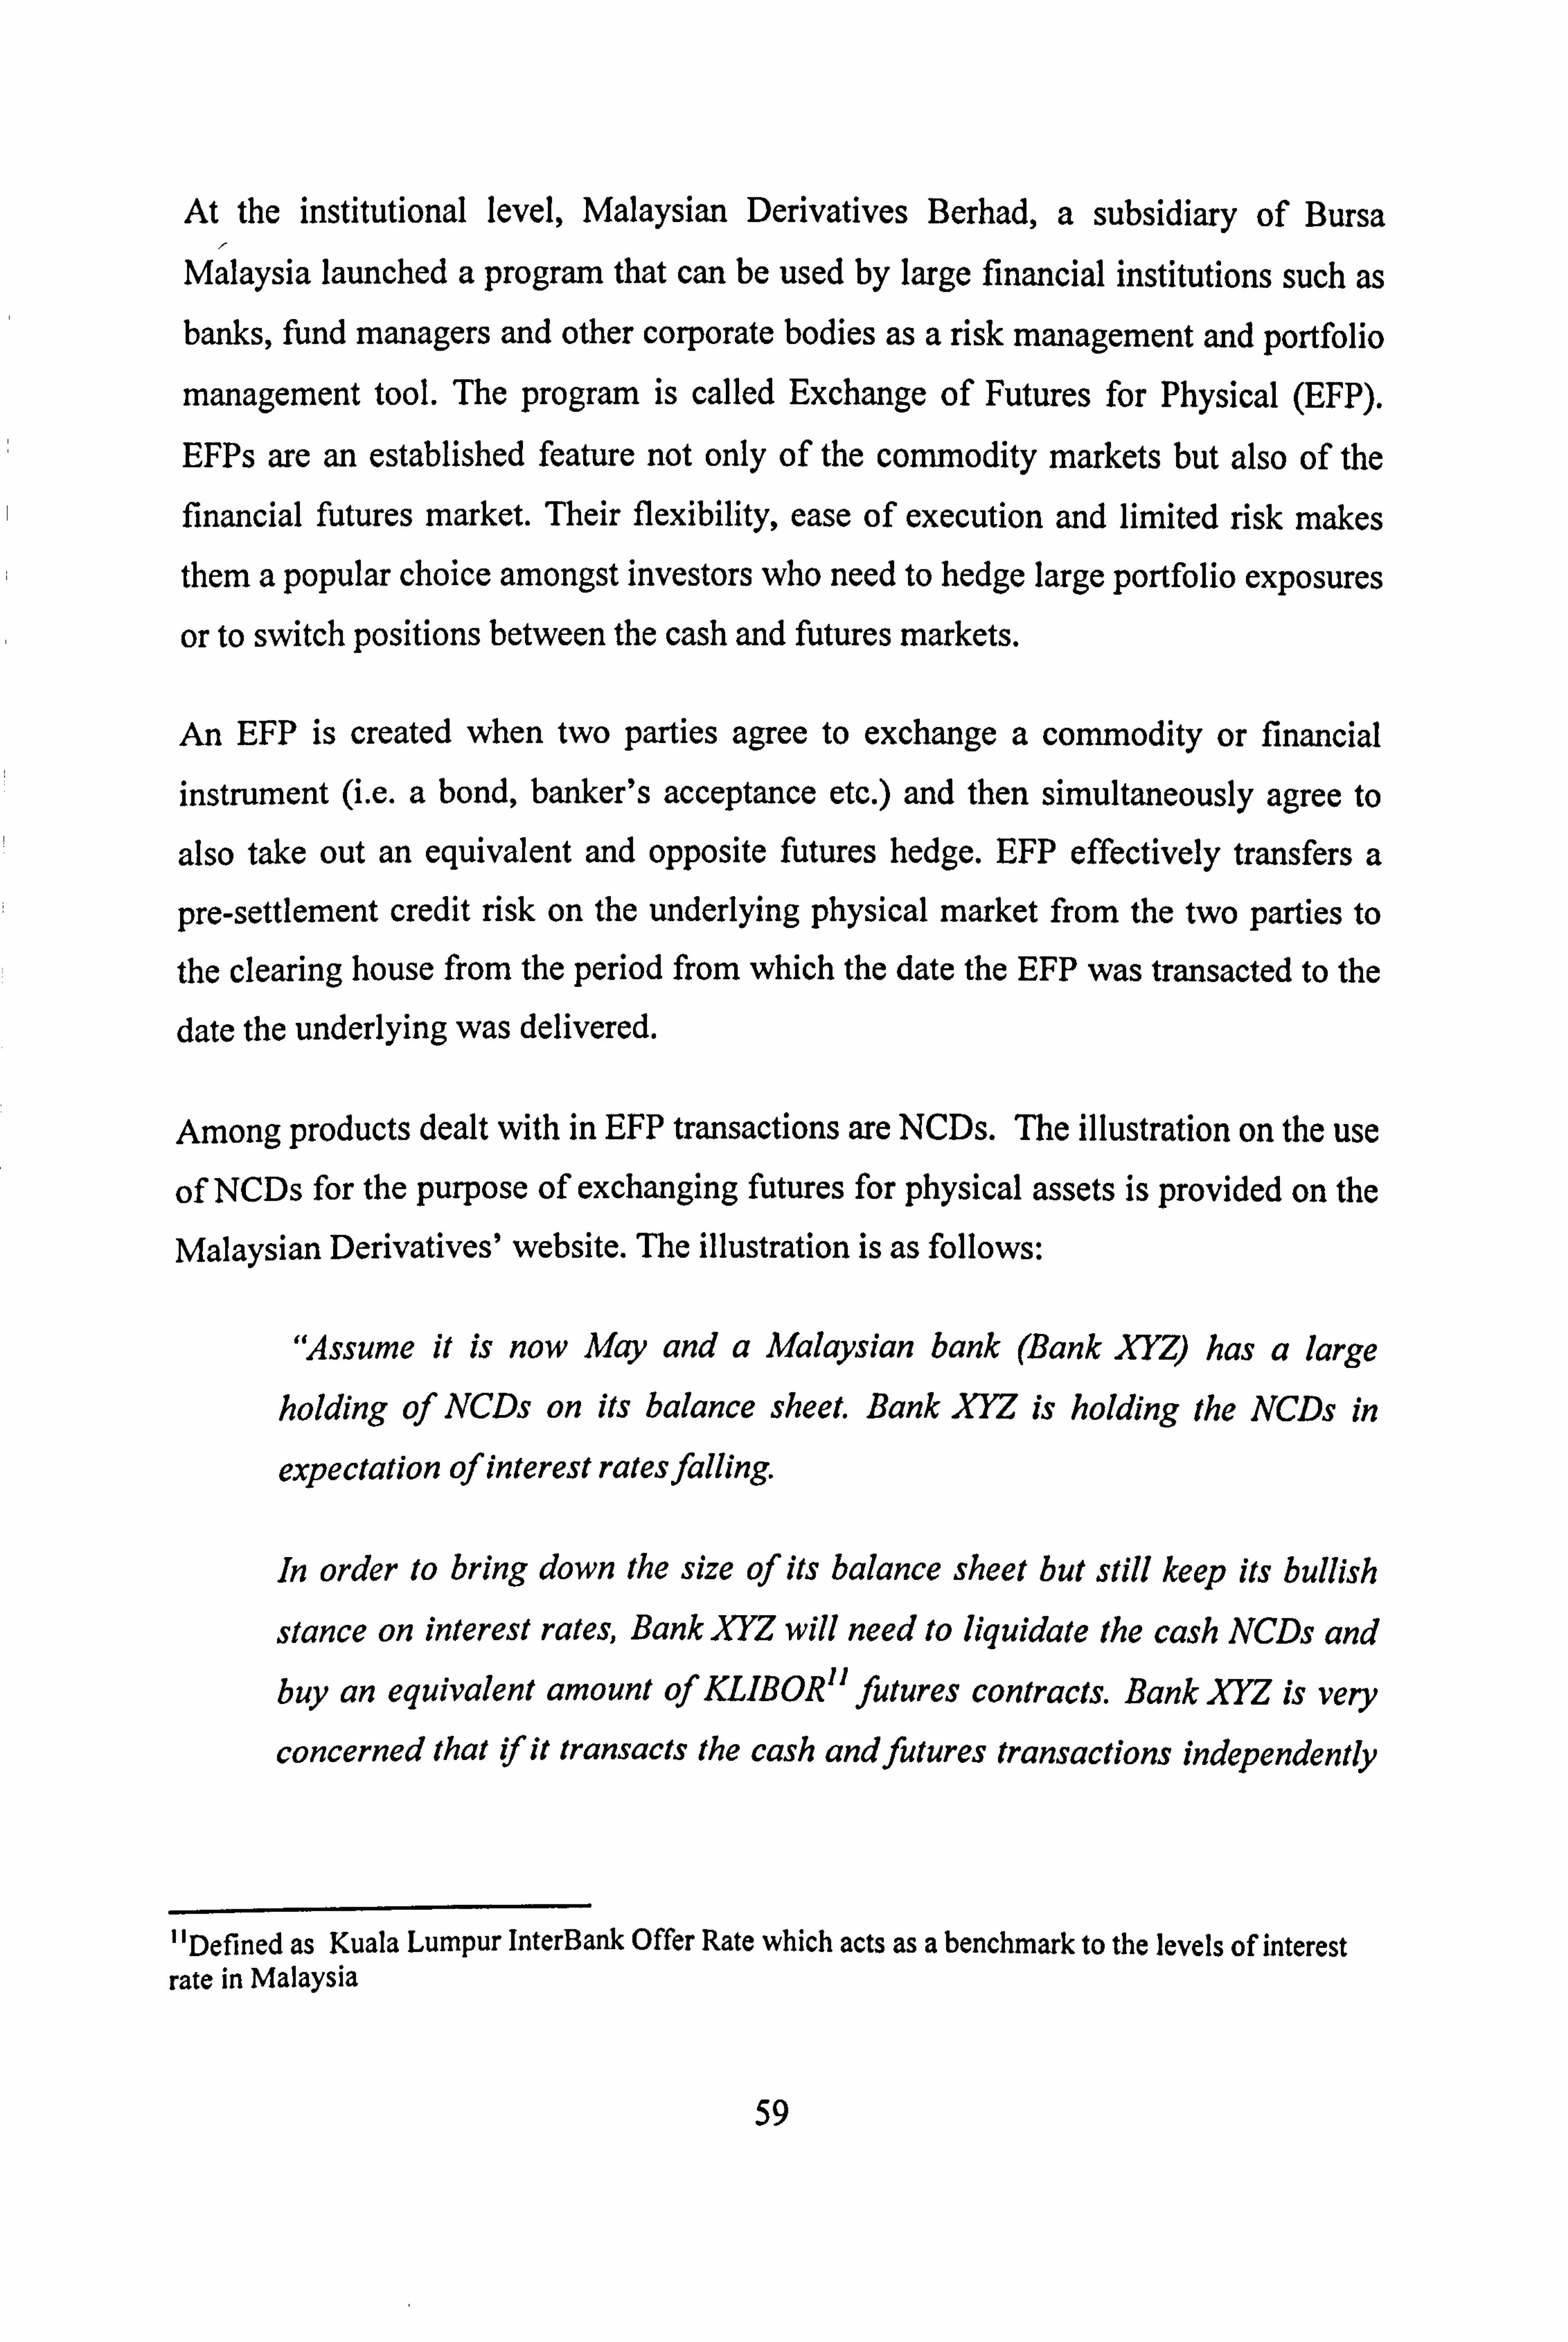
At the institutional level, Malaysian Derivatives Berhad, a subsidiary of Bursa
Malaysia launched a program that can be used by large financial institutions such as banks, fund managers and other corporate bodies as a risk management and portfolio
management tool. The program is called Exchange of Futures for Physical (EFP).
EFPs are an established feature not only of the commodity markets but also of the financial futures market. Their flexibility, ease of execution and limited risk makes them a popular choice amongst investors who need to hedge large portfolio exposures
or to switch positions between the cash and futures markets.
An EFP is created when two parties agree to exchange a commodity or financial
instrument (i. e. a bond, banker's acceptance etc. ) and then simultaneously agree to
also take out an equivalent and opposite futures hedge. EFP effectively transfers a
pre-settlement credit risk on the underlying physical market from the two parties to
the clearing house from the period from which the date the EFP was transacted to the
date the underlying was delivered.
Among products dealt with in EFP transactions are NCDs. The illustration on the use
of NCDs for the purpose of exchanging futures for physical assets is provided on the
Malaysian Derivatives' website. The illustration is as follows:
"Assume it is now May and a Malaysian bank (Bank XYZ) has a large
holding of NCDs on its balance sheet. Bank XYZ is holding the NCDs in
expectation of interest ratesfalling.
In order to bring down the size of its balance sheet hut still keep its bullish
stance on interest rates, Bank XYZ will need to liquidate the cash NCDs and buy an equivalent amount of KLIBOR" futures contracts. Bank XYZ is very
concerned that if it transacts the cash andfutures transactions independently
"Definedas Kuala Lumpur InterBank Offer Rate which acts as a benchmark to the levels of interest rate in Malaysia
59
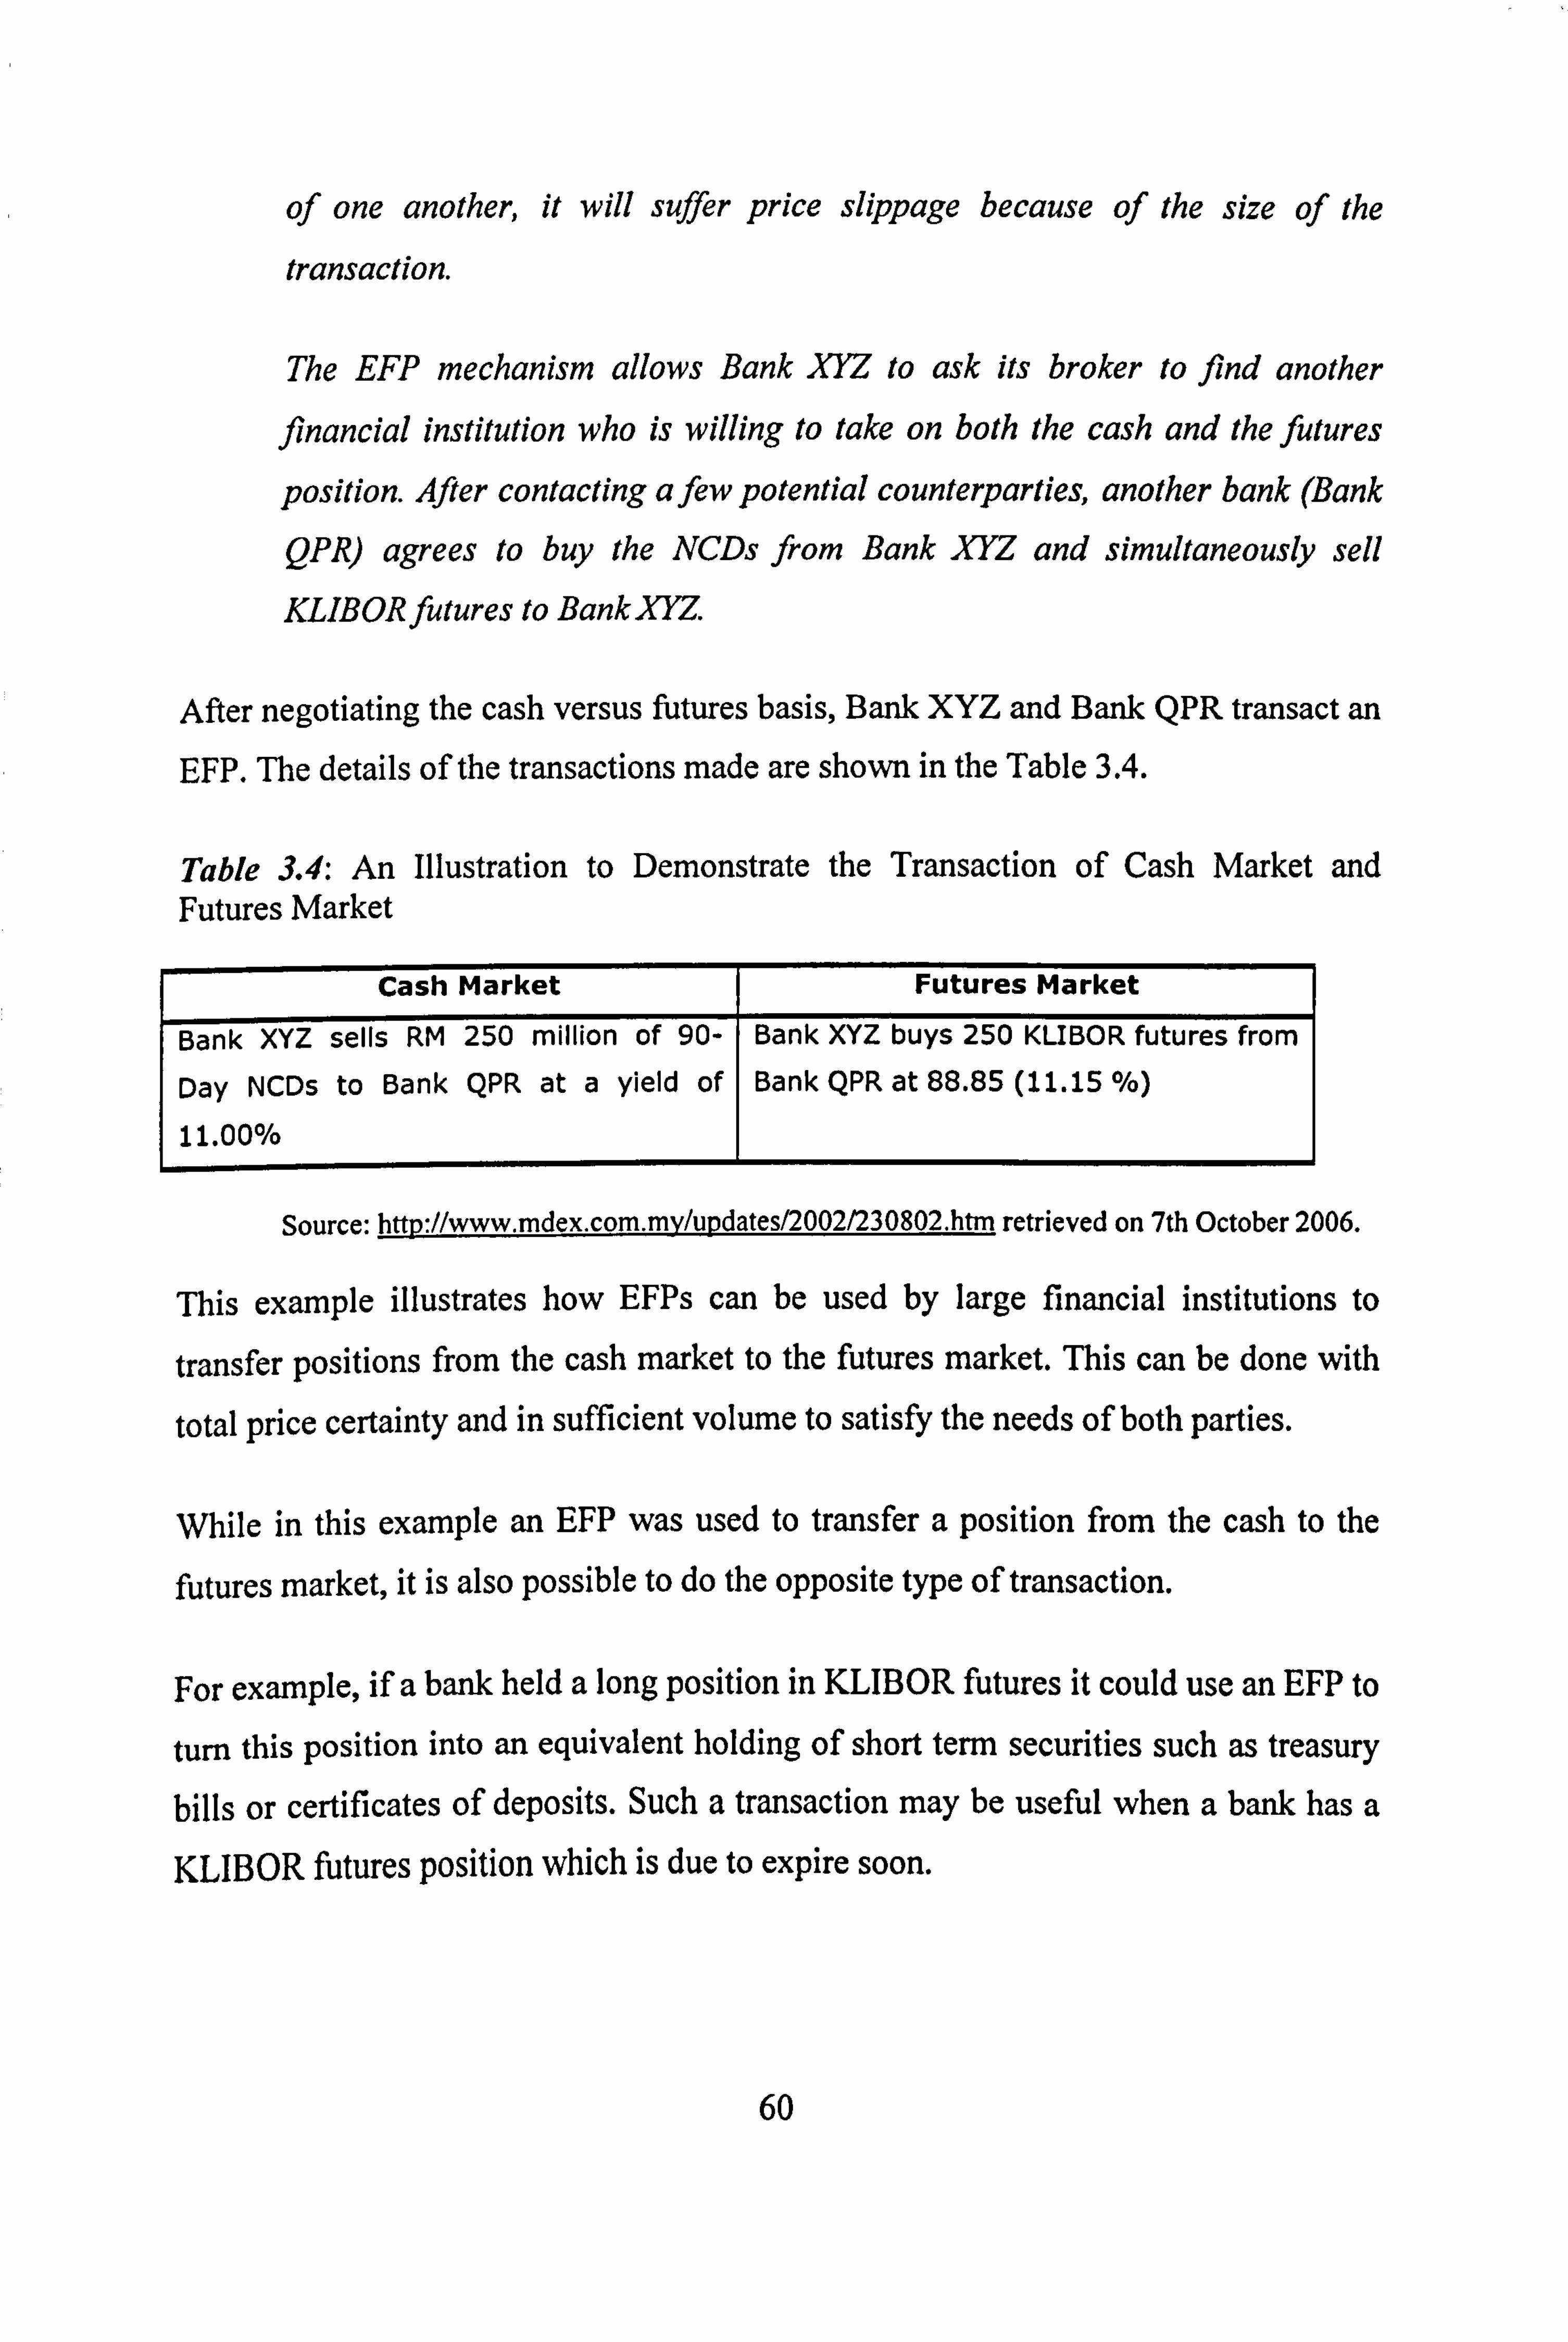
of one another, it will suffer price slippage because of the size of the
transaction.
The EFP mechanism allows Bank XYZ to ask its broker to find another
financial institution who is willing to take on both the cash and the futures
position. After contacting a few potential counterparties, another bank (Bank
QPR) agrees to buy the NCDs ftom Bank XYZ and simultaneously sell KLIBORfutures to BankXYZ.
After negotiating the cash versus futures basis, Bank XYZ and Bank QPR transact an EFP. The details of the transactions made are shown in the Table 3.4.
Table 3.4: An Illustration to Demonstrate the Transaction of Cash Market and Futures Market
Cash Market Futures Market
Bank XYZ sells RM 250 million of 90- Bank XYZ buys 250 KLIBOR futures from
Day NCDs to Bank QPR at a yield of Bank QPR at 88.85 (11.15 %)
11.00% 1 1
Source: http: //www. mdex. com. my/ul2dates/2002/230802. htm retrieved on 7th October 2006.
This example illustrates how EFPs can be used by large financial institutions to
transfer positions from the cash market to the futures market. This can be done with
total price certainty and in sufficient volume to satisfy the needs of both parties.
While in this example an EFP was used to transfer a position from the cash to the
futures market, it is also possible to do the opposite type of transaction.
For example, if a bank held a long position in KLIBOR futures it could use an EFP to
turn this position into an equivalent holding of short term securities such as treasury
bills or certificates of deposits. Such a transaction may be useful when a bank has a
KLIBOR futures position which is due to expire soon.
60

Rather than having the position to be in cash and then needing to do a separate cash
market transaction, the bank could transfer their KLIBOR position into the cash
market by doing an EFP. Both legs of the EFP are transacted simultaneously in
volume and at a fully negotiable price.
From the illustration we may understand that NCDs can be used by fund managers
and other financial institutions alike in order to manage portfolios by switching
physical financial assets to futures products or vice versa with other parties. This will
enhance the diversification of fund portfolios thus reducing risks while maximising
returns on investments. Although the holding of NCDs is considerably low among
Malaysian households, they are in fact enjoying the benefit of holding NCI)s via the
diversification of risk introduced by NCI)s in their investment portfolio held by the
banks, EPF and unit trusts.
3.2.3 Savings Bonds
Savings bond can be defined as a type of government bond that earris interest. A high
rate of interest is paid but cash is tied up in the account for a period of time. Savings
bonds are non-marketable and non-negotiable form of securities. Once they are
purchased, they cannot be bought or sold in the secondary market. In the US savings
bonds have been categorised as one of the securities issued by the US Treasury.
Other types of treasury commodities such as Treasury Bills, Treasury Notes and
Treasury Bonds are heavily traded on the secondary market.
In Malaysia, Bank Negara Malaysia issued Bon Simpanan Merdeka, a form of
savings bonds that was structured according to the Syariah principle, Bay"41-Inah
(sell and buy-back arrangement). The bonds are issued exclusively to pensioners. According to Bank Negara Malaysia (BNM), the purpose of this bond issue is to
provide assistance to retirees who depend primarily on interest income from deposits
placed with the banking institutions. The prevailing low interest rate environment has
61

adversely affected the disposable income of this segment of the population. As such, the bonds carry a slightly higher return than market interest rates.
In the press statements 12 issued by BNM, it was stated that the following are eligible to purchase BSM 04/2005:
9 Malaysian citizens, aged 55 years and above;
* Malaysian Armed Forces personnel who are on mandatory retirement; and Malaysian citizens who have retired on medical grounds (as certified by the Medical Board) under the age of 55;
With the condition that they are individually:
* Not employed on a permanent basis, and
9 Not adjudged as a bankrupt.
Four issues were made in 2005. For BSM 04/2005 the fund size is MYR 300 million,
with the profit margin set at 5% per annum, which is higher than the 12-month
commercial bank fixed deposit rates. The return from the bonds is also tax-exempt.
The profit from the bonds will be paid every quarter directly to bondholders'
designated bank account. The minimum amount that can be purchased is MYR 1,000
and in multiples of MYR 100, up to a maximum of MYR 100,000 per bondholder,
with a maximum holding of five certificates.
As savings bonds are the safest form of investment that earns a high rate of return,
this investment avenue is suitable to safeguard the financial wellbeing of elderly householders on reduced income upon retirement. This measure is a way that the
government has taken in order to ensure that poverty among pensioners is reduced.
12 Available on: httv: //www. bnm. 2 tr ., ov. rny/index. l)hi2? ch=8&1)a=14&ac=841. Re ieved on l9th December 2006
62

By investing in this type of bonds, elderly householders will be able to diversify their
savings in employee provident funds and earn higher rates of return at the same time.
3.2.4 Bonds
The corporate bond market maintained its strong position as a source of fundraising
with the Securities Commission (SC) approving 126 private debt securities issues in
2005 amounting to MYR 60.7 billion, an increase of 27% from the MYR 47.8 billion
approved in 2004. It is noted that a significant portion of funds raised was for debt
refinancing (Security Commission, 2006).
Bonds are fixed income investments, so called because the issuer of the bonds pay a
regular fixed interest or coupon to the investor who buys and holds the bonds until
the bonds mature at a specified date. Issuers of bonds are the government,
corporations and large financial institutions. Corporate issued bonds are usually
called private debt securities. Parties who buy bonds are usually large financial
institutions such as banks, insurance companies, managed funds and other
institutional investors. Individual investors do not normally participate in the bond
market as they are normally sold over-the-counter (OTC) in large amounts; an
average issuance amounts to MYR 5 million.
The size of the bond market is a fair indication of a country's financial market
liquidity. A mature bond market plays an important role in stabilising the overall
financial system of a country. In many developed countries, the market capitalisation
of the bond market is larger than that of the stock markets. As we can see in Table
3.5, the size of the bond market in developed countries is much bigger than those of
developing countries such as Malaysia, Indonesia and Thailand. Advanced markets
such as Japan and Korea show a high value of local currency bonds at 8,943.8 and 606.5 of USD billion.
63

Nonetheless, the Malaysian corporate debt market had increased 45 times by 2004 at MYR 188 billion in 2004 from only MYR 4.1 billion in 1989. The size of Malaysian
corporate bond market has reached a favourable level as it represents 37% of the
country's GDP. This is among the largest in the world (Ibrahim and Wong, 2006).
Tahle 3.5: Size of Local Currencv Bond Market Total size (USID billions) Percentac e share
Government Corporate China 527.7 62.9 37.1
_ Honq Kong SAR 79.6 19.8 80.2 _ Indonesia 52.8 87.1 12.9 Japan 8943.8 77.5 22.5 Korea 606.5 30.6 69.4
- Malaysia 114.7 42.9 57.1 _ Sinqapore 78.2 56.0 44.0 Thailand 70.2 52.1 47.9 Note: L; orporate aata mciuae rinanciai institutions Source: Asian Development Bank and Asian Bonds online as reported in Ibrahim and Wong (2006)
interestingly, Ibrahim and Wong (2006) noted that the limited size of the bond market in Malaysia was one of the important factors that made the Asian financial crisis in
1997-1998 worse. Over -dependency of the government and other institutional
investors on loans provided by financial institutions resulted in a mismatch of funding
and a lack of risk diversification. Since then, the development of the bond market has
been a priority of the Malaysian government.
Ibrahim and Wong (2006) laid out several key developments in the Malaysian bond
market. They charted its growth from the early years. The BNM was the only party
responsible for corporate bond issuance before 1993. In March 1993, the SC was
given the responsibility to act as the single regulatory body to promote the
development of the bond market. Rating agencies such as Rating Agency Malaysia
Berhad (RAM) and the Malaysian Rating Corporation Berhad (MARC) were
established in 1990 and 1995 respectively. They provide independent opinion of
aspects of risk involved in investing in bonds. A fully automated system for tendering
(FAST) was introduced in September 1996 and the Real-Time Gross Settlement
64

System (RENTAS) was launched in July 1999.13 Furthermore, the introduction of the
Islamic Interbank Money Market (IIMM) that was launched in September 2004
further enhances the development of the bond market in Malaysia.
Unfortunately, according to Ibrahim and Wong (2006), liquidity in the secondary
market continues to be hampered by the shortage of paper available for trading. Small
issue sizes coupled with the buy-and-hold strategy adopted by large institutional
investors dominated by the government-controlled funds (such as the Employee
Provident Fund and savings institutions such as the Pilgrims Fund Board) aggravate
the liquidity problem of Malaysia's secondary market.
High issues of sukuk (Islamic bonds) significantly reduce the problem of liquidity in
the bond market in Malaysia. In 2004,32% of total issues were Islamic bonds.
Another 17% consisted of Islamic Medium Term Notes (MTNs), asset backed bonds
formed 11% of total issues, and conventional MTNs, straight bonds and convertible
bonds contributed 9%, 16% and 15% respectively to the total issuance in 2004.14
Retail fixed-income securities, mainly bills and bonds, are also offered to households
by banking institutions. The EON Bank Berhad, for example, offers the following
fixed income securities to its customers.
13 See page 115 of Ibrahim and Wong (2006), BIS paper No 26, February 2006. Available online: htti2: //www. bis. ori! /t)ubVbDl2df/bispal22612. pdf#search=ý/ý22ibrahimý/`20andý/`20wonp-ý/ý2Bbnmý/`22. The link retrieved on 7" October 2006. 14 Bank Negara Annual Report, 2004
65

Tahla ? K- Tvnf-. -, nf Fixed Income Securities Offered bv EON Bank
Items Tvpes of securities Particulars 1 Malaysian Government a Issued by Malaysian government
Securities 0 Maturity periods range from 3 to 10 years Issued at par or MYR 100.00 Interest Income is exempted from tax
2 Malaysian Treasury Bills Issued by Malaysian government Period ranges from 90 days to 1 year Issued on a discounted basis Denominated in multiples of MYR 100,000.00
3 Bank Negara Bills Issued by Bank Negara Malaysia Maturity period ranges from 30 days to 1 year Issued on a discounted basis Denominated in multiples of MYR 100,000.00
4 Bank Negara Negotiable Issued by BNM based on Bay-al Inah contract Notes whereby BNM undertakes to sell an asset to
the successful participants on a cash basis and subsequently will buy back the same asset at a higher price which Is normally at par on a credit basis.
5 Private Debt Securities Issued by corporate, state agency and quasi government Maturity period ranges from 30 days to 20 years May be issued on discounted basis or coupon bearing
" All issues are rated by rating agencies as required by the relevant authority to assess the risk profile of the Issuer.
6 Banker's Acceptance *A bankers acceptance (BA) is a bill of exchange, drawn on and accepted by finance institutions on behalf of their clients, for trade financing. The tenor of financing ranges from 21 days to 200 days.
" BA is a discounting Instrument and Interest is paid up front by deducting from the principal amount. EON Bank provides both conventional and Islamic Bankers Acceptance.
66

Table 3.6: Types of Fixed Income Securities Offered by EON Bank (continued)
7 Government Investment Issue
Issued by BNM based on the Bay-al Inah concept whereby successful bidder would purchase assets from the government upon Issuance on discounted basis. The government would then repurchase the assets on nominal value to be paid on the maturity date.
8 Islamic Acceptance Bills Islamic Acceptances Bills are drawn and accepted by Islamic banks and SPI pursuant to an acceptance credit facility to finance genuine trade transaction. The goods involved in the trade transaction are tangible goods and non-haram goods and to be used in the production of non-haram goods. Islamic Acceptances Bills are Issued with minimum of MYR 50,000.00 In multiple of MYR 1,000.00. The minimum period for security is 21 days up to a maximum of 365 days.
9 Khazanah Bonds 0 Issued by Khazanah Nasional Berhad based on the Murabahah concept with no coupon payment.
Source: hn: //www. eonbank. com. my/tib/treasury-investment-products. htm. Retrieved on 13th July 2006
67

3.2.5 Shares
Securities Commission of Malaysia moved to broaden the capital market and enhance
the regulatory framework in the system, according to its press release on annual the
15 report on it activities in the year 2005 . Its major plan in the capital market had been
formulated through the Capital Market Plan (CMP) which spans ten years starting
from the year 2000 until the year 2010. Phase I covered the period of 2000-2003,
which strengthen domestic capacity and developed strategic and nascent sectors.
Phase 2 covered the period of 2004-2005. The main objective was to further
strengthen key sectors and gradually liberalise market access. Finally, Phase 3 covers
the period between the years 2006-2010. The objective is to expand and strengthen
market process and infrastructure to becoming a fully developed capital market and
enhance its international positioning in areas of comparative and competitive
advantage. As at the end-2005, which marked the end of Phase 2 of the CMP, 99
recommendations or 65% of the 152 recommendations in the CMP had been
completed, with the remaining 35% still in progress or due to be implemented in
Phase 3 (2006-2010).
As at the end of 2005, the overall size of the capital market stood at MYR 1.1 trillion
with the equity market valued at MYR 695 billion. The number of companies listed
on the exchange increased to 1,021 accounting for a total market capitalisation of
MYR 695 billion as at end-2005, compared to 963 companies with a total market
capitalisation of MYR 722 billion as at end-2004. The drop in market capitalisation
was mainly due to the weaker performance of the stock market in 2005 rather than on
the volume traded in the market. Household with medium to high risk preferences
were still investing in stocks rather than in the unit trusts. Furthennore, considerable
. Vbtml/resourcesýpress/pr 20060314. htm]. Retrieved on 13th March 2006 15 http: //www. sc. com. my/ene
68

amount of risk involved in the investment of blue chip stocks 16 encouraged household
to hold stock.
There are broad types of indices calculated in the Bursa Malaysia which reflect the
extensive range of stocks offered in the market. They act as indicators to measure the
performance of stocks held by individuals. One objective of fund managers is to
manage funds under their authority to outperform the relevant index. Good managers
are rated by their performance to outperform the index that their collections of stocks
are in. The indices are as follows:
Composite Index (top hundred companies listed in Bursa Malaysia): The
Kuala Lumpur Composite Index is generally accepted as the local stock
market barometer. It was introduced in 1986 after it was found that there was
a need for a stock market index which would serve as an accurate indicator of
the performance of the Malaysian stock market and the economy. In 1995, the
number of component companies was increased to 100 and will be limited to
this number although the actual component companies may change from time
to time. 2. EMAS (Exchange Main Board All Share) Index: The Kuala Lumpur Stock
Exchange Main Board All Share Index is a capitalization-weighted index of all
companies quoted and listed on the KLSE Main Board. The Index was developed with a
base value of 100 as of October 16,1991.
3. industrial Index: Index calculated based on performance of companies
dealing in industrial businesses.
4. Consumer Products Index: Based on performance of companies producing
consumer products.
5. Industrial Products Index: Based on performance of companies producing
industrial products.
16 Blue chip stock can defined as the common stock of nationally known companies that have a long
record of profit, growth, and dividend payment and a reputation for quality management, products, and services. The web based definition obtained from www. aneelfire. com/ii/faf]2/Plossary. htmi. Retrieved
on 14th March 2006
69

6. Construction Index: Based on the performance of companies operating in
the construction sector. 7. Trading/Services Index: Based on the performance of companies offering
trading services such as shipping and postage.
8. Finance Index: Based on the performance of companies in finance sector
such as banking and insurance services. 9. Properties Index: Index calculated based on the performance of companies
operating in property dealing.
10. Mining Index: Based on the performance of companies dealing mining
businesses such in gold and copper. 11. Plantations Index: Based on tfie performance of companies operating in
plantations such in palm oil and rubber. 12. Syariah Index: The Syariah Index was launched in April 1999. The Syariah
Index is a weighted-average index with its components comprising the
securities of Main Board companies which have been designated as Syariah
Approved Securities by the Syariah Advisory Council (SAC) of the Securities
Commission (SC).
13. TechnoIogy Index: The Kuala Lumpur Stock Exchange (KLSE) launched a technology sector and a corresponding technology index on Monday, 15 th
May 2000. This is to help spread an understanding that technology stocks are
not only confined to IT and internet related stocks, but include stocks of
companies from a broad range of economic activities which are innovative in
the development and use of technology. For example, those from the
computer hardware and software, electronics and telecommunication areas
which are technologically innovative and currently engaged in or committed
to research and development activity
14. Second Board Index: Index calculated for newly listed stocks which have the
potential for future growth.
70

15. MESDAQ Market Index (Malaysian Exchange of Securities Dealing &
Automated Quotation): It was launched on 6h October 1997 as a separate
market mostly for technology based companies listing.
The perfonnance of the indices in tenns of points and percentages can be summarised in Table 3.7. The points are calculated, usually based on the weighted average or
simple average method base, on any selected base year. For example, for the
composite index, the market capitalisation of the 100 companies is compiled in an
updated manner; information is obtained from the stock-broking companies online. The current aggregate market capitalisation will be compared to that of the aggregate
of base market capitalisation. and multiplied by hundred to reflect the value in
percentage points.
Table 3.7. - The Performance of Indices of Bursa Malaysia at the End of Year 2004 nnd 2005
End-Dec 2004 End-Aug 2005 _
Change Composite 907.4 913.8 0.7 EMAS 214.3 208.2 -2.8 Second board 110.9 88.4 -20.3 Mesdaq market 122.8 90.5 -26.3 Construction 171.3 145.6 -15.0 Consumer products 232.2 224.3 -3.4 Finance 7462.9 7378.8 -1.1 Industrial 1965.6 1983.0 0.9 Industrial products 85.1 78.2 -8.1 Mining 361.2 370.1 2.5 Plantation 2417.1 2571.2 6.4 Property 717.0 599.1 -16.4 Syariah 133.8 130.8 -2.2
r Technology 43.1 29.5 -31.6 Trading/services 1 131.9 131.9 0
Source: Economic Report year 2005/20U6 produced by the Ministry of Finance, reported in New Straits Time, Saturday, October, 2005.
71

3.2.6 Unit trusts
As at 30 June 2005, the total funds managed by fund management companies in
Malaysia amounted to MYR 115.6 billion, a 1.3% increase from the end of 2004.
Local unit trust funds, which stood at MYR 88.45 billion as at end of June 2005,
continued to be the main source of funds under management. Other types of funds
under management include the funds of charitable bodies, corporate bodies, EPF,
government bodies/agencies, individuals, insurance companies and private pension funds.
As at 31 December 2005, the total funds managed by licensed fund management
companies in Malaysia increased by 11.4% to MYR 127.22 billion as compared to
2004. The main source of funds under management continued to be the unit trust
funds, reaching MYR 99.92 billion as at end of 2005 compared to MYR 88.13 billion
as at end of 2004. This amount represented more than 78% of the total of funds under
management. Other types of funds under management include funds of the charitable
bodies, corporate bodies, EPF and EPF contributors, government bodies/agencies,
individuals, insurance companies and private pension. Table 3.8 summarises the
performance of these funds in terms of the amount they managed.
72

Table 3.8: Local and Foreign Funds Managed by Licensed Fund Management Companies on December 2004 and 2005
Source of Local (MYR) million) Foreign (US million) Funds June 2005 Dec 2004 June 2005 Dec 2004
Charitable bodies
381.56 366.23 1.11 1.00
Corporate bodies
5,804.93 6,127.95 277.15 461.91
Employee Provident Fund
6,070.85 6,385.16 - -
Government agencies/bodies
4,008.17 3,455.73 - -
Individuals 1,597.43 1,727.76 28.69 37.65 Insurance companies
853.59 901.71 36.75 3.41
Private pension funds
1,062.34 1,056.61 1.24 0.72
. Unit trust funds 88,450.79 70,757.08 161.84 184.88 Other funds 4,488.14 2960.12
1 246.35 301.16
TOTAL 112,717.82 93,738.35 753.13 990.73
Source: Bursa Malaysia's wcbsite, formerly known as Securities Commission of Malaysia. Available
on: hn: //www. sc. com. my/enp-/ht I/rcsources/stats/stat fmdec05. html. Retrieved on 18th June 2006
These overall efforts contributed to the investment management industry continuing
to grow strongly with funds under management growing from MYR 114 billion in
2004 to MYR 127 billion in 2005. The NAV of unit trust funds grew by 12.7% to
MYR 98.49 billion, accounting for 14.2% of market capitalisation at end of 2005.
The total approved fund size of the unit trust industry also grew by 22% to 267.33
billion units in 2005.
Presented with an environment where individual savings are growing into a more
prominent pool of investible assets, the investment management industry is
increasingly becoming a key intermediary in the mediation of retail savings for
financing economic activity. To facilitate the growth of investment management the
SC worked in 2005 to further broaden the range of products and investment
oPportunities available for Malaysian savers and investors. Consistent with the
government's objectives that were articulated in the 2004 and 2005 budget
73

announcements, the SC introduced new guidelines to expand the range of products to
cover real estate investment trusts (REITs), exchange traded funds (ETFs) and 2005
saw several important product innovations in the local Islamic capital market, which
effectively broadened the products and investor base of the Islamic capital market. Leveraging on the earlier introduced REITs guidelines, a set of Islamic REITs
guidelines was released in 2005, making Malaysia the first jurisdiction in the world to issue such guidelines.
As further tangible results of the SC's efforts, the Islamic bond market witnessed
several landmark issuances in 2005, including the inaugural World Bank issuance of Ringgit-denominated Islamic bonds, Cagamas issuance of the first Islamic residential
mortgage-backed securities and issuance of the first floating rate istisna' bond.
These initiatives and overall efforts at developing and promoting the Islamic capital
market have resulted in its emergence as a significant area of growth in 2005. The SC
in 2005 approved 77 Islamic bonds valued at MYR 43.32 billion and representing
71.4% of total new bonds approved and Islamic bonds accounted for MYR 9.7 billion
or 27.2% of the total funds raised; and Syariah-based unit trusts contributed 8.6% of
the industry's total NAV. 17
17 htti): //ww%v. sc. com. mV/enz/html/resources/12res U/r 20060314. html. The link retrieved on 14'h April 2006
74

3.2.7 Retirement Accounts
The biggest retirement fund is the Employee Provident Funds with assets of more than MYR 190 billion. In tenn of participants, all government servants and private
sector employees are obliged to contribute. As for self-employed individuals, at
present they are not obliged to contribute but are encouraged to do so.
Table 3.9: Top Public Sector Provident and Pension Funds in 2004 (MYR billions)
Providers Assets Employees Provident Fund 191.1 Pension Trust Fund 16.8 Pilqrims Fund Board 10.2 Social Security Organisation 8.6 Armed For es Fund 4.8 TOT L MARKET 231.4
Source: Repro(luceci trom tconomist inteingent unit (tiu) L)nlme Store. Available online at: httl2: //store. ciu. com/index. asl2? layout--show sampleftroduct id=280000228&countrv id=MY Sources quoted by ElU are from Bank Negara Malaysia and individual fund reports.
The Employee Provident Fund (Amendment) Act of 1996 allows EPF participants to
invest some of their contributions in the capital markets via mutual funds. The
government appointed 25 Malaysian financial institutions as designated fund
managers to handle the investments. The investment option, which is limited to
contributors below the age of 55 with savings of over MYR 50,000, allows
withdrawals of a maximum 20% of any surplus over MYR 50,000 for capital-market investment. Any dividends paid are directed into the contributors' EPF savings
accounts. Effective in January 2002, a new withdrawal payment scheme replaced the
old annuity scheme, allowing contributors to withdraw regular payments plus dividends upon reaching the age of 55. More changes followed in 2003 as the EPF
sought ways to lift its current 5% return on investment.
75

The EPF is an active investor in the country's infrastructure. It was the single-largest financier of the MYR 9 billion Kuala Lumpur International Airport and holds a stake in the controversial Bakun hydroelectric dam project. To enable it to finance private-
sector activity, the EPF Act was liberalised in 1991 to allow the EPF to channel up to
50% of its annual investible funds (up from 30%) into non-goverriment securities. It
has also allowed investment in the Singapore and Thai stock exchanges.
The Pensions Trust Fund, which was set up by the government in 1991 as a second
pension fund for private-sector employees, had resources totalling MYR 16.8 billion
as of the end of 2000. The Social Security Organisation, established in 1971, provides benefits to workers through the Employment Injury Insurance Scheme and the
Invalidity Pension Scheme. It had assets of MYR 8.6 billion at the end of year 2000.
The Pilgrims Fund Board, also known as Tabung Haji, had assets of MYR 10.2
billion at end of year 2000. The Fund was established in 1962 to help Malaysian
Muslims save for the annual pilgrimage to Islam's holy sites in Saudi Arabia and to
provide other services for pilgrims.
The resources of the Armed Forces Fund came mainly from its members and returns
on its investments. Established in 1972, it serves members of the armed forces,
including its retirees. It had assets of MYR 4.8 billion at the end of year 2000. Other
pension funds include the Malaysian Estates Staff Provident Fund and the Teachers'
Provident Fund. Most of the resources of these funds are invested in medium- and
long-term assets, since their liabilities are long-term.
76

3.2.8 Life Insurance
The insurance market continued to expand in reaching an increasingly important role in supporting economic and social development. The insurance industry of Malaysia
registered a second consecutive year of double-digit growth in 2004, supported by
robust growth in the life sector. During the year 2004, combined premium income for
life and general business increased at a stronger pace of 17.2% (2003: 11.6%) to
achieve MYR 22,038.9 million (2003: MYR 18,812.3 million). Both insurance
penetration and density levels have further increased. Combined premium income as
a percentage of nominal Gross National Product increased to 5.2% (2003: 5.1%),
while the market penetration rate was also higher at 37.9% (2003: 36.8%),
underscoring its growing importance within the economy in promoting economic
activity and individual financial well-being. Total assets of insurance funds expanded
by 13.1% to MYR 86,848.5 million in 2004 (2003: MYR 76,807 million) mainly due to the growth of the life fund assets. The fundamentals underlying profitability
were also stronger, with more disciplined underwriting supporting positive results in
the general sector, while further improvements in asset-liability matching were
observed in the life sector. Efficiency gains also contributed to improved results. 18
Table 3.10 presents the amount of life premium and non-life premium for Asian
countries and several developed countries. This is to illustrate the differences on the
amount of premiums of insurance especially of life insurance between developed and
developing countries in Asia. The data is the total amount of insurance and life
insurance written for the year in the relevant countries.
" information obtained from Bank Negara Malaysia. http: //www. bnm. p-ov. my/index. php? ch=174&1)g=500&ac=485. Retrieved on 3 rd September 2006
77

Table 3.10: Life and Non-Life Insurance Premiums in 2004 (Direct premiums written, in US millions)
Country Non-Life
Premiums (1) Life Premiums Total
Premiums
Percent of Total
Premiums Honq Konq 2,291 12,969 15,260 0.47 India (5) 4,330 16,919 21,249 0.66 Indonesia 1,754 1,626 3,381 0.10 Japan (5) 105,587 386,839 492,425 15.18 Malaysia (5) 2,245 4,208 6,453 0.20 Philippines 509 783 1,292 0.04 Sinqapore 3,237 6,459 9,696 0.30 Taiwan 9,385 33,851 43,236 1.33 Thailand 2,581 3,167 5,747 0.18 Vietnam 302 601 904 0.03 United Kingdom 105,241 189,591 294,631 9.09 United States (9) 603,018 494,818 1,097,836 33.84 France 65,811 128,813 194,624 6.00 Germany 106,261 84,535 190,797 588
(1) Includes accident and health insurance. (2) Non-life insurance: July 1,2002 - June 30,2003. (3) Life business expressed in net premiums. (4) July 1,2002 - June 30,2003. (5) April 1,2003 - March 31,2004. (6) March 21,2003 - March 20,2004. (7) Non-life insurance is gross premiums including a small amount of reinsurance premiums. (8) Premium in local currency in TRL billions. (9) Life premiums include an estimate of group pension premiums. Non-life insurance includes state funds.
Source: Swiss Re, sigma, No. 2,2005. Also available at: httl2: //www. intemationalinsurance. orp-/intemational/overview0table sort 72458 1 =3. Retrieved on 19th April 2006
Outside the United States, the insurance industry is divided into life and non-life or
general insurance rather than life/health and property/casualty. In 2004, world insurance premium volume, for both sectors combined, totalled $3.24 trillion, up 9.7
percent from $2.96 trillion in 2003, according to Swiss Re. The number of countries in the survey of world insurance premiums conducted by Swiss Re increased from 78
in 1995 to 88 in 2004. To be included, countries must have had reliable data and direct premiums of over $100 million from 1995 to 1998, over $150 million from
1999 to 2002, at least $200 million in 2003 and at least $250 million in 2004.
78

As for Malaysia, the level of penetration of life insurance rose marginally from 37.9%
to 38.3% from 2004 to 2005. This reflects high potential for growth in the future
years. According to the 2005/2006 Economic Report published by the Ministry of
Finance Malaysia, new business premiums of MYR 3.6 billion in the life insurance
sector were driven by strong consumer demand the attractive investment options
especially in endowment plans. Investment-linked insurance new business premium
reduced by 31% compared to the strong demand from the previous year. 190n the
other hand, there was strong growth for pure protection policies such as credit
protection policies and medical and health insurance policies. This indicates that
householders in Malaysia prefer pure insurance policies than policies that are attached
to investment performance. This may due to the attitude of householders that are risk
adverse. As insurance policies are taken to minimise risks, householders do not
prepare to add elements of risks to their investment-linked insurance policies.
In relation to family takaful (Islamic insurance), the statistics compiled by the BNM
indicate that the level of contribution has increased over the years. The same goes to
the number of new businesses that had been recorded over the years from 2000 to
2005. More importantly, the amount of assets generated from the family takaful
increased steadily from MYR 1,542 million in 2000 to MYR 4,918 million in 2005.
This reflects growth of 71.5%, 20%, 22%, 12%, 13% and 18% respectively for the
years starting in 2000. The full statistics can be seen in Table 3.11.
19 Data and information refers to Malaysian Economic Report 2005/2006 published by the Ministry of Finance. The report contains a comprehensive review of economic performance in various sectors of the economy including banking and financial services. Also available on the net at: h --
Tent News/BT/Friday/economicrel2/ecn!: V0506. t)d The link retrieved on 25th April 2006
79

Table 3.11: Family Takaful Key Indicators from the Years 2000 until 2005
As at end September September (1)
2000 2001 2002 2003 2004 2004 2005 New Businesses No. of certificates (unit) 209,256 229,199 237,037 256,035 290,538 213,653 272,917 Sums participated 12,350.7 13,990.5 14,174.8 18,330.1 36,458.1 49,835.7 31,750.4 (RM million) 764.8 952.0 452.2 511.0 603.7 478.3 828.5 Contributions (MYR million) Business in Force No. of certificates (unit) 572,354 771,256 932,212 1,128,446 1,315,195 1,256,654 1,446,777 Sums participated 34,167.7 48,559.0 53,625.9 63,573.8 88,711.9 106,635.2 96,126.1 (RM million) 1,257.2 2,019.0 2,105.8 394.2 477.2 446.4 550.2 Contributions (MYR million) Distribution of Sums Participated in Force (%) 97.2 95.2 95.9 96.6 97.6 98.0 99.1 Ordinary family 57.0 56.8 61.9 65.2 68.2 48.0 63.3 Individual 40.2 38.4 34.0 31.4 29.4 50.0 35.8 Group 2.8 4.8 4.1 3.4 2.4 2.0 0.8
- - - ... 0.1 ... 0.1 Annuity
, Investment-linked Net Contribution -- Income (RM1 841.3 1,219.8 663.8 762.5 794.4 388.3 497.8
Net Certificate Benefits (RM1 78.4 132.7 178.6 201.4 281.0 198.2 264.2 million) 44.2 53.1 68.8 50.9 120.3 84.3 112.6 Death and 2.7 4.2 3.3 6.3 8.9 7.3 6.6 disability 21.9 63.2 93.5 76.0 117.0 83.9 110.2 Maturity 9.6 12.2 13.0 68.1 34.7 22.8 34.7 Surrender Others Assets Fund assets (RM million) 1,542.4 2,644.7 3,162.8 3,861.0 4,305.1 4,163.8 4,917.9 Fund assets - 71.5 19.6 22.1 11.5 12.8 18.1(2)
Notes: (1) 9-months ending September 2005 (2) Corresponding period growth
... Negligible Source: hqp: //www. bnm. izov. mv/index. php? ch=174&pg=500&ac=485. Retrieved on 16 Ih October 2006
80

3.3 Conclusion
Savings and wealth accumulation is vital for households for two reasons: for
retirement funds and for precautionary purposes. This study concentrates on the life-
cycle effect on savings and wealth accumulation. Householders are assumed to have
their expected average level of consumption match their actual consumption to reduce the gap between their expected and actual consumption. Savings and the process of
wealth accumulation will be the residual values of the matching process. Using
various types of financial assets available in the market, householders can increase
their amount of wealth according to their level of risk and return consideration
characterised by each financial asset. Householders' investment allocation or how
they select their range of financial assets affects the amount of wealth and the speed
of achieving their financial target as each asset has different characteristics from the
other. The allocation process made by householders can be explained by many factors
such as their level of income, wealth and net wealth as well as other demographic and
specific factors such as their level of financial literacy. This research aims to ascertain
whether variations in the level of demand for different types of financial assets exist
and to look for factors that cause these variations to occur.
81

CHAPTER 4
FINANCIAL PLANNING, FINANCIAL LITERACY AND ISLAMIC FINANCIAL PLANNING IN MALAYSIA: A SURVEY
4.1 Introduction
in the study conducted by Elmerick et aL (2002) that examined the use of financial
planners by US households, it was revealed that 21.1% of respondents in the survey
engaged in financial planning either in the form of comprehensive financial planning,
credit or borrowing and investment planning. Their study further analysed the
characteristics of householders engaging in financial planning using economic and
socio-demographic variables.
In respect of this, the financial planning division of AICPA in 1995 conducted a
study to assess the needs of clients and how they valued the service provided by
certified financial planners. In the first phase of the study, the internal focus group
consisting of members of AICPA's financial planning division were used to examine how clients chose financial planners and the nature of competition in the market. In
the second phase, an external focus group study with 45 users from either financial
planning services or CPAs were conducted.
Among other key findings of the study are the expectation of long-term relationships
between clients and financial planners, the experience requirement by clients, a
compensation method favoured by the client, which is on a fee basis instead of
commissions, and the responsiveness of financial planners to their clients' needs. Clients also stated that they desired financial planning assistance when they entered a
new phase of life such as growing older or having children and when they
experienced increased of income or assets. The lack of time to handle their personal
82

finances also was quoted as a reason for them to appoint a personal financial
planner. 20
Both of the above surveys provided this study with the idea that financial planning
services had been considered important by householders, especially in the case of the U. S. This chapter examines the reasons why householders decided to use professional
services. Issues on financial planning, theoretical frameworks and the history of financial planning association will also be reviewed. As professional advice on financial planning is beneficial to improve efficiency of household portfolio diversification, we will examine various roles that have been played by financial
planning associations as well as independent financial planners in household portfolio
management. Furthermore, issues related to the personal financial planning industry
such as the building of its theoretical framework, tools development and marketing initiatives will also be addressed in order to provide a comprehensive discussion the financial planning industry. The aim of this chapter is to link the existence and the development of the financial planning industry with household demand for financial
assets in a portfolio allocation.
4.2 Financial Planning Industry and Financial Planning Association of Malaysia (FPAM)
This section provides a review on the importance of the financial planning industry to
the financial markets. In addition, it provides an examination on the role of financial
planning associations in providing training to prospective financial planners and
encouraging financial education in Malaysia. Finally, several aspects on the
association that encourage the practice of financial planning is explained.
20 Perception and Expectations of CPA Financial Planners", Journal of Accountancy, June 1996.
83

4.2.1 The Importance of Financial Planning Industry to the Capital and Financial Market in Malaysia
The personal financial planning (PFP) industry is a part of the capital market's
regulatory framework and the growth of the PFP industry will shape future changes in capital market regulations. The PFP industry may enhance the governance and the
ethical standards of financial and capital market as well as the training and
educational programs. This is because, in the PFP industry, training and the
development of financial planners are vital to ensure that planners have the ability to
continue to advise their clients amidst the changes of both the financial products and the financial situations of their clients. Financial planners, thus, can be regarded as an important link between investors and the capital markets as they guide and facilitate
investors in financial asset acquisition.
How the PFP activities may enhance the performance and development of segments
of financial and capital markets namely banking, insurance, trust fund and social
security scheme industry is to be discussed. PFP activities performed by householders
contribute massive funds which are managed by the above institutions to mobilise
their investments. The route to increased savings and investment in a country can begin with the involvement of individuals via personal financial planning, which in
turn promotes the development of institutions in the capital market. This study
closely examines how PFP induces the development of Islamic financial institutions
such as Islamic Banks, takaful operators and fund management companies. This
study also discusses the social security scheme at the end of the sub-chapter.
Islamic banks, generally, provides savings and current accounts, certificates of deposits, real property financing, investment accounts such mudharabah scheme and
other customer services products such as buying and selling of currencies, telegraphic
transfer service and so on. Their products range from safe, medium and risky types of
assets.
84

Internet research on the central bank of Malaysia, Bank Negara Malaysia, revealed that significance numbers of banks are offering private banking facilities to their
customers. The institutions are doing this to tap the market for high net-worth individuals as well as for middle income group of individuals. For example, the Bank
Islarn Malaysia Berhad and the Islamic compliant operations of Maybank Berhad are
offering private banking services under the heading of private banking and investment services such as the management of personalised accounts. The banks also
offer real estate management to its customers. However, comprehensive personal financial management services by the banks are still lacking, in particular for
insurance and takaful products which are provided by separate institutions. This may be due to the exclusive existence of takaful institutions to promote their own range of
products and services.
Takaful operators, on the other hand, provide Islamic type 'insurance' which may act
as a risk management tool for individuals to protect themselves against loss or damage to properties, vehicles or merely for the purpose of providing their families
with a sum of money upon death or permanent disability. The major difference
between conventional insurance and takaful is the management of a contributor's
money. In a conventional scheme, an insurance company operates as a different entity
providing the service of risk manager, while a takaful operator acts as an agent
managing contributor's monies in accordance with the concept of tabarru'
(contribution, donation or offering). Another instrument used in takaful is
mudharabah, where the takaful operator shares the profit of a takaful operation with
the contributors. Contributors in this case agree to collectively donate the pooled funds to the less fortunate participant. This can be an effective tool of risk
management among participants, and a profit and loss sharing agreement between
participants and the takaful operators.
85

In Muslim countries, the market for takaful policy is large and relatively untapped. The market is large because there are basically over one billion Muslims making up 20 per cent of the world's population. In general, Muslims are sceptical towards the
concept of life insurance as they consider that fate is all in the hands of Allah so that
nothing can be done about the future. That is why we can see minimal involvement in
insurance especially in life insurance policies in Muslim countries such the Gulf
countries. The highest uptake of life insurance policies is in Malaysia with $72 spent
per person in 1994. Compared this with over $1,000 spent per person on life
insurance in most other countries, whose national income per capita may be similar or lower than that of some Muslim countries. The per capita expenditure on life
insurance in the UK was $1,281 where GDP is around $16,400 per capita in 2004 21 .
In contrast, in Kuwait the per capita spend was $14 while its GDP per capita was
around $17,600. Though it is true that everything is in the hands of Allah and Muslims have to believe in Qada' and Qadar, they are not abstained from helping
each other out in the case of misfortune which is central to the establishment of
takaful.
As for Islamic unit trusts, their establishment has encouraged the participation of
middle-income individuals in investment. The advantage of unit trusts is that they are
an affordable investment tool. Investors indirectly invest in real properties, equities
and commodities through different mixes and matches of unit trust funds via the
ownership of units. Except for the special institutions established to offer various
types of unit trusts products to cater different needs of investors, fund units are
usually promoted by takaful institutions and banking institutions. Furthermore, trust
fund management is in the hands of professional financial managers.
" Statistics in this paragraph obtained from www. failaka. com retrieved on 23 rd May 2006
86

In a speech delivered in her role as the Director of Market Policy and Development 22 Division of Securities Commission of Malaysia, Dr Nik Ramlah Nik Mahmood ,
said the key success factors for Islamic funds are the availability of Syariah-
compliant stocks, investments and indices, Islamic brokers and financial planners,
experts in fund management and a general awareness of the trust unit concept and a
strong regulatory framework and guidelines. Thus, to further develop the Islamic
capital market in Malaysia, we have to make sure that all above prerequisites are well
catered for. Without the contribution from financial planners, the delivery of financial
products to investors will be less efficient.
The establishment of Islamic banks all over the world since 1960s and of a takaful
company in Sudan in 1979 and a Syariah-compliant ASM Mara Unit Trust in
Malaysia in 1968 has given mass choices for individuals to build their financial plans.
With the establishment of these institutions described above, Muslims have been able
to increase their participation in Islamic compliant portfolios and thus increase their
wealth in a manner pleasing to Allah S. W. T.
Social security schemes are not private corporations like other institutions discussed
in this chapter. The development of this independent institution of social security is
largely due to the massive financial contributions provided by employees. In
Malaysia and Singapore, contributors can actively control their contributions to these
provident funds. There are specific accounts which exist for them to invest in
approved unit trusts as well as managing their risks. This is particularly true for
personal medical aspects. the minimal control of contributors in their contributions
limits the role of any social security scheme in the portfolio allocations of
householders. But the case does not rule out the fact that the existence of social
" The speech had been delivered during the seminar on Islamic Private Securities: Exploring New opportunities in the Capital Market. The full text is available on the net at: http: //www. sc, com. my/enehtmi/resources/sl2eech/2001/sp2OOlO924.12df (the link retrieved on 31 July 2006).
87

security schemes have contributed to the non-discretionary savings among households.
It is worth mentioning that the management of social security schemes in the form of
employee's provident funds in Malaysia are currently managed using conventional
principles. The justification of the management not to manage the fund using the
Islamic principles is due to lack of Islamic financial products for the funds to be well diversified. Furthermore, the lack of short and middle-term investment avenues hinders proper management of the liquid assets of the fund.
The existence of stable social security schemes may affect the development of financial planning industry both in positive and negative way. Stable schemes are beneficial for resource mobilization from individuals to institutions which have more
expertise to manage the fund to generate good returns on investment. At the same
time, stable and efficient schemes might also discourage individuals to save and invest having ideas in mind that they have enough savings and cover in the event of a health crisis. Total dependence on social schemes is unwise, since the scheme is open
to the risk of mismanagement and financial crisis which is remote from the control of
participants.
In a nutshell, personal financial planning activities, if intensified, may contribute to
the development of industries in the capital market. Measures should be taken to
encourage individuals to participate in personal financial management and to
restructure related institutions to be able to manage and invest funds under their
control for the purpose of increasing the national level of savings and investments.
88

4.2.2 Reasons for the Growth of Financial Planning Practice in Malaysia
Increasing the percentage of individuals interested in engaging in personal financial
planning activities is due to several factors. The perception of the public changes in
time to favour services from independent financial planners which have been seen as
providing comprehensive financial advice in contrast to specific advice from different
sets of other providers in financial matters.
Previously, the public at large had to rely on various professionals in relation to their
financial affairs. In the US, Gentile (1998) reported that there were five most
frequently used sources of financial advice. From 7000 consumers involved in the
survey, 55% relied on advice from accountants, 51% on stockbrokers, 44% on advice
from financial planners and finally 6% on financial advice from bankers. Note that
the percentages are not mutually exclusive as an individual may consult with more
than one financial advisor at a time. However, the trend evolves to a greater demand
for financial planner as a sole provider of financial advice due to the need for
comprehensive financial planning.
Researchers might be able to forecast the development of financial planning in
Malaysia by looking at several factors to which the development of personal financial
planning is accruing. Under the heading of economic, socio-economic and regulatory
factors, we will discuss vital factors generating the development of the personal
financial planning industry in Malaysia.
The current economic setting of the steady gr6wth of the financial services industry
triggers the industrial development. The number of companies listed on the Kuala
Lumpur Stock Exchange has increased from 732 in 1998 to 932 in 2006. Unit trust
counters also multiplying to 243 funds with more than 10 million accounts. There is
also a parallel blooming of Islamic equities and debt securities such as in the issuance
of USD 600 Million Malaysian Global Sukuk in 2002. Due to such development,
89

investors are expected to be more actively trade in the capital market thus creating a need for advice from financial planners. Apart from offering greater products suitable to the vast number of individuals participating in the financial market, the development of this market also introduces complexity in the financial instruments on offer. The public, hence, is in even greater need for financial advice from
professionals than ever. Islamic financial products offer Syariah compliant savings and investment vehicles to Malaysian public, the majority of whom are Muslims. However, different concepts and terms are used in Islamic financial products call for
professional assistance, since these terms are rarely understood by the average individual, perhaps due to the fact that these are new concept of operation in contrast to well established conventional banking and finance.
The growth of a middle class group in developing countries also gives an impact to
the development of the personal financial planning industry. Warschauer (2002)
reported that middle class individuals are able to achieve their goal of wealth
accumulation through proper financial planning in contrast to wealthy individuals
who have usually inherited significant wealth from their ancestors. He justifies his
argument by reasoning that financial planning association around the world, being
members of CFP international board, are constituted by countries having a significant
percentage of middle class people. II out of 17 member countries are Organisation of Economic Co-operation and Development (OECD)23 countries that are relatively
advanced economically. The remaining are developing countries having a sizable
middle-income class such as Malaysia, Hong Kong, Singapore, Brazil and South
Africa. The FPAM of Malaysia in line with this argument has launched a campaign
exhorting greater participation from middle income class individuals in personal financial planning. They have emphasized the fact that public individuals do not have
to be wealthy to be involved in financial planning. Middle income class groups are
23 The list of OECD countries can be viewed at htti2: Hen. wikipedia. orWwiki/Orp-anisation for Economic Co-operation and Development. The website was visited on I November 2006 for the current lists of OECD countries with the founding members and joining members.
90

likely to become major clients for certified financial planners for they are usually
concerned with financial issues such as cash flow management, debt reduction
advice, income tax planning, investment planning in unit trusts and shares as well as
advice on retirement planning.
With their diverse attitudes to financial planning, the middle income group, are the biggest potential group for growth in the personal financial planning industry.
Financial literacy and awareness on issues of personal financial planning, however,
are very important before this group of individuals can be the core base group clients for financial planners. The industry may not be able to multiply in size, if its
dependency on wealthy clients with high assets and net income is not eliminated. Wealthy individuals form only a minimum percentage of population as compared to
middle income groups who represent about 50% of the population given the
satisfactory levels of income distribution in Malaysia.
Changes in the social environment as a result of economic forces can be termed as the
socio-economic factor. The society has been changing enormously due to such
economic and financial related reasons such as increasing life expectances, the
adoption of hectic modem lifestyles and increasing competition in the work place.
Life expectancy is likely to increase in future years due to the advanced nature of
health services and the improved quality of life. In developing countries, the elderly 24
population is expected to increase by 80% by the year 2025 , making the activity of
personal financial planning vital in order for this group of individuals to secure a
retirement income. The rapid pace of modem life also limits the individual's time
which can be spent in managing personal finance. With the availability of advice from professional financial advisor equipped with state of the art financial tools,
individuals are more confident to plan their finances. With the time limitation, the
tendency is high that they will either seek advice from independent financial planners
24 The speech delivered by Dr Nik Ramlah of Securities Commission of Malaysia available online: rni/resources/speech/200 I /sp20010924-ndf. retrieved on 23rd July 2006
91

or do no planning at all. Ignoring personal financial planning and deferring financial
decisions will result in sub-optimal financial situations that will costs individuals in
their later years.
A competitive labour market, on the other hand, imposes pressures on individuals to
maintain their skill levels to cater for changes in the latest trend and market demand.
Less job security and the trend for temporary job assignment put pressures on individuals to work hard to maintain their level of competency in their specialisation.
These situations induce individuals to engage in constant training, development and
re-education programmes even though they are costly and time consuming. Given
that, less time is available for individuals to plan their personal finances themselves.
Modem parents are also usually concerned with the future education costs of their
children. This is because of changes in government policy on college funding where
university scholarships are no longer available. University students are now facing
huge costs to repay their education loans. To avoid their children facing debt before
even securing a job, parents feel obliged to provide funding for their education. Unit
trust funds, special saving accounts and unit-linked insurance are typical products
available for parents to choose from. But due to the size of the problem, and need for
long-term planning to raise such huge amounts of money, individuals now usually
need advice from professionals to manage this specific issue.
Regulatory issues pertaining to the financial market and retirement accounts will also
change the way individuals manage their personal finances. The self-contributing
Employee Provident Fund of Malaysia (EPF) is now slowly changing their model of
operation to draw in more contributors. From time to time, contributors are now
entitled to participate in investment decision in the investment section in their
accounts. Contributors are also given several choices on the types of income they
would like to receive during their retirement; whether to purchase an annuity or
receive a lump sum payment.
92

The changing scenario of the EPF from a government managed provident fund to
self-managed accounts was done to be in line with the trend for self-managed
retirement accounts which exist in the western countries. The US and UK
governments are now educating their public to be more financially literate in order to
mange their own retirement savings. Due to the massive risks involved in retirement
schemes, governments around the world are now obligating their former role of
providing pensions for retirees by sponsoring the development of self-managed
retirement accounts such as Individual Retirement Accounts (IRAs) and employer-
sponsored retirement plan such as 40 1 (k), 403 (b), or 45 7 plans. 25
Individuals anxious to safeguard their retirement income are very likely to consult
professionals to advise them. Concerns for retirement planning are diverse ranging
from the need for steady income to maintaining their normal standard of living. This
is difficult to accomplish in the current world of high taxation, increased prices of
necessities, the changing trends in the financial markets as well as changes in
government regulations. Retired individuals are also likely to have to continue to pay
the costs of their children's education and mortgages debts. For these reasons, proper
planning by the young is important to secure a debt-free and financially adequate
retirement income.
25 The 401(k) plan is a type of employer-sponsored retirement plan that allows worker to save for
retirement with the benefit of withholding of tax until withdrawal. The most common option made by the participant is to self-manage the account. Usually, it is the participants who actively manage the account. Participants can select to invest in ranges of investment such as mutual funds that contain selections of stocks, bonds and money market instruments. In the less common trustee-directed 401(k) plans, the employer appoints trustees who decide how the plan's assets will be invested. Other retirement plans are Individual Retirement Accounts that allow participants to hold cash and cash equivalents to be invested in most types of securities. The account is also tax exempted until withdrawn. There are many types of IRA which may be either employer provided plans and self- provided plans. Other types of retirement plans are 403(b) and 457 plans. A 403(b) plan is a tax advantaged savings plan available for public education organisations, some non-profit employers and self-employed ministers in the U. S. It has a tax treatment extremely similar to a 40 1 (k) plan. 457 plans, on the other hand are types of tax advantaged defined contribution retirement plan that is available for government and certain non-government employers in the U. S. Additional information can be obtained from hn: //en. wikir)edia. oriz/wiki/401(k). The link visited on I November 2006 for the information briefed in this footnote.
93
Researchers have identified the trend towards higher risk investments by individual
investors. This phenomenon increases the demand for professional financial planners. Kennickell et aL (2000), for example reported that the volume of safe assets decreased from 33% of investors' portfolios in 1966 to 16% in 1998. The way that insurance was viewed as a method for hedging risks has also changed as variable life insurance products grew from zero in 1966 to 26% of all life insurance in 2000. Conventional savings-based insurance also reduced from 77% of all life insurance to 58% in 2000. The trend towards risky investment undertakings might reflect increased risk toleration due to a higher level of financial literacy among investors.
They are now beginning to become involved in investment activities per se rather than simply saving for retirement or for precautionary purposes. By engaging in investing activities, they are showing a willingness to take higher risks for investment
gains. When personal financial planning was regarded as a mean for managing
personal risk, the role of independent financial planners was vital, especially in the
case of individuals who have risky investments. Moreover, financial planners are trained professionals usually having the luxury of latest financial software, so that
they can suggest the best financial advice to manage the risks involved.
The downturn of the financial markets around the world from the major regional
crisis in Asia in 1997 and Brazil in 1998 to the economic slowdown of the Japanese
and American economies in late 1990s and 2000s introduced vulnerability to
individuals who had participated in the financial markets. One of the ways to manage
exposure to risks in financial markets is through investment diversification, which is
at the heart of the financial advice in investment planning offered by financial
planners.
94

Finally, the establishment of the CFP Board as a formal institution acting as the
standard-setting body in the industry give impact to public perceptions on the subject. Individuals now are more confident to engage in personal financial planning as they
may place their trust in certified financial planners who have been trained and
educated with the relevant skills. Formal designation for independent financial
planners has also increased public confidence due to the liability coverage. Financial
planners are now fully responsible for their financial advice in drafting an
individual's financial plan. Financial planners are now covered by liability insurance
schemes, in which the premium rate depends on the type of advice offered and the
numbers of years of experience that they have. Being able to manage various types of
risks helps financial planners to engage individuals who thus are confident enough to
seek their financial advice. In other words, individuals are attracted to hiring financial
planners now that the latter owe a degree of duty of care and responsibility.
The establishment of the Financial Planning Association of Malaysia (FPAM) in
1999 as a membership organization of CFP council enabled the introduction of the
relatively new practice to the Malaysian public. FPAM educated the public and
potential customers via websites and articles about aspects of personal finance such
as retirement and credit management. It also has been an umbrella for a handful of
certified financial planning corporations which aim to provide financial planning
services specifically to individuals.
95

4.2.3 Introduction to FPAM
The personal Financial Planning Association of Malaysia (FPAM) was established in
Malaysia on 13 th of December 1999. The organization is relatively new to the capital
market industry and has promoted the Certified Financial Planner (CFP) certification
process.
FPAM's main target groups are the Malaysian public and the small business
enterprises that are in need of strategic and systematic financial planning. Public
investors and small business enterprise owners are less likely to hire accountants and
other specialists to assist them in making business decision. Thus, the CFP provides
an advisory service on financial matters in order to achieve minimal risk exposure as
well as generating higher rate of returns for their clients. To cater for the needs for
comprehensive personal financial planning, the association has boosted itself with an
abundance of resources from individuals from such diverse areas of financial services
as insurance, unit trusts, banking, legal services, stockbroking, accounting and asset
management (FPAM, 2003). The reason for its establishment as cited was to educate
Malaysian public on the importance of personal financial planning.
FPAM is an affiliate of the Financial Planning Standard Board (FPSB) which is now
currently a division of the International CFP council. International CFP council's
main concern is to promote the licensing of a certified financial planner mark around
the world. The council itself was established in 1990. FPSB was created specially to
realize the goal of internalizing the certification program and promoting
professionalism in the industry. There are currently 20 financial planning associations
in countries around the world as affiliates to the FPSB. These organizations are non-
profit motive bodies, whose main aims are to produce certified financial planners as
well as promoting standards in financial planning practice. Financial planning
associations exist in various parts of world including developed countries, European
countries as well in developing countries. In Asian countries particularly, personal
96

financial planning associations exist in India, Singapore, Hong Kong and Malaysia.
Other affiliates are the United States, Canada, Switzerland, the United Kingdom and
several other European countries such as Belgium, Germany and France.
The personal financial planning industry is a self-regulated industry, so that the CFP
Board and FPAM are responsible for setting standards and offering practice guidance for independent financial planners to adhere to. Recommendations on good practice
and ethical requirements are also formulated by these organizations.
Citing from the organization's website 26 , the objectives of FPAM are as follows:
To establish a professional self-regulatory organization to benefit the public by fostering professional standards in financial planning;
ff To introduce the concepts of financial planning to practitioners and other
related professionals in the financial services industry;
w To develop practice standards for the profession in Malaysia;
0 To establish open dialogues with financial services entities and encourage
them to adopt ethics, education and practice standards for their
representatives;
0 To develop strategic partnerships with consumer groups to promote the
importance of financial planning;
To promote and assist academia in establishing a knowledge base for financial
planning in Malaysia; and
To strengthen cooperation with the Certified Financial Planner Board of
Standards in Denver, Colorado and to work with the International CFP Council to develop cooperative policies that promotes CFP certification as the
globally recognised standard of excellence for financial planners.
26 www. foam. org retrieved on 12'h March 2004
97

Certification programs offered by FPAM are subjected to several requirements. Candidates have to go through four certification requirements. They are education,
examination, experience, and ethics. Modules for examination currently stand at six
modules with a distinctive feature for the Malaysian environment. One specific
module had been introduced to prepare future certificate holders to be able to advise
on Islamic personal financial management.
There are various roles to be played by financial planning associations that help
householders to structure their portfolios. Apart from providing the certification
program and educating the public on the awareness of financial literacy and personal financial planning, they are also responsible for preparing standards and ethical
guidelines. They also act as watchdog to monitor conformance of personal financial
planners under their license to the standards and regulations in force. Personal
financial planning associations in order to increase participation from the public may
engage in marketing and promotion initiatives. The role played by personal financial
planning associations is examined in turn.
The aim of financial planning associations is to offer professional, well-trained
independent financial planners whose trustworthiness in the eyes of the public is
supported by a well-defined certification program. The CFP Board, since 1990 has
designed requirements for a certification mark to be passed to individuals upon
satisfying four major requirements. These requirements are meeting educational
requirements, passing certification requirements (examination), adhering to the Code
ofEthics and Professional Responsibility and Financial Planning Practice Standards
and finally meeting the level of experience needed in the industry. Warschauer (2002)
offer readers a comprehensive review of the certification program offered by the CFP
Board. Various requirements for certification including education, examination,
experience and ethical requirement are discussed in detail.
98

The education requirement may be satisfied by prospective certificate holders
choosing from three options offered by the Board. The education requirement was
updated with effect from l't July 2002, in the case of Malaysia. This requirement forms the examination requirement of the CFP Board. Individuals with appropriate
qualifications are entitled to partial exemptions as are those eligible for a challenge
status do not have to sit for the examination. The three options offered are the CFP
certification course, the partial exemption on modules and the CFP challenge option. For all three options, prospective certificate holders are required to enrol with
registered education providers and those candidates who needed to sit for the
examination have to have valid membership in order to qualify.
As for the Option A, namely the CFP certification course, it involves six distinctive
modules. Certification course module will be summarised in the table 4.1.
Table 4.1: Option A of CFPTm Certification Course Offered by FPAM
Module 1 Foundation in Financial Planning Module 2 Risk Management and Insurance Planning Module 3 Tax Planninq Module 4 Investment Planning Module 5 Retirement Planning and Estate Planning Module 6 Financial Plan Construction and Professional
Responsibilities Source: www. fparn. org. Retrieved on 12- March 2004
In addition, FPAM launched the Practice Module I- Islamic Financial Planning
course in October 2003. This course complements the CFP certification course, and
equips certificants to work with conventional and Islamic financial planning clients.
For Option B- Partial exemption on modules, individuals with the stipulated
educational background or members of approved bodies are entitled to apply for
partial exemptions from the board. Details are shown on the association's website.
99

Warschauer (2002) makes a point that the most disputed criteria for meeting the
educational requirement is the challenge status option, which is option 3. This option
enables individuals wanting to be the holder of a certified financial planners'
certificate to file for challenge status. The board accommodates quite a diverse range
of education backgrounds for this reason. Included are individuals with accounting
professional status such as MIA, CPA (M), CPA (Aust. ), AICPA, CA, ACCA, ICMA
and AIA. Company secretaries such as ICSA and Fellows of MACS are also
accommodated. On top of this, Chartered Financial Consultants, Chartered Financial
Analysts and PhDs in Business Administration, Accounting or Economics as well as Master's degree holders in Business Administration, Finance, Economics and Accounting are also entitled to file for challenge status. However, individuals entitled
to challenge status still have to undertake Module 6 in constructing financial plans for
clients as a practical training in constructing comprehensive financial planning when
they become certified financial planners. In addition, they have to learn about
professional responsibility that covers ethical and standard practice provided by the
Board.
With the wide opportunities for entitled individuals to apply for challenge status, Warschauer (2002) commented that the efforts taken by the board threaten the
viability of registered programs i. e. the certification course of Option I described
above. He argues that no other profession allows a substantial portion of its
examinees to avoid the educational component as is the current practice of the Board.
The board, on the other hand argued that such considerations were made to encourage
various professionals related to financial planning industry to enrol as financial
planners. In a related development, FPAM of Malaysia lobbied Malaysia's Securities
Commission (SEC) to proposed amendments to the Securities Industry Act to
regulate who can be called a financial planner. The Board proposed that only certified
members of CFP under the Board should be called a certified financial planner. The
amendments are expected to be in the near future.
100

On top of the education and examination requirement, certificants have to possess
experience related to the industry. For example, all certification course candidate as
well as candidate entitled to partial exemptions and the challenge status option are
required beforehand to gain experience in one or more fields related to financial
planning such as insurance, mutual funds, securities, asset management, accounting,
estate planning, banking, taxation, trusts, retirement planning and financial planning.
Continuous education programmes must also be attended from time to time. The
Board employs a points system in order to track the ongoing education to be sought by the certificate holders. Certified financial planners must in total accumulate 30
points in two years for them to secure their future membership status. Topics included
for ongoing education range from investment strategies, tax updates, Islamic financial
aspects and standards and ethical issues.
Finally, like other members of professional bodies, CFP certificate holders have to
undergo continuous training that carry points for the purpose of renewal
requirements. In this respect, certification by the board of those engaged in the
financial planning industry will produce possible benefits as well as attracting various
costs to the planners. There are various benefits that flow from the certification. They
include enhancement of public acceptance, increased numbers of long-term clients
and the marketing benefits. The downside of certification is the increasing liability
attached to financial planners once they are thought as professionals. It is argued, however, that the benefit from certification is greater than the potential liability to be
faced in the future (Warschauer, 2002).
Ethical and standards were also introduced in the financial planning industry in order
to promote professionalism so that the public can be protected. By adhering to
relevant ethical requirements and practice standards, certified financial planners are
obliged to act objectively and professionally. In offering advice to their clients, financial planners must device plans which are not only sound from a theoretical and
101
.,
0-

technical point of view but conform with the industry's norms as far as principles,
rules and ethics are concerned.
There are three main institutions involved in developing an ethical requirement and
conforming to standard practices in the industry. The responsibility as the main
standard setter for the industry is held by the CFP Board. Since the Board was the
first institution to introduce the concept of personal financial planning in the financial
market, it is responsible for promoting adequate standards of practice to protect the
public. The Board has also been the main provider of independent financial planners
since its establishment in 1985.
The CFP Board recently produced its ethics and practice standards for certified
financial planners to abide by when engaging in consultancy. Apart from the CFP, the
major player, initiatives promoted by other personal financial planning service
providers such as certified financial accountants and certified insurance providers can
also significantly enhance the development of ethics and practice standards for the
industry. Furthermore, close communication between the CFP Board and other
comparable international bodies such as International Standardisation of Organisation
(ISO) will enhance and accelerate the adoption of higher standards.
4.3 Financial Planners and Household Portfolio Allocation
As indicated, the role of financial planners is to provide advice to their clients on how
to establish financial goals as well as on financial products that suit the plan. In order
to operate as a professional party that offers advice on financial plans, financial
planners have to work within the established framework that governs their practice. Thus, frameworks and models in which financial planning operates is discussed. In
addition, the roles of financial planners during the process of portfolio allocation are
discussed, in particular on the acquisition of financial assets.
102

4.3.1 Theoretical Framework and Models for Financial Planning
The discussion on the lack of a theoretical foundation in the financial planning industry was made by Cohen (1988), Warschauer (2002) and Black et aL (2002).
Cohen (1988) specifically addressed the issue of the needs and prospects of research in personal financial planning.
In determining whether it is better for individuals to seek advice from independent
financial planners, we cannot ignore the theoretical hindsight of Black et aL (2002).
In their study, they addressed the gap in academic and theoretical research. They
proposed models for personal financial planning delivery by suggesting two models:
a generalist model and planner-delivery model. They used Modem Portfolio Theory
(MPT), which is relevant to most areas in finance as the base for their delivery model. Their main concern is to theoretically analyse whether the practice of hiring
independent financial planners referred to, as 'the planner model' in their research is
superior to the 'generalist' model. They discussed various advantages and disadvantages of the planner model. They argued that the planner model is superior because of its advantage: improved diversification of clients' portfolios and improved
economies of scale.
Economies of scale may be promoted in a planner model due to the fact that the costs
of holding and monitoring portfolios may be reduced with the assistance from the
financial planners. Costs of research in searching for suitable products to be included
in portfolios are also minimised, owing to the intensive training and specialisation of financial planners. By offering explanations on the prevailing reasons for hiring
personal financial planners as well as exposing readers to the danger of using the
planner model in managing personal finance, one might be aware of caveats
surrounding such planner model. Black et aL (2002) also cautioned readers on the
possible drawbacks of the model: the threat of under-diversification, agency problem
103

rose between planners and clients and over-dependency of clients to their financial
planners.
Elmerick et aL (2002) considered the point made in Black et aL (2000) and conducted
a survey on the use of financial planners by US households. They discovered that
consumption economies of scale really do exist if households choose to manage their
financial affairs via a personal financial planner. Economies of scale is achieved
when one party is specialising in doing what it does best thus reducing costs of
operations. They found that householders who hire financial planners can reduce the
cost of searching for the right products to be included in their portfolios and the costs
of monitoring them.
Warschauer (2002) also pointed out several cases which may act as challenges to the
current state of the profession. Players in the industry fail to agree on vital issues such
as the need for standardised practice for ratio analysis in measuring clients' risk. He
drew attention to lack of fundamental theoretic guidance, which calls for the
development of a theoretical model. He illustrated the case using the issue of disagreements among practitioners on using a debt ratio it had been established by
Mason and Griffith (1988) as a powerful tool to calculate risk of corporations and individuals. To make the application of debt ratios handy to practitioners, Geringer Ct
aL (1996) suggested six ratios related to solvency and credit standing. Unfortunately,
research materials regarding the issue are not yet incorporated in the theoretical basis
in the personal finance books and for structuring financial plans for clients until now.
Another example to illustrate the lack of an adequate theoretical basis is the
measurement of liquid resources needed by individuals. Currently, CFP Board
materials recommend individuals to hold six months of expenses as liquid resources in their financial plan. The simplistic approach without proper backing of any
theoretical research on this particular subject is an indication of the need for decision-
model research (Warschauer, 2002). Warschauer also commented that despite rapid
104

development in personal financial planning industry in the past 40 years, limited
theoretical research limits the ability of financial planners to improve the quality of
their advice to their clients.
A possible way out of the problem of the lack of a theoretical foundation is to start developing one from the point of personal risk management. Various activities in
personal financial planning, ranging from an evaluation of the current status of financial wellbeing to managing risks through insurance and investment activities. Bodie (2002) and Shiller (2003), in an attempt to do that, provided a theoretical
explanation and practical suggestions on the subject of personal risk management.
In developing a theoretical framework for personal financial management, Bodie
(2002) proposed the paradigm of life-cycle finance. In his opinion, the measure of
wealth for individuals should be to maximise the lifetime consumption of goods and leisure. Planning time-frame also should be in many periods, thus resulting in stocks
and other equities to be as risky in the long-term as in the short-term. This is different
to the conventional finance approach to measurement of wealth maximisation and
single period time frame, which denotes that equities are safe in the long term.
Based on this idea, Bodie (2002) suggested a new breed of retail investment products
such as structured standard of living contracts, which takes into accounts the effect of
inflation in 'annuity-like' contracts, and targeted accounts such as tuition-linked
certificates of deposit. These products are contrasted with the use of mutual funds as a
vehicle to increase the diversification of retail products in conventional finance.
Bodie's view on life-cycle based financial planning may be further studied and taken
into consideration by financial planners in constructing financial plans for their
clients. He argued that by including life-cycle financial products in their portfolios, householders are able to manage their risks and secure their desired level of returns
taking into account their age characteristics along with other necessary
considerations.
105

Shiller (2003) pointed out that personal financial planning is basically an exercise in
personal risk management. In line with this, efforts should rightly be taken to address
major risks faced by individuals. He argued that current technology and practice are
spending a considerable amount of resources in addressing minor rather than more important risks. He is of the opinion that the major risks that individuals should take
into account are the following risks:
1) Diminishing human capital during the individual's working period; 2) The reduction in neighbourhood which in turn adversely affects the value of their
houses;
3) Changing in the economic and societal values which will make the individuals'
retirement difficult and
4) Stock market downtum that will reduce or sweep away savings for retirement.
Shiller (2003) also pointed out that only this last type of risk has been addressed in
research and to some degree dealt with in the practice of financial planning.
Practically, none of other risks have been taken into consideration. It is thus
important for the industry to recognise the other risks that if not considered could
adversely affect individuals' quality of lives. This calls for the development of a
structured and proper theoretical framework so that individuals can understand the
magnitude of the problem they face.
At the application level, financial planners rely strongly on the software available in
the market in order to construct financial plans for their clients. The software may
have been developed in-house or purchased as a freestanding product as offered in the
market. Although there are significant models as tools for financial advice, the
theoretical model for financial planning construction is still limited.
106

In relation to specific models to be applied to client's financial plan, Puelz (1991)
suggested a goal-programming model that can be used to help financial planners to
allocate household portfolio. His model takes into account the subjective variables of
clients as well as objective variables such as the cost of products and the rate of
returns offered. Subjective variables, according to him, are equally important in the
process of household's portfolio allocation. Goals in his model may be generally divided into two: consumption goals which concern liquidity and portfolio goals
which concern for the consideration of returns. He used the analytical hierarchy
process (AHP) to maximise multiple clients' objectives in order to emerge with an
efficient portfolio allocation plan.
In addition to approaches discussed, the American Institute of CPAs (AICPA)
proposed an approach for managing their clients' personal finance called the 'activity
approach'. The recommendation was formally made in the issuance of Statement of Position no. 82-1, Accounting and Financial Reporting for Personal Financial
StatementS. 27 In the conventional method, lists of a client's assets, liabilities, income
and taxable income are prepared independent of each other. This approach attempted
to match expenses and tax payable related to a specific category of assets. By
including all income and expenses as well as tax payable related to the specific
activity, the client will be able to understand his current financial state. For example, if the life style activity shows a negative balance after considering all expenses, the
client is alerted to the situation and may find a solution to the problem. The SOP has
clearly illustrated the activities worksheet for planning and followed it with
recommendations for the preparation of projected financial statements that explain both financial positions of the assets and liabilities and changes in net worth.
Mason and Griffin (1988), on the other hand suggested on the use of accounting
ratios when creating clients' financial plan. They stated five factors than can be
observed when analysing the ratios. The factors include the current stage of the
27 Discussed in Mason and Griffin (1988)
107

clients' life-cycle, his family status, economic status, economic environment and his
objectives and preferences.
Although various financial planning models have been proposed in order to improve
efficiency in the portfolio allocation process such as those by Khaksari and Grieves
(1989), Puelz and Puelz (1991), Puelz (1991) and Mason and Griffin (1988), much
more is needed in order to improve currently available practical models that have a
strong theoretical foundation.
4.3.2 The Roles of Financial Planners in Household Portfolio Allocation
The main role of financial planners is to design financial plan that suits that the needs
of their clients. The advice can be in the form of comprehensive financial planning
that deals with the whole range of issues in financial planning or 'slice' financial
planning that focuses on certain segment of financial planning, for example risk
management and investment planning. Basically, services offered are in line with the
content analysis of personal financial planning. There are 10 1 content areas suggested in the CFP Board's current guide on CFP Certification 28
. Major headings are:
a) general principles of financial planning;
b) insurance planning and risk management;
C) employee benefits planning;
d) investment planning;
e) income tax planning;
f) retirement planning; and
g) estate planning.
28 As reported in CFP Practitioner Survey 1999.
108

The above topics listed were based on the 1999 Job Analysis Study. The list is also
used for the CFPV Certification Examination which indicates the topic coverage
areas required to fulfil the pre-certification program and continuous education credit by the CFP Board. Based on Table 4.2 obtained from the first annual CFP
Practitioner Survey in 1999, the percentages of CFP in the US provide relevant types
of service are as follows:
Table 4.2: Numbers of Certified Financial Planners Practicing in Various Areas of
Financial Planning
Types of Business Numbers of CFP Practitioners Financial Planning 56 Securities 16 Accounting 9 Tax Preparation 5 Insurance 5 Banking 2 All Other 3 Not Specified 4
Source: CFP Practitioner Survey in 1999, CkF 130ar(l. AvailaDle onitne:
www. cfb. net/media/survey. asp? id=14. Accessed on 26h October 2004
Although the content and coverage of personal financial planning information is
comprehensive, clients may also choose to hire personal financial planner at some
critical points in their lives such as getting married, the birth of a child, making a
major purchase decision and upon reaching retirement. This phenomenon is called
6slice' financial planning which is event-induced. On the other hand, clients may
engage in contracts with their financial planners to manage the whole state of their
financial plans. This is called 'comprehensive' financial planning.
109

Elmerick et aL (2002) empirically analysed the scope of financial planning services
acquired from financial planners. They divided their observation into three scenarios
where clients seek advice from independent financial planners: 1) Credit and borrowing purposes,
2) Saving and investing purposes and
3) Comprehensive financial plans.
They designed their survey to incorporate data on demographic and socio-economic
factors such as age, education, race, marriage status, employment status and location.
They also asked about the nature of services usually needed by clients. Other
financial data from respondents was asked: income, net worth, amount of financial
assets held and debt to income ratio. They found that, in general, there are 21.8
million US householders (21.2% of the population) using the services of financial
planners. Most of householders had sought advice on saving and investing (11.8
million), followed by comprehensive advice (7.2 million), and 2.8 million specialised
advices on credit and borrowing.
The process of financial planning outlined by the CFP Board consists of five stages.
Unlike the perception of the general public financial planning is not simply about
matching good financial products to suit clients' needs, but actually more
comprehensive Financial planners, upon understanding their clients' goal, will
conduct a research on products which not only involves product selection but the
whole clients' financial situation. In brief, the lists of financial planning processes
that have to be executed by financial planners with their clients are as follows:
a) Analyse needs and objective of clients;
b) Match objectives with appropriate products and services;
c) Implement the financial plan;
d) Provide the ongoing review on the plan;
e) Realise modifications to the plan.
110

This is essential for financial planners to take account of their prospective clients' age
and wealth financial situation as well as their level of basic financial planning knowledge. This is to ensure that planners are able to commit to a long-term
relationship with their clients while trying to ensure that their business can enjoy long-term success.
There are several issues to be dealt with when financial planners are preparing to
evaluate a client. For example, whether the client will cooperate during the process
and commit enough time to the process. The evaluation process can be done via an initial interview with the client. The level of financial planning knowledge possessed by clients is also important as it is desirable that client can understand the extent of
what the planner is offering at every stage of the process. The financial skills
regarded as important is budgeting, cash and cash flow management and debt
management. Information on the whole picture of financial planning activities are
also important. Interviews can be conducted to identify the level of understanding of
clients on the above issues. They also must be briefed on the nature range of fees that
they are subject to during the process of personal financial planning.
In practice, the process described above will be executed through a series of interviews with clients during the information gathering stage and re-evaluation of
planning stage. In the course of suggesting appropriate products to clients,
comprehensive research has to be done taking into account rates of return and levels
of risk suitable to the client's profile. As for the actual construction of the plan, the
use of software can be useful. There is a wide range of software available in the
market as stand-alone products if the financial planners operate on small scale. The
software executes the planning by introducing strategies and amounts to be set aside
for each planning activity such as education funding and insurance coverage. Data
sharing between each activity have to be made available in order to minimize data
input time.
ill

Although individuals hiring CFP rely on their financial planners to make sensible financial decision, they still have to evaluate the advice given by their planners. Clients have to understand the recommendations made and monitor their action
continuously in order to avoid fraud. Various ways may be used to track actions and
performance of the CFP. One way is to track returns by looking at the reports
provided by the CFP. Any report should include the 'real' rate of return, i. e. the return
after paying all advisors' fees and commissions. Some reports also include the real
rate of return earned by investments that are similar to client's position. This is called
a benchmark return. Having this benchmark helps clients compare their returns with
the returns that other investors are getting.
Clients also have to read their account statements. These statements show the value of
clients' net worth and the value of their investments. Clients may track how their
investments are performing and what they are costing them. A monthly accounting
report of the total gross commissions earned on a client's account is also regularly
provided by a good CFP. This is part of a regular set of reports that every broker and financial planner receives from his or her firm and there is no law or regulation to
prevent the adviser from sharing this report with a client.
Besides this, clients may also consult various organizations in order to select a good CFP. The National Association of Personal Financial Advisors (NAPFA) and the
Certified Financial Planner (CFP) Board of Standards are two institutions providing
vital information on how to select good financial planners. NAPFA's brochure
'Working with a Financial Adviser' provides criteria to consider when shopping for a financial adviser, along with other details about what a client can expect from the
client-adviser relationship. The CFP Board of Standards publishes 'Your Rights as a
Financial Planning Client', which describes the kind of treatment you deserve from
your financial planner.
112

4.4 Financial Literacy and Financial Education in Malaysia
Literacy, in general has been defined by many scholars in various aspects and
disciplines. In its pure definition, literacy is defined as an individual's ability to read
and write. Hartley (1990) suggests literacy as a relative concept, where we should be
aiming for active literacy, rather than functional literacy. Functional literacy is the
ability to accomplish simple reading and writing tasks, while active literacy involves
integration of listening, speaking, reading, writing and critical thinking as well as
numeric skills.
Mason and Wilson (2000), attempted to conceptualise the term so that it can be used
in further studies. Their framework on financial literacy indicates that to be
financially literate, one must have financial awareness. Financial awareness, on the
other hand, is individual's understanding of financial terms such as balance sheet,
budget and depreciation. They also lamented that the term literacy appears to be
borrowed when a problem is in need of a solution. Financial literacy, thought to be
lacking among the majority of consumers in the UK, has contributed to the problem
of increasing personal bankruptcy and steep increases in personal debts in recent
years. The amount of personal debt of UK householders according to the Bank of
England stood at more than I trillion pounds in the year 2006 29 .
To combat the problems arising from the lack of financial literacy, many
organisations have been set up to promote financial literacy among individuals. These
include the Financial Literacy Centre, University of Warwick, and the National
Endowment for Financial Education (USA), the Financial Literacy Center (USA) and
programmes such as the Start Right Coalition for Financial Literacy (Canada) and the
jump Start Coalition for Personal Financial Literacy (USA). In the UK, the Money
29 hlM: //www. creditaction. org. uk/debtstats. htm retrieved on 2nd August 2006.
113

Management Council is involved in a number of projects aimed at raising the
financial literacy of consumers.
In Malaysia, Bank Negara Malaysia (BNM) launched educational programmes on financial literacy called 'Bank Negara Malaysia Link'. The link provides information,
advice and services for the public on Bank Negara and other financial issues. BNM
also launched a special booklet training school children to budget their pocket money by launching its "Buku Wang Saku" (Pocket Money Book) and 'Buku Perancangan
dan Penyata Kewangan Keluarga' (Family Financial Statement Book) for the year 2006 .
30 At the corporate level, Citibank, a foreign bank operating in Malaysia,
became the first corporate organisation to educate the public on financial literacy.
100,000 copies of its book that entitled 'The Adventures of Agent Penny"', a comic
on good money management were distributed to school children all over the country. In addition, BNM also recently launched an organisation under its wing called Credit
Counselling and Debt Management Agency to give advice to householders who are having problems with their debt. With the increasing incidence of personal
bankruptcy and default, BNM took the initiative to offer the advice on to tackle the
problem by opening a branch in each state in Malaysia. 31
Ameriks et aL (2002), in their study revealed a strong relationship between financial
planning and wealth accumulation. Their survey data suggest that individuals with a
low propensity to plan are unable to monitor their spending and unlikely to be able to
accumulate wealth. Due to the significant relation between the propensity to plan and
wealth accumulation, their study calls for policy makers to initiate a savings
educational program in order to build planning skills.
30 Information on the programme available at: http: //www. duitsaku-com/. Retrieved on 2 nd August
2006
31 The link to the Credit Counseling and Debt Management Agency: http: //www. akt)k. orti. MV. Retrieved on 14'h December 2006
114

According to Braunstein and Welch (2002), there are considerable resources that have been devoted to financial literacy education, with a wide range of organisations
providing training to householders. These organisations include banks, consumer and
community groups, employers, and government agencies. Braunstein and Welch
(2002) also provided a comprehensive review on various aspects of financial literacy
including numerous factors leading to the need for financial literacy, evaluation of
training initiatives on various topics and challenges on future progress of financial
literacy programs. Among programmes analysed by them are financial training,
homebuyer counselling, savings initiatives, workplace and general training. In a
survey on general training programs in the high schools, the general public felt that
favourable long-term effect would be seen with increased exposure to financial
information and increased asset accumulation among young individuals when they
reach adulthood.
Public awareness on the need for financial planning in Malaysia is still low compared
to advanced nations. In Malaysia, the earliest stage when individuals are exposed to
financial education is perhaps when they are students at the undergraduate level and
studying accounting or business administration and finance. Students majoring in
other subjects not related to business and finance are left with no financial education
until they enter the workplace. Indirect inclusion of financial education in subjects
such as mathematics and in other subjects at primary and secondary school levels are
almost non-existent. Basic topics in financial education may include budgeting, credit
management, cheque book balancing and investment principles. These topics have
been taught in 29 states in the US from 1957 (Bernheirn et al. 1997). To make up for
the lack of financial awareness of individuals in the early stage of their lives, financial
education should be provided in the workplace.
115

Apart from this, the trend of shifting financial decisions from employers to
employees in employee benefits schemes increases the need for financial education. There is a close proximity between employers and the financial management of their
employees, albeit an indirect one. Large amount of time spent in the workplace
should foster a long-term relationship between the two. There are various incentives for employers to provide financial education in the
workplace. Garman (1999) provided evidence that the costs of reduced employee
productivity caused by poor personal financial behaviour are substantial. Findings in
Garman et al. (1999) revealed that as many as 91 % of employees who participated in
employer-sponsored personal financial planning workshops agreed that they received
relevant information that they need. More importantly, 75% of participants reported
that they made better financial decision after attending the workshop.
Traham and Gitman (2003) explored the opportunity for marketing personal financial
services to corporate markets, namely to the employees of corporations. Their study
sought to gain insight on various issues in financial planning using the data from
employees from selected Fortune 500 companies. They found that the prospect of
marketing financial planning in these companies was significant in the case of senior
managers who represented 67% of total respondents. Their study can be treated as a
starting point for personal financial planners to broaden their market which are
currently limited to individual clients.
FPAM, in the case of Malaysia, measures are now being taken to encourage
employers to provide financial planning training to their employees. FPAM is now
targeting its corporate members which consist of big companies to do that. Several
programmes were launched encouraging education program in the workplace, and
guidelines on training provision by are available on its website.
The internet may also be used to educate the public on the subject of financial
awareness. Yunich (2003) wrote about various ways the internet could help in
116

disseminating information about personal financial planning. Resources that are available in the internet range from products on offer for personal financial planning construction, the technical assistance needed and research publications on investment
management which are available on investment management companies' websites.
In a nutshell, financial literacy contributes to increased awareness in financial
management and it should also help individuals learn where best to go for more detailed information as their competence increases.
4.5 Syariah Literacy and Islamic Personal Financial Planning
The Syariah Advisory Council (SAC) was established in 1996 under the authority of
the Securities Commission. The duty of the council is to advise the Security
Commission on Islamic capital market operations, standardise and harmonise the
application of Syariah principles and concept, review Syariah compatibility with
other conventional instruments and new Islamic Instruments and the most important
function, endorse the halal or permitted counters in its list of Syariah approved
securities (Ali, 2003). The members of the board comprise of Muslim scholars who
are experts in Islamic Syariah principles.
To facilitate Muslim investors' participation in acquiring halal financial assets, the
council will revise and publish the halal securities every six months. By keeping the
information on halal counters on such a regular basis, Muslim investors can be
confident that they are adhering to Islamic Syariah requirements while investing.
Table 4.3 lists securities approved by the Syariah council as at 20th April 2006.
117

Table 4.3: Securities Approved by Syarlah Advisory Council Published as at 20'h
April 2006
Main Board/Second Board/ MESDAQ
Approved Security Total security Percentage of approved security
Consumer goods 129 140 92 Industrial goods 289 305 95 Mining 1 1 100 Construction 59 59 100 Trade/services 168 206 82 Property 82 102 80
Plantation 38 45 84
Technology 94 98 96
Infrastructure 7 9 78
Finance 4 52 8
Hotel None 5 None
Closed-end fund None 2 None
Source: hltp: //www. sc. com. my/enWhtmi/icm/sas/syariahapr, 2uu6. pdt. Intormation was retrieved from
the Securities Commission's website on the 18th July 2006.
In order to compile a list of halal counters, Syariah scholars agreed that securities that
fall in categories listed below must to be excluded.
a) operations based on riba' (interest) involving such financial institutions
such commercial and merchant banks and finance companies;
b) Operations involve gambling activities;
C) Activities involving the manufacturing or sale of haram (forbidden in
Syariah's point of view) products such as pork, liquor and non-slaughtered
meat; and
d) Operations in the presence of gharar (uncertainty) elements such as
conventional insurance companies.
118

Furthermore, if companies are involved in both permitted and non-permitted activities, the following criteria to be used:
e) The core activities must be those conforming to the Syariah guidelines. Haram elements must be very small compared to the haram activities;
f) The public perception of the company must be good or accepted as
companies dealing in lawful Islamic activities; and
g) The core activities must be important and beneficial from an Islamic point
of view.
In addition to the general outline on core activities, the Syariah scholars also agreed
on the threshold of non-permitted activities that may be allowed for a security to be
granted Syariah adherence status. A 5% threshold of non-permitted activity can be
tolerated when harain elements (activities not allowed by Syariah) are inseparable
from the operation of the business. This 5% threshold applies to activities related to
riba' from conventional financial institutions such as banks and insurance operators,
gambling, alcohol and pork. A 10% threshold, however, can be allowed in the case
of activities considered as 'umum balwa'or activities that involve the general public
which they would usually find very difficult to avoid in the context of modem
business operations. The activities include income generated from fixed deposits
received from conventional banking institutions and income received from the
tobacco business. An even more lenient threshold of 25% can be allowed income
generated Syariah unlawful from activities that are regarded as highly of important
for the development of society. Such activities are called "maslahah ". Among
activities that fall into this category are hotel operations and share brokerage because
these activities are needed in order to mobilise resources in the economy. As for the
hotel operation, it is feared that hotels will be involved in selling alcohol and other
unlawful activities. But at the same time, the hotel trade is vital for the use of the
general public in general. A high percentage threshold, thus, will be allowed for
income generated by the sector.
119

It is to be noted that SAC approval includes ordinary shares, warrants and transferable subscription rights (TSRs). Loan stocks and bonds are not included
unless they are issued in accordance with the Islamic principles. Other Syariah issues
dealt with by the SAC are on the revision of the halal status of securities from halal
(allowable) to non-halal and vice versa. 32
The bottom point is that the establishment of SAC has been able to guide Muslim
investors in choosing halal investments. Before, Muslim investors were either
reluctant to deal in stocks or had great difficulties in looking for the halal investment.
SAC however had particularly responsible for the increasing Muslim investor's
participation in the equity markets. Muslim investors are hence urged to keep up-to- date with current changes in the list of approved securities, as well as the Islamic
scholars' opinions on certain investment modes. This ensures that investment
ventures and financial planning processes as a whole are executed in accordance with
the Islamic principles.
Dar (2004) lamented the scarcity of research on the estimation of demand for Islamic
financial services except on banks' selection criteria. One of the main topics
regarding Islamic banking selection criteria is the Syariah's consideration of
customers. Metawa and Almossawi (1998) studied the banking behaviour of the
customers of two Islamic commercial banks operating in Bahrain. They found that
adherence to Islamic Syariah was the main motivating factors for Muslims customers
to demand Islamic financial services. In contrast, Erol and El-Bdour (1989) found
that religious motivation was not a main reason why Jordanians selected Islamic
banks. Naser et al. (1999) reported that 70 percent of Jordanian Muslim respondents
32 Further discussions can be found in Imad Ali (2003), in a paper presented in Islamic Wealth Creation Seminar, University of Durham, 2003.
120
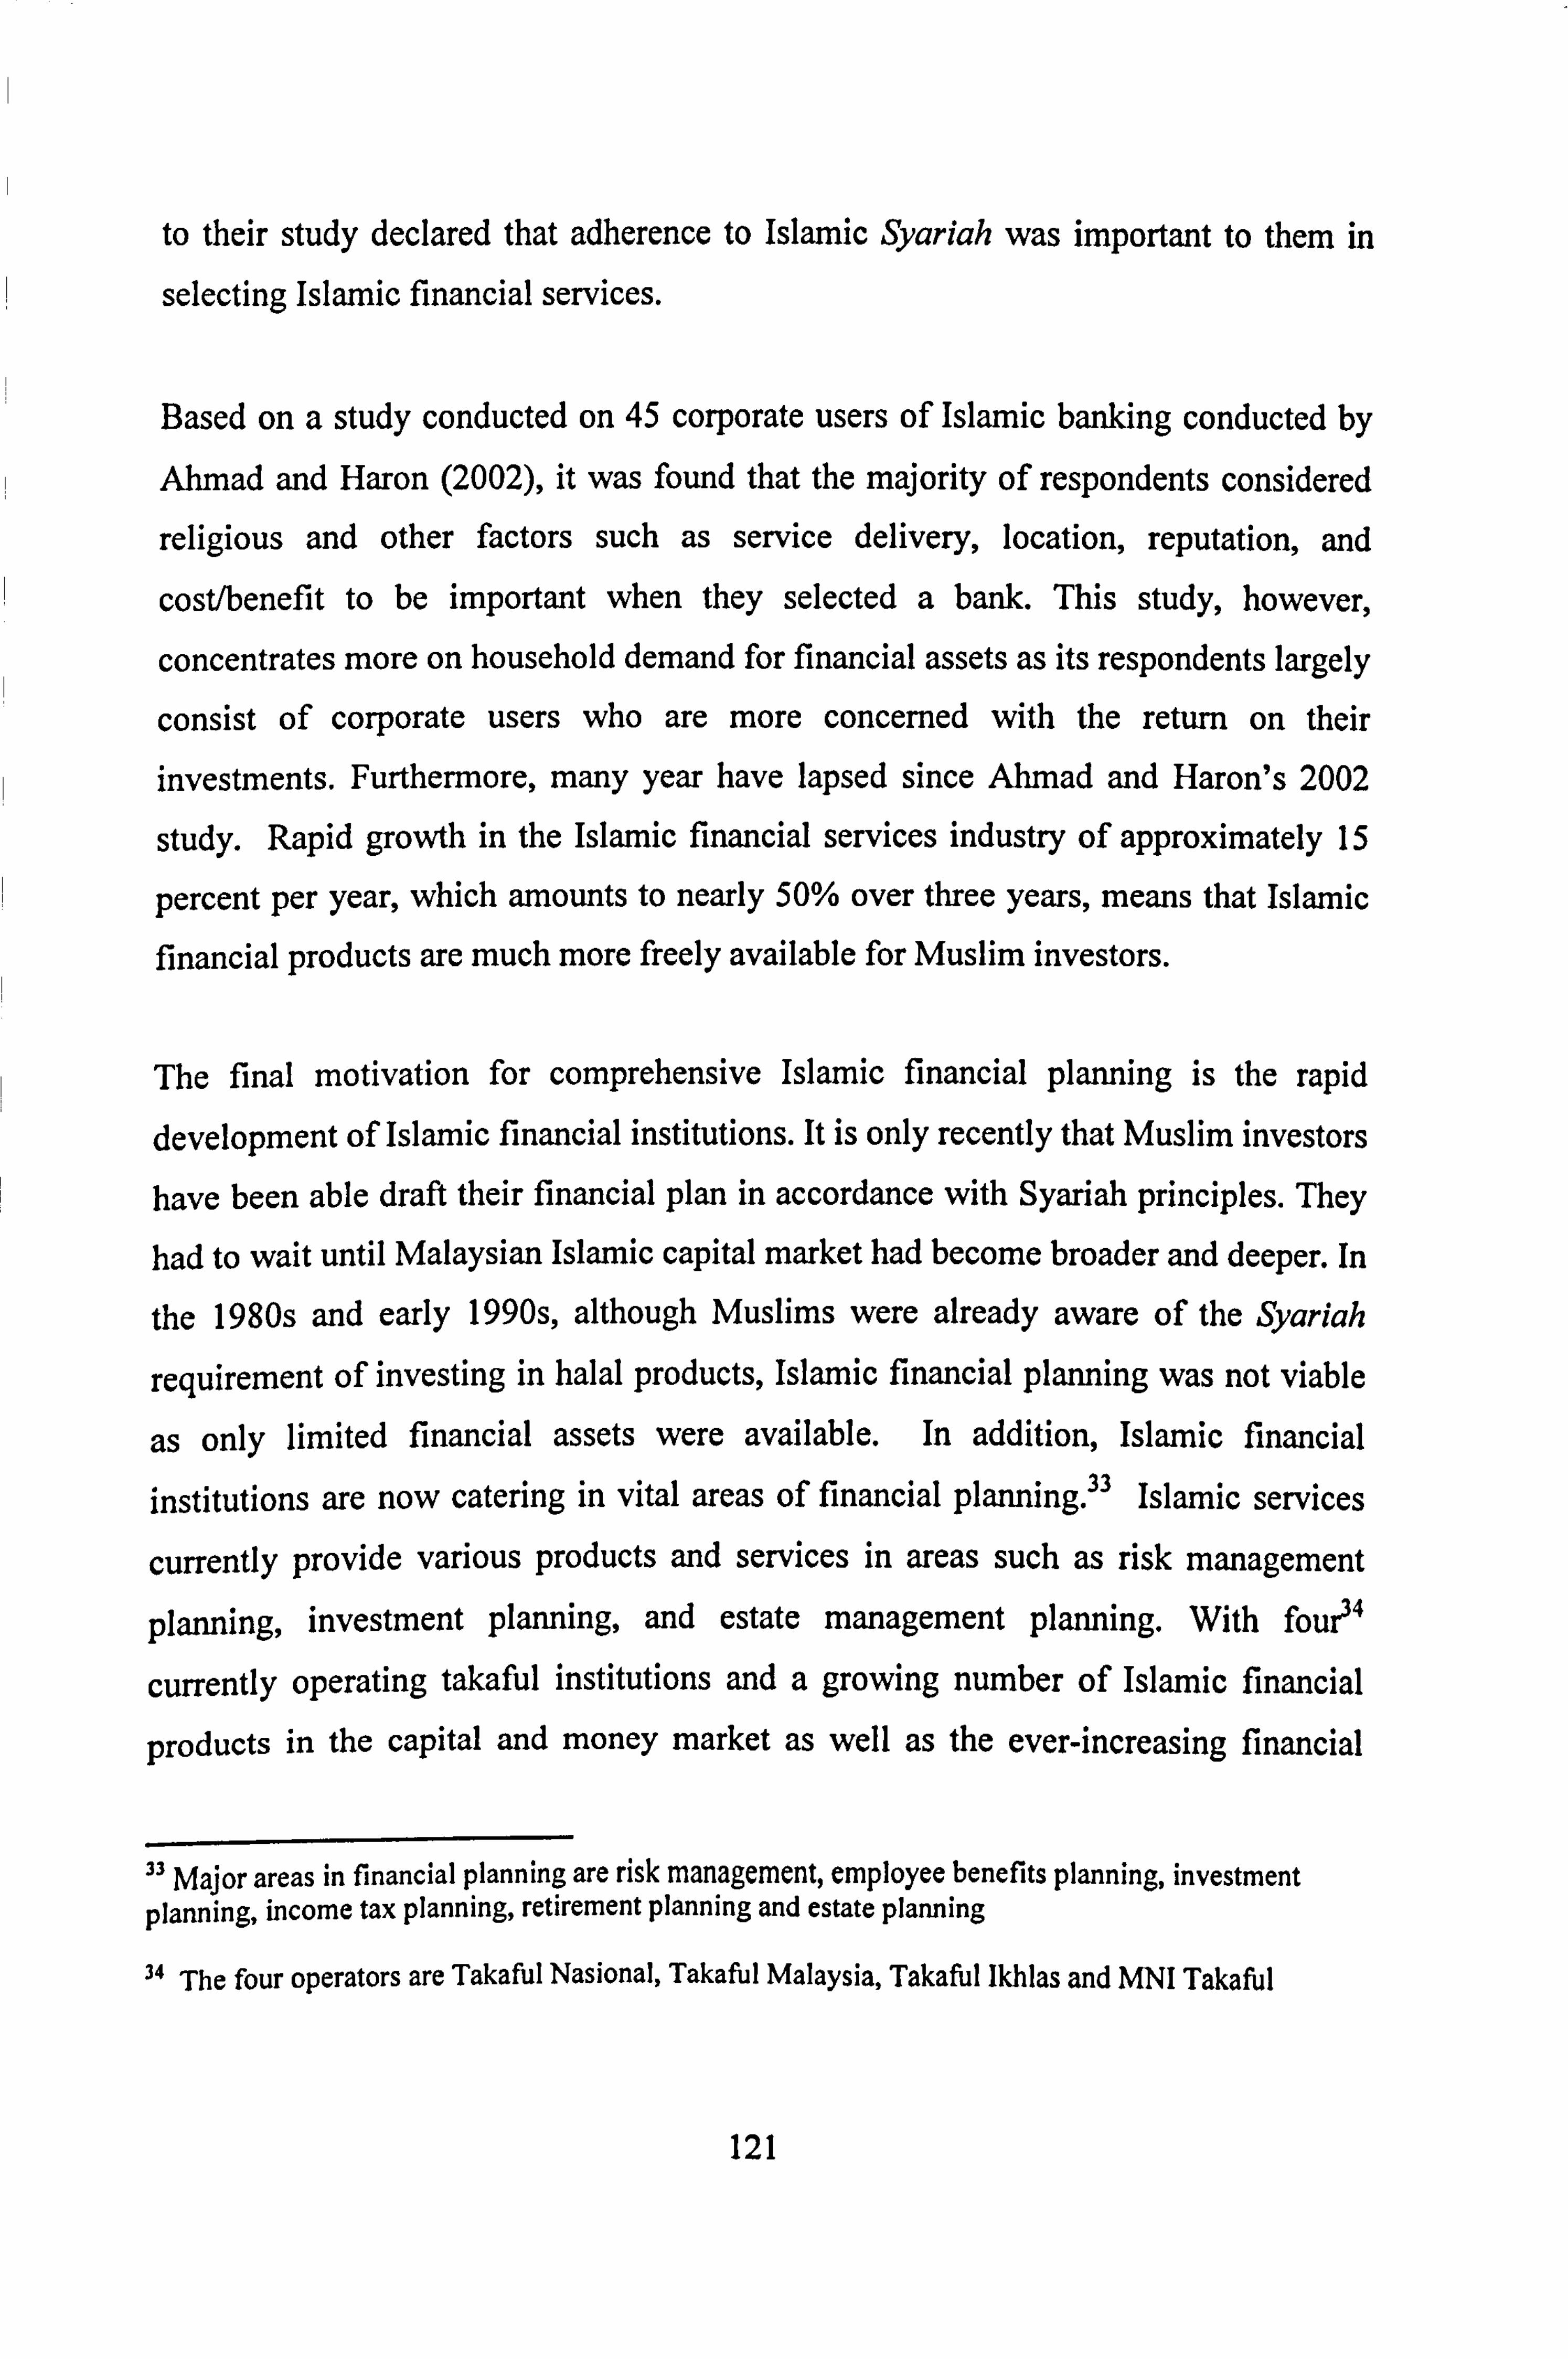
to their study declared that adherence to Islamic Syariah was important to them in
selecting Islamic financial services.
Based on a study conducted on 45 corporate users of Islamic banking conducted by
Ahmad and Haron (2002), it was found that the majority of respondents considered
religious and other factors such as service delivery, location, reputation, and
cost/benefit to be important when they selected a bank. This study, however,
concentrates more on household demand for financial assets as its respondents largely
consist of corporate users who are more concerned with the return on their
investments. Furthermore, many year have lapsed since Ahmad and Haron's 2002
study. Rapid growth in the Islamic financial services industry of approximately 15
percent per year, which amounts to nearly 50% over three years, means that Islamic
financial products are much more freely available for Muslim investors.
The final motivation for comprehensive Islamic financial planning is the rapid development of Islamic financial institutions. It is only recently that Muslim investors
have been able draft their financial plan in accordance with Syariah principles. They
had to wait until Malaysian Islamic capital market had become broader and deeper. In
the 1980s and early 1990s, although Muslims were already aware of the Syariah
requirement of investing in halal products, Islamic financial planning was not viable
as only limited financial assets were available. In addition, Islamic financial
institutions are now catering in vital areas of financial planning. 33 Islamic services
currently provide various products and services in areas such as risk management
planning, investment planning, and estate management planning. With fou? 4
currently operating takaful institutions and a growing number of Islamic financial
products in the capital and money market as well as the ever-increasing financial
" Major areas in financial planning are risk management, employee benefits planning, investment planning, income tax planning, retirement planning and estate planning
34 The four operators are Takaful Nasional, Takaful Malaysia, TakaU Ikhlas and MNI Takaful
121
services offered by the Islamic financial institutions, it is trouble-free to engage in
Islamic financial planning.
The Islamic financial institutions consist of Islamic Banks, takaful (Islamic
insurance) operators and fund management companies. Islamic banks generally
provide savings and current accounts, certificates of deposits, real property financing,
investment accounts such mudharabah (Profit and Loss) schemes and other customer
service products such as the buying and selling of currencies, telegraphic transfer
services and so on.
Takaful operators, on the other hand, provide Islamic type risk management tools
which can be utilised by household in allocating their portfolio. The major difference
between conventional insurance and takaful is the management of contributors'
monies. In a conventional scheme, an insurance company operates as a different
entity providing the service of risk manager, while a takaful operator acts as an agent
managing contributors' monies in accordance with the concept of tabarru'
(contribution, donation or offering). Takaful operators may also agree to use
Mudharabah contracts and share profits or losses with contributors. Contributors in
this case agree collectively to donate the pooled funds to the less fortunate
participants. This can be an effective tool of risk management enabling profit and loss
sharing agreements between participants and the takaful operators.
As for Islamic unit trusts, their establishment has encouraged the participation of
middle-income individuals to invest given the advantage of unit trusts being
affordable. Investors indirectly invest in real properties, equities and commodities
through a mix and match of unit trust funds via their ownership of units. Valuable
research on the performance, overview and legal framework of Islamic Unit Trust in
Malaysia has been carried out Ali (2003).
122

The establishment of the first Islamic banks in 1984 via the creation of Bank Islam
Malaysia Berhad (BIMB), and takaful in 1984 via Takaful Malaysia Berhad, a
subsidiary of BIMB and Islamic Unit Trust in 1993 via, incorporation of Tabung
Ittikal Arab Malaysian as the first unit trust using mudharabah principle, has given
mass choices for individuals to build their financial plans. With the establishment of
the various institutions described above, Muslims have been able to increase their
participation in building Islamic compliant portfolios hence increasing their level of
wealth. Table 4.4 provides readers with information on Islamic financial institutions
and conventional institutions that operate within an Islamic window.
Table 4.4: Islamic Financial Institutions and Conventional Institutions Operating Islamic Windows System
Panel A: Islamic Financial Institutions 1 Adil Islamic Growth Fund (innosabah Securities Sdn. Bhd. ), Labuan 2 Arab Malaysian Merchant Bank Berhad, Kuala Lumpur 3 Bank Burniputra Malaysia Berhad, Kuala Lumpur 4 Bank Islam Malaysia Berhad, Kuala Lumpur 5 Bank Kerjasama Rakyat Malaysia Berhad, KL 6 Dallah Al-Baraka (Malaysia) Holding Sdn Bhd 7 Lembaga Urusan dan Tabung Haji (Fund), KL 8 Malayan Banking Berhad (Maybank), KL 9 Multi Purpose Bank Berhad, KL 10 United Malayan Banking Corporation Berhad, KL 11 Bank Muamalat Berhad, Malaysia 12 Securities Commission 13 Labuan Offshore Financial Services Authority (LOFSA)
14 Islamic Banking & Takaful Dept, Bank Negara Malaysia Panel 13: Conventional Institutions operating Islamic windows system Commercial banks
1 Affin Bank Berhad 2 Alliance Bank Berhad 3 Arab-Malaysian Bank Berhad 4 Bank Utama (Malaysia) Berhad 5 Citibank Berhad 6 EON Bank Berhad 7 Hong Leong Bank Berhad 8 HSBC Bank (M) Berhad 9 Malayan Banking Berhad 10 OCBC Bank (M) Berhad 11 Public Bank Berhad 12 RHB Bank Berhad 13 Southern Bank Berhad 14 Standard Chartered Bank Malaysia Berhad
123
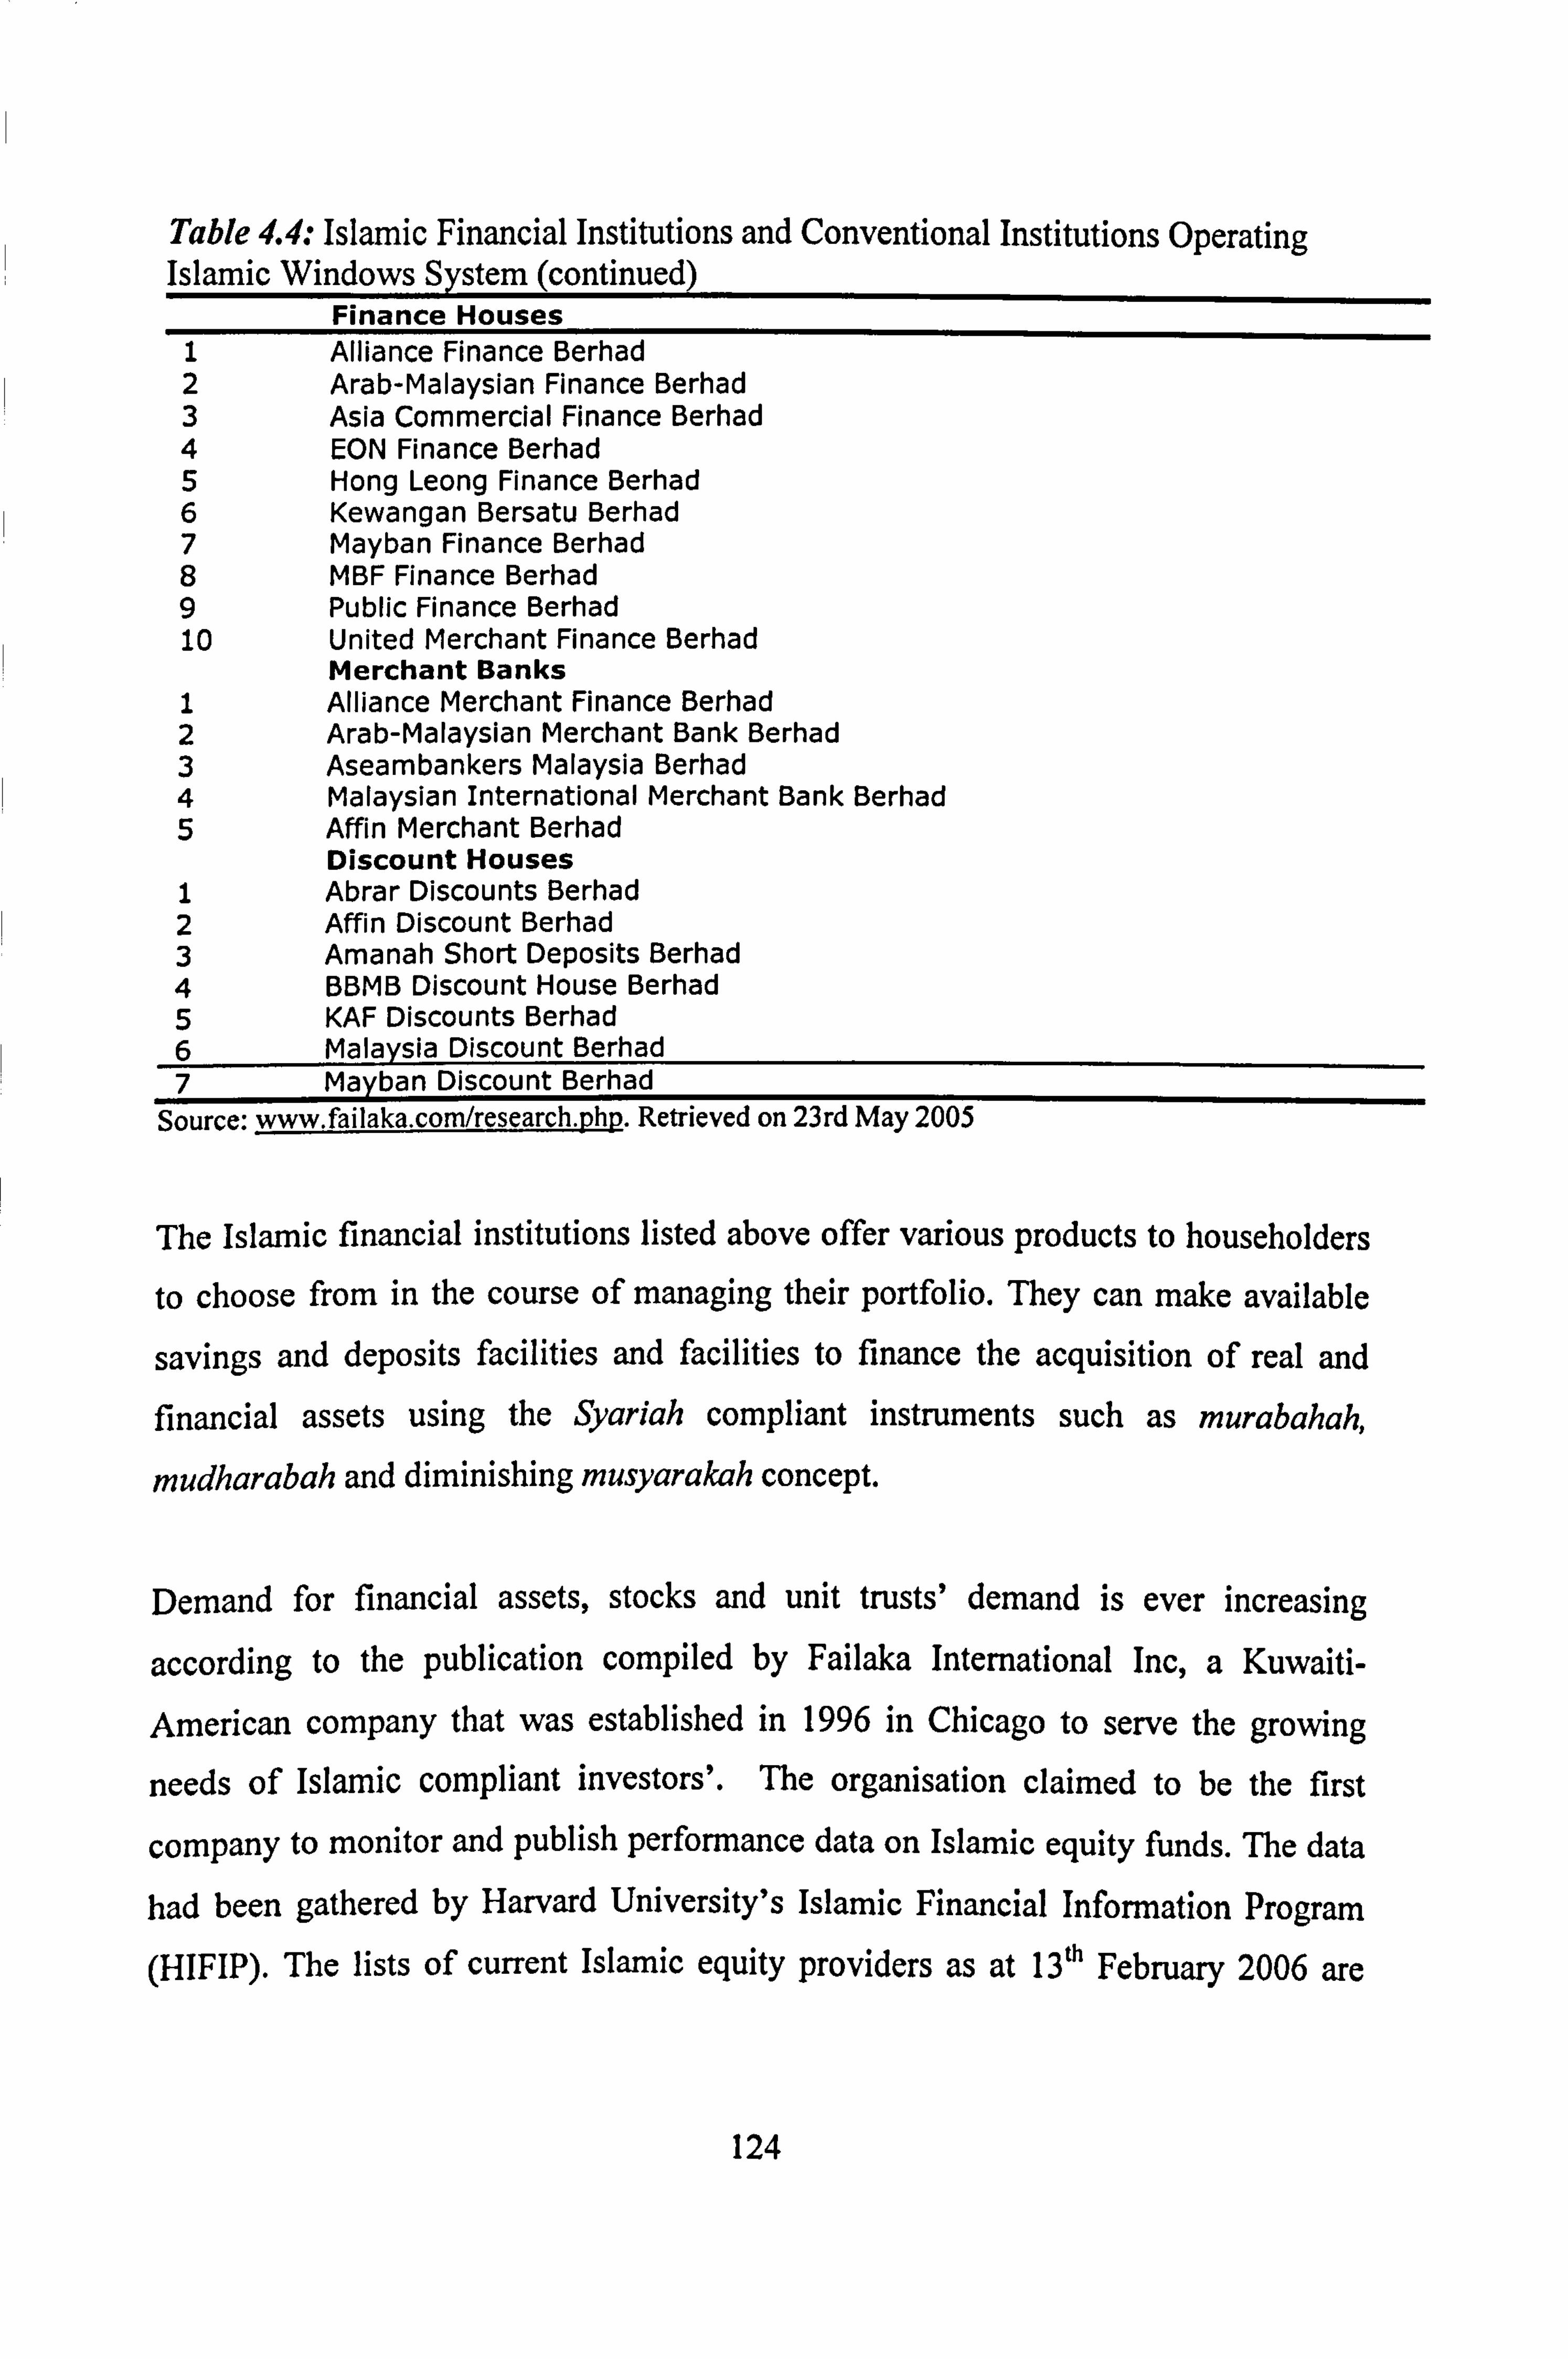
Table 4.4: Islamic Financial Institutions and Conventional Institutions Operating Islamic Windows System (continued)
Finance Houses 1 Alliance Finance Berhad 2 Arab-Malaysian Finance Berhad 3 Asia Commercial Finance Berhad 4 EON Finance Berhad 5 Hong Leong Finance Berhad 6 Kewangan Bersatu Berhad 7 Mayban Finance Berhad 8 MBF Finance Berhad 9 Public Finance Berhad 10 United Merchant Finance Berhad
Merchant Banks 1 Alliance Merchant Finance Berhad 2 Arab-Malaysian Merchant Bank Berhad 3 Aseambankers Malaysia Berhad 4 Malaysian International Merchant Bank Berhad 5 Affin Merchant Berhad
Discount Houses 1 Abrar Discounts Berhad 2 Affin Discount Berhad 3 Amanah Short Deposits Berhad 4 BBMB Discount House Berhad 5 KAF Discounts Berhad 6 Malaysia Discount Berhad 7 Mayban Discount Berhad
Source: www. failaka. com/research. php. Retrieved on 23rd May 2005
The Islamic financial institutions listed above offer various products to householders
to choose from in the course of managing their portfolio. They can make available
savings and deposits facilities and facilities to finance the acquisition of real and financial assets using the Syariah compliant instruments such as murabahah,
mudharabah and diminishing musyarakah concept.
Demand for financial assets, stocks and unit trusts' demand is ever increasing
according to the publication compiled by Failaka International Inc, a Kuwaiti-
American company that was established in 1996 in Chicago to serve the growing
needs of Islamic compliant investors'. The organisation claimed to be the first
company to monitor and publish performance data on Islamic equity funds. The data
had been gathered by Harvard University's Islamic Financial Information Program
(HIFIP). The lists of current Islamic equity providers as at 13 th February 2006 are
124

shown in Appendix 3. From the Appendix we can observe large numbers of providers are based in Malaysia. This shows that the depth of provision of Islamic compliant
unit trusts in Malaysia is high.
The Financial Planning Association of Malaysia (FPAM) launched FPAM Practice
Module I- Islamic Financial Planning Course in 2005. The objective of FPAM in
introducing the Module was to provide insights into crucial aspects of Islamic
financial planning. To encourage its members to sit for the module, 20 Certification
Examination (CE) points are awarded upon the passing the examination.
With the existence of comprehensive types of Islamic financial assets being offered in
the Malaysian market as listed above, householders have a diversity of choices in the
course of working out their financial portfolio. However, large numbers of Islamic
financial products will not ensure that Malaysians public take up the opportunity to
use these products to structure their portfolio as asset allocation is more than just an
understanding of the product selection process. For that matter, this research may
enlighten readers on the level of involvement of Malaysians in Islamic financial asset
acquisition and the level of their engagement in financial planning, Islamic financial
planning included.
125

4.6 Conclusion
With the various measures taken by the government and the financial planning
associations, further growth of the financial planning and Islamic financial planning industry is expected. With proper planning, householders will be more informed in
making the investment and other financial decisions that directly affect their lives.
The growth of the financial planning industry will also affect directly the type and
amount of financial assets being supplied in the market. Healthy development of financial planning boards to introduce practical standards and professional guidance
as discussed in the chapter will enhance the publics' acceptance of the services these
financial planners have to offer. It is expected that growth in the financial planning
industry will multiply the growth of other financial services such as unit trusts and
insurance and private banking.
126

CHAPTER5
RESEARCH DESIGN AND METHODOLOGY
5.1 Introduction
This chapter focuses on the research design and methodology of the study. Firstly,
theoretical underpinnings of the research and the theoretical framework are discussed
followed by the hypothesis development for the study on household's asset demand.
The proposed model as well as the measurement of relevant variables is presented
next in the chapter. Discussions on population and the sampling related issues are
also explained and justified as is the justification of the instrumentation used in the
research. Finally, the chapter offers the methodology for the interviews with the
financial planners.
5.2 Theoretical underpinnings
The model for the life-cycle effect of asset accumulation and allocation introduced by
Modigliani and Brumberg (1954) suggested that the propensity to consume and the
propensity to save are different at various stages of individuals' lives. Individuals
usually have a life-cycle income pattern that is inversely U-shaped: earnings are
modest in the early working life but grow until retirement age after which income
declines. Assuming income follows this described manner, financial assets holding
may also be predicted to behave according to the same pattern.
The life-cycle hypothesis predicts that consumption and saving behaviour change
significantly with income, wealth, age, marital status and other socio-economic and
demographic conditions during various stages of the individual's life (Jan Tin, 2000).
This is in line with the General Theory of Keynes which states that the marginal
127

propensity to save is detennined by sets of objective and subjective factors. Objective
factors include income and rates of returns while subjective factors being
demographic and socio-economic factors of which householders belong to.
Poterba and Sarnwick (1997) found that different characteristics of financial assets by
nature will attract different patterns of life-cycles compared to real asset holdings.
Furthermore, unique characteristics of various types of financial assets will likely
result in different levels of demand for each type of financial assets along the life
cycle. Thus, a study to examine the effect for the life cycle on different types of financial assets needs to be conducted to prove the applicability of their findings in
other economies.
If the demand for Islamic financial assets is to be considered, other factors such as household preferences to acquire Islamic financial assets or conventional financial
assets must be specified. Household levels of Syariah literacy will also be relevant in
such studies. On the other hand, other factors explaining the variation in the demand
for financial assets can be added. Ameriks et aL (2002) revealed a strong relationship
between financial planning and wealth accumulation. Their survey data suggested
that individuals with a low propensity to plan are unable to monitor their spending
and are not likely to be able to accumulate wealth. In addition, Ioannide (1992)
examined on the effect of professional involvement from financial planners in his
study on household portfolio allocation. Thus an examination on the demand for
financial assets in relation to householders' involvement with financial planners and
their ability to plan is desirable due to the minimum amount of literature available.
In their 2002 research Ameriks et. aL discussed a survey on the general training
programs in the high schools in the U. S. In the survey, the American public expressed
the opinion feels that favourable long-term effects could be anticipated with increased
exposure to financial information and increased asset accumulation among young
individuals when they reach adulthood. Financial literacy would increase awareness
128

of financial management and wealth accumulation process, thus an examination on the relationship between household levels of financial literacy and the demand for
various types of financial assets is worthwhile.
In consideration of the literature in the studies on financial asset demand, we formulated factors affecting this demand for financial assets by the way of regression
analysis. We first identified the sets of factors related to the demand for financial
assets and than ascertained whether these factors had any significant relationship with
the demand.
The variable of interest, the dependent variable in this case, is the value of financial
assets held by householders. These are the savings accounts, unit trusts and shares. The variation in the level of demand for financial assets is explained by the analysis
on the sets of independent variables, which are income, wealth, net wealth, age,
gender, marital status, race, educational background, job sector, respondent's risk
preferences, respondent's engagement with certified financial planners, respondent's
preference for Islamic and conventional financial assets, the level of respondent's
Syariah literacy, the level of respondent's financial exposure and the respondent's
propensity to plan their financial activities.
129
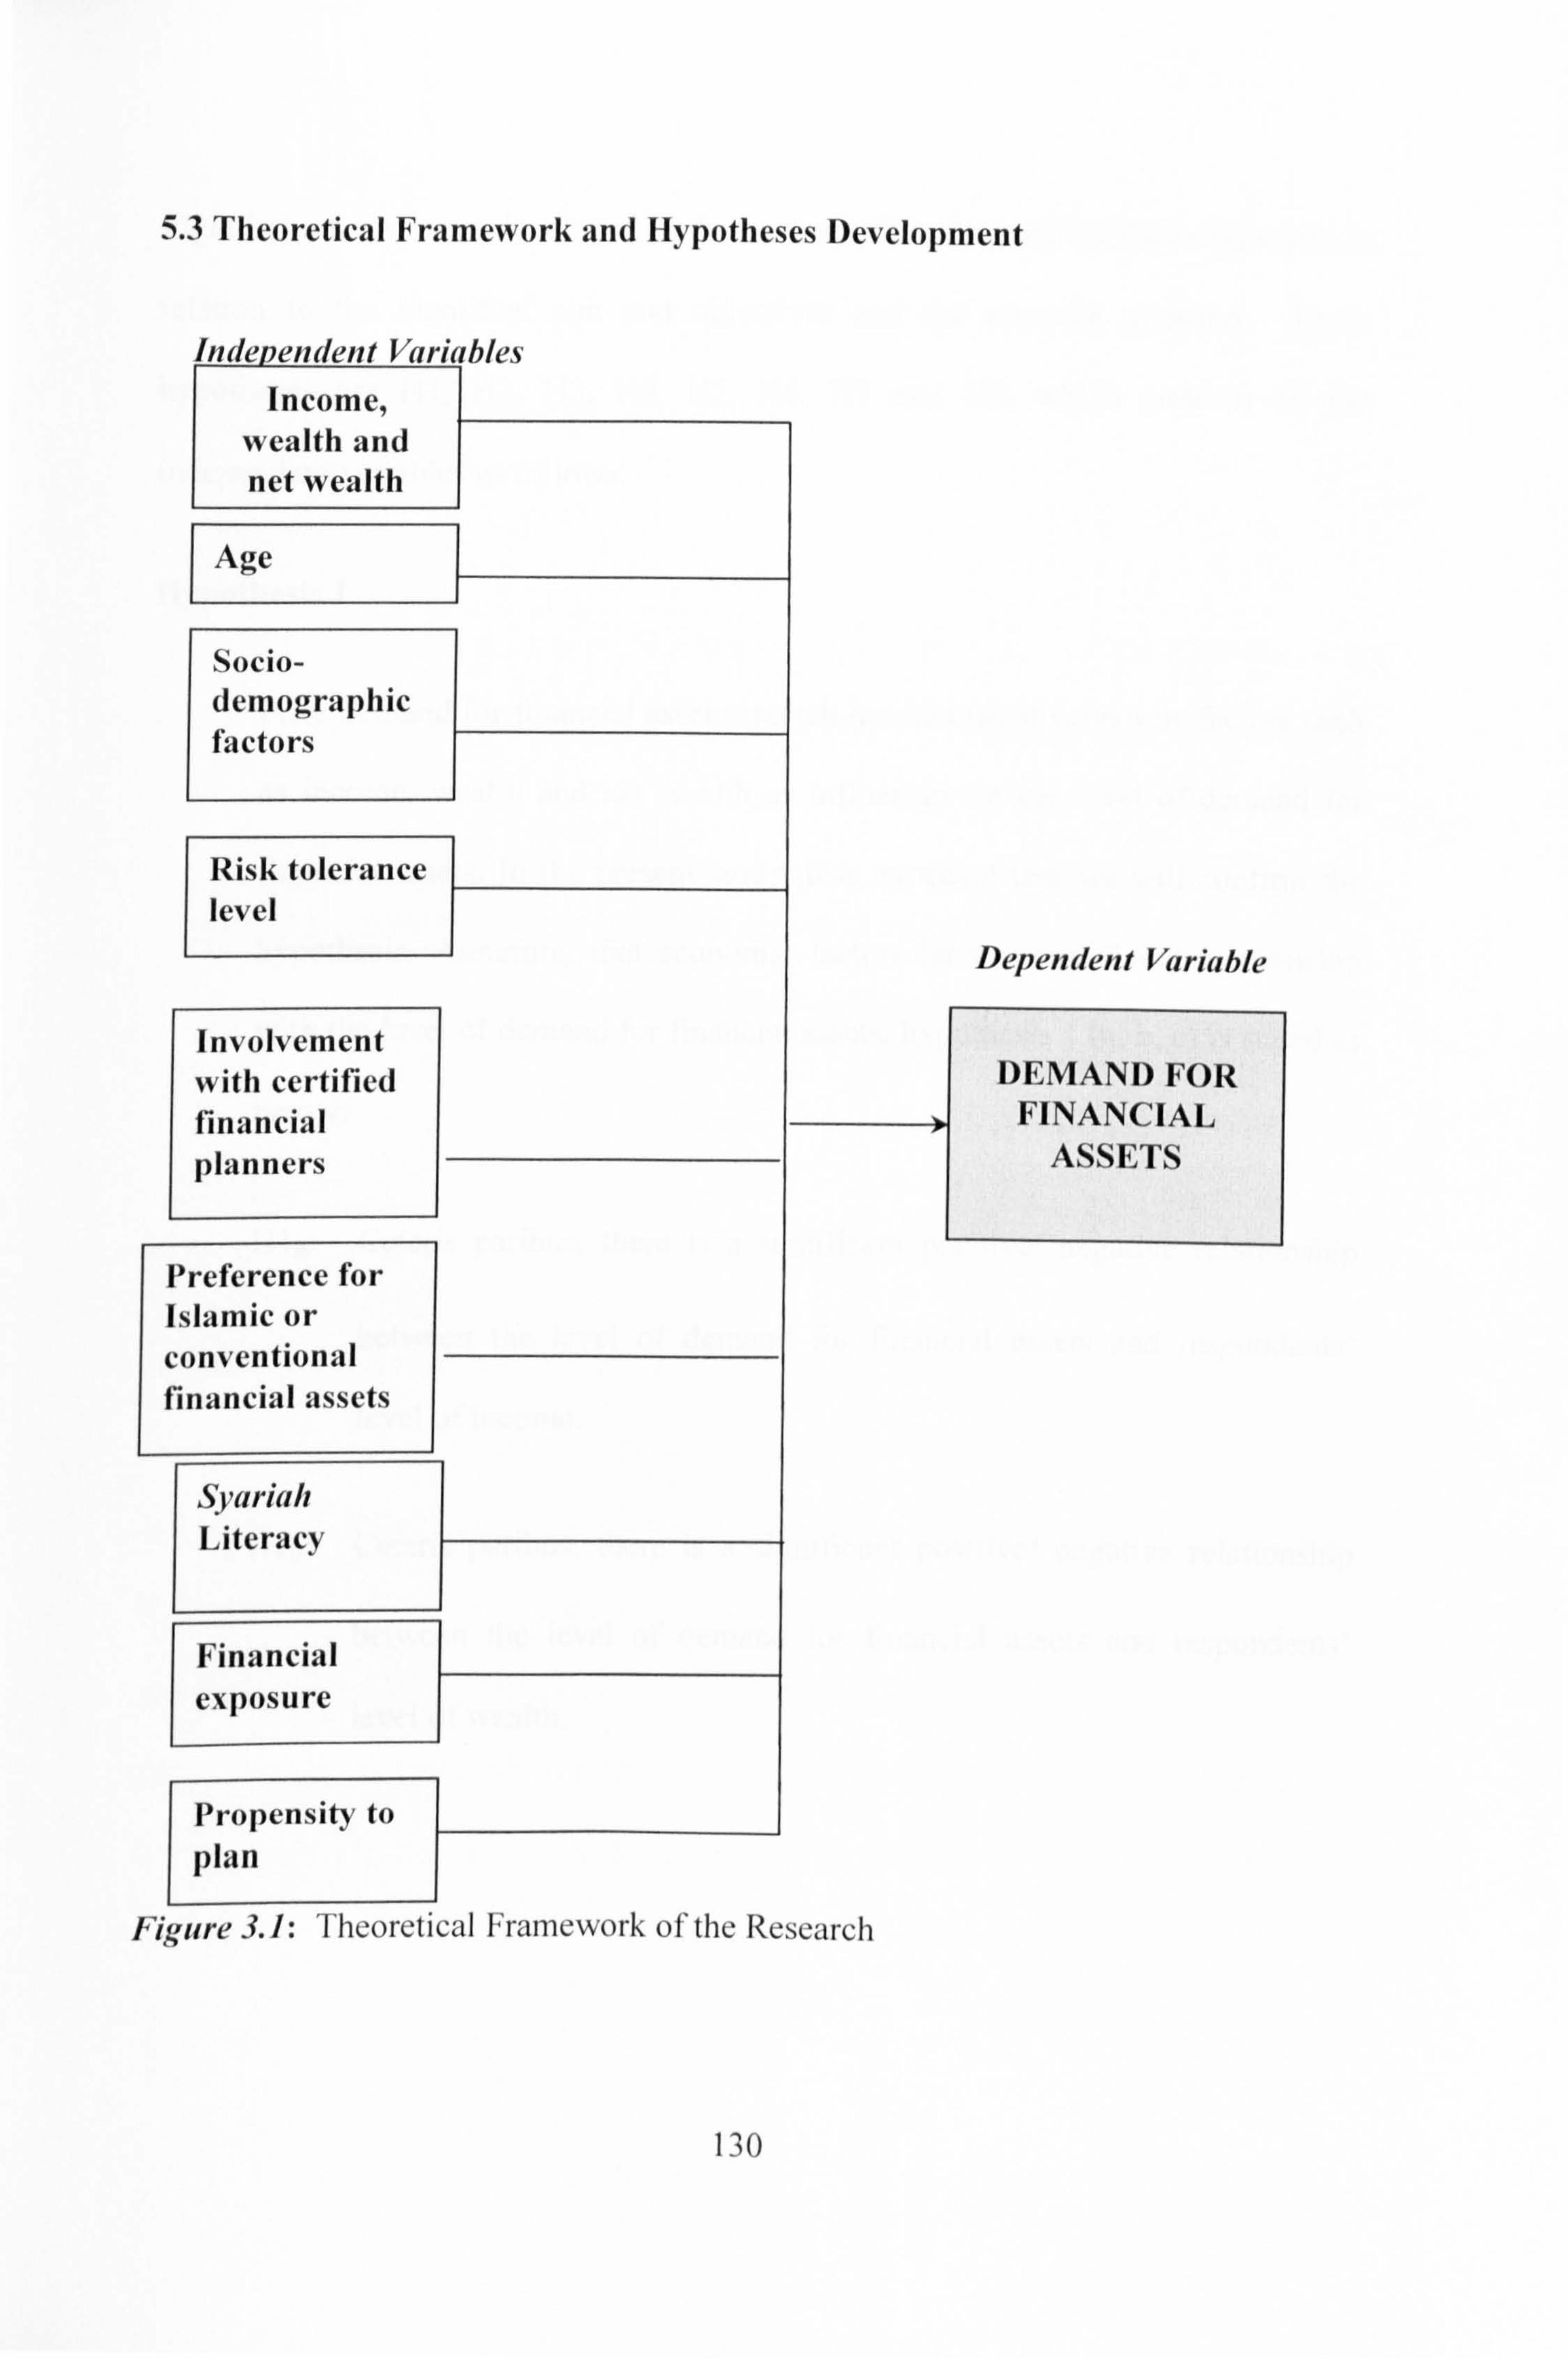
5.3 Theoretical Framework and Hypotheses Development
Independent Vark Income,
wealth and net wealth
I
Age
Socio- demographic factors
Risk tolerance level
Involvement with certified financial planners
Preference for Islamic or conventional financial assets
Syariah Literacy
Financial exposure
Propensity to plan
Figure 3.1: Theored cal Framework o I'the Research
Dependent Variable
DEMAND FOR FINANCIAL
ASSETS
130

Eight hypotheses were developed in the context of the demand for financial assets in
relation to the identified aim and objectives and the research question. These
hypotheses are HI, H2, H3, H4, H5, H6, H7 and H8, which concem all the
independent variables as follows:
Hypothesis 1
Prior demand for financial asset research has identified economic factors such
as income, wealth and net wealth as influences on the level of demand for
financial assets. In the present study, it is expected that we will confirm the
hypothesis. Assuming that economic factors have a significant relationship
with the level of demand for financial assets, hypothesis I (a, b, c) is stated as
below:
Hla: Ceteris paribus, there is a significant positive/ negative relationship
between the level of demand for financial assets and respondents'
level of income.
Hlb: Ceteris paribus, there is a significant positive/ negative relationship
between the level of demand for financial assets and respondents'
level of wealth.
131

Hl,: Ceteris paribus, there is a significant positive/ negative relationship
between the level of demand for financial assets and respondents'
level of net wealth.
Hypothesis 2
To ascertain whether the life-cycle effect exists for every type of financial assets as
originally suggested in Modigliani and Brumberg (1954), hypothesis 2 is stated as
below:
H2: Ceteris paribus, there is a significant relationship between the level of
demand for financial assets and respondents' age.
Hypothesis 3
Regarding socio-economic variables, a number of studies such as Jan Tin's (2000)
study included factors like age, number of children, education level, marital status,
sex, and race as demographic variables to be tested as factors to influence the level of
asset demand. Hall and Mishkin (1982), Zeldes (1989), and Lusardi (1996) are
among others who tested demographic variables to affect wealth allocation and
demand for money and financial assets. Considering the number of studies including
demographic variables to influence the level of financial assets demand, including the
hindsight of Keynes (1936), socio-demographic variables are included as predictors
132

to the level of financial assets demand. Assuming that identified socio-demographic
variables do have a relationship with the demand for financial assets, hypothesis 3
(a, b, c, d and e) is stated as below:
H3a' Ceteris paribus, there is a significant relationship between the level of
demand for financial assets and respondents' gender.
H3b: Ceteris paribus, there is a significant relationship between the level of
demand for financial assets and respondents' marital status.
H3c: Ceteris paribus, there is a significant relationship between the level of
demand for financial assets and respondents' race.
113d: Ceteris paribus, there is a significant relationship between the level of
demand for financial assets and respondents' level of education.
Me: Ceteris paribus, there is a significant relationship between the level of
demand for financial assets and respondents'job sector.
133

Hypothesis 4
According to Sharpe (1964), individuals' levels of risk tolerance and preference will
affect their pattern of demand for money and assets. Applying the concept of risk
tolerance to our study of demand for financial assets, we examined whether risk
tolerance levels affect the demand for certain types of financial assets. Hypothesis 4
relates to the level of demand for financial assets and respondents' risk tolerance level
was tested as follows:
H4: Ceteris paribus, there is a significant positive/ negative relationship
between the level of demand for financial assets and respondents' risk
tolerance level.
Hypothesis 5
Following the example of Ioannide (1992) who examined on the effect of
professional involvement from financial planners on household portfolio allocation,
we tested whether respondents' involvement with financial planners affects their level
of demand for financial assets. Hypothesis 5 thus was tested as follows:
H5: Ceteris paribus, there is a significant relationship between the level of
demand for financial assets and respondents' involvement with
certified financial planners.
134

Hypothesis 6
Following our intention to include the analysis on demand for financial assets to take
into account Islamic financial product preferences and levels of Syariah literacy,
hypothesis 6 (a and b) has tested as follows:
H6,,: Ceteris paribus, there is a significant positive/ negative relationship
between the level of demand for financial assets and respondents'
preference for Islamic or conventional financial assets.
H6b: Ceteris paribus, there is a significant positive/ negative relationship
between the level of demand for financial assets and respondents,
Syarlah literacy.
Hypothesis 7
Due to the importance of the knowledge of financial management, this study tested
whether respondents' exposure to financial issues affects their level of demand for
financial assets. Hypothesis 7 was as follows:
H7: Ceteris paribus, there is a significant positive/ negative relationship
between the level of demand for financial assets and respondents'
exposure to financial issues.
135

Hypothesis 8
Ameriks et aL (2002) revealed a strong relationship between financial planning and
wealth accumulation. Their survey data suggested that individuals with a low
propensity to plan are unable to monitor their spending and not likely to be able to
accumulate wealth. Following their study, we chose to test whether householders'
propensity to plan affect their level of demand for financial assets. Hypothesis 8 was
tested thus:
H8: Ceteris paribus, there is a significant positive/ negative relationship
between the level of demand for financial assets and respondents'
propensity to plan.
136
5.4 Methodological Framework
The study employs regression analysis as a method to establish the relationship between various variables contributing to the demand for financial assets. Variables
explaining the variation in the demand for financial assets are called independent
variables. Due to several independent variables being used in our model, the model is
called multiple regression analysis. The term of multiple regressions had first been
introduced by Pearson (1908)35 . The general purpose of multiple regressions is to
learn more about the relationship between several independent or predictor variables
and a dependent or criterion variable.
There are two types of information that can be obtained by performing the regression
analysis. One is the ability of the regression model to explain the joint significance Of
all variables and second is the relative predictive importance of each variable. The
two qualities of information that can be explained by the regression model attract
researchers to perform regression analysis in order, quantitatively to, examine their
research interest. In this study, the interest is to explain the variation of the level of
demand for financial assets looking at a set of forecasting variables and to study the
relative importance of each factor in relation to other factors which would be obtained
by comparing the beta weights.
In this study, in order to explain variation of the demand for financial assets, we
regressed the observed numerical value of demand for each financial asset to a
constant and various independent variables. Once the relationship between dependent
and independent variables had been established, the model was run to see whether
and how these measures relate to the level of demand for financial assets. For
example, as age is one of the regressors or predictors in our model, we expected to
33 As noted in Sekaran (2003). Research Methods for Business: A Skill Building Approach, 4h Edition, john Wiley and Sons, Inc. New York.
137

learn whether age is a better predictor of the level of demand for financial assets in
relation to other independent variables in the regression equation. Readers may also learn about the entire significance of a set of variables in the model explaining the
proportion of the variance in a dependent variable by looking at the R-squared value.
It could be observed, however, that the set of independent variables might not be
perfectly explaining the actual case. As regression analysis can only establish that a
set of variables explains the proportion of the variance or variation in the dependent
variable, some of the values unexplained by the model might be recorded in the error term. This is called the residual value. It is produced when a regression analysis is
performed. Multiple regressions are usually estimated by using the ordinary least
squares (OLS) method that takes into account these errors or residuals which result from running the regression equation. The goal of regression procedures is to fit a
straight line through the points which had been plotted using the actual observation. The I'modus operandi" of the regression analysis is to minimize the squared deviations of the observed points from the imaginary line of best fit.
For researchers to be able to use OLS as a method of estimation, various requirements have to be met. They are a linearity relationship among variables, normality of distribution of the error term, absence of any multicollinearity 36 problem between
independent variables and homoscedascity or equal variance of the error term.
Furthermore, the regression model must be correctly specified using suitable types of
variables as well as the correct use of power level of the variable. For example, if the
model is specified as a function of a variable with a squared value, merely including
the variable without the power term will accrue to the problem of model
misspecification. If the above observation had been met, then the use of OLS as a
36 This is a common problem in a multiple regression analysis. Multicollinearity is a situation where a relationship between independent variables is observed. For example, if there is thought to be relationships between income and education level, the two variables are considered to contribute to collinearity problem.
138

method of estimation can be used. However, if the above observations cannot be met, a multiple regressions model may still be estimated using the generalised least
squares (GLS) method. In our case, all relevant tests will be performed: for example, performing correlation matrix analysis to detect multicollinearity problem,
examination of error terms to observe the normality and homoscedascity
requirements and so on.
Estimating relationships using regression analysis will result in a more objective
evaluation of a causal relationship as compared to the orthodox method of listing
factors likely to affect a specified occurrence. Subjective judgment is substantially
eliminated when researchers quantify every descriptive factor into numbers before
regression analysis is conducted. On the other hand, to run a regression model, a large amount of data is required for the model to be useful. Regression models with few data are not likely to be enough to explain the true case of a population. They
lack of power of inference for the results to be applied to the whole population.
An empirical limitation of the model is the problem of multicollinearity or interaction
of independent variables. The problem arises when a form of relationship exists between independent variables themselves as well as between independent and
dependent variables. To mitigate the problem, variables must be selected so as to
eliminate collinearity as far as possible. Finally, users of the regression results have to
understand that results that are correct mathematically are not usually applicable to
the situations in hand. The understanding of the problem is beneficial for users when
applying the results of regression not simply a blind interpretation of the
mathematical results.
139

When using regression as a method of analysis, it should be understood that multiple
regression analysis is not an examination of causal analysis. If we find that an independent variable is able to explain a percentage of variation in the dependent
variable, it is not the same as saying that that factors or independent variables cause
or drive the occurrence of the phenomenon. Concerns must also be placed on the fact
that the results of a regression model are only true for the sample that has been
selected and not for the whole population. Although we made efforts to infer that the
results in our regression were applicable to the case of the whole population, the
results are applicable, for example at 95 % level of confidence.
140

5.5 Model Specification
Regression analysis is one of the available models that may be applied in research to find factors which are able to explain a specific phenomenon of research interest. In
our case, multiple regression analysis was conducted to explain the variation in demand for financial assets. Multiple independent variables selected in the light of theoretical and empirical findings of other researchers will be tested to explain the
variation of financial asset demand. The regression model was adopted in similar
studies on the life-cycle effect by Jan Tin (1998), Ioannides (1992) and Poterba and Samwick (1997).
Log Miý ßi+ ß2 109 Wt+ ß3St + ß4Drisk + ß5DcFp + ß6Dconientionaillslamic + ß7syajit+
ßdItý ex _p
+ßjiný_plan+e
Where:
mi=quantity of monetary or financial asset demanded during the period t
w, =scale variable representing household income, wealth and net worth
St= a set of socio-demographic variables (age, gender, marital status, race,
educational level, job sector)
D, j, kt-= Dummy for risk preferences
D, fp= Dummy for engagement with certified financial planners D,
onventionallIslami, = Dummy for preference for Islamic and conventional financial assets Syajit-- the level of Syariah literacy
p= the level of exposures to personal financial issues Fiq ex Fin-plan= the regularity of monitoring of personal financial activities
e= error term
141

Composite or scale variables were used in the regression equation. The variable
consisted of three different wealth measurements. They are householders' income,
wealth and net wealth. Three different wealth measurement variables have to be
tested separately in order to correctly measure the wealth factor without the problem
of multicollinearity being incurred. It meant that, for the type of financial assets
under examination, three separate equations had to be tested to individually trace the
effect of each wealth measurement on the demand for financial asset.
5.6 Measurement and Analysis
Variables included in the research were measured accordingly before the data
collection process and analysis was performed.
5.6.1 Dependent Variables
The amount of financial assets held by householders is the subject of interest of this
research. Financial assets included in the research were chosen on the basis of the
most common types of assets held by average middle-income investors and of the
familiarity of the assets to average householders. By research in the marketplace via
the internet and websites of the leading financial institutions, such as banks, insurance
and unit trust companies, the following lists of assets were included in the research
are as follows: savings accounts in all financial institutions in Malaysia, shares listed
in Bursa Malaysia, the Malaysian stock exchange (formerly known as the Kuala
Lumpur Stock Exchange, KLSE) notwithstanding whether they were in the first or
the second board and unit trusts 37
37 In the U. S, types of financial assets usually included in similar research are checking accounts, NOW and Super-NOW accounts, passbook savings, certificates of deposit, stocks and mutual funds
and municipal and corporate bonds. See Wolff (1979), Jan Tin (1998,2000) and loannides (1992).
142

Transaction accounts, namely current accounts, were excluded as our main concern was to track the financial asset holdings of householders which only related to
savings and wealth accumulations. The holding of current accounts is also less
common than savings accounts in Malaysia where financial institutions usually offer
savings accounts to their customers more than they offer current accounts.
Householders were asked to declare the actual amount of financial assets they are holding. Having the ratio scale data ensured that a parametric test of multiple
regressions could be carried out. The actual amounts were then transformed into logarithm values to avoid the possibility of non-normality distribution of the data
obtained. By taking the log function, dispersion of values for the amount could be
reduced thus reducing the incidence of having data that have outliers' values.
5.6.2 Independent Variables
Sets of independent or explanatory variables have been recognised as able to explain the variation in the demand for financial assets of our research. Measurement of all independent variables will be discussed alternately.
Economic Factors
The economic factors were householders' current income, amount of their wealth and
net wealth. These variables were then separately tested in each regression for every
type of financial asset. This is because income, wealth and net wealth are heavily
correlated due to the one being a subset of another. For example, wealth includes
income values and net wealth is the difference of wealth to financial obligations
under the names of respondents and their spouses.
143

In our case, income was divided into two categories; labour income and non-labour income. Labour income was wages and salaries while non-labour income was income
from financial and non-financial assets such as rental income and income from other
sources. Wealth represented the sum of total labour income described earlier and
current values of other non-financial assets. Non-financial assets included in our case
were current values of homes and other property, estimated saleable value of a business or enterprise, stock of wealth in the form of existing balance in retirement
accounts and current values of motor vehicles.
To arrive at the net wealth value, total liabilities of households had been computed. Data on secured and non-secured liabilities was. In this case, secured liabilities
consisted of the balance on the hire purchase on homes and other property, the
balance of hire purchase debt on motor vehicle, and debt on business and profession
as well as margin and broker accounts. Non-secured liabilities are liabilities which are
not collaterised against any assets owned by the household. We included credit card bills, loans from individuals, loan from financial institutions, educational loans and
other unsecured loans in this category of liability. 38
Householders were required to fumish the actual amount of their income, wealth and
net wealth. The monetary values of the assets were transformed into logarithm values
for the same reason as the amount of financial assets explained earlier.
11 The categorisation and definition for income, wealth and liabilities are guided by the practice of the Survey of Income and Participation (SIPP) of the U. S bureau of Census and Survey of Consumer Finance (SCF) of the Federal Reserve Board of U. S.
144
Age Factor or Life Cycle Hypothesis
To test for the existence of the life-cycle effect, householders' current age were
obtained. There were three distinct age group-boxes for respondents to fill in. The
three groups' categories are less than 30,30-50 and more than 50. The groups
represent qualitative variables. These are variables which can not be quantified in a
meaningful way. To mitigate the problem, they had to be transformed into indicator
variables or dummy variables. 39 The three dummy variables were then tested in the
regression analysis in order to ascertain if there was life-cycle effect for the demand
for financial assets.
Socio- demographic Variables
A set of other socio-demographic variables (gender, marital status, race, educational
level, job sector) were also converted into indicator or dummy variables.
Respondent's gender and marital status represent a dichotomy item with a choice of
responses: male or female for gender; and single or married for marital status of householders. Other variables, i. e. the respondents' race group, level of education and
job sector, fall into categories items. For example, responses for racial type could be
Malay, Chinese or Indian. As for the level of education, the possible responses were
secondary school, diploma, degree graduate and Master's degree qualification.
options in the job sector were fixed as self-employed, government sector or private
sector.
39 See Dielman T. E (2001), Applied Regression Analysis for Business and Economics, Yd Edition, Duxbury Thomson Learning.
145

Risk Tolerance Level
This variable is a dichotomy item. Respondents were asked "Do you prefer to invest
in bonds or stocks? " They were also briefed that investments in stocks are riskier but
have prospects of obtaining higher returns. The purpose of asking this question was to
assess respondents' risk tolerance levels. If a respondent selected the option of bonds,
we have assumed that he is risk adverse compared to those who selected for the
option of stocks.
Choice of Hiring Certified Financial Planners
For this question, respondents were faced with options of yes and no. The wording of
the questions were "Did you hire the service of certified financial planners? " If they
chose the option "Yes", they were then asked to explain why they decided to do so.
The options here were whether they were confident with the advice, whether they
believed that CFP recommended suitable financial products, whether they felt that
they do not have the expertise and confident to do it themselves and finally whether
they do not have sufficient time to do their financial planning. If they answered "No",
they had then to answer the next question of why did they did not hire the service of
CFP. Options here were: Did you do not have enough funds to hire a CFP? Are you
capable of managing your own financial affairs? Are you not comfortable for other
parties to be involved in your financial planning? And finally, are you not familiar
with the service provided by CFPs? The dummy variable of respondent's
involvement with CFP was then regressed against the demand for financial assets to
analyse whether respondent's involvement with CFP is significant in driving the
demand for financial assets.
146

Preference for Islamic and Conventional Financial Assets
Because one of the objectives of the study was to analyse the demand for Islamic and
conventional financial assets, a dummy variable to assess respondent's preference for
the two types of financial assets was asked. If they chose the option of Islamic
financial assets, this was taken to mean that they prefer to invest Syariah approved
assets. If they had invested in a combination of the two products, they had to declare
which type of financial assets (Islamic or conventional) they preferred more. If the
result of the dummy variable is significant, this was taken to mean that there is a
significant difference between respondents' demand for Islamic financial assets and
conventional financial assets. In other words, the way respondents' chose the type of financial assets affect the level of demand for that type of asset.
Syariah Literacy
This variable was included in the study to capture the respondents' level of Syarlah
literacy. It relates directly with examining the demand for financial assets especially
with the specific intention of distinguishing between the demand for Islamic and
conventional financial assets. The level of Syariah literacy relates to respondents'
exposure to issues in Islamic finance such as their understanding on the prohibition of
riba', unlawful activities, uncertainty, gambling and discouragement of monopolies.
Furthermore, respondents were then asked whether they were aware of various
aspects concerning the Syariah Advisory Boards. They were asked whether they were
aware of the existence of such boards and who the key persons of the boards are what
the boards stood for and how aware were they on lists of halal counters approved by
the boards. A total of 10 questions were posed to measure respondents' levels of
Syariah literacy. The response format was a five-point Likert scale ranging from I-
point (poor), indicating the lowest level of literacy, to 5-point (excellent) indicating
the highest level of literacy. The lowest total score is 10, whilst the highest total score
147

is 50 indicating that the level of Syariah literacy to the demand for financial assets is high.
Financial Exposure
The Likert scale was used in measuring a respondent's financial exposure. In this
case, respondent's level of financial exposure was captured using variables such as the usage of financial information from such sources as business magazines,
newspapers, television programmes, radio programs and representatives of financial
products. The response format was from I-point (never use) indicating the lowest
level of literacy, to 5-point (use greatly) indicating the highest level of literacy. A
total of 5 questions were asked. The lowest score is 5, whilst the highest score is 25
indicating that the level of financial literacy to the demand for financial assets is high.
Financial Planning
As for the measurement of the concept of financial planning, four questions were
asked. They were asked on how often they save for their future, monitor their income
and expenditures, and investments and retirement accounts. A 5-point Likert scale
was used in this case. 1 point was given if they answered "never", 2 points for "once
in a year", 3 points for "once in 6 months", 4 points for "monthly" monitoring and 5
points if they monitored their personal financial activities "weekly".
148

5.7 Data Collection Issues
5.7.1 Population, sampling frame and sampling method
The choice of sample frame is critical to the sampling process. If the frame is
wrongly defined, it will result in the sample not being representative of the target
population. As wrongly defined sample frame is the result of under-definition or
over-definition of the subjects. For example, an under-defined sample frame may
contain the target population plus others who should not be included. The sample frame may be also ill-defined where it contains wrong sets of subjects. This is the
case where the sample frame does not contain the target population.
For this study, the sample frame was very large. This is because we did not have the
information on the total size of our population, which is the total number of
respondents investing in various types of financial assets. This information was not
obtainable as, being confidential by nature, to obtain it from related financial
institutions such as unit trust institutions and savings institutions would lead to a
breach of confidentiality regulations. The sample frame, thus, could not have been
made available in our case. Furthermore, names, addresses and other information of
investors are also confidential by nature. 40
There are two types of method that may be used when conducting sample surveys.
One is probability sampling and the other is non-probability sampling. Probability
sampling is a method of selecting a sample such that each sampling unit has a
specific probability of being chosen. Probabilities of sampling units to be chosen may
be either equal or not equal. There are various types of probability sampling but the
most commonly used technique is simple random sampling. Non-probability
sampling, on the other hand is a method of selecting sampling units using no specific
40 The confidential clients' information had been expressed in BAFIA (Banking and Financial Institutions Act 1989, Part VIII)
149

probability structure. The method of selection of non-probability sampling is based
on various factors, for example, the percentage of a specific group to the population
or quota and a self-selection of sampling subjects or voluntary sampling.
For probability sampling to be conducted, a full sampling frame is needed. The
absence of a sampling frame in our case limited the use of probability sampling. This
of course would adversely affect the quality of empirical study in our research. This is
because probability sampling is superior to non-probability sampling, because only
results from probability sampling can be generalised to the whole population. Non-
probability sampling, on the other hand, limits the use of sample survey results to be
inferred to the whole population. But, in social sciences study, this does not apply. Inferences in social science research drawn term sample surveys are now accepted
and justifiable. This is only possible, however, if samples taken represent the
population under the study (Oakes, 1986).
Driven by the unavailability of a sampling frame, voluntary sampling technique was
utilised. This gave the prospect of increasing the level of participations of sampling
units. This technique is widely used in market surveys where the significance of
participation is needed. Voluntary sampling in this study is not merely applied only for its conveniences, but more on the ground of statistical requirement of sampling frame which was lacking in our research. Furthermore, increasing the level of
participation could be ensured by using this specific sampling technique of non-
probability sampling.
For this reason, responses related to financial assets were collected. Thus, the data
from banks on savings account holders, unit trust institutions for unit trust holders
and securities companies for share holders were assembled. Only respondents who 66passed" the vetting process were invited to answer the questionnaires. By collecting the data from places which contain the subjects related to the sample, the applicability
and relevancy of the data is enhanced.
150

The projected numbers of individuals acting as heads of a householder to fill in the
questionnaires ranged from 200 to 300. They were to be offered small a key chain as in gratitude for their participation.
5.7.2 Sample size estimation
The aim in sampling was to get an accurate estimate of the population's
characteristics from measuring the sample's characteristics. The main contributing factor in deciding whether the estimates will be accurate is to ensure that the sample is representative of the population. One way to achieve this is to determine on the
correct size of the sample. The basis for calculating the size of samples is that there is
a minimum sample size required for a given population to provide estimates with an
acceptable level of precision. Any sample larger than the minimum size, if chosen
properly, should yield results no less precise, but not necessarily more precise, than
the minimum sample. Using a small sample increases the possibility that the sample
will not be representative, but a sample that is larger than the minimum calculated
sample size does not necessarily increase the probability of getting a representative
sample. As with precision, a larger-than-necessary sample may be used, but is not justified on statistical grounds.
In addition, both an appropriate sample size with the proper sampling technique is
required. If the sampling process is carried out correctly, using an effective sample
size, the sample will be representative and the estimates it generates will be useful.
There are several assumptions which have to be made when estimating sample sizes.
First, has to be assumed that estimates produced by a set of samples from the same
population are normally distributed. Estimates from samples may either follow the
151

normal distribution pattern or non-normal distribution pattern. A well-designed
random sample is the sampling method that will most usually produce such a distribution. In this study, we assumed the normality of the sample estimates could be
achieved due to the representative quality of samples to the population which the
sampling techniques used. This assumption is vital if researchers wish to determine
their sample sizes using the normal distribution formulae recommendation.
The second stage is to assume or rather decide on the level of acquired accuracy of the sample estimate. For example, if we decide that the accuracy has to be ± 5%, the
estimated value must be within five percent either way of the 'true' value, within the
margin of error defined in the next assumption.
We can decide on a margin of error for the estimate, usually expressed as a
probability of error (5% or 0.05). This means that in an acceptably-small number of
cases (e. g. five out of a hundred) our sample estimate is not within the accuracy range
of the population estimate defined in the last assumption.
We can provide a value for the population variance (S' ') of the variable being
estimated. This is a measure of how much variation there is within the population in
the value of the property we are trying to estimate. Note that it is the variance of the
population of variables that is needed to calculate the appropriate sample size. In
general we would require a larger sample to accurately estimate something that is
very variable and a smaller sample in the situation of less variation in the population
variance. Although we almost never have a value for the population variance, there
are various ways of obtaining an estimate to be used in calculating sample sizes.
Conducting pilot studies before performing the actual sample survey is a valid
estimation technique of population variance of variables.
152

The formula for this rule of thumb is based on the standard error as used in normal curve tests. Size determination formulae were as follows:
(S) *ZIT)2 Sample Size =A
where (S) is the population variance of the variable with the largest variance (perhaps estimated in a pre-test sample),
z is the number of standard units corresponding to the desired proportion of cases (z = 1.96 for two-tailed tests at the 0.05 significance level), and
T is the tolerated variation or margin of error in the sample as described above.
It is to be noted that the sample size is not related to population size (N); it depends
on the variability of the population and the accuracy and that we wished to achieve as well as our toleration for errors in the results.
In relation to the determination of sample sizes, Roscoe 41 suggested that for
multivariate research, the sample size should be ten times or more than the number of
variables in the study. In our case, the number of predicting variables was 17, thus the
minimum number of response needed was 170. A more relaxed approach was also
proposed by Roscoe that sample sizes of 30 to 500 are appropriate for most research.
For the reason of simplicity, we observed his suggestions when determining the
sample size of our research.
" As cited in Sekaran (2003).
153

5.8 Research instruments, reliability and validity tests
Each of the individuals was thought to be suitable was given a set of questionnaires.
Householders with comprehensive holdings of financial assets were included in the
study and required to provide input data about their level of income, wealth, net
worth and their pattern of financial assets holdings. To ensure the quality of the data,
a vetting process was conducted before the questionnaires were distributed. Further
justification of the vetting process was to make sure that the only householders with
an appropriate level of financial assets holding were included. The wrong type of
respondents would allow an inappropriate evaluation being drawn on the life-cycle
effect on financial asset demand.
in respect of the data on the demand for financial assets, household holdings for the
three types of assets, namely unit trusts, shares and saving accounts, were recorded as
well as the level of assets held. We used micro data obtained directly from
households in order to mitigate the shortcomings of using aggregate money supply as
has been done in other studies. Using the aggregate money supply as proxy for
demand for financial assets can lead to identification problems as discussed in
Laidler (1977 and Cooley and LeRoy (198 1). If research using aggregate data is to be
conducted, difficulties to decompose the components of data at the aggregate level
will result to inaccuracy of the data is being used. For this reason, we decided to use
micro data obtained directly from the target group of our study to eliminate any
identification problem.
Data on the characteristics of householders, on the other hand, who actually demand
the types of assets referred to above, had to be observed. In this respect, data on labour income, wealth, net worth, demographic, socioeconomics had also to be made
available. Jan Tin (1998) in similar study used the above types of data which he
obtained from the Survey of Income and Program Participation (SIPP). The reference
on what types of background data to collect can be found in the Survey of Consumer
154

Finance in the U. S. In Malaysia, there have been no surveys on consumer finance
ever conducted apart from data emanating from the census on population is done once in every 5 years. Lack of micro data available on household finances forced us to
conduct questionnaire sessions in order to retrieve the information on wealth, income,
liability holdings, choices of financial assets held as well as socio-demographic data.
Apart from this, other information needed to pursue this research, such as the
On the other hand, data on the characteristics of householders who actually demand
the types of assets referred to above had to be observed. In this respect, data on labour
income, wealth, net worth, demographic, socioeconomics had also to be made
available. Jan Tin (1998) in similar study used the above types of data which he
obtained from the Survey of Income and Program Participation (SIPP). The reference
on what types of background data to collect can be found in the Survey of Consumer
Finance in the U. S. In Malaysia, there have been no surveys on consumer finance
ever conducted apart from data emanating from the census on population is done once
in every 5 years. Lack of micro data available on household finances forced us to
conduct questionnaire sessions in order to retrieve the information on wealth, income,
liability holdings, choices of financial assets held as well as socio-demographic data.
Apart from this, other information needed to pursue our research such as the
involvement of professional assistance on portfolio allocation and the attitude of
households towards Syariah compliancy had to be collected.
As the data concerned household finances issues covering major important areas in
consumer finances, our study may act as an incentive stepping-stone to such
authorities such as Bank Negara Malaysia to conduct similar survey to widen
understanding on the current situation of consumer finances in the country. Such an
initiative is needed as BNM is the main authority responsible in drafting various
policies relating to consumer finances such as rates of interest, the promotion of
certain types of financial asset holding and monitoring the inflation rate for the whole
economy. By understanding the actual situation of consumer finances, macro
155

economic policies may be formulated in a more informed way. Furthermore, data,
information and research on consumer finance are needed for subsequent research on
consumer finance to be conducted. This is the case in the US where numerous
studies are conducted concerning household portfolio allocation behaviour and
consumer finance issues. Research by Teichman et al. (2001) is among other studies
that used data from the Survey of Consumer finance provided by the Federal Reserve
Board of US as a benchmark for their work on the management of personal finances
among urology residents. A similar initiative is needed to facilitate similar research in
Malaysia.
Jan Tin (1998) conducted a time series study to examine major financial assets in the
U. S. Our study, in contrast is a cross-section study of major financial asset demand in
Malaysia. The choice to perform the cross-section analysis stems partly from the lack
of previous data related to Malaysian consumer finances which can be used for
comparison purposes. Furthermore, by performing a cross-section analysis,
information on differences in portfolio allocation behaviour can be thoroughly related
to differences in householders' ages. For young, middle aged and old households,
behaviour in asset allocations via the types of financial assets chosen may be studied
after taking into consideration their background variables of wealth, income and
demographic variables.
To ensure that the questionnaire was indeed accurate to measure all the construct
variables for Syariah literacy, propensity to plan and financial literacy, Cronbach's
coefficient alpha was performed to test for internal consistency of the measures. The
reliability of the instrument indicates the extent to which it is without bias (error free)
and hence ensures consistent measurement across time and across the various items in
the instrument (Sekaran, 2003). On top of this, the reliability of the instrumentation is
an indication of the stability and consistency with which the instrument measures the
concept and helps to assess the goodness of a measure. In other words, it indicates
how well the items in a set are positively correlated to one another. The closer
156

Cronbach's alpha is to 1, the higher the internal consistency for reliability. An alpha
value of 0.7 or more is considered sufficient as suggested by Nunnally 42 . Results in
Table 5.10 confirm that items in the questionnaire relating to all construct variables
are all consistent across time. For example, for Syariah literacy, the alpha value is
0.86. This means that the 10 items constructed to measure Syariah literacy are
positively correlated to one another. This makes the measurement of the concept
consistent across time and various items constitute the Syariah literacy variable.
Table 5.1: The Results for Reliability Test
Construct/Variable No. of Items Cronbach's Alpha
Syariah Literacy 10 Alpha = 0.8572
Propensity to Plan 4 Alpha= 0.6072
Financial Literacy 5 Alpha = 0.7958
Source: Based on Author's Own Calculation
On the other hand, validity tests enlighten how well the developed instrument was
able to measure the particular concept as intended. Validity is concerned with
whether we measure the right concept. Principal component analysis (Varimax) was
applied to test their construct validity (Cook and Campbell, 1979, cited in Sekaran,
2003).
Table 5.2 shows the results of validity for each construct used in this study. The
Bartlett test of sphericity is significant at p<0.0001 and the Kaiser-Meyer-Olkin
measure of sampling adequacy for each construct is greater than 0.7 except for a
"propensity to plan" measure with the value of 0.638. The desired value for the KMO
42 According to Nunnaly (1978), as cited in Sekaran (2003), the satisfactory level of reliability depends on how a measure is being used. In the early stages of research on predictor tests or hypothesized measures of a construct, one saves time and energy by working with instruments that have only modest reliability, for which purpose reliabilities of 0.60 or 0.50 will suffice (p. 226).
157

test is 0.7 and above although values near to 0.7 can be considered acceptable. This
validates that each construct has been developed effectively to measure the variables concept.
Table 5.2: The Results for Validity Test
Bartlett's Test
Construct/Variable No. of
Items
Approx Chi
Square
Sig. KMO
Syadah Literacy 10 1568.42 0.000 0.845
Propensity to Plan 4 123.44 . 000 0.638
Financial Exposures 5 452.51 0.000 0.731
Source: 13ased on Autlior's L)wn Calculation
5.9 Procedures for Questionnaire with Householders and Questionnaire with Financial Planners
500 sets of questionnaires were personally distributed in the place of data collection between the periods of I" November 2005 to 31" December 2005 (Refer to Appendix
4 for the full questionnaire). The questionnaire sessions were held in Permodalan
Nasional Berhad, Tabung Haji, Maybank, APEX, and KN Kenanga 43 . For Tabung
Haji, in addition to their clients, all managers in every department in its headquarters
were also approached. Most of the time, respondents were asked to return the
completed questionnaires promptly. The researcher used the opportunity to distribute
the questionnaires directly to respondents while they were waiting for services at the
counters. They were allowed to return their questionnaires by post for which they
" Permodalan Nasional Berhad is a unit trust company which sells various unit trusts products. Tabung Haji is a non-banking financial institution that facilitates depositors to perform hajj. Depositors also can deposit there solely for saving and investment purpose. Maybank is a local banking institution that is considered as a major bank in Malaysia. APEX and KN Kenanga is the brokerage houses that manage accounts of investors investing in various selections of shares and bonds.
158

were given a self-addressed enveloped. The researcher believed that by personally
approaching the respondents, they would be more likely to answer the questions with
care once they had agreed to take part.
At the end of the period of data collection of seven weeks, a total of 258 completed
questionnaires had been answered leaving 242 questionnaires unanswered. The
completed 258 questionnaires represent a response rate of 51%. The response rate of 51% is considered high, according to Roscoe (as cited in Sekaran, 2003) where, for
multivariate research, the recommended sample size should be 10 times or more than
the number of variables in the study. However, Roscoe also stated that sample sizes
of between 30 and 500 are appropriate for most research.
With regards to the financial planners, we sent the questionnaire via emails (A sample
of an invitation letter to a financial planner and his answers to the questionnaire can be found in appendix 8). Telephone calls followed later to confirm their participation.
Initially face-to-face interviews were planned, but after much discussion it was
agreed that it would be more convenient and time-saving for the questions to be
answered electronically. The responses of the financial planners who agreed to
participate were fast. Financial planners only took an average of a week to respond to
the questions.
Initially, the names and contact details of practising financial planners was obtained
from FPAM's website. At the time of our research, there were the names of ten
financial planners actively advertising their services on the website 44 . Emails
containing the invitation letter sent to all ten of them in addition at a new contact, Independent Islamic Financial Planners (IIFIN) Sdn. Bhd. that had been obtained
44 A new list of licensed financial advisers (financial planners) as at 3 Oth June 2005 are available at:
- icensed/IAFP. 12df. The new lists consist of 20 companies and 34
individuals practicing as certi ied financial planners. The updated lists had been produced according to the new requirement of Securities Commissions of Malaysia (SEC) on financial planners wanting to practice in Malaysia.
159

through my attendance to a financial planning conference 45 . Eventually, a total of
seven financial planners agreed to participate.
Table 5.3: The Lists of Certified Financial Planners on FPAM's Website as at 10'h November 2005 Rajen Devadason, RD WealthCreation Sdn Bhd
_Tel: +60-6-6328955, Email: rajen0)rajendevadason. com
NK Foo, NK Foo Business Solutions Sdn Bhd
_Tel: +60-88-262630, +60-88-256684, Email: nkfoobizcavo. faring. my
Poedio Soesilotorno, ATA Capital Sdn Bhd Tel: +60-88-238706, +60-88-216000, Email: tom(a)atacar)ital. com Christina Lo,, Purmacs Corporate Network Sdn Bhd / Purmacs Management Sdn Bhd Tel: +60-88-255199, +60-88-255655,088-266166, Email: r)urmacspl)o. iarinq. mv Robert Foo, MyFP Services Sdn. Bhd. Tel: +60-3-89963292, +60-3-89963428, Email: robert(&mvfr). com. mv Chan Chee Sing, MyFP Services Sdn. Bhd ' Tel: +60-3-89963292, +60-3-89963428, Email: chancs0mvfD. com. mv Arbayah Ismaill, Moreclass (M) Sdn Bhd Tel: +60-3-55128700, Email: arbavah(5)tm. net. my Thum KP, KPR Wealth Management Sdn Bhd Tel: +60-4-6567885, +60-4-6570132, Email: ki)thum(-d)kr)rwealth. com Mike Lee, CTLA Financial Planners Sdn Bhd Tel: +60-3-78061422, Email: mikelee(&ctia. com. my Teoh Kok LLn, Singular Asset Management Sdn Bhd Tel: +60-3-62016208, Email: koklIn@singuLar. com. My
Source: www. fbam. org. mv
After contacting the financial planners, 7 financial planners agreed to participate. This
reflects the participation rate of 70% which is very high. The financial planners who had accepted our offer to participate in the research are as follows:
a. Poedjo Soesilotomo of ATA Capital Sdn. Bhd.
b. Maznita Mokhtar of HFIN Sdn. Bhd.
c. Robert Foo of MyFP Sdn. Bhd.
d. KP Thum KPR Wealth Management Sdn. Bhd.
45 seminar Kewangan Keluarga Islam (Seminar on financial management for Muslim families), was held on 25-26 December 2004 at the Pan Pacific Hotel. The event was organized by Institut Kefahaman Islam Malaysia (Institute of Islamic Understanding Malaysia), government body disseminating information about Islamic affairs and Hijrah Strategic Advisory Group (Hijrah) whose executive director is Hajah Rohani Datuk Mohd Shahir, a prominent expert in Islamic financial planning. Hijrah is one of many IFP Education providers of FPAM offering FPAM Practice Module 1: Islamic Financial Planning Course.
160

e. Rajen Devadason of RD WealthCreation Sdn. Bhd. f. Arbayah Ismail of Moreclass Sdn. Bhd. - the company collaborates
with CTLA financial planners
g. Karen Ong of OSK wealth planners
The questions were designed to know about the financial planners such as on their
background such as their qualifications, number of years they had been in operation
as well as on their age and gender. On the question of their experience in financial
planning we were keen to learn about the types of services they offered, methods of
compensation and the types of clients the dealt with. We asked about their clients' demographic as well as their economic background. In order to learn more about the
level of financial planning expertise of householders who had chosen to hire them we
requested planners to rate their clients' skills. We also sought information on their
clients' level of knowledge on Islamic financial planning.
5.10 Conclusion
Our research aim was to study the demand for financial assets in Malaysia. To do
that, we tested on the presumable factors which drive the demand for financial assets
which includes savings accounts, unit trust and shares. A set of questionnaire was
developed to accomplish the research objectives accordingly. Consequently, data
were then analysed systematically by using the SPSS: a statistical package
commonly used in social sciences research. One of the aims of the research is also to
learn about financial planning in Malaysia in term of the practice of financial planners
and the background of their clients. In order to do that, we designed a questionnaire
for financial planners to provide the relevant information.
161

CHAPTER 6
DETERMINANTS OF THE DEMAND FOR FINANCIAL ASSETS IN
MALAYSIA: EMPIRICAL RESULTS AND FINDINGS
6.1 Introduction
This chapter presents the empirical results of the study. The first section provides
profiles of the respondents who participated in the study. It is followed by the
descriptive statistics of the data collected. A descriptive statistics presentation is
important to make sense of data and will also assist readers who are less familiar with
the jargon of regression analysis to benefit from the findings of our research. In
order to identify factors important to the level of demand for financial assets, we
present our descriptive results in a similar manner to assist readers to understand the
objective of the study rather than merely to describe data. In other words, the
descriptive statistics presentation should serve more than a mere description of the
data but also as an opportunity to understanding the demand for financial assets. The
areas of descriptive statistics that discussed are the demographic characteristics,
financial characteristics and various aspects of household demand for financial assets.
Next in this chapter are the results of the validity and reliability of the research
instruments. Tests on the validity of the instruments used in data collection were
necessary in order to validate the data collected and concepts we measured. This is
relevant for the construct variable created to measure the concepts of Syariah literacy,
financial literacy and the household's propensity to plan. The next test presented is
the reliability test which is needed to check that the instruments used are consistent
each and every time they are used and thus are reliable to measure the intended
concept.
162

The main result of the analysis using multivariate regression analysis is reported next in the chapter. Model summary that contains the estimation of the goodness of fit of
the data (R, R2 and R') is presented for all three types of financial assets. Standard
error of estimate, F-test that assess overall performance of the regression model and Durbin Watson test that reflects the degree of dependency of variable with its own
error term, i. e. autocorrelation, is also presented.
Finally, the results of post-regression tests or diagnostic tests performed to validate
all the assumptions for the regression analysis are reported in this chapter. The
diagnostics tests for linearity, constant variances, and normality distribution of data
collected. In addition, we tested for autocorrelation of disturbance and to assess
correlation between independent variables. These tests were performed in order to
ascertain that multiple regression analysis performed was correctly and precisely
carried out so that the results can be relied upon.
6.2 Descriptive Statistics
6.2.1 Demographic background
Table 6.1 depicts the respondent's characteristics with regards to their demographic
backgrounds, from where it can be observed that most of the respondents were aged
between 30 and 50 years. 65.5% of observations are from this age group. Nearly 67%
are male. Most of the respondents are married householders. 41.5% of respondents
hold undergraduate degrees. In terms of job sector, most of our respondents are
working in the private sector. Finally, a high majority of 91% of our respondents are
Malay.
163

Table 6.1: Respondent's Demographic Backgrounds
Demographic backgrounds Frequency Percentage
Age Less than 30 years 40 15.5
Between 30-50 years 169 65.5
More than 50 years 49 19.0
Gender Male 172 66.7
Female 86 33.3
Marital status Single 34 13.2 Married 220 85.3 Divorced 4 1.6
Highest academic Secondary school 28 10.9 qualification
Diploma 66 25.6
Degree 107 41.5 Master's degree 52 20.2
Doctoral degree 5 1.9
Job sector Self-employed 33 12.8
Government 96 37.2
Private 123 47.7
Currently unemployed 6 2.3
Ethnicity Malay 236 91.5 Non-Malay 22 8.6
Source: Based on Author's own caiculation
From the frequency analysis in Table 6.1, we decided to use the highest frequency for
every group as the base or dummy group. As many demographic background
variables are categorical variables, one category has to be treated as the control group
or dummy variable before multiple regression analysis can be employed. Thus, the
categories of "age between 30-50 years", 66male", "married", "degree", "private
sector" and "Malay" were regarded as the base groups. For frequency analysis, we
also decided to drop insignificant categories in which the frequency of response was
significantly low. These categories are "divorced", "doctoral degree" and "currently
unemployed". The justification for the decision is for the regression not to be over-
164

burdened with the inclusion of less significant variables. Inclusions of the respective insignificant categories would result in lengthy regressions that would be of little to
the research. Trivial data can also introduce outliers that could adversely affect
regression analysis.
6.2.2 Financial Background: Income, Wealth and Net Wealth
In addition to the respondents' demographic data, data on their financial position, for
example their level of income, wealth and net wealth, were also collected. From the
sample size of 258; n=258, a mean value which indicates the average income of
respondents was about MYR 83 '00046 annually. The value of mean is higher than of
the median of nearly 58,000 annually. The value of the standard deviation is huge at
about MYR 100,000. This indicates that the value of an observation can be higher or
lower than the mean value by that amount. High standard deviation signals that we
have to convert the definite value of income to logarithm values. This is in order to
reduce the gap between the absolute values to eliminate obvious outliers' data which
in turn can affect the quality of the research. The minimum value of recorded income
is zero and the highest is MYR 855,000 and this large gap between the minimum and
maximum value contribute to high standard deviation.
The mean value of wealth, which is the addition of income and other assets holding
such as property and motor vehicles as well as financial assets is higher at more than
one million. The median is also high at more than MYR 700,000. The standard
deviation is very high at 1.4 million. The minimum value is nearly MYR 41,000 and
the maximum is nearly MYR 16 million. On the other hand, the mean value of net
wealth of respondents is nearly MYR 900,000. Net wealth reflects the addition of
income and assets after all liabilities have been deducted which explains its lower
46 All figures are in Malaysian currency, Ringgit Malaysia (MYR).
165
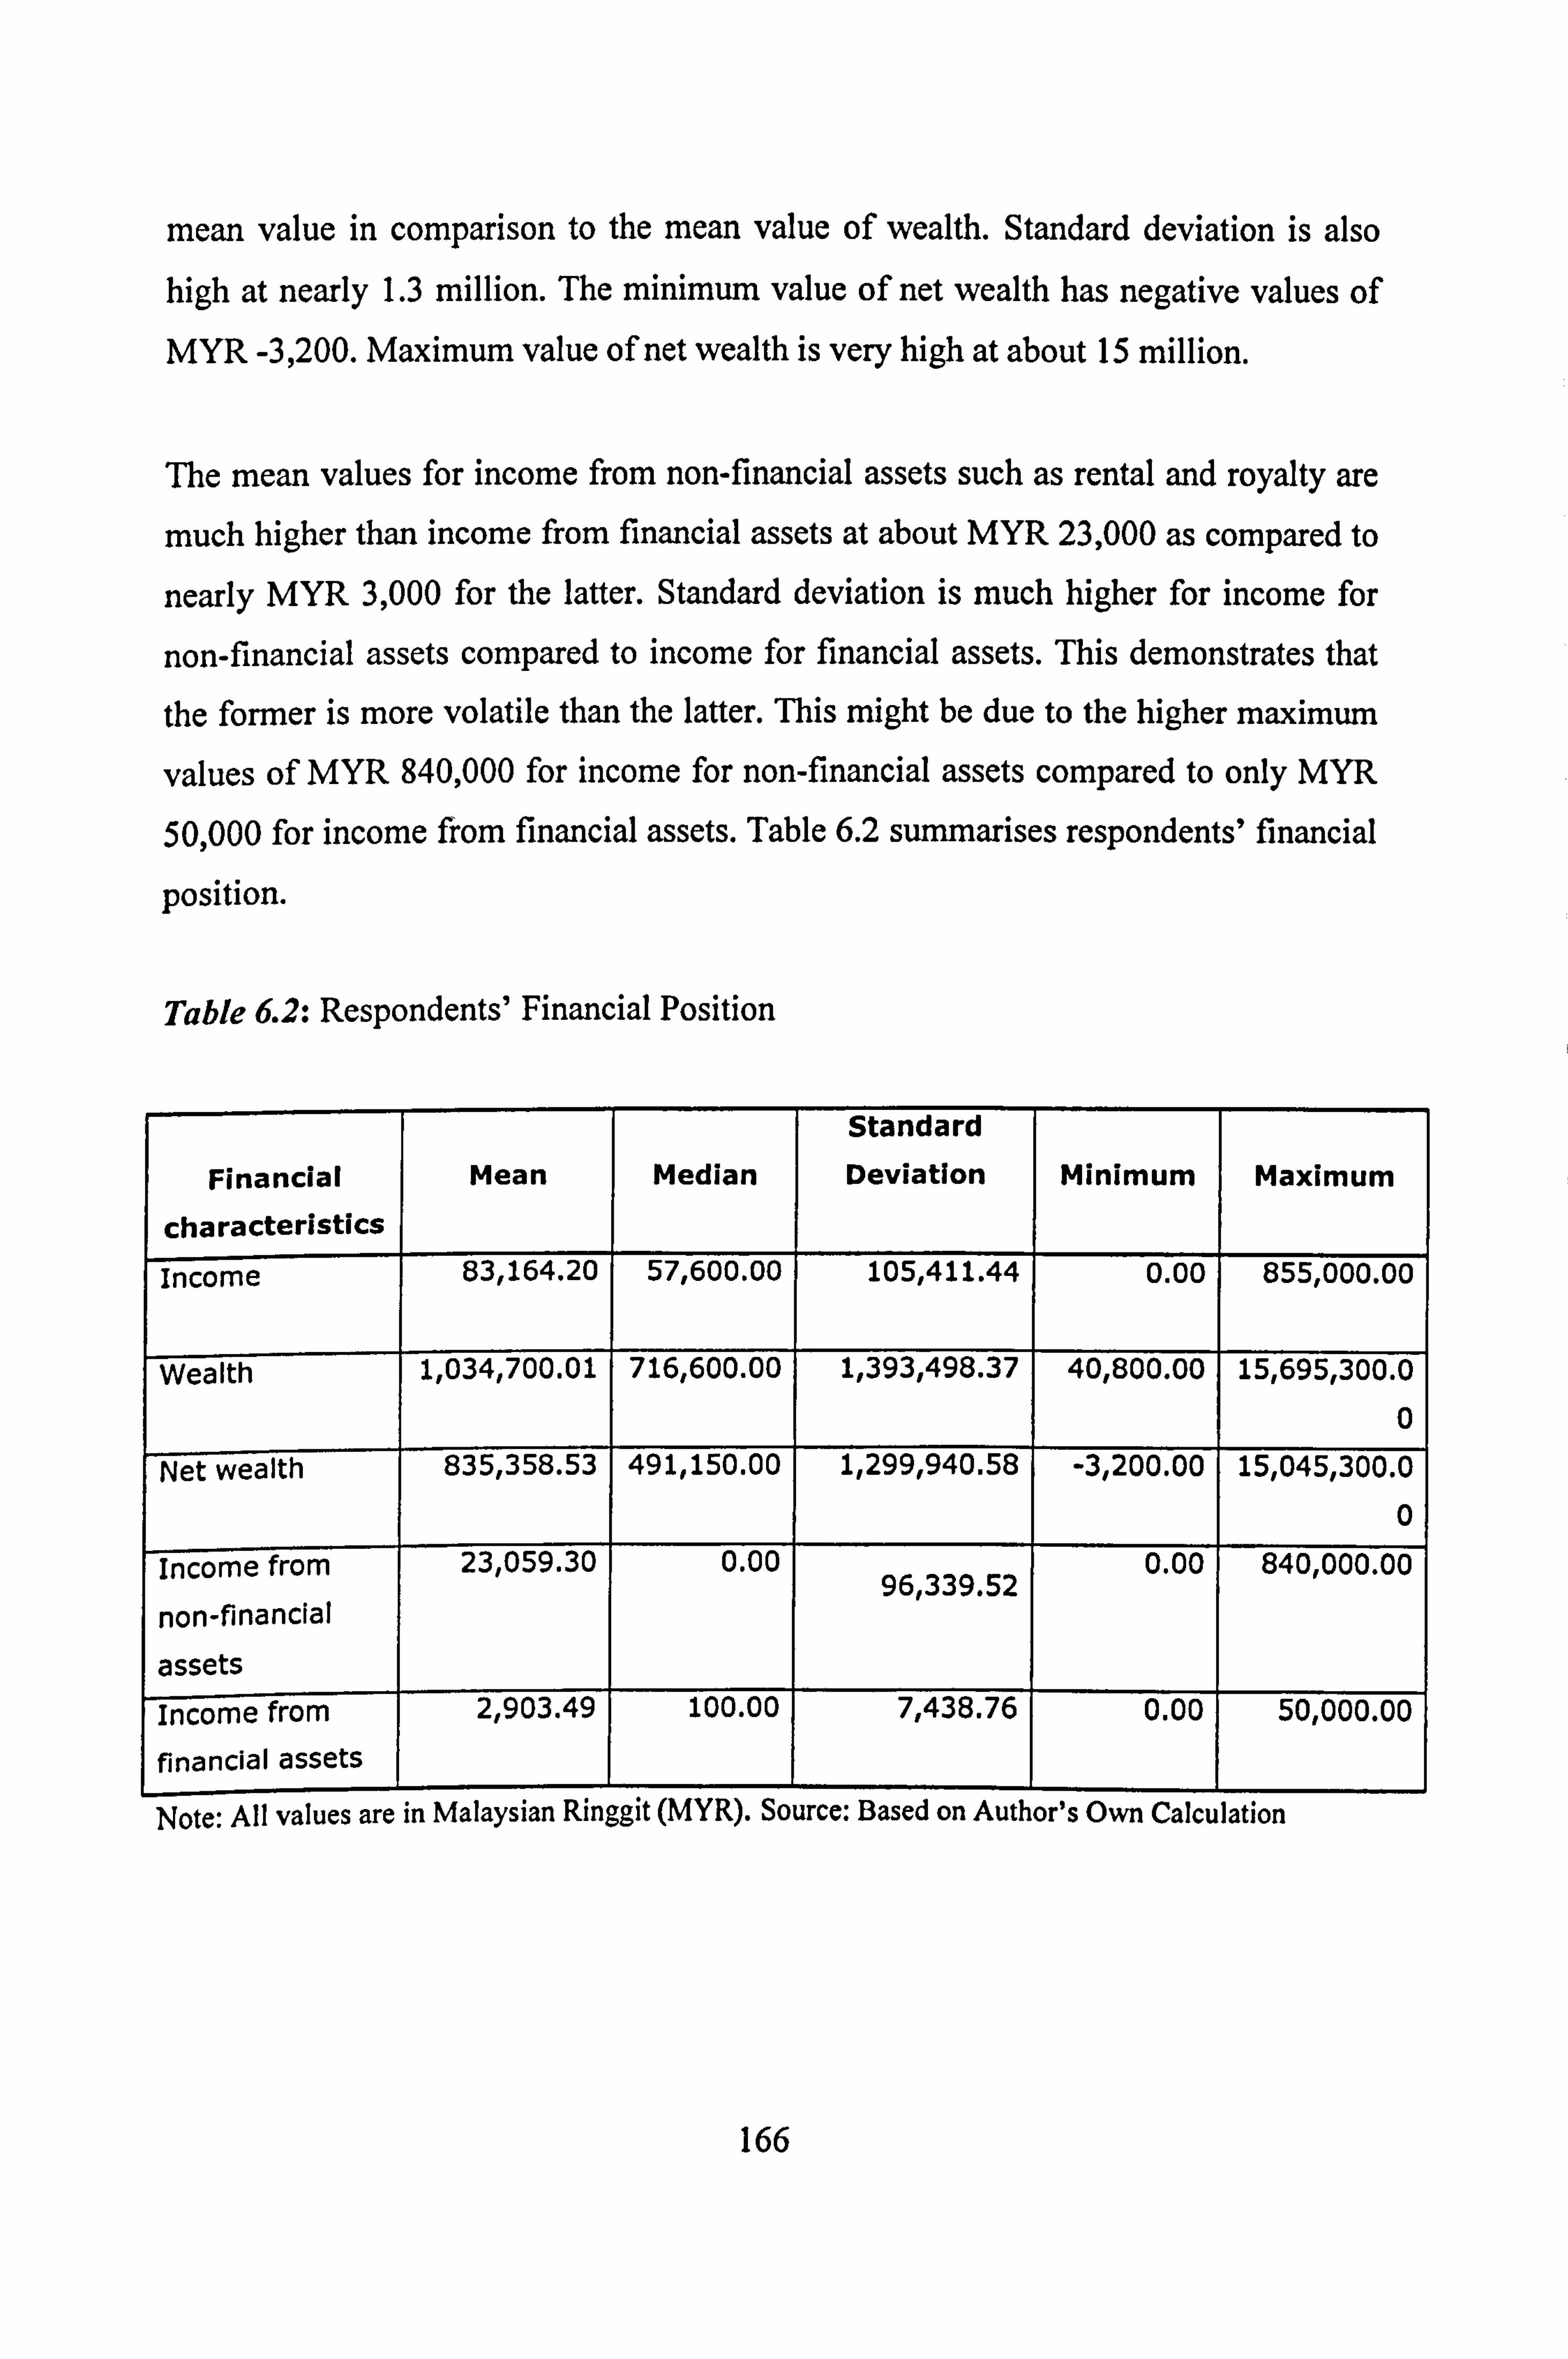
mean value in comparison to the mean value of wealth. Standard deviation is also high at nearly 1.3 million. The minimum value of net wealth has negative values of MYR -3,200. Maximum value of net wealth is very high at about 15 million.
The mean values for income from non-financial assets such as rental and royalty are
much higher than income from financial assets at about MYR 23,000 as compared to
nearly MYR 3,000 for the latter. Standard deviation is much higher for income for
non-financial assets compared to income for financial assets. This demonstrates that
the former is more volatile than the latter. This might be due to the higher maximum
values of MYR 840,000 for income for non-financial assets compared to only MYR
50,000 for income from financial assets. Table 6.2 summarises respondents' financial
position.
Table 6-2: Respondents' Financial Position
Standard
Financial Mean Median Deviation Minimum Maximum
characteristics income 83,164.20 57,600.00 105,411.44 0.00 855,000.00
Wealth 1,034,700.01 716,600.00 1,393,498.37 40,800.00 15,695,300-. 0
0
Net wealth 835,358.53 491,150.00 1,299,940.58 -3,200.00 15,045,300.0
0
Income from 23,059.30 0.00 0.00 840,000.00 96,339.52
non-financial
assets
ncome from 2,903.49 100.00 7,438.76 0.00 50,000.00
financial assets
Note: All values are in Malaysian Ringgit (MYR). Source: Based on Author's Own Calculation
166

6.2.3 Frequency Analysis on the Demand for Unit Trusts, Shares and Savings
As the main objective of the research is to examine the level of demand for financial
assets of respondents, we asked them about the type and level of financial assets they held including unit trusts, shares and savings. The mean value of respondents'
holdings of unit trusts, shares and savings is slightly higher than MYR 50,000, nearly
MYR 19,000 and slightly more than MYR 13,000 respectively. The median value for
unit trust and savings is comparable at the value of MYR 8,000 and MYR 10,000
while the median value of shares is zero. The standard deviation for unit trusts is the
highest at about MYR 112,000 while the standard deviation for shares and savings is
comparable at about MYR 60,000 for both types of financial assets. Maximum values
for unit trusts are MYR 540,000 while for both shares and savings they are MYR
400,000. The descriptive statistics are presented in Table 6.3.
Table 6.3: Amount of Respondents' Financial Assets Standard
Items s
[
Mean Median Deviation Minimum Maximum
of Total V-alue 51,612.40 8,000.00 112,131.19 0.00 540,000.00
Unit Trust
Total Value of 18,992.25 0.00 61,730.00 0.00 400,000.00
Shares -fo-tal ýValue of 13,224.57 10,000.00 59,343.31 0.00 400,000.00
Savings I I I I I I Note: All values are in Malaysian Kinggit tivi T K). zoource: t3asea on Aumors uwn uaicuiation
Further examination was performed by way of frequency and percentage analysis.
Table 6.4 demonstrates the frequency and percentage of unit trust holders at a specific
value. It can be observed from the table that 36% of respondents do not hold any
amount of unit trusts.
167

Nearly 59.3 % of respondents hold less than MYR 10,000 worth of value of trust trusts (Refer to the cumulative percent column of Table 6.4). 70.9% of all respondents hold unit trusts to the value of less than MYR 20,000 while 76% of respondents hold less than 30,000 of unit trusts. 85.3% of respondents hold less than MYR 60,000 thus giving the remaining 15% of respondents hold amounts between
MYR 60,000 and MYR 540,000. The top 10% of respondents who own unit trusts fall into the range of MYR 230,000 to MYR 540,000.
Table 6.4: Total Value of Unit Trust Held by Respondents
Amoun (MYR) Frequency Percent Valid Percent Cumulative
Percent Valid 0 93 36.0 36.0 36.0
4000 1 .4 .4 36.4 5000 13 5.0 5.0 41.5 6000 9 3.5 3.5 45.0 7000 5 1.9 1.9 46.9 7500 2 .8 .8 47.7 8000 14 5.4 5.4 53.1 9000 16 6.2 6.2 59.3
10000 1 .4 .4 59.7 11000 2 .8 .8 60.5 12000 5 1.9 1.9 62.4 13000 4 1.6 1.6 64.0 14000 2 .8 .8 64.7 15000
- - 5 1.9 1.9 66.7
160 00 6 2.3 2.3 69.0 17000 1 .4 .4 69.4 18000 3 1.2 1.2 70.5
- 19000 1 .4 - .4 70.9 20000 2 .8 .8 71.7 23000 3 1.2 1.2 72.9 24000 1 .4 .4 73.3 25000 2 -. 8 .8 74.0 28000 - -
1 .4 .4 74.4 00 00 5 1.9 1.9 76.4
34000 2 .8 .8 77.1 35000 4 1.6 1.6 78.7 36000
- - 1 .4 .4 79.1
T7 00 0 31 1.2 1.21 80.21
168

Table 6.4: Total Value of Unit Trust Held by Respondents (continued)
38000 4 1.6 1.6 81.8 40000 1 .4 .4 82.2 41000 1 .4 .4 82.6 42000 2 .8 .8 83.3 45000 3 1.2 1.2 84.5 50000 1 .4 .4 84.9 56000 1 .4 .4 85.3
120000 2 .8 .8 86.0 130000 2 .8 .8 86.8 140000 3 1.2 1.2 88.0 150000 1 *4 .4 88.4 200000 1 .4 .4 88.8 230000 3 5 1.9 1.9 90.7
:::::::: ,5
E2 50000 1 .4 .4 91.1
260000 1 4 .4 91.5 270000 6 2.3 2.3 93.8 300000 3 1.2 1.2 95.0 340000 1 .4 .4 95.3 350000 2 .8 .8 96.1
_ _ 430000 5 1.9 1.9 98.1 500000 4 1.6 1.6 99.6 540000, 1 .4 . 41 1000
Total 1 258. 100.0 100.01 7ýý
Note: All values are in Malaysian iunggit tmYK). ziource: tsasea on Autnor's L)wn ualculation
The data on the amount of trust holding is skewed to the left which indicates that
more respondents hold fewer amounts of unit trusts with fewer respondents having
larger holdings. This kind of distribution is typical for householders. The following
histogram may help to visualise the situation:
169

200
1 ý,
Std. Dev = 112131.2
Wan = 51612.4
N= 258.00
0,0 100000.0 200000.0 300000.0 400000.0 500000.0
500000 150000.0 250000.0 350000.0 450000.0 550000.0
Total Value of Unit Trust
Figitre 6.1: Total value of unit trusts holding of respondents
According to Table 6.5, in comparison to the ownership of unit trusts, a very high
percentage of respondents do not own shares. 62.8% percent do not own shares
compared to only 36% who do. This shows that unit trusts are more popular with the
public than shares. This may be due the fact that the provident fund only allows
participants to invest in unit trusts and not in shares. The regulation is a blanket
approach adapted to participants in order to reduce the exposure to risk and protect
the individual's retirement fund which is designed to act a buffer stock when his/her
period ofernployment ceases. 82.2% ol'the respondents held less than MYIZ I o, ooo
worth of' value of shares. This indicates that share holding is not a popul, 11- type oI,
asset to be held by Malaysians. 90% ol'the householders held MYR 42,000 or I'mcr
V, IlLICS of' shares. The data also revealed that the demand Cor shares dispersed greatly
from MYR 40,000 to 400,000 lor Ilie reinaining 109/14 oftlie respoildents.
170

Tahle 6.5: Total Value of Shares Held by the Respondents
Amo nt (MYR) Frequency Percent Valid Percent Cumulative
Percent Valid 0 162 62.8 62.8 62.8
4000 2 _ .8 .8 63.6
5000 13 5.0 5.0 68.6 6000 7 2.7 2.7 71.3 6500 3 1.2 1.2 72.5 7000 7 2.7 2.7 75.2 7500 2 .8 .8 76.0 8000 12 4.7 4.7 80.6 8500 1 .4 .4 81.0 9000 3 1.2 1.2 82.2
10000 5 1.9 1.9 84.1 12000 1 -
.4 .4 84.5 14000 2 .8 .8 85.3 15000 1 .4 .4 85.7 16000 1 .4 .4 86.0 17000 2 .8 .8 86.8 18000 2 .8 .8 87.6 33000 1 .4 .4 88.0 35000 2 .8 .8 88.8 36000 1 .4 .4 89.1 40000 2 .8 .8 89.9 42000 1 .4 .4 90.3 46000 1 .4 .4 90.7- 50000 1 .4 .4 91.1 65000 3 1.2 1.2 92.2 70000 4 1.6 1.6 93.8 76000 2 .8 .8 94.6 80000 2 .8 .8 95.3 90000 1 .4 .4 95.7
- 1_30000 1 .4 .4 96.1
- 165000 1 .4 .4 _ 96.5
180000 1 .4 .4 96.9 250000 1 .4 .4 97.3 300000 3 1.2 1.2 98.4 360000 2 .8 . 81 99.2 400000 2 .8 . 81 100.0
Total 258 100.0 100.01 Note: All values are in Malaysian Ringgit (MYR). Source: Based on Author's Own Calculation
171

300
200
100
0
Std. Dev = 61730.00
Wan = 18992.2
N= 258.00 0 ý,
' -0 -ý, zO 7, D, qO 70 Ob Co oo, 3oý % Co % Co 00 oý 0 0 190 ob 19b ob týo
'? 0 ý? o ý? o 0'? o, 0'? o- 0'? o- oqo- 0'? o, 0'? o, 0'? o- 0'? o, 0'? o- 0'? o- 0'? o- oi? o- 0? o Total Value of Shares
Figure 6.2: Total Value of Share I foldings of Respondents
The percentage of respondents who do not have any savings is low at 9.7% compared
to the percentage of' respondents who do not hold unit trusts and shares at 36% and
62.8% respectively. On the other hand, 91.9% of respondents hold savings of less
than MYR 10,000 leaving the remaining 8.1%% with more than MYR 10,000
savings up to a value of MYR 250,000. This may due to the popular believe that it is
necessary to maintain a specific Fund for emergency that lasts I*or several nionths.
observing Figure 6.3, again it is clear that the distribution t'Or the pattern of' dernand
savings is also tilted to the left. This indicates that more respondents hold lcwer
savings and that the vast arnount of savings is held in the hands ofthe wealthy 10%
ofrespondents.
172
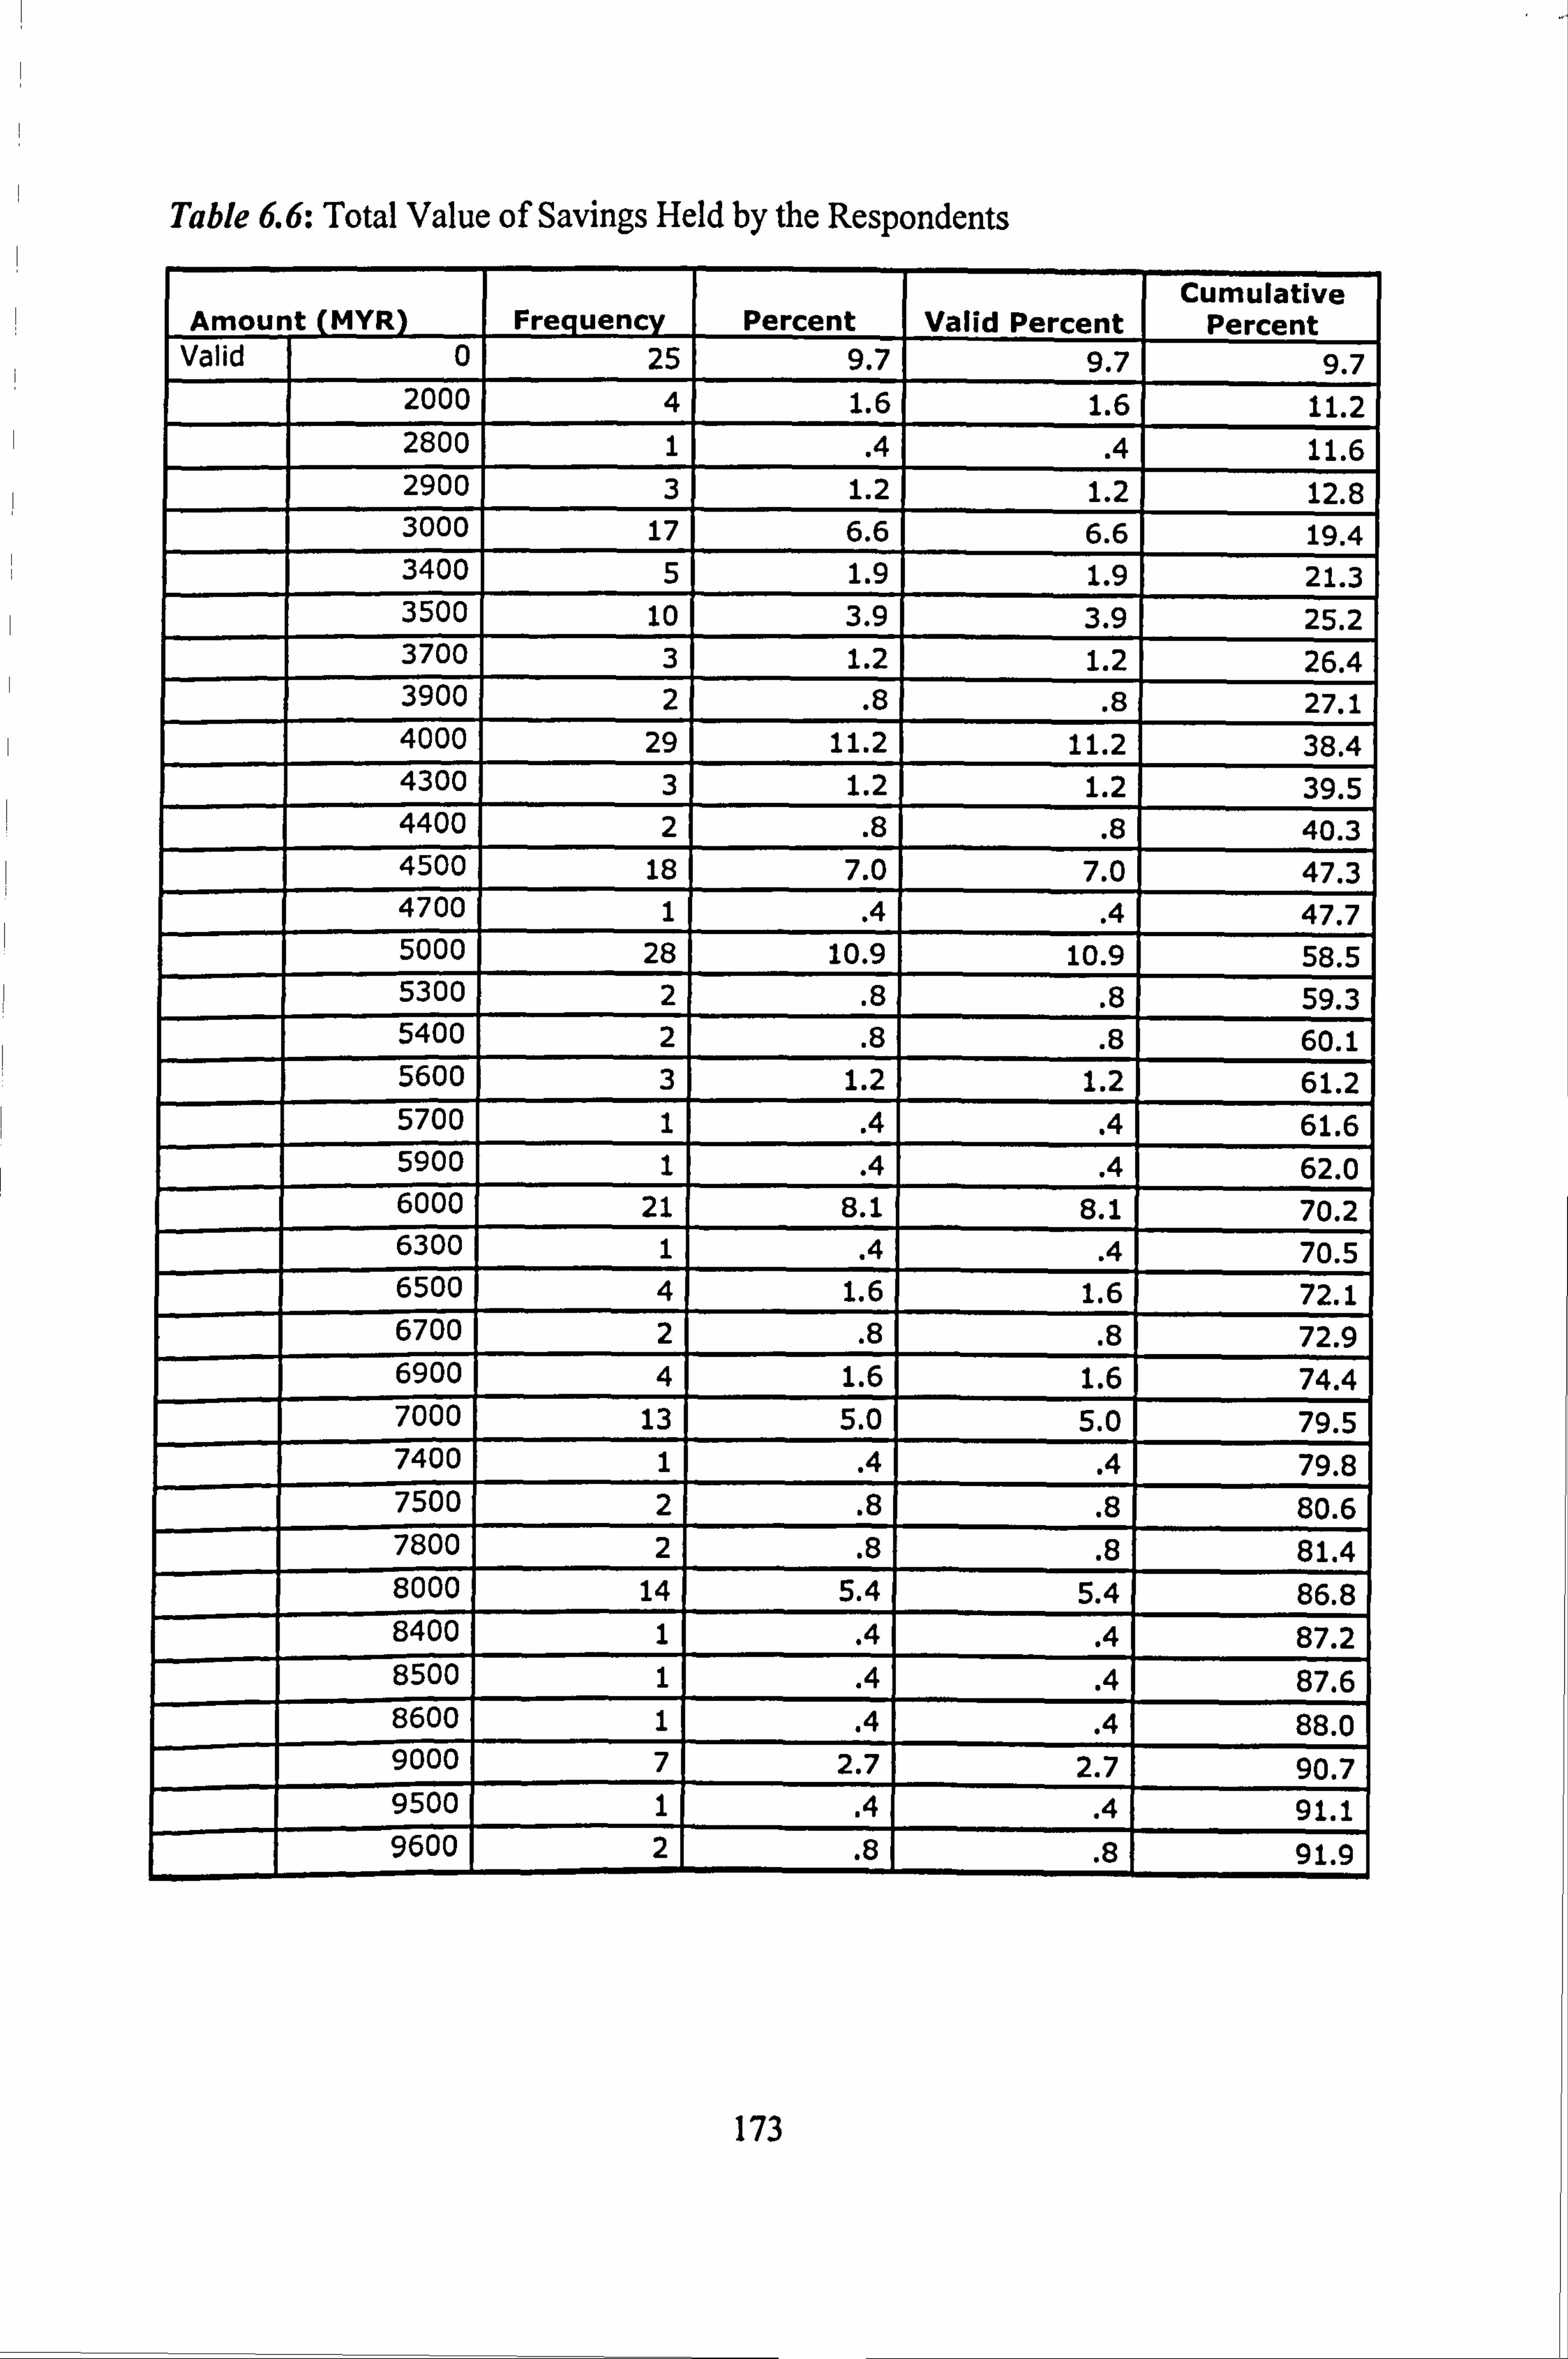
Table 6.6: Total Value of Savings Held by the Respondents
Amou t (MYR) Frequenc Percent Valid Percent Cumulative
Percent Valid 0 25 9.7 9.7 9.7
2000 4 1.6 1.6 11.2 2800 1 .4 .4 11.6 2900 3 1.2 1.2 12.8 3000 17 6.6 6.6 19.4 3400 5 1.9 1.9 21.3 3500 10 3.9 3.9 25.2 3700 3 1.2 1.2 26.4 3900 2 .8 .8 27.1 4000 29 11.2 11.2 38.4 4300 3 1.2 1.2 39.5 4400 2 .8 .8 40.3 4500 18 7.0 7.0 , 47.3 4700 1 .4 .4 47.7 5000 28 10.9 10.9 58.5 5300 2 .8 .8 59.3 5400 2 .8 .8 60.1 5600 3 1.2 1.2 61.2 5700 1 .4 .4 61.6 5900 1 .4 .4 62.0 6000 21 8.1 8.1 70.2 6300 1 .4 .4 70.5 6500 4 1.6 1.6 72.1 6700 2 .8 .8 72.9 6900 4 1.6 1.6 74.4 7000 13 5.0 5.0 79.5 7400 1 .4 .4 79.8 7500 2 .8 .8 80.6 7800 2 .8 .8 81.4 8000 14 5.4 5.4 86.8 8400 1 .4 .4 87.2 8500 1 .4 .4 87.6 8600 1 .4 .4 88.0' 9000. 7 2.7. 2.7 90.7 95001 1 .4 .4 91.11
r-I 96001 2 .81 . 81 91.91
173

Table 6.6: Total Value of Savings Held by the Respondents (continued) 12000 1 A A 92.2 13000 1 A A 92.6 15000 2 .8 .8 93.4 16500 2 .8 .8 94.2 23000 1 A 94.6 34000 1 A 95.0 45000 2 .8 .8 95.7
100000 1 A .4 96.1 120000 1 A A 96.5 150000 2 .8 .8 97.3 180000 1 A .4 97.7 200000 1 A A 98.1 230000 4 1.6 1.6 99.6 250000 1 .4 A 10
11 Total 1 258 100 0 100.0 1 9
Note: All values are in Malaysian Ringgit (MYR). Source: Based on Author's Own Calculation
300
200
100
Std. Dev = 38663 68
Nban = 132446
N= 258.00
0 -"0 570 190 &0 70 7ýD 117, -16,1 7& �--0, lýD -: slr e
0 190 190 ob 190 00 ob ob ob ob 190 00 ob 00, ý`o q0 q0 ý`o % 0'?
o 0'?
o %%%%%%
Total Value of Savings
Figtire 6.3: Total Value of Savings of Respondents
174

6.2.4 Frequency Analysis on the Choice between Islamic and Conventional
Financial Assets, Syariah Literacy, Propensity to Plan and Financial Literacy
The expansion of the Islamic banking and finance industry in Malaysia from the
1980s onwards has resulted in increased household participation in the demand for
Islamic financial assets. To demonstrate the fact, we asked respondents about their
choices of financial assets. Did they choose conventional financial assets or Islamic
financial assets? Table 6.7 surnmarises the frequency and percentage of demand for
Islamic and conventional unit trusts, shares and saving accounts. From the table it can be observed that 61.6% of respondents had chosen to invest in conventional unit
trusts compared to the remaining 38.4% who held Islamic unit trusts. This is
understandable since conventional unit trusts have been offered in Malaysia far
longer than Islamic unit trusts thus giving conventional unit trust providers the
advantage of a more stable client base compared to Islamic unit trust providers.
As for the demand for shares, nearly 80% of respondents hold conventional shares
compared to Islamic compliant shares despite the fact that about 80% of shares listed
in Bursa Malaysia are Syariah compliant. As for savings, more than half of
respondents saved in Islamic financial institutions such as banks and other Islamic
institutions such as Tabung Haji (a pilgrimage fund). As unit trusts and shares are
comparatively new investment avenues offered by the Islamic financial institutions,
the level of demand for them is not as high as the demand for Islamic compliant
savings which have now entered into the stable stage of its establishment.
175
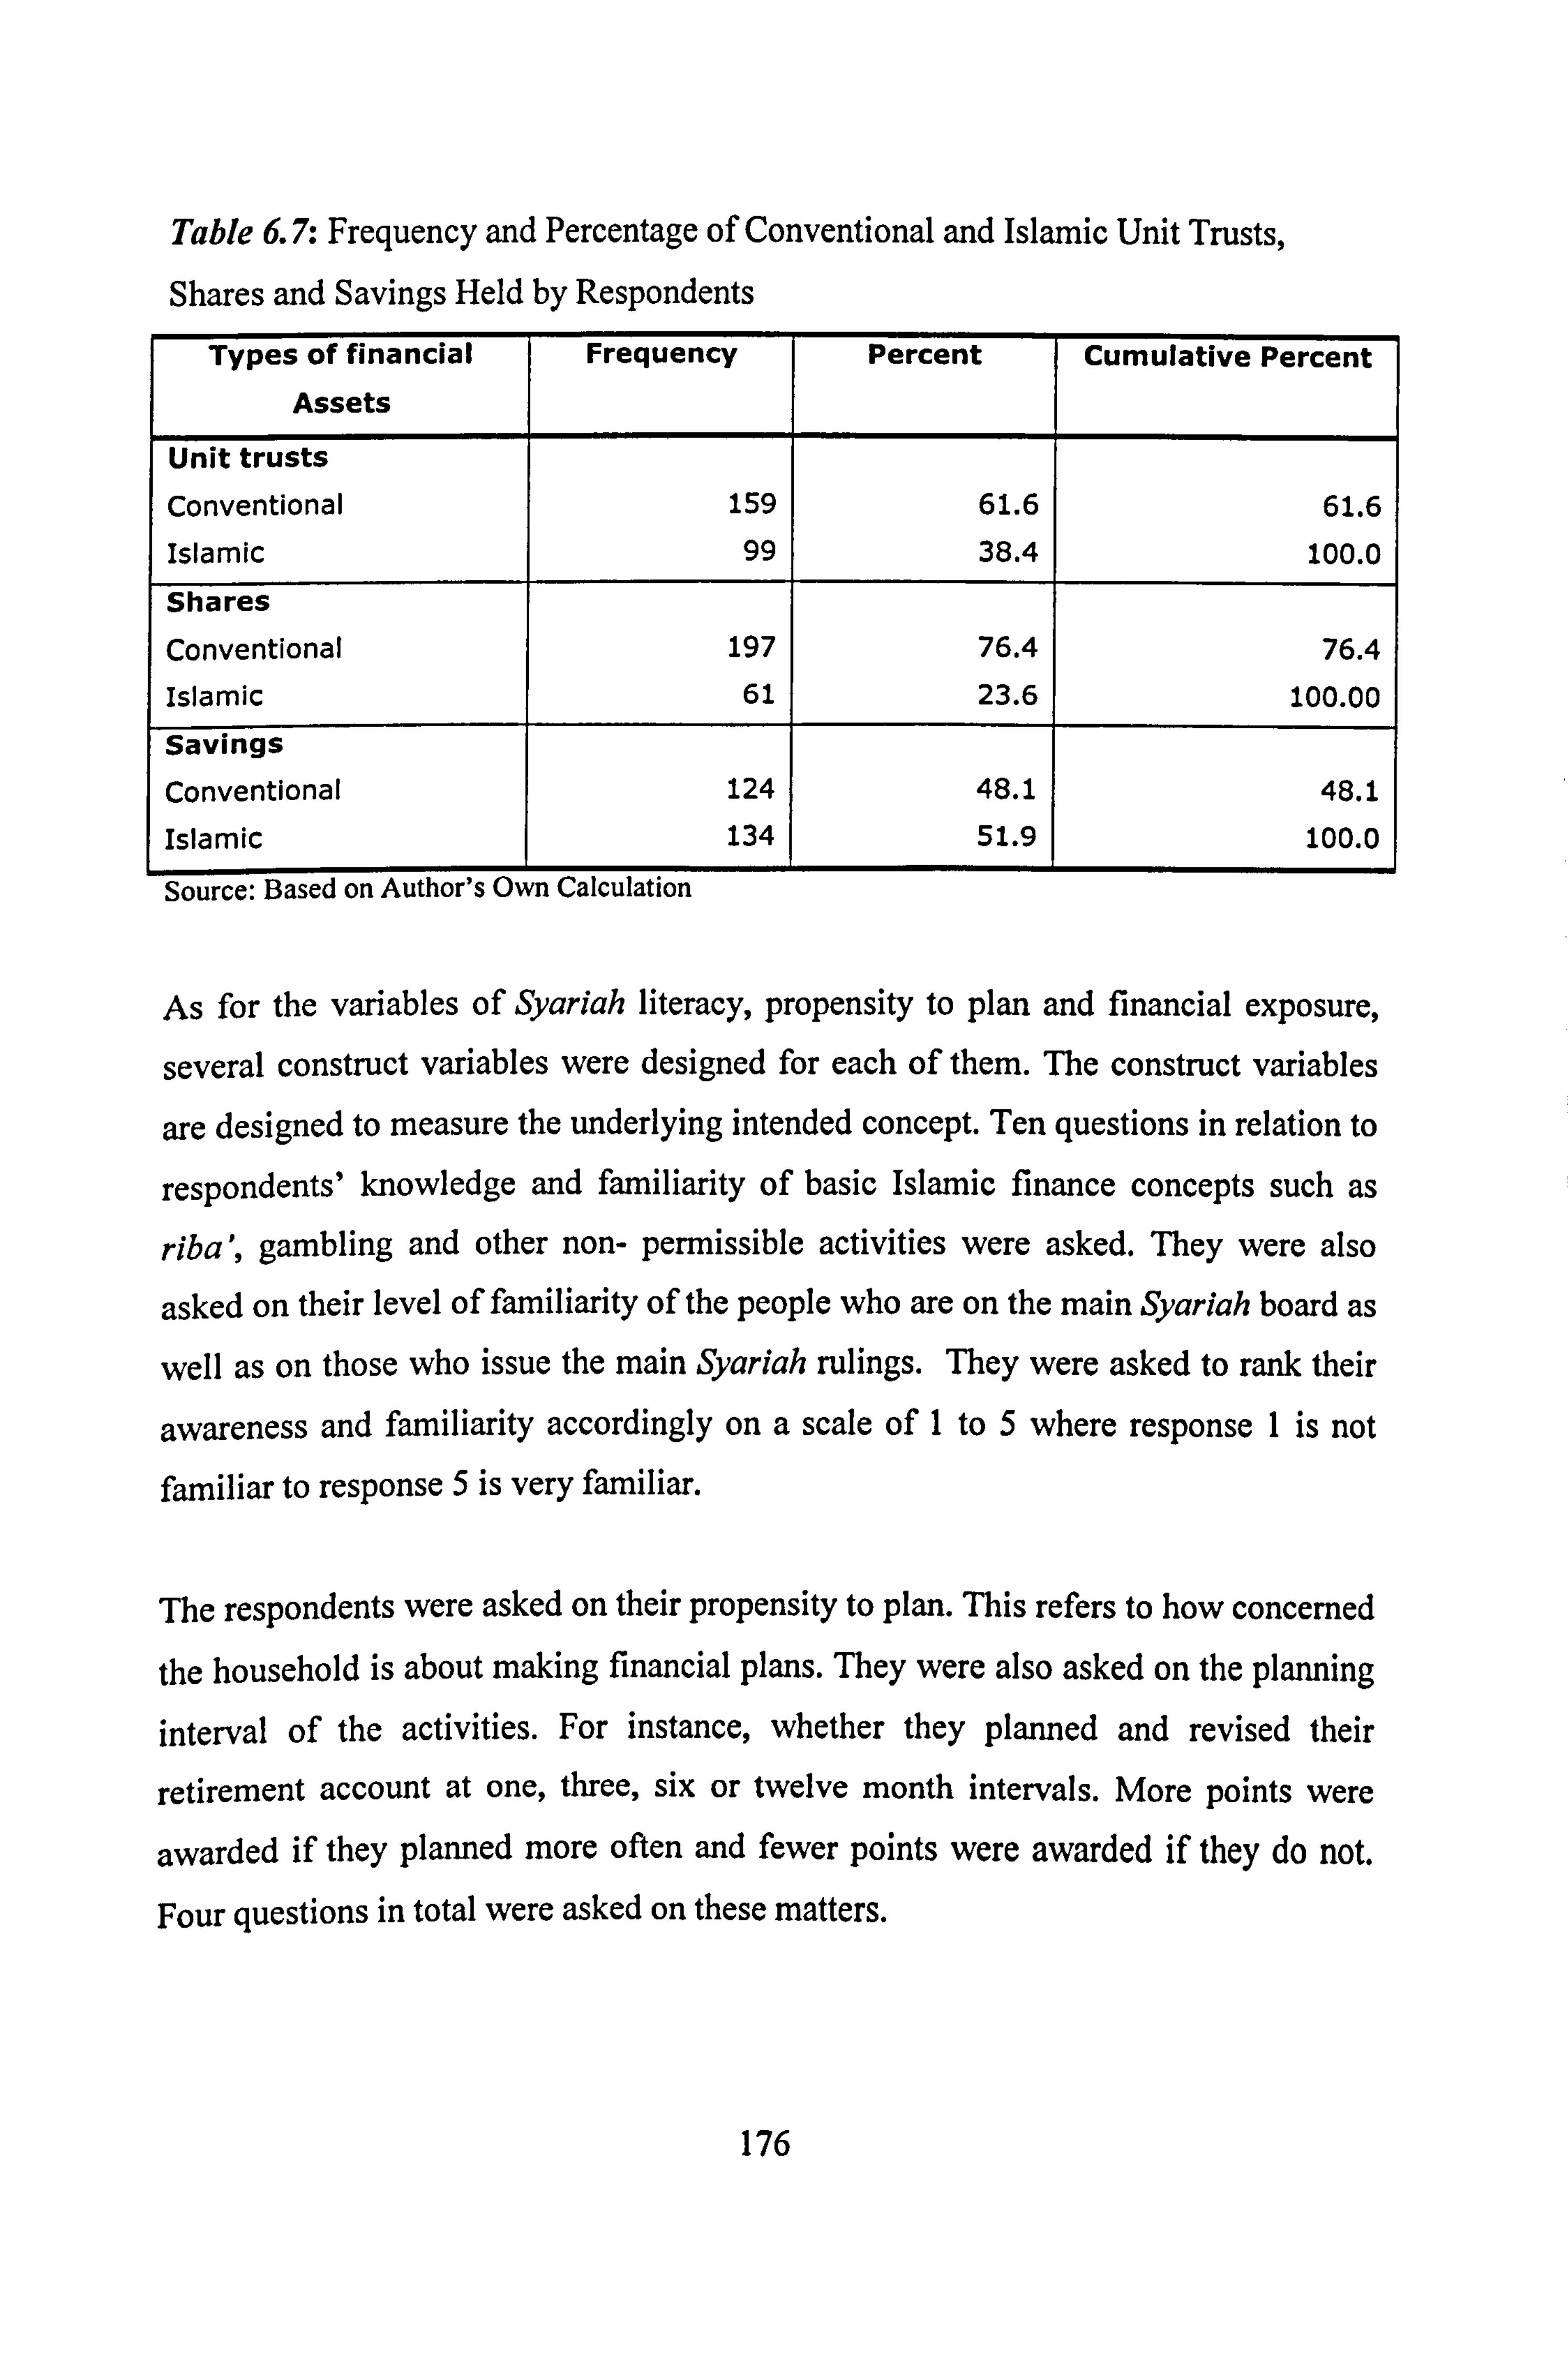
Table 6.7. - Frequency and Percentage of Conventional and Islamic Unit Trusts,
Shares and Savings Held by Respondents
Types of financial Frequency Percent Cumulative Percent Assets
Unit trusts
Conventional 159 61.6 61.6
Islamic 99 38.4 100.0
Shares
Conventional 197 76.4 76.4
Islamic 61 23.6 100.00
Savings Conventional 124 48.1 48.1
Islamic 134 51.9 100.0
Source: Based on Author's Own Calculation
As for the variables of Syariah literacy, propensity to plan and financial exposure,
several construct variables were designed for each of them. The construct variables
are designed to measure the underlying intended concept. Ten questions in relation to
respondents' knowledge and familiarity of basic Islamic finance concepts such as
riba', gambling and other non- permissible activities were asked. They were also
asked on their level of familiarity of the people who are on the main Syarlah board as
well as on those who issue the main Syariah rulings. They were asked to rank their
awareness and familiarity accordingly on a scale of I to 5 where response I is not familiar to response 5 is very familiar.
The respondents were asked on their propensity to plan. This refers to how concerned
the household is about making financial plans. They were also asked on the planning interval of the activities. For instance, whether they planned and revised their
retirement account at one, three, six or twelve month intervals. More points were
awarded if they planned more often and fewer points were awarded if they do not.
Four questions in total were asked on these matters.
176

On financial literacy, five questions were designed. The questions were devised in
order to learn about respondents' perceptions of the usefulness of various sources of information such as television, radio, newspaper and magazines. They were asked on
their frequency of usage of the respective information provider. Responses varied from never to great use of the information source; scale I for never and 5 for great
use of the source information.
Table 6.8 summarises important statistics on Syariah literacy, the propensity to plan
and financial literacy. The minimum and maximum values reported allow for the
possibility of an extremely low or high response level. The lowest score for Syariah
literacy is 10 indicating that there were incidences of one point have been scored for
all ten questions. The maximum score is 50 indicating that there were one or more incidences where the maximum 5 points for a question had been scored for all ten
questions. The minimum values for propensity to plan were also one point for each
question and the highest is 19 points indicating that no single respondents had a
perfect financial plan. The same applied to financial literacy with the minimum
scores of one point of each question and no perfect score for all questions thus
resulting in a score of 24 out of a possible 25 points.
The best indicator for evaluating the level of Syariah literacy is the value of mean and
standard deviation. The mean score for Syariah literacy is nearly 34 points; higher by
nearly 10 points to the middle value of 25 out of the possible maximum value of 50.
The respondents had been given five options of response to self-report on their level
of Syariah literacy related to specific issues. The options were poor, not very poor,
moderate, good and very good. The mean value of 34 reflects that, on average, most
respondents indicated that they are moderately literate on the issues related to Syariah
compliant investment. The standard deviation for Syariah literacy is 8.55 reflecting
that an observed value can range between 8.55 lower or higher than that of the mean
value of 34.
177
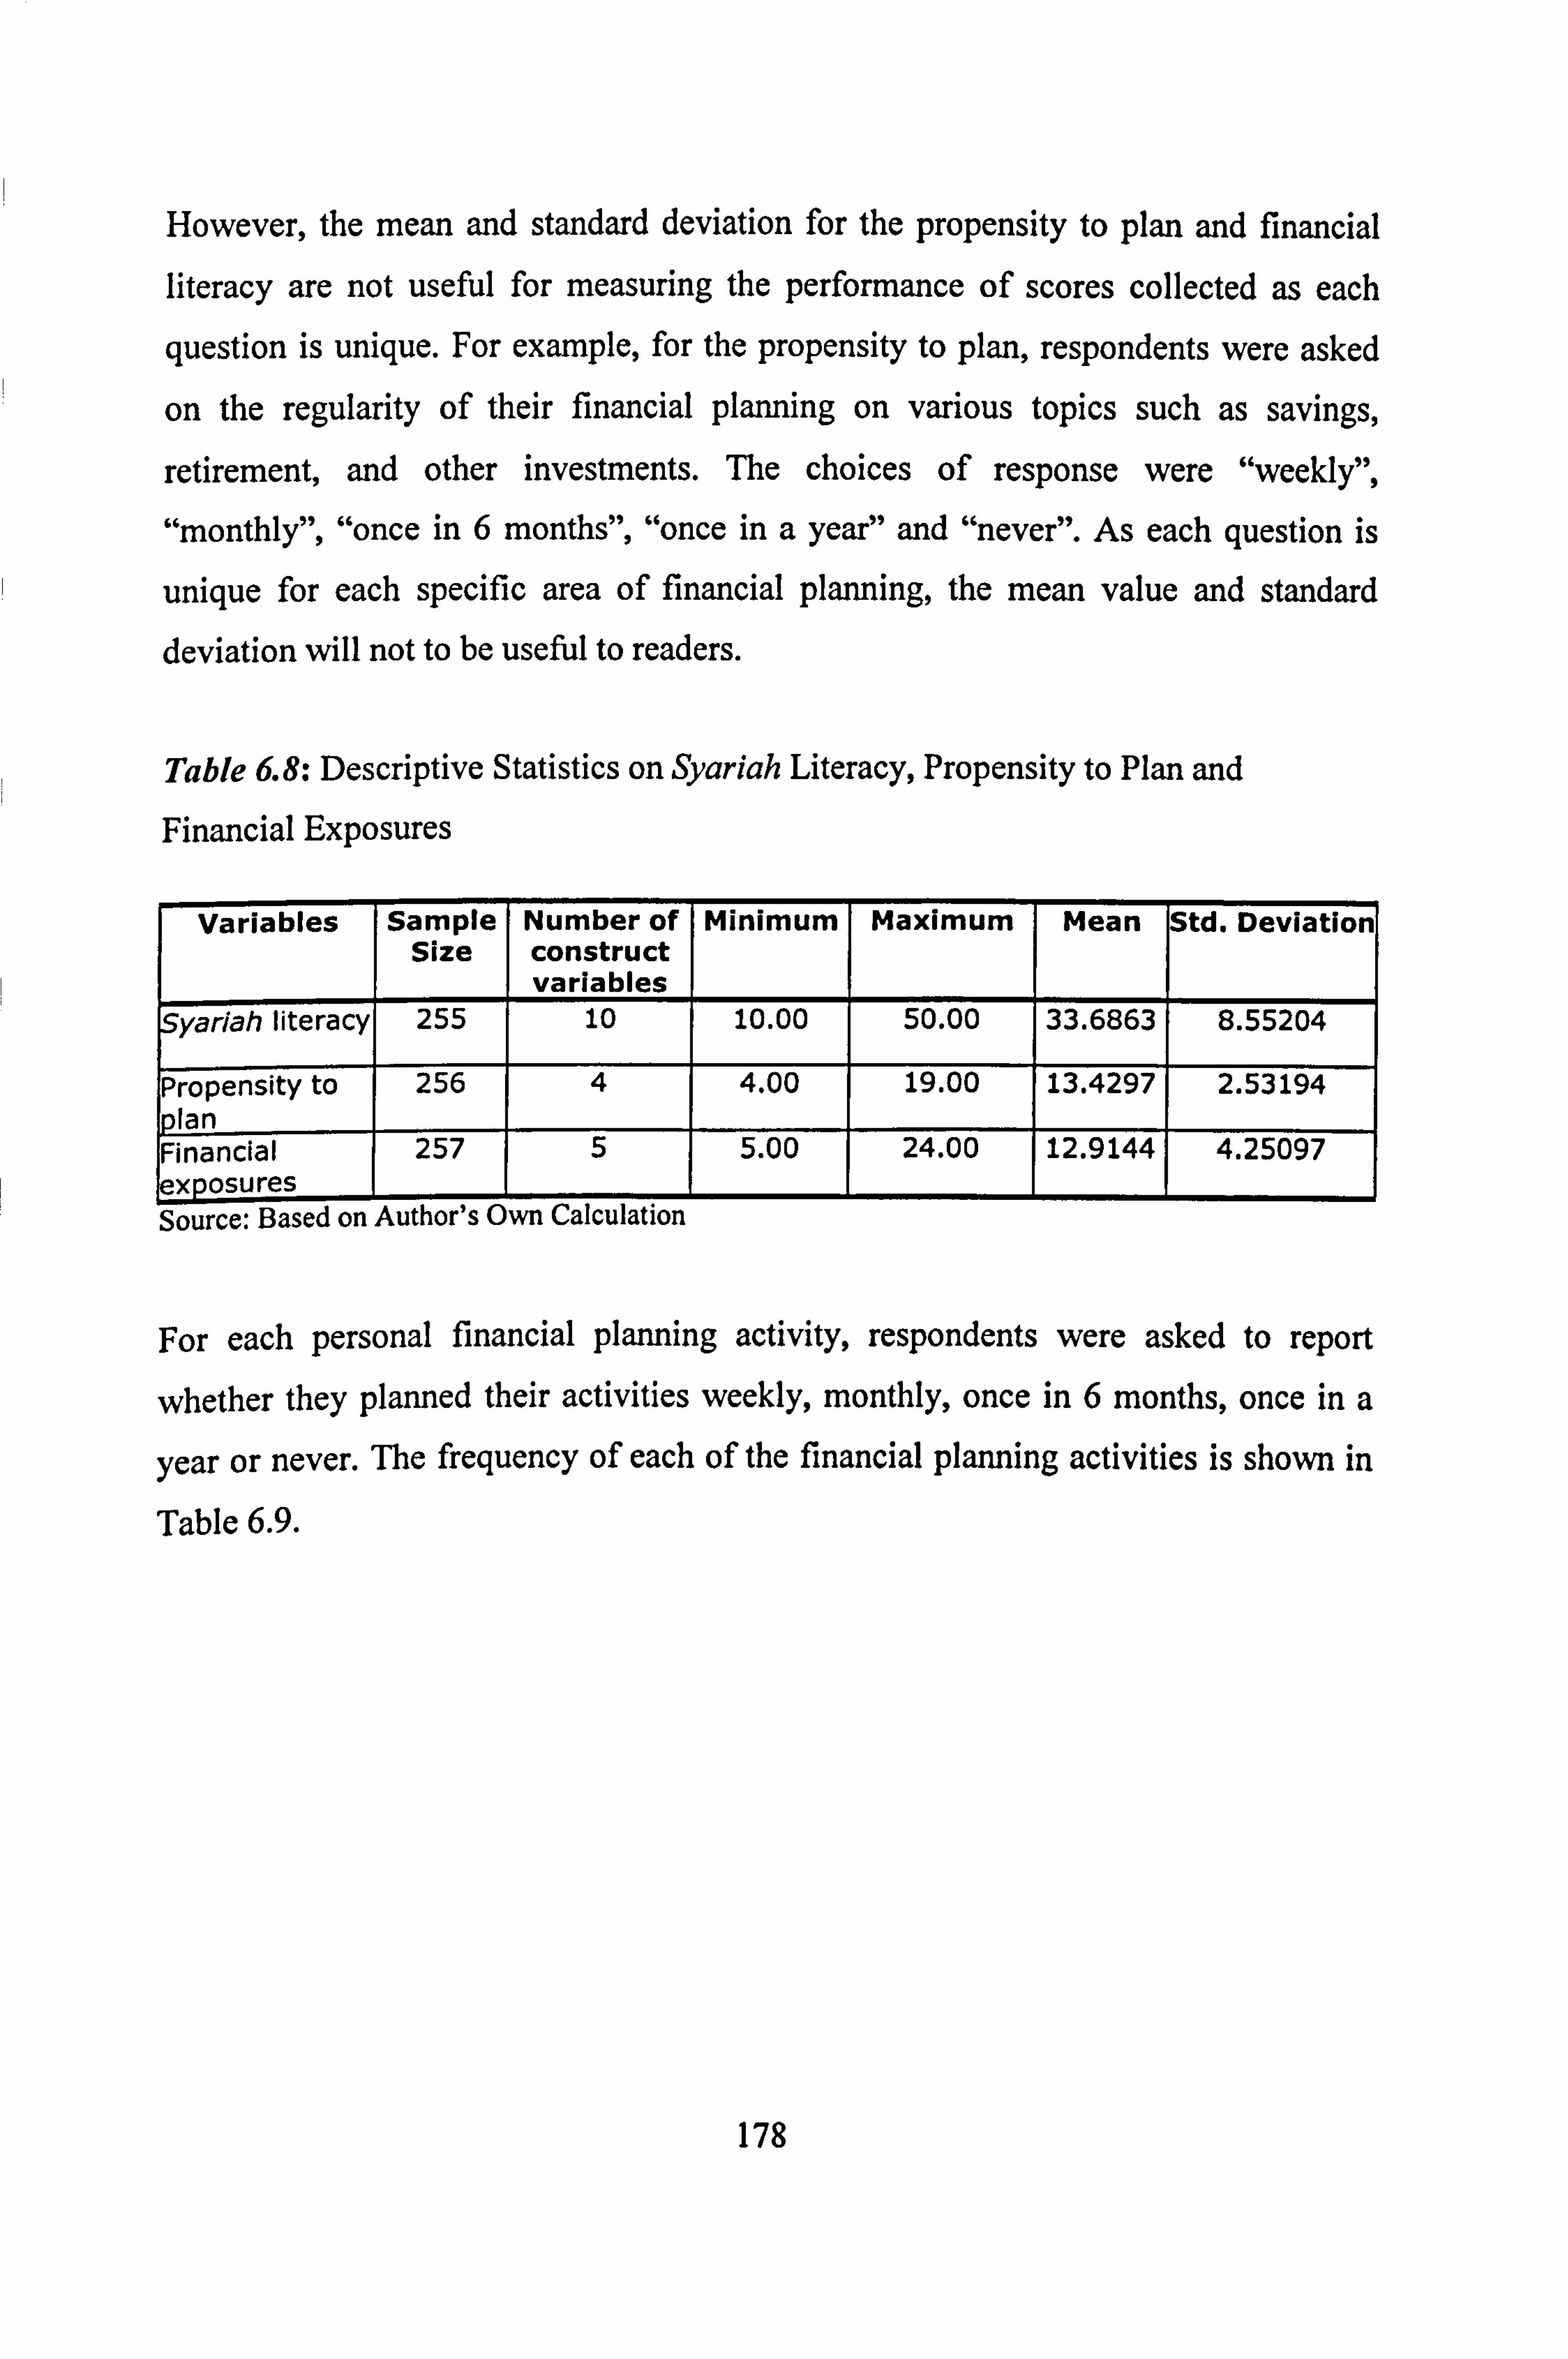
However, the mean and standard deviation for the propensity to plan and financial
literacy are not useful for measuring the performance of scores collected as each
question is unique. For example, for the propensity to plan, respondents were asked
on the regularity of their financial planning on various topics such as savings,
retirement, and other investments. The choices of response were "weekly",
66monthly", "once in 6 months", "once in a year" and "never". As each question is
unique for each specific area of financial planning, the mean value and standard deviation will not to be useful to readers.
Table 6.8: Descriptive Statistics on Syariah Literacy, Propensity to Plan and Financial Exposures
Variables Sample Number of Minimum Maximum Mean Std. Deviation Size construct
variables Syariah literacy 255 10 10.00 50.00 33.6863 8.55204
Propensity to 256 4 4.00 19.00 13.4297 2.53194 olan I I I I I Financial
i 257
i 5 I 5.00 24.00 1 12.91441 4.25097 I
exposures Source: Based on Author's Own Calculation
For each personal financial planning activity, respondents were asked to report
whether they planned their activities weekly, monthly, once in 6 months, once in a
year or never. The frequency of each of the financial planning activities is shown in
Table 6.9.
178

Table 6.9: The Frequency Distribution for Several Areas of Financial Planning
Activities
I Frequency I Percent I Valid I Cumulative Percent Percent
How often do you save money eant to be used in the future? Valid Weekly 4 1.6 1.6 1.6
Monthly 6 2.3 2.3 3.9 Once in 6 months 27 10.5 10.5 14.3 Once a year 206 79.8 79.8 94.2 Never 15 - 5. 5.8 100.0
Total 1 1 25ý 10 0 1
100.0 1 How often do you monitor your ncome and xpenditures? Valid Weekly 11 4.3 4.3 4.3
Monthly 5 1.9 1.9 6.2 Once in 6 months 28 10.9 10.9 17.1 Once a year 157 60.9 61.1 78.2 Never 56 21.7 21.8 100.0 Total 257 99.1 100.0
Total 258 100. How often do you monitor your nvestments? Talid Weekly 31 12.0 12.1 12.1
Monthly 35 13.6 13.7 25. E Once in 6 months 80 31.0 31.3 57. C Once a year 89 34.5 34.8 91. E Never 21 8.1 8.2 100. C Total 256 99.2 100.0
Total 258 100.0 How often do you monitor your etirement accounts? Valid Weekly 49 19.0 19.1 19.1
Monthly 86 33.3 33.6 52.7 Once in 6 months 72 27.9 28.1 80.9 Once a year 46 17.8 18.0 98.8 Never 3 1.2 1.2 100.0 Total 256 991 100.0 ITotal 1 258 100.
Source: Based on Author's Own Calculation
In relation to the respondents' financial exposure, we asked them on their usage of
various source of information in their financial planning and management. Their
responses are surnmarised in Table 6.10. From their responses, it can be reported
that, around 20% of respondents use a made great use of business magazines, usually
used their information or moderately used their information. A small percentage of
respondents reported they hardly used or never used financial information from
business magazines. In contrast, a high percentage of respondents reported that they
moderately used financial information from the business sections in the newspapers
179

(38.8%). Around 20% of them hardly use financial information from newspapers. As
for the use of financial information from the television, 22. s% and 37.2% of
respondents reported that they usually used or moderately used television
information. A significantly low percentage (3.1%) reported that they never used
television information to learn about financial planning. High percentages of 30.4%,
24.5% and 30.4% were recorded for the most regular source of information from the
radio. Only around 10% reported that they never used the information from the radio. The same trends were also recorded for the use of financial information from agents
working for unit trusts providers and retail banks. A high percentage of respondents
reported on high use of financial information from this source of information. This
observation is in line with the findings from interviews with financial planners (it will be reported in detail in Chapter 8). Many financial planners observed that
householders usually perceived that information they obtained from representatives of
unit trust providers or banks was adequate in order for them to make their financial
decisions. According these planners, general public should not rely heavily on such information as the advice may not be independent and/or probably will not suit the
financial goals of the clients.
180

Table 6.10: The Frequency Distribution for Respondents' Score on Their Usage of Various Source of Information on Financial Planning
I Frequency I Perce I Valid L Cumulative I 7ý Percent Percent
Business magazines
1
Valid Greatly use 71 27.5 27. E 27. Usually use 53 20.5 20.6 48.2 Moderate 76 29.5 29.6 77.8 Hardly use 44 17.1 17.1 94.9 Never use 13 5.0 5.1 100.0 Total 257 99. 100. O
Total 1 1 25ý 1
100. L
Newspa per- business sections
Valid Greatly use 35 13.6 13.6 13.6 Usually use 56 21.7 21.8 35.4 Moderate 100 38.8 38.9 74.3 Hardly use 52 20.2 20.2 94.6 Never use 14 5.4 5.4 100.0 Total 257 99. 100.0
Total 258 01 100. [
Television programmes
Valid Greatly use 501 4 19 19.5 19.5 Usually use 5 : 22 5 22.6 42. C Moderate 96 37.2 37.4 79.4 Hardly use 45 17.4 17.5 96.9 Never use 8 3.1 3.1 100.0 Total 257 99. 100.
Total 258 01 100. 1
Radio programmes
Valid ; Greatly use 78 30.2 30.4 30.4 Usually use 63 24.4 24.5 54.5 Moderate 78 30.2 30.4 85.: Hardly use 26 10.1 10.1 95.2 Never use 12 4.7 4.7 10O. C
otal 25 ý 99. 100.0 Total 5 25 1
1 00.
1
Represe tatives of financial products (e. shares remislers, I surance agents) Valid Greatly use 61 23.6 23.7 23.7
Usually use 54 20.9 21.0 44.7 Moderate 85 32.9 33.1 77.6 Hardly use 37 14.3 14.4 92.2 Never use 20 7.8 7.8 100.0
otal T 257 99.6 100. ýTotaf I 1 258 100.0
1
Source: Based on Author's Own Calculation
181

6.3 The Regression Results
Multiple regression analysis is usually employed in order to distinguish how much
the variation in the dependent variable can be explained by sets of independent
variables of the regression. In our case, we intended to explain the variation of
demand for three types of financial assets, namely unit trusts, shares and saving
accounts. The regressions were modelled using the cross-sectional data collected in
the months of November and December of 2005. Three regression models will be
performed, one for each economic variable: income, wealth and net wealth (The full
regression results based on net wealth are presented in Appendix 5). Three regression
models need to be run because of the inter-connection of the three economic
variables, as levels of net wealth are directly related to the level of wealth of
respondents. The results of our analysis were thus presented and analysed alternately
beginning with regression model (1) the demand for unit trusts in relation to income;
(2) the demand for unit trusts in relation to wealth; and (3) the demand for unit trusts
in relation to net wealth. The same also applied to the demand for two other assets
involved in the analysis, shares and saving accounts.
This approach is following the approach of Tin (2000) when he performed regression
analysis to establish the life-cycle effect on the demand for financial assets in the U. S.
He argued that performing three regressions containing each of the economic
variables dictated by the fact that these variables are dependent on each other. All
regression results are obtained with the ordinary least square (OLS) estimation
method. The use of OLS does not produce bias is results since the error term in one
asset demand regression is not contemporaneously correlated with the error term in
other asset demand equations. As the circumstances of his work were similar to ours,
the OLS estimation method was adopted to run the regression.
182

To ensure the normality of the variables with exact monetary figures such as income,
wealth, net wealth and the amount of financial assets held, we converted these values to natural log values. By doing so, the coefficients of income, wealth and net wealth
no longer represent the exact changes of the above variables to the demand for
financial assets. Taking logs means that we substituted exact figures to be represented by equivalent logged values. Having done that, the interpretation of the regression
will be no longer to an exact change to both dependent and independent variables. The results, now, reflect the change in one unit of demand for financial assets due to
one unit change of income, wealth or net wealth, which means change of elasticity of these variables.
Regression assumes interval data, but dichotomy variables that have two responses
such as 'Yes' and 'No' or 'Male' and 'Female' can be considered a special case of interval measurement. In this study, nominal and ordinal categories were transformed
into sets of dichotomies, called dummy variables. To prevent perfect
multicollinearity, one category must be left out. This is usually called the base or
suppress group. For instance, for the nominal variable 'gender' we treat male as the
base group thus including female respondents' responses in the regression. The
results in the regression will only show the results for female respondents (the non- base group), which later may be compared to observe whether significant difference
between female and male (the base group) exists. It is important to remember that
these results assess the significance of the difference between this category and the
category that we eliminated from the analysis; that is why if one category is a control
or 'normal' condition, we choose that one to eliminate.
The same approach to test for significance of categorical variables using dummy
groups was also adopted in Tin (2000) on the propensity to the effect of propensity to
consume and the demand for financial assets. He converted categorical variables of
age, gender, marital status, level of education and job sector into dummy variables so
that they can be tested in a regression model.
183

For the 'level of education' variable we created a set of dummy variables called Secondary School, Diploma and Master's Degree leaving out Degree/Bachelor
Holder. The complete lists for all dummy variables created for the purpose of the
regression may be observed in Table 6.13:
Table 6.11: Dummy Variables Included in the Regression
Dummy variables Base/ Suppress group Variables included in the n
Age 30-50 years 1) Less than 30
2) More than 50 Gender Male 1) Female
Marital Status Single 1) Married
Race Malay 1) Non-Malay
Level of Education Degree 1) Secondary School
2) Diploma
3) Master's Deqree Job Sector Private 1) Self Employed
2) Government Risk Tolerance Bond 1) Shares
Certified Financial Planner's Engagement
Yes 1) No
Choice of Investment
I
Islamic
I
1) Conventional
I
Source: Author's Own
184

Therefore, the multiple regression function would be estimated as follows:
ya+b, INCOME1TVF, 4LTH1NET WEALTH+ b2AGE LESS THAN 30 + b3
AGE MORE THAN 50 + b4 FEAMLE + bsM4RRlED + b6NON-AIALAY + h7SECONDARY
SCHOOL + b8 DIPLOM4 + bgAlASTER'S DEGREE + blo SELF EMPLOYED +
blIGOVERNMENT + b12PREFER STOCKS + b13DO NOT HIRE CFP +
b14CONVENTIONAL UYIT TRUSTSIS11ARESISAVING ACCOUNTS + bjsSYARLIH
LITERACY + bl6FINANCIAL PLAN + bl7FINANCIAL LITERACY +e
Each proxy is described as follows;
y Demandfor Unit Trustsl Sharesl Savings account
X, Amount of incomel wealthl net wealth ofrespondents
X2 Age group (AGE LESS THAN 30): dummy variable with
respondents aged less than 30 being scored one (1), otherwise a zero
(0).
X3 Age group (AGE MORE THAN 50): dummy variable with
respondents aged more than 50 being scored a one (1), otherwise a
zero
X4 Gender (FEAMLE): dummy variable with female respondent
being scored a one (1), otherwise (0).
185

X5 Marital Status (AL4RRIED): dummy variable with respondent
a married individual being scored a one (1), otherwise a zero (0).
X6 Ethnicity (NON-AMLA19: dummy variable with respondent a
non-Malay being scored a one (1), otherwise a zero (0).
X7 Level of Education (SECONDARY SCHOOL): dummy variable
with respondent who completed Secondary school being
scored a one (1), otherwise a zero (0).
X8 Level of Education (DIPLOAM): dummy variable with
respondent who completed diploma education being scored a
one (1), otherwise a zero (0).
xg Level of Education (AMSTER'S DEGREE): dummy variable
with respondent who completed master's degree being scored
a one (1), otherwise a zero (0).
X10 Job sector (SELF-EMPLOYED): dummy variable with
respondent who is a self-employed individual being scored a one (1),
otherwise a zero (0).
X1 I Job sector (GOVERNMENT): dummy variable with respondent
who works in government sector being scored a one (1), otherwise a
zero
186

X12 Risk Preference (PREFER STOCKS): respondent
who is a risk adverse individual being scored a one
otherwise a zero (0).
X13 Certified Financial Planner's engagement (DO NOT HIRE
CFP): dummy variable with respondent who do not hire certified
financial planner being scored a one (1), otherwise a zero (0).
X14 Choice of financial asset holding (UNIT TRUSTSISHARES1
SAVING ACCOUNTS): dummy variable with respondent who prefers
to hold conventional financial asset being scored a one (1), otherwise
a zero
X15 Syariah literacy (SYARIAH LITERAC19: the level of Syariah
literacy ofrespondent
X16 Financial plan (FINANCIAL PLAN): the level ofpropensity to
plan of respondent
X1 7 Financial exposure (FINANCIAL EXPOSURE): t. he level of
financial exposure ofrespondent
e= error term generatedfrom the regression
187

6.3.1 The regression results for the demand of unit trusts
Table 6.12 provides the summary results for the regressions containing income,
wealth and net wealth in relation to the demand of unit trusts. First, we may observe that the correlation of coefficients, given by R is high in all three regressions, which
measures the linear association between the variables. The high R value of 0.66,0.73
and 0.76, respectively, obtained in the three regression containing income, wealth and
net wealth respectively, means that there are strong linear relationships between the dependent and independent variables in all regressions.
In the results produced, the R'value for each regression is reasonably high. An
R'value of 0.372 in the income regression means that all the variables included in the
analysis regarding income explain 37% of the variation in the demand for unit trusts.
Thus nearly 60% of the variation in the demand for unit trusts containing income
measurement, however, remained unexplained by the analysis. The R'value
improved to 0.478 for the regression containing wealth and 0.52 for the regression
containing net wealth.
The standard error of the estimates ranging from 0.49,0.45 and 0.43 reported in the
next column of Table 6.12 reflects how much the observed y-values differ from the
values on the regression line. It gives us an idea of the scatter of the points around
the line of regression. We may see that the differences between the observed y-values
and the value on the regression line in all three regressions are not significantly
different.
To assess the overall performance of the established model, observation of F-statistics
has to be made. In the case of the demand for unit trusts, a significant model for all
three regressions for income, wealth and net wealth was established. All p-values denoted by "Sig. " Values in the table are significant, indicating that all the models for
unit trusts fit the data very well.
188

Tahle 6.12: Model Summary for the Multiple Regressions of Unit Trusts
R Adjusted Std. Error of Model R Square R Square the Estimate F Sig.
_ Regression for 0.66 0.44 0.37 0.49 -
6.620 0.000(a) income Regression for 0.73 0.53 0.48 0.45 9.723 0.000(a) wealth
_ Regression for 0.76 0.57 0.52 0.43 11.374 0.000(a) net wealth I I I
Source: Based on Author's Own Calculation a. Predictors: (Constant), financial literacy, self employed, non-Malay, age more than 50, do not hire CFP, log income/log wealth/log net wealth, conventional unit trust, master's degree, Syariah literacy, secondary school, married, government, prefer stocks, propensity to plan, female, diploma, age less than 30 b. Dependent Variable: log unit trust
To determine whether an individual variable included in the analysis is actually
significant in explaining the variation in the demand for unit trust, the coefficient or beta of each independent variable has to be observed. On the other hand, technical
terminology used to represent the value of the coefficient of a variable divided by its
standard error is the t-statistics. We will report the coefficient of every variable
included with its respective t-statistics. T-statistics reflect the explanation capacity of
a variable in explaining the variation in the demand for unit trusts taking into account its standard error.
Table 6.13 contains the coefficients for all variables included in the three regressions for the demand of unit trusts. For all three regressions, all economic variables consist
of income, wealth and net wealth. These three variables significantly drive the
variation in the demand for unit trusts. This is in line with major studies performed on
demand for financial assets.
189

Apart from economic variables, in the regression (1) containing income, other
significant variables are the age variables. We established beforehand that these
variables are dummy variables, in which the group of respondents in the age of 30 to
50 years was treated as the base group. With the dummy for age "less than 30" and
the dummy for age "more than 50" being significant, two interpretations can be
derived from the results. The first is that these two age groups significantly drive the
demand for unit trusts. The second is the suggestion that significant difference
between the above two age groups and the base group exists. The results thus reveal
that the life-cycle pattern exists as far as the demand for unit trusts is concerned.
In the regression containing income, the conventional unit trust variable is significant.
This means that the conventional unit trust variable is significant in determining the
level of demand for unit trusts. There is a significant difference between respondents'
preferences to acquire conventional unit trusts and Islamic unit trusts, but the
relationship between the two is not an inverse relationship. In other words, we cannot
establish that respondents who choose conventional assets would demand more unit
trusts than those who choose Islamic financial assets.
The other significant variable is financial literacy. The sign of the coefficient is
negative, in contrast to the expected positive sign. This might have been due to our
questionnaire design. For financial literacy we asked the respondents to scale their
frequencies from "frequently" to "never" on their usage of various information
sources which were television, radio, newspaper and financial magazines. In this
case, maybe their lack of usage of these media for making their financial decision hid
the fact that they were using other modes of financial information provider such as
advice from financial planners and so on. For the variable financial plan, the
coefficient of the variable is nearly significant at 95% confidence level.
190

For regression (2) containing wealth, other significant variables apart from economic
variables of income, wealth and net wealth are age less than 30, age more than 50,
married and conventional unit trusts. In the regression containing net wealth, i. e.
regression (3), other significant variables are age less than 30, age more than 50, self-
employed, government and conventional unit trusts.
191

0
0
0
-1
6P 0
-0
6 ýj ,ýt ý
, Constant ýO C zSG ýO o O oE
CO j Zl N
0
73 P income w
:,. Ln -N Ln
F), -; z P I Wealth
Net Wealth b, CO
P Ln
-IZP Age to ý! N 'D * Ij
4w 10 N ý t! hi
I
Less 30
x;
P P P Age More 50 SOO
4 6 Female CO Cl ý! CO C,
m 0
--6 P -6 O Married ýj '0 b t4 w Q
b b, Ln
6 6P 6 Non ýj Z4 KJ Malay I
P ZP SP Secondary Lq a i" - - ýO School
2c-; 6 Z6 6 Diploma
,: ý 0, - 00 ZN
P -89 SP master c) OD bo 0 CD C) " LA degree
P 4P -6 Self zo PQ ýj W CO Employed eW SID :ý %0 1
-6 6 Government 6 L,
Zj
,, 6 6 6 Prefer Stocks zo b o NJ 0
No N ww , Go CFP
,ZP VP 'Z P Conventional 0 j, NJ 01 ý, j Unit Trust
c) Ob P ZP Syarlah 0 0 w Literacy
P BP Financial 0 bo Ow Plan
6 Financial 0 o
Literacy Sk Is N a0
I-v
C) 0
C/)
W
(D I
0
crq
0
5
CD
co 0 CD
E3

6.3.2 The Regression Results for the Demand of Shares
Table 6.14: Model Summary for the Multiple Regressions of Shares
R Adjusted Std. Error of Model III Square R Square the Estimate IF Sia. Regression for 0.700 0.489 0.374 0.45984 4.227 . 000(a) income Regression for wealth I
0.726 I
0.526 I
0.419 I
0.44280 I
4.905 . 000(a)
Regression for net wealth
I 0.728 1 0.529 0.423 0.44143 4.962 . 000(a)
source: tsasea on Autnor-s tjwn L; aicuiation a Predictors: (Constant), log net wealth, non-Malay, financial literacy, self employed, secondary school, age less than 30, Syariah literacy, do not hire CFP, age more than 50, master's degree, government, prefer stocks, propensity to plan, conventional shares, married, female, diploma b. Dependent Variable: log shares
It can be observed in Table 6.14 that R-values are 0.7 and above in all regressions for
the demand of shares. This means that the correlations of the independent variables
with of the dependent variables are high, after all inter-correlations among independent variables have been taken into account. The adjusted R-square values for
all regressions are 0.374,0.419, and 0.423. The results suggest that nearly 40% of the
variance in the demand of shares can be explained by the 17 independent variables,
while in the regressions of wealth and net wealth, more than 40% of the variance in
the demand for shares could be explained by all independent variables. As for the
performance of all the models as a whole, all F-statistics are significant which means
that the regression models for the demand of shares are statistically significant at a
very high level of confidence as the data fits fairly in the regression of demand for
shares.
The estimated coefficients are reported in the Table 6.15. From the table, we may
observe that once again, all economic variables are significant. In the regression
containing income, other significant variables are "Age more than 50", "Master's
degree", "Do not hire CFP" and "Conventional shares".
193

On the other hand, in the regression containing wealth, other variables significantly
determine the variation in the demand of shares are age more than 50, master's
degree, government, do not hire CFP and conventional shares.
in the regression of net wealth, again the value of net wealth of respondents
significantly affects the amount of shares demanded. On top of that, the variables of
"Age more than 50", "Master's degree", "Government", "Do not hire CFP" and
"Conventional shares" significantly affect the demand for shares.
194
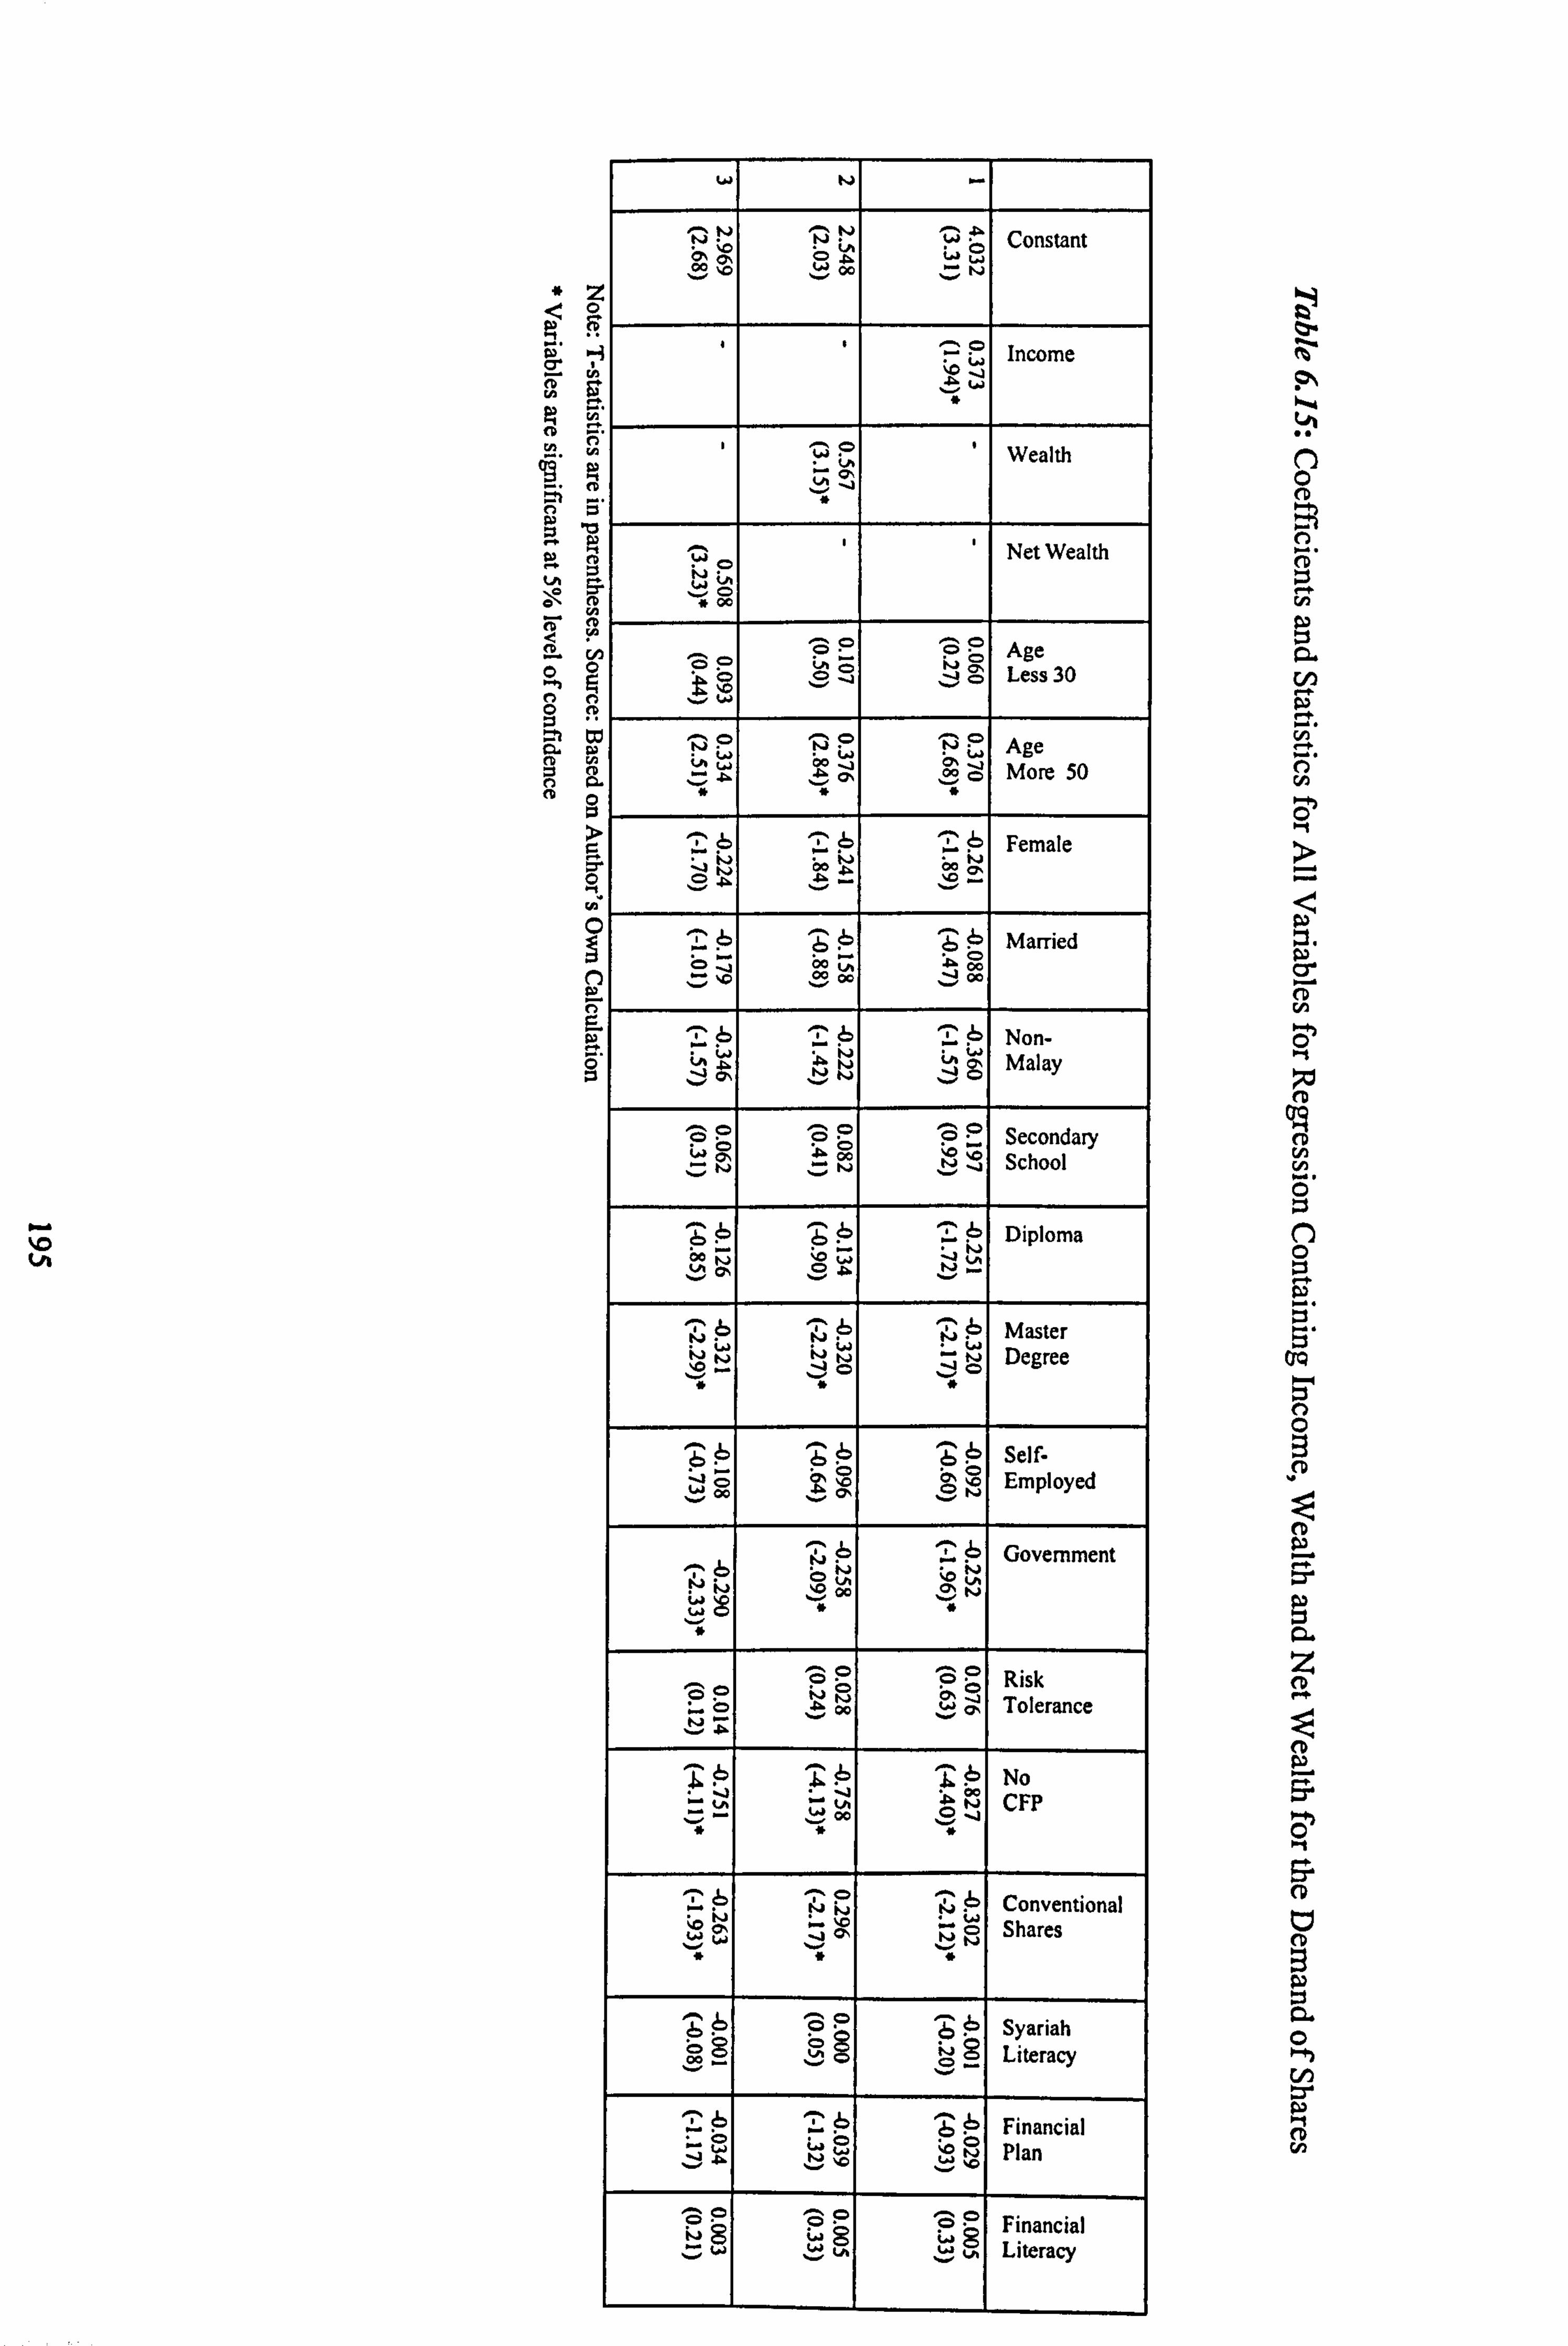
G tA
(D
Cb
Constant 10 01 (" L,
b, W ;ý (D
w M, O 0, =
Income
Wealth
Net Wealth
Age Less 30
Age More 50
-7,6 Female
!b ýb Married
-110 Zý
ý 00 (M 00 Go
6 Non- iA Malay
Secondary 00 School
Z:! b Diploma ba ýO ýj
-L 6 4)
Z Master Degree
-6 Self- 10 Employed
00
-6 oz !S
" pi Government
ýj ý, L4
6 tA Soo ý, (7, "
Risk ZP i1j 1!; 00
b" CD Tolerance
1ý 0 T ýD 'Z !b No CFP
00
'7' 6 Conventional C Shares
'ýý 6 zP Z0 Syariah Literacy
6 7,6 !6 Financial Zw L, p
(I ýO 0 w bi Plan
ZP Financial Z: t! Gý t! Literacy
C4ý
OIN N-A Lot
0 (D
(D 0 r, n 0 z CL En
CD r'n
CD rA (n.
C)
S, aq 0-4
0 -3
CD
z
cn

6.3.3 The Regression Results for the Demand of Saving Accounts
Table 6.16: Model Summary for the Multiple Regression of Saving Accounts
R Adjusted Model R Square R Square
Std. Error of the Estimate F Sig.
Regression for 0.525 0.276 0.219 0.41985 4.880 0.000 income Regression for 0.573 0.328 0.277 0.40193 6.356 0.000 wealth Regression for 0.590 0.348 0.298 0.39726 6.881 0.000 net wealth Source: Based on Author's Own Calculation a Predictors: (Constant), log net wealth, government, syariah literacy, do not hire CFP, financial literacy, prefer stocks, diploma, female, conventional savings, self employed, non-Malay, secondary school, master's degree, married, propensity to plan, age more than 50, age less than 30 b Dependent variable: log savings
In the model summary table, we may observe that R-values of 0.52,0.57 and 0.59 are
slightly lower than previous regressions on the demand of unit trusts and shares. This
means that lower correlations between independent variables and the demand for
saving accounts existed compared to the demand of unit trusts and shares. The
observation is also true for the adjusted R- Square values for all regressions of saving
accounts. They are lower at 0.22,0.33 and 0.35 in regressions containing income,
wealth and net wealth respectively. These results show that the variation in the
demand of saving accounts are explained only by percentage figures of well below
40% in all regressions. Nevertheless, the regression model is proven as a good model
to explain the variation in the demand of saving accounts. This can be deducted from
the result of the F-test that can be observed in the two last columns in the model
summary table. The "sig. " values of 0.000 for the F-test signify that the regression
model fits the data appropriately.
The coefficients for every variable included in the regression for saving accounts can
be observed in Table 6.17. From the table it can be observed that all economic
variables are also significant as in the demand for unit trusts and shares. They are all
significant in every regression of the demand for unit trusts, shares and saving
196

accounts. It is proven that income, wealth and net wealth are robust determinants for
all types of financial assets included in the analysis.
In the regression containing income, other significant variables are age "More than
50", "Female", "Self-employed", "No CFP" and "Syariah literacy". The same
variables significantly affect the variation of the regression of saving accounts
containing wealth except for "Female" and "No UP". The similar pattern can also be
observed in the regression containing net wealth. Significant variables other than the
economic variables are age "More than 50", "Female", "Self-employed" and "Syariah literacy". In summary, all economic variables, age "More than 50", "self-
employed" and "Syariah literacy" are the significant variables in all three regressions
of the demand for saving accounts.
197

00
<0
ý B.
Ih ý2. w
N
Constant b0 'i Ln CO
ID bý 00 e a, 20, 'iý %. n
Iz P income
Z; P Wealth bo Ln
Net Wealth
-6 -6 Age
%0 w 1 Less 30
-
P VP TP Age
Ln More 50
liý P ItZ P 'Z P Female
-N ID LA
6 6 -, 6 P Married
b WN
-6 0. 6P --6 Non-
0 zo 10 b, 0 00 ý, w Malay
_ 14 w S'M
SP SP Secondary Ln School
'(7D' 6 --6 0
1' 6 Diploma ;A0 ýj
P -4
master i. (, J 'bo -
degree S0 awl 4
P P Self- ýj fj 0 j ýj Employed
'Z 6 Z6 ýj . Ln Lý
--6 O Government
Zý, 6 "
0 L, 2 0' m
b 6 0%
R
't -0 -
6 6 -6 96
Risk
00 CO Tolerance 11 CO CD 1
ý'6 --6 -6 No 4 10 ý UP
4 OD
6 6 Conventional Ij
ýj C,
Savings
P Syarlah ýj C5 Literacy
Financial ýj 0 0 Plan
6P 6P -6 ý Financial
0 i" 0 b Literacy
ý 1-: 4.3 0 C2. 9 01 Gn ký
0
cn
cn
CD Ln
: i. ti
0
59
(D
(D
0 0-h

6.4 Diagnostic Tests to Multiple Regression Analysis
The correct use of the coefficient of regression depends heavily on the
assumptions made with respect to the nature of data to be regressed and on
understanding the principles of forming the regression. Regression is a central
measure within the general linear model of statistics. However, in situations
where its assumptions are violated, regression becomes inadequate to explain a
given relationship. To the extent that any of these assumptions are violated, the
coefficient of regression does not correctly reflect the relationship. In Dielman
(2000), a chapter on how to assess the assumptions of the regression is outlined. According to him, the ideal conditions for the estimation and inference in the
multiple regression models are as follows:
a) The expected values of the disturbances are zero. When this is the
case, it indicates that the relationship is linear in the explanatory
variables (with the dependent variables). If this property is met, then
the use of multiple regression analysis isjustified.
b) The disturbances have a constant variance. In residual plot residuals
versus an explanatory variable, the residuals should appear scattered
randomly about the zero line with no differences in the amount of variation in the explanatory variable.
c) The disturbances are normally distributed. This can be assessed using the tests of normality of Kolmogorov-Smirnov or Shapiro-Wilk.
Normal probability plots also can be used for the matter d) There is no autocorrelation between disturbances. This means that
disturbances are independent of each other. To examine that this
assumption had been met, the Durbin Watson test can be used when
researchers are using time series data in their research. The test is not applicable when researchers are using the cross-sectional data.
e) The explanatory variables are not highly correlated. In order to
correctly infer sample estimates to the population, explanatory
variables should not appear dependent or correlated between each
199

other. If this condition can not be met, then the inferences using sets of
explanatory variables have to be re-examined by dropping the
correlated variables.
Following Dielman's (2000) recommendations for using tests and plots, we
assessed all the assumptions of the multiple regression analysis used in our study. Assumptions a) through c) relate to the residuals of the regression and assumptions e) relates to the explanatory variables of the regression. SPSS
package, only allow for diagnostic tests to be performed in the manner of using
plots with no facilities for statistical tests. We therefore used plots to demonstrate
that all assumptions for multiple regressions were met.
Assumption 1: Linearity of Residuals
Three regression models were tested containing income, wealth and net wealth for
all three types of financial assets tested in the regression analysis. Therefore,
scatter plots for residuals for regressions containing income, wealth and net
wealth for all three types of variables had to be examined. Upon examination of
the regression results for all types of financial assets above, the regression
containing net wealth were the best models with the highest R-square values.
Thus, we observed the scatter for log net wealth variable versus dependent
variables of demand for unit trusts, shares and saving accounts in this section. By
definition, for linearity of residuals to exist, scatter plots of residuals against
standardised predicted values in the regression for unit trust, shares and savings
should not reveal a clear relationship i. e. they generate random patterns.
The three scatter plots presented below reveal no clear relationship between
residuals and predicted values that indicate that the regression line passes through
the conditional means of dependent variable. In short, the regression is linear in
the explanatory variable. The observations in diagrams 6.1 to 6.3 are consistent
200

with the aSSLIMption of' linearity between all variables and the dependent
variable 47
Dependent Variable- log unit trust 3-1
C3
70
0 (1)
Li
0
m _0 c CD
U)
(1) Of
13 13 13
0 00 11
13 13 to
000 13 13 0 93
00
0 13 a 13 0
13 0
El 0 13 C3
0 qb , CP
0 qb 0S
C3 CIO 0 CP
0 11
00 [30 C: )
00 [3
13
0o
-2 -1 01
Regression Standardized Predicted Value
C3 0
0
2
Diagi-tim 6.1: Scatter Plot of'Regression Standardised Residual Containing
Net Wealth against Regression Standardised Predicted VaILICS f'or Log
Unit Trust
47 scc Coakes SJ, Stced L. G (2003). SPSS: Anal)sis Without Anguish Version 11.0 for Windows, John Wilcy and Sons Australia Ltd.
201

Dependent Variable: log shares z
:3 _0
'0 (D N 0 E cz
_0 c
U)
0 U)
0 13 13
El
[1 13 13 a 13
13 13 0
13 0
0 [3
C] C3 13 C3 13
00 El 13 %0
13
cl 0
C) C3
[I
El
-2 -101
Regression Standardized Predicted Value
Diagrant 6.2: Scatter Plot of Regression Standardised Residual Containing
Net Wealth against Regression Standardised Predicted Values fior Log
Shares
202

Dependent Variable- log savings 3
2 (13 :3
73
LJ 0 c3 (Z
A
0
(n -2 Wn Q) 0) (D (r -3
13 cm
11 0 El 0 13
o 06 13
13 13 C3 00
" C3
0 C) Cl cl El dP 0 cl
" C% 8 Elaý
13 13
N0
'1 13 -t313
13 ID 13
0 13 -S.
0 13
13 0 13
00 13 13 00 13
13 13 (313 C3
11
13 C3
-3 -2 -1 01234
Regression Standardized Predicted Value
Diagram 6.3: Scatter Plot of Regression Standardised Residual Containing
Net Wealth against Regression Standardised Predicted Values for Log
Savings
Assumption 2: Constant Variances of Disturbances
To check whether the variance of' the disturbances is constant Im all values of,
explanatory variables, scatter plots of residuals versus explanatory or independent
variables can be performed. In this case, we presented a scatter plot of residuals
plotted against major independent variables such as income, wealth and net
wealth. The residuals should appear scattered randomly about the zero line with
no differences in the arnount of variation in income, wealth and net wealth. When
the disturbance variance is not constant, the use of' the least-squares method has
two major drawbacks. The estimates of' the regression coefilicients are no longer
minimurn variance and the estimates of the standard errors arc biased. Thc first
drawback suggests that estimates of the coelliclents with smaller sampling
203

variability may exist. Because of the second drawback, hypothesis tests about the
population regression parameters Could provide misleading results.
For the regression of unit trust, three sets of residuals were obtained with regard to
separate regressions carried out for income, wealth and net wealth (the variable income, wealth and net wealth have to be separately tested to the incidence of
multicollinearity of' the three variables). The residuals were saved for regression
containing incorne, wealth and net wealth. From the regression results discussed
above, the best regression model for unit trusts is the regression containing net
wealth. Thus, we concentrated more on the regression model containing net
wealth. In the regression containing net wealth, the major variable explaining the
variation in tile dernand for unit trust is the variable log net wealth itself. So, we
present scatter plots of residuals for the regression containing incorne against the
values of log net wealth. This enabled us to check for the hornoscedascity of
variance of residuals in the regression containing net wealth flor all values of log
net wealth of respondents.
3
V
.
0
00 oll 11
0 13 00C
0 C3 Cl a
[I 1: 3 0
13 13 C3
0 13 00
13 '
C3
0 13 E3
13 00
06 0 in
cl
13 0 13 3,
C3 13
11 00
0 cp CPO [1 000
00
0 E3
§
13 00
013013 0
0 co 0u
cl 0
45 5.0 5.5 6.0 6.5 TO 75
log net wealth
Diagram 6.4: Scatter Plot ot'Standardised Residual for Regression Containing
Net Wealth against Log Net Wealth- Demand oftinit TrUSt
204

The observation from the scatter plots above indicated that heterogeneous
variance of residuals had been produced for all values of net wealth of
respondents.
Similarly, the best regression model for the demand of shares is the regression
containing net wealth. 'rhus, to check for hornoscedascity ofvariance of residuals for all values of explanatory variables, scatter diagram of residuals against net
wealth values are presented in the Diagram 6.5.
3
m
-0 c m 65
13
cl 13
0
E) 13 0o 0
013 1) E3 [13,3 0
13 13
a 13
C3 0 0c] 0 13 00 11 cl 0
11 0 cl
C3 Eb 0
cl 0 13
0 Ll
0 [3 a
0
13
4.5 5.0 5.5 6.0 &5 7.0 7.5
log net wealth
Ditigram 6.5: Scatter Plot ofStandardised ResidUal for Regression Containing
Net Wealth against Log Net Wealth- Demand of Shares
Upon inspection of' the above diagrarn, we concluded that hornoscedascity of'
variance of residuals for all values of log net wealth of respondents had not been
assured. When this happens, standard errors of estimates tend to be higher and
205

more volatile. Since we have the problem of unequal variances, we tested for the
robustness of t-statistics using the EVIEWS software under the Newey-West test. The test calculated the t-statistics taking into account the higher volatility of
standard errors. From the examination, it was found that the regression models
are robust, i. e. the results from the robust regression are about the same as in our
original regression model.
Assumption 3: Normality of Disturbances
As part of the regression procedures, it is prudent that assumption of normality
must be met before pursuing multiple regressions analysis. For the normality test,
due to the sensitivity of the Kolmogorov-Smimov rules, we failed to assume the
normality of the residuals with a significance level of lower than 0.05. (i. e.,
p=0.008) for some residuals. But, according to Shapiro-Wilk, normality tests can
reveal that all residuals are normally distributed i. e. the normality test cannot be
rejected, thus the incidence of normality for residuals.
206

Table 6.18: Results for Normality Test of Residual
Kolmociorov-Smi nov(aL_ Shapiro-Wil k Statistic df S1q. Statistic df Sig.
Standardised residual- Income unit . 094 68 . 200(*) . 980 68 . 352 trust Standardised residual- wealth unit . 100 68 . 092 . 972 68 . 127 trust Standardised residual-net wealth . 084 68 . 200(*) . 980 68 . 336 unit trust Standardised residual-income . 103 68 . 070 . 964 68 . 049 shares Standardised residual-wealth . 097 68 . 190 . 985 68 . 566 shares Standardised residual-net wealth . 090 68 . 200(*) . 982 68 . 445 shares Standardised residual-income . 128 68 . 007 . 939 68 . 002 savincis Standardised residual- wealth . 121 68 . 015 . 944 68 . 004 savings Standardised residual-net wealth . 138
I 68 . 003 . 956
I 68
I
. 018 savings I I
* This is a lower bound ofthe true significance. a Lilliefors Significance Correction Source: Author's Own
Plots for standardised residuals for dependent variables are also presented using
the Normal Q-Q approach. Diagrams 6.7,6.8 and 6.9 show that most of residuals
generated from the regression lie on a right upward-sloping straight line. This is to
represent that the normality of residuals is ensured.
207

Normal Q-Q Plot of Standardized Residual
3
2
1
0
co E 0 z _0
.2 a) CL x LLJ -3
-net wealth unit trust
0 0
0
a LY
cl DOW
13 13
cl
-3 -2 -1 0123
Observed Value
Diagram 6.7: Normal Q-Q Plot of Standardised Residual for the Regression
Containing Net Wealth in the Regression of Unit Trusts
208

Normal Q-Q Plot of Standardized Residual
-net wealth shares
-0
x LU
0 0
0
13
C, El
12
0
2 -1
Observed Value
Diagram 6.8: Normal Q-Q Plot of Stanclardised Residual flor the Regression
Containing Net Wealth in the Regression of Shares
209

Normal Q-Q Plot of Standardized Residual
3
1
0
x LIJ -3
-net weatlh savings
2
-3 -2 -1 0123
Obser\ed Value
Dia, qram 6-9: Normal Q-Q Plot of Standardised Residual for the Regression
Containing Net Wealth in the Regression of Saving Accounts
In addition to normal probability plots for standardised residuals generated frorn
the regressions, we also have to make sure that the dependent variables are also
normally distributed. Normal probability plots have to be performed to inspect the
distribution of the dependent variable. Our results showed that normal distribution
is indeed ensured, where the cases fall more or less in the straight line (See
Appendix 6).
210
Assumption 4: Uncorrelated Explanatory Variables; Non-existence of
Multicollinearity among Independent Variables
Whilst all the above assumptions relate to residuals obtained from the regression
models, the final assumption concerns the relationship of the explanatory
variables included in the analysis. In order for the regression to be useful, to
reflect more of the population from the samples being tested, one of the
assumptions that have to be met is the non-existence of multicollinearity among
explanatory variables. In other words, the explanatory variables are not linearly
correlated among each other. Multicollinearity among explanatory variables increases the standard error of the sampling distribution of the coefficients of highly collinear variables. Greater sample-to-sample divergence can be expected in the case of high collinearity among explanatory variables. One solution to
multicollinearity problem is to drop the highly or perfectly collinear variables. But
this poses another problem of model inadequacy. Perhaps, if the collinearity of
variables is not serious, it is better not to drop the problematic variables from the
regression. This is because multicollinearity does not violate the OLS parameter
estimation process although it causes a substantial decrease in "statistical power"
for the reason stated above.
In this study, the Pair-wise Correlation Analysis was conducted for the
independent variables to determine the existence of any multicollinearity problem
in the model (Refer to Appendix 7). From the appendix we may observe that
multicollinearity among explanatory variables is not serious. Serious correlation
among economic income, wealth and net wealth could be expected. This justifies
the decision to run three separate regressions containing income, wealth and net
wealth for every type of financial asset. Other than that, collinearity among
explanatory variables is negligible. Highly correlated variables such as income
and number of years in education arejustifiable in the economic context.
211

6.5 Conclusion
In this chapter, we have discussed the respondents' profiles such as their
demographic and financial background. Extensive descriptive statistics have been
provided as a preliminary analysis to the actual regression analysis. The
regression results obtained indicate that the variables that are affecting the level of demand for unit trusts are net wealth, age, type of employment, conventional unit
trusts and financial literacy. With regard to the level of demand for shares, the
significant variables affecting its level of demand are net wealth, age more than
50, female, master's degree, government sector employee, household without
engagement with certified financial planner and conventional shares. Finally, with
regard to the demand for savings, the significant variables affecting the level of demand are net wealth, age more than 50, female, private sector employee and Syariah literacy.
The results specify that the age factor is important in estimating the level of demand for financial assets in Malaysia. For unit trusts, significant levels of demand exist for all three groups of age while for the demand for shares and
savings, significant differences only exist between household aged between 30 to 50 and those who are more than 50 years old. This shows that older householders
have more shares and savings than the younger. In contrast the significance of all
three age groups indicates that unit trusts are more popular as saving and investment avenues in Malaysia. This is due to the fact that certain units are
guaranteed by the government such as the Permodalan Nasional Berhad (PNB)
unit trusts which serve the purpose of savings rather than investment.
As predicted, the level of Syariah literacy affects the level of demand for savings
as Islamic banks had long been established before other investment avenues such
as unit trusts and shares. Female householders, as reported demand all three types
of financial assets in a different manner from that of their male counterparts.
212

In the chapter, we have also provided the tests and plots to examine that all
assumptions for multiple regression analysis have been confirmed with. We
particularly examined that the expected values of disturbances are zero. This was to check for linearity of relationships between variables and hence multiple
regressions can be performed. In addition, the disturbances have to have constant
variance, normally distributed, and do not correlate with each other. Finally, the
selected predictor variables have to be independent among each other so that
correlations among the variables can be checked.
213

CHAPTER 7
DISCUSSIONS OF THE RESULTS FOR THE MULTIPLE REGRESSION
ANALYSIS ON THE DEMAND FOR FINANCIAL ASSETS
7.1 Introduction and Background of the Research Analysis
The central aim of the research is to find factors that are able to explain the
variation in the demand for financial assets. They are the demand for unit trusts,
shares and saving accounts. Multiple independent variables were been selected in
the light of theoretical and empirical findings. They were subsequently tested
using multiple regression analysis to ascertain whether they significantly affect
the demand for the respective financial assets. Similar regression models had
been adopted by Tin (1998), Ioarmides (1992) and Poterba and Samwick (1997)
on the-life cycle effect upon the demand for financial assets.
Tin (1998), studied the demand for ten (10) types of financial assets to establish important factors affecting their demand. They were (1) regular or passbook
savings accounts in banks, (2) money market deposit accounts, (3) certificates of deposits or other savings certificates, (4) NOW or Super NOW accountsý' or other interest-earning savings accounts, (5) money market funds, (6) US government
securities, (7) municipal or corporate bonds, (8) other interest-earning assets, (9)
stocks and mutual fund shares, and (10) no interest-eaming checking accounts.
Tin (1998) broke up saving and current account as well as deposits into specific
products available in the American market. In our case, we considered saving and
current accounts as in the same category of deposit. In relation to stocks and mutual fund shares, Tin grouped them in the same category. Risk and return
characteristics motivated other authors such as King and Leape (1984) to combine
4' Negotiable Order of Withdrawal (NOW) account is interest-earning bank account where customers are allowed to write drafts against money held on deposit. A Super NOW account is the enhanced version of the NOW account. Depositors are awarded higher interest rates than on a NOW account, but lower than a money market account.
214

both types of assets in their analysis. We, on the other hand have analysed them
separately due to distinct regulations and the investment atmosphere surrounding
them. Malaysian authorities, over the years, have been encouraging the public to
invest in unit trusts using various means including tax credits on unit trust
investments. Changes to the retirement fund account of Employee Provident
Funds (EPF) were also been made to encourage participants of the retirement fund
to invest in unit truStS. 49
We did not include the demand for bonds in our analysis, as government bonds
and corporate bonds are not the types of instruments that are usually demanded by
householders but by institutional investors such as banks, insurance companies
and unit trusts management companies. The same goes for certificates of deposit
and other types of money market deposits as our preliminary field study revealed
that numbers of householders actually owning them are minimal.
in a similar study, King and Leape (1984) examined on wealth and portfolio
composition. They partly dealt with the issue of wealth elasticity of demand for
various types of assets. They included financial assets such as checking accounts,
corporate equity and taxable bonds and non-financial assets such as owner-
occupied housing in their research. Apart from examining wealth, King and Leape
included other explanatory variables such as employment income, net wealth,
marginal tax rates, age of the head of household, marital status, occupation,
education, employment status and the subjective perception of risk aversion.
49 Every employed individual is obliged to participate in an employee contribution fund (EPF)
which is managed by Kumpulan Simpanan Wang Pekcrja (KWSP). KWSP is a governmental body
managing employee funds. The organization collects, manages, invests and provides sums of participant's contribution in the event of retirement. A participant's contribution is divided into 4
accounts which can only be used for the purpose for which the account is created. With effect from I November 1994, generally funds in Account (1) are accumulated for the purpose of retirement. Account (2) can be used to finance house building or purchase and Account (3) is allocated to provide for health expenses. 60%, 30% and 10% of the participant's monthly contributions are allocated in Account (1), (2) and (3) respectively, Furthermore, the use of contributions in Account (1) has been extended for the participant to invest in unit trusts if their balance in the account is more than RM55,000.
215

Our regression model takes into account the economic and demographic variables
as in King and Leape (1984), Tin (1998) Hall and Mishkin (1982), Zeldes (1989),
and Lusardi (1996), among others. In addition, we examined the effect of other
variables such as household's preferences for either Islamic or conventional financial assets, risk preferences, and levels of Syariah literacy. The level of financial literacy and financial planning is also tested following the research
which has been done by Ameriks et al. (2002). Another aspect taken into account in our research is the effect of the personal financial planner's involvement in
structuring a household's portfolio. This has had been analysed by loannide (1992). In our case, we particularly examined whether the involvement of certified financial planners in household financial affairs would affect the level of demand
for financial assets.
Following King and Leape (1984), no consideration has been made to include
rates of returns or interest rates in our analysis on the demand for assets. Although
many other researchers such Tin (1998) and Hamburger (1968) considered rates
of return for financial assets in their analysis as a possible detennining factor, we have only examined the effect of micro factors directly related to householders
such as the demographic variables: ethnicity, age, marital status; the socio- demographic variables: educational level, employment status as well as the
economic variables: income, wealth and net wealth.
7.2 The Discussion of the Results
in the light of the results obtained from our multiple regression analysis, we have
discussed the effect of selected variables upon the demand for chosen financial
assets. Variables in the same category such as secondary school, diploma and
master's degree that belong to the category of educational level will only be
meaningful if they are discussed jointly. This is also true for age variables. Age
less than 30 and age more than 50 are tested against the base group of age between 30 and 50. The results for these variables are discussed jointly under the
216

life-cycle category. Basically, the discussion of results is based on the established dummy groupings. Table 6.11 from the previous chapter is reproduced to illustrate the groupings of the variables.
Tahle 6.11: Lists of Dummy Variables Used in the Regression Analysis
Dummy variables Base/ Suppress group Variables included In the rearession
1) Less than 30 Age 30-50 years
2) More than 50
Gender Male 1) Female
Marital Status Single 1) Married
Ethnicity Malay 1) Non-Malay
1) Secondary School
Level of Education Degree 2) Diploma
3) Master's Deqree 1) Self Employed
3ob Sector Private 2) Government
Risk Tolerance Bond 1) Shares
Certified Financial Planner's Yes 1) No Engagement
Choice of Investment Islamic 1) Conventional
Source: Author's Own
217

The full regression model tested in our research is as follows:
Log mt= a+ PI 109 Wt+ P2 Age less than 30 + P3 Age more than 50 + P4 Female +
P5 Married + P6 Non-Malay + P7 Secondary School + P8 Diploma + Pq Master's
Degree + P10 Self Employed + P, Government + P12 Prefer Stocks+ 013 Do Not
Hire CFP+ P14 Conventional Unit Trusts/Shares/Saving Accounts + P15
Syariah Literacy+ P16 Financial Plan+ P17 Financial Literacy+ e
Although we have a lengthy list of variables included in our model, our analysis
mainly surrounds ten (10) major variables. They are economic factors, life-cycle
factor, demographic factors, socio-economic factors, risk tolerance level, certified
financial planner's involvement, householders' preferences between Islamic and
conventional assets, Syariah literacy financial plan and financial literacy.
Upon our analysis, we found that net wealth is the variable with the highest R-
Squared values for all types of financial assets. For that reason, we have made
much use of the results generated from the regression that contains net wealth in
order to discuss more on the level of demand for financial assets. The summary of the coefflcients for the regression results in the regression containing net wealth for the demand of unit trusts, shares and saving accounts is reported in Table 7.1.
218

Table 7.1: Summary of the Coefficients of Variables Included in the Regression for All Financial Assets
Variables Unit trusts Shares Saving accounts
XI: Net Wealth 0.875* 0.508* 0.546*
X2: Age less than 30 0.647* 0.093 0.029
X3: Age more than 50 0.430* 0.334* 0.224*
X4: Female -0.068 -0.224* 0.124*
X. 5: Married -0.187 -0.179 -0.107
X6: Non-Malay -0.182 -0.346 -0.097
x7: Secondary School 0.092 0.062 0.034
X8: Diploma -0.016 -0.126 -0.027
X. 9: Master's Degree 0.087 -0.321* -0.110
X10: Self Employed -0.229* -0.108 0.202*
xii: Government -0.177* -0.290*
-0.019
X12: Prefer Stocks -0.077 0.014 -0.084
X13: Do Not Hire CFP -0.125 -0.751* -0.194
X14: Conventional Unit Trusts/Shares/Saving Accounts
0.263* -0.263* -0.056
X15., Syarlah Literacy 0.004 -0.001 0.012*
X16: Financial Plan 0.010 -0.034 -0.014
X17: Financial Literacy -0.009 0.003 -0.003
d usted R- quared ýj 0.423 0.298
Note: * Significance at 95% level of confidence. Source: Based on Author's Own Calculations
219

As demonstrated above, our aim was to examine relevant factors driving the
variations of the demand for financial assets of our research. Accordingly, we discuss the results in the light of similar literatures established by authors involved
in the same area of study as well as refer to the actual investment environment in
Malaysia. Variables tested in our regression models are discussed in turn.
The best regression referred to the regression with the highest R-squared value or
the goodness of fit. High R-squared value means the power of all factors
collectively explain the variability in the dependent variable. R-squared for the
demand of unit trusts is 0.37,0.48 and 0.52 for the regression containing income,
wealth and net wealth respectively. For the demand of shares, R-squared values
are 0.37 for the regression containing income and 0.42 for both regressions
containing wealth and net wealth. On the other hand, R-squared values for the
demand of saving accounts are slightly lower than the above financial assets.
They are 0.22,0.28 and 0.30 for the regression containing income, wealth and net
wealth respectively.
From the examination of R-squared values, we can establish that our model
explains best the demand for unit trusts followed by the demand for shares and
saving accounts. At an R-squared value of 0.52, the regression model for unit
trusts is considered good. Our model explains more than 50% of the variation in
the demand for them. However, the remaining 50% of the variation in the demand
for unit trusts cannot be explained by our analysis. For the demand for shares,
more than 40% of the variation is captured by our model. On the other hand, only 30% of the variation in demand for saving accounts can be modelled by the
selection of factors included in our regression. From the results of the R-squared
values, we can see the level of demand for unit trusts is explained better than the
variation in demand for shares and saving accounts.
220

7.2.1 Economic Variables: Income, Wealth and Net Wealth Elasticities of Demand
For the demand of unit trusts, the coefficients for wealth and net wealth elasticities of demand 50 are far greater at 0.88 (rounded to 2 decimal places) as compared to a coefficient of income of 0.56. This means that one unit increase in
wealth and net wealth would increase the demand for unit trusts by 0.88 units. However, the fact does not mean that a Malaysian Ringgit (MYR) increase in
wealth and net wealth eventually would increase the demand for unit trusts by 88
sen. This is because we have converted the monetary values of income, wealth
and net wealth as well as the values for monetary holding of unit trusts to units of logged values. But we can still see from these results that there is s significant
effect of income, wealth and net wealth upon the demand for unit trusts in terms
of unit changes.
The reason why wealth elasticity of demand and net wealth elasticity of demand
contains more explanatory value is due to the extensive lists of items reflecting households' ability to consume. Wealth, in our research includes, among others,
value of homes, other properties, monetary value of savings and investments as well as the amount of money in households' retirement accounts.
The demand for unit trusts soared after the introduction of the unit trust
investment scheme in the Employee Provident Fund (EPF). In an effort to develop
a more diversified capital market, the government is encouraging the growth of
unit trusts by providing various tax incentives. For example, gains arising from
the realisation of investments are regarded as ordinary income from a unit trust
and such gains on distribution are not taxed. Further, foreign-sourced income
received by a unit trust is exempt from tax with effect from year of assessment 199851. Participants are allowed to withdraw their funds from Account (1) subject
10 when discussion about income, wealth and net wealth in regression model is provided it means that we are referring to the elasticities of demand of the said variables. 11 httD: //www. us- asean. orp, /Malaysia/business guide/Tax Svstem. aSD#6. %201nvestment%201ncentives. Retrieved on 18' March 2006
221

to a balance in the account of more than RM 55,000. They may use 20% of the
amount each time to be invested in unit trusts managed by any fund management institutions approved by the Ministry of Finance. The list of approved institutions
is provided in Table 6.2. Subsequent withdrawal can be made after three months
provided that the balance in Account (1) is more than RM 55,000. If the face
value of participants' investments in unit trusts experiences a loss which reduces the fund of Account (1) to be less than RM 55,000, they have to wait until the
threshold of RM 55,000 is achieved before they will be able to invest again.
222

Tahle 7.2: Lists of Appointed Fund Management Institutions by the Malaysian Ministry of Finance
No IPD Code Name of the institution 1 IPD 001
_ -Mayban Investment Manaqtment Sdn. Bhd.
2 IPDO02 OSK-OUB Unit Trust Management Berhad 3 IPDO03 Public Mutual Berhad 4 IPDO04 Amanah Saham Sarawak 5 IPDO05 Southern Investment Bank Berhad 6 IPDO06 HLG Unit Trust Berhad 7 IPDO07 Asia Unit Trust Berhad 8 IPDO08 RHB Asset Management Sdn. Bhd. 9 IPDO09 TA Unit Trust Management Berhad 10 IPDO10 SBB Mutual Berhad 11 IPD011 Arninvestment Services Berhad 12 IPDO12 ASM Mara Unit Trust Manaqement Berhad 13 IPDO13 Pacific Mutual Fund Berhad 14 IPDO14 Lembaga Tabung Hail 15 IPDO15 Permodalan BSN Berhad 16 IPDO16 RHB Unit Trust Management Berhad 17 IPDO17 Phillip Capital Management Sdn. Bhd. is IPDO18 CMS Trust Management Berhad 19 IPDO19 HLG Asset Management Sdn. Bhd. 20 IPDO20 Mayban Unit Trust Berhad 21 IPDO21 Apex Investment Services Berhad 22 IPDO22 CIMB-Principal Asset Management Berhad
23 IPDO23 Amanah Saham Naslonal Berhad 24 IPDO24 ASM Asset Manaqement Sdn. Bhd. 25 IPDO25 KAF Fund Manaqement Sdn. Bhd. 26 IPDO26 JMF Asset Manaqement Sdn. Bhd.
-17 IPDO27 Affin Trust Manaqement Berhad 28 IPDO28 PHEIM Asset Management Sdn. Bhd. 29 IPDO29 Avenue Investment Berhad 30 IPDO30 MAAKL Mutual Bhd. 31 IPDO31 Avenue Asset Management Services Sdn. Bhd. 32 IPDO32 Meridian Asset Management Sdn. Bhd. 33 IPDO33 Prudential Unit Trusts Berhad 34 IPDO34 KL City Unit Trust Berhad 35 IPDO35 KLCS Asset Management Sdn. Bhd. 36 IPDO36
- BIMB Unit Trust Management Berhad
ý7- IPDO37 Kenanga Investment Manaqement Sdn. Bhd. 38 IPDO38 Kenanga Unit Trust Berhad 39 D039 Alliance Unit Trust Manaqement Berhad 40 IPDO40 PHEIM Unit Trusts Berhad ý-j IPDO41 KSC Capital Berhad 42 IPDO42 Hwang-DBS Investment Management Berhad Source: Aclapte(I from www. Kwsl2. pov. my. Ketrievea on 23- March ZUU6
223

The large amount of funds available in the EPF 52 retirement account for
Malaysian householders contributes to the high demand for unit trusts. By 2005,
the percentage contribution was I I% of wages from the employee and 12% from
the employer thus resulting in 23% of monthly income being contributed to the
fund each month. To mobilise pooled funds in their accounts, householders invest
in unit trusts since it is the only investment that is allowed under the EPF rule. Householders are motivated to invest in order to diversify their assets and/or to
earn higher returns from their investments than the standard 5% provided by the
EPF. Investment in unit trusts can also be used to reduce tax liability as income
and gains from the investment are tax exempted.
However, the effect of income, wealth and net wealth on the demand of shares is
less than that of the demand for unit trusts. Although income is significant at 0.38,
the coefficients of wealth and net wealth are far greater at 0.57 and 0.51. Here,
one unit change in wealth and net wealth results in changes to the level of demand
for shares of more than 0.5 units compared to a greater effect on wealth and net
wealth from unit trusts at 0.88 units.
On the other hand, the coefficients of income, wealth and net wealth are 0.39,
0.56 and 0.55 respectively. The coefficient of income is much lower than those of
wealth and net wealth. From our results we may deduce that wealth and net
wealth have almost the same effect on the demand for saving accounts.
The result is not unusual in researches analysing the demand for financial assets.
Tin (1998) obtained the same results except in his regression equation for the
demand of non-interest earning checking accounts for householders aged 60 and
more. In all other regressions for every type of financial assets included in his
analysis, elasticity of net worth contained more explanatory power than other
economic variables. In the regression of non-interest checking accounts, the
52 The Employee Provident Fund (EPF) provides retirement benefit for most workers in Malaysia. EPF is fully funded with contributions and accrued interests are credited into individual's account. The amount accumulated becomes available in a lump sum or in instalments at the age of 55 (the general rule). At the end of 1988, total membership of EPF was 5.3 million people and fund, s assets were RM 36.5 billion.
224

53 elasticity of income had more explanatory power than wealth and net wealth.
Our results thus confirm that much financial asset demand in Malaysia is driven
more by the elasticity of wealth and net wealth than elasticity of income.
It is worth mentioning that in the regression for the demand of saving accounts,
the performance of our regression model containing income, wealth and net
wealth is almost similar. In contrast to the for regression model for the demand of
unit trusts and shares, the overall performance for the regression containing
wealth and net wealth is more accurate than the regression containing income.
Upon examination of the R-squared value for all regressions for every type of financial asset, we can see that R-squared value in the regression containing income is far less in the demand for unit trusts and shares than in the demand for
savings. As for the regressions for saving accounts, the differences in the R-
squared value in the three regression containing income, wealth and net wealth is
not prominent. This suggests that for the demand of saving accounts, the income
model is as good as the wealth and net wealth regression model. In contrast, for
unit trusts and shares, wealth and net wealth are better models in explaining the
variation of the demand than the regression model containing income.
In Malaysia, householders are using saving accounts in commercial banks for
transactional purposes rather than for investment purposes. Employees in private
and government bodies often use saving accounts for their salary deposit at the
end of every month. This results in these accounts serving as better indicators on
the demand for saving accounts in Malaysia. On the other hand, savings in other
institutions such as Tabung Haji or pilgrimage funds can be regarded as pure
saving. Funds in Tabung Haji can only be withdrawn from its counters. There is
no other means such as auto-teller machines or cheque facilities offered by
Tabung Haji which limits fund withdrawals by depositors. Furthermore, the main
objective of saving in Tabung Haji is to provide lump sum capital for pilgrimage
for Muslim investors. As the amount of saving included in the research is the
combination of deposits in banking institutions and other institutions such as
53 Can be referred in 884, Table 1, Jan Tin (1998), "Household demand for financial assets: A life- cycle analysis", The Quarterly Review ofEconomics and Finance, Vol. 38, No. 4,875-897.
225

Tabung Haji, income elasticity of demand for saving accounts is still slightly lower for wealth and net wealth. If deposits in Tabung Haji are not accounted for,
the effect of the elasticity of income on the demand for saving accounts results
would have been higher.
As stated above, Tin (1998) produced the same results for the demand for the non-
interest earning checking account. The feature of this product is that it can be
closely matched with the saving accounts offered by banking institutions in
Malaysia. Both his results and our results suggest that income playas a more
important role or about the same role as wealth and net wealth do for the demand
of a financial asset that is used more for transaction purposes rather than for a
saving purpose. This is not true for financial assets that are acquired for
investment and saving purpose such as unit trusts and shares.
in summary, we have found that net wealth is able to explain more on the
variations for the demand for all financial assets except for saving accounts. As
net wealth is defined as the surplus of wealth after all liabilities are taken into
account, it is a more meaningful measure of householders' ability to acquire
financial assets. The results also suggest that wealth stocks rather than income
flow affect more the level of demand for unit trusts and shares. On the other hand,
income flow rather than stocks of wealth and net wealth affect the level of savings
more.
226

7.2.2 The Life-cycle Hypothesis
On the demand of unit trusts, householders in the age group of less than 30 are far
more likely to demand unit trusts than householders aged from 30 to 50 years (the
base group) by 0.412 units. A possible explanation for this higher demand by
younger householders is that unit trusts are often used as a saving mode by parents
wanting to save for their children's benefit. Amanah Saham Nasional and Amanah Saham Bumiputra (unit trust funds offered by Permodalan Nasional Berhad) are
relatively risk-free and provide a steady income stream, thus motivating parents to
choose these schemes to invest for their children's future. In addition, at younger
age, households face minimal financial obligations having not yet acquired their
own homes and other types of debt. Thus they find themselves with extra funds to
invest in unit trusts.
In relation to householders aged more than 50, their level of demand for unit trusts is greater than the base group (age 30 to 50) by 0.648 units. The coefficient for
this age group is more than the coefficient of the results for household aged less
than 30 by more than 2 units (0.648 versus 0.412). These figures confirm that householders aged more than 50 are demanding more unit trusts than the other age
groups. As we have suggested earlier these results may be driven by the introduction of self-regulating retirement funds of EPF by the government. Individuals are allowed, even encouraged, to invest their entitled amount of funds
in Account I (funds of more than RM 55,000) in various unit trusts scheme
approved by the Ministry of Finance. Having accumulated a sizable holding in the
account, they are likely to be interested in diversifying their holdings by investing
in unit trusts. At this age, they are busy trying to accumulate sufficient income for
retirement so that they inclined to switch from an EPF account to other fortris of investment such as unit trusts to earn higher rates of return at a tolerable level of
risk.
227

Investments in the unit trusts schemes offered by PNB are virtually risk-free (Ali,
2003). Stable rates of return and the price of PNB unit trusts rarely fluctuate
making them a suitable asset to hold during retirement years. Superior rate of
returns provided by PNB unit trusts also contribute to the high demand of their
products. 54 In comparison, other unit trusts provided by other unit trust providers
may offer high rates of return but they are not considered so desirable because of
the perceived risk of their nits either fluctuating or even deflating.
Our results which indicate that older households are less risk averse compared to
younger households are in line with results obtained by Ameriks and Zeldes
(2001). In their study on the demand for financial assets by American households,
they found that equity financial holdings increase with age, peaking in peoples'
fifties and becoming constant in the later years. Furthermore, older householders
are willing to hold more unit trusts because they regard unit trust schemes offered
by the national unit trust management company that is PNB, as risk free
investment. We cannot emphasize more that it is actually true in case of PNB unit
trusts. The fact that the government guarantees the investment values of
householders in the PNB unit trusts unit only confirms the fact. Although it is not
always true in the finance world, the expectations of households do matter in
order for them to hold the units. Retired households usually consider holding units
offered by PNB to secure their retirement capital as well as earning stable and
sensible amount of returns on their investments.
In addition, mature households will usually have more disposable income
available for investment. In contrast to households aged between 30 and 50, this
group of households usually have fewer financial obligations as they are clearing
their debts in preparation for retirement. Householders in their fifties are likely to
have fewer financial obligations such as house mortgage balance, car hire
54 The dividend rate of 7.1 sen per unit of par value of one Ringgit Malaysia had been announced for the year ending 31" August 2005 for Amanah Saham Wawasan 2020 (One among 10 unit trust schemes managed by PNB). A dividend of 7.1 sen a unit represents a return of 7.1% on the investment. Similar rates of return around 7%-8% can be expected on all unit trust schemes managed by PNB according to past trends.
228

purchase balance and other forms of debt leaving them with more disposable
income to invest.
In the regression containing wealth, the coefficient for householders of less than 30 is 0.539 units more than the base group. On the other hand, for householders
aged more than 50 the coefficient is 0.516 higher than the base group. The results are consistent with the results in the regression containing income. Younger and
older households invest more in unit trusts than middle-aged householders do.
Different patterns, however, exist in relation to the direction of the coefficients between younger and older householders. In income regression, the coefficient of
younger householders is fewer than that of older householders. In contrast, the
reverse pattern is observed in the other two regressions that contain wealth and net
wealth as the economic measures. In the regressions containing wealth and net
wealth, the coefficient for younger householders is higher than for older householders. The result is prominent in the regression containing net wealth. Younger householders in more unit trusts by 0.647 units than the base group while
older householders invest more than the base group by 0.516 units. In this
regression we may observe that the coefficient for the younger householders is
higher than for the older householders unlike in the regression containing income
where young households' coefficient is less than the older households. The results
reveal that income, wealth and net wealth affect differently for different age
groups as far as the demand for unit trusts is concerned.
In sum, in relation to the demand for unit trusts, the three age groups analysed in
our research are significantly different in the regressions that contain income,
wealth and net wealth. Taking households age between 30 to 50 years as a base
group, we found that households aged less than 30 and households aged more than
50 invest more than the base group does. The coefficients are all positive indicating that the difference between the age groups moves along in the same direction. The results obtained from our analysis suggest that a life-cycle pattern
exists among Malaysian households in relation to the demand for unit trusts. More
importantly, the results are robust since regressions containing economic
229

indicators such as income, wealth and net wealth produce similar pattern, albeit at different degrees of strength.
In relation to the demand for shares, a less obvious pattern of life cycle is found.
In the regression containing net wealth (Refer to Table 7.1), householders aged less than 30 demanded almost the same level of shares as the base group does.
Statistically, no significant difference between the two groups was found. On the
contrary, a life-cycle pattern can be found among householders aged more than 50
and that of the base group. Our results successfully show that there is a significant difference in the level of demand for shares among householders aged more than 50 and householders aged between 30 and 50. ' Clearly, a life-cycle pattern can be
traced in relation to the demand for shares based on the regression analysis on net
wealth. .
Similarly, in the regression on the income of households, significant differences in
the level of demand for shares exist between older households and the base group
(householders aged 30 to 50). Older householders invest 0.370 units more units of
shares compared to middle-aged householders. With reference to the householders
aged less than 30, the same results of no life-cycle pattern as in the regression
containing net wealth. The same pattern was also found in the results obtained in
the regression containing wealth. Older householders show a significantly higher
demand for shares in comparison to middle-aged householders by 0.376 units.
Results obtained in the net wealth regression are more reliable since they reflect
the real ability of households to invest in financial assets. Thus, we concluded
that a life-cycle pattern demand for shares does exist in Malaysian householders.
From the results, we may suggest that the age factor is prominent in determining
the level of demand for shares as it is in the demand for unit trusts.
Consistent results in the demand for saving accounts have been obtained in all
regressions containing income, wealth and net wealth. In the regression containing
net wealth, householders aged more than 50 have a higher level of savings
compared to householders aged 30 to 50 years by 0.224 units. The results are
230

significant at 5% level of significance. Results from the regressions containing income and wealth both are also consistent with this fact. The results are similar to the findings of Biorn (1980)55. He analysed the life-cycle effect on
consumption of Norwegian households by analysing age parameters, consumption
expenditure, and income and wealth at the micro level, as in our case. He found
that young persons, who have longer planning periods than older people, show a life-cycle pattern in their consumption which is not found in the consumption
patterns of older householders.
On the other hand, the life-cycle effect is absence between households aged less
than 30 against the middle-aged householders group. In the regression containing
net wealth, young households have a higher level of savings than middle-aged householders by only 0.029 units resulting in insignificant differences between
them. On the other hand, in the regression containing income and wealth, our
results indicate that young householders have fewer savings than middle-aged householders by 0.0153 and 0.0340 respectively. There is an inverse relationship
between the two groups. Younger households save less due to the fact that they
have to save for other purposes such as accumulating money for down-payment
on housing, study loan repayments and so on. Our results are thus in line with the
prediction of the life-cycle hypothesis stating that individuals who start off with
meagre savings, can begin to build their wealth as they age.
in conclusion, the results from the demand regression for the three types of financial assets reveal mixed evidence on the life-cycle effect. As stated by
Poterba and Samwick (1999), the effect of the life-cycle is not uniform across different types of assets. In our case, results on the demand for unit trusts show a distinct life-cycle effect across the three groups of age. This effect, however, is
only partly founded in the case for the demand for shares. A significant life-cycle
pattern only exists between middle-aged householders and older householders, not
among the very young and middle-aged householders. Finally, as for the demand
for saving accounts, a distinct life-cycle effect exists between older householders
" See Biorn (1980), "The consumption function and the life cycle hypothesis: An Analysis of Nonvegian Household Data", Scandinavian Journal ofEconomics, 465- 480.
231

and middle-aged householders. A life-cycle pattern between young householders
and middle-aged householders has not been established in our analysis on the demand for savings accounts.
When the age effect fails to be fully explained for some type of financial assets, namely shares and saving accounts, other theories to explain the behaviour for
savings and wealth accumulation may be applicable. The competing theory of savings and wealth accumulation is the theory of precaution. According to this theory, the pattern of wealth accumulation is not detertnined by the age of individuals, but to their need to save for some precautionary reason. In this research, we cannot conclude that the theory of precautionary savings prevails
over the prediction of the life-cycle. A drawback in our research design dealing
with the theory of precautionary savings prohibits us from drawing such
conclusion.
The hypothesis proposed by Modigliani and Brumberg (1954) and Friedman
(1957) on how the life-cycle effect affects various aspects of householders'
economic decisions, includes their consumption's pattern as well as the pattern of their demand for financial assets during their life-cycle. Their hypothesis on different patterns of demand for financial assets that occur at various age levels is
also partly found in our research. Our results suggest that only the demand for unit
trusts produces a distinctive life-cycle pattern. This pattern also exists between
older householders and middle aged householders but not between young and
middle aged householders in relation to the demand for both shares and savings
accounts.
232

7.2.3 Demographic Factor: Gender, Marital Status and Race
Demographic factors are among important determinants of the demand for
financial assets. Both Keynes (1936) in his theory of marginal propensity to save
and Friedman (1956) in his theory of asset demand had examined sets of demographic variables that could affect their theories. For example, Keynes stated that the individual's propensity to save is influenced by objective factors such as income and wealth as well as subjective factors such as precaution, pride and independence. These subjective factors vary greatly among individuals with different socioeconomic characteristics (Tin, 2000, page 113).
Tin (2000) included factors such as age, number of children, marital status,
gender, and race as sets of demographic variables to be tested in his examination
of financial assets demand. His results revealed that the demand for financial
assets increase with age and decreases with the number of children. As for the
level of education, the coefficient is not always positive for every type of asset
under his analysis. Some assets are demanded less by educated people. As for
marital status, a negative coefficient in the level of demand for most types of
assets may be linked to the number of children they have. Married couples having
children will have less disposable income available for investment due to the
significant expenses devoted to their children. It is the same for the gender of
householders. Men demand certain types of assets more than women. In general,
his analysis revealed that the propensity to save in householders varies
considerably depending on the demographic groups that they belong to.
Other studies that consider the effect of demographic factors on savings and
consumption level have been done by Hall and Mishkin (1982), Zeldes (1989) and Lusardi (1996). In line with their studies, we examined sets demographic
background of householders in our study of financial asset demand. Demographic
and socio-economic variables included in the regression analysis are age, gender,
marital status, level of education, job sectors which householders fall into as well
as their racial composition. The age effect has been discussed exclusively due to
233

our research objective to learn more about the life-cycle effect. Discussions on the
effect of demographic variables tested in our regression model are discussed in the
next section.
In our main regression which contains net wealth as the economic variable, it can be seen that females acquire fewer shares compared to their male counterparts. But the result is not significant at the 5% significant level. On the demand for unit trusts, there is no distinguishable difference between female householders and male householders. The negative sign of the coefficient insinuates that female
acquire fewer unit trusts, but since the results are not significant at the stipulated level of significance, gender differences on the level of demand for unit trusts
cannot be established. On the other hand, female householders save significantly
more than male householders.
For both types of risky investments, i. e. unit trusts and shares, gender differences
do not prevail. Thus our results do not confirm the findings of Barber and Odean
(2001) and Lott and Kenny (1999) who stated that men and women have different
attitudes to risk. The only difference that exists in relation to gender is in the demand for savings accounts.
Men are generally more confident than women (Lundeberg el al., 1994). In
addition, Prince (1993) stated that men feel more competent and confident than
women on matters related to finance. In relation to the demand for shares, Barber
and Odean (2001), from their research on 35,000 American men and women investing in stocks from 1991 to 1997, found that men trade 45% more than
women. The motivation for their study was quite different from our, as their aim
was to examine for possible returns differences of participating men and women. We, on the other hand, have examined only on the amount of shares held by both
sexes. Lenney (1977) also stated that women have lower opinions of their abilities
when facing uncertain and ambiguous conditions. Feedback on women 9s
participation in stock market activity and share acquisition is ambiguous an
234

inconclusive. Our results hint that females hold significantly fewer shares. But the
results are not significant at 5% level of significance.
Yet it is not possible to conclude that women are less interested in acquiring financial assets. They save more than male householders and hold about the same
amount of unit trusts as their male counterpart. Indeed increased participation by
women in the last twenty years may be the core underlying reason for the results obtained in our analYsis. There was a massive increase in demand for women in '
the workforce during the growth of manufacturing industry in the nineties. 46.4%
(in 1990) and 43.4% (in 1995) of workers in manufacturing are women. The
service sector and the government sector are also the main employers of women. In these sectors 60% of employees are women. As almost 50% of workforce in
Malaysia are now women, it is safe to deduce that women and men have the same
opportunity to save and invest, thus resulting in a more equitable and balanced
level of financial asset ownership by Malaysian men and women. The inadequate
level of women's ownership of shares is moderated by the higher amount of
savings that they have, and their more or less the equal ownership of unit trusts.
Table 7.3 presents the percentage distribution of the female labour force out of total labour force during 1970-1995.
Table 7 3: Percentage Distribution of Female Labour Force during the Year 1970- 1995
Sector 1970 1980 1985 1990 1995 Agriculture, Forestry, Livestock and Fishing
38.0 39.0 38.4 34.4 28.4
Mining and Quarrying 12.6 10.3 10.5 12.9 11.9 Manufacturinq 28.1 40.3 43.1 46.4 43.4 Construction 5.3 7.5 3.4 6.9 12.4 Electricity. Gas and Water 6.7 7.1 5.6 4.3 7.8 Transport, Storage and Communication
18.2 29.3 37.4 38.6 11.2
Wholesale and Retail Trade, Hotels and Restaurants
4.3 6.3 10.4 11.1 37.6
Finance, Insurance, Real Estate and NA 29.5 35.1 34.2 40.3
Community, Social and Personal Services; Public Administration; and other Services
NA 29.4 36.8 37.9 39.2
Source: Sixth Malaysia Plan, 1991 ancl Seventh Malaysia Plan, 1996.
235

On the other hand, the marital status of households does not affect their level of
demand for any type of financial assets. The negative sign of coefficients for this
variable hints at possible demand differences between married and single householders. The demand by married householders may be lower than that by
single householders. However, the results are not significant at 5% significant
level which indicates that households who are married do not acquire financial
assets in a different pattern to those who are single. Tin (2000), on the other hand,
produced a result which shows that married households do acquire fewer of
financial assets than single households. All financial assets in his analysis demonstrated the same pattern of demand; that is married householders
demanding fewer financial assets compared to single householders. Married
householders, in general, have more obligations: to provide necessities for their
children such as education, childcare and living expenses. In view of this, they
have less disposable income available to invest in financial assets. This view is
supported by Bosworth, Burtless and Sabelhaus (1991) and Avery and Kennickel
(1991) who they agreed that married couple with children save less than their
counterparts.
Our results which indicate that married and single householders save and invest
about the same amount thus do not support the popular stance on financial
planning. Financial planners usually advise their married clients to save more so
that they can provide their offspring with an adequate level of education.
Householders with growing children are supposed to invest in education trust
funds or other forms of safe investments in order to provide sums for their
children's education costs in the future. Our results might be driven by the fact
that insurance holdings as takaful are not included. Takaful schemes offered by
various Islamic and conventional institutions usually provide educational takaful
for children. By not including this insurance premium in our analysis, we cannot
conclude that householders in our analysis are, as a matter of fact, making
provision for their children's education or not.
236

In relation to the racial composition of householders, our results suggest that there
is no significant differences between non-Malay and Malay as far as the demand
of financial assets are concern. The negative coefficients from the results suggest
that Malays have fewer financial assets but the results are not significant at 5%
level of significance. The results can be seen as a positive indicator reflecting that
no significant economic parity exists between non-Malays and Malays. Reducing
the economic gap between different races in Malaysia was one of the major
objectives of the New Economic Policy (NEP). The Malaysian New Economic
Policy (NEP or DEB for Dasar Ekonomi Baru in Malay) was a restructuring
program launched by the Malaysian government in 1971 under the then Prime
Minister Tun Abdul Razak. The term of the NEP ended in 1990. It was succeeded by the National Development Policy in 199 1.
The NEP had the stated goal of poverty eradication and economic restructuring so
as to eliminate the identification of ethnicity with economic function (in colonial
times, Malays were farmers, Indians were rubber tappers and Chinese were mine
workers). The initial target was to move the ratio of economic ownership in
Malaysia from a current ratio of 2.4: 33: 63 ratios of Bumiputra, other Malaysian,
and foreign-ownership to a 30: 40: 30 ratios. Malays are the original group in
Malaysia. Traditionally, Malays were recognised as among the poorest group of
people in Malaysia with the Indians. The Malays lived in the rural areas working
rice plantations. During the post-independent years i. e. in 60s, 70s and 80s, the
majority of Malays worked either in the government sector or were employed in
the traditional jobs in the rural areas. Compared to the Chinese, only a minimum
number of Malays were engaged in business activities which made them poorer
than the Chinese (Malaysian Chinese). As a result, the Malays share is far lower
that that of the Chinese. In 1970, the Malaysian Government estimated that
Burniputras held roughly 2.4% of Malaysia's economy, compared to 33% owned
by other races with 63% in foreign hands. Also, in 1969 Malaysia experienced her
worst ever racial rioting and the NEP was perceived as a means of preventing
such outbreaks in future. The perception was that the Malays (and not all
Bumiputra) had rioted due to poverty and lack of opportunities.
237

As a result of the NEP, the wealth in the hands of the Burniputras went from 4% in 1970 to about 20% by 1997. Table 7.4 surnmarises the results of the NEP implementation.
Table 7.4: Burniputra, Equity and Some Economic Performance for the Year 1970,1990 and 2004
NEP Benchmarks 1970 1990 2004
Burniputra Equity 2.4% (RM477m)
19.3% (RM20.9b)
18.7% (RM73.2b)
overall poverty 52% 17.1% 5% Rural poverty 59% 21.8% 110/0 Household Income RM660 RM1,254 RM2,996
Source: httl2: Hen. wikipedia. orWwiki/Malaysian New Economic Policy. Retrieved 13th November 2006
However, wealth distribution under the NEP remains unequal. In 1997,70.2% of households in the bottom 40% income group were Burniputra, while 62.7% of
households in the top 20% income bracket were non-Burniputra. Also, while the NEP may assure that the Bumiputras collectively own a certain percentage of the
national wealth, it does not ensure that the median economic situation of the Burniputra is improved in any meaningful sense. For example, a goal of 30% of
the national wealth held by Burniputra was not indicative that the median 60% of
Bumiputras held 28 percent of the national wealth. It could also be achieved by
just one Burniputra holding 29% of the national wealth and the rest holding 1%
collectively. As our analysis does not examine on the distribution of financial
asset held by Malays and non-Malays, we can not enlighten readers on the issue
of financial wealth distribution.
238

7.2.4 Socio-economic Effect: Educational Background and Employment
sector
There are many explanations offered by researchers on the effect of education and
the risk attitude of households. Hochguertel et al. (1997) found that better
educated households invest more in stocks than less educated people, indicating
that the better educated householders are more willing to take greater risks
compared to less educated householders. He found that better educated householders get better pay with less risk of income fluctuation. Accordingly,
educated householders may be more likely to engage in investments which are
more risky in nature as they are more able to compensate for their investment
losses with their secured and higher income. Householders with high levels of
education are also less likely to be made redundant due to their expertise and intellectual capacity. Lucas (2000), in his study on labour income variation also
established that labour income variation represents the amount of risks individuals
are willing to take in relation to their demand for financial assets.
Another explanation for the positive relationship between the level of education
and amount of equity holdings is that better educated households have access to
more information. This school of thought was researched by King and Leape
(1987), among others. They suggested that educated people have better
information about various investment opportunities. Since shares and other equity
related investments are information-driven investment ventures, better-educated
households usually acquire more shares and equity related investments.
In our analysis, levels of education were divided into secondary school, diploma,
degree and master's degree. For the purpose of the analysis, we took
undergraduate degree as the base group, secondary school leavers signifies 10 to
12 years of education and students have to complete a further 3 years of education
in order to gain a diploma and another 2 years to obtain an undergraduate degree.
For a master's degree, universities in Malaysia usually offer a two-year
239

programme except for a very few such as University Technology Mara which has
an 18-month master's degree in business administration.
Based on our analysis, the only significant results were obtained in the regression for the demand of shares. It was found that householders with undergraduate degree levels demanded more shares than householders with master's degrees.
Other than in the regression of shares, no evidence was discovered on the effect of
education level and the demand for financial assets. No significant difference was
established in the regressions of the demand for unit trusts and saving accounts. This suggests that households' educational level has little or no influence on the demand for financial assets.
Our results, in this regard does do not coincide with majority view-point in the
literature that states householders with higher education level invest more in
equity. One reason driving this phenomenon is that subjects currently taught in
classes, colleges and universities in Malaysia are not related to financial education
and awareness. School children as well as universities' students are not directly
exposed to basic financial education. Formal subjects such as mathematics,
commerce, accounting and house science subject are being taught, but no
connection has yet been made to link the usage of these subjects towards financial
education.
7.2.5 Risk Tolerance Level
In theory, how householders perceive themselves to be risk-averse or risk-taker
affects their level of demand for financial assets. However, the level of risk that
can be tolerated by householders is a product of many factors. For instance, age, income and wealth level, number of dependents and nature of employment all
contribute to the level of tolerated risk of a householder. Increased age, for many householders is a reason to be more prudent. Thus they may be more likely to
reduce their level of equity holdings. Fluctuation in income stream due to human
240

capital uncertainty is also a possible factor to affect the level of demand for
financial assets according to Heaton and Lucas (1997). Entrepreneurs, who are facing greater income risk than salaried householders are less likely to hold wealth in the form of stocks and other risky financial assets according to Heaton and Lucas (2000).
in our research, we have included householders' own perceptions on their level of
risk tolerance by asking them whether they prefer to hold shares or bonds. Their
answers have been taken as a proxy for their level of risk tolerance. The results
from the regression models revealed that there is no significant difference between
the holdings of stocks and bonds in all regressions. This suggests that
householders' own evaluations on their own level of risk tolerance are not a valid
factor in the demand for financial assets. For example, if a householder considers
himself as a risk-taker, it does not necessarily follow that he will hold more unit
trusts and shares than one who is a risk-averse.
The coefficient for householders holding stocks in the demand for unit trusts is
negative compared to the base group of "prefer bonds". Where the result is
significant, we have assumed that householders who are risk-takers (prefer stocks
over bonds, thus producing a negative coefficient) demand more unit trusts than
householders who are risk-averse. For the demand for shares, the coefficient is
positive although not significant. For saving accounts, the coefficient is negative
suggesting that those who are risk takers have fewer savings. The positive sign of
the coefficient indicates that households who prefer stocks actually holding more
stocks than bonds.
241

7.2.6 Certified Financial Planners' involvement
In the specialist model for personal financial planning delivery proposed by Black
et al. (2002), certified financial planners are the closest parties to the householders
who have chosen to hire professional advice in planning their portfolio. In a
specialist model, as opposed to a generalist model, householders depend on the
financial planners to survey products and carrying out the duty of planning their
financial matters. Due to the comprehensive involvement of financial planners in
household portfolio allocation, we resolved to examine whether financial
planners' involvement affects the levels of demand for assets. In other words, we
wanted to know whether householders who hire the service of financial planners
tend to demand certain types of financial assets. A similar study that examined
the effect of the professional involvement of financial planners in household
portfolio allocation was done in Ioannide (1992).
We have taken householders who have hired the services of financial planners as
the dummy group. Thus, coefficients in the regression results should indicate
whether differences in demand for financial assets exist among the householders
who hire the service of planners and those who did not.
The regression result for the demand of unit trusts is negative but not significant at
5% level of significance. This indicates that, in relation to the demand of unit
trusts, there is no significant difference between householders hiring financial
planners and those who do not. But, if the results should have significant, it could
indicate that householders hiring certified financial planners have a tendency to
demand more unit trusts than householders who do not. The results might be due
to the fact that many householders are investing in unit trusts following the
government initiatives to encourage this particular type of investment. Middle
aged householders have usually acquired a significant amount of savings in the
retirement accounts which enables them to invest. Many householders usually depend on the advice received from unit trust agents to make their investment
decisions rather than use the services of financial planners. As investment in unit
242

trusts is perceived not to be too risky, for example, when investing in the national
unit trust provider, Permodalan Nasional Berhad (PNB), householders are more likely to follow the free advice from their unit trust agents.
In the regression of the demand for shares, our results revealed that there is a
significant difference between households hiring certified financial planners and households who do not. The negative coefficient means that households who are
using the services of financial planners demand significantly more shares than householders who manage their financial affairs on their own. The result is in line
with the proposition made by researchers such as Hochguertel et al. (1997) and King and Leape (1987) that better- educated and better-infon-ned householders
will demand more equities than those who are less educated. Investment ventures in shares and other equity holdings needs to be more fully researched. With the
guidance obtained from certified financial planners, households are more
confident to invest in risky investments since certified financial planners had
adequate training and vast experience to guide their clients to invest in accordance
with their clients' financial objectives.
In relation to the demand for saving accounts, the results turn out to be
insignificant. This indicate that it is not statistically proven that households hiring
the service of financial planners invest more in saving accounts than households
who manage their own personal finances. As saving accounts are easy to set up
and straight forward to manage, it is predictable that the demand for saving
accounts will be about the same for households who have the luxury of receiving
advice from financial planners and who do not.
243

7.2.7 Preference between Islamic and Conventional Financial Assets
According to the publication of researchandmarket. com, year 2005's annual
turnover of Islamic financial institutions was between 200-300 billion pounds
compared to only around 5 billion in 1985 56 . The rate of growth was estimated to
be 10-15% per year. Indeed, a double-digit growth was recorded in the Islamic
banking sector. Due to the rapid development of Islamic banking and finance for
the past 25 years, 1980- 2005, we determined to examine whether households
demonstrate significant preferences between Islamic and conventional financial
assets.
At present, an analysis of the differences between the two means of banking and finance is viable due to the approximately level playing field on which they both
operate. At present, Islamic banking operations are in a stable growth situation. It
had surpassed the initial stage of its development life-cycle. It can be argued that
it now at a mature, stable pace of existence. More savings, investments and risk
management products had been introduced to the market. Moreover, diverse
numbers of outlets in the form of standalone Islamic banks and conventional banks Islamic window have been made accessible to investors.
With high rates of growth and increased levels of funds in the Islamic financial
market, the sophistication of Islamic financial products also increases (Zamir
Iqbal, 1997). However, the product innovations of Islamic banks are limited to
areas which are permitted by the Syariah. The fact has been expressed by Haqiqi
and Pomeranz in one of their articles: 57
"Pursuant to the principles of Syariah, Islamic banks do not grant loans bearing interest, and do not hold any investment instruments
with fixed income, such as bonds, convertible bonds, and preferred stocks. On the other hand, there are joint ventures, cooperation,
56 The market research is titled "Introducing Islamic Compliant Financial Products-A Guide to Capitalising on Potential Opportunities". It was written by Michael Gassner, a leading consultant in Islamic finance based in Germany. 57 Available on: http: //islamic-finance. net/islamig-ethics/article-12/articlel2-4. htmi
244

sharing and other agreements between the depositors and the banks,
and the borrowers and the banks. " Available on: http: //islamic-finance. net/islamic-ethics/article-I2/articleI2-4. htmI.
Retrieved 18th July 2005
Iqbal (1997) in his study on the subject of an Islamic financial system discusses
the principles of Islamic banking. In order to understand more about how an Islamic financial system is different from its conventional counterpart, we
reproduced his work in Table 7.5:
Tahle 75: Principles of an Islamic Financial System
Islamic Principles Explanation Prohibition of interest Prohibition of riba, a term literally meaning "an
excess" and Interpreted as "any unjustiflable increase of capital whether In loans or sales" is the central tenet of the system. More precisely, any positive, fixed, predetermined rate tied to the maturity and the amount of principal (i. e., guaranteed regardless of the performance of the investment) Is considered riba'and Is prohibited. The general consensus among Islamic scholars Is that riba'covers not only usury but also the charging of "Interest" as widely practiced.
Risk-sharing Because Interest Is prohibited, suppliers of funds become investors Instead of creditors. The provider of financial capital and the entrepreneur share business risks In return for shares of the profits.
Money as "potential" capital Money Is treated as "potential" capital, that Is, it becomes actual capital only when It joins hands with other resources to undertake a productive activity. Islam recognizes the time value of money, but only when It acts as capital, not when It Is "potential" capital.
-- Prohibition of speculative An Islamic financial system discourages hoarding behaviour and prohibits transactions featuring extreme
uncertainties, gambling, and risks. Sanctity of contracts Islam upholds contractual obligations and the
disclosure of Information as a sacred duty. This feature Is Intended to reduce the risk of asy metric Information and moral hazard
Shariah-approved activities only those business activities that do not violate the rules of Syarlah qualify for Investment. For example, any Investment In businesses dealing with alcohol, gambling, and casinos would be prohibited.
Source: Adapted from Zamir lqbal (1997), "Islamic Financial Systems", Finance and Development, June 1997. Available online httl2: twww. imf orgLexternal/t)ubs/ft/fandd/I 997/O6ý/Vdf/iqbal. l2d Retrieved on 13th August 2006
245

In Malaysia, Islamic banking and finance were formally launched by the first
operation of the Islamic bank, Bank Islam Malaysia Berhad (BIMB) in 1984.
Inspired by the successful operation of the first Islamic bank, there are now three
Islamic banks in operation in Malaysia; BIMB, Bank Muamalat and RHB Islamic
Bank. On top of this, almost all conventional banks offer an "Interest- Free
Banking Scheme" via their Islamic window system. The system had been
introduced by the Central Bank of Malaysia, in 1993 to encourage the
development of Islamic banks. The introduction of the scheme multiplied the
performance and the amount of deposits that are Islamic-compliant. Table 7.6
summarises amounts and percentage changes of deposits held by Islamic banks
and other financial institutions in the year 2004 and the year 2005.
Table 7.6. Islamic Banking System- Deposits by Type and Institution Deposits and institutions AnnualChange As at end
2004 2003 2 004
RM (Million ) 0/0 RM (Million) 0/0 RM (Million) Demand deposits 1,796 19.6 1,937 17.6 12,917 Islamic banks 693 20.1 435 10.5 4,578 commercial banks 1,103 19.2 1,502 22.0 8,339
Savings deposits 1,442 26.6 1,566 22.8 8,432 Islamic banks 190 10.8 350 17.9 2,302 commercial banks 1,145 37.8 1,596 38.2 5,771 Finance companies 107 16.9 -380 -51.4 359
Investment deposits -741 -2.1 6,769 19.2 41,996 Islamic banks 93 0.8 1,736 15.5 12,919 Commercial banks 2,351 -18.7 8,923 87.2 19,150 Finance companies 614 7.3 -5,159 -57.2 3,860 Merchant banks 213 S6.5 714 121.0 1,304 Discount houses 690 19.6 555 13.2 4,763
other deposits 4,410 161.6 2,375 33.3 9,514 Islamic banks 187 157.1 651 212.7 957 Commercial banks 3,148 147.6 1,234 23.4 6,515 Finance companies 1,150 2,017. 5 526 43.6 1,733 Merchant banks -46 -15.0 -38 -14.6 233 Discount houses -29 -25.7 2 2.4 86
Total deposits 6,906 13.0 12,647 21.0 72,859 Islamic banks 1,163 7.1 3,172 18.0 20,756 Commercial banks 3,043 13.0 13,255 50.0 39,775 Finance companies 1,871 20.6 -5,013 -45.7 5,952 Merchant banks 168 24.6 676 79.3 1,527 Discount houses 661 18.2 557 13.0 4,849
Source: Bank Negara Malaysia Annual Report 2004, at httv: h=1 16&r)z--350&ac=1. Retrieved 25h June 2006
246

Although Islamic banking services have been introduced for quite some time,
Haron et. al. (1994), established that only 63% of Muslim and non-Muslim
respondents in two states of Malaysia had either partly or fully understood the
concept of Islamic banking. 39% of respondents stated that they had chosen Islamic banks purely due to their religious belief. The same phenomenon had also been found in Singapore. Only 26% of Singaporean respondents stated that they hold Islamic financial products solely due to religious faith, (Gerrard and Cunningham, 1997). These findings may lead to two arguments. The low
percentage of clients who stated that they held products of Islamic banks due to
religious reasons may suggest a lack of educational measures to educate
customers in Islamic banking concepts. On the other hand, this phenomenon could
also suggest that these customers are banking with Islamic banks for plenty of
other positive reasons such as diversity of products, greater availability of outlets
and good service. Customers do not need to be Islamic financially literate before
they may decide to use the service of Islamic banks.
According to our analysis, no significant difference exists between Islamic and
conventional savings balances. In other words, depositors are indifferent to the
types of saving accounts that they have. They do not choose Islamic and
conventional avenues of saving to be different. This result is surprising as Islamic
banking services are currently available to almost all domestic and international
conventional banking outlets. This means it is easy to open and maintain interest-
free savings accounts as they are available everywhere. With such development,
householders may be expected to hold more Islamic saving accounts than
conventional saving accounts. The results partly explain the findings of Haron et
al. (1994) that the cause is the low understanding of depositors on the operation of
Islamic banks and interest-free deposits. However, since the main purpose of
saving and investing is to earn a high return and minimise the level of risks, householders are still of the opinion that putting their savings in conventional institutions is more rewarding. The big banks in Malaysia are the conventional
banks (although many have interest-free products). As most people think that "big
is beautiful", they are placing greater trust in the big established banking and
247

financial institutions. Householders, in general, also place great confidence in
foreign banks due to their stability following their superior financial organisation
and performance over a long period of years.
For the demand of unit trusts, there is a significant difference between Islamic and
conventional financial asset holding. From the amount of demand for unit trusts,
the demand for conventional unit trusts is higher by 0.263 units. This is evidenced by the small holdings of Islamic unit trusts compared to the total value of unit trust investments in Malaysia. Although the share of Islamic unit trusts to the total
net assets (NAV) increased from 6.8% to 7.7% from the year 2003 to 2004, the holdings are significantly small at 6.8%. Other information about Islamic unit trusts can be observed in Table 7.7.
Table 7 7. - Syariah-based Unit Trust Funds 2004 2003
Number of management companies 28 27 Number of approved funds 71 55 Total approved fund size (billion units) 38.00 24.90 Units In circulation (billion units) 13.16 8.59 Number of accounts 427,000 346,152 NAV of funds (RIVI billion) 6.76 4.75 O/o of NAV to total Industry 7.7 6.8 Source: Islamic Capital Market Review 2004. Available online: http: //www. sc. com. my/enpJhtmi/resources/annual/ar2OO4-enW pdf/pt2 icm. Vd Retrieved on 18th May 2006
Another possible reason why the demand for conventional unit trusts is higher
than Islamic unit trusts is due to the greater maturity of conventional unit trusts as
compared to Islamic unit trusts which had only been introduced by the launch of Arab Malaysia Tabung Ittikal Trust Fund in 1993. In contrast, conventional unit trusts had been launched in Malaysia by the introduction of Amanah Saham
Nasional in April 1981. Furthermore, conventional unit trusts have more complex
and better channels of selling with more agents and outlets. For example, Pcrmodalan Nasional Berhad has its own offices in every state in Malaysia. In
addition, their products may be bought and sold in major banks and all post
offlces in Malaysia. Moreover diverse distribution undoubtedly enhances the
value of unit trusts sold by the provider. Our results indicate that conventional unit trusts are more popular than Islamic unit trusts notwithstanding the rapid
248

development of Islamic unit trusts during the last few years. Table 7.8 provides
the list of Islamic unit trust ftinds that have been approved by Syariah Advisory
Council as at 15th October 2004.
Tahle 7 8: List of Islamic Unit Trust Funds (Launch as at 15 October 2004) Name of Management Company Name of Fund
Government 1. Amanah Saham Kedah Berhad Amanah Saham
Kedah 2. ASM MARA Unit Trust Management 2. Dana AI-Alman Berhad 3. Dana Bestari
4. ASM Dana Mutiara (formerly known as Kumpulan Modal Bum1putera Yang Keempat)
3. PTB Unit Trust Berhad 5. Amanah Saham Darul Iman
4. Pelaburan Johor Berhad 6. Amanah Saham Anqkasa
Private 1. Avenue Unit Trust Management Berhad 1. Avenue
SyarlahEXTRA Fund 2. Amanah Saham
Wanita 2. Affin Trust Management Berhad 3. Dana Islamiah Affin 3. AmInvestment Services Berhad 4. AmIttikal Fund
5. AmBond Islam 6. AmAI-Amin 7. AmIslarnic Balanced 8. AmIslarnic Growth
4. Apex Investment Services Berhad 9. Apex Dana AI-Sofl formerly known as Apex Unit Trusts (formerly known as Berhad Apex Islamic
Income Fund) 10. Apex Dana AI-Faiz
(formerly known as Apex Islamic Balanced Fund
S. Asia Unit Trusts Berhad 11. AUTB Dana Bakti 12. AUTB Dana Bon
Amanah
249

Table 7.8: List of Islamic Unit Trust Funds (Launch as at 15 October 2004) (continued)
6. BIMB Unit Trust Management Berhad 13. Amanah Saharn Bank Islam Tabung Pertama
14. ASBI Dana Bon Islam
15. ASBI Dana Pendidikan
16. ASBI Dana Persaraan
7. SBB Mutual Berhad 17. SBB Mutual Dana Al-1hsan
18. SBB Mutual Dana Al-Mizan
19. SBB Mutual Dana Al-Ihsan2
20. SBB Mutual Dana Al-Azarn
21. SBB Mutual Fa-na Al-Hikmah
22 SBB Dana Al-Haflz 23. SBB Dana Al-Ikhlas 24. SBB Dana Al-Falz
8. Commerce Trust Berhad 25. Lifetime Dana Mubarak
26. Lifetime Dana Barakah
9. RHB Unit Trust Management Berhad 27. RHB Mudharabah Fund
28. RHB Islamic Bond Fund
29. RHB Islamic Growth Fund
10. HLG Unit Trust Management Berhad 30. HLG Dana Makmur 31. HLG Dana Maa'rof 32. HLG Dana Munir
11. Hwang-DBS Unit Trust Berhad 33. Hwang-DBS Dana Izd1har
34. Hwang-DBS Dana Fahim
12. Kenanga Unit Trust Management 35. KUT-Negara Equity Berhad Islamic Trust
250
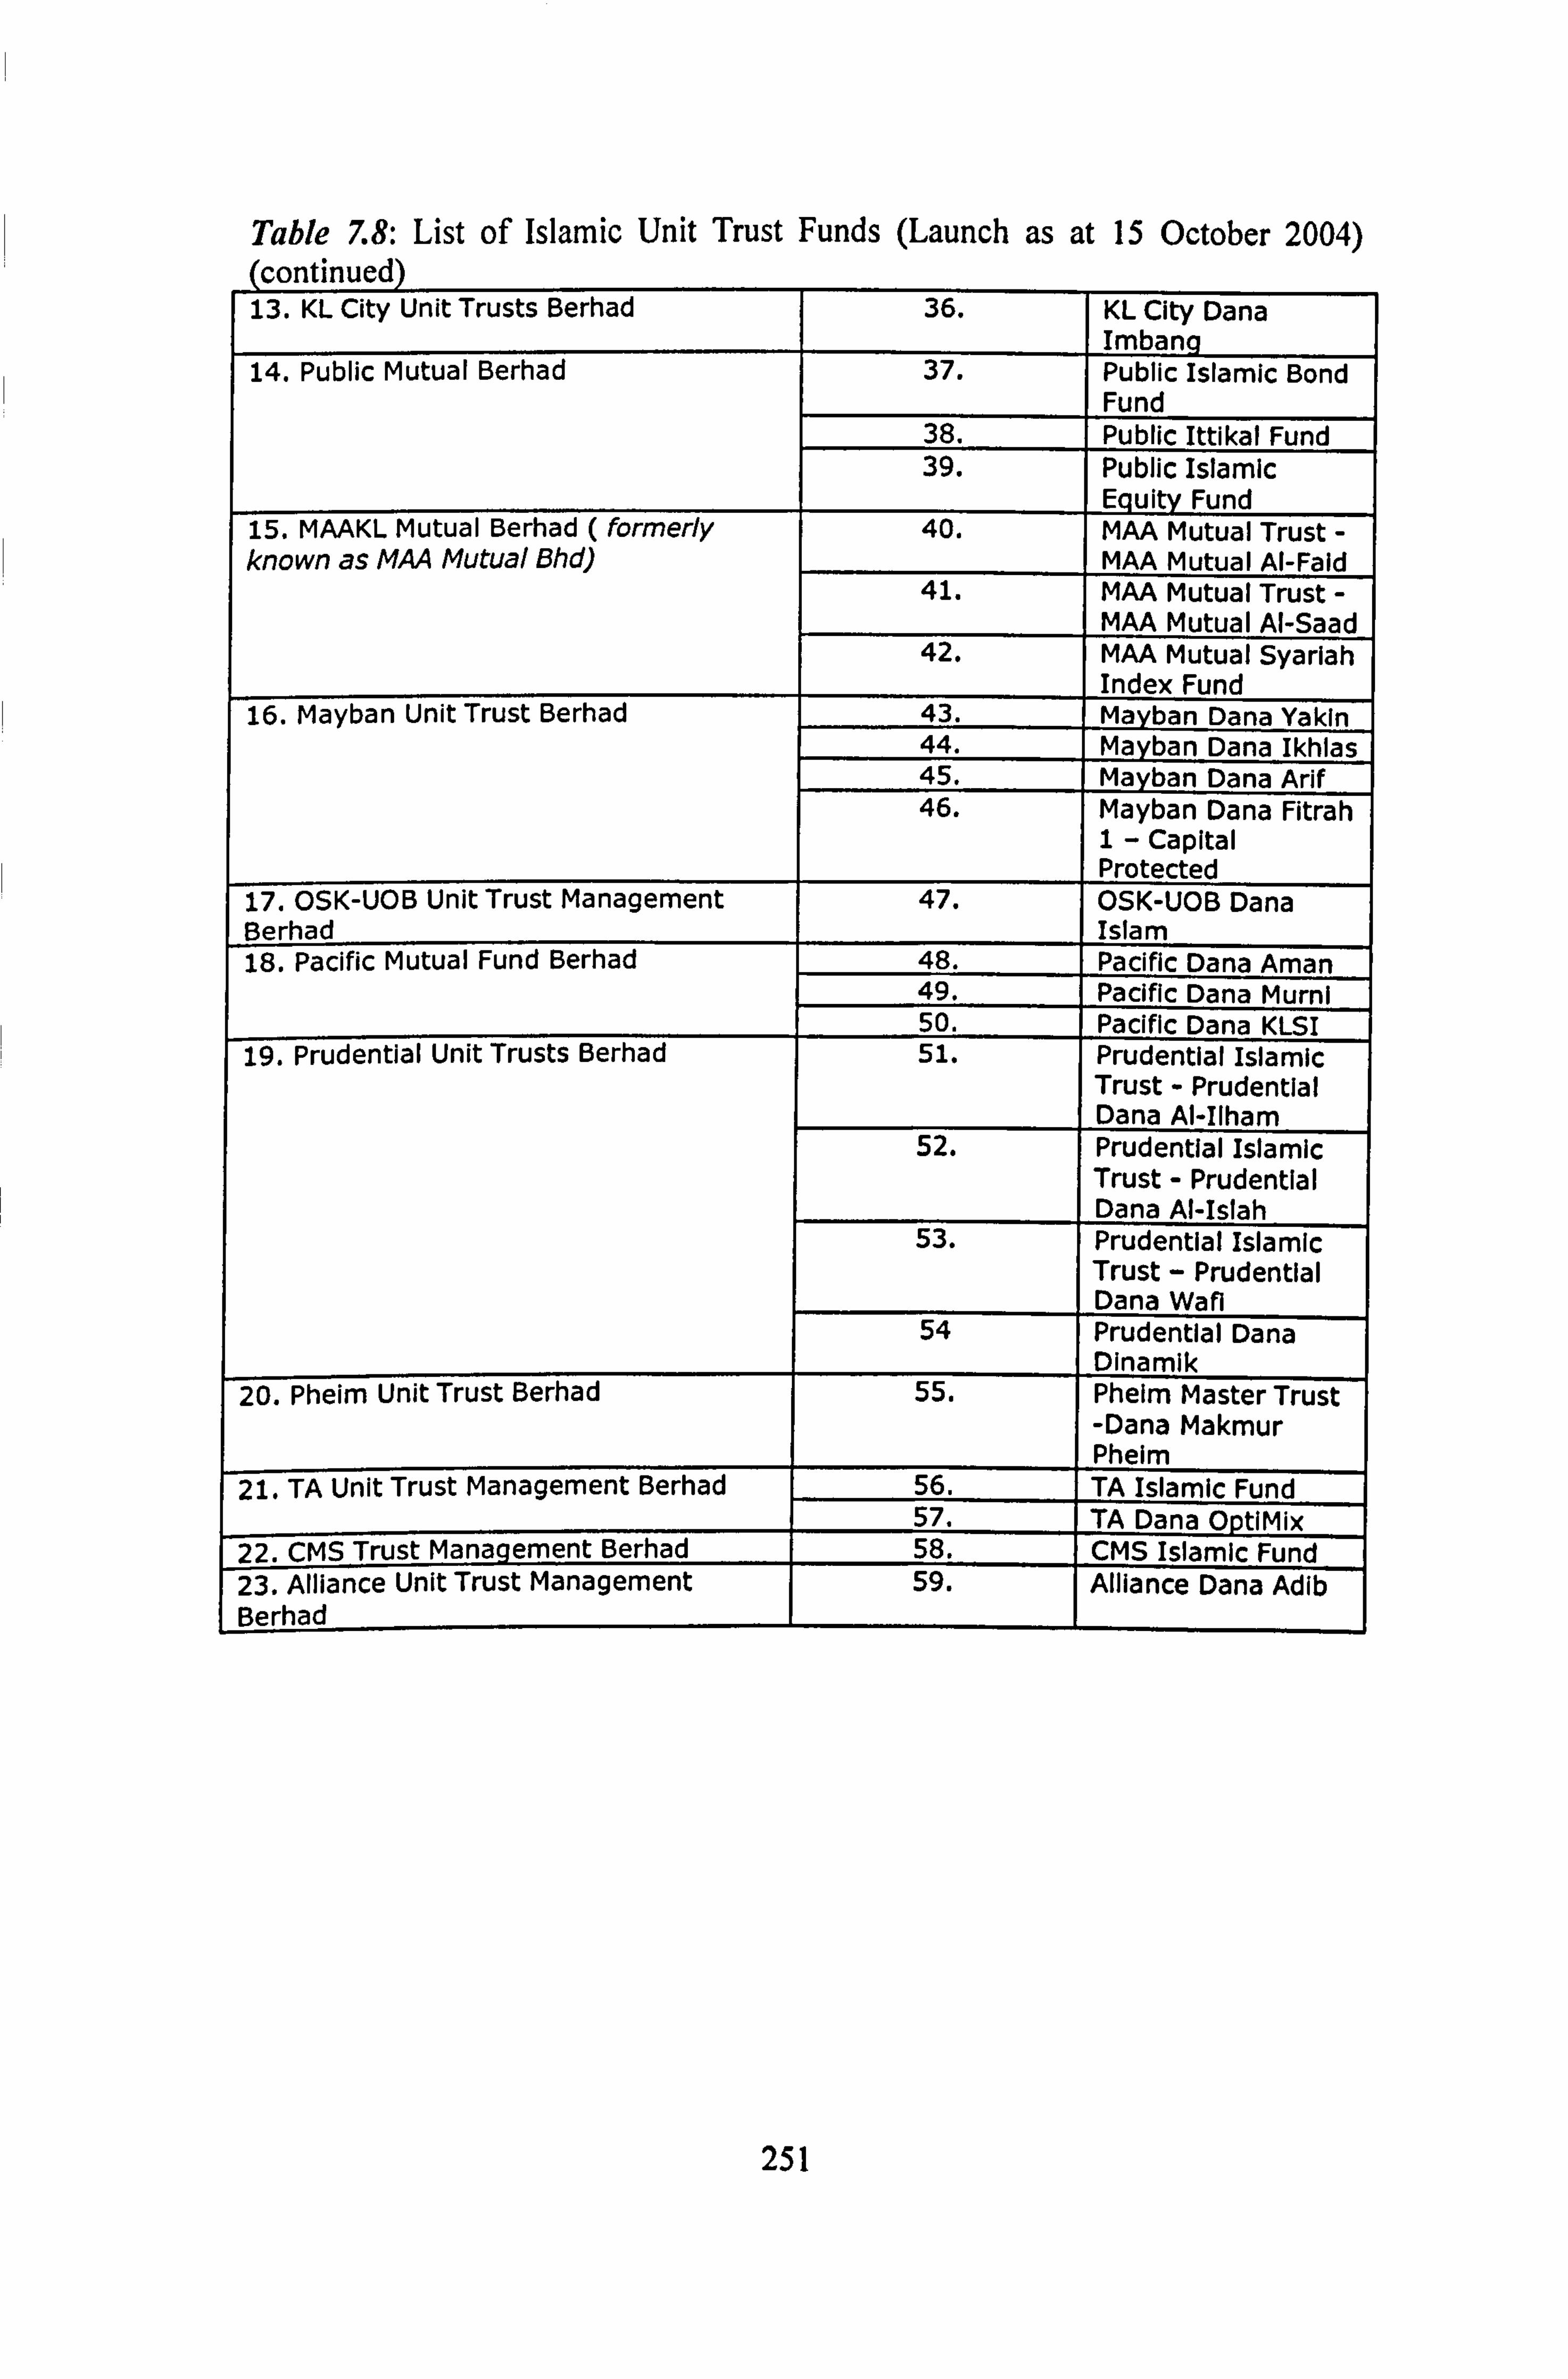
Table 7.8: List of Islamic Unit Trust Funds (Launch as at 15 October 2004) (continued) 13. KIL City Unit Trusts Berhad 36. KL City Dana
Imbanq 14. Public Mutual Berhad 37. Public Islamic Bond
Fund 38. Public Ittikal Fund 39. Public Islamic
Equity Fund 15. MAAKL Mutual Berhad ( formerly 40. MAA Mutual Trust - known as MAA Mutual Bhd) MAA Mutual AI-Fald
41. MAA Mutual Trust - MAA Mutual Al-Saad
42. MAA Mutual Syarlah Index Fund
16. Mayban Unit Trust Berhad 43. Mayban Dana Yakin 44. Mayban Dana Ikhlas 45. Mayban Dana Arif 46. Mayban Dana Fitrah
1- Capital Protected
17. OSK-UOB Unit Trust Management 47. OSK-UOB Dana Berhad Islam 18. Pacific Mutual Fund Berhad 48. Pacific Dana Aman
49. Pacific Dana Murni 50. Pacific Dana KLSI
19. Prudential Unit Trusts Berhad 51. Prudential Islamic Trust - Prudential Dana Al-Ilham
52. Prudential Islamic Trust - Prudential Dana Al-Islah
53. Prudential Islamic Trust - Prudential Dana Wafl
54 Prudential Dana Dinamik
20. Pheim Unit Trust Berhad 55. Phelm Master Trust -Dana Makmur Pheim
21. TA Unit Trust Management Berhad 56. TA Islamic Fund 57. TA Dana OptlMix
1 22. CMS Trust Management Berhad 58. CMS Islamic Fund 1 23. Alliance Unit Trust Management 59.
I Alliance Dana Adib
Berhad I
251

Table 7.8: List of Islamic Unit Trust Funds (Launch as at 15 October 2004) (continued)
24. ING Funds Bhd. 60. OneAnswer Investment Funds - ING Ekuitl Islam
61. OneAnswer Investment Funds - ING Bon Islam
Source: www. sc. com-mv under the heading of Islamic Capital Market and biannual SAC list booklet. Retrieved on 280'November 2006
On the other hand, the demand for conventional shares is lower than the demand
for shares that have been approved by the Syarlah Advisory Council (SAC) of Bursa Malaysia. The results are not surprising since 83% of the stocks listed on Bursa Malaysia in the year 2004 had been classified as Syariah-approved
securities by the Syariah Advisory Council (SAC). 58 From the year 2003, the
percentage of Islamic compliant shares to total shares traded on the Malaysian
stock exchange was actually high. The percentage rate was 81% for both in 2003
and 2004
The percentage of Islamic compliant shares for previous years is actually
promising. The growth of Islamic compliant shares in Bursa Malaysia can clearly be seen in Diagram 7.1 (Chart 1; reproduced from the Report of the Islamic
Capital Market, 2004). As the majority of securities listed on Bursa Malaysia are
Islamic compliant, it increases further the development of the Islamic capital
market at the national level. Greater choices of equity investment also provide
Muslims and non-Muslim investors with the benefit of diverting people from
investing in conventional shares. As part of the criteria for Syariah approval is for
companies to have a minimal debt ratio (less than one third), investors who prefer
low gearing investment may find investing in Islam ic-com pliant shares as more
attractive.
5' Report of Islamic Capital Market, 2004
252

Number of Syariah-approved Securities on Bursa Malaysia- Based
on Islamic Capital Market Report, Secuties Commission, 2004
1000 800 1: 1 Total Securities 600
U) 400 E Approved 4- 0
200 Securities 6 z0
CY) C-) Cy-) C) CD C: ) C) C) C: ) C) 0 Cz
< ---1 0
Diagram 7.1: Number of Syariah-approved Securities Listed on Bursa Malaysia Source: Islamic Capital Market Report, Securities Commission, 2004
7.2.8 Variah literacy
In the questionnaires, householders were asked to answer a series ot'clucstions oil
aspects of Siwritth literacy. They were asked whether they had many knowledge
of tile existence of Spiritih Advisory Board (SAC) aniong the financial
institutions in Malaysia and of' key persons on the boards. In addition, they, were
asked whether they knew about any of the major announcements made by the
council. They were also asked to rate their level 01' understanding I rom (I) (least
understand) to (5) (fully understand), about Islamic principles such as prohibition
of interest, gambling and uncertainties.
253

On analysis it was found that Syariah literacy had no effect on the demand for
financial assets except on the demand for saving accounts. The result may be
justifiable since Islamic was introduced more than 20 years since the first Islamic
bank was established. After 20 years of operations, it is reasonable to expect that
householders have already been able to grasp the concept of Islamic banking and
its principles. As for the other types of financial assets, the level of Syariah
literacy among householders was found not relevant to the volume of their
demand.
7.2.9 Financial Planning and Financial Exposure
Ameriks et aL (2002), in their study revealed a strong relationship between
financial planning and wealth accumulation. Their survey data suggest that
individuals with a low propensity to plan are unable to monitor their spending and
likely not to be able to accumulate wealth. Due to the significant relationship
between the propensity to plan and wealth accumulation, their study calls for
policy makers to initiate savings- push educational programmes to build planning
skills.
In this research, we examined whether financial planning activities made by
householders affect the level of financial assets included in our research. We
would like to know, for instance, if a householder plans his/her financial affairs
well, will there be an effect on the level of saving accounts' demand. Our analysis
shows that financial planning does not affect the level of demand for any financial
assets.
As for financial literacy, we are aimed to examine whether the level of financial
literacy affects the level of demand for financial assets. Although formal financial
education is yet to be introduced for Malaysian students, we wanted to investigate
whether there is a relationship between the level of financial literacy possessed by
householders and the level of their demand for financial assets. The earliest stage
when an individual is exposed to financial education is perhaps when they are at
254

the undergraduates studying accountancy, business administration and finance.
Students majoring in subjects not related to business and finance are left with no financial education until they enter the workplace. Indirect inclusion of financial
education in subjects such as mathematics and other subject in primary and
secondary school is also almost non-existent. Basic topics in financial education
may include budgeting, credit management, check book balancing and investment
principles. These topics have been taught in 29 states in the US from 1957
onwards (Bernheim el al. 1997).
The results obtained from our regression analysis reveal that there is no
relationship between the level of financial literacy and the demand for financial
assets. We suspect that if various investment institutions were to increase
educational initiatives, the level of demand for their investment products would
increase. As financial literacy education is vital for individuals to be able to be
informed consumers and manage their personal finance, efforts should be taken
through various programs made accessible to the public. Places where financial
education program may be conducted are in the high schools, colleges,
universities and workplace. For this reason, topic coverage and modes of delivery
have to be designed for maximum effects. Financial planning associations, then
may provide resources, expertise and supervision to help educate individuals in
financial matters.
Although the initiatives for financial education are still in their infancy, credit has
to be given to organisations and individuals who have committed themselves to
help educate the Malaysian public. Citibank, one of many foreign banks operating
in Malaysia, has launched a program on financial education targeting Malaysian
youngsters. In its press release dated May 18,2005, it was announced that
Citibank and Malaysian Invention and Design Society (MINDS) had launched the
first comic book on good money management among primary students. The comic
was titled "The Adventures of Agent Penny". 10,000 copies of the comic book, in
both English and Bahasa Malaysia were distributed to primary students over the
255

year. To reinforce the key learning of the comic book, Citibank commissioned a local professional theatre group, Stars by Write, to produce a short play that illustrates the importance of saving and budgeting. 59 The launch of the Adventures of Agent Penny program is the latest in a series of financial education initiatives that Citibank has introduced to Malaysia and the Asia Pacific region. It
also follows Citigroup's pledge to commit US$200 million (RM760 million) to financial education globally over the next 10 years. In addition to these initiatives
for children, Citibank has collaborated with INSEAD, a world's top tier business
school which had organised the Financial Education Summit 2005.
The focus of the summit was to advance financial literacy among youths and
adults in the Asia Pacific region. Over 250 participants from the government,
academic, non-profit and private sectors in Asia Pacific and around the world
participated in the summit. The one-and-a-half day event included high-level
discussion forums about the social and economic imperatives for improving
financial literacy levels in the region and ways for developing national financial
literacy frameworks. Experienced financial education advocates, educators and
practitioners also share in different training approaches and best practices to
engage adults and youth and increase their financial understanding and
confidence. 60
Other organisations promoting financial education include Bank Negara Malaysia
(BNM) and Permodalan Nasional Berhad (PNB)- Initiatives taken by BNM
include establishing "Bank Negara Malaysia Link". This link provides information, advice and services for the public on Bank Negara and other financial issues. Services and objectives of BNM link have been laid out on its
website as follows:
" Information on the programmes is available at: www. kidswealthfoundation. oriz. Retrieved on July 2006 60 httV. //%vmv. gifip-roul2. com/citizroup/press/2005/051122a. htm. Retrieved on 24th December 2005
256
"Bank Negara Malaysia LINK represents one of Bank Negara
Malaysia's important points of contact with the general public. Bank
Negara Malaysia LINK acts as a centralised point of contact to
facilitate a rapid and effective response for members of the public
and small and medium enterprises (SMEs) in matters related to the
financial sector. Bank Negara Malaysia LINK through its
exhibitions, self-service kiosks and booklets also provides consumer financial education as well as awareness on the role of Bank Negara
Malaysia in nation-building to the public.
Bank Negara Malaysia LINK provides face-to-face customer service
to walk-in visitors on general enquiries and public complaints.
Personnel of Bank Negara Malaysia LINK are available to assist and
effectively address and attend to matters in the areas of banking,
insurance, SMEs financing, currency as well as other areas under the
preview of Bank Negara Malaysia.
Through its exhibitions, Bank Negara Malaysia LINK provides the
public with information on access to financing especially by the
SMEs as well as information on conventional and Islamic banking
and insurance and takaful. Information on the role and
responsibilities of members of the public as consumers of financial
products and services are also provided. A section of the exhibition
area focuses on the role and functions of Bank Negara Malaysia and its historical contribution in shaping the country's economy and financial sector from the 1950s to date. "
Source: httl2: //www. bnm. gov. my/bnmlink/index. htm. Retrieved 24th December
2006
257

The introduction of Bank Negara Malaysia Link is more conceptual than practical,
with fewer prospects for actual involvement by the general public. However, the initiative was made by BNM to publish the two books on financial planning, "Buku Wang Saku" (Pocket Money Book) and "Buku Perancangan dan Penyata
Kewangan Keluarga" (Family Financial Statement Book) for the year 2006. 61 Introduced in 1999, the books are now in their eighth series. These publications are part of Bank Negara Malaysia's on-going effort to enhance public awareness
on the importance of managing personal finances and financial planning. BWS is
designed specially for students and the 2006 edition carries the theme "Financial
education as a foundation for financial planning". To date, in collaboration with the commercial banks under the School Adoption Programme, a total of 4.5
million copies of BWS has been distributed to the students of more than 7,000
schools all over Malaysia. BWS 2006 has two versions, one for secondary school
students and one for primary school students. The BWS for secondary school
students focuses on learning of accounting and financial education while BWS for
primary school students emphasises on the use of the BWS as a tool to manage
pocket money.
The BPPKK or Household Planning and Account Book 2006 is designed to assist families to manage their budget and plan their household income, expenses,
savings and investments. The book includes a section that features the concept of "Life and Financial Planning" for a family. BPPKK has also been distributed
through selected distribution channels such as selected book stores and Kedai Pos
2020 since 1999 to reach adult Malaysians, in particular, women and workers. The objective is to provide greater knowledge and awareness in financial planning
and budgeting. These books are available in commercial banks and Kedai Pos
2020 (Post office shop outlet) and selected bookstores.
61 Information on the programme available at: http: //www. duitSaku-com/. Retrieved on I 91h August 2006
258

In addition, Bank Negara Malaysia and the Association of Banks in Malaysia
(ABBM) have launched "Malaysia BankingInfo", a one-stop information centre
about money and banking. 62 The objective is to make Malaysians more aware of their rights and responsibilities with regard to banking products and services.
Permodalan Nasional Berhad (PNB), as the main unit trust provider in Malaysia,
has played its part in educating the public. One of its initiatives is the "Financial
Simulation" document which has been made available on its website 63 . The
simulation, notwithstanding its sophisticated headline, only deals with the amount
of savings households must provide in order to meet their children's educational
costs. The programme is a simplified approach to understanding financial
planning, which can be further enhanced in the future. As PNB is the one of the
major institutions involved with householders, it should be able to offer more than
the simple financial simulation currently available.
In addition, PN13 also organised "Minggu Amanah Saharn Malaysia" (MSAM)
(Unit trusts Week). According to PNB, the MSAM programme is a social effort to
educate the public on investment and encourage them to actively participate in the
country's unit trust industry. Until now, six MSAM programme have been
organised. On its website, PNB states that "MSAM is presented in a
comprehensive and creative manner combining exhibition and edutainment-based
activities. Besides learning more about PN13 and its investment-based activities,
visitors from all walks of life can take part in various education programmes
organised throughout the week-long MSAM. "
62 The information available at: htti): //www. bankinizinfo. com. my/. Retrieved on 29th November 2006
"I The financial simulation is available at: http: //wNv%v. 12nb. com-mv/index. cfm. Retrieved 30th November 2006
259

At present, many authors have written books on financial planning. Among them
are Rajen Devadason, Azizi Ali, Dr Rosli (Chef Li) and Hajah Rohani Datuk
Shahir. Mr Rajen Devadason is a practicing Certified Financial Planner, currently has written nine books. The title of his books includes "Your A-Z guide to the
Stock Market- And all YOU need to know about Capital Terrns" (1997),
"Financial Freedom-Your Guide to Lifetime Financial Planning" (1998) and "Financial Freedom 2- Through Malaysian Equities and Unit Trusts (2000).
Recently he has written motivational books related to financial management and investments in the form of e-books. 64
Mr Azizi Ali, is another Malaysian author writing motivational books related to
financial wellbeing. Among his books are "The Millionaire Chronicles". "How to
Become a Property Millionaire". "The Millionaire in Me", "Millionaires are from
a different planet" and several series written in the Malay language . 65 Another
author is Hajah Rohani, who wrote a Malay language book titled "Cukup Wang
Hati Tenang" (Enough money ensures adequate hearts). This book incorporates
the concept of Islamic financial planning. As the writer's company is one of the
education providers of Islamic financial planning, she applies her knowledge in
the book. Another author is Dr Rusly Abdullah who is better known as "Chef Li".
He wrote "Jutawan Senyap" (Silent Millionaire), a book which is also a financial
planning-motivation book.
64 To view Rajen Devadason's selection of books, visit: http: //www. raa'esncdlevacd, asotn. com/RD/books. a mmcomal_'#Doýkslaý-12. Retrieved 24th August 2006 65 His website is at: http: //www. millionairesplanet. com/
260

7.3 Conclusion
Our main research aim was to examine sets of factors affecting the levels of demand for financial assets namely unit trusts, shares and saving accounts. Three
sets of regressions have been performed on income, wealth and net wealth for
types of financial assets. Our analysis shows that all economic variables are
significant in determining the level of demand for financial assets. Moreover, a life-cycle effect prevails for all age categories of young, middle-aged and older householders in the demand for unit trusts. On the demand for shares and saving
accounts, a life-cycle effect exists between young and older households. Gender is
the only demographic variable that is significant in the demand for all financial
assets except in the regression on the demand for unit trusts. Marital status and
race do not affect the demand for financial assets. The level of education is
irrelevant for the demand for financial assets except partly in the demand for
shares. Sector of employment which householders belong partly explain the
variation in the demand for unit trusts and saving accounts. There are significant differences between Islamic and conventional financial assets for the demand for
unit trusts and shares, but not for the demand of saving accounts. Syariah literacy
only affects the demand for saving accounts but not the other two types of financial assets. Neither financial planning nor financial literacy affects the level
of demand for financial assets.
261

CHAPTER8
FINDINGS OF SEMI-STRUCTURED INTERVIEWS WITH CERTIFIED FINANCIAL PLANNERS
8.1 Introduction
The main aim of our research primarily concerns the factors driving the level of demand for unit trusts, shares and saving accounts. Factors tested in our analysis include demographic, economic and the socio-economic backgrounds of householders. In addition, householders' involvement with certified financial
planners, their level of financial literacy, Syariah literacy and their level of
propensity to plan their financial affairs are also tested for their role in
determining the level of demand for financial assets. We have performed a field
study on relevant householders of their demand for financial assets named above. A set of questionnaires was distributed to clients of the major provider of unit
trusts, Permodalan Nasional Berhad, clients of several stock broker companies
concerning the demand for shares and clients of various banking and saving institutions on the demand for saving accounts.
In short, we wanted to learn about the characteristics of householders who demand unit trusts, shares and savings accounts and be able to compare and
contrast whether households with different characteristics tend to demand more of
one type of financial asset than another. From the regression results, we have
learned that householders hiring the services of certified financial planners show a
greater demand for shares than those who do not. Apart from the demand of
shares, there is no significant relationship between the levels of demand for
financial assets and householders involvement in formal financial planning with
certified financial planners.
262

In addition to examining the level of demand for financial assets in isolation, we
set out to learn about the characteristics of householders who actively manage their financial portfolios via engagement with certified financial planners. By doing so, more precise information about the characteristics of householders who
actively manage their financial portfolios themselves can be obtained. By
collecting data using questionnaire with certified financial planners more insight
on the demographic and economic characteristics of householders as financial
planners' clients as well as their level of financial literacy, Syariah literacy and
propensity to plan, can be further studied. As financial planners are trained
professionals in the area of financial asset allocation and demand, their data and opinions are of a very credible nature.
Furthermore, by collecting data from certified financial planners, we may explore
more the current prospects of financial planning are a catalyst for increased
demand for the various types of financial assets. Financial planning, apart from
providing the platform for householders to plan their financial affairs, may be as
well a successful channel of distribution for various types of financial assets. The
Securities Commission in its current Capital Market MasterPlan (CMP) of 2001-
2010 has pointed to financial planning as a critical component of capital market development in Malaysia.
Under its objective, too, of promoting an effective investment management industry and a more conducive environment for investors, the plan states that:
"It is also important to continue educating retail investors of the investment
management opportunities available to them. Therefore, measures will be taken to facilitate the development of a domestic financial planning industry and to co-
ordinate a greater quantity and frequency of promotional and educational
programmes to increase awareness among investors of investment products and services"
Sourcc: httl2: //www, sc. com. my/engbtml/cmp/char)ter3. pdf. Retricved on 5th January
2007
263

Deputy Chief Executive of the Securities Commission, Datin Zarinah Anwar, at the 4th International Financial Planning Advisors conference 2004, addressed this fact in her keynote address for the conference:
"The opportunities for the financial planning industry are therefore significantly
enhanced, and will undoubtedly continue to grow, especially with the ageing of
the population, the increasing range of financial opportunities and the greater financial literacy of the investing community. The Securities Commission (SC)
sees the development of the financial planning industry as a critical component of
capital market development in Malaysia. " 4th International Financial Planning
Advisors Conference 2004,
Sunway Pyramid Convention Centre,
Petaling Jaya. Malaysia, 3 April 2004.
First, we questioned those financial planners on their background such as their
qualifications, number of years they had been in operation as well as on their age
and gender. On the question of their experience in financial planning we were keen to learn about the types of services they offered, methods of compensation
and the types of clients the dealt with. Most clients, we were told, were householders rather than companies. We asked about their clients' demographic
as well as their economic background. We were particularly interest to learn about
clients' annual income and net worth.
In order to learn more about the level of financial planning expertise of householders who had chosen to hire them we requested planners to rate their
clients' skills as "poor", "medium" or "excellent". The areas of financial planning
expertise that were rated concerned establishing financial goals, knowledge on basic characteristics of financial products, money management, investments,
264

retirement planning, tax, insurance and estate management. We also sought information on their clients' level of knowledge on Islamic financial planning.
In addition to the above issues, we also asked several questions on Islamic
financial planning such as the percentage of their clients engaging in Islamic
financial planning. We also asked the planners how they rated their own level of knowledge on Islamic financial planning and sought their opinion on the most
effective ways to promote Islamic financial planning
8.2 Findings Related to Financial Planners
All financial planners have the certified financial planning qualification (CFP)
awarded by the Financial Planning Association of Malaysia (FPAM). All of them
have to register with FPAM for them to be able to operate legally as financial
planners in Malaysia. In addition to that, Mr Poedjo Soesilotomo of ATA Capital
stated that he was now recognised as a Registered Financial Planner (RFP) by the
Institute of Advanced Financial Planner in Canada, as a Fellow Chartered
Financial Practitioner (FChFP) by the Insurance and Financial Practitioner's
Association of Singapore and Islamic Financial Planning Ceritificate (IFPC) by
FPAM. Mr Robert Foo, apart from having his CFP qualification, is also the holder
of a Master's degree in Business Studies. Karen Ng, on the other hand, is licensed
as a Chartered Financial Consultant (ChFC), a Chartered Life Underwriter (CLU),
a Life Underwriter Training Fellow (LUTCF) and a Registered Financial Planner
(RFP) apart from CFP.
The bar chart below shows the number of years financial planners had been in
practice. One financial planner has been operating for less than a year, three of
them for more than a year and three of them have the experience of being a
financial planner for more than 3 years.
265

Number of years as CFP 3.5
3.0
2.5
ZO
1.5
1( >'
C-)
a) & 0
0- 0.0 less than a year 1-2 years 3-5 years
Number of years as CFP
Diagram 8.1: NUrnber of Years Financial Planners Operate
In relation to age of' Financial planners, three of them are aged froin 36 to 40, one
person is aged 41 to 50 and tile remaining three of' financial planners are all aged in
more than 50. As financial planners are required to have Undergone rigorOLIS
aMOL111t of training, none of them is aged less than 36 years. As lor tile gender distribution, four out of the seven financial planners interviewed are men.
In addition questions about their practice background Nvcre also been asked. The
areas of coverage on financial planners' practice information are as follows:
I) Types of financial planning service offered. partial or comprehensive;
2) Provision of otlicr services apart from financial planning;
3) I"ypcs ofmajor clients;
4) NUmber of clients; and
5) Types and rate of fees
266

In relation to the types of financial planning offered, all seven financial planners
offer comprehensive financial planning. All of them deal with basic financial
planning, insurance and risk management, investment, retirement planning and
estate planning. As for tax management, only two of the seven provide the service by themselves and two of them provide tax planning through their associates. The
remaining three do not offer this type of service. One reason for this might be due
to the availability of tax advisors who offer more specialist skills in minimising the tax liabilities of their clients.
The group of seven were also asked whether they provide other services apart
from financial planning services such as accounting and other financial services.
All seven of financial planners offer financial services. By doing so, they are
acting as a financial services company providing insurance and insurance products
to their clients. Usually, financial planners will be compensated by commissions
from the provider of the financial products recommended and sold by them. One
financial planner provides both accounting and financial services. One financial
planner mentioned about that one service he provided which could be classified as 66
non-financial was will-writing and Hibah . He also dealt in trust creation and
mortgage restructuring. Another financial planner is offering the service of
personal effective mentoring. He delivers lectures and writes books on financial
planning and investing. 67 The remaining financial planners provide financial
services but not accounting services.
As for the types of major clients, six out of the seven financial planners stated that
individuals are their typical clients rather than institutions. They have as their
clients both individuals and corporate bodies, but individuals form the bulk of their client base. On the numbers of clients currently managed by financial
66 Hibah is one means to distribute one's assets in Islamic financial planning. Wealth involved in hibah may be transferred during the transferor's lifetime or in estate distribution of the deceased. 67 Rajen Devadason has written eight books featuring issues ranging from stock market guide, financial freedom and financial self help books. Information is available on http: //www. rajcndevadason. com/RD/books-asp.
267

planners, two of' them are currently managing II to 20 clients and one 41-50
clients. The other Iour planners are currently managing more than 50 clients. ]'he
information can be easily analysed in the bar chart below:
5
Numbers of clients currently managed
4
3
2
0- a) LL
11-20 41-50
Numbers of clients currently managed
Ditigram 8.2: Numbers of Clients Currently Managed by Financial I'lanncrs
Types of fees charged by financial planners are one of' tile controversial areas ill
the personal financial planning industry. Financial planners should act
independently while serving clients in a prollessional relationship. Independence
however, can easily be compromised in the case of' financial planners because, ill
addition to having a contract to serve their clients, they may also have entered
contracts with financial service providers to sell their products. Financial products
in this case range From various types of personal insurance products to unit trusts
products. As agents who are selling these products, they are entitled to receive
certain amount of commission. The econornic reward from such ilivolvclllcllt call
afTcct the prollessionalism of financial planners in recommending the bcst SOILItion
268

to their clients' financial objectives and situation. They might be attempted to sell financial products that offer them the highest amount of commission rather than
the products that best suit the financial objectives and position of the clients.
We asked the seven financial planners involved in our interview how they are
usually recompensed for their service. As far as the financial planners involved in
our interview were concerned, the majority of them charge fees for their services. Two of them stated that they charge commission on their advice more often than a
fee. Two of them charge a combination of both fees and commissions more often
than other types of compensation. Table 8.2 summarises the descriptive results for
the rate of hourly fees charged by the group. Most of them charge hourly fees of
RM 200 to RM 250. For one financial planner the question was not relevant due
to the fact that he/she used commission as his/her method of compensation.
Table 7.2: Rate of Hourly Fees Charged by Financial Planners
Frequency Percent
Less than RM 100 1 14.3 RM 151-200 2 28.6 RM 201-250 3 42.9 More than RM 250 0 0 Not Applicable 1 14.3
r -TOTAL 7 100
Source: Based on Author's Own Calculations
8.3 Findings Related to Financial Planners' Clients
Another series of questions was asked of the planners about their clients. The
questions relate to demographic and economic background, monthly saving rates
and levels of financial planning's skills.
Demographically, most financial planners (5 out of 7) reported that the age of
their typical clients is between 41-50 years old. Two financial planners stated that
269

the majority of their clients are of younger age being 31 to 40 years old. None of
them reported having as their clients, individuals under the age of 30 and over 50.
These findings are in line with our life-cycle hypothesis which states that
householders aged 31-50 tend to accumulate wealth, actively manage their assets
and acquire more financial assets than their younger and older counterparts. At a
young age of less than 30, householders are still in the saving process, do not
actively manage their financial affairs formally and use the services of financial
planners. At a matured age of more than 50, householders have established
themselves financially and are probably not looking for investment and risk
management, with which financial planners are usually associated. At a more
mature age, they should, by right, be more concerned with planning estate
management and will-writing. This is a view commonly shared by the Malaysian
public and thus it should come as no surprise to learn that none of our group of
seven reported as having as their typical clients people over the age of 50.
Table 8.3: Age of the Typical Client of Financial Planners
Freauency Percent Less than 30 year 0 14.3 31- 40 years 2 28.6 41-50 years 5 71.4 More than 50 years 0 0 TOTAL 7 100
Source: Based on Author's Uwn L; alcuiations
As financial planning is a service that requires a close professional-client
relationship, the gender of clients, according to our interview, is dictated by the
gender of the financial planners. As five of our financial planners interviewed are
men, we found that five financial planners report having males as their typical
clients. The remaining two financial planners, who are women, stated that their
typical clients are female individuals. As for the racial composition of the clients,
most of our financial planners reported that their typical clients are Malays. Two
of them reported that the majority of their clients are Chinese and only one stated
that his clients are Indian. Again, from the interview we found that the race of
270

clients dictated their choice of a financial planner from the same racial group. Thus we may suggest that familiarity, common backgrounds, gender and race are important factors for a client when choosing his financial planner.
In addition to the demographic background, we also asked questions about the financial position of our planner's clients, about their annual income, total net
worth and their monthly saving rates.
Most financial planners reported that their typical clients have an annual income
of RM 100,000 to RM 300,000, with a median of RM 200,000. The Gross
Domestic Product (GDP) of Malaysians is 9000 USD that is around RM 34,000.68
From the figure, we may deduce that the income of individuals hiring financial
planners is well above the income of the average Malaysian population. The bar
chart in Diagram 8.3 below illustrates the annual income of the typical clients of
all seven financial planners involved in our interview.
68 From CIA World Factbook as at January 1,2005. Available on http: //www. indexmundi, com/g/r. aspx? c=my&v--67
271

annual income of typical client
>1 L) c
LL
Less than RM 50,000 RM 100,001- RM 300,0 RM 51,000- RM 100,00
annual income of typical client
Ditwram 8.3: Annual Income ofthe Typical Clients ot'llarticipating Financial
Planners
In addition, 5 out of the 7 financial planners stated that their typical clients' net
worth is between RM 100.000 and RM 300,000. One planner specifically stated that his/her clients typically are financially worth more than RM I million. Table
8.4 exhibits the entire descriptive results of' the net worth of' financlal planners'
typical client.
Table 8.4: Net Worth offinancial Planners' Typical Clicnts
Frequency Percent Less than RM 30,000 1 14.3 RM 30,001- RM 50,000 0 RM 100,001- RM 200,000 1 14.3 More than RM 200,000 5 71.4 fOTA L1 7 100
soul-cc: Bascd oil Author's Own Calculations
272

We also required our financial planners to answer a question on the percentage of income that their clients' are saving each month. The majority (4 out of 7) stated that most of their clients are saving from I I% to 20% of their monthly income.
Two of our planners stated that their clients are saving 21%-30% of their monthly
income. Only one financial planner mentioned that most of his/her clients are
saving more than 30% each month.
8.4 Clients' Financial Planning Expertise
The planners were asked to rate the ability of their typical client (the ability of
majority of their clients) on several aspects of financial planning. They were
asked to rate their clients as poor, medium or excellent for each of the financial
planning aspects.
We recorded that three of the seven planners stated that ma ority of their clients j
are have medium skills in evaluating their financial goals. Clients often need
assistance to establish and evaluate their financial goals. Two of the planners
stated that their clients' skills on the matter are poor. The remaining two stated
that, in their opinion their clients are able to evaluate their financial goals in
accordance with their current financial position.
The financial planners' assessment on the financial planning skills of their typical
client includes all areas involving financial planning. Apart from an evaluation Of
the financial goals discussed above, other skills involved are basic knowledge on
financial products, money management, investment, retirement, risk, tax and
estate planning. Overall results are shown in Table 8.5.
273

Table 8.5: Financial Planners' Evaluation on the Level of Financial Planning
Skills of Their Typical Clients Poor Medium Excellent Total
responses
Evaluating Financial Goals 2(28.6) 3(42.9) 2(28.6) 7
Basic Knowledge on
Financial Products
1(14.3) 5(71.4) 1(14.3) 7
Money Management 1(14.3) 6(85.7) 0 7
Investment 2(28.6) 4(57.1) 1(14.3) 7
Retirement Planning 5(71.4) 2(28.6) 0 7
Risk Management
(Insurance)
4(57.1) 2(28.6) 1(14.3) 7
Tax Planning 5(71.4) 2(28.6) 0 7
Estate Planning 7(100) 0 0 7
Note: Figures in brackets are in percentage. Source: Based on Author's Own Calculations
In addition, we requested the planners to provide their opinion on the financial
planning awareness among Malaysian householders in general. Below is a series
of their opinion (quoted directly from their responses in the written interviews):
"The awareness level is still very low amongst Malaysian households, especially
the Malays, as they are typically expectant of government aid and/or subsidy for
their future (children's education, government retirement benefit program). Non
Malays seem to be more prepared with a retirement fund and have at least basic
plans to ensure each child has education funding. "
"Tbe awareness is still low as the FP industry is also in its infancy stage. Given
time, I foresee that the average Malaysian would want to meet a financial planner
to discuss issues related to FP. However, I still believe that the Insurance, Unit
Trust and Will Writing Professional would be the ones making inroads in
274

promoting financial planning, as they are more sales/marketing oriented. The
Financial Planners from the accountants, remisiers, etc. would be slower in
promoting financial planning to the masses as they are known to be 'order takers'
unless they too become more aggressive in marketing their know-how. "
"Awareness is low but gradually improving due to promotion by FPAM and also
because of the support by Securities Commissions and Bank Negara Malaysia.
However, the wrong awareness is being created because of vested interests of the
product manufacturers (e. g. the Unit trust companies and Insurance companies)
who want financial planning to be a way for their tied agents to push more of their
products. Although financial products are part of what the financial planning
process is, the objectivity and independence of the financial planners is even more
crucial to ensure the public/clients get the best products for their personal
circumstances and will not be "pushed" products which in the long run is not to
their best interests. This is where the independence or unbiased advice of the
financial planner is crucial to ensure the public/client obtains real value from the
expertise and experience of the financial planner. Otherwise the financial planner
will be just a salesman pushing his companies products but with a glorified title. "
"Low level but it is increasing slowly. "
"Moderate, with a certain pocket of the population possessing a great deal of
knowledge"
"Still low"
275

"Awareness is still low. Many of them view personal financial planning as sales
of financial services / products; that they do not require financial planning and that the service should be given free. "
8.5 Islamic Financial Planning
Due to our concern to know more about Islamic financial planning, we asked
series of questions related to Islamic financial planning. First, we asked the
planners whether they provide the service of Islamic financial planning. We then
asked them to state the percentage of their clients who favour Islamic financial
planning in comparison to this content with traditional financial planning. Our
seven financial planners were also required to evaluate themselves on the level of their on knowledge on Islamic financial planning. At the same time, we also asked
them on their clients' level of knowledge on Islamic financial planning. Finally,
they were also asked to give their opinion on the most effective ways to promote Islamic financial planning.
Six out of the seven financial planners stated that they do provide Islamic
financial planning for their clients. The percentage of their clients involved in
Islamic financial planning is reported in Table 8.6.
276

Tahle 8.6: Percentage of Financial Planners' Clients Involved in Islamic Financial
Planning
Frequency Percent
Less than 10% 2 28.6
31%-50% 1 14.3
More than 50% 3 42.9
None 1 14.3
Total 7 100.0
Source: Liasea on Autnor-s uwn Laicuiations
From the table, we can see that two financial planners have 10% of their clients
involved in Islamic financial planning. Most planners (3 out of 7) reported that the
proportion of their clients who are engaged in Islamic financial planning totals
more than 50% of client-base.
More critically, we wanted to discover the extent of our seven planners' own knowledge of Islamic financial planning. If more financial planners are equipped
with proper level of understanding, we can predict that Islamic financial planning
will be more successful in the future. Sufficient knowledge on this area will broaden the range of services which can be offered by financial planners. This
should encourage them to be more willing to promote Islamic financial planning
to the public. Table 8.7 surnmarises our findings.
Table 8.7. Financial Planners' Level of Understanding on Islamic Financial
Planning
Frequency Percentage (%)
Understand the basics of Islamic financial
planning
3 42.9
Well versed but not practice much of Islarnic Financial Planning
2 28.6
Well versed and practice Islamic Financial Planning much
2 28.6
Mtal 7 100.0
Source: Based on Autnor's L)wn LaiculaElons
277

In relation to the financial planners' understanding on Islamic financial planners,
three financial planners mentioned that they have basic knowledge of Islamic
financial planning, but not at current offer the services of Islamic financial
planning due to the lack of demand from their clients. They fully understood that
Muslim clients are not allowed to invest in activities related to alcohol, gambling
and pork. The same goes to dealing with conventional financial institutions such
as banks and insurance companies. They, however, stated that they did not update
themselves on the latest rulings passed by the Syariah Advisory Council. The
remaining two financial planners reported that they are well versed with the
practice of Islamic financial planning but do not practice much of it due to the
lack of clients wanting that particular service from them. They stated that they
updated themselves with latest rulings and understood that Muslim clients'
objectives are usually not only related to economic, but also to religious
considerations such as their objective to put their savings for pilgrimage and
towards furthering education in Islamic courses. The remaining two of them stated
that they are well versed with Islamic financial planning and provide the service
of Islamic financial planning to their clients. One financial planner in particular
mentioned about his active research on Islamic inheritance and estate planning
I (Faraid).
Finally, we asked our group of planners to offer their opinions on ways to
promote Islamic financial planning. Most of financial planners stated that direct
communication with clients is one of the best ways to promote Islamic financial
planning. One planner stated that mass media marketing can be exploited to
market Islamic financial planning. Other suggestions are education initiatives
through talks to the public on the opportunities and advantages attached to Islamic
financial planning and networking. More non-Muslims could also be encouraged
to participate in the promotion and marketing of Islamic compliant services and
products. Two financial planners highlighted on govemance and recognition of
Islamic financial planning opportunities by parties such as Bank Negara Malaysia
(BNM). The support of the Securities Commission (SEC) is also paramount in
278

encouraging more financial planners to become involved in Islamic financial
planning. Relevant regulators, as stated by one financial planner should introduce
Islamic Financial Planning Courses (IFPC) to CFPs making it a prerequisite for
financial planners who advise Muslim clients.
8.6 Conclusion
The data collection session with financial planners is useful in many ways. First
we had been able to learn more on the practice of financial planners in Malaysia,
for instance their qualifications, types of services offered and rates and method of
compensation. In addition, several aspects of financial planners clients are also
been discovered from the interview results. Clients of financial planners are
usually from the high end of income earners and having rather high total amount
of net wealth. As to the clients' level of financial planning knowledge, financial
planners stated that it is generally low and in need of more education in many
aspects. Finally, we had been provided with vital aspects on Islamic financial
planning such as financial planners' practice and knowledge on Islamic financial
planning. More importantly, we had been provided with practical suggestions on
how to promote and improve Islamic financial planning in Malaysia.
279

CHAPTER 9
CONCLUDING REMARKS, IMPLICATIONS AND RECOMMENDATIONS
9.1 Introduction
In this chapter, we summarise our results and relate them to the main findings of
the literature reviewed. We also state the extent to which we believe that the aims
and objectives of our research have been met. We will discuss the implications of
our findings on the publics' awareness and knowledge of Islamic financial
planning products, on the attitudes of financial planning policy makers and other institutions offering financial products and on the ensuing implications for
Malaysian householders. We will alternately discuss the implications in the light
of our findings in relation to the wealth accumulation and savings atmosphere in
Malaysia. The integration of such knowledge will assist relevant parties to make
more informed decisions on policies in general and investment and wealth
accumulation for householders in particular. As for academic interestý we will
provide suggestions for possible future research.
9.2 Summary of Findings
This research mainly considers the factors that affect the wealth accumulation of households via the acquisition of financial assets. The framework of the research is based on the life-cycle effect on this accumulation process. Wealth
accumulation, inspired by life-cycle motives is based on the practice of individuals to maximise their consumption lifetime utility rather than at a specific
time period. Due to lifetime maximisation, a rational consumer will consume at a
stable rate that corresponds to their expected average consumption over their life-
cycle. They will try to smooth their consumption and wealth accumulation process
over time to attain wealth considered appropriate for their retirement. This
hypothesis is also known as savings and wealth accumulation for retirement
280

purposes. Works on this hypothesis is often based on the works of Duesenberry
(1949), Modigliani and Brumberg (1954) and Tobin (1967). According to them,
the propensity to consume and the propensity to save are different at various stages of an individuals' life. In order to satisfy their need for funds during
retirement, householders need to maximise their savings and wealth accumulation during their midlife cycle since they are not able to do so when they are younger due to their limited income and lack of experiences in the wealth accumulation
process. This research is aimed at examining whether this hypothesis is valid for
the three most commonly held financial assets in Malaysia namely unit trusts,
shares and saving accounts.
This research is not only a novel approach on the examination of the life-cycle
effect in Malaysia, but also includes factors that concern Islamic financial assets
such as household preferences for conventional and Islamic financial assets, Syariah literacy and aspects of financial planning in addition to the "benchmark"
examination of factors such as income, the demographic and socio-demographic
backgrounds of households and the risk-taking behaviour of householders. By
considering this latter set of factors, much more can be learned about estimations
of the demand for financial assets in Malaysia. The inclusion of such factors is
relevant since Malaysian households have been significantly exposed to Islamic
financial products in addition to conventional products that are also available in
the west.
Based on the data, we can generalise that the life-cycle effect can be found in the
level of demand for unit trusts by all age groups; i. e. young, middle-aged and
mature age groups. It is also clear that householders aged more than 50
significantly hold more unit trusts than those aged between 30 and 50. On the demand for shares and saving accounts, a life-cycle effect exists between the
middle aged and older householders, with the older householders holding more of these assets. Although our results also reveal a life-cycle pattern in the demand for
financial assets, the stage of the life-cycle where the demand for financial assets
peak is inconsistent with the results from previous studies conducted. Studies
281

conducted in the US (Amerkis and Zeldes; 2001) and in European countries as
reported by Guiso, Haliassos and Jappeli (2001) suggest that a life-cycle pattern
exists in the level of demand for shares: minimal when young, peaking in the
fifties and declining afterwards. In our case, the demand for unit trusts, shares and
saving accounts is higher for householders aged more than 50 than for
householders aged 30 to 50. Our results suggest that householders in Malaysia
accumulate financial wealth later in their lives.
Apart from testing for the existence of a life-cycle effect on the demand for
financial assets, all economic variables such as income, wealth and net wealth are
all significant in the determination of the level of demand for all the types of
financial assets under question. However, income, wealth and net wealth
elasticities affect unit trusts, shares and saving account balances differently. For
example, when we look at the goodness of the regression model as the whole
(deduced from the observation on R-Squared value), we can see that wealth and
net wealth elasticities of demand are more important than those of income
elasticities of demand for unit trusts and shares. In contrast, all three types of
economic variables affect, almost in the same way, to saving account balances of
householders. From our findings, we can suggest that stocks of wealth are more
appropriate in determining the level of demand for unit trusts and shares but that
the flow of both income and stocks of wealth are equally important in estimating
the level of saving account balances.
Other dimensions added in the multiple regression analysis concern the level of
demand for financial assets are the demographic and socio-demographic effects.
Researches on the level of demand for financial assets such as that by Jan Tin
(1998,2000), Poterba and Sarnwick (1997), Hall and Mishkin (1982), Zeldes
(1989) and Lusardi (1996) and Dar (2005) consider that demographic and socio.
demographic factors important in studying the level of demand for financial assets
and investment. We include several of these factors in our research.
282

From the many variables tested, the gender of the respondents is the only demographic variable that is significant in the demand for all financial assets (except in the regression for the demand of unit trusts). Marital status and race does not affect the demand for any types of financial assets. Levels of education
are irrelevant for the demand for financial assets except partly in the demand for
shares. This is probably because, in Malaysia, householders' earning power does
not correlate with their education levels due to the uncertainty of job market. The
sector of employment to which householders belong partly explains the variation in the demand for unit trusts and saving accounts.
More importantly, our research adds other important variables that we perceive to
affect the level of demand for financial assets in Malaysia. Variables measuring
the level of risk tolerance, certified financial planners' involvement, households'
preference for conventional and Islamic financial assets, Syariah literacy and
respondents' propensity to plan and their financial exposure have been tested
accordingly. To test for the effect of these factors, several hypotheses have been
established based on our research questions. Our regression analysis has
successfully answered the hypotheses posed in our research.
In the demand for unit trusts and shares, but not for the demand of saving
accounts, there are significant differences between attitudes on the preferences for
Islamic and conventional financial assets. Syariah literacy only affects the
demand for saving accounts but not for the other two types of financial assets. Neither financial planning nor financial exposure affects the level of demand for
any type of financial assets.
In all, the analysis performed has successfully answered all the research questions
with all hypotheses constructed tested. The main research objective of identifying
and analysing the sets of factors driving the variation of the demand for financial
assets has been achieved by way of multiple regression analysis.
283

In addition, we enriched the research by extending our examination on the demand for financial assets by surveying the financial planners who provide financial planning services to the Malaysian public. It has been a second aim of the research to examine the issue of financial planning and the financial literacy of Malaysian households. Particular emphasis has been given to the level of financial knowledge of individuals engaged in financial planning. Financial planners themselves have also been asked to rate their clients' level of financial literacy
such as their knowledge on financial products, risk management, tax and retirement planning. Other aspects of financial planning such as financial
planners' practice information such as their qualifications, types of services offered and the amount of fees charged comprised other information we gathered. This has enabled us formally to survey financial planning practices in Malaysia. We think this valuable because such research in financial planning is currently lacking.
In relation to financial planners' client financial planning skills, the survey with
seven financial planners revealed that 3 out of our 7 financial planners stated that
majority of their clients have medium skills when evaluating their financial goals. In general, a majority of our 7 financial planners think that their clients have
medium to excellent skills in basic knowledge about financial products, money
management and investment. On the other hand, most of them claim that their
clients have poor skills in retirement planning, risk management, tax planning and
estate planning. As households in general consider having decent resources for
retirement, more education is needed in order to avoid poverty during old-age. We
will, therefore offer recommendations on how to mitigate the problem of a lack of
understanding of these aspects of financial planning among households.
284

9.3 Implications of the findings
Implications of our research can be analysed in many aspects such as on knowledge, policy makers and service providers of financial assets. The research
can be made useful for better understanding on financial assets demand depending
on the successful dissemination of the research findings in journal publications, magazines and newspapers as well on the televisions and radios' programmes. Research collaboration between universities and practitioners will increase the likelihood of the researchers like ours to be consulted when they attempt to make business decisions. To increase the usefulness of our research, we will discuss the
research implications under headings as follows.
9.3.1 Implications for knowledge
The implications of our research on the effect of age on financial assets demand
are: 1) As financial assets are categorised into risky and safe (shares and unit
trusts are risky and saving accounts are not risky because they are guaranteed by
the government), the holdings of certain types of financial assets by certain types
of age group can affect the wealth level of households. If over-55 households hold
more risky assets, it implies that they are taking more risks than they need to and
will thus expose their retirement funds to various types of investment risk. Our
findings are that older households demand more unit trusts than younger households. One reason for this, highlighted by Iwaisako (2003) who found that
older households usually own their home and have nearly paid for it, so they are
more willing to take risks and diversify into more risky financial assets. Ile found
that equity shares in portfolios increases in line with households are, peaking in
the fifties age group, then becoming constant. This peak comes in a much later
stage of the life-cycle compared to US households as we have also found in our
research.
2) The trend for financial asset holding among certain age groups of households is
beneficial for the social security system in a country. As most defined
contribution plan allow participants to partly manage their funds, increasing risky
285

asset investment from the retirement funds of older households can be perceived
as worrying. But in the Malaysian system, EPF participants are allowed to invest a
small portion of their retirement fund in unit trusts which may not pose threat the
value of their retirement funds.
In addition to the examination of the life-cycle hypothesis, we aimed to contribute
to the body of knowledge by highlighting more aspects of financial assets demand
offered in other related research. This research is the first research to incorporate
Islamic financial assets in the examination of the life-cycle hypothesis in addition
to estimating the factors that affect the level of demand for financial assets. This
research took into account the reality of the Malaysian economy that operates
using the principles of Islamic finance and banking for more than 20 years since
its first inception of Islamic bank in Malaysia. In this respect we examined the
effect of households' preferences on the demand for conventional and Islamic
financial assets as well as households' levels of Syariah literacy. Driven by the
maturity of the operation is Islamic banking in Malaysia, our results show that
Syariah literacy is only significant in the demand for saving accounts but not for
unit trusts and shares. To capture the increasing popularity of financial planning in
Malaysia, we have included financial exposure variable and a dummy variable for
financial planners' participation in household demand. These two aspects are new
approaches in examining the level of demand for financial assets in Malaysia. It is
hoped that future research on the role of financial planners in household portfolio
allocation will be conducted in relation to examining wealth accumulation by
households.
286
z

9.3.2 Implications for financial institutions
As raised by lwaisako (2003), how firms raise funds for their business (the supply
structure of financial assets) is directly related to the way households allocate their funds (the demand structure of financial assets). Understanding the factors
affecting the demand for financial assets should educate firms on efficient ways to
raise their finances. Many service providers have their own research team or hire
the services of academic researchers to enlighten them on issues such as the ones
we have examined in our research. For example, research on the commercial demand for general takarful was conducted in the faculty of Finance and Banking,
Northern University of Malaysia in 2003 by Diara Md. Jadi, Norlida Abdul
Manab & Prof. Madya Dr. Yusnidah Ibrahim. 69 Professor Muhammad Bin
Muda'o, with the collaboration with PNB has also examined the penetration levels
of Amanah Saham Burniputra and Amanah Saham Nasional by PN13 unit trust
investments among Malays, the native people of Malaysia in early 1990s. In his
research, he found that Malays' participation in ASB and ASN, the earliest unit
trusts scheme offered by PNB were at their peak at the time of the research. From
the report, PNB moved forward to offer units such as Amanah Saham Wawasan
2020 (Vision 2020 unit trusts) and Amanah Saham Didik (Education unit trusts)
that are now on sale for all Malaysians, regardless of their race.
In addition to research performed in collaboration with the service providers as we have discussed, there is other academic research that can benefit financial
institutions. Some examples are on the patronage for selections of Islamic banks
by Erol and Elbdour (1989), Sudin, Ahmad and Planisek (1994) and on the
estimation of demand for Islamic financial services in the UK by Dar (2004). In
contrast to these researchers, we concentrate on factors that affect the demand for financial services while focusing on the life-cycle.
69httv: HfNvb. uum. edu. my/index. 12hp? option=com content&task=view&id=109<emid=2. Retrieved on 8 th January 2007 70 information obtained from the discussion with the researcher, which also the Dean to the Faculty of Economics and Muamalat, Universiti Sains Islam Malaysia.
287
L-"
In addition to contributing to the literature as well as disseminating knowledge to
the service providers, our research also contribute to the finance literature in
general by examining the demand for financial assets according to the life-cycle
hypothesis taking into account Islamic financial assets. It is time for research
teams close to conventional finance such as the life-cycle hypothesis area to
extend their research into the domain of Islamic compliant financial assets to
reflect more of the reality of investment in Islamic countries such as Malaysia and
other Middle Eastern countries.
In the pursuit of the implications of our findings, we will consider their effect on
policy makers and service providers.
9.3.3 Implications for Policy Makers
This research has been designed to understand and estimate the level of demand
for financial assets in Malaysia. The findings of this research are valuable not only for policy makers around the Asian region but for countries which have similar investment facilities and economic infrastructures such as the size of their capital
and financial markets. Researchers who would like to understand about Malaysian
financial system also can benefit from the findings of this research as how
Malaysian households allocate their portfolio directly affect the system.
As our research also examine Syariah implications on the demand for financial
assets such as Syariah literacy and preference for conventional and Islamic
financial assets, the results from our research can be made useful to policy makers
that operate in Islamic financial market. Planners who operate in an Islamic-
compliant climate can use our results to understand more of the market demand
for financial assets. Middle-Eastern countries economies are big and have definite
potential for the further development of Islamic financial assets and so research
that offers ways to understand these aspects more can be useful. If policy makers
in these countries can predict the demand for Islamic financial assets by observing
the factors examined in our analysis, it will help to raise finance in these countries
and thus increase the profile of Islamic financial centres such as Bahrain and
288

Dubai. Policy makers can also look further into learning more on how to regulate
the social pension services available in these countries and help to develop social
security services that still have many areas to be improved.
Bank Negara Malaysia (BNM) has to further educate the Malaysian public on
financial education as the findings of this research point to the fact that financial
education has so far failed to direct them to allocate their wealth efficiently. Financial exposures variable was found not be significant in the process of their
wealth allocation. More importantly, as pointed by the Hijrah unit trust
management7l, the lack of employer training on the aspect of wealth management
has resulted in a negative effect on the portfolio management of employees. This
motivates Hijrah Unit Trust Management to lobby the government for more
employees training scheme in workplaces in Malaysia.
As having decent resources for retirement is considered an important issue, more
education is needed in order to avoid poverty among old-aged households. it is
broadly agreed that more financial education is needed. Lack of education in this
aspect in the west, for example, in making decisions on home equity release to
provide for a stream of income for pensioners may have led some householders to
lose their homes. This is especially the case if householders have lived longer than
the projected period of their home equity release contract. With the release or
, lifetime' mortgages, interest does not have to be paid each month but is added to
the amount outstanding. The loan must be repaid after a homeowner dies or
moves into a care home. In the case of couples, it must be repaid after the death of
the surviving spouse or partner. Nevertheless, the longer a person lives, the higher
will be the bill.
Government also needs to look further on the threshold of funds which can be invested in unit trusts as the majority of households are not up to managing their
71 Hijrah Unit Trust management was the organiscr of a conference on financial planning attended by the author during the course of data collection. The director is one of the certified providers of financial planning course provided by PNB. The information on its lobbying of the government had been obtained during the course of interview with the director, Hajah Rohani Datuk Shahir.
289

funds on their own. If the government can provide some sort of help for
households to make informed decisions by way of employer-sponsored financial
advisors, households' quests for growing their retirement funds may be more
successful.
We also asked financial planners on ways to promote Islamic financial planning. As Islamic financial planning is close to the heart of Malaysians, the majority of
whom are Muslims, increased availability of Islamic financial planning assistance
could boost Malaysians' involvement in financial planning. The financial
planners' views on ways to market Islamic financial planning have to be taken
seriously.
9.4 Research Limitations and Suggestions for Future Research
We have considered only the demand for the most popular assets in accordance
with our initial observations, namely saving accounts, shares and unit trusts. Certainly, future research could also examine the demand for conventional bonds
and sukuk that are now taking their place in Malaysia. The demand for these types
of financial assets is worth examining due to their characteristics of providing a
steady income stream without having to take high risks. The current scenario in
Malaysia, however, is not encouraging as lamented by Ibrahim and Wong (2006)
that the holdings for bonds and sukuk are concentrated in the hands of the fund
manager of big insurance companies, unit trusts funds and employee provident funds. However, with increasing offer of sukuk by the government and private institutions in Malaysia, this situation may change in the near future.
As for the selection of the variables, we paid little attention to quantify the effect
of returns on investment from households' ownership of the respective financial
assets. From our experience with the early respondents participated in the data
collection, we leamt that it is unrealistic for us to ask respondents to give detailed
290
information on their investments as the process is lengthy and cumbersome. We
learrit that the complexity of that kind of questionnaires actually discourage
respondents to answer them. We also believe that the cost of obtaining the data
outweighed the benefit that the data would bring to our research. Our depth of
micro-data cannot match that used by Tin (1997,2000) and Iwaisako (2003).
They used government survey data that is high in quality but very expensive to
collect. In Malaysia, the kind of survey that involves households' financial data is
not yet performed. Naturally this limits the number of research studies that can
benefit from that kind of data.
Another concern of our research was the relatively small number of respondents
who answered our questionnaires, i. e. 258 out of 500 questionnaires distributed.
We were unable to increase the number of participants due to time and money
restrictions. Unlike other research that have enjoyed financial assistance in the
form of government grants and university funds, we have had to rely on the
minimal allowance provided by the government of Malaysia for doctoral students
writing their theses. The sampling of our data, however, was carefully designed to
capture the dynamics of the population it intended to generalise. By doing this we have been able to minimise the adverse effect of the low numbers of respondents.
In relation to the definition of wealth used in our research, we included owner-
occupied housing as one element of the variable. Such practice can be argued as less accurate as the ownership of such houses is for consumption and not for
investment purposes. This will result in the householders' wealth and net wealth levels that are available for savings and investment being inflated. Future
researchers in this area should take into consideration the effect of owner-
occupied housing on the demand for financial assets.
Future research that examines further on the Syariah literacy, financial literacy
and financial planning is also desirable since these aspects are a growing concern
for the Malaysian public and policy makers. As a country that is actively playing
the role of Islamic banking and finance hub in the region or indeed in the world,
such studies are critical for further development. The growing need for financial
291

planning due to the increased willingness of EPF participants to invest at their
own discretion also makes the call for measures to educate households all the
more important.
When using the regression analysis to predict the level of demand for financial
assets, we assumed that the predictor variables are all exogenous while they can be the either exogenous or endogenous variables. Future research that can distinguish among them is beneficial to further detailing the estimation of the
demand for financial assets. Causality tests that can ascertain the cause of the
demand for financial assets can also be researched in the future.
9.5 Conclusion
Our research has been conducted with the aim of distinguishing the factors
affecting the level of demand for financial assets in Malaysia and learning about
the industry of financial planning in Malaysia. Our research has successful in its
use of multiple regression analysis to test the hypotheses developed. Considerable
knowledge also had been learnt from the interviews with leading financial
planners in Malaysia.
292

Bibliography
Ahmad, N., and Haron, S. 2002, 'Perception of Malaysian corporate customers towards Islamic banking products and services', International Journal of Islamic Financial Services, vol. 3, no. 4.
Aizcorbe, A. M., Kennickell, A. 13, and Moore, K. B. 2003, 'Recent changes in US family finances: Evidence from the 1998 and 2001 survey of consumer finances', Federal Reserve Bulletin, January 2003.
Ali, 1.2003, Islamic Unit Trust in Malaysia. Paper presented in Islamic Wealth Creation Seminar, September 2003.
Ameoteng, K. A 2002, 'Do stock and home ownership influence U. S personal savings', Journal ofManagerial Finance, vol. 28, no. 4.
Ameriks, J., Caplin, A., and Leahy, J. 2002, 'Wealth accumulation and propensity to plan', NBER Working Paper, no. 8920.
Ameriks, J., and Zeldes, S. P. 2001, 'How do household portfolio shares vary with ageT, <http: //www. izsb. columbia. eýu/faculty/szeldes/research>.
Ando, A., and Modigliani, F. 1963, 'The "life-cycle" hypothesis of saving: Aggregate implications and tests', . 4merican Economic Review 53,
pp. 55-84.
Ando, A., and Kennickell, A. 1987, How much (or little) life cycle in their in micro data? The cases of the United States and Japan, in: Macroeconomics and Finance, Essays in Honour of France Modigliani, MIT Press.
Avery, R. B., and Kennickell, A. B. 1991, 'Household saving in the U. S., Review ofIncome and Wealth, vol. 37(4), pp. 409-432.
BAFIA (Banking and Financial Institutions Act 1989, Part VIII)
Bank Negara Annual Report, 2004
Banks, J. W., Blundell, R. W., and Smith, J. 2002, 'Wealth portfolios in the UK and the US. ', NBER WP, no. 9128.
Barber, B. M, and Odean, T. 2001, 'Boys will be boys: Gender, overconfidence, and common stock investment', Quarterly Journal of Economics, vol. 116(l), pp. 261-292.
Bamett, W. A. 1978, 'The user cost of money', Economic Letters, vol. 1, pp. 145-149.
293

Barnett, W. A., Douglas, F., and Apostolos, S. 1990, 'Consumer theory and the demand for money', Journal ofEconomic Literature, vol. XXX, pp. 2086- 2119.
Barnett, W. A. 1997, 'Which road leads to stable money demandT, Yhe Economic Journal, vol. 107, pp. 1171-1185.
Baumol, W. J. 1952, 'The transactions demand for cash: An inventory-theoretic approach', Quarterly Journal ofEconomics, vol. 66, p. 545-556.
Benartzi, Shlomo, and Thaler R. H. 2001, 'Na*fve diversification strategies in retirement savings plans', American Economic Review, vol. 91, pp. 79-98.
Bennet, A. 2005, 'UMNO: A threat to national prosperity', Malaysia Today, October 30.
Bernheim, B. D. 1988, 'Personal saving, information, and economic literacy: New directions for public policy. In Tax Policyfor Economic Growth in the 1990s. Washington, DC., American Council for Capital Formation, pp. 53-78.
Bernheim, B. D. 1994, the determinants and consequences offinancial illiteracy, Mimeo, Stanford University.
Bernheim, B. D., and Garret, D. M. 1996, 'The determinants and consequences of financial education in the workplace: Evidence from a survey of households', NBER WP, no. 5667.
Bertaut, C., and Starr-McCluer, M. 2000, 'Household portfolios in the United States, Federal Reserve Board of Governors, April.
Bertaut, C. 1998, 'Stockholding behaviour of US households: Evidence from 1983-1989 survey of consumer finances', Review of Economics and Statistics, vol. 80, pp. 263-275.
Black, Jr., Conrad, S. C., and Skipper, H. D. 2002, 'Issues in comprehensive personal financial planning', Financial Services Review, vol. 11, pp. 1-9.
Blume, M. E., and Friend, 1.1975, 'The asset structure of individual portfolios and some implications for utility functions', The Journal of Finance, vol. 30(2), pp. 585-603.
Bodie, Z. 1995, 'On the risk of stocks in the long run', Financial Analyst Journal, vol. 5 1, pp. 18-23.
Bodie, Z. 1992, 'Life cycle finance in theory and in practice, Boston University School ofManagement Working Paper, no. 2002-02.
294

Bodie, Z. 2003, 'Thoughts on Life cycle investing in theory and practice', Finance Analysts Journal, January/February Edition, pp. 15-19.
Bodie, Z., Merton, R. C., and Samuelson, W. F. 1992, 'Labour supply flexibility and portfolio choice in a life-cycle model', Journal ofEconomic Dynamics and Control, vol. 16, pp. 427-449.
Braunstein, S., and Welch, C. 2002, 'Financial literacy: An overview of practice, research and policy' ", Federal Reserve Bulletin, vol. 87, pp. 445.
Braunstein, S., and Welch, C. 2002, 'Financial literacy: An overview of practice, research and policy' ", Federal Reserve Bulletin, vol. 87, pp. 445.
Braunstein, S., and Welch, C. 2002, 'Financial literacy: An overview of practice, research and policy' ", Federal Reserve Bulletin, vol. 87, pp. 445.
Brueckner, J. K. 1997, 'Consumption and investment motives and the portfolio choices of homeowners', Journal of Real Estate Finance and Economics, vol. 15, no. 2, pp. 159-180.
Biorn, E. 1980, 'The consumption function and the life cycle hypothesis: An analysis of Norwegian household data', Scandinavian Journal of Economics, vol. 82(4), pp. 464- 480.
Bosworth, B., Burtless, G., Sabelhaus, J., Poterba, J. M., and Summers, L. H. 1991, 'The decline in saving: Evidence from household surveys', Brookings Papers on Economic Activity, vol. 199 1, no. 1, pp. 183-256.
Caballero, R. J. 1988, 'A non-life cycle model of wealth accumulation', Discussion Paper, no. 40 1, Colombia- Department of Economics.
Caballero, R. J. 1991, 'Earning uncertainty and aggregate wealth accumulation', The American Economic Review, vol. 8 1, no. 4, pp. 859-87 1.
Cagetti, M. 2003, 'Wealth accumulation over the life cycle and precautionary savings', Journal of Business and Economic Statistics, vol. 2 1, no. 3, pp. 339-353.
Canner, N., Mankiw, N. G. and Weil, D. W. 1997, 'An asset allocation puzzle', American Economic Review, vol. 87, no. 18, pp. 181-19 1.
Carroll, C. D., and Samwick, A. 1992, 'The nature and magnitude of precautionary wealth', WP No. 124, Board of Governors of the Federal Reserve System.
Coakes S. J., Steed, L. G. 2003, SPSS. - Analysis Without anguish Version 11.0for Windows, John Wiley and Sons Australia Ltd.
295

Cobb-Clark, D. A., and Hildebrand, V. 2002, 'The wealth and asset holdings of U. S. Bom and Foreign-Born Households: Evidence from SIPP data,, Discussion paper no. 674for the Institutefor the Study of Labour (M), Bonn, Germany.
Cohen, N. G. 1988, 'Basic research in personal financial planning: Needs and prospects', Working Paper, George Washington University.
Cohn, R. A., Wilbur, G., Lewellen, R. C. L., and Gary, G. S. 1975, 'Individual investor risk aversion and investment portfolio composition', Journal of Finance, vol. 30, no. 2, pp. 605-620.
Cuthbertson, K. 1997, 'Micro foundations and the demand for money', The Economic Journal, vol. 107, pp. 1186-120 1.
Dar H. A. 2004, 'Demand for Islamic Financial Services in the UK: Chasing a MirageT, Economic Research Paper, No 04-11, University of Loughborough. <http: //magpie. lboro. ac. uk/dspace/handle/2134/335>. Retrieved on 31 July 2006.
Bakar D. 2002, "Islamic Unit Trust", A paper presented in International Capital Market Investment Conference, Hilton Hotel, 27 June 2002, Kuala Lumpur, Malaysia.
David L. U. 1985, 'The activity approach to personal financial planning', Journal ofAccountancy, vol. 85, pp. 94-103.
Dicks-Mireaux X. L., King M. A. 1982, TOrtfOliO composition and pension wealth: An econometric study', National Bureau of Economic Research Working Paper, no. 903, Cambridge, MA,
Dielman, T. E 2000, Applied Regression Analysisfor Business and Economics, 3 rd Edition, Duxbury Thomson Leaming.
Donelan, J. G. 1993, 'Costs and benefits of personal financial planning accreditation', Journal ofPersonal Financial Planning, vol. 176, pp. 108- 112.
Duesenberry, J. S. 1949, Income, Saving and the Yheory of Consumer Behaviour, Cambridge Mass.
Duflo, E., and Saez, E. 2000, 'Participation and investment decisions in a retirement plan: The influence of colleagues' choices', NBER WP No. 7735.
296

Durlauf S. N, Handbook of Economic Growth, Vol. IA, North-Holland, Amsterdam, 865-934.
Edwards, R. D. 2002, 'Health risk and portfolio choice,, Working Paper University of California, Berkeley.
Elger, J. F. 2004, 'Personal financial planning as personal risk management', Journal ofFinancial Service Professionals, January, pp. 38-39.
Elmerick, S. A., Montalto, C. P., and Fox, J. J. 2002, 'Use of financial planners by U. S. households', Financial Services Review, vol. 11, pp. 217-23 1.
Emery, A. T., Gitman, L. J. 2003, 'The corporate market for personal financial planning services benefits', Financial Services Review vol. 12, pp. 1- 18.
Erol, C., and El-Bdour, R. 1989, 'Attitudes, behaviour and patronage factors of bank customers towards Islamic banks', International Journal o Bank !f Marketing, o. 6, pp. 31-37.
Feldstein, M. 1976, 'Personal taxation and portfolio composition: An econometric analysis', Econometrica, vol. 44, pp. 631-650.
Financial Planner Board of Standards (1999). First Annual CFP Practitioner Survey: Executive Summary of Findings.
Flavin, M., and Yamashita, T. 1998, 'Owner-occupied housing and the composition of the household portfolio over the life cycle', NBER WP. no. 6389.
Flavin, M., Yamashita, T. 2002, 'Owner-occupied housing and the composition of the household portfolio over the life cycle', American Economic Review, vol. 92, no. 1, pp. 345-362.
Foldes, L. 2000, 'Valuation and martingale properties of shadow prices: An exposition', Journal of Economic Dynamics and Control, vol. 24, no. I I. 12, pp. 1641-1701.
Fowler, E. 1984, Survey Research Methods. Beverly Hills, CA: Sage Publications.
Francesco Z. 2001, 'Personal saving and social security in Italy: Fresh evidence from a time-series analysis, Temi di discussione, no. 417, Bank of Italy.
Friedman, M. 1957, A Theory of the Consumption Function, Princeton University Press, Princeton.
Friedman, M. 1956, The quantity theory ofmoney: A restatement. In Studies in the Quantity Theory ofMoney, edited by Friedman, M. Chicago: Chicago University Press.
297

Fries, G., McCluer, M. S., and Sunden, A. E., 1998, 'The measurement of household wealth using survey data: An overview of the survey of consumer finances', Federal Reserve Board of Governors.
Garman, E. T., et al. 1999, 'Workplace financial education improves personal financial wellness, Financial Counselling and Planning, vol. 10, no. 1, pp. 79-88.
Gentile, G. 1998, 'Planners: The future is yours, Financial Planning, vol. 28, no. 5, pp. 134-138.
Geringer, S. A., Hampton, V. L., Kitt, K. A., and Achacoso, J. A. 1996, 'Ratios and benchmarks for measuring the financial well being of families and individuals', Financial Services Review, vol. 5, pp. 57-70.
Gerrard, P., and Cunningham, J. 13.1997, 'Islamic banking: A study in Singapore', International Journal ofBank Marketing, vol. 15, no. 6, pp. 204-16.
Goetzmann, W. N., Kumar A., 2001, 'Equity portfolio diversification', NBER WP, no. 8686.
Goh, C. T. 1994, Malaysia: Beyond Communal Politics. Pelanduk Publications. ISBN 967-978-475-4.
Gorman, W. M. 1953, 'Community preference fields', Econometrica, vol. 21, pp. 63-80.
Grossman, S. J., and Laroque, G., 1990, 'Asset pricing and optimal portfolio choice in the presence of illiquid durable consumption goods', Econometrica, vol. 5 8, pp. 25-5 1.
Guiso, L., Jappelli, T. and Terlizzese, D. 2001, 'Income risk, borrowing constraints, and portfolio choice', The American Economic Review, vol. 86, no. 1,158-172.
Hall, R. E. 1978, 'Stochastic implications of the life-cycle permanent income hypothesis: Theory and evidence', Journal ofPolitical Economy, vol. 86, no. 2, pp. 971-987.
Hall, R, E., and Mishkin, F. S. 1982, 'The sensitivity of consumption of transitory income: Estimates from panel data on households', Econometrica, vol. 50, pp. 462-481.
Hamburger, M. J. 1968, 'Household demand for financial assets, Econometrica, vol. 36, no. 1, pp. 97-118.
Hartley, R. 1990. 'Literacy -A matter of social justice', Australian Institute of Family Studies, vol. 27, pp. 14-16.
298
Heaton, J., and Lucas, D. 1997, 'Market frictions, savings behaviour and portfolio choice', Macroeconomic Dynamics, vol. 1, pp. 76-10 1.
Heaton, J., and Lucas, D. 1997, 'Savings behaviour and portfolio choice: Evidence from the tax data', Working Paper, Northwestern University.
Heaton, J., and Lucas, D. 2000, 'Portfolio choice and asset prices: The importance of entrepreneurial risk', Journal ofFinance, vol. 55, no. 3, pp. 1163-1198.
Hilgert, M. A., and Hogarth J. M. 2003, 'Household financial management: The connection between knowledge and behaviour', Federal Reserve Bulletin, July 2003, pp. 309-322.
Hochguertel, S., Alessie, R., and Soest, V. A. 1997, 'Savings accounts versus stocks and bonds in household portfolio allocation', Scandinavian Journal ofEconomics, vol. 99, no. 1, pp. 81-97.
Hochguertel, A. R. S, and Socst, A. V. 2000, 'Household portfolios in the Netherlands', Centerfor Economic Research, no. 2000-5 5.
Ibrahim M., and Wong A. 2006, 'Developing Corporate Bonds Market in Asia', BIS Paper No. 26, February 2006.
Ioannides, Y. M. 1992, 'Dynamics of the composition of household asset portfolios and the life cycle', Applied Financial Economics, vol. 2, pp. 145-159.
Islamic Capital Market Fact Finding Report, July 2004, International Organisation of Securities Commissions (IOSCO) Capital Market Task Force.
Iqbal, Z. 1997, 'Islamic Financial Systems', Finance and Development, June 1997.
Iwaisako, T. 2003, 'Household portfolio in Japan', NBER WP, no. 9647.
jaganathan, R., and Kocherlakota, N. R. 1996, 'Why should older people invest less in stocks than younger peopleT, Federal Reserve Bank of Minneapolis Quarterly-Review, vol. 20, no. 3, pp. 11-23.
Jappelli, T. 1999, 'The age-wealth profile and the life-cycle hypothesis: A cohort analysis with a time series of cross-sections of Italian households', Review ofIncome and Wealth, vol. 45, no. 1, pp. 57-76.
Kapteyn, A., and Panis, C. 2003, 'The size and composition of wealth holdings in the Unites States, Italy, and the Netherlands', NBER WP, no. 10 182.
Kennickel A. B. 2003, CodeBookfor 2001 Survey of Consumer Finance, Federal Reserve Board.
299

Kennickel, A. B., McCluer, M. S., and Surette, 13J. 2000, 'Recent changes in U. S. family finances: Results from the 1998 Survey of Consumer Finances', Federal Reserve Bulletin, vol. 86, pp. 1-29.
Kennickel, A. B., McCluer, M. S. 1994, 'Changes in family finances from 1989 to 1992: Evidence from the survey of consumer finances', Federal Reserve Bulletin, vol. 80, no. 10, pp. 861-882.
Kennickel, A. B., and McCluer, M. S. 1997, household saving and portfolio change: Evidence from the 1983-89 SCF Panel, Federal Reserve Board of Governors.
Kennickell, A. B. 2000, Codebook for 1998 Survey of Consumer Finance. Washington, DC: Board of Governors of the Federal Reserve System.
Kennickell, A. B., McCluer, M. S., Sunden, A. E. 1996, Saving and financial planning: Some findings from a focus group, Federal Reserve
Board of Governors, Washington D. C.
Kcynes, J. M. 1936, The general theory ofemployment, interest, and money. London: Macmillan.
Khaksari S. R. K, and Grieves, R. 1989, 'A new approach to determining optimal portfolio mix', Journal ofPorfolio Management, Spring: 4349.
King, M. A., and Leape, J. 1.1998, 'Wealth and portfolio composition: Theory and evidence', Journal ofPublic Economics, vol. 69, no. 2, pp. 155-193.
King, M. A., and Leape, J. 1.1984, 'Wealth and portfolio composition: Theory and evidence', NBER WP, no. 1468.
King, M. A., and Leape, J. 1.1987, 'Asset accumulation, information, and the life cycle', NBER WP, no. 2392.
Kullman, C., and Stephan S. 2003, Real estate and its role in householdpor(folio choice, Manuscript, University of British Columbia.
Lemon, N. 1973. Attitudes and their measurement. Halsted Press: New York.
Lott, J. R., and Kenny, L. W. 1999 'Did women's suffrage change the size and scope of government? ', Journal OfPolilical Economy, vol. 107, no. 6, pp. 1163-1198.
Loibl, C., and Hira, T. K. 2006, Effects offinancial education in self-directed financial learning and career satisfaction oflower-level, white collar workers: NEFE publications, <httl2: //www. nefe. oraJdownloads/loibl. pdfý>. Retrieved on 3rd April 2006.
300

Lusardi, A. 1996, 'Permanent income, current income, and consumption: Evidence from two panel data sets', Journal of Business and Economic Statistics, vol. 14, pp. 81-90.
Levine, R. 2005, Finance and Growth: Yheory and Evidence in Aghion, P., and Markowitz, H. 1952, 'Portfolio selection', Journal ofFinance, vol. 7, pp. 77- 91.
Markowitz, H.. 1952, 'The utility of wealth', Journal ofPolitical Economy, vol. 60, pp. 151-158.
Mason C. L. J., Wilson R. M. S. 2000, 'Conceptual ising financial literacy', Business School Research Series, University of Loughborough, Paper 2000-2007.
Mason, J. W., and Griffith, R. 1988, 'New ratios for analyzing and interpreting personal financial statements', Journal of Institute of Certified Financial Planners, vol. 2, pp. 71-87.
Meghir, C., and Weber, G. 1996, 'Intertemporal nonseparity or borrowing restrictions? A disaggregate analysis using a U. S consumption panel', Econometrica, vol. 64: 1151-1181
Mehra, R., and Prescott, E. C. 1985, 'The Equity Premium', Journal of Monetary Economics, vol. 15, pp. 45-161.
Metawa, S. A., and Almossawi, M. 1998, 'Banking behaviour of Islamic bank customers: Perspective and implications', International Journal of Bank Marketing, vol. 17, pp. 299-313.
Ministry of Finance, Economic Report year 2005/2006. In New Straits Time, Saturday, October, 2005.
Mizen, P. 1997, 'Micro foundations for a stable demand for money function', The Economic Journal, vol. 107, pp. 1202-1212.
Modigliani, F., and Brumberg, R. 1954, Utility analysis and the consumption function: An interpretation of the cross-section data. In Post- Keynesian Economics, edited by Kenneth Kurihara, New Brunswick, NJ: Rutgers University Press, pp. 388-436.
Morgan Stanley, 2005, Asian Fixed Income and Currency: Secondary Market Profiles, Morgan Stanley Fixed Income Research.
Morris K., Siegel, A., and Morris, V. 1995, Guide to Planning Your Financial Future, The Wall Street Journal.
301

Mossin, J. 1969, 'Security Pricing and Investment Criteria in Competitive Markets', American Economic Review, vol. 59, no. 5, pp. 749-756.
Musa, M. B. 1999, The Malay Dilemma Revisited, Merantau Publishers. ISBN I- 58348-367-5.
Naser, K. J. A, and Al-Khatib, K. 1999, 'Islamic banking: A study of customer satisfaction and preferences in Jordan', International Journal of Bank Marketing, vol. 17, no. 3, pp. 135-150.
Ng, J., 2003, 'The Best Performing Unit Trust Funds of 2002', Personal Money, March 2003, Kuala Lumpur, Malaysia.
Oakes, M. 1986, Statistical Inference: A Commentary for the Social and Behavioral Sciences, New York: John Wiley & Sons.
Oppenheim, A. N. 1992. Questionnaire design, interviewing and attitude measurement. Pinter Publisher: London and New York. Oxford.
Oxendom, J. 1980, Literacy: Writing, Reading and Social Organisation, London Routledge and Kegan Paul, pp. 80.
Paxson, C. 1990, 'Borrowing constraints and portfolio choice', Quarterly Journal ofEconomics, vol. 105, pp. 535-543.
Phillips, P. C. B., and Hansen, B. E. 1990, 'Statistical inference in instrumental variable regression with 1 (1) Regressors', Review of Economic Studies, vol. 57, pp. 99-125.
PNB annual report, 2005 and 2006.
Polkovnichenko, V. 2003, Household por(folio diversification, University of Minnesota and The Federal Reserve Bank of Minneapolis.
Poterba, J., and Samwick, A. W. 1999, 'Taxation and Household portfolio composition: US evidence from the 1980's and 1990's', NBER WP No. 7392.
Poterba, J. M., and Samwick, A. W. 1997, 'Household portfolio allocation over the life cycle', NBER WP, no. 6185.
Puelz, A., and Puelz, R., 1991, 'Personal financial planning and the allocation of disposable wealth, Financial Services Review 1(2), pp. 87-99.
Puelz, R. 199 1, 'A process for selecting life insurance contracts', Journal of Risk andInsurance, vol. 53, pp. 138-146.
302
Putra, T. A. R. 1986, Political Awakening, p. 98. Pelanduk Publications. ISBN 967- 978-136-4.
Ramly, H. 2003, 'A Different Way, Are Islamic Unit Trusts more risk averse? Yes, and no', Personal Money, the Edge Communications Sdn. Bhd, Malaysia.
Rosen, H. S., and Wu, S. 2003, 'Portfolio choice and health status', NBERWP, no. 9453.
Roscoe, J. T. 1975, Fundamental research statisticsfor the behavioural sciences, Holt, Rinehart and Winston.
Sekaran, U. 2003, Research Methodsfor business: A skill building approach (4h ed), John Wiley & Sons, Inc., New York.
Selltiz, C. 1969. Research methods in social relations. Latimer Trend and Co Ltd: Whitstable, Kent.
Shefrin, H., and Thaler, R. 1988, 'The Behavioural Life-Cycle Hypothesis', Economic Inquiry, vol. 26, pp. 609-643.
Shiller, R. J. 2003, The New Financial Order: Risk in 21"' Century, Princeton University Press.
Sixth Malaysia Plan, 1991 and Seventh Malaysia Plan, 1996, Kuala Lumpur, Economic Planning Unit, Malaysia.
Sekaran, U. 2003, Research Methodsfor Business: A Skill Building Approach, 4 th Edition, John Wiley and Sons, Inc. New York.
Sharpe, W. F. 1964, 'Capital asset prices: A theory of market equilibriums under condition of risk', Journal ofFinance, vol. 19, pp. 425-442.
Skinner, J. 1988, 'Risky income, life cycle consumption, and precautionary savings', Journal ofMonetary Economics, vol. 22, no. 2, pp. 237-255.
Smith, J. P. 1999, 'Healthy bodies and thick wallets: The dual relation between health and economic status', Journal of Economic Perspectives, vol, 13, no. 2, pp. 145-166.
Statman, M. 1987, 'How many stocks make a diversified portfolio? ', Journal of Financial and Quantitative Analysis, vol. 22, pp. 353-363.
Sundaresan, S. 2002, Fixed-Income Markets and Their Derivatives, 2nd Ed, South- Western.
303

Suruga, T., and Tachibanaki, T. 1991, 'The effect of household characteristics on savings behaviour and the theory of Savings in Japan', Empirical Economics, vol. 16, no. 3, pp. 351-62.
Tin, J. 1998, 'Household demand for financial assets: A life cycle analysis', The Quarterly Review ofEconomics andFinance, vol, 38, no. 4, pp. 875-897.
Tin, J. 2000, 'Life cycle hypothesis, propensities to save, and demand for financial assets', Journal of Economics and Finance, vol. 24, no. 2, pp. 110-121.
Tobin, J. 1956, 'The interest elasticity of the transactions demands for cash', The Review ofEconomics and Statistics, vol. 38, pp. 241-247.
Tobin, J. 1958, 'Liquidity preference as behaviour toward risk', Review of Economics Studies, vol. 25, no. 2, pp. 65-86.
Tobin, J. 1967, Life cycle saving and balanced growth. In Ten Economic Studies in the Tradition ofIrving Fisher, New York: Wiley, pp. 231-256.
Uhler, R. S., and Cragg, J. G. 1971, 'The structure of the asset portfolios of households', Review ofEconomics Studies, vol. 38, pp. 341-357.
Usmani, M. T. 2000, An Introduction to Islamic Finance, Idaratul Maarif, Karachi Pakistan.
Venti, S. F., and Wise, D. A. 1990, But they don't want to reduce housing equity. In, Wise D. A, Issues in the Economics of Aging, Chigaco: University of Chicago Press.
Viceira, L. M. 1999, 'Optimal portfolio choice for long-horizon investors with non-tradable labor income', NBER WP, no. 7409.
Warschauer, T. 2002, 'The role of universities in the development of the personal financial planning profession', Financial Services Review, vol. 11, pp. 201-206.
Wolff, E. N. 1979, 'The accumulation of household wealth over the life cycle: IA micro data analysis, Paper presented at the Eastern Economics Association meetings in Boston, May 1979.
Wolff, E. N. 1979, 'The distributional effects of the 1969-1975 Inflation on holdings of household wealth in the United States', Review ofIncome and Wealth, Series 25, no. 2, pp. 195-207.
Wolff, E. N. 1994, 'Trends in Household Wealth in the United States', 1962-83 and 1983-89, Review ofIncome and Wealth, vol. 40, no. 2, pp. 143-174
304

Yamashita, T. 2003, 'Owner-occupied housing and investment in stocks: An empirical test'. Journal of Urban Economics, vol. 53, no. 2, pp. 220-237.
Yc, L. S. 2003, The Chinese Dilemma, East Wcst Publishing. ISBN 0-9751646-1- 9.
Zeldes, S. P. 1989, 'Consumption and liquidity constraints: An empirical investigation', Journal ofPolitical Economy, vol. 97, pp. 304-346.
<http: //www. failaka. comALibrary/ArticlesAFailakaý/ý20Survey. ]2df>. The link retrieved on I November 2006
<http: //web. worldbank. orz/WBSITE/EXTERNAL/DATASTATISTICS/>. Retrieved on 17th May 2006
<httl2: //www. bnm. gov. my/index. phl2? ch=l II #Fi nanc ial Sector>. Retrieved on 5th November 2006
, my/english/frameset kev9ajLRhp. Retrieved on 5th November 2006
< httn: //www. affinbank. com. my/rates/ratesib. htm>. Retrieved 5th September 2006
'index. php? ch=13&cat=bankin Retrieved 23rd April 2006
'files/publication/msb/2006/10/pdf/ii 18. pd Retrieved on 22 December 2006
'files/publication/msb/2006/10/pdf/ii 13.12d Retrieved on 22nd December 2006
v/updates/2002/230802. htm> retrieved on 7th October 2006.
index. Vhp? ch=8&pg=14&ac=841. > Retrieved on 19th December 2006
)ppdf/bispap26p. pdf#search=ý/ý22ibrahimý/ý20and`/ý20 wonjz%2Bbnm%22. > The link retrieved on 7th October 2006.
. my/tib/treasury-investment-products. htm. > Retrieved on 13th July 2006
ig/htmi/resources/ press/or 20060314. html. > Retrieved on 13th March 2006
305

<www. anRelfire. com/il/fafp/jzlossary. html. > Retrieved on 14th March 2006
<http: //www. sc. com. my/engAtmi/resources/stats/stat fmdec05. html. > Retrieved on 18th June 2006
<http: //www. sc. com. my/ena/htmi/ýesources/t)ress/Xr 20060314. html. > The link retrieved on 14th April 2006
<http: //www. bnm. izov. my/index. php? ch=174&pa--500&ac=485. > Retrieved on 3rd September 2006
<http: //www. intemationalinsurance. orp, /intemational/overview/? table sort 72458 1=3> Retrieved on 19th April 2006
<http: //www. btimes. com. my/Current News/BT/Friday/ýconomicrep/ýcnEV0506.12 df. > The link retrieved on 25th April 2006
index. j2hj2? ch=I 74&pg--500&ac=485> Retrieved on 16th October 2006
<www. failaka. com> retrieved on 23rd May 2006
igLhtmi/resources/speech/2001/sp2OOlO924. pd >(the link retrieved on 31 July 2006).
mic Co- operation and Development>. The website was visited on I November 2006 for the current lists of OECD countries with the founding members andjoining members.
<http: //www. sc. com. my/enýAtml/resources/speech/2001/sp200lO924. pd >retriev ed on 23rd July 2006
<http: //en. wikipedia. oriz/wiki/401 (k). >
pamm. org> retrieved on 12th March 2004 <M2ny. f
-. ýwww. CFRP-Board. or )H, /cnse cLdebk. html. > Retrieved on 15th August 2005 2--g-_ -L-
<httl2: //www. creditaction. org. uk/debtstats. htm> retrieved on 2nd August 2006. Information on the programme available at:
<hlln: //www. duitsaku. com/. > Retrieved on 2nd August 2006
. 5httZ. //www. ak or n .> Retrieved on 14th December 2006 y --a1kL--j-M
. -5htt //www. nceeLnetX/ir ramL/. > Retrieved 13th May 2005 . Z_ [gg-
306

<httl2: //www. sc. com. my/eniz/html/icm/sas/svariahaPr2OO6.12df. >Information was retrieved from the Securities Commission's website on the 18th July 2006.
<www. failaka. com/research. phl2. >Retrieved on 23rd May 2005
<http: //www2. chass. ncsu. edu/jzarson/PA765/rejzress. htm> retrieved on 4th September 2006.
<http: //www. usasean. orgJMalaysia/business guide/Tax System. asp#6. %201nvest ment%201ncentives. > Retrieved on 18th March 2006
<www. kwsvjzov. m .> Retrieved on 25th March 2006
<http: //en. wikipedia. ora/wiki/Malavasian New Economic Policy. > retrived 13d, November 2006
<http: //islamic-finance. net/islamic-ethics/ýrticle-I2/article124. htm1. > Retrieved 18th July 2005
httl2: //www. imfor%z/extemal/Xubs/ft/fandd/1997/06/r)df/igbal. pd Retrieved on 13th August 2006
> Retrieved 25th June 2006
<httt): //www. sc. com. my/engAitml/resources/ýnnual/ýr2OO4-engý2df/[2t2 icm. ndf> Retrieved on 18th May 2006
<www. sc. com-m >under the heading of Islamic Capital Market and biannual SAC list booklet. Retrieved on 28th November 2006
< www. kidswealthfoundation. or .> Retrieved on 3rd July 2006 i/citiaroup/press/2005/051122a. htm. > Retrieved on
24th December 2005
nmlink/index. htm. > Retrieved 24th December 2006
/. >Retrieved on 19th August 2006
< httl2: //www. bankinainfo. com. m > Retrieved on 29th November 2006
ndex. cfm. > Retrieved 30th November 2006
n. com/RD/books. asp. > Retrieved 24th August 2006
igAtml/cmV&hapter3. pdf> Retrieved on 13th July 2006
307

<: http: //www. fipam. org. my/pdf/Licensed/IAFP. pd > Retrieved on 19th June 2006
. dex. php? oi)tion=com content&task=view&id=109<
emid=2. > Retrieved on 3rd January 2007
about/index. asl2. > Retrieved on 18th December 2006
308

Appendix 1: Survey Results by Failaka. com: Demand for Islamic Investments in America
fallaka May 2000
international. inc. P. O. Box 1,103 Chicago, IL 6D690-1203 Tel/Fax: (2209) 391-4248 Wait infoofailaka. com Wely wwwfailaka. com
Survey Results: Demand for Islamic Investments in America
, %fethodoloU
The following survey was conducted on July 4-6,1997 at the annual Islamic Circle of North America (ICNA) conference in Pittsburgh, PA. The survey analyzes the results of 100
respondents.
The ICNA conference is an annual gathering of 10,000 to 20,000 Muslims from all over the US and Canada to discuss various Muslim issues, get involved in social activities. buy and sell products. and promote Islamic organizations and products (ie. Islamic financial services). The current Muslim population in the US is estimated at 6-9 million depending on the source.
Respondents were asked to complete a survey of 15 questions to the best of their knowledge. The survey was dhided into three sections; name and address, demographic infortnation, inv, estment st)Ie and preferences. Respondents were not paid or compensated in any manner. This was probably one of the reasons for a small sample size. Another reason relates to cultural issues. Nfuslims, especially from South Asia, are relUCt3nt to share personal financial information with others. The younger generation and those born in the US are more willing to share such information.
The survey was originally developed for a mailing campaign but received limited success due to the above mentioned issues. Face-to-face contact was a better approach.
Given the fact that no other study has been conducted on Islamic financi2l services in the US, the following study is considered to be the best available at this time.
Limitations
Small sample size. Results may not be indicative of the target audience at-large. Demographic breakdown of respondents shows 2 high percentage of students and those new in the job market (higher than the demographic breakdown compiled by the American Muslim Council. Washington, DC) Some respondents who have limited knowledge of financial services and investments were hesitant about answering questions relating to their financial knowledge and, thus, left some questions unansweredL As such, results of some questions maybe based on less than 100 respondents.
cm, n&C 1997-2000. FailAa WomationA Iw- All L&s BAsw%-td
IN-wwbOakacom Damnd foc bmstme2ft in Amwics
309

Demographic Analysis
P1.0fession: 0-
, -er 5P'. of respondents came from profesiional backgromids. FdIIC3tOI- ClTe_FOYý' iiidtldeý Iiiji- versi. y level pror . essors as xell as K-12educatofs. Tlierexasa high level 0, StIldents In (lie 5.1111ple size
The 'orher ciregory iiiclude5 clerical. blue-collar as ,, vell as homemaker professions.
Age Bi-eikdoii ii: The lirgesT . 1ge group xas the 36-5 ý cilegory which is a prime nivestment age -o-oup. The 55
aze group I'vis luldefrepresellted , xhich -, vaý most likelv due to the culturil issues menrioned in Methodology.
Nore thil the 18-2ý Cateaon, is repre; entative of the Snictenr profession above (15* o)
CotiIIII. A. of Bil th: The South Asiall 111,1de V [Ile I, irgest group xith over 4S*o of the sample s., ze. reýpondents born in Pakistan inade tip 34*o
As the NIL1511111, POPUIVIO11 Coll- tinues to expand in the US. tluouz)i nantral zioxth or nii- gration. the nuniber of. 1,4uslinis born in the I'S will increase A majority of the US born respon- dents . vere second L7eneration Mrusluný from South Asia and the Middle East.
n. lika com
Profession
-ýýplo ed Eng -eer 14%
ý! Uc-t IV.
Age Breakdown
e5f
Country of Birth
A, - Arab Coun,. ii, s
12%
Alrican Zc. ri"es
11..
310
3k van -W.
20%
2#mh2d fOr Namc Izvemen-a ji Am*ncs

Level of Educatiou: The level of education in rhe sample size ivas impressive Over 77., have illuversitv de- grees- of -a-hich over 371o have post- gractuare degrees.
N, . ote. howeven that studenti currently enfolled III college are sp. -ead acrois three citegories. high school. some college. and college degree A large porioil of tile sludents III the Sample are POST- 91'All3te STUClelltS.
Household Income: Over 17'o of respoliclezirs' iii- collie was less thill $25.000 an- 1111111v. "vilich is reflective of tile 10 student rrio
C)-.. *ef 5"o of respondents have alilliml iliconles of Over ý45.000.
M3 s*. es
Deg-ee 22'.
ý611 oc ý2 E-
ICI.
34 5. IC
30%
lin-c-stim-nt SrYle ind Pt eference Analysis
Level of Investment: There was nal linexpec'edly ! ox pefcetirage of respondenTs who ýaid thev currenth, invest.
�0
Percentage of respondents that Said they currently invest
The definition of invesailen:
was: 0'ývllerslllp of stocks. bonds. nionev markets, rell es- tice. ownerillip ill I Private company and rnrenien, ic- count's I' ,
R-ý 4CIK , !. 0-xiler5li"P
of 1 primir-7., residence xis nor Included
iwr_IJk3 on
C'Yl, - Ccl e-pe 1-"..
-, lege
52:. Oo *- 5.1" DO 141.
5.1-01- !
YC s 5ý1.
: ýmAnd fOr 104MIC Im%lVinwi m Am-inca
311
Level of Education
-igh S. 1ic. -
Annual Household Income
-! -- ý ., CC. S-1- Cýj

Curi ent rypes of invemnents: Reýpollcle"ITS who illveiT v. -ere asked wherlier then uivestmentý
,. ve-e Halil Niaria coiliphinr). Conventional or lild I collibix-l- tioll ofbotllý
Oveý 62'o said that they have Hal-al only investments or both
indiciles thir abouT two- tlllfd. S Of NILIS111r. 5 xe concerned with Iliving invesnuents that are in line xith Their religious beliefý
Bri-ak-down of investments: Only 27"o of respondents said that thev hive mutual fands and otih, Soo said thit they have bonds. CDs. or nionev iiiarkes. This mav suaoest thit thev ire trvi . ng to avoid ftlvestirens thi, ire clearly b ase Ll on ri-ba (interest).
D, tect inveslinew includes in- vesTment ui piwate family busi- liess.
Reasons for not having Halal investments: As exj)ecled ovei- 570ý percent of reipondeiits said diat they do
not have Hatal inveirnients be- ciuse they can't find any. Sur-
prisingly. 23'o -', lid TIlIt they CIL, , lot seek out HAal uivestireiitý because Islamic Investment ý Ind their ISýOCIZITed companies lack a good repuriTion
Current types of investments
Breakdown of current types of invesmtents
Lcasin,; ýun, 5
I ý, j ds
C-, ecl Invesuretrs
101,
Rea -ý5*xe
I
-I%*ý
St, ý ks 17-.
RA. 14- IK 22*1e
Reasons for not having Halal investments 0 th
Dc nc*. ptc-., gccd el. r
s 3,, c rv*s: m, -ts
la. k repxxioi 2? %
, -an t frd any ! 7%
4 : eMandfollifamicb, ,. com esmenn 13 Amenca
312

Types of Halal investments iespondents would like ro have or would Consider if available: A 111,1JOnly of lesponclents (430o) Slid that they would. like to have muntil funds ivailable to theni. this jiiclude; ý IR-Aý and Pension PlIns
Over 21 'o said dilt thev ire in-
terested in real estate. but this
, also weans that they would like Slia, II Compliant mortziges iather than real estate
iiiveýtllleilt vehicles
Types of Halal investment under consideration
Leas, n.; ýur e. 1.
ve s! r- ent
Real Es.
ýunzs 4S*ý
, --line recor Reýpondenrs *xere asked to identifY fillMCMI SerVICe C0111PI. 'lies ftlll .1 list of ren The resul: s not only highlight brand recognition 31110119 Musluils, but also show the level of k-llo-xledge of financial sen-ices ill ýgeneral. As sus! qesýed iii previoui itin-ev resillis. XjjIs- lillis reild to be less educated oil financial semces than the population in the US it-lar2e. This could be the result of Nime Recognition religious beliefs -where (Which of the ten companies have heard of before? ) olle would , adler not ill- N-est III fear of violiling religious pidelliles or be- Mem I Lrz! - Cluse of Cultural differ- ellces, Ill Illost N111slilij Sni*. h Ba, rey
Cou. -i-ries family plivs are large -, Ole not Oill". Ill the A-3-3 1.1-'. u3
ýuns social stnICTilre but ilso ill file ecollorilic S11,11CRIfe. : pperhe ie, .2 Family illeilibers tetid to rel%' oil OTheIS f0f fU1,1IICIal
, xell-beillg : md xelfafe The working gelle"Itio. 's stipipt. irr the younger and OC-1dm3^ the Older generations. 'fo-a-ever. ai xealli ui- 5% crease Inct Me liex gen-
entioll Joins the labor Slim Rc-e
force. more lilt! Illore at- F3rnhi, i
telitioll is being paid to N, ght Inves-mrs 10119-Terill fillincial plall-
111119, NImIllil will 1111-
doubtedlv seek ISI', IllllC fl- Ctate Svew
lialicill senices
com :: emAnd for 1 Jj=R Imlime3n ja Amenci
313
t
c C% 5. DIS ,Z 3% 15 0** 23 3% : 5. Dýe 3C Cl%

Appendix 2: Financial Education Programme in School, Colleges and Universities in the U. S.
Title of the Objectives Target group Medium of
programme/ presentation
resources 1) All KCEE Providing wide range of publications (more K-12 teachers and their On the website:
Publications than 80 titles) for economics and personal students store. ncee. net
finance
2) Advanced Advanced Placement Economics (aka the AP Economics teachers and The books can be
Placement Morton Books) teaches a college-level their students.
purchased on: economics course that prepares high school
Economics students for the AP Economics Exam. The http: //store. ncee. net/a Teacher Resource Manual introduces the key
peconomics. html concepts, and the Student Activities booklets - - Microeconomics and Macroeconomics -- reinforce the principles with activity-based lessons.
3) Capstone The recently released 2003 edition of Capstone contains a teacher's The print materials Capstone is a set of 45 exemplary lessons for guide as well as a thought- can be purchased high school economics teachers and their provoking student activity from the NCEE students. Capstone contains a teacher's guide book for high school Store. The and a thought-provoking student activities economics teachers and their companion web site book; a complete glossary of economic terms; students. with detailed economic reasoning applied to a wide range of information on all of problems and issues; and multiple choice and the materials is essay questions built into each lesson. located at:
httl2: //cai2stone. ncee. n The 45 lessons cover a wide range of et.
economic concepts including the economic way of thinking, markets, supply and demand,
personal finance, macroeconomics, the role of government and the global economy to name a few.
4) Choices & This series uses basic economic principles to Choices & Changes includes The print materials help students develop the knowledge, materials for K- 10 teachers can be purchased
Changes reasoning skills, and confidence that will and their students. from : store. ncee. ne allow them to take responsibility for their futures and to understand that human behavior is a result of choices, not chance. Students learn that by investing in their skills and knowledge and by leaming to make sound decisions, they can gain control over and improve opportunities in their own lives.
314

5) EconEdLink EconEdLink provides a premier souce of classroom-tested, Internet-based economic lesson materials for K-12 teachers and their students. With over 467 lessons to choose from, teachers can use as many of the lessons
as they would like and as often as they would like.
The Internet-based lessons are targeted for K- 12 teachers and their students. Each of the lessons includes a teacher's version as well as a student's version. Each of the lessons is designed to be delivered in a variety of formats and classroom settings.
All of the lessons are Intemet-based and free to everyone. Each lesson contains a teacher's version as well as a student's version which can be used in a variety of ways. To view the list of over two hundred and fifty lessons, visit EconEdLink. org.
W)--ECONnections ECONnections contains standards-based lesson plans adapted from NCEE printed materials for the Internet with interactive activities for students. The most exciting and innovative aspect of ECONnections is its use of "volunteer experts" from The McGraw-Hill Companies.
7)- Economics The NCEE/Goldman Sachs National
Challenge Economics Challenge is a state, regional and national competition for high school students designed to increase their understanding of and interest in economics and finance. Students compete in teams for a chance to win prizes and a trip to New York City to compete in the national finals
ýT)E_xcellence in Congress first authorized the Excellence in Economic Economic Education (EEE) Act (20 USC Education 7267) as a part of the landmark No Child Left
Behind Act, and appropriated $1.5 million for EEE in the Fiscal Year 2004. The EEE "program promotes economic and financial literacy among all students in kindergarten through grade 12 through the award of one grant to a national non-prof it education organization that has as its primary purpose the improvement of student understanding of personal finance and economics. " This organization in turn must allocate three quarters of EEE funding to State and local education organizations to carry out the purposes of the program.
ECONnections is designed fi both teachers and students. Each lesson contains a teacher's version as well as a student's version.
around the US have the opportunity to compete in state, regional, and national level competitions.
The research grants are available for researchers wanting to pursue research in related areas.
All of the lessons are Internet-based and free to everyone at: www. e- connections. org.
available on: http: //economicschall enge. ncee. net/ or by contacting John Morton at imorton(a-)ncee. net.
Information on how to apply and its conditions can be viewed on: http: //www. ncee. net/ ea/program. php? pid= 23
315

9) it All Adds It All Adds Up is a web site for teens who It All Adds Up is targeted at All of the activities want to get a head start on their f manci al high school age students. are Intemet-based
Up futures. The web site contains online games and free to everyone. and simulations to help students learn about Visit credit management, buying a car, paying for ItAllAddsUI2. or to college, budgeting, saving, and investing. start using it today
10) Financial Helps students apply economics and decision- Financial Fitness for Life The print materials
Fitness for Life making skills to the real world of earning and contains K-12 student and CD-ROM can be spending an income, savings, using credit, activities, teacher guides, purchased from the investing, and managing money. This parent guides, a CD-ROM as NCEE Store. The comprehensive K-12 program consists of well as a companion web site. companion web site teacher resource manuals, student workbooks, with detailed parent guides, interactive activities, and a CD- information on all of ROM. the materials is
located at: http: //fffl. ncee. net.
1) Learning, Learning, Earning and Investing is a multi- Learning, Earning and The print materials
Earning and faceted, comprehensive investor education Investing contains a 16-lesson can be purchased program for students in grades four through middle school print book and from the NCEE
Investing 12. The 16-lesson middle school print book the 23-lesson high school print Store. The and the 23-lesson high school print book is book. companion web site designed to teach the benefits of and strategies with detailed for long-term investing success. In addition, information on all of the companion Web site offers a wide array of the materials is current data, investment education links, located at: downloadable classroom visuals, interactive httr): /Aei. ncee. ne lessons and classroom-tested print lessons for students.
-1 -2)-Mathematics -Created to help mathematics teachers answer The Mathematics & The print materials the proverbial question "Why do I have to Economics materials include a can be purchased
& Economics learn this? " Mathematics & Economics is a set grades 6-8 book targeted at from the NCEE of lecture material, classroom activities, and mathematics teachers in the 6-
, Store. The
Web resources designed to help students 8th grades, and a grades 9-12 companion web site discover how mathematical processes and book targeted at mathematics with detailed concepts can be used in real world situations. teachers in the 9-12th grades. information on all of The materials include one book for grades 6-8 the materials along and one book for grades 9-12. Elementary Teachers Now with additional
Have Fun and Easy Way to resources is located Integrate Mathematics and at: Economics into Curriculum. httV: //mathandecon. n
cee. ne .
13) Nasdaq The NASDAQ National Teaching Awards are Awards are given teachers 2005 Regional Teaching designed to advance economic literacy in our teaching financial education Winners and Semi. Awards nation's schools by recognizing middle school Finalists are available
and high school teachers who are helping on: students to think, make sound, informed http: //www. ncee. neti decisions, and function well in the economy. ea/program. php? pid-
6
316

14) National The National Council on Economic Education The essential propositions of Can be viewed on: (in partnership with the National Association economics are identified in the http: //www. ncee. net/ Standards of Economic Educators and the Foundation 20 content standards that ea/standards/. for Teaching Economics) has produced a set follow. Each standard is Standards can be of curriculum standards based on the essential followed by a rationale for its viewed, downloaded principles of economics, titled Voluntary inclusion. The benchmarks for or purchased from: National Content Standards in Economics. the teaching of each of the http: //store. ncee. net/v Each of the 20 content standards, developed content standards are provided olnatconsta. html. by a panel of economists and economic indicating recommended This 108 page educators, includes a rationale for its levels of attainment for publication contains inclusion; benchmarks indicating attainment students in grades 4,8, and 12. detailed information levels for students in grades 4,8, and 12; Finally samples of what on the 20 Content samples of what students can do to enhance or students can do to enhance or Standards demonstrate their understanding of demonstrate their economics; and correlation of existing understanding of the EconomicsAmerica publications to the benchmarks are provided. standards.
15) Preservice Principles of Economics for Prospective This publication is intended An online syllabus Teachers SyllabusThis publication is intended for use by college and that can be
Syllabus for use by college and university faculty university faculty members downloaded and used members involved in the preparation of future involved in the preparation of as you prepare teachers. It discusses the role of economic future teachers. teachers for education coursework in teacher-training economic education. programs and provides model syllabi for a httl2: //www. ncee. net/s two-course sequence of instruction in macro- Yllabus and microcconomics for prospective elementary and high school teachers. The model syllabi might be used by faculty members in economics and education to develop new economics courses for prospective teachers or to strengthen existing courses.
16) The Mint The Northwestern Mutual Foundation, the The Mint is designed for All of the materials charitable arm of Northwestern Mutual, middle school and high school are Internet-based partnered with the National Council on students, teachers, and parents. and free to everyone. Economic Education (NCEE) in the redesign To begin using The of TheMint. org, to emphasize personal Mint, visit financial literacy. First developed in 1997, the httl2: //www. themint. o Web site now provides more tools to help rR parents as well as educators teach children about sound money management and establish good money habits at home.
317

17) Thinking Thinking Economics is a comprehensive High school teachers and their For more information Economics standards-based economics curriculum for students. Can be used as a visit
high school teachers. It features 75 mainstream economics http: //www. thinkinge technology-based lessons for students, plus curriculum in the social conomics. com/the or planning tools and testing materials for studies department, or as the http: //store. ncee. net/t teachers. Teachers use the print resources to economics component within hinkinizeconomics. ht plan in-class activities and simulations that business, entrepreneurship and ml to purchase reinforce the principles and challenge their marketing classes. TE is ; nline. students with advanced applications of "real- recommended for alternative world" economics. Teachers without access to education programs, a full lab may use an LCD projector for full technology oriented public and class instruction. private schools, and even
distance education.
18)Virtual The Virtual EconomicsZ: Version 3.0 CD- Virtual Economics& Version The CD-ROM can be EconomicsQD ROM provides a complete Resource Library 3.0 is designed to be used by purchased from the
of lessons and instructional materials for K- 12 teachers as a refresher in http: //store. ncee. net/v understanding and teaching basic concepts in basic economic concepts as irtualeconomics. html. economics. well as a comprehensive The companion web
library of economic lessons. site with more information on the CD-ROM is located at: httl2: Hve. ncee. net.
318

Appendix 3: The Lists of Current Islamic Equity Providers as at 13 th February 2006 by Failaka. corn conducted by Harvard University's Islamic Financial Information Program (HIFIP), Harvard University.
Abrar Investment Fund Abrar Unit Trust Managers Malaysia Alfanar Investment Holdings AIH Investment Management Company Ltd. UK Al-Rajhi Egyptian Equity Fund Al Rajhi Bankinq & Investment Saudi Arabia Al-Rajhi Euorpean Equity Fund Al Rafh! Banking & Investment Saudi Arabia A[-Rajhi GCC Equity Fund Al Rajhi Banking & Investment Saudi Arabia Al-Rajhi Global Equityfund Al Raihi Bankinq & Investment Saudi Arabia Al-Raihi Local Shares Fund Al Raihi Banking & Investment Saudi Arabia Children Fund Al Rajhl Banking & Investment Saudi Arabia Global Small Cap Equity Fund Al' Rajhi Bankinq & Investment Saudi Arabia Ladies Fund Al Rajhi Banking & Investment Saudi Arabia TAIB Crescent Global Fund Albert Asset Management Bahrain Dow ]ones Islamic Index (US) Fund * Allied Asset Advisors Funds USA Children's Investment Fund Al-Tawfeek Company for Investment Funds Saudi Arabia Alfanar US Capital Value Apex Capital LLC UK AI-Mubarakah Portfolio Arab National Bank Saudi Arabia AI-Naqaa Al Mubarak Fund Arab National Bank Saudi Arabia Crescent Fund Arab National Bank Saudi Arabia
rusts Bhd Malaysia Tabung Amanah Bakti Asia Unit Trust Berhad Malaysia Dana Al-Aiman ASM Mara Unit Trust Management Malaysia Azzad Income Fund * Azzad Asset Management USA 71--Seef Fund Bank Al-Bilad Saudi Arabia Asayel Fund Bank Al-Bilad Saudi Arabia Al Khair Equities Fund Bank Aljazira Saudi Arabia 71--Mashareq Japanese Equities Bank Aljazira Saudi Arabia Al Tai)tebat Saudi Equities Bank Aliazira Saudi Arabia Al Thoraiya Equities Bank Aljazira Saudi Arabia
_ Al-Khair Global Equity Fund Bank Aljazira Saudi Arabia Al-Nukhba Asian Equity Bank Aljazira Saudi Arabia AFBadr Fund Saudi Riyal Bank Alsaudi Alfransi Saudi Arabia E
EF
r Uý Badr US Dollar Bank Alsaudi Alfransi Saudi Arabia I Naqaa Asiia Growth Fund Bank Alsaudi Alfransi Saudi Arabia
Noor Equity Trading Fund Bank Alsaudi Alfransi Saudi Arabia Al indeel igh yield Murabaha Bank Alsaudi Alfransi Saudi Arabia Al-Saffa Saudi Equity Tradinq Bank Alsaudi Alfransi Saudi Arabia
--g-B--MBDana Putra BBMB Unit Trust Management Malaysia 13HLB Pacific Dana Al-Mizan (Balanced) BHLB Pacific Trust Malaysia ý-HLB Dana Al-Ihsan BHLB Pacific Trust Malaysia ý-manah saham Bank Islam BIMB Unit Trust Mgmt Bhd. Malaysia
`6ow Jones Islamic index Fund Brown Brothers Harriman & Co. USA -Pars-o-liGlobal Equity Cap I Cure Sharp. Ltd. UK ; ýI'-sukoor European Equity CICM Fund Management Ltd. Germany
- Citi GlobFal portfolios Cit! Asset Management Group Bahrain Menclaki Ca ital Protected Fund DBS Asset Management Singapore p-endaki Global Fund DBS Asset Management Sinqapore ýýe-nLa-kiGrowth Fund DBS Asset Management Singapore Sxmj Fund Dynamic Mutual Funds Ltd. Canada Alfallar _Glo6al
Healthcare Essex Investment Management LLC UK Alýanar Technology Essex Investment Manaqement LLC UK f ' First Arabian Equity 2000 First Investment Funds E. C. Kuwait S t
E
n=arUS Capital Growth Forstmann-Leff Associates LLC UK f a A1
319

FutureGrowth AlBaraka Equity Fraters Asset Management South Africa QIB Global Equities Global Asset Management (GAM) Qatar Al-Durra Islamic Fund Global Investment House Kuwait Global Islamic Fund Global Investment House Kuwait Amanah Saham Wanita Hijrah Unit Trust Management Bhd Malaysia HLB Dana Makmur Fund HLB Unit Trust Management Bhd Malaysia
-- ; ým anah European Basket Protected HSBC Amanah Finance UAE jý-m-anah Global Titans Protected HSBC Amanah Finance UAE HSBC Amanah Aclar Income Fund (Coming Soon) HSBC Amanah Finance UAE HSBC Amanah Best-Manager Fund (Cominq Soon) HSBC Amanah Finance UAE
I Source: Failaka International (www. failaka. com). Equity Fund Name Fund Manager Location HSBC Amanah Blue Chip Protected Fund HSBC Amanah Finance UAE
- -ý`S BC Amanah Euro Basket Protected Fund HSBC Amanah Finance UAE RSBC Amanah Global Index Fund HSBC Amanah Finance UAE HSBC Amanah Global Properties Income Fund HSBC Amanah Finance UAE
_ R-SBC Amanah Healthcare Protected Fund HSBC Amanah Finance UAE HSBC Amanah Pan-European Protected Fund HSBC Amanah Finance UAE
-ý-SBc Life Amanah Pension Fund HSBC Amanah Finance UAE HSBCAmanah Saudi Equity Fund HSBC Amanah Finance UAE
- SBCAmanah Global Equity HSBC Investment Funds (Lux. ) SA UAE --j4 - fB-B Global Equity Fund Islamic Bank of Brunei Brunei
Kuala Lumpur Ittikal Fund Kuala Lumpur Mutual Funds Malaysia Mayban Dana Yakin Mayban Management Bhd. Malaysia Al Baraka Global Equity Merril Lyric set Mgmt Bahrain Arzag Investment Fund Multi-Manager Kuwait Al-Watania Fund National Bank of Bahrain Bahrain AlAhli Asia Pacific Trading Equity National Commercial Bank (AlAhli) Saudi Arabia AlAhli Europe Trading t: quity National Commercial Bank (AlAhli) Saudi Arabia AlAhli GCC Trading Eq ity Fund National Commercial Bank (AlAhli) Saudi Arabia AlAhli Global Trading Equity National Commercial Bank (AlAhli) Saudi Arabia AlAhli Healthcare I rading Equity National Commercial Bank (AlAhli) Saudi Arabia AlAhli Saudi Dynamic Trading Equity National Commercial Bank (AlAhli) Saudi Arabia AlAhli Saudi I racling Equity National Commercial Bank (AlAhli) Saudi Arabia AlAhk Small Cap Trading Equity National Commercial Bank (AlAhli) Saudi Arabia AlAhli US Trading Equity National Commercial Bank (AlAhli) Saudi Arabia Navis Asia III (CIMB-Muamalat Fund) Navis Investment Partners/ Navis-CIMB Malaysia Oasis Crescent Rind (1; Asset Management Ltd. South Africa is Oasis Crescent (-, InhAl En Dbal Management Co. Ireland Is Pacific Dana Amana Pacific Mutual Fund Trust Malaysia AI-r Worl I-Dar World Equities Pictet & Cie Switzerland TT
C7 II Small Cap Equity (European) Pictet Asset Management Ltd. UK
Amanah Saham Darul Iman PTB Amanah Saham Darul Iman Malaysia ý-l -Namae International Stock Portfolio Qatar Islamic Bank Qatar RHB Muclarabah Fund RHB Unit Trust Management Malaysia Al Hadi Islamic Portfolio Riyad Bank Saudi Arabia Al Mokdam Islamic Portfolio Riyad Bank Saudi Arabia Al Shamekh Islamic Portfolio Riyad Bank Saudi Arabia Al Shu'a a Islamic or o io iya an au i ra ia
M
I ult Equity Fund Riyad Bank Saudi Arabia Global Islamic Balanced Income Fund Riyad Bank Saudi Arabia Ri ad E uity Fund 2 (Saudi) Riyad Bank Saudi Arabia Al-Safwa International Equity Roll & Ross Asset Management Saudi Arabia Mira Glo al Equity Royal Bank of Canada Canada Al Raed Fund SAMBA Saudi Arabia
Global E uity Trad. (Al Manall 11-111 Saudi Arabia
320

Intl Equity & ITF (Al Wasat) SAMBA Saudi Arabia Amana Growth * Saturna Capital USA Amana Income * Saturna Capital USA Amanah Balanced Portfolio Saudi British Bank Saudi Arabia
anah Defensive Portfolio Saudi British Bank Saudi Arabia Amanah Global Equity Index Fund Saudi British Bank Saudi Arabia Amanah Growth Portfolio Saudi British Bank Saudi Arabia ; ým--anah Saudi Equity Fund Saudi British Bank Saudi Arabia ; ýrnanah Saudi Industrial Fund Saudi British Bank Saudi Arabia ýOsR Aman Portfolio Saudi Hollandi Bank Saudi Arabia
- - -jý o SRMizan Portfolio Saudi Hollandi Bank Saudi Arabia YOS ý Tamoh Portfolio Saudi Hollandi Bank Saudi Arabia Gulf Companies Fund Saudi Investment Bank Saudi Arabia (ý-u--IfIndustrial Companies Fund Saudi Investment Bank Saudi Arabia Saudi Companies Fund Saudi Investment Bank Saudi Arabia SUT Ethical Growth Fund Singapore Unit Trust Ltd. Singapore
- TEthical Value Fund Singapore Unit Trust Ltd. Singapore -ý-U §'ource: Failaka International (www. failaka. com). Equity Fund Name Fund Manager Location TAIB Islamic Currency Fund Taib Bank E. C. Bah ain TAIB Islamic GCC Equities Index Fund Taib Bank E. C. Bahrain
- AIBIslamic UK Equities Index Fund Taib Bank E. C. Bahrain T -; ýJfanar Europe TT International Investment Management UK
Ibn Majid Emerging Markets UBS Brinson Switzerland Noriba Global Equity UBS Islamic Fund Manaqement Co. Bahrain
ari Global Equity Wafra Investment Advisory Group USA AI u l' = F - BBr , ýrclays Global Equity Wellington Management Co. LLP USA
Crv CC aravan Fund Wellington Management Co. LLP USA Hegira Global Equity Wellington Management Co. LLP USA Alfanar US Large Cap WP Stewart Asset Management UK Azzad DJIM Index Fund * Wright Investors' Service USA Balanced & Hybrid Funds Fund Manager A -Rajhi Balanced Fund 1 Al Rajhi Banking & Investment Saudi Arabia A -Rajhi Balanced Fund 2 Al Rajhi Banking & Investment Saudi Arabia Al Hilal Fund (Balanced) Merril Lynch Mercury Asset Mgmt UAE AlManarah Conservative Growth Portfolio National Commercial Bank (AlAhli) Saudi Arabia AlManarah High Growth Portfolio National Commercial Bank (AlAhli) Saudi Arabia AlManarah Medium Growth Portfolio National Commercial Bank (AlAhli) Saudi Arabia Islarnic Bond (Sukuk) Funds Fund Manager Arnlak Amlak Finance UAE ýSD 66omn Malaysia Global Sukuk HSBC Amanah Finance Malaysia
-ýSD 70OMn Qatar Global Sukuk HSBC Amanah Finance Qatar Kuala Lumpur Islamic Bond Fund Kuala Lumpur Mutual Funds Malaysia Dahlia ýyariah Income Fund Mayban Life Assurance Bhd. Malaysia RHB Islamic Bond Fund RHB Unit Trust Management Malaysia
alkafull Funds Fund Manager Takaful lobal Fund HSBC Singapore Singapore
Aeasing Funds Fund Manager GCC Leasing Fund Al-Tawfeek Company for Investment Funds Saudi Arabia GCC Leasinq Fund II Al-Tawfeek Company for Investment Funds Saudi Arabia
-i-nternational Leasing Fund A[-Tawfeek Company for Investment Funds Saudi A-rabia AlAhli Auto Finance Fund "A" National Commercial Bank (AlAhli) Saudi Arabia AlAhli Auto Finance Fund "B" National Commercial Bank (AlAhli) Saudi Arabia Real Estate Funds Fund Manager
AlBait UK Real Estate Fund ABC Islamic Asset Mýnaqement UK
321

Amlak First Real Estate Fund Amlak Finance UAE 6obal Us Real Estate Fund Global Investment House Kuwait ý-I-Deara Real Estate Finance Fund Kuwait Finance House Kuwait ; ýJ-Soor Real Estate Leasing Fund Kuwait Finance House Kuwait First Industrial Fund Kuwait Finance House Kuwait AlAhli Real Estate Income Fund National Commercial Bank (AlAhli) Saudi Arabia Badr ProPertyy Fund Qatar Islamic Bank Qatar LQ_ý NOTE:
This list does not include currency funds or trading funds. The locations listed are not necessarily where the funds are domiciled. they are the location of the fund manager. Funds registered with the SEC, which may be bought and sold by US residents,
Source: Failaka International (www. failaka. com).
322

Appendix 4: The Questionnaire for Households on the Demand for Financial Assets
11HOUSEHOLDS'PORTFOLIO ALLOCATION AND DEMAND FOR FINANCIAL ASSETS: A MICRODATA TEST OF MALAYSIAN EXPERIENCE
TO THE LIFECYLE HYPOTHESIS"
NOTE TO ALL THE INTERVIEW PARTICIPANTS:
This interview is conducted to learn about personal finances of Malaysian households. By agreeing to be a participant of this questionnaire interview, you will be asked on questions covering areas such as income, wealth and amount of financial obligations. You will also be asked about your holdings of various types of financial assets. Please be assured that your answers will be kept confidential, with no names and identification will be asked thus recorded. The findings of the research will only be used for academic purpose as part of the requirements of my doctorate study in Islamic Finance in the University of Durham, United Kingdom.
Please tick in the appropriate boxes.
Age E] Less than 30
30-50 More than 50
Gender E] Male Female
3. Marital status Single Married Divorced Others
4. Number of children F1 None r -2
3-4 F1 5-6 More than 6
5. Highest academic qualification [] Secondary school Ej Diploma n Degree EJ Master's degree
Ej Doctorate's degree
323

6. Job sector Self employed Private
7. Race E] Malay F-I Non-Malay
8. Please state your monthly salary:
Fý Government Ej Currently Unemployed
9. Please fill in the amount from sources of income as below (annual)
Rental income RM Business income RM
EJ Annuity RM [: ] Gratuity RM EJ Royalty RM EJ Others (e. g. bonus) RM
10. Please fill in the amount from sources of income as below (annual) E] Divided from shares/unit trust s: RM n Interest /income from bonds RM Ej Interest /profit from savings RM
11. Estimated value of your house/s 12. Balance of mortgage on the house/s 13. Value of other real properties 14. Balance of mortgage on the properties 15. Market value of motor vehicle/s 16. Hire purchase balance on the motor vehicle/s 17. Estimated value of any land holdings 18. Balance of your retirement accounts
(EPF or other retirement accounts) 19. Estimated saleable of any business venture
(Wholly or partly owned) 20. Amount owed for business or professional purpose 2 1. Amount owed for personal use 22. outstanding credit card bills 23. Amount owed from individuals other than financial
Institutions 24. Amount owed on educational loans
324

C. Questions below are designed to know about your financial assets holding
25. What type of unit trusts you hold? M None Ej Conventional M Islamic
26. The approximate value of unit trusts holding
27. What type of savings you have? M None Ej Conventional M Islamic
28. The approximate value of savings
29. The approximate value of savings in other financial institutions other than bank, e. g. Tabung Haji
30. What type of shares you hold? E] None E] Conventional Ej Islamic
3 1. The approximate value of shares held
32. What type of bonds you hold? Ej None Ej Conventional Ej Islamic
33. The approximate value of bonds held
34. What type of family insurance you have? E] None Ej Conventional Ej Islamic
3 5. Do you prefer to invest in bonds or stocks? (investment in stocks is riskier and have prospects ofobtaining higher returns)
EJ Bonds r-1 Stocks
325

36. Do you ever consult the following professionals for their advice? (You may have more than one option) F-I None M Tax specialists Fj Certified insurance representatives F1 Certified unit trust representatives F] Accountants F] Personal lawyers
37. Do you hire the service of certified personal financial planners? Yes No
3 8. Why you have decided to hire a CFP? M Confident with advice given by CFP Ej CFP may recommend suitable financial products [: ] No expertise to do it myself Ej No time
39. The types of advice that you seek E] Credit and borrowing
Risk management (insurance or takaful) investment advice
E] Tax planning Ej Retirement planning advice [: ] Estate management advice
40. Why you decided NOT to hire a CFP? E: ] Do not have enough funds E] Capable to manage on my own [: ] Not comfortable for other parties to involves in personal finances Ej Not familiar with the service provided by personal financial planners
326

Please rank your understanding on the following issue relating to Islamic finance.
ISSUES Poor Excellent
41 Prohibition of interest/ riba' 12 3 4 5 42 Prohibition of unlawful activities 12 3 4 5 43 Prohibition of uncertainty in 12 3 4 5
business dealings/ gharar 44 Prohibition of gambling in 12 3 4 5
business dealings / maisir 45 Discouragement of monopoly 12 3 4 5 46 Existence of agreement of parties 12 3 4 5
in business transactions / akad
Nease rank your knowledge on Syariah Advisory Councils (e. g. in central bank, banking ristitutions and other financial institutions offering financial products)
ISSUES Poor Excellent
47 Aware of the existence of such 12345 boards
48 Aware on who is the key person 12345 of the board
49 Aware on major opinions of the 12345 board
50 Aware on the lists of halal 12345 counters announced by the board
327

Please state the frequency of your financial monitoring practice
ISSUES Weekly Monthly Onceevery 6 months
Yearly Never
51 How often you save 1 2 3 4 5 money which meant to be used in the future?
52 How often you monitor 1 2 3 4 5 your income and expenditures?
53 How often you monitor 1 2 3 4 5 your investments
54 How often you monitor 1 2 3 4 5 your retirement accounts?
Please indicate the usage of the sources of financial information you usually use to make financial decisions
ISSUES Use Greatly
Never
55 Business magazines 1 2 3 4 5 56 Newspaper-business 1 2 3 4 5
sections 57 Television programmes 1 2 3 4 5 58 Radio programmes 1 2 3 4 5 59 Representatives of 1 2 3 4 5
financial products (e. g. shares remisiers, insurance agents).
END OF QUESTIONNAIRES QUESTIONS
Thank you very much for answering the questionnaires and best wishes.
328

APPENDIX 5: THE REGRESSION RESULTS FOR ALL FINANCIAL ASSETS
A: THE REGRESSION RESULTS FOR THE DEMAND FOR UNIT TRUSTS
Variables Entered/Removed Model Variables Entered Variables
Removed Method
1 log net wealth, non-Malay, financial literacy, prefer Enter stocks, do not hire CFP, government, conventional unit trust, female, diploma, self employed, syariah literacy, secondary school, married, master's degree, propensity to plan, age more than 50, age less than 1 30 1
a All requested variables entered. b Dependent Variable: log unit trust
ANOVA Model Sum of
Squares df Mean
Square F Sig.
Regression 36.127 17 2.125 11.374 . 006 Residual 27.091 145 . 187
Total 63.217 162
a Predictors: (Constant), log net wealth, non-Malay, financial literacy, prefer stocks, do not hire CFP, government, conventional unit trust, female, diploma, self employed, syariah literacy, secondary school, married, master's degree, propensity to plan, age more than 50, age less than 30 b Dependent Variable: log unit trust
329

CnAfficients Unstandardized
Coefficients Standardized Coefficients
t Sig.
Model B Std. Error Beta I (Constant) -. 688 . 697 -. 987 . 325
aqe less than 30 . 647 . 130 . 355 4.969 . 000 aqe more than 50 . 430 . 101 . 292 4.255 . 000 Female -. 068 . 082 -. 053 -. 834 . 405 Married -. 187 . 108 -. 112 -1.737 . 084 non-Malay -. 182 . 146 -. 076 -1.250 . 213 secondary school . 092 . 155 . 037 . 590 . 556 Diploma -. 016 . 097 -. 011 -. 166 . 868 master's degýe-e . 087 . 094 . 059 . 927 . 355 self employed -. 229 . 117 -. 118 -1.954 . 053 Government -. 177 . 084 -. 138 -2.105 . 037 conventional unit trust
. 263 . 076 . 209 3.476 . 001
prefer stocks -. 077 . 078 -. 062 -. 981 . 328 do not hire CFP -. 125 . 142 -. 054 -. 884 . 378
_ svariah literacy . 004 . 005 . 050 . 804 . 423 propensity to plan . 010 . 017 . 040 . 599 . 550 ýinancial literacy -. 0091 . 00ý -. 0651 -1.0591 . 291 I loq net wealth 1 . 87ý . 1111 . 5741 7.8631 . 000
a Dependent Variable: log unit trust
g2gaciellialc Statistics Minimum Maximum Mean Std.
Deviation N
Predicted Value 3.3987 5.6794 4.4147 . 47223 163 Residual -. 8197 1.0769 . 0000 . 40893 16 Std. Predicted Value -2.151 2.678 . 000 1.000 163 IStd. Residual -1.8961 2.4911 . 0001 . 940 16jl a Dependent Variable: log unit trust
330

Scatterplot
3
(f)
W
Dependent Variable: log unit trust
13 13
cl
0 Oll 0a
CIO 00 13 0
0 0a 13
0 rp
0 cbO 0 0.0 00 lba 0
13 a cl 00 00 13 13 00
08 #13 CIO 00
13 0
0 13 IF.
.-0
0 13
-3 -2 -1 01
Regression Standardized Predicted Value
ED
331

B: THE REGRESSION RESULTS FOR THE DEMAND FOR SHARES
Variables Entered/Removed Model Variables Entered Variables
Removed Method
1 log net wealth, non-Malay, financial literacy, self Enter employed, secondary school, age less than 30, syariah literacy, do not hire CFP, age more than 50, master's degree, government, prefer stocks, propensity to plan, conventional shares, married, remale, diploma
a All requested variables entered. b Dependent Variable: log shares
Model Summant Model RR Square Adjusted R Std. Error of the Durbin-Watson I J_Square I
Estimate 1 . 720 . 5291 . 4231 . 44143 1.890
a Predictors: (Constant), log net wealth, non-Malay, financial literacy, self employed, secondary school, age less than 30, syariah literacy, do not hire CFP, age more than 50, master's degree, government, prefer stocks, propensity to plan, conventional shares, married, female, diploma b Dependent Variable: log shares
ANOVA Model Sum of
Squares df Mean
Square F Sig.
l Regression 16.439 17 . 967 4.962 . 000 Residual 14.615 75 . 195 Total 31.054 92
a Predictors: (Constant), log net wealth, non-Malay, financial literacy, self employed, secondary school, age less than 30, syariah literacy, do not hire CFP, age more than 50, master's degree, government, prefer stocks, propensity to plan, conventional shares, married, female, diploma b Dependent Variable: log shares
332

r. npffit-ipnts Unstandardized
Coefficients Standardize
d Coefficients
t Sig.
-W-o-del B Std. Error Beta l (Constant) 2.969 1.109 2.678 . 009 aqe less than 30 . 093 . 210 . 042 . 442 1 . 660 aqe more than 50 . 334 . 133 . 249 2.506 . 014 female -. 224 . 132 -. 191 -1.702 . 093 married -. 179 . 178 -. 108 -1.008 . 317 non-Malay -. 346 . 220 -. 168 -1.573 . 120 secondary school . 062 . 198 1 . 032 . 313 . 7561 diploma -. 126 . 1481 -. 101 -. 8551 . 39N master's degree -. 321 . 140 -. 236 -2.280 . 02E self employed -. 108 . 149 -. 071 -. 728 . 46S ciovernment -. 290 . 125 -. 219 -2.326 . 022 prefer stocks . 014 . 116 . 012 . 124 . 901 do not hire UP -. 751 . 183 -. 365 -4.106 . 00C syariah literacy -. 001 . 0071 -. 008 -. 078 . 938 propensity to plan -. 034 . 029 -. 114 -1.165 . 248 financial literacy . 003 . 015 . 021 . 215 R-41
r- conventional shares -. 263 . 136 -. 219 -1.935 057 log net wealth . 508 . 157 . 36, ý 3.233 . 002
'9- -Dependent Variable: log shares
onairlimic Statistirs Minimum Maximum Mean Std. Deviation N
Predicted Value 3.4944 5.4831 4.2357 . 42271 93 Residual -. 7932 1.1190 . 0000 . 39857 93
Std. Predicted Value -1.754 2.951 . 000 1.000 93 Std. Residual -1.797 2.535 . 000 . 903 93
a Dependent Variable: log shares
333

3
-0
-0 c m
Scatterplot
Dependent Variable: log shares
11
13
13
cl 0 13
0 a C3
C) 110
E] 11
Li K3 cp
C,
cl pq dm CID
13 C)
0
00
E3
-2 -1 U12
Regression Standardized Predicted Value
34
334

C: THE REGRESSION RESULTS FOR THE DEMAND FOR SAVINGS
Variables Entered/Removed Model Variables Entered Variables
Removed Method
1 log net wealth, government, syariah literacy, do Enter not hire CFP, financial literacy, prefer stocks, diploma, female, conventional savings, self employed, non-Malay, secondary school, master's degree, married, propensity to plan, age more ýhan 50, age less than 30
a All requested variables entered. b Dependent Variable: log savings
Model Summary Model RR Square Adjusted R Std. Error of the Durbin- II
Square I
Estimate Watson 1 . 5901 . 3481 . 2981 . 39726 1.88
a Predictors: (Constant), log net wealth, government, syariah literacy, do not hire CFP, financial literacy, prefer stocks, diploma, female, conventional savings, self employed, non- Malay, secondary school, masters degree, married, propensity to plan, age more than 50, age less than 30 b Dependent Variable: log savings
ANOVA Model Sum of
Squar s df Mean
Square F Sig.
Regression 18.460 17 1.086 6.881 . 000 Residual 34.561 219 . 158
Total 53.020 236 a Predictors: (Constant), log net wealth, government, syariah literacy, do not hire CFP, financial literacy, prefer stocks, diploma, female, conventional savings, self employed, non- Malay, secondary school, master's degree, married, propensity to plan, age more than 50, age less than 30 b Dependent Variable: log savings
335

Coefficients Unstandardized
Coefficients Standardized Coefficients
t Sig.
Model B Std. Error Beta l (Constant) 1.076 . 524 2.052 . 041
age less than 30 . 029 . 091 . 023 . 319 . 750
11 age more than 50 . 224 . 075 . 180 2.837 . 00 1
female . 124 . 05E . 125 2.139 . 0341 married -. 107 . 084 -. 081 -1.268 . 200 non-Malay -. 097 . 107 -. 055 -. 909 . 364
, secondary school
. 034 . 102 . 021 . 333 . 739
diploma -. 027 . 069 -. 026 -. 395 . 693 master's degree
-. 110 . 074 -. 094 -1.487 . 138 I
self employed . 202 . 091 . 133 2.216 . 028 qovernment -. 019 . 06C -. 019 -. 314 . 754 prefer stocks -. 084 . 058 -. 088 -1.457 . 147 do not hire UP
-. 194 . 111 -. 103 -1.748 . 082
syariah literacy . 012 . 003 . 217 3.49C . 001
propensity to plan
-. 014 . 01 I 074 -1.163 . 246
financial literacy
-. 003 . 00 I 027 I
-. 457 . 64 I
conventional savinqs
-. 055 . 056 -. 058 -. 985
loq net wealth . 54Q . 085 . 492 6.451 a Dependent Variable: log savings
onelfilinta AfAfictin-4%
Minimum Maximum Mean Std. Deviation
N
Predicted Value 3.5172 4.8787 4.0927 . 27968 237 Residual -. 9177 1.1963 . 0000 . 38268 237 Std. Predicted Value I -2.058 I
2.810 . 000 1.000 II
237
Std. Residual 1 -2.3101 3.0111 . 000 963 237
a Dependent Variable: log savings
336

Scatterplot
Dependent Variable: log savings
-0
-0
0 0
[up EP a 13 0 E313 0 [3 1300, C) 13
0 c :1 1311
11 13
at 13
LYcb C3 a ESE] 000
0o0 13 13 0
13 13
0 13 00
13P 13 UP
[3
0,13 113 0
o"I
-3 -2 -1 01
Regression Standardized Predicted Value
23
337

APPENDIX 6:
PAIR-WISE CORRELATION ANALYSIS FOR THE INDEPENDENT VARIABLES TO DETERMINE FOR POSSIBLE EXISTENCE OF
MULTICOLLINEARITY
338

'Correlations
Page 1

Correlations
syariah log income log wealth log net wealth literacv
log income Pearson Correlation 1 . 557" . 555" -. 082 Sig. (2-tailed)
. 000 . 000 . 198 N 254 254 252 251
log wealth Pearson Correlation . 557" 1 . 952*1 -. 005
Sig. (2-tailed) . 000 . 000 . 931
N 254 257 255 254 log net wealth Pearson Correlation
. 555" . 952*' 1 -. 009 Sig. (2-tailed)
. 000 . 000 . 882 N 252 255 255 252
syariah literacy Pearson Corr; lation -. 082 -. 005 -. 009 1 Sig. (2-tailed)
. 198 . 931 . 882 N 251 254 252 255
propensity to plan Pearson Correlation . 152* . 203*' . 200** . 153*
Sig. (2-tailed) . 016 . 001 . 001 . 015 N 252 255 253 253
financial literacy Pearson Correlation . 005 -. 013 -. 029 . 100 Sig. (2-tailed) . 940 . 837 . 640 . 113 N 253 256 254 254
Age Pearson Correlation . 195*' . 451*' . 517" -. 051 Sig. (2-tailed) . 002 . 000 . 000 . 417 N 254 257 255 255
-de n ýde r Pearson Correlation 177*' -. 203*1 -. 227*' -. 109 Sig. (2-tailed) . 005 . 001 . 000 . 082 N 254 257 255 255
arital Status Pearson Correlation . 151* . 374* . 388*' -. 012 Sig. (2-tailed) . 016 . 000 . 000 . 854 N 254 257 255 255
R'g--hesý Academic Pearson Correlation . 390" . 252*' . 276*' . 083 Education Sig. (2-tailed) . 000 . 000 . 000 . 186
N 254 257 255 255 b Sector Pearson Correlation 132* -. 119 124* . 001
Sig. (2-tailed) . 036 . 058 . 049 . 992 N 254 257 255 255
Race Pearson Corr; lation . 067 -. 027 -. 009 -. 297** Sig. (2-tailed) . 289 . 664 . 887 . 000 N 254 257 255 255
Choice of Unit Pearson Correlation -. 055 . 087 . 069 . 149* Trusts Holding Sig. (2-tailed) . 383 . 163 . 275 . 017
N 254 257 255 255 Saving Pearson Correlation -. 068 . 011 -. 015 . 126*
Accounts Sig. (2-tailed) . 281 . 866 . 815 . 044
N 254 257 255 255 Choice of Shares Pearson Correlation
. 168*1 . 165" . 166*1 . 033 Sig. (2-tailed)
. 007 . 008 . 008 . 597 N 254 257 255 255 Pearson Correlation Bonds or Stocks
. 085 . 069 . 095 . 175** Preferences Sig. (2-tailed)
. 185 . 280 . 138 . 006 N 245 248 247 246
Page 2

Correlations
syariah
- log income loq wealth log net wealth literacv
rvice of Certified Pearson Correlation ýTe -. 011 7069
-. 011 -. 057 Financial Planners Sig. (2-tailed) 5 . 270
. 866 . 367 N 254
1 257 255 255
Page 3

Correlations
propensity to financial
- plan lit Ae Gender Marital Status log income Pearson CF relation . 152* . 005 . 195" -. 177" . 151*
Sig. (2-tailed) . 016 . 940 . 002 . 005 . 016
N 252 253 254 254 254 log wealth Pearson Correlation
. 203*' -. 013 . 451 -. 203*' . 374** Sig. (2-tailed)
. 001 . 837 . 000 . 001 . 000 N 255 256 257 257 257
log net wealth Pearson Correlation . 200*0 -. 029 . 517*0 -. 227" . 388**
Sig. (2-tailed) . 001 . 640 . 000 . 000 . 000
N 253 254 255 255 255 syariah literacy Pearson Correlation
. 153* . 100 -. 051 -. 109 -. 012 Sig. (2-tailed) . 015 . 113 . 417 . 082 . 854 N 253 254 255 255 255
propensity to plan Pearson Correlation 1 . 328" . 035 -. 044 . 088 Sig. (2-tailed)
. 000 . 578 . 480 . 160 N 256 255 256 256 256
Tin-ýancial literacy Pearson Correlation . 328*' 1 . 000 . 043 . 016 Sig. (2-tailed) . 000 . 994 . 488 . 797 N 255 257 257 257 257
Age Pearson Correlation . 035 . 000 1 210" . 344** Sig. (2-tailed) . 578 . 994 . 001 . 000 N 256 257 258 258 258
-5-e-n-d er Pearson Correlation -. 044 . 043 -. 210*1 1 -. 045 Sig. (2-tailed) . 480 . 488 . 001
. 472 N 256 257 258 258 258
Marital Status Pearson Correlation . 088 . 016 . 344*1 -. 045 1 Sig. (2-tailed) . 160 . 797 . 000 . 472 N 256 257 258 258 258
Highest Academic Pearson Correlation -. 046 -. 043 . 014 -. 069 -. 099 EdL, cation Sig. (2-tailed) . 468 . 491 . 817 . 271 . 111
N 256 257 258 258 258 jo Sector Pearson Correlation . 113 -. 004 -. 104 . 145* -. 074
Sig. (2-tailed) . 071 . 948 . 096 . 020 . 236 N 256 257 258 258 258
Race Pearson Correlation . 013 . 015 . 024 . 078 -. 041 Sig. (2-tailed) . 835 . 815 . 697 . 211 . 517 N 256 257 258 258 258
-Uh-oice of Unit Pearson Correlation -. 008 -. 045 . 038 . 066 -. 102 Trusts Holding Sig. (2-tailed)
. 904 . 477 . 548 . 287 . 103 N 256 257 258 258 258
Choice of Saving Pearson Correlation -. 100 . 045 -. 145* . 084 -. 085 Accounts Sig. (2-tailed)
. 111 . 472 . 019 . 178 . 175 N 256 257 258 258 258
Choice of Shares Pearson Correlation . 286*11 . 168** . 138* . 168*' . 025
Sig. (2-tailed) . 000 . 007 . 027
. 007 . 694 N 256 257 258 258 258
Bonds or Stocks Pearson Correlation . 100 -. 021 -. 136* . 059
Preferences Sig. (2-tailed) . 118 . 736 . 004 . 032 . 357
N 247 248 249 249 249
Page 4

Correlations
propensity to financial plan literacv Age Gender
Service of Certified Pearson Correlation -. 122 -. 066 . 043 . 080 Financial Planners Sig. (2-tailed) 051 . . 292 . 495 . 203
N1 256 257 258 258
Marital Status
. 050
. 423 258
Page 5

Correlations
Highest Choice of Choice of Academic Unit Trusts Saving Education Job Sector Race Holding Accounts
log income Pearson Correlation . 390*' -. 132* . 067 -. 055 -. 068
Sig. (2-tailed) . 000 . 036 . 289 . 383 . 281
N 254 254 254 254 254 log wealth Pearson Correlation
. 252*1 -. 119 -. 027 . 087 . 011 Sig. (2-tailed)
. 000 . 058 . 664 . 163 . 866
N 257 257 257 257 257 log net wealth Pearson Correlation
. 276** 124* -. 009 . 069 -. 015 Sig. (2-tailed)
. 000 . 049 . 887 . 275 . 815 N 255 255 255 255 255
syariah literacy Pearson Correlation . 083 . 001 -. 297*' . 149* . 126*
Sig. (2-tailed) . 186 . 992 . 000 . 017
. 044 N 255 255 255 255 255
propensity to plan Pearson Correlation -. 046 . 113 . 013 -. 008 -. 100 Sig. (2-tailed)
. 468 . 071 . 835 . 904 . 111 N 256 256 256 256 256
inancial literacy Pearson Correlation -. 043 -. 004 . 015 -. 045 . 045 Sig. (2-tailed)
. 491 . 948 . 815 . 477 . 472 N 257 257 257 257 257
Age Pearson Correlation . 014 -. 104 . 024 . 038 -. 145*
Sig. (2-tailed) . 817 . 096 . 697 . 548 . 019 N 258 258 258 258 258
-U, e-nder Pearson Correlation -. 069 . 145* . 078 . 066 . 084 Sig. (2-tailed) . 271 . 020 . 211 . 287
. 178 N 258 258 258 258 258
tatus Marital St Pearson correlation -. 099 -. 074 -. 041 -. 102 -. 085 Sig. (2-tailed) . 111 . 236 . 517 . 103
. 175 N 258 258 258 258 258
H17g-hest Academic Pearson Correlation 1 -. 062 -. 031 . 145* . 028 Education Sig. (2-tailed) . 320 . 620 . 020
. 649 N 258 258 258 258 258
job sector Pearson Correlation -. 062 1 . 042 . 048 . 028
Sig. (2-tailed) . 320 . 503 . 443
. 650 N 258 258 258 258 258
Race Pearson Correlation -. 031 . 042 1 -. 106 -. 080 Sig. (2-tailed)
. 620 . 503 . 088 . 202
N 258 258 258 258 258 -Eh-oice of Unit Pearson Correlation
. 145* . 048 -. 106 1 . 185**
Trusts Holding Sig. (2-tailed) . 020 . 443 . 088
. 003 N 258 258
_258 258 258
'Choice of saving Pearson Correlation . 028 . 028 -. 080 . 185*' 1
Accounts Sig. (2-tailed) . 649 . 650 . 202 . 003
N 258 258 258 258 258 Choice of Shares Pearson Correlation -. 042 . 098 . 007 . 059
. 040 Sig. (2-tailed)
. 501 . 116 . 906 . 341
. 521 N 258 258 258 258 258
-Fo-nd-s or Stocks Pearson Correlation -. 050 -. 102 -. 035 -. 218" -. 027 Preferences Sig. (2-tailed)
. 434 . 109 . 580 . 001 . 672 N 249 249 249 249 249
Page 6

Correlations
Highest Choice of Choice of Academic Unit Trusts Saving Education Job Sector Race Holding Accounts
Service of Certified Pearson Correlation . 089 -. 037 -. 026 -. 18 14 Financial Planners Sig. (2-tailed) . 155
1 I
. 559 . 677 . 004 , 021 02 I]
N 258 258 2 258 8 8 5, __
Page 7

Correlations
Service of Bonds or Certified Choice of Stocks Financial Shares Preferences Planners
log income Pearson Z! orreiation . 168*' . 085 -. 011 Sig. (2-tailed) . 007 . 185 . 856
N 254 245 254 log wealth Pearson Correlation
. 165*' . 069 -. 069 Sig. (2-tailed)
. 008 . 280 . 270 N 257 248 257
log net wealth Pearson Correlation . 166** . 095 -. 011
Sig. (2-tailed) . 008 . 138 . 866
N 255 247 255 syariah literacY Pearson Correlation l i e r 033 ' . 175* -. 057
Sig. (2-tailed) . 597
]
. 006 . 367 N
F
255 246 255 sity to o plan Pearson Correlation propensi t y t . 286 . 100 -. 122
Sig. (2-tailed) . 000 . 118 . 051 N 256 247 256
7, n'anciai literacy Pearson Correlation . 168*' -. 021 -. 066 Sig. (2-tailed) . 007 . 736 . 292 N 257 248 257
Age Pearson Correlation . 138* -. 181*1 . 043 Sig. (2-tailed) . 027 . 004 . 495 N 258 249 258
Gender Pearson Correlation . 168" -. 136* . 080 Sig. (2-tailed) . 007 . 032 . 203 N 258 249 258
Marital Status Pearson Correlation . 025 . 059 . 050 Sig. (2-tailed) . 694 . 357 . 423 N 258 249 258
l- ýIghe-stAcademic Pearson Correlation -, 042 -. 050 . 089 Education Sig. (2-tailed) . 501 . 434 . 155
N 258 249 258 Job Sector Pearson Correlation . 098 -. 102 -. 037
Sig. (2-tailed) . 116 . 109 . 559 N 258 249 258
Race Pearson Correlation . 007 -. 035 -. 026 Sig. (2-tailed) . 906 . 580 . 677 N 258 249 258
oice of Unit Pearson Correlation . 059 -. 218*0 -. 181** Trusts Holding Sig. (2-tailed)
. 341 . 001 . 004 N 258 249 258
-Ehoice of saving Pearson correlation . 040 -. 027 144*
Accounts Sig. (2-tailed) . 521 . 672 . 021
N 258 249 258 -C-ho-ic-e of-Shares Pearson Correlation 1 . 078 -. 080
Sig. (2-tailed) . 219 . 202
N ý -
258 249 258 B, on, ds OrStock s Pearson Correlation
. 078 1 . 031 Preferences Sig. (2-tailed)
1
. 219 . 629
N 249 249 249
Page 8

Correlations
Service of Bonds or Certified
Choice of Stocks Financial Shares Preferences Planners
Service of Certified Pearson Correlation -. 080 . 031 1 Financial Planners Sig. (2-talled)
. 202 . 629 N1 258 1 249 1 258
Correlation is significant at the 0.01 level (2-tailed). Correlation is significant at the 0.05 level (2-tailed).
Page 9
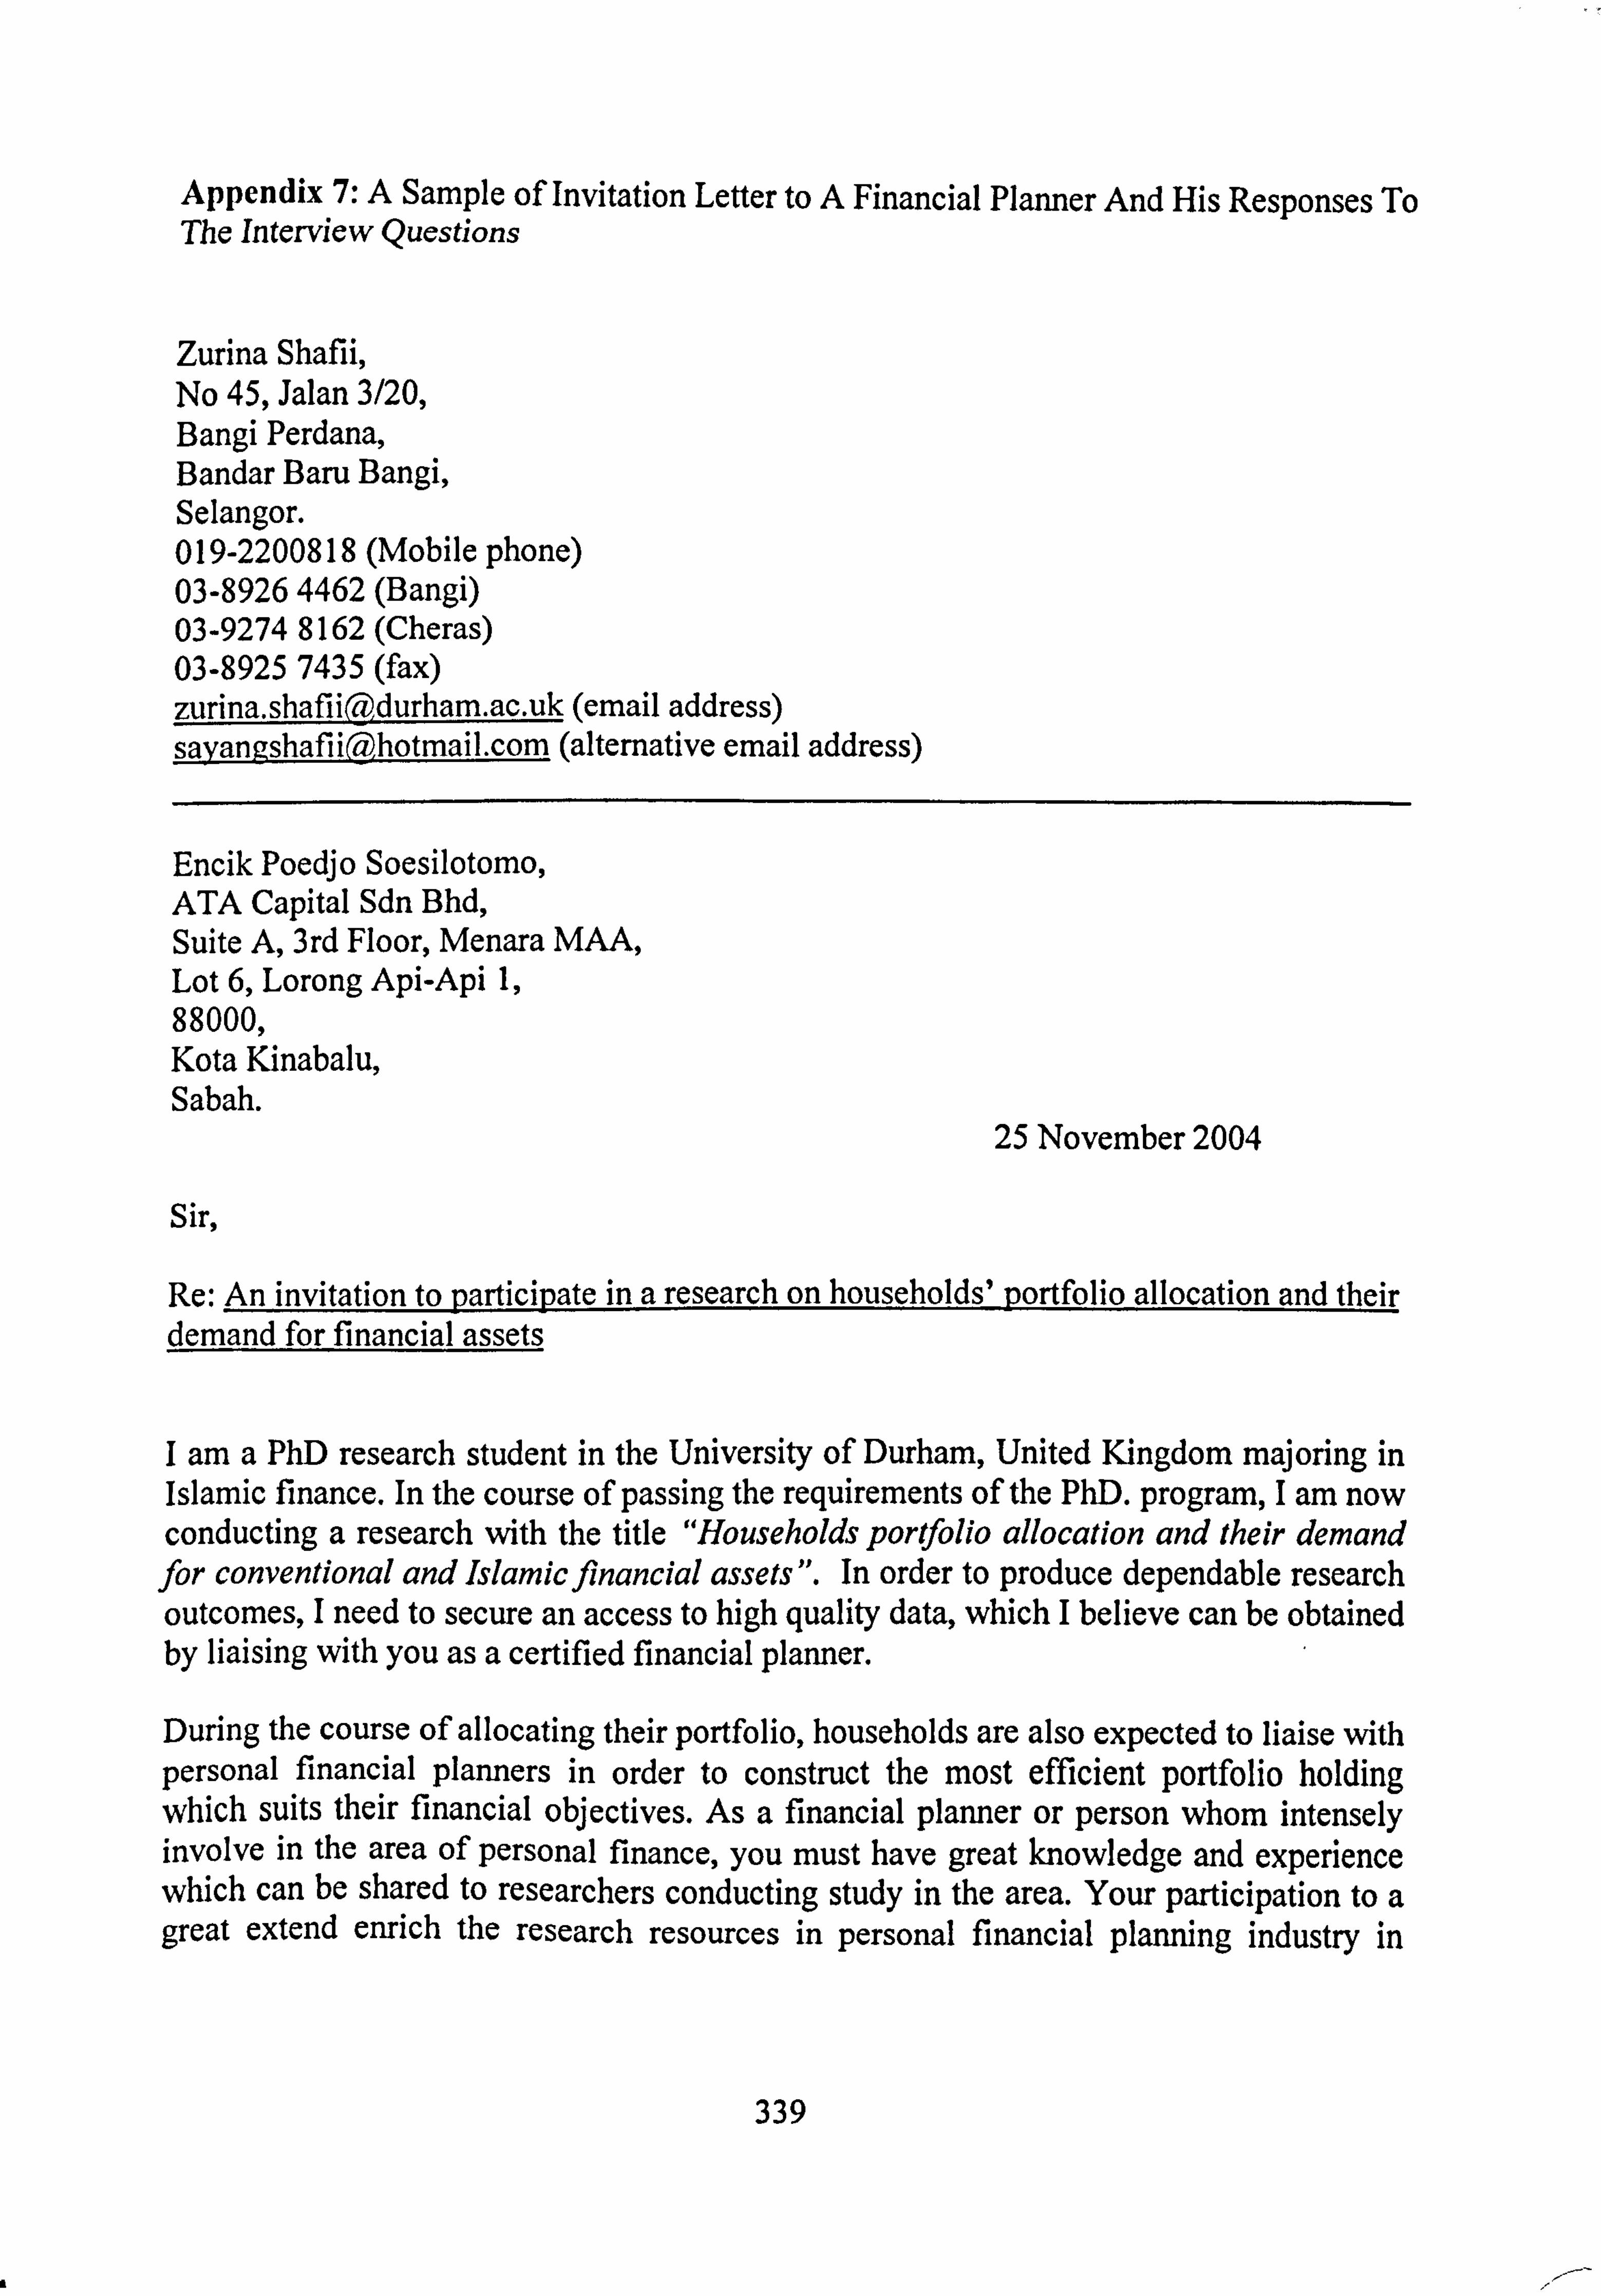
Appendix 7: A Sample of Invitation Letter to A Financial Planner And His Responses To The Interview Questions
Zurina Shafli, No 45, Jalan 3/20, Bangi Perclana, Bandar Baru Bangi, Selangor. 0 19-2200818 (Mobile phone) 03-8926 4462 (Bangi) 03-9274 8162 (Cheras) 03-8925 7435 (fax) zurina. shafii(q-), durham. ac. uk (email address) savangshafHO), hotmail. com (alternative email address)
Encik Poedjo Soesilotorno, ATA Capital Sdn Bhd, Suite A, 3rd Floor, Menara MAA, Lot 6, Lorong Api-Api 1, 88000, Kota Kinabalu, Sabah.
25 November 2004
Sir,
Re: An invitation to participate in a research on households' portfolio allocation and their demand for financial assets
I am a PhD research student in the University of Durham, United Kingdom majoring in Islamic finance. In the course of passing the requirements of the Phl). program, I am now conducting a research with the title "Households porýfolio allocation and their demand for conventional and Islamic financial assets ". In order to produce dependable research outcomes, I need to secure an access to high quality data, which I believe can be obtained by liaising with you as a certified financial planner.
During the course of allocating their portfolio, households are also expected to Raise with personal financial planners in order to construct the most efficient portfolio holding which suits their financial objectives. As a financial planner or person whom intensely involve in the area of personal finance, you must have great knowledge and experience which can be shared to researchers conducting study in the area. Your participation to a great extend enrich the research resources in personal financial planning industry in
339

Malaysia which is less resourceful in comparison to other markets such as US, UK, Italy and Japan.
The semi-structured interview sessions are planned to be conducted between the dates beginning from 7 th December 2004 to 31't January 2005 to ask for your responses and opinion on the research subject briefed as above. You may agree to set up an appointment date for a face-to-face interview or fax, post, or email your responses. Leaving the modes of answering questions open will hopefully facilitate you to respond to the interview questions using method that best suites you.
Your responses will be held in confidence. No individual response will be shared with other parties. Survey results will solely be used for academic purpose and to fulfill the requirements of the Phl). program. Finally, your willingness to participate in this research project is greatly appreciated. I
Best wishes and thank you again.
Sincerely,
Zurina Shafii, PhD. Research student in Islamic Finance, University of Durham, United Kingdom
cc:
1) Professor Rodney Wilson, Professor in Economics, University ofDurham (Supervisorfor the research)
2) FPAM Kuala Lumpur
3) Professor Muhammad Bin Muda, Dean, Faculty ofEconomics and Mvamalat, Islamic University College of Malaysia, Malaysia
4) Customer & Agent Relation Department, Amanah Saham Nasional Berhad, Kuala Lumpur.
340

Semi-structured interview questions with personal financial planners
For a PhD. research on "Households'portfolio allocation and demandforfinancial assets
according to the life cycle hypothesis "
Estimated interview time: 45 minutes to 1 hour
SECTION A. CERTIFIED FINANCIAL PLANNERS RELATED QUESTIONS
Al. Background of financial planners What qualification/s do you currently hold?
4 Certified Financial Planning (CFP) qualification
F-1 SC qualification as an IALARL and managing client's fund
Certified Insurance qualification RFP and FChFP
Others, please state _Lvlamic Financial Planning Cerifficale, IFPC
2. How many years have you been operated as a certified personal financial planner?
F-I Less than one year 4 1-2 years
F-I 3-5 years
F7 5 years and more
341

3. What is your age range?
25-30 years
31-35 36-40
41-50 1-1 50-above
4. You are 4 Male
F-I Female
A2. Background of practice of financial planners, i. e. practice
demographics
5. Do you offer partial or comprehensive financial planning?
Fý Partial
4 Comprehensive
Ifyou are doing partialfinancial planning, please go to question 6
Ifyou are doing comprehensivefinancial planning, please go to
question 7
6. What types of partial/slice financial planning activities you involve in
providing services? Please tick at the appropriate boxes
342

Types of activities Involvement (Yes/No) i. credit and borrowing financial planning ii. investment planning
7. What types of comprehensive financial planning you offer? Please
tick at the appropriate boxes
Types of activities Involvement Yes/No)
i. Basic financial planning Yes ii. Insurance and risk management Yes iii. Investment Yes, Through Associales iv. Tax management 1es, Through Associates v. Retirement planning Yes vi. Estate planning YCIS
8. Do you offer other services apart from financial planning advice? Yes, Throiýgh., lssociatcs Yes
Fj No
Ifves please state yes or no in thefollowing boxes on other types of
services.
343

Types of services Involvement
(Yes/No)
i. accounting Yes, Through Associates
ii. financial services Yes, ie Will writing, Trust creation. morigage restructuring and ivasiat and hibah in nearjWure
9.
10.
11.
What are the types of major clients which you provide with the advice
of personal financial planning?
Institutions
Individuals
How many clients you are currently managing at this point of time?
F-I Less than 10
4 10-20
F-I 21-40
F-I 41-50
F7 More than 50
What is the average length of relationship do you have with your individual clients? 1: 1 1 year
F-I 2 years
171 3 years 1-1 5 years
344

q Morethan5years It should be as long aspossible since FP is a
process 1hal requires monilorhkg and review
A3. Financial aspects of financial planner's practice i. e. practice
economics
12. What is the primary method of compensation applied to your financial
planning services?
Fees
Commission
13. How much is the average hourly rate applies to your advice of financial planning? Not related to Q. 12
r-ý Less than RM100.00
Fý RM 100.00-150.00
Fý RM 151- 200.00
F-I RM 201.00 -250.00 F1 More than RM 250.00
14. Are you involved in managing clients' assets?
Yes Indirectly, Obtain advicefrom Fund managers and Investment advisors
7 No
345
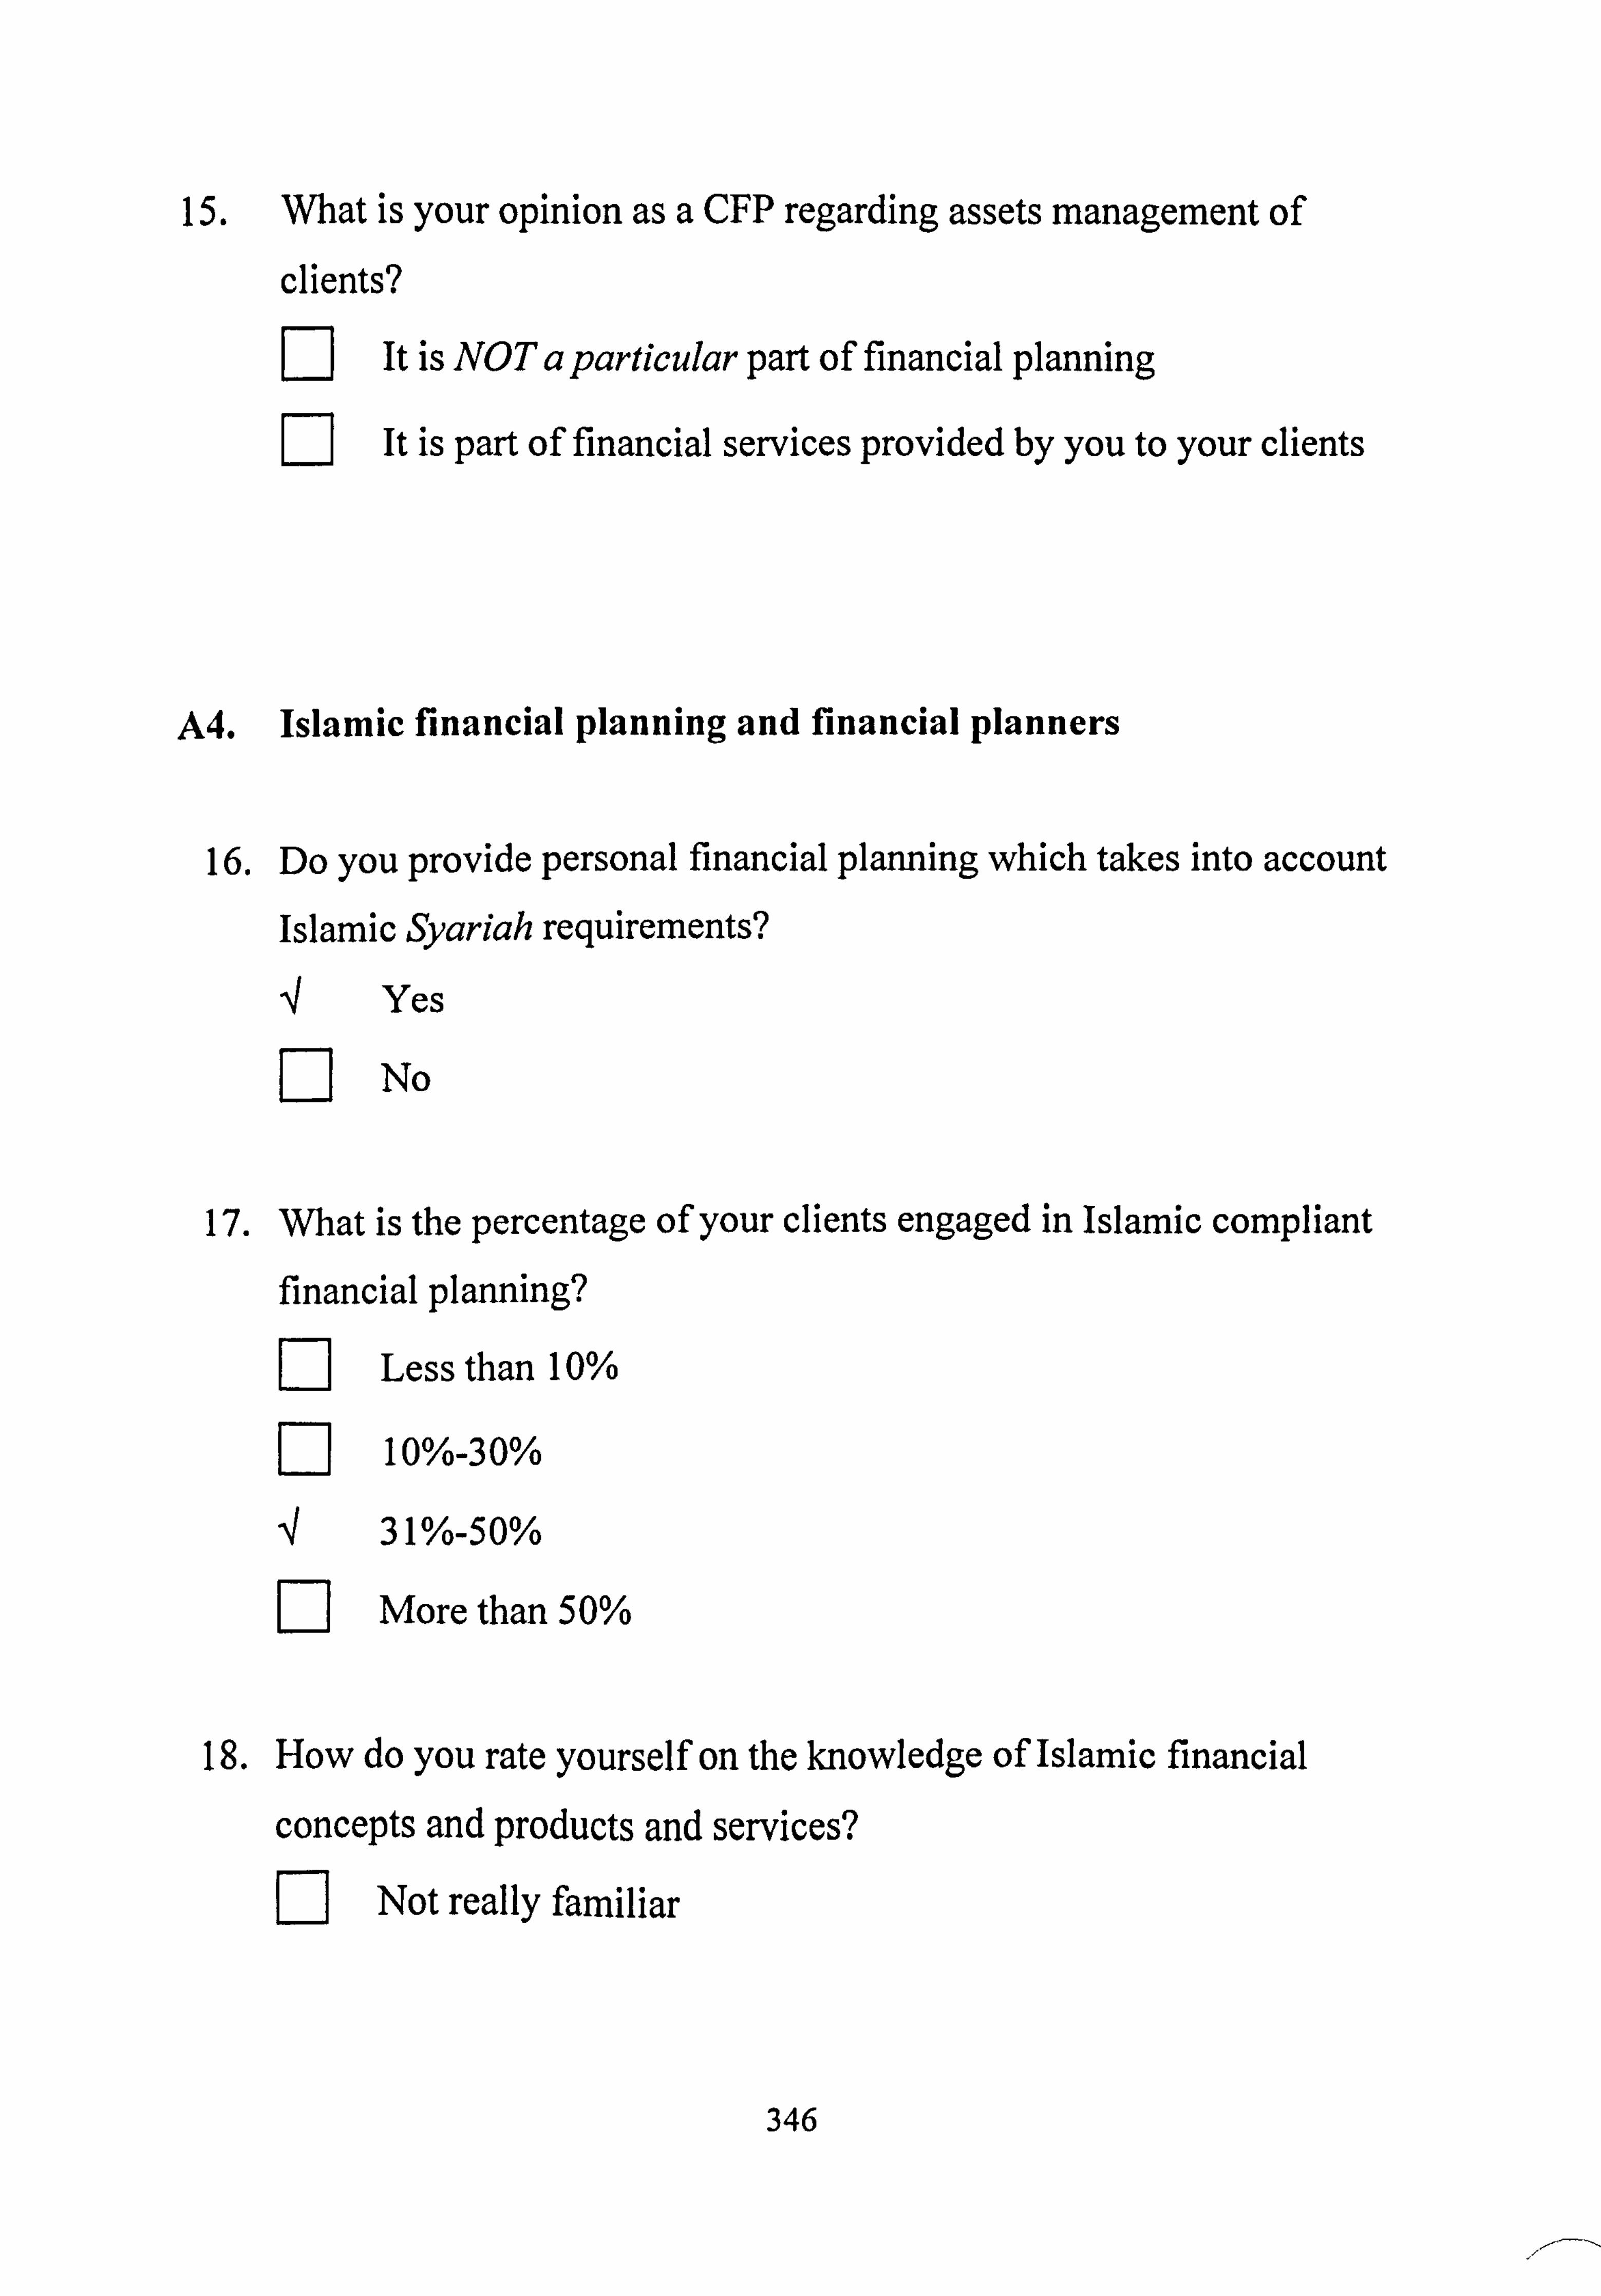
15. What is your opinion as a CFP regarding assets management of
clients?
F-1 It is NOT a particular part of financial planning Fý It is part of financial services provided by you to your clients
Islamic financial planning and financial planners
16. Do you provide personal financial planning which takes into account Islamic Syariah requirements? 4 Yes F-ý No
17. What is the percentage of your clients engaged in Islamic compliant financial planning?
F-I Less than 10%
Fý 10%-30%
q 31%-50%
7 More than 50%
18. How do you rate yourself on the knowledge of Islamic financial
concepts and products and services? Fý Not really familiar
346

[-] Possess understanding on the basics of Islamic financial
concepts 4 Well versed on Islamic financial concepts but do not offer much
advice due to the lack of demand from clients F-] Well versed on Islamic financial concepts as well as engaged in
many portfolios of Islamic financial planning
19. In your opinion, what is the most effective ways to promote Islamic
compliant financial planning? All
Marketing through mass media
Direct advice to clients
Others, please state in the blank space below
The regulators should introduce the Islamic financial Planning
Course to CFPs or RFPs making it also a prerequisite for anyone
offeringfinancial planning advice to Muslim clients. WithoutIslamic
FP knowledge, a conventional FP could in fact give wrong or incomplete advice to his Muslim clients.
SECTION B. CLIENTS'RELATED QUESTIONS
B1. Client's demographics and economics
20. Can you please give percentages to the range of age of your clients to
the total of your clients' base?
I Client's age I Percentage (%) I
347

i. Less than 26
ii. 26-30
iii. 31-40 80
iv. 41-50 10
v. 50 years and above 10
21. What the gender of your average client? [-ý Male 70%
[71 Female 30%
22. What is the percentage of race of your total clients?
Race Percentage ii. Chinese 30% iii. Malay 50% RV. Indian 0 I V. Others
1 20%
23. Can you distribute your total clients into the following range of annual
income? Range of annual income Percentages
i. Less than RM 50,000 50
ii. RM 5 1,000-100,000 30
i. RM 100,001-300,000 20
iv. more than RM
300,000
5
24. What is the net worth of a typical client of yours?
348

Less than 20,000
20,001- 50,000 50,001-100,000
100,000-200,000
More than 200,000
25. Can you suggest the percentage of savings and investments made by
average client out of their income looking at a monthly basis?
Less than 10%
10%-20%
Fý 21%-30%
r-I More than 30%
26. What is your opinion on the level of personal financial planning
awareness among Malaysian households? You may write your
opinion in the space below.
The awareness is still low as the FP industry is also in its infancy
stage. Given time, Iforesee that the average Malaysian would want to
meet a FP to discuss issues related to FR However, I still believe that
the Insurance, Unit Trust and Will Writing Professional would be the
ones making inroads in promoting FP as there are more
sales/marketing oriented The FPs from the accountants, remisiers fraternity etc would be slower in promoting FP to the masses as they
are known to be 'order takers' unless they too become more aggressive in marketing their know-how.
349

B2. Client's attitude about Syariah Compliancy
27. If you were to rate the knowledge of your clients which involves in
Islamic financial planning on Syariah requirements, which categories
can they best fit into? You may also add your opinion in the spaces
below
Need much explaining on the concepts and basics
Need only assistance in the allocation process, for instance,
where and how much to invest
F-I Other comments and opinion as below
However, many are still not aware on major areas ofEstate planning
ie Faraid, Hibah as well as Wasiat and Trusts as instruments
available to them to do proper estate planning
28. Do you reckon that clients who actively involves Islamic financial
planning placing great importance on Syariah compliancy issue before
investing? Or rather they are more interested with the economic
aspects of the products. 4 Syariah compliancy comes first
Fý Attractive returns is more important
4 Other comments and opinion as below
For clients who are serious andparticular about Syariah compliancy issues, they would insist on syariah approved investments, The
350

economic aspects come a distant second. In some cases, Islamic
investments sometimes outperform conventional ones.
29. What are other issues you would like to highlight on the subject of
personal financial planning and Islamic personal financial planning?
Please write your opinion in the spaces below.
Please refer to Q. 19. In addition, Malaysia having a predominantly Islamic population and endeavoring to be the regional hubfor Islamic
Finance should seriously introduce the Islamic Financial Planning
Course to the up and coming Financial Planners who plan to offer FP
advice to the Muslim community.
B3. Client's financial planning expertise
During the process of establishing personal financial plans with your clients,
you must have assessed the level of financial planning knowledge of your
clients. In general, how did you find their level of financial planning that
they have? Can you possibly state a series of scores on the knowledge of
your clients on major aspects of financial planning by ticking in the
appropriate boxes below?
Types of knowledge poor medium Excellent i. Establishing and evaluating financial goals fl. Basic characteristics of financial products
iii. Money I management I
351

iv. Investments
v. Retirement planning
v. Taxes
vi. Insurance
vii. Estate planning
End of interview questions. Thank you for your participation.
352
a
Related Documents