The LEGO Group Annual Report 2015 CVR: 54 56 25 19

Welcome message from author
This document is posted to help you gain knowledge. Please leave a comment to let me know what you think about it! Share it to your friends and learn new things together.
Transcript

The LEGO Group
Annual Report 2015 CVR: 54 56 25 19
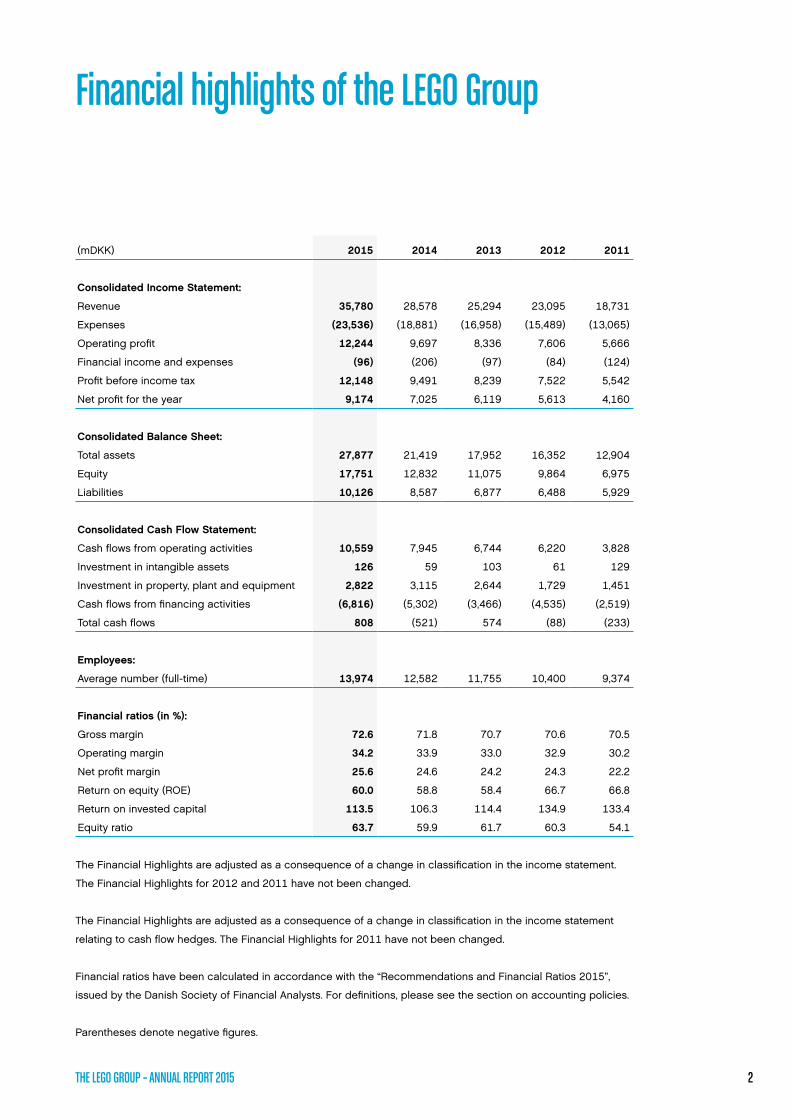
Financial highlights of the LEGO Group
(mDKK) 2015 2014 2013 2012 2011
Consolidated Income Statement:
Revenue 35,780 28,578 25,294 23,095 18,731
Expenses (23,536) (18,881) (16,958) (15,489) (13,065)
Operating profit 12,244 9,697 8,336 7,606 5,666
Financial income and expenses (96) (206) (97) (84) (124)
Profit before income tax 12,148 9,491 8,239 7,522 5,542
Net profit for the year 9,174 7,025 6,119 5,613 4,160
Consolidated Balance Sheet:
Total assets 27,877 21,419 17,952 16,352 12,904
Equity 17,751 12,832 11,075 9,864 6,975
Liabilities 10,126 8,587 6,877 6,488 5,929
Consolidated Cash Flow Statement:
Cash flows from operating activities 10,559 7,945 6,744 6,220 3,828
Investment in intangible assets 126 59 103 61 129
Investment in property, plant and equipment 2,822 3,115 2,644 1,729 1,451
Cash flows from financing activities (6,816) (5,302) (3,466) (4,535) (2,519)
Total cash flows 808 (521) 574 (88) (233)
Employees:
Average number (full-time) 13,974 12,582 11,755 10,400 9,374
Financial ratios (in %):
Gross margin 72.6 71.8 70.7 70.6 70.5
Operating margin 34.2 33.9 33.0 32.9 30.2
Net profit margin 25.6 24.6 24.2 24.3 22.2
Return on equity (ROE) 60.0 58.8 58.4 66.7 66.8
Return on invested capital 113.5 106.3 114.4 134.9 133.4
Equity ratio 63.7 59.9 61.7 60.3 54.1
The Financial Highlights are adjusted as a consequence of a change in classification in the income statement.
The Financial Highlights for 2012 and 2011 have not been changed.
The Financial Highlights are adjusted as a consequence of a change in classification in the income statement
relating to cash flow hedges. The Financial Highlights for 2011 have not been changed.
Financial ratios have been calculated in accordance with the “Recommendations and Financial Ratios 2015”,
issued by the Danish Society of Financial Analysts. For definitions, please see the section on accounting policies.
Parentheses denote negative figures.
THE LEGO GROUP – ANNUAL REPORT 2015 2

Contents
2 Financial Highlights of the LEGO Group
4 Company Information
5 Management’s Review
10 Management’s Statement
11 Independent Auditor’s Report
13 The LEGO Group Financial Statements 14 Consolidated Income Statement and
Consolidated Statement of Comprehensive Income
15 Consolidated Balance Sheet
17 Consolidated Statement of Changes in Equity
18 Consolidated Cash Flow Statement
19 Notes
58 Parent Company Financial Statements 59 Income Statement
60 Balance Sheet
62 Statement of Changes in Equity
63 Notes
71 Group Structure
LEGO A/S Aastvej 1 DK-7190 Billund Denmark Tel: +45 79 50 60 70 CVR no: 54 56 25 19 Incorporated: 19 December, 1975 Residence: Billund Financial Year: 1 January – 31 December Internet: www.LEGO.com
Annual Report 2015 is published for the LEGO Group by Finance and Corporate Brand Communications. Design: Kontrapunkt. Print: Rosendahls. Printed copies: 100.
LEGO, the LEGO logo, the Minifigure, DUPLO, the FRIENDS logo, DIMENSIONS and NINJAGO are trademarks of the LEGO Group. ©2016 The LEGO Group.© & ™ Lucasfilm Ltd. ™ & © Warner Bros. Entertainment Inc.
THE LEGO GROUP – ANNUAL REPORT 2015 3

Company Information
Management Board
Jørgen Vig Knudstorp
President and Chief Executive Officer
John Goodwin
Executive Vice President and Chief Financial Officer
Julia Goldin
Executive Vice President and Chief Marketing Officer
Loren I. Shuster
Executive Vice President and Chief Commercial Officer
Bali Padda
Executive Vice President and Chief Operations Officer
Auditors
PricewaterhouseCoopers
Statsautoriseret Revisionspartnerselskab
Board of Directors
Niels Jacobsen
Chairman of the Board and member since 2008.
President and CEO of William Demant Holding A/S. Deputy Chairman of the Board of KIRKBI A/S. Deputy Chairman of the Board of A.P. Møller-Mærsk A/S. Deputy Chairman of the Board of Jeudan A/S. Chairman of the Board of Össur hf. Member of the Board of Boston Holding A/S.
Kjeld Kirk Kristiansen
Deputy Chairman of the Board since 1996.
Chairman of the Board of KIRKBI A/S and board member in 6 fully owned subsidiaries. Chairman of the Board of LEGO Foundation, Ole Kirk’s Foundation and Koldingvej 2, Billund A/S. Member of the Board of Capital of Children Office A/S. President and CEO of the LEGO Group 1979-2004.
Thomas Kirk Kristiansen
Member of the Board since 2007.
Representing the fourth generation of the owner family. Member of the Board of KIRKBI A/S and board member in 4 fully owned subsidiaries. Deputy Chairman of the Board of the LEGO Foundation. Executive Management member of Kirk & Kirk Holding ApS and management roles in 4 subsidiaries.
Kåre Schultz
Member of the Board since 2007.
CEO of H. Lundbeck A/S. Chairman of the Board of Royal Unibrew A/S.
Søren Thorup Sørensen
Member of the Board since 2010.
CEO of KIRKBI A/S, KIRKBI Invest A/S and Koldingvej 2, Billund A/S. Chairman of the Board of K&C Holding A/S and Boston Holding A/S. Deputy Chairman of KIRKBI AG and INTERLEGO AG. Chairman of Topdanmark A/S, Topdanmark Forsikring A/S and Danske Forsikring A/S. Member of the Board of LEGO Juris A/S, KIRKBI Invest A/S, TDC A/S, Falck Holding A/S, Koldingvej 2, Billund A/S, Ole Kirk’s Fond and Merlin Entertainments PLC.
Eva Berneke
Member of the Board since 2011.
CEO of KMD A/S. Member of the Board of Schibsted. Member of the Board of DTU. Member of the Foreign Economic Forum. Member of the Board of Directors of Nationalbanken.
Jan Nielsen
Member of the Board since 2013.
Senior Managing Director and Partner in Blackstone. Chairman of the Board of Antares Restaurants Group. Member of the Board of Blackstone Hong Kong. Member of the Board of Ixom Ltd. Member of the Board of Simone Acc. Collection.
THE LEGO GROUP – ANNUAL REPORT 2015 4

Management’s Review
The LEGO Group delivered a year of exceptional growth
in 2015. Revenue increased by 25.2% in 2015 to DKK
35.8 billion against DKK 28.6 billion the year before. This
was on top of a particularly strong 2014 that was aided
by the successful LEGO Movie.
Revenue growth excluding foreign exchange impacts
was 19.3% year over year (on a local currency basis).
All the LEGO Group’s market regions experienced
double digit sales growth while the traditional toy mar-
ket in most countries grew by mid-single digit rates.
The LEGO Group’s profit before tax amounted to DKK
12.1 billion in 2015 against DKK 9.5 billion the year
before, a growth of 28.0%. The result is considered
highly satisfactory.
Operating profit
The LEGO Group’s operating profit amounted to DKK
12.2 billion in 2015 against DKK 9.7 billion in 2014.
The operating margin was 34.2% in 2015 against 33.9%
in 2014.
Financial income and expenses
Net financials created a total expense of DKK 96 million
in 2015 against an expense of DKK 206 million in 2014.
Corporate income tax
Corporate income tax amounts to DKK 3.0 billion
against DKK 2.5 billion the year before. The effective tax
rate for the year is 24.5% against 26.0% in 2014.
Profit for the year
The LEGO Group’s profit for the year amounted to DKK
9.2 billion in 2015 against DKK 7.0 billion in 2014, which
is higher than expected at the beginning of the year.
The positive results are closely related to the LEGO
Group’s strategy of globalising its operations. This has
resulted in reaching new consumers in new areas of the
world. The results are further driven by the continued,
innovative expansion of the product portfolio. As new
products make up approximately 60% of the total
sales each year, an innovative and consumer- oriented
development process is key to continued success.
Delivering on customer and consumer demands has
been enabled by a focus on continuous improvement
and a strong collaboration across the entire value chain
while evolving the company’s organisation design to
ensure ability to support the broader global reach in a
consis tent and cohesive manner.
THE LEGO GROUP – ANNUAL REPORT 2015 5

Cash flows and equity
The LEGO Group’s assets increased by DKK 6.5 billion
in 2015 and amount to DKK 27.9 billion against DKK
21.4 billion at the end of 2014.
Cash flows from operating activities amounted to DKK
10.6 billion against DKK 7.9 billion in 2014.
After recognition of the profit for the year and distribu-
tion of dividend, the LEGO Group’s equity has increased
by DKK 5.0 billion to DKK 17.8 billion in 2015.
At the end of 2015, the equity ratio of the LEGO Group
was 63.7% against 59.9% in 2014.
Return on equity for the LEGO Group was 60.0% in
2015 against 58.8% in 2014.
Capacity investments
In 2015 the LEGO Group continued its extensive
investments in production capacity, building on its over-
all strategy to locate production close to core markets.
Investments in property, plant and equipment amounted
to DKK 2.8 billion in 2015 against DKK 3.1 billion in 2014.
In April 2015, a major new extension of the LEGO
factory in Kladno, the Czech Republic, was completed.
The new hall was the final element in an expansion pro-
ject that started in 2013.
During 2015, production has started at the new LEGO
factory in Jiaxing, China. The facility is expected to be
fully built out in 2017.
In October 2015, the LEGO Group announced plans
for very large expansions of the LEGO factories in
Nyíregyháza, Hungary, and Monterrey, Mexico, in order to
meet the continued high demand for LEGO products.
At the Mexican plant, construction started late 2015,
and based on current projections, the factory could in
terms of size be expanded by up to 190,000 square
metres and add another 3,000 employees to LEGO
operations in Mexico. The expansion will include mould-
ing, processing and warehousing. Manufacturing will be-
gin in 2018, and the new facility will be fully operational
by 2022, according to current plans.
At the Hungarian plant, construction will start during
2016. Depending on the development of LEGO
sales as many as 1,600 new jobs may be created in
Nyíregyháza towards 2020. In terms of size, the factory
will be expanded from its present size of 120,000
square metres up to a total of 290,000 square metres.
The expansion will include moulding, processing,
packing, warehousing and offices.
As a consequence of the LEGO Group’s growth in
the Asian region, the global main office in Singapore
moved to a new and larger location during 2015. 250
employees work at the new office, which is being pre-
pared to accommodate up to 400 employees. Also at
the global main office in Shanghai, China, a move to
larger premises is anticipated in the coming period.
Research and development activities
Each year, new launches account for approximately 60%
of the LEGO Group’s sales to consumers. More than
250 designers from 35 different countries make up the
creative core of product development within the com-
pany, with the majority being based in the company’s
headquarter in Billund, Denmark.
The considerable development activities that enable
such an extensive degree of innovation comprise a
wide range of activities from trend spotting and anthro-
pological studies to the actual development of specific
products and campaigns.
In June 2015, the LEGO Group announced its deci-
sion to invest DKK 1 billion in setting up a Sustainable
Materials Centre. The objective for the centre is to
fulfill the company’s ambition of finding sustainable
alternatives to its present raw materials and pack-
ing by 2030. The centre is expected to have a staff of
Management’s Review
THE LEGO GROUP – ANNUAL REPORT 2015 6

approximately 100, the majority of whom will be located
at the company’s headquarters in Denmark.
Moreover, the LEGO Group cooperates with a number
of educational institutions concerning various research
projects within, among other things, children’s play and
new technologies.
Intellectual capital resources
The considerable success of the company is only possi-
ble because of the skills, dedication and commitment of
LEGO employees.
The average number of full-time employees was 13,974
in 2015 compared to 12,582 in 2014.
Due to the significant intake of new employees, it is
therefore of the utmost importance to the company
that new employees are carefully on-boarded with a
focus on the Group’s cultural foundation, governance
approach and strategic outlook. A global induction
programme is at the heart of this effort, but just as
importantly all employees are encouraged to support
the onboarding of new colleagues to the LEGO culture.
Not least due to the considerable growth and on-
going globalisation, it is key to the company and its
performance to ensure a clear link between the over-
all targets and objectives of the company and the
individual employees’ targets. Therefore, all employees
in the LEGO Group participate in the Performance
Management Programme (PMP). This Programme
ensures that the targets set for the performance of
the employees relate directly to the overall objectives
of the Group. On a current basis during the year, the
manager and the employee follow up on progress on
the targets that can be either individual or shared with
other colleagues in order to foster collaboration. A total
evaluation of the employee’s and the company’s per-
formance compared with the defined targets, which is
carried out at year-end, decides the amount of bonus for
each individual employee.
In October 2015, the LEGO Group announced its plans
to consolidate certain service activities within the HR
and Finance areas in a new global function located at
the company’s existing sites in Kladno, Czech Republic,
Monterrey, Mexico and in Singapore. The transition into
the new set-up will be completed in 2018.
The new function is established to support the LEGO
Group’s growth and global expansion. The aim is to
create a function that is able to scale up and down in
a responsive and agile manner to support the fur-
ther glob alisation of the LEGO Group, as well as direct
professional focus and resources according to the
changing business needs.
Globally, 190 LEGO employees have been informed
that their current jobs will move to other locations over
the coming two years, and during the transition phase,
a number of activities will be initiated to support the
affected employees.
Responsible business conduct
The LEGO Group wants to have a positive impact on its
stakeholders and its surroundings.
This is at the core of the Group’s culture and the
foundation of the strategy it pursues.
In 2003, the LEGO Group was the first company in the
toy industry to sign the United Nations Global Compact.
This was a confirmation of the company’s many years’
of support of human rights, labour standards, anti-
corruption and the environment.
The LEGO Group confirms its support to United Nations
Global Compact and has issued its Responsibility
Report 2015 (COP report) describing how the Group
is working within the areas of human rights, labour
standards, the environment and anti-corruption.
Pursuant to section 99 a and 99 b of the Danish
Financial Statements Act, the Responsibility Report
2015 constitutes the statutory statement of corporate
social responsibility. This also includes the required
Management’s Review
THE LEGO GROUP – ANNUAL REPORT 2015 7

quantitative targets for the underrepresented gender on
the Board of Directors.
The Responsibility Report furthermore describes the
LEGO Group’s efforts to achieve its non-financial goals.
The Responsibility Report 2015 is available at:
www.LEGO.com/responsibility
Market development
The LEGO Group’s main activity is the development,
production, marketing and sale of play materials.
The market for traditional toys, in which the Group
operates, saw healthy growth during 2015.
North American and most European toy markets
experienced mid-single digit growth during the year
– with these regions posting the highest year over
year growth in the last 10 years. Most of the Asian toy
markets also posted solid growth but have slowed
compared to more recent periods.
LEGO® sales
Most major LEGO markets experienced growth in 2015.
The Group’s largest market, the US, grew double digit,
as did the UK, France, Italy and China, while Central and
Northern European markets achieved healthy single
digit growth rates. The only major market that saw a
significant decrease measured in DKK was Russia due
to the difficult currency conditions.
Among the top selling lines in 2015 were core themes
like LEGO® City, LEGO® Star Wars™, LEGO NINJAGO,
LEGO Friends and LEGO® DUPLO®. Furthermore, the
new fantasy theme LEGO Elves is off to a good start
as is LEGO DIMENSIONS, a new play experience that
merges physical LEGO brick building with interactive
console gameplay. Like with LEGO video games, LEGO
DIMENSIONS is developed by TT Games and published
by Warner Bros. Interactive Entertainment.
During the coming years, the LEGO Group expects to
grow moderately ahead of the global toy market that is
expected to grow low single digit. This is expected to be
achievable due to the Group’s continued focus on inno-
vation and its commitment to global expansion.
As a consequence of the LEGO Group’s global growth,
the company experiences an increase in the risk related
to trade receivables. This is reflected in an increase in
provisions for bad debts, ref. note 16.
The majority of the LEGO Group’s sales are in foreign
currency, the risks relating to currency are described in
note 24.
Events after the reporting date
No events have occurred after the balance sheet date
that would influence the evaluation of the Annual Report.
Expectations for 2016
The LEGO Group expects continued sales growth in 2016,
in line with the long-term expectations mentioned above.
The LEGO Group expects satisfactory results for 2016.
Management’s Review
THE LEGO GROUP – ANNUAL REPORT 2015 8

25.2% Revenue growth 2015
35.8 billionRevenue 2015 (DKK)
9.2 billion Net profit 2015 (DKK)
The LEGO Group 2015

Management’s Statement
The Management Board and the Board of Directors
have today considered and adopted the Annual Report
of LEGO A/S for the financial year 1 January to 31
December 2015.
The Consolidated Financial Statements are prepared
in accordance with International Financial Reporting
Standards as adopted by the EU, and the Parent
Company Financial Statements are prepared in accord-
ance with the Danish Financial Statements Act. Moreover,
the Consolidated Financial Statements are prepared in
accordance with additional Danish disclosure require-
ments. Manage ment’s Review is prepared in accordance
with the Danish Financial Statements Act.
In our opinion, the Consolidated Financial Statements
and the Parent Company Financial Statements give
a true and fair view of the financial position at 31
December 2015 of the Group and the Parent Company
and of the results of the Group and the Parent
Company operations and consolidated cash flows for
the financial year 1 January to 31 December 2015.
In our opinion, Management’s Review includes a true
and fair account of the development in the operations
and financial circumstances of the Group and the
Parent Company, of the results for the year and of the
financial position of the Group and the Parent Company
as well as a description of the most significant risks
and elements of uncertain ty facing the Group and the
Parent Company.
We recommend that the Annual Report be adopted at
the Annual General Meeting.
Management Board
Jørgen Vig Knudstorp
President and Chief Executive Officer
John Goodwin
Executive Vice President and Chief Financial Officer
Julia Goldin
Executive Vice President and Chief Marketing Officer
Loren I. Shuster
Executive Vice President and Chief Commercial Officer
Bali Padda
Executive Vice President and Chief Operations Officer
Board of Directors
Niels Jacobsen
Chairman
Eva Berneke
Kjeld Kirk Kristiansen
Deputy Chairman
Jan Nielsen
Thomas Kirk Kristiansen
Kåre Schultz
Søren Thorup Sørensen
Billund, 22 February 2016
THE LEGO GROUP – ANNUAL REPORT 2015 10
Independent Auditor’s Report
To the shareholders of LEGO A/S
Report on Consolidated Financial Statements and Parent Company Financial Statements
We have audited the Consolidated Financial Statements
and the Parent Company Financial Statements of
LEGO A/S for the financial year 1 January to 31
December 2015, which comprise income statement,
balance sheet, statement of changes in equity and
notes, including summary of significant accounting
policies, for both the Group and the Parent Company,
as well as statement of comprehensive income and
cash flow statement for the Group. The Consolidated
Financial Statements are prepared in accordance with
International Financial Reporting Standards as adopted
by the EU and additional disclosure requirements of
the Danish Financial Statements Act, and the Parent
Company Financial Statements are prepared under the
Danish Financial Statements Act.
Management’s Responsibility for the Consolidated
Financial Statements and the Parent Company
Financial Statements
Management is responsible for the preparation of
Consolidated Financial Statements that give a true
and fair view in accordance with International Financial
Reporting Standards as adopted by the EU and addi-
tional disclosure requirements of the Danish Financial
Statements Act and for preparing Parent Company
Financial Statements that give a true and fair view
in accordance with the Danish Financial Statements
Act and for such internal control as Management
determines is necessary to enable the preparation
of Consolidated Financial Statements and Parent
Company Financial Statements that are free from
material misstatement, whether due to fraud or error.
Auditor’s Responsibility
Our responsibility is to express an opinion on the Con-
solidated Financial Statements and the Parent Company
Financial Statements based on our audit. We conducted
our audit in accordance with International Standards
on Auditing and additional requirements under Dan-
ish audit regulation. This requires that we comply with
ethical requirements and plan and perform the audit to
obtain reasonable assurance whether the Consolidated
Financial Statements and the Parent Company Financial
Statements are free from material misstatement.
An audit involves performing procedures to obtain
audit evidence about the amounts and disclosures in
the Consolidated Financial Statements and the Parent
Company Financial Statements. The procedures select-
ed depend on the auditor’s judgement, including the
assessment of the risks of material misstatement of
the Consolidated Financial Statements and the Parent
Company Financial Statements, whether due to fraud
or error. In making those risk assessments, the auditor
considers internal control relevant to the Company’s
preparation of Consolidated Financial Statements and
Parent Company Financial Statements that give a true
and fair view in order to design audit procedures that
are appropriate in the circumstances, but not for the
purpose of expressing an opinion on the effectiveness
of the Company’s internal control. An audit also includes
evaluating the appropriateness of accounting policies
used and the reasonableness of accounting estimates
made by Management, as well as evaluating the overall
presentation of the Consolidated Financial Statements
and the Parent Company Financial Statements.
We believe that the audit evidence we have obtained
is sufficient and appropriate to provide a basis for our
audit opinion.
The audit has not resulted in any qualification.
THE LEGO GROUP – ANNUAL REPORT 2015 11

Opinion
In our opinion, the Consolidated Financial Statements
give a true and fair view of the Group’s financial position
at 31 December 2015 and of the results of the Group’s
operations and cash flows for the financial year 1 Janu-
ary to 31 December 2015 in accordance with Interna-
tional Financial Reporting Standards as adopted by the
EU and additional disclosure requirements of the Danish
Financial Statements Act.
Moreover, in our opinion, the Parent Company Financial
Statements give a true and fair view of the Parent Com-
pany’s financial position at 31 December 2015 and of
the results of the Parent Company’s operations for the fi-
nancial year 1 January to 31 December 2015 in accord-
ance with the Danish Financial Statements Act.
Statement on Management’s Review
We have read Management’s Review in accordance
with the Danish Financial Statements Act. We have not
performed any procedures additional to the audit of the
Consolidated Financial Statements and the Parent Com-
pany Financial Statements. On this basis, in our opinion,
the information provided in Management’s Review is
consistent with the Consolidated Financial Statements
and the Parent Company Financial Statements.
Billund, 22 February 2016
PricewaterhouseCoopers
Statsautoriseret Revisionspartnerselskab
CVR: 33 77 12 31
Mogens Nørgaard Mogensen
State Authorised Public Accountant
Henrik Trangeled Kristensen
State Authorised Public Accountant
Independent Auditor’s Report
THE LEGO GROUP – ANNUAL REPORT 2015 12
2.8 billion Capacity investments 2015 (DKK)
13,974 Average employees 2015
The LEGO GroupFinancial Statements
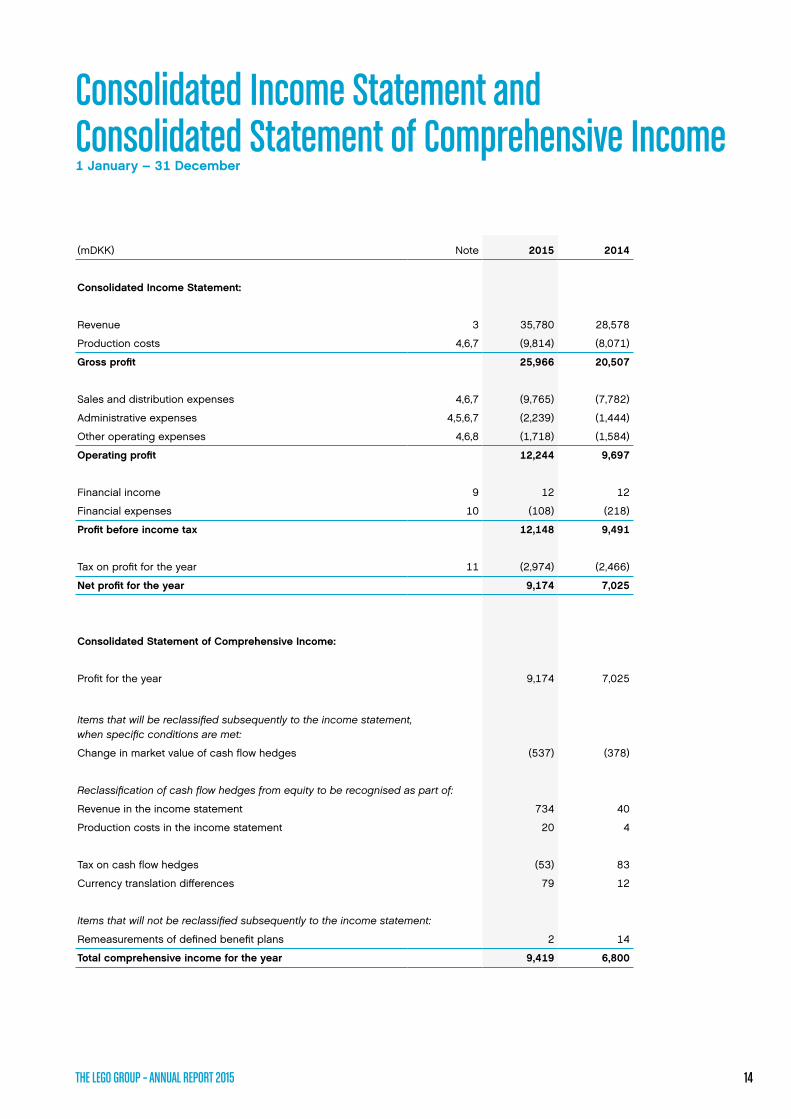
Consolidated Income Statement and Consolidated Statement of Comprehensive Income 1 January – 31 December
(mDKK) Note 2015 2014
Consolidated Income Statement:
Revenue 3 35,780 28,578
Production costs 4,6,7 (9,814) (8,071)
Gross profit 25,966 20,507
Sales and distribution expenses 4,6,7 (9,765) (7,782)
Administrative expenses 4,5,6,7 (2,239) (1,444)
Other operating expenses 4,6,8 (1,718) (1,584)
Operating profit 12,244 9,697
Financial income 9 12 12
Financial expenses 10 (108) (218)
Profit before income tax 12,148 9,491
Tax on profit for the year 11 (2,974) (2,466)
Net profit for the year 9,174 7,025
Consolidated Statement of Comprehensive Income:
Profit for the year 9,174 7,025
Items that will be reclassified subsequently to the income statement, when specific conditions are met:
Change in market value of cash flow hedges (537) (378)
Reclassification of cash flow hedges from equity to be recognised as part of:
Revenue in the income statement 734 40
Production costs in the income statement 20 4
Tax on cash flow hedges (53) 83
Currency translation differences 79 12
Items that will not be reclassified subsequently to the income statement:
Remeasurements of defined benefit plans 2 14
Total comprehensive income for the year 9,419 6,800
THE LEGO GROUP – ANNUAL REPORT 2015 14

Consolidated Balance Sheetat 31 December
(mDKK) Note 2015 2014
ASSETS
Non-current assets:
Development projects 139 85
Software 138 126
Licences, patents and other rights 55 60
Intangible assets 12 332 271
Land, buildings and installations 5,016 3,299
Plant and machinery 3,033 2,494
Other fixtures and fittings, tools and equipment 1,176 1,072
Fixed assets under construction 1,076 1,591
Property, plant and equipment 13 10,301 8,456
Deferred tax assets 19 419 494
Investments in associates 14 3 3
Prepayments 169 162
Other non-current assets 591 659
Total non-current assets 11,224 9,386
Current assets:
Inventories 15 2,747 2,182
Trade receivables 16,25 6,410 5,891
Other receivables 25 920 683
Prepayments 179 149
Current tax receivables 254 48
Receivables from related parties 25,29 4,932 2,598
Cash at banks 25,28 1,211 482
Total current assets 16,653 12,033
TOTAL ASSETS 27,877 21,419
THE LEGO GROUP – ANNUAL REPORT 2015 15
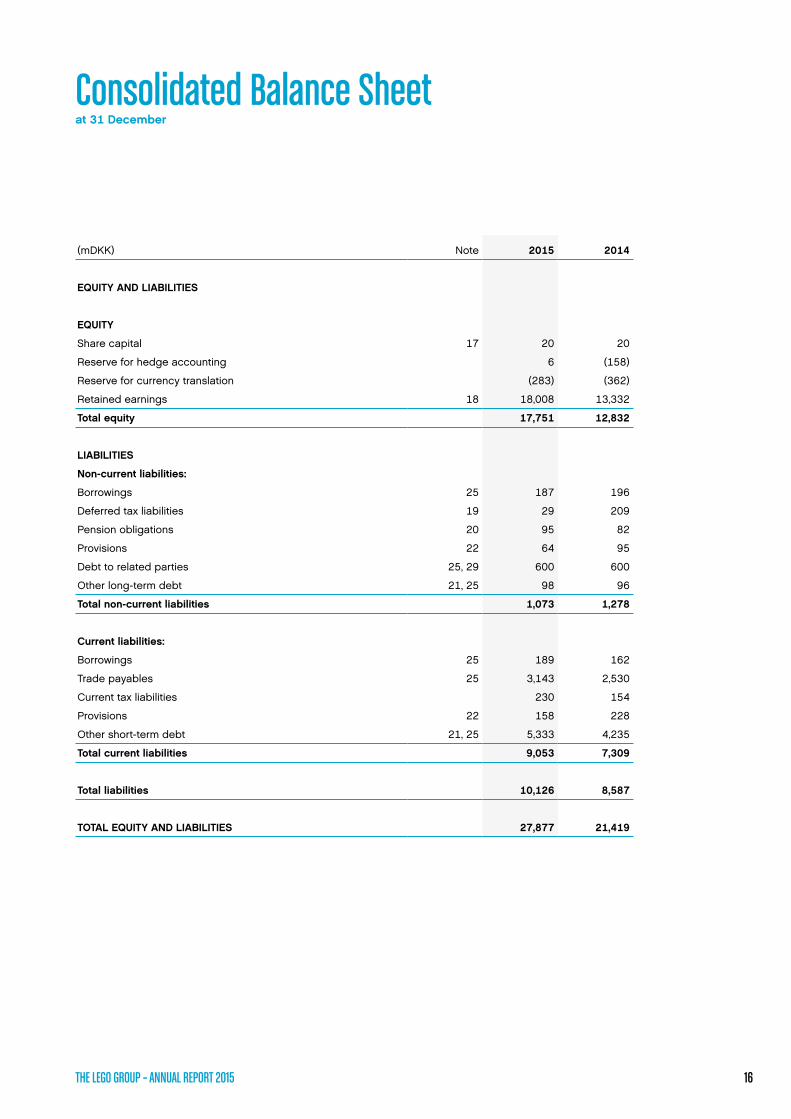
(mDKK) Note 2015 2014
EQUITY AND LIABILITIES
EQUITY
Share capital 17 20 20
Reserve for hedge accounting 6 (158)
Reserve for currency translation (283) (362)
Retained earnings 18 18,008 13,332
Total equity 17,751 12,832
LIABILITIES
Non-current liabilities:
Borrowings 25 187 196
Deferred tax liabilities 19 29 209
Pension obligations 20 95 82
Provisions 22 64 95
Debt to related parties 25, 29 600 600
Other long-term debt 21, 25 98 96
Total non-current liabilities 1,073 1,278
Current liabilities:
Borrowings 25 189 162
Trade payables 25 3,143 2,530
Current tax liabilities 230 154
Provisions 22 158 228
Other short-term debt 21, 25 5,333 4,235
Total current liabilities 9,053 7,309
Total liabilities 10,126 8,587
TOTAL EQUITY AND LIABILITIES 27,877 21,419
Consolidated Balance Sheetat 31 December
THE LEGO GROUP – ANNUAL REPORT 2015 16

Consolidated Statement of Changes in Equity
2015
(mDKK)Share
capital
Reserve for hedge- accounting
Reserve for currency
translationRetained earnings
LEGO A/S’ share of
equity
Non- controlling
interestsTotal
equity
Balance at 1 January 20 (158) (362) 13,332 12,832 – 12,832
Profit for the year – – – 9,174 9,174 – 9,174
Other comprehensive income/ (expenses) for the year – 164 79 2 245 – 245
Dividend paid relating to prior year – – – (4,500) (4,500) – (4,500)
Balance at 31 December 20 6 (283) 18,008 17,751 – 17,751
2014
(mDKK)Share
capital
Reserve for hedge- accounting
Reserve for currency
translationRetained earnings
LEGO A/S’ share of
equity
Non- controlling
interestsTotal
equity
Balance at 1 January 20 94 (374) 11,335 11,075 – 11,075
Profit for the year – – – 7,025 7,025 – 7,025
Other comprehensive income/ (expenses) for the year – (252) 12 15 (225) – (225)
Acquisition of non-controlling interest in subsidiary – – – (43) (43) 43 –
Dividend paid relating to prior year – – – (5,000) (5,000) (43) (5,043)
Balance at 31 December 20 (158) (362) 13,332 12,832 – 12,832
THE LEGO GROUP – ANNUAL REPORT 2015 17

(mDKK) Note 2015 2014
Cash flows from operating activities:
Cash generated from operations 27 13,850 10,707
Interest paid etc. (40) (218)
Interest received etc. 12 12
Income tax paid (3,263) (2,556)
Net cash generated from operating activities 10,559 7,945
Cash flows from investing activities:
Purchases of intangible assets 12 (126) (59)
Purchases of property, plant and equipment 13 (2,822) (3,115)
Proceeds from sale of property, plant and equipment 13 10
Net cash used in investing activities (2,935) (3,164)
Cash flows from financing activities:
Dividend paid to shareholders (4,500) (5,000)
Dividend paid to non-controlling interests – (43)
Acquisition of non-controlling interest – (36)
Payment to related parties 29 (12,144) (12,948)
Repayment from related parties 29 9,810 12,660
Repayments of borrowings 18 65
Net cash used in financing activities (6,816) (5,302)
Total cash flows 808 (521)
Cash and cash equivalents at 1 January 482 1,024
Exchange losses on cash at banks (79) (21)
Cash at banks at 31 December 28 1,211 482
Consolidated Cash Flow Statement1 January – 31 December
THE LEGO GROUP – ANNUAL REPORT 2015 18

Notes
Basis for preparation
20 Note 1. Significant accounting policies
26 Note 2. Significant accounting estimates
and judgements
Income Statement
26 Note 3. Revenue
27 Note 4. Expenses by nature
27 Note 5. Auditors’ fees
28 Note 6. Employee expenses
29 Note 7. Depreciation and amortisation
29 Note 8. Research and development costs
30 Note 9. Financial income
30 Note 10. Financial expenses
31 Note 11. T ax on profit for the year
Balance Sheet and other disclosures
32 Note 12. Intangible assets
33 Note 13. Property, plant and equipment
35 Note 14. Investments in associates
35 Note 15. Inventories
36 Note 16. Trade receivables
37 Note 17. Share capital
37 Note 18. Dividend per share
38 Note 19. Deferred tax
40 Note 20. Pension obligations
42 Note 21. Other debt
43 Note 22. Provisions
44 Note 23. Contingent assets, contingent
liabilities and other obligations
45 Note 24. Financial risks
46 Note 25. Financial assets and liabilities
50 Note 26. Derivative financial instruments
53 Note 27. Other reversals with no effect
on cash flows
53 Note 28. Cash at banks
54 Note 29. Related party transactions

Note 1. Significant accounting policies
The Consolidated Financial Statements of the LEGO Group
have been prepared in accordance with International Financial
Reporting Standards (IFRS) as adopted by the EU and addi-
tional Danish disclosure requirements.
The Consolidated Financial Statements have been prepared
in accordance with the historical cost conversion, as modified
by the revaluation of financial assets and financial liabilities
(including financial instruments) at fair value.
Effects of new and amended accounting standards
All new and amended standards and interpretations issued
by IASB and endorsed by the EU effective as of 1 January
2015 have been adopted by the LEGO Group. The applica-
tion of the new IFRS’s has not had a material impact on the
Consolidated Financial Statements in 2015 and we do not
anticipate any significant impact on future periods from the
adoption of these new IFRS’s.
The following standards which are not yet effective and have not
yet been endorsed by the EU are relevant for the LEGO Group:
• IFRS 9, Financial instruments. IFRS 9 is the new stan-
dard on classification and measurement of financial
instruments. Among other amendments, it introduces
a new hedge accounting model that is designed to be
more closely aligned with risk management activities.
It includes amendments to the treatment of option
premiums and the possibility to hedge net positions.
The standard is effective for annual periods beginning
on or after 1 January 2018.
• IFRS 15, Revenue from contracts with customers. IFRS 15
deals with revenue recognition and establishes principles
for reporting the nature, amount, timing and uncertainty of
revenue and cash flows arising from an entity’s contracts
with customers. Revenue is recognised when a cus tomer
obtains control of a good or service and thus has the
ability to direct the use and obtain the benefits from the
good or service. The standard replaces IAS 18, Revenue.
The standard is effective for annual periods beginning on
or after 1 January 2018.
It is Management’s assessment that the above mentioned
changes in accounting standards and interpretations will not
have any significant impact on the Consolidated Financial
Statements upon adoption of these standards.
IASB issued IFRS 16 Leases in January 2016. IFRS 16 sets out
the principles for the recognition, measurement, presentation
and disclosure of leases for lessee. The standard has not yet
been endorsed by the EU. The standard is effective for annual
periods beginning on or after 1 January 2019. Management
has not yet finalised the investigation of the impact on the
Consolidated Financial Statements upon adoption of IFRS 16.
Consolidation practice
The Consolidated Financial Statements comprise LEGO A/S
(Parent Company) and the companies in which LEGO A/S
directly or indirectly holds more than 50% of the votes or
otherwise exercises control (subsidiaries). LEGO A/S and these
companies are referred to as the LEGO Group.
Subsidiaries are fully consolidated from the date on which
control is transferred to the LEGO Group. They are de-
consolidated from the date on which control ceases.
Associates are all entities over which the LEGO Group has sig-
nificant influence but not control, and are generally represented
by a shareholding of between 20% and 50% of the voting rights.
Investments in associates are accounted for using the equity
method of accounting and are initially recognised at cost.
Intercompany transactions, balances and unrealised gains
on transactions between group companies are eliminated.
Unrealised losses are also eliminated unless the transaction
provides evidence of impairment of the asset transferred.
Subsidiaries’ accounting policies have been changed where
necessary to ensure consistency with the policies adopted by
the LEGO Group.
THE LEGO GROUP – ANNUAL REPORT 2015 20

Note 1. Significant accounting policies
Non-controlling interests include third party shareholders’
share of the equity and the results for the year in subsidiaries
which are not 100% owned.
The part of the subsidiaries’ results that can be attributed to
non-controlling interests forms part of the profit or loss for the
period. Non-controlling interests’ share of the equity is stated
as a separate item in equity.
Foreign currency translation
Functional and presentation currency
Items included in the financial statements of each of the
LEGO Group’s entities are measured using the currency of the
primary economic environment in which the entity operates.
The Consolidated Financial Statements are presented in
Danish kroner (DKK), which is the functional and presentation
currency of the Parent Company.
Transactions and balances
Foreign currency transactions are translated into the functional
currency using the exchange rates prevailing at the dates of
the transactions. Foreign exchange gains and losses result-
ing from the settlement of such transactions and from the
translation at balance sheet date exchange rates of monetary
assets and liabilities denominated in foreign currencies are
recognised in the income statement, except when deferred in
equity as reserve for exchange rate adjustments.
Group companies
The results and financial position of subsidiaries that have a
functional currency different from the presentation currency
are translated into the presentation currency as follows:
• Assets and liabilities for each subsidiary are translated
into DKK at the closing rate at the balance sheet date.
• Income and expenses for each subsidiary are translated
at average exchange rates.
• Differences deriving from translation of the foreign
sub sidiaries opening equity to the exchange rates
prevailing at the balance sheet date, and differences
owing to the translation of the income statements of the
foreign sub sidiaries from average exchange rates to
balance sheet date exchange rates are recognised in
other comprehensive income and classified as a separate
reserve for exchange adjustments under equity.
Derivative financial instruments
The effective portion of changes to the fair value of derivative
financial instruments which meet the criteria for hedging future
cash flows are recognised in other comprehensive income
and in a separate reserve under equity. Income and expenses
relating to these hedge transactions are reclassified from
equity when the hedged item affects the income statement or
the hedged transaction is no longer to take place. The amount
is recognised in the same line as the hedged item. Fair value
changes attributable to the time value of options are recog-
nised in financial income or expenses in the income statement.
Fair value hedge
Changes in the fair value of derivatives that are designated and
qualify as fair value hedges are recorded in the income state-
ment, together with any changes in the fair value of the hedged
asset or liability that are attributable to the hedged risk.
Cash flow hedge
The effective portion of changes in the fair value of derivat ives
that are designated and qualify as cash flow hedges is
recognised in other comprehensive income. The gain or loss
relating to the ineffective portion is recognised immediately
in the income statement within ‘financial items’. Amounts
accumulated in other comprehensive income are reclassified
to the income statement in the period when the hedged item
affects the income statement.
Other derivatives
Changes to the fair value of other derivatives are recognised in
the financial income or expenses.
THE LEGO GROUP – ANNUAL REPORT 2015 21

Income statement
Recognition of sales and revenues
Sales represent the fair value of the sale of goods excluding
value added tax and after deduction of provisions for returned
products, rebates and trade discounts relating to the sale.
Provisions and accruals for rebates to customers are made in
the period in which the related sales are recorded. Historical
data are readily available and reliable and are used for
estimating the amount of the reduction in sales.
Revenues from the sale of goods are recognised when all the
following specific conditions have been met and the control
over the goods has been transferred to the buyer.
• Significant risks and rewards of ownership of
the goods have been transferred to the buyer.
• The revenues can be measured reliably.
• It is probable that the economic benefits associated with
the transaction will flow to the LEGO Group.
• Costs incurred or to be incurred in respect of the
transaction can be measured reliably.
These conditions are usually met by the time the products are
delivered to the customers.
Licence fees are recognised on an accrual basis in accor-
dance with the relevant agreements. Revenues are measured
at the fair value of the consideration received or receivable.
Production costs
Production costs comprise costs incurred to achieve revenue
for the year. Costs comprise raw materials, consumables,
direct labour costs and indirect production costs such as
mainten ance and depreciation, etc.
Administrative expenses
Administrative expenses comprise expenses for Management,
administrative staff, office expenses, depreciation, etc.
Sales and distribution expenses
Distribution expenses comprise costs in the form of salaries
to sales and distribution staff, advertising and marketing
expenses as well as depreciation, etc.
Other operating expenses
Other operating expenses include royalty and research and
development costs.
Taxes
The tax expenses for the period comprise current and deferred
tax. Tax is recognised in the income statement, except to the
extent that it relates to items recognised in other comprehen-
sive income. In this case, the tax is also recognised in other
comprehensive income.
Deferred income tax on temporary differences arising be-
tween the tax bases of assets and liabilities and their carrying
amounts is provided in full in the Consolidated Financial
Statements, using the liability method.
Deferred tax reflects the effect of any temporary differences. To
the extent calculated deferred tax is positive, this is recognised
in the balance sheet as a deferred tax asset at the expected
realisable value. Deferred tax assets are recognised only to the
extent that it is probable that future taxable profit will be avail-
able against which the temporary differences can be utilised.
Any changes in deferred tax due to changes in tax rates are
recognised in the income statement.
Balance sheet
Software and development projects
Research expenses are charged to the income statement as
incurred. Software and development projects that are clearly
defined and identifiable and which are expected to generate
future economic profit are recognised as intangible non-current
assets at historical cost less accumulated amortisation and any
impairment loss. Amortisation is provided on a straight-line basis
over the expected useful life which is normally 3-6 years. Other
development costs are recognised in the income statement.
An annual impairment test of the intangible assets under
construction is performed.
Note 1. Significant accounting policies
THE LEGO GROUP – ANNUAL REPORT 2015 22

Borrowing costs related to financing development projects
that take a substantial period of time to complete and whose
commencement date is on or after 1 January 2009 are
included in the cost price.
Licences, patents and other rights
Acquired licences, patents and other rights are capitalised
on the basis of the costs incurred. These costs are amortised
over the shorter of their estimated useful lives and the
contractual duration.
Property, plant and equipment
Land and buildings comprise mainly factories, warehouses and
offices. Property, plant and equipment (PPE) are measured at
cost, less subsequent depreciation and impairment losses, ex-
cept for land, which is measured at cost less impairment losses.
Depreciation is calculated using the straight-line method to
allocate the cost of each asset to its residual value over its
estimated useful life as follows:
Buildings 40 years
Installations 10-20 years
Plant and machinery 5-15 years
Moulds 2 years
Furniture, fittings and equipment 3-10 years
The residual values and useful lives of the assets are reviewed
and adjusted, if appropriate, at each balance sheet date.
Gains and losses on disposals are determined by comparing
the proceeds with the carrying amount and recognised in the
income statement.
Cost comprises acquisition price and expenses directly related
to the acquisition until the time when the asset is ready for use.
The cost of self constructed assets comprises direct expenses
for wage consumption and materials. Borrowing costs related to
financing self constructed assets that take a substantial period
of time to complete and whose commencement date is on or
after 1 January 2009 are included in the cost price.
Leases
Leases of assets where the LEGO Group has substantially all
risks and rewards of ownership are capitalised as finance leases
under property, plant and equipment and depreciated over the
estimated useful lives of the assets, according to the periods
listed under the section property, plant and equipment. The cor-
responding finance lease liabilities are recognised in liabilities.
Operating lease expenses are recognised in the income state-
ment on a straight-line basis over the period of the lease.
Impairment of assets
Assets that are subject to depreciation and amortisation
are tested for impairment whenever events or changes in
circumstances indicate that the carrying amount may not be
recoverable. Intangible assets under development are tested
for impairment at each reporting date.
An impairment loss is recognised for the amount by which the
carrying amount of the asset exceeds its recoverable amount.
The recoverable amount is the higher of the fair value of an
asset less expenses to sell and value in use. For the purposes
of assessing impairment, assets are grouped at the lowest
levels for which there are separately identifiable cash flows
(cash generating units).
Inventories
Inventories are measured at the lower of cost and net realis able
value. Cost is determined using the first-in, first-out (FIFO) method.
The cost of raw materials, consumables and purchased
goods comprises the invoice price plus delivery expenses.
The cost of finished goods and work in progress comprises
the purchase price of materials and direct labour costs plus
indirect production costs. Indirect production costs include
indirect materials and wages, maintenance and depreciation of
plant and machinery, factory buildings and other equipment as
well as expenses for factory administration and management.
Other receivables and prepayments
Other receivables and prepayments recognised under
assets include VAT, financial instruments, royalty and prepaid
expenses on leases.
Note 1. Significant accounting policies
THE LEGO GROUP – ANNUAL REPORT 2015 23

Receivables
Trade receivables are initially recognised at fair value and
subsequently measured at amortised cost less write down
for losses. Provisions for losses are made on basis of an
objective indication if an individual receivable or a portfolio
of receivables are impaired.
Equity
Reserve for hedge accounting
The reserve for hedge accounting consists of the effective por-
tion of gains and losses on hedging instruments designated as
cash flow hedges.
Reserve for currency translation
The reserve for exchange adjustments consists of exchange
rate differences that occur when translating the foreign sub-
sidiaries financial statements from their functional currency
into the LEGO Group’s presentation currency. On disposal of
the net investment, the reserve for exchange adjustments of
that foreign subsidiary is recognised in the income statement.
Reduction of a net investment in a foreign operation which
does not result in loss of control is not treated as a disposal.
Dividend distribution
Dividends are recognised as a liability in the period in which
they are adopted at the Annual General Meeting.
Liabilities
Borrowings
Borrowings are initially recognised at fair value, net of
transaction expenses incurred. Borrowings are subsequently
mea s ured at amortised cost. Any differences between the
proceeds and the redemption value are recognised in the
income statement over the period of the borrowings using
the effective interest method.
Borrowings are classified as current liabilities unless the LEGO
Group has an unconditional right to defer settlement of the
liability for at least 12 months after the balance sheet date.
Employee benefits
Wages, salaries, social security contributions, paid annual leave
and sick leave, bonuses and non-monetary employee benefits
are accrued in the year in which the associated services are
rendered by the employees of the LEGO Group. Where the
LEGO Group provides long-term employee benefits, the costs
are accumulated to match the rendering of the services by the
employees concerned.
Retirement benefit obligation
Costs regarding defined contribution plans are recognised
in the income statement in the periods in which the related
employee services are delivered.
Net obligations in respect of defined benefit pension plans are
calculated separately for each plan by estimating the amount
of future benefits that employees have earned in return for
their service in the current and prior periods; that benefit is
discounted to determine its present value, and the fair value
of any plan assets is deducted. Discount rates are based
on the market yield of high quality corporate bonds in the
country concerned approximating to the terms of the LEGO
Group’s pension obligations. The calculations are performed
by a qualified actuary using the Projected Unit Credit Method.
When the benefits of a plan are increased, the portion of the
increased benefit relating to past service by employees is
recognised as an expense in the income statement over the
vesting period. To the extent that the benefits are vested, the
expense is recognised in the income statement immediately.
Actuarial gains and losses arising from experience adjustments
and changes in acturial assumptions are charged or credited to
other comprehensive income in the period in which they occur.
Past service costs are recognised immediately in profit/loss.
Net pension assets are recognised to the extent that the LEGO
Group is able to derive future economic benefits in the way of
refunds from the plan or reductions of future contributions.
Provisions
Provisions are recognised when the LEGO Group identifies legal
or constructive obligations as a result of past events and it is
Note 1. Significant accounting policies
THE LEGO GROUP – ANNUAL REPORT 2015 24
probable that it will lead to an outflow of resources that can be
reliably estimated. In this connection, the LEGO Group makes
the estimate based upon an evaluation of the individual, most
likely outcome of the cases. In cases where a reliable estimate
cannot be made, these are disclosed as contingent liabilities.
Further provisions for restructuring expenses are only recog-
nised when the decision is made and announced before
the balance sheet date. Provisions are not made for future
operating losses.
Provisions are measured at the present value of the estimated
obligation at the balance sheet date.
Other liabilities
Other liabilities are measured at amortised cost unless
specifically stated otherwise.
Cash flow statement
The consolidated cash flow statement shows cash flows for
the year broken down by operating, investing and financing
activities, changes for the period in cash and bank overdrafts
and cash and bank overdrafts at the beginning of the year.
Cash flows from operating activities are calculated indirectly as
operating profit adjusted for non-cash items, financial expens-
es paid, income taxes paid and changes in working capital.
Cash flows from investing activities comprise payments relating
to acquisitions and disposals of activities, intangible assets,
property, plant and equipment, fixtures and fittings as well as
fixed asset investments. Furthermore they comprise interest
and dividends received.
Cash flows from financing activities comprise proceeds from
borrowings, repayment of interestbearing debt and dividend
paid to shareholders.
Cash and cash equivalents comprise cash that can readily be
converted into cash reduced by short-term bank debt.
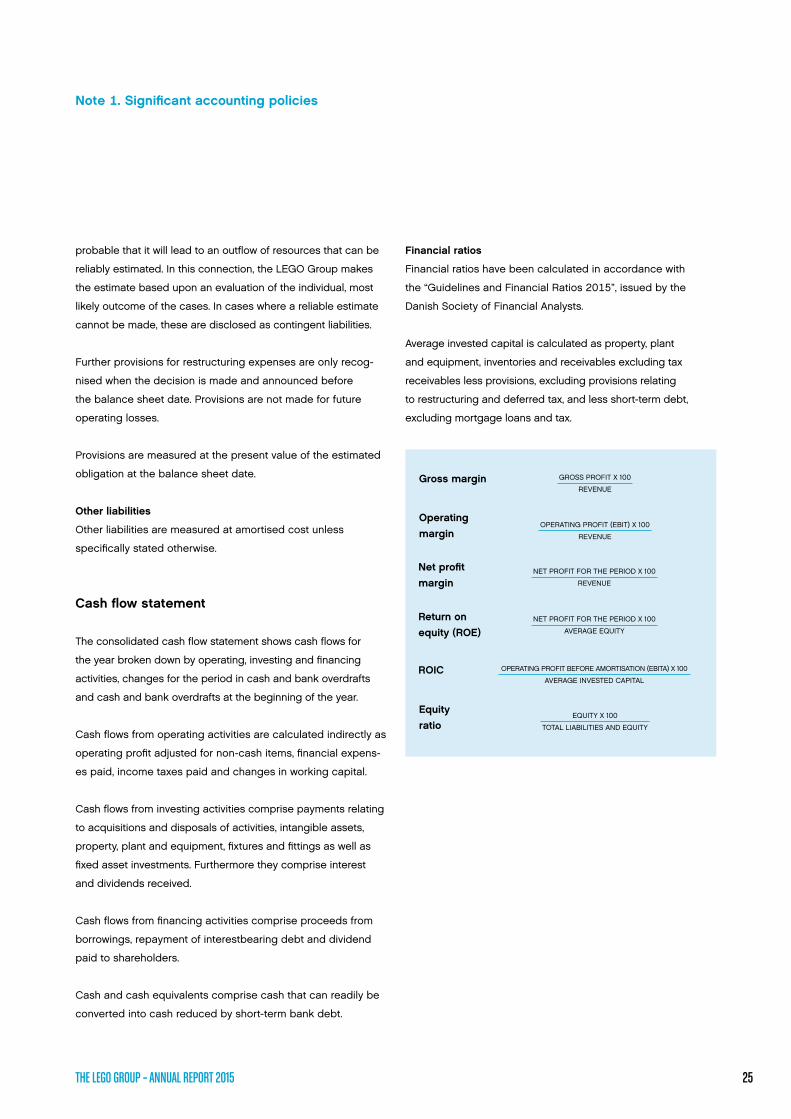
Financial ratios
Financial ratios have been calculated in accordance with
the “Guidelines and Financial Ratios 2015”, issued by the
Danish Society of Financial Analysts.
Average invested capital is calculated as property, plant
and equipment, inventories and receivables excluding tax
receivables less provisions, excluding provisions relating
to restructuring and deferred tax, and less short-term debt,
excluding mortgage loans and tax.
GROSS PROFIT X 100
REVENUEGross margin
OPERATING PROFIT (EBIT) X 100
REVENUE
Operating margin
NET PROFIT FOR THE PERIOD X 100
REVENUE
Net profit margin
NET PROFIT FOR THE PERIOD X 100
AVERAGE EQUITY
Return on equity (ROE)
OPERATING PROFIT BEFORE AMORTISATION (EBITA) X 100
AVERAGE INVESTED CAPITALROIC
EQUITY X 100
TOTAL LIABILITIES AND EQUITY
Equity ratio
Note 1. Significant accounting policies
THE LEGO GROUP – ANNUAL REPORT 2015 25

Note 2. Significant accounting estimates and judgements
Note 3. Revenue
When preparing the Consolidated Financial Statement it is necessary that Management makes a number of
accounting estimates and judgements that affect the reported amounts of assets and liabilities and the reported
amounts of revenues and expenses.
Estimates and judgements used in the determination of reported results are continuously evaluated.
Management bases the judgements on historical experience and other assumptions that Management
assesses are reasonable under the given circumstances. Actual results may differ from these estimates
under different assumptions or conditions.
The following accounting estimates and judgements are those that Management assesses to be material:
Property, plant and equipment
Assessment of estimated residual value and useful life of property, plant and equipment requires judgements.
It is Management’s assessment that the estimates are reasonable (note 13).
Inventories
Calculation of indirect production costs requires estimates and judgements regarding various assumptions.
The sensitivity of the measurement to these assumptions can be significant. It is the assessment of Management
that the assumptions and estimates made are reasonable (note 15).
Trade receivables
Management makes allowance for doubtful trade receivables in anticipation of estimated losses resulting from
the subsequent inability of customers to make required payments. Management analyses trade receivables and
examines historical bad debt, customer concentrations, customer creditworthiness and payment history and
changes in customer payment terms (note 16).
Revenue contains sale of goods and licence income. Sale of goods amounts to DKK 35,359 million (DKK 28,141
million in 2014), and licence income amounts to DKK 421 million (DKK 437 million in 2014).
THE LEGO GROUP – ANNUAL REPORT 2015 26

Note 4. Expenses by nature
Note 5. Auditors’ fees
(mDKK) Note 2015 2014
Raw materials and consumables used 5,366 4,062
Employee expenses 6 5,956 4,754
Depreciation and amortisation 7 1,081 947
Licence and royalty expenses 2,523 2,019
Other external expenses 8,610 7,099
Total operating expenses 23,536 18,881
(mDKK) Note 2015 2014
Fee to PwC:
Statutory audit of the Financial Statements 10 9
Other assurance engagements 1 1
Tax assistance 20 18
Other services 34 12
65 40
THE LEGO GROUP – ANNUAL REPORT 2015 27

Note 6. Employee expenses
(mDKK) Note 2015 2014
Wages and salaries 5,266 4,201
Termination benefit and restructuring 25 8
Pension costs 20 235 262
Other expenses and social security expenses 475 327
Total employee costs for the year 6,001 4,798
Employee costs included in:
Intangible assets (12) (13)
Property, plant and equipment (33) (31)
Total employee costs expensed in the income statement 5,956 4,754
Classified as:
Production costs 1,833 1,533
Sales and distribution expenses 2,579 2,050
Administrative expenses 1,300 966
Other operating expenses 244 205
5,956 4,754
Including Key Management Personnel (Management Board):
Salaries 43 25
Pension 2 1
Short-term incentive plans 12 8
Long-term incentive plans 23 19
80 53
Including fee to Board of Directors: 4 4
Average number of full-time employees 13,974 12,582
Number of employees (Headcount) 17,294 14,762
Incentive plans comprise a short-term incentive plan based on yearly performance and a long-term incentive
plan related to long-term goals regarding value creation.
THE LEGO GROUP – ANNUAL REPORT 2015 28
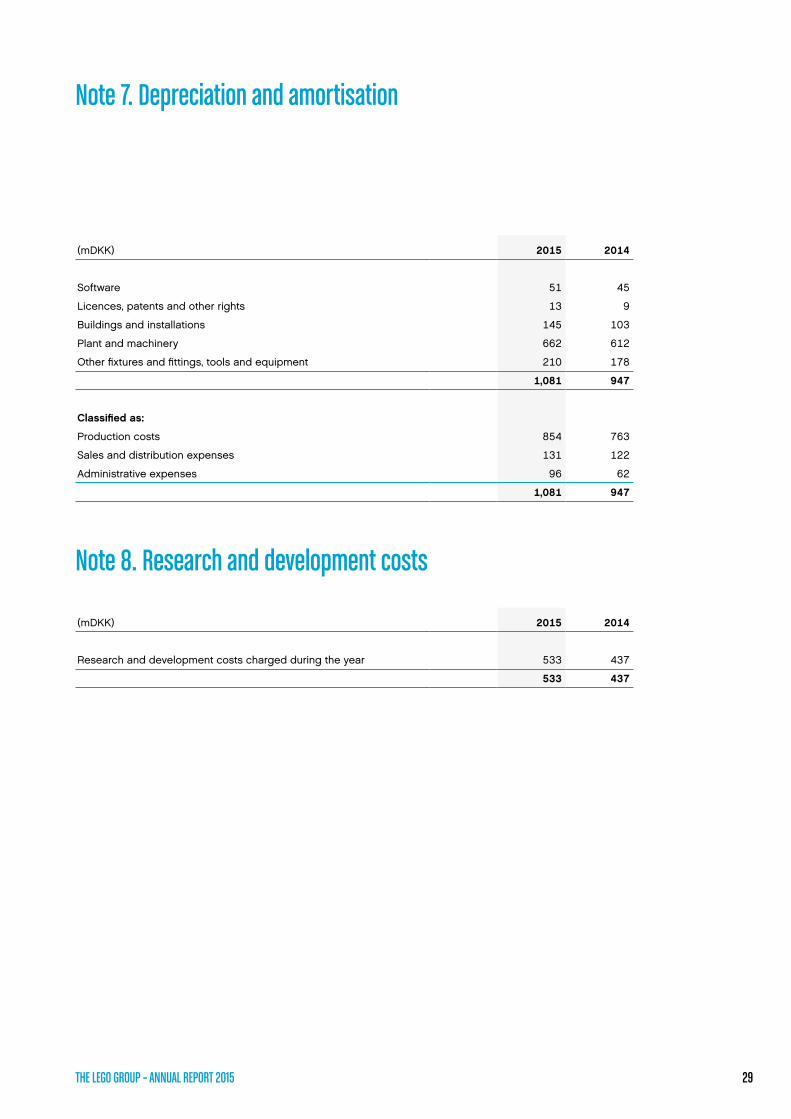
Note 7. Depreciation and amortisation
Note 8. Research and development costs
(mDKK) 2015 2014
Software 51 45
Licences, patents and other rights 13 9
Buildings and installations 145 103
Plant and machinery 662 612
Other fixtures and fittings, tools and equipment 210 178
1,081 947
Classified as:
Production costs 854 763
Sales and distribution expenses 131 122
Administrative expenses 96 62
1,081 947
(mDKK) 2015 2014
Research and development costs charged during the year 533 437
533 437
THE LEGO GROUP – ANNUAL REPORT 2015 29

Note 9. Financial income
Note 10. Financial expenses
(mDKK) 2015 2014
Interest income from related parties – 1
Interest income from credit institutions measured at amortised cost 7 6
Other interest income 5 5
12 12
(mDKK) 2015 2014
Interest expenses on mortgage loans measured at amortised cost 1 2
Interest expenses to related parties 19 19
Interest expenses to credit institutions measured at amortised cost 10 8
Other interest expenses 10 14
Exchange loss, net 68 175
108 218
THE LEGO GROUP – ANNUAL REPORT 2015 30
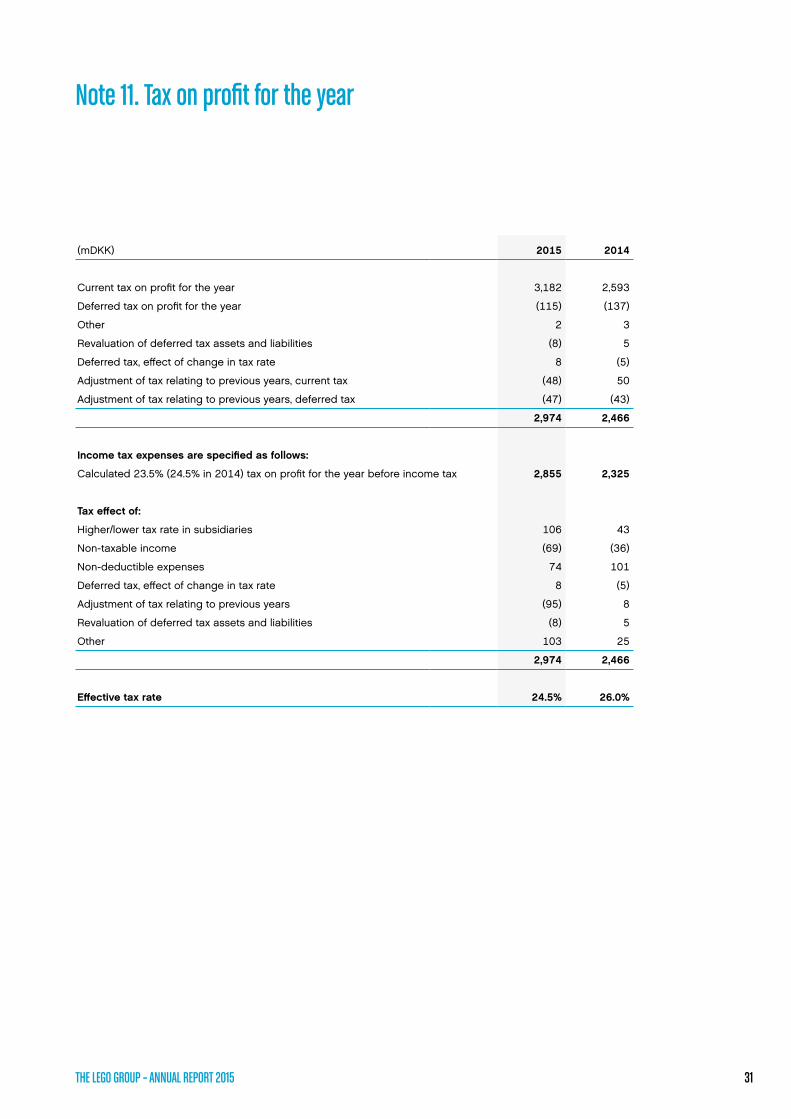
Note 11. Tax on profit for the year
(mDKK) 2015 2014
Current tax on profit for the year 3,182 2,593
Deferred tax on profit for the year (115) (137)
Other 2 3
Revaluation of deferred tax assets and liabilities (8) 5
Deferred tax, effect of change in tax rate 8 (5)
Adjustment of tax relating to previous years, current tax (48) 50
Adjustment of tax relating to previous years, deferred tax (47) (43)
2,974 2,466
Income tax expenses are specified as follows:
Calculated 23.5% (24.5% in 2014) tax on profit for the year before income tax 2,855 2,325
Tax effect of:
Higher/lower tax rate in subsidiaries 106 43
Non-taxable income (69) (36)
Non-deductible expenses 74 101
Deferred tax, effect of change in tax rate 8 (5)
Adjustment of tax relating to previous years (95) 8
Revaluation of deferred tax assets and liabilities (8) 5
Other 103 25
2,974 2,466
Effective tax rate 24.5% 26.0%
THE LEGO GROUP – ANNUAL REPORT 2015 31
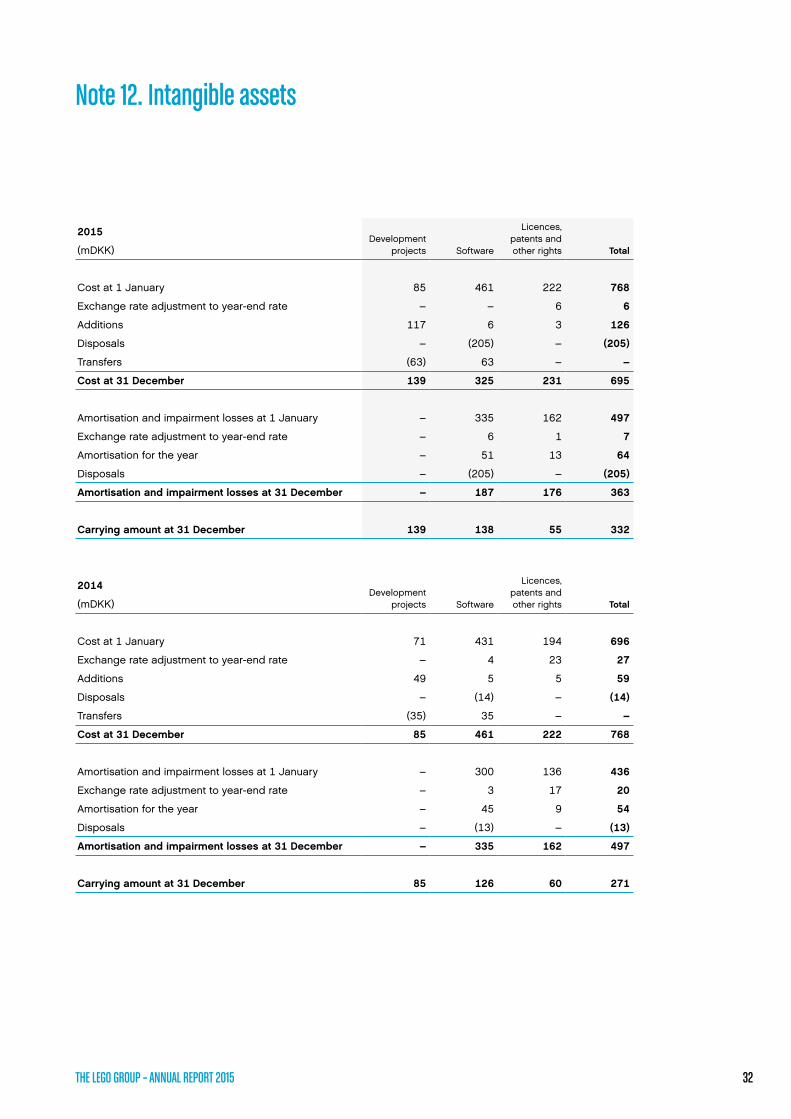
Note 12. Intangible assets
2015
(mDKK)Development
projects Software
Licences,patents andother rights Total
Cost at 1 January 85 461 222 768
Exchange rate adjustment to year-end rate – – 6 6
Additions 117 6 3 126
Disposals – (205) – (205)
Transfers (63) 63 – –
Cost at 31 December 139 325 231 695
Amortisation and impairment losses at 1 January – 335 162 497
Exchange rate adjustment to year-end rate – 6 1 7
Amortisation for the year – 51 13 64
Disposals – (205) – (205)
Amortisation and impairment losses at 31 December – 187 176 363
Carrying amount at 31 December 139 138 55 332
2014
(mDKK)Development
projects Software
Licences,patents andother rights Total
Cost at 1 January 71 431 194 696
Exchange rate adjustment to year-end rate – 4 23 27
Additions 49 5 5 59
Disposals – (14) – (14)
Transfers (35) 35 – –
Cost at 31 December 85 461 222 768
Amortisation and impairment losses at 1 January – 300 136 436
Exchange rate adjustment to year-end rate – 3 17 20
Amortisation for the year – 45 9 54
Disposals – (13) – (13)
Amortisation and impairment losses at 31 December – 335 162 497
Carrying amount at 31 December 85 126 60 271
THE LEGO GROUP – ANNUAL REPORT 2015 32
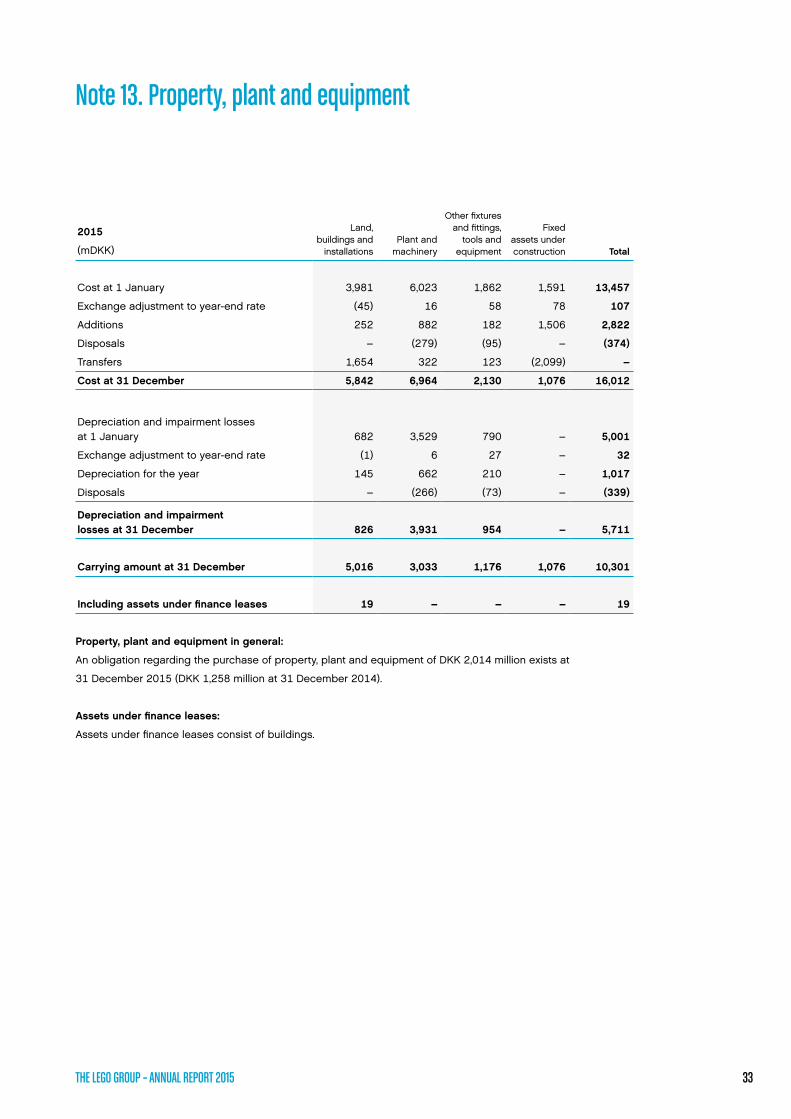
Note 13. Property, plant and equipment
2015
(mDKK)
Land, buildings and
installationsPlant and
machinery
Other fixtures and fittings,
tools and equipment
Fixed assets under construction Total
Cost at 1 January 3,981 6,023 1,862 1,591 13,457
Exchange adjustment to year-end rate (45) 16 58 78 107
Additions 252 882 182 1,506 2,822
Disposals – (279) (95) – (374)
Transfers 1,654 322 123 (2,099) –
Cost at 31 December 5,842 6,964 2,130 1,076 16,012
Depreciation and impairment losses at 1 January 682 3,529 790 – 5,001
Exchange adjustment to year-end rate (1) 6 27 – 32
Depreciation for the year 145 662 210 – 1,017
Disposals – (266) (73) – (339)
Depreciation and impairment losses at 31 December 826 3,931 954 – 5,711
Carrying amount at 31 December 5,016 3,033 1,176 1,076 10,301
Including assets under finance leases 19 – – – 19
Property, plant and equipment in general:
An obligation regarding the purchase of property, plant and equipment of DKK 2,014 million exists at
31 December 2015 (DKK 1,258 million at 31 December 2014).
Assets under finance leases:
Assets under finance leases consist of buildings.
THE LEGO GROUP – ANNUAL REPORT 2015 33
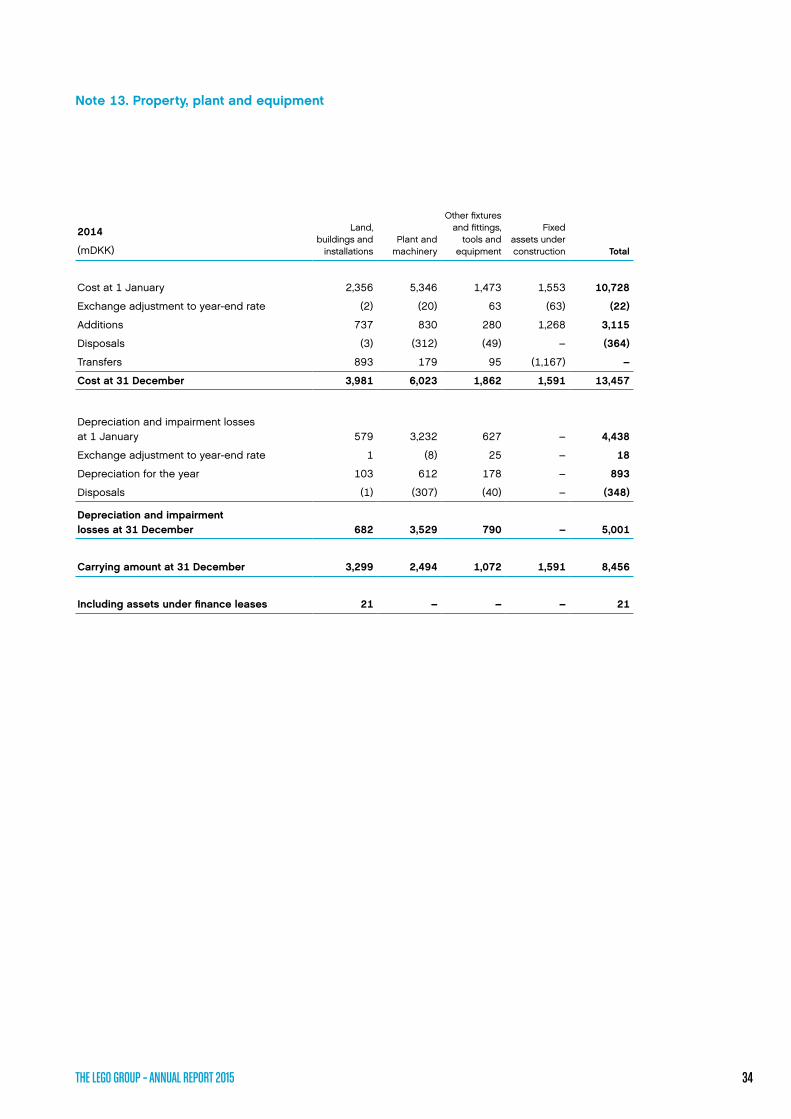
2014
(mDKK)
Land, buildings and
installationsPlant and
machinery
Other fixtures and fittings,
tools and equipment
Fixed assets under construction Total
Cost at 1 January 2,356 5,346 1,473 1,553 10,728
Exchange adjustment to year-end rate (2) (20) 63 (63) (22)
Additions 737 830 280 1,268 3,115
Disposals (3) (312) (49) – (364)
Transfers 893 179 95 (1,167) –
Cost at 31 December 3,981 6,023 1,862 1,591 13,457
Depreciation and impairment losses at 1 January 579 3,232 627 – 4,438
Exchange adjustment to year-end rate 1 (8) 25 – 18
Depreciation for the year 103 612 178 – 893
Disposals (1) (307) (40) – (348)
Depreciation and impairment losses at 31 December 682 3,529 790 – 5,001
Carrying amount at 31 December 3,299 2,494 1,072 1,591 8,456
Including assets under finance leases 21 – – – 21
Note 13. Property, plant and equipment
THE LEGO GROUP – ANNUAL REPORT 2015 34
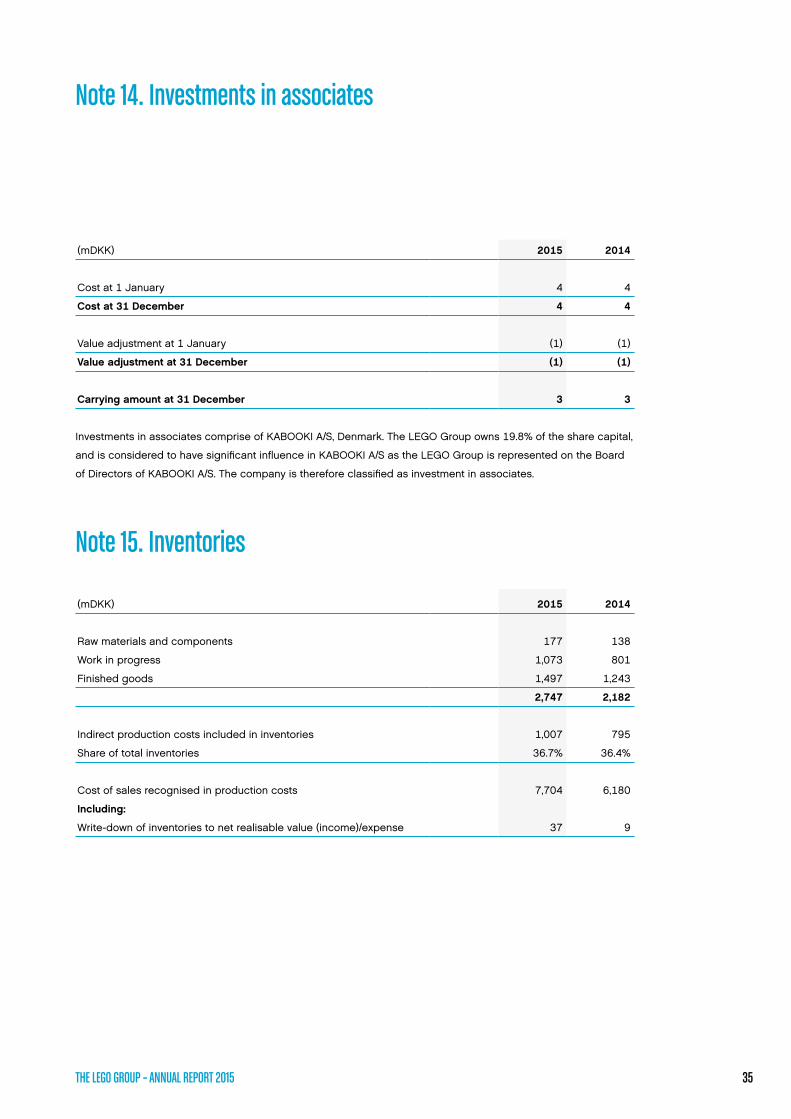
Note 14. Investments in associates
Note 15. Inventories
(mDKK) 2015 2014
Cost at 1 January 4 4
Cost at 31 December 4 4
Value adjustment at 1 January (1) (1)
Value adjustment at 31 December (1) (1)
Carrying amount at 31 December 3 3
(mDKK) 2015 2014
Raw materials and components 177 138
Work in progress 1,073 801
Finished goods 1,497 1,243
2,747 2,182
Indirect production costs included in inventories 1,007 795
Share of total inventories 36.7% 36.4%
Cost of sales recognised in production costs 7,704 6,180
Including:
Write-down of inventories to net realisable value (income)/expense 37 9
Investments in associates comprise of KABOOKI A/S, Denmark. The LEGO Group owns 19.8% of the share capital,
and is considered to have significant influence in KABOOKI A/S as the LEGO Group is represented on the Board
of Directors of KABOOKI A/S. The company is therefore classified as investment in associates.
THE LEGO GROUP – ANNUAL REPORT 2015 35

(mDKK) 2015 2014
Trade receivables (gross) 6,770 5,970
Provision for bad debts:
Balance at 1 January (79) (48)
Exchange adjustment to year-end rate (2) 1
Change in provision for the year (291) (44)
Realised losses for the year 12 12
Balance at 31 December (360) (79)
Trade receivables (net) 6,410 5,891
(mDKK) 2015 2014
Not overdue 6,234 5,329
0 - 60 days overdue 449 577
61 - 120 days overdue 13 23
121 - 180 days overdue 21 9
More than 180 days overdue 53 32
6,770 5,970
Note 16. Trade receivables
All trade receivables fall due within one year. The nominal value is considered equal to the fair value of
receiv ables falling due within one year from the balance sheet date.
The LEGO Group has no significant trade receivables concentrated in specific countries, but has some single
significant trade debtors. The LEGO Group has fixed procedures for determining the LEGO Group’s granting of
credit. The LEGO Group’s risk relating to trade receivables is considered to be moderate. For more information,
see note 24.
As a consequence of the LEGO Group’s global growth, the company experiences an increase in the risk related
to trade receivables. This is reflected in an increase in provisions for bad debts.
The age distribution of gross trade receivables is as follows:
THE LEGO GROUP – ANNUAL REPORT 2015 36
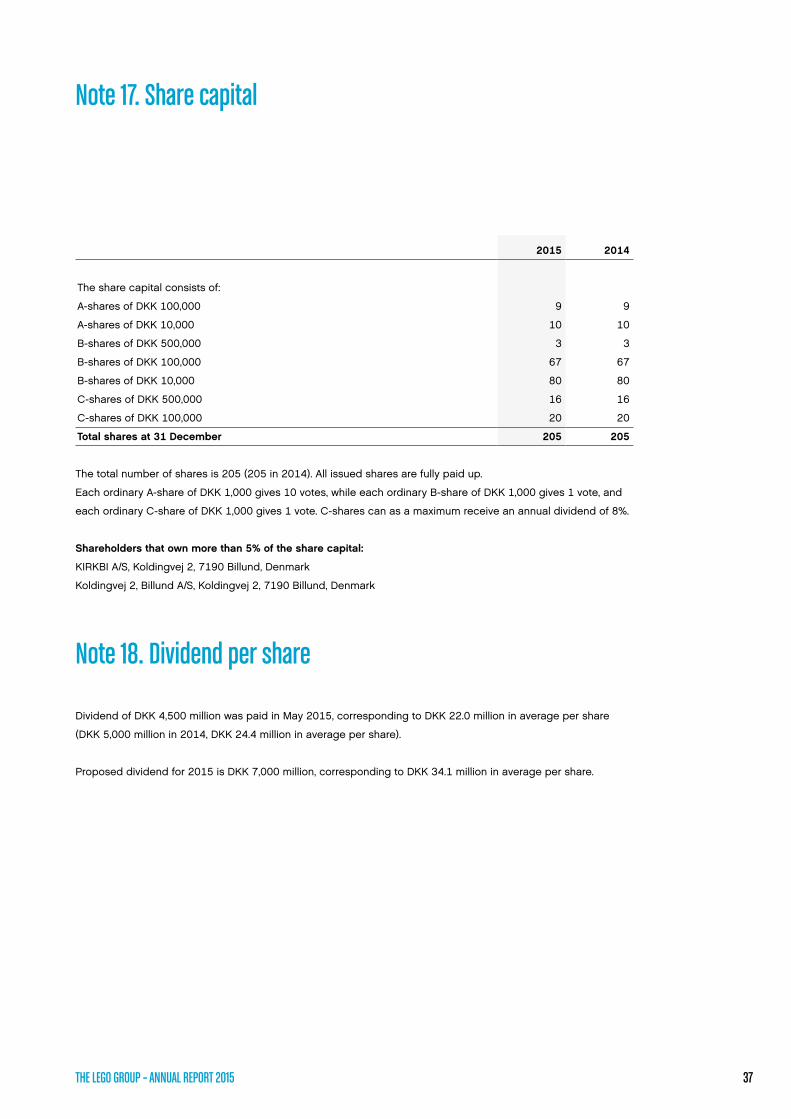
2015 2014
The share capital consists of:
A-shares of DKK 100,000 9 9
A-shares of DKK 10,000 10 10
B-shares of DKK 500,000 3 3
B-shares of DKK 100,000 67 67
B-shares of DKK 10,000 80 80
C-shares of DKK 500,000 16 16
C-shares of DKK 100,000 20 20
Total shares at 31 December 205 205
Note 17. Share capital
Note 18. Dividend per share
The total number of shares is 205 (205 in 2014). All issued shares are fully paid up.
Each ordinary A-share of DKK 1,000 gives 10 votes, while each ordinary B-share of DKK 1,000 gives 1 vote, and
each ordinary C-share of DKK 1,000 gives 1 vote. C-shares can as a maximum receive an annual dividend of 8%.
Shareholders that own more than 5% of the share capital:
KIRKBI A/S, Koldingvej 2, 7190 Billund, Denmark
Koldingvej 2, Billund A/S, Koldingvej 2, 7190 Billund, Denmark
Dividend of DKK 4,500 million was paid in May 2015, corresponding to DKK 22.0 million in average per share
(DKK 5,000 million in 2014, DKK 24.4 million in average per share).
Proposed dividend for 2015 is DKK 7,000 million, corresponding to DKK 34.1 million in average per share.
THE LEGO GROUP – ANNUAL REPORT 2015 37

(mDKK) 2015 2014
Deferred tax, net at 1 January 285 14
Change in tax rates recognised in income statement (8) 5
Exchange rate adjustments (4) 8
Income statement charge 170 175
Charged to other comprehensive income (53) 83
Deferred tax, net at 31 December 390 285
Classified as:
Deferred tax assets 419 494
Deferred tax liabilities (29) (209)
390 285
Note 19. Deferred tax
THE LEGO GROUP – ANNUAL REPORT 2015 38

Note 19. Deferred tax
2015
(mDKK)Deferred tax
assetsDeferred tax
liabilitiesDeferred
tax net
Non-current assets 115 (109) 6
Receivables 49 (5) 44
Inventories 245 (183) 62
Provisions 147 – 147
Other liabilities 132 (47) 85
Other 70 (27) 43
Offset (342) 342 –
Tax loss carry-forwards 3 – 3
419 (29) 390
2014
(mDKK)Deferred tax
assetsDeferred tax
liabilitiesDeferred
tax net
Non-current assets 117 (87) 30
Receivables 1 (2) (1)
Inventories 257 (158) 99
Provisions 128 – 128
Other liabilities 94 6 100
Other 24 (111) (87)
Offset (143) 143 –
Tax loss carry-forwards 16 – 16
494 (209) 285
Tax loss carry-forwards:
Tax assets arising from tax losses carried forward are capitalised based on an assessment of whether they can
be utilised in the future.
DKK 2 million of the LEGO Group’s capitalised tax losses expire after 7 years (DKK 3 million in 2014 expire after
5 years).
THE LEGO GROUP – ANNUAL REPORT 2015 39

Note 20. Pension obligations
Defined contribution plans
In defined contribution plans, the LEGO Group recognises in the income statement the premium payments (e.g.
a fixed amount or a fixed percentage of the salary) to the independent insurance companies responsible for the
pension obligations. Once the pension contributions for defined contribution plans have been paid, the LEGO
Group has no further pension obligations towards current or past employees. The pension plans in the Danish
companies and some of the foreign companies are all defined contribution plans. In the LEGO Group, DKK 235
million (DKK 262 million in 2014) have been recognised in the income statement as costs relating to defined
contribution plans.
Defined benefit plans
In defined benefit plans, the LEGO Group is obliged to pay a certain pension benefit. The major defined benefit
plans in the Group include employees in Germany and in the UK. In the LEGO Group, a net obligation of DKK 95
million (DKK 82 million in 2014) has been recognised relating to the LEGO Group’s obligations towards current or
past employees concerning defined benefit plans. The obligation is calculated after deduction of the plan assets.
In the LEGO Group, DKK -12 million (DKK -5 million in 2014) have been recognised in the income statement and
DKK 2 million (DKK -14 million in 2014) have been recognised in other comprehensive income.
(mDKK) 2015 2014
The amounts recognised in the balance sheet are calculated as follows:
Present value of funded obligations (193) (171)
Fair value of plan assets 153 144
(40) (27)
Present value of unfunded obligations (55) (55)
Net liability recognised in the balance sheet (95) (82)
Of which included as part of the liabilities (95) (82)
The change in present value of defined benefit obligations for the year is as follows:
Present value at 1 January (226) (172)
Exchange adjustment to year-end rate (15) (12)
Pension costs relating to current financial year (9) (3)
Interest expenses (8) (7)
Remeasurement gains/(losses) 3 (37)
Benefits paid 7 5
Present value at 31 December (248) (226)
THE LEGO GROUP – ANNUAL REPORT 2015 40
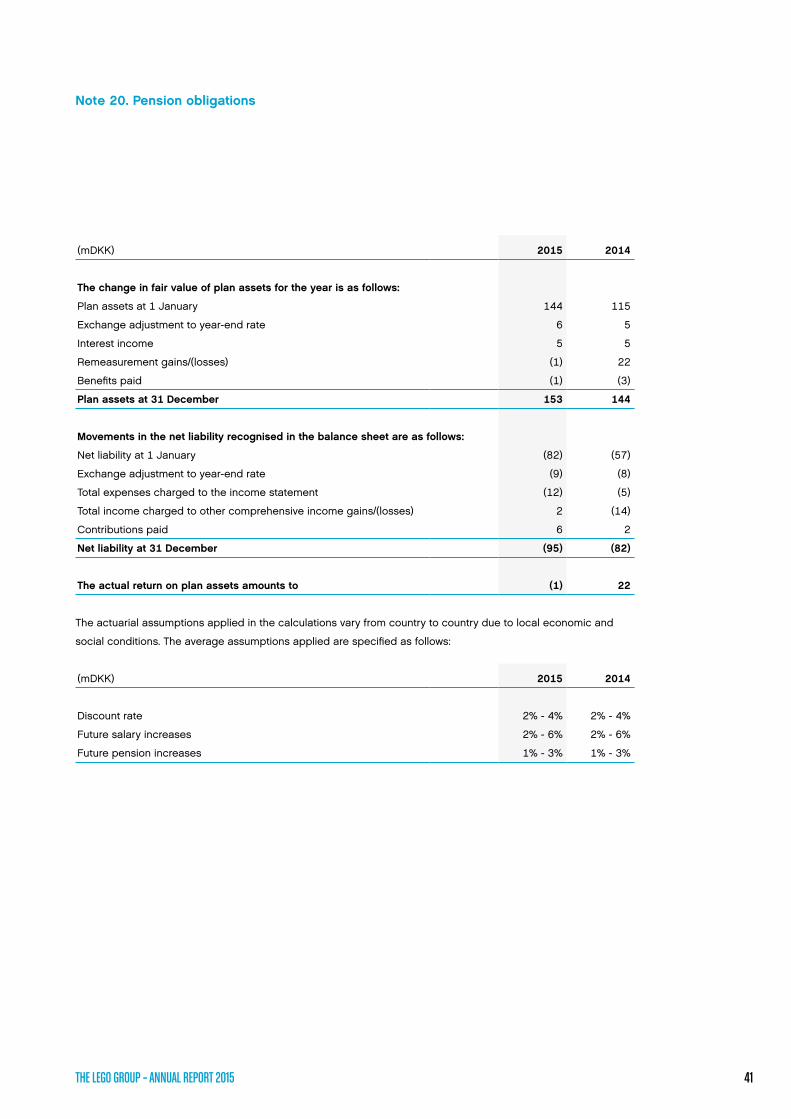
Note 20. Pension obligations
(mDKK) 2015 2014
The change in fair value of plan assets for the year is as follows:
Plan assets at 1 January 144 115
Exchange adjustment to year-end rate 6 5
Interest income 5 5
Remeasurement gains/(losses) (1) 22
Benefits paid (1) (3)
Plan assets at 31 December 153 144
Movements in the net liability recognised in the balance sheet are as follows:
Net liability at 1 January (82) (57)
Exchange adjustment to year-end rate (9) (8)
Total expenses charged to the income statement (12) (5)
Total income charged to other comprehensive income gains/(losses) 2 (14)
Contributions paid 6 2
Net liability at 31 December (95) (82)
The actual return on plan assets amounts to (1) 22
(mDKK) 2015 2014
Discount rate 2% - 4% 2% - 4%
Future salary increases 2% - 6% 2% - 6%
Future pension increases 1% - 3% 1% - 3%
The actuarial assumptions applied in the calculations vary from country to country due to local economic and
social conditions. The average assumptions applied are specified as follows:
THE LEGO GROUP – ANNUAL REPORT 2015 41

Note 21. Other debt
(mDKK) 2015 2014
Wage-related payables and other charges 1,844 1,282
Debt to related parties 521 374
Finance lease obligations 27 28
VAT and other indirect taxes 408 330
Amortised debt 147 151
Discounts 768 698
Other current liabilities 1,716 1,468
5,431 4,331
Specified as follows:
Non-current 98 96
Current 5,333 4,235
5,431 4,331
(mDKK) 2015 2014
Obligations regarding finance leases are as follows:
0-1 year 7 6
1-5 years 26 26
> 5 years 2 6
35 38
Reconciliation of carrying amount and gross liability:
Carrying amount of the liability 27 28
Interest expenses not yet accrued 8 10
Gross liability 35 38
Finance lease obligations:
The fair value of obligations regarding assets under finance leases corresponds to the carrying amount.
The fair value is estimated to equal the present value of expected future cash flows at a market interest rate for
similar leases.
No contingent leases have been recognised in expenses in 2015 or 2014.
None of the assets under finance leases have been subleased.
THE LEGO GROUP – ANNUAL REPORT 2015 42
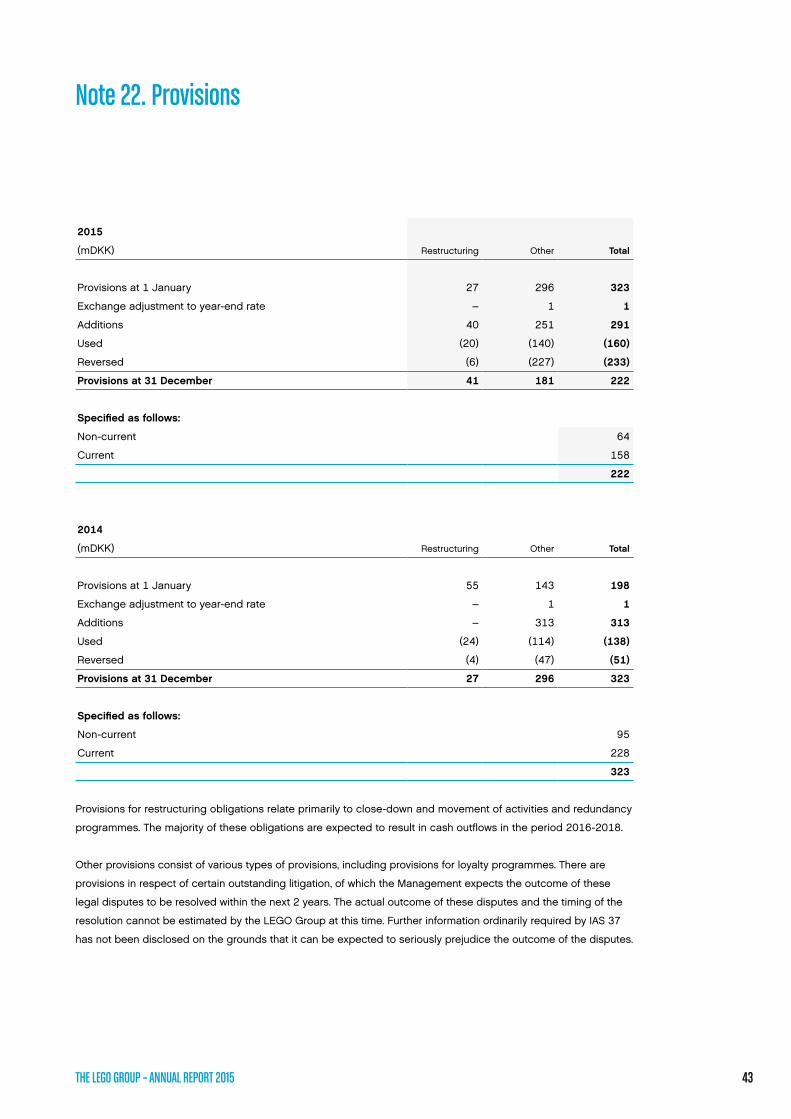
Note 22. Provisions
Provisions for restructuring obligations relate primarily to close-down and movement of activities and redundancy
programmes. The majority of these obligations are expected to result in cash outflows in the period 2016-2018.
Other provisions consist of various types of provisions, including provisions for loyalty programmes. There are
provisions in respect of certain outstanding litigation, of which the Management expects the outcome of these
legal disputes to be resolved within the next 2 years. The actual outcome of these disputes and the timing of the
resolution cannot be estimated by the LEGO Group at this time. Further information ordinarily required by IAS 37
has not been disclosed on the grounds that it can be expected to seriously prejudice the outcome of the disputes.
2015
(mDKK) Restructuring Other Total
Provisions at 1 January 27 296 323
Exchange adjustment to year-end rate – 1 1
Additions 40 251 291
Used (20) (140) (160)
Reversed (6) (227) (233)
Provisions at 31 December 41 181 222
Specified as follows:
Non-current 64
Current 158
222
2014
(mDKK) Restructuring Other Total
Provisions at 1 January 55 143 198
Exchange adjustment to year-end rate – 1 1
Additions – 313 313
Used (24) (114) (138)
Reversed (4) (47) (51)
Provisions at 31 December 27 296 323
Specified as follows:
Non-current 95
Current 228
323
THE LEGO GROUP – ANNUAL REPORT 2015 43

Note 23. Contingent assets, contingent liabilities and other obligations
(mDKK) 2015 2014
Guarantees 127 96
Operating lease obligations 2,702 2,214
Other obligations 262 368
3,091 2,678
(mDKK) 2015 2014
Related parties:
0-1 year 53 60
1-5 years 117 125
> 5 years 189 157
359 342
Other:
0-1 year 500 414
1-5 years 1,425 1,010
> 5 years 418 448
2,343 1,872
(mDKK) 2015 2014
Lease expenses for the year charged to the income statement amount to 747 633
Guarantees relate to bank guarantees for commitments.
The LEGO Group leases various offices, LEGO retail stores, warehouses and plant and machinery under non-
cancellable operating leases. The leases have varying terms, clauses and rights. The LEGO Group also leases
plant and machinery under cancellable operating leases. The LEGO Group is required to give various notices of
termination of these agreements.
Security has been given in land, buildings and installations with a net carrying amount of DKK 344 million (DKK
318 million in 2014) for the LEGO Group’s mortgage loans.
The LEGO Group has utilised tax losses in non-Danish jurisdictions in the Danish joint taxation until 31 December
2004. The deferred tax of this amounts to DKK 108 million (DKK 116 million in 2014), of which DKK 0 million has
been recognised as provision for deferred tax. The amount of DKK 108 million is not expected to be recaptured.
The Danish companies in the LEGO Group are jointly and severally liable for corporate income tax according to
the joint taxation in the LEGO Group, KIRKBI A/S and in the companies controlled by KIRKBI A/S. The total amount
of current tax liabilities, as well as related current tax credit counterparts are shown in the Annual Report of KIRKBI
A/S, which is the administration company of the joint taxation. The Danish companies in the LEGO Group are
furthermore jointly and severally liable for Danish taxes at source withheld on behalf of nonresident companies for
dividend, royalty and interest.
The LEGO Group is part in certain legal disputes. For further infomation see note 22.
Future minimum lease payments under non-cancellable operating leases are specified as follows:
THE LEGO GROUP – ANNUAL REPORT 2015 44
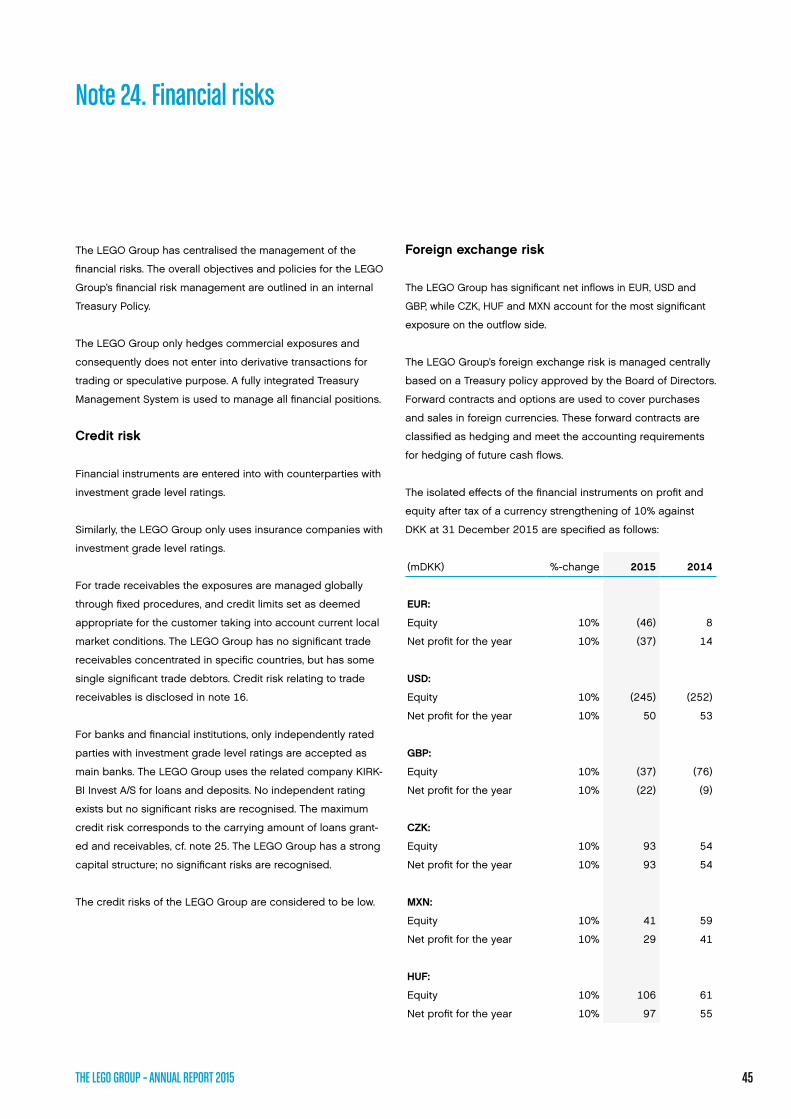
The LEGO Group has centralised the management of the
financial risks. The overall objectives and policies for the LEGO
Group’s financial risk management are outlined in an internal
Treasury Policy.
The LEGO Group only hedges commercial exposures and
consequently does not enter into derivative transactions for
trading or speculative purpose. A fully integrated Treasury
Management System is used to manage all financial positions.
Credit risk
Financial instruments are entered into with counterparties with
investment grade level ratings.
Similarly, the LEGO Group only uses insurance companies with
investment grade level ratings.
For trade receivables the exposures are managed globally
through fixed procedures, and credit limits set as deemed
appropriate for the customer taking into account current local
market conditions. The LEGO Group has no significant trade
receivables concentrated in specific countries, but has some
single significant trade debtors. Credit risk relating to trade
receivables is disclosed in note 16.
For banks and financial institutions, only independently rated
parties with investment grade level ratings are accepted as
main banks. The LEGO Group uses the related company KIRK-
BI Invest A/S for loans and deposits. No independent rating
exists but no significant risks are recognised. The maximum
credit risk corresponds to the carrying amount of loans grant-
ed and receivables, cf. note 25. The LEGO Group has a strong
capital structure; no significant risks are recognised.
The credit risks of the LEGO Group are considered to be low.
Note 24. Financial risks
(mDKK) %-change 2015 2014
EUR:
Equity 10% (46) 8
Net profit for the year 10% (37) 14
USD:
Equity 10% (245) (252)
Net profit for the year 10% 50 53
GBP:
Equity 10% (37) (76)
Net profit for the year 10% (22) (9)
CZK:
Equity 10% 93 54
Net profit for the year 10% 93 54
MXN:
Equity 10% 41 59
Net profit for the year 10% 29 41
HUF:
Equity 10% 106 61
Net profit for the year 10% 97 55
Foreign exchange risk
The LEGO Group has significant net inflows in EUR, USD and
GBP, while CZK, HUF and MXN account for the most significant
exposure on the outflow side.
The LEGO Group’s foreign exchange risk is managed centrally
based on a Treasury policy approved by the Board of Directors.
Forward contracts and options are used to cover purchases
and sales in foreign currencies. These forward contracts are
classified as hedging and meet the accounting requirements
for hedging of future cash flows.
The isolated effects of the financial instruments on profit and
equity after tax of a currency strengthening of 10% against
DKK at 31 December 2015 are specified as follows:
THE LEGO GROUP – ANNUAL REPORT 2015 45
The financial instruments included in the foreign exchange
sensitivity analysis are the LEGO Group’s; Cash at banks,
Trade receivables, Trade payables, Current and Non- current
Borrowings and foreign exchange forwards and foreign
exchange options.
Interest rate risk
The LEGO Group’s interest rate risk relates to interest-bearing
debt and interest-bearing assets. The LEGO Group’s interest-
bearing assets consist mainly of liquid funds. Liquid funds yield
interest on the short-term money market. An increase in the
interest level of 1.0% for 2015 would have had a positive impact
on the LEGO Group’s profit before tax of approx. DKK 13.8
million in 2015 (DKK 4.4 million in 2014). The LEGO Group’s
interest rate risk is considered immaterial and is not expected
to have a significant impact on the LEGO Group’s results.
Other market risk
Liquidity risk
Liquidity is managed centrally and is continually assessed.
It is ensured that, at any given time, sufficient financial
resources are available. Based on the financial reserves with
banks and credit facilities available in credit institutions and
from related parties, there are no liquidity problems. The
liquidity risk is therefore not significant. Furthermore excess
liquidity is placed at KIRKBI Invest A/S which is why the
counterparty risk is assessed to be low.
Capital risk management
Dividend of DKK 4,500 million has been paid in May 2015
(DKK 5,000 million in 2014). It is expected that the dividend
for 2015, to be paid in 2016 will amount to DKK 7,000 million.
The dividend payment reflects the strategy behind the capital
structure where the LEGO Group is the operational company
and any surplus liquidity is distributed to the owners.
Note 24. Financial risks
The maturity profile of financial liabilities is disclosed accord-
ing to category and class distributed on period to maturity.
All interest payments on and repayments of financial assets
and liabilities are based on contracts. Interest payments on
floating-rate instruments are fixed by means of a zero coupon
interest structure. None of the cash flows are discounted.
At 31 December 2015 forward contracts and options have
been applied for hedging of cash flows covering future finan-
cial periods. The hedging mainly relates to the LEGO Group’s
sales of goods and services in USD, EUR, GBP, AUD and
CAD as well as purchases of goods in CZK, MXN and HUF.
All contracts are expected to expire - and thus affect results
- in the financial year 2016.
The following table shows the timing of cash flows related to
financial liabilities and hedging instruments.
Note 25. Financial assets and liabilities
THE LEGO GROUP – ANNUAL REPORT 2015 46

2015
(mDKK)Carrying amount Fair value 0-1 year 1-5 years
Over 5 years
Total cash flows
Measured at amortised cost (liabilities):
Debt to credit institutions 376 376 189 42 149 380
Debt to related parties 600 600 19 638 – 657
Trade payables 3,143 3,143 3,143 – – 3,143
Other debt1 3,076 3,076 3,056 26 2 3,084
7,195 7,195 6,407 706 151 7,264
Derivative financial instruments:
Measured at fair value through the income statement 56 56 56 – – 56
Measured at fair value through other comprehensive income (cash flow hedging) 32 32 32 – – 32
88 88 88 – – 88
Total financial liabilities 7,283 7,283 6,495 706 151 7,352
Measured at amortised cost (loans and receivables):
Trade receivables 6,410 6,410 6,410 – – 6,410
Other receivables1 579 579 579 – – 579
Receivables from related parties 4,932 4,932 4,932 – – 4,932
Cash at bank and in hand 1,211 1,211 1,211 – – 1,211
13,132 13,132 13,132 – – 13,132
Derivative financial instruments:
Measured at fair value through the income statement 12 12 12 – – 12
Measured at fair value through other comprehensive income (cash flow hedging) 43 43 43 – – 43
55 55 55 – – 55
Total financial assets 13,187 13,187 13,187 – – 13,187
1 Prepayments are excluded from the other receivables balance and taxes and duties payable and wage related payables are excluded from other debt balance as this analysis is only required for financial instruments.
Note 25. Financial assets and liabilities
THE LEGO GROUP – ANNUAL REPORT 2015 47

2014
(mDKK)Carrying amount Fair value 0-1 year 1-5 years
Over 5 years
Total cash flows
Measured at amortised cost (liabilities):
Debt to credit institutions 358 358 163 42 167 372
Debt to related parties 600 600 19 657 – 676
Trade payables 2,530 2,530 2,530 – – 2,530
Other debt1 2,378 2,378 2,356 26 6 2,388
5,866 5,866 5,068 725 173 5,966
Derivative financial instruments:
Measured at fair value through the income statement 87 87 87 – – 87
Measured at fair value through other comprehensive income (cash flow hedging) 246 246 246 – – 246
333 333 333 – – 333
Total financial liabilities 6,199 6,199 5,401 725 173 6,299
Measured at amortised cost (loans and receivables):
Trade receivables 5,891 5,891 5,891 – – 5,891
Other receivables1 385 385 385 – – 385
Receivables from related parties 2,598 2,598 2,598 – – 2,598
Cash at bank and in hand 482 482 482 – – 482
9,356 9,356 9,356 – – 9,356
Derivative financial instruments:
Measured at fair value through the income statement 16 16 16 – – 16
Measured at fair value through other comprehensive income (cash flow hedging) 37 37 31 6 – 37
53 53 47 6 – 53
Total financial assets 9,409 9,409 9,403 6 – 9,409
Note 25. Financial assets and liabilities
1 Prepayments are excluded from the other receivables balance and taxes and duties payable and wage related payables are excluded from other debt balance as this analysis is only required for financial instruments.
THE LEGO GROUP – ANNUAL REPORT 2015 48

Note 25. Financial assets and liabilities
The following table presents the LEGO Group’s assets and liabilities measured at fair value at 31 December 2015:
• Quoted prices (unadjusted) in active markets for identical assets or liabilities (level 1).
• Inputs other than quoted prices included within level 1 that are observable for the assets or liabilities,
either directly (that is, as prices) or indirectly (what is, derived from prices) (level 2).
• Inputs for assets or liabilities that are not based on observable market data (that is, unobservable inputs) (level 3).
2015
(mDKK) Level 1 Level 2 Level 3 Total
ASSETS
Financial assets at fair value through income statement:
Derivative financial instruments – 12 – 12
Financial assets at fair value through other comprehensive income:
Derivative financial instruments (cash flow hedging) – 43 – 43
TOTAL ASSETS – 55 – 55
LIABILITIES
Financial liabilities at fair value through income statement:
Derivative financial instruments – 56 – 56
Financial liabilities at fair value through other comprehensive income:
Derivative financial instruments (cash flow hedging) – 32 – 32
TOTAL LIABILITIES – 88 – 88
THE LEGO GROUP – ANNUAL REPORT 2015 49

Note 25. Financial assets and liabilities
2014
(mDKK) Level 1 Level 2 Level 3 Total
ASSETS
Financial assets at fair value through income statement:
Derivative financial instruments – 16 – 16
Financial assets at fair value through other comprehensive income:
Derivative financial instruments (cash flow hedging) – 37 – 37
Total assets – 53 – 53
LIABILITIES
Financial liabilities at fair value through income statement:
Derivative financial instruments – 87 – 87
Financial liabilities at fair value through other comprehensive income:
Derivative financial instruments (cash flow hedging) – 246 – 246
Total liabilities – 333 – 333
Note 26. Derivative financial instruments
Total hedging activities
The LEGO Group uses a number of derivatives to hedge currency exposure. The hedging activities are categorised
into hedging of forecast transactions (cash flow hedges), and hedging of assets and liabilities (fair value hedges).
The changes in fair value of the financial instruments qualifying for hedge accounting are recognised directly
under other comprehensive income until the hedged items affect the income statement. The changes in fair value
of the financial instruments not qualifying for hedge accounting are recognised directly in the income statement.
This includes time value of options.
All changes in fair value of hedging of assets and liabilities (fair value hedging) are recognised directly in the
income statement.
THE LEGO GROUP – ANNUAL REPORT 2015 50

The table below shows the fair value of hedging activities specified by hedging instruments and the major currencies.
2015
(mDKK) Contract
amount Positive
fair value Negative fair value
Period covered
Hedging of forecast transactions qualifying for hedge accounting:
USD (Sale of currency) 3,382 19 15 12 months
JPY (Sale of currency) 284 – 11 11 months
GBP (Sale of currency) 203 7 – 5 months
Other (Purchase of currency) 278 – 3 11 months
Other (Sale of currency) 589 17 3 4 months
Total forward contracts 4,736 43 32
USD (Sale of currency) 666 – – 4 months
Total currency options 666 – –
Hedging of balance items qualifying for hedge
accounting:
USD (Sale of currency) 915 7 38 2 months
JPY (Sale of currency) 57 – 4 2 months
GBP (Sale of currency) 305 – 3 2 months
CZK (Purchase of currency) 34 – – 2 months
Other (Purchase of currency) 162 2 – 2 months
Other (Sale of currency) 59 1 3 2 months
Total forward contracts 1,532 10 48
USD (Sale of currency) 666 – – 2 months
Total currency options 666 – –
Total for which hedge accounting applies 7,600 53 80
Other forecast transaction hedges for which
hedge accounting is not applied:
Other 6 – – 1 month
Total forward contracts 6 – –
Options (Time Value) – 2 8 4 months
Total currency options – 2 8
Total for which hedge accounting is not applied 6 2 8
Total of forecast transactions 7,606 55 88
Note 26. Derivative financial instruments
THE LEGO GROUP – ANNUAL REPORT 2015 51
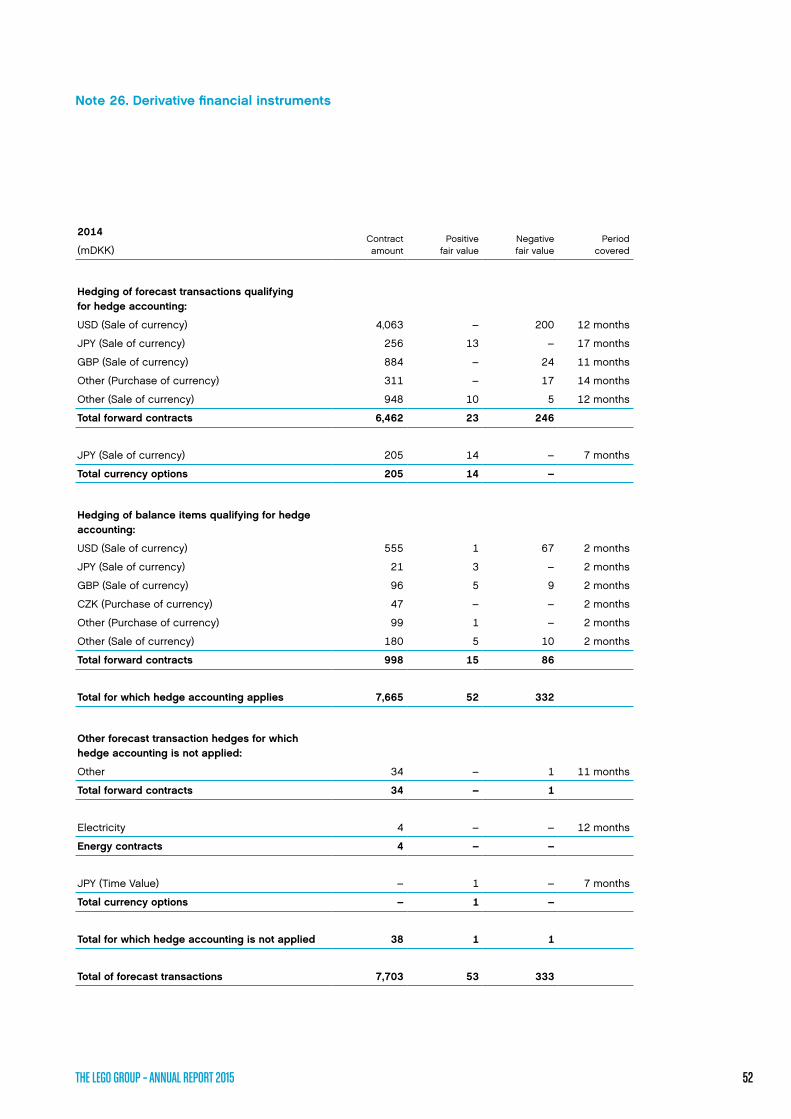
2014
(mDKK) Contract
amount Positive
fair value Negative fair value
Period covered
Hedging of forecast transactions qualifying
for hedge accounting:
USD (Sale of currency) 4,063 – 200 12 months
JPY (Sale of currency) 256 13 – 17 months
GBP (Sale of currency) 884 – 24 11 months
Other (Purchase of currency) 311 – 17 14 months
Other (Sale of currency) 948 10 5 12 months
Total forward contracts 6,462 23 246
JPY (Sale of currency) 205 14 – 7 months
Total currency options 205 14 –
Hedging of balance items qualifying for hedge
accounting:
USD (Sale of currency) 555 1 67 2 months
JPY (Sale of currency) 21 3 – 2 months
GBP (Sale of currency) 96 5 9 2 months
CZK (Purchase of currency) 47 – – 2 months
Other (Purchase of currency) 99 1 – 2 months
Other (Sale of currency) 180 5 10 2 months
Total forward contracts 998 15 86
Total for which hedge accounting applies 7,665 52 332
Other forecast transaction hedges for which
hedge accounting is not applied:
Other 34 – 1 11 months
Total forward contracts 34 – 1
Electricity 4 – – 12 months
Energy contracts 4 – –
JPY (Time Value) – 1 – 7 months
Total currency options – 1 –
Total for which hedge accounting is not applied 38 1 1
Total of forecast transactions 7,703 53 333
Note 26. Derivative financial instruments
THE LEGO GROUP – ANNUAL REPORT 2015 52

Note 27. Other reversals with no effect on cash flows
Note 28. Cash at banks
(mDKK) Note 2015 2014
Profit before income tax 12,148 9,491
Adjustments for:
Depreciation 7 1,081 947
Loss on sale of property, plant and equipment 22 6
Net movements in provisions (101) 125
Remeasurements of defined benefit plans 2 14
Net movements in pension 13 25
Financial income and expenses 9,10 96 206
Hedge accounting 217 (334)
Other adjustments – 55
Changes in working capital:
Trade receivables (424) (1,021)
Inventory (567) (358)
Other receivables (222) 213
Prepayments (26) (41)
Trade payables 587 329
Other debt 1,024 1,050
13,850 10,707
(mDKK) 2015 2014
Cash at banks 1,211 482
1,211 482
THE LEGO GROUP – ANNUAL REPORT 2015 53

Note 29. Related party transactions
The Parent of the LEGO Group is LEGO A/S, a company incorporated in Denmark, whose shares are owned
by KIRKBI A/S (75%) and Koldingvej 2, Billund A/S (25%). The shares in KIRKBI A/S are wholly owned by the
Kirk Kristiansen family (Billund, Denmark). Related parties are considered to be Key Management, KABOOKI
A/S, KIRKBI A/S, subsidiaries of KIRKBI A/S, KIRKBI AG Group and Merlin Entertainments Group, in which the
above-mentioned family has significant interest. None of the related party transactions are secured.
The following transactions were carried through with related parties:
(mDKK) 2015 2014
Transactions with KIRKBI A/S:
Acquisitions of assets (2) –
Sale of assets – 1
Rent charged (41) (44)
Service fee charged – (3)
Service fee received 21 19
Total transactions with KIRKBI A/S (22) (27)
Transactions with Koldingvej 2, Billund A/S:
Service fee received 50 42
Total transactions with Koldingvej 2, Billund A/S 50 42
Transactions with associates:
Trademark fee received 8 9
Purchase of products (3) (4)
Total transactions with associates 5 5
Transactions with KIRKBI Invest A/S Group:
Interest received – 1
Rent charged (19) (18)
Interest charged (19) (19)
Service fee received 15 30
Trademark fee charged (1,324) (1,036)
Total transactions with KIRKBI Invest A/S Group (1,347) (1,042)
Transactions with Merlin Entertainments Group:
Sale of products 481 373
Trademark fee received 23 19
Service fee charged (11) (10)
Total transactions with Merlin Entertainments Group 493 382
THE LEGO GROUP – ANNUAL REPORT 2015 54

Note 29. Related party transactions
(mDKK) 2015 2014
Transactions with other related parties:
Sale of products – 2
Donations received 27 10
Rent charged (1) (1)
Service fee charged – (2)
Service fee received 1 –
Total transactions with other related parties 27 9
(mDKK) 2015 2014
Balances with KIRKBI A/S:
Receivables 7 5
Payables (3) –
4 5
Balances with Koldingvej 2, Billund A/S:
Receivables 30 3
30 3
Balances with associates:
Receivables 4 –
Payables (1) –
3 –
Balances with KIRKBI Invest A/S Group:
Receivables 14 18
Payables (524) (360)
(510) (342)
Remuneration to Key Management Personnel is disclosed in note 6.
Transactions with related parties were carried out on an arm’s length basis.
Year-end balances arising from sales/purchases of goods/services:
THE LEGO GROUP – ANNUAL REPORT 2015 55

Note 29. Related party transactions
Year-end balances regarding loans:
2015
(mDKK)KIRKBI
Invest A/S
Balance at 1 January – Loan investment 2,598
Loans advanced during the year 12,144
Repayments - loan investment (9,810)
Balance at 31 December 4,932
Specified as follows:
Non-current –
Current 4,932
4,932
Balance at 1 January – Loan borrowing (600)
Balance at 31 December (600)
Specified as follows:
Non-current (600)
Current –
(600)
(mDKK) 2015 2014
Balances with Merlin Entertainments Group:
Receivables 50 60
Payables (2) (1)
48 59
Balances with other related parties:
Receivables 7 1
7 1
THE LEGO GROUP – ANNUAL REPORT 2015 56

Note 29. Related party transactions
1 Payments to related parties amounting to DKK 12,948 million and payments from related parties amounting to DKK 12,660 million.
2014
(mDKK)KIRKBI
Invest A/S
Balance at 1 January – Loan investment 2,310
Loans advanced during the year1 10,948
Repayments - loan investment1 (10,660)
Balance at 31 December 2,598
Specified as follows:
Non-current –
Current 2,598
2,598
Balance at 1 January – Loan borrowing (600)
Loans raised during the year1 (2,000)
Repayments – loan borrowing1 2,000
Balance at 31 December (600)
Specified as follows:
Non-current (600)
Current –
(600)
THE LEGO GROUP – ANNUAL REPORT 2015 57

Parent CompanyFinancial Statements

(mDKK) Note 2015 2014
Revenue 119 97
Gross profit 119 97
Other operating expenses 2 (85) (73)
Operating profit 34 24
Net profit for the year from subsidiaries 9,133 7,023
Financial income 3 38 2
Financial expenses 4 (60) (36)
Profit before income tax 9,145 7,013
Tax on profit for the year 5 (2) (14)
Net profit for the year 9,143 6,999
Proposed distribution of profit:
Dividend 7,000 4,500
Reserve from the use of the equity method 2,620 1,228
Retained earnings (477) 1,271
9,143 6,999
Income Statement1 January – 31 December
59PARENT COMPANY – ANNUAL REPORT 2015

Balance Sheetat 31 December
(mDKK) Note 2015 2014
ASSETS
Non-current assets:
Patents 5 6
Intangible assets 6 5 6
Land, buildings and installations 6 6
Property, plant and equipment 7 6 6
Deferred tax assets 10 7 2
Investments in subsidiaries 8 19,353 15,714
Investments in associates 8 3 3
Other non-current assets 19,363 15,719
Total non-current assets 19,374 15,731
Current assets:
Receivables from subsidiaries 1,810 311
Other receivables 4 4
Total current assets 1,814 315
TOTAL ASSETS 21,188 16,046
60PARENT COMPANY – ANNUAL REPORT 2015
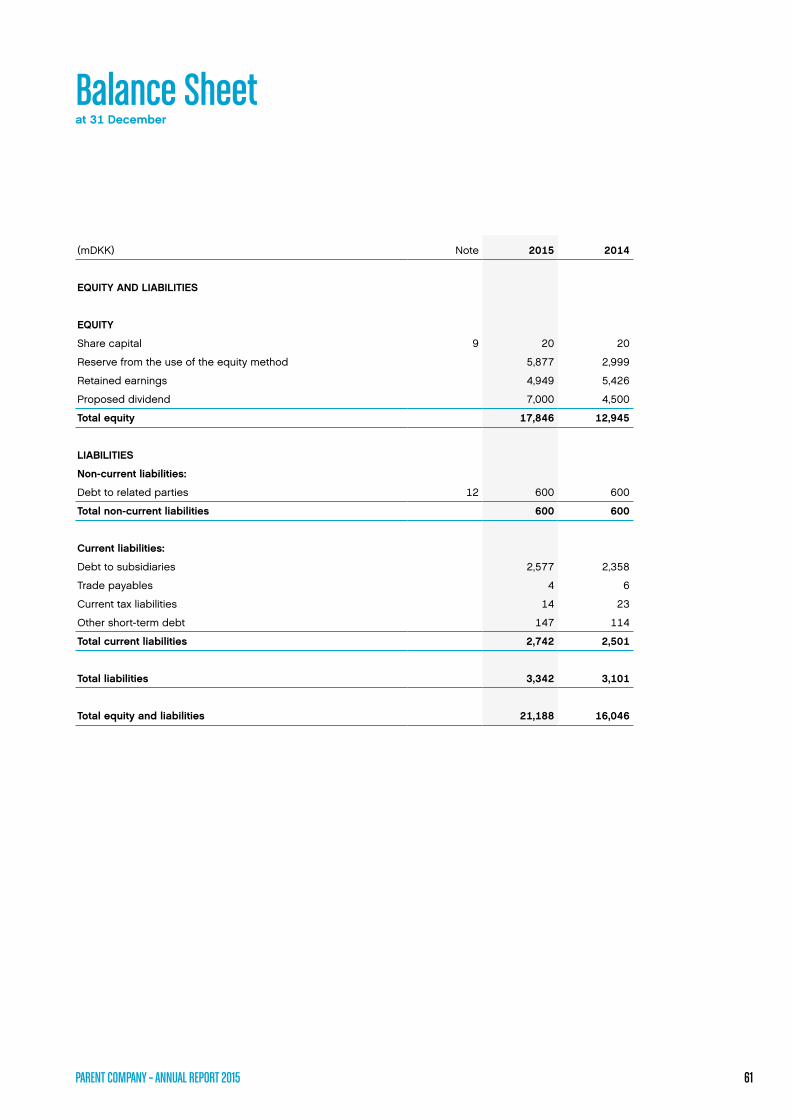
Balance Sheet at 31 December
(mDKK) Note 2015 2014
EQUITY AND LIABILITIES
EQUITY
Share capital 9 20 20
Reserve from the use of the equity method 5,877 2,999
Retained earnings 4,949 5,426
Proposed dividend 7,000 4,500
Total equity 17,846 12,945
LIABILITIES
Non-current liabilities:
Debt to related parties 12 600 600
Total non-current liabilities 600 600
Current liabilities:
Debt to subsidiaries 2,577 2,358
Trade payables 4 6
Current tax liabilities 14 23
Other short-term debt 147 114
Total current liabilities 2,742 2,501
Total liabilities 3,342 3,101
Total equity and liabilities 21,188 16,046
61PARENT COMPANY – ANNUAL REPORT 2015

Statement of Changes in Equity
2015
(mDKK)Share
capital
Reserve from the use of the
equity methodRetained earnings
Proposed dividend
Total equity
Equity at 1 January 20 2,999 5,426 4,500 12,945
Dividend paid relating to prior year – – – (4,500) (4,500)
Net profit for the year – 2,620 (477) – 2,143
Currency translation adjustments – 92 – – 92
Entries recognised directly on equity
in subsidiaries – 166 – – 166
Proposed dividend – – – 7,000 7,000
Equity at 31 December 20 5,877 4,949 7,000 17,846
2014
(mDKK)Share
capital
Reserve from the use of the
equity methodRetained earnings
Proposed dividend
Total equity
Equity at 1 January 20 2,029 4,155 5,000 11,204
Dividend paid relating to prior year – – – (5,000) (5,000)
Net profit for the year – 1,228 1,271 – 2,499
Currency translation adjustments – 22 – – 22
Entries recognised directly on equity
in subsidiaries – (280) – – (280)
Proposed dividend – – – 4,500 4,500
Equity at 31 December 20 2,999 5,426 4,500 12,945
62PARENT COMPANY – ANNUAL REPORT 2015

Notes
Basis for preparation
64 Note 1. Significant accounting policies
65 Note 2. Employee expenses
Income Statement
65 Note 3. Financial income
65 Note 4. Financial expenses
66 Note 5. T ax on profit for the year
Balance Sheet and other disclosures
66 Note 6. Intangible assets
67 Note 7. Property, plant and equipment
68 Note 8. Investments in associates and subsidiaries
69 Note 9. Share capital
69 Note 10. Deferred tax
70 Note 11. Contingent liabilities and other obligations
70 Note 12. Related party transactions

Note 1. Significant accounting policies
The Financial Statements of the Parent Company have been
prepared in accordance with the provisions of the Danish
Financial Statements Act applying to enterprises of reporting
class C (medium-sized).
The accounting policies are the same as for the Consolidated
Financial Statements with the following additions.
The accounting policies for the Financial Statements of the
Parent Company are unchanged from the latest financial year.
Supplementary accounting policies for the Parent Company
Taxes
Current income tax, based on taxable income for the year, is
expensed together with changes in deferred tax for the year.
Deferred income tax on temporary differences arising be-
tween the tax bases of assets and liabilities and their carrying
amounts is provided in full using the liability method.
The provision of deferred tax reflects the effect of any tax loss-
es carried forward etc. to the extent it is considered likely that
such items can be utilised against future taxable income. To
the extent calculated deferred tax is positive, this is recognised
in the balance sheet as a deferred tax asset at the expected
realisable value.
Any changes in deferred tax due to changes in tax rates are
recognised in the income statement.
Investments in subsidiaries and associates
Subsidiaries and associates of the Parent Company are rec-
ognised under the equity method, which is at the respective
share of the net asset values in subsidiaries and associates.
Any costs in excess of net assets in the acquired company are
capitalised in the Parent Company under Investments in sub-
sidiaries as part of the investments (“Goodwill”). Amortisation of
the goodwill is provided under the straight-line method over a
period not exceeding 5 years based on estimated useful life.
To the extent it exceeds declared dividend from subsidiaries,
net revaluation of investments in subsidiaries and associates is
transferred to net revaluation reserve according to the equity
method under equity.
Profits in subsidiaries and associates are disclosed as profit
after tax in the income statement of the Parent Company.
Equity
Dividend distribution
Dividend distribution proposed by Management for the
financial year is disclosed as a separate item under equity.
64PARENT COMPANY – ANNUAL REPORT 2015

Note 2. Employee expenses
Note 3. Financial income
Note 4. Financial expenses
(mDKK) 2015 2014
Management Board1:
Salaries 43 25
Pension 2 1
Short-term incentive plans 12 8
Long-term incentive plans 23 19
80 53
Including fee to Board of Directors: 4 4
Number of employees 5 4
(mDKK) 2015 2014
Interest income from subsidiaries 38 2
38 2
(mDKK) 2015 2014
Interest expenses on mortgage loans – 2
Interest expenses to related parties 19 19
Interest expenses to subsidiaries 41 15
60 36
1 Management Board includes Executive Vice Presidents and the CEO for the LEGO Group. Employee expenses to Management Board are the total amount expensed in all entities within the LEGO Group.
65PARENT COMPANY – ANNUAL REPORT 2015

Note 5. Tax on profit for the year
Note 6. Intangible assets
(mDKK) 2015 2014
Current tax on profit for the year 6 10
Deferred tax on profit for the year (6) (5)
Adjustment of tax relating to previous years, current tax 2 9
2 14
2015
(mDKK) Patents
Cost at 1 January 10
Cost at 31 December 10
Amortisation and impairment losses at 1 January 4
Amortisation for the year 1
Amortisation and impairment losses at 31 December 5
Carrying amount at 31 December 5
2014
(mDKK) Patents
Cost at 1 January 4
Additions 6
Cost at 31 December 10
Amortisation and impairment losses at 1 January 4
Amortisation and impairment losses at 31 December 4
Carrying amount at 31 December 6
66PARENT COMPANY – ANNUAL REPORT 2015
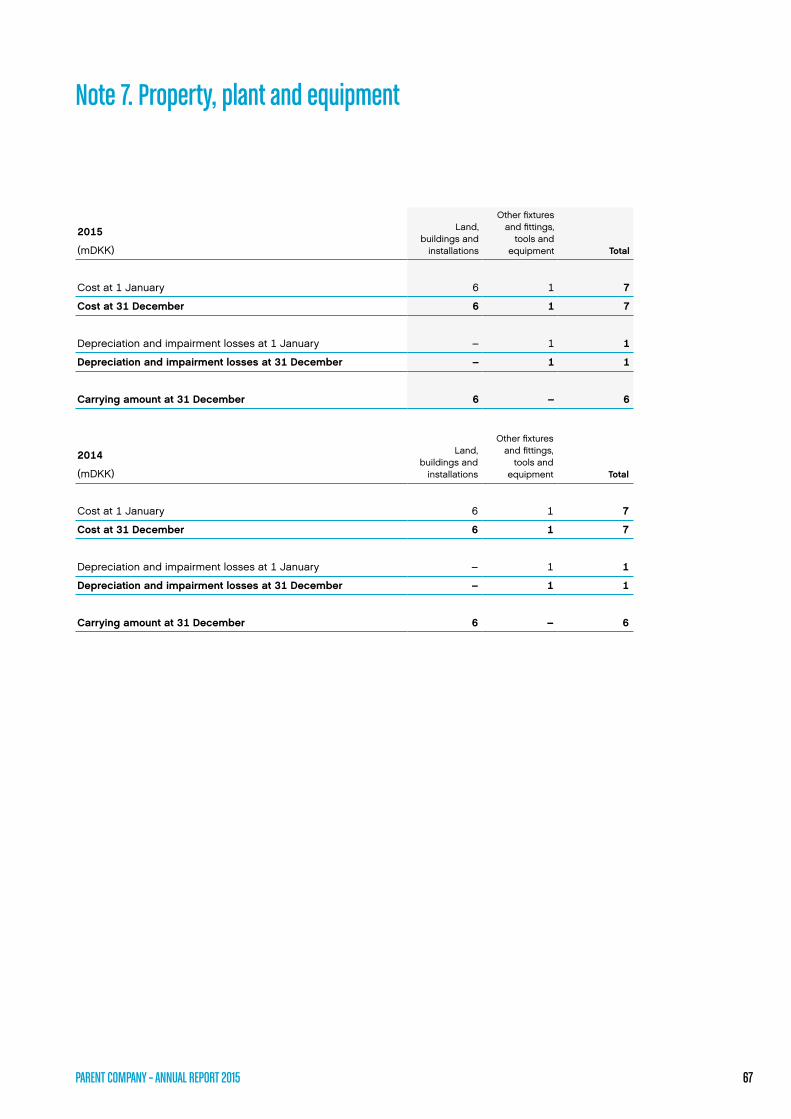
Note 7. Property, plant and equipment
2015
(mDKK)
Land, buildings and
installations
Other fixtures and fittings,
tools and equipment Total
Cost at 1 January 6 1 7
Cost at 31 December 6 1 7
Depreciation and impairment losses at 1 January – 1 1
Depreciation and impairment losses at 31 December – 1 1
Carrying amount at 31 December 6 – 6
2014
(mDKK)
Land, buildings and
installations
Other fixtures and fittings,
tools and equipment Total
Cost at 1 January 6 1 7
Cost at 31 December 6 1 7
Depreciation and impairment losses at 1 January – 1 1
Depreciation and impairment losses at 31 December – 1 1
Carrying amount at 31 December 6 – 6
67PARENT COMPANY – ANNUAL REPORT 2015

Note 8. Investments in associates and subsidiaries
2015
(mDKK) Investments in
subsidiaries Investments in
associates
Cost at 1 January 7,215 4
Additions 761 –
Cost at 31 December 7,976 4
Value adjustment at 1 January 8,499 (1)
Currency translation adjustments 92 –
Share of net profit for the year 9,133 –
Dividend (6,513) –
Entries recognised directly on equity in subsidiaries 166 –
Value adjustment at 31 December 11,377 (1)
Carrying amount at 31 December 19,353 3
2014
(mDKK) Investments in
subsidiaries Investments in
associates
Cost at 1 January 6,668 4
Additions 547 –
Cost at 31 December 7,215 4
Value adjustment at 1 January 7,529 (1)
Currency translation adjustments 22 –
Share of net profit for the year 7,023 –
Dividend (5,795) –
Entries recognised directly on equity in subsidiaries (280) –
Value adjustment at 31 December 8,499 (1)
Carrying amount at 31 December 15,714 3
68PARENT COMPANY – ANNUAL REPORT 2015

Note 9. Share capital
Note 10. Deferred tax
(mDKK) 2015 2014
The Company’s share capital consists of:
A-shares of DKK 1,000 or multiples hereof 1 1
B-shares of DKK 1,000 or multiples hereof 9 9
C-shares of DKK 1,000 or multiples hereof 10 10
Total shares at 31 December 20 20
(mDKK) 2015 2014
Deferred tax, net at 1 January 2 (3)
Change in deferred tax 5 5
Deferred tax, net at 31 December 7 2
Classified as:
Deferred tax assets 7 2
Deferred tax liabilities – –
7 2
There have been no changes in the share capital during the last 5 years.
Shareholders that own more than 5% of the share capital:
KIRKBI A/S, Koldingvej 2, 7190 Billund, Denmark
Koldingvej 2, Billund A/S, Koldingvej 2, 7190 Billund, Denmark
69PARENT COMPANY – ANNUAL REPORT 2015

Note 11. Contingent liabilities and other obligations
Note 12. Related party transactions
LEGO A/S is jointly and severally liable for corporate income tax according to the joint taxation in the LEGO
Group, KIRKBI A/S and in the companies controlled by KIRKBI A/S. The total amount of current tax liabilities, as
well as related current tax credit counterparts are shown in the Annual Report of KIRKBI A/S, which is the admin-
istration company of the joint taxation. LEGO A/S is furthermore jointly and severally liable for Danish taxes at
source withheld on behalf of nonresident companies for dividend, royalty and interest.
The Company has utilised tax losses in non-Danish jurisdictions in the Danish joint taxation until 31 December
2004. The deferred tax of this amounts to DKK 108 million (DKK 116 million in 2014), of which DKK 0 million has
been recognised as provision for deferred tax. The amount of DKK 108 million is not expected to be recaptured.
(mDKK) 2015 2014
Transactions with KIRKBI Invest A/S:
Interest charged (19) (19)
Total transactions with KIRKBI Invest A/S (19) (19)
Transactions with Merlin Entertainments Group:
Trademark fee received 23 19
Total transactions with Merlin Entertainments Group 23 19
Balances with KIRKBI Invest A/S:
Payable – (10)
Loan (600) (600)
(600) (610)
Balances with Merlin Entertainments Group:
Receivables 4 3
4 3
70PARENT COMPANY – ANNUAL REPORT 2015

LEGO A/S
• LEGO System A/S
• LEGO Security Billund ApS
• LEGO Park Holding UK Ltd.
- LEGO Lifestyle
International Ltd. (UK)
• LEGO Company
Limited (UK)
• LEGO Belgium n.v.
• LEGO Netherland B.V.
• LEGO Sverige AB
• LEGO Norge A/S
• Oy Suomen LEGO Ab
(Finland)
• LEGO GmbH (Germany)
• LEGO Handelsgesells.
GmbH (Austria)
• LEGO S.A.S. (France)
• LEGO Brand Retail S.A.S.
(France)
• LEGO S.p.A. (Italy)
• LEGO S.A. (Spain)
• LEGO Lda. (Portugal)
• LEGO Production s.r.o.
(Czech Republic)
• LEGO Trading s.r.o.
(Czech Republic)
• LEGO Schweiz AG
• LEGO Hungária Kft.
• LEGO Manufacturing Kft.
(Hungary)
• LEGO Polska Sp. z.o.o.
• LEGO Romania S.R.L.
• LEGO Ukraine LLC
• OOO LEGO (Russia)
• LLD Share verwaltungs
GmbH (Germany)
- LLD Share Gmbh &
Co. KG (Germany)
• LEGO Turkey Oyuncak
Tiearet Anonim Sirketi
• LEGO do Brazil Ltda.
• LEGO do Brasil
Comércio e Distribuicão
de Brinquedos Ltda
• LEGO Canada Inc.
• LEGO Mexico S.A. de C.V
• Administratión de Servicios
LEGO, S. de R.L. de C.V.
(Mexico)
• LEGO Operaciones de
Mexico S.A. de C.V. (Mexico)
• LEGO Real Estate, S.A. de
C.V. (Mexico)
• LEGO System Inc. (US)
- LEGO Brand Retail Inc.
(US)
• LEGO Hong Kong Limited
• LEGO Australia Pty. Ltd.
• LEGO New Zealand Ltd.
• LEGO Korea Co. Ltd.
• LEGO South Africa (Pty.) Ltd.
• LEGO Japan Ltd.
• LEGO Company Ltd.
(Hong Kong)
• LEGO Trading (Beijing)
Co., Ltd.
• LEGO Singapore Pte. Ltd.
• LEGO India Private Limited
• LEGO Trading (Malaysia)
Sdn. Bhd.
• LEGO Toy Manufacturing
(Jiaxing) Co.
• LEGO Toy (Shanghai)
Co., Ltd.
• LEGO Trading (Taiwan)
Co., Ltd.
Ownership is 100% unless stated otherwise.
LEGO A/S is 75% owned by KIRKBI A/S and is included in the Consolidated Annual Report of KIRKBI A/S. KIRKBI A/S is the ultimate Parent Company.
LEGO A/S owns 19.8% of KABOOKI A/S which is an associate.
Group Structure
THE LEGO GROUP – ANNUAL REPORT 2015 71

The LEGO Group
Aastvej
7190 Billund
Denmark
Tel.: +45 79 50 60 70
www.LEGO.com
In our Responsibility Report you will find detailed information on the LEGO Group’s non-financial results for 2015.
www.LEGO.com/responsibility
Related Documents