Landscape Analysis Country Assessment 1 The Landscape Analysis Indonesian Country Assessment Final Report 6 September 2010

Welcome message from author
This document is posted to help you gain knowledge. Please leave a comment to let me know what you think about it! Share it to your friends and learn new things together.
Transcript
Landscape Analysis Country Assessment
1
The Landscape Analysis
Indonesian Country
Assessment
Final Report
6 September 2010
Landscape Analysis Country Assessment
2
The Landscape Analysis - Indonesian Country
Assessment
Table of Contents
Executive Summary ................................................................................................... 4 1. Introduction ........................................................................................................... 6
2. The Landscape Analysis Country Assessment Process ........................................... 8 3. The Nutrition Situation in Indonesia .................................................................... 10
Nutrition and Health Situation of Children in Indonesia ....................................... 10 Nutrition and Health Situation of Women in Indonesia ......................................... 12
Maternal and Infant and Young Child Feeding in Indonesia ................................. 14 4. Findings of the Landscape Analysis Country Assessment and analysis ................ 20
Perception of the problem .................................................................................... 20 Nutrition policies and activities currently practised .............................................. 21
Nutrition Coordination ......................................................................................... 23 Human Resources for Nutrition ............................................................................ 24
Planning, Budget and Funding ............................................................................. 26 Nutrition Information System ............................................................................... 27
Summary of Findings ........................................................................................... 28 5. Recommendations ................................................................................................ 29
Overall Objective ................................................................................................. 29 Nutrition Coordination & Responsibilities ............................................................ 29
Budget and Funding ............................................................................................. 29 Planning and Design of Programmes .................................................................... 30
Human Resources ................................................................................................ 31 Service Provision ................................................................................................. 33
Nutrition Information System ............................................................................... 33 6. Next Steps ........................................................................................................... 36
Appendix 1. The Country Assessment methodology ................................................ 38 Appendix 2. Indonesia’s nutrition oriented poverty reduction programmes ........... 104
Cluster 1 - Social Assistance and Protection Programmes ................................... 105 Raskin Programme ......................................................................................... 106
Cash Transfers ............................................................................................... 107 Health Insurance ............................................................................................ 108
Cluster 2 - Community Empowerment Programmes ........................................... 109 PNPM Mandiri (National Programme on Community Empowerment) ........... 109
PNPM Generasi (Community Cash Transfer for Health and Smart Generation)110 Micro and Small Business Empowerment....................................................... 111
Appendix 3. Essential Nutrition Interventions Policy and Programme framework . 112 Appendix 4. WFP Food Security and Vulnerability Mapping ............................... 119

Landscape Analysis Country Assessment
3
Figures and Table
Figure 1: The timing of growth faltering in children under five in developing countries
.................................................................................................................................. 6 Figure 2: The UNICEF Nutrition Conceptual Framework .......................................... 8
Figure 3: Functions of the Nutrition System which help define Commitment and
Capacity ................................................................................................................... 10
Figure 4: Underweight Prevalence in children under five years of age in Indonesia .. 11 Figure 5: Stunting and wasting by province in Indonesia (Riskesdas 2007) .............. 11
Table 1: Coverage of the Lancet Nutrition Interventions in Indonesia....................... 18
Landscape Analysis Country Assessment
4
Executive Summary
Despite the gross national income having grown five fold since the eighties, progress in
nutrition has been limited with 37% of Indonesian children still being stunted.
Concerned about the situation of stunting and the need for an adequate assessment of
the capacity of the government nutrition system in the new decentralized administration,
the National Planning Agency and the Ministry of Health of the Government of
Indonesia (GOI) decided to carry out the Landscape Analysis Country Assessment
process in order assess their “readiness” to act to accelerate the reduction of maternal
and child undernutrition.
An analysis of the nutrition situation reveals that although child underweight prevalence
has been reduced in Indonesia and the Mid-Term Development and the Millennium
Development Goals for hunger reduction have been achieved, Indonesia continues to
have serious stunting and wasting problems among young children. Considerable
maternal undernutrition exists, which is contributing to the relatively high level of low
birth weight as well as stunting. Programme coverage of existing nutrition programmes
is reasonable for some activities, but much higher coverage needs to be achieved of the
more preventive essential nutrition interventions that can help accelerate the reduction
of maternal and child undernutrition, including promotion and counselling on
breastfeeding and complementary feeding, iron folate supplementation of women,
deworming of women and children, protein and energy supplementation of poor
pregnant women, treatment of diarrhoea with zinc, and improved coverage of food
fortification and home fortification programmes.
The findings of the Country Assessment are that although the commitment to act for
nutrition is reasonably strong, the capacity to act for nutrition still needs to be
strengthened. The existing strong commitment to act for nutrition is misdirected at
trying to resolve acute nutrition problems rather than putting into place systems and
interventions to prevent children and women becoming malnourished, largely because
the latter is not generally recognized as a problem. Commitment to resolving the
problem of stunting is growing at the national level, but at the provincial and district
levels where all the action is decided and implemented, the nutrition problem is still
largely equated with severe undernutrition (Gizi Buruk) and/or to a lack of food.
Mechanisms for policy coordination, identification of priorities and setting of goals and
targets are weak or non-existent at all levels. The capacity to act for nutrition needs to
be strengthened if stunting reduction is to be achieved. Service provision largely
revolves around child growth monitoring and is misdirected to the under-five year olds
rather than focused on children under two years where nutrition interventions can have a
greater effect. Less priority is given to preventive activities related to counseling of
mothers on infant and young child feeding than to the curative function of detecting and
treating wasting. Inter-sectoral coordination of implementation needs to be reinforced.
Although sufficient nutritionists are being trained their curricula is outdated or
incomplete. They are under employed in the system, and especially in the
implementation of service delivery. Little or no in-service training in nutrition occurs.
The use of monitoring data for decision making or of evaluation data to learn from
programme experience is very uncommon.
Recommendations are made concerning the areas of: Nutrition Coordination and
Responsibilities; Budget and Funding; Planning and Design of Programmes; Human

Landscape Analysis Country Assessment
5
Resources; Service Provision; Nutrition Information System. In summary, priority
should be given to creating mechanisms which promote the development of harmonized
Food and Nutrition Action Plans at Province and District level based on the national
plan, decree and guidelines, as well as to developing inter-sectoral coordination
mechanisms to oversee and monitor their implementation. In order to increase cost-
effectiveness of funding, guidance and incentives should be provided to districts for
them to prioritize evidence-based interventions targeted at vulnerable groups of pre-
pregnant, pregnant and lactating women and children under two-years of age. Length of
children under two and maternal anemia should be given increasing emphasis and
prioritized for measuring the effectiveness of both nutrition as well as poverty reduction
programmes at all levels. In parallel to this, job descriptions need to be updated to
reflect new program directions (i.e., measurement of stunting and maternal
health/anemia) for all staff involved in nutrition at all levels of the system. A human
resource map for nutritionists and other health workers should be developed in order to
identify deployment gaps and competencies, and develop a national plan for a training
approach to teach nutritional competencies for volunteers, nurses and midwives, and to
provide technical updates for doctors in the nutrition sciences. In parallel to this the
implementation at scale (as appropriate depending on local conditions), of the package
of Essential Nutrition Interventions (ENI) should be progressively implemented starting
in a few districts and provinces and gradually expanding so that within five years most
mothers and children are covered by ENI as a continuum of care from pre-conception,
conception to two years of age. Monitoring and evaluation guidelines should be
modified to reflect new programme focus and relevant indicators.
Landscape Analysis Country Assessment
6
1. Introduction
While the Indonesian economy has grown impressively over the last four decades, child
malnutrition rates although reduced, still remain stubbornly high. The gross national
income has grown five fold since the eighties, but child underweight rates have little
more than halved in the same period, and 18% of Indonesian children are still so
affected. Perhaps the most worrying aspect of this however, is that 37%1 of Indonesian
children are stunted. Child stunting is widely accepted as one of the best predictors of
the quality of human capital, influencing potential academic performance and future
earning capability of a nation2.
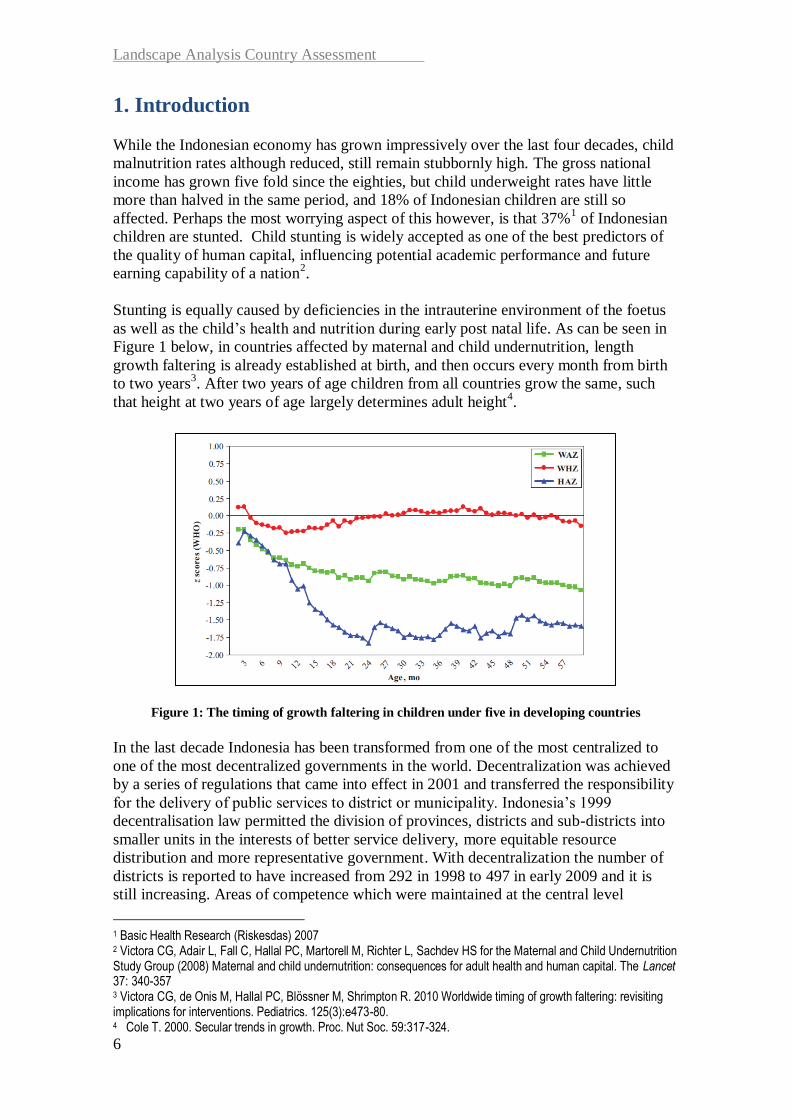
Stunting is equally caused by deficiencies in the intrauterine environment of the foetus
as well as the child’s health and nutrition during early post natal life. As can be seen in
Figure 1 below, in countries affected by maternal and child undernutrition, length
growth faltering is already established at birth, and then occurs every month from birth
to two years3. After two years of age children from all countries grow the same, such
that height at two years of age largely determines adult height4.
Figure 1: The timing of growth faltering in children under five in developing countries
In the last decade Indonesia has been transformed from one of the most centralized to
one of the most decentralized governments in the world. Decentralization was achieved
by a series of regulations that came into effect in 2001 and transferred the responsibility
for the delivery of public services to district or municipality. Indonesia’s 1999
decentralisation law permitted the division of provinces, districts and sub-districts into
smaller units in the interests of better service delivery, more equitable resource
distribution and more representative government. With decentralization the number of
districts is reported to have increased from 292 in 1998 to 497 in early 2009 and it is
still increasing. Areas of competence which were maintained at the central level
1 Basic Health Research (Riskesdas) 2007 2 Victora CG, Adair L, Fall C, Hallal PC, Martorell M, Richter L, Sachdev HS for the Maternal and Child Undernutrition Study Group (2008) Maternal and child undernutrition: consequences for adult health and human capital. The Lancet 37: 340-357 3 Victora CG, de Onis M, Hallal PC, Blössner M, Shrimpton R. 2010 Worldwide timing of growth faltering: revisiting implications for interventions. Pediatrics. 125(3):e473-80. 4 Cole T. 2000. Secular trends in growth. Proc. Nut Soc. 59:317-324.

Landscape Analysis Country Assessment
7
included Foreign Affairs, Defence, Fiscal and Monetary, Justice and Religion. For the
remaining areas including Health, Agriculture and Education, the role of central level of
government is restricted to that of setting standards and norms, monitoring and
evaluation and controlling, while that of the provincial government is one of supervision
and facilitation5.
Furthermore it would seem that the lack of improvement in child undernutrition since
around the turn of the century, which was related initially to the economic crisis, has
since been associated with a deterioration of nutrition programme service delivery
capacity caused by decentralization. Between 1995 and 2006, the number of health
providers such as medical doctors and specialists, midwives and nurses has, however,
risen significantly but the focus seems to have been on multiplying the numbers of
workers, with quality given less attention. The preliminary results of the WHO/GoI
report on hospital assessment of quality of child care conducted in six provinces6show
that the percentage of standard achievement of case management of undernutrition was
30% on average or less than 60%, a cut-off figure that suggests a strong need for
improvement. The lowest achievement was observed in East Java (23%) and the highest
achievement in NTT (43%). A further causal analysis of these figures is required to
uncover the full extent and nature of the deficiency, as well as to assess the prevailing
current knowledge and practices of nutritional care by health and nutrition professionals
in the community.
Just as the district government struggled to match human resource skills with its newly
attained authority, so did provincial and central level planners and policy makers face
the new challenges of coordination, monitoring and standardization. The end result
during this transition has been that the shortage of nutrition capacity at the district level
combined with the challenges to coordination and leadership at the provincial and
central levels has resulted in a deterioration of nutrition programmes in general.7
Concerned about the situation of stunting and the need for an adequate assessment of
the capacity of the government nutrition system in the new decentralized administration,
the National Planning Agency and the Ministry of Health of the Government of
Indonesia (GOI) decided to carry out the Landscape Analysis Country Assessment
process that has been developed by the UN and other international agencies under the
leadership of WHO8. The Country Assessment (CA) aims to help countries assess their
“readiness” to act to accelerate the reduction of maternal and child undernutrition.
Readiness is recognized to be a function of both “commitment” and “capacity” and
influenced by factors operating at all levels of causality as depicted in the UNICEF
Nutrition Conceptual Framework (See Figure 2 below). Commitment can be measured
by the existence of policies and the amounts of resources applied to the problem, while
capacity is reflected at the underlying level in terms of adequacy of service delivery.
5 Suwandi M 2001. Top down versus bottom up approaches to decentralization (the Indonesian experience). Jakarta: Ministry of Home Affairs and Regional Autonomy. 6 The assessment was done in three hospitals each in Jambi, Southeast Sulawesi, East Java, NTT, North Maluku and Central Kalimantan. The results have also shown that the management of cases of diarrhoea, fever and cough/difficult breathing was also below 60% (WHO, 2009. Report of hospital assessment on quality of child health care in 6 provinces, February) 7 Friedman J, Heywood PF, Marks G, Saaday F, Choi Y. 2006.Health Sector Decentralization and Indonesia’s Nutrition Programs: Opportunities and challenges. Report No. 39690-IND. Washington: World Bank. 8 Nishida, N Shrimpton R, Darnton-Hill I 2009. Landscape Analysis on countries readiness to accelerate action in nutrition. SCN News 37: 4-9. Geneva: SCN.

Landscape Analysis Country Assessment
8
Figure 2: The UNICEF Nutrition Conceptual Framework
2. The Landscape Analysis Country Assessment Process
The overall objective of the CA is to assist in the creation of greater capacity and
commitment for improving the nutrition situation in order to accelerate the reduction of
maternal and child undernutrition. To this end, with the support provided by the main
UN agencies involved, a national team was created with representatives from the
Ministry of Health as well as from the BAPPENAS together with provincial level
representatives from the planning boards and health offices of the three provinces where
the CA was undertaken. The Micronutrient Initiative, Helen Keller International, and
academic institutions including the University of Indonesia were also involved. The full
methodology together with questionnaires, the schedule of interviews and the people
interviewed are contained in Appendix 1, and the process is further summarized here.
The overall rationale guiding the CA process is derived from the understanding agreed
at the UN Standing Committee on Nutrition 35th Session
9. It was recognized that the
effective targeting of mothers and children from conception to two years of age (the
‘window of opportunity’) of the set of interventions coming from the Lancet Nutrition
Series (LNS)10
on how to accelerate the reduction of maternal and child undernutrition
could prevent at least a quarter of child deaths under 36 months of age and reduce the
prevalence of stunting by about a third in the short term.
The assessment methodology used for the Indonesian CA was a qualitative one.
Questionnaires derived from those provided by WHO Geneva were translated into
Indonesian and further refined by the national team to meet Indonesian requirements for
decision making at national, provincial and district levels. Stakeholders interviewed at
9 SCN 2008. Recommendations from the SCN 35th Session: "ACCELERATING THE REDUCTION OF MATERNAL AND CHILD UNDERNUTRITION" Available at http://www.unscn.org/Publications/AnnualMeeting/SCN35/35th_Session_Recommendations.pdf (Accessed 09/07/09) 10 The Lancet Series on Maternal and Child Undernutrition 2008. Available at URL: http://www.theLancet.com/series/maternal-and-child-undernutrition (Accessed 05/11/09)

Landscape Analysis Country Assessment
9
the central level included officials from ministries of planning, health, home affairs,
industry, agriculture, education, social welfare, as well as representatives from
parliament, donor agencies, international and national non-government organizations
and universities. The national interview team was divided to visit three provinces, and
included members coming from provincial offices of home affairs, health, agriculture,
various other state offices and NGOs. Stakeholders interviewed at the provincial level
were the same as at national level, but at the district level the heads of health centers and
nutritionists as well as village midwives and posyandu cadres were also included.
The timing of the various Landscape Analysis activities was as follows:
11 – 13 March: Preparation of the logistics of the various field visits as well as
training the interviewers in the use of the questionnaires;
13 March: National Launch of the Landscape Analysis Country Assessment;
15 March: Provincial level launches and interviews with stakeholders in Aceh,
Jawa Tengah and NTT;
16 – 18 March: Meetings and interviews with District level stakeholders in Aceh
Timur, Aceh Besar, Kota Semarang, Banyumas, Sikka and Belu;
19 March: Provincial level feedback sessions;
22 – 23 March: National level interviews;
24 March: Consolidation of the results from the district, provincial and national
level interviews;
25 March: Development of the draft findings and recommendations;
26 March: Presentation and discussion of the draft findings and
recommendations with national level stakeholders.
The first step in the analysis of the questionnaires was to summarize the responses of
the national, provincial and district level interviewees using the headings that grouped
the various questions. An analytical matrix, derived from that used in other Country
Assessments11
, showing the various indicators of “commitment” as well as those of
“capacity” to act, was also used to help further summarize the questionnaires results.
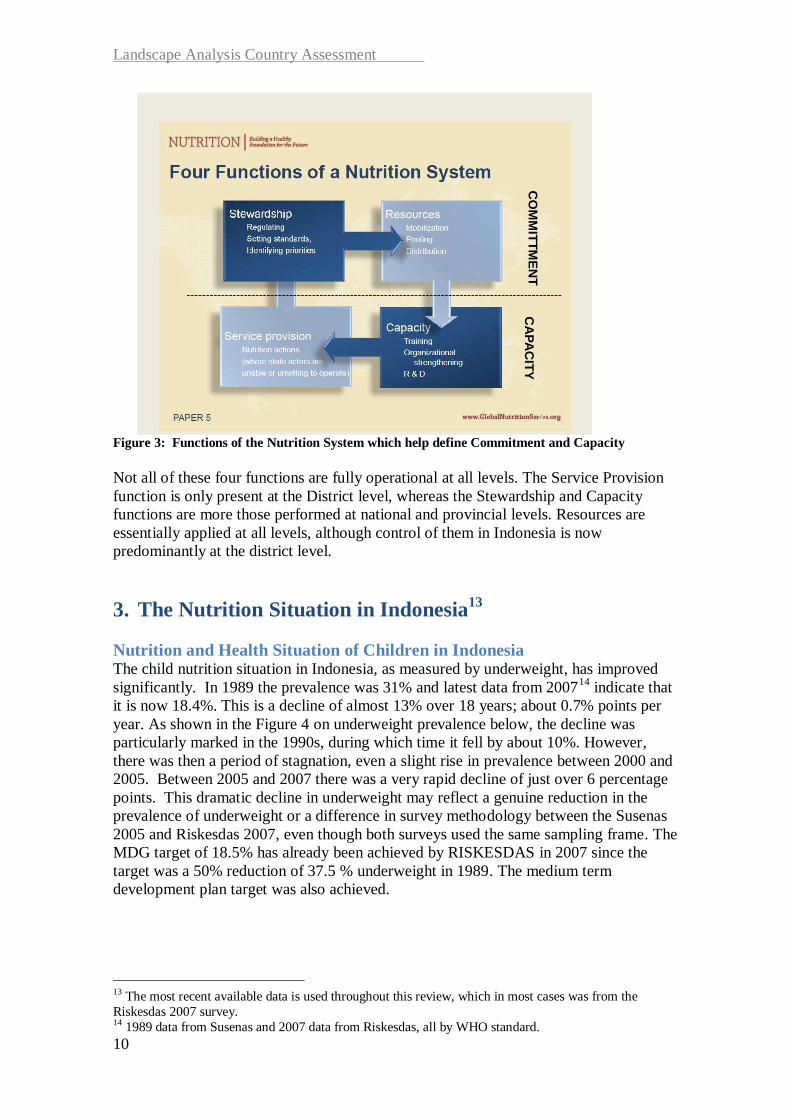
This matrix included the four elements of the nutrition system as proposed in the Lancet
Nutrition Series (LNS)12
(see Figure 3 below), where “Commitment to Act” is related to
the Stewardship and Resources functions and “Capacity to Act” is related to the
Capacity and Service Provision functions.
11 Chopra M, Pelletier D, Witten C, Dietrich M. 2009. Assessing countries’ readiness: Methodology for in-depth country assessment. SCN News 37:17-22 12 Morris SS, Cogill B, Uauy R, et al Effective international action against undernutrition: why has it proven so difficult and what can be done to accelerate progress? Lancet. 371(9612):608-21.
Landscape Analysis Country Assessment
10
CO
MM
ITT
ME
NT
CA
PA
CIT
Y
---------------------------------------------------------------------------------------------------
Figure 3: Functions of the Nutrition System which help define Commitment and Capacity
Not all of these four functions are fully operational at all levels. The Service Provision
function is only present at the District level, whereas the Stewardship and Capacity
functions are more those performed at national and provincial levels. Resources are
essentially applied at all levels, although control of them in Indonesia is now
predominantly at the district level.
3. The Nutrition Situation in Indonesia13
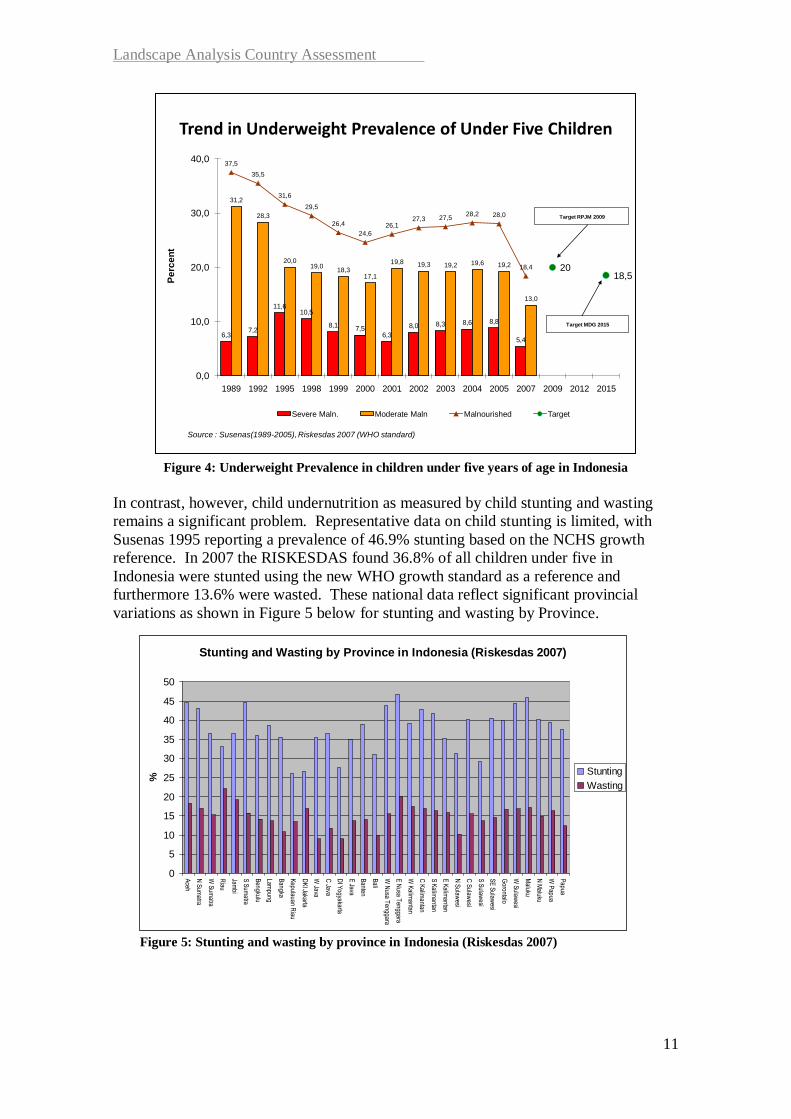
Nutrition and Health Situation of Children in Indonesia The child nutrition situation in Indonesia, as measured by underweight, has improved
significantly. In 1989 the prevalence was 31% and latest data from 200714
indicate that
it is now 18.4%. This is a decline of almost 13% over 18 years; about 0.7% points per
year. As shown in the Figure 4 on underweight prevalence below, the decline was
particularly marked in the 1990s, during which time it fell by about 10%. However,
there was then a period of stagnation, even a slight rise in prevalence between 2000 and
2005. Between 2005 and 2007 there was a very rapid decline of just over 6 percentage
points. This dramatic decline in underweight may reflect a genuine reduction in the
prevalence of underweight or a difference in survey methodology between the Susenas
2005 and Riskesdas 2007, even though both surveys used the same sampling frame. The
MDG target of 18.5% has already been achieved by RISKESDAS in 2007 since the
target was a 50% reduction of 37.5 % underweight in 1989. The medium term
development plan target was also achieved.
13 The most recent available data is used throughout this review, which in most cases was from the
Riskesdas 2007 survey. 14 1989 data from Susenas and 2007 data from Riskesdas, all by WHO standard.
Landscape Analysis Country Assessment
11
Figure 4: Underweight Prevalence in children under five years of age in Indonesia
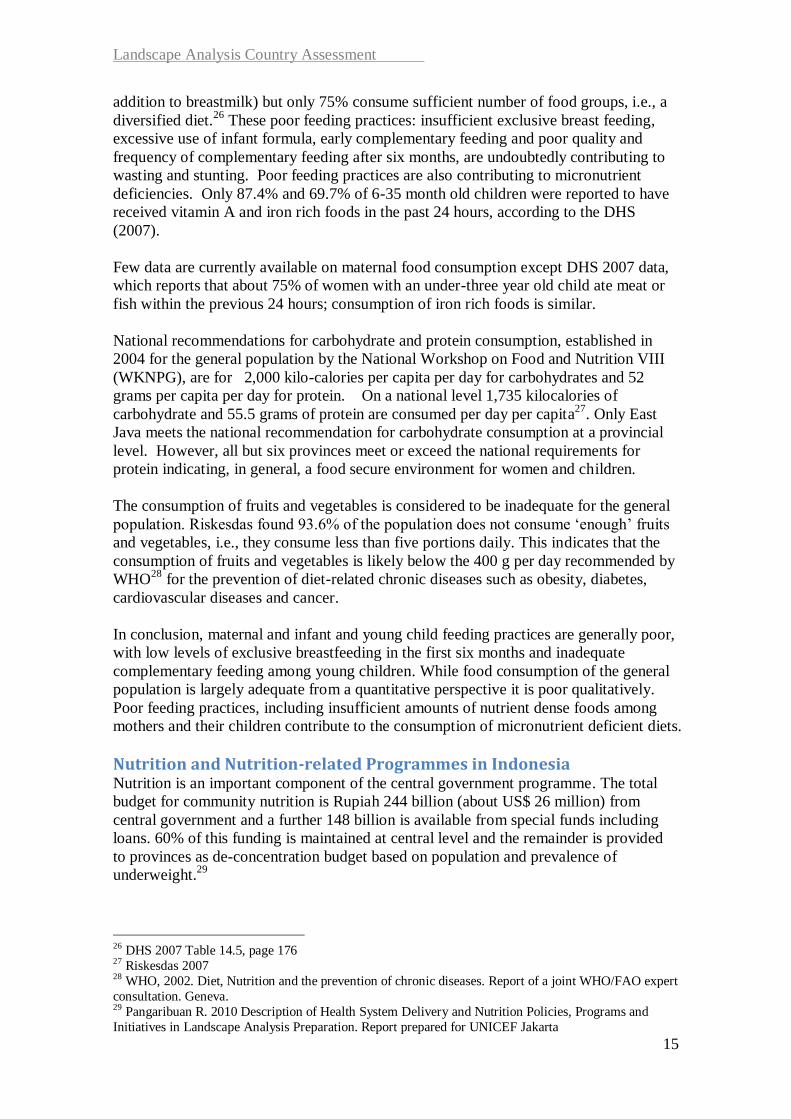
In contrast, however, child undernutrition as measured by child stunting and wasting
remains a significant problem. Representative data on child stunting is limited, with
Susenas 1995 reporting a prevalence of 46.9% stunting based on the NCHS growth
reference. In 2007 the RISKESDAS found 36.8% of all children under five in
Indonesia were stunted using the new WHO growth standard as a reference and
furthermore 13.6% were wasted. These national data reflect significant provincial
variations as shown in Figure 5 below for stunting and wasting by Province.
Figure 5: Stunting and wasting by province in Indonesia (Riskesdas 2007)
Trend in Underweight Prevalence of Under Five Children
6,37,2
11,610,5
8,17,5
6,3
8,0 8,3 8,6 8,8
5,4
31,2
28,3
20,019,0
18,317,1
19,8 19,3 19,2 19,6 19,2
13,0
37,5
35,5
31,6
29,5
26,4
24,6
26,127,3 27,5
28,2 28,0
18,4 2018,5
0,0
10,0
20,0
30,0
40,0
1989 1992 1995 1998 1999 2000 2001 2002 2003 2004 2005 2007 2009 2012 2015
Pe
rce
nt
Severe Maln. Moderate Maln Malnourished Target
Target RPJM 2009
Target MDG 2015
Source : Susenas(1989-2005), Riskesdas 2007 (WHO standard)
Stunting and Wasting by Province in Indonesia (Riskesdas 2007)
0
5
10
15
20
25
30
35
40
45
50
Aceh
N S
umatra
W S
umatra
Riau
Jambi
S S
umatra
Bengkulu
Lampung
Bangka
Kepulauan R
iau
DK
I Jakarta
W Java
C Java
DI Y
ogyakarta
E Java
Banten
Bali
W N
usa Tenggara
E N
usa Tenggara
W K
alimantan
C K
alimantan
S K
alimantan
E K
alimantan
N S
ulawesi
C S
ulawesi
S S
ulawesi
SE
Sulaw
esi
Gorontalo
W S
ulawesi
Maluku
N M
aluku
W P
apua
Papua
%
Stunting
Wasting

Landscape Analysis Country Assessment
12
East Nusa Tenggara (NTT) is the province with the highest prevalence of stunting in
Indonesia with 46.7%, and there are nine provinces with stunting prevalence over 40%,
categorized by WHO as ‘very high’. Wasting rates are also high, since a prevalence of
over 15% it is considered an emergency situation with requirements for supplementary
feeding programmes. Eighteen of Indonesia’s 33 provinces have a wasting prevalence
above 15%. Moreover nationally, 6.2% of children are severely wasted which puts
them at high risk of death.
Child illness still remains a problem that compromises nutritional status in Indonesia.
Diarrhoea and ARI remain the two main causes of death for infants and children under
five.15
Prevalence of these illnesses is also high. 11% and 31% of children had ARI and
a fever respectively in the two weeks preceding the DHS 2007 and for only 65.9% was
treatment or advice sought from a health facility or provider. 13.7% of children had
diarrhoea in the previous two weeks of the DHS and 60.9% received some form of oral
rehydration. Immunization rates are also low – only 46.2% of children 12-23 months
were found to have completed their vaccinations (Riskesdas 2007). It seems likely that
the high rates of infectious illness will be contributing to the high rates of wasting in
young children, and most probably are a reflection of the poor infant feeding practices
and poor hygiene conditions that are discussed further below.
Overall therefore, while underweight prevalence has been reduced in Indonesia and the
Mid-Term Development and the Millennium Development Goals have been achieved,
Indonesia continues to have serious stunting and wasting problems, with an almost two
fold difference in prevalence seen across the provinces. The high stunting and wasting
rates are accompanied by high rates of infection disease among children under five
years of age
Nutrition and Health Situation of Women in Indonesia WHO notes that weight of the child at birth is directly influenced by the general level of
health and nutrition of the woman before and during pregnancy16
, and that while
prematurity is the main cause of low birth weight in industrialized societies, in
developing countries it is predominantly caused by intra-uterine growth retardation17
.
Riskesdas 2007 data indicates that 13.6% of women have chronic energy deficiency as
measured by mid-upper arm circumference <23.5 cm. This represents a decline in
prevalence from the 2003 level of 16.7%. Nevertheless, prevalence remains greater than
15% in eight provinces. According to WHO18
, a prevalence between 10-19% is
considered as a medium prevalence indicating a poor nutrition situation.
Data on birth weight although limited does suggest that there is a problem. Although
only about half of babies are weighed at birth, 11.5% of these have birth weight below
2.5kg19
. Although data from the 2007 DHS indicate a much lower proportion of low
15 Riskesdas 2007 16 Kramer M 1987. Determinants of low birth weight: methodological assessment and meta-analysis.
Bulletin of the World Health Organization 65: 663-737 17 Villar J and Belizan JM. 1982. The relative contribution of prematurity and foetal growth retardation to
low birth weight in developing and developed societies. Am J Obstetrics & Gynaecology 143: 793-798 18 Physical status: the use and interpretation of anthropometry. Report of a WHO Expert Committee.
Technical Report Series No. 854. 1995. URL:
http://www.who.int/childgrowth/publications/physical_status/en/index.html. (accessed 17 June 2010) 19 Riskesdas 2007

Landscape Analysis Country Assessment
13
birth weight children (5.5%), it seems that around 35% of newborn birth weights were
gathered from the child health cards during the DHS, while the cards were used as a
source of information for around 50% of children during the Riskesdas 2007.
It is notable that according to DHS 2007 more than 90% of women have their weight
monitored during pregnancy, although it is not clear if specific support and advice is
given to ensure that women gain sufficient weight during pregnancy. Total weight gain
during pregnancy has been found to be insufficient in around 80% of mothers in a
population based study in rural Central Java20
, suggesting that more might be done to
improve weight gain. Trials of food supplementation during pregnancy in Java, besides
improving birth weight, subsequently led to a 20% reduction in stunting in under-five
year old children21
.
Although nationally representative data on anaemia in women is limited and dated,
anaemia still seems to be a problem. The National Household Health Survey in 2001
indicated that 27.9% of reproductive age women and 40.1% of pregnant women were
anaemic. Riskesdas 2007 data indicates that in urban areas 19.7% of reproductive age
women are anaemic, and 24.5% are anaemic in pregnancy. There is other evidence that
iron status is limiting, such that during the time of the 1997/8 financial crisis mothers
were the first ones to show signs of undernutrition as reflected in increased wasting and
levels of anaemia associated with reduced consumption of high quality food22
. A more
recent study has suggested that 20% of early neonatal deaths in Indonesia could be
attributed to a lack of iron and folic acid supplementation during pregnancy23
.
Considerable information exists on maternal health practices during pregnancy and
around delivery, which are far from being limited in their content. Riskesdas 2007
reported that 84.5% of women receive some form of pregnancy check up, and even in
rural areas and amongst the poorest economic quintile almost 80% of women have a
pregnancy check up. 97.1% of these women report receiving three or more
interventions during their visit. The majority of women receive blood pressure
measurements, fundal height examination, tetanus toxoid immunization and weight
measurement. However only 33.8% receive a haemoglobin test and only 36.4% a urine
test. DHS 2007 also has data on the type of maternal care during pregnancy: 93.3% of
women receive ANC from a trained provider and 75.3% of women have their first ANC
visit at less than four months, with the result that the average duration of pregnancy of
first visit is 2.7 months. 81.5% of women have more than four visits in total and only
4.2% of women have no visit. 46.1% of women deliver in a health facility, the majority
in a private facility, and 53% of women deliver at home. 79.4% are delivered by a
skilled provider, the majority by a nurse, midwife or village midwife. Nevertheless
maternal mortality remains high in Indonesia and is not improving.
Despite the high ANC coverage the treatment of anaemia during pregnancy doesn’t
seem to be very effective. Although most mothers receive supplements they don’t take
20 Winkvist A, Stenlund H, Hakimi M, Nurdiati DS, and Dibley MJ. 2002. Weight-gain patterns from prepregnancy until delivery among women in Central Java, Indonesia. Am J Clin Nutr 75:1072–7. 21 Kusin JA, Kardjati S, Houtkooper JM, Renqvist UH. 1992. Energy supplementation during pregnancy and postnatal growth. Lancet 340(8820):623-6. 22 Block SA , Kiess L, Webb P, Kosen S, et al. 2004. Macro shocks and micro-outcomes: child nutrition during Indonesias crisis. Ecn Hum Biol 2(1):21-24. 23Titaley CR, Dibley MJ, Roberts CL, Hall J & Aghod K 2009. Iron and folic acid supplements and reduced early neonatal deaths in Indonesia. Bull World Health Organ 87: 1–23.

Landscape Analysis Country Assessment
14
enough of them. Riskesdas 2007 found that 92.2% of women received iron and folic
acid supplementation during the last pregnancy which is slightly different from DHS
2007 which reports that only 79.3% of women received iron supplements during
pregnancy. More importantly is that Riskesdas reports that only 29.2% of women
consumed the 90+ tablets during the last pregnancy as recommended24,
Fertility in Indonesia has dropped to only 2.6 births per woman though it remains
significantly higher in some provinces such as NTT and Maluku. Median age at first
birth is 21.5 years with little variation, though it is slightly lower in rural areas (20.6
yrs), among those with no education (19.6 yrs) and those from the lowest wealth
quintile (20.7 yrs). As a result, the percentage of teenagers who have begun child
bearing (15-19 years) is relatively low at only 8.5%. The low fertility rate is at least
partially due to the fact that 61% of currently married women were using some form of
family planning (57.4% were using a modern method) at the time of the data
collection25
with an unmet need for family planning of only 9.1% amongst currently
married women.
We can conclude that despite the limited information available, there is considerable
maternal undernutrition which is likely to be contributing to the relatively high level of
low birth weight as well as stunting. While it appears that women receive reasonable
health care during pregnancy and delivery if measured in terms of timing of first visit,
frequency of visits and delivery by a skilled attendant, the “nutrition” oriented
interventions could be improved. Visits earlier in the first trimester would be preferable,
as would more blood tests and urine tests done to identify risk factors such as anaemia
and urine infections. Also, too few women consume the required number of iron folate
tablets in pregnancy to protect them from anaemia.
Maternal and Infant and Young Child Feeding in Indonesia Infant and young child feeding practices in Indonesia are far from adequate. According
to the DHS 2007, only 32.4% of children less than six months of age are exclusively
breastfed. This represents a net decrease from the 40% rate in 2002 and is likely
attributed to the sharp increase of bottle-feeding practices from 17% to 28% among
children under-six months of age during the same period. Susenas data indicate the
same trend regarding the practices of breastfeeding. In the worst off provinces (i.e.,
Riau Islands, Jakarta and Bali) exclusive breastfeeding benefits less than 15% of
children. As breastmilk is the optimal source of nutrition for children, this puts young
children at a severe disadvantage both nutritionally and for the prevention of illness.
Added to this is the fact that only 43.9% of children start breastfeeding within an hour
of birth and 64.6% receive a prelacteal feed. Young children in Indonesia are also
receiving complementary foods too early: at 4-5 months of age more than half (52.9%)
are receiving some form of solid or semi-solid foods, and even below two months,
33.4% are receiving infant formula. Complementary feeding should start from about six
months and children should receive three or more food groups a minimum number of
times according to their age group in addition to breastmilk. DHS 2007 data indicate
that only 52.5% are optimally fed in this way.
The main area of weakness in infant and young child feeding is frequency of feeding
(only 67% offer complementary foods the minimum times per age group per day in
24 Riskesdas 2007 25 DHS 2007
Landscape Analysis Country Assessment
15
addition to breastmilk) but only 75% consume sufficient number of food groups, i.e., a
diversified diet.26
These poor feeding practices: insufficient exclusive breast feeding,
excessive use of infant formula, early complementary feeding and poor quality and
frequency of complementary feeding after six months, are undoubtedly contributing to
wasting and stunting. Poor feeding practices are also contributing to micronutrient
deficiencies. Only 87.4% and 69.7% of 6-35 month old children were reported to have
received vitamin A and iron rich foods in the past 24 hours, according to the DHS
(2007).
Few data are currently available on maternal food consumption except DHS 2007 data,
which reports that about 75% of women with an under-three year old child ate meat or
fish within the previous 24 hours; consumption of iron rich foods is similar.
National recommendations for carbohydrate and protein consumption, established in
2004 for the general population by the National Workshop on Food and Nutrition VIII
(WKNPG), are for 2,000 kilo-calories per capita per day for carbohydrates and 52
grams per capita per day for protein. On a national level 1,735 kilocalories of
carbohydrate and 55.5 grams of protein are consumed per day per capita27
. Only East
Java meets the national recommendation for carbohydrate consumption at a provincial
level. However, all but six provinces meet or exceed the national requirements for
protein indicating, in general, a food secure environment for women and children.
The consumption of fruits and vegetables is considered to be inadequate for the general
population. Riskesdas found 93.6% of the population does not consume ‘enough’ fruits
and vegetables, i.e., they consume less than five portions daily. This indicates that the
consumption of fruits and vegetables is likely below the 400 g per day recommended by
WHO28
for the prevention of diet-related chronic diseases such as obesity, diabetes,
cardiovascular diseases and cancer.
In conclusion, maternal and infant and young child feeding practices are generally poor,
with low levels of exclusive breastfeeding in the first six months and inadequate
complementary feeding among young children. While food consumption of the general
population is largely adequate from a quantitative perspective it is poor qualitatively.
Poor feeding practices, including insufficient amounts of nutrient dense foods among
mothers and their children contribute to the consumption of micronutrient deficient diets.
Nutrition and Nutrition-related Programmes in Indonesia Nutrition is an important component of the central government programme. The total
budget for community nutrition is Rupiah 244 billion (about US$ 26 million) from
central government and a further 148 billion is available from special funds including
loans. 60% of this funding is maintained at central level and the remainder is provided
to provinces as de-concentration budget based on population and prevalence of
underweight.29
26 DHS 2007 Table 14.5, page 176 27 Riskesdas 2007 28 WHO, 2002. Diet, Nutrition and the prevention of chronic diseases. Report of a joint WHO/FAO expert
consultation. Geneva. 29 Pangaribuan R. 2010 Description of Health System Delivery and Nutrition Policies, Programs and
Initiatives in Landscape Analysis Preparation. Report prepared for UNICEF Jakarta

Landscape Analysis Country Assessment
16
At district level, funding for nutrition comes from district funding (APBD II), provincial
health offices - from province budget (APBD II) and passing on funding from central
level (APBN) - and special grants. Proposals are submitted for activities for which
funding is required but the process of review of these proposals is lengthy and
convoluted and nutrition activities may be dropped from the district plan due to budget
limitations or if representatives of the District Health Office are not able to justify them
to the decision makers of the district budget – Bappeda, DPRD and District Health
Office. A similar process takes place at provincial level.
Since decentralization was adopted in 1999, responsibility for delivery of public health
services has been devolved to district level. However Minimum Service Standards
(SPM) have been issued under the Ministry of Home Affairs’ Regulation on Technical
Guidance on Formulating and Establishing Minimum Service Standards for
Government Departments. The SPM ensure that local governments provide basic
services and ensure consistency between districts. The 2008 MOH Regulation on
Obligatory Minimum Service Standards specifies the following basic services and
require local authorities to monitor whether the standards are being met.
Coverage of ANC for pregnant women (at least four visits), including iron and
folic acid supplementation: 95% by 2015
Coverage of postpartum health services, including vitamin A supplementation:
90% by 2015
Universal child immunization: 100% by 2010
Coverage of infant health services, including vitamin A supplementation: target
90% by 2010
Coverage of child health services, including vitamin A supplementation and
growth and development monitoring): target 90% by 2010
Coverage of supplementary feeding of 6-24 month old children from poor
families: 100% by 2010
Coverage of treatment of severely malnourished children: 100% by 2010
Due to the above SPM and traditions of nutrition interventions in Indonesia, the main
intervention implemented to address these high levels of undernutrition is community
(versus facility) based growth monitoring in integrated health posts – the posyandu.
The policy is that all children under five should be regularly weighed at the posyandu,
preferably once per month30
, that the weight is plotted on the “Road to Health” (Kartu
Menuju Sehat or KMS) growth charts or in the chart in the KIA (mother and child
health) book and that mothers of faltering children should be counselled. In addition,
children from poor families are given supplementary food at the posyandu in the form
of fortified blended food for those aged 6-11 months and fortified biscuits for those
aged 12-23 months. If a child has not gained weight for the previous two consecutive
months or has fallen below -3SD (fallen below the red line) they should be referred to
the local health facility. The health facility should provide further examination,
including weight-for-height assessment to confirm severe acute malnutrition and
medical check-up. Based on the results, they should be provided with treatment: either
supplementary feeding or therapeutic feeding.
30 According to the Nutrition Plan of Action at Central Level (Rencana aksi pembinaan gizi masyarakat,
2010-2014), 80% of all preschoolers are to be weighed at Posyandu.

Landscape Analysis Country Assessment
17
In reality, however, in 2007 only 45.4% of children under five were weighed at least 4
times in the six months prior31
. In some provinces such as NTT and Yogyakarta the
percentage was much higher (i.e., above 65%) but in others such as North Sumatera and
Jambi it was only 30% or below. 25.5% of children under five had not been weighed at
all in the last six months. Moreover, it has been observed that very few mothers whose
children are growth faltering received counselling. At its best, a community based
growth monitoring approach is more curative than preventive. As practiced in
Indonesia, the focus is very much on weighing and not on the preventative and
supportive interventions that are intended to actually address the problem of
undernutrition.
Another major nutrition intervention is vitamin A supplementation. Under
decentralization, all districts are meant to purchase adequate supplies of vitamin A
supplements for children 6-59 months and post partum women. The supplements for
children are meant to be distributed through posyandu in February and August with the
necessary mobilization and socialization activities to take place before the distribution
to encourage attendance on the distribution day. Children who do not attend are to be
followed up in their homes. According to DHS 2007 only 68.5% reportedly received a
vitamin A capsule within the past six months. Riskesdas 2007 reported a similar figure
of 71.5%. Women are to receive a vitamin A supplement after delivery during a post
partum visit or when they take their newborn for immunization. However, the DHS
2007 found that only 44.6% of women had received the supplement.
The final main maternal nutrition intervention is iron and folic acid supplementation of
pregnant women. As reported above however, only about 30% of women received 90+
tablets as intended; compliance is not recorded.
Several other interventions related to maternal health and child health impact upon
nutritional status, as does, for example, access to water and sanitation and food security.
Indonesia also operates several major poverty reduction programmes which could be
expected to have a significant impact on child and maternal undernutrition. For
example, a programme called RASKIN distributes subsidized rice to the poor and a
programme of conditional cash transfers (PKH – Program Keluarga Harapan) aims to
reduce maternal and child mortality by providing cash transfers to families on condition
of accessing services such as antenatal and postnatal care, pregnancy iron
supplementation, assisted delivery, child immunization, growth monitoring and vitamin
A supplementation. The PKH works with another programme PNPM Generasi which
provides block grant to villages to help them improve access to health and education
services. A more complete description of these nutrition oriented poverty reduction
programmes is contained in Appendix 2.
In 2008 a major analysis by the Lancet32
identified 14 feasible and effective
interventions for which there was sufficient evidence for implementation in all 36
countries with 90% of stunted children, including Indonesia. The Lancet also identified
a further 10 interventions, for which there was sufficient evidence for implementation in
specific, situational contexts. Table 1 below summarizes the coverage in Indonesia of
these ‘essential nutrition interventions’, A more detailed analysis showing the current
31 Riskesdas 2007 32 The Lancet Series on Maternal and Child Undernutrition 2008. Available at URL: http://www.theLancet.com/series/maternal-and-child-undernutrition (Accessed 05/11/09)

Landscape Analysis Country Assessment
18
policy and legislation for each of these interventions is included in Appendix 3. The
data indicate that there are several ‘essential interventions’ where much higher
coverage needs to be achieved including promotion and counselling on breastfeeding
and complementary feeding, iron folate supplementation of women, deworming of
women and children, protein and energy supplementation of poor pregnant women,
treatment of diarrhoea with zinc, and improved coverage of food fortification and home
fortification programmes.
The Lancet recommends both iron folate supplementation and multiple micronutrient
supplementation, without indicating which to use in the package of interventions.
Indonesian national policy is to provide iron folate supplements to all pregnant women,
but the multiple micronutrients are being piloted in two provinces. Trials of the multiple
micronutrient as compared with iron folate supplements carried out in Indonesia have
shown them to be as effective as iron folate in improving anaemia status 33
and to reduce
90-day infant mortality by nearly 20% as compared with iron folate supplements34
.
Table 1: Coverage of the Lancet Nutrition Interventions in Indonesia
Interventions with sufficient evidence for implementation in all 36 countries
Intervention
Current
Coverage in
Indonesia
References and Notes
Maternal and birth outcomes
Iron folate supplementation 29.2% DHS 2007- 90+ days
Maternal supplements of multiple
micronutrients 0%
Policy in Indonesia is to give iron and folate during pregnancy. MNS are being piloted in two provinces with UNICEF support.
Maternal iodine through iodized salt 62.8% Riskesdas - no of households consuming adequately iodized salt (titration)
Interventions to reduce tobacco
consumption and indoor air pollution 97%
DHS - % of women who do not use tobacco. However on 87.8% of men use tobacco. Data on indoor air pollution is not available
Newborn babies
Promotion of breastfeeding (individual
and group counselling) N/A
Infants and children
Promotion of breastfeeding (individual
and group counselling) N/A
Behaviour change communications for
improved complementary feeding N/A
Zinc in management of diarrhoea N/A It is policy but data not available on coverage.
Vitamin A supplementation 68.5% - 71.5%. DHS 2007 and Riskesdas 2007
Universal salt iodization 62.8% Riskesdas - no of households consuming adequately iodized salt (titration)
33 Sunawang, Utomo B, Hidayat A, Kusharisupeni, Subarkah. 2009. Preventing low birthweight through maternal multiple micronutrient supplementation: a cluster-randomized, controlled trial in Indramayu, West Java. Food Nutr Bull. 30 (4 Suppl):S488-95 34 Supplementation with Multiple Micronutrients Intervention Trial (SUMMIT) Study Group, Shankar AH, Jahari AB, Sebayang SK, Aditiawarman, Apriatni M, Harefa B, Muadz H, Soesbandoro SD, Tjiong R, Fachry A, Shankar AV, Atmarita, Prihatini S, Sofia G. 2008. Effect of maternal multiple micronutrient supplementation on fetal loss and infant death in Indonesia: a double-blind cluster-randomised trial. Lancet. 371(9608):215-27.

Landscape Analysis Country Assessment
19
Handwashing or hygiene interventions 23.2% and
71.1%
Riskesdas - % of population over 10
years with correct behaviour in handwashing and defecating
Treatment of severe acute malnutrition N/A
Interventions with sufficient evidence for implementation in specific, situational
contexts
Maternal and birth outcomes
Maternal supplements of balanced
energy and protein** 0% Not policy in Indonesia
Maternal deworming in pregnancy 0% The Indonesian policy does not allow for mass deworming in pregnancy.
Maternal calcium supplementation N/A No policy exists although there is some implementation
Intermittent preventative treatment of
malaria* N/A
Planned in the new Mid-Term Development Plan but not yet implemented
Insecticide treated bednets* 2.3% DHS - % of pregnant women who
slept under an insecticide-treated net the night before the survey
Newborn babies
Neonatal vitamin A supplementation 0% Not yet a WHO recommendation
and no policy in Indonesia
Delayed cord clamping 0% No policy in Indonesia
Infants and children
Conditional cash transfer programmes
(with nutritional education)** 0.1%
In 2009 the conditional cash transfer programme covered 72,000 households.
Deworming*** 0%
The national policy recommends
deworming for children aged two to five years old and school-aged children depending on prevalence: >50% -- mass deworming 2x/yr 20 – 50% -- mass deworming 1x/yr <20% -- targeted deworming However, coverage data is scarce.
Iron fortification and supplementation
programmes*** 100%
Flour fortification with iron is
mandatory in Indonesia and close to 100% of all flour is fortified although it is not known how much flour young children consume.
Insecticide-treated bednets* 3.3% DHS - % of children under 5 who slept under an insecticide-treated net the night before the survey
*In areas with malaria
** For women and children from poor families
*** In areas with high worm infestation and/or anaemia
In summary although child underweight prevalence has been reduced in Indonesia and
the Mid-Term Development and the Millennium Development Goals have been
achieved, Indonesia continues to have serious stunting and wasting problems among
young children. There is considerable maternal undernutrition which is likely to be
contributing to the relatively high level of low birth weight as well as stunting. The
programmes coverage indicates that much higher coverage needs to be achieved of the
essential nutrition interventions that can help accelerate the reduction of maternal and
child undernutrition, including promotion and counselling on breastfeeding and
complementary feeding, iron folate supplementation of women, deworming of women
and children, protein and energy supplementation of poor pregnant women, treatment of

Landscape Analysis Country Assessment
20
diarrhoea with zinc, and improved coverage of food fortification and home fortification
programmes.
4. Findings of the Landscape Analysis Country Assessment
and analysis 35
Perception of the problem The general perception in the provinces and districts is that the nutrition problem is that
of severe wasting. There is little recognition of stunting or maternal undernutrition as
being problems. At the national level there is a more widespread and growing
understanding of the stunting problem. At the sub-national level, stunting as small
stature is commonly attributed to genetics as it affects most of the population.
This perception is understandable: over the last two decades, awareness and advocacy
on nutrition has mainly focused on severe wasting. The nationwide advocacy in 1998
during the first Asian economic crisis had an impact on the continued programme of
management of severe acute malnutrition at all levels. This concept has been carried
forward over the years as reflected in current nutrition policies and strategies: the
Presidential Decree no. 741 issued in 2008, which provides guidance on the minimum
health services standards 36
(SPM) to be achieved by 2015, gives rehabilitation of 100%
of children affected by severe underweight as one of the main nutrition targets for the
districts. This guidance is reflected in the objectives of the current health and nutrition
programme of some provinces (RPJMD 2009-2013) such as NTT which contains an
objective on the elimination of severe starvation. In regard to maternal nutrition, the
Decree no. 741 recommends that 95% of pregnant women be covered with 4 antenatal
care visits, including 90+ iron folate tablets. The SPM do not include any requirements
for prevention of general child or maternal malnutrition such as counselling on infant
feeding or nutrition during pregnancy.
There is agreement at national level that food availability is not a major cause of
undernutrition, though many think that poverty is constraining access to adequate,
quality food in some communities. The GOI/WFP Food Security and Vulnerability
Atlas of Indonesia indicate that food availability37
is really only in deficit in Papua,
Maluku, Riau, Jambi, Bengka Belitung, Sumatera Barat and Kalimantan Tengah. On
the other hand when access is taken into account, due to poverty or lack of infrastructure
for example, vulnerability to food security increases significantly. Overall, taking food
availability, access and utilization into account, the analysis identified 100 districts, out
of 346 for which there was data, as being high priority (priority 1, 2 and 3). These 100
districts are home to some 25 million people. The 20 priority 1 districts are concentrated
in Papua, NTT and Papua Barat. Therefore, while people often attribute undernutrition
to food security, especially at district level, in reality, food access due to poverty is more
often the cause, rather than actual deficits in food availability. A more detailed
discussion on Food Security and its surveillance is described in Appendix 4.
35 The findings relate mainly to the three provinces visited which, though offering a representative
overview of three different environments and situations, cannot be considered as representing the full
diversity of Indonesia. 36 The SPM are the reference used to define planning programme targets at district and kota levels. 37 As measured by ratio of per capita normative consumption to net cereal production. Map 2.1. Page 35.
GOI and WFP. A Food Security and Vulnerability Atlas of Indonesia, 2009
Landscape Analysis Country Assessment
21
Micronutrient deficiencies are not well recognized by respondents outside the national
level. This is impacting, for example, on district budget allocation to purchase vitamin
A capsules for young children. However, although it was not specifically mentioned as
a major nutrition problem by those interviewed, iron deficiency is acknowledged as of
public concern by some nutrition stakeholders at sub-national level. During the Country
Assessment, iron/folic acid tablets were found in most of the visited puskesmas. For
instance, in Aceh province, all puskesmas and posyandu visited during the LA had
stocks of iron folate tablets. At puskesmas level, micronutrient fortified supplementary
foods were also found. Iodine deficiency has been given little attention over the last few
years outside the national level possibly because people assume that Indonesia has
achieved universal salt iodization. Riskesdas 2007 showed that an estimated 92% of
households consume iodized salt. However, only 63% consume adequately iodized salt
(>15ppm iodine).
Obesity was not perceived as a problem at any level reflecting the fact that overweight
and obesity only emerged recently in Indonesia. Yet, in the current National Plan on
Food and Nutrition (2006-2010), there is a pillar on improvement of healthy living
pattern which includes activities to address overweight and obesity. The
implementation of activities related to that component is limited.
Nutrition policies and activities currently practiced Nutrition activities are focused on growth monitoring (for identification of growth
faltering), treatment of undernutrition or Gizi Buruk, and, to a lesser extent, on
supplementary feeding. This finding was expected given the guidance provided by the
Presidential Decree No 741 mentioned above on minimal standards for health services
(SPM); it lists only micronutrient supplementation, growth monitoring, supplementary
feeding and treatment of severely malnourished children as basic services for nutrition.
One of the required basic services is coverage of health services, including vitamin A
supplementation and growth and development monitoring. The data used to report on
this indicator (i.e., the proportion of children receiving health services) does not
necessarily reflect the implementation of all components. In order to calculate the
coverage of health services of balita (12-59 months children), one needs only to
measure the total number of children who have attended growth monitoring at least
eight times during a certain time in one area and divide this number by the total number
of babies born during the same period. Thus, the limited (or absence of) implementation
of some nutrition interventions such as nutrition education or counselling may be
attributed to the fact that there is no need to specifically report on them. If not measured
or reported upon, they may be perceived as not essential or necessary to implement.
The Ministry of Health is solely responsible for micronutrient supplementation (i.e.,
iron folate for pregnant women and vitamin A supplementation for children 6-59
months and post-partum women) and complementary feeding. However the MOH
shares responsibility for other nutrition related interventions with other ministries as
follows: fortification of food - MoHA, BPOM, MoI); nutrition education -MoE, MONE,
MWE and others; promotion of exclusive breastfeeding - Ministry of Women
Empowerment and Child Protection and food programmes - MoHA and Ministry of
Social Affairs. The posyandu itself is under the Ministry of Home Affairs. Thus, many
“nutrition activities” are implemented or controlled outside of the health sector and
targeting, implementation and coordination aspects may not be happening optimally in
order to achieve the best nutrition outcome.

Landscape Analysis Country Assessment
22
The concepts of “packages of interventions” and of a “continuum of care” from
conception to two years of age are not well understood in spite of the fact that the
minimum standards and the technical guidelines represent a valuable effort to provide
such guidance and knowledge in that direction. The guidelines provide indications of
health services to be given during pregnancy, the neonatal period, the first year of life
and the period from 12-59 months. It is likely that the rationale for the minimum
standards and the technical guidelines are not fully understood by the potential users.
This may explain why, although policies, protocols, manuals and guidelines for the
implementation of nutrition interventions are available in health structures such as
puskesmas, they are not fully implemented. There is a new effort to include a
continuum care for mother and child into the ‘Buku KIA’, which is used in posyandu
and puskesmas, but it seems that the use of this book is not optimal.
Another bottleneck to implementation of a package of effective nutrition interventions
through a continuum of care concept seems to be the lack of awareness by health
providers of its importance and effectiveness. (Human resources will be discussed in
another section.)
Many health facilities are not able to treat severely wasted children or even severely
underweight children. For example, the supplementary feeding is provided for a fixed
period of time, usually 90 days, regardless of whether the child’s nutrition status has
improved adequately or not. There also seems to be little understanding of the
difference in importance, causes and treatment of severe underweight compared to
severely wasted.
The National Plan for Development 2010-2014 (RPJMN) is focused on stunting and the
Essential Nutrition Intervention package from the Lancet Nutrition Series. Although
provinces and districts plans are supposed to refer to the RPJMN when defining their
own plans, there is a disconnect between planning processes at central and sub-national
levels. Consequently, although some targets are defined in the new RPJMN or even in
the recent Ministerial Decree no. 741 on the SPM and Ministerial Decree no. 838 in the
technical guidelines, given the different planning periods between central (2010-2014)
and sub-national levels (2009-2013 for NTT; 2007-2012 for Aceh; 2008-2013 for
Central Java), the targets and indicators set up at central, province or district levels may
be different. For example, in the current RPJMN, one objective is to reduce underweight
from 18% to less than 15% by 2015. In the NTT RPJMD, the aim is to reach 13% by
2013, while it is less than 15% by 2012 in the Aceh RPJMD. Moreover, the Central
Java RPJMD does not include any target for underweight and focuses only on the
reduction of severe wasting to less than 0.82% . Another example relates to the
technical guidelines on the implementation of the minimum health services standards. In
that document, it is stated that 95% of pregnant women shall received four antenatal
visits by 2015. Since this includes the iron folate supplementation, one would assume
that coverage of supplementation would also be set at 95%. Yet, the NTT target for iron
folate supplementation coverage is 90% by 201338
while the target is set at 85%39
in
Aceh and 80% in Central Java40
.
38 RPJMD NTT 2009-2013 39 RPJMD Aceh 2008-2012, Bab II 40 Central Java Province Health Office Strategic Plan 2008-2013

Landscape Analysis Country Assessment
23
The National Action Plan for Food and Nutrition (RANPG) for the five year period
2011-2015 is currently under development. It will be based on the actual National
RPJMN at both national and provincial level. Its main objective is to reduce stunting by
five percent in the next five years (from 37% to 32%).
Clearly, there has been considerable political commitment on nutrition at national level
in Indonesia over the past decades, as evidenced in policy documents such as the current
RPJMN. Nutrition and nutrition-related programme plans at District level are also found
as part of the Provincial Development Plan (RPJMD 2009-2013 of NTT province,
RPJMD 2007-2012 of Aceh province, RPJMD 2008-2013 of Central Java province)
including health, education and agriculture. However, despite the existence of these
national and provincial plans, large scale nutrition programmes at both province and
district level in Health Strategic Plan (Renstra) are not adequately funded. As
mentioned earlier, the lack of knowledge of the sector planners on the causes and
implications of undernutrition and its importance as a determinant of health and human
development is likely a barrier.
The examination of all nutrition-related programs in-country also showed that many
nutrition-related activities are carried out by the non-health sector. For example, the
education sector distributes food to preschool children as a part of the early child care
development programme (PAUD). The Food Security Agency has complementary
feeding programmes in some of its project sites in NTT. Snacks at schools (PMT-AS)
are provided to increase enrolment and prevent school drop-outs of girls in particular,
and to improve the learning process. There is strong commitment from national
government to increase the coverage and impact of this program.
Programmes like the unconditional cash transfer programme (PKH) and other pro-poor
programs have the potential to significantly improve nutrition. These programmes could
be very synergistic with direct nutrition interventions, if implemented in a coordinated
way, with common objectives and indicators. However, if they are disjointed they risk
squandering financial resources that could be used more effectively if targeted at the
root causes of nutrition problems in the country. For example, if the RASKIN
programme could be better targeted to those with actual food availability and access
issues, some of the undernutrition caused by food insecurity, could be addressed.
Similarly, if the conditional cash transfers programme requires families to access
services and practice behaviours that have been identified as essential interventions by
the RANPG, and if systems are in place to ensure the necessary conditions are met
before the cash transfer is made, coverage of essential interventions would likely
significantly increase. At the same time, the MOH must work in collaboration with the
PKH programme to ensure that the services specified in the PKH are available at high
quality in the programme areas.
Nutrition Coordination There is a widespread and strong feeling that coordination is lacking for improving
nutrition across sectors, within sectors, at all levels of government, and in the UN. At
government level, this might be due to the fact that nutrition is under Health and has
been given a lower priority in terms of coordination. At national level coordination is
needed for strategy and policy development, while at sub-national levels (district and
sub-district) coordination is needed for implementation.

Landscape Analysis Country Assessment
24
At central level, BAPPENAS makes a lot of effort to ensure the coordination of the
health and nutrition programmes through an established Directorate of Health and
Nutrition which oversees activities under UNICEF-GoI cooperation. There is also a
Food Security Council chaired by the President, Republic of Indonesia (RI) with
ministers from the related ministries as members. A similar Board exists at sub-national
level chaired by the Governor and Bupati. Moreover, several Task Forces/Committees
have been created for the purpose of improving coordination. As such, there is a
Nutrition task force under the Food Security Council at central, province and district
levels. However, it seems that there is no clear definition of roles and responsibilities
among these various bodies. The absence of a work plan creates a challenge that limits
their efficiency. This is in contrast to the good collaboration between local governments
and NGO/INGOs working in nutrition activities at all levels.
At district level, it is felt that there is a vacuum of local nutrition leadership and
governance. Although different efforts have been made, it seems that there is no strong
coordination mechanism to enhance the coordination of activities of sectors and partners
leading to a fragmentation of activities and effect. For instance, although 79.4% of birth
deliveries are assisted by skilled birth attendants, early initiation of breastfeeding is
practiced by mothers in only 44% of cases. Furthermore, only 45% of post-partum
women receive vitamin A capsules during the first 42 days after delivery.
Although MOH is seen to have the lead role in nutrition, questions were raised on
whether or not it should be the coordinator. This may be due to the fact that the nutrition
problem is still perceived by many as related to the lack of food. From this perspective,
other ministries (e.g., the Ministry of Agriculture in charge of food security) are seen as
having a larger role to play thus diminishing the relative authority of the Ministry of
Health as the coordinator. It is also often difficult for one sector to ‘coordinate’ others;
this role might need to be taken by someone ‘above’ the individual sectors.
Provincial or district Food and Nutrition Action Plans do not exist in every province and
district; nor are there consistent nutrition targets in the existing Plans. There are
exceptions: in NTT province as well as in Belu District, nutrition activities and targets
are present in the health strategic plans which cover the 2009-2013 period; the
provincial Aceh programme on nutrition has nutrition targets such as reduction of
prevalence of underweight and improvement of exclusive breastfeeding to name a few.
The Central Java province strategic plan has targets for reduction of IDD, anemia
among pregnant and postpartum women, severe wasting, and chronic energy
malnutrition among pregnant women. It is likely that efforts to improve nutrition
through the on-going partnerships between UNICEF, other agencies and NGOs with the
Government in these provinces (and in some districts) have had an impact on planning
and budget for nutrition.
Human Resources for Nutrition Though data suggest that a sufficient number of nutritionists are trained in Indonesia,
they are not employed nor effectively deployed, especially ‘in the field’: thus only 30%
of puskesmas or health centers have a 3-year Diploma (D3) nutritionist. Most
nutritionists are trained by one of the 33 accredited Academies of Nutrition spread
throughout the country and supervised by the Government. On an annual basis, over a
thousand nutritionists graduate from these academies. In addition to the Academy-
graduates, medical doctors can also undertake nutrition training (2-4 additional years to
their curriculum) to become clinical nutritionists or community dieticians. After their
Landscape Analysis Country Assessment
25
pre-service training, nutritionists and dieticians apply for jobs wherever they want. As in
other countries, most prefer to work in urban areas given the improved living conditions
in such settings. Consequently, as for other health professionals, the geographical
distribution of nutritionists is inequitable in Indonesia. In 2007, there were 1.7
nutritionists per puskesmas in Yogyakarta while in Papua and NTT, the ratio was 0.2
and 0.5 per puskesmas respectively. Moreover, as pointed out by the World Bank41
, the
actual approach for staff allocation at district level is based on national staffing
standards which do not necessarily match with district needs.
Nutritionists are often responsible for other programmes. It is likely that the lack of a
clear job description (the job-description for nutritionist at puskesmas was developed
over a decade ago) leads to nutritionists having difficulties in interpreting their job or
prioritising their responsibilities. Moreover, even though several nutrition activities are
to be implemented at district level as indicated by the SPM, it is noteworthy that
nutritionists are rarely mentioned as responsible for the implementation of nutrition
interventions as opposed to midwives and medical doctors. In fact, the practice is to
refer to a nutritionist only when facing problems related to the rehabilitation of severely
undernourished children, for supplementary feeding for children of poor families, and
logistic management of nutrition supplies. There is no mention of the need to refer to a
nutritionist either for counseling on breastfeeding and complementary feeding or for
micronutrient supplementation of children and women.
This may explain why other health professionals such as the midwives and nurses have
more responsibilities in terms of nutrition interventions although they may lack relevant
technical knowledge and expertise. For example, the curricula of pre-service training for
midwives in Aceh includes only 12 hours on nutrition out of the six semesters and the
majority of these 12 hours are dedicated to the “balanced nutrition of children” (pre- and
school-age). In addition, six hours are spent on post-partum care, which includes
breastfeeding, general nutrition, vitamin A supplementation, and baby hygiene. This is
inadequate training, though it leads some to question the usefulness of recruiting a
nutritionist in the field or assigning nutritionists as responsible for programmes. It likely
also explains why District Health Officers often struggle to convince the Bupati to
employ nutritionists.
Added to the problem with deployment of nutritionists, is the challenge of inadequately
qualified nutritionists even among those trained. The quality of pre-service nutrition
training (D3) is not consistent in all Academies. There are some that still use the 1997
curricula which emphasises theory compared to the 2003 curricula which has a stronger
component on practice. In 2009, the curriculum was up-dated but is still not
consistently used for pre-service training. Based on a review of the curriculum of the
Nutrition Academy in Aceh, it seems that there is no specific component on infant and
young child feeding practices nor on maternal nutrition. Actually, approximately 70%
of the content of the Academy curriculum is standardized, leaving the introduction of
new topics such as infant and young child feeding practices or maternal nutrition to the
discretion of each institution to fill the remaining 30%. The Aceh province training
center for health workers will be the first to add IYCF into the nutrition curriculum. In
addition to the Academy, there are private institutions that could implement the new
curriculum. The quality of the pre-service training in these institutions likely varies,
41 World Bank/GoI, 2009. Indonesia’s doctors, midwives and nurses: Current stock, increasing needs,
future challenges and options. January, World Bank, Jakarta, Indonesia.

Landscape Analysis Country Assessment
26
though it has never been assessed. Moreover, as an example of the quality of the
nutritionist training, even though puskesmas has nutritionist, the prevalence of
undernutrition may still be of concern and this, in spite of an adequate quantity of staff.
For example, in Semarang city most puskesmas (14/18) have a nutritionist, but nutrition
indicators are still poor, eg 38% stunting.
Finally, as explained above, other factors such as the limited knowledge of nutrition
among other health professionals and the unequal geographical distribution of
nutritionists also contribute to the lack of adequate qualified human resources in
nutrition, particularly in remote areas.
In addition to the weaknesses described in pre-service training, the Country Assessment
also found that in-service training on nutrition was insufficient. Most health staff
interviewed during the CA admitted that they have received no in-service training in the
last two years.
There is enthusiasm among district authorities for more involvement of community
volunteers. More than two million volunteers or “cadres” serve 260,000 posyandu in
480 districts. The cadres are members of the Family Empowerment for Welfare (PKK)
organization, the most popular women’s organization in Indonesia. The capability and
competency of these volunteers vary and depend on the attention of local governments
for training and re-training.
Lack of monitoring and supervision also jeopardizes the motivation of human resources
and the quality of services. Finally, as for other health professionals such as the
midwives and nurses, the accreditation process of nutritionists may not be aligned with
international standards of independence, credibility and transparency to the public,
which also impacts on the quality of the staff.
Planning, Budget and Funding As highlighted in the previous section on nutrition and nutrition-related
programmes/activities, there are significant resources allocated for nutrition and
nutrition-related activities at central level, including major poverty reduction and safety
net programmes. Yet, most of these resources are not under the responsibility of the
Ministry of Health.
Numerous sources of funding are available for food and nutrition related activities at the
district level but are complicated by restrictions and time constraints. In addition, the
complex processes between budget allocation, approval and implementation due to
bureaucratic restrictions and earmarking often delayed the implementation of nutrition
interventions.
Despite the potential availability of funds, very little funding actually gets included in
nutrition budgets at sub-national level and what exists may not be appropriate for the
nutrition targets included in the Province and District workplans. For example, in Belu
district of NTT province, one of the workplan objectives is to reduce the prevalence of
malnutrition from 40% in 2008 to 20% in 2012, yet only 18% of the district health
budget goes to nutrition activities. Furthermore, particularly at lower levels, most of the
budget goes toward to administration (salaries) and infrastructure, with very limited
funds for programme activities: in NTT 70% of the 2009 budget (APBD II) goes to
salaries and allowances -- the remaining 30% goes to all sectors with 8% to health and

Landscape Analysis Country Assessment
27
half of that for infrastructure. In the budget of one district in Aceh province, of a total of
Rp 53,120,000,000 going to health, only 0.2% was for nutrition. The low allocation on
nutrition is clearly linked to the perception that nutrition is not a major concern.
Moreover, more than 65% (of this 0.2%) was allocated to food for pregnant women and
children under five and to the rehabilitation of severely undernourished children. A low
allocation to nutrition was also observed in Kota Semarang in Central Java, where the
nutrition comprises merely 2% of the total health budget. Most of the funds are spent
on supplementary feeding and treatment of severe wasting. In Banyumas District, the
local district budget suffered an effective 70% cut due to a sudden increase in salaried
positions, as staff previously paid honoraria were moved to formal salary lines. This left
almost nothing for the health and nutrition programs. This disconnect between planning
and budget approval and allocation is observed at all levels.
There is a general culture of budget-based planning rather than coverage/results-based
planning.
Available funding is not being allocated to the most effective interventions. The
planning, budget and funding going to nutrition programmes and activities are in line
with the perceptions of the nutrition problem as well as with the existing content of
policies, strategies and guidelines to address the situation and the current planning
process. Given the widespread and growing understanding of nutrition (including the
stunting problem at national level) it also explains why many more resources are
allocated at national rather than sub-national level on nutrition and nutrition-related
activities, including major poverty reduction and safety net programmes. It also
highlights the disconnect with nutrition activities at District level. Nutrition programmes
such as those for vitamin A are perceived to be a central level responsibility.
Consequently, budget for the procurement of vitamin A capsules is not always included
in sub-national budgets. Even in those instances where development partners are
financing various nutrition programmes, funds are not always spent on the most
effective interventions.
Nutrition Information System Large amounts of data are available, including from routine reports and national
surveys. However, information on certain basic indicators is not available on a regular
basis, nor is available data always complete and accurate (e.g., anaemia data on
pregnant women is not routinely collected or reported).
The SKDN data (S=children under five that exist at that posyandu, K=those that have a
growth card, D=those that came to be weighed last month, and N=those that grew) are
collected routinely at posyandu level and sent upwards. Although large amounts of staff
time appear to be spent collecting this information and reporting it up, it is seldom used
for programme improvement, targeting, evaluation etc. One reason is that the
denominator is often not reported up with the numerator. Another is that there are no
triggers for action (e.g. take action if prevalence exceeds x%) and it is not clear what
action to take on the basis of this data.
Data on breastfeeding, consumption of iodized salt, vitamin A capsules supplementation
and nutritional status among “nutritionally aware families” are collected through the
Sistem Kewaspadaan Pangan dan Gizi or SKPG (food and nutrition surveillance
system). Data on iron / folate supplementation of pregnant women are also gathered.
Landscape Analysis Country Assessment
28
These sets of data are sent to the Puskesmas on a monthly basis. However, it is unclear
how all the above data are used for decision making and/or in supervisory discussions.
Survey data are used quite well for advocacy at national and province level. For
example, given the high prevalence of stunting as shown by the 2007 Riskesdas and
given its recognized impact on development, the government has decided to address the
problem over the next five years. As such, the reduction of stunting prevalence has
become an important target of the RPJMN 2010-2015 and the main objective of the
2011-2015 National Plan on Food and Nutrition.
The SPM is intended to guide districts on what basic interventions they must provided
and to provide targets they should achieve and report on. For the most part however the
SPM indicators are not used for monitoring. Yet, there are exceptions. In Central Java,
the SPM is fully used. This includes indicators on (i) Severe Acute Malnutrition cases
treated, (ii) coverage of MP-ASI distribution and use, (iii) coverage of vitamin A, and
(iv) coverage of iron / folate. However, the limitation of monitoring only these four
indicators is that the emphasis of the district nutrition programs is only on the associated
interventions.
There are an insufficient number of programme evaluations; there is insufficient data to
indicate whether the efforts being made are having the expected impact – for example
are iron folate supplements being consumed and if so are they improving iron status in
pregnant women or is flour fortification contributing to improvements in micronutrient
status. Funding for monitoring and evaluation is a duty and responsibility of local
government in charge of the budget. It appears that low priority is given to supervision,
monitoring and evaluation of nutrition programmes.
Summary of Findings Commitment to act for nutrition is reasonably strong, but misdirected at trying to
resolve acute nutrition problems rather than putting into place systems and interventions
to prevent children and women from becoming malnourished. Commitment to resolving
the problem of stunting is growing at the national level, but at the provincial and district
levels where all the action is decided and implemented, the nutrition problem is largely
equated with severe undernutrition (Gizi Buruk) and/or to a lack of food. In some
districts (e.g., in Aceh and Central Java) nutrition is no longer thought to be a big
problem. Considerable amounts of resources appear to be expended on food distribution
due to confusion about the extent of food availability and to address poverty. In reality
food distribution may be a common intervention because it is politically popular, rather
than to address any actual problems of poverty, food availability or nutrition.
Mechanisms for policy coordination, identification of priorities and setting of goals and
targets are weak or non-existent at the national level.
Capacity to act for nutrition needs to be strengthened. Service provision largely revolves
around child growth monitoring and is misdirected to the under-five year olds rather
than focused on children under two years where nutrition interventions can have a
greater effect. Less priority is given to preventive activities related to counseling of
mothers on infant and young child feeding than to the curative function of detecting and
treating wasting. When counseling is done it is by minimally trained community based
posyandu cadres. Attention to maternal nutrition is limited to iron/folate tablet
distribution with little priority or promotion. Inter-sectoral coordination of
implementation needs to be reinforced. Although sufficient nutritionists are being

Landscape Analysis Country Assessment
29
trained their curricula is outdated or incomplete. They are under-employed in the system,
and especially in the implementation of service delivery. Little or no in-service training
in nutrition occurs. The use of monitoring data for decision making or evaluation data to
learn from programme experience is very uncommon.
5. Recommendations42
Overall Objective
To accelerate the reduction of maternal and child undernutrition and contribute
to the achievement of MDGs 1, 4, 5 and 6.
The first section below presents the recommendations that could be prioritized in terms
of implementation over the next few years. Other recommendations that could also be
implemented but not considered as priorities are also suggested in the second section.
Recommendations in bold font are considered as innovative. For all recommendations, a
timeframe is suggested.
Suggested recommendations to be prioritized on a Medium-Term
Nutrition Coordination & Responsibilities
1. At Sub-national level: Harmonize the Food and Nutrition Action Plans at Province
and District level based on the national plan, decree and guidelines, and develop
intersectoral coordination mechanisms to oversee and monitor their implementation.
This complements the decentralized structure of decision making at the
Province and District, while at the same time retaining the unifying
objectives and overall strategies that are presented in the National
Plan. Intersectoral inputs are needed to reflect and organize the inputs
of the various stakeholders in nutrition security.
2. At National level: Approve a Government Regulation, that puts into effect the
principles of the International Code of Marketing of Breastmilk Substitutes to
control the marketing of breastmilk substitutes and develop a mechanism for
monitoring and enforcement
Control of the marketing of breastmilk substitutes requires a national
effort because of the importance of the problem and the scope of
resources being channeled into the marketing of infant formula and
other substitutes. This recommendation draws attention to the
alarming decline in EBF rates, and calls for defining ways to monitor
and enforce the Regulation.
Budget and Funding
1. At all levels: Increase cost-effectiveness of funding by choosing evidence-based
interventions targeted at vulnerable groups of pre-pregnant, pregnant and
42 Recommendations are prioritized under each heading so that those given first (in bold) are the most
important, and should be considered for immediate implementation. (In the case of Human Resources,
the first two are prioritized.) Second and third recommendations are also important, and are to be
implemented over the medium or long -term.

Landscape Analysis Country Assessment
30
lactating women and children under two-years of age. The recent data from the
World Bank calculations43
on the costs of effective nutrition and health
interventions can likely be used as a reference for that exercise. Moreover,
accompanying central level funds with clear and mandatory guidelines on how
to use them.
In keeping with the strategy of the Lancet Nutrition Series, this is to
support local decision makers who want to ‘do the right thing’ and stop
paying for other interventions that are without evidence of effectiveness.
Targeting vulnerable groups (i.e., pre-pregnant, pregnant and lactating
women, and children under two-years of age) will increase the impact of
funding as these are the groups with the highest rates of malnutrition.
2. At Central level: Work with MoH and BAPPENAS to set guidelines for
calculating the proportion of budget to be dedicated to nutrition based on a
newly defined ‘Maternal and Child Undernutrition Index’ (i.e., using stunting
and anemia in pregnant women as indicators).
This recommendation acknowledges that the main problem of funding of
nutrition-related interventions is not the absence or lack of sufficient
financial resource, but their allocation at the Provincial and District
levels. The development of an ‘Index’, using the values for two key
indicators, will allow local governments to make informed decisions on
where to allocate funds to the areas of greatest need for the greatest
impact. It will also focus attention on the problems of stunting and
anaemia which currently receive insufficient recognition.
Planning and Design of Programmes
1. At all levels: Measure length of all children <2 years of age every six months
during vitamin A distribution months; Measure anemia in pregnant women as
a part of ANC; Continue measuring weight of children regular activity of the
posyandu but prioritize weighing on children under 2 years of age.
Length does not need to be measured as frequently as weight since the
increments of change are less and are less obvious on a month- to-
month basis. Community measuring sessions should only be done
periodically (every six months) making it feasible for a trained team from
the Puskesmas to do the measuring and thereby reduce inaccuracies. If
there is good socialization before hand, this should include all children,
especially as it will be linked with vitamin A distribution. The data will
provide strong evidence of the success of community based interventions
directed at reducing stunting.
Anemia in pregnancy is an indicator of a mother’s nutritional status, her
access to quality health care (i.e., intercurrent infections like urinary
infections, tuberculosis, gastro-intestinal parasites, or malaria can also
cause anaemia), and her status in the family and the community as a
reflection of how well she is cared for. This should be done in every
pregnancy.
43 Horton, S., Shekar, M., McDonald, C., Mahal, A., brooks, J.K. 2010. Scaling up nutrition: What will it
cost? The World Bank. Washington, D.C., USA.

Landscape Analysis Country Assessment
31
Weighing of children can continue as a popular and important part of
posyandu activities but the cadres should focus their attention on
children <2 years of age as this is the age when most faltering occurs.
2. At National level: Target nutrition programs at all pregnant women and
infants and young children 0 – 2 years old in order to (i) focus on the ‘window
of opportunity’, (ii) to use fewer resources more efficiently, and (iii) to increase
the time to counsel mothers of young children and pregnant women.
The shift to targeting children under 2 years of age and pregnant women
throughout their pregnancy will free up time spent in weighing older
children (where the potential to impact on their nutrition is less) and
allow the health worker to focus more on teaching and counseling
mothers and women, especially pregnant women and those planning a
pregnancy, in the Puskesmas and posyandu.
3. At all levels: Develop advocacy materials for members of non-health sectors on the
importance of nutrition for social, economic, cognitive, and physical development.
MOH/MOHA to develop nutrition advocacy materials to influence the campaigns of
Bupatis running for election/re-election.
There are many non-health sectors involved in nutrition but not all of
them are fully informed about the impact of evidence-based interventions,
or the full importance of nutritional improvement. Furthermore, Bupatis
are sometimes constrained by campaign promises to support activities
that are outside of nutrition. By making sure that nutritional goals
become a part of the Bupati’s campaign, there is a greater likelihood
that these goals will be pursued after election.
Human Resources
1. Update existing job descriptions and include new program directions (i.e.,
measurement of stunting and maternal health/anemia) for all staff involved in
nutrition in each ministry/department
Job descriptions, where they exist, are outdated and do not always
reflect the skills and practices that are necessary in a changing
environment. Adjustment of the nutritionist’s job to meet the new
nutrition goals and interventions is necessary.
2. Develop a human resource map for nutritionists and other health workers in order to
identify deployment gaps and competencies. This map is to be used for advocacy
with senior level decision makers. (e.g., President, Governor, Bupati) and Ministries
(e.g., PAN). Use this resource map to develop a national plan for a training
approach to teach nutritional competencies for Volunteers, Nurses and Midwives,
and to provide technical updates for doctors in the nutrition sciences.
As mentioned in the Country Assessment, many nutrition positions in the
Districts are not filled by qualified nutritionists (D3). Knowing where the
resources are needed is the first step in filling those gaps. As the
geographic gaps are being assessed, efforts should be made to ascertain
competency gaps as well. All health workers should be included in this
assessment.

Landscape Analysis Country Assessment
32
3. Expand incentives now being offered to doctors to include nutritionists for working
in underserved areas.
Staff members need incentives to work in more challenging
environments; this is recognized in the placement of doctors. In
recognition of the importance of nutrition for health and development,
the same incentives are necessary to attract and retain qualified
nutrition staff in challenging areas, which are often those in greatest
need.
4. Establish accreditation requirements and procedures (including training
qualifications for nutritionists at all levels) to be recognized and implemented by the
Association of Nutritionists (PERSAGI) with recognition from other professional
associations.
This links with revised and updated job descriptions (mentioned above)
as a means of increasing the professional profile of nutritionists and of
standardizing their knowledge and performance around the evidence-
based interventions outlined in the literature.
5. Nutrition Academies and Universities to standardize and update curriculum,
competencies and accreditation for pre-service and in-service training of public
health nutritionists, including new program emphasis on stunting and maternal
nutrition; Add or reinforce nutrition to pre-service training on nutrition to all
Doctors, Bidans, Nurses;
Nutrition education needs to be updated and expanded to include new
concepts and recent research in the pre-service training of all health and
nutrition professionals; academic institutions are also important in
providing in-service training.
6. Ensure the provision of a continuum of health and nutrition care from conception
through to two years of age, through appropriately organized facility based, periodic
outreach and ongoing community based delivery of services44
.
Stunting is a perfect example of an undesirable nutrition outcome that is
the equal result of deficiencies in intrauterine life and post-natal
conditions. Failing to approach the problem from a continuum of care
perspective will not reduce stunting, as is evident from its persistence
over the past decades that reflects approaches that targeted children
when they were already stunted; no attention was paid to the intrauterine
causes of the problem. Furthermore, if pregnant women are to be
targeted in the first trimester, attention must be paid to the young woman
before she becomes pregnant, (and to the adolescent girl whose own
growth must be protected from a premature pregnancy.)
Nutrition Information System
1. Update the SPM to reflect new programme focus and relevant indicators.
44 Kerber KJ, de Graft-Johnson JE, Bhutta ZA, Okong P, Starrs A, Lawn JE. 2007 Continuum of care for maternal, newborn, and child health: from slogan to service delivery. Lancet 370: 1358–69
Landscape Analysis Country Assessment
33
The standard indicators should be brought in line with current
programme goals and objectives if progress is to be made and
measured toward new goals like stunting and maternal nutrition.
2. NIS to measure indicators listed in the Food and Nutrition Action Plan that can be
used to assess performance and for supervision.
Indicators are to be measured and used in decision making more than
is the present practice. Measuring the output and outcome of practices
in the field will allow supervisors to identify individuals and facilities
that are doing high quality work. These facilities would be eligible for
performance rewards. Those who are not performing well could be
directed to participate in continuing education classes to upgrade their
skills, knowledge, and practice.
Suggested recommendations to be prioritized on a long-term
Service Provision
1. Implement at scale (as appropriate depending on local conditions), the package of
Essential Nutrition Interventions (ENI) effectively targeted to mothers and children
from conception to two years of age.
Packaging key interventions assures that all components necessary for a
healthy and nutritious life are being provided at the same time and in the
same place in a way that will lead to the best outcome. Implementation
of individual interventions separately and in different places (e.g., giving
Vitamin A without giving deworming tablets) is wasteful as well as
ineffective since neither is as effective if used alone. Implementation of
this package could prevent at least a quarter of child deaths under 36
months of age, and reduce the prevalence of stunting by about a third in
the short term45
46
.
Nutrition Information System
1. As a longer term objective, create a working group, chaired by BPS, to consider how
the number of national surveys (eg. RISKESDAS, DHS, IFLS) can be reduced and
rationalized.
Surveys are expensive though their cost is often outweighed if they are
used for critical decision making regarding program focus, targeting
populations, and so on. There are, however, a large number of
national surveys that collect data that is sometimes duplicative. These
should be rationalized so that only one or two surveys are needed to
provide all the information that decision makers need for improving
program performance. The first step in doing this is to define the
actual decisions that need to be taken, the data needed to make those
decisions, the sources of those data, and the methods for collecting
them.
45 The Lancet Series on Maternal and Child Undernutrition 2008. Available at URL: http://www.theLancet.com/series/maternal-and-child-undernutrition (Accessed 31/03/10) 46 SCN 2008. Recommendations from the SCN 35th Session: "ACCELERATING THE REDUCTION OF MATERNAL AND CHILD UNDERNUTRITION" Available at http://www.unscn.org/Publications/AnnualMeeting/SCN35/35th_Session_Recommendations.pdf (Accessed 09/07/0)

Landscape Analysis Country Assessment
34
Other recommendations that could be implemented on a medium-term
Nutrition Coordination & Responsibilities
1. At National level: Create a national level coordination mechanism to oversee and
coordinate implementation of the National Food and Nutrition Action Plan by
changing the name of the existing National Food Security Council to the National
Food and Nutrition Council, or by creating a new body with the designated
responsibility of national nutrition coordination.
By adding the words “…and Nutrition”, Food Security is recognized
as a vital part of the greater goal of Nutrition Security. The Council is
then mandated to implement the National Food and Nutrition Plan,
which is aimed at achieving Nutrition Security through many
approaches, one of which is Food Security. This Council will therefore
fulfill the much needed role of coordinating nutrition security actions
which is very much missing currently. NB. If the scope of the Council is
expanded to include also nutrition security, it may be necessary to
place the Council under President’s office in recognition of the greater
scope.
Planning and Design of Programmes
1. At National level: Develop and implement a strategy for reaching pre-pregnant
women in the age group 18-24 years with a package of health and nutrition
services by working with staff involved in family planning and community
religious leaders during pre-marital visits, etc. Establish a surveillance or
monitoring system to monitor coverage of pre-pregnant women with this
package. The first trimester is now recognized as of key importance for fetal
growth in length and in brain growth, and the micronutrient status
around conception is key for preventing some birth defects. Most women
do not come to the Bidan until their second trimester. Therefore to make
sure that their protein, energy, and micronutrient nutrition is adequate
and that they are free from diseases that compete for nutrients in the first
trimester, they need to be reached before they become pregnant or as
early as possible after conception.
2. At National level: Strengthen national food fortification programs by updating
fortification standards for wheat, making oil fortification mandatory, and improving
the enforcement of the salt fortification law.
National food fortification programmes are an effective, cost efficient
and important way to increase the micronutrient status of the population
consuming the food vehicle. They can improve micronutrient intake in
women before they become pregnant, in adolescents and in men; all
groups not commonly targeted or able to be reached by other
micronutrient interventions such as supplementation. The effectiveness
of the wheat flour fortification programme needs to be increased by
updating the SNI in line with global WHO recommendations, oil
fortification is happening but needs to be made mandatory in order to
have optimal impact on public health and enforcement of the salt

Landscape Analysis Country Assessment
35
fortification law is needed to ensure all salt is iodized and that quality
assurance systems are improved.
Human Resources
1. Use high achievements in reducing stunting, anemia in pregnancy, and improvements
in early and exclusive breastfeeding as basis for additional performance rewards to
puskesmas and posyandu.
Performance incentives may be in the form of financial or non-financial
rewards. When awarded to well-performing facilities (rather than to
individuals) they can stimulate improved teamwork, efficiency, and
community service.
Other recommendations that could be implemented on a long-term
Budget and Funding
1. At all levels: Implement a process to identify ways to strengthen poverty reduction
programmes for increased impact on child and maternal undernutrition.
Under the auspices of the National Team for Accelerated Poverty
Reduction” (TNP2K), chaired by the Vice President, initiate a process to
review each of the poverty-reduction programmes to identify how they
can be adapted to contribute to improvements in nutrition priorities and
interventions in line with the National Medium Term Development Plan
and the National Food and Nutrition Plan. Implement these changes
through the TNP2K at provincial and district level. If not already there,
include a nutrition indicator such as prevalence of child stunting as an
impact indicator of the programmes in recognition of the close link
between poverty and child nutrition.
Planning and Design of Programmes
1. Focus the objective of school feeding programs on increasing school enrolment and
retention, and, if resources are a limiting factor, prioritize the program to secondary
schools in poorer areas as an incentive for girls to stay in school.
School-age children are not the most nutritionally vulnerable; hence they
do not benefit significantly from school feeding programmes. School
feeding can however provide an incentive, in certain situations, to
increase enrolment and retention of children in schools. Where this
becomes of great importance is in the adolescent girl who will be
pressured to stop her schooling prematurely, particularly in families
without sufficient finances. In these cases, food becomes an economic
supplement more than a nutritional one, although the nutritional impact
will be felt if girls stay in school longer since this is associated with a
later age of marriage, and a later age (beyond adolescence) of first
pregnancy.
Landscape Analysis Country Assessment
36
Human resources
1.Provide technical assistance in the development of distance learning modules for in-
service training of nutrition staff linked to accreditation and performance rewards for
successful completion of training and achievement of higher scores.
Distance learning with rewards for achievements offers a less expensive
way to maintain the training and knowledge of staff in the field. New
techniques that ensure confidentiality and monitor participation allow
courses to be run inexpensively in a secure environment.
6. Next Steps
Obtaining final approval of the LA report from MoH at Central level and, in
particular, from the department of Community Nutrition.
Translation of the LA report in Bahasa Indonesia
Design and printing of the LA report in both languages (English and Bahasa
Indonesia)
Organization of a meeting at MoH at Central level between all relevant
departments namely Community Nutrition, Maternal Health and Child
Health to disseminate the LA report. This meeting can be organized by the
Director General of Community Health at MoH.
Dissemination of the LA report by MoH/Bappenas at Central level to all
relevant partners including donors, ministries, UNs agencies, NGOs, etc.
Integration of the prioritized recommendations in the 2011-2015 National
Food and Nutrition Action plan. This could be done through the process of
the development of the National plan which will be ongoing up to December
210. Moreover, using the prioritized recommendations of the Landscape
Analysis Country Assessment, identify short term actions that can already be
acted on for 2011, and longer term activities that will require new laws and
regulations, etc.
Present the results of the Landscape Analysis Country Assessment at the
province level. Use this opportunity to start the process of harmonization of
objectives and targets between national and sub-national levels as well as to
advocate for more nutrition budget at sub-national levels.
Initiate the implementation of the National Food and Nutrition Action Plan
in one (or two) districts of each of the three provinces and further refine and
focus the posyandu system following the recommendations. This will
include Bidans and Kadres working more with groups of mothers preparing
them to get pregnant with no anaemia, etc. This will include equipping the
puskesmas to do the necessary measurements and working on procedures,
etc, developing the IEC material, etc.
In summary, the recommendations are made concerning the areas of: Nutrition
Coordination & Responsibilities; Budget and Funding; Planning and Design of
Programmes; Human Resources; Service Provision; Nutrition Information System.
Priority should be given to creating mechanisms which promote the development of
harmonized Food and Nutrition Action Plans at Province and District level based on the
national plan, decree and guidelines, as well as to develop inter-sectoral coordination
mechanisms to oversee and monitor their implementation. In order to increase cost-
Landscape Analysis Country Assessment
37
effectiveness of funding, guidance and incentives should be provided to districts for
them to prioritize evidence-based interventions targeted at vulnerable groups of pre-
pregnant, pregnant and lactating women and children under two-years of age. Length of
children under two and maternal anemia should be given increasing emphasis and
prioritized for measuring the effectiveness of both nutrition as well as poverty reduction
programmes at all levels. In parallel to this job descriptions need to be updated to reflect
new program directions (i.e., measurement of stunting and maternal health/anemia) for
all staff involved in nutrition at all levels of the system. A human resource map for
nutritionists and other health workers should be developed in order to identify
deployment gaps and competencies, and develop a national plan for a training approach
to teach nutritional competencies for volunteers, nurses and midwives, and to provide
technical updates for doctors in the nutrition sciences. In parallel to this the
implementation at scale (as appropriate depending on local conditions), of the package
of Essential Nutrition Interventions (ENI) should be progressively implemented starting
in a few districts and provinces and gradually expanding so that within five years most
mothers and children are covered by ENI as a continuum of care from conception to two
years of age. Monitoring and evaluation guidelines should be modified to reflect new
programme focus and relevant indicators.

Landscape Analysis Country Assessment
38
Appendix 1. The Country Assessment methodology
Scope of Country Assessment of the landscape analysis
Overall Vision: District government and health authorities have the commitment and capacity to ensure high coverage of effective nutrition interventions in order to accelerate the reduction of maternal and child undernutrition. Effective nutrition interventions are those identified by the Lancet Nutrition Series. District government commitment and capacity will be ensured by central level guidance to district government and health authorities on the effective nutrition interventions and building their capacity to undertake microplanning to achieve high coverage and quality implementation. Provincial government and health authorities will provide supervision and quality assurance support. Effective nutrition interventions will be implemented through existing health systems and be supported by and synergistic with national level policies and initiatives on health, nutrition, agricultural development, poverty alleviation and safety nets, that are successfully articulated at the local level At all levels the Country Assessment will focus on identifying weaknesses and opportunities for improvement on the following seven challenges identified by the Lancet Series:
1. Putting nutrition on the national agenda, 2. Doing the right things, 3. Not doing the wrong things, 4. Doing things at scale, 5. Reaching those in need, 6. Using data for nutrition decision-making, 7. Building strategic and operational capacity.
At district level the Country Assessment will focus on the following:
1. How to improve the capacities of districts to microplan and implement essential nutrition interventions
2. How national policies and guidance is delivered to and utilized by districts 3. How district implementation of essential nutrition interventions can be facilitated and
supported by provincial authorities 4. How funding mechanisms and resources can be better accessed and used for improving
coverage and quality of essential nutrition interventions 5. How national programmes and initiatives including safety net and pro-poor programmes can
be more synergistic with and better support district implementation of essential nutrition interventions
6. What data is needed and how it can be better used at district level to facilitate quality implementation at high coverage of essential nutrition interventions.
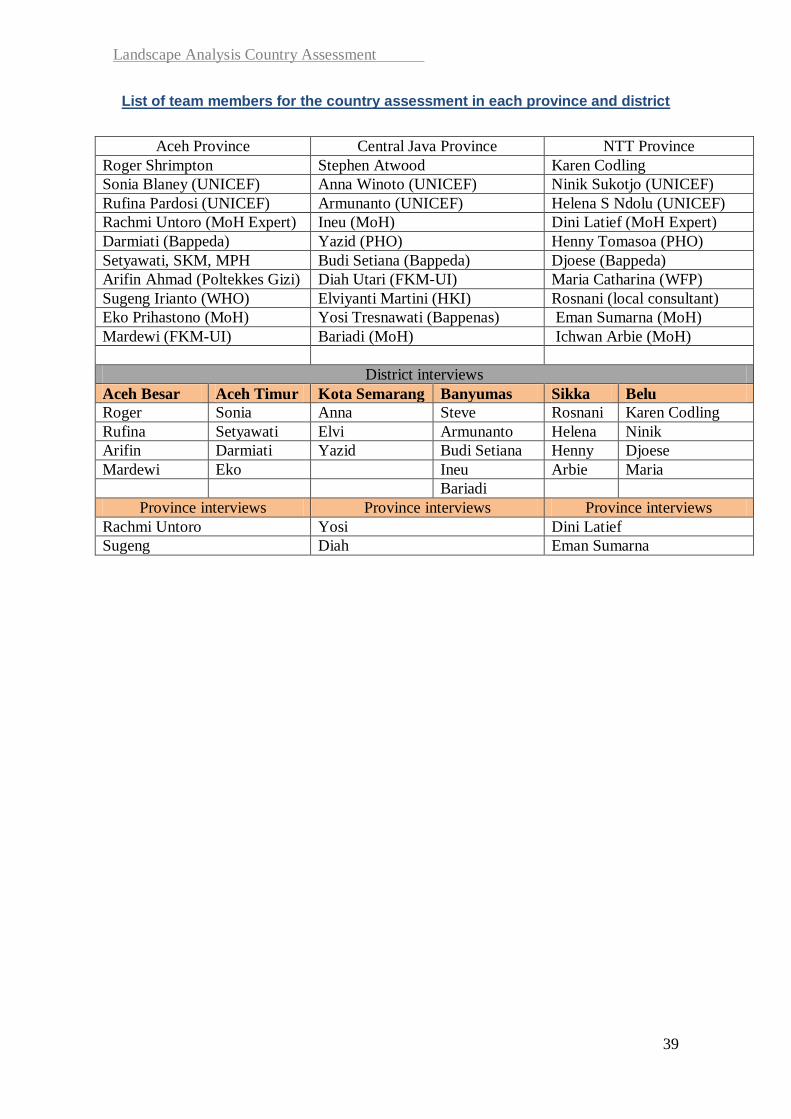
Landscape Analysis Country Assessment
39
List of team members for the country assessment in each province and district
Aceh Province Central Java Province NTT Province
Roger Shrimpton Stephen Atwood Karen Codling
Sonia Blaney (UNICEF) Anna Winoto (UNICEF) Ninik Sukotjo (UNICEF)
Rufina Pardosi (UNICEF) Armunanto (UNICEF) Helena S Ndolu (UNICEF)
Rachmi Untoro (MoH Expert) Ineu (MoH) Dini Latief (MoH Expert)
Darmiati (Bappeda) Yazid (PHO) Henny Tomasoa (PHO)
Setyawati, SKM, MPH Budi Setiana (Bappeda) Djoese (Bappeda)
Arifin Ahmad (Poltekkes Gizi) Diah Utari (FKM-UI) Maria Catharina (WFP)
Sugeng Irianto (WHO) Elviyanti Martini (HKI) Rosnani (local consultant)
Eko Prihastono (MoH) Yosi Tresnawati (Bappenas) Eman Sumarna (MoH)
Mardewi (FKM-UI) Bariadi (MoH) Ichwan Arbie (MoH)
District interviews
Aceh Besar Aceh Timur Kota Semarang Banyumas Sikka Belu
Roger Sonia Anna Steve Rosnani Karen Codling
Rufina Setyawati Elvi Armunanto Helena Ninik
Arifin Darmiati Yazid Budi Setiana Henny Djoese
Mardewi Eko Ineu Arbie Maria
Bariadi
Province interviews Province interviews Province interviews
Rachmi Untoro Yosi Dini Latief
Sugeng Diah Eman Sumarna
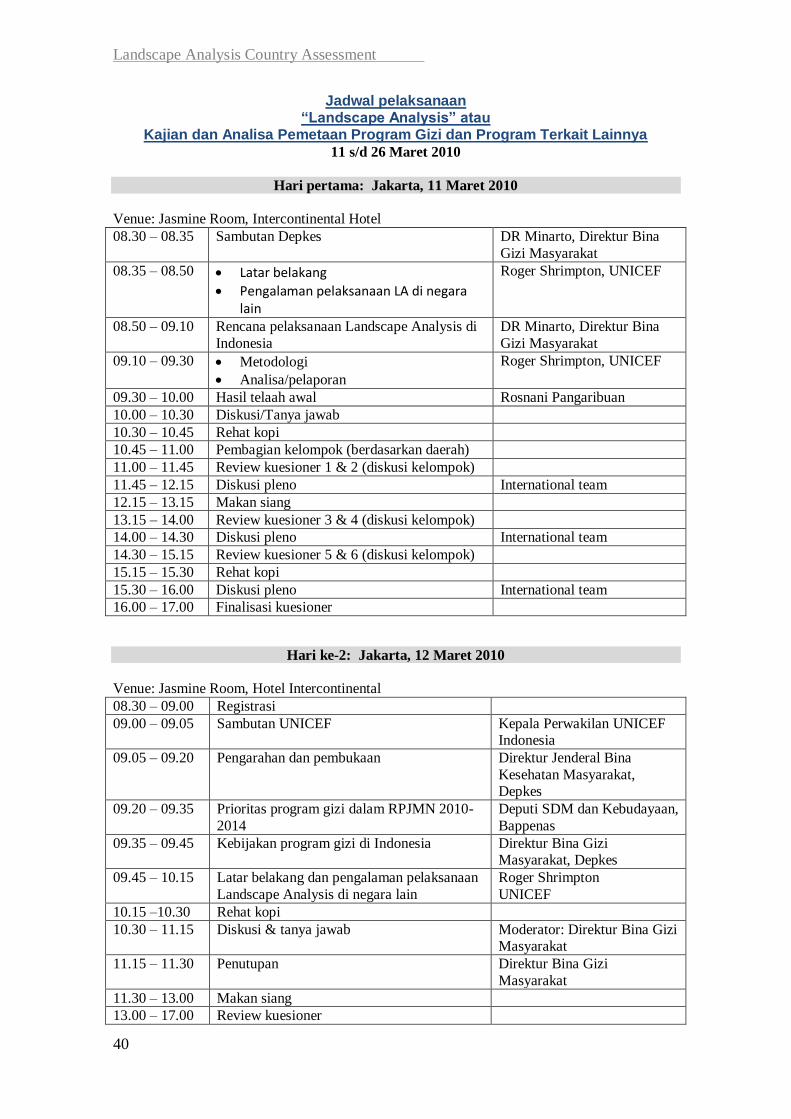
Landscape Analysis Country Assessment
40
Jadwal pelaksanaan “Landscape Analysis” atau
Kajian dan Analisa Pemetaan Program Gizi dan Program Terkait Lainnya
11 s/d 26 Maret 2010
Hari pertama: Jakarta, 11 Maret 2010
Venue: Jasmine Room, Intercontinental Hotel
08.30 – 08.35 Sambutan Depkes DR Minarto, Direktur Bina
Gizi Masyarakat
08.35 – 08.50 Latar belakang
Pengalaman pelaksanaan LA di negara lain
Roger Shrimpton, UNICEF
08.50 – 09.10 Rencana pelaksanaan Landscape Analysis di
Indonesia
DR Minarto, Direktur Bina
Gizi Masyarakat
09.10 – 09.30 Metodologi
Analisa/pelaporan
Roger Shrimpton, UNICEF
09.30 – 10.00 Hasil telaah awal Rosnani Pangaribuan
10.00 – 10.30 Diskusi/Tanya jawab
10.30 – 10.45 Rehat kopi
10.45 – 11.00 Pembagian kelompok (berdasarkan daerah)
11.00 – 11.45 Review kuesioner 1 & 2 (diskusi kelompok)
11.45 – 12.15 Diskusi pleno International team
12.15 – 13.15 Makan siang
13.15 – 14.00 Review kuesioner 3 & 4 (diskusi kelompok)
14.00 – 14.30 Diskusi pleno International team
14.30 – 15.15 Review kuesioner 5 & 6 (diskusi kelompok)
15.15 – 15.30 Rehat kopi
15.30 – 16.00 Diskusi pleno International team
16.00 – 17.00 Finalisasi kuesioner
Hari ke-2: Jakarta, 12 Maret 2010
Venue: Jasmine Room, Hotel Intercontinental
08.30 – 09.00 Registrasi
09.00 – 09.05 Sambutan UNICEF Kepala Perwakilan UNICEF Indonesia
09.05 – 09.20 Pengarahan dan pembukaan Direktur Jenderal Bina
Kesehatan Masyarakat, Depkes
09.20 – 09.35 Prioritas program gizi dalam RPJMN 2010-
2014
Deputi SDM dan Kebudayaan,
Bappenas
09.35 – 09.45 Kebijakan program gizi di Indonesia Direktur Bina Gizi Masyarakat, Depkes
09.45 – 10.15 Latar belakang dan pengalaman pelaksanaan
Landscape Analysis di negara lain
Roger Shrimpton
UNICEF
10.15 –10.30 Rehat kopi
10.30 – 11.15 Diskusi & tanya jawab Moderator: Direktur Bina Gizi Masyarakat
11.15 – 11.30 Penutupan Direktur Bina Gizi
Masyarakat
11.30 – 13.00 Makan siang
13.00 – 17.00 Review kuesioner
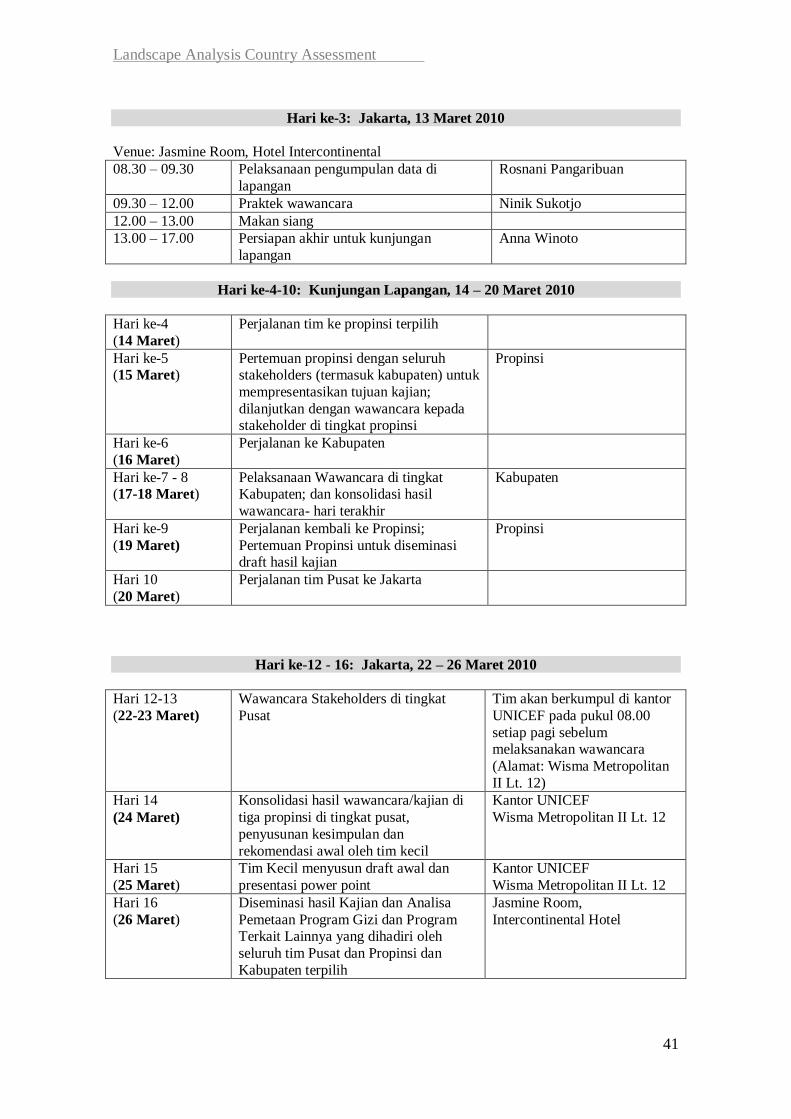
Landscape Analysis Country Assessment
41
Hari ke-3: Jakarta, 13 Maret 2010
Venue: Jasmine Room, Hotel Intercontinental
08.30 – 09.30 Pelaksanaan pengumpulan data di
lapangan
Rosnani Pangaribuan
09.30 – 12.00 Praktek wawancara Ninik Sukotjo
12.00 – 13.00 Makan siang
13.00 – 17.00 Persiapan akhir untuk kunjungan
lapangan
Anna Winoto
Hari ke-4-10: Kunjungan Lapangan, 14 – 20 Maret 2010
Hari ke-4
(14 Maret)
Perjalanan tim ke propinsi terpilih
Hari ke-5 (15 Maret)
Pertemuan propinsi dengan seluruh stakeholders (termasuk kabupaten) untuk
mempresentasikan tujuan kajian;
dilanjutkan dengan wawancara kepada stakeholder di tingkat propinsi
Propinsi
Hari ke-6
(16 Maret)
Perjalanan ke Kabupaten
Hari ke-7 - 8 (17-18 Maret)
Pelaksanaan Wawancara di tingkat Kabupaten; dan konsolidasi hasil
wawancara- hari terakhir
Kabupaten
Hari ke-9
(19 Maret)
Perjalanan kembali ke Propinsi;
Pertemuan Propinsi untuk diseminasi draft hasil kajian
Propinsi
Hari 10
(20 Maret)
Perjalanan tim Pusat ke Jakarta
Hari ke-12 - 16: Jakarta, 22 – 26 Maret 2010
Hari 12-13
(22-23 Maret)
Wawancara Stakeholders di tingkat
Pusat
Tim akan berkumpul di kantor
UNICEF pada pukul 08.00
setiap pagi sebelum melaksanakan wawancara
(Alamat: Wisma Metropolitan
II Lt. 12)
Hari 14
(24 Maret)
Konsolidasi hasil wawancara/kajian di
tiga propinsi di tingkat pusat,
penyusunan kesimpulan dan
rekomendasi awal oleh tim kecil
Kantor UNICEF
Wisma Metropolitan II Lt. 12
Hari 15
(25 Maret)
Tim Kecil menyusun draft awal dan
presentasi power point
Kantor UNICEF
Wisma Metropolitan II Lt. 12
Hari 16
(26 Maret)
Diseminasi hasil Kajian dan Analisa
Pemetaan Program Gizi dan Program Terkait Lainnya yang dihadiri oleh
seluruh tim Pusat dan Propinsi dan
Kabupaten terpilih
Jasmine Room,
Intercontinental Hotel
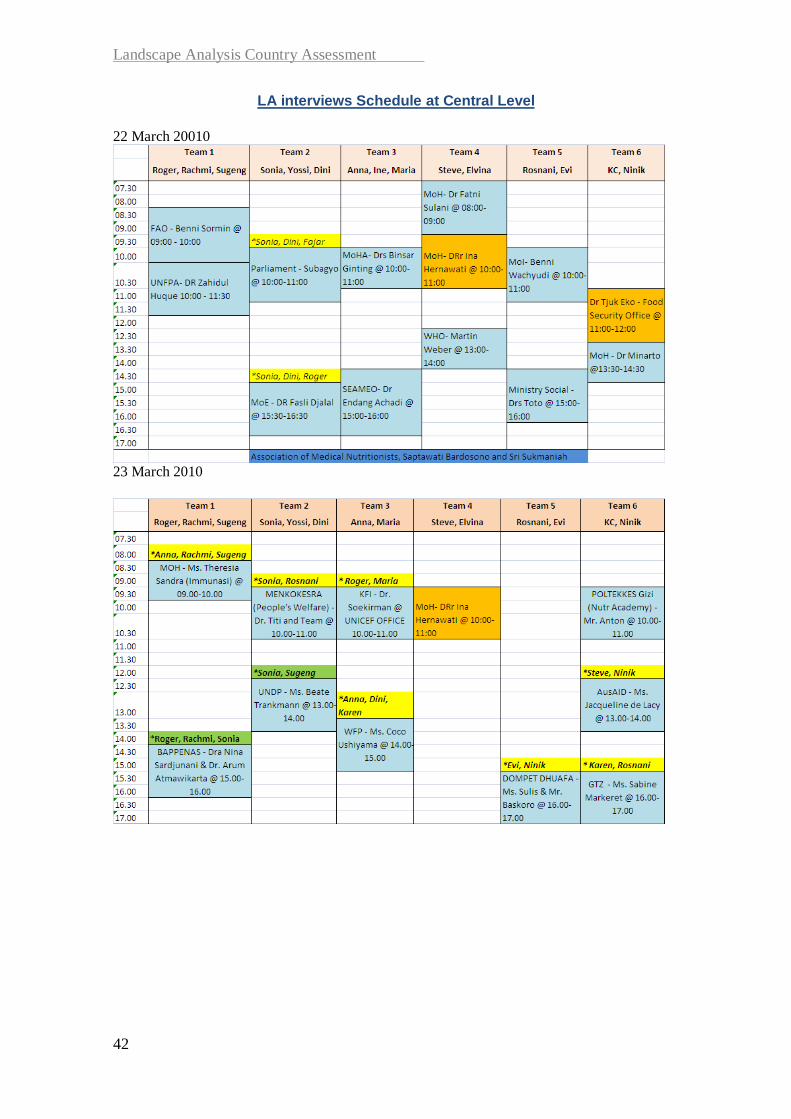
Landscape Analysis Country Assessment
42
LA interviews Schedule at Central Level
22 March 20010
23 March 2010

Landscape Analysis Country Assessment
43
List of interviewees
Aceh province, Aceh Timur and Aceh Besar Districts
No Name Title Institution Remarks
1 Jamil Rusaleh Bidang Pelayanan dan Rehabilitasi
Sosial
Dinas Sosial Aceh Province
2 Khairani Staf Pelayanan Anak Dinas Sosial Aceh Province
3 dr. Hasnani Kasie KIA dan Gizi Dinas Kesehatan Aceh Province
4 drg. Efi Syafrida Kabid Pembinaan Kesehatan Dinas Kesehatan Aceh Province
5 dr.Yani Kepala Dinas Dinas Kesehatan Aceh Province
6 Azhari Kabid Pendidikan Dasar Dinas Pendidikan Aceh Province
7 M. Yunus Ilyas, SE, M.Si Sekretaris Fraksi Komisi F DPRA Province
8 Nasir Kabid Industri Kimia Agro Dinas Perindustrian, Perdagangan,
Koperasi & UKM Aceh
Province
9 Dewi Mutia Kasie Kimia Afro Dinas Perindustrian, Perdagangan,
Koperasi & UKM Aceh
Province
10 Isnaidi Kasie Logam Mesin Dinas Perindustrian, Perdagangan,
Koperasi & UKM Aceh
Province
11 Parabi Kabid Anak Badan Pemberdayaan Perempuan
dan Perlindungan Anak Aceh
Province
12 M. Nur Kabid Ketahanan Pangan Mukim
dan Gampong
Dinas Pemberdayaan Masyarakat
Aceh
Province
13 Ellya Kasubbid Motivasi dan Swadaya Dinas Pemberdayaan Masyarakat
Aceh
Province
14 Buchari Kasubbid Pengembangan Sumber
Daya Tradisi dan Budaya
Dinas Pemberdayaan Masyarakat
Aceh
Province
15 Aripin Ahmad Kajur Gizi Poltekes Aceh Poltekes NAD Province
16 Ir. Rusli Kepala Bidang Konsumsi &
Keamaanan Pangan
Badan Ketahanan Pangan Aceh Province
17 Cut Sumarni Kepala Bidang Distribusi Badan Ketahanan Pangan Aceh Province
18 Erisna Bagian Keanekaragaman Konsumsi
Pangan
Badan Ketahanan Pangan Aceh Province
19 Kabid Tanaman Pangan Dinas Pertanian Aceh Besar District Aceh Besar
20 Sekretaris Dinas Pertanian Aceh Besar District Aceh Besar
21 Kasie Tanaman Pangan Dinas Pertanian Aceh Besar District Aceh Besar
22 Kepala Bidang Penguatan
Kelembagaan Masyarakat
Badan Pemberdayaan Masyarakat
dan Gampong Aceh Besar
District Aceh Besar
23 Kepala Badan Badan Ketahanan Pangan dan
Penyuluhan Aceh Besar
District Aceh Besar
24 Kabid Ketahanan Pangan Badan Ketahanan Pangan dan
Penyuluhan Aceh Besar
District Aceh Besar
25 Sekretaris Badan Ketahanan Pangan dan
Penyuluhan Aceh Besar
District Aceh Besar
26 Kepala Bappeda Aceh Besar District Aceh Besar

Landscape Analysis Country Assessment
44
27 Hasanudin Kasubbid Pengembangan SDM &
Keistimewaan Aceh
Bappeda Aceh Besar District Aceh Besar
28 Kepala Dinas Dinas Kesehatan Aceh Besar District Aceh Besar
29 Program Officer KIA Dinas Kesehatan Aceh Besar District Aceh Besar
30 Program Officer P2P Dinas Kesehatan Aceh Besar District Aceh Besar
31 Komisi E DPRK Aceh Besar District Aceh Besar
32 Kepala Puskesmas Puskesmas Indrapuri District Aceh Besar
33 Tenaga Pelaksana Gizi Puskesmas Indrapuri District Aceh Besar
34 Bidan Koordinator Puskesmas Indrapuri District Aceh Besar
35 Bidan Desa Puskesmas Indrapuri District Aceh Besar
36 Kader Posyandu Puskesmas Indrapuri District Aceh Besar
37 Kepala Puskesmas Puskesmas Darul Imarah Aceh
Besar
District Aceh Besar
38 Tenaga Pelaksana Gizi Puskesmas Darul Imarah Aceh
Besar
District Aceh Besar
39 Bidan Desa Lheu Blang Puskesmas Darul Imarah Aceh
Besar
District Aceh Besar
40 Kader Posyandu Lheu Blang Puskesmas Darul Imarah Aceh
Besar
District Aceh Besar
41 Kepala bidang BPMG (Badan
Pemberdayaan Masyarakat
Gampong)
Kantor BPM-PKS District Aceh Timur
42 DPRK, Komisi E Kantor DPRK District Aceh Timur
43 Dr Hambali, Agustina and
Marlita
Kepala Puskesmas, TPG dan Bidan
Koordinator
Puskesmas Bireum Bayeun District Aceh Timur
44 Bupati Aceh Timur dan
Bpk. Syanfanmur
Bupati dan Sekretaris Kantor Bupati Distritc Aceh Timur
45 Ir. Irham, MT Kepala Bappeda Kantor Bappeda District AcehTimur
46 Bidan Desa dan Kader Posyandu of Desa Alue Buloh District Aceh Timur
47 Ayubi, SKM dan Amir,
SKM
Kepala Dinas Kesehatan, Kepala
Bidang Pelayanan Kesehatan
Dinas Kesehatan District Aceh Timur
48 Kabid Hortikultura Dinas Pertanian District Aceh Timur
49 Badan Ketahanan Pangan Kantor Ketahanan Pangan District Aceh Timur
50 BPM-PKS Kepala Pemberdayaan
Masy, Perempuan & Keluarga
Sejahtera
Kantor BPM-PKS District Aceh Timur
51
Bidan Desa dan Kader Posyandu Camar Laut-Desa Blang
Qlumpang
District Aceh Timur
52
Kepala Puskesmas, TPG dan Bidan
Koordinator
Puskesmas Idi Rayeuk District Aceh Timur

Landscape Analysis Country Assessment
45
Central Java province, Kota Semarang and Banyumas district
No Name, Title Institution Remarks
1 Bambang Setyobudi (Kabid), Dwi Arminingsih (staf), Ratna Widyarini (staf)Bidang Kesra Province
2 Dr. Mardiyatmo, SP RAD (Kepala Dinas) Dinas Kesehatan Province
3 Dr. Retno Budiastuti (Kasubdit Yankes) Dinas Kesehatan Province
4 Dr. Djoko Mardijanto, Mkes (Kabid. P2PL) Dinas Kesehatan Province
5 Dr. Yuswanti (Kasie Kesga Gizi) Dinas Kesehatan Province
6 Achmad Syaifudin (Ka.Perencanaan) Dinas Kesehatan Province
7 Dr. Messy Widiastuti, MARS (Komisi E) DPRD Province
8 Ir. Suyatno, Mkes (Wadek III, staf Jur. Gizi) FKM Undip bagian gizi Province
9 Ir. Basuki Sigit (Ka. Jur) Poltekkes Gizi Province
10 Surati Dinas Pendidikan Province
11 Drs. Ali Yahya, MPd Bapermas Province
12 Mery Zuliana (anggota Pokja IV) PKK Province
13 Munawir, SH (Bid. Kemandirian Pangan, bid. Ketersediaan Pangan)Badan Ketahanan Pangan Province
14 Hari Sutjahyo (Sie. Industri Kimia Bid. Industri Agro Kimia dan Hasil Hutan)Dinas Perindag Province
15 F. Himawan E.W. (Kasie. Pengembangan SDM & Kelembagaan)Dinas Pertanian Province
16 Moch Junaedi (Kasie. Potensi Sumber Kesejahteraan Sosial)Dinas Sosial Province
17 Dra. Diana Susilowati (Kasubid. Perlindungan Anak bid. Kesejahteraan dan Perlindungan Anak)BP3AKB Province
18 Dyah Siti Sundari (Diklat) BKKBN Province
19 Hernowo Budi Luhur (Kabid Perencanaan Sosbud)Bidang Sosbud Kota Semarang
20 Dr. Tatik Suyarti (Kadinkes) Dinas Kesehatan Kota Semarang
21 Dr Susi Herawati (Kasubdit Kesga) Dinas Kesehatan Kota Semarang
22 Dr Widoyono (Kabid P2ML) Dinas Kesehatan Kota Semarang
23 Purwanti (Kasie Gizi) Dinas Kesehatan Kota Semarang
24 Drg Lusi Suryani (Kasie Perencanaan Subbag) Dinas Kesehatan Kota Semarang
25 Tenaga Gizi Puskesmas Pandanaran Kota Semarang
26 Retno (bidan) Posyandu Setialsulu Kota Semarang
27 Ismoyowati, Ani (kader) Posyandu Setiasulu Kota Semarang
28 Kepala Puskesmas Puskesmas Srondol Kota Semarang
29 Bidan Puskesmas Srondol Kota Semarang
30 Ahli gizi Puskesmas Srondol Kota Semarang
31 Drs Hidayatullah (Kasie TS SD) Dinas Pendidikan Kota Semarang
32 Dra. Hayu & Lilik Haryanto Bapermas Kota Semarang
33 Dra. Wijayanti (Pokja IV) TP PKK Kota Semarang
34 S. Kiswanti (Kasie Konsumen & Ketahanan Pangan) & Diana Hidayati (staff)Badan Ketahanan Pangan Kota Semarang
35 Agus Guntoro (Seksi Agro Kimia & Hasil Hutan) Dinas Perindag Kota Semarang
36 Ir Komara Irawati (Kasie Agroindustri Pangan & Hortikultura)Dinas Pertanian Kota Semarang
37 Dra Dahlia Gombiarti MSI (Kabid PMKS) Dinas Sosial Kota Semarang
38 Mardjoko (Bupati) Bupati Kab Banyumas
39 Ir Wahyu Budi Saptono M.Si (Kepala) Bappeda Kab Banyumas
40 Ir Achmad Wahyudi (Kabid Pemb.) Bappeda Kab Banyumas
41 Bagus Abimanyu (Kasubid Kesmas) Bappeda Kab Banyumas
42 dr Widayanto (Kadinkes) Dinas Kesehatan Kab Banyumas
43 dr Supraptini (Kabid Yankes) Dinas Kesehatan Kab Banyumas
44 Baharudin SKM (Seksi Gizi) Dinas Kesehatan Kab Banyumas
45 Suwanseno (Kasie Palawija) Dinas Pertanian Kab Banyumas
46 Puji Rahardjo (Seksi pengendalian mutu) Dinas Pendidikan Kab Banyumas
47 Suwarno (Kasie Bappeluh) Badan Ketahanan Pangan Kab Banyumas
48 Suharyanto (Bidang kelembagaan) Bapermades Kab Banyumas
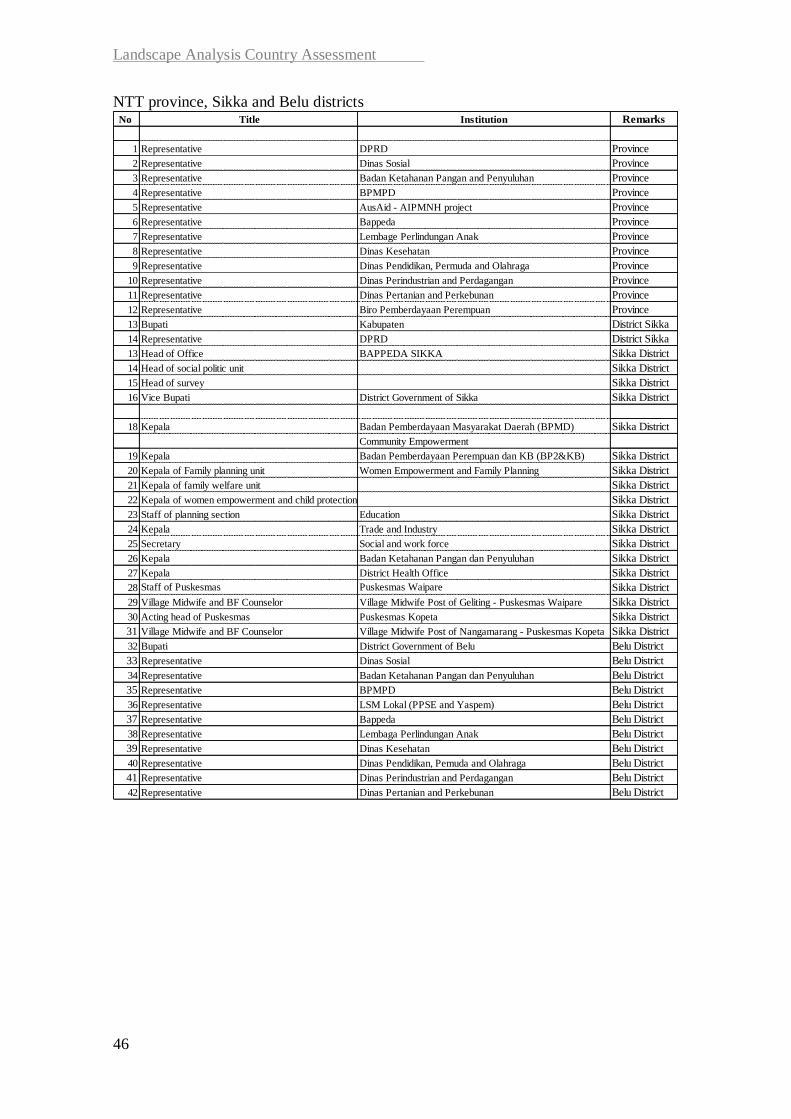
Landscape Analysis Country Assessment
46
NTT province, Sikka and Belu districts No Title Institution Remarks
1 Representative DPRD Province
2 Representative Dinas Sosial Province
3 Representative Badan Ketahanan Pangan and Penyuluhan Province
4 Representative BPMPD Province
5 Representative AusAid - AIPMNH project Province
6 Representative Bappeda Province
7 Representative Lembage Perlindungan Anak Province
8 Representative Dinas Kesehatan Province
9 Representative Dinas Pendidikan, Permuda and Olahraga Province
10 Representative Dinas Perindustrian and Perdagangan Province
11 Representative Dinas Pertanian and Perkebunan Province
12 Representative Biro Pemberdayaan Perempuan Province
13 Bupati Kabupaten District Sikka
14 Representative DPRD District Sikka
13 Head of Office BAPPEDA SIKKA Sikka District
14 Head of social politic unit Sikka District
15 Head of survey Sikka District
16 Vice Bupati District Government of Sikka Sikka District
18 Kepala Badan Pemberdayaan Masyarakat Daerah (BPMD) Sikka District
Community Empowerment
19 Kepala Badan Pemberdayaan Perempuan dan KB (BP2&KB) Sikka District
20 Kepala of Family planning unit Women Empowerment and Family Planning Sikka District
21 Kepala of family welfare unit Sikka District
22 Kepala of women empowerment and child protection Sikka District
23 Staff of planning section Education Sikka District
24 Kepala Trade and Industry Sikka District
25 Secretary Social and work force Sikka District
26 Kepala Badan Ketahanan Pangan dan Penyuluhan Sikka District
27 Kepala District Health Office Sikka District
28 Staff of Puskesmas Puskesmas Waipare Sikka District
29 Village Midwife and BF Counselor Village Midwife Post of Geliting - Puskesmas Waipare Sikka District
30 Acting head of Puskesmas Puskesmas Kopeta Sikka District
31 Village Midwife and BF Counselor Village Midwife Post of Nangamarang - Puskesmas Kopeta Sikka District
32 Bupati District Government of Belu Belu District
33 Representative Dinas Sosial Belu District
34 Representative Badan Ketahanan Pangan dan Penyuluhan Belu District
35 Representative BPMPD Belu District
36 Representative LSM Lokal (PPSE and Yaspem) Belu District
37 Representative Bappeda Belu District
38 Representative Lembaga Perlindungan Anak Belu District
39 Representative Dinas Kesehatan Belu District
40 Representative Dinas Pendidikan, Pemuda and Olahraga Belu District
41 Representative Dinas Perindustrian and Perdagangan Belu District
42 Representative Dinas Pertanian and Perkebunan Belu District

Landscape Analysis Country Assessment
47
Questionnaires
Preface
Overview of the Landscape Country Assessment Tool
The Landscape Analysis Country Assessment Tool consists of eight main
questionnaires and checklists for assessing commitment and capacity to accelerate
actions to reduce maternal and child undernutrition at national and various sub-national
levels. In Indonesia, only questionnaires 1 to 6 were used for the country assessment.
Questionnaire 2 was used for the NGOs interviews instead of questionnaires 7 and 8.
Core package of questionnaires and checklists includes:
Level Existing tools:
National 1. Semi-structured interview tool for national level stakeholders
(government agencies and other stakeholders such as UN
agencies, donors and NGOs)
Regional /
Provincial
2. Semi-structured interview tool for provincial level stakeholders
(provincial government agencies and regional based NGOs and
other organizations)
District 3. Semi-structured interview tool for district level management staff
Facility 4. Semi-structured interview tool for the facility manager and
nutrition responsible
5. Facility checklist
6. Structured questionnaire for health workers in posyandu,
puskesmas and polindes
Field 7. Semi-structured interview tool for manager of implementing
NGOs
8. Semi-structured interview tool for nutrition coordinator in NGOs
The original tools were have been developed by the Medical Research Council of Cape
Town, South Africa for the WHO Department of Nutrition for Health and Development
and adapted throughout the first six Landscape Assessments in Madagascar, Burkina
Faso, Ghana, Guatemala, Peru and South Africa. Each of these countries has further
enhanced the tools, adapting them to their respective national situations. A major
revamp was done by the South African country team to allow a nation-wide large scale
assessment where a total of almost 1,000 questionnaires were completed. To facilitate
computer based analysis of this amount of questionnaires, coding fields were added.
Due to the high focus on nutrition and HIV in South Africa, an additional set of tools
were developed for use in the ARV clinics (Forms 9 and 10).
Preparations
As part of the preparations for the Landscape Analysis Country Assessment, the country
team has reviewed the tools, select which ones to use and adapt them to the national
situation. The country team also determined the scope of the assessment, including
scheduling interviews and planning field visits. The Word document questionnaires can

Landscape Analysis Country Assessment
48
be obtained from WHO Department of Nutrition for Health and Development, by
contacting [email protected].
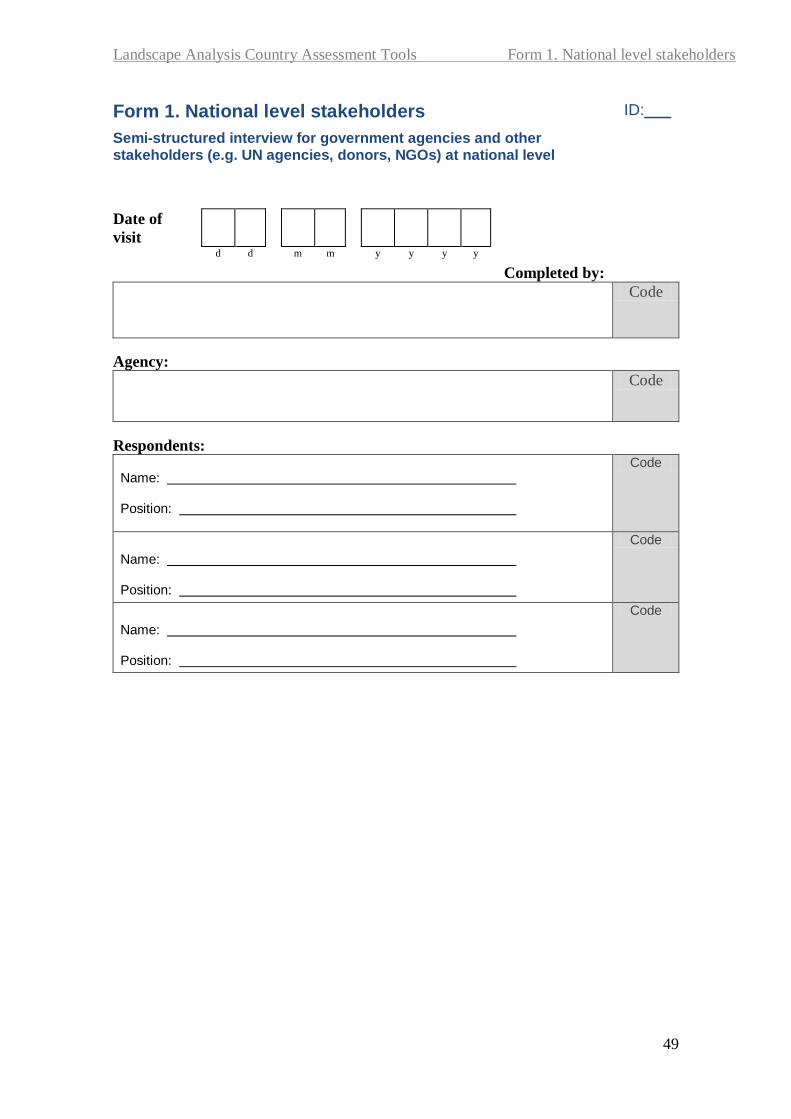
Landscape Analysis Country Assessment Tools Form 1. National level stakeholders
49
Form 1. National level stakeholders
Semi-structured interview for government agencies and other stakeholders (e.g. UN agencies, donors, NGOs) at national level
ID:___
Completed by:
Code
Agency:
Code
Respondents: Name: Position:
Code
Name: Position:
Code
Name: Position:
Code
Date of
visit
d d m m y y y y

Landscape Analysis Country Assessment Tools Form 1. National level stakeholders
50
Section 1. Nutrition situation and priorities 1.1 What do you perceive as the three major nutrition problems in the country?
(List according to importance)
1. Code
2. Code
3. Code
1.2 Do you feel these identified problems are adequately addressed in the national nutrition
policy, strategy and/or action plan?
1 Yes
0 No
98 Don’t know if they
are addressed
99 Don't know of any national nutrition
policy
Code
Justify:
1.3 What do you perceive as the most important causes of these nutrition problems?
(List according to importance)
1. Code
2. Code
3. Code
1.4 What do you perceive as the major barriers for scaling-up nutrition actions? (List
according to importance)
1. Code
2. Code
3. Code

Landscape Analysis Country Assessment Tools Form 1. National level stakeholders
51
1.5 What do you perceive as the major opportunities for scaling-up nutrition actions? (List according to importance)
1. Code
2. Code
3. Code
Section 2. Nutrition coordination system 2.1 What do you perceive as the major strengths of the current system/mechanism for
coordinating nutrition actions in the country? (List according to importance)
1. Code
2. Code
3. Code
4. Code
5. Code
2.2 What do you perceive as the major aspects of the coordination of nutrition actions that
should be improved? (List according to importance)
1. Code
2. Code
3. Code
4. Code
5. Code

Landscape Analysis Country Assessment Tools Form 1. National level stakeholders
52
Section 3. Agency nutrition activities and policies 3.1 What specific actions, if any, does your agency/department/unit support in the area of
nutrition?
Code
3.2 Please describe your agency/department/unit actions and support at the different levels:
Level Actions and support Code
National
Provincial
District
Community
3.3 Are there any policies in your agency/department/unit that support these actions?
1 Yes
0 No
99 Don’t know
Code
If yes, please describe:
3.4 What do you feel are the important nutrition strategies and actions that should be scaled
up?
Code
3.5 How does your agency/department/unit provide this support in the area of nutrition?
Code

Landscape Analysis Country Assessment Tools Form 1. National level stakeholders
53
Section 4. Budget and funding 4.1 Could you estimate the annual budget of your agency/department/unit that is dedicated to
nutrition actions?
Current year:
Code
Last year:
Code
4.2 Approximately what percentage of your agency/department/unit total annual budget does
this represent?
Current year: % Code
Last year: % Code
4.3 What are the sources of funding for nutrition activities implemented by your
agency/department/unit?
1 %
Code
2 %
Code
3 %
Code
4 %
Code
5 %
Code
4.4 Do you feel there is adequate funding to tackle the nutrition situation in the country?
Justify.
Code
4.5 If no, do you have any specific plans or ideas for increasing funding?
Code

Landscape Analysis Country Assessment Tools Form 1. National level stakeholders
54
Section 5. Human resources for nutrition 5.1 Do you think that there are enough nutritionists at the different levels (national, regional,
district, community) in the country?
Code
5.2 If no, what do you think should be done to strengthen nutrition capacity in the country?
Code
5.3 Does your agency/department/unit have staff dedicated part-time or full-time to the
implementation of the nutrition activities?
1 Yes
0 No
99 Don’t know
Code
5.3.1 If yes, please indicate how many: and the approximate
number of staff at full-time or part-time at different levels.
Level Full-Time Code Part-Time Code
National
Provincial
District
Community
5.3.2 How many of them have degrees in nutrition (equivalent of D3)?
Code
5.4 Could you describe about any in-service, short-, or longer term training programmes that
your staff have participated in over the last two years?
Level Number of staff trained Topic of training Code
International
Regional
National
5.5 If no staff have participated in training during the two past years, why not?
Code
Landscape Analysis Country Assessment Tools Form 1. National level stakeholders
55
Section 6. Nutrition information system 6.1 What types of information/data on nutrition do you use regularly?
Code
6.2 How are these data collected and collated and by whom? Probe: surveys, routine, data, etc.
Code
6.3 How does your agency/department/unit use these data and how do you share
results/data with provincial and district levels and other stakeholders in nutrition?
Code
Section 7. Nutrition and the food price crisis 7.1 Which three groups (e.g. urban vs. rural; people who are net consumers vs. net
producers; specific regions of the country, etc.) do you perceive to be most badly affected by the rise in food prices?
1. Code
2.
3.
7.2 What actions are national/regional/local governments taking to mitigate the effects of the
crisis?
Code

Landscape Analysis Country Assessment Tools Form 1. National level stakeholders
56
Section 8. Nutrition in emergencies (e.g natural disasters) 8.1 Which groups do you perceive to be most badly affected by natural disasters?
1. Code
2.
3.
8.2 What actions are national/regional/local governments taking to mitigate the effects of emergencies?
Code
Section 9. Advocacy and scaling-up 9.1 In your experience, what information or specific messages that could facilitate working
together among nutrition partners in the country?
Code
9.2 Have you used the Millennium Development Goals (MDG) in this effort?
1 Yes
0 No
99 Don’t know
Code
If yes, please describe:
9.3 Have you used the Convention on the Rights of the Child (CRC) or UU23/2002 in this
effort?
1 Yes
0 No
99 Don’t know
Code
If yes, please describe:
9.4 Have you used any other advocacy tools/presentations?
1 Yes
0 No
99 Don’t know
Code
If yes, please describe:
9.5 Which type of intervention or support could your agency/department/unit provide to
support scaling-up of nutrition actions?
1. Code

Landscape Analysis Country Assessment Tools Form 1. National level stakeholders
57
2. Code
3. Code
9.6 If your agency/department/unit could do only one thing at scale to improve nutrition –
what would that be?
Code
Section 10. Concluding questions 10.1 In your opinion, what are the top three priority needs of this province in order to
accelerate reduction of malnutrition? Do NOT prompt for options listed, rank as mentioned by interviewee
Rank (1, 2, 3) Code
Human resources (more staff, better salaries, high staff turn over)
Training (more training, better training modules or trainers)
Supplies (better drug and supply systems)
Infrastructure (more space, better equipment)
Financial resources (larger budget, more external funding)
Others
10.2 Is there anything else that you think you should tell us to have a better understanding
about the nutrition situation in the country?
Code

Landscape Analysis Country Assessment Tools Form 2. Provincial level stakeholders
58
Form 2. Provincial level stakeholders
Semi-structured interview for government agencies and other stakeholders (e.g. UN agencies, donors, NGOs) at provincial level
ID:___
Completed by:
Code
Province:
Code
Agency:
Code
Respondents: Name: Position:
Code
Name: Position:
Code
Name: Position:
Code
Date of
visit
d d m m y y y y

Landscape Analysis Country Assessment Tools Form 2. Provincial level stakeholders
59
Section 1. Nutrition situation and priorities 1.1 What do you perceive as the three major nutrition problems in your province?
(List according to importance)
1. Code
2. Code
3. Code
1.2 Do you feel these identified problems are adequately addressed in the national or any
provincial nutrition policy, strategy and/or action plan?
1 Yes
0 No
99 Don’t know
Code
Justify:
1.3 What do you perceive as the most important causes of these nutrition problems?
(List according to importance)
1. Code
2. Code
3. Code
1.4 What do you perceive as the major barriers for scaling-up nutrition actions? (List according to
importance)
1. Code
2. Code
3. Code
1.5 What do you perceive as the major opportunities for scaling-up nutrition actions? (List
according to importance)
1. Code

Landscape Analysis Country Assessment Tools Form 2. Provincial level stakeholders
60
2. Code
3. Code
Section 2. Nutrition coordination system 2.1 What do you perceive as the major strengths of the current system/mechanism for
coordinating nutrition actions in your province? (List according to importance)
1. Code
2. Code
3. Code
4. Code
5. Code
2.2 What do you perceive as the major aspects of the coordination of nutrition actions that
should be improved? (List according to importance)
1. Code
2. Code
3. Code
4. Code
5. Code

Landscape Analysis Country Assessment Tools Form 2. Provincial level stakeholders
61
Section 3. Agency nutrition activities and policies 3.1 What specific actions, if any, does your agency/department/unit support in the area of
nutrition?
Code
3.2 Please describe your agency/department/unit actions and support at the different levels:
Level Actions and support Code
Provincial
District
Community
3.3 Are there any policies in your agency/department/unit that support these actions?
1 Yes
0 No
99 Don’t know
Code
If yes, please describe:
3.4 What do you feel are the important nutrition strategies and actions that should be scaled
up?
Code
3.5 How does your agency/department/unit provide this support in the area of nutrition?
Code
Section 4. Budget and funding 4.1 Could you estimate the annual budget of your agency/department/unit that is dedicated to
nutrition actions?
Current year:
Code
Last year:
Code

Landscape Analysis Country Assessment Tools Form 2. Provincial level stakeholders
62
4.2 Approximately what percentage of your agency’s total annual budget does this represent?
Current year:
Code
Last year:
Code
4.3 What are the sources of funding for nutrition activities implemented by your agency?
1 %
Code
2 %
Code
3 %
Code
4 %
Code
5 %
Code
4.4 Do you feel there is adequate funding to tackle the nutrition situation of your province?
Justify.
Code
4.5 If no, do you have any specific plans or ideas for increasing funding?
Code
Section 5. Human resources for nutrition 5.1 Do you think that there are enough nutritionists at your institution?
Code
5.2 If no, what do you think should be done to strengthen nutrition capacity in your institution?
Code

Landscape Analysis Country Assessment Tools Form 2. Provincial level stakeholders
63
5.3 Does your agency/department/unit have staff dedicated part-time or full-time to the implementation of the nutrition activities?
1 Yes
0 No
99 Don’t know
Code
5.3.1 If yes, please indicate how many: and the approximate
number of staff at full-time or half-time at different levels.
Level Full-Time Code Part-Time Code
National
Provincial
District
Community
5.3.2 How many of them have degrees in nutrition D3?
Code
5.4 Do you think that there are enough nutritionists at the different levels (provincial, district,
community) in your province?
Code
5.5 If no, what do you think should be done to strengthen nutrition capacity in your province?
Code
5.6 Could you describe about any in-service, short-, or longer term training programmes that
your staff have participated in over the last two years?
Level Number of staff trained Topic of training Code
International
Regional
National
5.7 If no staff have participated in training during the two past years, why not?
Code

Landscape Analysis Country Assessment Tools Form 2. Provincial level stakeholders
64
Section 6. Nutrition information system 6.1 What types of information/data on nutrition do you use regularly?
Code
6.2 How are these data collected and collated and by whom? Probe: surveys, routine, data, etc.
Code
6.3 How does your agency/department/unit use these data and how do you share
results/data with other stakeholders in nutrition??
Code
Section 7. Nutrition and the food price crisis 7.1 Which three groups (e.g. urban vs. rural; people who are net consumers vs. net
producers; specific regions of the country, etc.) do you perceive to be most badly affected by the rise in food prices in your province?
1. Code
2.
3.
7.2 What actions are national/regional/local governments taking to mitigate the effects of the
crisis in your province?
Code
Section 8. Nutrition in emergencies (natural disasters) 8.1 Which groups do you perceive to be most badly affected by natural disasters?
1. Code
2.
3.
Landscape Analysis Country Assessment Tools Form 2. Provincial level stakeholders
65
8.2 What actions are national/regional/local governments taking to mitigate the effects of emergencies?
Code
Section 9. Advocacy and scaling-up 9.1 In your experience, what information or specific messages that could facilitate working
together among nutrition partners in your province?
Code
9.2 Have you used the Millennium Development Goals (MDG) in this effort?
1 Yes
0 No
99 Don’t know
Code
If yes, please describe:
9.3 Have you used the UU 23/2002 in this effort?
1 Yes
0 No
99 Don’t know
Code
If yes, please describe:
9.4 Have you used any other advocacy tools/presentations, such as “PROFILES”?
1 Yes
0 No
99 Don’t know
Code
If yes, please describe:
9.5 Which type of intervention or support could your agency/department/unit provide to
support scaling-up of nutrition actions?
1. Code
2. Code
3. Code
Landscape Analysis Country Assessment Tools Form 2. Provincial level stakeholders
66
9.6 If your agency/department/unit could do only one thing at scale to improve nutrition – what would that be?
Code
Section 10. Concluding questions 10.1 In your opinion, what are the top three priority needs of this province in order to
accelerate reduction of malnutrition? Do NOT prompt for options listed, rank as mentioned by interviewee
Rank (1, 2, 3) Code
Human resources (more staff, better salaries, high staff turn over)
Training (more training, better training modules or trainers)
Supplies (better drug and supply systems)
Infrastructure (more space, better equipment)
Financial resources (larger budget, more external funding)
Others
10.2 Is there anything else that you think you should tell us to have a better understanding
about the nutrition situation in your province?
Code
Landscape Analysis Country Assessment Tools Form 3. District level management staff
67
Form 3. District level management staff Semi-structured interview
ID:___
Completed by:
Code
Province:
Code
District:
Code
District office: 1 District Department of Health 2 District Department of Food and Agriculture 3 District Department of Women and Child Welfare 77 Other:
Code
Respondent: 1 District manager 2 Nutrition programme officer 3 Maternal-Child Health programme officer 4 Community Health Worker 5 Volunteers / Lay counsellors 77 Other: _____________________________
Code
Date of
visit
d d m m y y y Y

Landscape Analysis Country Assessment Tools Form 3. District level management staff
68
Section 1. Nutrition programme and activities 1.1 Which key nutrition activities are included in the current district action plan?
Code
1.2 What community based nutrition related activities are implemented in your district to
promote
1.2.1 Maternal nutrition : Code
1.2.2 Breastfeeding:
Code
1.2.3 Complementary feeding (including distribution of fortified foods):
Code
1.2.4 Prevention of micronutrient deficiencies (e.g vitamin A among children and post-partum women, MMN for pregnant women and children, salt iodization):
Code
1.2.5 Identification and management of severe or moderate malnutrition:
1.2.6 Prevention and care for children with diarrhoea:
1.2.7 Breastfeeding in the context of HIV/AIDS:
1.2.8 Healthy eating and physical activity to prevent overweight:
1.2.9 Prevention of intestinal parasites for children and pregnant women (e.g. hygiene promotion, deworming)

Landscape Analysis Country Assessment Tools Form 3. District level management staff
69
1.2.10 Prevention of malaria for children and pregnant women (e.g. intermittent treatment, bednet)
1.2.11 Prevention of communicable diseases for children and women (immunization)
1.2.12 Family planning
1.2.13 Other:
1.3 Which three groups (e.g. urban vs. rural; people who are net consumers vs. net
producers; specific regions, etc.) do you perceive to be most badly affected by the rise in food prices in your district?
1. Code
2.
3.
1.4 What actions are national/regional/local governments taking to mitigate the effects of the
crisis in your district?
Code
1.5 In what ways does the district enforce the International Code of Marketing of Breast-milk
Substitutes?
Code
1.6 How many facilities in the district are certified BFHI (Baby-Friendly Hospital Initiative)?
Code
1.7 How many facilities are preparing to become certified BFHI?
Code
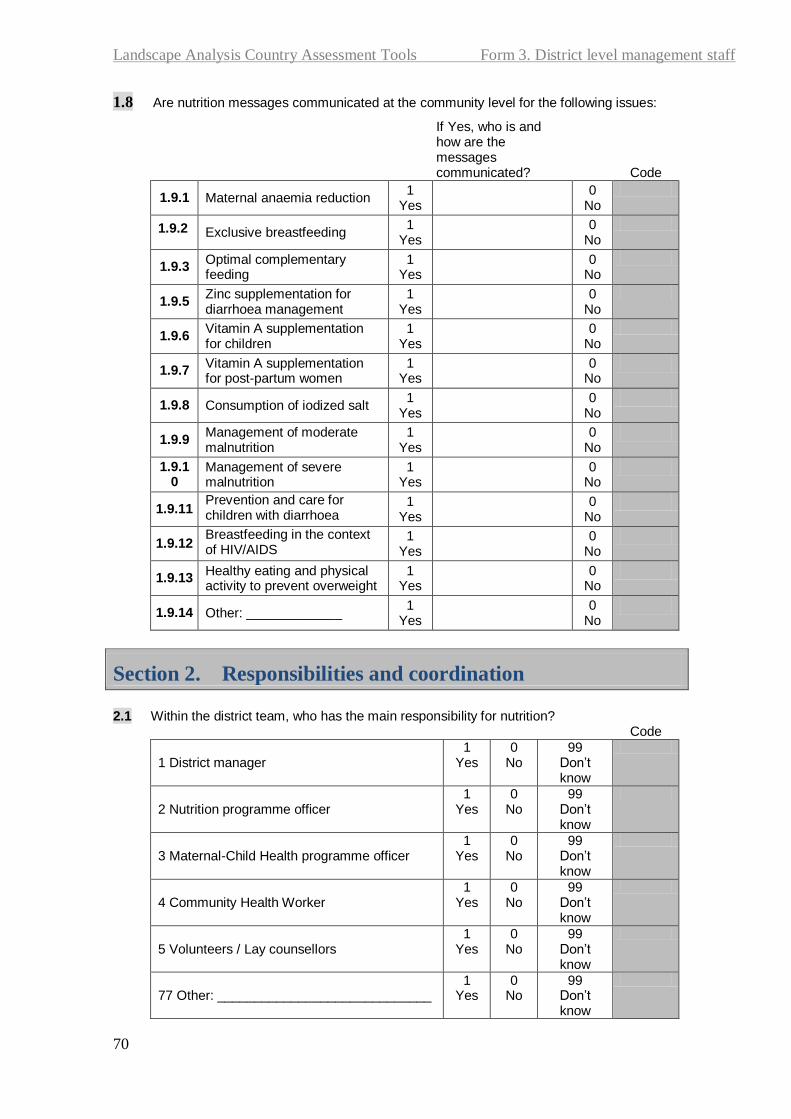
Landscape Analysis Country Assessment Tools Form 3. District level management staff
70
1.8 Are nutrition messages communicated at the community level for the following issues:
If Yes, who is and how are the messages communicated?
Code
1.9.1 Maternal anaemia reduction 1
Yes
0 No
1.9.2 Exclusive breastfeeding 1
Yes
0 No
1.9.3 Optimal complementary feeding
1 Yes
0
No
1.9.5 Zinc supplementation for diarrhoea management
1 Yes
0
No
1.9.6 Vitamin A supplementation for children
1 Yes
0
No
1.9.7 Vitamin A supplementation for post-partum women
1 Yes
0
No
1.9.8 Consumption of iodized salt 1
Yes
0 No
1.9.9 Management of moderate malnutrition
1 Yes
0
No
1.9.10
Management of severe malnutrition
1 Yes
0
No
1.9.11 Prevention and care for children with diarrhoea
1 Yes
0
No
1.9.12 Breastfeeding in the context of HIV/AIDS
1 Yes
0
No
1.9.13 Healthy eating and physical activity to prevent overweight
1 Yes
0
No
1.9.14 Other: _____________ 1
Yes
0 No
Section 2. Responsibilities and coordination
2.1 Within the district team, who has the main responsibility for nutrition?
Code
1 District manager 1
Yes 0
No 99
Don’t know
2 Nutrition programme officer 1
Yes 0
No 99
Don’t know
3 Maternal-Child Health programme officer 1
Yes 0
No 99
Don’t know
4 Community Health Worker 1
Yes 0
No 99
Don’t know
5 Volunteers / Lay counsellors 1
Yes 0
No 99
Don’t know
77 Other: _____________________________ 1
Yes 0
No 99
Don’t know
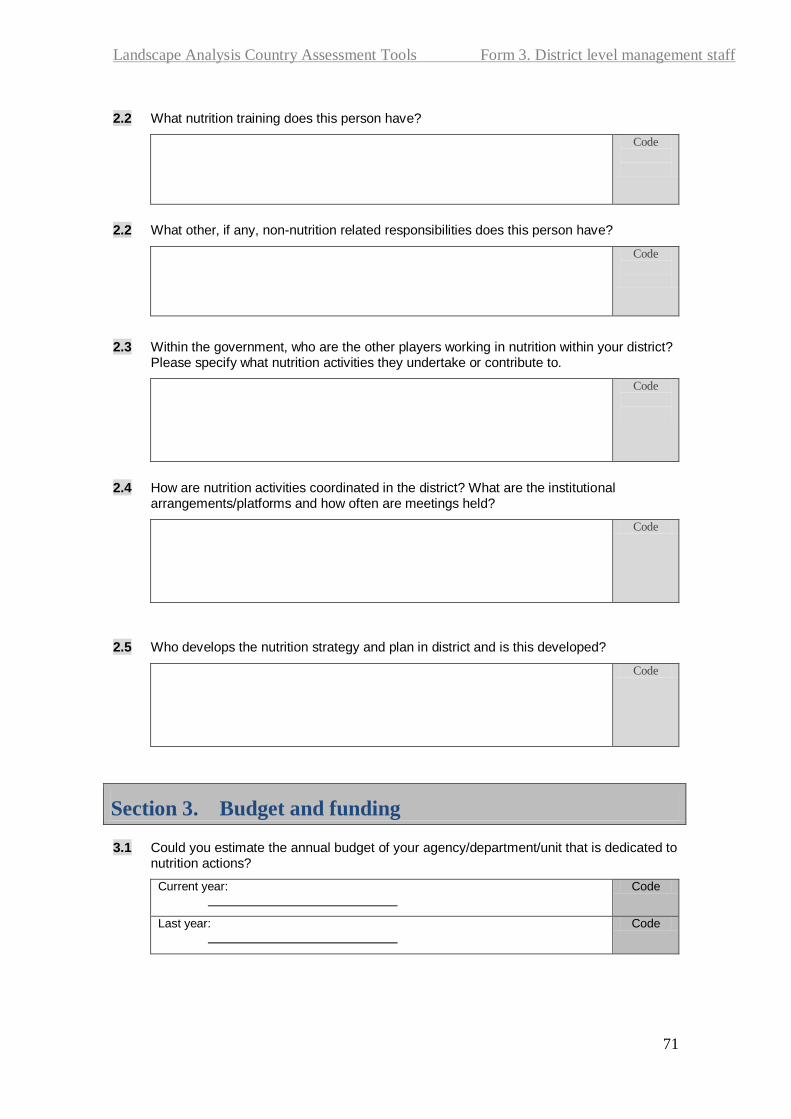
Landscape Analysis Country Assessment Tools Form 3. District level management staff
71
2.2 What nutrition training does this person have?
Code
2.2 What other, if any, non-nutrition related responsibilities does this person have?
Code
2.3 Within the government, who are the other players working in nutrition within your district? Please specify what nutrition activities they undertake or contribute to.
Code
2.4 How are nutrition activities coordinated in the district? What are the institutional
arrangements/platforms and how often are meetings held?
Code
2.5 Who develops the nutrition strategy and plan in district and is this developed?
Code
Section 3. Budget and funding 3.1 Could you estimate the annual budget of your agency/department/unit that is dedicated to
nutrition actions?
Current year:
Code
Last year:
Code

Landscape Analysis Country Assessment Tools Form 3. District level management staff
72
3.2 Approximately what percentage of your agency’s total annual budget does this represent?
Current year:
Code
Last year:
Code
3.3 What are the sources of funding for nutrition activities implemented by your agency?
1 %
Code
2 %
Code
3 %
Code
4 %
Code
5 %
Code
3.4 Do you feel there is adequate funding to tackle the nutrition situation of your province? Justify.
Code
3.5 If no, do you have any specific plans or ideas for increasing funding?
Code
Section 4. Human resources for nutrition 4.1 Do you think that there are enough nutritionists at your institution?
Code
4.2 If no, what do you think should be done to strengthen nutrition capacity in your institution?
Code
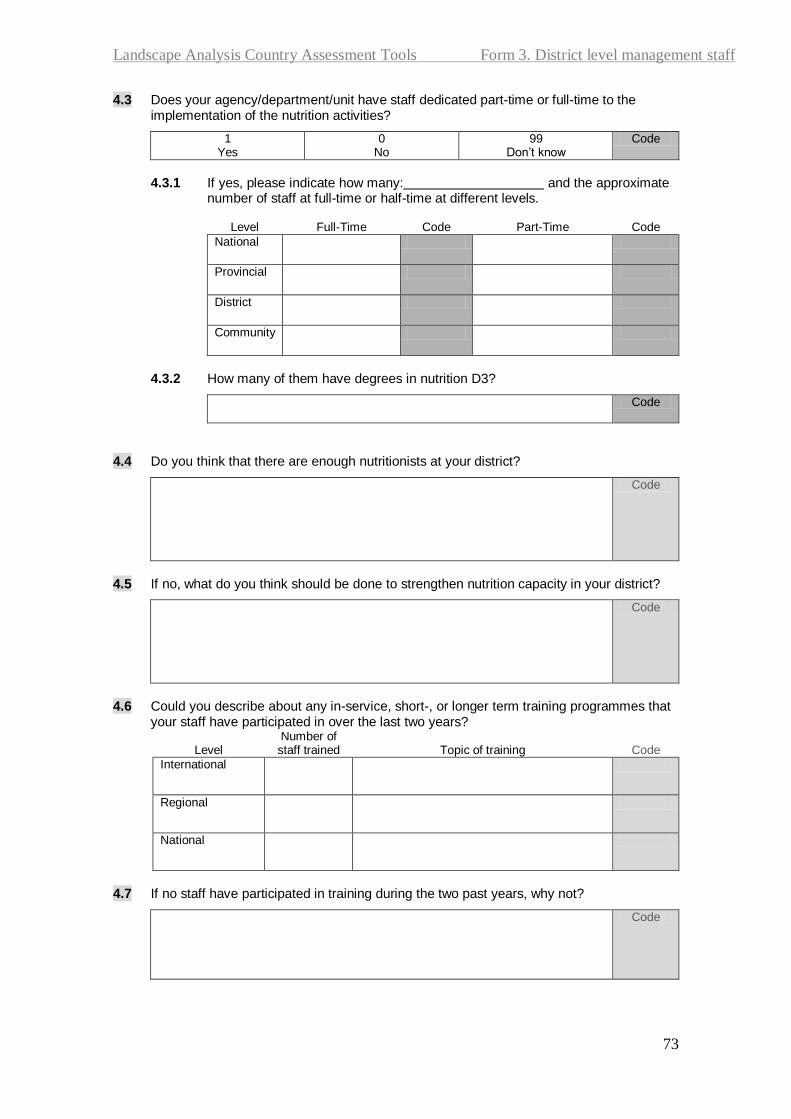
Landscape Analysis Country Assessment Tools Form 3. District level management staff
73
4.3 Does your agency/department/unit have staff dedicated part-time or full-time to the implementation of the nutrition activities?
1 Yes
0 No
99 Don’t know
Code
4.3.1 If yes, please indicate how many: and the approximate
number of staff at full-time or half-time at different levels.
Level Full-Time Code Part-Time Code
National
Provincial
District
Community
4.3.2 How many of them have degrees in nutrition D3?
Code
4.4 Do you think that there are enough nutritionists at your district?
Code
4.5 If no, what do you think should be done to strengthen nutrition capacity in your district?
Code
4.6 Could you describe about any in-service, short-, or longer term training programmes that
your staff have participated in over the last two years?
Level Number of staff trained Topic of training Code
International
Regional
National
4.7 If no staff have participated in training during the two past years, why not?
Code

Landscape Analysis Country Assessment Tools Form 3. District level management staff
74
Section 5. Training
5.1 What nutrition related training have there been in your district in the past two years?
A. Trainings (title, organizing institution)
B. Participants (number of participants and their
affiliations) Code
5.2 How is training monitored or followed-up? Probe for existence of refresher training and on site
training
Describe:
Code
Section 6. Information management systems 6.1 What are the most important nutrition indicators that are routinely collected and/or
collated at district level?
Code
6.2 How do you use this information?
Code
6.3 Have you ever received feedback on the information on nutrition that you send to the
provincial or national level?
1 Yes
0 No
99 Don’t know
Code

Landscape Analysis Country Assessment Tools Form 3. District level management staff
75
6.4 If yes, is this feedback useful? And how do you use this feedback?
Code
Section 7. Management systems, supervision and support
7.1 How often does the person in charge of nutrition get to visit facilities and/or communities
to provide nutrition programme support?
1 Everyday
2 Every week
3 Every month
4 Less often
Code
7.2 In relation to nutrition activities, how does the district office communicate
7.2.1 With partners (government and non-government) in the district:
Code
7.2.2 With the provincial or national office:
Code
7.3 What support has your district received during the last two years to enable the nutrition team to undertake nutrition programming, planning and implementation?
Probe for training, budget support, research, dialogue, field visits.
Code
Section 8. Concluding questions
81 In your opinion, what are the top three priority needs of your District in order to accelerate
reduction of malnutrition? Do NOT prompt for options listed, rank as mentioned by interviewee
Rank (1, 2, 3) Code
Human resources (more staff, better salaries, high staff turn over)
Training (more training, better training modules or trainers)
Supplies (better drug and supply systems)
Infrastructure (more space, better equipment)
Financial resources (larger budget, more external funding)
Others

Landscape Analysis Country Assessment Tools Form 3. District level management staff
76
8.2 Is there anything else that you think you should tell us to have a better understanding about nutrition situation in the district?
Code
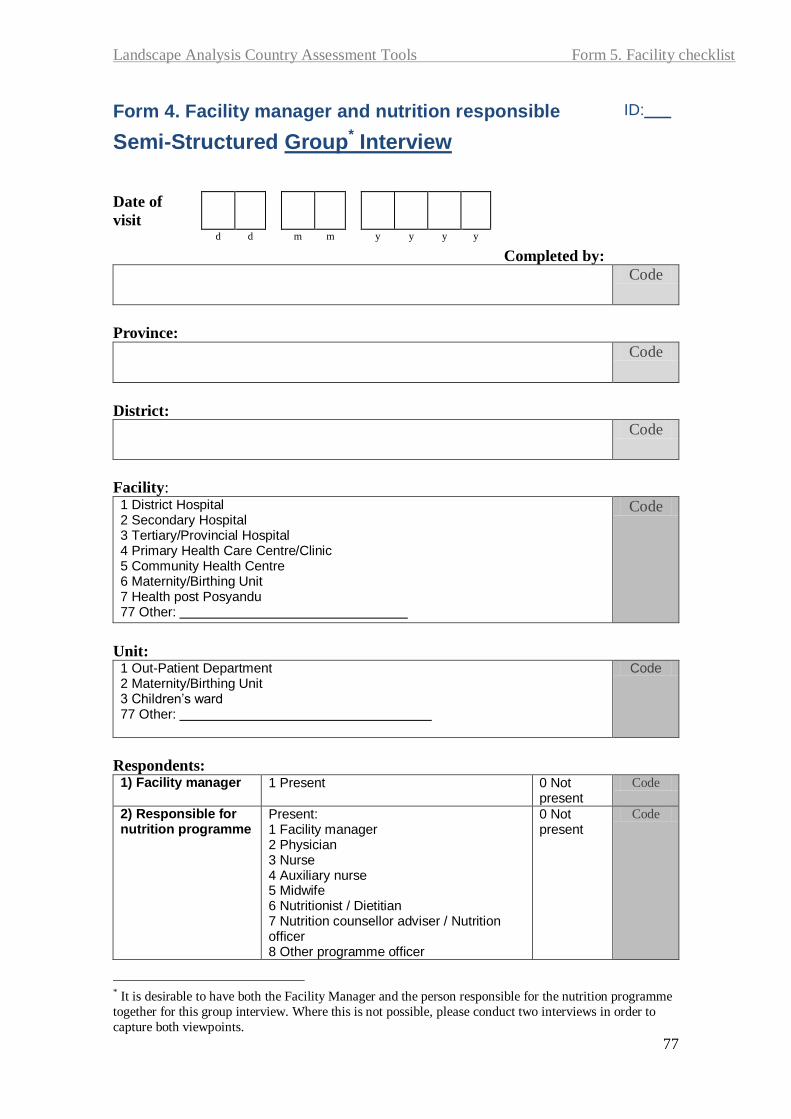
Landscape Analysis Country Assessment Tools Form 5. Facility checklist
77
Form 4. Facility manager and nutrition responsible
Semi-Structured Group* Interview
ID:___
Completed by:
Code
Province:
Code
District:
Code
Facility: 1 District Hospital 2 Secondary Hospital 3 Tertiary/Provincial Hospital 4 Primary Health Care Centre/Clinic 5 Community Health Centre 6 Maternity/Birthing Unit 7 Health post Posyandu 77 Other:
Code
Unit: 1 Out-Patient Department 2 Maternity/Birthing Unit 3 Children’s ward 77 Other:
Code
Respondents: 1) Facility manager 1 Present 0 Not
present Code
2) Responsible for nutrition programme
Present: 1 Facility manager 2 Physician 3 Nurse 4 Auxiliary nurse 5 Midwife 6 Nutritionist / Dietitian 7 Nutrition counsellor adviser / Nutrition officer 8 Other programme officer
0 Not present
Code
* It is desirable to have both the Facility Manager and the person responsible for the nutrition programme
together for this group interview. Where this is not possible, please conduct two interviews in order to
capture both viewpoints.
Date of
visit
d d m m y y y y
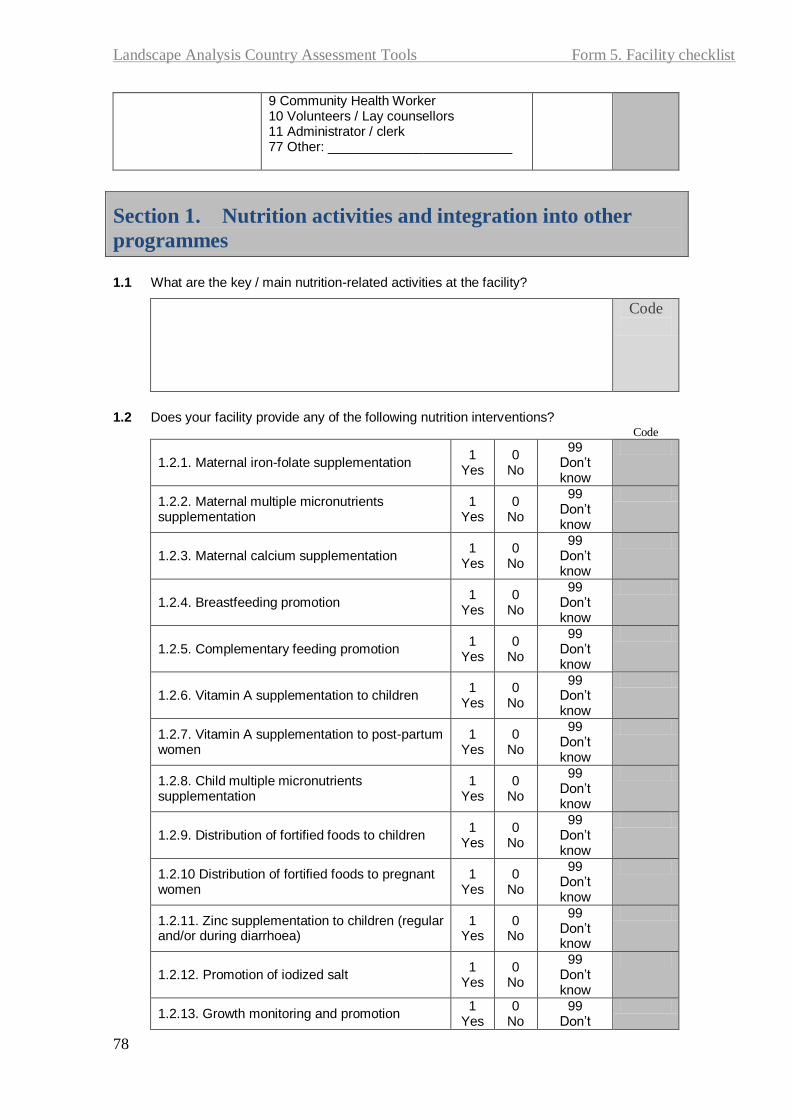
Landscape Analysis Country Assessment Tools Form 5. Facility checklist
78
9 Community Health Worker 10 Volunteers / Lay counsellors 11 Administrator / clerk 77 Other: _________________________
1.1 What are the key / main nutrition-related activities at the facility?
Code
1.2 Does your facility provide any of the following nutrition interventions?
Code
1.2.1. Maternal iron-folate supplementation 1
Yes 0
No
99 Don’t know
1.2.2. Maternal multiple micronutrients supplementation
1 Yes
0 No
99 Don’t know
1.2.3. Maternal calcium supplementation 1
Yes 0
No
99 Don’t know
1.2.4. Breastfeeding promotion 1
Yes 0
No
99 Don’t know
1.2.5. Complementary feeding promotion 1
Yes 0
No
99 Don’t know
1.2.6. Vitamin A supplementation to children 1
Yes 0
No
99 Don’t know
1.2.7. Vitamin A supplementation to post-partum women
1 Yes
0 No
99 Don’t know
1.2.8. Child multiple micronutrients supplementation
1 Yes
0 No
99 Don’t know
1.2.9. Distribution of fortified foods to children 1
Yes 0
No
99 Don’t know
1.2.10 Distribution of fortified foods to pregnant women
1 Yes
0 No
99 Don’t know
1.2.11. Zinc supplementation to children (regular and/or during diarrhoea)
1 Yes
0 No
99 Don’t know
1.2.12. Promotion of iodized salt 1
Yes 0
No
99 Don’t know
1.2.13. Growth monitoring and promotion 1
Yes 0
No 99
Don’t
Section 1. Nutrition activities and integration into other
programmes

Landscape Analysis Country Assessment Tools Form 5. Facility checklist
79
know
1.2.14. Management of moderate malnutrition 1
Yes 0
No
99 Don’t know
1.2.15. Management of severe malnutrition 1
Yes 0
No
99 Don’t know
1.2.16. Feeding of the sick child 1
Yes 0
No
99 Don’t know
1.2.17. Hand washing promotion 1
Yes 0
No
99 Don’t know
1.2.18. Deworming (children or pregnant mothers)
1 Yes
0 No
99 Don’t know
1.2.19. Promotion of insecticide-treated bednets 1
Yes 0
No
99 Don’t know
1.2.20 Presumptive treatment for pregnant women for malaria
1 Yes
0 No
99 Don’t know
1.2.21. Breastfeeding in the context of HIV/AIDS 1
Yes 0
No
99 Don’t know
1.2.22.Healthy eating and physical activity for prevention of overweight
1 Yes
0 No
99 Don’t know
1.2.23 Family planning 1
Yes 0
No
99 Don’t know
1.2..24. Other: __________________________ 1
Yes 0
No
99 Don’t know
1.3 How is nutrition integrated into other primary health care programs or activities?
Probe: How nutrition is integrated into IMCI, maternal health, adolescent health, HIV/AIDS, etc.
Code
1.4 Describe how nutrition education takes place in the health centery
Probe: Who is responsible, when and where does it take place
Code
1.5 How do you think nutrition could be improved at the health center?
Code
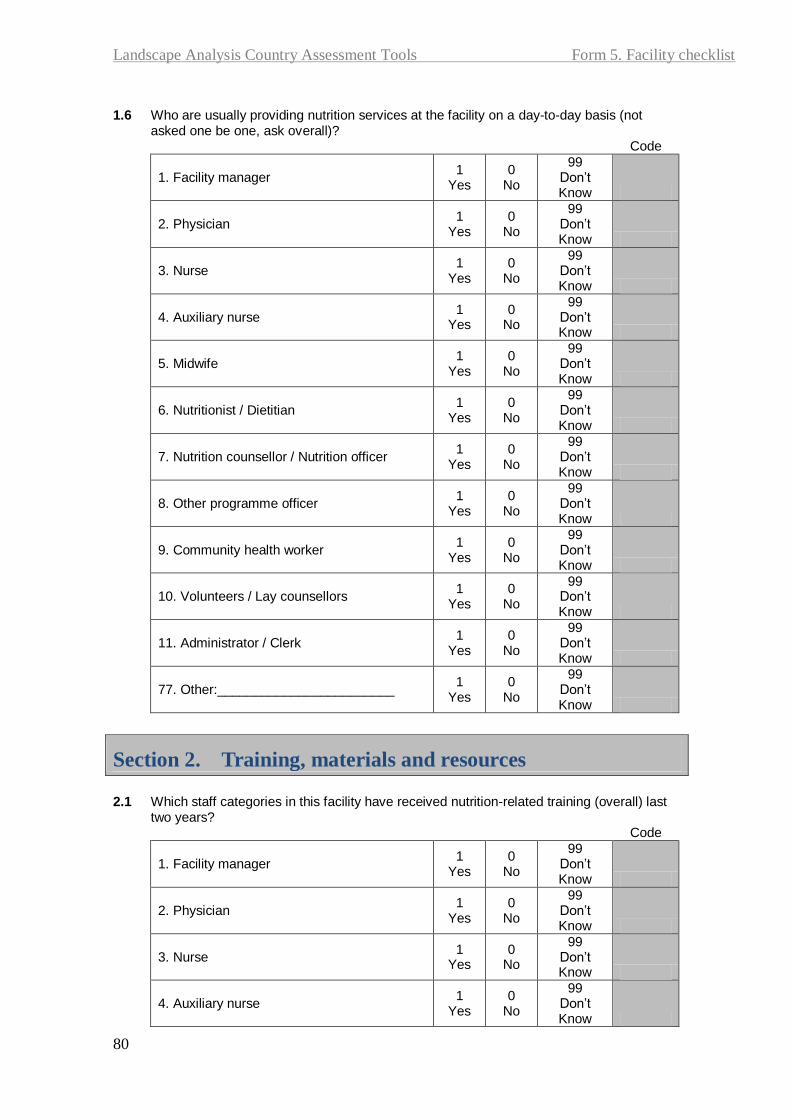
Landscape Analysis Country Assessment Tools Form 5. Facility checklist
80
1.6 Who are usually providing nutrition services at the facility on a day-to-day basis (not
asked one be one, ask overall)? Code
1. Facility manager 1
Yes 0
No
99 Don’t Know
2. Physician 1
Yes 0
No
99 Don’t Know
3. Nurse 1
Yes 0
No
99 Don’t Know
4. Auxiliary nurse 1
Yes 0
No
99 Don’t Know
5. Midwife 1
Yes 0
No
99 Don’t Know
6. Nutritionist / Dietitian 1
Yes 0
No
99 Don’t Know
7. Nutrition counsellor / Nutrition officer 1
Yes 0
No
99 Don’t Know
8. Other programme officer 1
Yes 0
No
99 Don’t Know
9. Community health worker 1
Yes 0
No
99 Don’t Know
10. Volunteers / Lay counsellors 1
Yes 0
No
99 Don’t Know
11. Administrator / Clerk 1
Yes 0
No
99 Don’t Know
77. Other:________________________ 1
Yes 0
No
99 Don’t Know
Section 2. Training, materials and resources
2.1 Which staff categories in this facility have received nutrition-related training (overall) last
two years? Code
1. Facility manager 1
Yes 0
No
99 Don’t Know
2. Physician 1
Yes 0
No
99 Don’t Know
3. Nurse 1
Yes 0
No
99 Don’t Know
4. Auxiliary nurse 1
Yes 0
No
99 Don’t Know

Landscape Analysis Country Assessment Tools Form 5. Facility checklist
81
5. Midwife 1
Yes 0
No
99 Don’t Know
6. Nutritionist / Dietitian 1
Yes 0
No
99 Don’t Know
7. Nutrition counsellor / Nutrition officer 1
Yes 0
No
99 Don’t Know
8. Other programme officer 1
Yes 0
No
99 Don’t Know
9. Community health worker 1
Yes 0
No
99 Don’t Know
10. Volunteers / Lay counsellors 1
Yes 0
No
99 Don’t Know
11. Administrator / Clerk 1
Yes 0
No
99 Don’t Know
77. Other:________________________ 1
Yes 0
No
99 Don’t Know
2.2 How many of the above staff who have received nutrition training are still at the facility?
1 All
2 Most
3 Some
4 None
77 Other
99 Don’t know
Code
2.3 For each of the following areas have any of the facility staff have received training and/or
provided training to others. Code
2.3.1 Maternal nutrition 1
Received
2 Provide
d
3 Both
0 None
2.3.2 Breastfeeding counselling 1
Received
2 Provide
d
3 Both
0 None
2.3.3 Training on breastfeeding counseling
1 Receive
d
2 Provide
d
3 Both
0 None
2.3.4 Complementary feeding counselling
1 Receive
d
2 Provide
d
3 Both
0 None
2.3.5 Zinc supplementation for diarrhoea management
1 Receive
d
2 Provide
d
3 Both
0 None
2.3.6 Vitamin A supplementation for children
1 Receive
d
2 Provide
d
3 Both
0 None
2.3.7 Vitamin A supplementation for post-partum women
1 Receive
d
2 Provide
d
3 Both
0 None
2.3.8 Child multiple micronutrients supplementation
1 Receive
d
2 Provide
d
3 Both
0 None
2.3.9 Maternal micronutrients supplementation
1 Receive
2 Provide
3 Both
0 None

Landscape Analysis Country Assessment Tools Form 5. Facility checklist
82
d d
2.3.10
Growth monitoring and promotion
1 Receive
d
2 Provide
d
3 Both
0 None
2.3.11
Management of moderate malnutrition
1 Receive
d
2 Provide
d
3 Both
0 None
2.3.12
Management of severe malnutrition
1 Receive
d
2 Provide
d
3 Both
0 None
2.3.13
Prevention and care for children with diarrhoea
1 Receive
d
2 Provide
d
3 Both
0 None
2.3.14 Breastfeeding in the context of HIV/AIDS counselling
1 Receive
d
2 Provide
d
3 Both
0 None
2.3.15 Healthy eating and physical activity to prevent overweight
1 Receive
d
2 Provide
d
3 Both
0 None
2.3.16 Prevention of intestinal parasites
1 Receive
d
2 Provide
d
3 Both
0 None
2.3.17 Prevention of communicable diseases
1 Receive
d
2 Provide
d
3 Both
0 None
2.3.18 Family planning 1
Received
2 Provide
d
3 Both
0 None
2.3.19 Prevention of malaria 1
Received
2 Provide
d
3 Both
0 None
2.3.20 Other: __________________ 1
Received
2 Provide
d
3 Both
0 None
2.4 Is there any system for follow-up or monitoring of training, such as on-site or refresher
training?
1 Yes
0 No
Code
If Yes, please describe:
Section 3. Community support 3.1 How does the facility work with communities to improve: Ask one by one
Probe: role of volunteers, husbands, TBAs, community leaders etc.
3.2.1 Maternal nutrition (including distribution of fortified foods) ; Code

Landscape Analysis Country Assessment Tools Form 5. Facility checklist
83
3.2.2 Breastfeeding:
Code
3.2.3 Complementary feeding (including distribution of fortified foods): Code
1.2.4 Prevention of micronutrient deficiencies (e.g. vitamin A among children and post-partum women, MMN for pregnant women, salt iodization)
Code
1.2.5 Identification and management of moderate malnutrition
1.2.6 Identification and management of severe malnutrition:
1.2.7Prevention and care for children with diarrhoea:
1.2.8 Breastfeeding in the context of HIV/AIDS:
1.2.9 Healthy eating and physical activity to prevent overweight:
1.2.10 Prevention of intestinal parasites for children and pregnant women (e.g. hygiene promotion, deworrming):
1.2.11 Prevention of malaria for children and pregnant women (e.g. intermittent treatment, bednet):
1.2.12 Immunization for children and women:
1.2.13 Family planning

Landscape Analysis Country Assessment Tools Form 5. Facility checklist
84
1.2.10 Other:
3.2 Has the facility participated in other community beside posyandu?
Code
3.3 In your opinion, how could the community better support breastfeeding? Probe: role of volunteers, husbands, TBAs, community leaders etc.
Code
Section 4. Support 4.1 How often are meetings held with the district nutrition programme staff?
1 Everyday
2 Every week
3 Every month
4 Less often
5 Almost never
Code
4.2 Do you feel that you receive adequate support from the district/provincial nutrition
programme staff?
1 Yes
0 No
Code
4.2a If Yes, please describe:
Code
4.2b If No, why not and what could be done to improve this situation? Give specific
examples:
Code
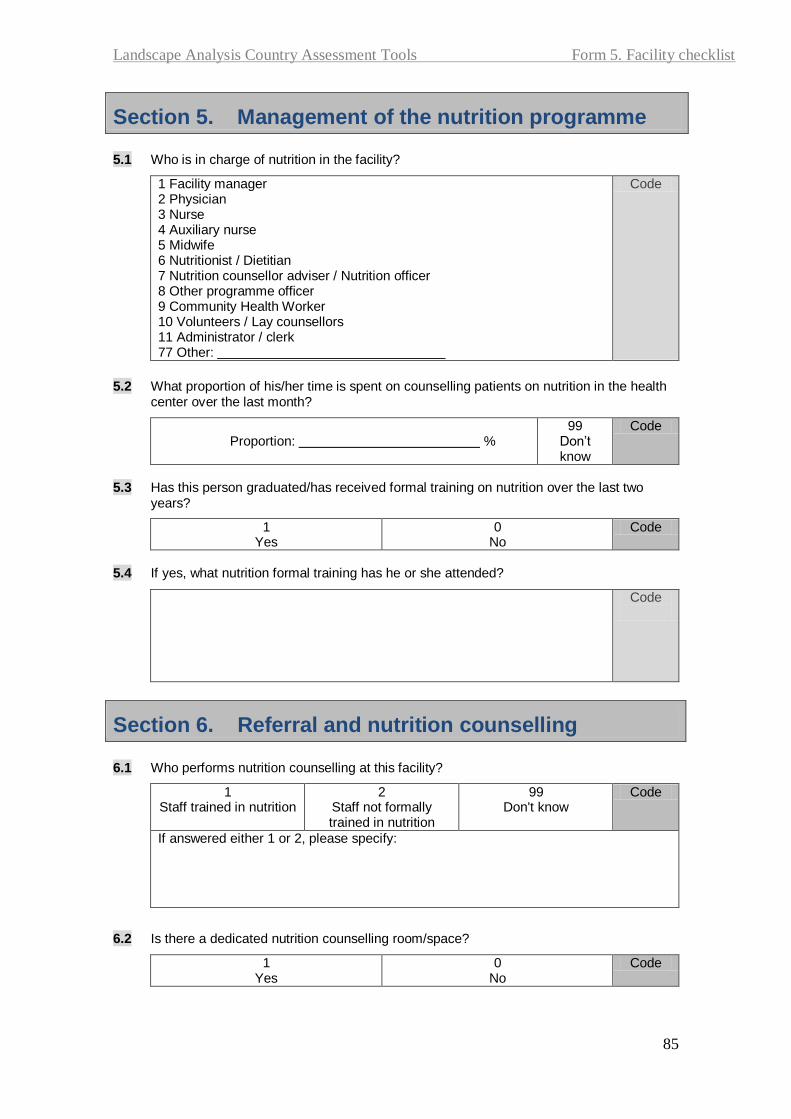
Landscape Analysis Country Assessment Tools Form 5. Facility checklist
85
Section 5. Management of the nutrition programme 5.1 Who is in charge of nutrition in the facility?
1 Facility manager 2 Physician 3 Nurse 4 Auxiliary nurse 5 Midwife 6 Nutritionist / Dietitian 7 Nutrition counsellor adviser / Nutrition officer 8 Other programme officer 9 Community Health Worker 10 Volunteers / Lay counsellors 11 Administrator / clerk 77 Other:
Code
5.2 What proportion of his/her time is spent on counselling patients on nutrition in the health
center over the last month?
Proportion: % 99
Don’t know
Code
5.3 Has this person graduated/has received formal training on nutrition over the last two
years?
1 Yes
0 No
Code
5.4 If yes, what nutrition formal training has he or she attended?
Code
Section 6. Referral and nutrition counselling 6.1 Who performs nutrition counselling at this facility?
1 Staff trained in nutrition
2 Staff not formally trained in nutrition
99 Don't know
Code
If answered either 1 or 2, please specify:
6.2 Is there a dedicated nutrition counselling room/space?
1 Yes
0 No
Code

Landscape Analysis Country Assessment Tools Form 5. Facility checklist
86
6.3 Is there a particular day in the week or month when nutrition counselling services can be booked?
1 Yes
0 No
Code
6.4 What is the average number of patients per month booked for nutrition counselling?
Code
6.5 What are the most common cases for referral?
Code
Section 7. Concluding questions 7.1 In your opinion, what are the top three priority needs of your health center in order to
accelerate reduction of malnutrition? Do NOT prompt for options listed, rank as mentioned by interviewee
Rank (1, 2, 3) Code
Human resources (more staff, better salaries, less staff turn over)
Training (more training, better training modules or trainers)
Supplies (better drug and supply systems)
Infrastructure (more space, better equipment)
Financial resources (larger budget, more external funding)
Others
7.2 Is there anything else that you would like to add regarding the nutrition services in this
health center?
Code
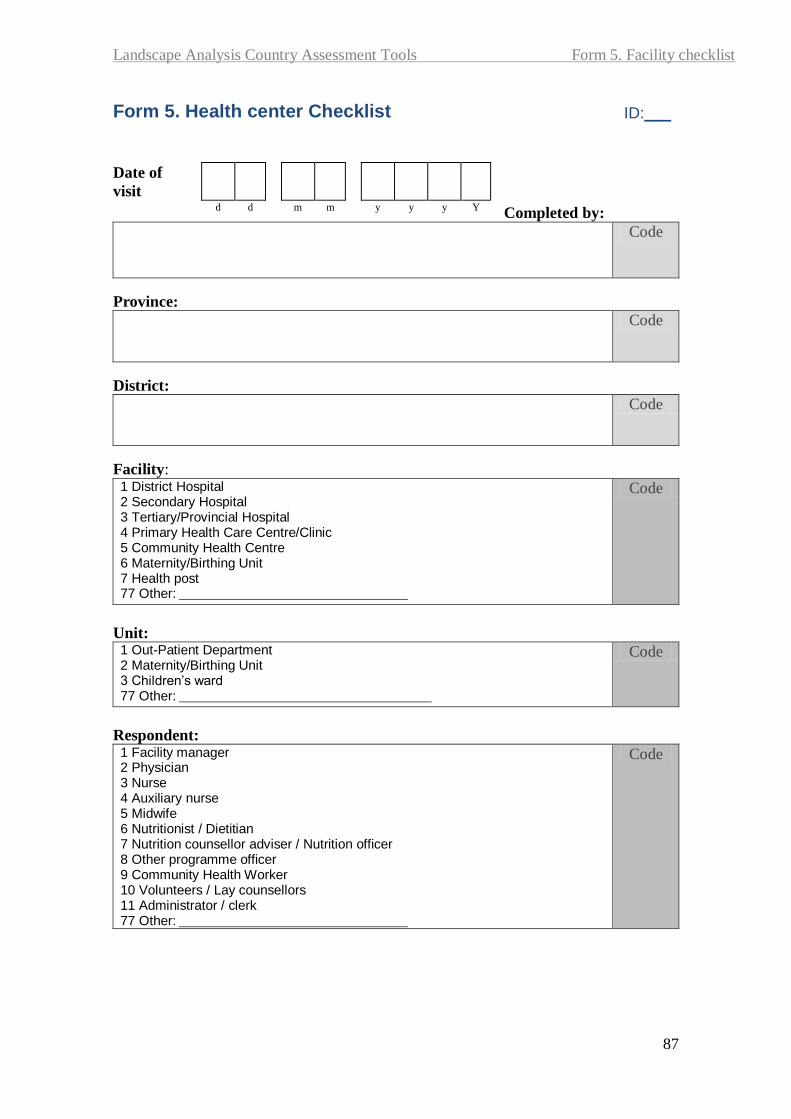
Landscape Analysis Country Assessment Tools Form 5. Facility checklist
87
Form 5. Health center Checklist ID:___
Completed by:
Code
Province:
Code
District:
Code
Facility: 1 District Hospital 2 Secondary Hospital 3 Tertiary/Provincial Hospital 4 Primary Health Care Centre/Clinic 5 Community Health Centre 6 Maternity/Birthing Unit 7 Health post 77 Other:
Code
Unit: 1 Out-Patient Department 2 Maternity/Birthing Unit 3 Children’s ward 77 Other:
Code
Respondent: 1 Facility manager 2 Physician 3 Nurse 4 Auxiliary nurse 5 Midwife 6 Nutritionist / Dietitian 7 Nutrition counsellor adviser / Nutrition officer 8 Other programme officer 9 Community Health Worker 10 Volunteers / Lay counsellors 11 Administrator / clerk 77 Other:
Code
Date of
visit
d d m m y y y Y
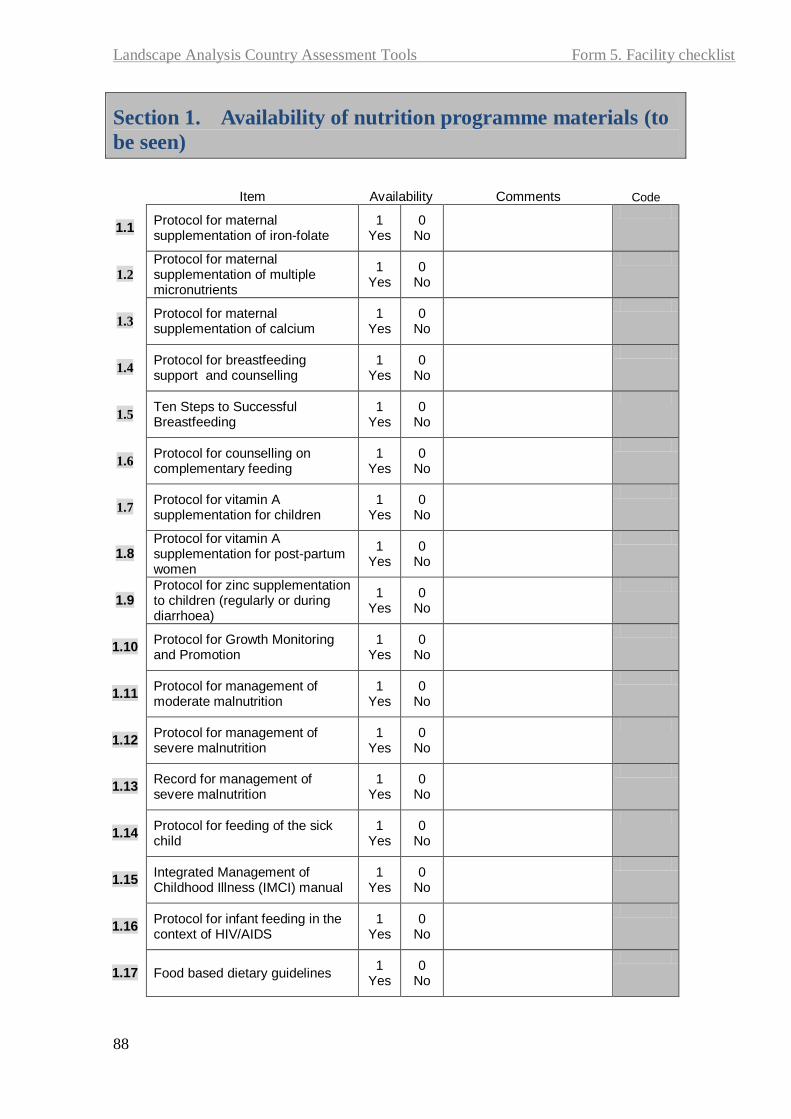
Landscape Analysis Country Assessment Tools Form 5. Facility checklist
88
Section 1. Availability of nutrition programme materials (to
be seen)
Item
Availability
Comments Code
1.1 Protocol for maternal supplementation of iron-folate
1 Yes
0 No
1.2
Protocol for maternal supplementation of multiple micronutrients
1 Yes
0 No
1.3 Protocol for maternal supplementation of calcium
1 Yes
0 No
1.4 Protocol for breastfeeding support and counselling
1 Yes
0 No
1.5 Ten Steps to Successful Breastfeeding
1 Yes
0 No
1.6 Protocol for counselling on complementary feeding
1 Yes
0 No
1.7 Protocol for vitamin A supplementation for children
1 Yes
0 No
1.8 Protocol for vitamin A supplementation for post-partum women
1 Yes
0 No
1.9 Protocol for zinc supplementation to children (regularly or during diarrhoea)
1 Yes
0 No
1.10 Protocol for Growth Monitoring and Promotion
1 Yes
0 No
1.11 Protocol for management of moderate malnutrition
1 Yes
0 No
1.12 Protocol for management of severe malnutrition
1 Yes
0 No
1.13 Record for management of severe malnutrition
1 Yes
0 No
1.14 Protocol for feeding of the sick child
1 Yes
0 No
1.15 Integrated Management of Childhood Illness (IMCI) manual
1 Yes
0 No
1.16 Protocol for infant feeding in the context of HIV/AIDS
1 Yes
0 No
1.17 Food based dietary guidelines 1
Yes 0
No

Landscape Analysis Country Assessment Tools Form 5. Facility checklist
89
1.18 Monthly health information report
1 Yes
0 No
1.20 Other:: ___________________ 1
Yes 0
No
Section 2. Availability of nutrition IEC materials (poster or
pamphlet, to be seen)
Item
Availability Comments Code
2.1 Nutrition during pregnancy 1
Yes 0
No
2.2 Reduction of maternal anaemia 1
Yes 0
No
2.3 Exclusive breastfeeding 1
Yes 0
No
2.4 Optimal complementary feeding 1
Yes 0
No
2.5 Vitamin A supplementation for children
1 Yes
0 No
2.6 Vitamin A supplementation for post-partum women
1 Yes
0 No
2.7 Zinc supplementation to children (regularly or during diarrhoea)
1 Yes
0 No
2.8 Child multiple micronutrients supplementation
1 Yes
0 No
2.9 Consumption of iodized salt 1
Yes 0
No
2.10 Buku KIA 1
Yes 0
No
2.11 Management of moderate malnutrition
1 Yes
0 No
2.12 Management of severe malnutrition
1 Yes
0 No
2.13 Feeding of the sick child 1
Yes 0
No
2.14 Hand washing 1
Yes 0
No
2.15 Deworming (children or pregnant mothers)
1 Yes
0 No
2.16 Use of insecticide-treated bednets
1 Yes
0 No
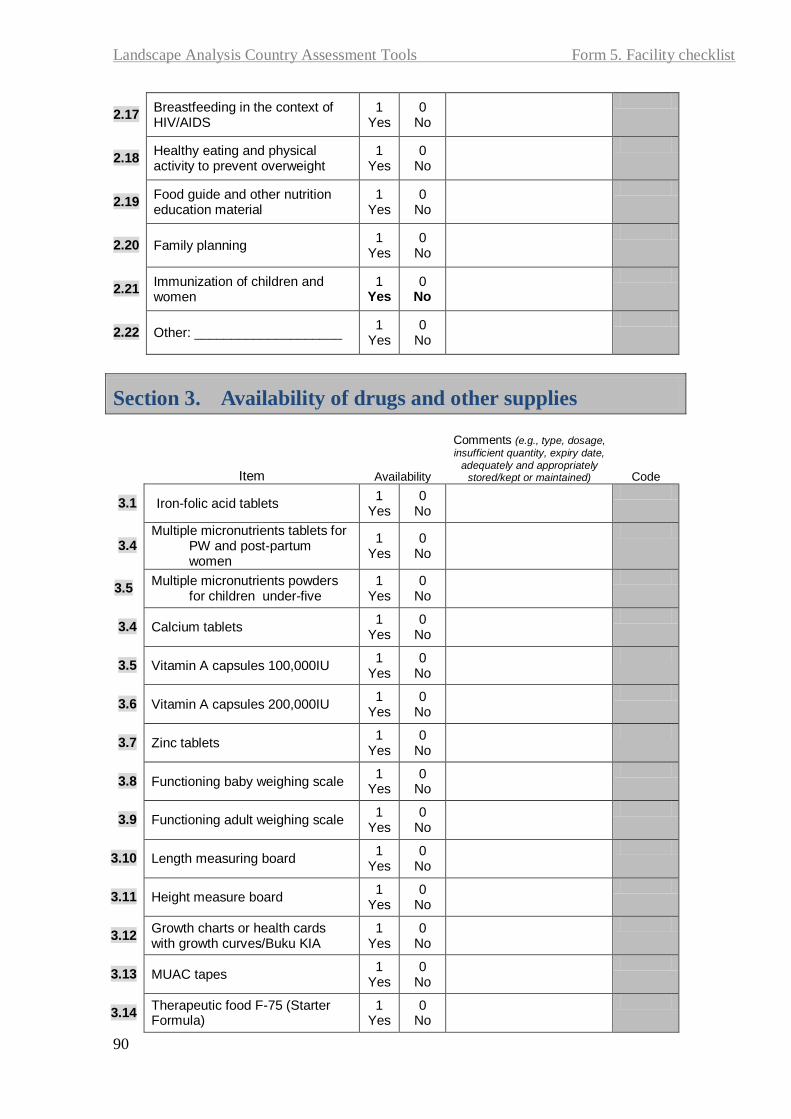
Landscape Analysis Country Assessment Tools Form 5. Facility checklist
90
2.17 Breastfeeding in the context of HIV/AIDS
1 Yes
0 No
2.18 Healthy eating and physical activity to prevent overweight
1 Yes
0 No
2.19 Food guide and other nutrition education material
1 Yes
0 No
2.20 Family planning 1
Yes 0
No
2.21 Immunization of children and women
1 Yes
0 No
2.22 Other: ____________________ 1
Yes 0
No
Section 3. Availability of drugs and other supplies
Item
Availability
Comments (e.g., type, dosage,
insufficient quantity, expiry date,
adequately and appropriately stored/kept or maintained) Code
3.1 Iron-folic acid tablets 1
Yes 0
No
3.4 Multiple micronutrients tablets for
PW and post-partum women
1 Yes
0 No
3.5 Multiple micronutrients powders
for children under-five 1
Yes 0
No
3.4 Calcium tablets 1
Yes 0
No
3.5 Vitamin A capsules 100,000IU 1
Yes 0
No
3.6 Vitamin A capsules 200,000IU 1
Yes 0
No
3.7 Zinc tablets 1
Yes 0
No
3.8 Functioning baby weighing scale 1
Yes 0
No
3.9 Functioning adult weighing scale 1
Yes 0
No
3.10 Length measuring board 1
Yes 0
No
3.11 Height measure board 1
Yes 0
No
3.12 Growth charts or health cards with growth curves/Buku KIA
1 Yes
0 No
3.13 MUAC tapes 1
Yes 0
No
3.14 Therapeutic food F-75 (Starter Formula)
1 Yes
0 No

Landscape Analysis Country Assessment Tools Form 5. Facility checklist
91
Item
Availability
Comments (e.g., type, dosage,
insufficient quantity, expiry date, adequately and appropriately
stored/kept or maintained) Code
3.15 Therapeutic food F-100 (Catch-up formula)
1 Yes
0 No
3.16 Ready-to-Use Therapuetic Food (RUTF)
1 Yes
0 No
3.17 MP-ASI porridge (biscuits and porridge)
1 Yes
0 No
3.18 Supplementary food packages (e.g., take home food pack)f
1 Yes
0 No
3.19 Oral Rehydration Solution (ORS) 1
Yes 0
No
3.20 Other: __________________ 1
Yes 0
No

Landscape Analysis Country Assessment Tools Form 6. Health worker
92
Form 6A. Health staff (Village Midwife)
Structured questionnaire interview for all clinic staff providing services to pregnant women or children
ID:___
Completed by:
Code
Province:
Code
District:
Code
Facility: 1 District Hospital 2 Secondary Hospital 3 Tertiary/Provincial Hospital 4 Primary Health Care Centre/Clinic 5 Community Health Centre 6 Maternity/Birthing Unit 7 Health post 77 Other:
Code
Unit: 1 Out-Patient Department 2 Maternity/Birthing Unit 3 Children’s ward 77 Other:
Code
Respondent: 1 Facility manager 2 Physician 3 Nurse 4 Auxiliary nurse 5 Midwife 6 Nutritionist / Dietitian 7 Nutrition counsellor adviser / Nutrition officer 8 Other programme officer 9 Community Health Worker 10 Volunteers / Lay counsellors 11 Administrator / clerk 77 Other:
Code
Date of
visit
d d m m y y y y
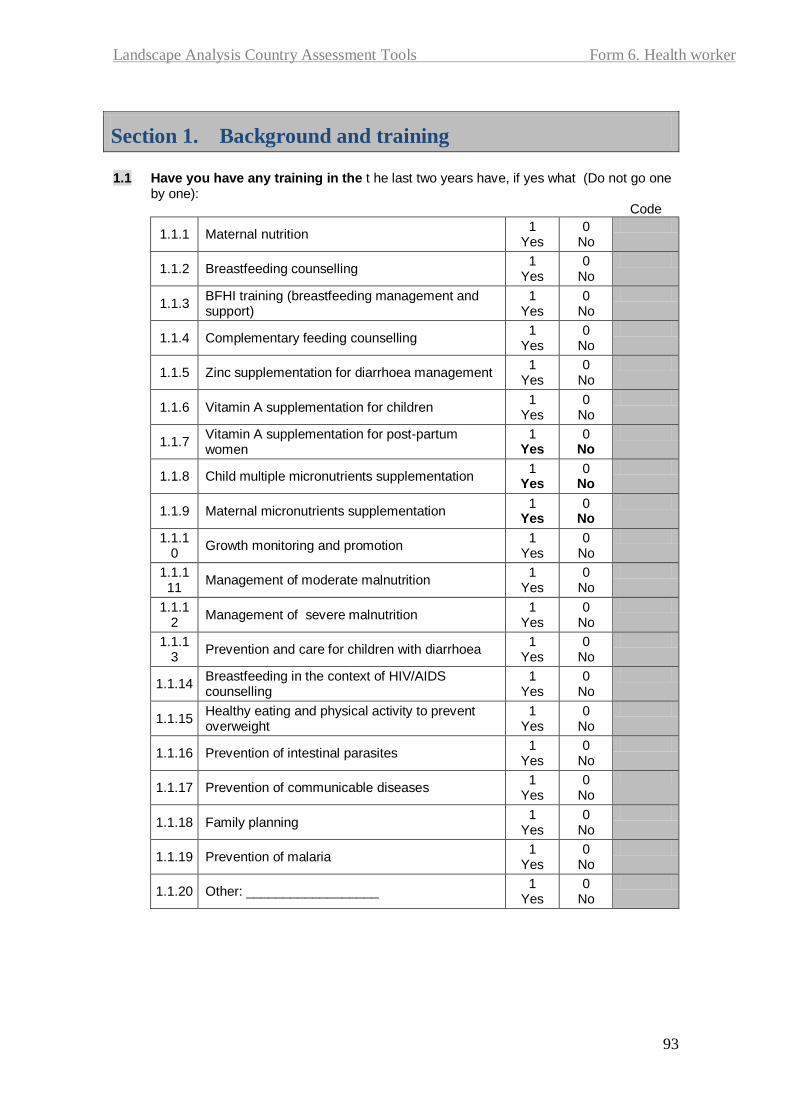
Landscape Analysis Country Assessment Tools Form 6. Health worker
93
Section 1. Background and training 1.1 Have you have any training in the t he last two years have, if yes what (Do not go one
by one): Code
1.1.1 Maternal nutrition 1
Yes 0
No
1.1.2 Breastfeeding counselling 1
Yes 0
No
1.1.3 BFHI training (breastfeeding management and support)
1 Yes
0 No
1.1.4 Complementary feeding counselling 1
Yes 0
No
1.1.5 Zinc supplementation for diarrhoea management 1
Yes 0
No
1.1.6 Vitamin A supplementation for children 1
Yes 0
No
1.1.7 Vitamin A supplementation for post-partum women
1 Yes
0 No
1.1.8 Child multiple micronutrients supplementation 1
Yes 0
No
1.1.9 Maternal micronutrients supplementation 1
Yes 0
No
1.1.10
Growth monitoring and promotion 1
Yes 0
No
1.1.111
Management of moderate malnutrition 1
Yes 0
No
1.1.12
Management of severe malnutrition 1
Yes 0
No
1.1.13
Prevention and care for children with diarrhoea 1
Yes 0
No
1.1.14 Breastfeeding in the context of HIV/AIDS counselling
1 Yes
0 No
1.1.15 Healthy eating and physical activity to prevent overweight
1 Yes
0 No
1.1.16 Prevention of intestinal parasites 1
Yes 0
No
1.1.17 Prevention of communicable diseases 1
Yes 0
No
1.1.18 Family planning 1
Yes 0
No
1.1.19 Prevention of malaria 1
Yes 0
No
1.1.20 Other: __________________ 1
Yes 0
No
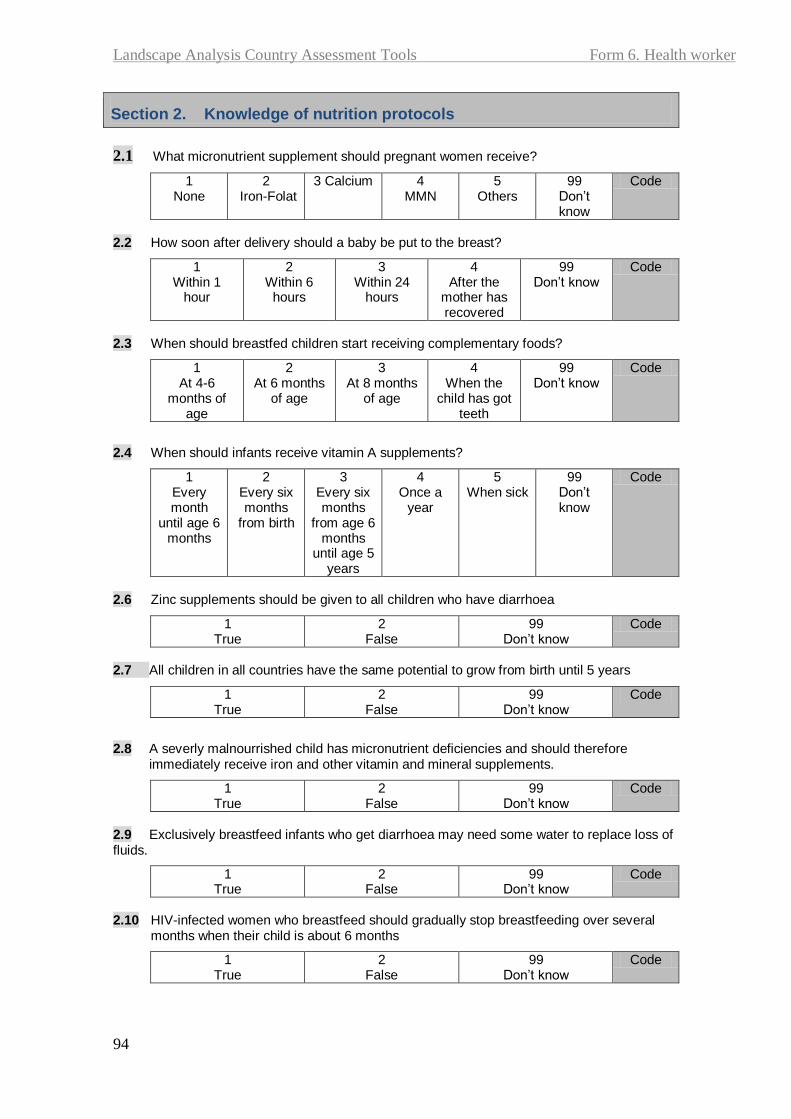
Landscape Analysis Country Assessment Tools Form 6. Health worker
94
Section 2. Knowledge of nutrition protocols
2.1 What micronutrient supplement should pregnant women receive?
1 None
2 Iron-Folat
3 Calcium 4 MMN
5 Others
99 Don’t know
Code
2.2 How soon after delivery should a baby be put to the breast?
1 Within 1
hour
2 Within 6
hours
3 Within 24
hours
4 After the
mother has recovered
99 Don’t know
Code
2.3 When should breastfed children start receiving complementary foods?
1 At 4-6
months of age
2 At 6 months
of age
3 At 8 months
of age
4 When the
child has got teeth
99 Don’t know
Code
2.4 When should infants receive vitamin A supplements?
1 Every month
until age 6 months
2 Every six months
from birth
3 Every six months
from age 6 months
until age 5 years
4 Once a
year
5 When sick
99 Don’t know
Code
2.6 Zinc supplements should be given to all children who have diarrhoea
1 True
2 False
99 Don’t know
Code
2.7 All children in all countries have the same potential to grow from birth until 5 years
1 True
2 False
99 Don’t know
Code
2.8 A severly malnourrished child has micronutrient deficiencies and should therefore immediately receive iron and other vitamin and mineral supplements.
1 True
2 False
99 Don’t know
Code
2.9 Exclusively breastfeed infants who get diarrhoea may need some water to replace loss of fluids.
1 True
2 False
99 Don’t know
Code
2.10 HIV-infected women who breastfeed should gradually stop breastfeeding over several
months when their child is about 6 months
1 True
2 False
99 Don’t know
Code
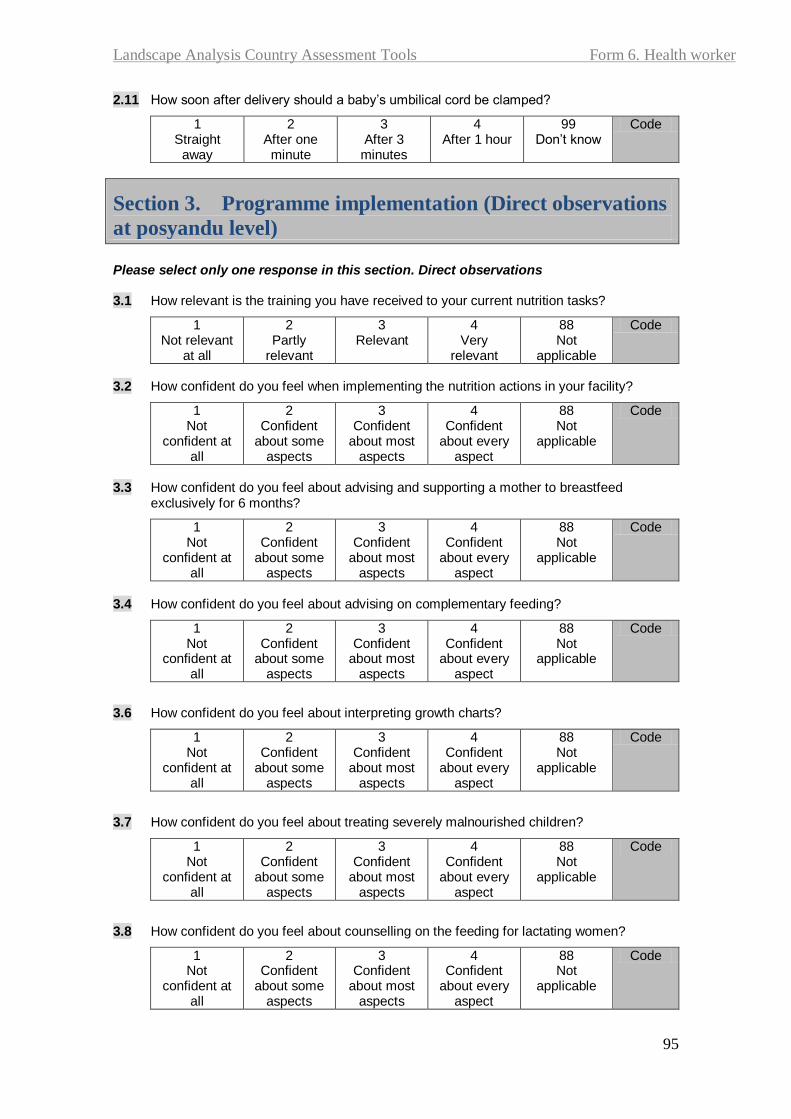
Landscape Analysis Country Assessment Tools Form 6. Health worker
95
2.11 How soon after delivery should a baby’s umbilical cord be clamped?
1 Straight
away
2 After one minute
3 After 3
minutes
4 After 1 hour
99 Don’t know
Code
Section 3. Programme implementation (Direct observations
at posyandu level) Please select only one response in this section. Direct observations 3.1 How relevant is the training you have received to your current nutrition tasks?
1 Not relevant
at all
2 Partly
relevant
3 Relevant
4 Very
relevant
88 Not
applicable
Code
3.2 How confident do you feel when implementing the nutrition actions in your facility?
1 Not
confident at all
2 Confident
about some aspects
3 Confident
about most aspects
4 Confident
about every aspect
88 Not
applicable
Code
3.3 How confident do you feel about advising and supporting a mother to breastfeed
exclusively for 6 months?
1 Not
confident at all
2 Confident
about some aspects
3 Confident
about most aspects
4 Confident
about every aspect
88 Not
applicable
Code
3.4 How confident do you feel about advising on complementary feeding?
1 Not
confident at all
2 Confident
about some aspects
3 Confident
about most aspects
4 Confident
about every aspect
88 Not
applicable
Code
3.6 How confident do you feel about interpreting growth charts?
1 Not
confident at all
2 Confident
about some aspects
3 Confident
about most aspects
4 Confident
about every aspect
88 Not
applicable
Code
3.7 How confident do you feel about treating severely malnourished children?
1 Not
confident at all
2 Confident
about some aspects
3 Confident
about most aspects
4 Confident
about every aspect
88 Not
applicable
Code
3.8 How confident do you feel about counselling on the feeding for lactating women?
1 Not
confident at all
2 Confident
about some aspects
3 Confident
about most aspects
4 Confident
about every aspect
88 Not
applicable
Code

Landscape Analysis Country Assessment Tools Form 6. Health worker
96
3.9 How confident do you feel about counselling HIV-infected women on infant feeding practices?
1 Not
confident at all
2 Confident
about some aspects
3 Confident
about most aspects
4 Confident
about every aspect
88 Not
applicable
Code
3.10 Is your posyandu/polindes ever received infant formula/poster/leaflet/block-note from
infant formula company?
1 Yes
2 No
99 don’t know
Code
Explain if yes:
Section 4. Breastfeeding support
4.1 How often do you counsel a mother on breastfeeding?
1 Everyday
2 Every week
3 Every month
4 Less often
5 Never
99 Don’t know
Code
4.2 How often do you counsel HIV-infected mothers about infant feeding?
1 Everyday
2 Every week
3 Every month
4 Less often
5 Never
99 Don’t know
Code
4.3 Has your posyandu/polindes ever received any posters/pamphlets/free formula milk
samples or paper pads/pens by formula manufacturing companies?
1 Yes
0 No
99 Don’t know
Code
If Yes, please describe:
Section 5. Community involvement and support groups 5.1 Are there any breastfeeding support groups or volunteers based at your clinic or in the
local community? E.g. BFHI support groups
1 Yes
0 No
99 Don’t know
Code
5.2 How often do they meet?
1 Everyday
2 Every week
3 Every month
4 Less often
5 Never
99 Don’t know
Code

Landscape Analysis Country Assessment Tools Form 6. Health worker
97
Section 6. Suggestions to improve
6.1 In your opinion, how can the nutrition programme be improved in your area?
Code
6.2 Are there any areas in nutrition which you feel that you need more training?
1 Yes
0 No
Code
If Yes, please describe the type of training:
Section 7. Support 7.1 Who do you consult if you need technical support regarding nutrition? (Technical support
includes help with difficult counselling cases, information about recent advances in nutrition)
Code
7.2 Do you have adequate time to carry out your nutrition duties?
1 Yes, sometimes
2 Yes, always
0 Never
Code
7.3 Is there anything else that you would like to add regarding the implementation of nutrition
services?
Code

Landscape Analysis Country Assessment Tools Form 1. National level stakeholders
Form 6B. Health staff (Village Health Volunteer)
Structured questionnaire interview for all clinic staff providing services to pregnant women or children
ID:___
Completed by:
Code
Province:
Code
District:
Code
Facility: 1 District Hospital 2 Secondary Hospital 3 Tertiary/Provincial Hospital 4 Primary Health Care Centre/Clinic 5 Community Health Centre 6 Maternity/Birthing Unit 7 Health post 77 Other:
Code
Unit: 1 Out-Patient Department 2 Maternity/Birthing Unit 3 Children’s ward 77 Other:
Code
Respondent: 1 Facility manager 2 Physician 3 Nurse 4 Auxiliary nurse 5 Midwife 6 Nutritionist / Dietitian 7 Nutrition counsellor adviser / Nutrition officer 8 Other programme officer 9 Community Health Worker 10 Volunteers / Lay counsellors 11 Administrator / clerk 77 Other:
Code
Date of
visit
d d m m y y y y

Landscape Analysis – Indonesian Country Assessment
Draft Report 27 June 2010
99
Section 1. Background and training
1.1 Have you have any training in the t he last two years have, if yes what (Do not go
one by one): Code
1.1.1 Maternal nutrition 1
Yes 0
No
1.1.2 Breastfeeding counselling 1
Yes 0
No
1.1.3 BFHI training (breastfeeding management and support)
1 Yes
0 No
1.1.4 Complementary feeding counselling 1
Yes 0
No
1.1.5 Zinc supplementation for diarrhoea management 1
Yes 0
No
1.1.6 Vitamin A supplementation for children 1
Yes 0
No
1.1.7 Vitamin A supplementation for post-partum women
1 Yes
0 No
1.1.8 Child multiple micronutrients supplementation 1
Yes 0
No
1.1.9 Maternal micronutrients supplementation 1
Yes 0
No
1.1.10
Growth monitoring and promotion 1
Yes 0
No
1.1.111
Management of moderate malnutrition 1
Yes 0
No
1.1.12
Management of severe malnutrition 1
Yes 0
No
1.1.13
Prevention and care for children with diarrhoea 1
Yes 0
No
1.1.14 Breastfeeding in the context of HIV/AIDS counselling
1 Yes
0 No
1.1.15 Healthy eating and physical activity to prevent overweight
1 Yes
0 No
1.1.16 Prevention of intestinal parasites 1
Yes 0
No
1.1.17 Prevention of communicable diseases 1
Yes 0
No
1.1.18 Family planning 1
Yes 0
No
1.1.19 Prevention of malaria 1
Yes 0
No
1.1.20 Other: __________________ 1
Yes 0
No
Section 2. Knowledge of nutrition protocols
2.1 What micronutrient supplement should pregnant women receive?
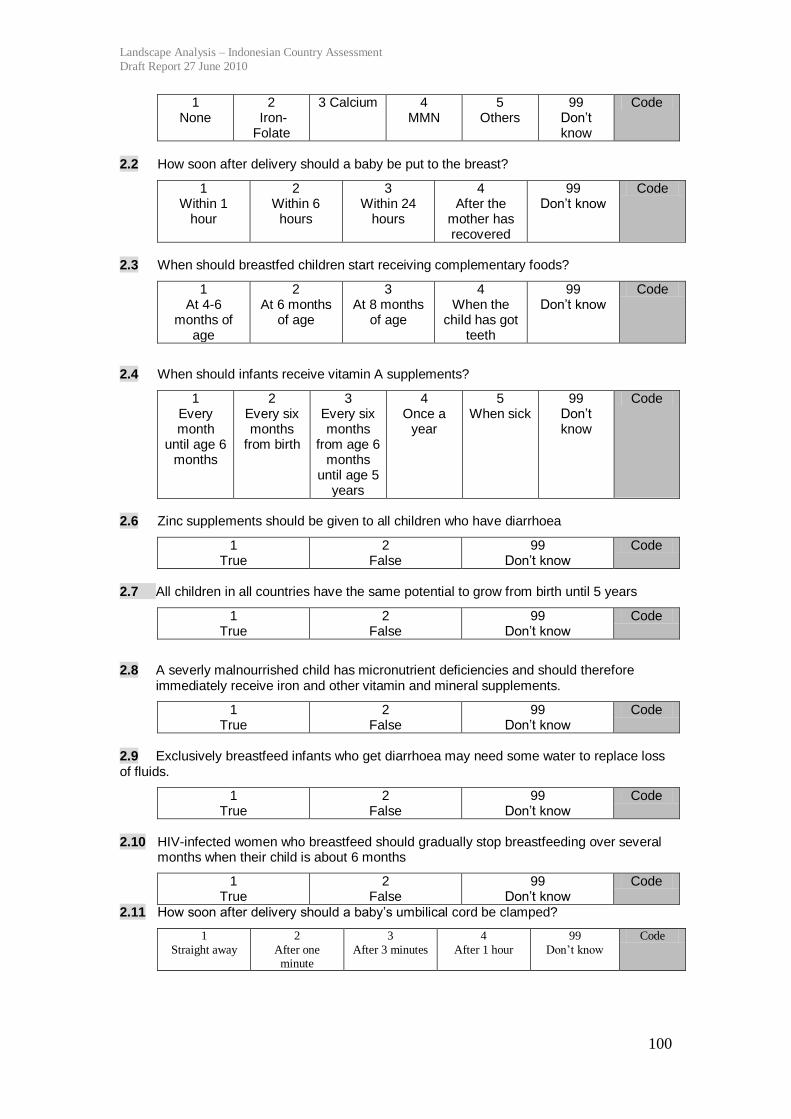
Landscape Analysis – Indonesian Country Assessment
Draft Report 27 June 2010
100
1 None
2 Iron-Folate
3 Calcium 4 MMN
5 Others
99 Don’t know
Code
2.2 How soon after delivery should a baby be put to the breast?
1 Within 1
hour
2 Within 6
hours
3 Within 24
hours
4 After the
mother has recovered
99 Don’t know
Code
2.3 When should breastfed children start receiving complementary foods?
1 At 4-6
months of age
2 At 6 months
of age
3 At 8 months
of age
4 When the
child has got teeth
99 Don’t know
Code
2.4 When should infants receive vitamin A supplements?
1 Every month
until age 6 months
2 Every six months
from birth
3 Every six months
from age 6 months
until age 5 years
4 Once a
year
5 When sick
99 Don’t know
Code
2.6 Zinc supplements should be given to all children who have diarrhoea
1 True
2 False
99 Don’t know
Code
2.7 All children in all countries have the same potential to grow from birth until 5 years
1 True
2 False
99 Don’t know
Code
2.8 A severly malnourrished child has micronutrient deficiencies and should therefore immediately receive iron and other vitamin and mineral supplements.
1 True
2 False
99 Don’t know
Code
2.9 Exclusively breastfeed infants who get diarrhoea may need some water to replace loss of fluids.
1 True
2 False
99 Don’t know
Code
2.10 HIV-infected women who breastfeed should gradually stop breastfeeding over several
months when their child is about 6 months
1 True
2 False
99 Don’t know
Code
2.11 How soon after delivery should a baby’s umbilical cord be clamped?
1
Straight away
2
After one minute
3
After 3 minutes
4
After 1 hour
99
Don’t know
Code
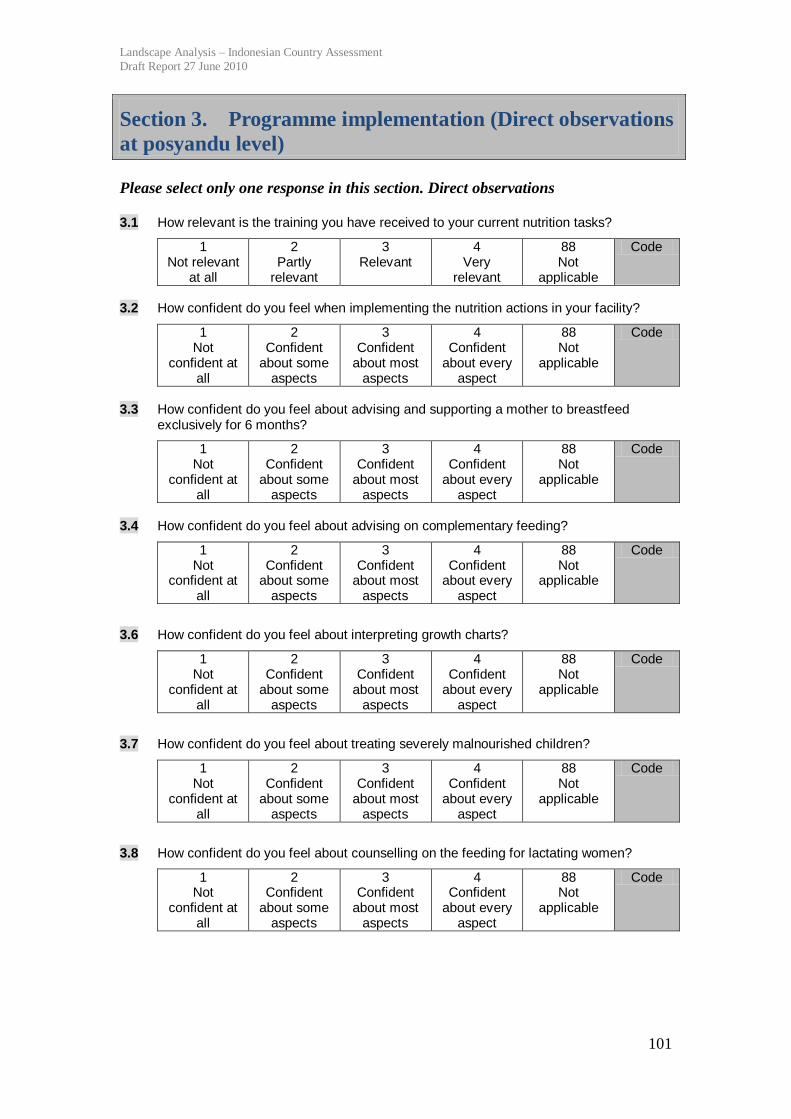
Landscape Analysis – Indonesian Country Assessment
Draft Report 27 June 2010
101
Section 3. Programme implementation (Direct observations
at posyandu level)
Please select only one response in this section. Direct observations
3.1 How relevant is the training you have received to your current nutrition tasks?
1 Not relevant
at all
2 Partly
relevant
3 Relevant
4 Very
relevant
88 Not
applicable
Code
3.2 How confident do you feel when implementing the nutrition actions in your facility?
1 Not
confident at all
2 Confident
about some aspects
3 Confident
about most aspects
4 Confident
about every aspect
88 Not
applicable
Code
3.3 How confident do you feel about advising and supporting a mother to breastfeed
exclusively for 6 months?
1 Not
confident at all
2 Confident
about some aspects
3 Confident
about most aspects
4 Confident
about every aspect
88 Not
applicable
Code
3.4 How confident do you feel about advising on complementary feeding?
1 Not
confident at all
2 Confident
about some aspects
3 Confident
about most aspects
4 Confident
about every aspect
88 Not
applicable
Code
3.6 How confident do you feel about interpreting growth charts?
1 Not
confident at all
2 Confident
about some aspects
3 Confident
about most aspects
4 Confident
about every aspect
88 Not
applicable
Code
3.7 How confident do you feel about treating severely malnourished children?
1 Not
confident at all
2 Confident
about some aspects
3 Confident
about most aspects
4 Confident
about every aspect
88 Not
applicable
Code
3.8 How confident do you feel about counselling on the feeding for lactating women?
1 Not
confident at all
2 Confident
about some aspects
3 Confident
about most aspects
4 Confident
about every aspect
88 Not
applicable
Code

Landscape Analysis – Indonesian Country Assessment
Draft Report 27 June 2010
102
3.9 How confident do you feel about counselling HIV-infected women on infant feeding practices?
1 Not
confident at all
2 Confident
about some aspects
3 Confident
about most aspects
4 Confident
about every aspect
88 Not
applicable
Code
3.10 Is your posyandu/polindes ever received infant formula/poster/leaflet/block-note from infant formula company?
1 Yes
2 No
99 don’t know
Code
Explain if yes:
Section 4. Breastfeeding support
4.1 How often do you counsel a mother on breastfeeding?
1 Everyday
2 Every week
3 Every month
4 Less often
5 Never
99 Don’t know
Code
4.2 How often do you counsel HIV-infected mothers about infant feeding?
1 Everyday
2 Every week
3 Every month
4 Less often
5 Never
99 Don’t know
Code
4.3 Has your posyandu/polindes ever received any posters/pamphlets/free formula milk
samples or paper pads/pens by formula manufacturing companies?
1 Yes
0 No
99 Don’t know
Code
If Yes, please describe:
Section 5. Community involvement and support groups 5.1 Are there any breastfeeding support groups or volunteers based at your clinic or in the
local community? E.g. BFHI support groups
1 Yes
0 No
99 Don’t know
Code
5.2 How often do they meet?
1 Everyday
2 Every week
3 Every month
4 Less often
5 Never
99 Don’t know
Code

Landscape Analysis – Indonesian Country Assessment
Draft Report 27 June 2010
103
Section 6. Suggestions to improve
6.1 In your opinion, how can the nutrition programme be improved in your area?
Code
6.2 Are there any areas in nutrition which you feel that you need more training?
1 Yes
0 No
Code
If Yes, please describe the type of training:
Section 7. Support 7.1 Who do you consult if you need technical support regarding nutrition? (Technical support
includes help with difficult counselling cases, information about recent advances in nutrition)
Code
7.2 Do you have adequate time to carry out your nutrition duties?
1 Yes, sometimes
2 Yes, always
0 Never
Code
7.3 Is there anything else that you would like to add regarding the implementation of
nutrition services?
Code

Landscape Analysis – Indonesian Country Assessment
Draft Report 27 June 2010
104
Appendix 2. Indonesia’s nutrition oriented poverty
reduction programmes
There are several methods used to identify Indonesia’s poor. One of the most
commonly used systems is as follows. In 2005 the central government, helped by
BPS, held a census to map poor families in urban and rural areas. The census was
called the Sosial Ekonomi Penduduk 2005 (PSE05). Households are categorized by
14 criteria. Once identified as poor, the household receives an Energy Compensation
Card (Kartu Kompensasi –KKB). At the same time, several programmes include a
process by which poor households are identified by local village authorities based on
the same 14 criteria (see below). Once identified by the village, the list is reviewed
and verified by local BPS agents. It is the local BPS office that approves the final list
of beneficiaries to any programme. The numbers and lists of poor generated by this
‘bottom-up’ process are used primarily by poverty reduction programmes to identify
recipients and participants to the programmes.
In addition, the annual Social and Economic Survey (Susenas) measures levels of
poverty. This data is used by national government and international agencies for
monitoring the levels of poverty in Indonesia and developing macro social and
economic strategies.
The national income poverty line is about PPP US$1.55. Indonesia’s poverty rate has
been steadily declining since the political and social upheavals of the 1990s. A large
increase was seen between 1993 and 1998 due to the Asian Financial Crisis and a
change in the way poverty was measured. It has since declined again to a level of
14.18% in 2009 that is almost equivalent to the pre-crisis level of 13.7% in 1993. The
decline has been steady except for a small increase between 2005 and 2006 as a result
of rice price increases in February 2005 as a result of a rice import ban.47
However,
with 32 million people in poverty, Indonesia still has a huge burden of poor. In
47 Although fuel prices increased significantly in October 2005, poverty rates did not increase due to
the programme of unconditional cash transfers (see below in document).
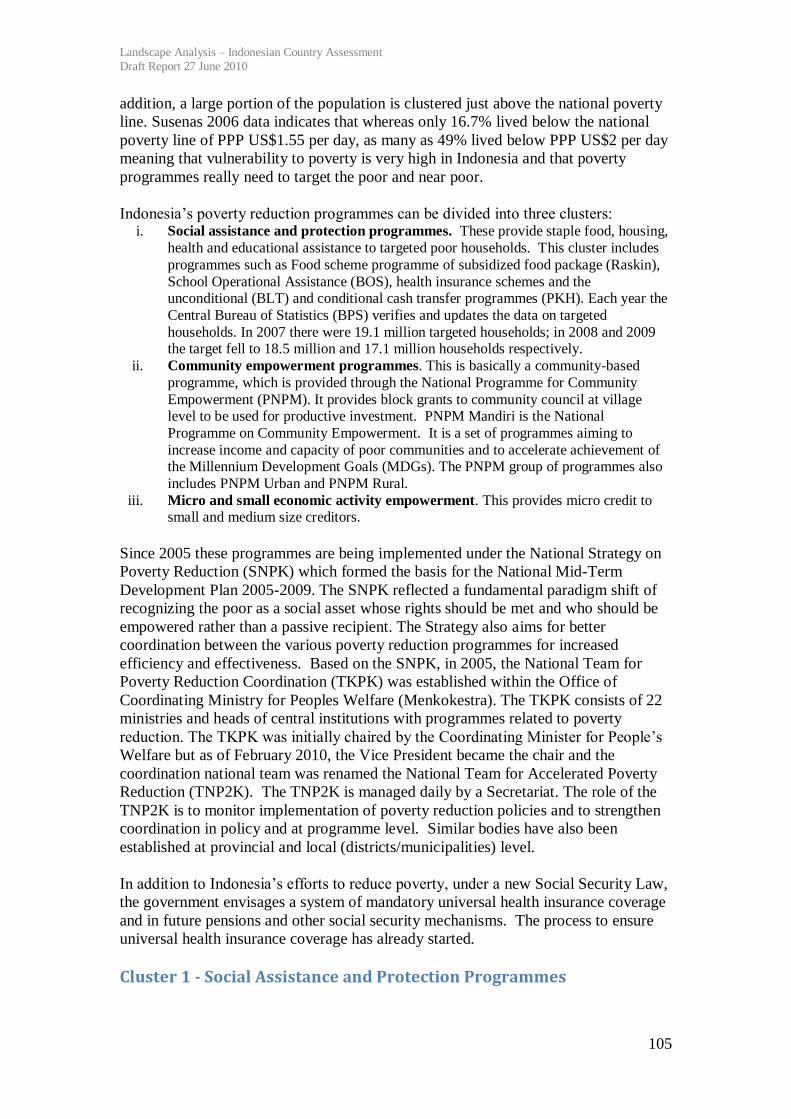
Landscape Analysis – Indonesian Country Assessment
Draft Report 27 June 2010
105
addition, a large portion of the population is clustered just above the national poverty
line. Susenas 2006 data indicates that whereas only 16.7% lived below the national
poverty line of PPP US$1.55 per day, as many as 49% lived below PPP US$2 per day
meaning that vulnerability to poverty is very high in Indonesia and that poverty
programmes really need to target the poor and near poor.
Indonesia’s poverty reduction programmes can be divided into three clusters: i. Social assistance and protection programmes. These provide staple food, housing,
health and educational assistance to targeted poor households. This cluster includes
programmes such as Food scheme programme of subsidized food package (Raskin),
School Operational Assistance (BOS), health insurance schemes and the unconditional (BLT) and conditional cash transfer programmes (PKH). Each year the
Central Bureau of Statistics (BPS) verifies and updates the data on targeted
households. In 2007 there were 19.1 million targeted households; in 2008 and 2009 the target fell to 18.5 million and 17.1 million households respectively.
ii. Community empowerment programmes. This is basically a community-based
programme, which is provided through the National Programme for Community
Empowerment (PNPM). It provides block grants to community council at village level to be used for productive investment. PNPM Mandiri is the National
Programme on Community Empowerment. It is a set of programmes aiming to
increase income and capacity of poor communities and to accelerate achievement of the Millennium Development Goals (MDGs). The PNPM group of programmes also
includes PNPM Urban and PNPM Rural.
iii. Micro and small economic activity empowerment. This provides micro credit to small and medium size creditors.
Since 2005 these programmes are being implemented under the National Strategy on
Poverty Reduction (SNPK) which formed the basis for the National Mid-Term
Development Plan 2005-2009. The SNPK reflected a fundamental paradigm shift of
recognizing the poor as a social asset whose rights should be met and who should be
empowered rather than a passive recipient. The Strategy also aims for better
coordination between the various poverty reduction programmes for increased
efficiency and effectiveness. Based on the SNPK, in 2005, the National Team for
Poverty Reduction Coordination (TKPK) was established within the Office of
Coordinating Ministry for Peoples Welfare (Menkokestra). The TKPK consists of 22
ministries and heads of central institutions with programmes related to poverty
reduction. The TKPK was initially chaired by the Coordinating Minister for People’s
Welfare but as of February 2010, the Vice President became the chair and the
coordination national team was renamed the National Team for Accelerated Poverty
Reduction (TNP2K). The TNP2K is managed daily by a Secretariat. The role of the
TNP2K is to monitor implementation of poverty reduction policies and to strengthen
coordination in policy and at programme level. Similar bodies have also been
established at provincial and local (districts/municipalities) level.
In addition to Indonesia’s efforts to reduce poverty, under a new Social Security Law,
the government envisages a system of mandatory universal health insurance coverage
and in future pensions and other social security mechanisms. The process to ensure
universal health insurance coverage has already started.
Cluster 1 - Social Assistance and Protection Programmes
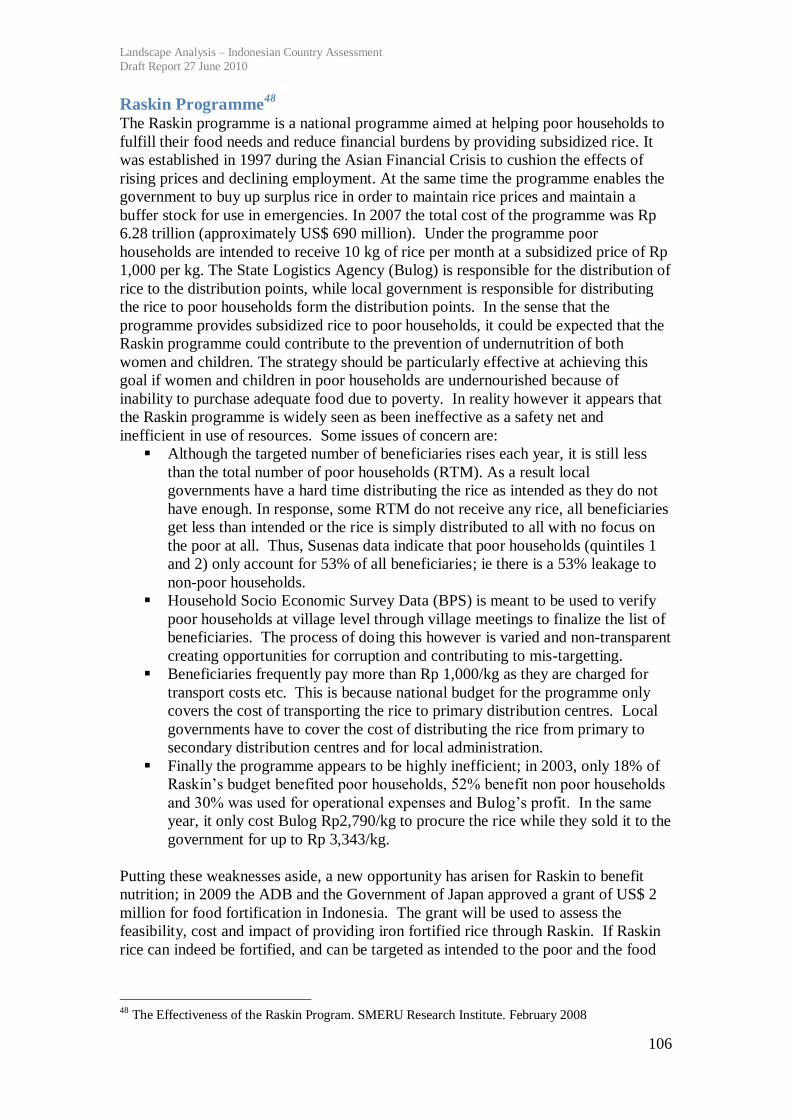
Landscape Analysis – Indonesian Country Assessment
Draft Report 27 June 2010
106
Raskin Programme48
The Raskin programme is a national programme aimed at helping poor households to
fulfill their food needs and reduce financial burdens by providing subsidized rice. It
was established in 1997 during the Asian Financial Crisis to cushion the effects of
rising prices and declining employment. At the same time the programme enables the
government to buy up surplus rice in order to maintain rice prices and maintain a
buffer stock for use in emergencies. In 2007 the total cost of the programme was Rp
6.28 trillion (approximately US$ 690 million). Under the programme poor
households are intended to receive 10 kg of rice per month at a subsidized price of Rp
1,000 per kg. The State Logistics Agency (Bulog) is responsible for the distribution of
rice to the distribution points, while local government is responsible for distributing
the rice to poor households form the distribution points. In the sense that the
programme provides subsidized rice to poor households, it could be expected that the
Raskin programme could contribute to the prevention of undernutrition of both
women and children. The strategy should be particularly effective at achieving this
goal if women and children in poor households are undernourished because of
inability to purchase adequate food due to poverty. In reality however it appears that
the Raskin programme is widely seen as been ineffective as a safety net and
inefficient in use of resources. Some issues of concern are:
Although the targeted number of beneficiaries rises each year, it is still less
than the total number of poor households (RTM). As a result local
governments have a hard time distributing the rice as intended as they do not
have enough. In response, some RTM do not receive any rice, all beneficiaries
get less than intended or the rice is simply distributed to all with no focus on
the poor at all. Thus, Susenas data indicate that poor households (quintiles 1
and 2) only account for 53% of all beneficiaries; ie there is a 53% leakage to
non-poor households.
Household Socio Economic Survey Data (BPS) is meant to be used to verify
poor households at village level through village meetings to finalize the list of
beneficiaries. The process of doing this however is varied and non-transparent
creating opportunities for corruption and contributing to mis-targetting.
Beneficiaries frequently pay more than Rp 1,000/kg as they are charged for
transport costs etc. This is because national budget for the programme only
covers the cost of transporting the rice to primary distribution centres. Local
governments have to cover the cost of distributing the rice from primary to
secondary distribution centres and for local administration.
Finally the programme appears to be highly inefficient; in 2003, only 18% of
Raskin’s budget benefited poor households, 52% benefit non poor households
and 30% was used for operational expenses and Bulog’s profit. In the same
year, it only cost Bulog Rp2,790/kg to procure the rice while they sold it to the
government for up to Rp 3,343/kg.
Putting these weaknesses aside, a new opportunity has arisen for Raskin to benefit
nutrition; in 2009 the ADB and the Government of Japan approved a grant of US$ 2
million for food fortification in Indonesia. The grant will be used to assess the
feasibility, cost and impact of providing iron fortified rice through Raskin. If Raskin
rice can indeed be fortified, and can be targeted as intended to the poor and the food
48
The Effectiveness of the Raskin Program. SMERU Research Institute. February 2008

Landscape Analysis – Indonesian Country Assessment
Draft Report 27 June 2010
107
insecure, it will be a highly cost effective way to improve iron intake in the most
vulnerable segments of society.
Cash Transfers In October 2005, the government raised the price of fuel by 85% to safeguard the
national budget. In order to off-set the impact on the poor, a programme of
unconditional cash transfers to households of poor and near poor families (Bantuan
Tunai Langsung – BLT) was started. In the first round of the scheme some 60 million
people in 15.5 million households (28% of the population) were targeted and in the
second round, May 2008 when the gas price was again increased, by 33.3%, the target
was extended to 70 million people in 19.2 million households. Grants of Rp 100,000
per month (US$ 10) are provided; in the first round it was provided from October
2005 to March 2006 after which it was suspended. The poor are initially identified by
local authorities and classified by economic level on the basis of 14 criteria develop
by the Central Bureau of Statistics (BPS)49
. Village authorities produce list of poor
households and these households are then visited by a BPS enumerator to help them
fill out an assessment form. The forms are reviewed by the local BPS office and a
final list is produced. The approved list is given to the Post Office which issues
entitlement cards and provides cash transfers in quarterly lump sums to the poor
household. In the first year, 2005, the government allocated 4.6 trillion for the
programme (US$ 500 million). The funds are taken from the partial cut of gas subsidy,
essentially transferring the gas subsidy into a household subsidy. An evaluation,
coordinated by the University of Indonesia,50
found that 90% of recipients used the
transfer for purchasing rice, just under 80% on purchasing oil and about 40% on debt
repayment and health costs. Only about 5% used it for gasoline purchase. Although
the programme was considered to be successful in the sense that it curtailed a rise in
poverty which would otherwise have occurred, the programme was converted into a
conditional cash transfer programme to empower poor communities.
The conditional cash transfers (Program Keluarga Harapan – PKH) was started in
2007 and targeted the same households as the BLT but with additional criteria for
eligibility. The objectives of the PKH are to (i) reduce maternal mortality, (ii) reduce
child mortality, (iii) ensure universal coverage of basic education, (iv) reduce child
labour and encourage children to go to school. Eligible households must have a
pregnant woman, children 0-6 years or children of primary or high school age (6-17).
The cash transfers are given to households on the condition that they meet the below
12 conditions. The funds are given to the mother (or another adult woman) in the
household every three months. Beneficiaries may participate for a maximum of 6
years and there is recertification of eligibility every 3 years. The PKH is implemented
by the Ministry of Social Affairs (DepSos) and will run until 2015 in line with the
MDGs. The PKH programme was implemented in 7 provinces in 2007 as a pilot. It
has since been expanded and in 2009 covered a total of 720,000 households.
49 Criteria include things like size of house, flooring and wall material of house, access to water and
sanitation, source of light, kind of fuel used for cooking, how many times per week the family buys
meat/chicken/milk, how many times per day the family eats and possession of specified assets. 50 Widjaja. An Economic and Social Review on Indonesian Direct Cash Transfer Program to Poor
Families Year 2005.
Landscape Analysis – Indonesian Country Assessment
Draft Report 27 June 2010
108
Health indicators:
Indicators for pregnant mothers: (i) four prenatal care visits during pregnancy, (ii)
take iron supplements during pregnancy, (iii) have a delivery assisted by a trained
professional, (iv) two postnatal care visits;
Indicators for under-five children: (v) complete childhood immunization, (vi) monthly
growth monitoring of children under 3 and quarterly thereafter (1-6 years), (vii)
monthly weight gain of infants, (viii) vitamin A every six months for under fives.
Education indicators: (i) all children aged 6-12 enrolled in primary school, (ii) minimum attendance rate of
85% for all primary school-aged children, (iii) all children aged 13-15 enrolled in
junior secondary school, (iv) minimum attendance rate of 85% for all junior
secondary school-aged children.
Problems experienced with the programme include beneficiary selection, in
particularly targeting errors (inclusion) and the transparency of the selection process,
interagency coordination in relation to financial arrangements and information flow,
insufficient socialization and insufficient monitoring and verification. There are also
issues with insufficient training of the facilitators and their workload, and problems
with the payment system.51
Overall however the programme is considered a success
and some concrete improvements have been measured as noted below.
Health Insurance52
In 2004, the Indonesia government made a commitment to provide its entire
population with health insurance coverage through a mandatory public health
insurance scheme. In principal this should be contributing substantially to improving
nutritional status in that it should ensure access to essential health services including
antenatal care, delivery care, micronutrient supplementation, treatment of childhood
illness and preventative services and nutritional counselling. In addition to ensuring
insurance coverage for all, inefficiencies in the health system and overall low quality
of service provision need to be addressed in order to improve the supply of basic
health services. Health financing since decentralization has become more
complicated and health service delivery appears to be worsening. As a result, half of
all health spending is private, largely out of pocket (OOP) and almost half of all those
who are ill actually seek health services from private providers.
In order to provide health insurance to everyone, the government established Asuransi
Kesehatan Masyarakat Miskin (Health Insurance for Poor Population) or Askeskin in
2004 and expanded it into Jaminan Kesehatan Masyarakat (Health Insurance for the
Population) or Jamkesmas in 2008. Meanwhile civil servants and their dependents are
covered under the Askes programme and Jamsostek covers private sector employees
in firms with 10 or more employees. Susenas 2007 indicates that 26% of the
population is covered by health insurance, the majority by Jamkesmas (14.3%). This
means that 73.9% remain uninsured. The government estimates however that by 2008
the proportion covered had increased to 48% mostly as a result of expansion of
Jamkesmas. The government vision is that coverage for the poor will be financed by
the government and financing for the remainder of the population will be through a
51 Karin Schelzig Bloom. Conditional Cash Transfers: Lessons from Indonesia’s Program Keluarga
Harapan. July 2009. ADB 52
Health Financing in Indonesia: A Reform Road Map. World Bank, 2009
Landscape Analysis – Indonesian Country Assessment
Draft Report 27 June 2010
109
contributory scheme. The legislation envisages existing health insurance carriers
converting to non-profit status and all carriers merging under a mandatory, universal
system under the national social security council. Problems will be in how the
government will identify additional fiscal space to finance coverage for the poor
(about 70 million people) and how the huge informal sector53
of some 60 million
people will be covered as they are difficult to identify and it will be difficult to obtain
contributions from this segment of the population.
Cluster 2 - Community Empowerment Programmes
PNPM Mandiri (National Programme on Community Empowerment) PNPN Mandiri was launched in April 2007. It is formed by the merging of two
community driven development approach programmes, the Kecematan Development
Programme (KDP) and the Urban Poverty Programme (UPP), which had themselves
been started in 1998 and 1999. In the PNPM Mandiri these two programmes have
been scaled up; in 2009 all sub-districts in the country were covered (6,408 sub-
districts).
The general objective of PNPM Mandiri is to improve the welfare of poor
communities. Specific objectives include (i) increasing participation of community
members, (ii) improving capacity of community institutions, (iii) improving local
government capacity to provide public services, (iv) increasing synergy between
communities, local government and other pro-poor stakeholders, (v) enhancing
capacity and capability of the community and local government and (vi) increasing
innovation and use of appreciate technology, information and communication in
community development.
PNPM Mandiri programmes can be categorized into: Core PNPM and Supporting
PNPM. The core PNPM programme consists of community based empowerment
programme and activities such as Rural PNPM Mandiri, Urban PNPM Mandiri,
PNPM Mandiri for Disadvantaged Areas, PNPM Mandiri for Rural Infrastructure, and
PNPM Mandiri for Regional Socio-Economic Infrastructure. The Supporting PNPM
programme consists of sector based, region based, and special community
empowerment designed to support poverty reduction related to the achievement of
specific targets such as PNPM Generasi, Green PNPM (PNPM Hijau), and PNPM
Smallholder Agribusiness Development Initiative (SADI).
The component of activities in PNPM Mandiri includes (i) community development,
(ii) strengthening local governance and partnership, (iii) community block grant and,
(iv) technical assistance for programme management and development. The PNPM
Mandiri works by providing Community Block Grants to poor community groups
including women’s groups. The community groups have been or are being
empowered and supported by almost 40,000 facilitators. The programme is planned to
continue until 2015, the deadline for the MDGs.
53 Some 85% of all workers are in firms of fewer than five workers and 38% are in firms of only one
worker.

Landscape Analysis – Indonesian Country Assessment
Draft Report 27 June 2010
110
Most of PNPM Mandiri’s source of fund comes from government annual budget
(APBN), regional funds (APBD), private/community contributions and also grants or
loans from various donor.
PNPM Generasi (Community Cash Transfer for Health and Smart
Generation) As noted above, PNPM Generasi is a component programme of PNPM Mandiri. It is
mentioned here because it contributes specifically to health and education goals and is
synergistic with the PKH. The PNPM Generasi aims to increase access of poor
households to health and education services. Through the PNPM Generasi the local
community can build infrastructure or procure equipment to enable them to access
basic services eg. Build community health centre, purchase standard equipment,
renovate facilities, build bridges or roads. The programme builds on the experiences
of the Kecamatan Development Project (KDP) and is implemented as part of the
PNPM Mandiri. The programme covers 3.1 million beneficiaries or 8.4% of total poor
people in Indonesia.
Under the programme, poor communities self-identify problems and seek solutions to
meet the same 12 conditions of the PKH. Community participation in PNPM Generasi
is conditional upon their commitment to meet the 12 conditions. All participating
villages receive facilitation or technical assistance in the form of facilitators and
training, and an average village block grant of US$ 8,400. Assisted by facilitator,
communities follow a cycle of socialization, village planning, village implementation
and performance measurement. A cycle takes 12 months with village implementation
taking 9 months. In the first year of operation, 2007, 56% of funds were used for
education activities vs 44% for health activities. Within health activities funds were
used as follows: supplementary feeding for underweight and malnourished children
(40%), financial assistance for pregnant women and mothers to access health services
(30%), infrastructure (13%), facilities and equipment (11%), socialization and training
(3%) and incentives for health workers (3%). An evaluation by the World Bank found
improvement in coverage of health services, in particular participation in
immunization coverage. The evaluation also noted an improvement in child
underweight under 3% (25% before and 21% after in Jakarta).54
It is clear that the PKH and Mandiri Generasi have significant potential to contribute
to improvements in nutrition, and some results in this area have been reported.
However as presently implemented, a significant proportion of the effort has gone on
interventions that are not the most effective at reducing maternal and child
undernutrition such as increasing participation in monthly weighting and
supplementary feeding programmes. The conditions for the PKH are in line with the
national strategy for nutrition in the sense that they include a focus on maternal health
and on young children (growth monitoring is stipulated to be monthly only for under
1 children for example) but even more emphasis could be placed on improving
maternal nutrition and on strengthening child nutrition services (such as breastfeeding
and complementary feeding counseling, or vitamin A supplementation) as opposed to
growth monitoring for example.
54 Karin Schelzig Bloom. Conditional Cash Transfers: Lessons from Indonesia’s Program Keluarga
Harapan. July 2009. ADB. It appears that these impacts have been achieved through a combination of
the PKH and PNPM Generasi.

Landscape Analysis – Indonesian Country Assessment
Draft Report 27 June 2010
111
Micro and Small Business Empowerment The People’s Business Credits (Kredit Untuk Rakyat – KUR) provides soft credit to
develop micro and small businesses. The credits use public funds managed by banks
but they are guaranteed by the government. Since its launching in November 2007,
until 2008, the programme has provided Rp13 trillion (US$1,417 million) to 1.7
million creditors.

Landscape Analysis Country Assessment Tools Form 1. National level stakeholders
Appendix 3. Essential Nutrition Interventions Policy and Programme framework
Interventions with sufficient evidence for implementation in all 36 countries Intervention Policy / legislation Supporting guidelines Target Implementation
status
Current
Coverage
in
Indonesia
References and
Notes
Maternal and
birth outcomes
Iron folate
supplementation
National Action Plan for
Food & Nutrition 2006-
2010
Plan of Action on
Community Nutrition
(2010-2014)
Operational guidelines
for family nutrition
awareness in alert
village (desa Siaga)
(MOH decree:
747/MOH/SK/VI/2007)
Counseling guideline
book to achieve family
nutrition awareness
2007 Guideline book of IEC
strategy for family
nutrition awareness
program 2007
85% (2014) National 29.2% DHS 2007- 90+
days
Maternal
calcium
supplementation
None None N/A Not implemented N/A
Maternal
supplements of
multiple
micronutrients
None None N/A Sub-national; Piloted
in NTB and NTT
provinces
Lombok
Tengah:
84,5%
(2008)
and 71,1%
(2009) of
women

Landscape Analysis – Indonesian Country Assessment Draft Report 27 June 2010
113
have
received
MMN
tablets
Maternal iodine
through iodized
salt
National Action Plan for
Food & Nutrition 2006-
2010
Decree No: JM 03 03/BV/2195/09
Accelerated intervention
of non-iodized salt 2009
Plan of Action on
Community Nutrition
(2010-2014)
Operational guideline
for family nutrition
awareness in alert
village (desa Siaga) (MOH decree:
747/MOH/SK/VI/2007
Counseling guideline
book to achieve family
nutrition awareness
2007
Guideline book of IEC
strategy for family
nutrition awareness
program 2007
Monitoring guideline of
iodized salt in the community 2001
90% (2014) National 62.8% Riskesdas - no of
households
consuming
adequately iodized salt (titration
methodology)
Interventions to
reduce tobacco
consumption
and indoor air
pollution
National Action Plan for
Food & Nutrition 2006-
2010
Council of Ulemas
(MUI), 2010 Fatwa
forbidding all muslims
from smoking in public
places
Ministry of Finance No
2003/PMK 001/2008
Cigarette Tax Increment
Health regulation No 36,
chapter 113, 114,115 on
N/A N/A Sub-national 97% DHS - % of
women who do not
use tobacco.
However on 87.8%
of men use
tobacco. Data on
indoor air pollution
is not available
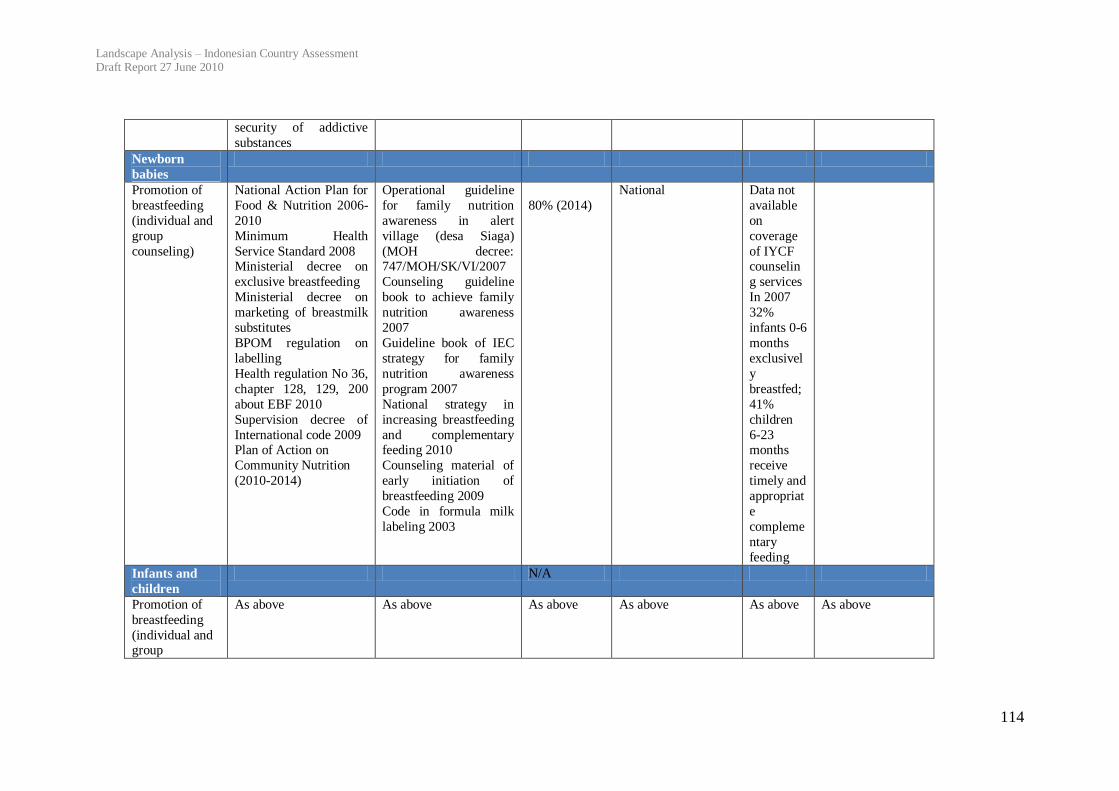
Landscape Analysis – Indonesian Country Assessment Draft Report 27 June 2010
114
security of addictive
substances
Newborn
babies
Promotion of
breastfeeding
(individual and
group
counseling)
National Action Plan for
Food & Nutrition 2006-
2010
Minimum Health
Service Standard 2008 Ministerial decree on
exclusive breastfeeding
Ministerial decree on
marketing of breastmilk
substitutes
BPOM regulation on
labelling
Health regulation No 36,
chapter 128, 129, 200
about EBF 2010
Supervision decree of
International code 2009 Plan of Action on
Community Nutrition
(2010-2014)
Operational guideline
for family nutrition
awareness in alert
village (desa Siaga)
(MOH decree: 747/MOH/SK/VI/2007
Counseling guideline
book to achieve family
nutrition awareness
2007
Guideline book of IEC
strategy for family
nutrition awareness
program 2007
National strategy in
increasing breastfeeding
and complementary feeding 2010
Counseling material of
early initiation of
breastfeeding 2009
Code in formula milk
labeling 2003
80% (2014)
National Data not
available
on
coverage
of IYCF counselin
g services
In 2007
32%
infants 0-6
months
exclusivel
y
breastfed;
41%
children
6-23 months
receive
timely and
appropriat
e
compleme
ntary
feeding
Infants and
children
N/A
Promotion of
breastfeeding
(individual and group
As above As above As above As above As above As above
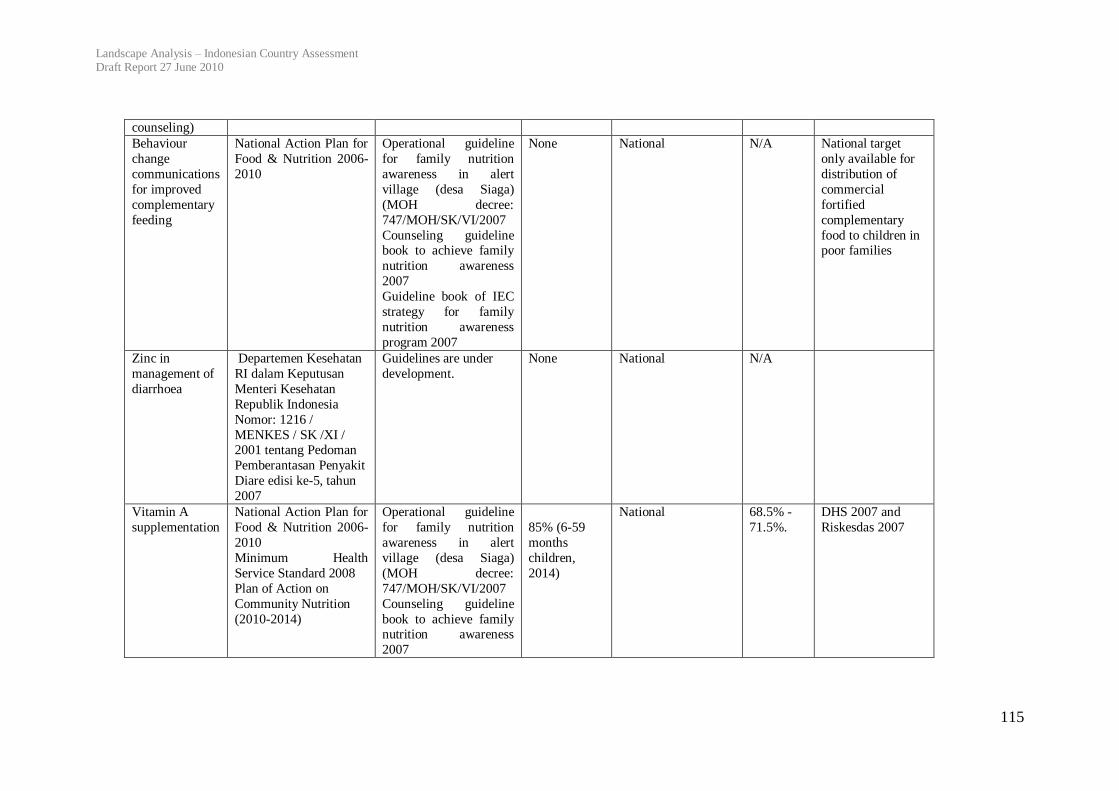
Landscape Analysis – Indonesian Country Assessment Draft Report 27 June 2010
115
counseling)
Behaviour
change
communications
for improved
complementary
feeding
National Action Plan for
Food & Nutrition 2006-
2010
Operational guideline
for family nutrition
awareness in alert
village (desa Siaga)
(MOH decree:
747/MOH/SK/VI/2007
Counseling guideline book to achieve family
nutrition awareness
2007
Guideline book of IEC
strategy for family
nutrition awareness
program 2007
None National N/A National target
only available for
distribution of
commercial
fortified
complementary
food to children in poor families
Zinc in
management of
diarrhoea
Departemen Kesehatan
RI dalam Keputusan
Menteri Kesehatan
Republik Indonesia
Nomor: 1216 /
MENKES / SK /XI / 2001 tentang Pedoman
Pemberantasan Penyakit
Diare edisi ke-5, tahun
2007
Guidelines are under
development.
None National N/A
Vitamin A
supplementation
National Action Plan for
Food & Nutrition 2006-
2010
Minimum Health
Service Standard 2008
Plan of Action on
Community Nutrition
(2010-2014)
Operational guideline
for family nutrition
awareness in alert
village (desa Siaga)
(MOH decree:
747/MOH/SK/VI/2007
Counseling guideline
book to achieve family nutrition awareness
2007
85% (6-59
months
children,
2014)
National 68.5% -
71.5%.
DHS 2007 and
Riskesdas 2007
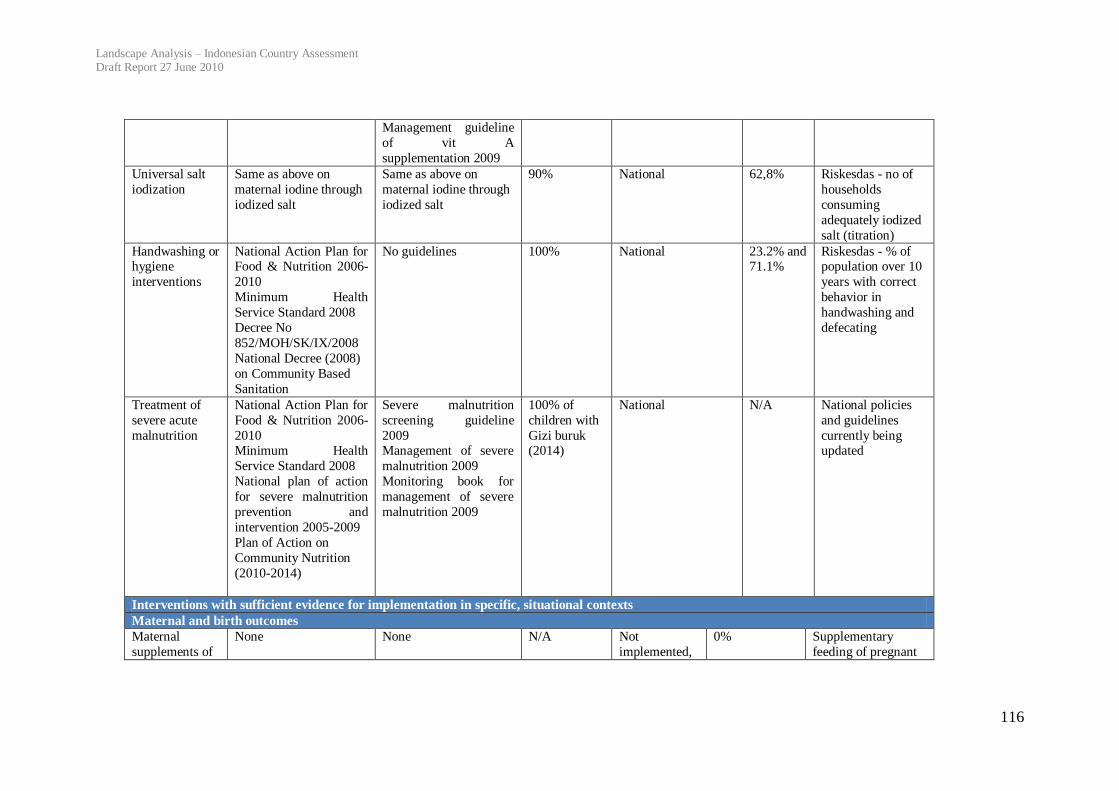
Landscape Analysis – Indonesian Country Assessment Draft Report 27 June 2010
116
Management guideline
of vit A
supplementation 2009
Universal salt
iodization
Same as above on
maternal iodine through
iodized salt
Same as above on
maternal iodine through
iodized salt
90% National 62,8% Riskesdas - no of
households
consuming
adequately iodized
salt (titration)
Handwashing or hygiene
interventions
National Action Plan for Food & Nutrition 2006-
2010
Minimum Health
Service Standard 2008
Decree No
852/MOH/SK/IX/2008
National Decree (2008)
on Community Based
Sanitation
No guidelines 100% National 23.2% and 71.1%
Riskesdas - % of population over 10
years with correct
behavior in
handwashing and
defecating
Treatment of
severe acute
malnutrition
National Action Plan for
Food & Nutrition 2006-
2010 Minimum Health
Service Standard 2008
National plan of action
for severe malnutrition
prevention and
intervention 2005-2009
Plan of Action on
Community Nutrition
(2010-2014)
Severe malnutrition
screening guideline
2009 Management of severe
malnutrition 2009
Monitoring book for
management of severe
malnutrition 2009
100% of
children with
Gizi buruk (2014)
National N/A National policies
and guidelines
currently being updated
Interventions with sufficient evidence for implementation in specific, situational contexts
Maternal and birth outcomes
Maternal
supplements of
None None N/A Not
implemented,
0% Supplementary
feeding of pregnant
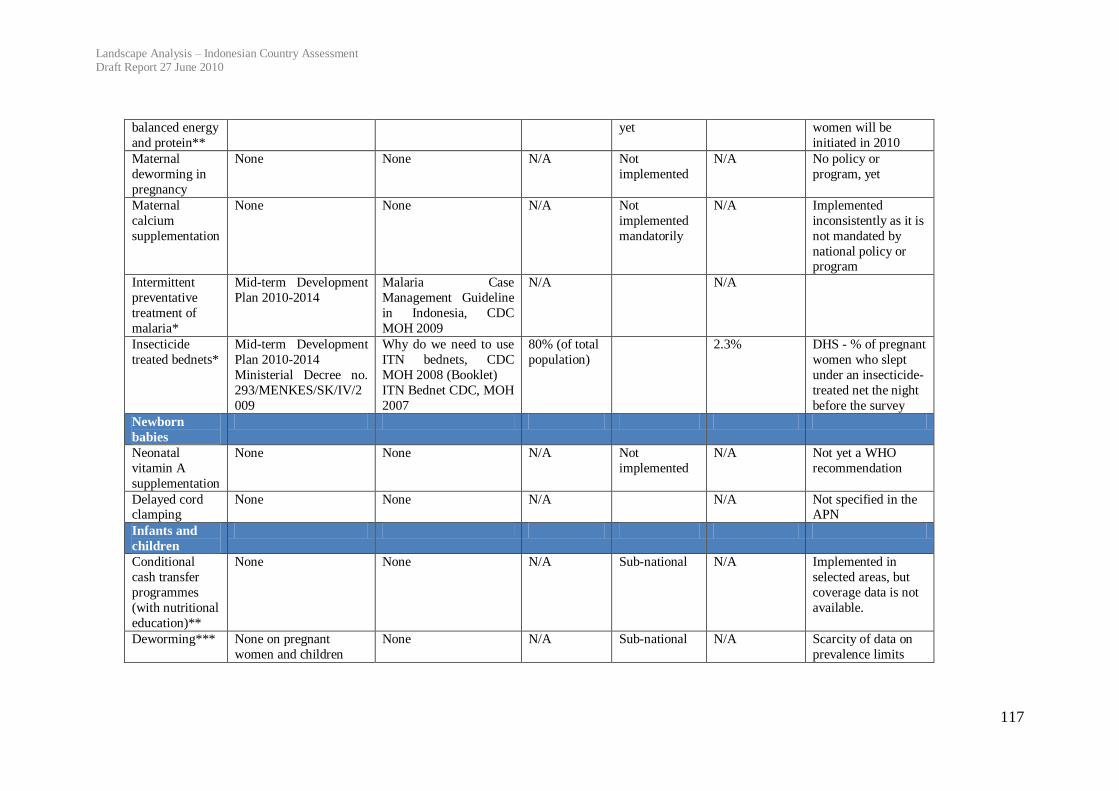
Landscape Analysis – Indonesian Country Assessment Draft Report 27 June 2010
117
balanced energy
and protein**
yet women will be
initiated in 2010
Maternal
deworming in
pregnancy
None None N/A Not
implemented
N/A No policy or
program, yet
Maternal
calcium
supplementation
None None N/A Not
implemented
mandatorily
N/A Implemented
inconsistently as it is
not mandated by
national policy or program
Intermittent
preventative
treatment of
malaria*
Mid-term Development
Plan 2010-2014
Malaria Case
Management Guideline
in Indonesia, CDC
MOH 2009
N/A N/A
Insecticide
treated bednets*
Mid-term Development
Plan 2010-2014
Ministerial Decree no.
293/MENKES/SK/IV/2
009
Why do we need to use
ITN bednets, CDC
MOH 2008 (Booklet)
ITN Bednet CDC, MOH
2007
80% (of total
population)
2.3% DHS - % of pregnant
women who slept
under an insecticide-
treated net the night
before the survey
Newborn
babies
Neonatal
vitamin A
supplementation
None None N/A Not
implemented
N/A Not yet a WHO
recommendation
Delayed cord clamping
None None N/A N/A Not specified in the APN
Infants and
children
Conditional
cash transfer
programmes
(with nutritional
education)**
None None N/A Sub-national N/A Implemented in
selected areas, but
coverage data is not
available.
Deworming*** None on pregnant
women and children
None N/A Sub-national N/A Scarcity of data on
prevalence limits

Landscape Analysis – Indonesian Country Assessment Draft Report 27 June 2010
118
under-five implementation of
this
policy/programme
Iron
fortification and
supplementation
programmes***
National Action Plan for
Food & Nutrition 2006-
2010
Decree No
1452/MOH/SK/X/2003 Flour Fortification
None All flour National 100% Flour fortification
with iron is
mandatory in
Indonesia and close
to 100% of all flour is fortified although
it is not known how
much flour young
children consume.
Insecticide-
treated bednets*
Same as above Same as above 3.3% DHS - % of children
under 5 who slept
under an insecticide-
treated net the night
before the survey
*In areas with malaria
** For women and children from poor families *** In areas with high worm infestation and/or anaemia
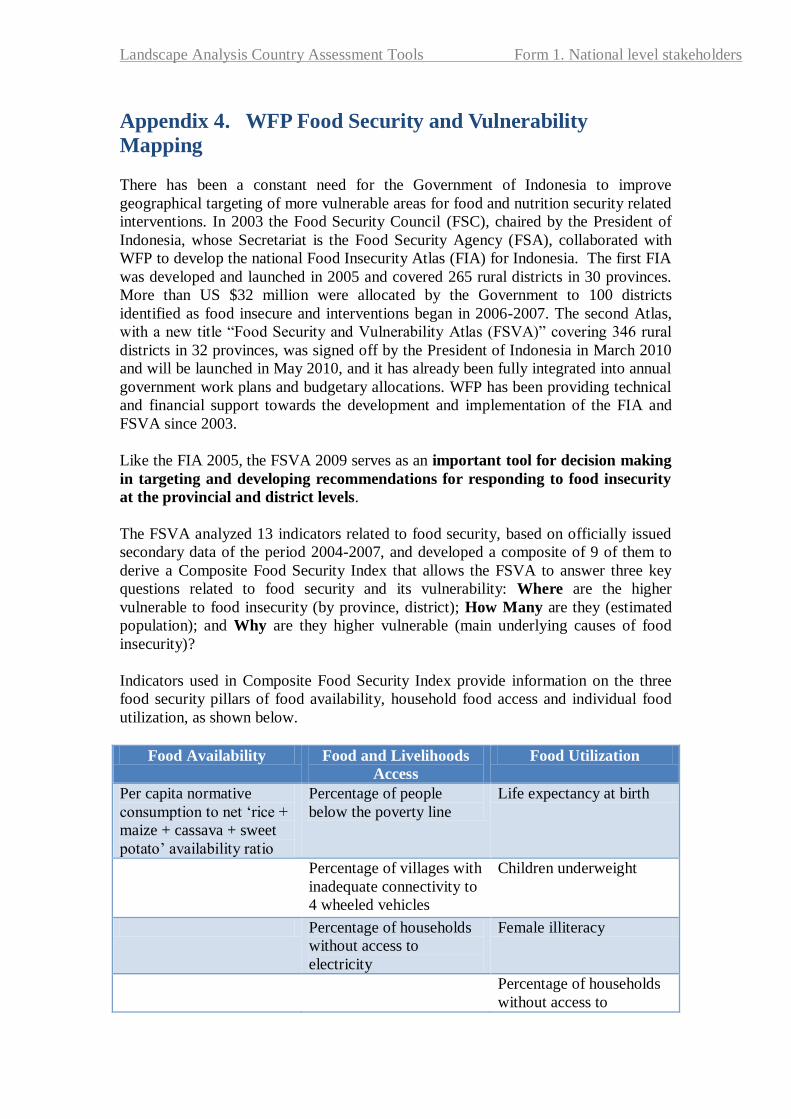
Landscape Analysis Country Assessment Tools Form 1. National level stakeholders
Appendix 4. WFP Food Security and Vulnerability
Mapping
There has been a constant need for the Government of Indonesia to improve
geographical targeting of more vulnerable areas for food and nutrition security related
interventions. In 2003 the Food Security Council (FSC), chaired by the President of
Indonesia, whose Secretariat is the Food Security Agency (FSA), collaborated with
WFP to develop the national Food Insecurity Atlas (FIA) for Indonesia. The first FIA
was developed and launched in 2005 and covered 265 rural districts in 30 provinces.
More than US $32 million were allocated by the Government to 100 districts
identified as food insecure and interventions began in 2006-2007. The second Atlas,
with a new title “Food Security and Vulnerability Atlas (FSVA)” covering 346 rural
districts in 32 provinces, was signed off by the President of Indonesia in March 2010
and will be launched in May 2010, and it has already been fully integrated into annual
government work plans and budgetary allocations. WFP has been providing technical
and financial support towards the development and implementation of the FIA and
FSVA since 2003.
Like the FIA 2005, the FSVA 2009 serves as an important tool for decision making
in targeting and developing recommendations for responding to food insecurity
at the provincial and district levels.
The FSVA analyzed 13 indicators related to food security, based on officially issued
secondary data of the period 2004-2007, and developed a composite of 9 of them to
derive a Composite Food Security Index that allows the FSVA to answer three key
questions related to food security and its vulnerability: Where are the higher
vulnerable to food insecurity (by province, district); How Many are they (estimated
population); and Why are they higher vulnerable (main underlying causes of food
insecurity)?
Indicators used in Composite Food Security Index provide information on the three
food security pillars of food availability, household food access and individual food
utilization, as shown below.
Food Availability Food and Livelihoods
Access
Food Utilization
Per capita normative
consumption to net ‘rice +
maize + cassava + sweet
potato’ availability ratio
Percentage of people
below the poverty line
Life expectancy at birth
Percentage of villages with
inadequate connectivity to
4 wheeled vehicles
Children underweight
Percentage of households
without access to
electricity
Female illiteracy
Percentage of households
without access to

Landscape Analysis – Indonesian Country Assessment Draft Report 27 June 2010
120
improved drinking water
Percentage of households
living more than 5km
away from health facilities
NB. For food utilization, data on direct indicators such as food consumption, was not
available at district level. Hence, indirect indicators that may be affected by food
utilization or may influence food utilization, and for which data was available at
district level, were used instead. In reality therefore, none of the indicators used
under food utilization can be said to be indicators of food utilization; rather they are
indicators of vulnerability to food and even nutritional security.
Using the composite index, 346 districts which had complete datasets, were ranked
and mapped. Among them, 100 were ranked as Priority 1 (30 districts), Priority 2 (30
districts) and Priority 3 (40 districts) with a total estimated population of 25 million
people. The remaining 246 districts are classified as Priorities 4-6. Higher attention
should be paid to districts of Priorities 1-3 in addressing food security and
vulnerability.
The FSVA provides information tools for decision makers to quickly identify the
more vulnerable areas where investments in different services, human development
and infrastructure related to food security will have more impact on livelihood, food
and nutrition security of the people.
Related Documents