The Lancet Countdown on health and climate change: from 25 years of inaction to a global transformation for public health Article Accepted Version Creative Commons: Attribution-Noncommercial-No Derivative Works 4.0 Watts, N., Amann, M., Ayeb-Karlsson, S., Belesova, K., Bouley, T., Boykoff, M., Byass, P., Cai, W., Campbell- Lendrum, D., Chambers, J., Cox, P. M., Daly, M., Dasandi, N., Davies, M., Depledge, M., Depoux, A., Dominguez-Salas, P., Drummond, P., Ekins, P., Flahault, A., Frumkin, H., Georgeson, L., Ghanei, M., Grace, D., Graham, H., Grojsman, R., Haines, A., Hamilton, I., Hartinger, S., Johnson, A., Kelman, I., Kiesewetter, G., Kniveton, D., Liang, L., Lott, M., Lowe, R., Mace, G., Odhiambo Sewe, M., Maslin, M., Mikhaylov, S., Milner, J., Latifi, A. M., Moradi-Lakeh, M., Morrissey, K., Murray, K., Neville, T., Nilsson, M., Oreszczyn, T., Owfi, F., Pencheon, D., Pye, S., Rabbaniha, M., Robinson, E., Rocklöv, J., Schütte, S., Shumake-Guillemot, J., Steinbach, R., Tabatabaei, M., Wheeler, N., Wilkinson, P., Gong, P., Montgomery, H. and Costello, A. (2018) The Lancet Countdown on health and climate change: from 25 years of inaction to a global transformation for public health. The Lancet, 391 (10120). pp. 581-630. ISSN 0140-6736 doi: https://doi.org/10.1016/S0140-6736(17)32464-9 Available at http://centaur.reading.ac.uk/73479/

Welcome message from author
This document is posted to help you gain knowledge. Please leave a comment to let me know what you think about it! Share it to your friends and learn new things together.
Transcript

The Lancet Countdown on health and climate change: from 25 years of inaction to a global transformation for public health Article
Accepted Version
Creative Commons: AttributionNoncommercialNo Derivative Works 4.0
Watts, N., Amann, M., AyebKarlsson, S., Belesova, K., Bouley, T., Boykoff, M., Byass, P., Cai, W., CampbellLendrum, D., Chambers, J., Cox, P. M., Daly, M., Dasandi, N., Davies, M., Depledge, M., Depoux, A., DominguezSalas, P., Drummond, P., Ekins, P., Flahault, A., Frumkin, H., Georgeson, L., Ghanei, M., Grace, D., Graham, H., Grojsman, R., Haines, A., Hamilton, I., Hartinger, S., Johnson, A., Kelman, I., Kiesewetter, G., Kniveton, D., Liang, L., Lott, M., Lowe, R., Mace, G., Odhiambo Sewe, M., Maslin, M., Mikhaylov, S., Milner, J., Latifi, A. M., MoradiLakeh, M., Morrissey, K., Murray, K., Neville, T., Nilsson, M., Oreszczyn, T., Owfi, F., Pencheon, D., Pye, S., Rabbaniha, M., Robinson, E., Rocklöv, J., Schütte, S., ShumakeGuillemot, J., Steinbach, R., Tabatabaei, M., Wheeler, N., Wilkinson, P., Gong, P., Montgomery, H. and Costello, A. (2018) The Lancet Countdown on health and climate change: from 25 years of inaction to a global transformation for public health. The Lancet, 391 (10120). pp. 581630. ISSN 01406736 doi: https://doi.org/10.1016/S01406736(17)324649 Available at http://centaur.reading.ac.uk/73479/

It is advisable to refer to the publisher’s version if you intend to cite from the work. Published version at: http://dx.doi.org/10.1016/S01406736(17)324649
To link to this article DOI: http://dx.doi.org/10.1016/S01406736(17)324649
Publisher: Elsevier
All outputs in CentAUR are protected by Intellectual Property Rights law, including copyright law. Copyright and IPR is retained by the creators or other copyright holders. Terms and conditions for use of this material are defined in the End User Agreement .
www.reading.ac.uk/centaur
CentAUR
Central Archive at the University of Reading
Reading’s research outputs online

1
The 2017 Report of 1
The Lancet Countdown on 2
Health and Climate Change 3 4
5
From 25 years of inaction to a global 6
transformation for public health 7
8
9
Nick Watts, Markus Amann, Sonja Ayeb-Karlsson, Kristine Belesova, Timothy Bouley, Maxwell Boykoff, Peter 10 Byass, Wenjia Cai, Diarmid Campbell-Lendrum, Jonathan Chambers, Peter M Cox, Meaghan Daly, Niheer 11 Dasandi, Michael Davies, Michael Depledge, Anneliese Depoux, Paula Dominguez-Salas, Paul Drummond, Paul 12 Ekins, Antoine Flahault, Howard Frumkin, Lucien Georgeson, Mostafa Ghanei, Delia Grace, Hilary Graham, 13 Rébecca Grojsman, Andy Haines, Ian Hamilton, Stella Hartinger, Anne Johnson, Ilan Kelman, Gregor 14 Kiesewetter, Dominic Kniveton, Lu Liang, Melissa Lott, Robert Lowe, Georgina Mace, Maquins Odhiambo Sewe, 15 Mark Maslin, Slava Mikhaylov, James Milner, Ali Mohammad Latifi, Maziar Moradi-Lakeh, Karyn Morrissey, 16 Kris Murray, Tara Neville, Maria Nilsson, Tadj Oreszczyn, Fereidoon Owfi, David Pencheon, Steve Pye, Mahnaz 17 Rabbaniha, Elizabeth Robinson, Joacim Rocklöv, Stefanie Schütte, Joy Shumake-Guillemot, Rebecca Steinbach, 18 Meisam Tabatabaei, Nicola Wheeler, Paul Wilkinson, Peng Gong*, Hugh Montgomery*, Anthony Costello* 19
* Denotes Co-Chair 20
21
[Current Word Count: 21,749 22
(excluding figures, captions, tables, references and executive summary)] 23
24
2
Table of Contents 25
List of Figures, Tables, and Panels .......................................................................................................... 5 26
List of Figures ...................................................................................................................................... 5 27
List of Tables ....................................................................................................................................... 7 28
List of Panels ....................................................................................................................................... 7 29
List of Abbreviations ............................................................................................................................... 9 30
Executive Summary ............................................................................................................................... 10 31
Introduction .......................................................................................................................................... 14 32
Indicators of Progress on Health and Climate Change ..................................................................... 14 33
Delivering the Paris Agreement for Better Health ............................................................................ 16 34
1. Climate Change Impacts, Exposures and Vulnerability ..................................................................... 18 35
Introduction ...................................................................................................................................... 18 36
Indicator 1.1: Health effects of temperature change ................................................................... 19 37
Indicator 1.2: Health effects of heatwaves ................................................................................... 20 38
Indicator 1.3: Change in labour capacity ...................................................................................... 22 39
Indicator 1.4: Lethality of weather-related disasters ................................................................... 24 40
Indicator 1.5: Global health trends in climate-sensitive diseases ................................................ 26 41
Indicator 1.6: Climate-sensitive infectious diseases ..................................................................... 27 42
Indicator 1.7: Food security and undernutrition .......................................................................... 29 43
Indicator 1.7.1: Vulnerability to undernutrition ........................................................................... 30 44
Indicator 1.7.2: Marine primary productivity ............................................................................... 31 45
Indicator 1.8: Migration and population displacement ................................................................ 32 46
Conclusion ......................................................................................................................................... 34 47
2. Adaptation Planning and Resilience for Health ................................................................................ 36 48
Introduction ...................................................................................................................................... 36 49
Indicator 2.1: National adaptation plans for health ..................................................................... 36 50
Indicator 2.2: City-level climate change risk assessments ............................................................ 38 51
Indicator 2.3: Detection and early warning of, preparedness for, and response to climate related 52
health emergencies ....................................................................................................................... 39 53
Indicator 2.4: Climate information services for health ................................................................. 43 54
Indicator 2.5: National assessments of climate change impacts, vulnerability, and adaptation for 55
health ............................................................................................................................................ 44 56
Indicator 2.6: Climate-resilient health infrastructure ................................................................... 45 57
Conclusion ......................................................................................................................................... 46 58
3. Mitigation Actions and Health Co-Benefits ....................................................................................... 46 59
Introduction ...................................................................................................................................... 47 60

3
Tracking the health co-benefits of climate change mitigation ......................................................... 47 61
Energy Supply and Demand Sectors ................................................................................................. 48 62
Indicator 3.1: Carbon intensity of the energy system .................................................................. 48 63
Indicator 3.2: Coal phase-out ........................................................................................................ 49 64
Indicator 3.3: Zero-carbon emission electricity ............................................................................ 51 65
Indicator 3.4: Access to clean energy ........................................................................................... 52 66
Indicator 3.5: Exposure to ambient air pollution .......................................................................... 53 67
3.5.1: Exposure to air pollution in cities ....................................................................................... 53 68
3.5.2: Sectoral contributions to air pollution ................................................................................ 55 69
3.5.3: Premature mortality from ambient air pollution by sector ................................................ 57 70
Transport Sector ............................................................................................................................... 58 71
Indicator 3.6: Clean fuel use for transport .................................................................................... 58 72
Indicator 3.7: Sustainable travel infrastructure and uptake ......................................................... 59 73
Food and agriculture ......................................................................................................................... 62 74
Indicator 3.8: Ruminant meat for human consumption ............................................................... 62 75
Healthcare sector .............................................................................................................................. 64 76
Indicator 3.9: Healthcare sector emissions ................................................................................... 64 77
Conclusion ......................................................................................................................................... 65 78
4. Finance & Economics ........................................................................................................................ 66 79
Introduction ...................................................................................................................................... 66 80
Indicator 4.1: Investments in zero-carbon energy and energy efficiency .................................... 67 81
Indicator 4.2: Investment in coal capacity .................................................................................... 68 82
Indicator 4.3: Funds divested from fossil fuels ............................................................................. 69 83
Indicator 4.4: Economic losses due to climate-related extreme events ...................................... 69 84
Indicator 4.5: Employment in low-carbon and high-carbon industries ........................................ 72 85
Indicator 4.6: Fossil fuel subsidies ................................................................................................ 73 86
Indicator 4.7: Coverage and strength of carbon pricing ............................................................... 74 87
Indicator 4.8: Use of carbon pricing revenues .............................................................................. 75 88
Indicator 4.9: Spending on adaptation for health and health-related activities .......................... 76 89
Indicator 4.10: Health adaptation funding from global climate financing mechanisms .............. 78 90
Conclusion ......................................................................................................................................... 79 91
5. Public and Political Engagement ....................................................................................................... 81 92
Introduction ...................................................................................................................................... 81 93
Indicator 5.1: Media coverage of health and climate change ...................................................... 81 94
5.1.1: Global newspaper reporting on health and climate change .............................................. 82 95
5.1.2: In-depth analysis of newspaper coverage on health and climate change .......................... 83 96

4
Indicator 5.2: Health and climate change in scientific journals .................................................... 83 97
Indicator 5.3: Health and climate change in the United Nations General Assembly ................... 85 98
Conclusion ......................................................................................................................................... 86 99
Conclusion - the Lancet Countdown in 2017 ........................................................................................ 88 100
The direction of travel is set ............................................................................................................. 88 101
References ............................................................................................................................................ 90 102
103
104

5
List of Figures, Tables, and Panels 105
106
List of Figures 107
Figure 1.1 Mean summer warming from 2000 to 2016 area weighted and exposure weighted, 108
relative to the 1986-2008 recent past average. 109
Figure 1.2 The change in exposure (in people aged over 65 years) to heatwaves from 2000 to 2016, 110
relative to the heatwave exposure average from 1986-2008. 111
Figure 1.3 The area and exposure weighted change in mean heatwave lengths globally from 2000 to 112
2016 (in people aged over 65 years), relative to the 1986-2008 recent past average. 113
Figure 1.4 The exposure weighted labour capacity change (%) globally from 2000 to 2016, relative to 114
the 1986-2008 recent past average. 115
Figure 1.5 Map of the change in labour capacity loss from 2000 to 2016, relative to the 1986-2008 116
recent past average. 117
Figure 1.6 Deaths and people affected by weather-related disasters. 1.6a) Percentage change over 118
time in the global number of deaths, the number of those affected, and the ratio of these (measured 119
against 1990-2009). 1.6b) Change over time in the number of people affected globally by different 120
weather-related disasters. 121
Figure 1.7 Trends in mortality from selected causes of death as estimated by the Global Burden of 122
Disease 2015, for the period 1990 to 2015, by WHO region. 123
Figure 1.8 Left: Academic publications reporting climate-sensitive infectious diseases by year. Right: 124
proportion of responses reported in publications by year and direction of impact. 125
Figure 1.9 Average annual vectorial capacity (VC) for dengue in Aedes aegypti and Aedes albopictus 126
for selected Aedes-positive countries (countries with Aedes present) (top panel; matrix coloured 127
relative to country mean 1950-2015; red = relatively higher VC, blue = relatively lower VC; countries 128
ordered by centroid latitude (north to south)). Bottom panel: average vectorial capacity (VC) for 129
both vectors calculated globally (results shown relative to 1990 baseline). 130
Figure 1.10 Total number of undernourished people multiplied by regional dependency on grain 131
production for countries. 132
Figure 2.1 Countries with national heath climate adaptation strategies or plans. 133
Figure 2.2 Number of global cities undertaking climate change risk assessments by a) income 134
grouping, and b) WHO region. 135
Figure 2.3 IHR Core Capacity Requirement by WHO region 2.3a) Percentage attainment of human 136
resources available to implement the International Health Regulations Core Capacity Requirements. 137
2.3b) Percentage attainment of having indicator-based surveillance for early warning function for 138
the early detection of a public health event. 2.3c) Percentage attainment for having a multi-hazard 139
public health emergency preparedness and response plan developed and implemented. 2.3d) 140
Percentage attainment of having a public health emergency response mechanisms established and 141
functioning. 142

6
Figure 2.4 National Meteorological and Hydrological Services (NHMSs) of WHO member states 143
reporting to provide targeted/tailored climate information, products and services to the health 144
sector. 145
Figure 2.5 Countries with national assessment of climate change impacts, vulnerability and 146
adaptation for health. 147
Figure 2.6 Countries taking measures to increase the climate resilience of health infrastructure. 148
Figure 3.1 Carbon intensity of Total Primary Energy Supply (TPES) for selected countries, and total 149
CO2 emissions (shaded area against secondary y-axis),1971-2013. 150
Figure 3.2 Total primary coal supply by region, and globally (shaded area against secondary y-axis), 151
1990-2013. 152
Figure 3.3 Renewable and zero-carbon emission energy sources electricity generation a) Share of 153
electricity generated from zero carbon sources; b) Electricity generated from zero carbon sources, 154
TWh; c) Share of electricity generated from renewable sources (excluding hydro); d) Electricity 155
generated from renewable sources (excl. hydro), TWh. 156
Figure 3.4 Proportion of population relying primarily on clean fuels and technology. 157
Figure 3.5 Annual mean PM2.5 concentration vs per capita GDP for 143 cities in the SHUE database. 158
Colours indicate WHO regions: blue – Africa; red – Europe; green – the Americas; Lime – Eastern 159
Mediterranean; orange – Western Pacific; purple – South East Asia. The dotted line marks the WHO 160
recommended guidance level of 10 µg.m-3. 161
Figure 3.6 Selected primary air pollutants and their sources globally in 2015. 162
Figure 3.7 a) Energy related PM2.5 emissions in 2015 and b) NOx emissions from transport from 163
1990-2010 by region. 164
Figure 3.8 Health impacts of exposure to ambient PM2.5 in terms of annual premature deaths per 165
million inhabitants in South and East Asian countries in 2015, broken down by key sources of 166
pollution. 167
Figure 3.9 Per capita fuel use by type (TJ/person) for transport sector with all fuels 168
Figure 3.10 Cumulative Global Electric Vehicle Sales. Note: BEV is Battery Electric Vehicle and PHEV is 169
Plug-in Hybrid Electric Vehicle. 170
Figure 3.11 Modal Shares in world cities. Note: ‘Other’ typically includes paratransit (transport for 171
people with disabilities) and/or electronic bikes. 172
Figure 3.12 Trends in modal share in selected cities. Note: Data from Santiago in 1991 represents 173
travel on a usual day; Data from Sydney represent Weekdays only; Cycling modal share in Sydney is 174
<1%. 175
Figure 3.13 The total amount of ruminant meat available for human consumption in kg/capita/year 176
by WHO-defined regions. 177
Figure 3.14 The proportion of energy (kcal/capita/day) available for human consumption from 178
ruminant meat vs from all food sources by WHO-defined regions. 179
Figure 4.1 Annual Investment in the Global Energy System. 180

7
Figure 4.2 Annual Investment in coal-fired power capacity. 181
Figure 4.3 Economic Losses from Climate-Related Events – Absolute. 182
Figure 4.4 Economic Losses from Climate-Related Events – Intensity. 183
Figure 4.5 Employment in Renewable Energy and Fossil Fuel Extraction. 184
Figure 4.6 Global Fossil Fuel Consumption Subsidies - 2010-2015. 185
Figure 4.7 Carbon Pricing Instruments implemented, scheduled for implementation and under 186
consideration. 187
Figure 4.8 For the financial year 2015-2016. 4.8a) Total health and health-related adaptation 188
spending and 4.8b) health and health-related adaptation and resilience to climate change (A&RCC) 189
spending as a proportion of GDP. All plots are disaggregated by World Bank Income Grouping. 190
Figure 4.9 Year on year multilateral and bilateral funding for all adaptation projects and health 191
adaptation projects (2003 through May 2017). 192
Figure 5.1 Newspaper reporting on health and climate change (for 18 newspapers) from 2007 to 193
2016, broken down by WHO region. 194
Figure 5.2 Number of scientific publications on climate change and health per year (2007-2016) from 195
PubMed and Web of Science journals. 196
Figure 5.3 Political engagement with the intersection of health and climate change, represented by 197
joint references to health and climate change in the UNGD. 198
Figure 5.4 Regional political engagement with the intersection of health and climate change, 199
represented by joint references to health and climate change in the UNGD, broken down by WHO 200
region. 201
202
List of Tables 203
Table 1 Thematic groups and indicators for the Lancet Countdown’s 2017 report. 204
Table 1.1 Locations migrating now due to only climate change. 205
Table 4.1 Carbon Pricing - Global Coverage and Weighted Average Prices. *Global emissions 206
coverage is based on 2012 total anthropogenic CO2 emissions. 207
Table 4.2. Carbon Pricing revenues and allocation in 2016. 208
209
List of Panels 210
Panel 1 Developing Lancet Countdown’s Indicators: An Iterative and Open Process. 211
Panel 1.1 Mental health and Climate Change. 212
Panel 2.1 WHO-UNFCCC Climate and Health Country Profiles. 213
Panel 2.2 The International Health Regulations. 214
Panel 3.1 Energy and Household Air Pollution in Peru. 215

8
Panel 4.1 International Donor Action on Climate Change and Health. 216

9
List of Abbreviations 217
A&RCC – Adaptation & Resilience to Climate 218 Change 219 AAP – Ambient Air Pollution 220 AUM – Assets Under Management 221 BEV – Battery Electric Vehicle 222 CDP – Carbon Disclosure Project 223 CFU – Climate Funds Update 224 CO2 – Carbon Dioxide 225 COP – Conference of the Parties 226 COPD – Chronic Obstructive Pulmonary 227 Disease 228 CPI – Consumer Price Indices 229 DALYs – Disability Adjusted Life Years 230 DPSEEA – Driving Force-Pressure-State-231 Exposure-Effect-Action 232 ECMWF – European Centre for Medium-233 Range Weather Forecasts 234 EJ – Exajoule 235 EM-DAT – Emergency Events Database 236 ERA – European Research Area 237 ETR – Environmental Tax Reform 238 ETS – Emissions Trading System 239 EU – European Union 240 EU28 – 28 European Union Member States 241 FAO – Food and Agriculture Organization of 242 the United Nations 243 FAZ – Frankfurter Allgemeine Zeitung 244 FISE – Social Inclusion Energy Fund 245 GBD – Global Burden of Disease 246 GDP – Gross Domestic Product 247 GHG – Greenhouse Gas 248 GtCO2 – Gigatons of Carbon Dioxide 249 GW – Gigawatt 250 GWP – Gross World Product 251 HAB – Harmful Algal Blooms 252 HIC – High Income Countries 253 ICS – Improved Cook Stove 254 IEA – International Energy Agency 255 IHR – International Health Regulations 256 IPC – Infection Prevention and Control 257 IPCC - Intergovernmental Panel on Climate 258 Change 259 IRENA - International Renewable Energy 260 Agency 261 LMICs – Low and Middle Income Countries 262 LPG – Liquefied Petroleum Gas 263 Mt – Megaton 264 MtCO2e – Metric Tons of Carbon Dioxide 265 Equivalent 266 NAP – National Adaptation Plan 267
NDCs = Nationally Determined Contributions 268 NHMSs – National Meteorological and 269 Hydrological Services 270 NHS- National Health Service 271 NOx – Nitrogen Oxide 272 OECD – Organization for Economic 273 Cooperation and Development 274 PHEV – Plug-in Hybrid Electric Vehicle 275 PM2.5 – Fine Particulate Matter 276 PV – Photovoltaic 277 SDG – Sustainable Development Goal 278 SDU – Sustainable Development Unit 279 SHUE – Sustainable Healthy Urban 280 Environments 281 SO2 – Sulphur Dioxide 282 SSS – Sea Surface Salinity 283 SST – Sea Surface Temperature 284 tCO2 – Tons of Carbon Dioxide 285 tCO2/TJ – Total Carbon Dioxide per Terajoule 286 TJ – Terajoule 287 TPES – Total Primary Energy Supply 288 TWh – Terawatt Hours 289 UN – United Nations 290 UNFCCC – United Nations Framework 291 Convention on Climate Change 292 UNGA – United Nations General Assembly 293 UNGD – United Nations General Debate 294 VC – Vectorial Capacity 295 WHO – World Health Organization 296 WMO – World Meteorological Organization297

10
298
Executive Summary 299
300
The Lancet Countdown tracks progress on the relationships between human health and climate 301
change, providing an independent assessment of global progress to implement the Paris Agreement, 302
and the health implications of these actions. 303
It follows on from the work of the 2015 Lancet Commission, which concluded that anthropogenic 304
climate change threatens to undermine the last 50 years of gains in public health, and conversely, 305
that a comprehensive response to climate change could be “the greatest global health opportunity 306
of the 21st century”. 307
The Lancet Countdown exists as a collaboration between 24 academic institutions and inter-308
governmental organisations, based in every continent, and with representation from a wide range of 309
disciplines, including: climate scientists, ecologists, economists, engineers, experts in energy, food 310
and transport systems, geographers, mathematicians, social and political scientists, public health 311
professionals, and physicians. The collaboration reports annual indicators across five domains: 312
climate change impacts, exposures and vulnerability; adaptation planning and resilience for health; 313
mitigation actions and health co-benefits; economics and finance; and public and political 314
engagement. 315
The 2017 key messages from its 40 indicators in its first annual report are summarised below. 316
317
The human symptoms of climate change are unequivocal and potentially irreversible – affecting 318
the health of populations around the world, today. Whilst these effects will disproportionately 319
impact the most vulnerable in society, every community will be affected. 320
The impacts of climate change are disproportionately affecting the health of vulnerable populations, 321
and those in low- and middle-income countries. By undermining the social and environmental 322
determinants that underpin good health, it exacerbates social, economic and demographic 323
inequalities with the effects eventually felt by all populations. 324
The evidence is clear that exposure to more frequent and intense heatwaves are increasing, with an 325
estimated 125 million additional vulnerable adults exposed to heatwaves from 2000 to 2016 326
(Indicator 1.2). Higher ambient temperatures have resulted in estimated reduction of 5.3% in labour 327
productivity, globally, from 2000 to 2016 (Indicator 1.3). Taken as a whole, a 44% increase in 328
weather-related disasters has been observed since 2000, with no clear upward or downward trend 329
in the lethality of these extreme events (Indicator 1.4), potentially suggesting the beginning of an 330
adaptive response to climate change. Yet, the impacts of climate change are projected to worsen 331
over time, with current levels of adaptation becoming insufficient in the future. The total value of 332
economic losses that resulted from climate-related events has been increasing since 1990, and 333
totalled $129 billion in 2016, with 99% of these losses in low-income countries uninsured (Indicator 334
4.4). Additionally, over the longer-term, altered climatic conditions are contributing to growing 335
vectorial capacity for the transmission of dengue fever by Aedes aegypti, reflecting an estimated 336
9.4% increase since 1950 (Indicator 1.6). 337

11
If governments and the global health community do not learn from the past experience of HIV/AIDS 338
and the recent outbreaks of Ebola and Zika virus, another slow response will result in an irreversible 339
and unacceptable cost to human health. 340
341
The delayed response to climate change over the past 25 years has jeopardised human life and 342
livelihoods. 343
Since the UN Framework Convention on Climate Change (UNFCCC) commenced global efforts to 344
tackle climate change in 1992, most of the indicators tracked by the Lancet Countdown have either 345
shown limited progress, particularly with regards to adaptation, or moved in the wrong direction, 346
particularly in relation to mitigation. Most fundamentally, carbon emissions, and global 347
temperatures, have continued to rise.. 348
A growing number of countries are assessing their vulnerabilities to climate change, and are 349
increasingly developing adaptation and emergency preparedness plans, and providing climate 350
information to health services (Indicators 2.1, 2.3-2.6). The same is seen at the city-level, with over 351
449 cities around the world reporting having undertaken a climate change risk assessment (Indicator 352
2.2). However, the coverage and adequacy of such measures in protecting against the growing risks 353
of climate change to health remains uncertain. Indeed, health and health-related adaptation funding 354
accounts for 4.6% and 13.3% of total global adaptation spending, respectively (Indicator 4.9). 355
Whilst there has been some recent progress in strengthening health resilience to climate impacts, it 356
is clear that adaptation to new climatic conditions can only protect up to a point; an analogy to 357
human physiology is useful here. The human body can adapt to insults caused by a self-limiting 358
minor illness with relative ease. However, where disease steadily worsens, positive feedback cycles 359
and limits to adaptation are quickly reached. This is particularly true when many systems are 360
affected, and where the failure of one system may impact on the function of another, as is the case 361
for ‘multi-organ system failure’, or where the body has already been weakened through repeated 362
previous diseases or exposures. The same is true for the health consequences of climate change. It 363
acts as a threat multiplier, compounding many of the issues communities already face, and 364
strengthening the correlation between multiple health risks, making them more likely to occur 365
simultaneously. Indeed, it is not a ‘single system disease’, instead, often acting to compound existing 366
pressures on housing, food and water security, poverty, and many of the determinants of good 367
health. Adaptation has limits, and prevention is better than cure to prevent potentially irreversible 368
effects of climate change. 369
Progress in mitigating climate change since the signing of the UNFCCC has been limited across all 370
sectors, with only modest improvements in carbon emission reduction from electricity generation. 371
Whilst there are increasing levels of sustainable travel in Europe and some evidence of decline in 372
dependence on private motor vehicles in cities in the USA and Australia, the situation is generally 373
less favourable in cities in emerging economies (Indicator 3.7). This, and a slow transition away from 374
highly-polluting forms of electricity generation, has yielded a modest improvement in air pollution in 375
some urban centres. However, global population-weighted PM2.5 exposure has increased by 11.2% 376
since 1990 and some 71.2% of the 2971 cities in the WHO air pollution database exceed 377
recommendations of annual fine particulate matter exposure (Indicator 3.5). The strength and 378
coverage of carbon pricing covers only 13.1% of global anthropogenic CO2 emissions, with the 379
weighted average carbon price of these instruments at 8.81USD/tCO2e in 2017 (Indicator 4.7). 380
Furthermore, responses to climate change have yet to fully take advantage of the health co-benefits 381

12
of mitigation and adaptation interventions, with action taken to-date only yielding modest 382
improvements in human wellbeing. In part, this reflects a need for further evidence and research on 383
these ancillary effects and the cost-savings available. However, it also reflects a need for more 384
joined-up policymaking across health and non-health ministries of national governments. 385
This delayed mitigation response puts the world on a ‘high-end’ emissions trajectory, resulting in 386
global warming of between 2.6°C and 4.8°C of warming by the end of the century. 387
388
The voice of the health profession is essential in driving forward progress on climate change and 389
realising the health benefits of this response. 390
This report, and previous Lancet Commissions, have argued that the health profession has not just 391
the ability but the responsibility to act as public health advocates, communicating the threats and 392
opportunities to the public and policymakers, and ensuring climate change is understood as being 393
central to human wellbeing. 394
There is evidence of growing attention to health and climate change in the media and in academic 395
publications, with global newspaper coverage of the issue increasing 78% and the number of 396
scientific papers more than tripling, since 2007 (Indicator 5.1.1 and 5.2). However, despite these 397
positive examples, the 2017 indicators make it clear that further progress is urgently required. 398
399
Whilst progress has historically been slow, the last five years have seen an accelerated response, 400
and the transition to low-carbon electricity generation now appears inevitable, suggesting the 401
beginning of a broader transformation. In 2017, momentum is building across a number of sectors, 402
and the direction of travel is set, with clear and unprecedented opportunities for public health. 403
In 2015, the Lancet Commission made 10 recommendations to governments, to accelerate action 404
over the following five years. The Lancet Countdown’s 2017 indicators track against these 2015 405
recommendations, with results suggesting that discernible progress has been made in many of these 406
areas, breathing life into previously stagnant mitigation and adaptation efforts. Alongside the Paris 407
Agreement, these provide reason to believe that a broader transformation is under way. 408
Recommendation 1) Invest in climate change and public health research: since 2007, the number of 409 scientific papers on health and climate change has more than trebled (Indicator 5.2). 410 411 Recommendation 2) Scale-up financing for climate-resilient health systems: spending on health 412 adaptation is currently at 4.63% (16.46 billion USD) of global adaptation spend; and in 2017, health 413 adaptation from global development and climate financing mechanisms is at an all-time high – 414 although absolute figures remain low (Indicators 4.9 and 4.10). 415 416 Recommendation 3) Phase-out coal-fired power: In 2015, more renewable energy capacity (150GW) 417 than fossil fuel capacity was added to the global energy mix. Overall, annual installed renewable 418 generation capacity (almost 2000 GW) exceeds that for coal, with about 80% of this recently added 419 renewable capacity located in China (Indicator 3.2). Whilst investment in coal capacity has increased 420 since 2006, in 2016 this turned and declined substantially (Indicator 4.1) and several countries have 421 now committed to phasing-out coal. 422 423 Recommendation 4) Encourage a city-level low-carbon transition, reducing levels of urban pollution: 424

13
Despite historically modest progress over the last two decades, the transport sector is approaching a 425 new threshold, with electric vehicles expected to reach cost-parity with their non-electric 426 counterparts by 2018 – a phenomenon that was not expected to occur until 2030 (Indicator 3.6). 427 428 Recommendation 6) Rapidly expand access to renewable energy, unlocking the substantial economic 429 gains available from this transition: Every year since 2015, more renewable energy has been added 430 to the global energy mix than all other sources, and in 2016, global employment in renewable energy 431 reached 9.8 million, over one million more than are employed in fossil fuel extraction. The transition 432 has become inevitable. However, in the same year, 1.2 billion people still did not have access to 433 electricity, with 2.7 billion people relying on the burning of unsafe and unsustainable solid fuels 434 (Indicators 3.3, 4.6 and 3.4). 435 436 Recommendation 9) Agree and implement an international treaty which facilitates the transition to a 437 low-carbon economy: In December 2015, 195 countries signed the Paris Agreement, which provides 438 a framework for enhanced mitigation and adaptation, and pledges to keep the global mean 439 temperature rise to “well below 2°C”. Going forward, a formal Health Work Programme within the 440 UNFCCC would provide a clear and essential entry point for health professionals at the national 441 level, ensuring that the implementation of the Paris Agreement maximises the health opportunities 442 for populations around the world. 443 444
Following the United States government’s announced intention to withdraw from the Paris 445
Agreement, the global community has demonstrated overwhelming support for enhanced action on 446
climate change, affirming clear political will and ambition to reach the treaty’s targets. The 447
mitigation and adaptation interventions committed to under the Paris Agreement have 448
overwhelmingly positive short- and long-term health benefits, but greater ambition is now essential. 449
Whilst progress has been historically slow, there is evidence of a recent turning point, with 450
transitions in sectors crucial to public health accelerating towards a low-carbon world. Whilst these 451
efforts must be greatly accelerated and sustained over the coming decades in order meet these 452
commitments, recent policy changes and the indicators presented here suggest that the direction of 453
travel is set. 454
From 2017 until 2030, the Lancet Countdown: Tracking Progress on Health and Climate Change will 455
continue its work, reporting annually on progress implementing the commitments of the Paris 456
Agreement, future commitments that build on them, and the health benefits that result. 457

14
Introduction 458
Climate change has serious implications for our health, wellbeing, livelihoods and the structure of 459
organised society. Its direct effects result from rising temperatures, and changes in the frequency 460
and strength of storms, floods, droughts, and heatwaves – with physical and mental health 461
consequences. Its impacts will also be mediated through less direct pathways, including changes in 462
crop yields, the burden and distribution of infectious disease, and in climate-induced population 463
displacement and violent conflict.1-3 Whilst many of these effects are already being experienced, 464
their progression in the absence of climate change mitigation will greatly amplify existing global 465
health challenges and inequalities.4 It threatens to undermine many of the social, economic and 466
environmental drivers of health, which have contributed greatly to human progress. 467
Urgent and substantial climate change mitigation will help to protect human health from the worst 468
of these impacts, with a comprehensive and ambitious response to climate change potentially 469
transforming the health of the world’s populations.4 The potential benefits and opportunities are 470
enormous, including cleaning up the air of polluted cities, delivering more nutritious diets, ensuring 471
energy, food and water security, and alleviating poverty and social and economic inequalities. 472
Monitoring this transition – from threat to opportunity – is the central role of the Lancet 473
Countdown: Tracking Progress on Health and Climate Change.5 The collaboration exists as a 474
partnership of 24 academic institutions from every continent, and brings together individuals with a 475
broad range of expertise across disciplines (including climate scientists, ecologists, mathematicians, 476
geographers, engineers, energy, food, and transport experts, economists, social and political 477
scientists, public health professionals, and physicians). The Lancet Countdown aims to track a series 478
of indicators of progress, publishing an annual ‘health check’, from now until 2030, on the state of 479
the climate, progress made in meeting global commitments under the Paris Agreement, and 480
adapting and mitigating to climate change (Panel 1). The initiative was formed following the 2015 481
Lancet Commission, which concluded that “tackling climate change could be the greatest global 482
health opportunity of the 21st century”.4 It builds on, and reinforces, the work of the expanding 483
group of researchers, health practitioners, national governments, and the World Health Organization 484
(WHO), who are working to ensure that this opportunity becomes a reality. 485
486
Indicators of Progress on Health and Climate Change 487
In 2016, the Lancet Countdown proposed a set of potential indicators to be monitored, launching a 488
global consultation to define a conclusive set for 2017.5 A number of factors determined the 489
selection of indicators, including: (i) their relevance to public health, both in terms of the impacts of 490
climate change on health, and the health effects of the response to climate change; (ii) their 491
relevance to the main anthropogenic drivers of climate change; (iii) their geographical coverage and 492
relevance to a broad range of countries and income-groups; (iv) data availability; and (v) resource 493
and timing constraints. Table 1 divides these into broad themes, aligned with the global action 494
agenda on climate change and health, agreed at the Second WHO Global Conference on Health and 495
Climate, Paris, July 2016: climate change impacts, exposures, and vulnerabilities; adaptation 496
planning and resilience for health; mitigation actions and health co-benefits; economics and finance; 497
and public and political engagement.6 498
Panel 1 Developing Lancet Countdown’s Indicators: An Iterative and Open Process. 499
The development of the Lancet Countdown’s indicators took a pragmatic approach, taking in to 500
account the considerable limitations in data availability, resources, and time. Consequently, the 501

15
indicators presented here represent what is feasible for 2017 and will evolve over time in response 502
to feedback and data improvements. 503
The purpose of this collaboration is to track progress on the links between public health and climate 504
change, and yet, much of the data analysed here was originally collected for purposes not directly 505
relevant to health. Initial analysis therefore principally captures changes in exposure, states, or 506
processes, as proxies for health outcomes – the ultimate goal. Employing new methodologies to 507
improve attribution to climate change is a particular priority. Subsequent reports will see the Lancet 508
Countdown set 2030 targets for its indicators which align more directly with the Paris Agreement, 509
allowing an assessment of its implementation over the course of the next 13 years. 510
The indicators presented thus far are the beginning of an ongoing, iterative and open process, which 511
will work to continuously improve as capacity, data quality, and methods evolve. The objectives of 512
the Lancet Countdown are both ambitious and essential, requiring support from a broad range of 513
actors. To this end, the collaboration welcomes support from academic institutions and technical 514
experts able to provide new analytical methods and novel data sets with appropriate geographical 515
coverage. Appendix 1 provides a short overview of several parallel and complementary processes 516
currently underway. 517
Throughout this report, the results and analysis of each indicator are presented alongside a brief 518
description of the data sources and methods. A more complete account of each indicator can be 519
found in the corresponding appendices. For a number of areas – such as the mental health impacts 520
of climate change, or hydrological mapping of flood exposure – a robust methodology for an annual 521
indicator has not been reported, reflecting the complexity of the topic and the paucity of data, 522
rather than its lack of importance. Table 1 provides a summary of the 2017 indicators, with a more 523
complete overview of these indicators provided in the supplementary online material. The thematic 524
groups and indicator titles provide an overview of the domain being tracked, allowing for the growth 525
and development of these metrics – for example, to more directly capture health outcomes – in 526
subsequent years. 527
528
Thematic Group Indicators
1. Climate Change Impacts, Exposures and Vulnerability
1.1. Health effects of temperature change
1.2. Health effects of heatwaves
1.3. Change in labour capacity
1.4. Lethality of weather-related disasters 1.5. Global health trends in climate-sensitive diseases
1.6. Climate-sensitive infectious diseases
1.7. Food security and undernutrition
1.7.1. Vulnerability to undernutrition
1.7.2. Marine primary productivity
1.8. Migration and population displacement
2. Adaptation Planning and Resilience for Health
2.1. National adaptation plans for health
2.2. City-level climate change risk assessments
2.3. Detection and early warning of, preparedness for, and response to health emergencies
2.4. Climate information services for health
2.5. National assessment of vulnerability, impacts and adaptation for health
2.6. Climate-resilient health infrastructure
3. Mitigation Actions and Health Co-Benefits
3.1. Carbon intensity of the energy system
3.2. Coal phase-out
3.3. Zero-carbon emission electricity
16
3.4. Access to clean energy
3.5. Exposure to ambient air pollution
3.5.1. Exposure to air pollution in cities
3.5.2. Sectoral contributions to air pollution
3.5.3. Premature mortality from ambient air pollution by sector
3.6. Clean fuel use for transport
3.7. Sustainable travel infrastructure and uptake
3.8. Ruminant meat for human consumption
3.9. Healthcare sector emissions
4. Economics and Finance 4.1. Investments in zero-carbon energy and energy efficiency
4.2. Investment in coal capacity
4.3. Funds divested from fossil fuels
4.4. Economic losses due to climate-related extreme events
4.5. Employment in low-carbon and high-carbon industries
4.6. Fossil fuel subsidies
4.7. Coverage and strength of carbon pricing
4.8. Use of carbon pricing revenues
4.9. Spending on adaptation for health and health-related activities
4.10. Health adaptation funding from global climate financing mechanisms
5. Public and Political Engagement
5.1. Media coverage of health and climate change
5.1.1. Global newspaper reporting on health and climate change
5.1.2. In-depth analysis of newspaper coverage on health and climate change
5.2. Health and climate change in scientific journals
5.3. Health and climate change in the United Nations General Assembly
Table 1 Thematic groups and indicators for the Lancet Countdown’s 2017 report. 529
530
531
Delivering the Paris Agreement for Better Health 532
The Paris Agreement has been ratified at the national level by 153 of 197 parties to the UNFCCC, and 533
currently covers 84.7% of greenhouse gas (GHG) emissions. It set out a commitment of ambitious 534
GHG emissions reduction to limit climate change to well below a global average temperature rise of 535
2°C above pre-industrial levels, with an aim to limit temperature increases to 1.5°C.7 536
Most countries (187) have committed to near-term GHG emission reduction actions up to 2030, 537
through their Nationally Determined Contributions (NDCs). Article 4 paragraph 2 of the Paris 538
Agreement states that each signatory “shall prepare, communicate and maintain successive 539
nationally determined contributions that it intends to achieve”.7 However, the NDCs of the 153 540
parties that have ratified the agreement currently fall short of the necessary reductions by 2030 to 541
meet the 2°C pathway.8 542
The Lancet Countdown’s indicators place national decisions within a broader context. They highlight 543
the fact that globally, total power capacity of ‘pre-construction’ coal (commitments for new coal 544
power plants) has halved from 2016 to 2017 alone; that every year since 2015, more renewable 545
energy has been added to the global energy mix than all other sources combined; its installed costs 546
continue to fall (with solar photovoltaic (PV) electricity generation now being cheaper than 547
conventional fossil fuels in an ever growing number of countries); electric vehicles are poised to 548
reach cost-parity with their petrol-based counterparts; and in 2016 global employment in renewable 549
energy reached 9.8 million, over one million greater than that in fossil fuel extraction. 550

17
These positive examples in recent years must not mask the dangerous consequences of failing to 551
meet the Paris Agreement, the past two decades of relative inaction, the economies and sectors 552
currently lagging behind, and the enormity of the task ahead, which leave achieving the Agreement’s 553
aims in a precarious position. Indeed, much of the data presented should serve as a wake-up call to 554
national governments, businesses, civil society, and the health profession. 555
However, as this report demonstrates, the world has already begun to embark on a path to a low-556
carbon and healthier world. Whilst the pace of action must greatly accelerate, the direction of travel 557
is set. 558

18
1. Climate Change Impacts, Exposures and Vulnerability 559
560
Introduction 561
This section provides a set of indicators that track health impacts related to anthropogenic climate 562
change. Such impacts are dependent upon the nature and scale of the hazard, the extent and nature 563
of human exposure to them, and the underlying vulnerability of the exposed population.9 Thus, 564
these indicators aim to measure exposure to climatic hazards and vulnerabilities of people to them, 565
and over time, quantify the health impacts of climate change. These, in turn, inform protective 566
adaptation and mitigation interventions (sections two and three), the economic and financial tools 567
available to enable such responses (section four), and the public and political engagement that 568
facilitates them (section five). 569
Climate change affects human health primarily through three pathways: direct; ecosystem-570
mediated; and human-institution-mediated.10 Direct effects are diverse, being mediated, for 571
instance, by increases in the frequency, intensity, and duration of extreme heat, and by rises in 572
average annual temperature experienced (leading to, for instance, increased heat-related mortality). 573
Rising incidence of other extremes of weather, such as flood and storms, increase the risk of 574
drowning and injury, damage to human settlements, the spread of water-borne disease, and mental 575
health sequelae.10 Ecosystem-mediated impacts include changes in the distribution and burden of 576
vector-borne diseases (such as malaria and dengue) and food and water-borne infectious disease. 577
Human undernutrition from crop failure, population displacement from sea-level rise, and 578
occupational health risks are examples of human-institution-mediated impacts. 579
Whilst the literature, and indeed some of the data presented here has traditionally focused on 580
impacts such as the spread of infectious diseases and mortality from extremes of weather, the 581
health effects from non-communicable diseases are just as important. Mediated through a variety of 582
pathways, they take the form of cardiovascular disease and acute and chronic respiratory disease 583
from worsening air pollution and aero-allergens, or the often-unseen mental health effects of 584
extreme weather events, or of population displacement.11,12 Indeed, emerging evidence is exploring 585
links between a rising incidence of chronic kidney disease, dehydration, and climate change.13,14 586
Eight indicators were selected and developed for this section: 587
1.1 Health effects of temperature change 588
1.2 Health effects of heatwaves 589
1.3 Change in labour capacity 590
1.4 Lethality of weather-related disasters 591
1.5 Global health trends in climate-sensitive diseases 592
1.6 Exposure to climate-sensitive infectious diseases 593
1.7 Food security and undernutrition 594
1.8 Migration and population displacement 595
596
Appendix 2 provides a more detailed discussion on the data and methods used, as well as the 597
limitations and challenges encountered in the selection of each indicator. The indirect indicators (1.5 598
to 1.8) each provide a ’proof of concept’, rather than being fully comprehensive, focusing variably on 599
a specific diseases, populations, or locations. Additionally, future iterations of the Lancet 600
Countdown’s work will seek to capture indicators of the links between climate change and air 601
pollution, and with mental ill-health. 602

19
Indicator 1.1: Health effects of temperature change 603 Headline Finding: People experience far more than the global mean temperature rise. Between 2000 604
and 2016, human exposure to warming was about 0.9oC - more than double the global area average 605
temperature rise over the same period. 606
Rising temperatures can exacerbate existing health problems among populations and also introduce 607
new health threats (including cardiovascular disease and chronic kidney disease). The extent to 608
which human populations are exposed to this change, and thus the health implications of 609
temperature change, depend on the detailed spatial-temporal trends of population and temperature 610
over time. 611
Temperature anomalies were calculated relative to 1986 to 2008, from the European Research Area 612
(ERA) produced by the European Centre for Medium-Range Weather Forecasts (ECMWF).15 This 613
dataset uses climate reanalysis to give a description of recent climate, produced by combining 614
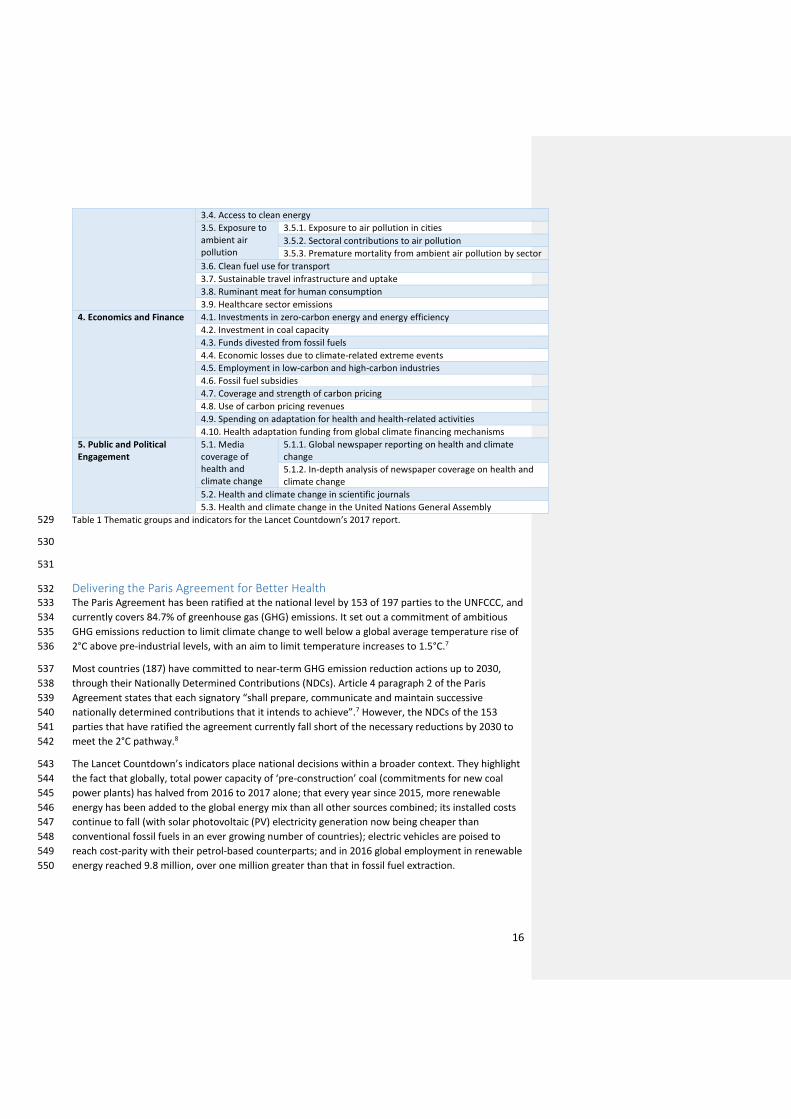
models with observations.16 The time series shown in Figure 1.1 are global mean temperatures 615
calculated from the gridded data, weighted by area (to avoid bias from measurements near the 616
poles) and by population (to show the number of people exposed); these are described as “area 617
weighted” and “exposure weighted”, respectively. 618
Changes in population were obtained per country and the data projected onto the gridded 619
population.17 Figure 1.1 shows area- (yellow lines) and exposure-weighted (blue lines) changes in 620
mean summer temperatures since 2000. Exposure-weighted warming from 2000 to 2016 (0.9oC) is 621
much higher than the area-weighted warming (0.4oC) over the same period. Hence, mean exposure 622
to warming is more than double the global warming since 2000. 623
The increase in exposure relative to the global average is driven partly by growing population 624
densities in India, parts of China and Sub-Saharan Africa. Accounting for population when assessing 625
temperature change provides a vital insight into how human wellbeing is likely to be affected by 626
temperature change, with the analysis here showing that temperature change where people are 627
living is much higher than average global warming. Details of the global distribution of this warming 628
can be found in Appendix 2. 629
630
20
631
Figure 1.1 Mean summer warming from 2000 to 2016 area weighted and exposure weighted, relative to the 632 1986-2008 recent past average. 633
634
Indicator 1.2: Health effects of heatwaves 635 Headline Finding: Between 2000 and 2016, the number of vulnerable people exposed to heatwave 636
events has increased by approximately 125 million, with a record 175 million more people exposed to 637
heatwaves in 2015. 638
The health impacts of extremes of heat range from direct heat stress and heat stroke, through to 639
exacerbations of pre-existing heart failure, and even an increased incidence of acute kidney injury 640
resulting from dehydration in vulnerable populations. The elderly, children under the age of 12 641
months, and people with chronic cardiovascular and renal disease are particularly sensitive to these 642
changes.10 643
Here, a heatwave is defined as a period of more than 3 days where the minimum temperature is 644
greater than the 99th percentile of the historical minima (1986-2008 average).18 This metric 645
therefore focuses on periods of high night-time temperatures, which are critical in denying 646
vulnerable people vital recuperation between hot days. Heatwave data were calculated against the 647
historical period 1986-2008. The population for the exposure calculations was limited to people over 648
the age of 65 (as this age group is most vulnerable to the health impacts of heatwaves), which was 649
obtained on a per-country basis from the UN World Population Prospects archives for each year 650
considered. 651
Figure 1.2 shows the increase in total exposure to heatwaves over the 2000-2016 period (one 652
heatwave experienced by one person). In 2015, the highest number of exposure events was 653
recorded, with approximately 175 million additional people exposed to heatwaves. Figure 1.3 shows 654
how the mean number of heatwave days experienced by people during any one heatwave 655
(exposure-weighted) increases at a much faster rate than the global mean (area-weighted) number 656

21
of heatwave days per heatwave; this is due to high populations densities in areas where heatwaves 657
have occurred. 658
659
660
Figure 1.2 The change in exposure (in people aged over 65 years) to heatwaves from 2000 to 2016, relative to 661 the heatwave exposure average from 1986-2008. 662
663

22
664
Figure 1.3 The area and exposure weighted change in mean heatwave lengths globally from 2000 to 2016 (in 665 people aged over 65 years), relative to the 1986-2008 recent past average. 666
667
Indicator 1.3: Change in labour capacity 668 Headline Finding: Global labour capacity in populations exposed to temperature change is estimated 669
to have decreased by 5.3% from 2000 to 2016. 670
Higher temperatures pose significant threats to occupational health and labour productivity, 671
particularly for those undertaking manual labour outside in hot areas. This indicator shows the 672
change in labour capacity (and thus productivity) globally and specifically for rural regions, weighted 673
by population (see Appendix 2 for details). Reductions in labour capacity have important 674
implications for the livelihoods of individuals, families, and communities, with particular impacts on 675
those relying on subsistence farming. 676
Labour capacity was estimated in the manner documented by Watts et al. (2015), based on wet bulb 677
globe temperatures.4 Figure 1.4 shows the estimated change in outdoor labour productivity 678
represented as a percentage relative to the reference period (1986-2008), with 0% implying no 679
change. Labour capacity is estimated to have decreased by 5.3% between 2000 and 2016, with a 680
dramatic decrease of over 2% between 2015 and 2016. Although there are some peaks of increased 681
labour capacity (notably 2000, 2004 and 2008), the overwhelming trend is one of reduced capacity 682
(Figure 1.4). These effects are most notable in some of the most vulnerable countries in the world 683
(Figure 1.5). 684

23
685
Figure 1.4 The exposure weighted labour capacity change (%) globally from 2000 to 2016, relative to the recent 686 past (1986-2008) average 687
688
689
Figure 1.5 Map of the change in labour capacity loss from 2000 to 2016, relative to the recent past (1986-2008) 690 average. 691
692
This indicator currently only captures the effects of heat on rural labour capacity. The Lancet 693
Countdown will work to expand this metric in the future to capture impacts on labour capacity in 694
other sectors, including manufacturing, construction, transportation, tourism and agriculture. 695
Through collaboration with HEAT-SHIELD, the Lancet Countdown will work to develop this process 696
going forward, providing more detailed analysis of labour capacity loss and the health implications of 697
heat and heatwaves, globally.19,20 698

24
Indicator 1.4: Lethality of weather-related disasters 699 Headline Finding: Despite a 46% increase in annual weather-related disasters from 2007 to 2016, 700
compared with the 1990-1999 average, there has been no accompanying increase in the number of 701
deaths, nor in those affected by disasters, nor in the ratio of these two outcomes. 702
Weather-related events have been associated with over 90% of all disasters worldwide over the last 703
twenty years. As expected, considering its population and area, the continent most affected by 704
weather-related disasters is Asia, with some 2,843 events between 1990-2016 affecting 4.8 billion 705
people and killing 505,013. Deaths from natural hazard-related disasters are largely concentrated in 706
poorer countries.21 Crucially, this must be understood in the context of potentially overwhelming 707
health impacts of future climate change, worsening significantly over the coming years. Indeed, the 708
2015 Lancet Commission estimated an additional 1.4 billion drought exposure events, and 2.3 billion 709
flood exposure events occurring by the end of the century – demonstrating clear public health limits 710
to adaptation.4 711
Disaster impact is a function of hazard and vulnerability, with vulnerability from a climate change 712
perspective sometimes defined as a function of exposure, sensitivity, and adaptive capacity.22 This 713
indicator measures the ratio of the number of deaths, to the number of people affected by weather-714
related disasters. Weather-related disasters included are: droughts, floods, extreme temperature 715
events, storms and wildfires. The health impacts of weather-related disasters expand beyond 716
mortality alone, including injuries, mental health impacts, spread of disease, and food and water 717
insecurity. Data for the calculations for this indicator come from the Emergency Events Database 718
(EM-DAT).23,24 Here, in line with the EM-DAT data used for analysis, a disaster is defined as either: 1) 719
10 or more people reported killed, 2) 100 or more people affected, 3) a declaration of a state of 720
emergency, or 4) a call for international assistance. 721
Between 1994 and 2013, the frequency of reported weather-related events (mainly floods and 722
storms) increased significantly. However, this trend may be partially accounted for by information 723
systems having improved in the last 35 years, and statistical data are now more available as a result 724
of increased socio-cultural sensitivity to disaster consequences and occurrence.25 From 2007 to 725
2016, EM-DAT recorded an average of 306 weather-related disasters per annum, up 46% from the 726
1990-1999 average. However, owing to impressive poverty reduction and health adaptation efforts, 727
this has not yet been accompanied by any discernible trend in number of deaths, nor in those 728
affected by disasters, nor in the ratio of these two (Figure 1.6a). Indeed, separating out the disasters 729
by the type of climate and weather hazard associated with the disaster (Figure 1.6b) shows there has 730
been a statistically significant global decrease in the numbers affected by floods, equating to a 731
decrease of 3 million people annually. Importantly, best available estimates and projections expect a 732
sharp reversal in these trends over the coming decades, and it is notable that a number of countries 733
have experienced increases in deaths associated with weather-related disasters, with many of these 734
being high-income countries, illustrating that no country is immune to the impacts of climate change 735
(see Appendix 2 for more details).A 736

25
a) 737
b) 738
Figure 1.6 Deaths and people affected by weather-related disasters. 1.6a) Percentage change over time in the 739 global number of deaths, the number of those affected, and the ratio of these (measured against 1990-2009). 740 1.6b) Change over time in the number of people affected globally by different weather-related disasters. 741
742
The relative stability of the number of deaths in a disaster as a proportion of those affected, despite 743
an increase in the number of disasters, could be interpreted in a number of ways. One plausible 744
conclusion is that this represents an increase in health service provision and risk reduction. However, 745
although weather-related disasters have increased in number over the past three to four decades, 746
the data here does not capture the severity of such events – a factor directly relevant to a country’s 747
vulnerability and ability to adapt.22It is also important to note the difficulties in discerning overall 748
trends, owing to the stochastic nature of the data and the relatively short time series. This poses 749

26
limitation on the significance of findings that can be drawn from analysis to date. Improving the 750
validity of this indicator will be a focus going forward. 751
Indicator 1.5: Global health trends in climate-sensitive diseases 752 Headline Finding: Global health initiatives have overwhelmingly decreased deaths associated with 753
climate-sensitive diseases since 1990, owing to important economic and public health advances over 754
the last three decades. 755
Disease occurrence is determined by a complex composite of social and environmental conditions 756
and health service provision, all of which vary geographically. Nonetheless, some diseases are 757
particularly sensitive to variations in climate and weather, and may thus be expected to vary with 758
both longer-term climate change and shorter-term extreme weather events.10 This indicator draws 759
from Global Burden of Disease (GBD) mortality estimates to show trends in deaths associated with 760
seven climate-sensitive diseases since 1990 (Figure 1.7).27 761
762 Figure 1.7 Trends in mortality from selected causes of death as estimated by the Global Burden of Disease 763 2015, for the period 1990 to 2015, by WHO region.27 (Created using Global Burden of Disease, 2016 data). 764
The disease trends above reveal global increases in dengue mortality, particularly in the Asia-Pacific 765
and Latin America and Caribbean regions, with some peak years (including 1998) known to be 766
associated with El Niño conditions.28 Beyond climate, likely drivers of dengue mortality include trade, 767
urbanization, global and local mobility and climate variability; the association between increased 768
dengue mortality and climate change is therefore complex.29 It naturally follows that an increase 769
spread of the disease resulting from climate change will be a significant contributing factor in the 770
increased likelihood of an associated increase in mortality. Malignant melanoma is a distinctive 771
example of a non-communicable disease with a clear link to ultraviolet exposure, with mortality 772
increasing steadily despite advances in surveillance and treatment; although it is important to 773
recognise that increased exposures also occur as a result of changing lifestyles (for example, a rise in 774
sun tanning). Heat and cold exposure is a potentially important aspect of climate-influenced 775
mortality, although the underlying attribution of deaths to these causes in the estimates is 776

27
uncertain.30-35 Deaths directly related to forces of nature have been adjusted for the effects of the 777
most severe seismic events. Of the ten highest country-year mortality estimates due to forces of 778
nature, seven were directly due to specific seismic activity, and these have been discounted by 779
replacing with the same countries’ force of nature mortality for the following year. The remaining 780
major peaks relate to three extreme weather events (Bangladesh cyclone of 1991, Venezuela floods 781
and mudslides of 1999 and Myanmar cyclone of 2008), which accounted for over 300,000 deaths. 782
Overall, the findings here highlight the effectiveness and success of global health initiatives since 783
1990, in largely reducing deaths associated with these diseases. Furthermore, these trends provide a 784
proxy for the global health profile of climate-sensitive diseases and thus to some degree, indication 785
of existing vulnerabilities and exposures to them. 786
Indicator 1.6: Climate-sensitive infectious diseases 787 Headline Finding: Vectorial capacity for the transmission of dengue by the mosquito vectors Aedes 788
aeqypti and Aedes albopictus in regions where these vectors are currently present has increased 789
globally due to climate trends by an average of 3% and 5.9%, respectively, compared to 1990 levels, 790
and by 9.4% and 11.1%, respectively, compared to 1950s levels. 791
Despite a declining overall trend, infectious diseases still account for around 20% of the global 792
burden of disease and underpin more than 80% of international health hazards as classified by the 793
World Health Organization (WHO).36,37 Climatic factors are routinely implicated in the epidemiology 794
of infectious diseases, and they often interact with other factors, including behavioural, 795
demographic, socio-economic, topographic and other environmental factors, to influence infectious 796
disease emergence, distribution, incidence and burden.2,38 Understanding the contribution of 797
climate change to infectious disease risk is thus complex, but necessary for advancing climate 798
change mitigation and adaptation policies.14 This indicator is split into two components: a systematic 799
literature review of the links between climate change and infectious diseases, and a vectorial 800
capacity model for the transmission of dengue virus by the climate-sensitive vectors. 801
For the first component, a systematic review of the climate change infectious disease literature was 802
performed (see Appendix 2 for details), in which trends in the evolution of knowledge and direction 803
of impact of climate change disease risk associations were measured (Figure 1.8). The number of 804
new publications fitting the search criteria in 2016 (n=89) was the highest yet reported, almost 805
double the number published in 2015 (n=50) and more than triple the number published in 2014 806
(n=25) (Figure 1.8, left). Over this period, the complexity of interactions between climate change and 807
infectious disease has been increasingly recognised and understood (Figure 1.8, right). 808
809

28
810
811
Figure 1.8 Left: Academic publications reporting climate-sensitive infectious diseases by year. Right: proportion 812 of responses reported in publications by year and direction of impact. 813
814
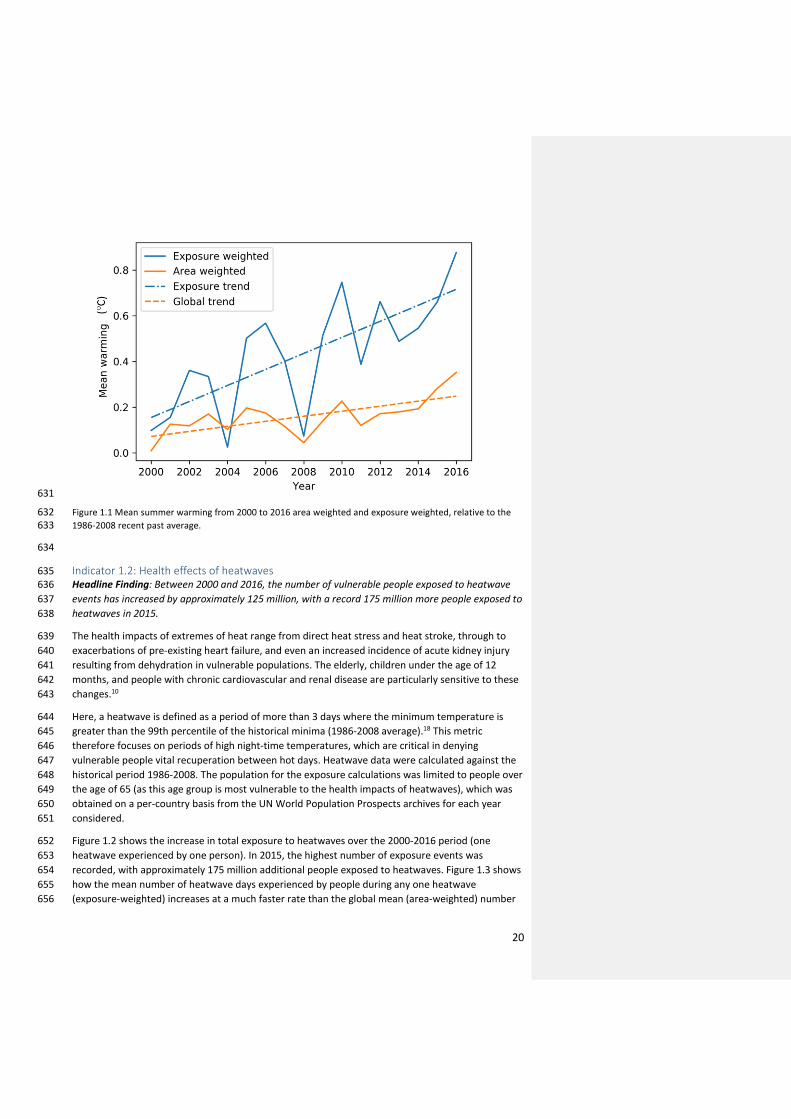
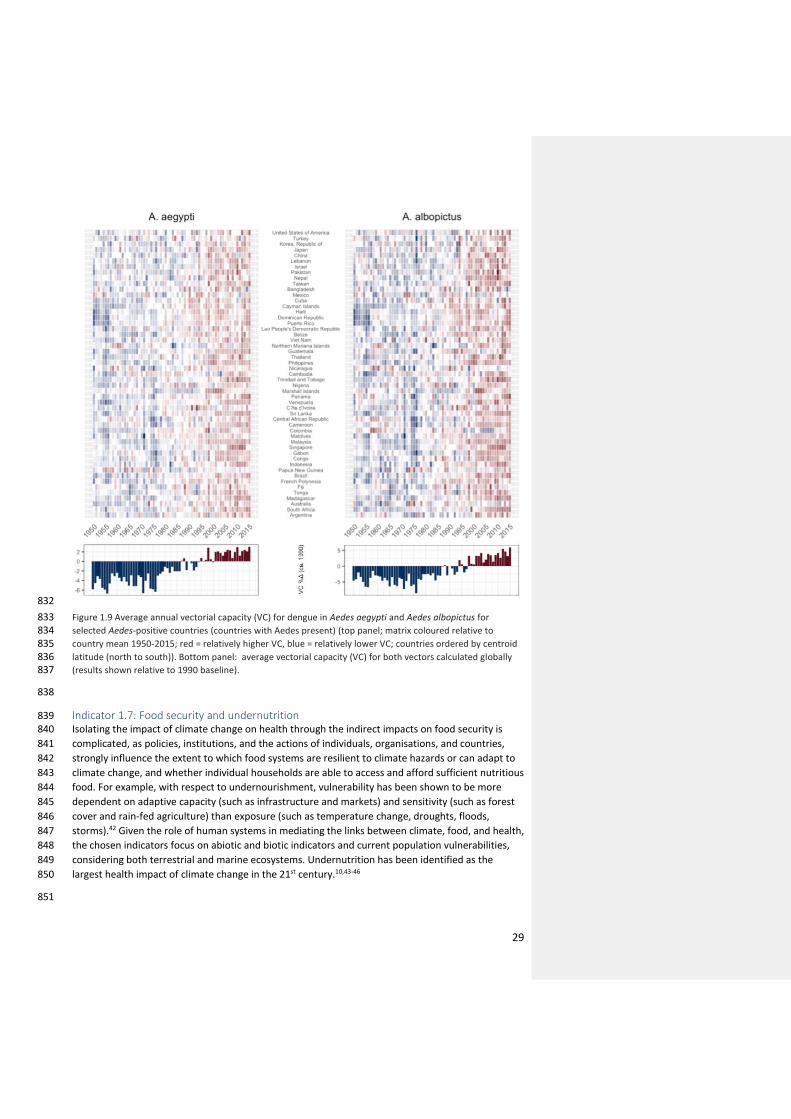
Trends in the global potential for dengue virus transmission (as represented by vectorial capacity 815
(VC) in the mosquito vectors Aedes aeqypti and Aedes albopictus) are presented. VC is “the rate 816
(usually daily) at which a bloodsucking insect population generates new inoculations from a 817
currently infectious case”.39 A global, mechanistic investigation was conducted of changes in annual 818
transmission potential for a model, high burden, climate-sensitive vector-borne disease, dengue 819
fever (Figure 1.9). For both vectors, VC in locations where these vectors are currently present 820
reached its highest or equal highest average level in 2015 over the period considered (Figure 1.9, 821
bottom panel). This consolidates a clear and significant increase in VC starting in the late 1970s 822
(+3.0% and +6.0% compared to 1990 levels for A. aegypti and A. albopictus, respectively). Nearly all 823
Aedes-positive countries showed relative increases in VC for both vectors over the period considered 824
(Figure 1.9, top panel). Annual numbers of cases of dengue have doubled every decade since 1990, 825
with 58.4 million (23.6 million–121.9 million) apparent cases in 2013, accounting for over 10,000 826
deaths and 1.14 million (0.73 million–1.98 million) disability-adjusted life-years.40 Climate change has 827
been suggested as one potential contributor to this increase in burden.41 Aedes aegypti and Aedes 828
albopictus, the principal vectors of dengue, also carry other important emerging or re-emerging 829
arboviruses, including Yellow Fever, Chikungunya, Mayaro and Zika viruses, which are likely similarly 830
responsive to climate change. 831
29
832
Figure 1.9 Average annual vectorial capacity (VC) for dengue in Aedes aegypti and Aedes albopictus for 833 selected Aedes-positive countries (countries with Aedes present) (top panel; matrix coloured relative to 834 country mean 1950-2015; red = relatively higher VC, blue = relatively lower VC; countries ordered by centroid 835 latitude (north to south)). Bottom panel: average vectorial capacity (VC) for both vectors calculated globally 836 (results shown relative to 1990 baseline). 837
838
Indicator 1.7: Food security and undernutrition 839 Isolating the impact of climate change on health through the indirect impacts on food security is 840
complicated, as policies, institutions, and the actions of individuals, organisations, and countries, 841
strongly influence the extent to which food systems are resilient to climate hazards or can adapt to 842
climate change, and whether individual households are able to access and afford sufficient nutritious 843
food. For example, with respect to undernourishment, vulnerability has been shown to be more 844
dependent on adaptive capacity (such as infrastructure and markets) and sensitivity (such as forest 845
cover and rain-fed agriculture) than exposure (such as temperature change, droughts, floods, 846
storms).42 Given the role of human systems in mediating the links between climate, food, and health, 847
the chosen indicators focus on abiotic and biotic indicators and current population vulnerabilities, 848
considering both terrestrial and marine ecosystems. Undernutrition has been identified as the 849
largest health impact of climate change in the 21st century.10,43-46 850
851
30
Indicator 1.7.1: Vulnerability to undernutrition 852 Headline Finding: The number of undernourished people in the 30 countries located in Africa and 853
Southern Asia with the highest prevalence (>15%) has increased from 398 million in 1990 to 422 854
million in 2016. These are countries located in regions which are highly dependent on regional 855
production for their food needs and where climate change is predicted to have the greatest negative 856
impact on yields. 857
The purpose of this indicator is to track the extent to which health will be compromised by climate 858
change in countries where both current dependence on domestic production of food, and current 859
level of undernourishment (which is strongly related to undernutrition) is already high. Climate 860
change could further compromise health through changes in localised temperature and 861
precipitation, manifested in falling yields. 862
Food markets are increasingly globalised, and food security is increasingly driven by human systems. 863
In response to falling yields caused by temperature increases, governments, communities, and 864
organisations can and will undertake adaptation activities that might variously include breeding 865
programmes, expansion of farmland, increased irrigation, or switching crops. However, the greater 866
the loss of yield potential due to temperature increases, the more difficult adaptation becomes for 867
populations dependent upon domestic food supply. 868
Rising temperatures have been shown to reduce global wheat production, which has been estimated 869
to fall 6% for each degree Celsius of additional temperature increase.47-49 Rice yields are sensitive to 870
higher night temperatures, with each 1°C increase in growing-season minimum temperature in the 871
dry season resulting in a fall in rice grain yield of 10%.50 Higher temperatures have been 872
demonstrated rigorously to have a negative impact on crop yields in lower-latitude countries.51-53 873
Moreover, agriculture in lower-latitudes tends to be more marginal, and more people are food 874
insecure. 875
This indicator, using data from the Food and Agriculture Organization of the United Nations (FAO), 876
focuses on vulnerability to undernutrition.54 Countries are selected for inclusion based on three 877
criteria: the presence of moderate or high level of undernourishment, reflecting vulnerability; their 878
physical location, focusing on geographies where a changing climate is predicted with high 879
confidence to have a negative impact on the yields to staples produced; and dependence on regional 880
production for at least half of its cereal consumption, reflecting high exposure to localised climate 881
hazards. Based on these criteria, 30 countries, all located in Africa or Southern Asia, are included. 882
Figure 1.10 presents the aggregated indicators, which shows the total number within the population 883
undernourished in these 30 countries, multiplied by total dependence on regional production of 884
grains. This gives a measure of how exposed already undernourished populations, who are highly 885
dependent on regionally produced grains, are to localized climate hazards. 886
887

31
888
Figure 1.10 Total number of undernourished people multiplied by regional dependency on grain production for 889 countries. 890
The regions with the highest vulnerability to undernutrition also coincide with areas where yield 891
losses due to warming are predicted to be relatively high, thus increasing the vulnerability of these 892
populations to the negative health consequences of undernutrition. High dependence on one crop 893
increases the vulnerability of individual countries further. For example, Kenya, which has a domestic 894
production dependency for cereals of almost 80%, 69% dependent on maize, is experiencing high 895
levels of undernutrition, and is particularly vulnerable to climate-related yield losses. Going forward, 896
these data will be refined through country-level exploration, incorporation of the predicted impact 897
of warming on yield losses, and incorporation of key temperature indicators such as ‘growing degree 898
days’ above critical crop-specific thresholds.55,56 899
900
Indicator 1.7.2: Marine primary productivity 901 Declining fish consumption provides an indication of food insecurity, especially in local shoreline 902
communities dependent upon marine sources for food, and hence are especially vulnerable to any 903
declines in marine primary productivity affecting fish stocks.57 This is particularly concerning for the 904
1 billion people around the world who rely on fish as their principal source of protein, placing them 905
at increased risk of stunting (prevented from growing or developing properly) and malnutrition from 906
food insecurity.58 In addition, fish are important for providing micronutrients, such as zinc, iron, 907
vitamin A, vitamin B12, and Omega-3 fatty acids. If current fish declines continue, as many as 1.4 908
billion people are estimated to become deficient and at elevated risk of certain diseases, particularly 909
those associated with the cardiovascular system.59,60 910
Marine primary productivity is determined by abiotic and biotic factors; measuring these globally 911
and identifying relevant marine basins is complex. Factors such as sea surface temperature (SST), sea 912
surface salinity (SSS), coral bleaching and phytoplankton numbers are key determinants of marine 913

32
primary productivity. Other local determinants have particularly strong influences on marine primary 914
productivity. For example, harmful algal blooms (HAB) occur as a result of uncontrolled algal growth 915
producing deadly toxins. The consumption of seafood contaminated with the toxins of harmful algal 916
blooms, such as those produced by Alexandrium tamarense, is often very dangerous to human 917
health, and potentially fatal.61 918
Changes in SST and SSS from 1985 to present, for twelve fishery locations essential for aquatic food 919
security are presented here. Data was obtained from NASA’s Earth Observatory Databank, and 920
mapped across to the significant basins outlined in Appendix 2. From 1985 to 2016, a 1oC increase in 921
SST (from an annual average of 22.74oC to 23.73oC) was recorded in these locations.62 This indicator 922
requires significant further work to draw out the attribution to climate change and the health 923
outcomes that may result. A case study on food security and fish stocks in the Persian Gulf is 924
presented in Appendix 2. 925
926
Indicator 1.8: Migration and population displacement 927 Headline Finding: Climate change is the sole contributing factor for at least 4,400 people already 928
being forced to migrate, globally. The total number for which climate change is a significant or 929
deciding factor is significantly higher. 930
Climate change-induced migration may occur through a variety of different social and political 931
pathways, ranging from sea level rise and coastal erosion, through to changes in extremes and 932
averages of precipitation and temperature decreasing the arability of land and exacerbating food 933
and water security issues. Estimates of future “climate change migrants” up to 2050 vary widely, 934
from 25 million to 1 billion.63 Such variation indicates the complexity of the multi-factorial nature of 935
human migration, which depends on an interaction of local environmental, social, economic, and 936
political factors. For example, in Syria, many attribute the initial and continued conflict to the rural-937
to-urban migration that resulted from a climate change-induced drought.64,65 However, the factors 938
leading to the violence are wide-ranging and complex, with clear quantifiable attribution particularly 939
challenging. Indeed, climate change is often thought of as playing an important role in exacerbating 940
the likelihood of conflict, and as a threat multiplier and an accelerant of instability. Nonetheless, 941
migration driven by climate change has potentially severe impacts on mental and physical health, 942
both directly and through the disruption of essential health and social services.66 943
Despite the methodological difficulties in proving a direct causal relationship between climate 944
change and population displacement, there are areas where this is methodologically possible. This 945
indicator focuses on these situations, attempting to isolate instances (as exemplars) where climate 946
change is the sole contributory factor in migration decisions. Sea level rise provides the clearest 947
example of this, although other examples exist as shown in Table 1.1. Estimating the number of 948
people who have involuntarily migrated (both internally and internationally) as a result of climate 949
change alone helps overcome the complexity of accounting for other societal, economic and 950
environmental factors that also influence migration. 951
Based on data derived from peer-reviewed academic publications (see Appendix 2 for full details). A 952
minimum of 4,400 people have been forced to migrate due solely to climate change (Table 1.1). This 953
will be an underestimate, as it excludes cases where more than one factor may be contributing to a 954
migration decision – such as a combination of both climate-related sea level rise and coastal erosion 955
not associated with climate change (possibly such as the village of Vunidogola, relocated by the 956
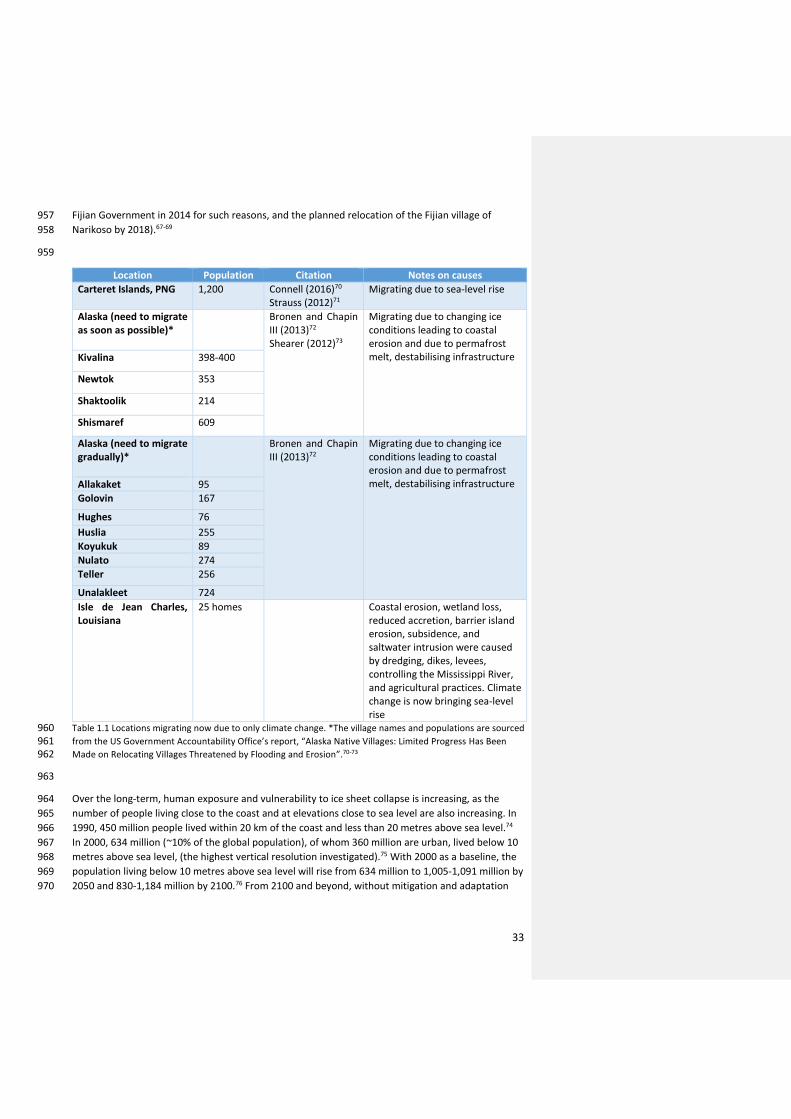
33
Fijian Government in 2014 for such reasons, and the planned relocation of the Fijian village of 957
Narikoso by 2018).67-69 958
959
Location Population Citation Notes on causes
Carteret Islands, PNG 1,200 Connell (2016)70 Strauss (2012)71
Migrating due to sea-level rise
Alaska (need to migrate as soon as possible)*
Bronen and Chapin III (2013)72 Shearer (2012)73
Migrating due to changing ice conditions leading to coastal erosion and due to permafrost melt, destabilising infrastructure Kivalina 398-400
Newtok 353
Shaktoolik 214
Shismaref 609
Alaska (need to migrate gradually)*
Bronen and Chapin III (2013)72
Migrating due to changing ice conditions leading to coastal erosion and due to permafrost melt, destabilising infrastructure Allakaket 95
Golovin 167
Hughes 76
Huslia 255
Koyukuk 89
Nulato 274
Teller 256
Unalakleet 724
Isle de Jean Charles, Louisiana
25 homes Coastal erosion, wetland loss, reduced accretion, barrier island erosion, subsidence, and saltwater intrusion were caused by dredging, dikes, levees, controlling the Mississippi River, and agricultural practices. Climate change is now bringing sea-level rise
Table 1.1 Locations migrating now due to only climate change. *The village names and populations are sourced 960 from the US Government Accountability Office’s report, “Alaska Native Villages: Limited Progress Has Been 961 Made on Relocating Villages Threatened by Flooding and Erosion”.70-73 962
963
Over the long-term, human exposure and vulnerability to ice sheet collapse is increasing, as the 964
number of people living close to the coast and at elevations close to sea level are also increasing. In 965
1990, 450 million people lived within 20 km of the coast and less than 20 metres above sea level.74 966
In 2000, 634 million (~10% of the global population), of whom 360 million are urban, lived below 10 967
metres above sea level, (the highest vertical resolution investigated).75 With 2000 as a baseline, the 968
population living below 10 metres above sea level will rise from 634 million to 1,005-1,091 million by 969
2050 and 830-1,184 million by 2100.76 From 2100 and beyond, without mitigation and adaptation 970
34
interventions, over one billion people may need to migrate due to sea level rise caused by any ice 971
sheet collapse which occurs.76,77 972
Whilst this indicator is not yet able to capture the true number of people being forced to migrate 973
due to climate change, that at least 4,400 people are already being forced to migrate as a result of 974
climate change only is concerning and demonstrates that there are limits to adaptation. The fact 975
that this is a significant underestimate further highlights the need to mitigate climate change and 976
improve the adaptive capacity of populations to reduce future forced migration. Significantly, only 977
instances of migration where climate change is isolated as the only factor are captured. Moving 978
forward, new approaches will be required to more accurately reflect the number of people forced to 979
migrate due to climate change, looking to capture situations where climate change plays an 980
important contributory role alongside other social and economic considerations. 981
982
Conclusion 983
Climate change impacts health through diverse direct and indirect mechanisms. The indicators 984
captured here provide an overview of a number of these effects, capturing exposure, impact, and 985
underlying vulnerabilities. Going forward, indicators will be developed to better measure direct 986
health outcome from climate change, in addition to exposure and vulnerabilities. 987
The indicators presented here will be continuously developed over time in order to more directly 988
capture mortality and morbidity outcomes from communicable and non-communicable diseases. 989
Indeed, work is already underway to produce new indicators to capture these concepts for 990
subsequent reports. Panel 1.1 and Appendix 2 describe one such ongoing process focused on mental 991
health and climate change. 992
Adaptation pathways can help to minimise some of the negative health impacts of global warming, 993
especially for the lower range of projected average temperature rises. However, there are powerful 994
limits to adaptation, and this section has drawn attention to the non-linearity and the spatial 995
distribution of the health impacts of climate change. The indicators presented here demonstrate 996
clearly that these impacts are being experienced across the world today, and provide a strong 997
imperative for both adaptation and mitigation interventions to protect and promote public health. 998
999
Panel 1.1 Mental Health and Climate Change 1000
Measuring progress in the effects of climate change on mental health and wellbeing is difficult. 1001
Whilst this is partly due to problems of attribution, the main measurement difficulty lies in the 1002
inherently complicated nature of mental health, which embraces a diverse array of outcomes (for 1003
instance, anxiety and mood disorders), many of which co-occur and all of which vary over contexts 1004
and lifetimes. They are products of long and complex causal pathways, many of which can be traced 1005
back to distal but potent root causes, such as famine, war and poverty, of which climate change is 1006
both an example and an accelerator.78 1007
Mental health, with its inherent intricacy, is a field where systems thinking is likely to be particularly 1008
valuable. A first step, therefore, in tracking progress on mental health and climate change is to build 1009
a conceptual framework using systems thinking. Initial work in partnership with the University of 1010
Sydney has begun to trace through the many direct and indirect causal pathways, in order to aid the 1011
identification of indicators. A number of challenges (e.g. how to gather and interpret highly 1012

35
subjective measures across cultures and income settings) are immediately apparent. Whilst further 1013
work, and engagement with other partners will be required, potential indicators may focus on a 1014
range of issues, including: national and local mental health emergency response capacity to climate-1015
related extreme events; the extent to which climate change is considered within national mental 1016
health strategies; or the social and psychological impact of uninsured economic losses that result 1017
from extreme weather events. 1018

36
2. Adaptation Planning and Resilience for Health 1019
1020
Introduction 1021
1022
Climate change adaptation is defined by the IPCC as the “adjustment in natural or human systems in 1023
response to actual or expected climatic stimuli or their effects, which moderates harm or exploits 1024
beneficial opportunities”.80 With respect to health, adaptation consists of efforts to reduce injury, 1025
illness, disability, and suffering from climate-related causes. Resilience has been defined as “the 1026
capacity of individuals, communities and systems to survive, adapt, and grow in the face of stress 1027
and shocks, and even transform when conditions require it”.81 In the context of climate change and 1028
health, resilience is an attribute of individuals, communities, and health care systems; resilience at 1029
all levels can reduce adverse health outcomes of climate change and should be a goal of adaptation 1030
planning. 1031
Indicators of resilience and adaptation are challenging to identify. Resilience is related to 1032
preparedness, response, resource management and coordination capacity, but it is not synonymous 1033
with them. Understanding the current resilience of a population’s health and health systems 1034
provides some indication of resilience to climate change, although direct indicators measuring this 1035
have not yet been developed by the Lancet Countdown. The indicators presented here are 1036
predominantly process-based, focusing on health adaptation planning, capacity, and response. 1037
Whilst the underlying resilience of communities is present to some extent in all of the indicators in 1038
this section, it is currently only captured directly for health systems, and hence most indicators that 1039
follow will focus more specifically on health adaptation. 1040
1041
The indicators presented here are: 1042
2.1 National adaptation plans for health 1043 2.2 City-level climate change risk assessments 1044 2.3 Detection and early warning of, preparedness for, and response to health emergencies 1045 2.4 Climate information services for health 1046 2.5 National assessment of vulnerability, impacts and adaptation for health 1047 2.6 Climate-resilience health infrastructure 1048
1049 Corresponding Appendix 3 provides more detailed discussion of the data and methods used. 1050
1051
Indicator 2.1: National adaptation plans for health 1052 Headline finding: 30 out of 40 responding countries have a national health adaptation plan or 1053
strategy approved by the relevant national health authority. 1054
Effective national responses to climate risks require that the health sector identify strategic goals in 1055
response to anticipated – and unanticipated – threats. A critical step in achieving these strategic 1056
goals is the development of a national health adaptation plan, outlining priority actions, resource 1057
requirements and a specific timeline and process for implementation. This indicator tracks the policy 1058
commitments of national governments for health and climate change adaptation. Data are drawn 1059
from the recent WHO Climate and Health Country Survey (Panel 2.1). 1060

37
Of the 40 countries responding to this baseline survey, 30 reported having a national adaptation 1061
strategy for health, approved by their Ministry of Health or relevant health authority (Figure 2.1). 1062
This number includes countries with a health component of their National Adaptation Plan (NAPs), 1063
which was established by the UNFCCC to help nations identity medium- and long-term adaptation 1064
needs and develop and implement programmes to address those needs.82 There is a need for 1065
caution in extrapolating the results to global level, as many of the respondent countries have 1066
received support from WHO in developing and implementing their plans.83,84 Nonetheless, with 75% 1067
of respondents in the survey having an approved national health adaptation plan there is evidence 1068
of the recognition of the need to adapt to climate change. Countries with national health adaptation 1069
plans are found across all regions and, perhaps most significantly, among some of the most 1070
vulnerable countries across Africa, South East Asia and South America. In future iterations of the 1071
survey, data will be gathered on the content and quality of these adaptation plans, their level of 1072
implementation, the main priorities for health adaptation, internal monitoring and review processes, 1073
and the level of funding available to support policy interventions. 1074
1075
1076
1077
1078 Figure 2.1 Countries with national heath climate adaptation strategies or plans. 1079
1080
Panel 2.1: WHO-UNFCCC Climate and Health Country Profiles. 1081
The WHO-UNFCCC Climate and Health Country Profile Project forms the foundation of WHO’s 1082
national level provision of information, and monitoring of progress, in this field. The profiles, 1083
developed in collaboration with ministries of health and other health determining sectors, support 1084
evidence-based decision making to strengthen the climate resilience of health systems and promote 1085
38
actions that improve health while reducing carbon emissions. In part, the data used in the 1086
development of the climate and health country profiles is collected through a biennial WHO Climate 1087
and Health Country Survey. Data from this survey is reported on for indicators 2.1, 2.5 and 2.6 1088
The 2015 baseline survey findings for 40 responding nations are presented in this report (for a 1089
complete list of country respondents, see Appendix 3). The findings include countries from all WHO 1090
regions (high, middle and low income groups) and with varying levels of risks and vulnerabilities to 1091
the health impacts of climate change. The 2015 survey data were validated as part of the national 1092
consultation process seeking input on respective WHO UNFCCC Climate and Health Country Profiles 1093
from key in-country stakeholders, including representatives of the Ministry of Health, Ministry of 1094
Environment, meteorological services and WHO country and regional technical officers. 1095
The validated data presented in this report tended to include a high number of countries that are 1096
actively working on climate and health with WHO; as such, the results here are indicative and are 1097
not meant to be inferred as an exact indicator of global status. The number of country respondents 1098
is expected to double in subsequent iterations of the survey. As such, the results presented here 1099
represent the beginning of the development of a more comprehensive survey, presenting results 1100
available at the start of this process. 1101
1102
Indicator 2.2: City-level climate change risk assessments 1103 Headline Finding: Of the 449 self-reporting cities, 45% have climate change risk assessments in 1104
place. 1105
Globally, 54.5% of people live in cities, where key health infrastructure is often concentrated.85 1106
These urban centres are increasingly at risk from climate change, with negative impacts predicted 1107
for human health and health services. These risks require city-level responses to complement NAPs, 1108
in order to improve cities’ ability to adapt to climate change. Indeed, cities have a unique 1109
opportunity to provide adaptation measures that help improve the resilience of urban populations, 1110
whilst also helping mitigate the impacts of climate change on public health.86 1111
Data for this indicator comes from the 2016 global survey of the Compact of Mayors and the Carbon 1112
Disclosure Project (CDP).87 88 Of the 449 cities with public responses (533 cities responded overall), 1113
45% reported to “have undertaken a climate change risk or vulnerability assessment for [their] local 1114
government” (Figure 2.2).89 1115
The highest number of cities with climate change risk assessments are in high income countries 1116
(HICs) (118 cities), with only 42 cities in low-income countries. This partly reflects the fact that more 1117
cities in HICs were surveyed, and partly the fact that these cities have a greater capacity to develop 1118
such plans. There were a higher number of respondents from cities in HICs compared with low 1119
income (236 versus 61). 1120
European cities in this survey have the highest number of climate change risk assessments (56 1121
cities), representing 83% of European cities surveyed. Conversely, only 28% of surveyed African cities 1122
have climate change risk assessments. This has serious implications for the adaptive capacity of 1123
some of the most vulnerable populations to climate change in low income countries. A concerted 1124
effort must be made to increase the number of climate change risk assessment in cities in low-1125
income countries, in order to better understand their vulnerability to climate change impacts and 1126
implement adaptation actions. 1127
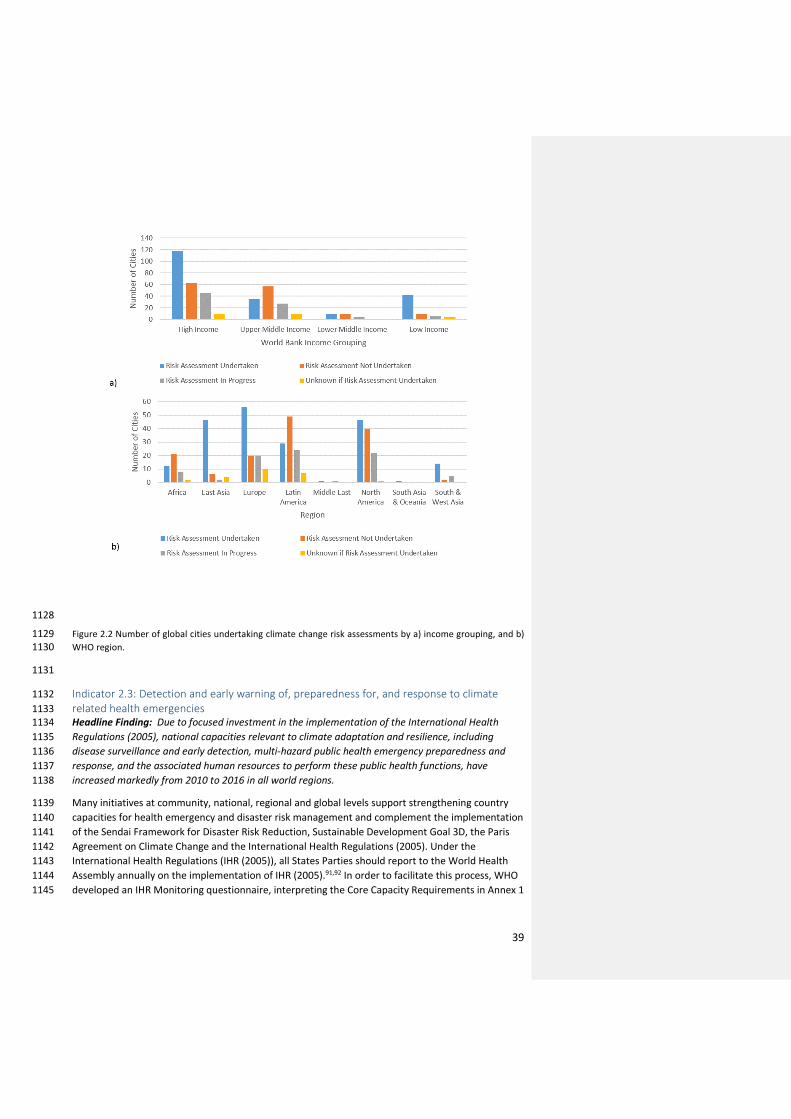
39
1128
Figure 2.2 Number of global cities undertaking climate change risk assessments by a) income grouping, and b) 1129 WHO region. 1130
1131
Indicator 2.3: Detection and early warning of, preparedness for, and response to climate 1132
related health emergencies 1133 Headline Finding: Due to focused investment in the implementation of the International Health 1134
Regulations (2005), national capacities relevant to climate adaptation and resilience, including 1135
disease surveillance and early detection, multi-hazard public health emergency preparedness and 1136
response, and the associated human resources to perform these public health functions, have 1137
increased markedly from 2010 to 2016 in all world regions. 1138
Many initiatives at community, national, regional and global levels support strengthening country 1139
capacities for health emergency and disaster risk management and complement the implementation 1140
of the Sendai Framework for Disaster Risk Reduction, Sustainable Development Goal 3D, the Paris 1141
Agreement on Climate Change and the International Health Regulations (2005). Under the 1142
International Health Regulations (IHR (2005)), all States Parties should report to the World Health 1143
Assembly annually on the implementation of IHR (2005).91,92 In order to facilitate this process, WHO 1144
developed an IHR Monitoring questionnaire, interpreting the Core Capacity Requirements in Annex 1 1145

40
of IHR (2005) into 20 indicators for 13 capacities (Panel 2.2). These metrics can serve as important 1146
proxies of health system adaptive capacity and system resilience, since they measure the extent to 1147
which health systems demonstrate a range of attributes necessary to detect, prepare for and 1148
respond to public health emergencies, some of which are climate sensitive. Four capacities reflecting 1149
seven indicators from IHR Monitoring questionnaire are reported here: surveillance, preparedness, 1150
response, and human resources. Additional details of all four of these IHR Capacities can be found in 1151
Appendix 3. 1152
Panel 2.2: The International Health Regulations (2005). 1153
The current IHR (2005), which entered into force in 2007, is legally binding on 196 States Parties, 1154
including all WHO member states. It requires States Parties to detect, assess, notify and report, and 1155
respond promptly and effectively to public health risks and public health emergencies of 1156
international concern (IHR Article 5, 13) and to develop, strengthen and maintain the capacity to 1157
perform these functions (IHR Article 5). Examples of required core capacities include national 1158
legislation, policy and financing; public health surveillance; preparedness and response; risk 1159
communication; human resources; and laboratory services. Under the International Health 1160
Regulations (IHR (2005)), all States Parties should report to the World Health Assembly annually on 1161
the implementation of IHR (2005). In order to facilitate this process, WHO developed an IHR 1162
Monitoring questionnaire.93 The method of estimation calculates the proportion/percentage of 1163
attributes (a set of specific elements or functions that reflect the performance or development of a 1164
specific indicator) reported to be in place in a country. Since 2010, 195 States Parties have submitted 1165
self-reports at least once. Indicator 2.3 is drawn from the results of these questionnaires to which 1166
129 of 196 States Parties responded in 2016.94 1167
1168
The first of these capacities is human resources, which reflects a single indicator: ‘human resources 1169
available to implement the International Health Regulations Core Capacities’. This is a useful proxy in 1170
lieu of an indicator that looks at specific capacity for health adaptation to climate change (Figure 1171
2.3a). In 2010, capacity scores ranged from 25% in Africa to 57% in Western Pacific. Human resource 1172
capacity has improved markedly by 2016, where on the average the capacity score is 67% (with the 1173
lowest score in the Africa region reporting 51% and the highest in the Western Pacific Region 89%). 1174
Secondly, surveillance capacity, summarizes two indicators in the IHR questionnaire ‘Indicator-based 1175
surveillance includes an early warning function for early detection of a public health event’, and 1176
‘Event-Based Surveillance is established and functioning’. This capacity score is used as a proxy for a 1177
health system’s ability to anticipate and identify outbreaks and changing patterns of climate-1178
sensitive infectious diseases, such as zoonosis and food-related outbreaks. Globally, 129 reporting 1179
States Parties scored 88% for this capacity in 2016 (Figure 2.3b). This proportion has increased 1180
steadily since 2010 (average score of 63%), indicating that health systems have increasing capacity 1181
for early detection of public health events. 1182
Thirdly, preparedness capacity reflects ‘Multi-hazard National Public Health Emergency 1183
Preparedness and Response Plan is developed and implemented’, comprised of the presence of a 1184
plan, the implementation of the plan, and the ability for this plan to operate under unexpected 1185
stress, and ‘priority public health risks and resources are mapped and utilized’. Of responding 1186
countries, progress can be seen in all world regions from 49% in 2010 to a 2016 global average of 1187
76% (Figure 4.3c). 1188

41
Finally, response capacity, reflects the availability and functioning of public health emergency 1189
response mechanisms, and Infection Prevention and Control (IPC) at national and hospital levels. 1190
This capacity is an important proxy for the ability of the health system to mobilize effective 1191
responses when shocks or stresses are detected. All countries demonstrate between 73-91% 1192
response capacity in 2016, with notable progress seen in Africa between 2010 (47%) and 2016 (73%) 1193
(Figure 2.3d). 1194
a) 1195

42
b) 1196
c) 1197

43
d) 1198
Figure 2.3: IHR capacity scores by WHO region. 2.3a) Human Resources capacity score. 2.3b) Surveillance 1199 capacity score. 2.3c) Preparedness capacity score. 2.3d) Response capacity score. 1200
There are some limitations to considering these capacities. Most importantly, IHR survey responses 1201
are self-reported; although national-level external verification has begun it currently remains 1202
relatively limited. Additionally, these findings capture potential capacity – not action. Finally, the 1203
quality of surveillance for early detection and warning is not shown, nor is the impact of that 1204
surveillance on public health. Response systems have been inadequate in numerous public health 1205
emergencies and thus the presence of such plans is not a proxy for their effectiveness. 1206
1207
Indicator 2.4: Climate information services for health 1208 Headline Finding: Out of the 100 WHO Member States responding to the WMO Survey, 73% report 1209
providing climate information to the health sector in their country. 1210
This indicator measures the proportion of countries whose Meteorological and Hydrological services 1211
self-reported to the World Meteorological Organization (WMO), providing tailored climate 1212
information, products and services to their national public health sector.95 Response rates for the 1213
2015 WMO survey were: 71% in the African region, 67% in the Eastern Mediterranean Region, 79% 1214
in the European Region, 81% in the Region of the Americas, 67% in the South-East Asia Region and 1215
44% in the Western Pacific Region. 1216
Taking into account the total number of WHO members (respondent and non-respondent) per WHO 1217
region, only between 14.8 % and 51.4% are known to provide climate information to the health 1218
sector (Figure 2.4) and between 18% and 55% did not provide information. 1219
1220

44
1221
Figure 2.4: National Meteorological and Hydrological Services (NHMSs) of WHO member states reporting to 1222 provide targeted/tailored climate information, products and services to the health sector. 1223
However, it is important to note that this sample is not representative of all countries (49% non-1224
response rate) and these are self-reported results. Crucially, this indicator does not capture the type 1225
of climate products made available, quality of the data provided, the ways in which the health sector 1226
makes use of this data (if at all), and whether the data is presented in a format and timely fashion 1227
relevant to public health. Future WMO surveys will aim to provide greater insight to the specific 1228
applications of climate information. See Appendix 3 for more information. 1229
1230
Indicator 2.5: National assessments of climate change impacts, vulnerability, and adaptation 1231
for health 1232 Headline Finding: Over two thirds of responding countries report having conducted a national 1233
assessment of climate change impacts, vulnerability, and adaptation for health. 1234
National assessments of climate change impacts, vulnerability, and adaptation for health allow 1235
governments to understand more accurately the extent and magnitude of potential threats to health 1236
from climate change, the effectiveness of current adaptation and mitigation policies and future 1237
policy and programme requirements. Although national assessments may vary in scope between 1238
countries, the number of countries that have conducted a national assessment of climate change 1239
impacts, vulnerability, and adaptation for health is a key indicator to monitor the global availability 1240
of information required for adequate management of health services, infrastructure and capacities 1241
to address climate change. This indicator tracks the number of countries that have conducted 1242
national assessments, based on responses to the 2015 WHO Climate and Health Country Survey 1243
(Panel 2.1). 1244
Over two-thirds of countries sampled (27 out of 40) reported having conducted a national 1245
assessment of impacts vulnerability, and adaptation for health (Figure 2.5). These countries cover all 1246
regions and include countries that are particularly vulnerable; for instance, of the nine responding 1247
countries in the South-East Asia Region, eight countries (Bangladesh, Bhutan, Indonesia, Maldives, 1248
Nepal, Sri Lanka, Thailand and Timor-Leste) reported having national assessments of impacts, 1249
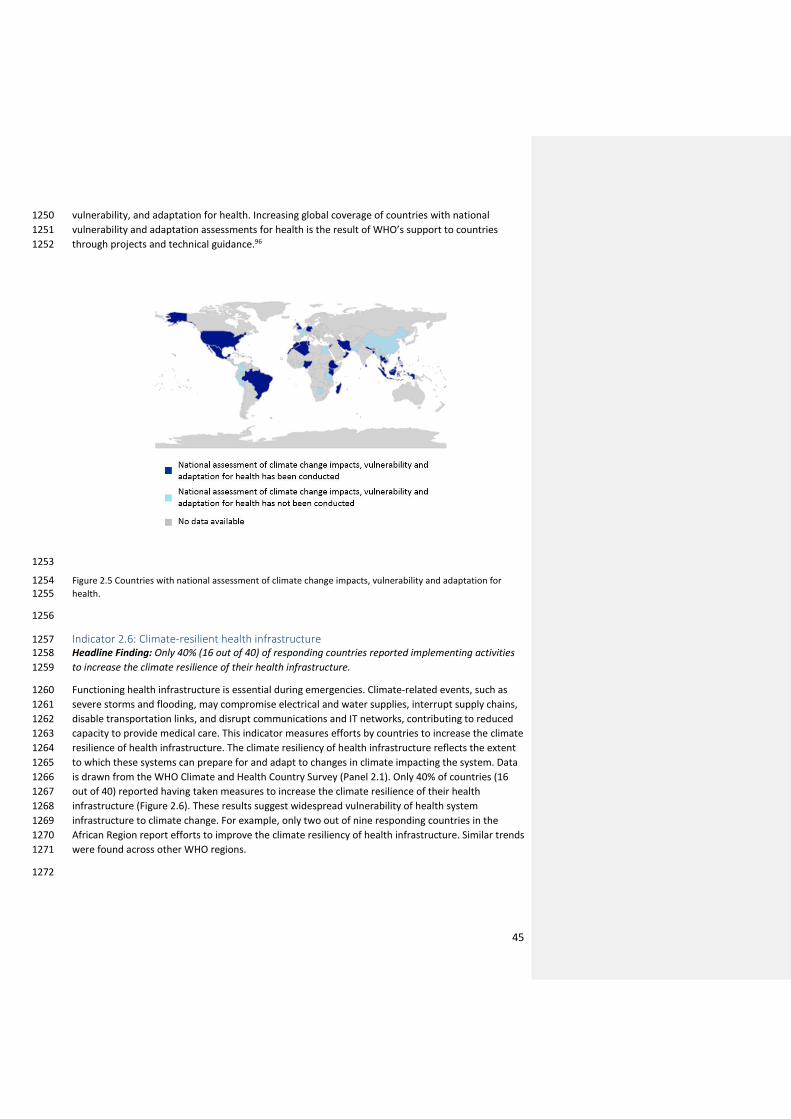
45
vulnerability, and adaptation for health. Increasing global coverage of countries with national 1250
vulnerability and adaptation assessments for health is the result of WHO’s support to countries 1251
through projects and technical guidance.96 1252
1253
Figure 2.5 Countries with national assessment of climate change impacts, vulnerability and adaptation for 1254 health. 1255
1256
Indicator 2.6: Climate-resilient health infrastructure 1257 Headline Finding: Only 40% (16 out of 40) of responding countries reported implementing activities 1258
to increase the climate resilience of their health infrastructure. 1259
Functioning health infrastructure is essential during emergencies. Climate-related events, such as 1260
severe storms and flooding, may compromise electrical and water supplies, interrupt supply chains, 1261
disable transportation links, and disrupt communications and IT networks, contributing to reduced 1262
capacity to provide medical care. This indicator measures efforts by countries to increase the climate 1263
resilience of health infrastructure. The climate resiliency of health infrastructure reflects the extent 1264
to which these systems can prepare for and adapt to changes in climate impacting the system. Data 1265
is drawn from the WHO Climate and Health Country Survey (Panel 2.1). Only 40% of countries (16 1266
out of 40) reported having taken measures to increase the climate resilience of their health 1267
infrastructure (Figure 2.6). These results suggest widespread vulnerability of health system 1268
infrastructure to climate change. For example, only two out of nine responding countries in the 1269
African Region report efforts to improve the climate resiliency of health infrastructure. Similar trends 1270
were found across other WHO regions. 1271
1272

46
1273
Figure 2.6 Countries taking measures to increase the climate resilience of health infrastructure. 1274
1275
This indicator does not capture the quality or effectiveness of efforts to build climate-resilient health 1276
system infrastructure. Nonetheless, it highlights the importance of ensuring that countries work to 1277
implement climate-resilient health infrastructure, as these findings suggest this is generally lacking. 1278
1279
Conclusion 1280
This section has presented indicators across a range of areas relevant to health adaptation and 1281
resilience. It is clear that the public, and the health systems they depend upon, are ill-prepared to 1282
manage the health impacts of climate change. 1283
In many cases, the data and methods available provide only a starting-point for an eventual suite of 1284
indicators that capture health-specific adaptation, and include both process-and outcome-based 1285
indicators. New indicators will also be required to better capture important indicators of resilience. 1286
1287
1288
1289
3. Mitigation Actions and Health Co-Benefits 1290
1291
47
Introduction 1292
Sections one and two have covered the health impacts of climate change, the adaptation available 1293
and currently being implemented, and the limits to this adaptation.10 This third section presents a 1294
series of indicators relevant to the near-term health co-benefits of climate mitigation policies. 1295
Accounting for this enables a more complete consideration of the total cost and benefits of such 1296
policies, and is essential in maximising the cumulative health benefits of climate change mitigation. 1297
The health co-benefits of meeting commitments under the Paris Agreement are potentially 1298
immense, reducing the burden of disease for many of the greatest global health challenges faced 1299
today and in the future.97 The indicators presented in this section describe a clear and urgent need 1300
to increase the scope of mitigation ambition if the world is to keep global average temperatures 1301
“well below 2°C”.7 1302
Countries are accelerating their response to climate change, with Finland, the UK, China, France, 1303
Canada and the Netherlands making strong commitments to phase-out or dramatically reduce their 1304
dependence on coal.98-101 By 2017, electric vehicles are poised to be cost-competitive with their 1305
petroleum equivalents, a phenomenon that was not expected until 2030. Globally, more renewable 1306
energy capacity is being built every year than all other sources combined.101,102 Consequently, 1307
renewable energy is now broadly cost-competitive with fossil fuels, with electricity from low-latitude 1308
solar PV being cheaper than natural gas.101-103 1309
1310
Tracking the health co-benefits of climate change mitigation 1311
Meeting the Paris Agreement will require global GHG emissions to peak within the next few years 1312
and undergo rapid reduction thereafter, implying near-term actions and medium- and long-term 1313
cuts through country-level activities.8 Global CO2 emissions from fossil fuels and industry were 36.3 1314
GtCO2 in 2015 (60% higher than in 1990), while emissions from land use change – which is 1315
intrinsically difficult to estimate – was approximately 4.8 GtCO2. In the same year, 41% of the total 1316
fossil fuel and industry emissions were estimated to come from coal, 34% from oil, 19% from gas, 1317
and 6% from cement.104 In 2015, the largest emitters of CO2 were China (29%), the USA (15%), the 1318
European Union’s (EU) 28 member states ((EU28); 10%) and India (6.3%). However, per capita 1319
emissions of CO2 belie the disparity driven by consumption, with global mean emissions at 4.8 tCO2 1320
per person per year compared to 16.8 in the USA, 7.7 in China, 7.0 in EU28, and 1.8 in India.104 1321
The actions needed to embark on rapid decarbonisation include avoiding the ‘lock-in’ of carbon 1322
intensive infrastructure and energy systems, reducing the cost of ‘scaling-up’ low-carbon systems, 1323
minimising reliance on unproven technologies, and realising opportunities of near-term co-benefits 1324
for health, security, and the environment.8 These actions will need to also be cost-effective and 1325
supported by non-state actors and industry. 1326
Indicators in this section are broadly considered within the framework of Driving Force-Pressure-1327
State-Exposure-Effect-Action (DPSEEA). The DPSEEA framework is recognized as being suitable for 1328
the development of environmental health indicators, and identification of entry points for policy 1329
intervention.105 An adaptation of the framework for examination of the health co-benefits of climate 1330
change mitigation is explained in Appendix 4. 1331
Here, health co-benefit indicators are captured for four sectors: 1) energy, 2) transport, 3) food, and 1332
4) healthcare. Appendix 4 provides more detailed discussion of the data and methods used. 1333

48
Energy Supply and Demand Sectors 1334
Fossil fuel burning comprises the largest single source of GHG emissions globally, producing an 1335
estimated 72% of all GHG emissions resulting from human activities.106,107 The majority (66%) of 1336
these emissions arise in the energy sector from the production of thermal and electric power for 1337
consumption across a range of sectors including industry, commercial, residential and transport. 1338
To meet the climate change mitigation ambitions of the Paris Agreement, it is widely accepted that 1339
the energy system will need to largely complete the transition towards near zero-carbon emissions 1340
by, or soon after, 2050, and then to negative emissions in the latter part of the century.108,109 Recent 1341
analysis has framed the necessary action as a halving of CO2 emissions every decade.110 1342
The potential short-term health benefits of such strategies are substantial, with significant 1343
improvements from a reduction in indoor and outdoor air pollution; more equitable access to 1344
reliable energy for health facilities and communities; and lower costs of basic energy services for 1345
heating, cooking, and lighting to support higher quality of life. 1346
1347
Indicator 3.1: Carbon intensity of the energy system 1348 Headline Finding: Globally, the carbon intensity of total primary energy supply (TPES) has remained 1349
stable since 1990, between 55-56 tCO2/TJ, reflecting the significant global challenge of energy 1350
system decarbonisation. This has occurred because countries, which have achieved a reduction in 1351
carbon intensity (USA, UK, Germany), have been offset by those which have increased the carbon 1352
intensity of their energy supply (India and China). 1353
To achieve the 2°C target (at a 66% probability), the global energy sector must reduce CO2 emissions 1354
to more than 70% below current levels by 2050. This means a large reduction in the carbon intensity 1355
of the global energy system, which can be measured as the tonnes of CO2 for each unit of total 1356
primary energy supplied (tCO2/TJ). TPES reflects the total amount of primary energy used in a 1357
specific country, accounting for the flow of energy imports and exports.111 Commitments under the 1358
Paris Agreement should begin to lower the overall carbon intensity of TPES, with the aim of reducing 1359
to near-zero by 2050. 1360
Drawing on data from the International Energy Agency (IEA), this indicator shows that globally, since 1361
the 1990s, the carbon intensity of primary energy supply has remained between 55-56 tCO2/TJ.112 1362
However, a 53% growth in energy demand over the period has meant that global CO2 emissions have 1363
grown significantly. Rapidly, low and middle income countries (LMICs) have seen an increase in 1364
carbon intensity since the 1970s, driven by increased coal use (Figure 3.1). For example, India’s TPES 1365
has almost tripled since 1980, with the share of coal in the mix doubling (from 22% to 44%). Over the 1366
same period, 1980-2014, a fourfold increase in China’s TPES, combined with increasing carbon 1367
intensity due to the coal share of TPES increasing from 52% to 66%, has led to strong growth in 1368
emissions. 1369
High-income countries have seen carbon intensity fall since the 1970s (for example, the USA and 1370
Germany in Figure Figure Figure 3.1). This decrease has resulted from a move away from coal use in 1371
energy production and use, reduced heavy industrial output, and increased use of lower carbon 1372
fuels, notably moving from coal to natural gas in the power sector and the use of renewable energy. 1373
1374
Formatted: Font: 11 pt
Formatted: Font: 11 pt

49
1375
Figure 3.1 Carbon intensity of Total Primary Energy Supply (TPES) for selected countries, and total CO2 1376 emissions (shaded area against secondary y-axis),1971-2013. 1377
1378
Indicator 3.2: Coal phase-out 1379 Headline Finding: Globally, total primary coal supply has increased from 92 EJ in 1990, to 160 EJ in 1380 2015. However, the 2015 supply level represents a reduction from the high point of 164 EJ in 2013, 1381 providing an encouraging indication that global coal consumption has peaked and is now in decline. 1382 1383 The primary means of reducing carbon intensity of the energy system within necessary timescales 1384
will be the phase-out of coal. Worldwide, coal supplies 30% of energy use and is the source of 44% 1385
of global CO2 emissions. The dirtiest form of coal produces almost twice the carbon per unit of 1386
primary energy than the least carbon intensive fossil fuel – natural gas.112 Given that a large share of 1387
coal is used for power generation, it is an important sector of focus, both to reduce CO2 emissions 1388
and mitigate a major source of air pollution.112 1389
This indicator of coal phase-out is the total primary coal supply (EJ) in the energy system (Figure 3.2), 1390
which makes use of recent data from the IEA.112 1391
Globally, coal use has increased by just under 60% since 1990. This is due to strong growth in global 1392
energy demand, and an increasing share of TPES coming from coal, rising from 26% to 29% between 1393
1990 and 2014.112 This growth has largely been driven by China’s increasing use of coal in industry 1394
and for electricity production, particularly in the 2000s (see East Asia trend in Figure Figure Figure 1395
3.2). Crucially, growth in coal use has plateaued and reduced since 2013, in large part due to a 1396
recognition of the health effects of air pollution, slower growth and structural changes in China’s 1397
economy, and a slowing in energy sector expansion.113 India has also seen significant growth in coal 1398
use, with the share of coal in TPES increasing from 31% in 1990 to 46% in 2015. The other large coal 1399
Formatted: Font: 11 pt
Formatted: Font: 11 pt
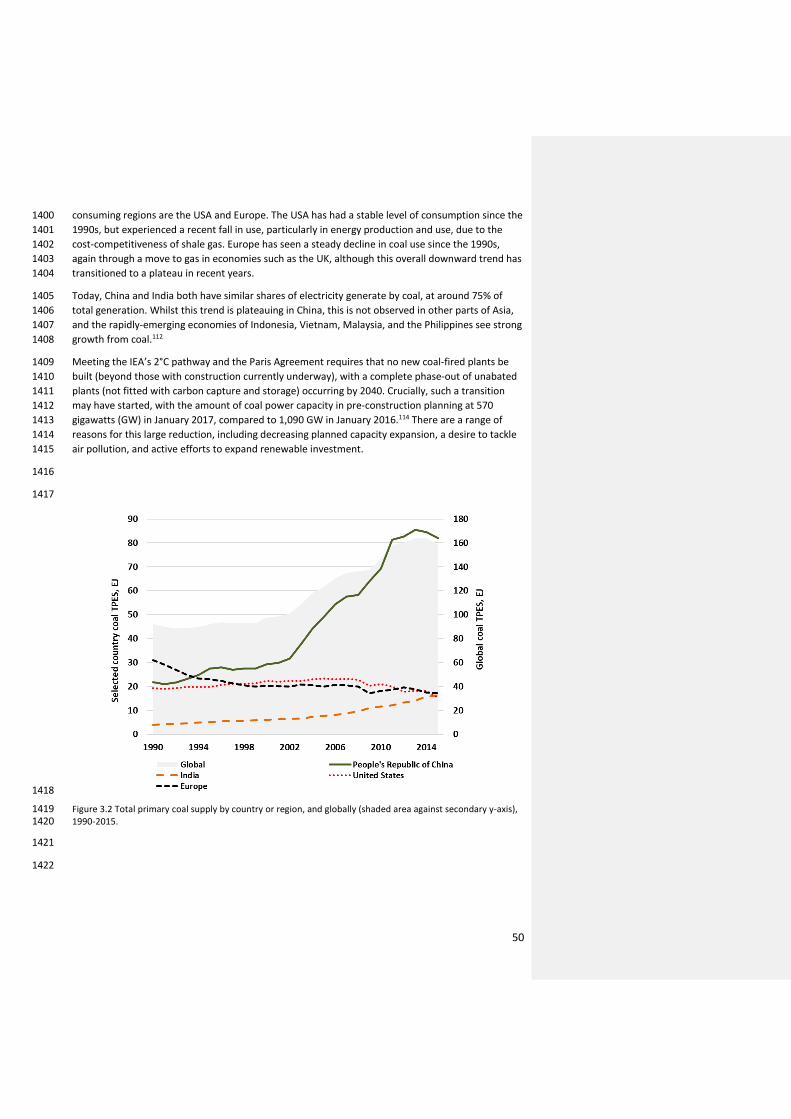
50
consuming regions are the USA and Europe. The USA has had a stable level of consumption since the 1400
1990s, but experienced a recent fall in use, particularly in energy production and use, due to the 1401
cost-competitiveness of shale gas. Europe has seen a steady decline in coal use since the 1990s, 1402
again through a move to gas in economies such as the UK, although this overall downward trend has 1403
transitioned to a plateau in recent years. 1404
Today, China and India both have similar shares of electricity generate by coal, at around 75% of 1405
total generation. Whilst this trend is plateauing in China, this is not observed in other parts of Asia, 1406
and the rapidly-emerging economies of Indonesia, Vietnam, Malaysia, and the Philippines see strong 1407
growth from coal.112 1408
Meeting the IEA’s 2°C pathway and the Paris Agreement requires that no new coal-fired plants be 1409
built (beyond those with construction currently underway), with a complete phase-out of unabated 1410
plants (not fitted with carbon capture and storage) occurring by 2040. Crucially, such a transition 1411
may have started, with the amount of coal power capacity in pre-construction planning at 570 1412
gigawatts (GW) in January 2017, compared to 1,090 GW in January 2016.114 There are a range of 1413
reasons for this large reduction, including decreasing planned capacity expansion, a desire to tackle 1414
air pollution, and active efforts to expand renewable investment. 1415
1416
1417
1418
Figure 3.2 Total primary coal supply by country or region, and globally (shaded area against secondary y-axis), 1419 1990-2015. 1420
1421
1422

51
Indicator 3.3: Zero-carbon emission electricity 1423 Headline Finding: Globally, renewable electricity as a share of total generation has increased by over 1424
20% from 1990 to 2013. In 2015, renewable energy capacity added exceeded that of new fossil fuel 1425
capacity, with 80% of recently added global renewable energy capacity currently located in China. 1426
Where renewables displace fossil fuels, in particular coal, it represents the beginning of reductions in 1427
morbidity and mortality from air pollution, and a potentially remarkable success for global health. 1428
As coal is phased out of the energy system, in particular in electricity production, the rapid scaling up 1429
of zero-carbon energy production and use will be crucial. To remain on a 2°C pathway, renewables-1430
based capacity additions will need to be sustained over the next 35 years, reaching 400 GW per year 1431
by 2050, which is two and a half times the current level. Critical renewable technologies for 1432
achieving this will be solar, wind and hydroelectric. 1433
Indicator 3.3 draws on IEA data, and considers both renewable and other zero-carbon electricity.112 1434
Conversely, renewable energy refers to “all forms of energy produced from renewable sources in a 1435
sustainable manner, which include: bioenergy, geothermal, hydropower, ocean energy (tidal, wave, 1436
thermal), solar energy and wind energy”.115 By comparison, zero-carbon energy means no GHG 1437
emissions (i.e. zero-carbon and carbon equivalent) at the point of energy production and use, which 1438
therefore also includes nuclear-powered electricity, but excludes biomass. 1439
Both displace the use of fossil fuels (although notably fossil capacity tends to have annual higher 1440
load factors than renewables), reducing air pollution and GHG emissions, and so are important 1441
indicators for climate change and for health. One caveat is that the combustion of solid biomass 1442
fuels such as wood, sometimes promoted for climate change mitigation purposes, may increase fine 1443
particulate air pollution exposure and may not be carbon-neutral.116 1444
As a share of total generation, renewable energy has increased by over 20% from 1990 to 2013. 1445
Renewable energy continues to grow rapidly, mainly from increasing wind and solar PV investment, 1446
most notably in the USA, China and Europe (Figure 3.3). In 2015, more renewable energy capacity 1447
(150GW) was added than fossil fuel plant capacity added globally. Overall, there is now more added 1448
renewable generation capacity installed globally (almost 2000 GW) than coal, with about 80% of this 1449
newly installed capacity located in China.112 1450

52
1451
a) b) 1452
c) d) 1453
Figure 3.3 Renewable and zero-carbon emission electricity generation a) Share of electricity generated from 1454 zero carbon sources; b) Electricity generated from zero carbon sources, TWh; c) Share of electricity generated 1455 from renewable sources (excluding hydro); d) Electricity generated from renewable sources (excl. hydro), TWh. 1456
1457
Indicator 3.4: Access to clean energy 1458 Headline Finding: In 2016, it was reported that 1.2 billion people did not have access to electricity, 1459
with 2.7 billion people relying on the burning of unsafe, unsustainable, and inefficient solid fuels. 1460
Increased access to clean fuels and clean energy technologies will have the dual benefit of reducing 1461
indoor air pollution exposure, and reducing GHG emissions by displacing fossil fuels.117 The use of 1462
clean energy for heating, cooling, cooking and lighting plays an important role in improving global 1463
health and wellbeing, economic productivity, and reducing the risk of harm from living in energy 1464
poverty.118 1465
It is estimated that globally, 1.2 billion people do not currently have access to electricity and 2.7 1466
billion people rely on burning unsustainable and inefficient solid fuels, which contributes to poor 1467
indoor air quality (see Panel 3.1), estimated to result in 4.3 million premature deaths related to 1468
pneumonia, stroke, lung cancer, heart disease, and chronic obstructive pulmonary disease (COPD) 1469
each year.119,120 Access to electricity, an energy source that emits no direct airborne particles 1470
(though particles may be emitted indirectly through the fuel used to generate the electrical power), 1471
is currently 85.3% globally but varies widely among countries and urban and rural settings. 1472
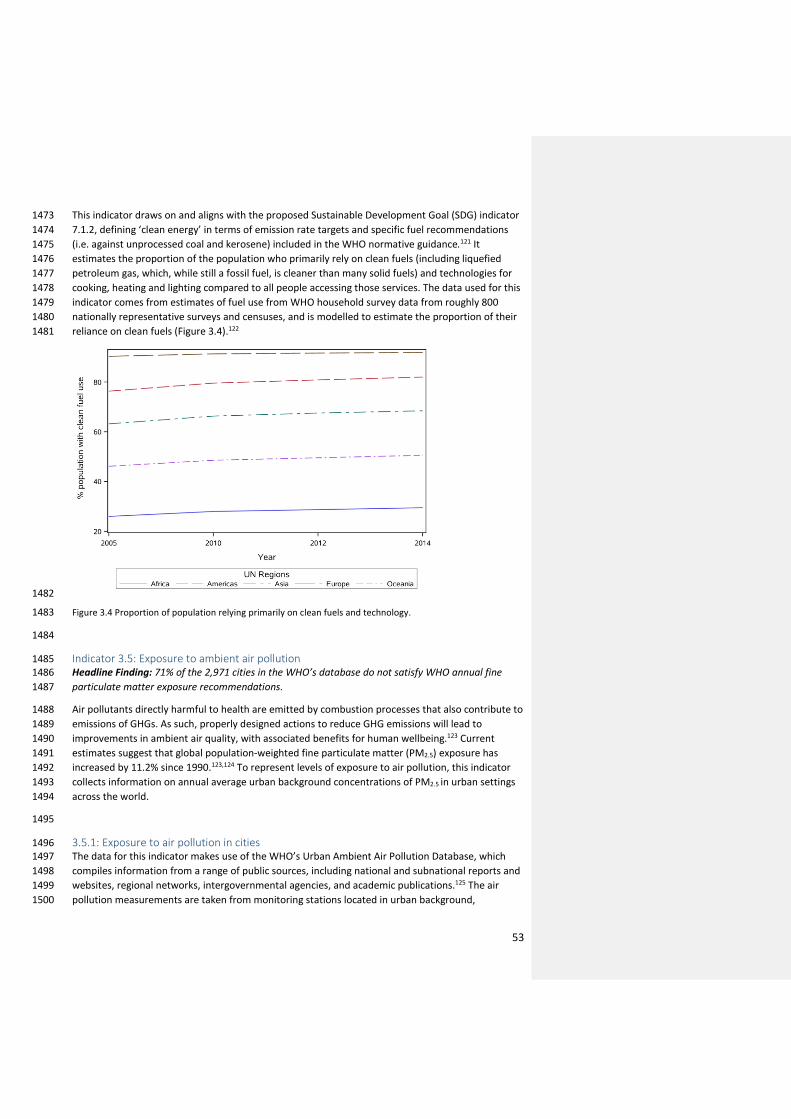
53
This indicator draws on and aligns with the proposed Sustainable Development Goal (SDG) indicator 1473
7.1.2, defining ‘clean energy’ in terms of emission rate targets and specific fuel recommendations 1474
(i.e. against unprocessed coal and kerosene) included in the WHO normative guidance.121 It 1475
estimates the proportion of the population who primarily rely on clean fuels (including liquefied 1476
petroleum gas, which, while still a fossil fuel, is cleaner than many solid fuels) and technologies for 1477
cooking, heating and lighting compared to all people accessing those services. The data used for this 1478
indicator comes from estimates of fuel use from WHO household survey data from roughly 800 1479
nationally representative surveys and censuses, and is modelled to estimate the proportion of their 1480
reliance on clean fuels (Figure 3.4).122 1481
1482
Figure 3.4 Proportion of population relying primarily on clean fuels and technology. 1483
1484
Indicator 3.5: Exposure to ambient air pollution 1485 Headline Finding: 71% of the 2,971 cities in the WHO’s database do not satisfy WHO annual fine 1486
particulate matter exposure recommendations. 1487
Air pollutants directly harmful to health are emitted by combustion processes that also contribute to 1488
emissions of GHGs. As such, properly designed actions to reduce GHG emissions will lead to 1489
improvements in ambient air quality, with associated benefits for human wellbeing.123 Current 1490
estimates suggest that global population-weighted fine particulate matter (PM2.5) exposure has 1491
increased by 11.2% since 1990.123,124 To represent levels of exposure to air pollution, this indicator 1492
collects information on annual average urban background concentrations of PM2.5 in urban settings 1493
across the world. 1494
1495
3.5.1: Exposure to air pollution in cities 1496 The data for this indicator makes use of the WHO’s Urban Ambient Air Pollution Database, which 1497
compiles information from a range of public sources, including national and subnational reports and 1498
websites, regional networks, intergovernmental agencies, and academic publications.125 The air 1499
pollution measurements are taken from monitoring stations located in urban background, 1500

54
residential, commercial, and mixed areas. The annual average density of emission sources in urban 1501
areas and the proximity of populations to those sources led the Lancet Countdown to focus on 1502
exposure in cities. 1503
For this indicator, the Lancet Countdown has combined the WHO database with the Sustainable 1504
Healthy Urban Environments (SHUE) database, presenting data on 246 randomly sampled cities 1505
across the world (stratified by national wealth, population size, and Bailey’s Ecoregion) (Figure 1506
3.5).126 1507
1508
1509
1510
Figure 3.5 Annual mean PM2.5 concentration vs per capita GDP for 246 cities in the SHUE database. Colours 1511 indicate WHO regions: blue – Africa; red – Europe; green – the Americas; Lime – Eastern Mediterranean; 1512 orange – Western Pacific; purple – South East Asia. The dotted line marks the WHO recommended guidance 1513 level of 10 µg.m-3. 1514
1515
PM2.5 levels in the majority of global cities are currently well above the WHO’s annual guideline level 1516
of 10 µg.m-3, with particularly high levels in cities in central, South and East Asia. Of almost 3,000 1517
cities in the WHO database, levels in 71.2% are above the guideline level. However, since monitoring 1518
is more common in high income settings, this is likely to represent an underestimation; for 1519
randomly-selected cities in the SHUE database, 87.3% of cities are above the guideline. The data 1520
suggests that air pollution levels have generally decreased in high income settings over recent 1521
decades, although it has marginally increased, globally.127 1522
Panel 3.1. Energy and Household Air Pollution in Peru. 1523
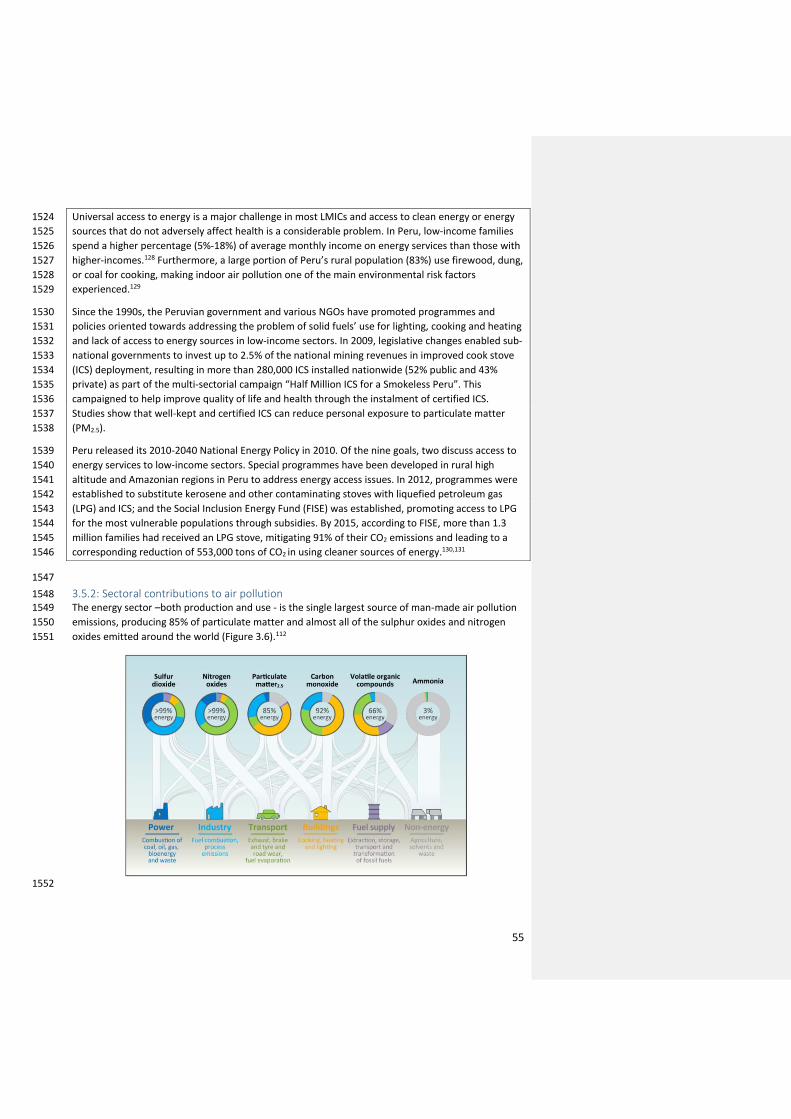
55
Universal access to energy is a major challenge in most LMICs and access to clean energy or energy 1524
sources that do not adversely affect health is a considerable problem. In Peru, low-income families 1525
spend a higher percentage (5%-18%) of average monthly income on energy services than those with 1526
higher-incomes.128 Furthermore, a large portion of Peru’s rural population (83%) use firewood, dung, 1527
or coal for cooking, making indoor air pollution one of the main environmental risk factors 1528
experienced.129 1529
Since the 1990s, the Peruvian government and various NGOs have promoted programmes and 1530
policies oriented towards addressing the problem of solid fuels’ use for lighting, cooking and heating 1531
and lack of access to energy sources in low-income sectors. In 2009, legislative changes enabled sub-1532
national governments to invest up to 2.5% of the national mining revenues in improved cook stove 1533
(ICS) deployment, resulting in more than 280,000 ICS installed nationwide (52% public and 43% 1534
private) as part of the multi-sectorial campaign “Half Million ICS for a Smokeless Peru”. This 1535
campaigned to help improve quality of life and health through the instalment of certified ICS. 1536
Studies show that well-kept and certified ICS can reduce personal exposure to particulate matter 1537
(PM2.5). 1538
Peru released its 2010-2040 National Energy Policy in 2010. Of the nine goals, two discuss access to 1539
energy services to low-income sectors. Special programmes have been developed in rural high 1540
altitude and Amazonian regions in Peru to address energy access issues. In 2012, programmes were 1541
established to substitute kerosene and other contaminating stoves with liquefied petroleum gas 1542
(LPG) and ICS; and the Social Inclusion Energy Fund (FISE) was established, promoting access to LPG 1543
for the most vulnerable populations through subsidies. By 2015, according to FISE, more than 1.3 1544
million families had received an LPG stove, mitigating 91% of their CO2 emissions and leading to a 1545
corresponding reduction of 553,000 tons of CO2 in using cleaner sources of energy.130,131 1546
1547
3.5.2: Sectoral contributions to air pollution 1548 The energy sector –both production and use - is the single largest source of man-made air pollution 1549
emissions, producing 85% of particulate matter and almost all of the sulphur oxides and nitrogen 1550
oxides emitted around the world (Figure 3.6).112 1551
1552

56
Figure 3.6 Selected primary air pollutants and their sources globally in 2015.112 (Source: IEA, 2016) 1553
1554
Of this, coal power is responsible for three-quarters of the energy production and use sector’s 1555
Sulphur Dioxide (SO2) emissions, 70% of its Nitrogen Oxide (NOx) emissions and more than 90% of its 1556
PM2.5 emissions.112 However, over the past decade, these emissions have largely decoupled from 1557
increases in coal-fired generation in several geographies, due to the introduction of emission 1558
standards for coal power plants.132,133 1559
In 2015, manufacturing and other industries (for example, refining and mining) were responsible for 1560
about half of global energy-related emissions of SO2 as well as 30% of both NOx (28 Mt) and PM2.5.112 1561
Furthermore, transport was responsible for around half of all energy-related NOx emissions in 2015 1562
as well as 10% of PM2.5. Within this sector, road vehicles were by far the largest source of the 1563
sector’s NOx and PM2.5 emissions (58% and 73%, respectively), while the largest portion of SO2 1564
emissions came from shipping.112 Trends in NOx emissions from the transport sector (1990 to 2010) 1565
are shown in Figure 3.7. 1566
1567
a) 1568
b) 1569
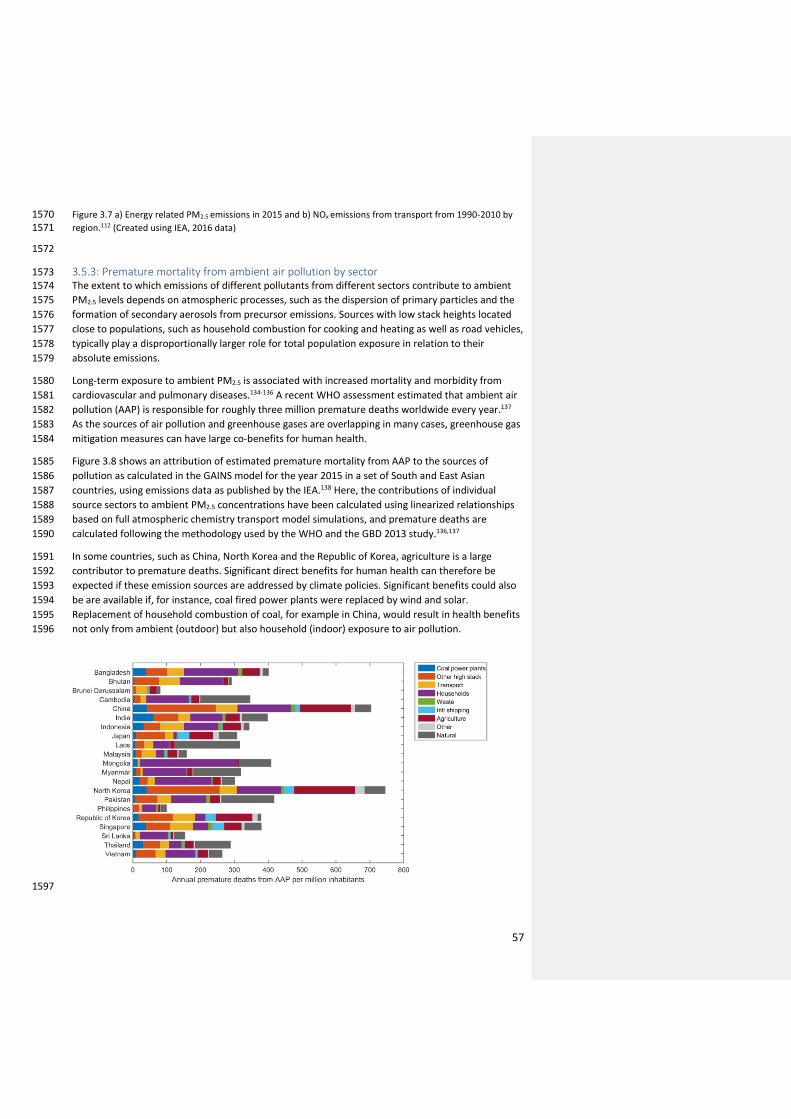
57
Figure 3.7 a) Energy related PM2.5 emissions in 2015 and b) NOx emissions from transport from 1990-2010 by 1570 region.112 (Created using IEA, 2016 data) 1571
1572
3.5.3: Premature mortality from ambient air pollution by sector 1573 The extent to which emissions of different pollutants from different sectors contribute to ambient 1574
PM2.5 levels depends on atmospheric processes, such as the dispersion of primary particles and the 1575
formation of secondary aerosols from precursor emissions. Sources with low stack heights located 1576
close to populations, such as household combustion for cooking and heating as well as road vehicles, 1577
typically play a disproportionally larger role for total population exposure in relation to their 1578
absolute emissions. 1579
Long-term exposure to ambient PM2.5 is associated with increased mortality and morbidity from 1580
cardiovascular and pulmonary diseases.134-136 A recent WHO assessment estimated that ambient air 1581
pollution (AAP) is responsible for roughly three million premature deaths worldwide every year.137 1582
As the sources of air pollution and greenhouse gases are overlapping in many cases, greenhouse gas 1583
mitigation measures can have large co-benefits for human health. 1584
Figure 3.8 shows an attribution of estimated premature mortality from AAP to the sources of 1585
pollution as calculated in the GAINS model for the year 2015 in a set of South and East Asian 1586
countries, using emissions data as published by the IEA.138 Here, the contributions of individual 1587
source sectors to ambient PM2.5 concentrations have been calculated using linearized relationships 1588
based on full atmospheric chemistry transport model simulations, and premature deaths are 1589
calculated following the methodology used by the WHO and the GBD 2013 study.136,137 1590
In some countries, such as China, North Korea and the Republic of Korea, agriculture is a large 1591
contributor to premature deaths. Significant direct benefits for human health can therefore be 1592
expected if these emission sources are addressed by climate policies. Significant benefits could also 1593
be are available if, for instance, coal fired power plants were replaced by wind and solar. 1594
Replacement of household combustion of coal, for example in China, would result in health benefits 1595
not only from ambient (outdoor) but also household (indoor) exposure to air pollution. 1596
1597

58
Figure 3.8 Health impacts of exposure to ambient PM2.5 in terms of annual premature deaths per million 1598 inhabitants in South and East Asian countries in 2015, broken down by key sources of pollution. 1599
1600
1601
Transport Sector 1602
Transportation systems – including road vehicles, rail, shipping, and aviation – are a key source of 1603
GHG emissions, contributing 14% of global emissions in 2010.111,112 In order to meet the 2°C target, 1604
the global transport sector must reduce its total GHG emissions by more than 20% below current 1605
levels, by 2050, and to be on a trajectory to zero carbon emissions in the second half of the 1606
century.139 Compared to other energy demand sectors, key sub-sectors of transportation (urban 1607
personal and freight transport, long distance road transport, shipping, short haul aviation, and long 1608
haul aviation) are more difficult to decarbonise because of the high energy density of fossil fuels, 1609
thus emissions reductions targets are lower for transport than the energy sector as a whole. 1610
The transport sector is also a major source of air pollutants, including particulate matter, nitrogen 1611
oxides, sulphur dioxide, carbon monoxide, volatile organic compounds, and indirectly, ozone. 1612
Furthermore, exposure to air pollution from road transport is particularly challenging in cities where 1613
vehicles emit street-level air pollution. In turn, significant opportunities for health exist through the 1614
reduction of GHG emissions from transport systems, both in the near-term through cleaner air and 1615
increased physical activity, and the long-term through the mitigation of climate change. 1616
1617
Indicator 3.6: Clean fuel use for transport 1618 Headline Finding: Global transport fuel use (TJ) has increased by almost 24% since 1990 on a per 1619
capita basis. While petrol and diesel continue to dominate, non-conventional fuels have been rapidly 1620
expanding, with more than 2 million electric vehicles being sold between 2010 and 2016. 1621
Fuels used for transport produce more than half the nitrogen oxides emitted globally and a 1622
significant proportion of particulate matter.111,112 Switching to low-emission transport systems is an 1623
important component of climate change mitigation and will help to reduce concentrations of most 1624
ambient air pollutants. However, the transport sector’s extremely high reliance on petroleum-based 1625
fuels makes this transition particularly challenging. 1626
This indicator focuses on monitoring global trends in levels of fuel efficiency, and on the transition 1627
away from the most polluting and carbon intensive transport fuels. More specifically, this indicator 1628
follows the metric of fuel use for transportation on a per capita basis (TJ/person) by type of fuel. To 1629
develop this indicator, the Lancet Countdown draws on transport fuel data from the IEA and 1630
population data from the World Bank.112 1631
While some transition away from carbon-intensive fuel use, towards increasing levels of fuel 1632
efficiency has occurred in select countries, transport is still heavily dominated by gasoline and diesel. 1633
Global transport fuel use has increased by almost 65% since 1970 on a per capita basis (Tj/person) 1634
(Figure 3.9). However, non-conventional fuels (for example, electricity, biofuels, and natural gas) 1635
have been rapidly gaining traction since the 2000s, with more than two million electric vehicles 1636
having been sold around the globe since 2010, mostly in the US, China, Japan and some European 1637
countries (Figure 3.10).140 These figures remain modest when compared to the overall number of 1638
cars sold per year, 77 million in 2017, and the total global fleet of 1.2 billion cars. 1639
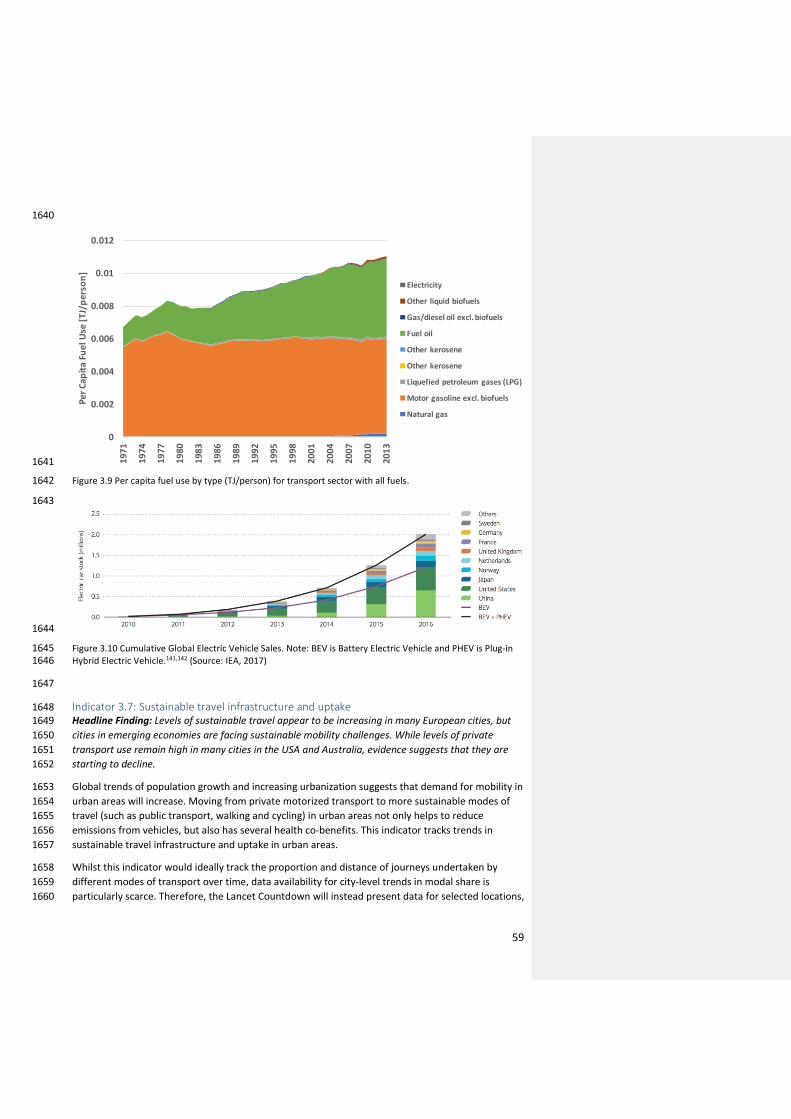
59
1640
1641
Figure 3.9 Per capita fuel use by type (TJ/person) for transport sector with all fuels. 1642
1643
1644
Figure 3.10 Cumulative Global Electric Vehicle Sales. Note: BEV is Battery Electric Vehicle and PHEV is Plug-in 1645 Hybrid Electric Vehicle.141,142 (Source: IEA, 2017) 1646
1647
Indicator 3.7: Sustainable travel infrastructure and uptake 1648 Headline Finding: Levels of sustainable travel appear to be increasing in many European cities, but 1649
cities in emerging economies are facing sustainable mobility challenges. While levels of private 1650
transport use remain high in many cities in the USA and Australia, evidence suggests that they are 1651
starting to decline. 1652
Global trends of population growth and increasing urbanization suggests that demand for mobility in 1653
urban areas will increase. Moving from private motorized transport to more sustainable modes of 1654
travel (such as public transport, walking and cycling) in urban areas not only helps to reduce 1655
emissions from vehicles, but also has several health co-benefits. This indicator tracks trends in 1656
sustainable travel infrastructure and uptake in urban areas. 1657
Whilst this indicator would ideally track the proportion and distance of journeys undertaken by 1658
different modes of transport over time, data availability for city-level trends in modal share is 1659
particularly scarce. Therefore, the Lancet Countdown will instead present data for selected locations, 1660
0
0.002
0.004
0.006
0.008
0.01
0.012
1971
1974
1977
1980
1983
1986
1989
1992
1995
1998
2001
2004
2007
2010
2013
PerCapitaFuelUse[TJ/person]
PerCapitaFuelUse[TJ/person]- Global
Electricity
Otherliquidbiofuels
Gas/dieseloilexcl.biofuels
Fueloil
Otherkerosene
Otherkerosene
Liquefiedpetroleumgases(LPG)
Motorgasolineexcl.biofuels
Naturalgas

60
across a limited time-scale. Figure 3.11 presents data on current modal shares (i.e. recent year 1661
estimates of the proportion of trips by different modes of transport) in world cities (see Appendix 4 1662
for details). The data, collated by the Land Transport Authority come from travel surveys of 1663
individual cities and national census data (see Appendix 4 for details).143 1664
1665
1666
Figure 3.11 Modal Shares in world cities. Note: ‘Other’ typically includes paratransit (transport for people with 1667 disabilities) and/or electric bikes. 1668
1669
Figure 3.12 collates data on trends in modal share in select cities, where data from at least three 1670
time points (including one pre-2000 time point) is available. While many cities have started to collect 1671
this information in the past decade, there is a paucity of data on trends from before 2000, with 1672
particularly wide gaps in data availability from cities in Asia, Africa and South America.144 1673
In Berlin, London and Tokyo, the proportion of trips by privatised motor transport has slowly 1674
declined since the late 1990s, while levels have remained high in Vancouver and Sydney and appear 1675
to be increasing in Santiago. Levels of cycling are generally low, but appear to be increasing in many 1676
cities. 1677
Public transport in emerging cities is often insufficient, inefficient and in poor condition, potentially 1678
leading to further declines in sustainable travel in many rapidly growing cities in the future. 145 As 1679
this transition occurs, ensuring the mistakes made in Organization for Economic Cooperation and 1680
Development (OECD) countries are not repeated will be vital. In particular, it is critical to improve 1681
walking and cycling environments, in order to both make these modes attractive choices and protect 1682
road users from injury. Recent United Nations (UN) guidance recommends devoting 20% of 1683
transport budgets to funding non-motorized transport at national and local levels in low- and 1684
middle-income countries.146 1685
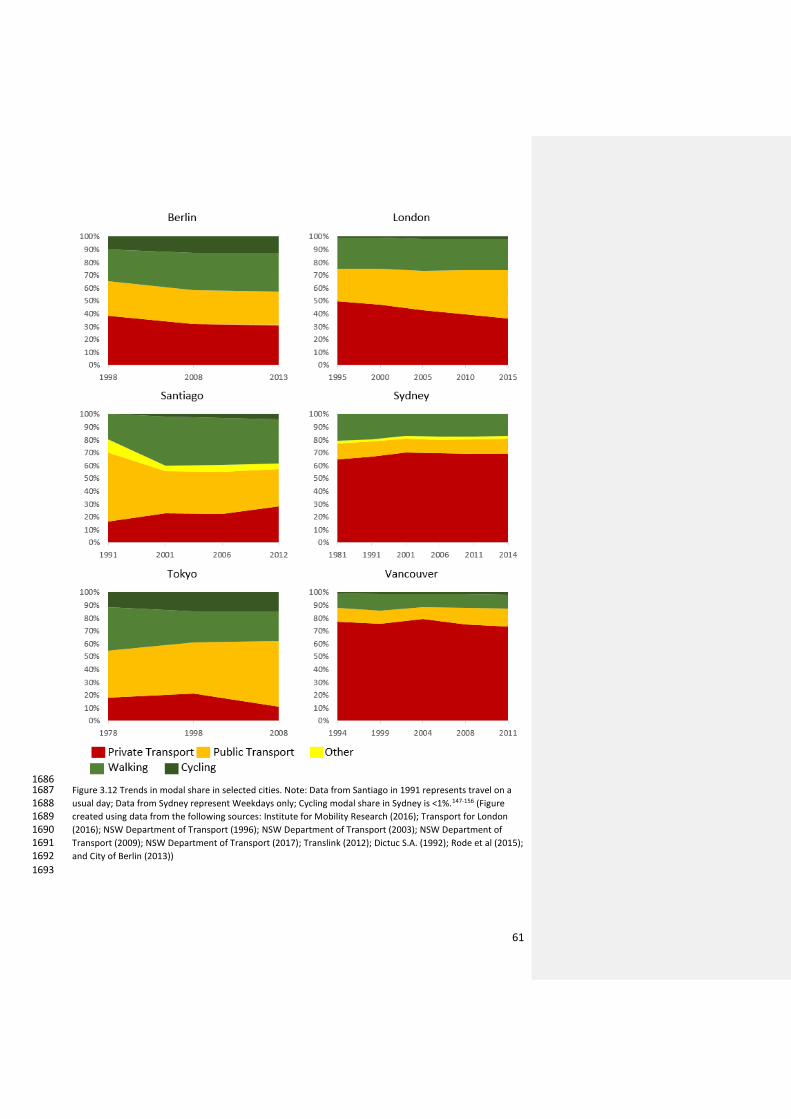
61
1686 Figure 3.12 Trends in modal share in selected cities. Note: Data from Santiago in 1991 represents travel on a 1687 usual day; Data from Sydney represent Weekdays only; Cycling modal share in Sydney is <1%.147-156 (Figure 1688 created using data from the following sources: Institute for Mobility Research (2016); Transport for London 1689 (2016); NSW Department of Transport (1996); NSW Department of Transport (2003); NSW Department of 1690 Transport (2009); NSW Department of Transport (2017); Translink (2012); Dictuc S.A. (1992); Rode et al (2015); 1691 and City of Berlin (2013)) 1692
1693
62
Food and agriculture 1694
The availability of food is central to human health. Its production, however, is also a major 1695
contributor to climate change, with the agricultural sector alone contributing 19-29% of 1696
anthropogenic GHG emissions globally.10,157 1697
Dietary choices determine food energy and nutrient intake, which are essential for human health, 1698
with inadequate and unhealthy diets associated with malnutrition and health outcomes including 1699
diabetes, cardiovascular diseases, and some cancers. Globally, dietary risk factors were estimated to 1700
account for over 10% of all Disability Adjusted Life Years (DALYs) lost in 2013.158 A transition to 1701
healthier diets, with reduced red and processed meat consumption, and higher consumption of 1702
locally and seasonally produced fruits and vegetables, could provide significant emissions savings.159 1703
Tracking progress towards more sustainable diets requires consistent and continuous data on food 1704
consumption, and related GHG emissions throughout food product life cycles. This would require 1705
annual nationally representative dietary survey data on food consumption. However, due to the 1706
complexity and cost of such data collection, dietary surveys are available for a limited number of 1707
countries and years only.160 Although efforts to compile data and ensure comparability are under 1708
way, their current format is not suitable for global monitoring of progress towards optimal dietary 1709
patterns in terms of health benefits of climate change mitigation.161,162 1710
1711
Indicator 3.8: Ruminant meat for human consumption 1712 Headline Finding: Globally, the amount of ruminant meat available for human consumption has 1713
declined slightly from 12.09 kg/capita/year in 1990 to 11.23 in 2013; the proportion of energy 1714
(kcal/capita/day) available for human consumption from ruminant meat as opposed to other sources 1715
has declined marginally from 1.86% in 1990 to 1.65% in 2013. 1716
This indicator focuses on ruminants because the production of ruminant meat, in particular cattle, 1717
dominates GHG emissions from the livestock sector (estimated at 5.6-7.5 GtCO2e per year), and 1718
consumption of red meat has known associations with adverse health outcomes.163It measures the 1719
total amount of ruminant meat available for consumption, and the ratio of ruminant meat energy 1720
supply to total energy supply. Together, these reflect the relative amount of high GHG emission 1721
foods in the system (Figure 3.13).164-166 Assuming correlation between ruminant meat supply and 1722
consumption, the indicator therefore also provides information on variations in certain diet-related 1723
health outcomes (such as colorectal cancer and heart disease).167,168 This indicator should be viewed 1724
in the context of the specific setting where this trend is examined (in some populations, meat 1725
consumption is a main source of food energy and provides essential micronutrients, as well as 1726
livelihoods). Data was constructed using data from the FAO food balance sheets, which comprises 1727
national supply and utilisation accounts of primary foods and processed commodities.169 1728
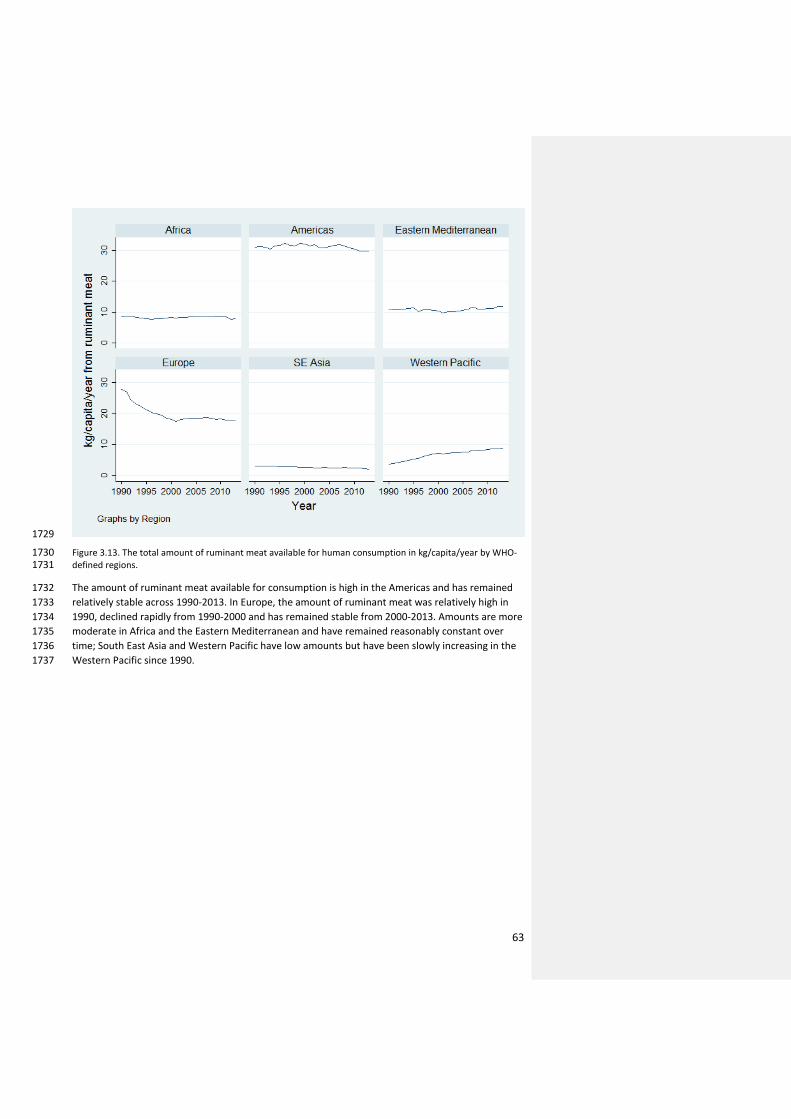
63
1729
Figure 3.13. The total amount of ruminant meat available for human consumption in kg/capita/year by WHO-1730 defined regions. 1731
The amount of ruminant meat available for consumption is high in the Americas and has remained 1732
relatively stable across 1990-2013. In Europe, the amount of ruminant meat was relatively high in 1733
1990, declined rapidly from 1990-2000 and has remained stable from 2000-2013. Amounts are more 1734
moderate in Africa and the Eastern Mediterranean and have remained reasonably constant over 1735
time; South East Asia and Western Pacific have low amounts but have been slowly increasing in the 1736
Western Pacific since 1990. 1737

64
1738
Figure 3.14 The proportion of energy (kcal/capita/day) available for human consumption from ruminant meat 1739 vs from all food sources by WHO-defined regions. 1740
The proportion of energy supply from ruminant meat has been markedly higher in the Americas than 1741
other regions since the 1990s, although the trend has been decreasing over time (Figure 3.14). In 1742
Europe, the proportion of energy from ruminant meat rapidly declined from 1990-2000 and has 1743
continued to slowly decline. By contrast, the trend has been increasing in the Western Pacific, 1744
possibly reflecting the increasing trend in beef consumption in China (16% annually).170 1745
Healthcare sector 1746
The healthcare sector is a considerable contributor to GHG emissions, and has both a responsibility 1747
and an appreciable opportunity to lead by example in reducing its carbon footprint. In 2013, the 1748
estimated US healthcare sector emissions were 655 MtCO2e, which exceeded emissions of the entire 1749
UK.171 GHG emissions in the healthcare sector illustrate an obvious externality which contributes to 1750
climate change, contradicting the sector’s aim of improving population health. 1751
The World Bank estimates that a 25% reduction from existing healthcare emissions in Argentina, 1752
Brazil, China, India, Nepal, Philippines, and South Africa would equate to 116-194 million metric tons 1753
of CO2e emission reduction, in other terms equal to decommissioning of 34-56 coal fired power 1754
plants or removing 24-41 million passenger vehicles from the road.171 1755
1756
Indicator 3.9: Healthcare sector emissions 1757 Headline Finding: Whilst no systematic global standard for measuring the greenhouse gas emissions 1758
of the healthcare sector currently exists, a number of healthcare systems in the UK, US, and around 1759
the world are working to reduce their contribution to climate change. 1760

65
Several health sector emission reduction targets can be highlighted as positive examples. The 1761
National Health Service (NHS) in the UK set an ambitious target of 34% health-system wide GHG 1762
emission reduction by 2020; Kaiser Permanente in the U.S. has set 2025 as a target to become net 1763
carbon positive; the Western Cape Government health system in South Africa committed to 10% 1764
emission reduction by 2020 and 30% by 2050 in government hospitals; and Albert Einstein Hospital 1765
in Sao Paulo, Brazil, has reduced its annual emissions by 41%.171 1766
In the UK, comprehensive GHG emissions reporting was facilitated by the centralized structure of the 1767
NHS. The Sustainable Development Unit (SDU) of the NHS has been monitoring GHG emissions from 1768
a 1992 baseline, including major contributions from procurement of pharmaceuticals and other 1769
products. NHS emissions reduced by 11% from 2007 to 2015, despite an 18% increase in activity.172 1770
Mitigation efforts from the healthcare sector provide remarkable examples of hospitals and health 1771
care systems leading by example, yielding impressive financial savings and health benefits for their 1772
patients. To this end, the efforts of the hospitals, governments, and civil society organisations driving 1773
this work forward must be supported and redoubled, ensuring a full transition to a healthier, more 1774
sustainable model of climate-smart, and increasingly carbon neutral healthcare.171 1775
Monitoring healthcare system emissions is an essential step towards accounting for the externality 1776
of these emissions. Comprehensive national GHG emissions reporting by the healthcare system is 1777
currently only routinely performed in the UK. Elsewhere, select healthcare organisations, facilities, 1778
and companies provide self-reported estimates of emissions, however this is rarely standardized 1779
across sites. The Lancet Countdown will continue to work on developing a standardised indicator on 1780
health sector emissions for subsequent reports. 1781
1782
Conclusion 1783
The indicators presented in this section have provided an overview of activities relevant to public 1784
health for the energy, transport, food and healthcare sectors’ mitigation. They have been selected 1785
for their relevance to both climate change and human health and wellbeing. 1786
A number of areas show remarkable promise – each of which should yield impressive benefits for 1787
human health. However, these positive examples must not distract from the enormity of the task at 1788
hand. The indicators presented in this section serve as a reminder of the scale and scope of 1789
increased ambition required to meet commitments under the Paris Agreement. They demonstrate a 1790
world which is only just beginning to respond to climate change, and hence only just unlocking the 1791
opportunities available for better health. 1792
1793
1794

66
4. Finance & Economics 1795
1796
Introduction 1797
Interventions to protect human health from climate change risks have been presented above. This 1798
section focuses on the economic and financial mechanisms necessary for them to be implemented, 1799
and their implications. Some the indicators here do not have an explicit link to human health, and yet, 1800
investment in renewable energy and a declining investment in coal capacity, for instance, is essential 1801
in displacing fossil fuels and reducing their two principal externalities – the social cost of climate 1802
change and the health costs from air pollution. Other indicators, such as economic and social losses 1803
from extreme weather events, have more explicit links to human wellbeing. 1804
The 2006 Stern Review on the Economics of Climate Change estimated that the impacts of climate 1805
change would cost the equivalent of reducing annual global Gross World Product (GWP) – the sum 1806
of global economic output – by “5-20% now, and forever”, compared to a world without climate 1807
change.173 The Intergovernmental Panel on Climate Change’s (IPCC) AR5 estimates an aggregate loss 1808
of up to 2% GWP even if the rise in global mean temperatures is limited to 2.5°C above pre-industrial 1809
levels.22 However, such estimates depend on numerous assumptions, such as the rate at which 1810
future costs and benefits are discounted. Further, existing analytical approaches are poorly suited to 1811
producing estimates of the economic impact of climate change, and hence their magnitude is likely 1812
greatly underestimated.174 175 In the presence of such uncertainty, with potentially catastrophic 1813
outcomes, risk minimisation through stringent emissions reduction seems the sensible course of 1814
action. 1815
The indicators in this section, which seek to track flows of finance and impacts on the economy and 1816
social welfare resulting from (in)action on climate change, fall into four broad themes: investing in a 1817
low-carbon economy; the economic benefits of tackling climate change; pricing GHG emissions from 1818
fossil fuels; and adaptation financing. The indicator presented are: 1819
4.1 Investments in zero-carbon energy and energy efficiency 1820
4.2 Investment in coal capacity 1821
4.3 Funds divested from fossil fuels 1822
4.4 Economic losses due to climate-related extreme events 1823
4.5 Employment in low-carbon and high-carbon industries 1824
4.6 Fossil fuel subsidies 1825
4.7 Coverage and strength of carbon pricing 1826
4.8 Use of carbon pricing revenues 1827
4.9 Spending on adaptation for health and health-related activities 1828
4.10 Health adaptation funding from global climate financing mechanisms 1829
1830
Appendix 5 provides more detailed discussion of the data and methods used. 1831
1832
1833
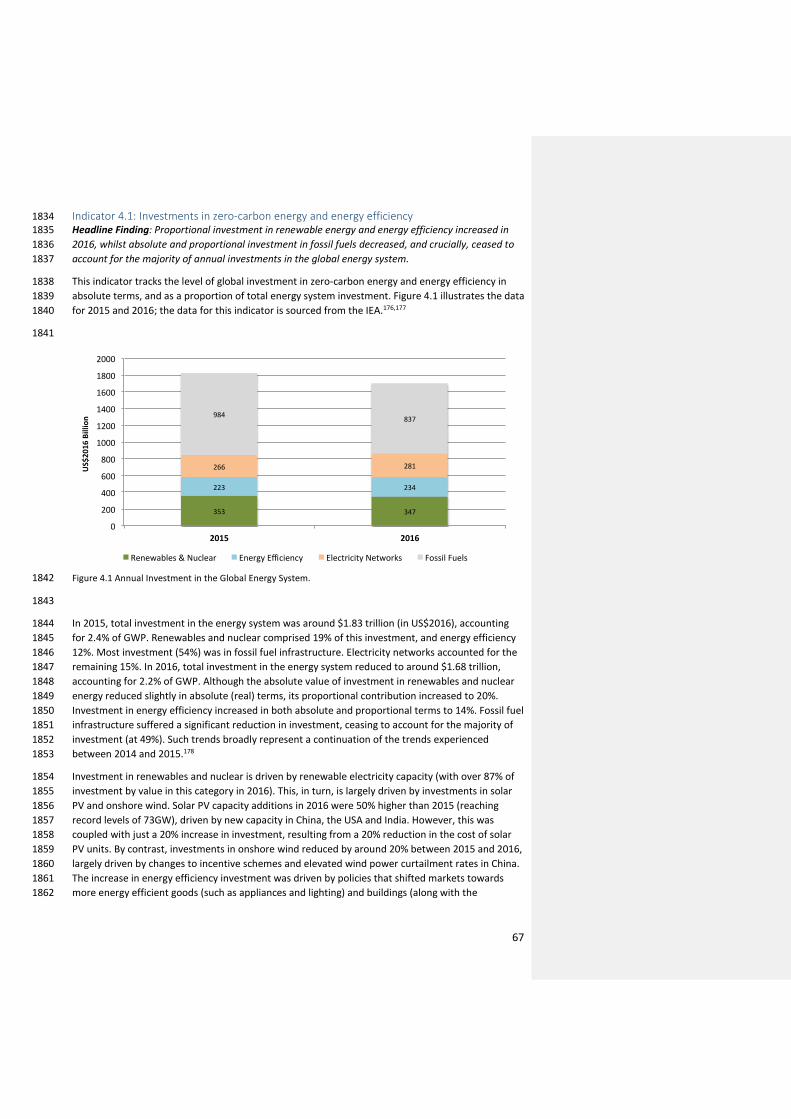
67
Indicator 4.1: Investments in zero-carbon energy and energy efficiency 1834 Headline Finding: Proportional investment in renewable energy and energy efficiency increased in 1835
2016, whilst absolute and proportional investment in fossil fuels decreased, and crucially, ceased to 1836
account for the majority of annual investments in the global energy system. 1837
This indicator tracks the level of global investment in zero-carbon energy and energy efficiency in 1838
absolute terms, and as a proportion of total energy system investment. Figure 4.1 illustrates the data 1839
for 2015 and 2016; the data for this indicator is sourced from the IEA.176,177 1840
1841
Figure 4.1 Annual Investment in the Global Energy System. 1842
1843
In 2015, total investment in the energy system was around $1.83 trillion (in US$2016), accounting 1844
for 2.4% of GWP. Renewables and nuclear comprised 19% of this investment, and energy efficiency 1845
12%. Most investment (54%) was in fossil fuel infrastructure. Electricity networks accounted for the 1846
remaining 15%. In 2016, total investment in the energy system reduced to around $1.68 trillion, 1847
accounting for 2.2% of GWP. Although the absolute value of investment in renewables and nuclear 1848
energy reduced slightly in absolute (real) terms, its proportional contribution increased to 20%. 1849
Investment in energy efficiency increased in both absolute and proportional terms to 14%. Fossil fuel 1850
infrastructure suffered a significant reduction in investment, ceasing to account for the majority of 1851
investment (at 49%). Such trends broadly represent a continuation of the trends experienced 1852
between 2014 and 2015.178 1853
Investment in renewables and nuclear is driven by renewable electricity capacity (with over 87% of 1854
investment by value in this category in 2016). This, in turn, is largely driven by investments in solar 1855
PV and onshore wind. Solar PV capacity additions in 2016 were 50% higher than 2015 (reaching 1856
record levels of 73GW), driven by new capacity in China, the USA and India. However, this was 1857
coupled with just a 20% increase in investment, resulting from a 20% reduction in the cost of solar 1858
PV units. By contrast, investments in onshore wind reduced by around 20% between 2015 and 2016, 1859
largely driven by changes to incentive schemes and elevated wind power curtailment rates in China. 1860
The increase in energy efficiency investment was driven by policies that shifted markets towards 1861
more energy efficient goods (such as appliances and lighting) and buildings (along with the 1862
353 347
223 234
266 281
984837
0
200
400
600
800
1000
1200
1400
1600
1800
2000
2015 2016
US$2016Billion
Renewables&Nuclear EnergyEfficiency ElectricityNetworks FossilFuels
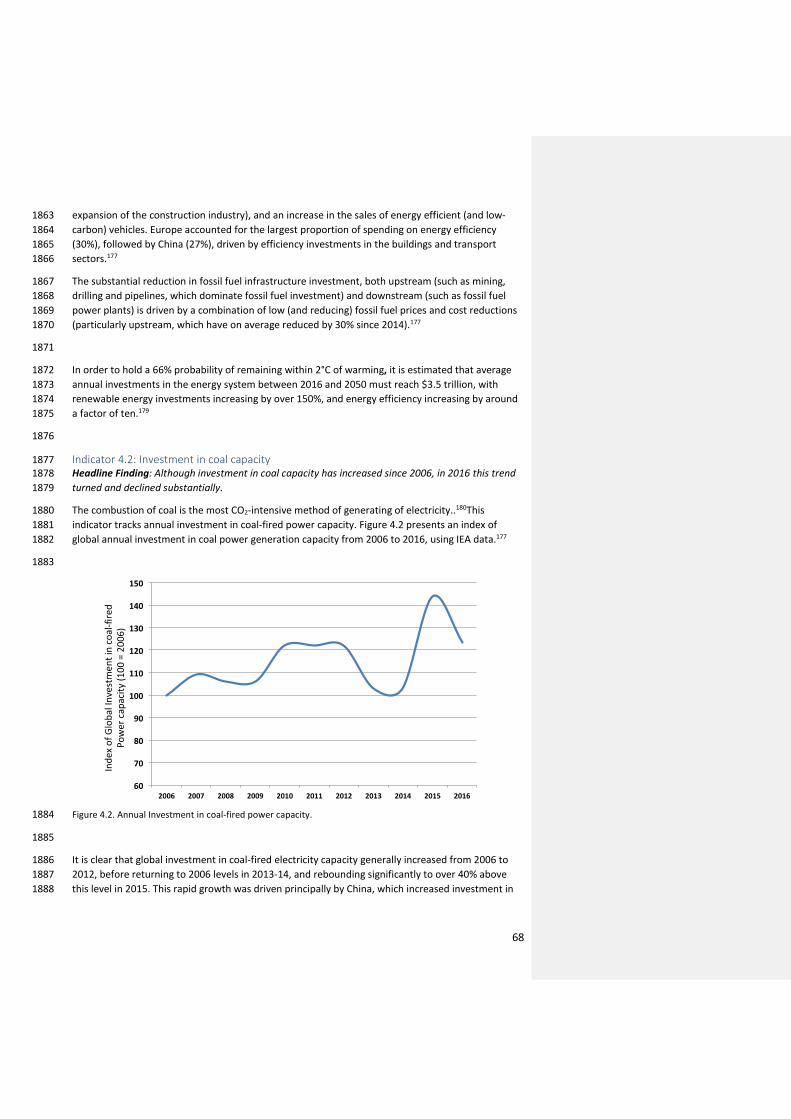
68
expansion of the construction industry), and an increase in the sales of energy efficient (and low-1863
carbon) vehicles. Europe accounted for the largest proportion of spending on energy efficiency 1864
(30%), followed by China (27%), driven by efficiency investments in the buildings and transport 1865
sectors.177 1866
The substantial reduction in fossil fuel infrastructure investment, both upstream (such as mining, 1867
drilling and pipelines, which dominate fossil fuel investment) and downstream (such as fossil fuel 1868
power plants) is driven by a combination of low (and reducing) fossil fuel prices and cost reductions 1869
(particularly upstream, which have on average reduced by 30% since 2014).177 1870
1871
In order to hold a 66% probability of remaining within 2°C of warming, it is estimated that average 1872
annual investments in the energy system between 2016 and 2050 must reach $3.5 trillion, with 1873
renewable energy investments increasing by over 150%, and energy efficiency increasing by around 1874
a factor of ten.179 1875
1876
Indicator 4.2: Investment in coal capacity 1877 Headline Finding: Although investment in coal capacity has increased since 2006, in 2016 this trend 1878
turned and declined substantially. 1879
The combustion of coal is the most CO2-intensive method of generating of electricity..180This 1880
indicator tracks annual investment in coal-fired power capacity. Figure 4.2 presents an index of 1881
global annual investment in coal power generation capacity from 2006 to 2016, using IEA data.177 1882
1883
Figure 4.2. Annual Investment in coal-fired power capacity. 1884
1885
It is clear that global investment in coal-fired electricity capacity generally increased from 2006 to 1886
2012, before returning to 2006 levels in 2013-14, and rebounding significantly to over 40% above 1887
this level in 2015. This rapid growth was driven principally by China, which increased investment in 1888
60
70
80
90
100
110
120
130
140
150
2006 2007 2008 2009 2010 2011 2012 2013 2014 2015 2016
IndexofGlobalInvestmentincoal-fired
Powercapacity(100=2006)

69
coal-fired power capacity by 60% from 2014, representing half of all new global coal capacity in 2015 1889
(with investment in India and other non-OECD Asia countries also remaining high).178 The 1890
subsequent reduction in investment in 2016 was similarly driven by reduced investment in China, 1891
due to overcapacity in generation, concerns about local air pollution and new government measures 1892
to reduce new capacity additions and halt the construction of some plants already in progress.177 1893
1894
Indicator 4.3: Funds divested from fossil fuels 1895 Headline Finding: Global Value of Funds Committing to Divestment in 2016 was $1.24 trillion, of 1896
which Health Institutions represent $2.4 billion; this represents a cumulative sum of $5.45 trillion 1897
(with health accounting for $30.3 billion). 1898
The fossil fuel divestment movement seeks to encourage institutions and investors to divest 1899
themselves of assets involved in the extraction of fossil fuels. ‘Divestment’ is defined relatively 1900
broadly, ranging from an organisation that has made a binding commitment to divest from coal 1901
companies only, to those who have fully divested from any investments in fossil fuel companies and 1902
have committed to avoiding such investments in future. Proponents cite divestment as embodying 1903
both a moral purpose (for example, reducing the fossil fuel industry’s ‘social licence to operate’), and 1904
an economic risk reduction strategy (for example, through reducing the investor’s exposure to the 1905
risk of ‘stranded assets’). However, others believe active engagement between investors and fossil 1906
fuel businesses is a more appropriate course of action (for instance, encouraging diversification into 1907
less carbon-intensive assets, through stakeholder resolutions).181 1908
This indicator tracks the global total value of funds committing to divestment in 2016, and the value 1909
of funds committed to divestment by health institutions in 2016, which was $1.24 trillion, and $2.4 1910
billion respectively. The values presented above are calculated from data collected and provided by 1911
350.org. They represent the total assets (or assets under management (AUM)) for institutions that 1912
have committed to divest in 2016, and thus do not directly represent the sums divested from fossil 1913
fuel companies. It also includes only those institutions for which such information is publicly 1914
available (or provided by the institution itself), with non-US$ values converted using the market 1915
exchange rate when the commitment was made. 1916
By the end of 2016, a total of 694 organisations with cumulative assets worth at least $5.45 trillion, 1917
including 13 health organisations with assets of at least $30.3 billion, had committed to divestment. 1918
From the start of January 2017 to the end of March 2017, a further 12 organisations with assets 1919
worth $46.87 billion joined this total (including Australia’s Hospitals Contribution Fund – HCF – with 1920
assets of $1.45 billion). 1921
1922
Indicator 4.4: Economic losses due to climate-related extreme events 1923 Headline Finding: In 2016, a total of 797 events resulted in $129 billion in overall economic losses, 1924
with 99% of losses in low-income countries uninsured. 1925
Climate change will continue to increase the frequency and severity of meteorological (tropical 1926
storms), climatological (droughts) and hydrological (flooding) phenomena, across the world. As 1927
demonstrated by indicator 1.4, the number of weather-related disasters has increased in recent 1928
years. The number of people affected and the economic costs associated with this increase is 1929
expected to have risen. This indicator tracks the number of events and the total economic losses 1930
(insured and uninsured) resulting from such events. In addition to the health impacts of these 1931
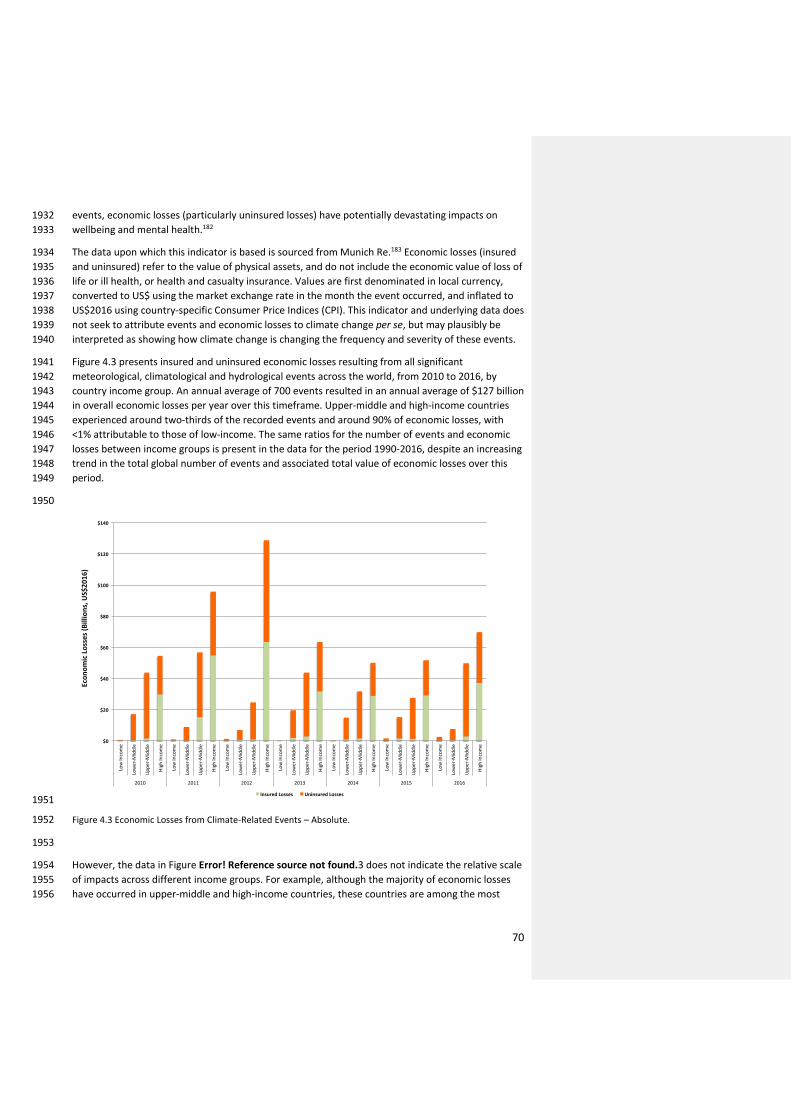
70
events, economic losses (particularly uninsured losses) have potentially devastating impacts on 1932
wellbeing and mental health.182 1933
The data upon which this indicator is based is sourced from Munich Re.183 Economic losses (insured 1934
and uninsured) refer to the value of physical assets, and do not include the economic value of loss of 1935
life or ill health, or health and casualty insurance. Values are first denominated in local currency, 1936
converted to US$ using the market exchange rate in the month the event occurred, and inflated to 1937
US$2016 using country-specific Consumer Price Indices (CPI). This indicator and underlying data does 1938
not seek to attribute events and economic losses to climate change per se, but may plausibly be 1939
interpreted as showing how climate change is changing the frequency and severity of these events. 1940
Figure 4.3 presents insured and uninsured economic losses resulting from all significant 1941
meteorological, climatological and hydrological events across the world, from 2010 to 2016, by 1942
country income group. An annual average of 700 events resulted in an annual average of $127 billion 1943
in overall economic losses per year over this timeframe. Upper-middle and high-income countries 1944
experienced around two-thirds of the recorded events and around 90% of economic losses, with 1945
<1% attributable to those of low-income. The same ratios for the number of events and economic 1946
losses between income groups is present in the data for the period 1990-2016, despite an increasing 1947
trend in the total global number of events and associated total value of economic losses over this 1948
period. 1949
1950
1951
Figure 4.3 Economic Losses from Climate-Related Events – Absolute. 1952
1953
However, the data in Figure Error! Reference source not found.3 does not indicate the relative scale 1954
of impacts across different income groups. For example, although the majority of economic losses 1955
have occurred in upper-middle and high-income countries, these countries are among the most 1956
$0
$20
$40
$60
$80
$100
$120
$140
LowIncome
Lower-M
iddle
Upper-M
iddle
HighIncome
LowIncome
Lower-M
iddle
Upper-M
iddle
HighIncome
LowIncome
Lower-M
iddle
Upper-M
iddle
HighIncome
LowIncome
Lower-M
iddle
Upper-M
iddle
HighIncome
LowIncome
Lower-M
iddle
Upper-M
iddle
HighIncome
LowIncome
Lower-M
iddle
Upper-M
iddle
HighIncome
LowIncome
Lower-M
iddle
Upper-M
iddle
HighIncome
2010 2011 2012 2013 2014 2015 2016
EconomicLosses(Billions,US$2016)
InsuredLosses UninsuredLosses
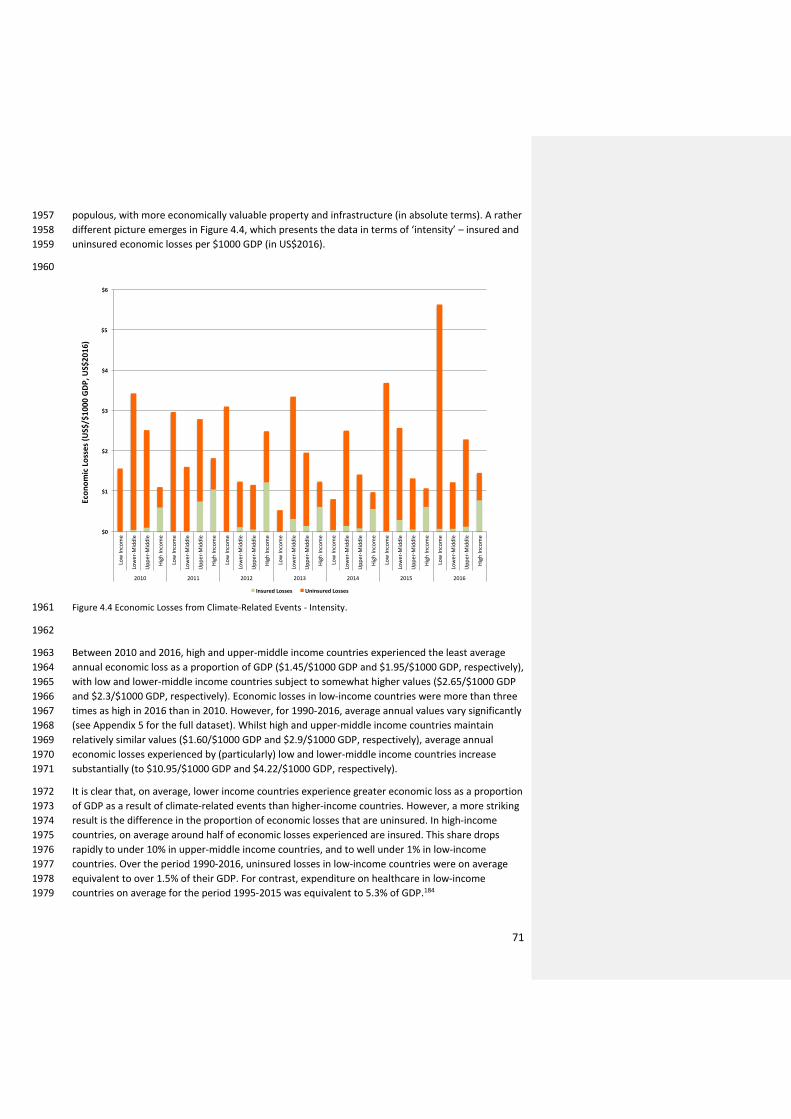
71
populous, with more economically valuable property and infrastructure (in absolute terms). A rather 1957
different picture emerges in Figure 4.4, which presents the data in terms of ‘intensity’ – insured and 1958
uninsured economic losses per $1000 GDP (in US$2016). 1959
1960
Figure 4.4 Economic Losses from Climate-Related Events - Intensity. 1961
1962
Between 2010 and 2016, high and upper-middle income countries experienced the least average 1963
annual economic loss as a proportion of GDP ($1.45/$1000 GDP and $1.95/$1000 GDP, respectively), 1964
with low and lower-middle income countries subject to somewhat higher values ($2.65/$1000 GDP 1965
and $2.3/$1000 GDP, respectively). Economic losses in low-income countries were more than three 1966
times as high in 2016 than in 2010. However, for 1990-2016, average annual values vary significantly 1967
(see Appendix 5 for the full dataset). Whilst high and upper-middle income countries maintain 1968
relatively similar values ($1.60/$1000 GDP and $2.9/$1000 GDP, respectively), average annual 1969
economic losses experienced by (particularly) low and lower-middle income countries increase 1970
substantially (to $10.95/$1000 GDP and $4.22/$1000 GDP, respectively). 1971
It is clear that, on average, lower income countries experience greater economic loss as a proportion 1972
of GDP as a result of climate-related events than higher-income countries. However, a more striking 1973
result is the difference in the proportion of economic losses that are uninsured. In high-income 1974
countries, on average around half of economic losses experienced are insured. This share drops 1975
rapidly to under 10% in upper-middle income countries, and to well under 1% in low-income 1976
countries. Over the period 1990-2016, uninsured losses in low-income countries were on average 1977
equivalent to over 1.5% of their GDP. For contrast, expenditure on healthcare in low-income 1978
countries on average for the period 1995-2015 was equivalent to 5.3% of GDP.184 1979
$0
$1
$2
$3
$4
$5
$6
LowIncome
Lower-M
iddle
Upper-M
iddle
HighIncome
LowIncome
Lower-M
iddle
Upper-M
iddle
HighIncome
LowIncome
Lower-M
iddle
Upper-M
iddle
HighIncome
LowIncome
Lower-M
iddle
Upper-M
iddle
HighIncome
LowIncome
Lower-M
iddle
Upper-M
iddle
HighIncome
LowIncome
Lower-M
iddle
Upper-M
iddle
HighIncome
LowIncome
Lower-M
iddle
Upper-M
iddle
HighIncome
2010 2011 2012 2013 2014 2015 2016
EconomicLosses(US$/$1000GDP,U
S$2016)
InsuredLosses UninsuredLosses
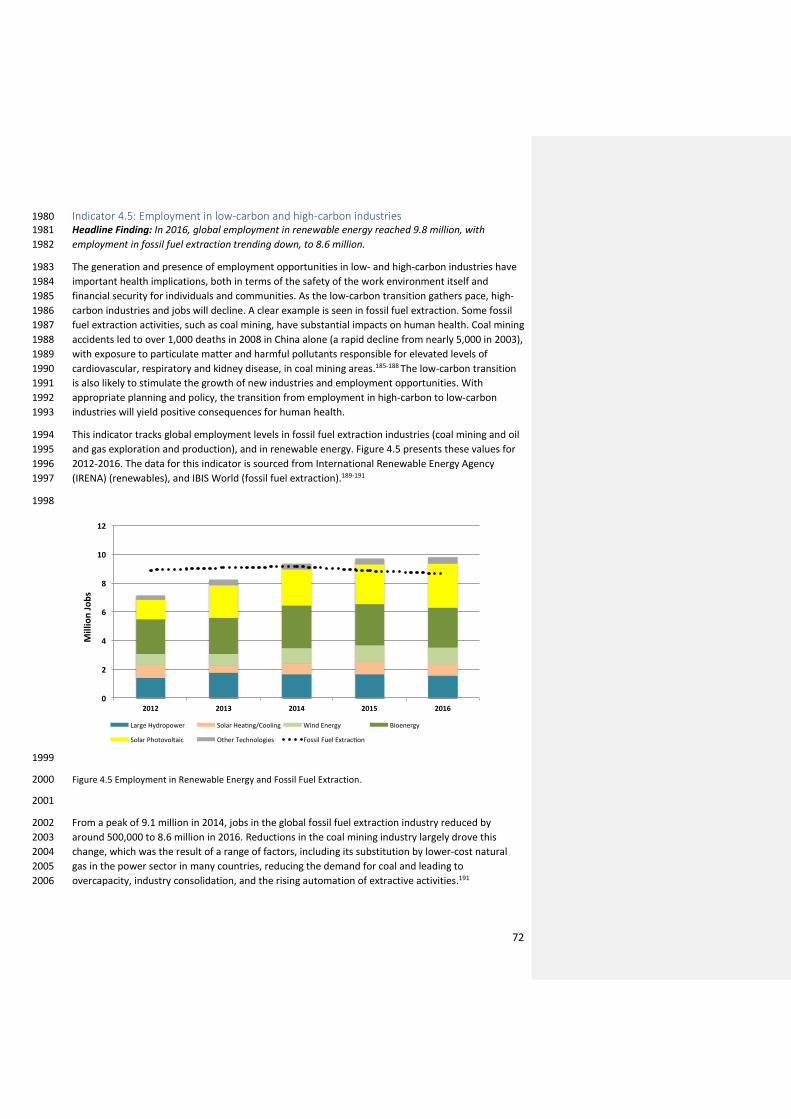
72
Indicator 4.5: Employment in low-carbon and high-carbon industries 1980 Headline Finding: In 2016, global employment in renewable energy reached 9.8 million, with 1981
employment in fossil fuel extraction trending down, to 8.6 million. 1982
The generation and presence of employment opportunities in low- and high-carbon industries have 1983
important health implications, both in terms of the safety of the work environment itself and 1984
financial security for individuals and communities. As the low-carbon transition gathers pace, high-1985
carbon industries and jobs will decline. A clear example is seen in fossil fuel extraction. Some fossil 1986
fuel extraction activities, such as coal mining, have substantial impacts on human health. Coal mining 1987
accidents led to over 1,000 deaths in 2008 in China alone (a rapid decline from nearly 5,000 in 2003), 1988
with exposure to particulate matter and harmful pollutants responsible for elevated levels of 1989
cardiovascular, respiratory and kidney disease, in coal mining areas.185-188 The low-carbon transition 1990
is also likely to stimulate the growth of new industries and employment opportunities. With 1991
appropriate planning and policy, the transition from employment in high-carbon to low-carbon 1992
industries will yield positive consequences for human health. 1993
This indicator tracks global employment levels in fossil fuel extraction industries (coal mining and oil 1994
and gas exploration and production), and in renewable energy. Figure 4.5 presents these values for 1995
2012-2016. The data for this indicator is sourced from International Renewable Energy Agency 1996
(IRENA) (renewables), and IBIS World (fossil fuel extraction).189-191 1997
1998
1999
Figure 4.5 Employment in Renewable Energy and Fossil Fuel Extraction. 2000
2001
From a peak of 9.1 million in 2014, jobs in the global fossil fuel extraction industry reduced by 2002
around 500,000 to 8.6 million in 2016. Reductions in the coal mining industry largely drove this 2003
change, which was the result of a range of factors, including its substitution by lower-cost natural 2004
gas in the power sector in many countries, reducing the demand for coal and leading to 2005
overcapacity, industry consolidation, and the rising automation of extractive activities.191 2006
0
2
4
6
8
10
12
2012 2013 2014 2015 2016
MillionJobs
LargeHydropower SolarHea ng/Cooling WindEnergy Bioenergy
SolarPhotovoltaic OtherTechnologies FossilFuelExtrac on

73
By contrast, employment in the renewable energy industry increased rapidly from over 7.1 million 2007
jobs in 2012 to over 9.3 million in 2014, and reaching 9.8 million in 2016. This growth has largely 2008
been driven by the solar PV industry, which added over 1.7 million jobs between 2012 and 2016. 2009
Solar PV is now the largest renewable energy employer, overtaking bioenergy, which has 2010
experienced a reduction of 250,000 jobs since 2012. 2011
2012
Indicator 4.6: Fossil fuel subsidies 2013 Headline Finding: In 2015, fossil fuel consumption subsidies followed a trend seen since 2012, 2014
decreasing markedly to $327 billion, principally as a result of declining global oil prices. 2015
The combustion of fossil fuels results in a variety of harmful consequences for human health, and 2016
the presence of subsidies for fossil fuels, either for its production (such as fossil fuel extraction) or 2017
consumption (such as regulated gasoline prices), artificially lowers prices, promoting 2018
overconsumption. This indicator tracks the global value of fossil fuel consumption subsidies. Figure 2019
4.6 illustrates the value of fossil fuel consumption subsidies for 2010-2016 using IEA data.178,192 2020
2021
2022
Figure 4.6 Global Fossil Fuel Consumption Subsidies - 2010-2015. 2023
2024
Despite rising from $444 billion in 2010 to a peak of $571 billion in 2012, fossil fuel consumption 2025
subsidies have decreased markedly to $327 billion in 2015 (in US$2016). The principal driver for this 2026
is the doubling in oil price between 2010 and 2012, after which it plateaued, before falling rapidly to 2027
below 2010 levels from mid-2014. Fossil fuel consumption subsidies are typically applied in order to 2028
moderate energy costs for low-income consumers (although in practice, 65% of such subsidies in 2029
LMICs benefit the wealthiest 40% of the population).193 As such, rising oil (and other fossil fuel) 2030
prices tend to increase subsidy levels, as the differences between market and regulated consumer 2031
prices increase, and governments take further action to mitigate the impact on citizens. When fossil 2032
0
100
200
300
400
500
600
2010 2011 2012 2013 2014 2015
US$2016
Oil NaturalGas Coal Electricity Total

74
fuel prices decrease, the gap between market and regulated prices reduces, and governments can 2033
reform fossil fuel subsidies whilst keeping overall prices relatively constant. 2034
Between 2014 and 2015, several countries took advantage of this opportunity, particularly regarding 2035
oil-based fuels, which accounted for over 60% of the reduction in total fossil fuel subsidies between 2036
2012 and 2015 (followed by natural gas at around 25%). This included India, which in deregulating 2037
diesel prices accounted for a $19 billion subsidy reduction between 2014 and 2015 (~13% of the 2038
global total reduction), and the major oil and natural gas producing nations (including Angola, 2039
Algeria, Indonesia, Iran, Qatar, Saudi Arabia and Venezuela), in which reduced hydrocarbon revenue 2040
created pressure for fiscal consolidation, and in turn for consumption subsidy reform.178 To 2041
encourage the low-carbon transition, fossil fuel subsidies should be phased out as soon as possible. 2042
The commitment made by the G7 in 2016 to achieve this goal by 2025 should be extended to all 2043
OECD counties, and globally by 2030.194 2044
2045
Indicator 4.7: Coverage and strength of carbon pricing 2046 Headline Finding: So far in 2017, various carbon pricing mechanisms covered13.1% of global 2047
anthropogenic CO2 emissions, up from 12.1% in 2016. This reflects a doubling in the number of 2048
national and sub-national jurisdictions with a carbon pricing mechanism over the last decade. 2049
This indicator tracks the extent to which carbon pricing instruments are applied around the world as 2050
a proportion of total GHG emissions, and the weighted average carbon price such instruments 2051
provide (Table 4.1). 2052
2053
2016 2017
Global Emissions Coverage* 12.1% 13.1%
Weighted Average Carbon Price of Instruments (current prices, US$)
$7.79 $8.81
Global Weighted Average Carbon Price (current prices, US$)
$0.94 $1.12
Table 4.1 Carbon Pricing - Global Coverage and Weighted Average Prices per tCO2e. *Global emissions 2054 coverage is based on 2012 total anthropogenic GHG emissions.195 (Source: World Bank, 2017) 2055
2056
Between 2016 and 2017, the proportion of global emissions covered by carbon pricing instruments, 2057
and the weighted average price of these instruments (and thus the global weighted average price for 2058
all anthropogenic GHG emissions), increased. This is due to the introduction of four new instruments 2059
in 2017 (note, this data runs up to 1 April 2017) - the carbon taxes in Alberta, Chile and Colombia, 2060
and an Emissions Trading System (ETS) in Ontario. As such, over 40 national and 25 sub-national 2061
jurisdictions now put a price on at least some of their GHG emissions (with substantially varying 2062
prices, from less than $1/tCO2e in Chongqing, to over $126/tCO2e in Sweden). The last decade has 2063
seen a rapid increase in the number of carbon pricing instruments around the world, with the 2064
number of jurisdictions introducing them doubling.196 Over 75% of the GHG emissions covered by 2065
carbon pricing instruments are in HICs, with the majority of the remainder covered by the 8 pilot 2066
pricing instruments in China (Figure 4.7). 2067

75
The World Bank provides the data for this indicator.195,196 Prices for 2016 and 2017 are those as of 1 2068
August 2016 and 1 April 2017, respectively. For 2017, the indicator includes only instruments that 2069
had been introduced by 1 April 2017. Instruments without price data are excluded. 2070
2071
2072
Figure 4.7 Carbon Pricing Instruments implemented, scheduled for implementation and under 2073 consideration.196 (Source: World Bank, 2017) 2074
2075
In total, a further 21 carbon pricing instruments are either scheduled for implementation, or are 2076
under consideration. This includes the commencement of a national ETS in China expected in the 2077
second half of 2017. Although this would replace the 8 pilot schemes currently in place in China, it 2078
could expand their emissions coverage fourfold, surpassing the European ETS to become the largest 2079
carbon pricing instrument in the world.196 2080
2081
Indicator 4.8: Use of carbon pricing revenues 2082 Headline Finding: 40% of government revenues generated from carbon pricing are spent on climate 2083
change mitigation, totalling US$9 billion. 2084

76
Carbon pricing instruments require those responsible for producing the emissions concerned to pay 2085
for their emissions, in one form or another. In most cases this generates revenue for the 2086
governments or authorities responsible for introducing the instrument. Such revenue may be put to 2087
a range of uses, including investment in climate change mitigation or adaptation or environmental 2088
tax reform (ETR), which involves shifting the burden of tax from negative activities, such as the 2089
generation of pollution, to positive activities, such as labour or environmentally beneficial products 2090
or activities. Such options may produce a ‘double dividend’ of environmental improvement with 2091
social and economic benefits.197 This indicator tracks the total government revenue from carbon 2092
pricing instruments, and how such income is allocated. 2093
Mitigation Adaptation Environmental
Tax Reform (ETR)
General Funds
Total Revenue
(US$2016)
Proportion (%)
40.4% 4% 19.5% 36.1% $22.31 Billion Value
(US$2016) $9.01 Billion $0.9 Billion $4.34 Billion $8.06 Billion
2094
Table 4.2. Carbon Pricing revenues and allocation in 2016.195 (Source: World Bank, 2017) 2095
2096
Tale 4.2 presents total government revenue generated by carbon pricing instruments in 2016, and 2097
four categories of expenditure for this revenue. The largest expenditure category is climate change 2098
mitigation, which is in receipt of over $9 billion annually in funds. Despite this, less than half of 2099
revenue-generating instruments allocate revenue for mitigation. 2100
ETR policies accounted for around 20% of revenue allocation in 2016. Just two instruments (the 2101
Portuguese and British Colombia Carbon Taxes) allocate all their revenue to allowing revenue-neutral 2102
reduction in other (for example, income) taxes, with another four allocating part of their revenue to 2103
this purpose. By contrast, only four instruments do not have any revenue allocated to general 2104
government funds (The British Colombian, Swiss, Japanese and Portuguese carbon taxes), with 11 2105
instruments allocating all revenues to this category (reaching €8 billion – or more than a third – of 2106
revenues generated in 2016). Data for individual carbon pricing instruments may be found in Appendix 2107
5. 2108
Data on revenue generated is provided by the World Bank, with revenue allocation information 2109
obtained from various sources (see Appendix 5).195 Only instruments with revenue estimates, and only 2110
revenue received by the administering authority before redistribution, are considered. Revenue must 2111
be explicitly allocated to climate change mitigation or adaptation, or for ETR, to be considered in these 2112
categories. If such explicit earmarking is not present, or no data is available, then revenue is assumed 2113
to be allocated to general funds. 2114
2115
Indicator 4.9: Spending on adaptation for health and health-related activities 2116 Headline finding: Out of the world's total adaptation spend just 4.63% ($16.46 billion USD) is on 2117
health and 13.3% ($47.29 billion USD) on health-related adaptation. 2118
This indicator reports estimates of spending on health and health-related climate change adaptation 2119
and resilience. Many adaptation activities within and beyond the formal health sector yield health 2120

77
co-benefits, which are important to understand and capture. Here, estimates of the total health and 2121
health-related adaptation spending were derived from the Adaptation & Resilience to Climate 2122
Change (A&RCC) dataset produced by kMatrix. This global dataset, covering financial transactions 2123
relevant to climate change adaptation, was compiled from a relevant subset of over 27,000 2124
independent databases and sources (such as public disclosures and reports from insurance 2125
companies, the financial sector, and governments).198 In this case, entries were triangulated 2126
between at least seven independent sources before being included. 2127
Examples of transactions captured here range from the procurement of goods or services (for 2128
example, purchasing sandbags for flood levees) through to spending on research and development 2129
(for example, for vulnerability and adaptation assessments) or staff training.198 Each of these 2130
‘adaptation activities’ are grouped in to eleven sectors: Agriculture and Forestry, Built Environment, 2131
Disaster-Preparedness, Energy, Health, ICT, Natural Environment, Professional Services, Transport, 2132
Waste, and Water. Whilst adaptation spending relevant directly to the formal health sector is clearly 2133
important (the ‘health’ category), interventions outside of the healthcare system will also yield 2134
important benefits for health and wellbeing. ‘Health-related adaptation spending’ was defined as 2135
that which additionally included adaptation spending from the agricultural sector (due to the 2136
centrality of food and nutrition to health) and disaster preparedness sector (due to the direct public 2137
health benefits that often result from these efforts). 2138
This data from the A&RCC dataset is reported here, showing health and health-related adaptation 2139
spending for 180 countries for the 2015-2016 financial year. Global health adaptation spending for 2140
the financial year 2015-2016, calculated in this way, totalled 16.46 billion USD, representing 4.63% of 2141
the global aggregate adaptation spend. Health-related adaptation spending totalled 47.29 billion 2142
USD, or 13.3% of the global total adaptation spend (Figure 4.8). 2143
Health-related adaptation and resilience spending, both national totals and per capita levels, is 2144
extremely low in low-income countries, and increase across the continuum towards high-income 2145
countries. Interestingly, health and health-related adaptation spending as a proportion of total 2146
adaptation spending is relatively constant across income groups. 2147
2148
2149
Figure 4.8 For the financial year 2015-2016. 4.8a) Total health and health-related adaptation spending and 2150 4.8b) health and health-related adaptation and resilience to climate change (A&RCC) spending as a proportion 2151 of GDP. All plots are disaggregated by World Bank Income Grouping. 2152

78
2153 2154 It is important to note that further work is required to more completely determine what should be 2155
considered as ‘health-related adaptation spending’. Spending for agriculture and disaster 2156
preparedness were included here, however other forms of adaptation spending clearly have 2157
important health implications. Second, only economic data relating to the financial year 2015-2016 2158
was available, precluding time trend analysis. Third, since public sector transactions may not leave a 2159
sufficient ‘footprint’ to be picked up by this methodology, adaptation spending data here may 2160
exclude some public-sector spending. 2161
2162
Indicator 4.10: Health adaptation funding from global climate financing mechanisms 2163 Headline Finding: Between 2003 and 2017, 0.96% of total adaptation funding for development, 2164
flowing through global climate change financing mechanisms, was dedicated to health adaptation. 2165
The final indicator in this section is designed in parallel with indicator 4.9, and aims to capture 2166
development funds available for climate change adaptation. It reports global financial flows 2167
dedicated to health adaptation to climate change, moving through established global climate 2168
financing mechanisms. Data was drawn from the Climate Funds Update (CFU), an independent 2169
source which aggregates funding data from multilateral and bilateral development agencies since 2170
2003.16,199 CFU data is presented in four categories (pledged, deposited, approved, and disbursed); 2171
this indicator uses data designated as ‘approved’. 2172
Between 2003 and 2017, only 0.96% of approved adaptation funding was allocated to health 2173
adaptation, corresponding with a cumulative total of 39.55 million USD (Figure 4.9). Total global 2174
adaptation funding peaked in 2013 at 910.36 million USD and declined thereafter. However, health-2175
related adaptation funding reached its highest level in early 2017, resulting in the near-doubling in 2176
the proportion of adaptation funding allocated to health. Panel 4.1 provides a brief overview of 2177
growing interest in health and climate change from the international donor community. 2178
2179

79
2180 Figure 4.9 Year on year multilateral and bilateral funding for all adaptation projects and health adaptation 2181 projects (2003 through May 2017). 2182
2183
Panel 4.1 International Donor Action on Climate Change and Health. 2184
In 2017, the World Bank released three independent reports on climate change and health, 2185
articulating (i) a new action plan for climate change and health, (ii) geographic focus areas, and (iii) 2186
new strategy for climate-smart healthcare. In addition to training staff and increasing government 2187
capacity, the World Bank outlines an approach to ensuring that at least 20% of new World Bank 2188
health investments are climate-smart by 2020, corresponding to as much as $1bn in new climate-2189
smart health finance for countries. Other development institutions and foundations are also getting 2190
involved. Two separate, major gatherings of public and private funders occurred in 2016 (May, 2191
Helsinki) and 2017 (May, Chicago) toward establishing new channels for health and climate finance, 2192
and a third is planned for late 2017 (October, Washington, DC). 2193
Conclusion 2194
The indicators presented in this section seek to highlight the status of the economics and finance 2195
associated with climate change and health across four themes; investing in a low-carbon economy, 2196
economic benefits of tackling climate change, pricing the GHG emissions from fossil fuels, and 2197
adaptation financing. 2198
Many of the trends show positive change over time, notably global investment in zero-carbon energy 2199
supply, energy efficiency, new coal-fired electricity capacity, employment in renewable energy, and 2200

80
divestment in fossil fuels. However, the rate of change is relatively slow, and must accelerate rapidly 2201
to meet the objectives of the Paris Agreement. 2202
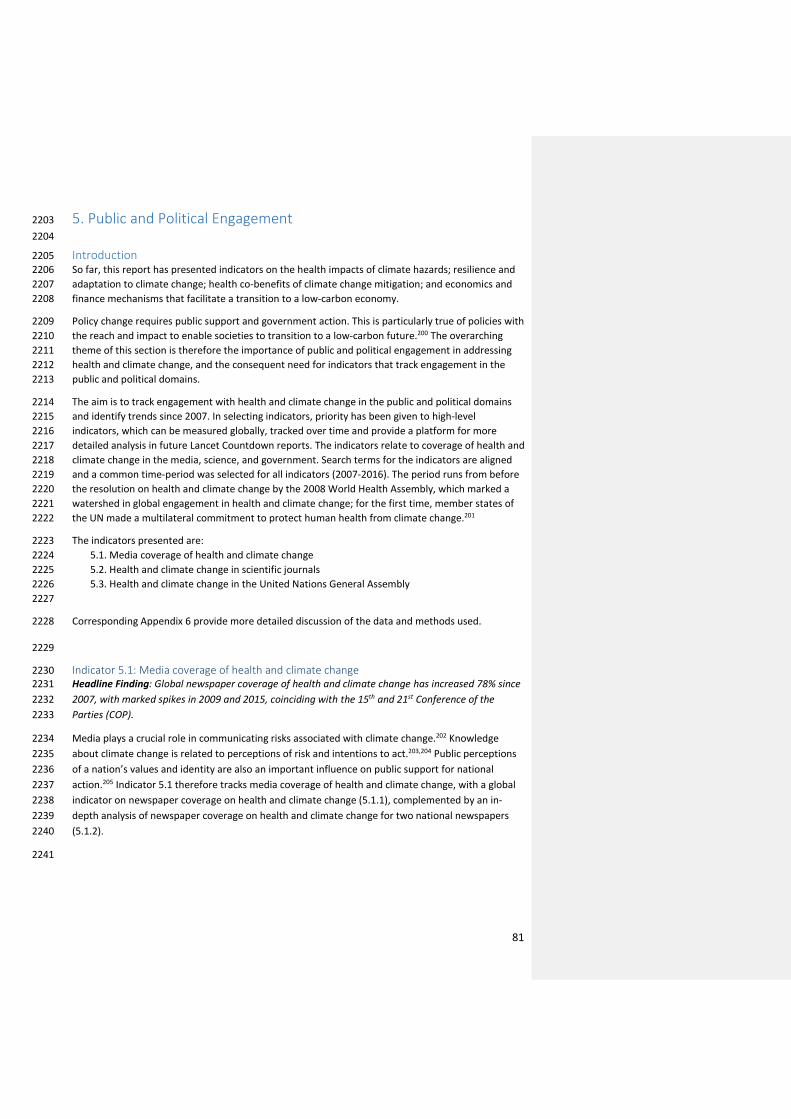
81
5. Public and Political Engagement 2203
2204
Introduction 2205
So far, this report has presented indicators on the health impacts of climate hazards; resilience and 2206
adaptation to climate change; health co-benefits of climate change mitigation; and economics and 2207
finance mechanisms that facilitate a transition to a low-carbon economy. 2208
Policy change requires public support and government action. This is particularly true of policies with 2209
the reach and impact to enable societies to transition to a low-carbon future.200 The overarching 2210
theme of this section is therefore the importance of public and political engagement in addressing 2211
health and climate change, and the consequent need for indicators that track engagement in the 2212
public and political domains. 2213
The aim is to track engagement with health and climate change in the public and political domains 2214
and identify trends since 2007. In selecting indicators, priority has been given to high-level 2215
indicators, which can be measured globally, tracked over time and provide a platform for more 2216
detailed analysis in future Lancet Countdown reports. The indicators relate to coverage of health and 2217
climate change in the media, science, and government. Search terms for the indicators are aligned 2218
and a common time-period was selected for all indicators (2007-2016). The period runs from before 2219
the resolution on health and climate change by the 2008 World Health Assembly, which marked a 2220
watershed in global engagement in health and climate change; for the first time, member states of 2221
the UN made a multilateral commitment to protect human health from climate change.201 2222
The indicators presented are: 2223
5.1. Media coverage of health and climate change 2224
5.2. Health and climate change in scientific journals 2225
5.3. Health and climate change in the United Nations General Assembly 2226
2227
Corresponding Appendix 6 provide more detailed discussion of the data and methods used. 2228
2229
Indicator 5.1: Media coverage of health and climate change 2230 Headline Finding: Global newspaper coverage of health and climate change has increased 78% since 2231
2007, with marked spikes in 2009 and 2015, coinciding with the 15th and 21st Conference of the 2232
Parties (COP). 2233
Media plays a crucial role in communicating risks associated with climate change.202 Knowledge 2234
about climate change is related to perceptions of risk and intentions to act.203,204 Public perceptions 2235
of a nation’s values and identity are also an important influence on public support for national 2236
action.205 Indicator 5.1 therefore tracks media coverage of health and climate change, with a global 2237
indicator on newspaper coverage on health and climate change (5.1.1), complemented by an in-2238
depth analysis of newspaper coverage on health and climate change for two national newspapers 2239
(5.1.2). 2240
2241
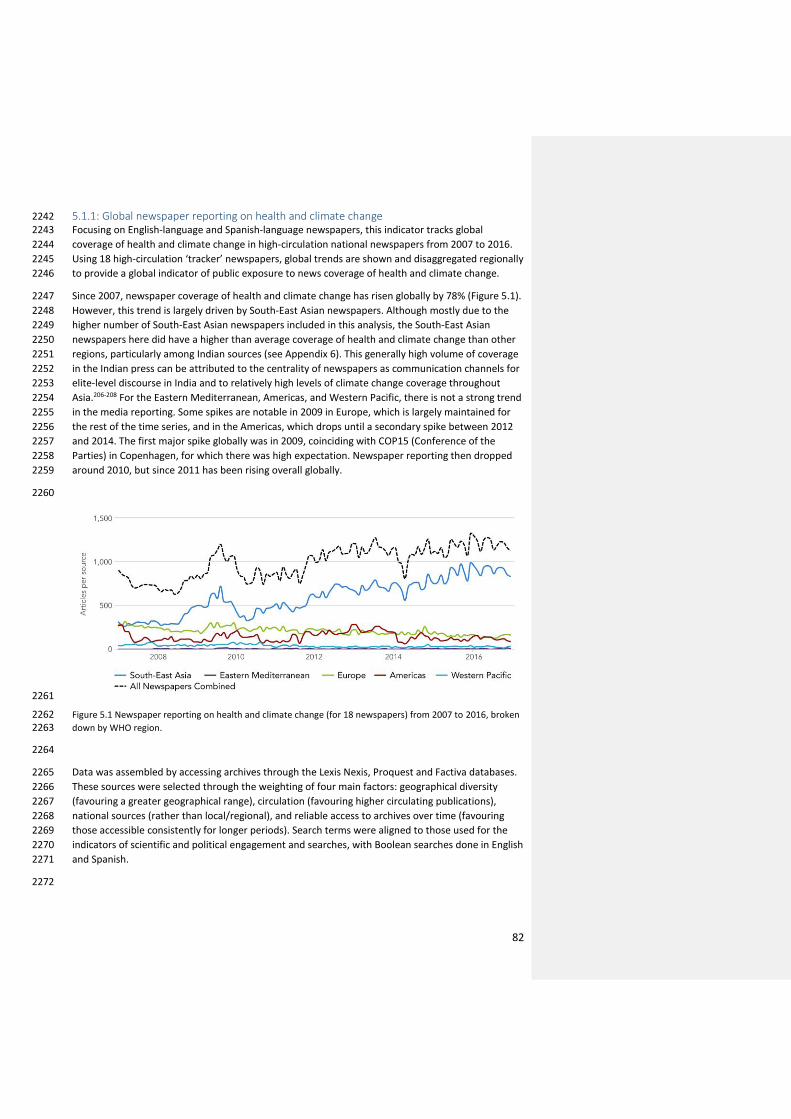
82
5.1.1: Global newspaper reporting on health and climate change 2242 Focusing on English-language and Spanish-language newspapers, this indicator tracks global 2243
coverage of health and climate change in high-circulation national newspapers from 2007 to 2016. 2244
Using 18 high-circulation ‘tracker’ newspapers, global trends are shown and disaggregated regionally 2245
to provide a global indicator of public exposure to news coverage of health and climate change. 2246
Since 2007, newspaper coverage of health and climate change has risen globally by 78% (Figure 5.1). 2247
However, this trend is largely driven by South-East Asian newspapers. Although mostly due to the 2248
higher number of South-East Asian newspapers included in this analysis, the South-East Asian 2249
newspapers here did have a higher than average coverage of health and climate change than other 2250
regions, particularly among Indian sources (see Appendix 6). This generally high volume of coverage 2251
in the Indian press can be attributed to the centrality of newspapers as communication channels for 2252
elite-level discourse in India and to relatively high levels of climate change coverage throughout 2253
Asia.206-208 For the Eastern Mediterranean, Americas, and Western Pacific, there is not a strong trend 2254
in the media reporting. Some spikes are notable in 2009 in Europe, which is largely maintained for 2255
the rest of the time series, and in the Americas, which drops until a secondary spike between 2012 2256
and 2014. The first major spike globally was in 2009, coinciding with COP15 (Conference of the 2257
Parties) in Copenhagen, for which there was high expectation. Newspaper reporting then dropped 2258
around 2010, but since 2011 has been rising overall globally. 2259
2260
2261
Figure 5.1 Newspaper reporting on health and climate change (for 18 newspapers) from 2007 to 2016, broken 2262 down by WHO region. 2263
2264
Data was assembled by accessing archives through the Lexis Nexis, Proquest and Factiva databases. 2265
These sources were selected through the weighting of four main factors: geographical diversity 2266
(favouring a greater geographical range), circulation (favouring higher circulating publications), 2267
national sources (rather than local/regional), and reliable access to archives over time (favouring 2268
those accessible consistently for longer periods). Search terms were aligned to those used for the 2269
indicators of scientific and political engagement and searches, with Boolean searches done in English 2270
and Spanish. 2271
2272
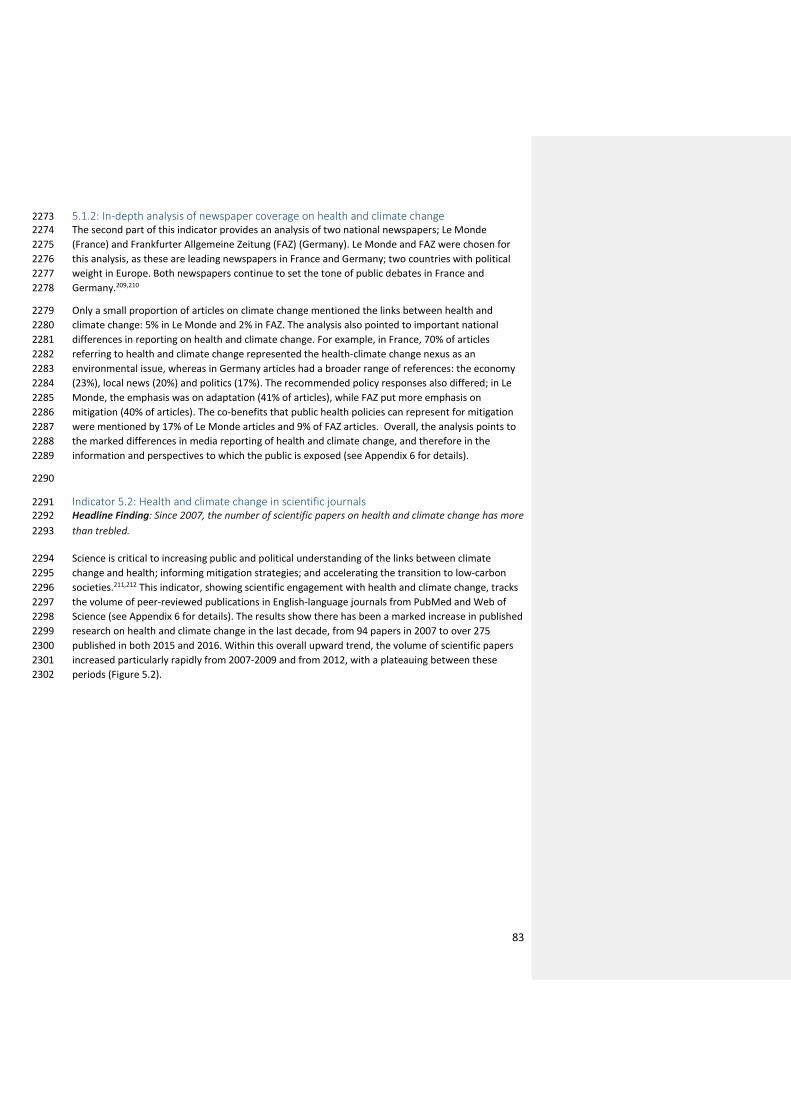
83
5.1.2: In-depth analysis of newspaper coverage on health and climate change 2273 The second part of this indicator provides an analysis of two national newspapers; Le Monde 2274
(France) and Frankfurter Allgemeine Zeitung (FAZ) (Germany). Le Monde and FAZ were chosen for 2275
this analysis, as these are leading newspapers in France and Germany; two countries with political 2276
weight in Europe. Both newspapers continue to set the tone of public debates in France and 2277
Germany.209,210 2278
Only a small proportion of articles on climate change mentioned the links between health and 2279
climate change: 5% in Le Monde and 2% in FAZ. The analysis also pointed to important national 2280
differences in reporting on health and climate change. For example, in France, 70% of articles 2281
referring to health and climate change represented the health-climate change nexus as an 2282
environmental issue, whereas in Germany articles had a broader range of references: the economy 2283
(23%), local news (20%) and politics (17%). The recommended policy responses also differed; in Le 2284
Monde, the emphasis was on adaptation (41% of articles), while FAZ put more emphasis on 2285
mitigation (40% of articles). The co-benefits that public health policies can represent for mitigation 2286
were mentioned by 17% of Le Monde articles and 9% of FAZ articles. Overall, the analysis points to 2287
the marked differences in media reporting of health and climate change, and therefore in the 2288
information and perspectives to which the public is exposed (see Appendix 6 for details). 2289
2290
Indicator 5.2: Health and climate change in scientific journals 2291 Headline Finding: Since 2007, the number of scientific papers on health and climate change has more 2292
than trebled. 2293
Science is critical to increasing public and political understanding of the links between climate 2294
change and health; informing mitigation strategies; and accelerating the transition to low-carbon 2295
societies.211,212 This indicator, showing scientific engagement with health and climate change, tracks 2296
the volume of peer-reviewed publications in English-language journals from PubMed and Web of 2297
Science (see Appendix 6 for details). The results show there has been a marked increase in published 2298
research on health and climate change in the last decade, from 94 papers in 2007 to over 275 2299
published in both 2015 and 2016. Within this overall upward trend, the volume of scientific papers 2300
increased particularly rapidly from 2007-2009 and from 2012, with a plateauing between these 2301
periods (Figure 5.2). 2302

84
2303
Figure 5.2 Number of scientific publications on climate change and health per year (2007-2016) from PubMed 2304 and Web of Science journals. 2305
2306
The two periods of growth in scientific outputs coincided with the run-up to the UNFCCC COPs held 2307
in Copenhagen in 2009 (COP15) and in Paris in 2015 (COP21). This pattern suggests that scientific 2308
and political engagement in health and climate change are closely linked, with the scientific 2309
community responding quickly to the global climate change agenda and the need for evidence. 2310
Most publications focus on the impacts of climate change and health in Europe and North America. 2311
Overall, more than 2000 scientific articles were identified, of which 30% of papers focussed on 2312
Europe, followed by 29% on the Americas. Within the Americas, the large majority (72%) of the 2313
papers related to health and climate change in North America (see Figure S5.1 in Appendix 6). By 2314
contrast, only 10% of published articles had a focus on Africa or the Eastern Mediterranean Region, 2315
demonstrating a marked global inequality in the science of health and climate change (see Figures 2316
S5.1 and S5.2 in Appendix 6). 2317
Among the journals in the analysis, infectious diseases, particularly dengue fever and other 2318
mosquito-transmitted infections, are the most frequently investigated health outcomes; 2319
approximately 30% of selected papers covered these health-related issues. Important gaps in the 2320
scientific evidence base were identified, including migration and mental ill-health. 2321
For this indicator, a scoping review of peer-reviewed articles on health and climate change, 2322
published in English between 2007 and 2016, was conducted; an appropriate approach for broad 2323
and inter-disciplinary research fields.213 Two databases were used, PubMed and Web of Science, to 2324
identify papers through a bibliometric analysis using keyword searches (see Appendix 6 for 2325
details).214 Inclusion and exclusion criteria were applied to capture the most relevant literature on 2326
the human health impacts of climate change within the chosen timeframe and papers were 2327
independently reviewed and screened three times to identify relevant publications.215 2328
2329
0
50
100
150
200
250
300
350
2007 2008 2009 2010 2011 2012 2013 2014 2015 2016
Nu
mb
er
of art
icle
s
Year
85
Indicator 5.3: Health and climate change in the United Nations General Assembly 2330 Headline Finding: There is no overall trend in United Nations General Debate (UNGD) references to 2331
health and climate change, but two significant peaks occurred in 2009 and 2014. 2332
The General Debate (GD) takes place every September at the start of each new session of the United 2333
Nations General Assembly (UNGA). Governments use their annual statements to present their 2334
perspective on events and issues they consider the most important in global politics, and to call for 2335
greater action from the international community. All UN Member States can address the UNGA, free 2336
from external constraints. Therefore, GD statements provide an ideal data source on political 2337
engagement with health and climate change, which is comparable spatially and temporally. This 2338
indicator focuses on the extent to which governments refer to linkages between health and climate 2339
change issues in their annual statements in the GD, with one reference representing one ‘hit’. 2340
Health and climate change are issues frequently raised in UNGD statements (see Figures S5.3-S5.5 in 2341
Appendix 6). However, statements less frequently link health and climate change together. Between 2342
2007 and 2016, linked references to health and climate change in the annual UNGD ranged from 44 2343
to 124 (Figure 5.3). The comparable figures for references to climate change alone were 378 and 2344
989. It was found that there is no overall trend in conjoint references to health and climate change 2345
across the period. 2346
2347
Figure 5.3 Political engagement with the intersection of health and climate change, represented by joint 2348
references to health and climate change in the UNGD. 2349
2350
While no overall trend is apparent, there are two distinct peaks between 2009 and 2011 and in 2351
2014. In both 2009 and 2014, there were 124 references linking health and climate change in the GD 2352
statements. The 2009 peak occurred after the 2008 World Health Day, which focussed on health and 2353
climate change, and in the build-up to COP15 in Copenhagen in 2009. The 2014 peak is indicative of 2354
the influence of the large UNGA on climate change in 2014 and the lead up to COP21 in Paris in 2355
2015. 2356

86
The 2015 UNGA, which focused on the Sustainable Development Goals, made relatively limited 2357
reference to climate change, and, after the 2014 peak, conjoint references to health and climate 2358
change declined. This irregular pattern points to the importance of key events in the global 2359
governance of health and climate change in driving high-level political engagement. 2360
There are country-level differences in the attention given to health and climate change in UNGD 2361
statements (Figure 5.4). More frequent reference is made to the issue by countries in the Western 2362
Pacific, particularly by the SIDS in these regions. In contrast, governments in the East Mediterranean, 2363
the Americas and South-East Asia tend to make fewer references to health and climate change. 2364
2365
Figure 5.4 Regional political engagement with the intersection of health and climate change, represented by 2366
joint references to health and climate change in the UNGD, broken down by WHO region. 2367
2368
This indicator is based on the application of keyword searches in the text corpus of debates. A new 2369
dataset of GD statements was used (UNGD corpus), in which the annual UNGD statements have 2370
been pre-processed and prepared for use in quantitative text analysis (see Appendix 6 for details).216 2371
2372
Conclusion 2373
The indicators in this section have demonstrated the importance of global governance in mobilising 2374
public and political engagement in health and climate change. The UN (and particularly the annual 2375
COPs) have a significant role here, clearly influencing media, scientific and political engagement with 2376
health and climate change. 2377
To further improve understanding of public and political engagement, indicators relating to national 2378
governments’ health and climate change legislation, private sector engagement, the inclusion of 2379
climate change in professional health education, and the prominence given to health in UNFCCC 2380
negotiations are proposed for future analysis. The previous sections in this report have presented 2381
findings on the impacts of climate hazards, adaptation and resilience, co-benefits of mitigation, and 2382

87
finance and economics. All of these hinge upon policy, which in turn is dependent upon public and 2383
political engagement. 2384

88
Conclusion - the Lancet Countdown in 2017 2385
In June 2015, the Lancet Commission laid the groundwork for its global monitoring platform, 2386
designed to systematically track progress on health and climate change, and hold governments to 2387
account for their commitments under the then to-be-finalised Paris Agreement.4 The Lancet 2388
Countdown will continue this work, reporting annually on the indicators presented in this report and 2389
on new indicators in future. 2390
2391
The direction of travel is set 2392
The data and analysis presented in this 2017 report cover a wide range of topics and themes from 2393
the lethality of weather-related disasters, to the phase-out of coal-fired power. The report begins 2394
with an indicator set dedicated to tracking the health effects of climate change and climate hazards. 2395
The analysis here demonstrates that the symptoms of climate change have been clear for a number 2396
of years, with the health impacts far worse than previously understood. These effects have been 2397
spread unequally, with a 9.4% increase in vectorial capacity of the dengue fever carrying Aedes 2398
aegypti predominantly spreading to low- and middle-income countries since 1950; and India 2399
disproportionately affected by the additional 75 million exposure events to potentially fatal 2400
heatwaves since 2000. 2401
These indicators also suggest that populations are beginning to adapt, with improvements in the 2402
world’s overall health profile strengthening its resilient capacity, and national governments 2403
beginning to invest in health adaptation planning for climate change. This is supported by some 2404
$47.29 billion USD spent annually on health-related adaptation (some 13.3% of global total 2405
adaptation spend). However, the academic literature and past experience make it clear that there 2406
are very real and immediate technological, financial, and political barriers to adaptation.10 2407
The indicators in the third section track health-relevant mitigation trends across four sectors, with an 2408
ultimate focus of keeping temperature rise “well below 2°C” and meeting the Paris Agreement. At an 2409
aggregate level, the past two decades have seen limited progress here, with many of the trends and 2410
indicators remaining flat or moving strongly in the opposite direction. More recently, trends in the 2411
electricity generation (deployment of renewable energy and a dramatic slow-down in coal-fired 2412
power) and transport sectors (soon-to-be cost parity of electric vehicles with their petrol-based 2413
equivalents) provide cause for optimism, which, if sustained, could reflect the beginning of system-2414
wide transformation. 2415
Indicators in the fourth and fifth sections underpin and drive forward this transition. Again, trends 2416
across the last two decades reflect concerning levels of inaction, with accelerated investment and 2417
intervention seen in more recent years. They reflect record levels of employment in the renewable 2418
energy sector to overtake those in fossil fuel extraction, and a global reduction in fossil fuel 2419
consumption subsidies. Carbon pricing mechanisms are slowly widening and now cover some 13.1% 2420
of global CO2 emissions. The final section considers the degree to which the public, political and 2421
academic communities have engaged with the links between climate change and health. It points to 2422
uneven patterns of engagement and the vital role of global institutions, and the UN particularly, in 2423
driving forward public, political and scientific support for enhanced mitigation and adaptation 2424
policies. 2425
Overall, the trends elucidated in the Lancet Countdown’s 2017 report provide cause for deep 2426
concern, highlighting the immediate health threats from climate change and the relative inaction 2427
seen across the world over the past two decades. However, they also point to more recent trends 2428
89
over the last five years demonstrating a rapid increase in action, which was solidified in the Paris 2429
Agreement. These ‘glimmers of progress’ are encouraging, and reflect a growing political consensus 2430
and ambition, which was seen in full-force in response to the US’s departure from the 2015 climate 2431
change treaty. Whilst action needs to increase rapidly, taken together, this provides the clearest 2432
signal to-date that the world is beginning to transition to a low-carbon world, that no one country or 2433
head of state can halt this progress, and that from today until 2030, the direction of travel is set. 2434
2435
2436
Contributors 2437
The Lancet Countdown: Tracking Progress on Health and Climate Change is an international 2438
academic collaboration which builds off the work of the 2015 Lancet Commission on Health and 2439
Climate Change, convened by The Lancet. The Lancet Countdown’s work for this paper was 2440
conducted by its five working groups, each of which were responsible for the design, drafting, and 2441
review of their individual indicators and sections. All authors contributed to the overall paper 2442
structure and concepts, and provided input and expertise to the relevant sections. Authors 2443
contributing to Working Group 1: Jonathan Chambers; Peter M Cox; Mostafa Ghanei; Ilan Kelman; Lu 2444
Liang; Ali Mohammad Latifi; Maziar Moradi-Lakeh; Kris Murray; Fereidoon Owfi; Mahnaz Rabbaniha; 2445
Elizabeth Robinson; Meisam Tabatabaei. Authors contributing to Working Group 2: Sonja Ayeb-2446
Karlsson; Peter Byass; Diarmid Campbell-Lendrum; Michael Depledge; , Paula Dominguez-Salas; 2447
Howard Frumkin; Lucien Georgeson; Delia Grace; Anne Johnson; Dominic Kniveton; Georgina Mace; 2448
Maquins Odhiambo Sewe; Mark Maslin; Maria Nilsson; Tara Neville; Karyn Morrissey; Joacim 2449
Rocklöv; Joy Shumake-Guillemot. Authors contributing to Working Group 3: Markus Amann; Kristine 2450
Belesova; Wenjia Cai; Michael Davies; Andy Haines; Ian Hamilton; Stella Hartinger; Gregor 2451
Kiesewetter; Melissa Lott, Robert Lowe; James Milner; Tadj Oreszczyn; David Pencheon, Steve Pye; 2452
Rebecca Steinbach; Paul Wilkinson. Authors contributing to Working Group 4: Timothy Bouley; Paul 2453
Drummond; Paul Ekins. Authors Contributing to Working Group 5: Maxwell Boykoff; Meaghan Daly; 2454
Niheer Dasandi; Anneliese Depoux; Antoine Flahault; Hilary Graham; Rébecca Grojsman; Slava 2455
Mikhaylov; Stefanie Schütte. The coordination, strategic direction, and editorial support for this 2456
paper was provided by Anthony Costello (Co-Chair), Hugh Montgomery (Co-Chair), Peng Gong (Co-2457
Chair), Nick Watts (Executive Director), and Nicola Wheeler (Programme Officer). The findings and 2458
conclusions in this article are those of the authors and do not necessarily represent the official 2459
position of World Health Organization, the World Bank, or the World Meteorological Organization. 2460
2461
Declarations of Interest 2462
The Lancet Countdown’s work is supported by an unrestricted grant from the Wellcome Trust (ref: 2463
200890/Z/16/Z)). The Lancet Countdown covered travel costs for meetings related to the 2464
development of the paper. Seven of the authors (NWa, NWh, ML, PD, MB, MD and JC) were 2465
compensated for their time while working on the Lancet Countdown’s drafting and development. 2466
HM is a board member of the UK Climate and Health Council, an Advisory Board member of the 2467
Energy and Climate Intelligence Unit, and is developing an air pollution mask (which represents no 2468
conflict of interest). NWa reports being the Director of the UK Health Alliance on Climate Change. AJ 2469
is a Governor of the Wellcome Trust, and a member of the Adaptation Sub-Committee of the 2470
Committee on Climate Change. MA, SAK, KB, TB, PB, WC, DCL, AC, PC, ND, MDa, MDe, AD, PDS, PE, 2471
AF, HF, LG, MG, PG, DG, HG, RG, AH, IH, SH, IK, GK, DK, LL, RL, GM, MM, SM, JM, AML, MML, KMo, 2472

90
KMu, TN, MN, TO, FO, DP, SP, MR, ER, JR, SS, MS, JSG, RS, MT, and PW declare no conflicts of 2473
interest. 2474
2475
Acknowledgements 2476
The Lancet Countdown would like to thank the Wellcome Trust, in particular Saskia Heijnen, Sarah 2477
Molten and Sophie Tunstall-Behrens, for its financial and strategic support—without which, this 2478
research collaboration would not be possible. While carrying out its work, the Lancet Countdown 2479
received invaluable technical advice and input from a number of individuals, including Neil Adger 2480
(University of Exeter), Kevin Andrews (University of Colorado Boulder), Nigel Arnell (University of 2481
Reading), Rob Bailey (Chatham House), John Balbus (National Institute of Environmental Health 2482
Sciences), Simon Bennet (International Energy Agency), Helen Berry (Australiana National 2483
University), Kathryn Brown (Climate Change Committee), Yossi Cadan (350.org), Tony Capon 2484
(University of Sydney), Carbon Disclosure Project (CDP), Michelle Chan (Universidad Peruana 2485
Cayetano Heredia), Lucia Fernandez (World Health Organization), Lauren Gifford (University of 2486
Colorado Boulder), Francesca Harris (London School of Hygiene & Tropical Medicine), Mathieu 2487
Hemono (Centre Virchow-Villermé), Niamh Herlihy (Centre Virchow-Villermé), Richard King 2488
(Chatham House), Tord Kjellstrom (Australian National University), Noemie Klein (Ecofys), Long Lam 2489
(Ecofys), Seline Lo (The Lancet), Rachel Lowe (London School of Hygiene & Tropical Medicine), Gesa 2490
Luedecke (University of Colorado Boulder), Lucy McAllister (University of Colorado Boulder), Marisa 2491
McNatt (University of Colorado Boulder), Jonathan Patz (University of Wisconsin-Madison), Sonia 2492
Roschnik (Sustainable Health Solutions), Osman Sankoh (INDEPTH), Ami Nacu-Schmidt (University of 2493
Colorado Boulder), Pauline Scheelbeek (London School of Hygiene & Tropical Medicine), Jan 2494
Semenza (European Centre for Disease Prevention and Control), Imogen Tennison (National Health 2495
Service), Hanna Tuomisto (London School of Hygiene and Tropical Medicine), Armando Valdes 2496
Valasquez (Universidad Peruana Cayetano Heredia) and Shelagh Whitley (Overseas Development 2497
Institute). Administrative and communications support was provided by Richard Black (Energy and 2498
Climate Intelligence Unit), Pete Chalkley (Energy and Climate Intelligence Unit), Tan Copsey (Climate 2499
Nexus), Tom Fern, Jack Fisher (University College London), Sarah Hurtes (European Climate 2500
Foundation), Paige Knappenberger (Climate Nexus) and George Smeeton (Energy and Climate 2501
Intelligence Unit). Mr Georgeson wishes to express gratitude for funding from the Economic and 2502
Social Research Council and the Natural Environment Research Council (grant number 2503
ES/J500185/1). 2504
The Lancet Countdown is funded through an unrestricted grant from the Wellcome Trust 2505
(200890/Z/16/Z). 2506
2507
2508
2509
2510
References 2511
2512

91
1. Kang Y, Khan S, Ma X. Climate change impacts on crop yield, crop water productivity 2513
and food security – A review. Progress in Natural Science 2009; 19(12): 1665–74. 2514
2. Lindgren E, Andersson, Y, Suk, J.E, Sudre, B. and Semenza, J.C. Monitoring EU 2515
Emerging Infectious Disease Risk Due to Climate Change. Science 2012; 336(6080): 418-9. 2516
3. Reuveny R. Climate change-induced migration and violent conflict. Political 2517
Geography 2007; 26(6): 656–73. 2518
4. Watts N, et al. Health and climate change: policy responses to protect public health. 2519
The Lancet 2015; 386(10006): 1861–914. 2520
5. Watts N, et al. The Lancet Countdown: tracking progress on health and climate 2521
change. The Lancet 2016; 389(10074): 1151–64. 2522
6. World Health Organization. Second Global Conference: Health and Climate (Paris 7-8 2523
July 2016), 2016. 2524
7. United Nations Framework Convention on Change. Paris Agreement. In: United 2525
Nations, editor. Paris, France; 2015. 2526
8. United Nations Environment Program. The Emissions Gap Report 2016. In: United 2527
Nations, editor. Nairobi, Kenya; 2016. 2528
9. Intergovernmental Panel on Climate Change. Climate Change 2014: Impacts, 2529
Adaptation, and Vulnerability. Part A: Global and Sectoral Aspects. Contribution of Working 2530
Group II to the Fifth Assessment Report of the Intergovernmental Panel on Climate Change. 2531
Cambridge, United Kingdom and New York, NY, USA, 2014. 2532
10. Smith KR, Woodward A, Campbell-Lendrum D, et al. Human health: Impacts, 2533
adaptation, and co-benefits. In: Field CB, Barros VR, Dokken DJ, et al., eds. Climate Change 2534
2014: Impacts, Adaptation, and Vulnerability Part A: Global and Sectoral Aspects 2535
Contribution of Working Group II to the Fifth Assessment Report of the Intergovernmental 2536
Panel of Climate Change. Cambridge and New York: Cambridge University Press; 2014: 709-2537
54. 2538
11. Berry HL, Bowen K, Kjellstrom T. Climate change and mental health: a causal 2539
pathways framework. International Journal of Public Health 2010; 55(2): 123-32. 2540
12. Reinmuth-Selzle K, et al. Air Pollution and Climate Change Effects on Allergies in the 2541
Anthropocene: Abundance, Interaction, and Modification of Allergens and Adjuvants. 2542
Environmental Science and Technology 2017; 51(8): 4119-41. 2543
13. Glaser J, et al. Climate Change and the Emergent Epidemic of CKD from Heat Stress 2544
in Rural Communities: The Case for Heat Stress Nephropathy. Clinical Journal of the 2545
American Society of Nephrology 2016; 11(8): 1472–83. 2546
14. McMichael AJ. Globalization, Climate Change, and Human Health. The New England 2547
Journal of Medicine 2013; 368: 1335-43. 2548

92
15. European Centre for Medium-Range Weather Forecasts (ECMWF). 2017. 2549
https://www.ecmwf.int/. 2550
16. European Centre for Medium-Range Weather Forecasts (ECMWF). Climate 2551
Reanalysis. 2017. https://www.ecmwf.int/en/research/climate-reanalysis. 2552
17. NASA. Gridded Population of the World (GPW), v4. 2017. 2553
18. Jacob D, Petersen J, Eggert B, et al. EURO-CORDEX: new high-resolution climate 2554
change projections for European impact research. Regional Environmental Change 2014; 2555
14(2): 563-78. 2556
19. HEAT-SHIELD. 2017. https://www.heat-shield.eu/. 2557
20. Kjellstrom T, Briggs D, Freyberg C, Lemke B, Otto M, Hyatt O. Heat, Human 2558
Performance, and Occupational Health: A Key Issue for the Assessment of Global Climate 2559
Change Impacts. Annual Review of Public Health 2016; 37: 97–112. 2560
21. Ijaz K, Kasowski E, Arthur RR, Angulo FJ, Dowell SF. International Health 2561
Regulations—What Gets Measured Gets Done. Emerging Infectious Diseases 2012; 18(7): 2562
1054-7. 2563
22. Intergovernmental Panel on Climate Change. Climate Change 2014: Synthesis 2564
Report. Contribution of Working Groups I, II and III to the Fifth Assessment Report of the 2565
Intergovernmental Panel on Climate Change [Core Writing Team, R.K. Pachauri and L.A. 2566
Meyer (eds.)]. Geneva, Switzerland: IPCC, 2014. 2567
23. Emergency Events Database. The Human Cost of Weather-Related Disasters 1995-2568
2015: Centre for Research on the Epidemiology of Disasters (CRED), 2015 2569
24. Emergency Events Database. The International Disaster Database - Centre for 2570
Research on the Epidemiology of Disasters. 2017. 2571
25. International Federation of Red Cross and Red Crescent Societies. World Disasters 2572
Report 2014: Focus on Culture and Risks, 2014. 2573
26. Centre for Research on the Epidemiology of Disasters. The Human Cost of Natural 2574
Disasters: A Global Perspective. Brussels: CRED (Centre for Research on the Epidemiology of 2575
Disasters), 2015. 2576
27. Global Burden of Disease. Global Burden of Disease Study 2015. Global Burden of 2577
Disease Study 2015 (GBD 2015) Results. In: Institute for Health Metrics and Evaluation 2578
(IHME), editor. Seattle, United States; 2016. 2579
28. Liyanage P, Tissera H, Sewe M, et al. A Spatial Hierarchical Analysis of the Temporal 2580
Influences of the El Nino-Southern Oscillation and Weather on Dengue in Kalutara District, 2581
Sri Lanka. International journal of environmental research and public health 2016; 13(11). 2582
29. Wilder-Smith A, Byass P. The elusive global burden of dengue. The Lancet Infectious 2583
diseases 2016; 16(6): 629-31. 2584

93
30. Mitchell D, Heaviside C, Vardoulakis S, et al. Attributing human mortality during 2585
extreme heat waves to anthropogenic climate change. Environmental Research Letters 2586
2016; 11(7): 074006. 2587
31. Zanobetti A, Schwartz J. Temperature and mortality in nine US cities. Epidemiology 2588
(Cambridge, Mass) 2008; 19(4): 563-70. 2589
32. Gasparrini A, Guo Y, Hashizume M, et al. Temporal Variation in Heat-Mortality 2590
Associations: A Multicountry Study. Environmental health perspectives 2015; 123(11): 1200-2591
7. 2592
33. Shi L, Kloog I, Zanobetti A, Liu P, Schwartz JD. Impacts of Temperature and its 2593
Variability on Mortality in New England. Nature climate change 2015; 5: 988-91. 2594
34. Guo Y, Gasparrini A, Armstrong BG, et al. Temperature Variability and Mortality: A 2595
Multi-Country Study. Environmental health perspectives 2016. 2596
35. Wang Y, Shi L, Zanobetti A, Schwartz JD. Estimating and projecting the effect of cold 2597
waves on mortality in 209 US cities. Environment international 2016; 94: 141-9. 2598
36. Murray CJL, et al. Disability-adjusted life years (DALYs) for 291 diseases and injuries 2599
in 21 regions, 1990–2010: a systematic analysis for the Global Burden of Disease Study 2600
2010. The Lancet 2013; 380(9859): 2197–223. 2601
37. Dye C. After 2015: infectious diseases in a new era of health and development. Royal 2602
Philosophical Transactions of The Royal Society B 2014; 369(1645). 2603
38. World Health Organization. Using climate to predict infectious disease epidemics. 2604
Geneva, Switzerland, 2005. 2605
39. World Health Organization. The Health and Environment Lexicon: Multi-Language 2606
Glossary of Health and Environment Terminology. 2017. 2607
http://apps.who.int/thelexicon/entry.php. 2608
40. Stanaway JD, et al. The global burden of dengue: an analysis from the Global Burden 2609
of Disease Study 2013. The Lancet: Infectious Diseases 2016; 16(6): 712–23. 2610
41. Hales S, de Wet, N, Maindonald, J. and Woodward, A. Potential effect of population 2611
and climate changes on global distribution of dengue fever: an empirical model. The Lancet 2612
2002; 360(9336): 830-4. 2613
42. Krishnamurthy PK, et al. A methodological framework for rapidly assessing the 2614
impacts of climate risk on national-level food security through a vulnerability index. Global 2615
Environmental Change 2014; 24: 121–32. 2616
43. Nelson GC, Rosegrant MW, Palazzo A, et al. Food Security Farming and Climate 2617
Change to 2050: scenarios, results, policy options: International Food Policy Research 2618
Institute, 2010. 2619

94
44. Schmidhuber J, Tubiello FN. Global food security under climate change. Proceedings 2620
of the National Academy of Sciences of the United States of America 2007; 104(50): 19703-8. 2621
45. Campbell-Lendrum D, Woodruff R. Comparative risk assessment of the burden of 2622
disease from climate change. Environmental health perspectives 2006; 114: 1935–41. 2623
46. Campbell-Lendrum DH, Corvalán CF, Prüss–Ustün A. How Much Disease Could 2624
Climate Change Cause? Geneva: The World Health Organization, 2003. 2625
47. Naylor RL, Falcon WP. Food security in an era of economic volatility. Population and 2626
development review 2010; 36(4): 693-723. 2627
48. Headey D, Fan S. Reflections on the global food crisis: how did it happen? how has it 2628
hurt? and how can we prevent the next one?, 2010. 2629
49. Asseng S, Ewert F, Martre P, et al. Rising temperatures reduce global wheat 2630
production. Nature climate change 2015; 5(2): 143-7. 2631
50. Peng S, Huang, J., Sheehy, J.E., Laza, R.C., Visperas, R.M., Zhong, X., Centeno, G.S., 2632
Khush, G.S. and Cassman, K.G. Rice yields decline with higher night temperature from global 2633
warming. Proceedings of the National academy of Sciences of the United States of America 2634
2004; 101(27): 9971-5. 2635
51. Lobell DB, Burke, M.B., Tebaldi, C., Mastrandrea, M.D., Falcon, W.P. and Naylor, R.L. 2636
Prioritizing climate change adaptation needs for food security in 2030. Science 2007; 2637
319(5863): 607-10. 2638
52. Lobell DB, Schlenker, W. and Costa-Roberts, J. Climate trends and global crop 2639
production since 1980. Science 2011; 333(6042): 616-20. 2640
53. Gornall J, et al. Implications of climate change for agricultural productivity in the 2641
early twenty-first century. Philosophical Transactions of the Royal Society B Biological 2642
Sciences 2010; 365(1554). 2643
54. FAO. The FAO Hunger Map 2015. In: Food and Agriculture Organization of the United 2644
Nations, editor.; 2015. 2645
55. Jones PG, Thornton PK. The potential impacts of climate change on maize production 2646
in Africa and Latin America in 2055. Global Environmental Change 2003; 13(1): 51-9. 2647
56. Lobell DB, Bänziger M, Magorokosho C, Vivek B. Nonlinear heat effects on African 2648
maize as evidenced by historical yield trials. Nature climate change 2011; 1(1): 42-5. 2649
57. High Level Panel of Experts on Food Security and Nutrition of the Committee on 2650
World Food Security. Sustainable Fisheries and Aquaculture for Food Security and Nutrition. 2651
Rome, Italy, 2014. 2652
58. World Health Organization. Availability and consumption of fish. 2017. 2653
http://www.who.int/nutrition/topics/3_foodconsumption/en/index5.html (accessed July 2654
2017. 2655

95
59. Djouse L, et al. Fish consumption, omega-3 fatty acids and risk of heart failure: a 2656
meta-analysis. Clinical Nutrition 2012; 31(6): 846-53. 2657
60. Golden Cea. Fall in fish catch threatens human health. Nature 2016; 534(317). 2658
61. Bushaw-Newton KL, Sellner KG. Harmful Algal Blooms: National Oceanic and 2659
Atmospheric Administration, 1999. 2660
62. Armstrong EM, Vazquez-Cuervo J. A New Global Satellite-Based Sea Surface 2661
Temperature Climatology. Geophysical Research Letters 2001; 28(22): 4199-202. 2662
63. International Organization for Migration. Migration and Climate Change, 2008. 2663
64. Gleick PH. Water, Drought, Climate Change, and Conflict in Syria. American 2664
Meteorological Society 2014. 2665
65. Kelley CP, Mohtadib S, Canec MA, Seagerc R, Kushnirc Y. Climate change in the 2666
Fertile Crescent and implications of the recent Syrian drought. Proceedings of the National 2667
Academy of Sciences of the United States of America 2015; 112(11): 3241–6. 2668
66. McMichael C, Barnett J, McMichael AJ. An Ill Wind? Climate Change, Migration, and 2669
Health. Environmental health perspectives 2012; 120(5): 646-54. 2670
67. Green M. Contested territory. Nature climate change 2016; 6: 817–20. 2671
68. United Nations Office for the Coordination of Humanitarian Affairs. Fiji: Building 2672
resilience in the face of climate change, 2014. 2673
69. EU-GIZ Adapting to Climate Change and Sustainable Energy Programme. Planned 2674
Relocation Project. 2017. 2675
70. Connell J. Last days in the Carteret Islands? Climate change, livelihoods and 2676
migration on coral atolls. Asia Pacific Viewpoint 2016; 57(1): 3-15. 2677
71. Strauss S. Are cultures endangered by climate change? Yes, but ... WIREs Climate 2678
Change 2012; 3(4): 371-7. 2679
72. Bronen R, Chapin I. Adaptive governance and institutional strategies for climate-2680
induced community relocations in Alaska. PNAS, Proceedings of the National Academy of 2681
Sciences 2013; 110(23): 9320-5. 2682
73. Shearer C. The political ecology of climate adaptation assistance: Alaska Natives, 2683
displacement, and relocation. Journal of Political Ecology 2012; 19: 174-83. 2684
74. Small C, Nicholls RJ. A Global Analysis of Human Settlement in Coastal Zones. 2685
Journal of Coastal Research 2003; 19(3): 584-99. 2686
75. McGranahan G, Balk, D. and Anderson, B. The rising tide: assessing the risks of 2687
climate change and human settlements in low elevation coastal zones. Environment & 2688
Urbanization 2007; 19(1): 17-37. 2689

96
76. Merkens JL, Reimann, L, Hinkel, J. and Vafeidis, A.T. Gridded population projections 2690
for the coastal zone under the Shared Socioeconomic Pathways. Global and Planetary 2691
Change 2016; 145: 57-66. 2692
77. Gregory J. Projections of sea level rise: Working Group I contribution to the IPCC 2693
Fifth Assessment Report - Climate Change 2013: The Physical Science Basis, 2013. 2694
78. Collins PY, et al. Grand challenges in global mental health: A consortium of 2695
researchers, advocates and clinicians announces here research priorities for improving the 2696
lives of people with mental illness around the world, and calls for urgent action and 2697
investment. Nature 2011; 475: 27-30. 2698
79. Vins H, Bell J, Saha S, Hess J. The mental health outcomes of drought: A systematic 2699
review and causal process diagram. International journal of environmental research and 2700
public health 2015; 12: 13251. 2701
80. Intergovernmental Panel on Climate Change. Climate Change 2007: Working Group 2702
II: Impacts, Adaptation and Vulnerability, 2001. 2703
81. Rockerfeller Foundation. Resilience. 2017. 2704
https://www.rockefellerfoundation.org/our-work/topics/resilience/ (accessed 02 Jul 2017). 2705
82. United Nations Framework Convention on Change. National Adaptation Plans. 2017. 2706
83. World Health Organization. WHO guidance to protect health from climate change 2707
through health adaptation planning. Switzerland, 2014. 2708
84. World Health Organization. Operational framework for building climate resilient 2709
health systems. Geneva, Switzerland, 2015. 2710
85. United Nations. The World's Cities in 2016, 2016. 2711
86. Doherty M, Klima K, Hellmann JJ. Climate change in the urban environment: 2712
Advancing, measuring and achieving resiliency. Environmental Science & Policy 2016; 66: 2713
310-3. 2714
87. Compact of Mayors. 2017. https://www.compactofmayors.org/. 2715
88. Carbon Disclosure Project. Carbon Disclosure Project Data. 2017. 2716
89. Carbon Disclosure Project. CDP Cities 2016 Information Request, 2016. 2717
90. Sustainable Development Knowledge Platform. Sustainable Development Goal 3 - 2718
Ensure healthy lives and promote well-being for all at all ages. 2017. 2719
https://sustainabledevelopment.un.org/sdg3. 2720
91. World Health Organization. International Health Regulations (2005) Second Edition, 2721
2008. 2722
92. World Health Assembly. World Health Assembly resolution WHA 62.1 2008. 2723

97
93. International Health Regulations. IHR Core Capacity Monitoring Framework: 2724
Questionnaire for monitoring progress in the implementation of IHR core capacities in states 2725
parties: World Health Organization, 2005. 2726
94. World Health Organization. International Health Regulations (2005). IHR Core 2727
Capacity Monitoring Framework: Questionnaire for Monitoring Progress in the 2728
Implementation of IHR Core Capacities in States Parties, 2017. 2729
95. World Meteorological Organization. Monitoring and Evaluation. 2017. 2730
96. World Health Organization. Protecting Health from Climate Change: Vulnerability 2731
and Adaptation Assessment, 2013. 2732
97. Lim SS, Allen K, Bhutta ZA, et al. Measuring the health-related Sustainable 2733
Development Goals in 188 countries: a baseline analysis from the Global Burden of Disease 2734
Study 2015. The Lancet 2016; 16: 31467-2. 2735
98. Ministry of Economic Affairs and Employment. National Energy and Climate Strategy. 2736
In: Government of Finland, editor.; 2016. 2737
99. Department for Business Energy and Industrial Strategy. Coal Generation in Great 2738
Britain. The pathway to a low-carbon future: consultation document In: HM Government, 2739
editor.; 2016. 2740
100. Mason J. In latest move, China halts over 100 coal power projects. 2017. 2741
http://uk.reuters.com/article/us-china-coal-idUKKBN151090 (accessed July 2017. 2742
101. UBS. UBS Evidence Lab Electric Car Teardown – Disruption Ahead?, 2017. 2743
102. International Energy Agency. Medium-Term Renewable Energy Market Report 2016, 2744
2016. 2745
103. Dezem V. Solar Sold in Chile at Lowest Ever, Half Price of Coal. 2016. 2746
https://www.bloomberg.com/news/articles/2016-08-19/solar-sells-in-chile-for-cheapest-2747
ever-at-half-the-price-of-coal. 2748
104. Le Quéré C, Andrew, R.M, Canadell, J.G, et al. Global Carbon Budget 2016. Earth 2749
System Science Data 2016; 8: 605-49. 2750
105. Schirnding YV. Framework for Linkages between Health, Environment and 2751
Development, 2002. 2752
106. Intergovernmental Panel on Climate Change. Climate Change 2014: Mitigation of 2753
Climate Change. Contribution of Working Group III to the Fifth Assessment 2754
Report of the Intergovernmental Panel on Climate Change. Cambridge, United Kingdom and 2755
New York, NY, USA, 2014. 2756
107. International Energy Agency. Energy and Climate Change, 2015. 2757

98
108. Rogelj J, Schaeffer, M, Meinshausen, M, et al. Zero emission targets as long-term 2758
global goals for climate protection. Environmental Research Letters 2015; 10(105007). 2759
109. Pye S, Li FGN, Price J, Fais B. Achieving net-zero emissions through the reframing of 2760
UK national targets in the post-Paris Agreement era. Nature Energy 2017; 2. 2761
110. Rockström J, Gaffney, O, Rogelj, J, Meinshausen, M, Nakicenovic, N. and 2762
Schellnhuber, H.J. A roadmap for rapid decarbonization. Science 2017; 80(355): 1269–71. 2763
111. International Energy Agency. World Energy Outlook. Paris, France, 2016. 2764
112. International Energy Agency. Energy and Air Pollution: World Energy Outlook Special 2765
Report. Paris, France, 2016. 2766
113. Green F, Stern N. China’s changing economy: implications for its carbon dioxide 2767
emissions. Climate Policy 2017; 17: 423–42. 2768
114. Shearer C, Ghio, N, Myllyvirta, L, Yu, A. and Nace, T. Boom and Bust 2017 - Tracking 2769
the global coal plant pipeline, 2017. 2770
115. IRENA. Conference on the establishment of the international renewable energy 2771
agency. Bonn, Germany, 2009. 2772
116. World Health Organization. The European health report 2015: Targets and beyond – 2773
reaching new frontiers in evidence, 2015. 2774
117. World Health Organization. Proportion of population with primary reliance on clean 2775
fuels and technology. Geneva, Switzerland, 2017. 2776
118. International Energy Agency, World Bank. Sustainable Energy for All 2017—Progress 2777
toward Sustainable Energy. Washington, D.C., 2017. 2778
119. World Energy Oulook. WEO 2016 Biomass Database. 2016. 2779
120. World Energy Outlook. WEO 2016 Electricity Access Database. 2016. 2780
121. World Health Organization. Household Fuel Combustion: WHO guidelines for indoor 2781
air quality, 2014. 2782
122. Bonjour S, Adair-Rohani, H, Wolf, J. et al. Solid Fuel Use for Household Cooking: 2783
Country and Regional Estimates for 1980–2010. Environmental health perspectives 2013; 2784
121: 784–90. 2785
123. West JJ, Smith, S.J, Silva, R.A. et al. Co-benefits of Global Greenhouse Gas Mitigation 2786
for Future Air Quality and Human Health. Nature climate change 2013; 3: 885–9. 2787
124. Institute for Health Metrics and Global Burden of Disease. State of Global Air - 2017: 2788
A special report on global exposure to air pollution and its disease burden, 2017. 2789

99
125. World Health Organization. WHO’s Urban Ambient Air Pollution database – Update 2790
2016. Geneva, Switzerland, 2017. 2791
126. Milner J, Taylor, J, Barreto, M.L. et al. Environmental risks of cities in the European 2792
region: analyses of the Sustainable Healthy Urban Environments (SHUE) database. Public 2793
Health Panorama 2017; 3: 300-9. 2794
127. World Health Organization. Air pollution levels rising in many of the world’s poorest 2795
cities, 2016. 2796
128. European Commission. Europe, Latin America and The Caribbean: sharing 2797
experiences in regional development policies, 2015. 2798
129. Instituto Nacional de Estadistica e Informatica. 2017. 2799
130. Fondo De Inclusion Social Energetico. Memoria Anual De Gestion Fise 2015, 2015. 2800
131. Fondo De Inclusion Social Energetico. Memoria Anual De Gestion Fise 2014, 2014. 2801
132. European Commission. Directive 2001/80/EC of the European Parliament and of the 2802
Council on the limitation of emissions of certain pollutants into the air from large 2803
combustion plants. OJEC L 309/1. 2001. 2804
133. EU Parliament and Council. Directive 2010/75/EU of the European Parliament and of 2805
the Council of 24 November 2010 on industrial emissions (integrated pollution prevention 2806
and control). OJEC L 334/17. 2010. 2807
134. Pope CAea. Lung Cancer, Cardiopulmonary Mortality and Long-Term Exposure to 2808
Fine Particulate Air Pollution. Journal of the American Medical Association 2002; 287 (9): 2809
1132–41. 2810
135. Lim SSea. A Comparative Risk Assessment of Burden of Disease and Injury 2811
Attributable to 67 Risk Factors and Risk Factor Clusters in 21 Regions, 1990–2010: A 2812
Systematic Analysis for the Global Burden of Disease Study 2010. The Lancet 2012; 2813
380(9859): 2224–60. 2814
136. Forouzanfar MHea. Global, Regional, and National Comparative Risk Assessment of 2815
79 Behavioural, Environmental and Occupational, and Metabolic Risks or Clusters of Risks in 2816
188 Countries, 1990–2013: A Systematic Analysis for the Global Burden of Disease Study 2817
2013. The Lancet 2015; 386(10010): 2287–323. 2818
137. World Health Organization. Ambient Air Pollution: A Global Assessment of Exposure 2819
and Burden of Disease. Geneva, Switzerland, 2016. 2820
138. Amann M, I. Bertok, J. Borken-Kleefeld, J. Cofala, C. Heyes, L. Höglund-Isaksson, Z. 2821
Klimont, et al. Cost-Effective Control of Air Quality and Greenhouse Gases in Europe: 2822
Modeling and Policy Applications. Environmental Modelling & Software 2011; 26(2): 1489–2823
501. 2824
139. International Energy Agency. Energy Technology Perspectives. Paris, France, 2016. 2825

100
140. International Energy Agency. Global EV Outlook 2016: Beyond on million electric 2826
cars. Paris, France, 2016. 2827
141. International Energy Agency. Global EV Outlook 2017: Two Million and Counting, 2828
2017. 2829
142. Electric Vehicle Initiative. Global Electric Vehicle Outlook. 2016. 2830
143. Land Transport Authority. Passenger Transport Mode Shares in World Cities, 2014. 2831
144. Salon D, Gulyani S. Mobility, Poverty, and Gender: Travel ‘Choices’ of Slum Residents 2832
in Nairobi, Kenya. Transport Reviews 2010; 30: 641–57. 2833
145. Sims R. RS, F. Creutzig, X. Cruz-Núñez, M. D’Agosto, D. Dimitriu, M.J. Figueroa Meza, 2834
L. Fulton, S., Kobayashi, O. Lah, A. McKinnon, P. Newman, M. Ouyang, J.J. Schauer, D. 2835
Sperling, and G. Tiwari. Transport, 2014. 2836
146. United Nations Environment Program. Global Outlook on Walking and Cycling: 2837
United Nations, 2016. 2838
147. Institute for Mobility Research. Mobility trends in cutting edge cities, 2016. 2839
148. Transport for London. Travel in London Report 9, 2016. 2840
149. NSW Department of Transport. Public transport travel patterns in the greater Sydney 2841
Metropolitan area 1981-1991. 1996. 2842
150. NSW Department of Transport. Household Travel Survey Summary Report 2002. 2843
2003. 2844
151. NSW Department of Transport. Household Travel Survey Summary Report 2007. 2845
2009. 2846
152. NSW Department of Transport. Key Transport Indicators- How do people travel. 2847
2017. 2848
153. Translink. Metro Vancouver Regional Trip Diary Survey Briefing Paper #1. 2012. 2849
154. S.A. D. Estudio Encuesta origen destino de viajes del Gran Santiago, 1991, 1992. 2850
155. Rode P, Hoffmann C, Kandt J, Smith D, Graff A. Toward New Urban. Mobility: The 2851
case of London and Berlin. London: London School of Economics and Political Science, 2015. 2852
156. City of Berlin. Mobility in the City: Berlin Traffic in Figures, 2013. 2853
157. Vermeulen SJ, Campbell BM, Ingram JSI. Climate change and food systems. Annual 2854
Review of Environment and Resources 2012; 37: 195-222. 2855
158. Lim SS, Vos, T, Flaxman, A.D. et al. Global, regional, and national comparative risk 2856
assessment of 79 behavioural, environmental and occupational, and metabolic risks or 2857

101
clusters of risks in 188 countries, 1990-2013: a systematic analysis for the Global Burden of 2858
Disease Study 2013. The Lancet 2016; 380: 2224–60. 2859
159. Springmann Mea. Analysis and valuation of the health and climate change cobenefits 2860
of dietary change. PNAS, Proceedings of the National Academy of Sciences 2016; 15: 4146-2861
51. 2862
160. Hawkesworth S, Dangour, A.D, Johnston, D. et al. Feeding the world healthily: the 2863
challenge of measuring the effects of agriculture on health. Philosophical Transactions of the 2864
Royal Society B Biological Sciences 2010; 365: 3083–97. 2865
161. Smith MR, Micha, R, Golden, C.D. et al. Global Expanded Nutrient Supply (GENuS) 2866
Model: A New Method for Estimating the Global Dietary Supply of Nutrients. PLoS One 2867
2016; 11. 2868
162. Gobbo LCD, Khatibzadeh, S, Imamura, F. et al. Assessing global dietary habits : a 2869
comparison of national estimates from the FAO and the Global Dietary Database 1 – 4, 2870
2015. 2871
163. Herrero Mea. Greenhouse gas mitigation potentials in the livestock sector. Nature 2872
climate change 2016; 6: 452–61. 2873
164. O’Mara FP. The significance of livestock as a contributor to global greenhouse gas 2874
emissions today and in the near future. Animal Feed Science and Technology 2011; 166–167: 2875
7–15. 2876
165. Herrero M, Havlík P, Valin H, et al. Biomass use, production, feed efficiencies, and 2877
greenhouse gas emissions from global livestock systems. Proceedings of the National 2878
Academy of Sciences of the United States of America 2013; 110: 20888–93. 2879
166. Carlsson-Kanyama A, González AD. Potential contributions of food consumption 2880
patterns to climate change. American Journal of Clinical Nutrition 2009; 89: 1704S–9S. 2881
167. Larsson SC, Wolk A. Meat consumption and risk of colorectal cancer: A meta-analysis 2882
of prospective studies. International Journal of Cancer 2006; 119: 2657–64. 2883
168. Norat T, Lukanova, A, Ferrari, P. and Riboli, E. Meat consumption and colorectal 2884
cancer risk: Dose-response meta-analysis of epidemiological studies. International Journal of 2885
Cancer; 98: 241–56. 2886
169. FAOSTAT. Food Balance Sheets, 2017. 2887
170. Ng M, Fleming T, Robinson M, al. e. Global, regional, and national prevalence of 2888
overweight and obesity in children and adults during 1980-2013: A systematic analysis for 2889
the Global Burden of Disease Study 2013. The Lancet 2013; 384: 766–81. 2890
171. World Bank. Climate-Smart Healthcare: Low-Carbon and Resilience Strategies for the 2891
Health Sector. Washington DC, 2017. 2892
172. NHS Sustainable Development Unit. NHS carbon footprint, 2016. 2893

102
173. Stern N. Stern Review on the Economics of Climate Change. In: Kingdom GotU, 2894
editor. London: Blackwell Publishing; 2006. p. 5. 2895
174. Weitzmann. M. Fat-Tailed Uncertainty in the Economics of Catastrophic Climate 2896
Change. Review of Environmental Economics and Policy 2011; 5(2): 17. 2897
175. Stern N. The Structure of Economic Modeling of the Potential Impacts of Climate 2898
Change: Grafting Gross Underestimation of Risk onto Already Narrow Science Models. 2899
Journal of Economic Literature 2013; 51(3): 21. 2900
176. International Energy Agency. World Energy Investment 2016. Paris, 2016. 2901
177. International Energy Agency. World Energy Investment 2017. Paris, 2017. 2902
178. International Energy Agency. World Energy Outlook 2016. Paris, France, 2016. 2903
179. International Energy Agency, International Renewable Energy Agency. Perspectives 2904
for the energy transition: Investment needs for a low-carbon energy system. Berlin, 2905
Germany, 2017. 2906
180. Olivier JGJ, Janssens-Maenhout G, Muntean M, Peters JAHW. Trends in Global CO2 2907
Emissions: 2016 Report: PBL Netherlands Environmental Assessment Agency, The Hague, 2908
2016. 2909
181. Ansar A, Caldecott B, Tilbury J. Stranded assets and the fossil fuel divestment 2910
campaign: what does divestment mean for the valuation of fossil fuel assets?: Smith School 2911
of Enterprise and the Environment, 2013. 2912
182. North CS. Disaster Mental Health Epidemiology: Methodological Review and 2913
Interpretation of Research Findings. Psychiatry 2016; 79(2): 16. 2914
183. Munich Re. NatCatSERVICE. In: Re M, editor.; 2017. 2915
184. World Health Organization. Global Health Observatory (GHO) data. In: World Health 2916
Organization, editor. Geneva; 2017. 2917
185. Ming-Xiao. W, Tao. Z, Miao-Rong. X, Bin. Z, Ming-Qiu. J. Analysis Of National Coal-2918
mining Accident data In China, 2001–2008. Public Health Rep 2011; 126(2): 5. 2919
186. Hendryx M, Ahern MM. Relations Between Health Indicators and Residential 2920
Proximity to Coal Mining in West Virginia. American Journal of Public Health 2008; 98(4): 2. 2921
187. Zullig. KJ, Hendryx. M. A Comparative Analysis of Health-Related Quality of Life for 2922
Residents of U.S. Counties with and without Coal Mining. Public Health Reports 2010; 2923
125(4): 7. 2924
188. Hendryx M. Mortality from heart, respiratory, and kidney disease in coal mining 2925
areas of Appalachia. International Archives of Occupational and Environmental Health 2009; 2926
82(2): 6. 2927

103
189. IBIS World. Global Coal Mining: Market Research Report, 2016. 2928
190. IBIS World. Global Oil & Gas Exploration & Production: Market Research Report, 2929
2017. 2930
191. IRENA. Renewable Energy and Jobs: Annual Review 2017. Abu Dhabi: International 2931
Renewable Energy Agency, 2017. 2932
192. International Energy Agency. World Energy Outlook 2012. Paris, France, 2012. 2933
193. Granado JA, Coady D, Gillingham R. The Unequal Benefits of Fuel Subsidies: A Review 2934
of Evidence for Developing Countries, 2010. 2935
194. General Secretariat of the Council. G7 Ise-Shima Leaders' Declaration. Brussels, 2936
Blegium; 2016. p. 1. 2937
195. World Bank. Carbon Pricing Dashboard. 2017. 2938
http://carbonpricingdashboard.worldbank.org (accessed 06.06.2017 2017). 2939
196. World Bank, Ecofys. Carbon Pricing Watch 2017. Washington DC, USA, 2017. 2940
197. Patuelli R, Nijkamp P, Pels E. Environmental tax reform and the double dividend: a 2941
meta-analytical performance assessment. Ecological Economics 2005; 55: 564-83. 2942
198. Georgeson L, al. e. Global Disparity in the Supply of Commercial Weather and 2943
Climate Information Services. Science Advances 2017; 3(5). 2944
199. Climate Funds Update. Climate Funds Update: The Data. 2017. 2945
http://www.climatefundsupdate.org/. 2946
200. Crompton T. Common Values: The Case for Working with our Cultural Values: WWF, 2947
2010. 2948
201. World Health Assembly. Sixty-first World Health Assembly WHA61.19. 2008. 2949
202. Boykoff MT, Goodman MK, Curtis I. Cultural Politics of Climate Change: Interactions 2950
in Everyday Spaces, 2009. 2951
203. Lee TM, Markowitz EM, Howe PD, al e. Predictors of public climate change 2952
awareness and risk perception around the world Nature climate change 2015; 5: 1014–20. 2953
204. Boykoff MT. Media and scientific communication: a case of climate change 2954
Geological Society 2008; 305: 11-8. 2955
205. Steentjes K, al e. European Perceptions of Climate Change: Topline findings of a 2956
survey conducted in four European countries in 2016, 2017. 2957
206. Billett S. Dividing climate change: global warming in the Indian mass media. Climatic 2958
Change 2010; 99(1/2): 525-37. 2959

104
207. Bhatta SNA. Coverage of Climate Change Issues in Indian Newspapers and Policy 2960
Implications. Current Science 2015; 108(11): 1972-3. 2961
208. Andrews K, Boykoff, M., Daly, M., Gifford, L., Luedecke, G., McAllister, L., and Nacu-2962
Schmidt, A. . World Newspaper Coverage of Climate Change or Global Warming, 2004-2017: 2963
Center for Science and Technology Policy Research, Cooperative Institute for Research in 2964
Environmental Sciences, University of Colorado, 2017. 2965
209. Schütte S, Depoux A, Vigil S, al. e. The influence of health concerns in scientific and 2966
policy debates on climate change. 2015; Journal of Epidemiology and Community Health. 2967
210. Depoux A, Hémono M, Puig-Malet S, Pédron R, Flahault A. Communicating climate 2968
change and health in the media. Public Health Reviews 2017; 38(1): 7. 2969
211. Hosking J, Campbell-Lendrum D. How well does climate change and human health 2970
research match the demands of policymakers? A scoping review. Environmental health 2971
perspectives 2012; 120(8): 1076-82. 2972
212. Campbell-Lendrum D, Bertollini R, Neira M, Ebi K, McMichael A. Health and climate 2973
change: a roadmap for applied research. The Lancet 2009; 373(9676): 1663-5. 2974
213. Arksey H, O’Malley L. Scoping studies: towards a methodological framework. 2975
International Journal of Social Research Methodology 2005; 8(1): 19-32. 2976
214. Janssen MA, Schoon, M.L, Ke, W, and Börner, K. Scholarly networks on resilience, 2977
vulnerability and adaptation within the human dimensions of global environmental change. 2978
Global Environmental Change 2006; 16(3): 240-52. 2979
215. Herlihy N, Bar-Hen A, Verner G, et al. Climate change and human health: what are 2980
the research trends? A scoping review protocol. British Medical Journal 2016; 6. 2981
216. Baturo A, Dasandi N, Mikhaylov S. Understanding State Preferences with Text as 2982
Data: Introducing the UN General Debate Corpus. Research and Politics 2017; 4(2). 2983 2984
Related Documents


