The Key Tool in Energy Management Andrew Ibbotson Joe Flanagan Monitoring and Targeting

The Key Tool in Energy Management Andrew Ibbotson Joe Flanagan Monitoring and Targeting.
Dec 15, 2015
Welcome message from author
This document is posted to help you gain knowledge. Please leave a comment to let me know what you think about it! Share it to your friends and learn new things together.
Transcript
The Key Tool in Energy Management
Andrew Ibbotson
Joe Flanagan
Monitoring and Targeting Monitoring and Targeting
Monitoring and Targeting (M&T)
Provides lowest payback savings
Provides excellent basis to identify, justify and monitor major projects
Provides most robust way of reporting back to Govt.

What is M&T
A management tool to help reduce energy and utility usage using a proven methodology.
A rigorous and well structured analysis of energy and production data
Identification of new cost saving opportunities
Maintains saving performance
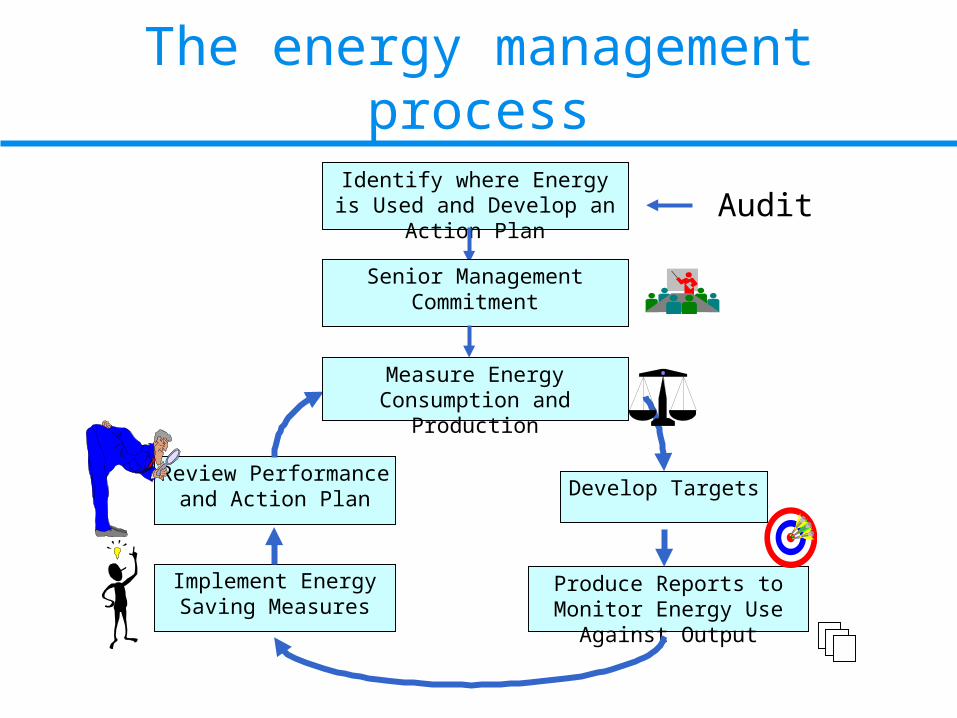
Identify where Energy is Used and Develop an Action Plan
Senior Management Commitment
Produce Reports to Monitor Energy Use Against Output
Review Performance and Action Plan
Implement Energy Saving Measures
Measure Energy Consumption and Production
Develop Targets
Audit
The energy management process

M&T System
Scoping StudyScoping Study
PeopleManagement Processes
Awareness & MotivationTraining
PeopleManagement Processes
Awareness & MotivationTraining
SystemsMetering & Data Acquisition
SoftwareAnalysis and Reporting
SystemsMetering & Data Acquisition
SoftwareAnalysis and Reporting
IntegrationIntegration
TechnologyProject IdentificationFinancial Evaluation
Engineering
TechnologyProject IdentificationFinancial Evaluation
Engineering
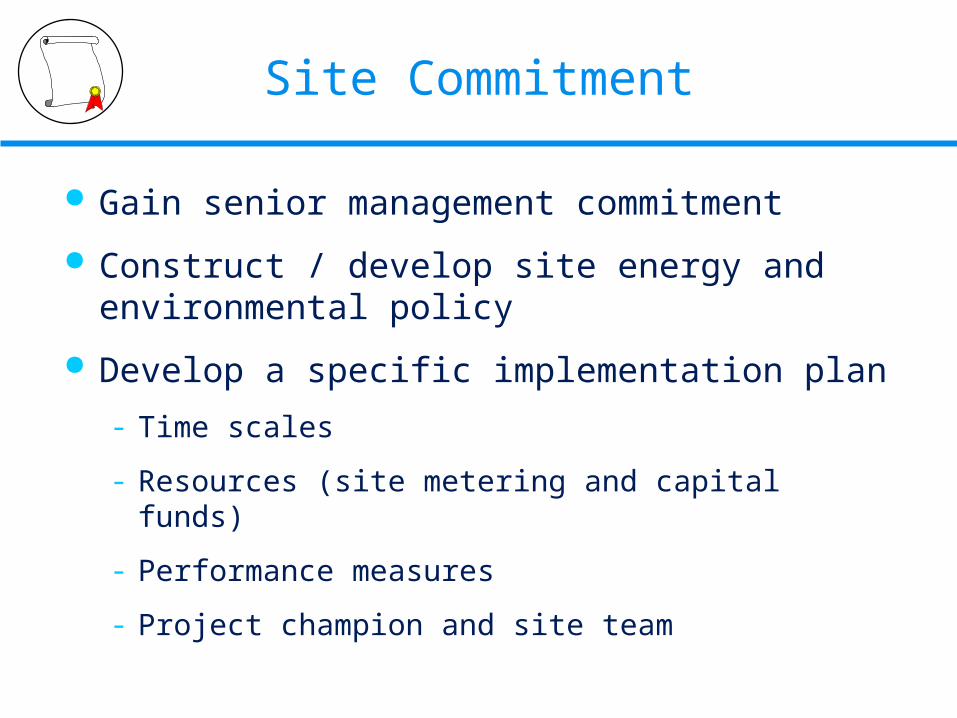
Site Commitment
Gain senior management commitment
Construct / develop site energy and environmental policy
Develop a specific implementation plan
- Time scales
- Resources (site metering and capital funds)
- Performance measures
- Project champion and site team
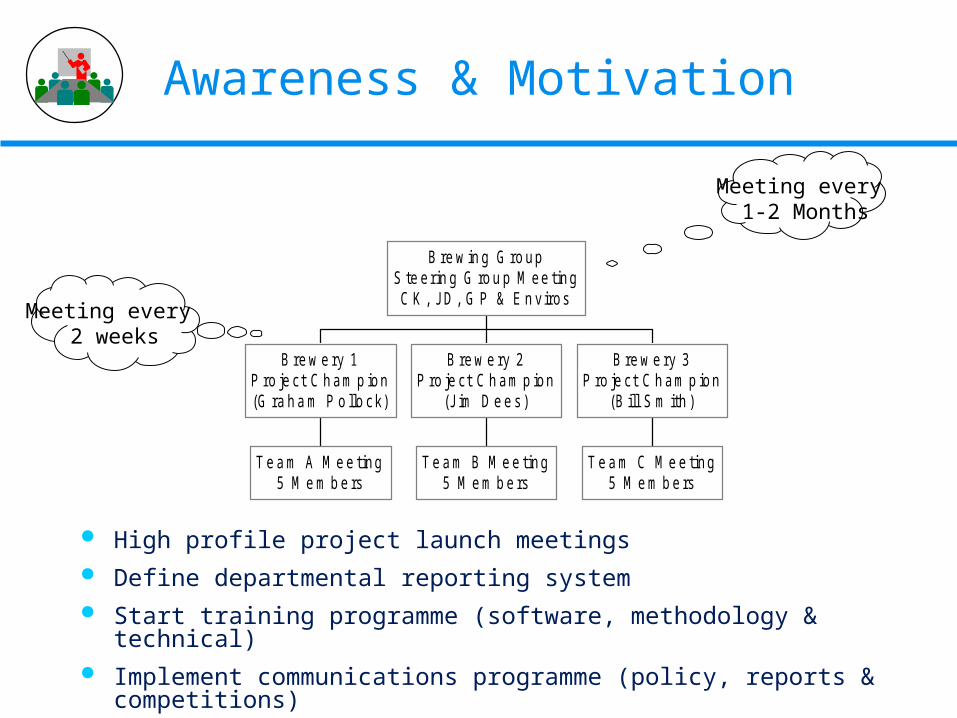
Awareness & Motivation
High profile project launch meetings Define departmental reporting system Start training programme (software, methodology & technical) Implement communications programme (policy, reports &
competitions)
T e a m A M e e ting5 M e m b e rs
B re w e ry 1P ro je ct C h am p ion(G ra h a m P o llo ck)
T e a m B M e e ting5 M e m b e rs
B re w e ry 2P ro je ct C h am p ion
(J im D e e s )
T e a m C M e e ting5 M e m b e rs
B re w e ry 3P ro je ct C h am p ion
(B ill S m ith )
B re w in g G ro upS te erin g G ro u p M ee tingC K , JD , G P & E n v iros
Meeting every 1-2 Months
Meeting every 2 weeks
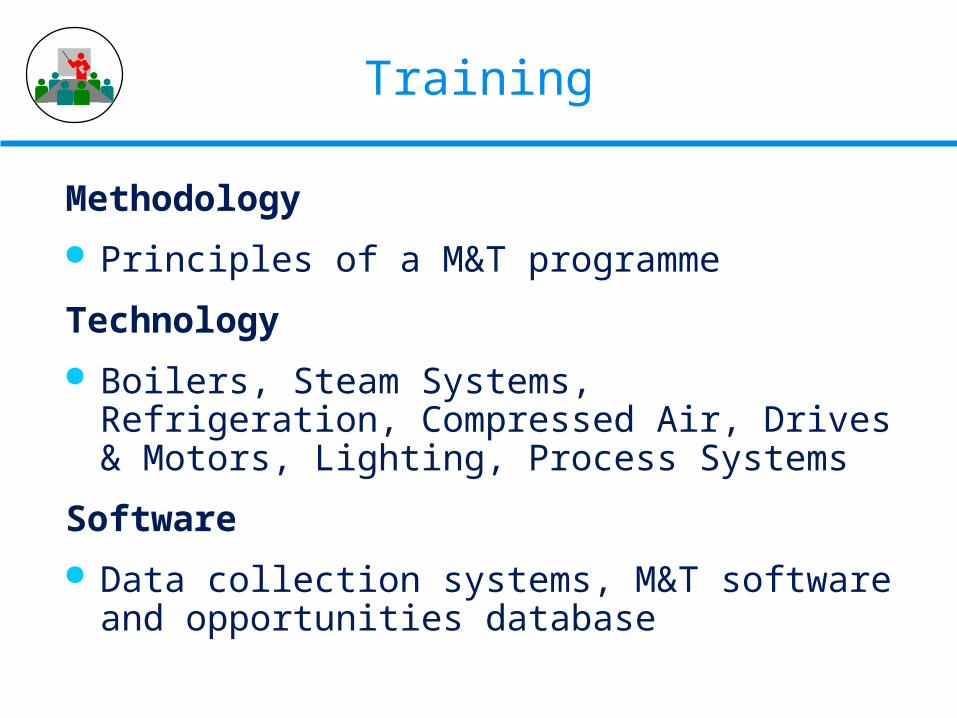
Training
Methodology
Principles of a M&T programme
Technology
Boilers, Steam Systems, Refrigeration, Compressed Air, Drives & Motors, Lighting, Process Systems
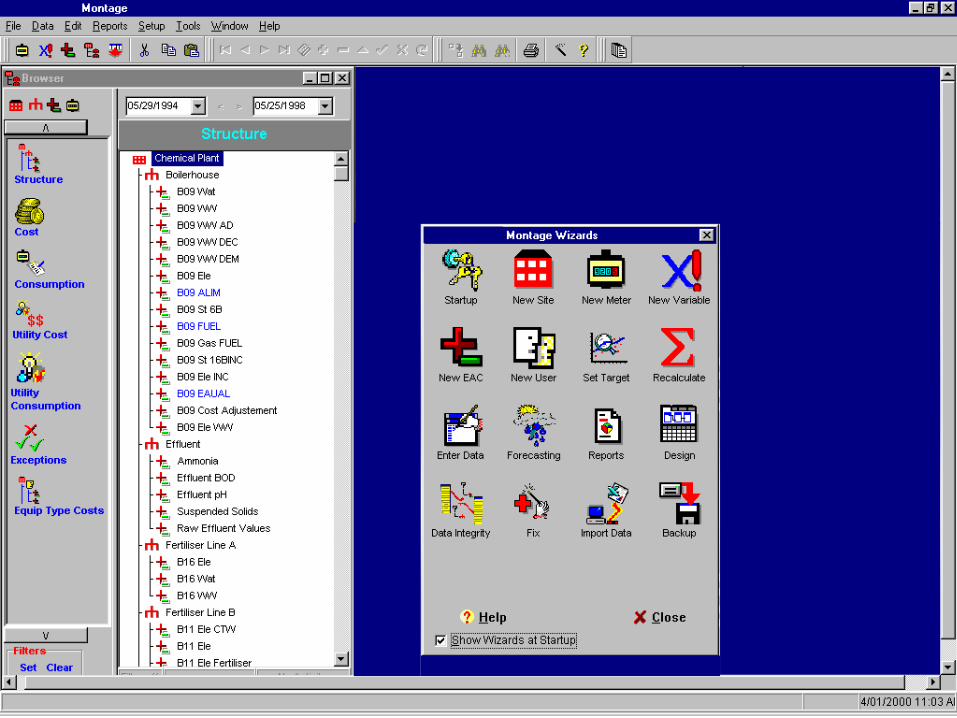
Software
Data collection systems, M&T software and opportunities database
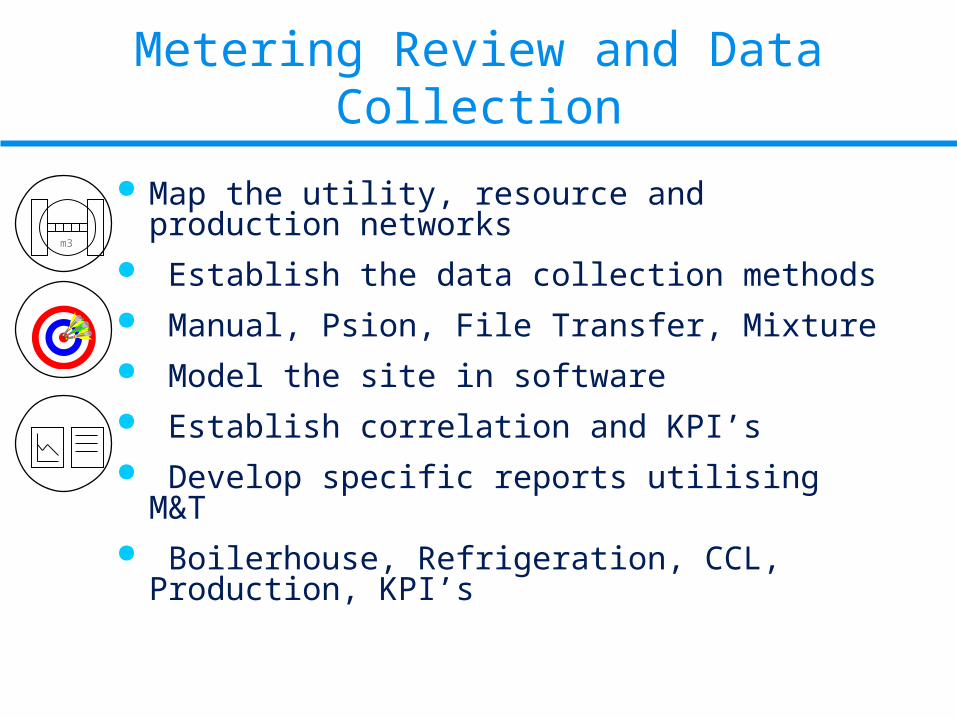
Metering Review and Data Collection
Map the utility, resource and production networks
Establish the data collection methods Manual, Psion, File Transfer, Mixture Model the site in software Establish correlation and KPI’s Develop specific reports utilising M&T Boilerhouse, Refrigeration, CCL,
Production, KPI’s
m3
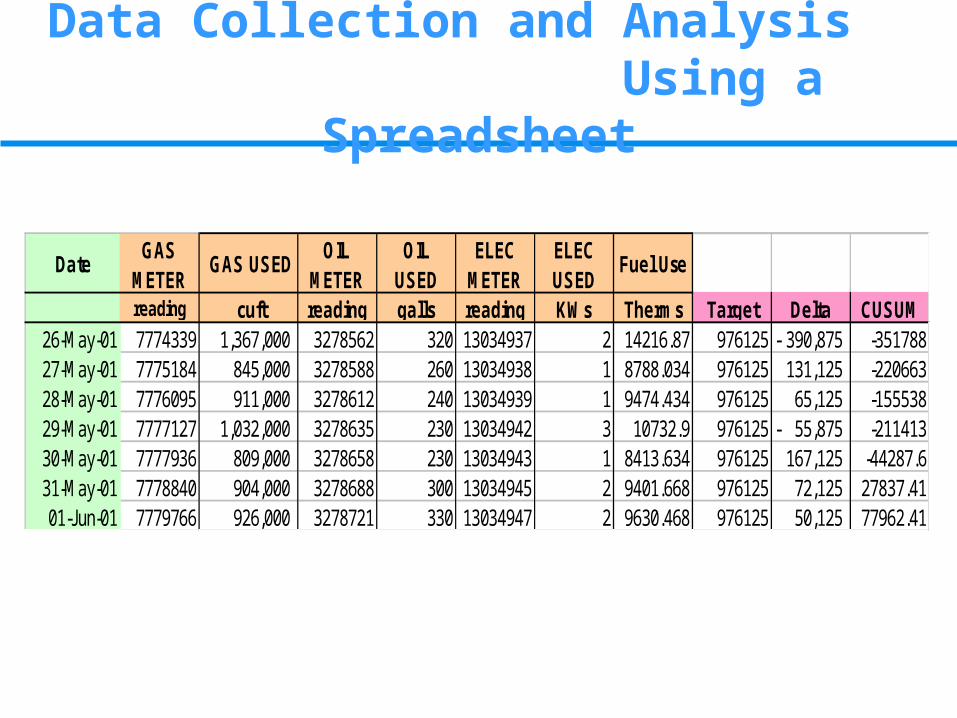
DateGAS
METER GAS USED
OIL METER
OIL USED
ELEC METER
ELEC USED
Fuel Use
reading cuft reading galls reading KWs Therms Target Delta CUSUM26-May-01 7774339 1,367,000 3278562 320 13034937 2 14216.87 976125 390,875- -35178827-May-01 7775184 845,000 3278588 260 13034938 1 8788.034 976125 131,125 -22066328-May-01 7776095 911,000 3278612 240 13034939 1 9474.434 976125 65,125 -15553829-May-01 7777127 1,032,000 3278635 230 13034942 3 10732.9 976125 55,875- -21141330-May-01 7777936 809,000 3278658 230 13034943 1 8413.634 976125 167,125 -44287.631-May-01 7778840 904,000 3278688 300 13034945 2 9401.668 976125 72,125 27837.4101-Jun-01 7779766 926,000 3278721 330 13034947 2 9630.468 976125 50,125 77962.41
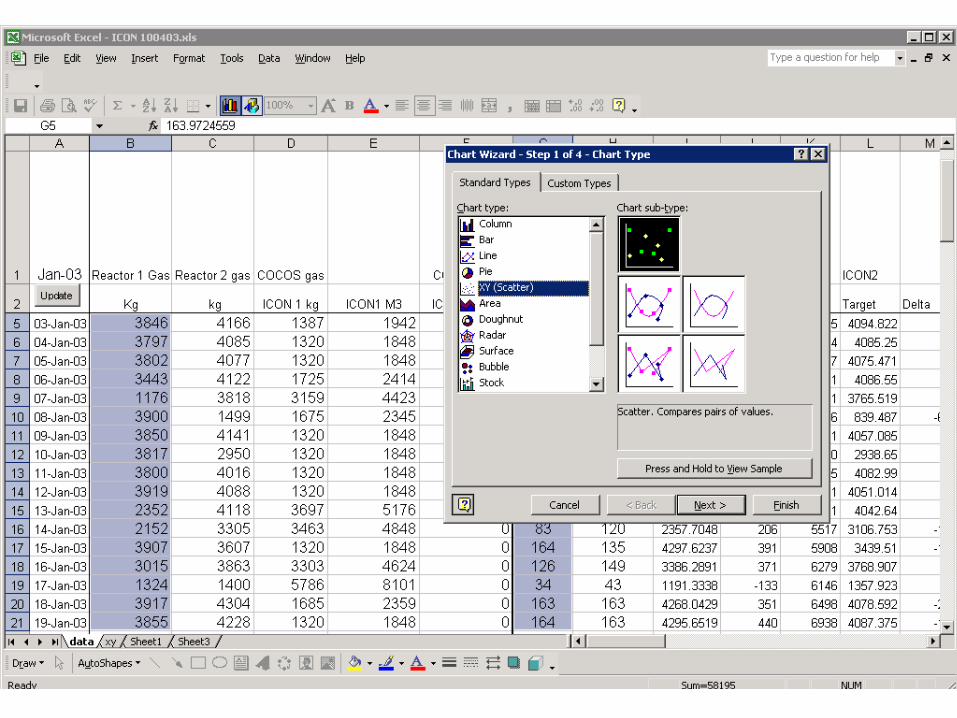
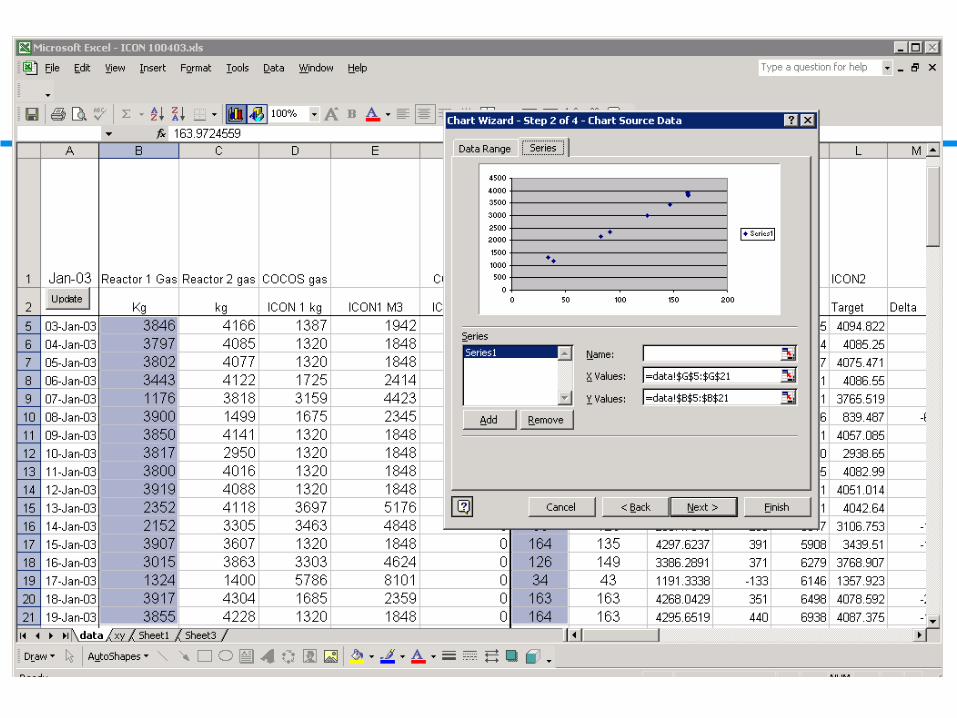
Data Collection and Analysis Using a Spreadsheet
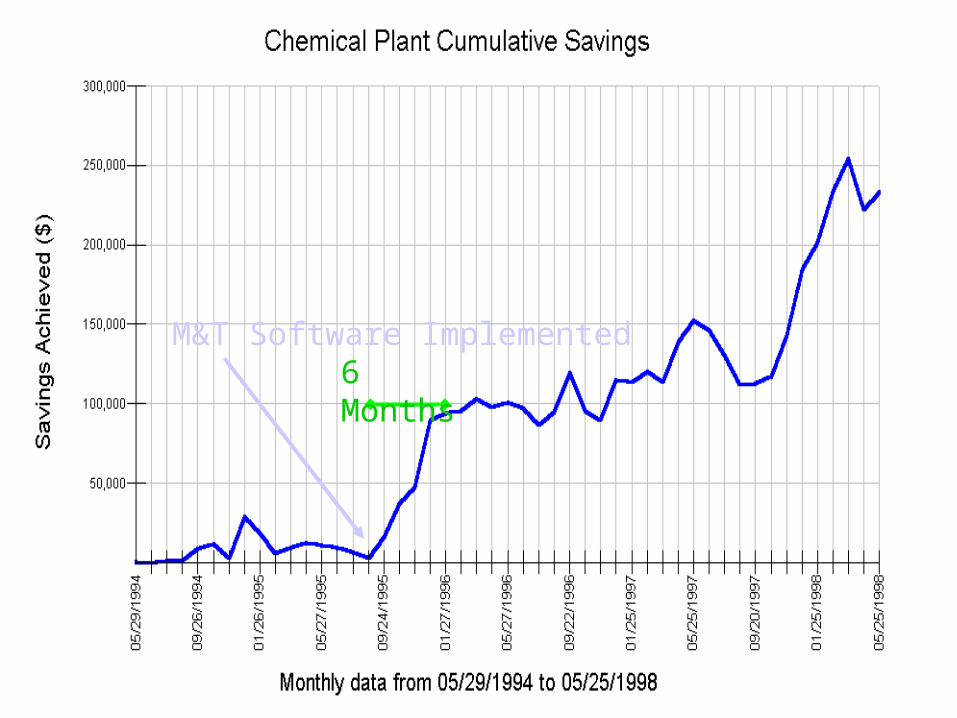
M&T Software Implemented6 Months

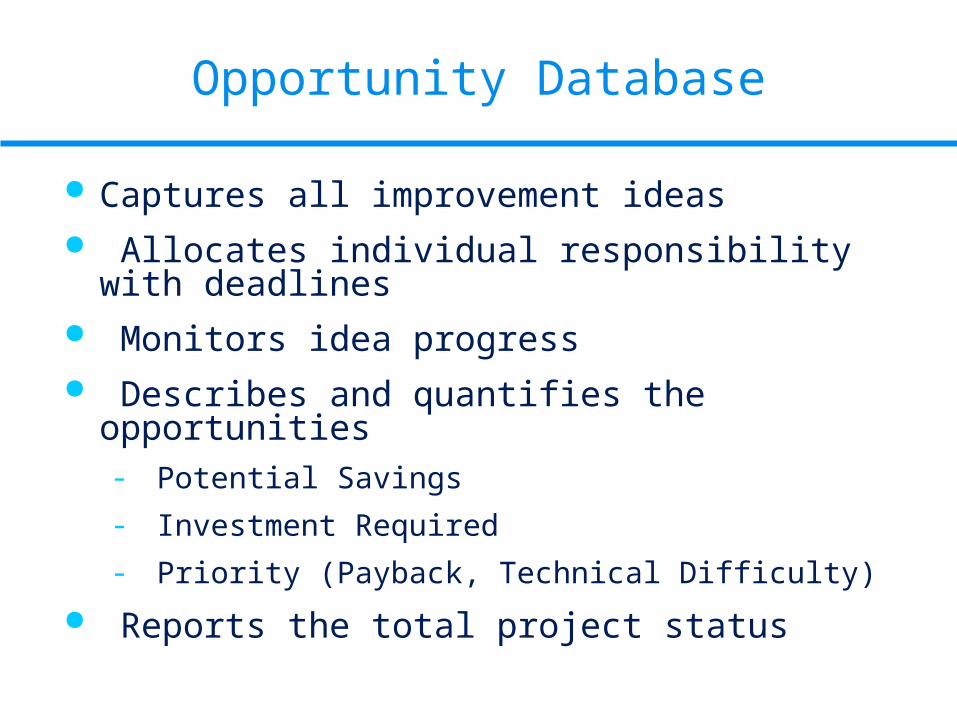
Opportunity Database
Captures all improvement ideas Allocates individual responsibility with
deadlines Monitors idea progress Describes and quantifies the opportunities
- Potential Savings
- Investment Required
- Priority (Payback, Technical Difficulty)
Reports the total project status
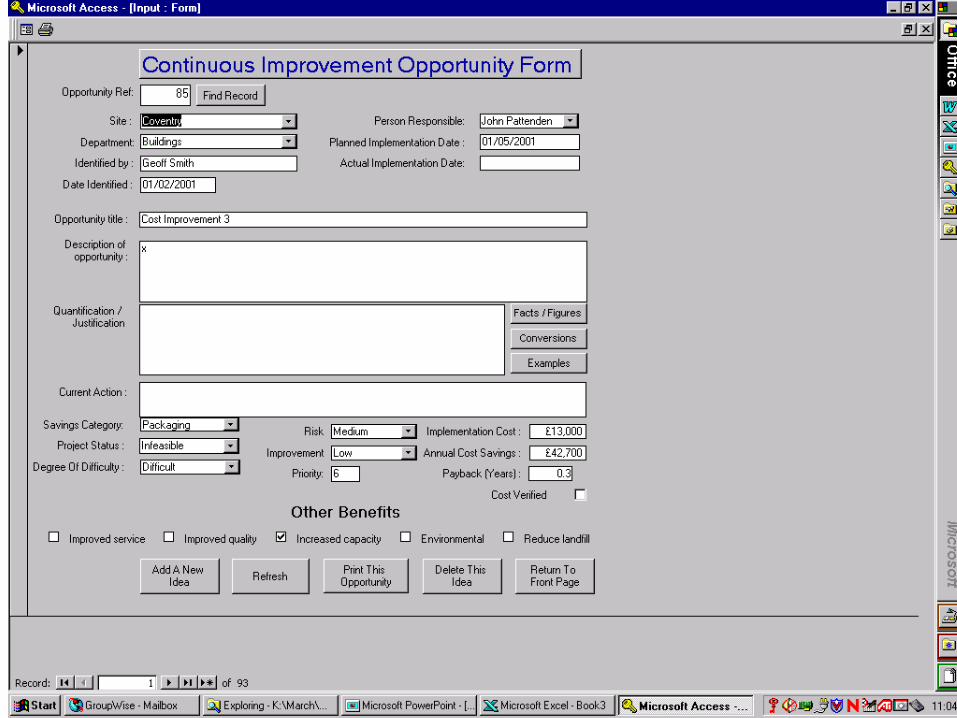
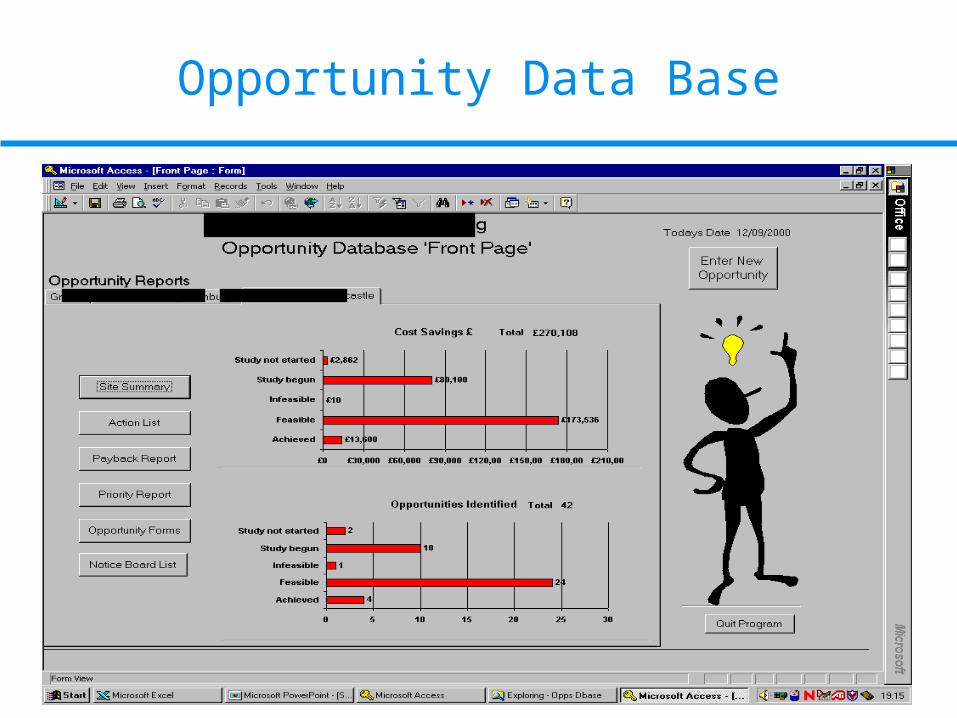
Opportunity Data Base
Project Review
Monthly Steering Group Meeting
- Total Savings
- Energy Usage
- Projects/Environmental Improvements
- Costs
The M&T Quality System
- Software Standards
- Training and Programme Standards
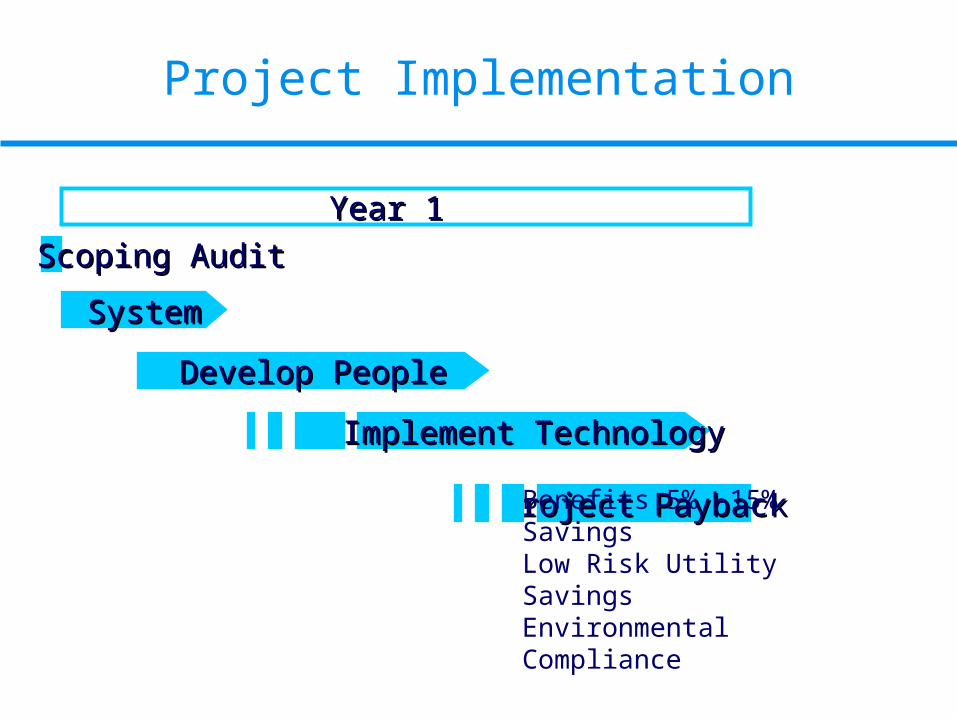
Project Implementation
Year 1Year 1
SystemSystem
Develop PeopleDevelop People
Implement TechnologyImplement Technology
Project PaybackProject PaybackBenefits 5% -15% SavingsLow Risk Utility SavingsEnvironmental Compliance
Scoping AuditScoping Audit

Case Study - UK Dairy Group
5 Site parallel implementation across UK
5 Teams of 6 people
20 Utility Sub Meters per site (10 water & 10 electric) £30K
enManage implementation costs £120 K
Utilities Savings £300,000
Packaging Savings £200,000
Product Savings £750,000
Total £1,250,000
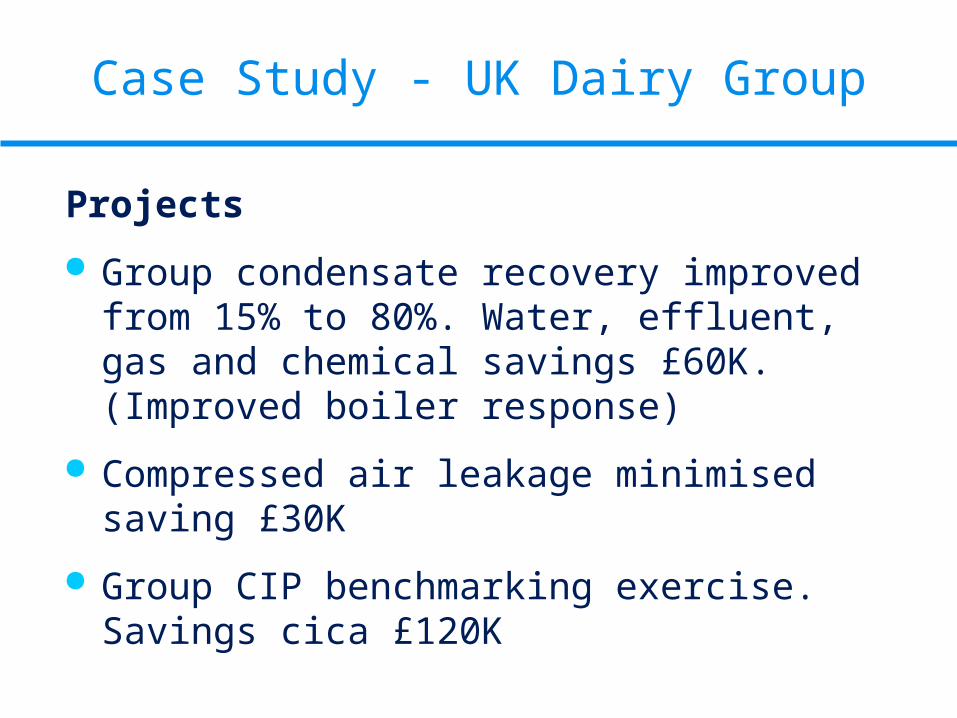
Case Study - UK Dairy Group
Projects
Group condensate recovery improved from 15% to 80%. Water, effluent, gas and chemical savings £60K. (Improved boiler response)
Compressed air leakage minimised saving £30K
Group CIP benchmarking exercise. Savings cica £120K
The Rewards
Resource cost savings - scope to save
- Utilities 5% - 15%
- Raw Materials up to 1%
- Packaging 5%
Environmental Compliance
- IPPC
- ISO 14001
Low Risk
Setting Up M&TData Collection and Meters
To determine what should be monitored
To determine areas of accountability
To determine costs of further monitoring equipment required
To propose a cost effective solution
Objectives
Some Initial Thoughts
How are energy costs monitored?
Who is acountable for usage?
Is the company using energy efficiently?
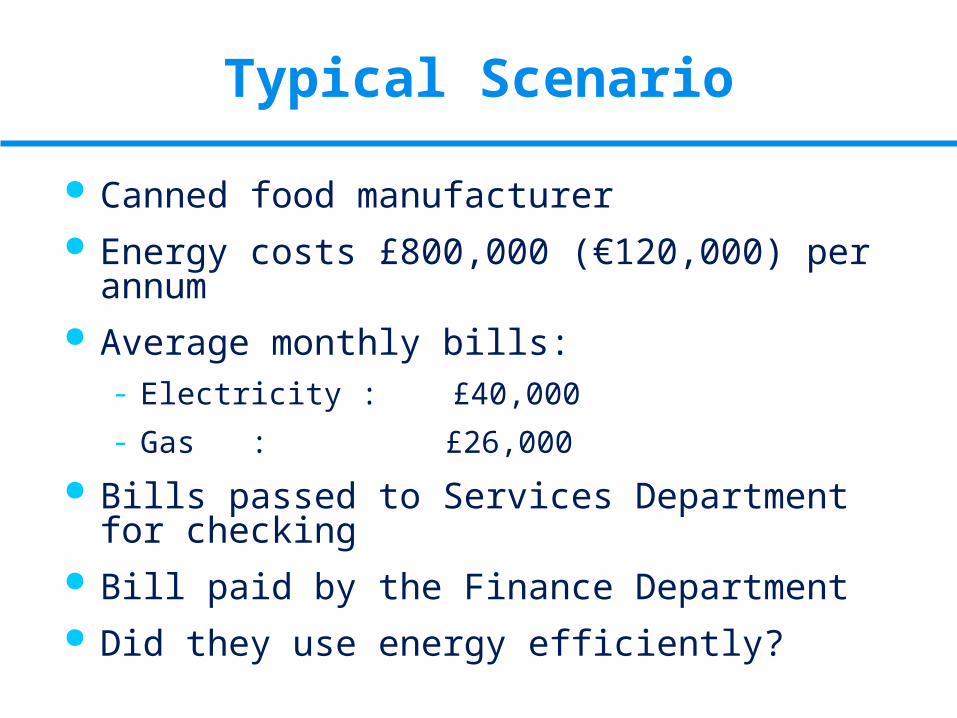
Typical Scenario
Canned food manufacturer Energy costs £800,000 (€120,000) per annum Average monthly bills:
- Electricity : £40,000
- Gas : £26,000
Bills passed to Services Department for checking
Bill paid by the Finance Department Did they use energy efficiently?
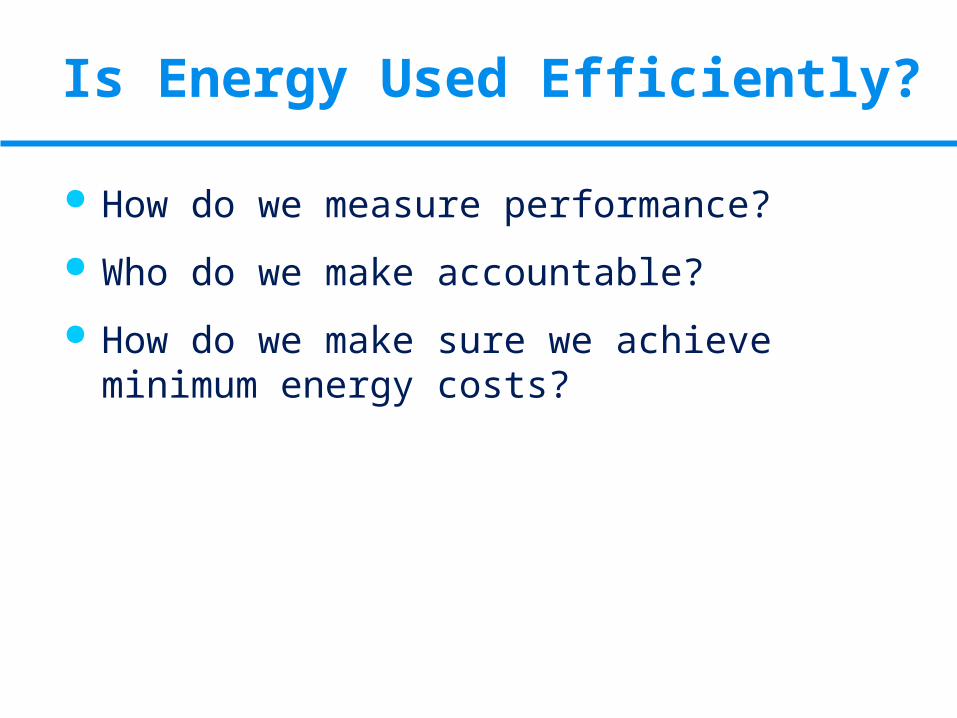
Is Energy Used Efficiently?
How do we measure performance?
Who do we make accountable?
How do we make sure we achieve minimum energy costs?
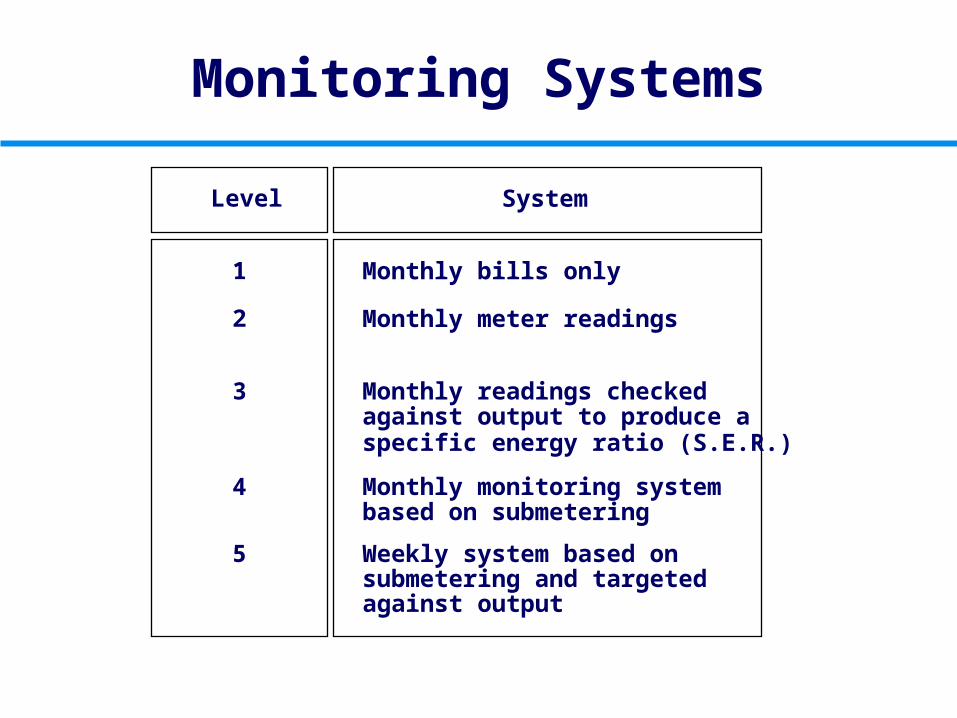
Monitoring Systems
Level System
1 Monthly bills only
2 Monthly meter readings
3 Monthly readings checkedagainst output to produce aspecific energy ratio (S.E.R.)
4 Monthly monitoring system based on submetering
5 Weekly system based on submetering and targetedagainst output
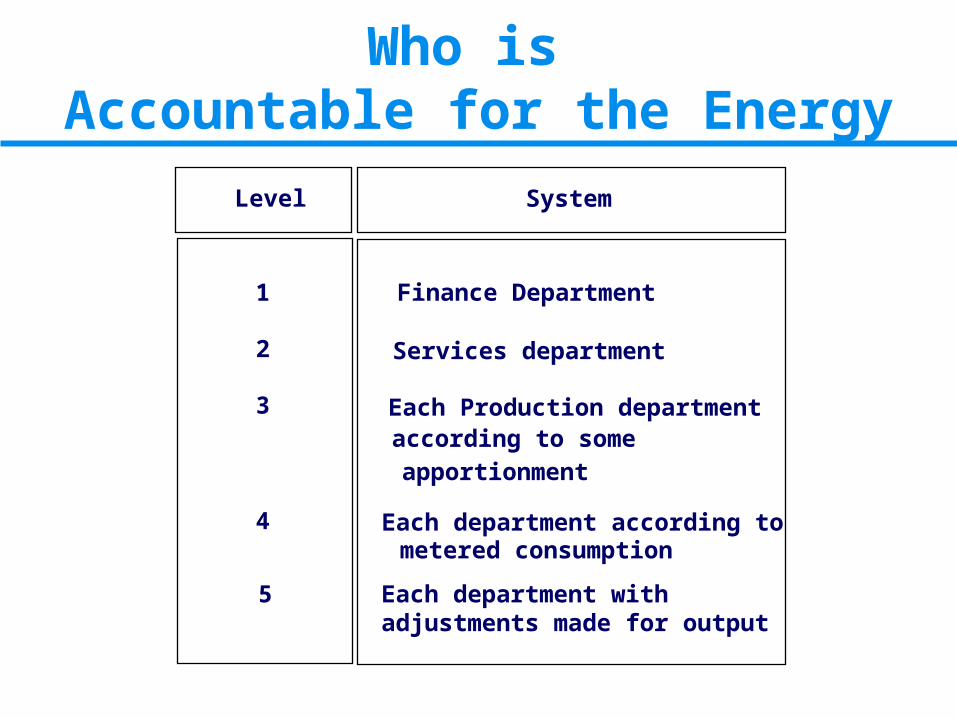
Who is Accountable for the Energy
Level System
1 Finance Department
2 Services department
3 Each Production departmentaccording to some apportionment
4 Each department according tometered consumption
5 Each department with adjustments made for output
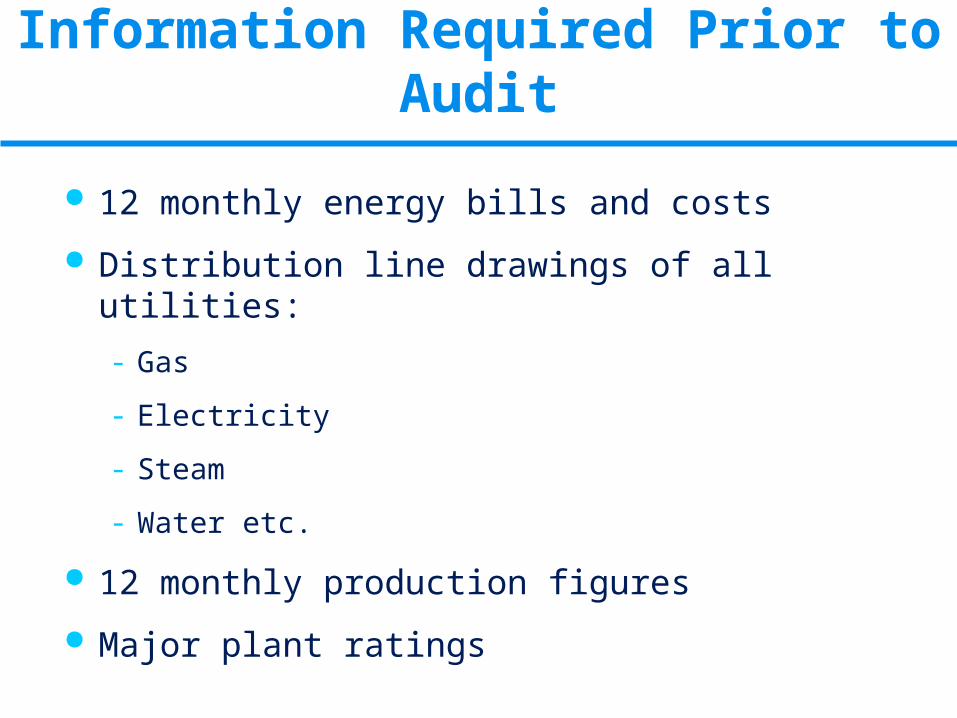
Information Required Prior to Audit
12 monthly energy bills and costs
Distribution line drawings of all utilities:
- Gas
- Electricity
- Steam
- Water etc.
12 monthly production figures
Major plant ratings
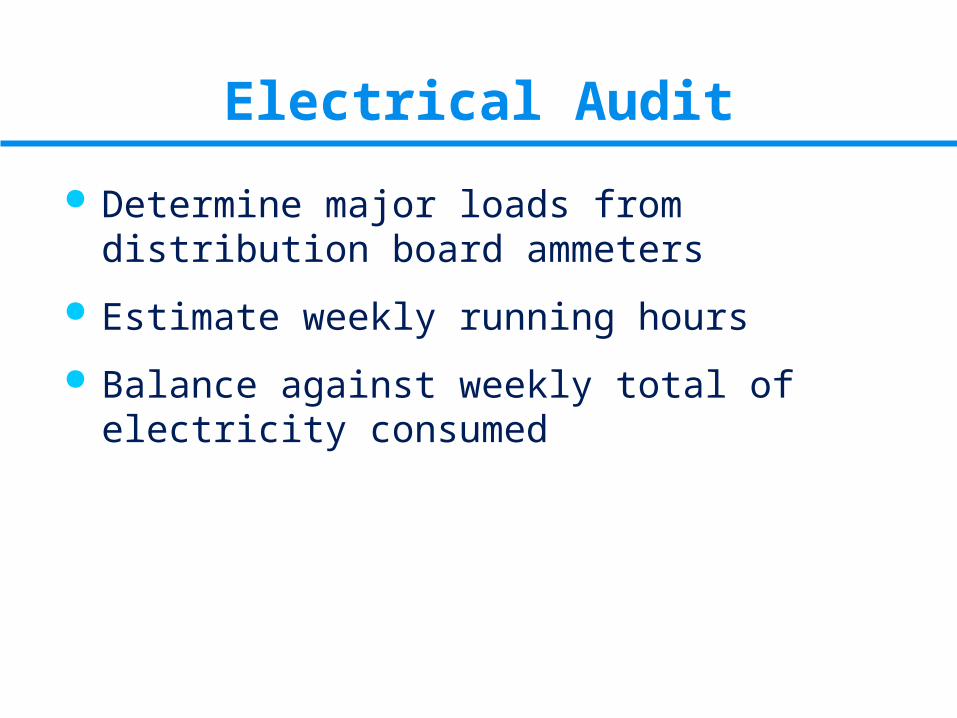
Electrical Audit
Determine major loads from distribution board ammeters
Estimate weekly running hours
Balance against weekly total of electricity consumed
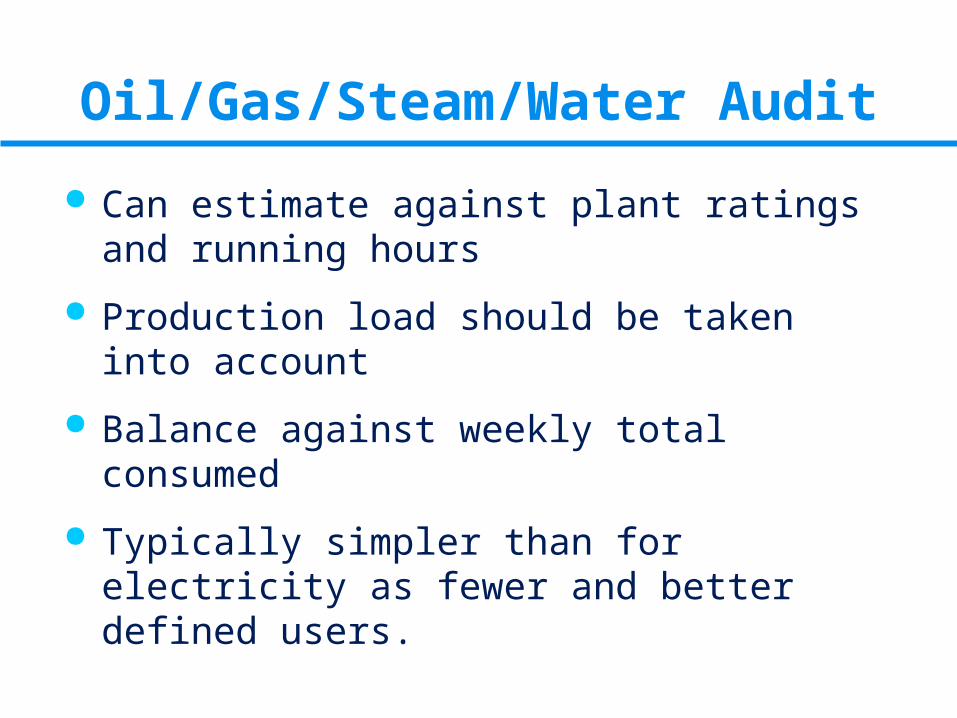
Oil/Gas/Steam/Water Audit
Can estimate against plant ratings and running hours
Production load should be taken into account
Balance against weekly total consumed
Typically simpler than for electricity as fewer and better defined users.
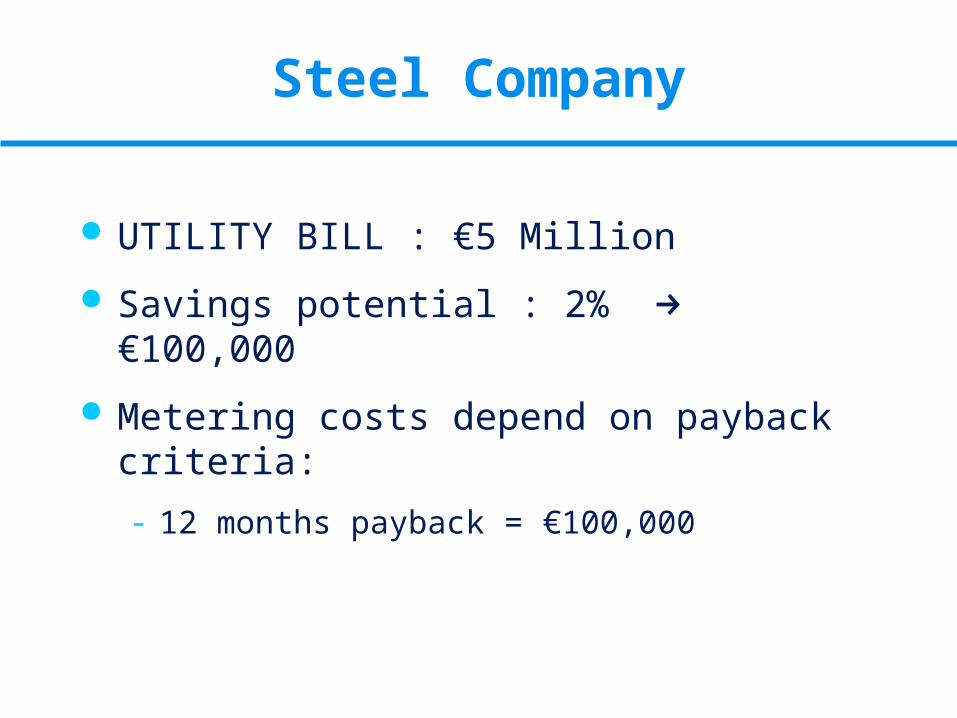
Steel Company
UTILITY BILL : €5 Million
Savings potential : 2% €100,000
Metering costs depend on payback criteria:
- 12 months payback = €100,000
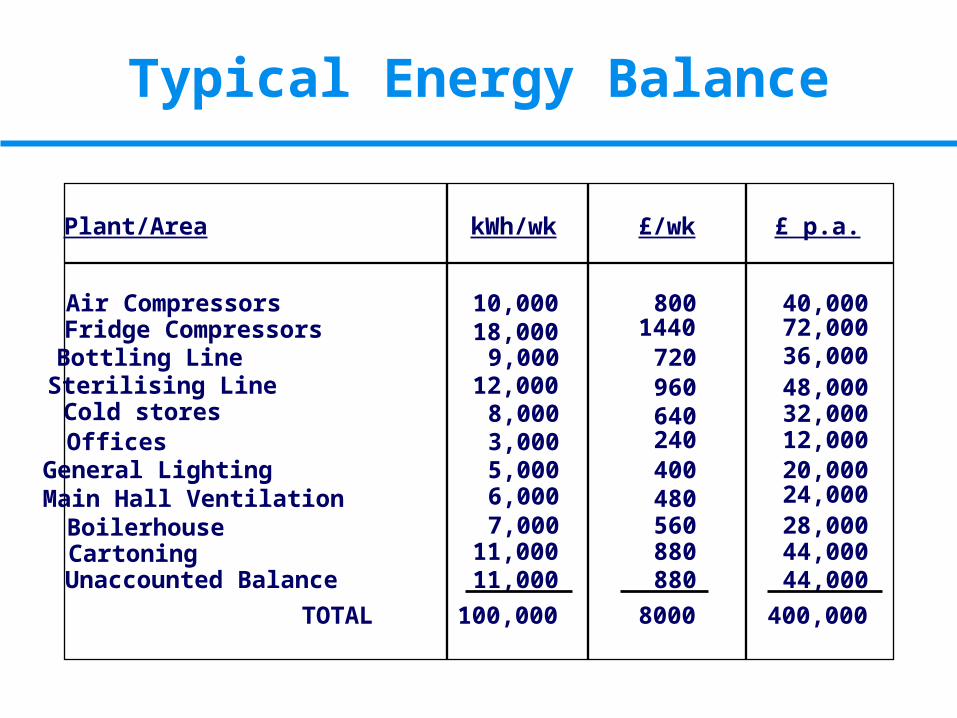
Air CompressorsFridge CompressorsBottling LineSterilising LineCold storesOfficesGeneral LightingMain Hall VentilationBoilerhouseCartoning
Plant/Area kWh/wk £/wk £ p.a.
10,00018,000
9,00012,000
8,0003,0005,0006,0007,000
11,000
8001440
720960640240400480560880
40,00072,00036,00048,00032,00012,00020,00024,00028,00044,000
Unaccounted Balance 11,000 880 44,000
TOTAL 100,000 8000 400,000
Typical Energy Balance
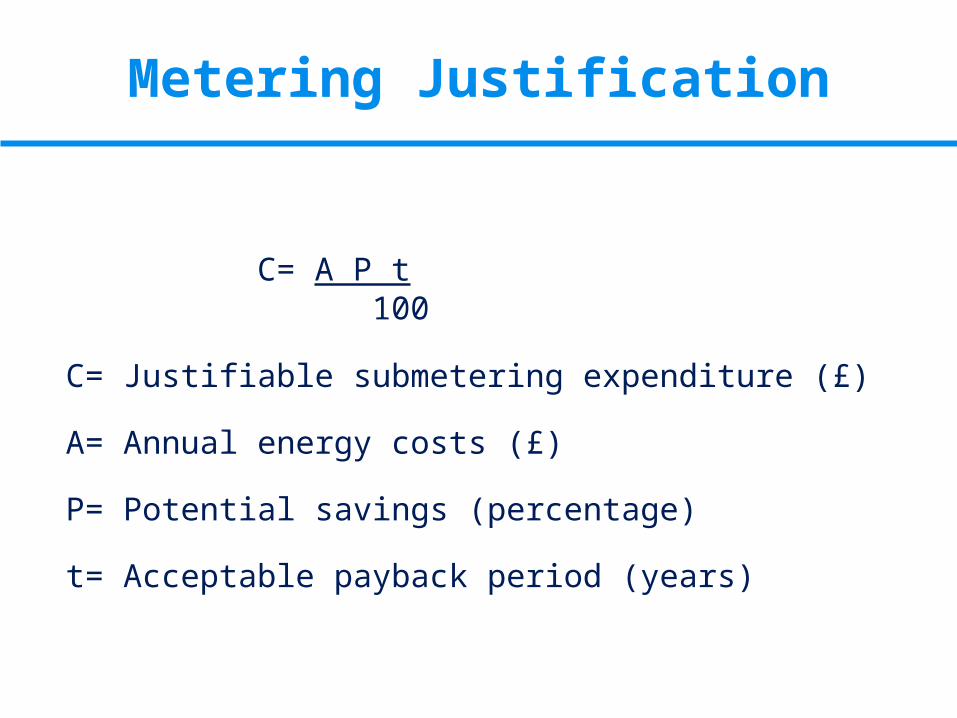
C= A P t 100
C= Justifiable submetering expenditure (£)
A= Annual energy costs (£)
P= Potential savings (percentage)
t= Acceptable payback period (years)
Metering Justification
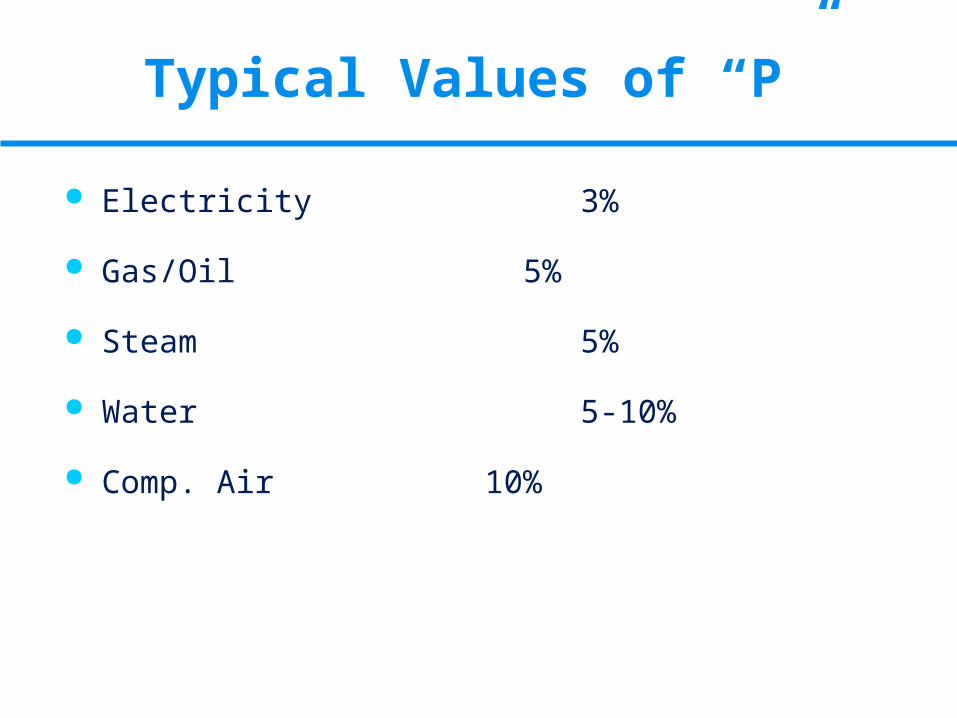
Electricity 3%
Gas/Oil 5%
Steam 5%
Water 5-10%
Comp. Air 10%
Typical Values of “P”
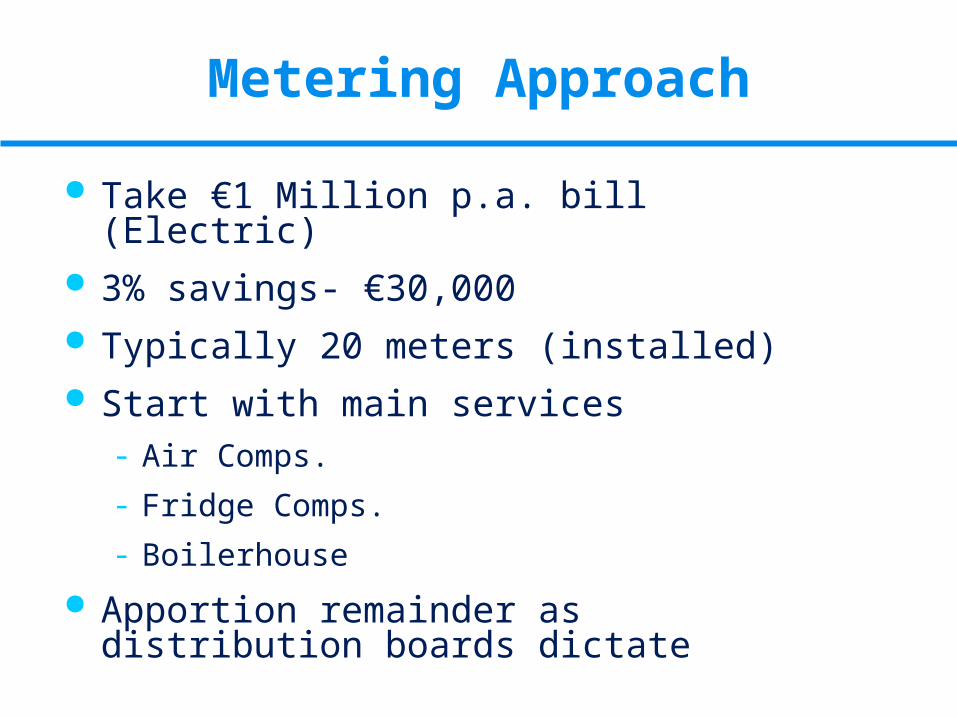
Take €1 Million p.a. bill (Electric) 3% savings- €30,000 Typically 20 meters (installed) Start with main services
- Air Comps.
- Fridge Comps.
- Boilerhouse
Apportion remainder as distribution boards dictate
Metering Approach
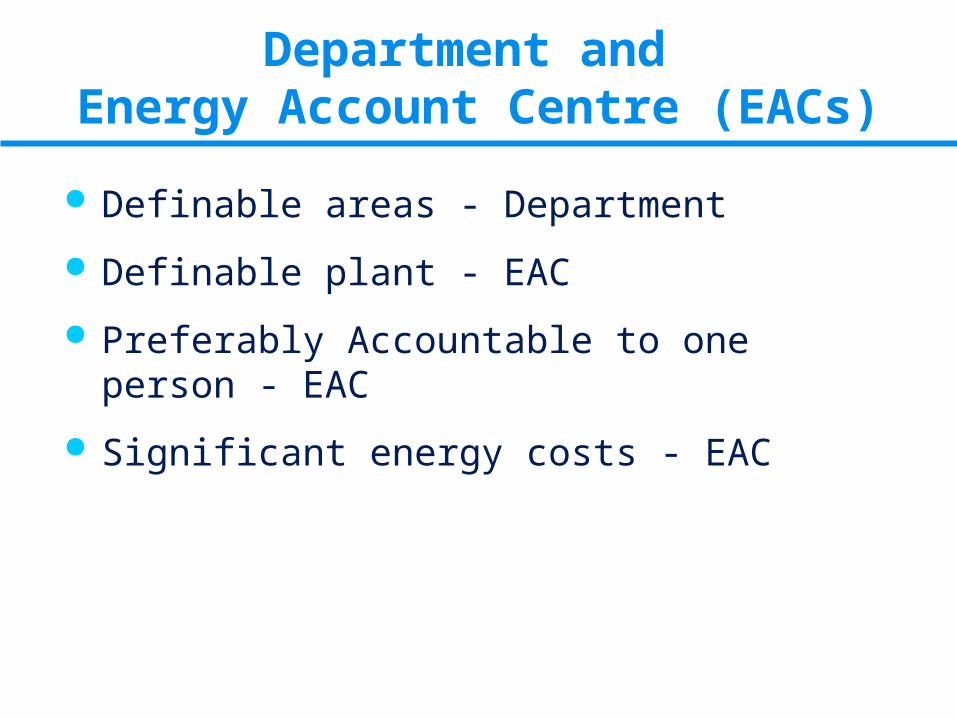
Definable areas - Department
Definable plant - EAC
Preferably Accountable to one person - EAC
Significant energy costs - EAC
Department and Energy Account Centre (EACs)

Metering
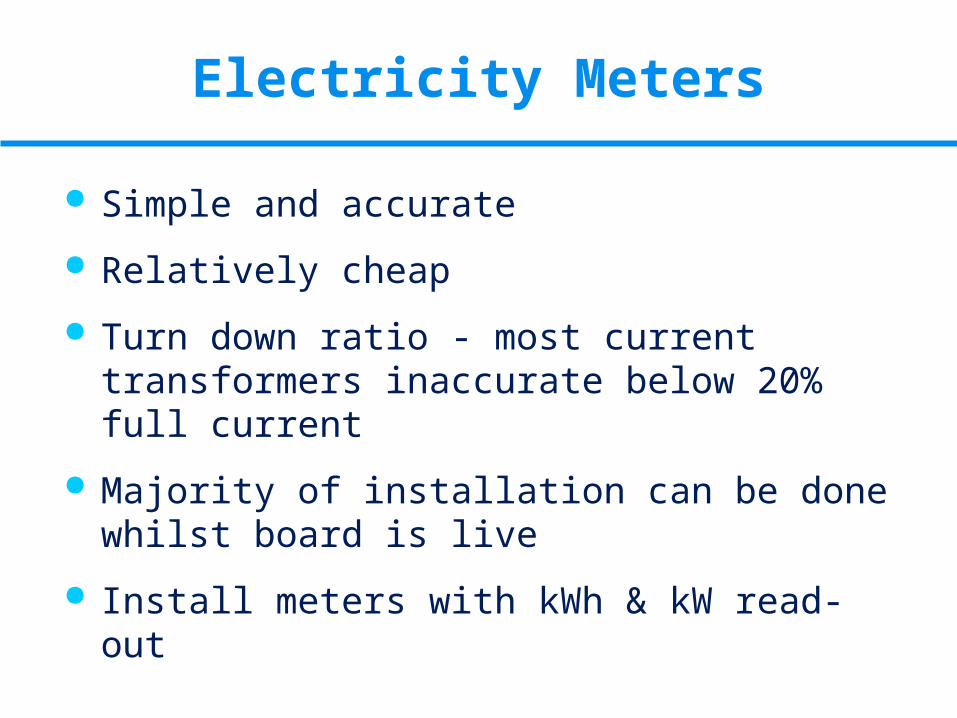
Simple and accurate
Relatively cheap
Turn down ratio - most current transformers inaccurate below 20% full current
Majority of installation can be done whilst board is live
Install meters with kWh & kW read-out
Electricity Meters

Different Types
Different Fluids
Accuracy Considerations
Installation Considerations
Flow Meters
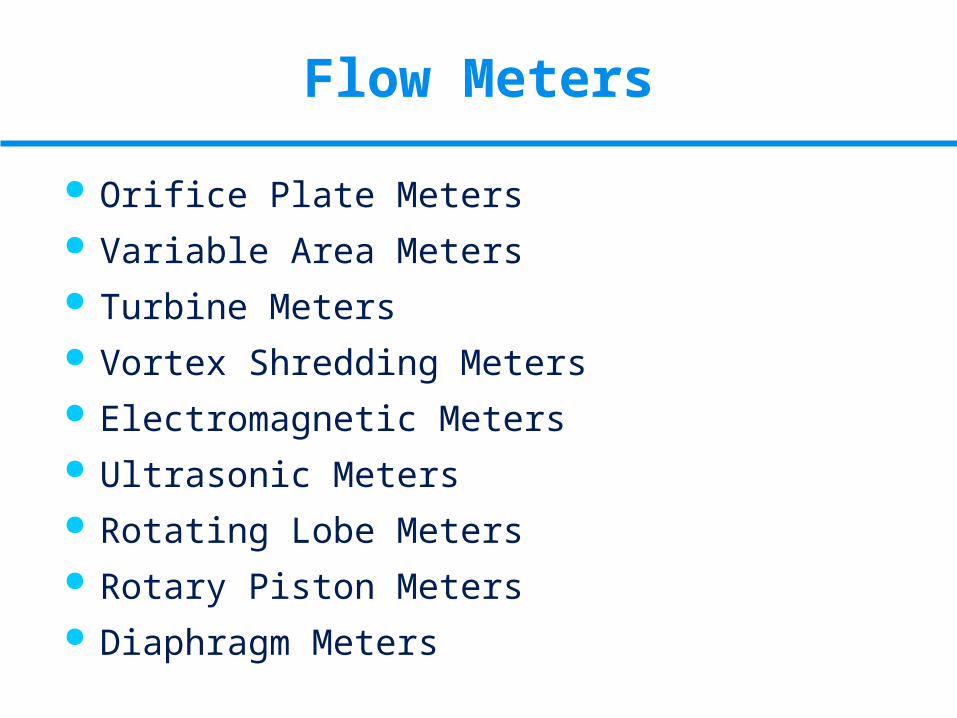
Orifice Plate Meters Variable Area Meters Turbine Meters Vortex Shredding Meters Electromagnetic Meters Ultrasonic Meters Rotating Lobe Meters Rotary Piston Meters Diaphragm Meters
Flow Meters

Suitable meters include:
- turbine
- diaphragm
- rotating lobe
Temperature and pressure compensation needed, ideally automatic for larger users
Fairly accurate +/-1%
Typical costs:
25mm 50mm 80mm
Turbine - €1,800 €2,700
Diaphragm €300 €1,200 -
Gas Meters

Suitable meter types include:
- Orifice plate
- Variable area
- Vortex shedding
- Rotary shunt
Relatively expensive
Accurate sizing very important
Temperature and Pressure correction essential
High on maintenance costs
Adequate removal of condensate to stop water hammer is essential
Steam Meters
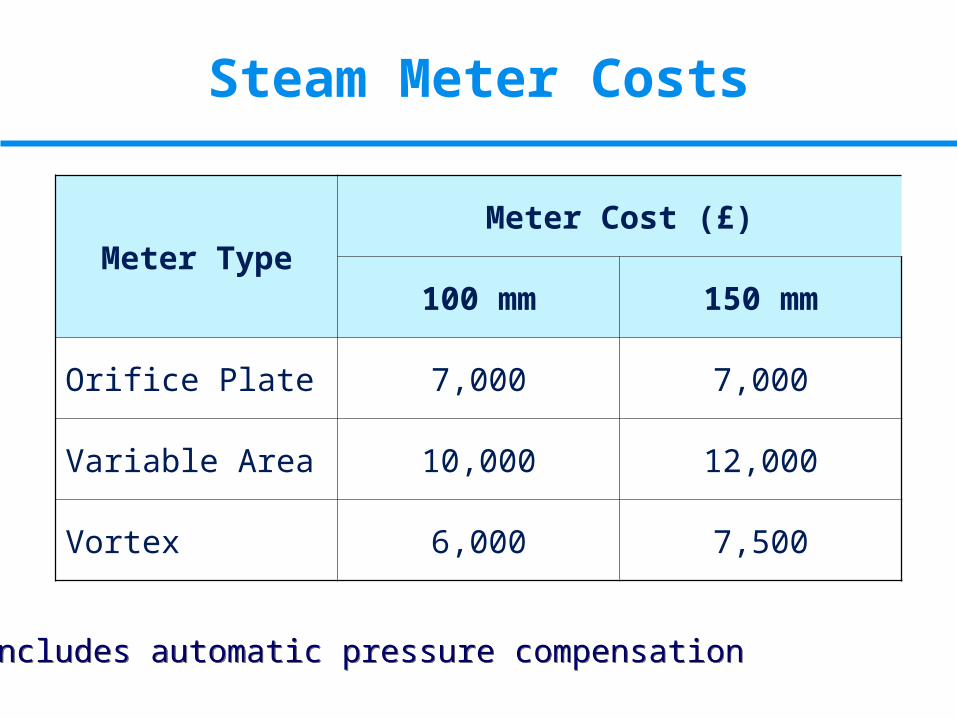
Steam Meter Costs
Meter TypeMeter Cost (£)
100 mm 150 mm
Orifice Plate 7,000 7,000
Variable Area 10,000 12,000
Vortex 6,000 7,500
Includes automatic pressure compensationIncludes automatic pressure compensation

Suitable meters include:- Rotary piston
- Turbine
- Vortex shedding
- Ultrasonic
- Electromagnetic
Standard meters accept 40oC Relatively cheap if use positive displacement meters Critical for control of steam usage in some cases Check flow rates accurately and reduce pipe diameter if
possible
Water Meters
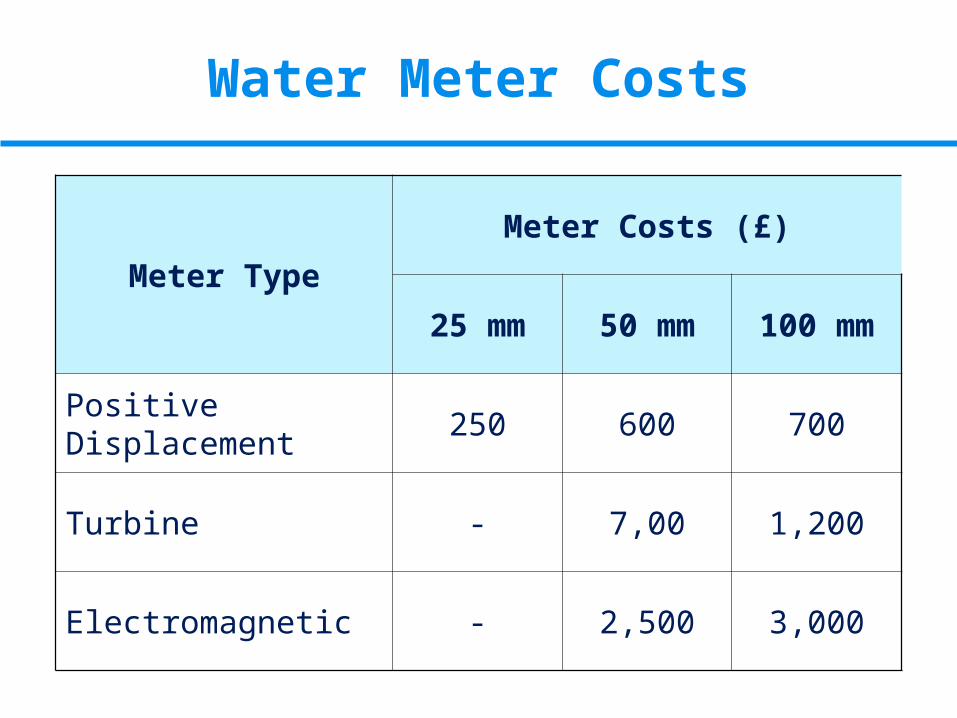
Water Meter Costs
Meter Type
Meter Costs (£)
25 mm 50 mm 100 mm
Positive Displacement 250 600 700
Turbine - 7,00 1,200
Electromagnetic - 2,500 3,000
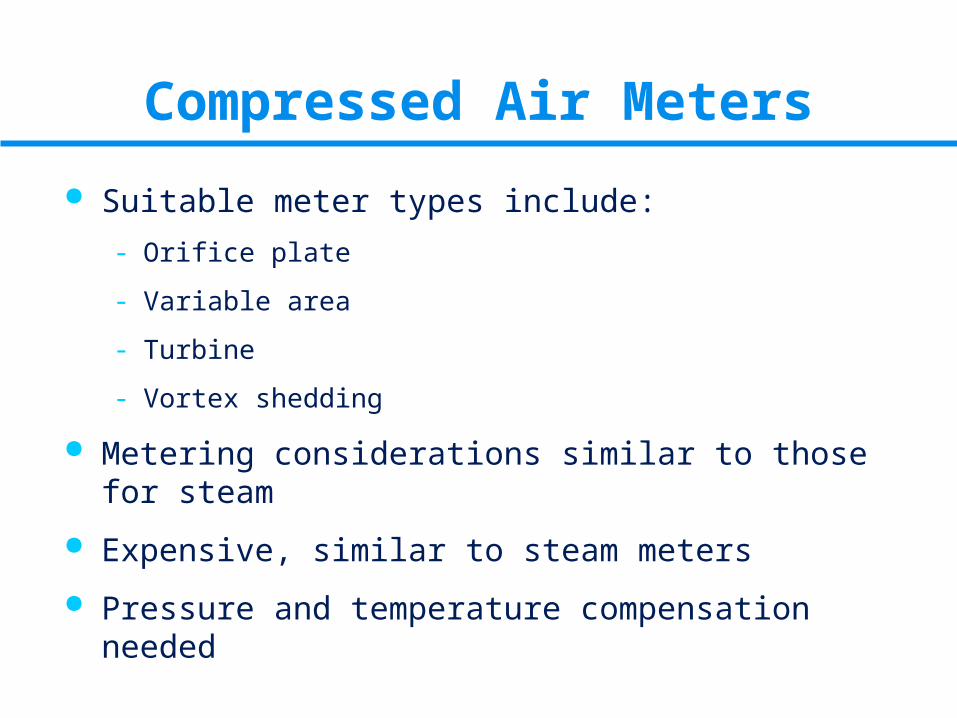
Compressed Air Meters
Suitable meter types include:
- Orifice plate
- Variable area
- Turbine
- Vortex shedding
Metering considerations similar to those for steam
Expensive, similar to steam meters
Pressure and temperature compensation needed
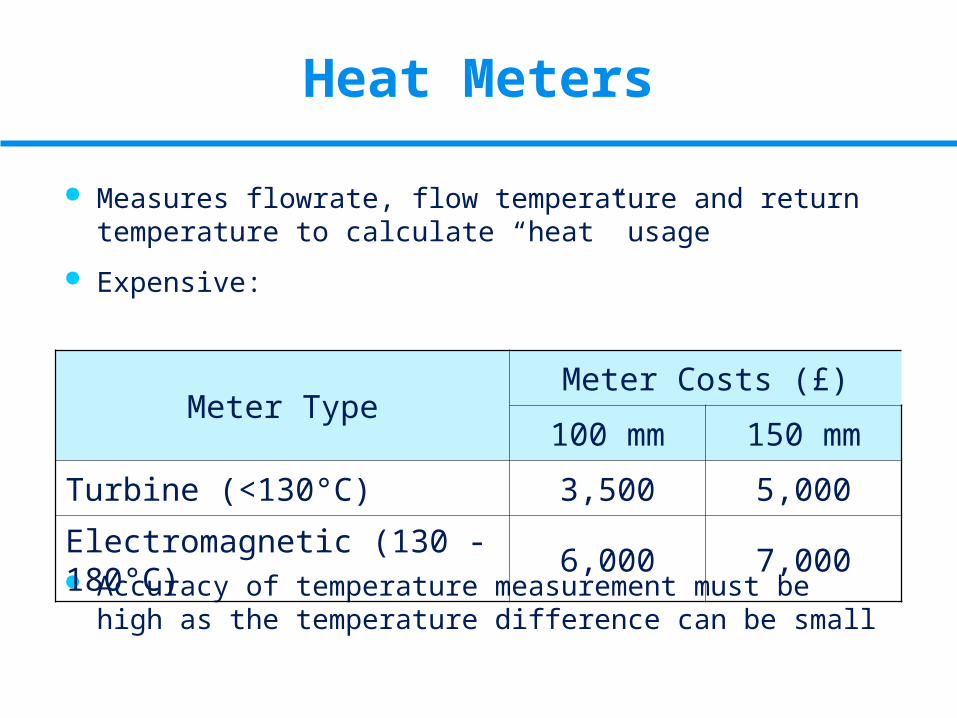
Measures flowrate, flow temperature and return temperature to calculate “heat” usage
Expensive:
Accuracy of temperature measurement must be high as the temperature difference can be small
Heat Meters
Meter TypeMeter Costs (£)
100 mm 150 mm
Turbine (<130°C) 3,500 5,000
Electromagnetic (130 -180°C) 6,000 7,000
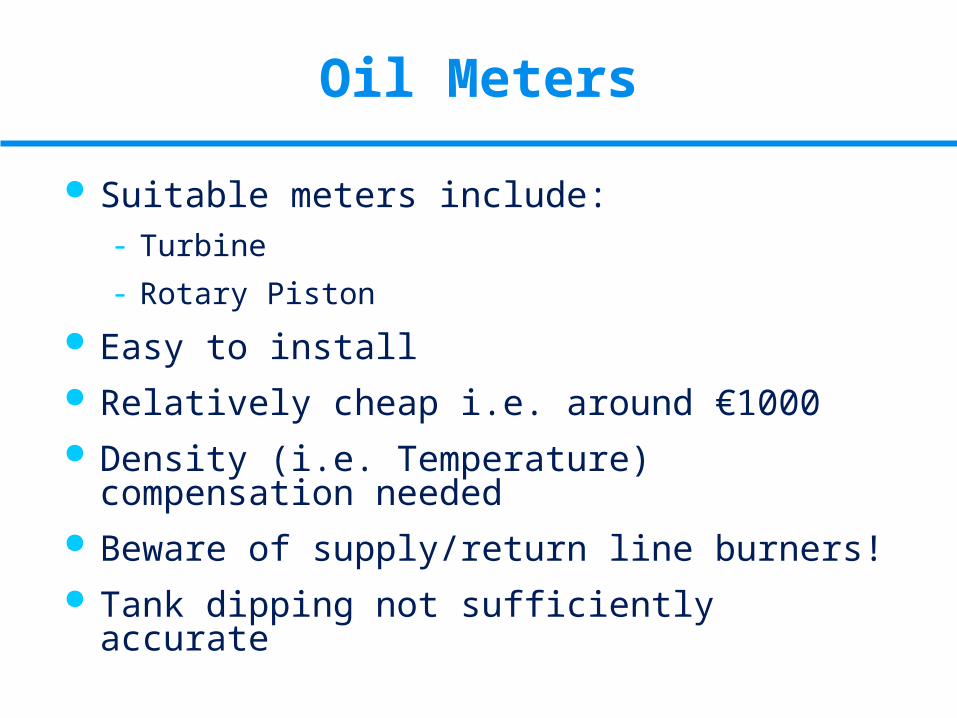
Suitable meters include:- Turbine
- Rotary Piston
Easy to install Relatively cheap i.e. around €1000 Density (i.e. Temperature) compensation
needed Beware of supply/return line burners! Tank dipping not sufficiently accurate
Oil Meters
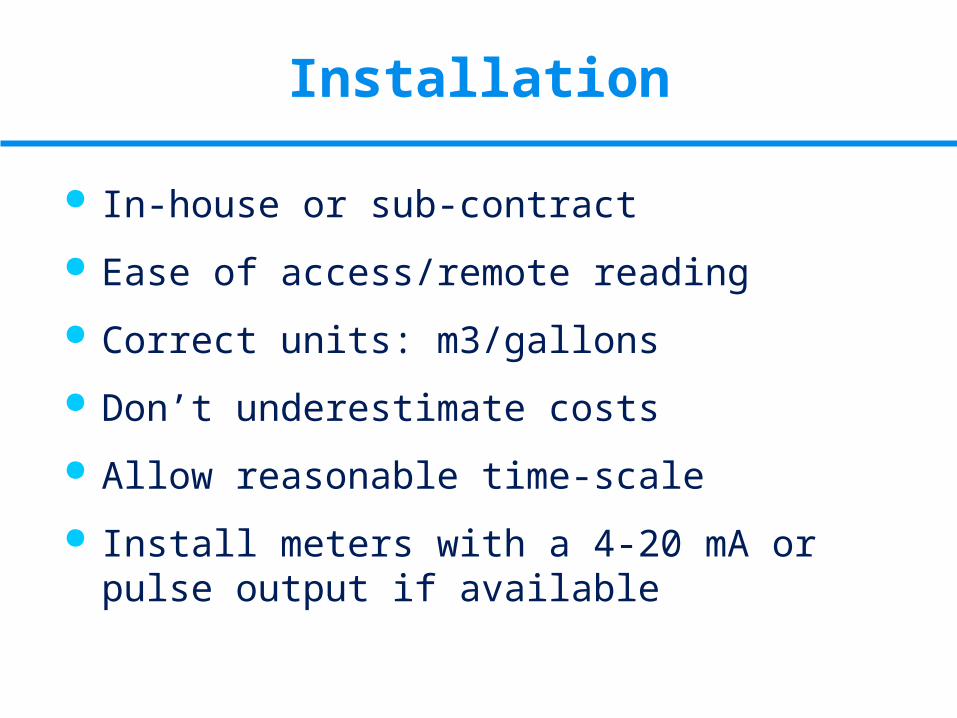
In-house or sub-contract
Ease of access/remote reading
Correct units: m3/gallons
Don’t underestimate costs
Allow reasonable time-scale
Install meters with a 4-20 mA or pulse output if available
Installation

Data Collection
All Meter readings
Production Data
Ambient Temperature Data (degree days)
Auxiliary Data
Data Collection
Monthly
Weekly
Daily
Each shift
Each batch
Meter Reading Frequency

Manual
Hand held data logger
Totally automatic
Data Collection Methods
Allow 1 minute/meter
Ensure meters read at same time each week
Ensure at least 2 people know location of all meters
Produce meter reading form to reduce errors
Manual / Portable Data Logger

Worthwhile for larger users
Allow at least double meter costs for automatic data collection
Cannot be justified on cost savings alone, must have additional benefits such as process control
Can lead to data saturation
Automatic Data Logger
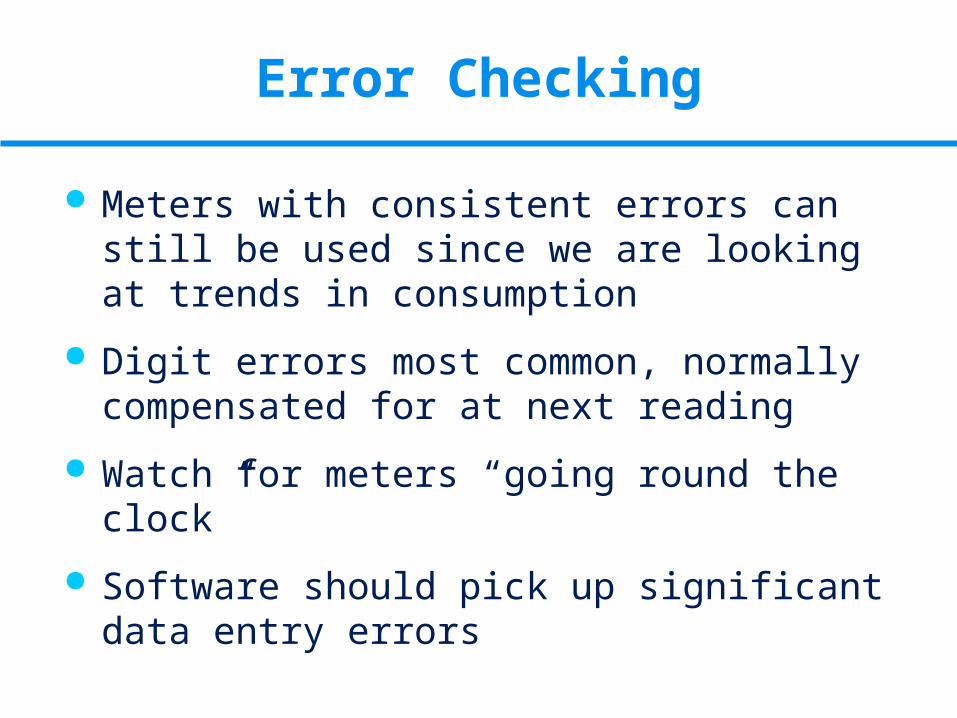
Meters with consistent errors can still be used since we are looking at trends in consumption
Digit errors most common, normally compensated for at next reading
Watch for meters “going round the clock”
Software should pick up significant data entry errors
Error Checking
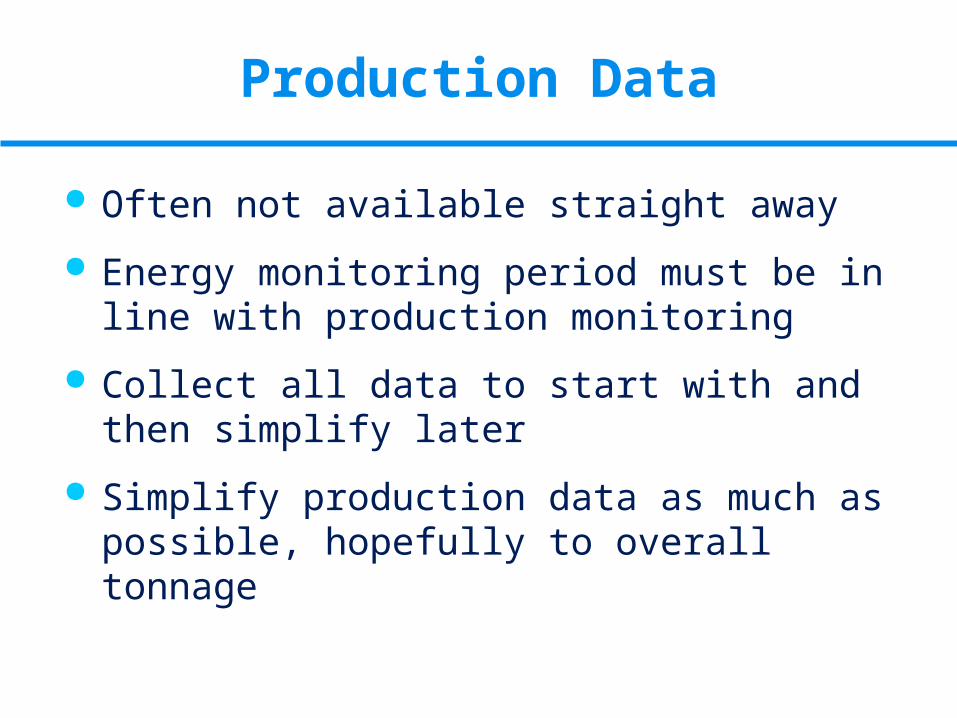
Often not available straight away
Energy monitoring period must be in line with production monitoring
Collect all data to start with and then simplify later
Simplify production data as much as possible, hopefully to overall tonnage
Production Data
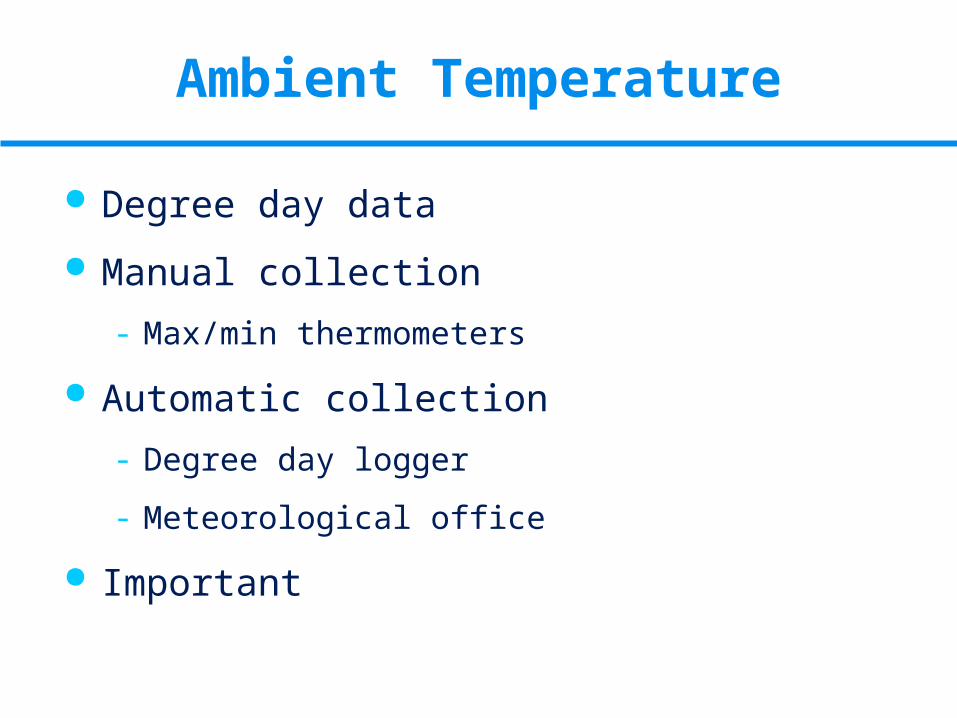
Degree day data
Manual collection
- Max/min thermometers
Automatic collection
- Degree day logger
- Meteorological office
Important
Ambient Temperature
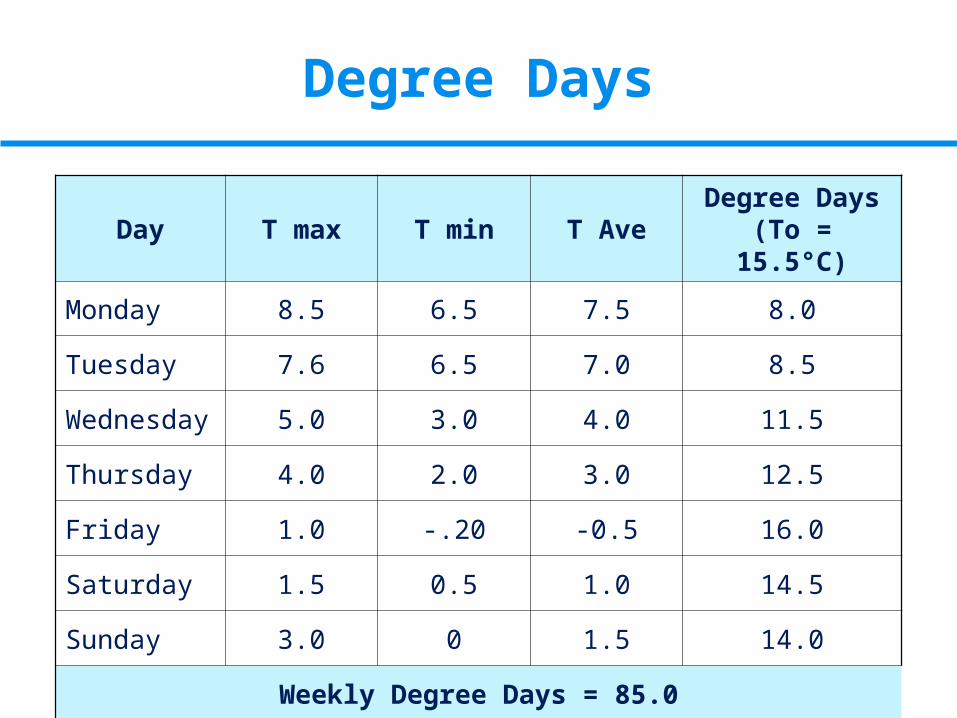
Degree Days
Day T max T min T AveDegree Days (To = 15.5°C)
Monday 8.5 6.5 7.5 8.0
Tuesday 7.6 6.5 7.0 8.5
Wednesday 5.0 3.0 4.0 11.5
Thursday 4.0 2.0 3.0 12.5
Friday 1.0 -.20 -0.5 16.0
Saturday 1.5 0.5 1.0 14.5
Sunday 3.0 0 1.5 14.0
Weekly Degree Days = 85.0
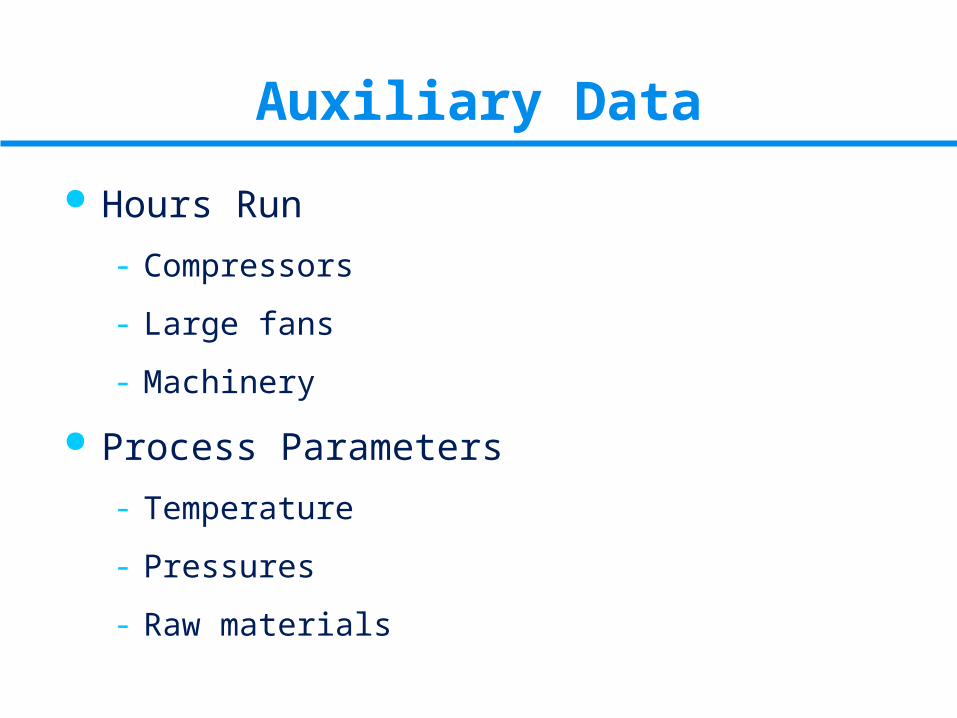
Auxiliary Data
Hours Run
- Compressors
- Large fans
- Machinery
Process Parameters
- Temperature
- Pressures
- Raw materials
Setting Targets
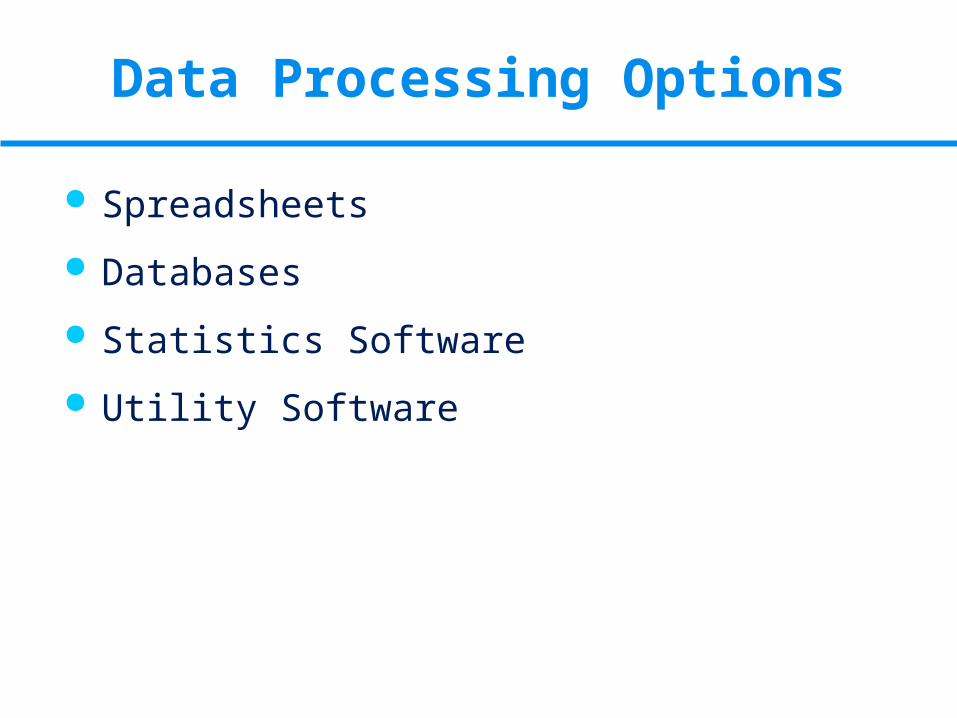
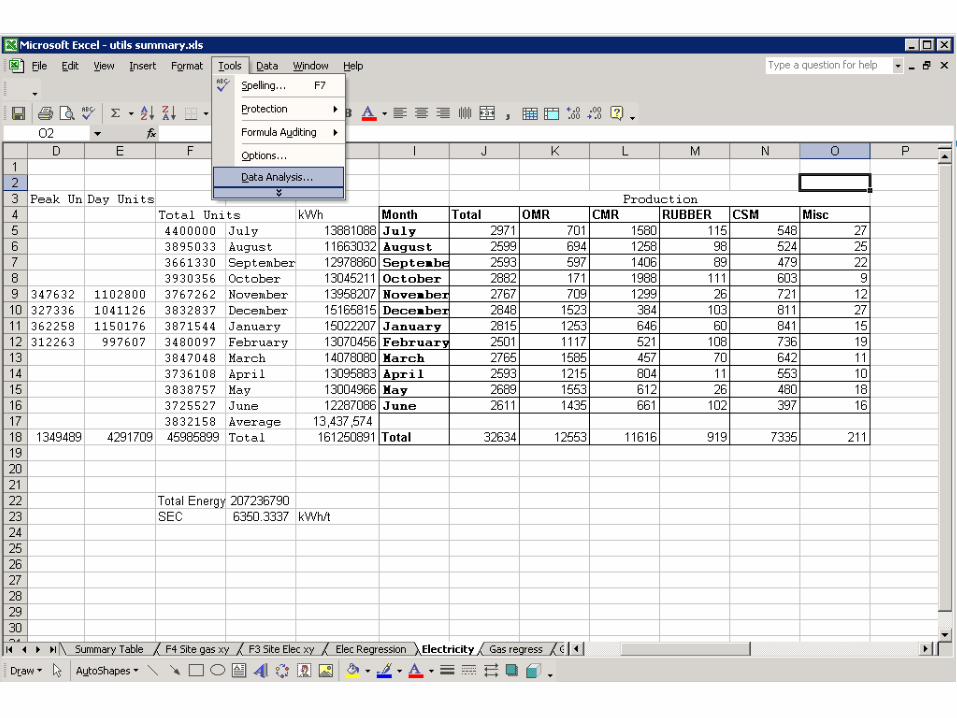
Data Processing Options
Spreadsheets
Databases
Statistics Software
Utility Software
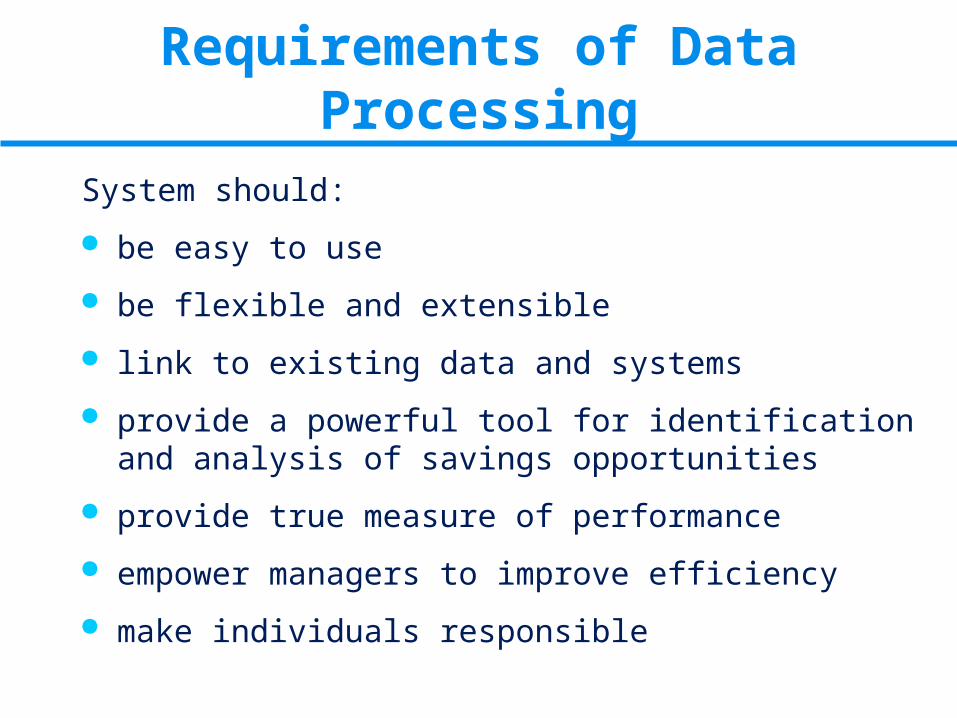
Requirements of Data Processing
System should:
be easy to use
be flexible and extensible
link to existing data and systems
provide a powerful tool for identification and analysis of savings opportunities
provide true measure of performance
empower managers to improve efficiency
make individuals responsible
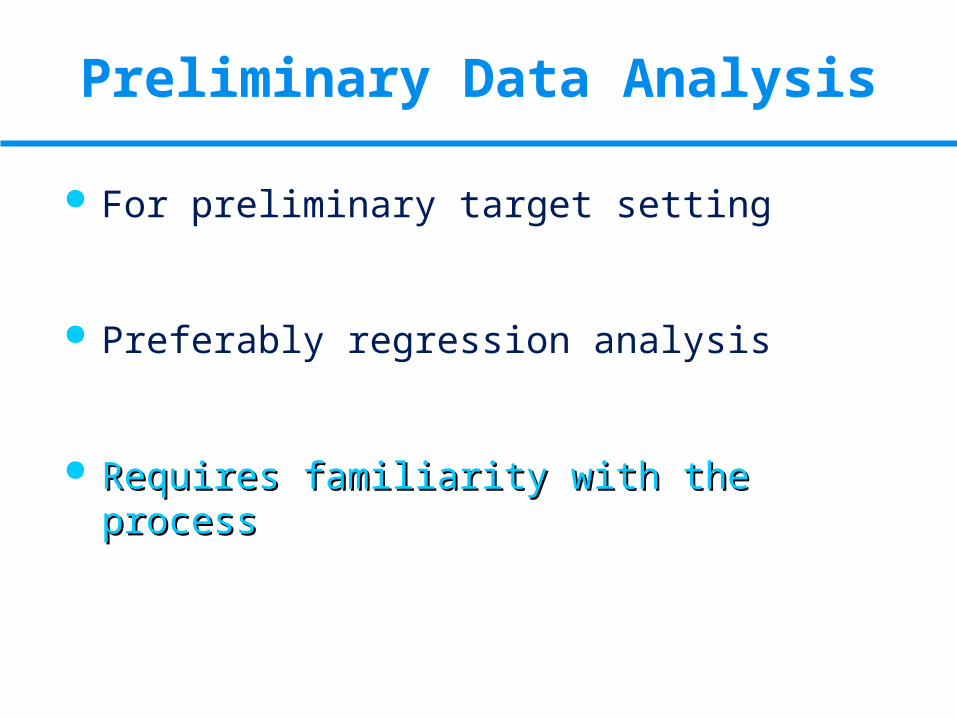
Preliminary Data Analysis
For preliminary target setting
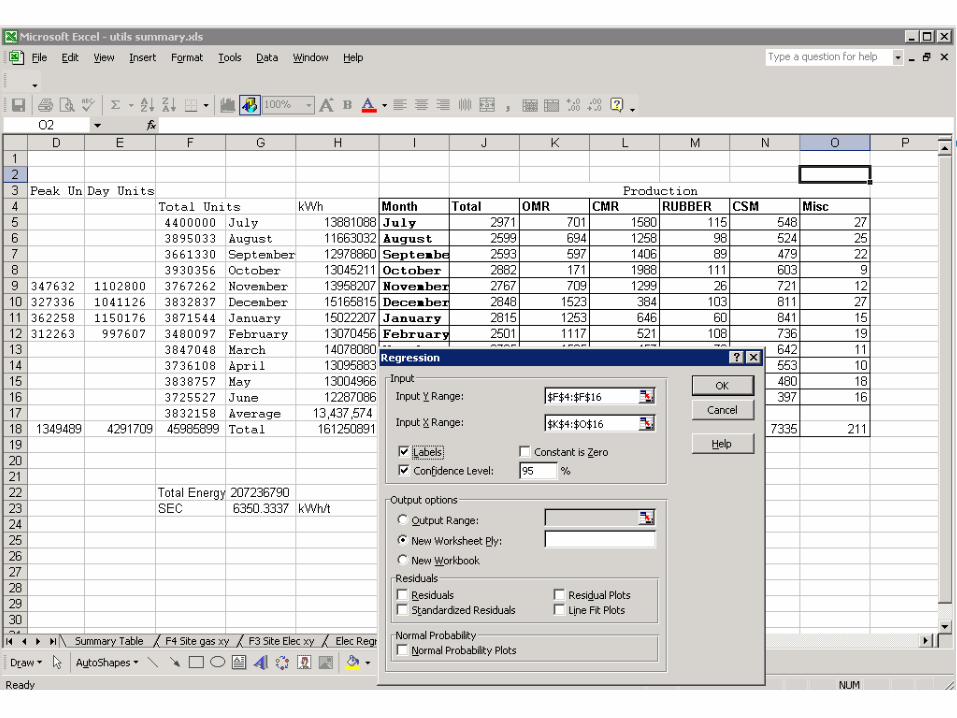
Preferably regression analysis
Requires familiarity with the processRequires familiarity with the process
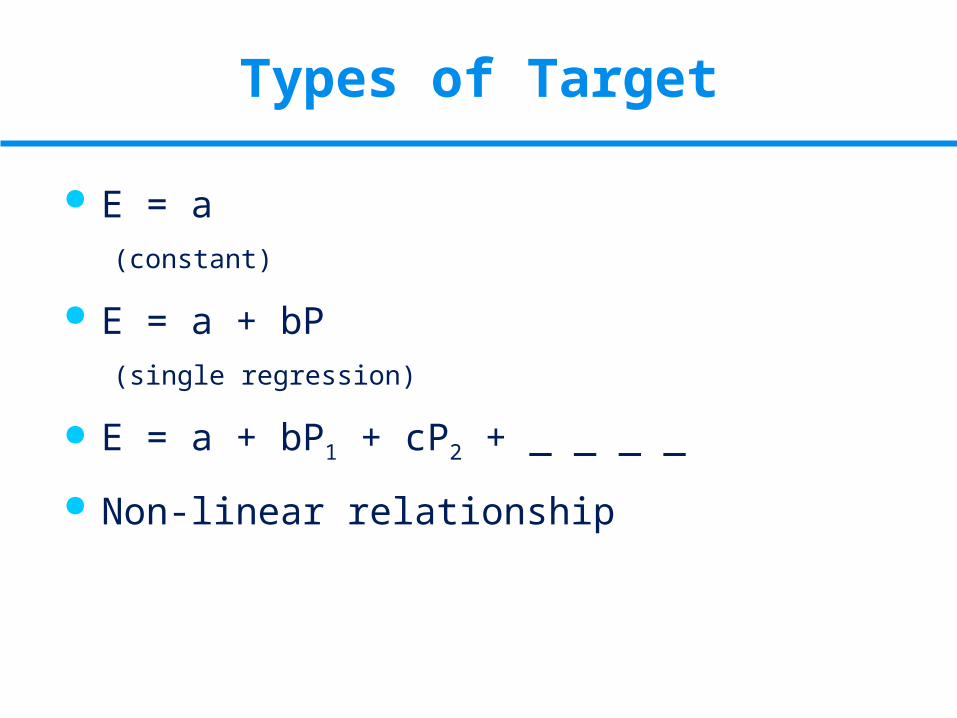
Types of Target
E = a(constant)
E = a + bP(single regression)
E = a + bP1 + cP2 + _ _ _ _
Non-linear relationship
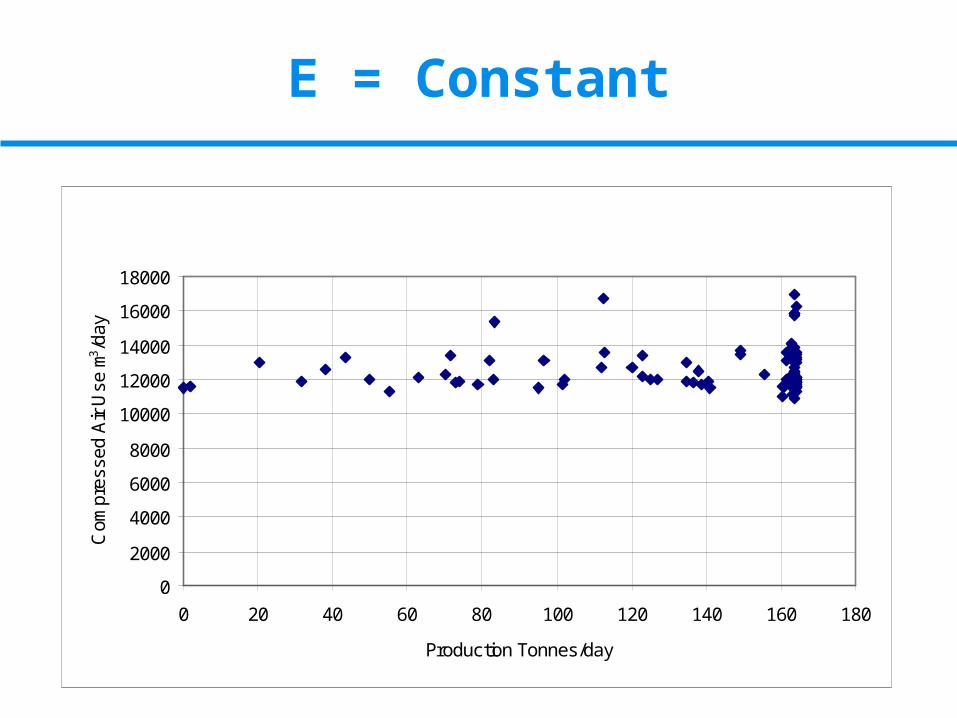
E = Constant
0
2000
4000
6000
8000
10000
12000
14000
16000
18000
0 20 40 60 80 100 120 140 160 180
Production Tonnes/day
Com
pres
sed
Air
Use
m3/d
ay
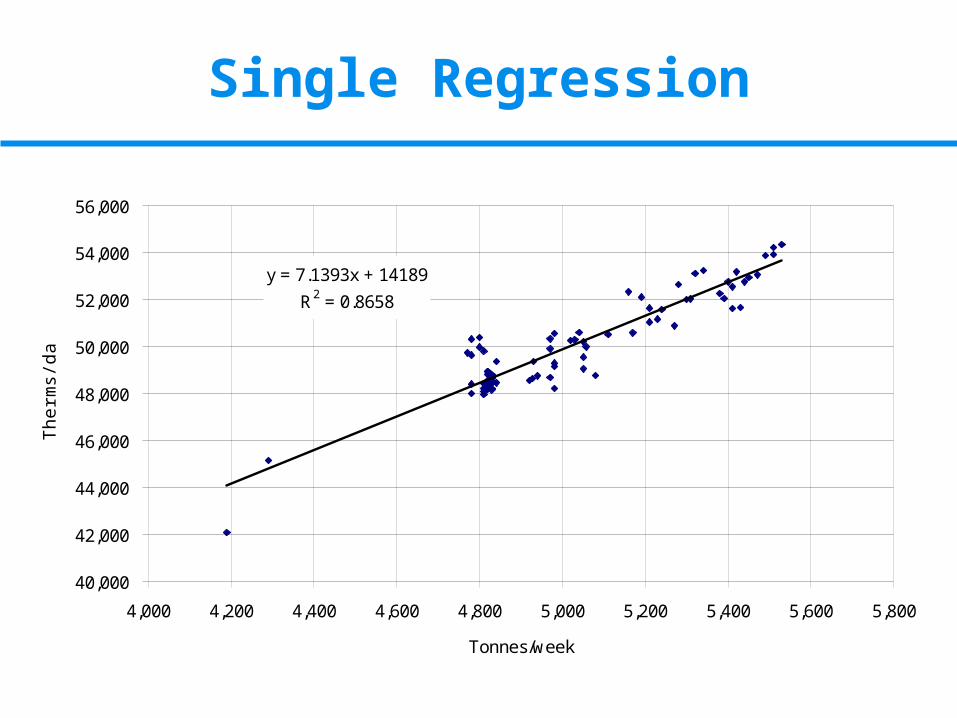
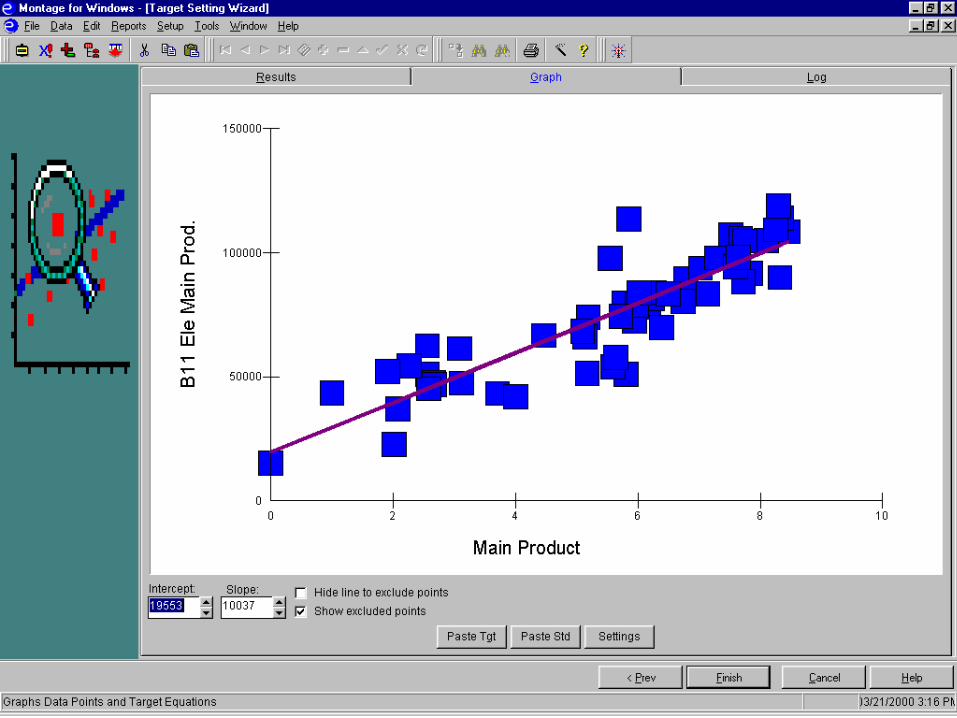
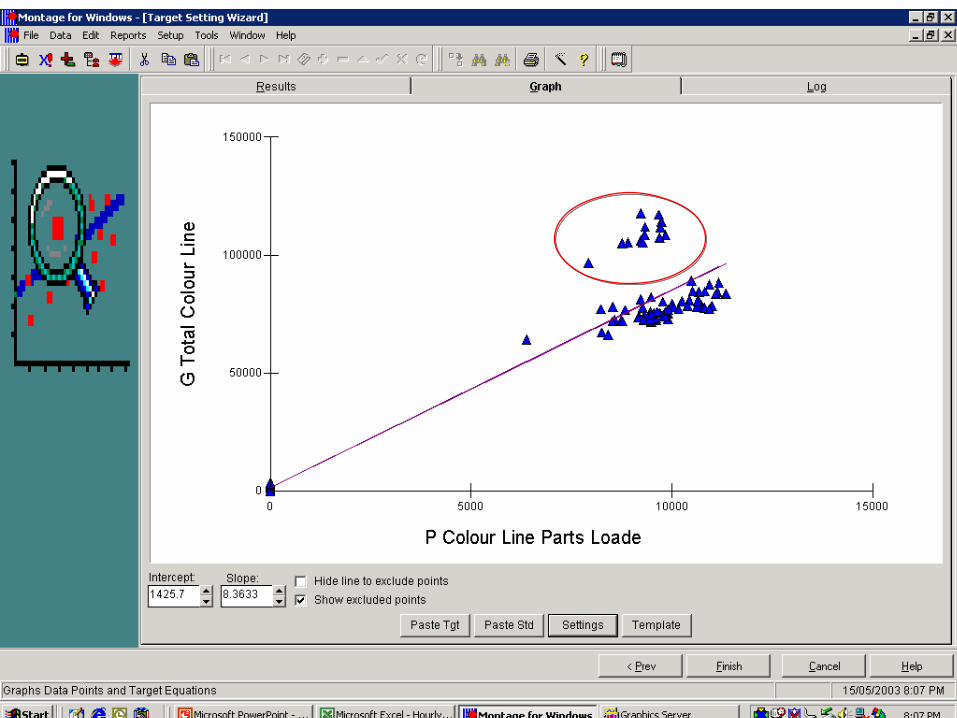
Single Regression
y = 7.1393x + 14189
R2 = 0.8658
40,000
42,000
44,000
46,000
48,000
50,000
52,000
54,000
56,000
4,000 4,200 4,400 4,600 4,800 5,000 5,200 5,400 5,600 5,800
Tonnes/week
Th
erm
s/d
ay

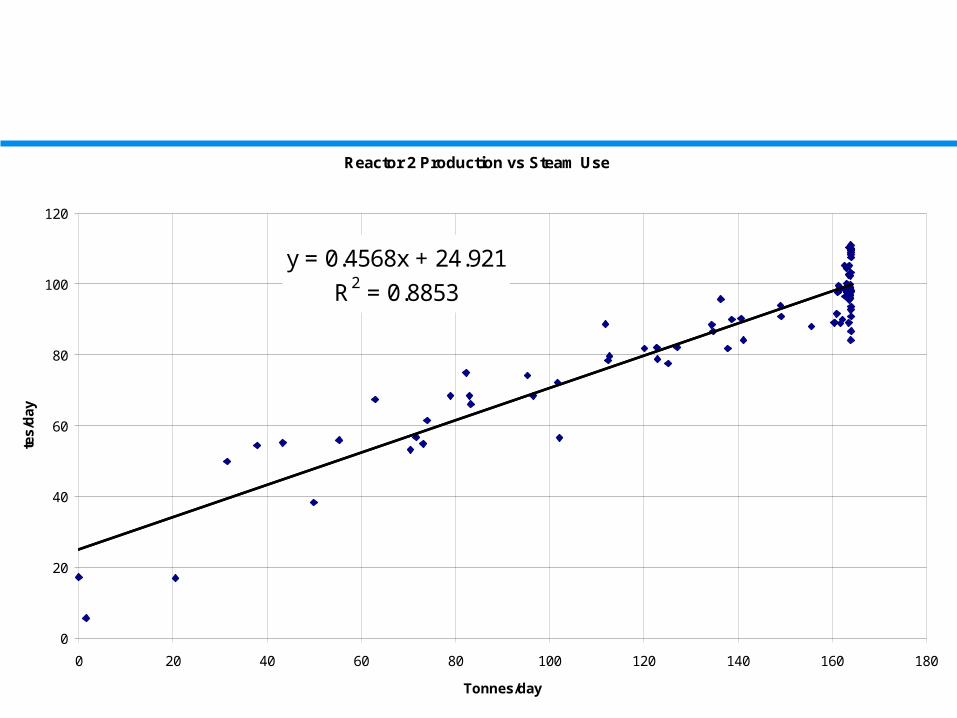
Reactor 2 Production vs Steam Use
y = 0.4568x + 24.921
R2 = 0.8853
0
20
40
60
80
100
120
0 20 40 60 80 100 120 140 160 180
Tonnes/day
tes/
day
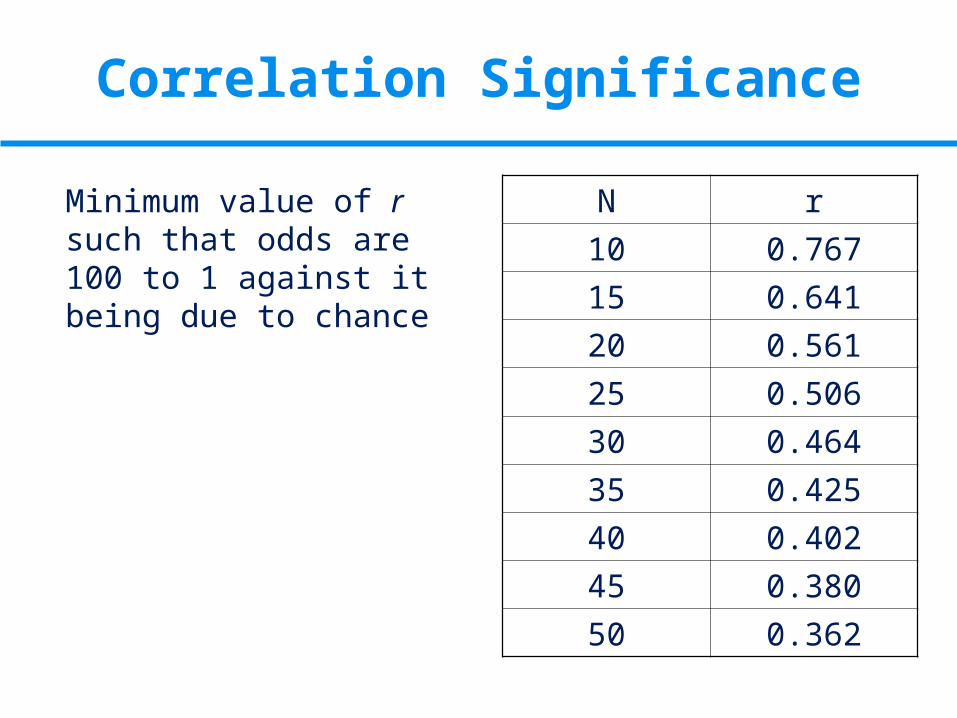
Correlation Significance
Minimum value of r such that odds are 100 to 1 against it being due to chance
N r
10 0.767
15 0.641
20 0.561
25 0.506
30 0.464
35 0.425
40 0.402
45 0.380
50 0.362
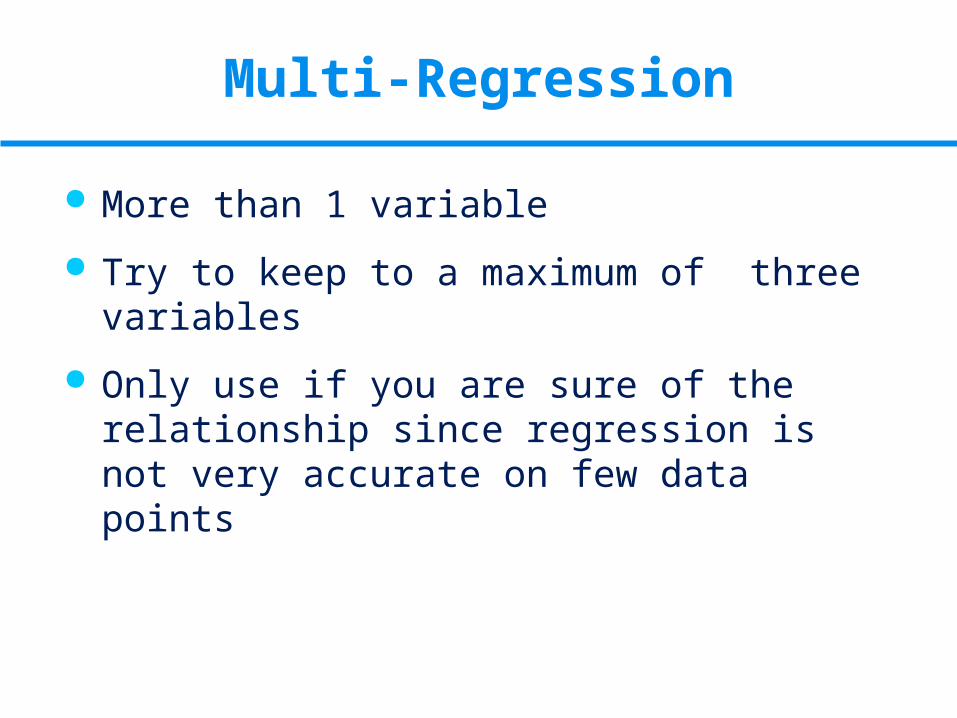
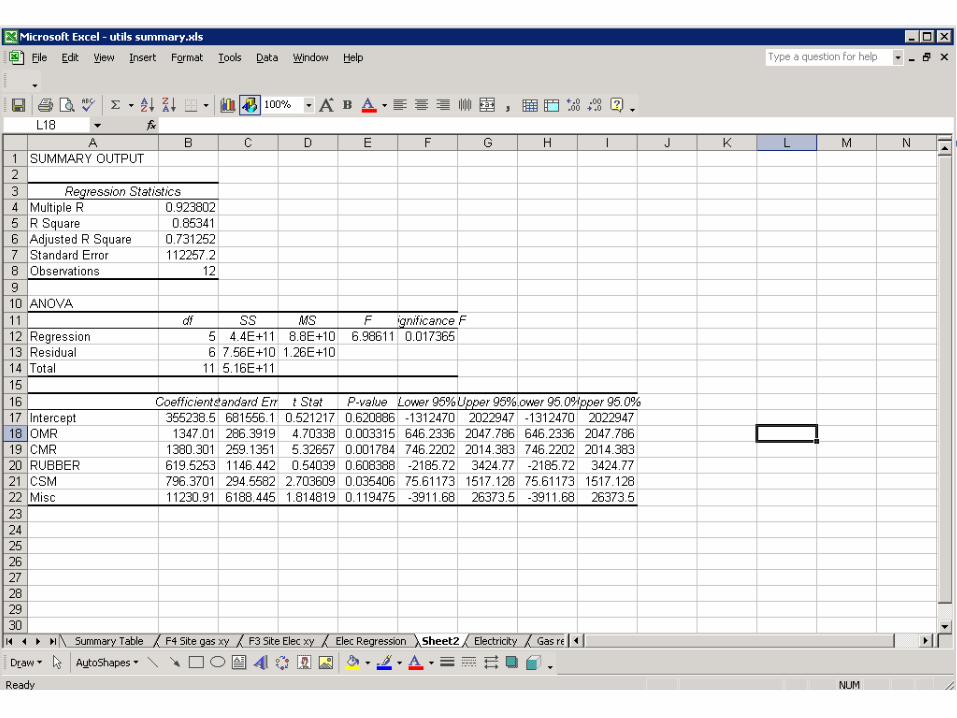
Multi-Regression
More than 1 variable
Try to keep to a maximum of three variables
Only use if you are sure of the relationship since regression is not very accurate on few data points
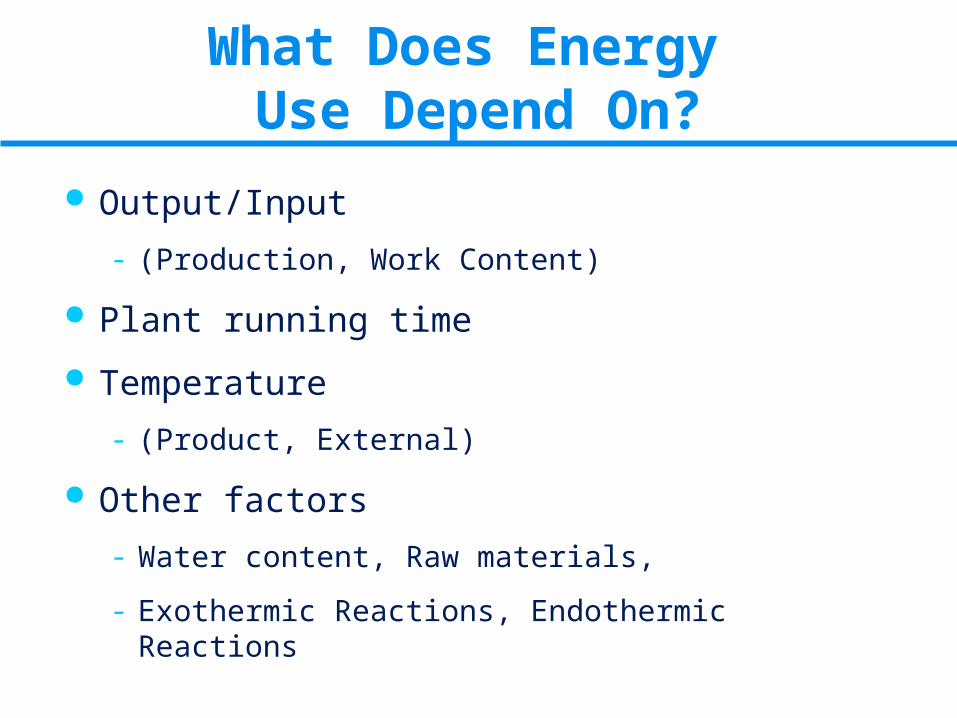
What Does Energy Use Depend On?
Output/Input
- (Production, Work Content)
Plant running time
Temperature
- (Product, External)
Other factors
- Water content, Raw materials,
- Exothermic Reactions, Endothermic Reactions
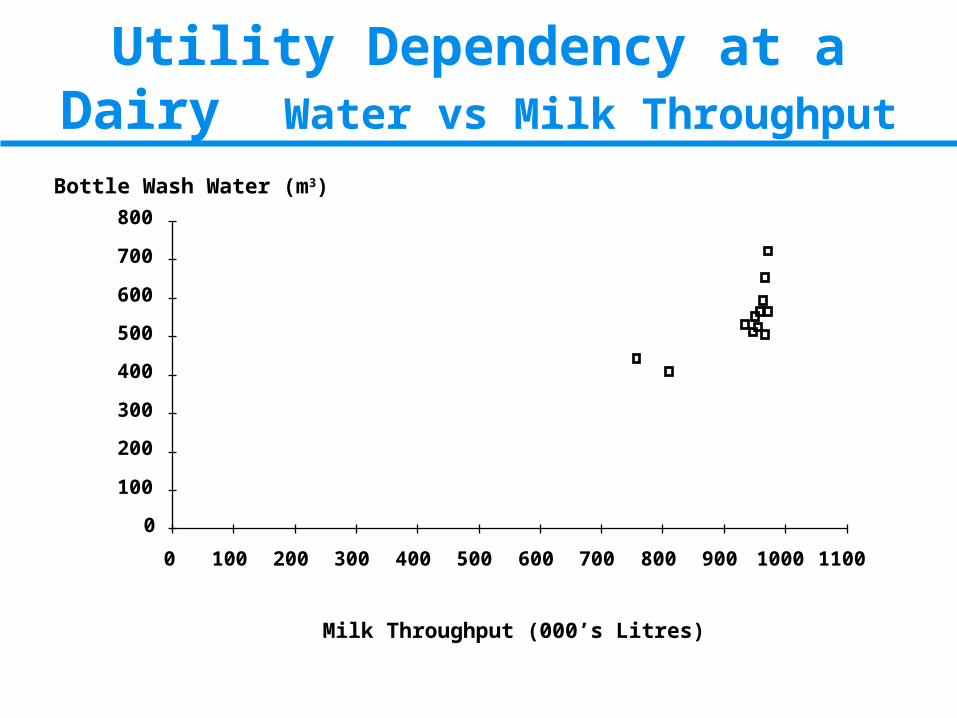
Utility Dependency at a Dairy Water vs Milk Throughput
0
100
200
300
400
500
600
700
800
0 100 200 300 400 500 600 700 800 900 1000 1100
Bottle Wash Water (m3)
Milk Throughput (000’s Litres)
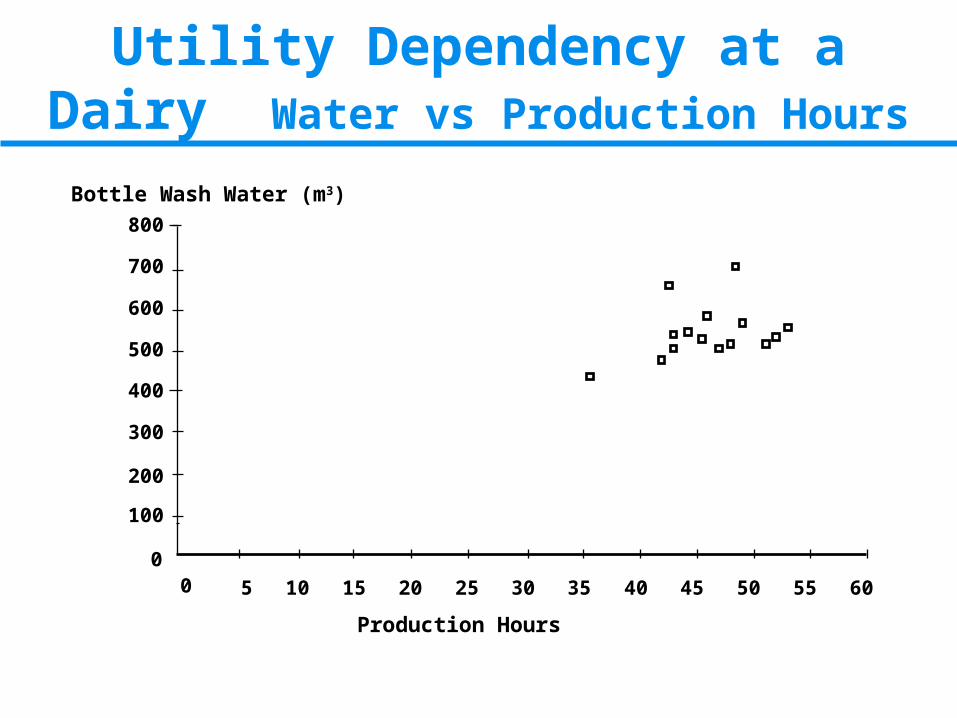
Utility Dependency at a Dairy Water vs Production Hours
0
100
200
300
400
500
600
700
800
0 5 10 15 20 25 30 35 40 45 50 55 60
Production Hours
Bottle Wash Water (m3)
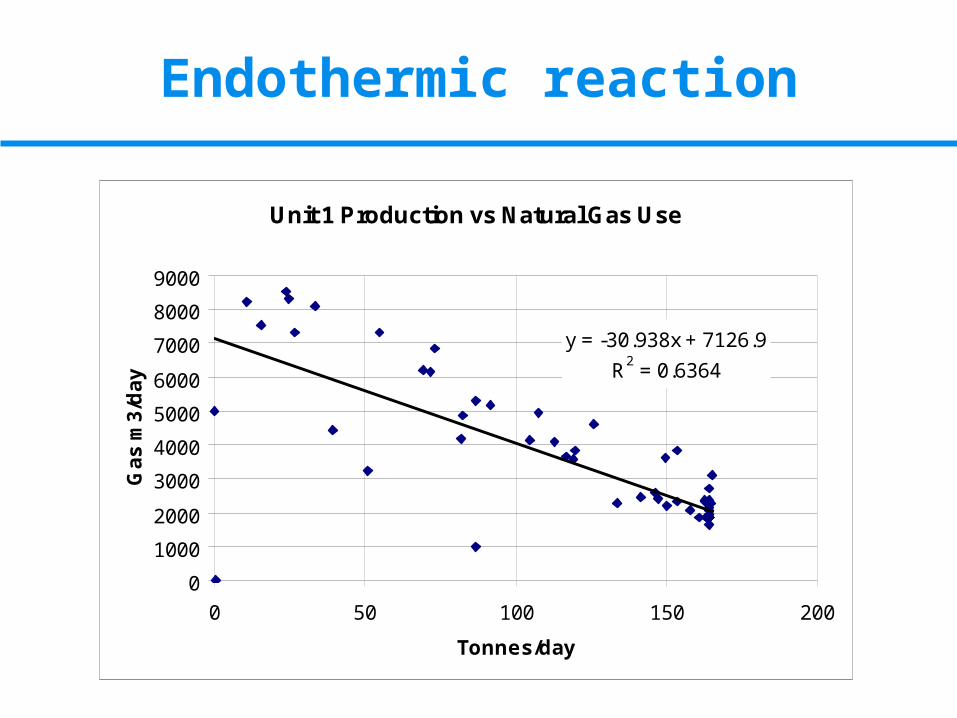
Endothermic reaction
Unit 1 Production vs Natural Gas Use
y = -30.938x + 7126.9
R2 = 0.6364
0
1000
2000
3000
4000
5000
6000
7000
8000
9000
0 50 100 150 200
Tonnes/day
Ga
s m
3/d
ay

Reporting and Sustaining the Programme
Need for Reporting
To keep people informed of their weekly
performance (against Key Performance
Indicators, regression targets)
To monitor long term progress
To create feedback on improvements made
To motivate people to improve
Reporting Frequency
Weekly
Monthly
Quarterly
Annually
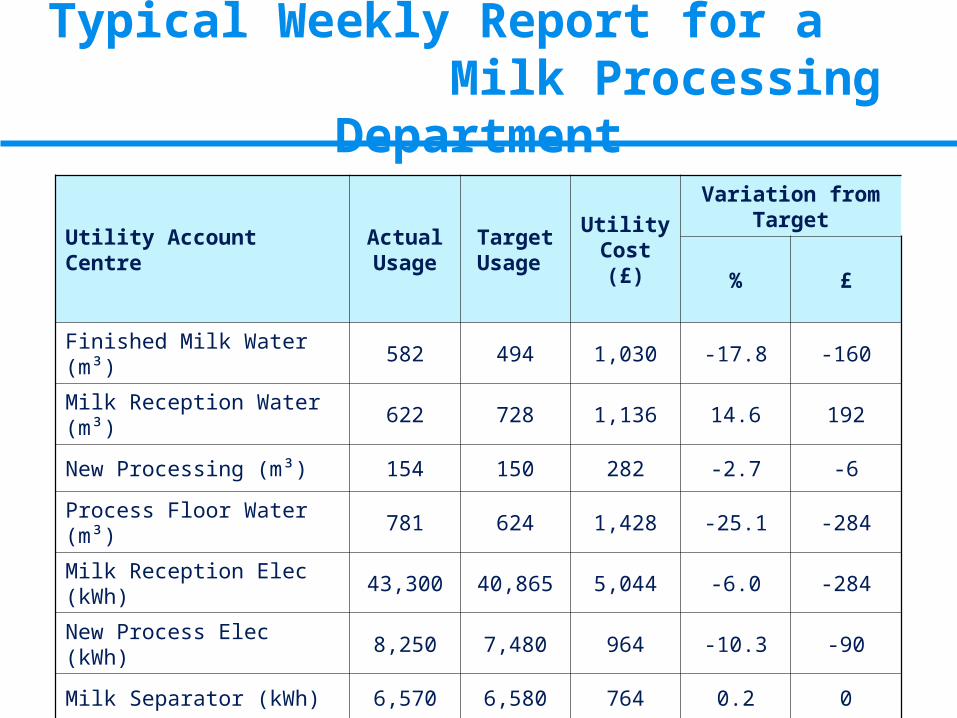
Typical Weekly Report for a Milk Processing Department
Utility Account CentreActual Usage
Target Usage
Utility Cost (£)
Variation from Target
% £
Finished Milk Water (m³) 582 494 1,030 -17.8 -160
Milk Reception Water (m³) 622 728 1,136 14.6 192
New Processing (m³) 154 150 282 -2.7 -6
Process Floor Water (m³) 781 624 1,428 -25.1 -284
Milk Reception Elec (kWh) 43,300 40,865 5,044 -6.0 -284
New Process Elec (kWh) 8,250 7,480 964 -10.3 -90
Milk Separator (kWh) 6,570 6,580 764 0.2 0
Departments Totals - - 10,648 -6.0 -632
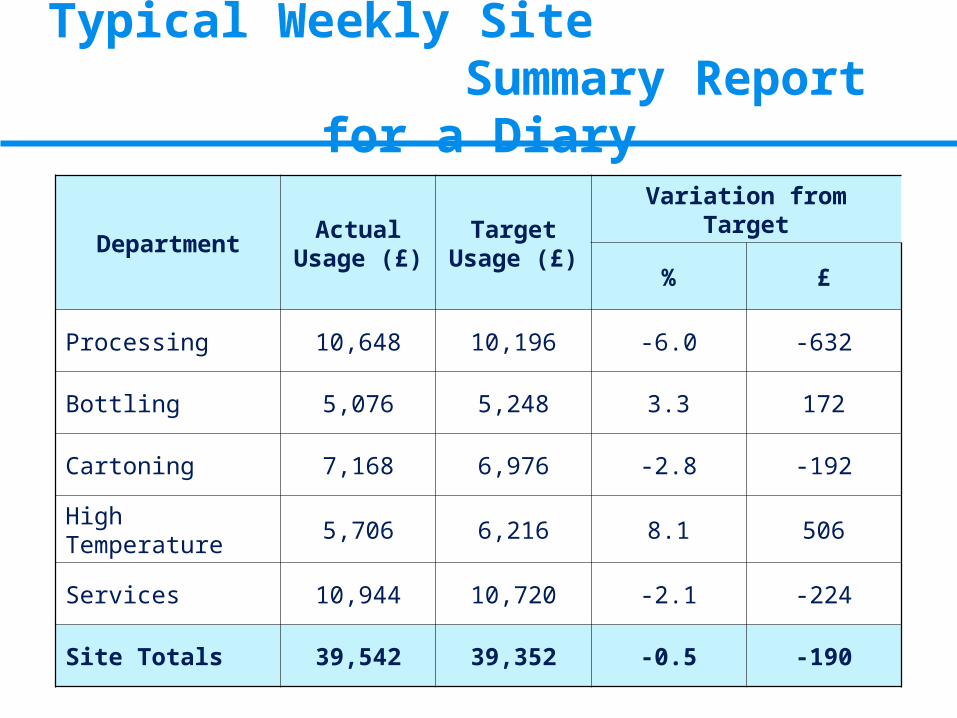
Typical Weekly Site Summary Report for a Diary
DepartmentActual
Usage (£)Target
Usage (£)
Variation from Target
% £
Processing 10,648 10,196 -6.0 -632
Bottling 5,076 5,248 3.3 172
Cartoning 7,168 6,976 -2.8 -192
High Temperature 5,706 6,216 8.1 506
Services 10,944 10,720 -2.1 -224
Site Totals 39,542 39,352 -0.5 -190
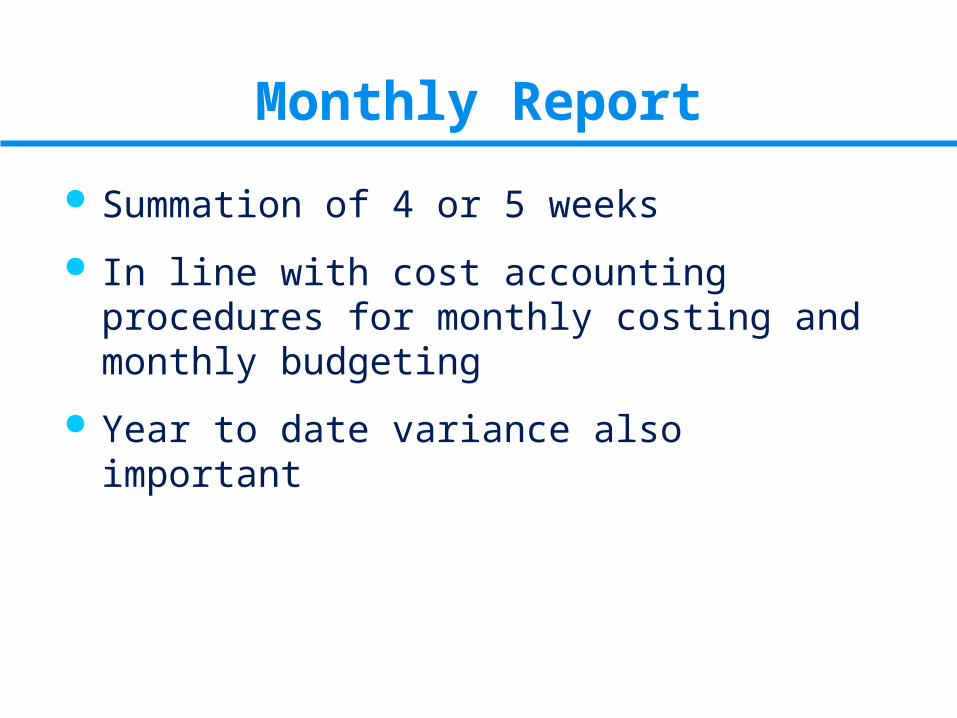
Monthly Report
Summation of 4 or 5 weeks
In line with cost accounting procedures for monthly costing and monthly budgeting
Year to date variance also important

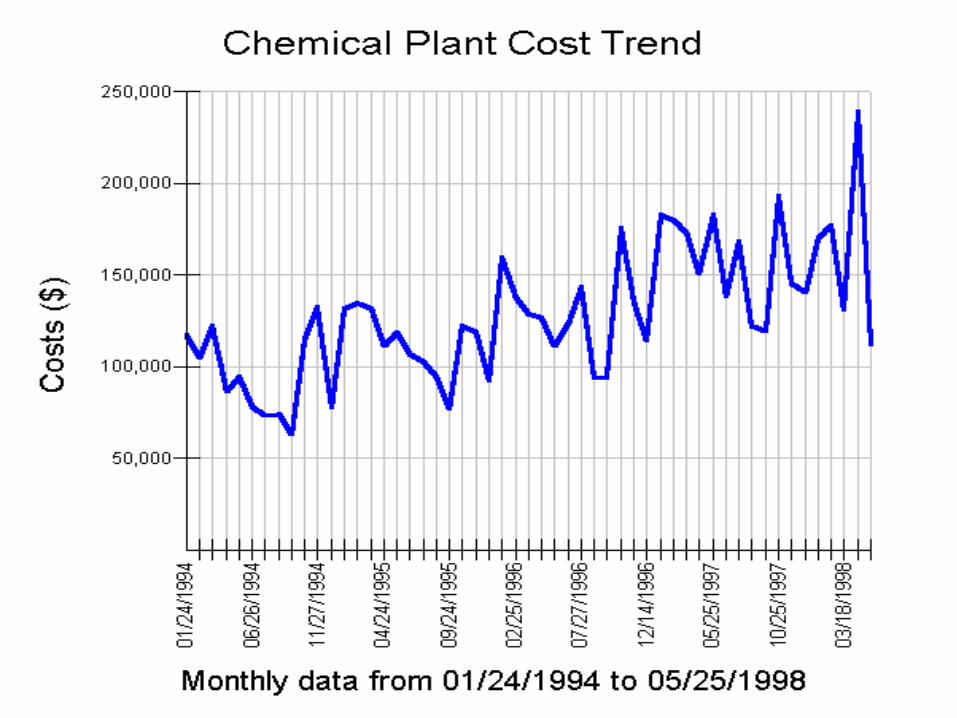
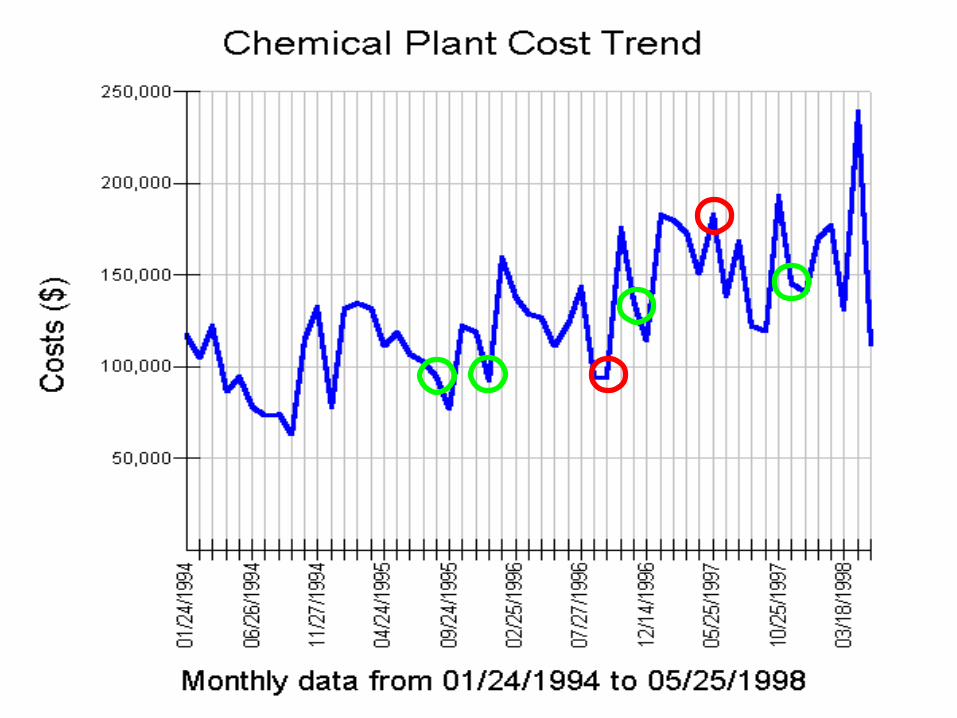
Trend Graphs
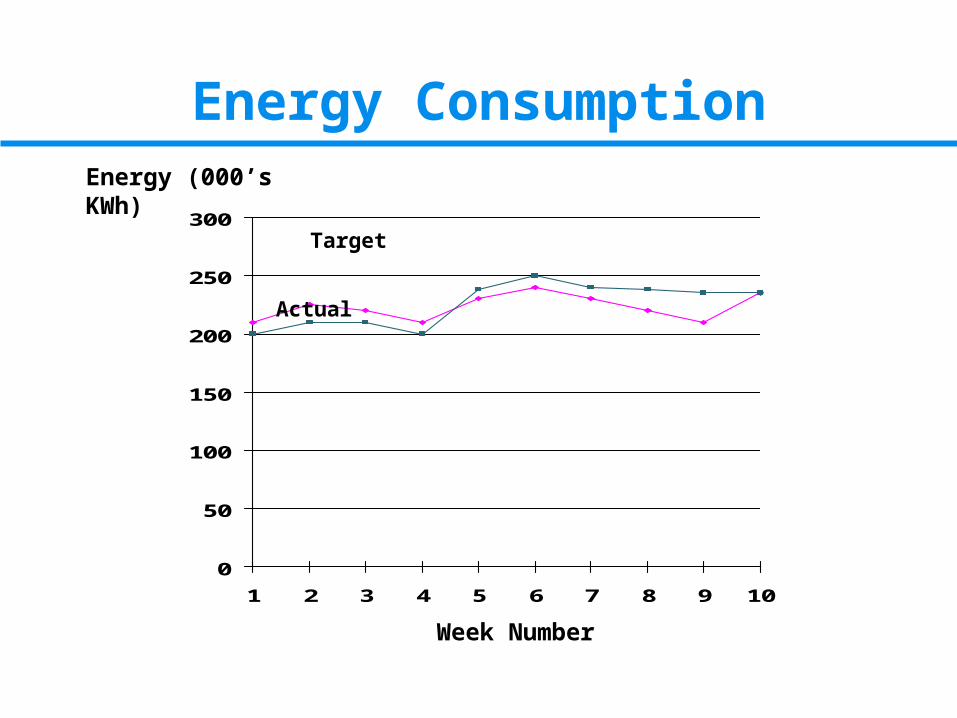
Energy Consumption
0
50
100
150
200
250
300
1 2 3 4 5 6 7 8 9 10
Energy (000’s KWh)
Week Number
Target
Actual
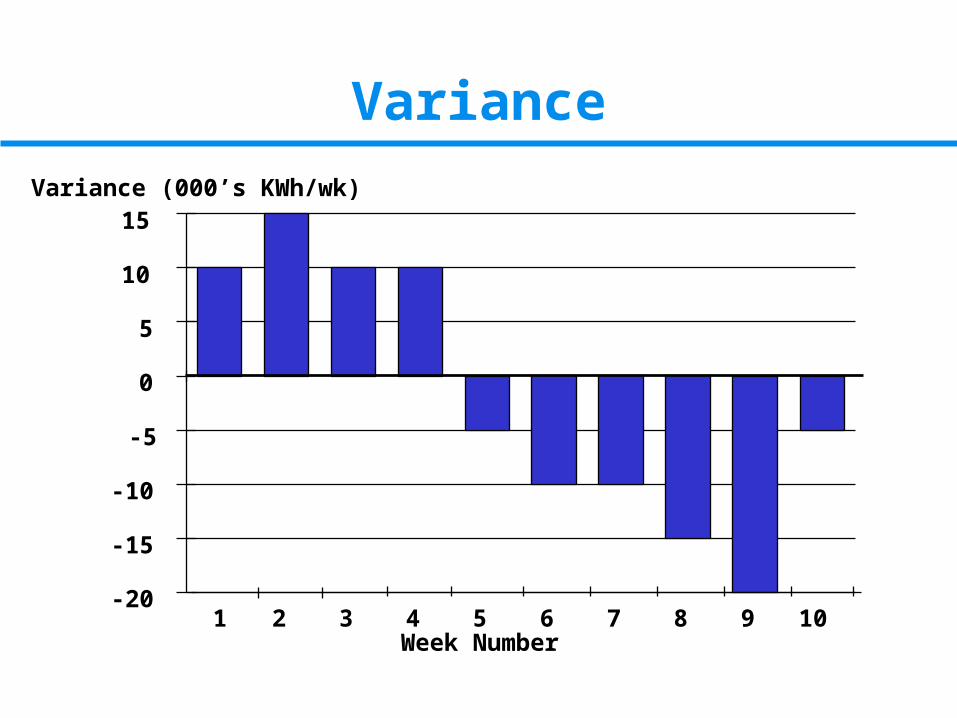
Variance
-20
-15
-10
-5
0
5
10
15
1 2 3 4 5 6 7 8 9 10
Variance (000’s KWh/wk)
Week Number
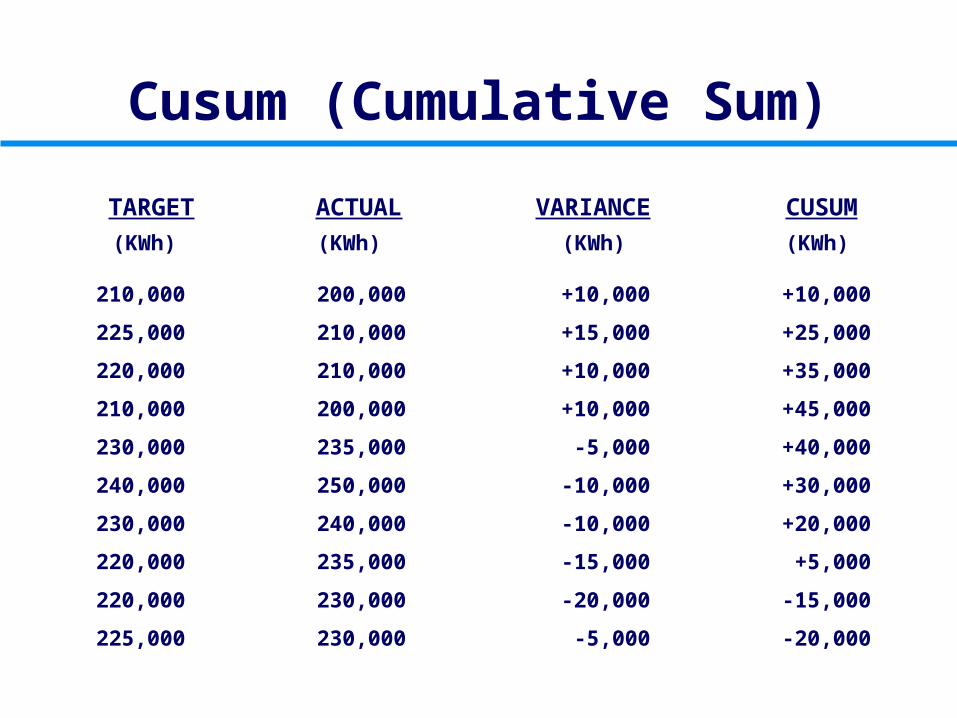
Cusum (Cumulative Sum)
TARGET ACTUAL VARIANCE CUSUM
(KWh) (KWh) (KWh)(KWh)
210,000
225,000
220,000
210,000
230,000
240,000
230,000
220,000
220,000
225,000
200,000
210,000
210,000
200,000
235,000
250,000
240,000
235,000
230,000
230,000
+10,000
+15,000
+10,000
+10,000
-5,000
-10,000
-10,000
-15,000
-20,000
-5,000
+10,000
+25,000
+35,000
+45,000
+40,000
+30,000
+20,000
+5,000
-15,000
-20,000
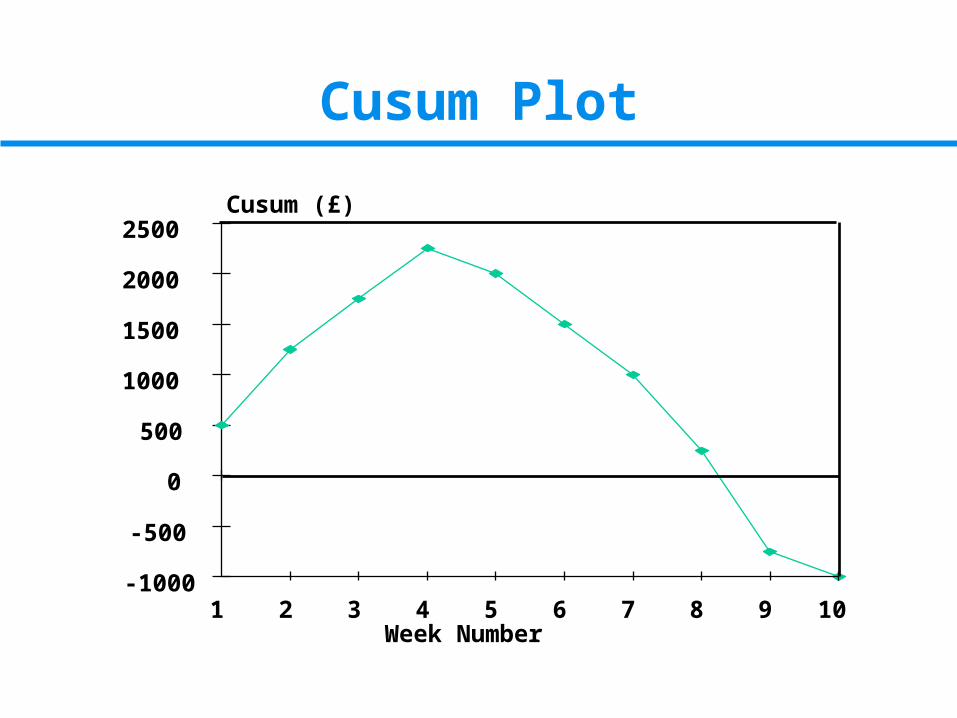
Cusum Plot
-1000
-500
0
500
1000
1500
2000
2500
1 2 3 4 5 6 7 8 9 10
Cusum (£)
Week Number

Arc Furnaces Energy Savings
Cumulativesum of ASHIFT
Cumulativesum of BSHIFT
Cumulativesum of CSHIFT
Cumulativesum of DSHIFT
(£)
WEEK
Organisation for Action
14
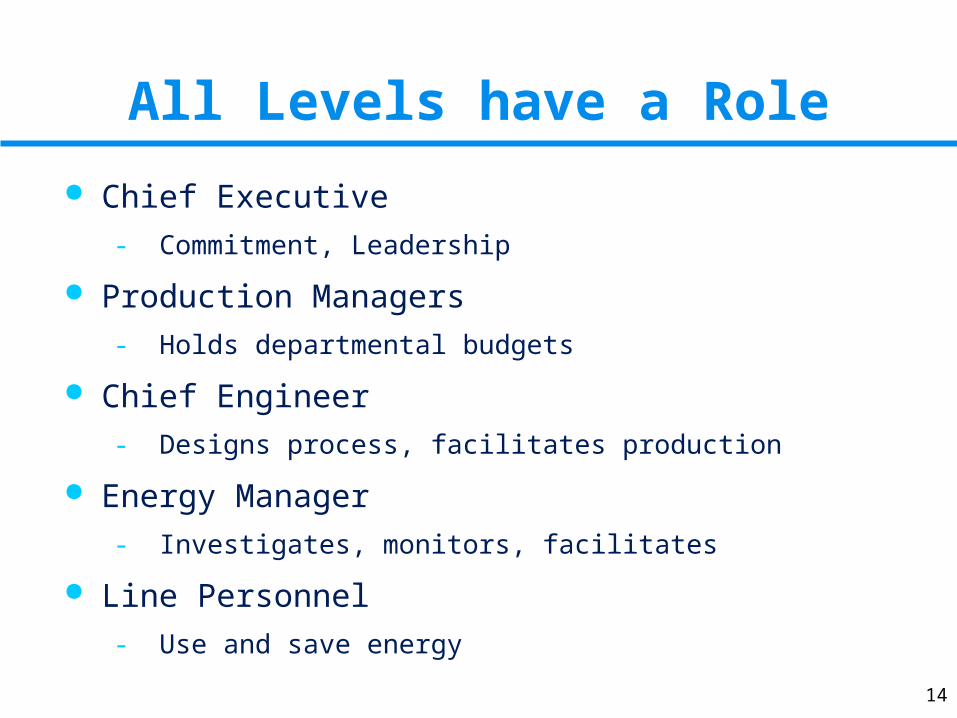
All Levels have a Role
Chief Executive
- Commitment, Leadership
Production Managers
- Holds departmental budgets
Chief Engineer
- Designs process, facilitates production
Energy Manager
- Investigates, monitors, facilitates
Line Personnel
- Use and save energy
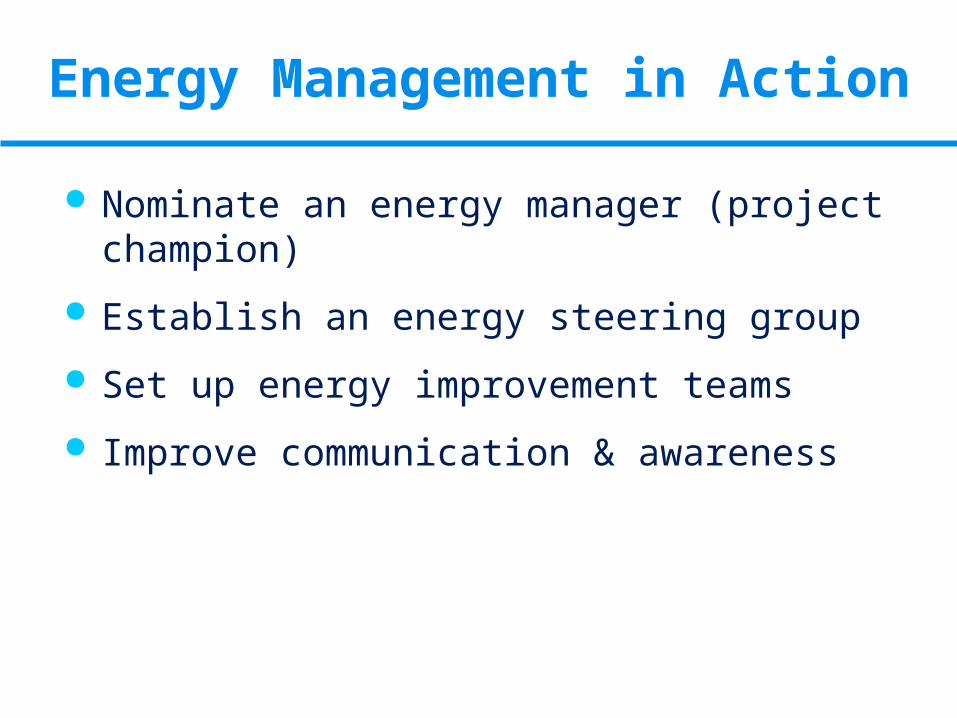
Energy Management in Action
Nominate an energy manager (project champion)
Establish an energy steering group
Set up energy improvement teams
Improve communication & awareness

The Tasks of the Energy Manager/Project Champion
Promote projects within the company
Develop the action plan
Identify, train and co-ordinate teams
Discuss resources and timescales with senior management
Measure progress
Report frequently, simply and clearly
Promote project successes
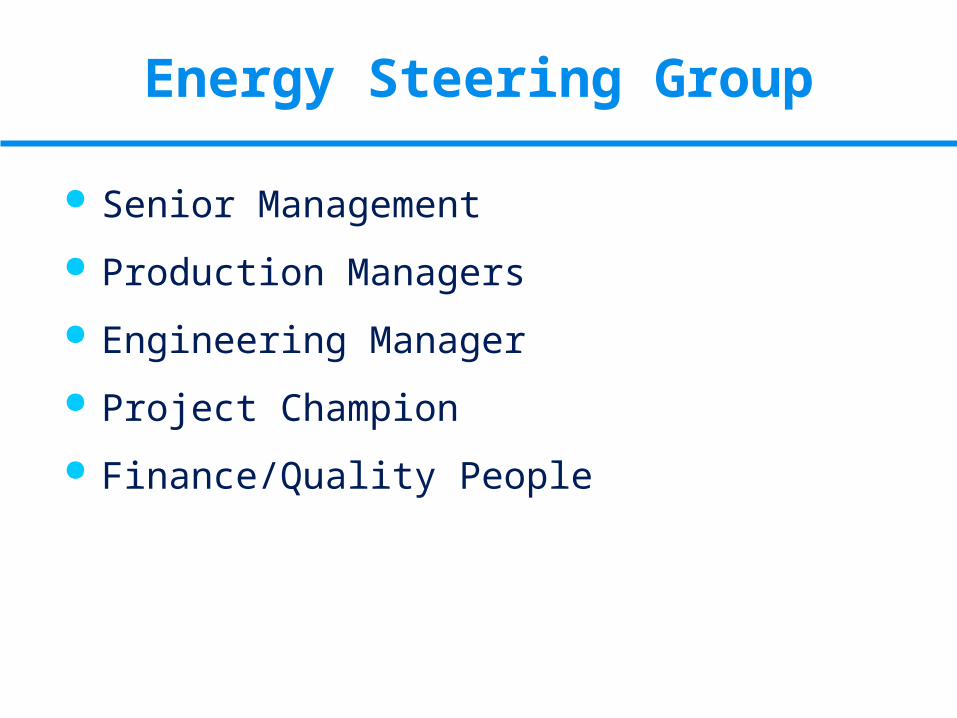
Energy Steering Group
Senior Management
Production Managers
Engineering Manager
Project Champion
Finance/Quality People
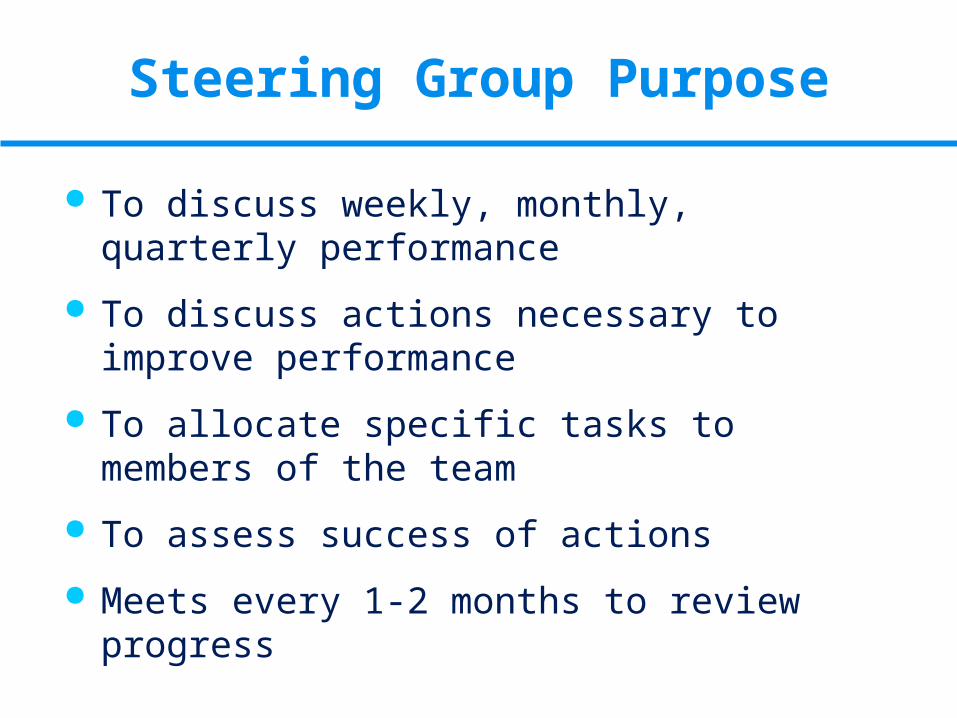
Steering Group Purpose
To discuss weekly, monthly, quarterly performance
To discuss actions necessary to improve performance
To allocate specific tasks to members of the team
To assess success of actions
Meets every 1-2 months to review progress

Role of the Improvement Team(s)
Monitor plant performance
- observation
- audits
Identify problem areas
Brainstorming sessions
Identify opportunities
Monitor implemented solutions
Meet every 2-4 weeks

Communication
Are staff aware of:
The site energy strategy?
Energy usage on site and the associated costs?
Energy reduction projects implemented?
The impact of their own role on energy costs?
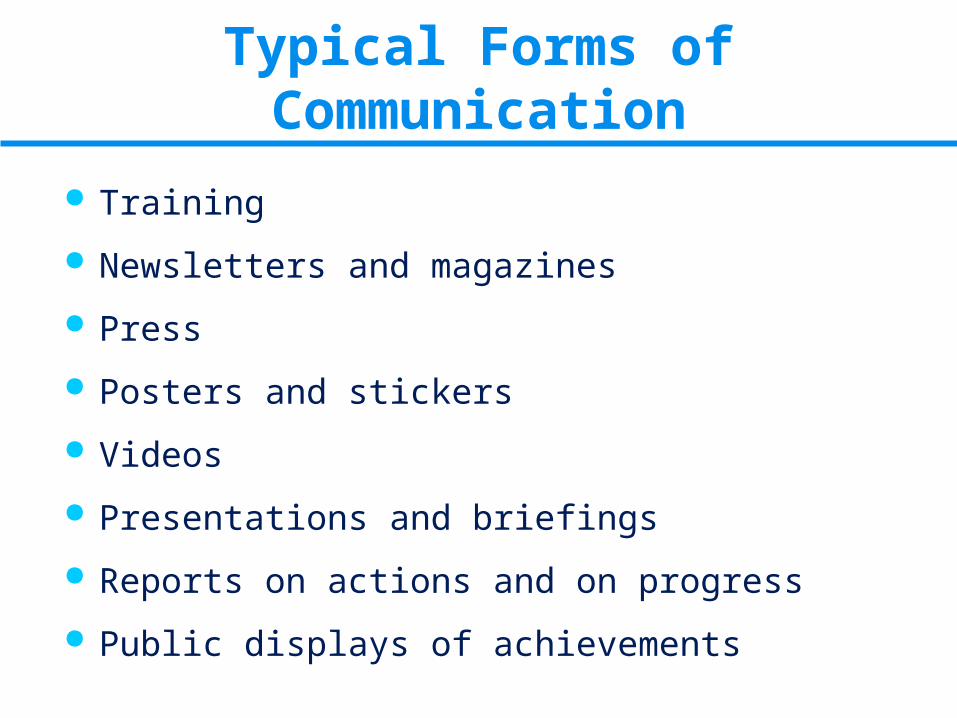
Typical Forms of Communication
Training
Newsletters and magazines
Press
Posters and stickers
Videos
Presentations and briefings
Reports on actions and on progress
Public displays of achievements
Typical Problems
Apathy
Lack of ownership and accountability
Lack of understanding of targeting process
Data errors
Lack of resources
Related Documents