Measurement IN GIS

Welcome message from author
This document is posted to help you gain knowledge. Please leave a comment to let me know what you think about it! Share it to your friends and learn new things together.
Transcript
Measurement IN GIS

A map is a visual representation of an area – a symbolic
depiction highlighting relationships between elements of that
space such as objects, region, themes.
The details represented in the map depends mostly on the scale
at which the map is designed.
Therefore Scale constitutes an integral element of the map.
―SCALE" which indicates the relationship between a certain
distance on the map and the distance on the ground.
Selecting the appropriate scale depends on the size of the sheet
of paper and the accurate placement of features.
Scaling is the process of measuring or ordering entities with
respect to quantitative attributes or traits.
• A Map must by necessity be small enough to be handled by an individual.
• A full-size map of the Earth would not only be too large to be useful, but it would also be impractical to make.
• Hence Maps are scaled down so that they fit on the available paper or screen.
• To be most useful, a map must show locations and distances accurately on a sheet of paper of convenient size. This means that everything included in the map—ground area of rivers, lakes, roads & distances between any two features like trees, building and so on—must be shown proportionately smaller than they really are. The proportion chosen for a particular map is its scale.
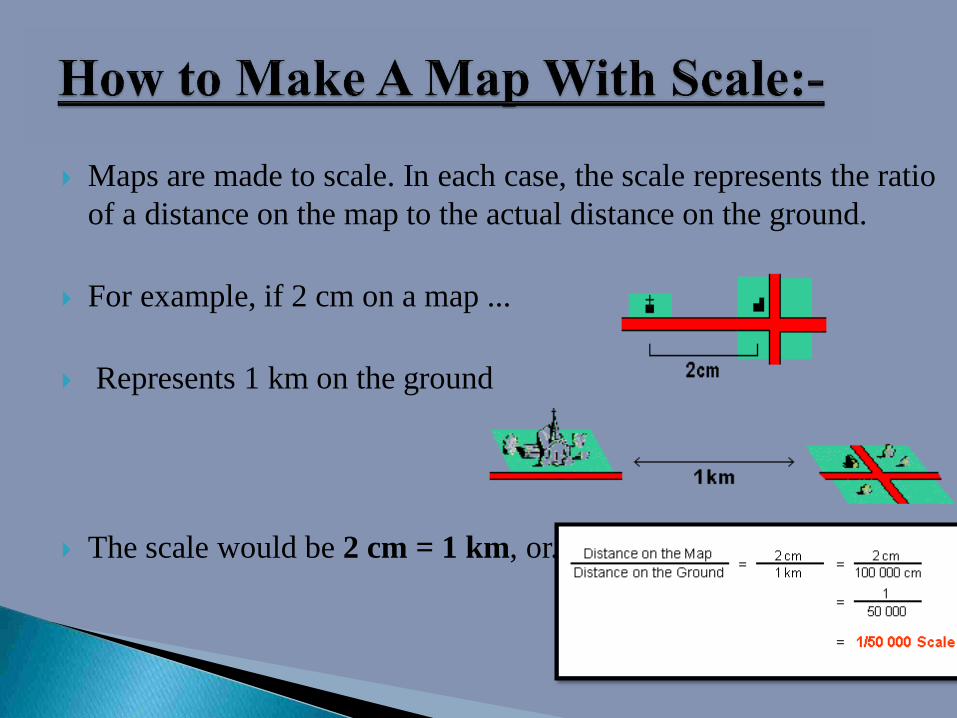
Maps are made to scale. In each case, the scale represents the ratio
of a distance on the map to the actual distance on the ground.
For example, if 2 cm on a map ...
Represents 1 km on the ground
The scale would be 2 cm = 1 km, or...
It is important that we recognize how to read, understand, and
utilize scale as we examine the various maps that we encounter.
There are three common approaches used by map makers to
depict scale.
The Representative Fraction Approach
The Verbal Approach
The Graphical Approach
The Representative Fractional Approach:
The Fractional approach for portraying the scale of a map uses a representative fraction to describe the ratio between the map and the real world. This can be shown as 1:50,000 or 1/50,000. In this example, 1 unit of distance on the map represents 50,000 of the same units of distance in the real world. This means that 1 inch on the map represents 50,000 inches in the real world, 1 foot on the map represents 50,000 feet on the map, and so forth.
1:50,000

The Word Statement or Verbal
Approach:
The verbal approach of depicting scale simply uses words to
describe the ratio between the map's scale and the real world.
For example, a map might say something like, ―Three inch
equals 10 miles‖ or "One centimeter equals ten kilometers.
1 INCHES= 1MILES
The Graphic Approach :-
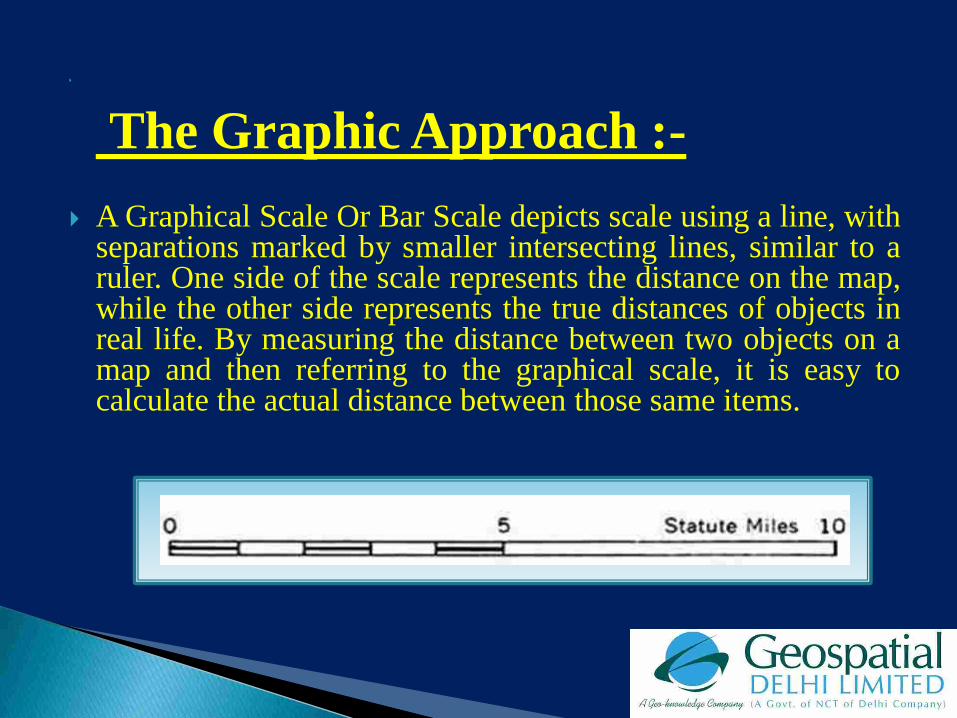
A Graphical Scale Or Bar Scale depicts scale using a line, with separations marked by smaller intersecting lines, similar to a ruler. One side of the scale represents the distance on the map, while the other side represents the true distances of objects in real life. By measuring the distance between two objects on a map and then referring to the graphical scale, it is easy to calculate the actual distance between those same items.
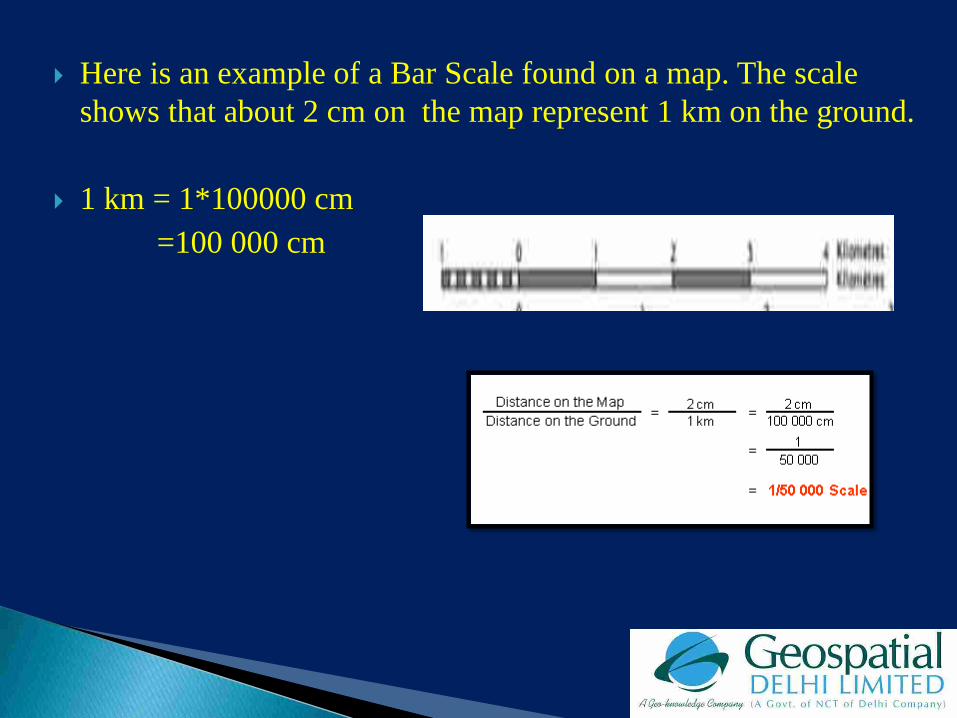
Here is an example of a Bar Scale found on a map. The scale
shows that about 2 cm on the map represent 1 km on the ground.
1 km = 1*100000 cm
=100 000 cm
LARGE SCALE MAPS:-
1. Large scale maps show a small area in greater details.
2. Large scale refers to maps on which objects are relatively large
3. Maps with details of cities/towns/villages in general terms are
called large scale maps.
4. The scale may be 1 cm = 50 m or 1 km
1:1250 scale-- Large Scale Map:
Maps at a scale of 1:1250 are large-scale maps. One centimeter is equal to 1250 centimeters (or 12.5 meters) on the ground; four centimeters on the map, therefore, represents 50 meters on the ground (80cm = 1000 meters or 1 km).
At this scale, roads, buildings, fences and landscape features are shown in detail. The shapes of individual buildings are accurately represented as well as being named or numbered.
Mapping at 1:1250 and 1:2500 scales is used by central and local government, utilities (gas, electricity, water and telecommunications companies) and other organizations wanting highly detailed mapping for planning or business management purposes.
SMALL SCALE MAPS:-
1. Small scale maps show a larger area in less detail.
2. Small Scale are maps on which features are relatively small.
3. Wall maps or atlas maps representing features like mountains,
plateaus, continents and countries are generally small scale
maps.
4. Scale may be 1 cm = 100 km.

1:1 000 000 scale:- Small Scale Map:
Maps at a scale of 1:1 000 000 (1:1 million) are extremely small-scale maps. One centimeter on a 1:1 000 000 scale map is equal to 1 000 000 centimeters (or 10 000 meters – 10 kilometers) on the ground; four centimeters on the map therefore represents 40 kilometers on the ground (10cm = 100km). Alternatively, one inch on the map is equal to 16 miles on the ground.
Maps at 1:1 000 000 scale only show cities and major towns together with the motorway and primary route network. Country boundaries are shown and are sometimes colour coded to make their shape and location clearly distinguishable.
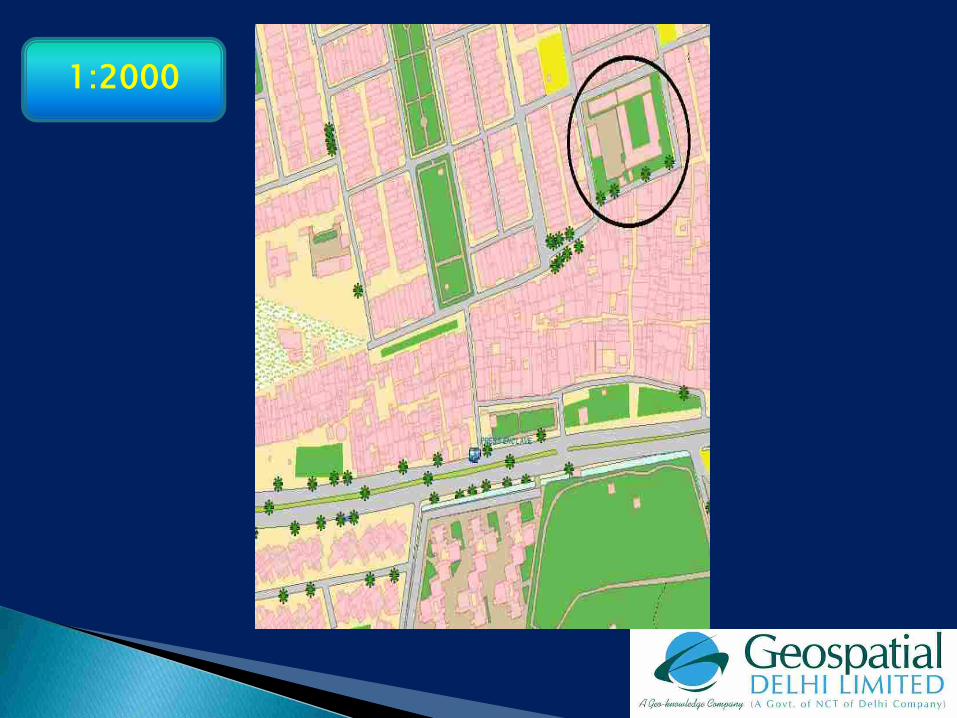
1:2000
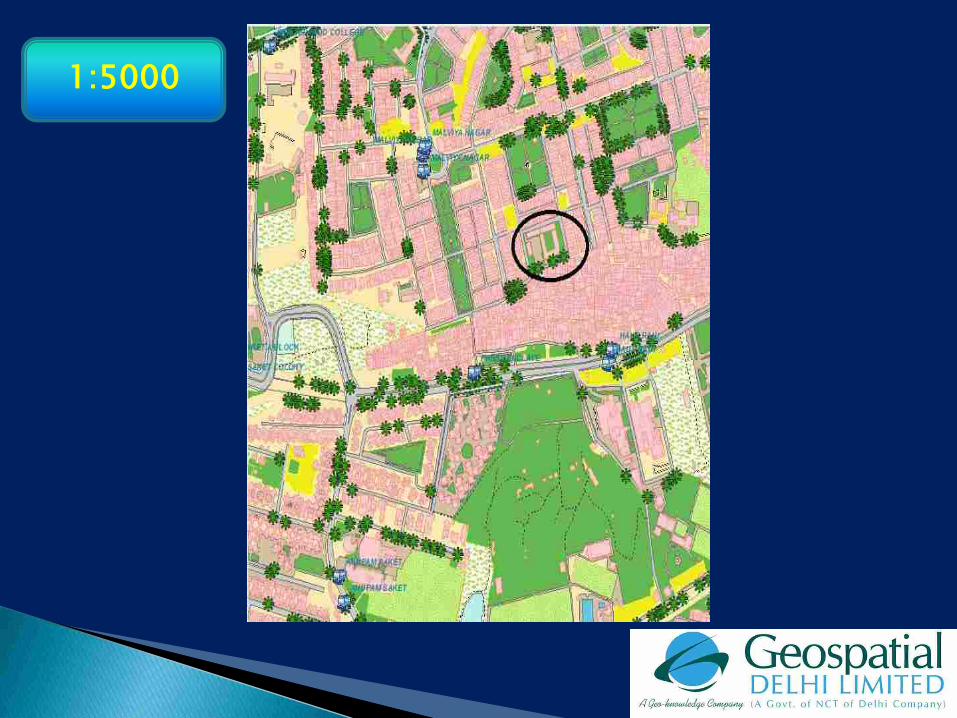
1:5000
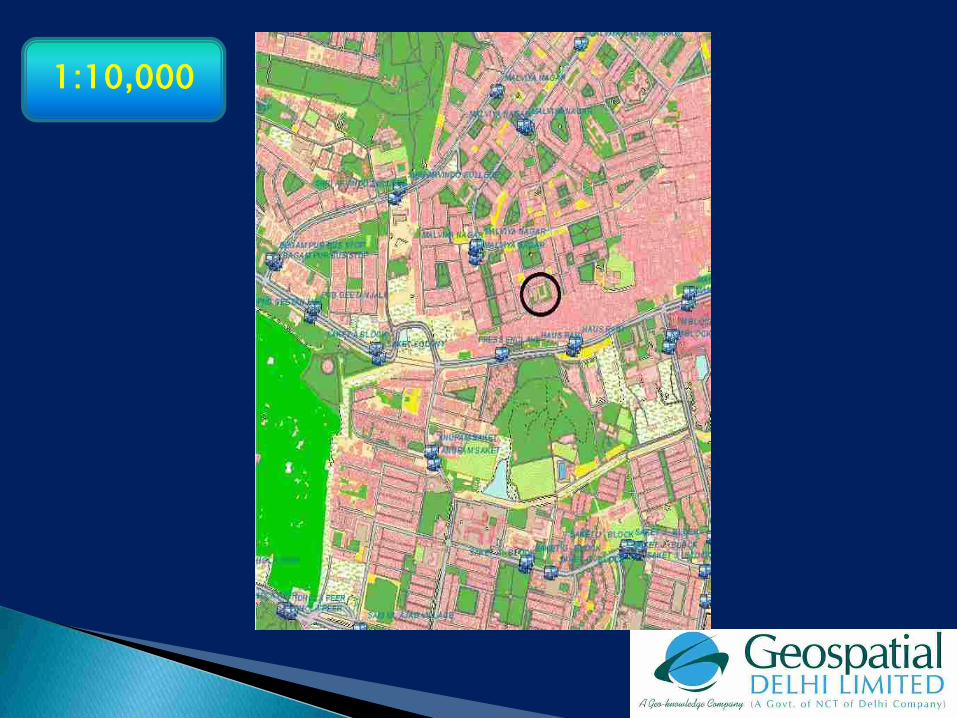
1:10,000
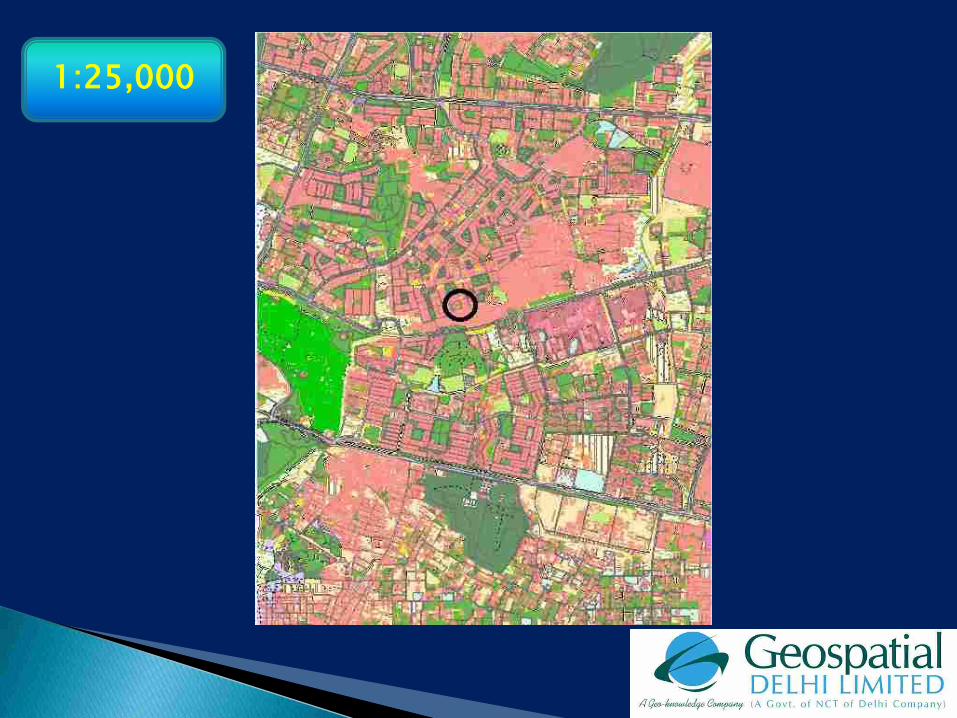
1:25,000
Large scale and small scale are subjective terms.
For example a town planner who is used to working with
plans at 1:1000, may consider 1:25 000 a small scale map.
While an atlas compiler commonly working with maps of
scales 1:5 000 000 would consider 1:25 000 a large scale
map.
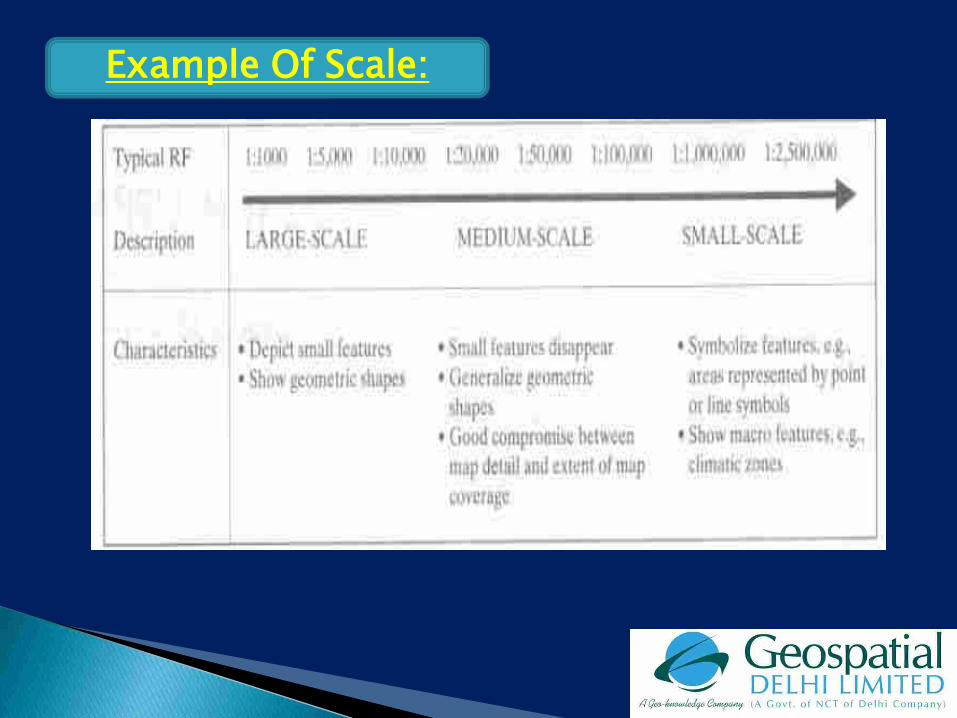
Example Of Scale:
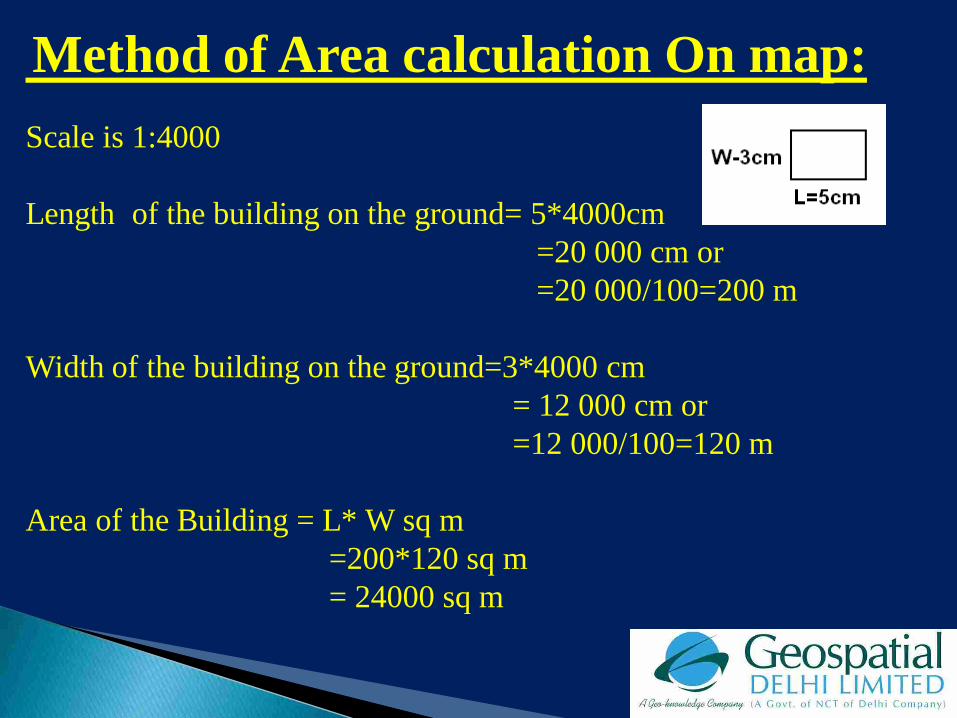
Method of Area calculation On map:
Scale is 1:4000
Length of the building on the ground= 5*4000cm
=20 000 cm or
=20 000/100=200 m
Width of the building on the ground=3*4000 cm
= 12 000 cm or
=12 000/100=120 m
Area of the Building = L* W sq m
=200*120 sq m
= 24000 sq m
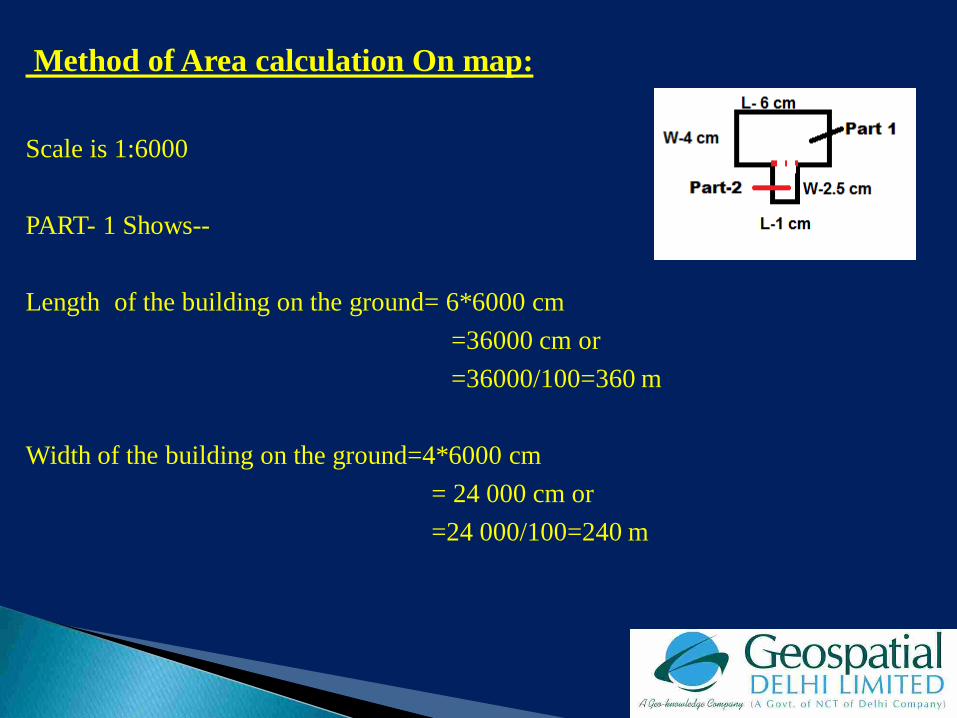
Method of Area calculation On map:
Scale is 1:6000
PART- 1 Shows--
Length of the building on the ground= 6*6000 cm
=36000 cm or
=36000/100=360 m
Width of the building on the ground=4*6000 cm
= 24 000 cm or
=24 000/100=240 m

Method of Area calculation On map:-
PART- 2 shows--
Length of the building on the ground= 1*6000 cm
=6000 cm or
=6000/100=60 m
Width of the building on the ground=2.5*6000 cm
= 15 000 cm or
=15000/100=150 m
Total Length On the ground=360+60 = 420 m Area of the Building = L* W sq m
Total Width on the ground = 240+150=390 m =420*390 sq m
= 163800 sq m

THANK YOU
Related Documents