The The Joy Joy of Design-Based of Design-Based Stats: Harnessing Chance Stats: Harnessing Chance Don Edwards Don Edwards Dept. of Statistics Dept. of Statistics University of South Carolina University of South Carolina [email protected] [email protected] www.stat.sc.edu www.stat.sc.edu Savannah River Chapter of Savannah River Chapter of the Health Physics Society the Health Physics Society Aiken, SC Aiken, SC April 15, 2011 April 15, 2011

The Joy of Design-Based Stats: Harnessing Chance Don Edwards Dept. of Statistics University of South Carolina [email protected] Savannah.
Jan 03, 2016
Welcome message from author
This document is posted to help you gain knowledge. Please leave a comment to let me know what you think about it! Share it to your friends and learn new things together.
Transcript
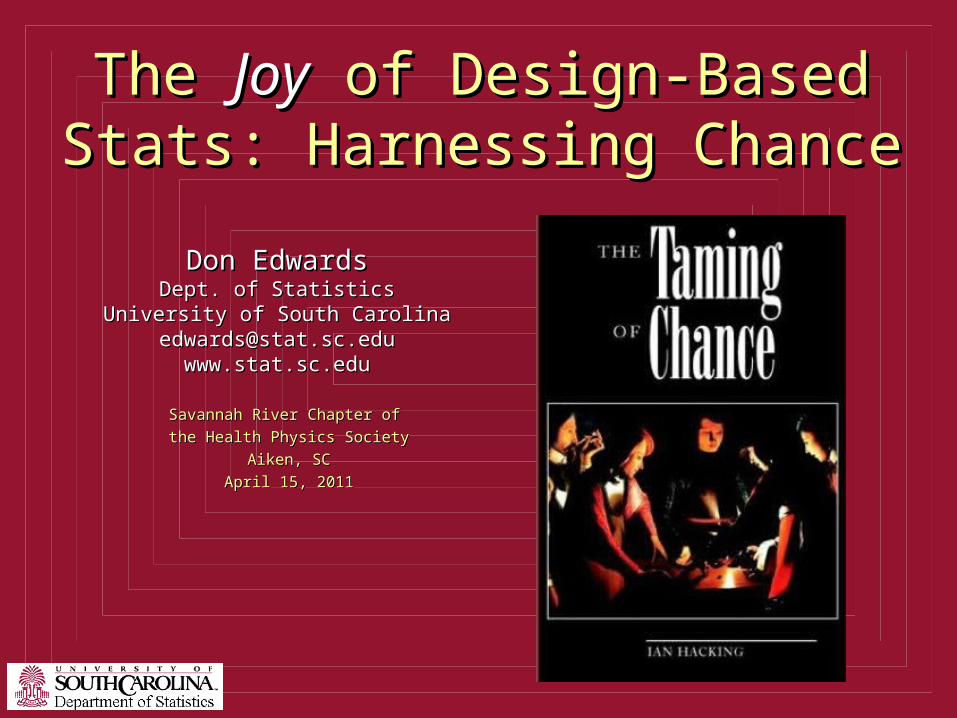
The The JoyJoy of Design-Based Stats: of Design-Based Stats: Harnessing ChanceHarnessing Chance
Don EdwardsDon EdwardsDept. of StatisticsDept. of Statistics
University of South CarolinaUniversity of South [email protected]@stat.sc.edu
www.stat.sc.eduwww.stat.sc.edu
Savannah River Chapter of Savannah River Chapter of the Health Physics Societythe Health Physics Society
Aiken, SCAiken, SC April 15, 2011April 15, 2011

Who Am I and Why Am I Here?Who Am I and Why Am I Here?

OutlineOutline● Sampling a hazardous waste dump: an exercise● Example 2: Healthcare Audits
● A general sampling problem● A test of significance● A confidence bound procedure
● Design-based vs. Model-based Inference● Thoughts about the future of statistics● USC graduate programs via distance learning● One good picture is worth a thousand p-values
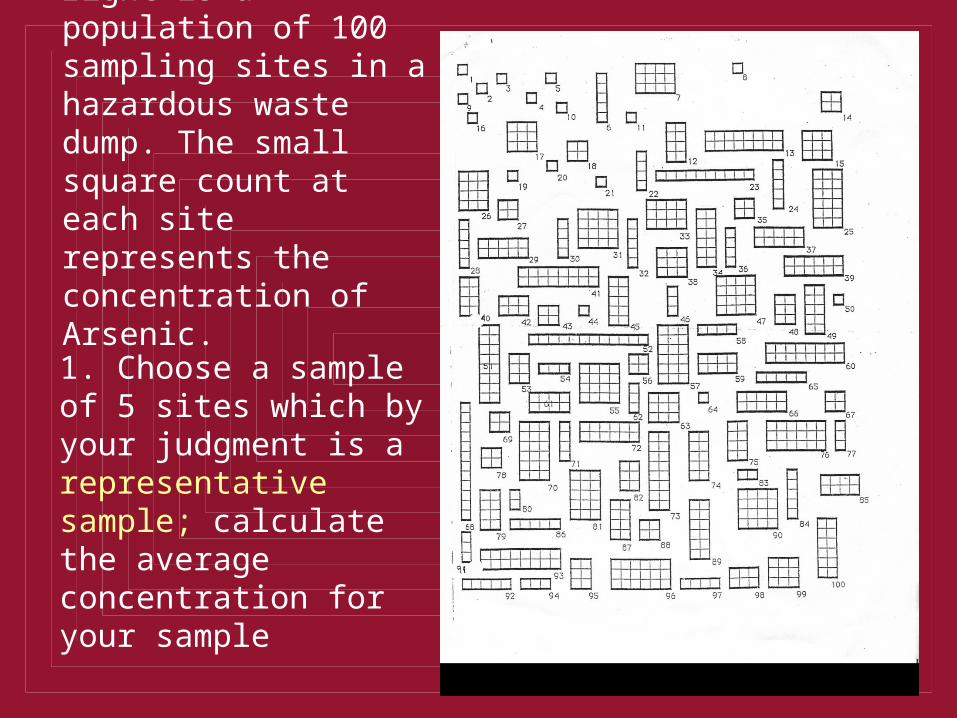
Exercise (R.L.Scheaffer): at right is a population of 100 sampling sites in a hazardous waste dump. The small square count at each site represents the concentration of Arsenic.
1. Choose a sample of 5 sites which by your judgment is a representative sample; calculate the average concentration for your sample
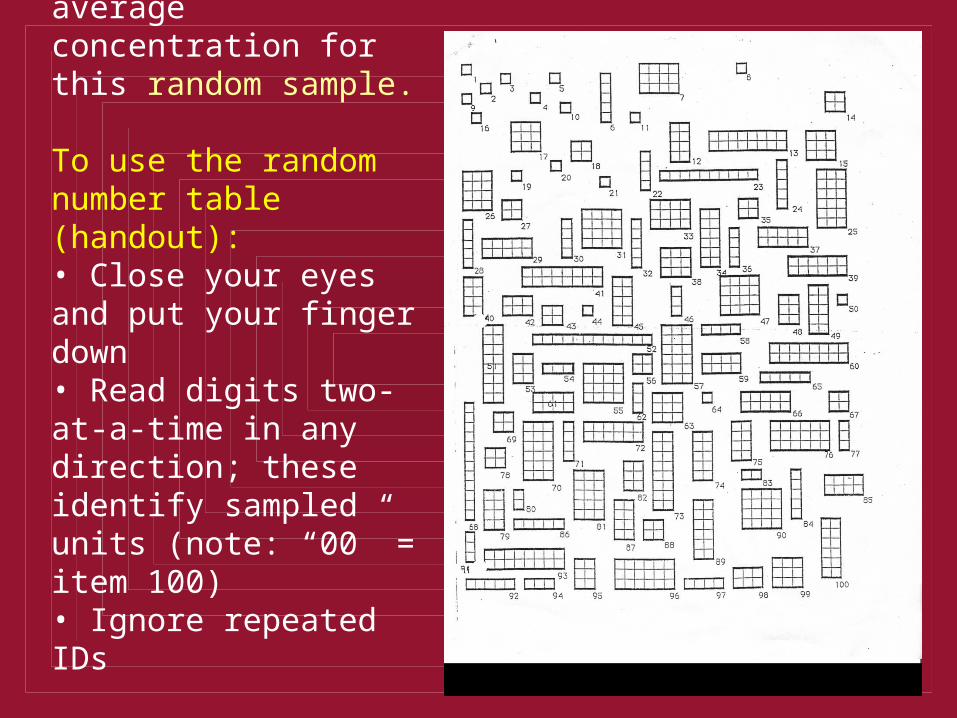
2. Use the random number table to choose 5 sampling sites at random. Calculate the average concentration for this random sample.
To use the random number table (handout):• Close your eyes and put your finger down• Read digits two-at-a-time in any direction; these identify sampled units (note: “00” = item 100)• Ignore repeated IDs

Google “Sixty minutes” Google “Sixty minutes” videos videos Medicare fraud 9/2009 episode Medicare fraud 9/2009 episode
Example 2: Who is this man?Example 2: Who is this man?
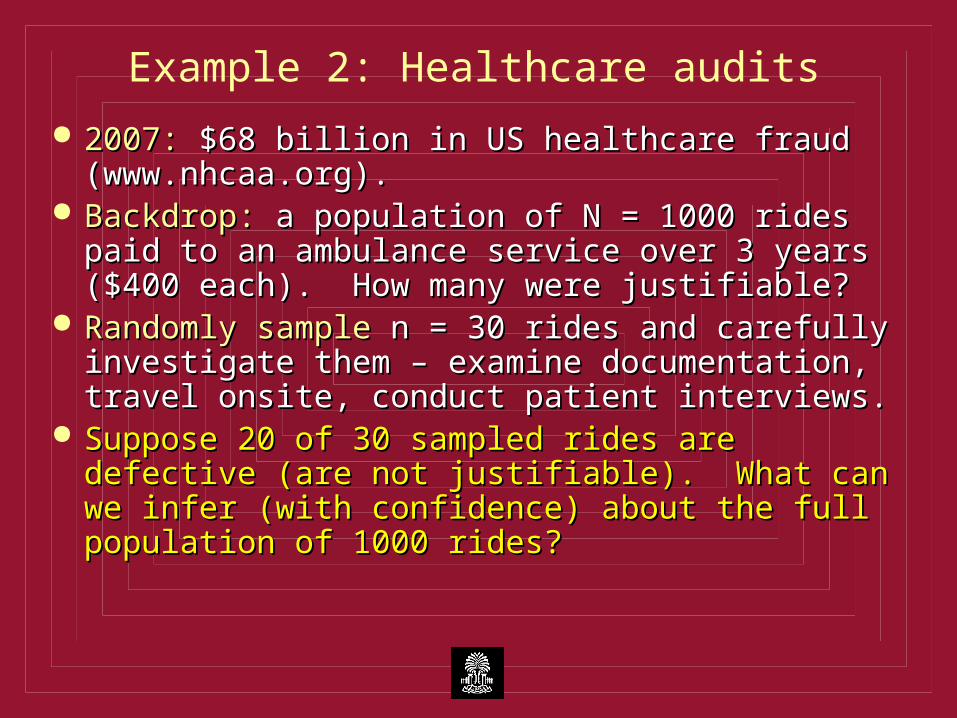
Example 2: Healthcare audits
2007:2007: $68 billion in US healthcare fraud $68 billion in US healthcare fraud (www.nhcaa.org).(www.nhcaa.org).
Backdrop:Backdrop: a population of N = 1000 rides paid to a population of N = 1000 rides paid to an ambulance service over 3 years ($400 each). an ambulance service over 3 years ($400 each). How many were justifiable?How many were justifiable?
Randomly sample Randomly sample n = 30 rides and carefully n = 30 rides and carefully investigate them – examine documentation, investigate them – examine documentation, travel onsite, conduct patient interviews.travel onsite, conduct patient interviews.
Suppose 20 of 30 sampled rides are defective Suppose 20 of 30 sampled rides are defective (are not justifiable). What can we infer (with (are not justifiable). What can we infer (with confidence) about the full population of 1000 confidence) about the full population of 1000 rides?rides?
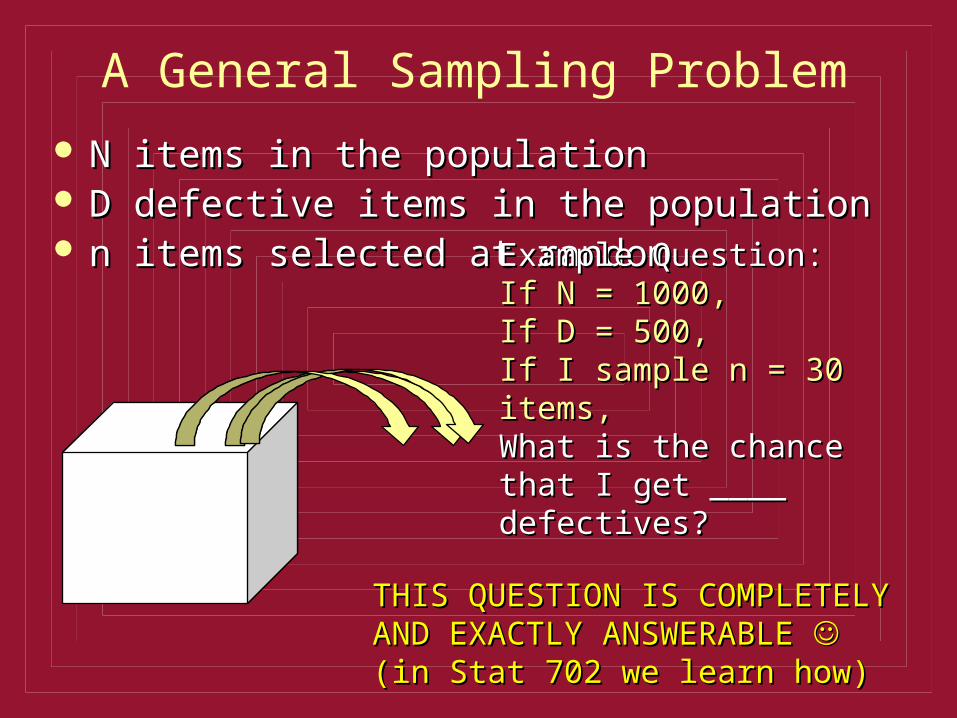
A General Sampling Problem
N items in the populationN items in the population D defective items in the populationD defective items in the population n items selected at randomn items selected at random
Example Question: Example Question: If N = 1000,If N = 1000,If D = 500, If D = 500, If I sample n = 30 items, If I sample n = 30 items, What is the chance that I get What is the chance that I get ____ defectives?____ defectives?
THIS QUESTION IS COMPLETELY THIS QUESTION IS COMPLETELY AND EXACTLY ANSWERABLE AND EXACTLY ANSWERABLE (in Stat 702 we learn how)(in Stat 702 we learn how)
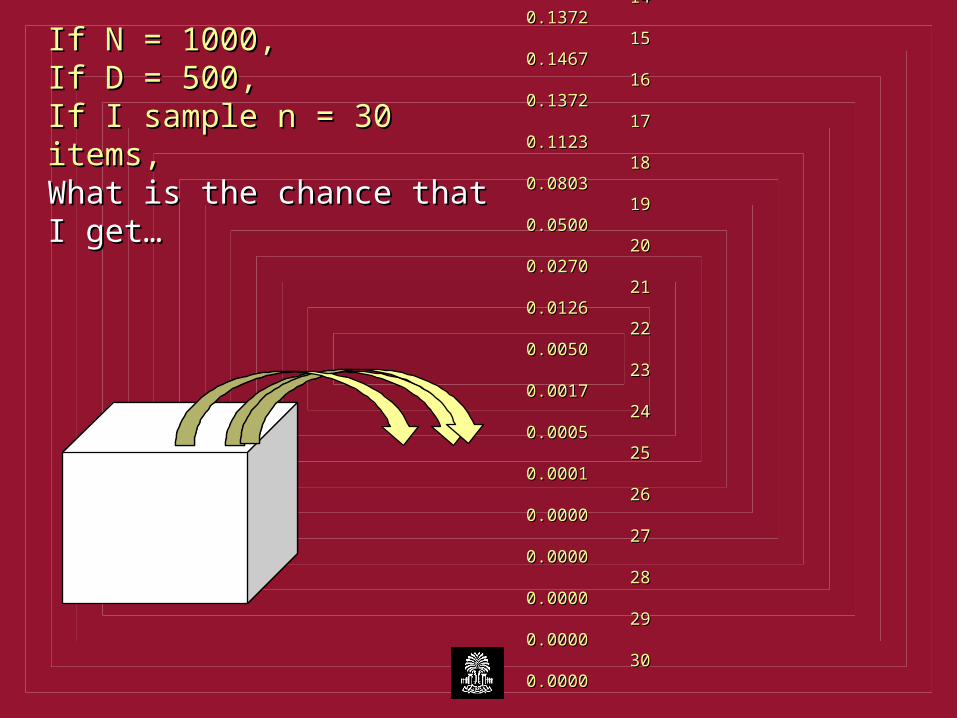
If N = 1000,If N = 1000,If D = 500, If D = 500, If I sample n = 30 items, If I sample n = 30 items, What is the chance that I get…What is the chance that I get…
defectives chancedefectives chance 0 0 0.00000.0000 1 1 0.00000.0000 2 2 0.00000.0000 3 3 0.00000.0000 4 4 0.00000.0000 5 5 0.00010.0001 6 6 0.00050.0005 7 7 0.00170.0017 8 8 0.00500.0050 9 9 0.01260.0126 10 10 0.02700.0270 11 11 0. 05000. 0500 12 12 0.08030.0803 13 13 0.11230.1123 14 14 0.13720.1372 15 15 0.14670.1467 16 16 0.13720.1372 17 17 0.11230.1123 18 18 0.08030.0803 19 19 0.05000.0500 20 20 0.02700.0270 21 21 0.01260.0126 22 22 0.00500.0050 23 23 0.00170.0017 24 24 0.00050.0005 25 25 0.00010.0001 26 26 0.00000.0000 27 27 0.00000.0000 28 28 0.00000.0000 29 29 0.00000.0000 30 30 0.00000.0000

If N = 1000,If N = 1000,If D = 500, If D = 500, If I sample n = 30 items, If I sample n = 30 items, What is the chance that I get…What is the chance that I get…
0 2 4 6 8 10 12 14 16 18 20 22 24 26 28 30
sample defectives
cha
nce
0.0
00
.02
0.0
40
.06
0.0
80
.10
0.1
20
.14
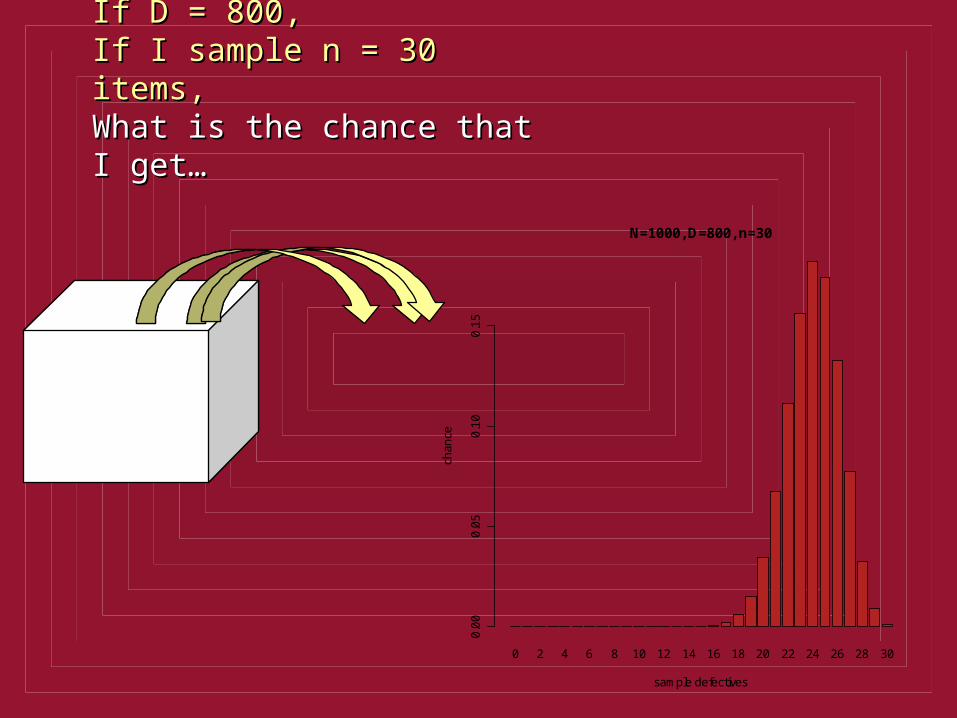
If N = 1000,If N = 1000,If D = 800, If D = 800, If I sample n = 30 items, If I sample n = 30 items, What is the chance that I get…What is the chance that I get…
0 2 4 6 8 10 12 14 16 18 20 22 24 26 28 30
sample defectives
cha
nce
0.0
00
.05
0.1
00
.15
N=1000, D=800, n=30

www.R-project.orgwww.R-project.org

A Test of SignificanceA Test of Significance
Suppose Suppose that criminal charges can be brought if that criminal charges can be brought if there is there is strong evidence strong evidence that more than half of the that more than half of the population rides are defective (=not justified).population rides are defective (=not justified).
If exactly 500 of 1000 population rides are If exactly 500 of 1000 population rides are defective, it is unusual to see 20 or more defective, it is unusual to see 20 or more defectives in a sample of 30.defectives in a sample of 30.
How unusual is it? How unusual is it? p = chance of obtaining 20 or more defectives in a p = chance of obtaining 20 or more defectives in a
sample of 30 = 0.0468sample of 30 = 0.0468 Is this strong evidence (beyond a reasonable Is this strong evidence (beyond a reasonable
doubt) that more than half the population rides are doubt) that more than half the population rides are defective? Many would say yes.defective? Many would say yes.
A Test of SignificanceA Test of Significance
Tests of significance are frequently misused / Tests of significance are frequently misused / abused / misinterpreted. For example:abused / misinterpreted. For example:
Statistical significance Statistical significance practical significance practical significance Data-snooping (using the same data to formulate Data-snooping (using the same data to formulate
and also test the hypothesis)and also test the hypothesis) Low power…Low power… Multiple looks (when did the experiment start? Multiple looks (when did the experiment start?
Best 2 out of 3?)Best 2 out of 3?) The filing cabinet effect (selection bias)The filing cabinet effect (selection bias)

A Confidence Bound ProcedureA Confidence Bound Procedure SO, For a population of 1000 items, observing 20 SO, For a population of 1000 items, observing 20
defectives in a sample of 30, many would say it is defectives in a sample of 30, many would say it is implausibleimplausible to claim that D = 500. to claim that D = 500.
A plausibility exerciseA plausibility exercise: Consider each possible D : Consider each possible D (0,1,2,…,1000) and re-calculate the chance of (0,1,2,…,1000) and re-calculate the chance of observing 20 or more defectives out of 30. observing 20 or more defectives out of 30.
Q: Q: What is the What is the smallest plausible Dsmallest plausible D, the smallest , the smallest value such that this chance is (say) at least 0.10?value such that this chance is (say) at least 0.10?
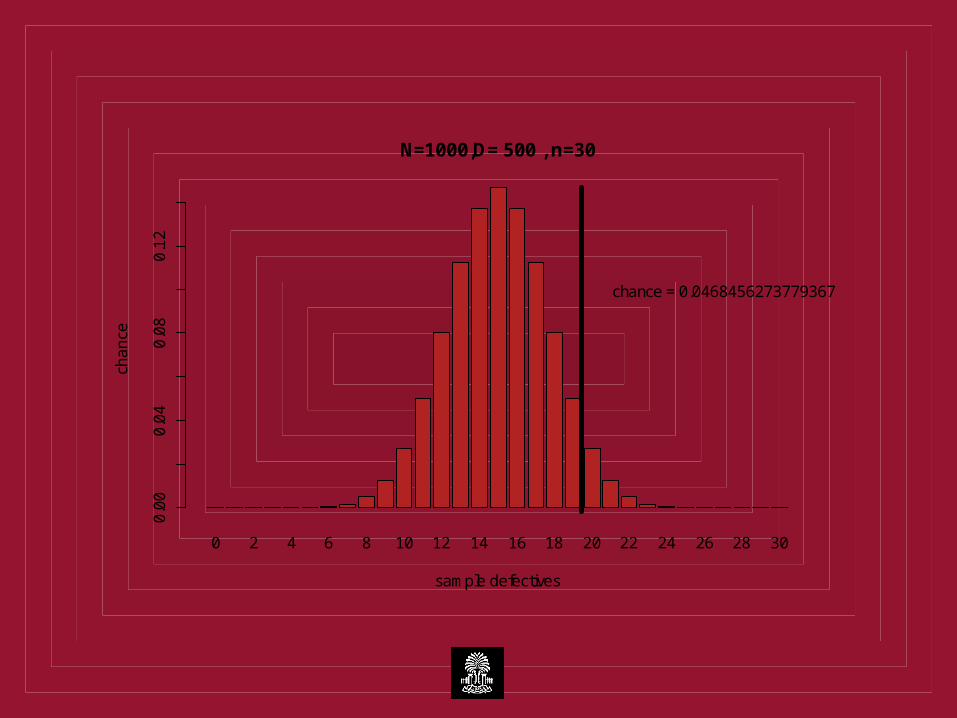
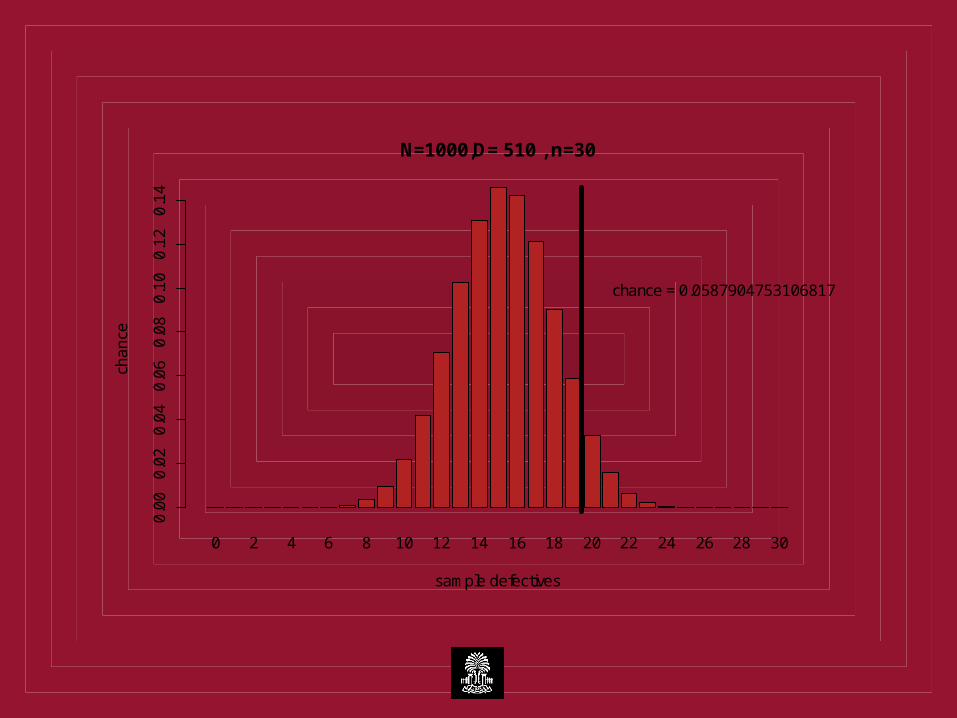
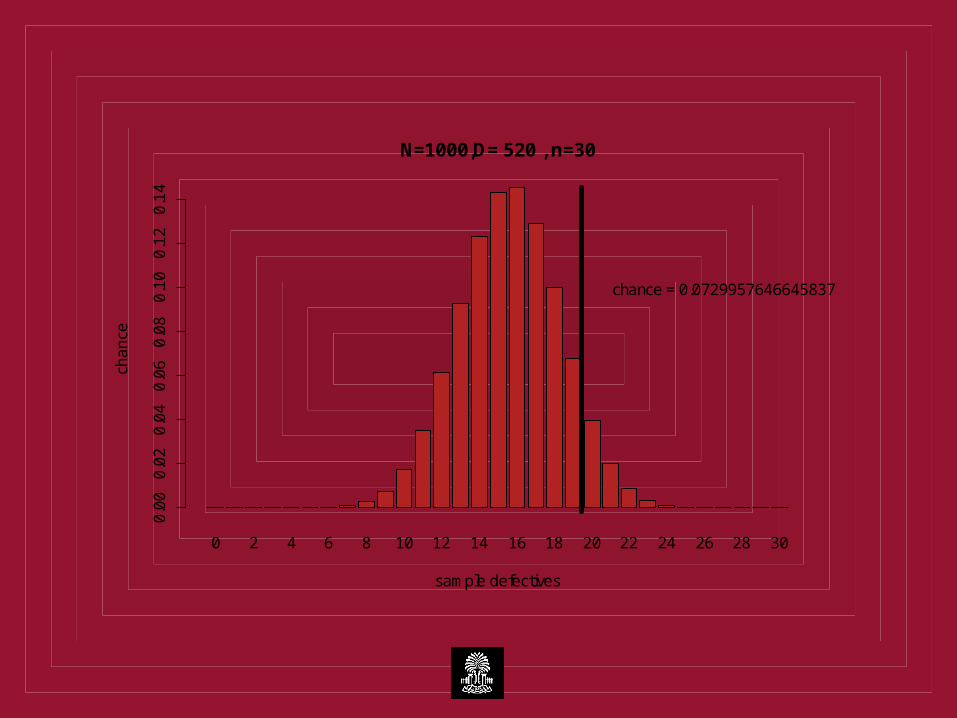
D = 500 chance = 0.0468D = 500 chance = 0.0468D = 510 chance = 0.0588D = 510 chance = 0.0588D = 520 chance = 0.0730D = 520 chance = 0.0730
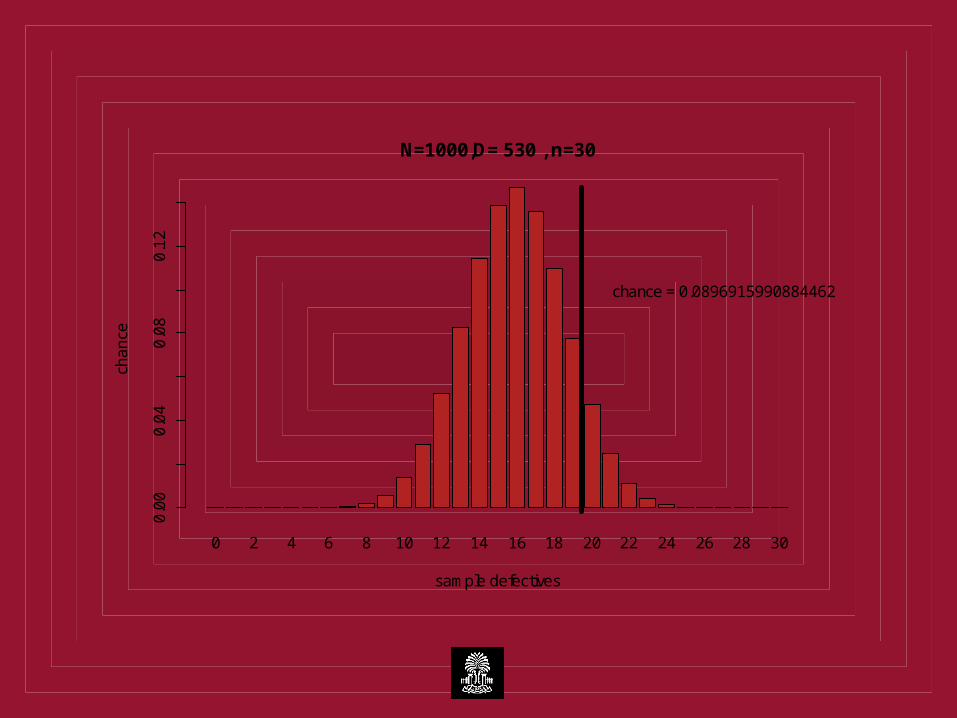
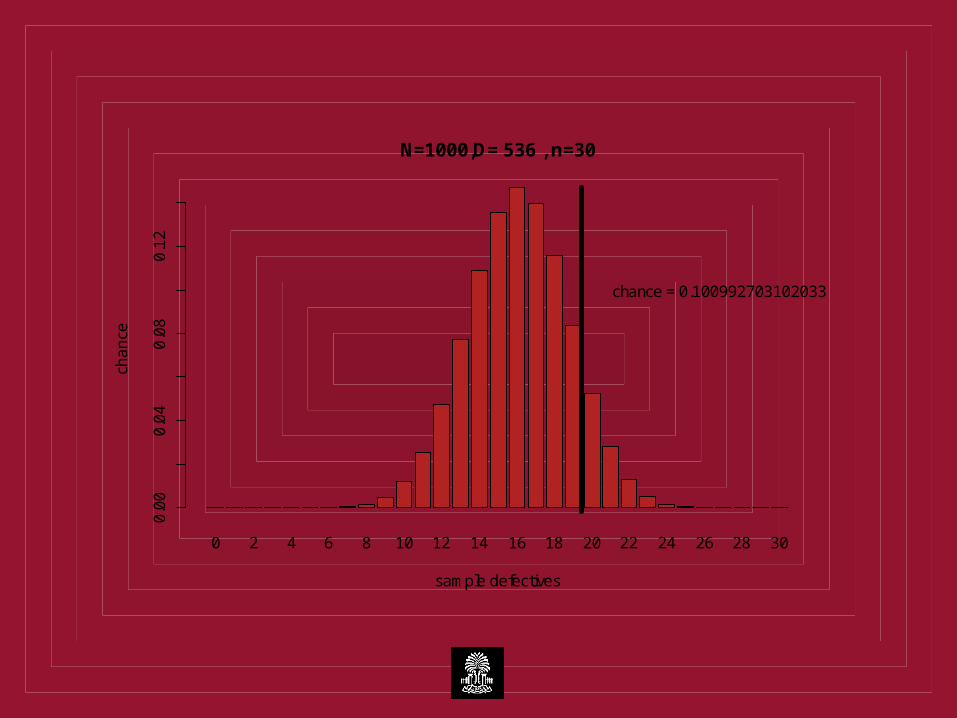
D = 530 chance = 0.0897D = 530 chance = 0.0897 D = 536 chance = 0.10099D = 536 chance = 0.10099
A Confidence Bound ProcedureA Confidence Bound Procedure
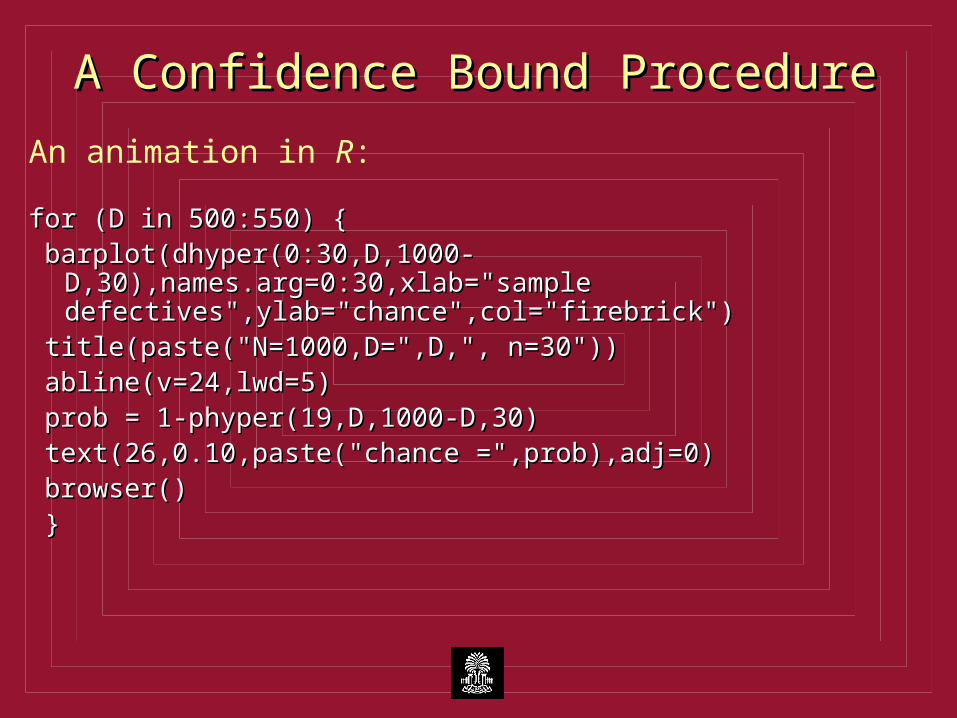
An animation in R:
for (D in 500:550) {for (D in 500:550) { barplot(dhyper(0:30,D,1000-D,30),names.arg=0:30,xlab="sample barplot(dhyper(0:30,D,1000-D,30),names.arg=0:30,xlab="sample
defectives",ylab="chance",col="firebrick")defectives",ylab="chance",col="firebrick") title(paste("N=1000,D=",D,", n=30"))title(paste("N=1000,D=",D,", n=30")) abline(v=24,lwd=5)abline(v=24,lwd=5) prob = 1-phyper(19,D,1000-D,30)prob = 1-phyper(19,D,1000-D,30) text(26,0.10,paste("chance =",prob),adj=0)text(26,0.10,paste("chance =",prob),adj=0) browser()browser() }}
0 2 4 6 8 10 12 14 16 18 20 22 24 26 28 30
sample defectives
cha
nce
0.0
00
.04
0.0
80
.12
N=1000,D= 500 , n=30
chance = 0.0468456273779367
0 2 4 6 8 10 12 14 16 18 20 22 24 26 28 30
sample defectives
cha
nce
0.0
00
.02
0.0
40
.06
0.0
80
.10
0.1
20
.14
N=1000,D= 510 , n=30
chance = 0.0587904753106817
0 2 4 6 8 10 12 14 16 18 20 22 24 26 28 30
sample defectives
cha
nce
0.0
00
.02
0.0
40
.06
0.0
80
.10
0.1
20
.14
N=1000,D= 520 , n=30
chance = 0.0729957646645837
0 2 4 6 8 10 12 14 16 18 20 22 24 26 28 30
sample defectives
cha
nce
0.0
00
.04
0.0
80
.12
N=1000,D= 530 , n=30
chance = 0.0896915990884462
0 2 4 6 8 10 12 14 16 18 20 22 24 26 28 30
sample defectives
cha
nce
0.0
00
.04
0.0
80
.12
N=1000,D= 536 , n=30
chance = 0.100992703102033
A Confidence Bound ProcedureA Confidence Bound Procedure
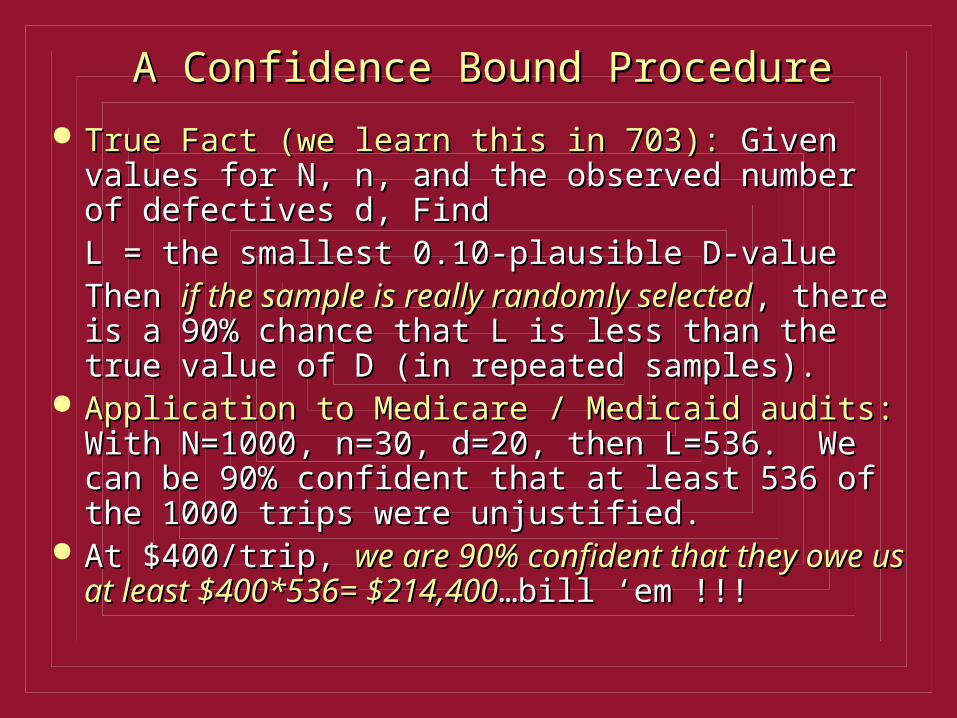
True Fact (we learn this in 703):True Fact (we learn this in 703): Given values for N, Given values for N, n, and the observed number of defectives d, Find n, and the observed number of defectives d, Find
L = the smallest 0.10-plausible D-valueL = the smallest 0.10-plausible D-valueThen Then if the sample is really randomly selectedif the sample is really randomly selected, there , there is a 90% chance that L is less than the true value of is a 90% chance that L is less than the true value of D (in repeated samples).D (in repeated samples).
Application to Medicare / Medicaid audits:Application to Medicare / Medicaid audits: With With N=1000, n=30, d=20, then L=536. We can be 90% N=1000, n=30, d=20, then L=536. We can be 90% confident that at least 536 of the 1000 trips were confident that at least 536 of the 1000 trips were unjustified.unjustified.
At $400/trip, At $400/trip, we are 90% confident that they owe us we are 90% confident that they owe us at least $400*536= $214,400at least $400*536= $214,400…bill ‘em !!!…bill ‘em !!!
Design-based vs. Design-based vs. Model-based proceduresModel-based procedures
““All statistical methods have assumptions” All statistical methods have assumptions” What What does this confidence bound procedure assume?does this confidence bound procedure assume?
More correctly stated: More correctly stated: MostMost statistical methods statistical methods have assumptions, varying widely in their levels have assumptions, varying widely in their levels of robustness, subjectivity, and check-ability. of robustness, subjectivity, and check-ability. They come in layers.They come in layers.
Case(s) in point: linear regression of Y on X:Case(s) in point: linear regression of Y on X: Design-basedDesign-based As a (frequentist) model with encountered dataAs a (frequentist) model with encountered data As a Bayesian model with encountered dataAs a Bayesian model with encountered data

Design-based vs. Design-based vs. Model-based proceduresModel-based procedures
Advantages of Design-Based procedures: why is Advantages of Design-Based procedures: why is this woman wearing a blindfold???this woman wearing a blindfold???

Design-based vs. Design-based vs. Model-based proceduresModel-based procedures
A typical Medicare legal hearing…A typical Medicare legal hearing…

Design-based vs. Design-based vs. Model-based proceduresModel-based procedures
Some advantages of Model-Based procedures: Some advantages of Model-Based procedures: Greater breadth of application / flexibilityGreater breadth of application / flexibility When the model is a good one, dramatic increase When the model is a good one, dramatic increase
in efficiency (greater accuracy / less expensive)in efficiency (greater accuracy / less expensive)

Thoughts About the Future of StatisticsThoughts About the Future of Statistics
More (and more complicated) model-based More (and more complicated) model-based methods for decision-makingmethods for decision-making
More use of statistics in the law (and with it, more More use of statistics in the law (and with it, more use of design-based procedures)use of design-based procedures)
Immense data sets = new challenges for analysisImmense data sets = new challenges for analysis More use of exact analyses - less reliance on More use of exact analyses - less reliance on
“large sample” approximate procedures“large sample” approximate procedures Widespread accreditation of statisticians (pstatWidespread accreditation of statisticians (pstat®®)) R , mateys !!!R , mateys !!!

Thoughts About the Future of StatisticsThoughts About the Future of Statistics
www.R-project.orgwww.R-project.org
One Good Picture is Worth a Thousand One Good Picture is Worth a Thousand p-values p-values
““The purpose of a statistician is to The purpose of a statistician is to arrange the data so that statistics are arrange the data so that statistics are not necessary to understand them.”not necessary to understand them.”
Lance WallerLance Waller(attributed to John Tukey)(attributed to John Tukey)

One Good Picture is Worth a Thousand One Good Picture is Worth a Thousand p-values p-values
700600500400300200
150
100
50
At Bats (number of attempts)
Run
s sc
ored
American League Batters, 1985
Rickey Henderson

One Good Picture is Worth a Thousand One Good Picture is Worth a Thousand p-values p-values
South Carolina

One Good Picture is Worth a Thousand One Good Picture is Worth a Thousand p-valuesp-values
www.youtube.comwww.youtube.com The Joy of StatsThe Joy of Stats
(BBC - Hans Rosling)(BBC - Hans Rosling)
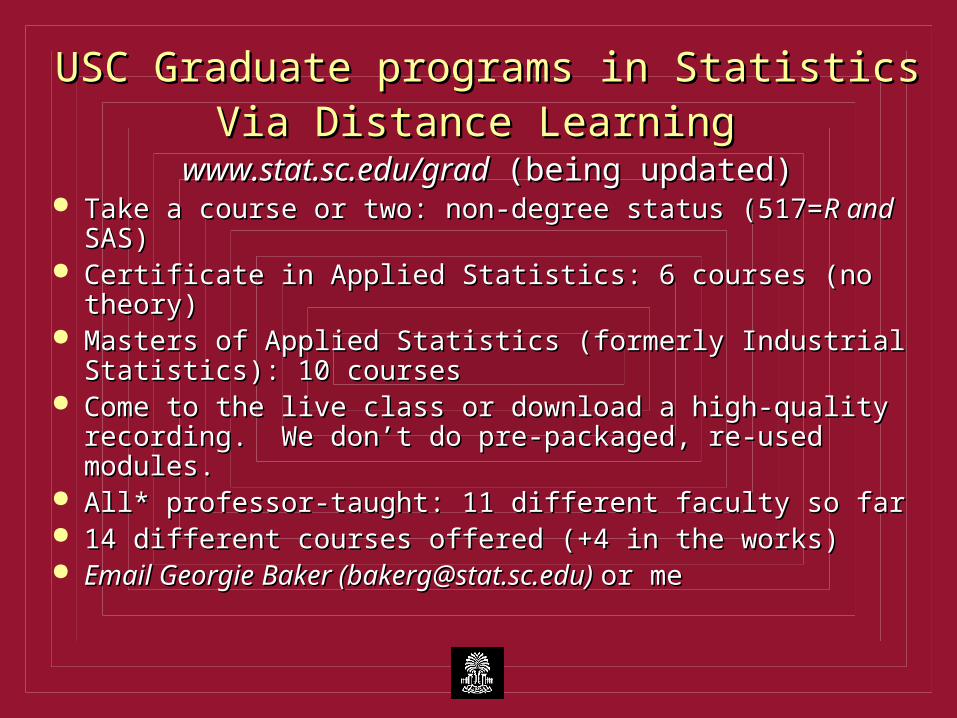
USC Graduate programs in StatisticsUSC Graduate programs in StatisticsVia Distance Learning Via Distance Learning
www.stat.sc.edu/grad www.stat.sc.edu/grad (being updated)(being updated) Take a course or two: non-degree status (517=Take a course or two: non-degree status (517=R and R and SAS)SAS) Certificate in Applied Statistics: 6 courses (no theory)Certificate in Applied Statistics: 6 courses (no theory) Masters of Applied Statistics (formerly Industrial Statistics): Masters of Applied Statistics (formerly Industrial Statistics):
10 courses10 courses Come to the live class or download a high-quality Come to the live class or download a high-quality
recording. We don’t do pre-packaged, re-used modules.recording. We don’t do pre-packaged, re-used modules. All* professor-taught: 11 different faculty so farAll* professor-taught: 11 different faculty so far 14 different courses offered (+4 in the works)14 different courses offered (+4 in the works) Email Georgie Baker ([email protected]) Email Georgie Baker ([email protected]) or meor me
Related Documents