The Journey to the End of Smoking A Personal and Population Perspective Carlo C. DiClemente, PhD, Janine C. Delahanty, PhD, Robert M. Fiedler, JD Background: Smoking cessation is best represented as a journey and not a single event. This article chronicles the path of change for the population of smokers in Maryland. Purpose: This study compared the population of ever-smokers in Maryland over three time points (2000, 2002, and 2006) examining how the population of ever-smokers shifted over time. Methods: Analysis of process of change and social influence variables conducted using data from the Maryland Adult Tobacco Surveys (MATS) administered in 2000, 2002, and 2006. Results: Analyses indicated an increasing percentage of ever-smokers (100 lifetime cigarettes) who have successfully quit and maintained cessation for more than 5 years. By 2006, the population of current adult smokers (aged 18 years) was smaller but seemed less interested in and able to quit. More 2006 smokers were in earlier stages of change for cessation and not interested in or planning to quit in the near term. Many had unsuccessfully tried to quit, with a substantial minority fınding that cessation products found effective in research were not effective for them. Despite past failures, the vast majority expects to quit, has considered quitting, and believes that they will likely succeed eventually. Larger percentages of 2006 smokers are being advised to quit by medical professionals, are accessing empirically supported quit-smoking aids, and have multiple quit attempts. They also smoked every day for more years, smoked as many cigarettes per day, and had environments as fılled with smoking as their 2000 and 2002 counterparts. Conclusions: Increasing successful cessation would require not only appropriate use of effective products but also successful negotiation of important tasks in the cessation journey. Health literacy and a consumer perspective can help to bridge gaps in the dissemination and effective use of empirically supported treatments. (Am J Prev Med 2010;38(3S):S418 –S428) © 2010 Published by Elsevier Inc. on behalf of American Journal of Preventive Medicine. Introduction D espite the substantial diffıculties of quitting nic- otine addiction and low rates of sustained suc- cess for individual cessation attempts, tobacco use in the U.S. has plummeted over the past 40 years. National estimates indicate that smoking declined signif- icantly (17%) from 1965 (42%) to 1990 (25%). The de- cline has been modest since 1990 with prevalence rates at 23.3% in 2000 1 and 19.8% in 2007. 2 In 2007, the population of U.S. adult current smokers was an estimated 19.8% (43.4 million), with 77.8% (33.8 million) smoking every day and 22.2% (9.6 million) smoking only some days. 2 However, among the esti- mated 90.7 million adults who were ever smokers (i.e., had smoked at least 100 cigarettes in their lifetimes), over half (52.1%; 47.3 million) were no longer smoking. 2,3 Moreover, current adult smokers have not given up on quitting smoking, with 70% reporting that they want to quit and almost half (44%) reporting a quit attempt in the past year. 4 Unfortunately, the majority of those making a quit attempt failed to sustain it, with only 5% successful at 3 months for smokers quitting “cold turkey” (i.e., abruptly and without assistance). 5 Among smokers quit- ting on their own, only one third remained abstinent after 2 days, only one quarter at 7 days, and less than one in fıve remained abstinent (19%) at 1 month. 6 Overall, less than 5% of those who had quit smoking in the past year were successful in maintaining their abstinence from smoking for 3–12 months. 1 Successful cessation is greater if empir- ically supported products and services are used with suc- cess at 1 year reaching from 10% to 30%. 5,7–9 From the Department of Psychology (DiClemente, Delahanty), University of Maryland, Baltimore County; and Maryland Department of Health and Mental Hygiene (Fiedler), Baltimore, Maryland Address correspondence and reprint requests to: Carlo C. DiClemente, PhD, University of Maryland Baltimore County, 1000 Hilltop Circle, Bal- timore MD 21250. E-mail: [email protected]. 0749-3797/00/$17.00 doi: 10.1016/j.amepre.2009.12.010 S418 Am J Prev Med 2010;38(3S):S418 –S428 © 2010 Published by Elsevier Inc. on behalf of American Journal of Preventive Medicine

Welcome message from author
This document is posted to help you gain knowledge. Please leave a comment to let me know what you think about it! Share it to your friends and learn new things together.
Transcript
I
DuNic2
wm
FoM
Pt
S
The Journey to the End of SmokingA Personal and Population Perspective
Carlo C. DiClemente, PhD, Janine C. Delahanty, PhD, Robert M. Fiedler, JD
Background: Smoking cessation is best represented as a journey and not a single event. This articlechronicles the path of change for the population of smokers in Maryland.
Purpose: This study compared the population of ever-smokers in Maryland over three time points(2000, 2002, and 2006) examining how the population of ever-smokers shifted over time.
Methods: Analysis of process of change and social influence variables conducted using data fromthe Maryland Adult Tobacco Surveys (MATS) administered in 2000, 2002, and 2006.
Results: Analyses indicated an increasing percentage of ever-smokers (100 lifetime cigarettes) whohave successfully quit and maintained cessation for more than 5 years. By 2006, the population ofcurrent adult smokers (aged �18 years) was smaller but seemed less interested in and able to quit.More 2006 smokers were in earlier stages of change for cessation and not interested in or planning toquit in the near term. Many had unsuccessfully tried to quit, with a substantial minority fınding thatcessation products found effective in research were not effective for them. Despite past failures, thevast majority expects to quit, has considered quitting, and believes that they will likely succeedeventually. Larger percentages of 2006 smokers are being advised to quit bymedical professionals, areaccessing empirically supported quit-smoking aids, and have multiple quit attempts. They alsosmoked every day formore years, smoked asmany cigarettes per day, and had environments as fılledwith smoking as their 2000 and 2002 counterparts.
Conclusions: Increasing successful cessation would require not only appropriate use of effectiveproducts but also successful negotiation of important tasks in the cessation journey. Health literacyand a consumer perspective can help to bridge gaps in the dissemination and effective use ofempirically supported treatments.(Am J Prev Med 2010;38(3S):S418–S428) © 2010 Published by Elsevier Inc. on behalf of American Journal ofPreventive Medicine.
smhhMqqpqaat2r5sfi
ntroductionespite the substantial diffıculties of quitting nic-otine addiction and low rates of sustained suc-cess for individual cessation attempts, tobacco
se in the U.S. has plummeted over the past 40 years.ational estimates indicate that smoking declined signif-cantly (17%) from 1965 (42%) to 1990 (25%). The de-line has been modest since 1990 with prevalence rates at3.3% in 20001 and 19.8% in 2007.2
In 2007, the population of U.S. adult current smokersas an estimated 19.8% (43.4 million), with 77.8% (33.8illion) smoking every day and 22.2% (9.6 million)
rom the Department of Psychology (DiClemente, Delahanty), Universityf Maryland, Baltimore County; and Maryland Department of Health andental Hygiene (Fiedler), Baltimore, MarylandAddress correspondence and reprint requests to: Carlo C. DiClemente,
hD, University of Maryland Baltimore County, 1000 Hilltop Circle, Bal-imore MD 21250. E-mail: [email protected].
c0749-3797/00/$17.00doi: 10.1016/j.amepre.2009.12.010
418 Am J Prev Med 2010;38(3S):S418–S428 © 2010 Published
moking only some days.2 However, among the esti-ated 90.7 million adults who were ever smokers (i.e.,ad smoked at least 100 cigarettes in their lifetimes), overalf (52.1%; 47.3 million) were no longer smoking.2,3
oreover, current adult smokers have not given up onuitting smoking, with 70% reporting that they want touit and almost half (44%) reporting a quit attempt in theast year.4 Unfortunately, the majority of those making auit attempt failed to sustain it, with only 5% successfult 3 months for smokers quitting “cold turkey” (i.e.,bruptly and without assistance).5 Among smokers quit-ing on their own, only one third remained abstinent afterdays, only one quarter at 7 days, and less than one in fıveemained abstinent (19%) at 1 month.6 Overall, less than% of those who had quit smoking in the past year wereuccessful in maintaining their abstinence from smokingor 3–12months.1 Successful cessation is greater if empir-cally supported products and services are used with suc-
ess at 1 year reaching from 10% to 30%.5,7–9by Elsevier Inc. on behalf of American Journal of PreventiveMedicine
aToittencsoansa
otieAhtefna
smltmmis
sinacasi
i2strattihcjtcspswsc
s22rnc
FN
DiClemente et al / Am J Prev Med 2010;38(3S):S418–S428 S419
M
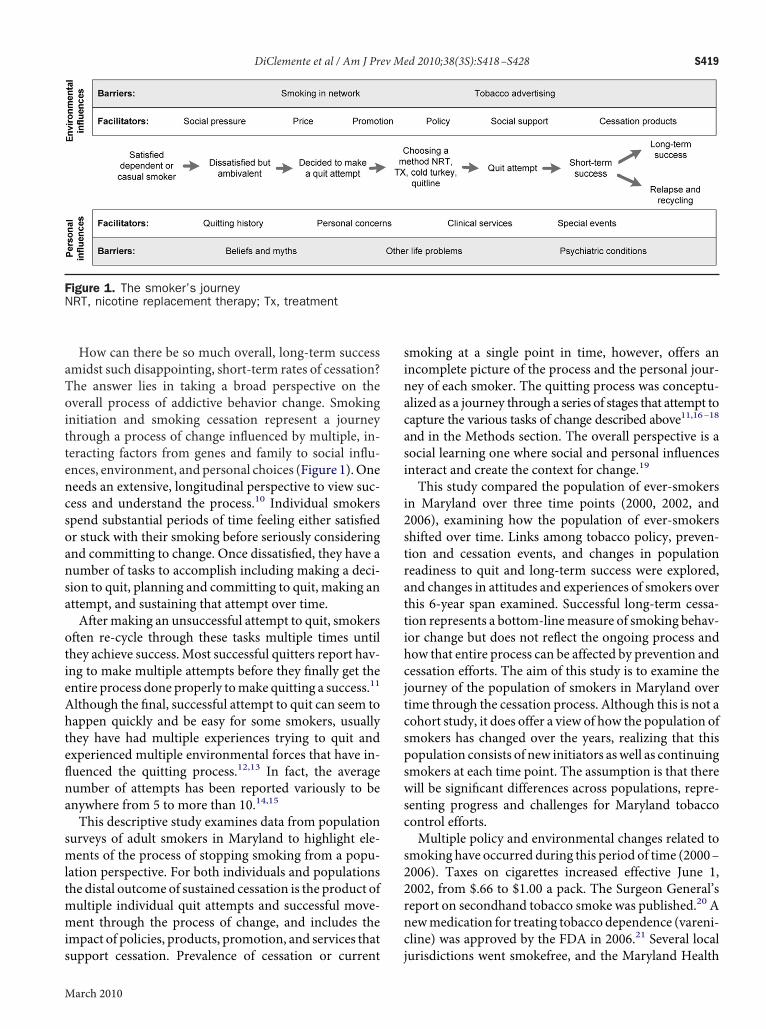
How can there be so much overall, long-term successmidst such disappointing, short-term rates of cessation?he answer lies in taking a broad perspective on theverall process of addictive behavior change. Smokingnitiation and smoking cessation represent a journeyhrough a process of change influenced by multiple, in-eracting factors from genes and family to social influ-nces, environment, and personal choices (Figure 1).Oneeeds an extensive, longitudinal perspective to view suc-ess and understand the process.10 Individual smokerspend substantial periods of time feeling either satisfıedr stuck with their smoking before seriously consideringnd committing to change. Once dissatisfıed, they have aumber of tasks to accomplish including making a deci-ion to quit, planning and committing to quit, making anttempt, and sustaining that attempt over time.After making an unsuccessful attempt to quit, smokersften re-cycle through these tasks multiple times untilhey achieve success. Most successful quitters report hav-ng to make multiple attempts before they fınally get thentire process done properly tomake quitting a success.11
lthough the fınal, successful attempt to quit can seem toappen quickly and be easy for some smokers, usuallyhey have had multiple experiences trying to quit andxperienced multiple environmental forces that have in-luenced the quitting process.12,13 In fact, the averageumber of attempts has been reported variously to benywhere from 5 to more than 10.14,15
This descriptive study examines data from populationurveys of adult smokers in Maryland to highlight ele-ents of the process of stopping smoking from a popu-
ation perspective. For both individuals and populationshe distal outcome of sustained cessation is the product ofultiple individual quit attempts and successful move-ent through the process of change, and includes the
mpact of policies, products, promotion, and services that
igure 1. The smoker’s journeyRT, nicotine replacement therapy; Tx, treatment
upport cessation. Prevalence of cessation or current j
arch 2010
moking at a single point in time, however, offers anncomplete picture of the process and the personal jour-ey of each smoker. The quitting process was conceptu-lized as a journey through a series of stages that attempt toapture the various tasks of change described above11,16–18
nd in the Methods section. The overall perspective is aocial learning one where social and personal influencesnteract and create the context for change.19
This study compared the population of ever-smokersn Maryland over three time points (2000, 2002, and006), examining how the population of ever-smokershifted over time. Links among tobacco policy, preven-ion and cessation events, and changes in populationeadiness to quit and long-term success were explored,nd changes in attitudes and experiences of smokers overhis 6-year span examined. Successful long-term cessa-ion represents a bottom-linemeasure of smoking behav-or change but does not reflect the ongoing process andow that entire process can be affected by prevention andessation efforts. The aim of this study is to examine theourney of the population of smokers in Maryland overime through the cessation process. Although this is not aohort study, it does offer a view of how the population ofmokers has changed over the years, realizing that thisopulation consists of new initiators aswell as continuingmokers at each time point. The assumption is that thereill be signifıcant differences across populations, repre-enting progress and challenges for Maryland tobaccoontrol efforts.Multiple policy and environmental changes related to
moking have occurred during this period of time (2000–006). Taxes on cigarettes increased effective June 1,002, from $.66 to $1.00 a pack. The Surgeon General’seport on secondhand tobacco smoke was published.20 Aewmedication for treating tobacco dependence (vareni-line) was approved by the FDA in 2006.21 Several local
urisdictions went smokefree, and the Maryland Health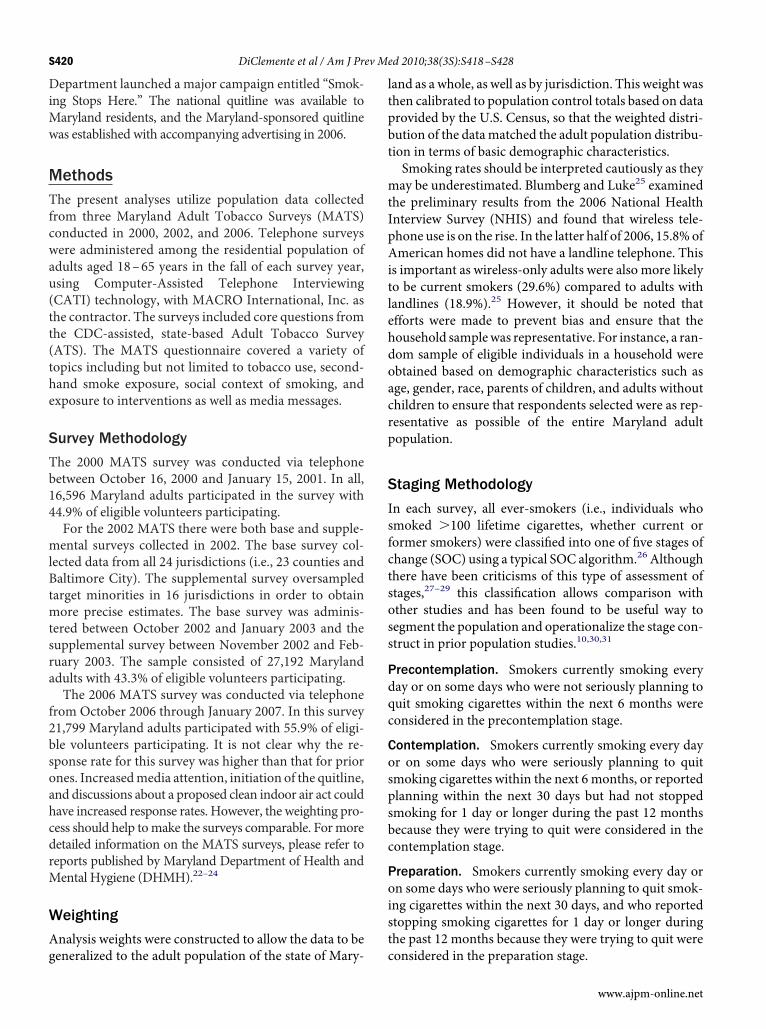
DiMw
MTfcwau(tt(the
S
Tb14
mlBtmtsra
f2bsoahcdrM
W
Ag
ltpbt
mtIpAitlehdoacrp
S
Isfctsoss
Pdqc
Cospsbc
Poist
S420 DiClemente et al / Am J Prev Med 2010;38(3S):S418–S428
epartment launched a major campaign entitled “Smok-ng Stops Here.” The national quitline was available toaryland residents, and the Maryland-sponsored quitlineas established with accompanying advertising in 2006.
ethodshe present analyses utilize population data collectedrom three Maryland Adult Tobacco Surveys (MATS)onducted in 2000, 2002, and 2006. Telephone surveysere administered among the residential population ofdults aged 18–65 years in the fall of each survey year,sing Computer-Assisted Telephone InterviewingCATI) technology, with MACRO International, Inc. ashe contractor. The surveys included core questions fromhe CDC-assisted, state-based Adult Tobacco SurveyATS). The MATS questionnaire covered a variety ofopics including but not limited to tobacco use, second-and smoke exposure, social context of smoking, andxposure to interventions as well as media messages.
urvey Methodology
he 2000 MATS survey was conducted via telephoneetween October 16, 2000 and January 15, 2001. In all,6,596 Maryland adults participated in the survey with4.9% of eligible volunteers participating.For the 2002 MATS there were both base and supple-ental surveys collected in 2002. The base survey col-
ected data from all 24 jurisdictions (i.e., 23 counties andaltimore City). The supplemental survey oversampledarget minorities in 16 jurisdictions in order to obtainore precise estimates. The base survey was adminis-
ered between October 2002 and January 2003 and theupplemental survey between November 2002 and Feb-uary 2003. The sample consisted of 27,192 Marylanddults with 43.3% of eligible volunteers participating.The 2006 MATS survey was conducted via telephone
rom October 2006 through January 2007. In this survey1,799 Maryland adults participated with 55.9% of eligi-le volunteers participating. It is not clear why the re-ponse rate for this survey was higher than that for priornes. Increasedmedia attention, initiation of the quitline,nd discussions about a proposed clean indoor air act couldave increased response rates. However, the weighting pro-ess should help tomake the surveys comparable. Formoreetailed information on the MATS surveys, please refer toeports published by Maryland Department of Health andental Hygiene (DHMH).22–24
eighting
nalysis weights were constructed to allow the data to be
eneralized to the adult population of the state of Mary- cand as a whole, as well as by jurisdiction. This weight washen calibrated to population control totals based on datarovided by the U.S. Census, so that the weighted distri-ution of the datamatched the adult population distribu-ion in terms of basic demographic characteristics.Smoking rates should be interpreted cautiously as theyay be underestimated. Blumberg and Luke25 examined
he preliminary results from the 2006 National Healthnterview Survey (NHIS) and found that wireless tele-hone use is on the rise. In the latter half of 2006, 15.8% ofmerican homes did not have a landline telephone. Thiss important as wireless-only adults were also more likelyo be current smokers (29.6%) compared to adults withandlines (18.9%).25 However, it should be noted thatfforts were made to prevent bias and ensure that theousehold samplewas representative. For instance, a ran-om sample of eligible individuals in a household werebtained based on demographic characteristics such asge, gender, race, parents of children, and adults withouthildren to ensure that respondents selected were as rep-esentative as possible of the entire Maryland adultopulation.
taging Methodology
n each survey, all ever-smokers (i.e., individuals whomoked �100 lifetime cigarettes, whether current orormer smokers) were classifıed into one of fıve stages ofhange (SOC) using a typical SOC algorithm.26 Althoughhere have been criticisms of this type of assessment oftages,27–29 this classifıcation allows comparison withther studies and has been found to be useful way toegment the population and operationalize the stage con-truct in prior population studies.10,30,31
recontemplation. Smokers currently smoking everyay or on some days who were not seriously planning touit smoking cigarettes within the next 6 months wereonsidered in the precontemplation stage.
ontemplation. Smokers currently smoking every dayr on some days who were seriously planning to quitmoking cigarettes within the next 6 months, or reportedlanning within the next 30 days but had not stoppedmoking for 1 day or longer during the past 12 monthsecause they were trying to quit were considered in theontemplation stage.
reparation. Smokers currently smoking every day orn some days who were seriously planning to quit smok-ng cigarettes within the next 30 days, and who reportedtopping smoking cigarettes for 1 day or longer duringhe past 12 months because they were trying to quit were
onsidered in the preparation stage.www.ajpm-online.net
Arw
Mwycet
Lftecp
M
Tbtfsdsiqtvbesc
aa
Abwptd
R
E
Ossiip21wtF1mMsms
c
F2
DiClemente et al / Am J Prev Med 2010;38(3S):S418–S428 S421
M
ction. Ever-smokers (100 lifetime cigarettes) not cur-ently smoking who stopped within the past 6 monthsere considered in the action stage.
aintenance. Ever-smokers not currently smokingho stopped for longer than 6 months but less than 5ears were considered in themaintenance stage. A 5-yearutoffwas used arbitrarily based on cancer recoverymod-ls and to concentrate on successful quitting within theimeframe of this study.
ong-term maintenance. Ever-smokers who success-ully quit smokingmore than 5 years agowere consideredo be in long-term maintenance. These individuals havestablished a newpattern of behavior and exited the cycle ofhange. They are included to examine overall change in theopulation of smokers inMaryland over this 6-year period.
easures
he MATS survey is focused almost exclusively on to-acco use and included demographic information, atti-udes and intentions about smoking, environmental andamilial tobacco smoking, experiences with quittingmoking, access to quitting advice and resources, andescriptions of current tobacco use including items as-essing dependence (time to fırst cigarette in the morn-ng) and cessation activities. These surveys also includeduestions about alternative tobacco use (e.g., chewingobacco, cigars, pipes, bidis, and kreteks). However, indi-iduals reporting any current use of these types of to-acco were excluded from analyses as this study focusedxclusively on cigarette smoking. Some former smokers in theurveys (i.e., individuals in action or maintenance) reportedurrent alternative tobacco use (12%, 7%, 9%, respectively
igure 2. Distribution of the stages of change for smokin
002, and 2006arch 2010
cross the surveys) and were excluded from the currentnalyses.Comparisons based on stage and survey wave usedNOVA and chi-square analyses, where appropriate. Alletween-stage and across-wave post hoc comparisonsere evaluated using Tukey’s B, with an alpha level of�0.05. Interpretations, however, should be made cau-iously as weighted data and large N’s can make smallifferences signifıcant.
esults
ver-Smokers and Current Smokers
ver the 6-year period from 2000 to 2006 there wereignifıcant reductions in the prevalence of currentmokers (individuals who smoked at least one cigaretten the past 30 days), from an estimated 16.9% of adultsn 2000 to 14.8% in 2002 and then to 13.8% in 2006,aralleling the national 3% decline from 2000 to007.24 Smoking rates among men declined from8.8% in 2000 to 15.9% in 2006 and rates amongomen declined from 15.2% to 11.8%. Prevalence inhe MATS survey differs from the Behavioral Riskactor Survey (BFRSS) estimate for Maryland of7.7%. Differences could be due to data collectionethodologies and the single focus on tobacco of theATS increasing non-participation among current
mokers. However, differences should not compro-ise the comparisons across surveys in this study as allurveys used the same methodology.By dividing the population into various stages of
hange at each survey time point, the study offers a dif-ferentiated view ofthe population’s jour-ney through the pro-cess of smoking ces-sation (Figure 2). Amajority ofMarylandever-smokers havebeen quit for morethan 6months (main-tenance and long-term maintenance)ranging from 58.3%in 2000 to 61.8% in2002 and decreasingslightly back to 59.2%in 2006 according toweighted estimates.Although nicotine ishighly addictive andssation in Maryland in 2000,
g ce smoking is diffıcult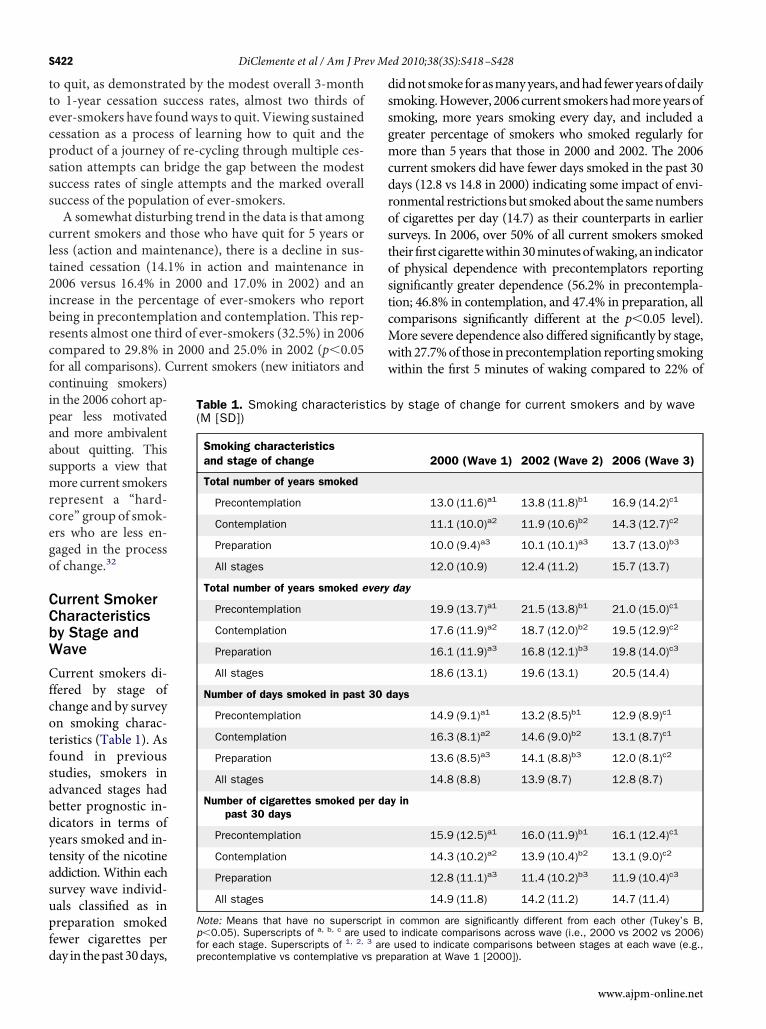
ttecpsss
clt2ibrcfcipaasmrcego
CCbW
Cfcotfsabdytasupfd
dssgmcdrostostcMww
S422 DiClemente et al / Am J Prev Med 2010;38(3S):S418–S428
o quit, as demonstrated by the modest overall 3-montho 1-year cessation success rates, almost two thirds ofver-smokers have foundways to quit. Viewing sustainedessation as a process of learning how to quit and theroduct of a journey of re-cycling through multiple ces-ation attempts can bridge the gap between the modestuccess rates of single attempts and the marked overalluccess of the population of ever-smokers.A somewhat disturbing trend in the data is that among
urrent smokers and those who have quit for 5 years oress (action and maintenance), there is a decline in sus-ained cessation (14.1% in action and maintenance in006 versus 16.4% in 2000 and 17.0% in 2002) and anncrease in the percentage of ever-smokers who reporteing in precontemplation and contemplation. This rep-esents almost one third of ever-smokers (32.5%) in 2006ompared to 29.8% in 2000 and 25.0% in 2002 (p�0.05or all comparisons). Current smokers (new initiators andontinuing smokers)n the 2006 cohort ap-ear less motivatednd more ambivalentbout quitting. Thisupports a view thatore current smokersepresent a “hard-ore” group of smok-rs who are less en-aged in the processf change.32
urrent Smokerharacteristicsy Stage andave
urrent smokers di-fered by stage ofhange and by surveyn smoking charac-eristics (Table 1). Asound in previoustudies, smokers indvanced stages hadetter prognostic in-icators in terms ofears smoked and in-ensity of the nicotineddiction. Within eachurvey wave individ-als classifıed as inreparation smokedewer cigarettes per
Table 1. Smoking characteris(M [SD])
Smoking characteristicsand stage of change
Total number of years smoked
Precontemplation
Contemplation
Preparation
All stages
Total number of years smoked e
Precontemplation
Contemplation
Preparation
All stages
Number of days smoked in past
Precontemplation
Contemplation
Preparation
All stages
Number of cigarettes smoked ppast 30 days
Precontemplation
Contemplation
Preparation
All stages
Note: Means that have no superscp�0.05). Superscripts of a, b, c are u
1, 2,
ay in thepast30days,for each stage. Superscripts of areprecontemplative vs contemplative vs pre
idnot smoke forasmanyyears, andhadfeweryearsofdailymoking.However, 2006current smokershadmoreyearsofmoking, more years smoking every day, and included areater percentage of smokers who smoked regularly forore than 5 years that those in 2000 and 2002. The 2006urrent smokers did have fewer days smoked in the past 30ays (12.8 vs 14.8 in 2000) indicating some impact of envi-onmental restrictions but smokedabout the samenumbersf cigarettes per day (14.7) as their counterparts in earlierurveys. In 2006, over 50% of all current smokers smokedheir fırst cigarettewithin30minutesofwaking, an indicatorf physical dependence with precontemplators reportingignifıcantly greater dependence (56.2% in precontempla-ion; 46.8% in contemplation, and 47.4% in preparation, allomparisons signifıcantly different at the p�0.05 level).ore severe dependence also differed signifıcantly by stage,ith 27.7%of those inprecontemplation reporting smokingithin the fırst 5 minutes of waking compared to 22% of
by stage of change for current smokers and by wave
2000 (Wave 1) 2002 (Wave 2) 2006 (Wave 3)
13.0 (11.6)a1 13.8 (11.8)b1 16.9 (14.2)c1
11.1 (10.0)a2 11.9 (10.6)b2 14.3 (12.7)c2
10.0 (9.4)a3 10.1 (10.1)a3 13.7 (13.0)b3
12.0 (10.9) 12.4 (11.2) 15.7 (13.7)
day
19.9 (13.7)a1 21.5 (13.8)b1 21.0 (15.0)c1
17.6 (11.9)a2 18.7 (12.0)b2 19.5 (12.9)c2
16.1 (11.9)a3 16.8 (12.1)b3 19.8 (14.0)c3
18.6 (13.1) 19.6 (13.1) 20.5 (14.4)
ays
14.9 (9.1)a1 13.2 (8.5)b1 12.9 (8.9)c1
16.3 (8.1)a2 14.6 (9.0)b2 13.1 (8.7)c1
13.6 (8.5)a3 14.1 (8.8)b3 12.0 (8.1)c2
14.8 (8.8) 13.9 (8.7) 12.8 (8.7)
y in
15.9 (12.5)a1 16.0 (11.9)b1 16.1 (12.4)c1
14.3 (10.2)a2 13.9 (10.4)b2 13.1 (9.0)c2
12.8 (11.1)a3 11.4 (10.2)b3 11.9 (10.4)c3
14.9 (11.8) 14.2 (11.2) 14.7 (11.4)
n common are significantly different from each other (Tukey’s B,to indicate comparisons across wave (i.e., 2000 vs 2002 vs 2006)
tics
very
30 d
er da
ript ised3
used to indicate comparisons between stages at each wave (e.g.,paration at Wave 1 [2000]).
www.ajpm-online.net
st
SE
Imfrisshtt2t(mt
tqsThdarbeitrme
Eo
T
N(va
s prep
DiClemente et al / Am J Prev Med 2010;38(3S):S418–S428 S423
M
mokers in contemplation and 19.3% of those in prepara-ion (p�0.05 for all comparisons).
moking History, Motivation, andxpectations About Quitting
n contrast, smoking history for current smokers differedinimally by stage and survey wave. Current smokers
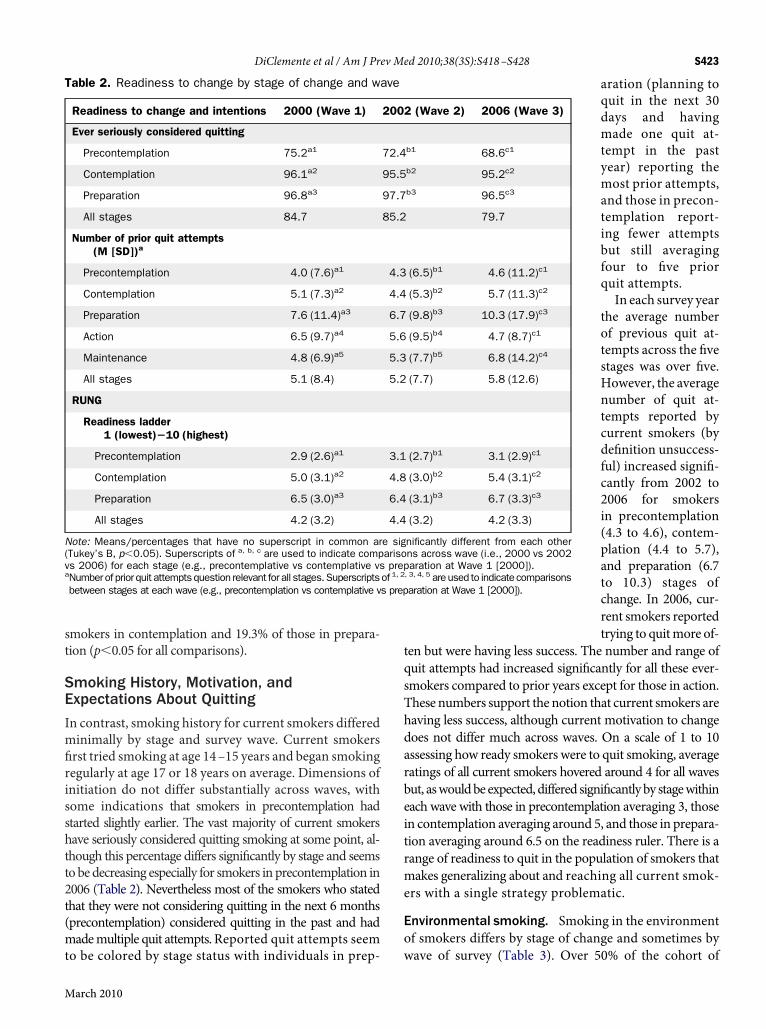
ırst tried smoking at age 14–15 years and began smokingegularly at age 17 or 18 years on average. Dimensions ofnitiation do not differ substantially across waves, withome indications that smokers in precontemplation hadtarted slightly earlier. The vast majority of current smokersave seriously considered quitting smoking at some point, al-hough this percentage differs signifıcantly by stage and seemsobedecreasing especially for smokers in precontemplation in006 (Table 2). Nevertheless most of the smokers who statedhat they were not considering quitting in the next 6 monthsprecontemplation) considered quitting in the past and hadademultiple quit attempts. Reported quit attempts seem
able 2. Readiness to change by stage of change and wa
Readiness to change and intentions 2000 (Wave 1)
Ever seriously considered quitting
Precontemplation 75.2a1
Contemplation 96.1a2
Preparation 96.8a3
All stages 84.7
Number of prior quit attempts(M [SD])a
Precontemplation 4.0 (7.6)a1
Contemplation 5.1 (7.3)a2
Preparation 7.6 (11.4)a3
Action 6.5 (9.7)a4
Maintenance 4.8 (6.9)a5
All stages 5.1 (8.4)
RUNG
Readiness ladder1 (lowest)�10 (highest)
Precontemplation 2.9 (2.6)a1
Contemplation 5.0 (3.1)a2
Preparation 6.5 (3.0)a3
All stages 4.2 (3.2)
ote: Means/percentages that have no superscript in common arTukey’s B, p�0.05). Superscripts of a, b, c are used to indicate comps 2006) for each stage (e.g., precontemplative vs contemplative vsNumberof prior quit attemptsquestion relevant for all stages.Superscriptsbetween stages at each wave (e.g., precontemplation vs contemplative v
o be colored by stage status with individuals in prep- w
arch 2010
aration (planning toquit in the next 30days and havingmade one quit at-tempt in the pastyear) reporting themost prior attempts,and those in precon-templation report-ing fewer attemptsbut still averagingfour to fıve priorquit attempts.In each survey year
the average numberof previous quit at-tempts across the fıvestages was over fıve.However, the averagenumber of quit at-tempts reported bycurrent smokers (bydefınition unsuccess-ful) increased signifı-cantly from 2002 to2006 for smokersin precontemplation(4.3 to 4.6), contem-plation (4.4 to 5.7),and preparation (6.7to 10.3) stages ofchange. In 2006, cur-rent smokers reportedtrying to quitmore of-
en but were having less success. The number and range ofuit attempts had increased signifıcantly for all these ever-mokers compared to prior years except for those in action.hese numbers support the notion that current smokers areaving less success, although current motivation to changeoes not differ much across waves. On a scale of 1 to 10ssessing how ready smokers were to quit smoking, averageatings of all current smokers hovered around 4 for all wavesut, aswouldbe expected, differed signifıcantlyby stagewithinach wave with those in precontemplation averaging 3, thosen contemplation averaging around 5, and those in prepara-ion averaging around 6.5 on the readiness ruler. There is aange of readiness to quit in the population of smokers thatakes generalizing about and reaching all current smok-rs with a single strategy problematic.
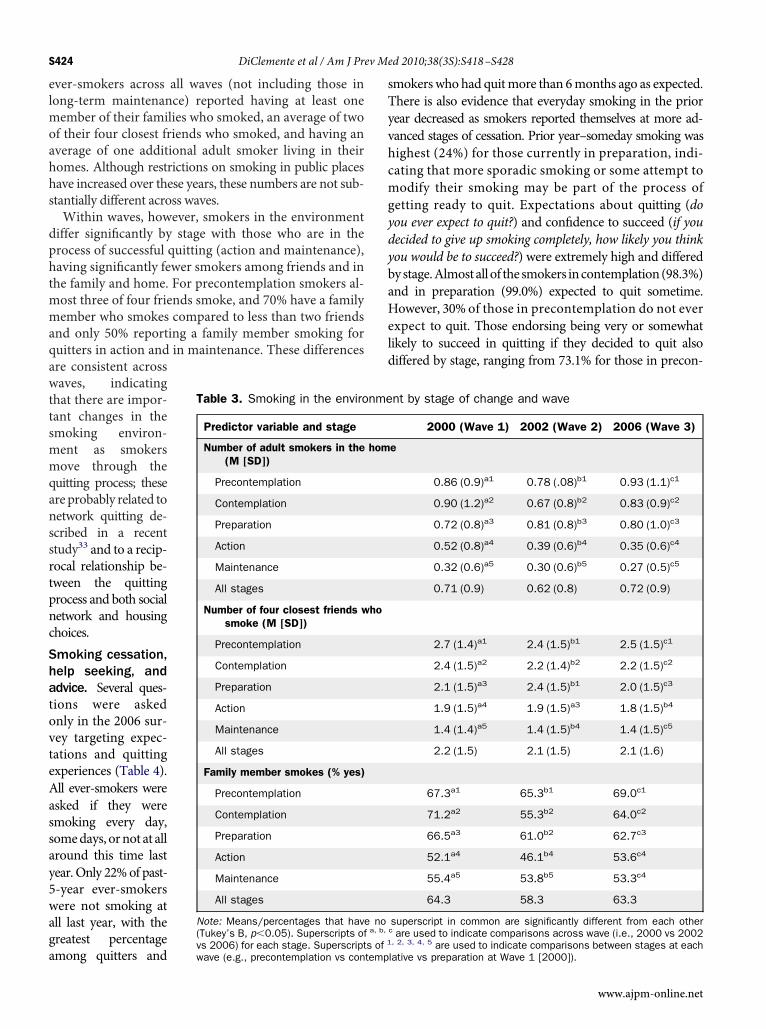
nvironmental smoking. Smoking in the environmentf smokers differs by stage of change and sometimes by
(Wave 2) 2006 (Wave 3)
b1 68.6c1
b2 95.2c2
b3 96.5c3
79.7
(6.5)b1 4.6 (11.2)c1
(5.3)b2 5.7 (11.3)c2
(9.8)b3 10.3 (17.9)c3
(9.5)b4 4.7 (8.7)c1
(7.7)b5 6.8 (14.2)c4
(7.7) 5.8 (12.6)
(2.7)b1 3.1 (2.9)c1
(3.0)b2 5.4 (3.1)c2
(3.1)b3 6.7 (3.3)c3
(3.2) 4.2 (3.3)
nificantly different from each otherns across wave (i.e., 2000 vs 2002aration at Wave 1 [2000]).
, 3, 4, 5 areused to indicate comparisonsaration at Wave 1 [2000]).
ve
2002
72.4
95.5
97.7
85.2
4.3
4.4
6.7
5.6
5.3
5.2
3.1
4.8
6.4
4.4
e sigarisoprep
of 1, 2
ave of survey (Table 3). Over 50% of the cohort of
elmoahhs
dphtmmaqawttsmmqanssrtpncShatovteAassay5waga
sTyvhcmgydybaHeld
S424 DiClemente et al / Am J Prev Med 2010;38(3S):S418–S428
ver-smokers across all waves (not including those inong-term maintenance) reported having at least oneember of their families who smoked, an average of twof their four closest friends who smoked, and having anverage of one additional adult smoker living in theiromes. Although restrictions on smoking in public placesave increased over these years, these numbers are not sub-tantially different across waves.Within waves, however, smokers in the environmentiffer signifıcantly by stage with those who are in therocess of successful quitting (action and maintenance),aving signifıcantly fewer smokers among friends and inhe family and home. For precontemplation smokers al-ost three of four friends smoke, and 70% have a familyember who smokes compared to less than two friendsnd only 50% reporting a family member smoking foruitters in action and in maintenance. These differencesre consistent acrossaves, indicatinghat there are impor-ant changes in themoking environ-ent as smokersove through theuitting process; thesere probably related toetwork quitting de-cribed in a recenttudy33 and to a recip-ocal relationship be-ween the quittingrocess and both socialetwork and housinghoices.moking cessation,elp seeking, anddvice. Several ques-ions were askednly in the 2006 sur-ey targeting expec-ations and quittingxperiences (Table 4).ll ever-smokers weresked if they weremoking every day,omedays, ornot at allround this time lastear.Only 22%of past--year ever-smokersere not smoking atll last year, with thereatest percentage
Table 3. Smoking in the enviro
Predictor variable and stage
Number of adult smokers in the(M [SD])
Precontemplation
Contemplation
Preparation
Action
Maintenance
All stages
Number of four closest friends wsmoke (M [SD])
Precontemplation
Contemplation
Preparation
Action
Maintenance
All stages
Family member smokes (% yes)
Precontemplation
Contemplation
Preparation
Action
Maintenance
All stages
Note: Means/percentages that have(Tukey’s B, p�0.05). Superscripts of
mong quitters andvwave (e.g., precontemplation vs contemp
mokerswhohad quitmore than 6months ago as expected.here is also evidence that everyday smoking in the priorear decreased as smokers reported themselves at more ad-anced stages of cessation. Prior year–someday smoking wasighest (24%) for those currently in preparation, indi-ating that more sporadic smoking or some attempt toodify their smoking may be part of the process ofetting ready to quit. Expectations about quitting (doou ever expect to quit?) and confıdence to succeed (if youecided to give up smoking completely, how likely you thinkou would be to succeed?) were extremely high and differedystage.Almostallof thesmokers incontemplation(98.3%)nd in preparation (99.0%) expected to quit sometime.owever, 30% of those in precontemplation do not everxpect to quit. Those endorsing being very or somewhatikely to succeed in quitting if they decided to quit alsoiffered by stage, ranging from 73.1% for those in precon-
nt by stage of change and wave
2000 (Wave 1) 2002 (Wave 2) 2006 (Wave 3)
e
0.86 (0.9)a1 0.78 (.08)b1 0.93 (1.1)c1
0.90 (1.2)a2 0.67 (0.8)b2 0.83 (0.9)c2
0.72 (0.8)a3 0.81 (0.8)b3 0.80 (1.0)c3
0.52 (0.8)a4 0.39 (0.6)b4 0.35 (0.6)c4
0.32 (0.6)a5 0.30 (0.6)b5 0.27 (0.5)c5
0.71 (0.9) 0.62 (0.8) 0.72 (0.9)
2.7 (1.4)a1 2.4 (1.5)b1 2.5 (1.5)c1
2.4 (1.5)a2 2.2 (1.4)b2 2.2 (1.5)c2
2.1 (1.5)a3 2.4 (1.5)b1 2.0 (1.5)c3
1.9 (1.5)a4 1.9 (1.5)a3 1.8 (1.5)b4
1.4 (1.4)a5 1.4 (1.5)b4 1.4 (1.5)c5
2.2 (1.5) 2.1 (1.5) 2.1 (1.6)
67.3a1 65.3b1 69.0c1
71.2a2 55.3b2 64.0c2
66.5a3 61.0b2 62.7c3
52.1a4 46.1b4 53.6c4
55.4a5 53.8b5 53.3c4
64.3 58.3 63.3
superscript in common are significantly different from each otherc are used to indicate comparisons across wave (i.e., 2000 vs 2002, 2, 3, 4, 5
nme
hom
ho
noa, b,
s 2006) for each stage. Superscripts of 1 are used to indicate comparisons between stages at each
lative vs preparation at Wave 1 [2000]).www.ajpm-online.net
tcpq2s
s
ctdpan
T
a
N
DiClemente et al / Am J Prev Med 2010;38(3S):S418–S428 S425
M
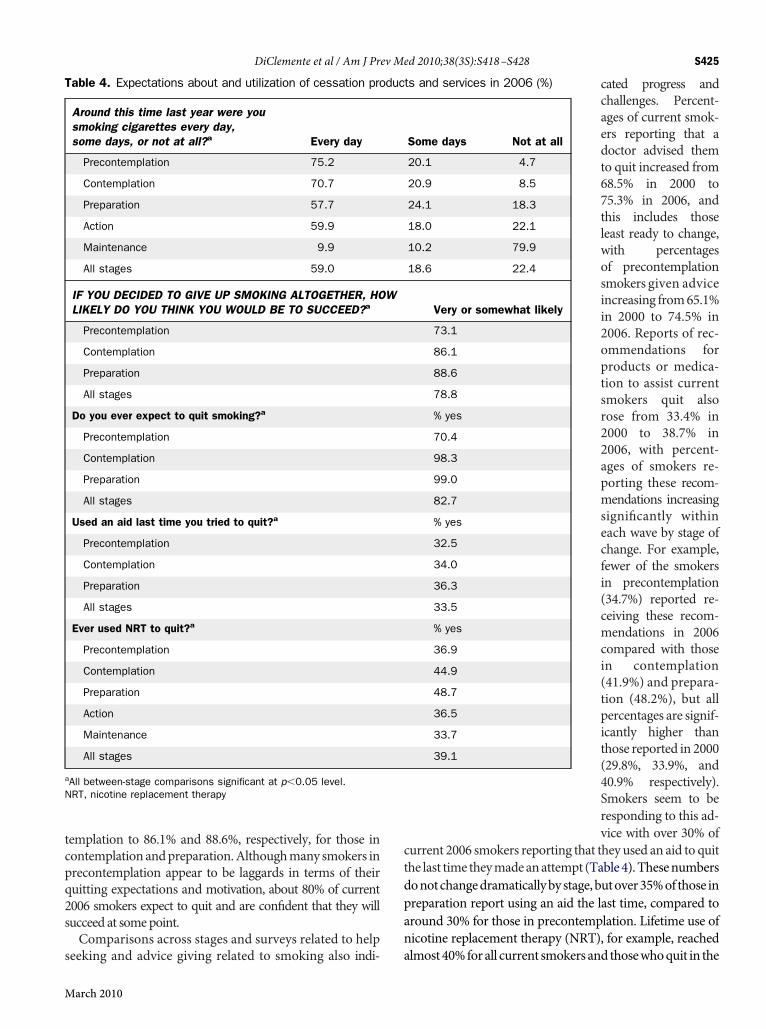
emplation to 86.1% and 88.6%, respectively, for those inontemplationandpreparation.Althoughmany smokers inrecontemplation appear to be laggards in terms of theiruitting expectations and motivation, about 80% of current006 smokers expect to quit and are confıdent that they willucceed at somepoint.Comparisons across stages and surveys related to help
able 4. Expectations about and utilization of cessation pro
Around this time last year were yousmoking cigarettes every day,some days, or not at all?a Every day
Precontemplation 75.2
Contemplation 70.7
Preparation 57.7
Action 59.9
Maintenance 9.9
All stages 59.0
IF YOU DECIDED TO GIVE UP SMOKING ALTOGETHER, HOLIKELY DO YOU THINK YOU WOULD BE TO SUCCEED?a
Precontemplation
Contemplation
Preparation
All stages
Do you ever expect to quit smoking?a
Precontemplation
Contemplation
Preparation
All stages
Used an aid last time you tried to quit?a
Precontemplation
Contemplation
Preparation
All stages
Ever used NRT to quit?a
Precontemplation
Contemplation
Preparation
Action
Maintenance
All stages
All between-stage comparisons significant at p�0.05 level.RT, nicotine replacement therapy
eeking and advice giving related to smoking also indi- a
arch 2010
cated progress andchallenges. Percent-ages of current smok-ers reporting that adoctor advised themto quit increased from68.5% in 2000 to75.3% in 2006, andthis includes thoseleast ready to change,with percentagesof precontemplationsmokers given adviceincreasing from65.1%in 2000 to 74.5% in2006. Reports of rec-ommendations forproducts or medica-tion to assist currentsmokers quit alsorose from 33.4% in2000 to 38.7% in2006, with percent-ages of smokers re-porting these recom-mendations increasingsignifıcantly withineach wave by stage ofchange. For example,fewer of the smokersin precontemplation(34.7%) reported re-ceiving these recom-mendations in 2006compared with thosein contemplation(41.9%) and prepara-tion (48.2%), but allpercentages are signif-icantly higher thanthose reported in 2000(29.8%, 33.9%, and40.9% respectively).Smokers seem to beresponding to this ad-vice with over 30% of
urrent 2006 smokers reporting that they used an aid to quithe last time theymadeanattempt (Table4).Thesenumbersonotchangedramaticallybystage,butover35%of those inreparation report using an aid the last time, compared toround 30% for those in precontemplation. Lifetime use oficotine replacement therapy (NRT), for example, reached
ts and services in 2006 (%)
Some days Not at all
20.1 4.7
20.9 8.5
24.1 18.3
18.0 22.1
10.2 79.9
18.6 22.4
Very or somewhat likely
73.1
86.1
88.6
78.8
% yes
70.4
98.3
99.0
82.7
% yes
32.5
34.0
36.3
33.5
% yes
36.9
44.9
48.7
36.5
33.7
39.1
duc
W
lmost40%forall current smokersand thosewhoquit in the
pgw
asaiNecq2drsaspawtuTj
DTl2aasa2agnMwufa
septcmsm
tCir
sopaas2TWNatdattcagTdh
omwcitprspspcsptbEeep
ew
S426 DiClemente et al / Am J Prev Med 2010;38(3S):S418–S428
ast 5 years. Percentages differ by stage of change withreater percentages of current smokers, who by defınitionere not successful, reporting lifetime use of NRT.Current smokers are being given advice and access to
ids and medications in growing numbers, yet there areubstantial numbers of thosewhohave used these andnotchieved cessation. Over 75% of those who reported us-ng something to help them quit last time mentionedRT with the use of other aids being reported by fewerver-smokers (Zyban, 33%; self-help materials, 25.7%;lasses, 14.9%; hypnosis, 10.9%; acupuncture, 2.4%; anduitline, 2.3% (note the Maryland Quitline began in mid006). Those individuals who reported using somethinguring their last quit attempt differed somewhat by cur-ent stage of change, but there was no clear pattern ofuccessful quitters in action ormaintenance using certainids more than those who were unsuccessful. Moreover,imilar percentages of smokers currently in precontem-lation who had made a quit attempt used these types ofids. Over 80% of those currently in precontemplationho used an aid to help them to quit last time reportedhat they used NRT, indicating that it may not have beensed properly or was ineffective for these individuals.ype and use of aids seem to be only one part of theourney of successful cessation.
iscussionhis examination of smoking in the population of Mary-and ever-smokers over the 6-year period from 2000 to006 using population survey snapshots from 2000, 2002,nd 2006 offers stakeholders in tobacco control programsview ofwhat has, and has not, changed over time amongubgroups of ever-smokers who are at different pointslong the journey of smoking cessation. By the end of006, the population of current smokers was smaller, butt the same time, was less willing and able to quit. Areater percentage were in earlier stages of change andot interested in or planning to quit in the near term.any current smokers had unsuccessfully tried to quit,ith a substantial minority fınding that cessation prod-cts touted as useful in research studies were not effectiveor them, highlighting the differences between effıcacynd effectiveness.Nonetheless, the vastmajority expects to quit, has con-
idered quitting, and believes that they will likely succeedventually. More are getting advised to quit by medicalrofessionals and are getting access to quit-smoking aidshat are empirically supported. As compared to previousohorts, the 2006 cohort of current smokers tried to quitore times, but also smoked every day for more years,moked as many cigarettes per day, and had environ-
ents as fılled with smoking as their counterparts despite nhe increasing numbers of environmental restrictions.urrent smokers seem more dependent, living in smok-ng environments, and learning how to smoke around theestrictions.The challenge presented to tobacco control programs
eeking to increase successful cessation appears to be onef not only helping smokers appropriately use effıcaciousroducts but also of addressing their current needs andssisting them to successfully negotiate the critical taskslong the journey of cessation. Greater percentages ofmokers in precontemplation and contemplation in the006 survey indicate discouragement and ambivalence.his supports the need for motivational interventions.hen many of these smokers tried to quit, they accessedRT andZyban products in equal percentages as those inction andmaintenance but did not seem to benefıt fromhese, either because they used them improperly or theyid not have the strength of decision and commitment orproper plan to use behavioral quitting strategies showno be part of successful cessation and important adjunctso any pharmacotherapy regimen. Although the 2006urrent smokers have increased their number of quitttempts, they have not achieved greater success as aroup, and overall ratings of readiness are not very high.his suggests that there may be important gaps in theissemination of empirically supported treatments andow to use them successfully.The overall journey toward cessation of the populationf ever-smokers has had substantial success, and there areany encouraging indicators that that current smokersill move toward cessation in greater numbers. Mosturrent smokers are not satisfıed smokers and are expect-ng to quit. However, interest and desire to quit has noturned into proximal motivation to quit yet, and largerercentages of current smokers in 2006 are joining theanks of the not ready in the near future. Efforts to under-tand and intervene with the barriers to motivation ap-ear to be more important than ever. Focusing on con-umer demand and getting a consumer perspective onroducts and services seems critical because many of theurrent smokers have already used current products andervices, and they have a unique perspective on theseroducts and services that needs to be understood byobacco control. Simply doing more of the same may note in the best interest of current smokers in this study.venmore importantly, unsuccessful attempts need to bexamined to discover what seems to be going wrong,specially when these smokers are using empirically sup-orted products and services.Interestingly, environmental restrictions have not less-
ned the typical numbers of smokers in the social net-orks and families of current smokers, indicating that
etworks of smokers continue to be linked together. Ef-www.ajpm-online.net
fswtsctfttddsa
L
Ttswppjct(rasotIr
a
1
2
3
4
5
Nt
R
1
1
1
1
1
DiClemente et al / Am J Prev Med 2010;38(3S):S418–S428 S427
M
orts to motivate and facilitate individual smokers to quithould probably target networks as well as individuals. Itould also be important to understandhowenvironmen-al events interact with personal motivation to create andtimulate change. The population of current smokers hasessation expectations and aspirations that seem open tohe influence of dramatic environmental events (taxes,ree nicotine replacement, clean indoor air initiatives)hat could substantially push the cessation process. Atimes the process may not appear as linear a journey asepicted in this article.13 However, the stage subgroupso seem to be consistently related tomotivational dimen-ions and can provide some guidance for understandingnd intervening with the population of smokers.
imitations of Survey
heMaryland Adult Tobacco Surveys suffer from limita-ions commonly found in other large telephone-basedurveys including: over-representation of participantsith higher education levels; retrospective reporting; andotential lack of generalizability. The MATS is a tele-hone survey that did not include cell phone and is sub-ect to bias by inclusion of households with landlines andaller screening. These surveys cannot be generalized tohe very poor, active military, or residents of institutionse.g., long-term hospitals or prisons). Moderate responseates in all three surveys (ranging from 43.3% to 55.9%)lso limit generalizability of fındings to all Marylandmokers. Moreover, recent statewide interventions thatffer free nicotine replacement (gum and patch) throughhe quitline and include increased taxes, and a Cleanndoor Air Act banning smoking in all bars and restau-ants, are not represented in these data.The following recommendations for tobacco control
re consistent with these fındings:
. Understand that the majority of current smokers ratethemselves as only modestly ready to quit (4 on a 10-point scale) and that the smallest percentage of smok-ers are in the most ready group, with average readinessratings over 6 on this scale. Tailoring media messagesand intervention efforts to motivate and not simplyeducate are needed.. Use a consumer-oriented focus with smokers to lookfor the key barriers preventing current smokers frombeing more immediately motivated to attempt to quit,recognizing that some barriers may be environmental.. Create better access to empirically supported productsand services as most current smokers did not use anyaids the last time they quit. However, health literacyefforts should include a greater emphasis on educatingthe consumers of these products and services onhow to
use these products properly. Pharmacotherapywithoutarch 2010
proper motivation and behavioral preparation mayundermine smokers’ cessation effıcacy and positiveoutcome expectations about the utility of these aids.. Smoking continues to exist within social networks andsubgroups, so tobacco control initiatives may be moreeffective if they promote network as well as individualsmoking-cessation efforts and promote smokefreehome initiatives.. Population surveys of smokers should focus on process-of-change information. Point prevalence (past-30-daysmoking) and smoking habit dimensions are insuffı-cient to understand current smokers and the journey ofcessation. Process variables should be included that tapmotivation, expectations, attitudes, and intentions, aswell as current andpast experiences, in order to capturethe successes and struggles of personal and populationsmoking cessation.
o fınancial disclosures were reported by the authors ofhis paper.
eferences1. CDC. Cigarette smoking among adults—U.S., 2000. MMWR
Morb Mortal Wkly Rep 2002;51(29):642.2. CDC. Cigarette smoking among adults—U.S., 2007. MMWR
Morb Mortal Wkly Rep 2008;57(45):1221–6.3. CDC. Erratum. MMWR Morb Mortal Wkly Rep 2008;
57(45):1281.4. CDC. Cigarette smoking among adults—U.S., 2006. MMWR
Morb Mortal Wkly Rep 2007;56(44):1157–61.5. Fiore MC, Jaén CR, Baker TB, et al. Treating tobacco use and
dependence 2008 update. Clinical practice guideline. RockvilleMD: USDHHS, 2008.
6. Hughes JR. Tobaccowithdrawal in self-quitters. J Consult ClinPsychol 1992;60(5):689–97.
7. Fiore MC, Smith SS, Jorenby DE. The effectiveness of thenicotine patch for smoking cessation: a meta-analysis. JAMA1994;271:1940–7.
8. Silagly C, Mant D, Fowler G. Meta-analysis on effıcacy ofnicotine replacement therapies in smoking cessation. Lancet1994;343:139–42.
9. Stead LF, Perera R, Bullen C, Mant D, Lancaster T. Nicotinereplacement therapy for smoking cessation. Cochrane Data-base of Systematic Reviews 2008 Jan 23;(1):CD000146.
0. Carbonari JP, DiClemente CC, Sewell KB. Stage transitionsand the transtheoretical ’stages of change’ model of smokingcessation. Swiss Journal of Psychology 1999;58(2):134–44.
1. DiClemente CC. Addiction and change: how addictions de-velop and addicted people recover. New York: Guilford Press,2003.
2. WestR.Time for a change: putting theTranstheoretical (StagesofChange)Model to rest. Addiction 2005;100(8):1036–9.
3. West R, Sohal T. ‘Catastrophic’ pathways to smoking cessa-tion: fındings from national survey. BMJ 2006;332:458–60.
4. USDHHS.Women and smoking: a report of the SurgeonGen-
eral. Atlanta GA: USDHHS, CDC, National Center for
1
1
1
1
1
2
2
2
2
2
2
2
2
2
2
3
3
3
3
S428 DiClemente et al / Am J Prev Med 2010;38(3S):S418–S428
Chronic Disease Prevention and Health Promotion, Offıce onSmoking and Health, 2001.
5. UW-CTRI: Center for Tobacco Research and InterventionUniversity of Wisconsin Medical School. Key messages onhow to help someone quit tobacco use. www.ctri.wisc.edu/Smokers/Help%20Someone%20Quit%20Tobacco.pdf.
6. Prochaska JO, DiClemente CC. Stages and processes of self-change of smoking: toward an integrative model of change. JConsult Clin Psych 1983;51(3):390–5.
7. DiClemente CC, Prochaska JO. Toward a comprehensive,transtheoretical model of change: stages of change and addic-tive behaviors. In: Miller WR, Heather N, eds. Treating addic-tive behaviors. 2nd ed. New York: Plenum Press, 1998.
8. Prochaska JO, DiClemente CC, Norcross JC. In search of howpeople change. Applications to addictive behaviors. Am Psy-chol 1992;47(9):1102–14.
9. Bandura A. Self-effıcacy: toward a unifying theory of behaviorchange. Psychol Rev 1977;84:191–215.
0. U.S. Department of Health and Human Services. The HealthConsequences of Involuntary Exposure to Tobacco Smoke: AReport of the SurgeonGeneral—Executive Summary. U.S. De-partment of Health and Human Services, Centers for DiseaseControl and Prevention, Coordinating Center for Health Pro-motion, National Center for Chronic Disease Prevention andHealth Promotion, Offıce on Smoking and Health, 2006.
1. U.S. Food and Drug Administration. FDA approved novel med-ication for smoking cessation. http://www.fda.gov/NewsEvents/Newsroom/PressAnnouncements/2006/ucm108651.
2. Maryland Department of Health and Mental Hygiene. Initialfındings from the Baseline Tobacco Study. www.dhmh.state.md.us/esm/initialbaseline.pdf.
3. MarylandDepartment ofHealth andMentalHygiene (DMHM).Monitoring changing tobacco use behaviors in Maryland: a re-port on the fıscal year 2001 and 2003MarylandTobacco Surveys.
crf.state.md.us/pdf/Fall2003DataReport.pdf.4. MarylandDepartment ofHealth andMentalHygiene (DMHM).Monitoring changing tobacco-use behaviors in Maryland: areport on the 2000–2006 Maryland tobacco studies. http://crf.maryland.gov/pdf/2007_tobacco_use_2000_2006.pdf.
5. Blumberg SJ, Luke JV. Wireless substitution: early release ofestimates based on data from the National Health InterviewSurvey, July—December 2006. 2007. http://www.cdc.gov/nchs/data/nhis/earlyrelease/wireless200705.pdf.
6. DiClemente CC, Prochaska JO, Fairhurst SK, Velicer WF,VelasquezMM, Rossi JS. The process of smoking cessation: ananalysis of precontemplation, contemplation, and preparationstages of change. J Consult Clin Psychol 1991;59(2):295–304.
7. Herzog TA. Analyzing the Transtheoretical Model using theframeworkofWeinstein,Rothman, andSutton (1998): the exam-ple of smoking cessation. Health Psychol 2008;27:548–56.
8. Sutton S. Back to the drawing board? A review of applicationsof the transtheoretical model to substance use. Addiction2001;96(1):175–86.
9. Sutton S, Norman P, AbrahamC, ConnerM. A critical review ofthe transtheoreticalmodel applied to smoking cessation. In:Nor-manP,AbrahamC,ConnerM,eds.Understandingandchanginghealth behaviour: from health beliefs to self-regulation. Amster-damNetherlands: Harwood Academic Publishers, 2000.
0. VelicerWF, Fava JL, Prochaska JO,AbramsDB, EmmonsKM,Pierce JP. Distribution of smokers by stage in three represen-tative samples. Prev Med 1995;24:401–11.
1. Etter J-F, Perneger TV.A comparison of twomeasures of stage ofchange for smoking cessation. Addiction 1999;94(12):1881–9.
2. Augustson EM, Marcus SE. Use of the Current PopulationSurvey to characterize subpopulations of continued smokers: anational perspective on the ‘hardcore’ smoker phenomenon.Nicotine Tob Res 2004;6(4):621–9.
3. Christakis NA, Fowler JH. The collective dynamics of smo-king in a large social network. N Engl J Med 2008;358(21):
2249–58.www.ajpm-online.net
Related Documents