Welcome message from author
This document is posted to help you gain knowledge. Please leave a comment to let me know what you think about it! Share it to your friends and learn new things together.
Transcript

The Journal of
Economic PerspectivesA journal of the American Economic Association
EditorDavid H. Autor, Massachusetts Institute of Technology
Co-editorsChang-Tai Hsieh, University of Chicago
Ulrike Malmendier, University of California at Berkeley
Associate EditorsBenjamin G. Edelman, Harvard University
Amy Finkelstein, Massachusetts Institute of TechnologyGordon Hanson, University of California at San Diego
Anil K Kashyap, University of ChicagoAdam Looney, US Department of the Treasury
David McKenzie, World BankRichard Newell, Duke University
Chad Syverson, University of ChicagoChristopher Udry, Yale University
Managing EditorTimothy Taylor
Assistant EditorAnn Norman
Editorial offices:Journal of Economic Perspectives
American Economic Association Publications2403 Sidney St., #260Pittsburgh, PA 15203
email: [email protected]
The Journal of Economic Perspectives gratefully acknowledges the support of Macalester College.Registered in the US Patent and Trademark Office (®).Copyright © 2014 by the American Economic Association; All Rights Reserved.Composed by American Economic Association Publications, Pittsburgh, Pennsylvania, USA.Printed by R. R. Donnelley Company, Jefferson City, Missouri, 65109, USA.No responsibility for the views expressed by the authors in this journal is assumed by the editors or by the American Economic Association.THE JOURNAL OF ECONOMIC PERSPECTIVES (ISSN 0895-3309), Fall 2014, Vol. 28, No. 4. The JEP is published quarterly (February, May, August, November) by the American Economic Association, 2014 Broadway, Suite 305, Nashville, TN 37203-2418. Annual dues for regular membership are $20.00, $30.00, or $40.00 depending on income; for an additional $15.00, you can receive this journal in print. E-reader versions are free. For details and further information on the AEA go to http://www.vanderbilt.edu/AEA/. Periodicals postage paid at Nashville, TN, and at additional mailing offices.POSTMASTER: Send address changes to the Journal of Economic Perspectives, 2014 Broadway, Suite 305,Nashville, TN 37203. Printed in the U.S.A.
The Journal of
Economic Perspectives
Contents Volume 28 • Number 4 • Fall 2014
Symposia
Social NetworksMatthew O. Jackson, “Networks in the Understanding of Economic Behaviors” . . 3Vasco M. Carvalho, “From Micro to Macro via Production Networks” . . . . . . . . . 23Kaivan Munshi, “Community Networks and the Process of Development” . . . . . 49
Tax Enforcement and ComplianceHenrik Jacobsen Kleven, “How Can Scandinavians Tax So Much?” . . . . . . . . . . . 77Timothy Besley and Torsten Persson, “Why Do Developing Countries Tax So
Little?” . . . . . . . . . . . . . . . . . . . . . . . . . . . . . . . . . . . . . . . . . . . . . . . . . . . . 99Gabriel Zucman, “Taxing across Borders: Tracking Personal Wealth and
Corporate Profits” . . . . . . . . . . . . . . . . . . . . . . . . . . . . . . . . . . . . . . . . . . 121Erzo F. P. Luttmer and Monica Singhal, “Tax Morale” . . . . . . . . . . . . . . . . . . . . . 149
ArticlesSheilagh Ogilvie, “The Economics of Guilds” . . . . . . . . . . . . . . . . . . . . . . . . . . . . 169Joshua Goodman, “The Wages of Sinistrality: Handedness, Brain Structure,
and Human Capital Accumulation” . . . . . . . . . . . . . . . . . . . . . . . . . . . . 193
FeaturesH. Spencer Banzhaf, “Retrospectives: The Cold-War Origins of the Value of
Statistical Life” . . . . . . . . . . . . . . . . . . . . . . . . . . . . . . . . . . . . . . . . . . . . . 213Timothy Taylor, “Recommendations for Further Reading” . . . . . . . . . . . . . . . . . 227“Correspondence: The Missing Middle,” James Tybout . . . . . . . . . . . . . . . . . . . . 235
Statement of Purpose
The Journal of Economic Perspectives attempts to fill a gap between the general interest press and most other academic economics journals. The journal aims to publish articles that will serve several goals: to synthesize and integrate lessons learned from active lines of economic research; to provide economic analysis of public policy issues; to encourage cross-fertilization of ideas among the fields of economics; to offer readers an accessible source for state-of-the-art economic thinking; to suggest directions for future research; to provide insights and read-ings for classroom use; and to address issues relating to the economics profession. Articles appearing in the journal are normally solicited by the editors and associate editors. Proposals for topics and authors should be directed to the journal office, at the address inside the front cover.
Policy on Data Availability
It is the policy of the Journal of Economic Perspectives to publish papers only if the data used in the analysis are clearly and precisely documented and are readily available to any researcher for purposes of replication. Details of the computations sufficient to permit replication must be provided. The Editor should be notified at the time of submission if the data used in a paper are proprietary or if, for some other reason, the above requirements cannot be met.
Policy on Disclosure
Authors of articles appearing in the Journal of Economic Perspectives are expected to disclose any potential conflicts of interest that may arise from their consulting activities, financial interests, or other nonacademic activities.
Journal of Economic PerspectivesAdvisory Board
Tim Besley, London School of EconomicsRobert E. Hall, Stanford University
Greg Ip, The EconomistChristopher Jencks, Harvard University
Carmen Reinhart, Peterson InstituteJohn Roemer, Yale University
Paul Romer, New York UniversityHoward Rosenthal, New York University
Journal of Economic Perspectives—Volume 28, Number 4—Fall 2014—Pages 3–22
T he explosive changes in our abilities to communicate over distances—spurred by the evolution of communication technologies coupled with increased capabilities of the internet and social media—have made social
networks very salient. Thus, it is perhaps more than coincidental that there has been a growth in network-related research that has accompanied the dramatic changes in the wiring of the world.1
Although the increased salience of networks may have awakened people to their importance, there is another more fundamental force that is driving the recent growth in the study of networks in economics. The main impetus is that, as economists endeavor to build better models of human behavior, they cannot ignore that humans are fundamentally a social species with interaction patterns that shape their behaviors. People’s opinions, which products they buy, whether they invest in education, become criminals, and so forth, are all influenced by friends and acquain-tances. Ultimately, the full network of relationships—how dense it is, whether some groups are segregated, who sits in central positions—affects how information spreads
1 Note that this is not the first revolution in communication that has rewired human interaction, as the world has shrunk many times before: with the advent of letter writing, the telegraph, trains, the telephone, air travel, and others. Evidence from a study of the spread of the Black Death in 14th-century Europe suggests that the average social distance between individuals was much larger centuries ago than today (Marvel, Martin, Doering, Lusseau, and Newman 2013).
Networks in the Understanding of Economic Behaviors†
■ Matthew O. Jackson is the William D. Eberle Professor of Economics at Stanford University, Stanford, California. He is also a Senior Fellow of the Canadian Institute for Advanced Research, Toronto, Ontario, Canada, and an external faculty member of the Santa Fe Institute, Santa Fe, New Mexico. His email address is [email protected].† To access the Data Appendix, visithttp://dx.doi.org/10.1257/jep.28.4.3 doi=10.1257/jep.28.4.3
Matthew O. Jackson
4 Journal of Economic Perspectives
and how people behave. This impetus for the growth in network studies has been unleashed by the increased availability of data, which when coupled with increased computing power, allows us to analyze networks in economic settings in ways not previously possible.
In this paper, I discuss and illustrate this driving force, and describe some of the ways in which networks are helping economists to model and understand behavior. I begin with an example that demonstrates the sorts of things that researchers can miss if they do not account for network patterns of interaction. Next, to provide a broader perspective on the different ways in which networks provide insights into economic behaviors, I discuss a taxonomy of network properties and how they impact behaviors. Each of these properties and its impact is illustrated via appli-cations.2 Finally, I discuss an important frontier of networks research—developing tractable models of network formation—which is essential in addressing issues of endogeneity when estimating network effects on behavior.
Why Networks?
Do economists really need to map out the network of interactions in order to understand economic phenomena? Can’t we ignore the patterns of interactions or proxy networks via other means such as peer groups or geography? Although we can circumvent network data in some situations, there are many settings in which network data provide essential insights into economic behaviors that are not available via other means. To make this point, I discuss a recent analysis in which network data play a vital role in disentangling potential explanations for behavior. In this example, house-holds are the nodes of the network, and links in the network concern things like the exchange of favors, kinship, the sharing of advice, and so forth. There are also many other sorts of networks, including contractual relationships among firms, alliances between countries, overnight lending among banks, and others in which nodes are organizations and relationships are more formal but would illustrate similar points.
In Banerjee, Chandrasekhar, Duflo, and Jackson (2013), we used network data to analyze the diffusion of microfinance in a set of rural Indian villages. A bank entered 43 villages that had relatively limited access to formal loans and began offering microfinance loans (roughly $200 per unsecured loan over 50 weeks, with a limit of one loan at a time per household). Having sufficient participation in such a loan program is critical to making it viable, and so understanding what drives the participation in the program also becomes essential; especially since participation varied across villages, ranging from 7 percent to 44 percent of eligible households.
2 There are large literatures analyzing social interactions that span several disciplines—with particular attention from sociology, economics, computer science, statistics, and statistical physics, and increas-ing attention from anthropology and political science. I do not attempt to survey the literatures here. Background can be found in Wasserman and Faust (1994); Granovetter (2005); Jackson (2005, 2008, 2011); Demange and Wooders (2005); Vega-Redondo (2007); Goyal (2007); Newman (2010); Benhabib, Bisin, and Jackson (2011); Jackson and Zenou (2014); Jackson, Rogers, and Zenou (2014).

Matthew O. Jackson 5
In such poor villages, information is mainly spread via word-of-mouth. Thus, the bank entered a village and contacted a few individuals—shopkeepers, teachers, and self-help group leaders—to tell them that the bank would be offering loans and to spread the news to other members of the village. To be able to analyze how infor-mation spread, we surveyed the villagers before the bank entered the villages and mapped out networks of twelve types of relationships: who borrows kerosene and rice from whom, whom a given villager would borrow a small sum of money from, who seeks medical help from whom, who gets advice from whom, who visits whose house for dinner, and so forth.
This network information was vital in understanding the large variation in participation across villages. Was it that basic information about loan availability was not reaching many households in some villages, or was it that there were strong complementarities and dependencies in decisions to participate across households? Answering these questions is essential in shaping policies to enhance participation. If it was simply that information was not spreading in the villages with low participa-tion rates, then the microfinance organization should work to increase awareness. If, instead, information was spreading extensively but villagers’ decisions to participate were heavily tied to the decisions of their friends and participation never got rolling, then that would suggest very different policies—for example, policies designed to educate and encourage participation among well-positioned households.
To understand why network information was essential in answering these ques-tions, let us begin by largely ignoring the rich network information that we have and simply analyzing decisions of households through a canonical peer-effects regres-sion. In particular, consider a standard logistic regression of the form
log ( pi _
1 − pi ) = βXi + λFi ,
where pi is the probability that household i participates in the loan program, Xi is a vector of household characteristics (caste, wealth, profession, and others), and Fi is the fraction of household i’s “friends” who participate in the program. This is a stan-dard way of formulating a discrete choice problem with peer influence (and similar results hold for a probit formulation). Here we are using the network information only in determining who a given household’s friends are.3
3 Actually, even this basic network information is helpful in such direct peer effect analyses in overcoming the “reflection problem” identified by Manski (1993). If the behavior of one individual depends on the average behavior of that person’s peers (in a linear way), then if the peers are all peers of each other it can be impossible to disentangle the peer effect from the effects of the characteristics. The resulting set of equations and unknowns has many solutions: everyone influences everyone else’s behavior and so those can be scaled up or down in ways that make it impossible to identify the peer influence sepa-rately from the influence of other exogenous characteristics and factors. This can be overcome with rich enough network data about who is friends with whom, as then the influences are not completely circular and the system of equations is no longer singular (Bramoullé, Djebbari, and Fortin 2009).
6 Journal of Economic Perspectives
If we run such a regression on these data, we find an estimate of λ above 2 with high significance (with a p -value below .01). How does one interpret this finding? It suggests strong “peer effects”: a given household’s decision is highly correlated with their friends’ decisions. For instance, increasing the fraction of the
households’ friends’ participation from 0 to 1 increases the odds ratio pi _ 1 − pi
by a
factor of roughly ten: so a household with a likelihood of pi = .05 of participating based on its characteristics and having no friends participating, ends up with an odds ratio of nearly .5, or a participation likelihood of roughly pi = .30 if all of its friends participate.
However, this analysis does not sort out whether the correlation in behaviors is due to basic information spreading and awareness, or other complementarities in decisions. To distinguish between these two possibilities, we can use the network to track the spread of information, and then re-estimate the logistic decision above after we have controlled for information spread. Thus, the richer estimation is based on a model that has two parts: households who have heard about microfinance randomly tell some of their friends, and once a household has heard about microfinance, then they make a decision based on their demographics and their friends’ decisions. The model involves three key parameters: 1) households who choose to participate in the microfinance program tell their friends with some probability q P; 2) the house-holds who choose not to participate tell their friends with some probability q N; and, 3) a parameter λ that captures endorsement effects: having more friends partici-pate might provide additional information concerning how appropriate a loan is for a given household or might provide other sorts of peer pressure or influence, resulting in additional dependencies in decisions across households.
This estimation takes advantage of data about the full network structure to identify the parameters. Given that there is some randomness in the passing of infor-mation, a household’s position relative to the first-informed people in the village affects the household’s likelihood of becoming informed, and so the fuller network structure allows us to identify the information-passing probabilities. With low prob-abilities of information passing, information dies quickly and does not spread far beyond the initially informed households. With high probabilities, most households become informed, except households that are relatively isolated. With intermediate probabilities, households who are closer to those initially informed are more likely to hear, as are households who might be more distant but who have many paths to the initially informed nodes. Using the patterns of eventual participation as a func-tion of network position, one can thus estimate the passing probabilities. With such probabilities in hand, one can then calculate the likelihood that any given house-hold is informed as a function of their position in the network, and the logistic participation decision can be run conditional upon a household being informed.
The best-fitting parameters that we found are q P = .55 (the probability that a participating household tells its neighbors in the network in a given time period), q N = .05 (the probability that a nonparticipating household tells its neighbors in the network in a given time period), and λ = −.2 (the peer influence or endorsement
Networks in the Understanding of Economic Behaviors 7
parameter). The information passing probabilities are both significantly different from zero and from each other, and λ is not significantly different from zero. These estimates paint a richer and very different picture than the original significantly posi-tive estimate of λ, which simply reflected a correlation between household decisions.
The findings suggest that households who participate in microfinance are much more likely to inform their friends that microfinance is available than households who choose not to participate. Thus, households that have a high fraction of friends who are participating are much more likely to hear about microfinance than those with a low fraction, all else held constant. Once we condition for the likelihood of becoming informed, the local endorsement or peer effects are no longer significant. Thus, the full-network analysis suggests that much of the peer interaction in this setting involves people making each other aware of microfinance and that peer influ-ences beyond that play an insignificant role in participation decisions.
Of course, as with any structural modeling, one cannot be sure of causation. In the network setting, one has to worry about the fact that networks are endogenous (a concern I discuss further below). Here, we are relying on identifying assumptions that take advantage of variation across villages regarding who was first informed: a given household’s position in the network relative to the first-informed house-holds affects its probability of hearing about microfinance, but does not substantially alter how endorsement and peer influence operate. The richness of the data and a modern ability to compute models enable us to check the robustness of such esti-mations and rule out alternative explanations, to provide some confidence that the model is capturing real phenomena. This is especially important as policies need to be enacted and we do not always have the luxury of controlled experiments or exogenous variation.
Network Properties and their Implications for Behavior
Beyond disentangling peer effects, network structure can help in many other ways in the understanding of economic behaviors. Given the complexity of networks, it is helpful to work with some basic characteristics that capture important aspects of network structure, and which have intuitive implications for behavior. It is useful to break these into two main categories: macro (global or aggregate) charac-teristics of networks, such as the density of connections or the segregation patterns among nodes, and micro (local or individual) characteristics of networks, such as the frequency with which two friends of a given node are friends with each other or how specific nodes are positioned in a network.4
Macro patterns of a network play primary roles in processes of diffusion and social learning, as well as in determining the extent to which disparate norms or cultures can exist within a given society. To fix ideas, let us continue with diffusion in
4 See Jackson, Rogers, and Zenou (2014) for extensive references and more discussion of some of the properties discussed here.
8 Journal of Economic Perspectives
mind: Which network characteristics determine whether diffusion of a new product (for example, microfinance) or idea is extensive or limited?
The most basic and intuitive “macro” property of networks that relates to diffu-sion and contagion is network density. Denser networks, in terms of average numbers of connections per node (for example, other households with whom a household exchanges favors, advice, and so on in our example above), lead to more exten-sive diffusion or contagion, all else held equal. The roots of this implication are seen in early studies of the spread of infectious diseases, and its understanding was fundamental in fighting diseases such as smallpox (for example, Anderson and May 1991). In this literature, the “basic reproduction number” tracks how many other people are newly infected by a typical infected individual. If the basic reproduction number is above one, then the disease expands and becomes endemic, while if it is below one, then the disease tends to die out—an insight that guides vaccination policies. The basic reproduction number depends not only on the characteristics of the disease, such as how easily it spreads from one individual to another, but also upon the network structure of interactions among individuals, which determines how many other people a given individual comes into contact with. Denser networks lead to more interactions and greater basic reproduction numbers (holding fixed the probability of transmission via any given interaction).
This basic insight from epidemiology translates readily to the diffusion of ideas, information, and products, and even some aspects of transmission of economic shocks and financial contagion.5 In the microfinance example discussed above, a household has, on average, about 15 connections in the network—which in this context refers to how many other households with whom it has at least some sort of regular interaction such as borrowing/lending kerosene or rice, seeking/providing medical help, exchanging advice, and other interactions. Our estimated probabili-ties of transmitting information from one household to another of .55 and .05 per period (for participating and nonparticipating households, respectively), lead to corresponding basic reproduction numbers of 8.25 and .75 per period. Given that these are per-period estimates, and households communicate over more than one period (typically three to six in the data), both basic reproduction numbers end up above one, and so nontrivial diffusion of information is feasible in the villages.
Although there is some variation in density across villages, they all end up with basic reproduction numbers that average above one, so variation in network density does not seem to be the answer as to why there is substantial differences in participa-tion across villages. Nonetheless, the large difference in the reproduction numbers between participating and nonparticipating households suggests that whether the first-informed households participate could be important: there is randomness in
5 Financial cascades add a twist to contagion processes since the amount of exposure of one institution to another varies along with the network structure. This can result in much richer interactions between network structure and cascades (for discussion, see Allen and Babus 2009; Gai and Kapadia 2010; Acemoglu, Ozdaglar, and Tahbaz-Salehi forthcoming; and Elliot, Golub, and Jackson forthcoming). Similarly, adding marketing or pricing to diffusion enriches the process, as in Campbell (2013).
Matthew O. Jackson 9
the diffusion process and it does not go on indefinitely, and so differences in the probability of one household telling another could have consequences regarding the extent of the diffusion. Indeed, participation of the first-informed households turns out to be a significant predictor of eventual participation.
More generally, these sorts of insights help make predictions about which soci-eties are more susceptible to contagions as well as widespread diffusion, and can help in designing policies on a wide range of things from vaccinations to the subsi-dization of technology adoption. The predictions of such theories are also born out in the field beyond epidemiological studies. For example, Alatas, Banerjee, Chandrasekhar, Hanna, and Olken (2012) use network information to assess how social learning is affected by network structure. Based on network information from more than 600 Indonesian villages, they find that network density and other charac-teristics correlate with how much people know about other people in their villages. This is also an example in which both the theoretical and the empirical research rely on measures of networks that cannot be proxied for, even with ideal geographic data—especially given the tight village formations.
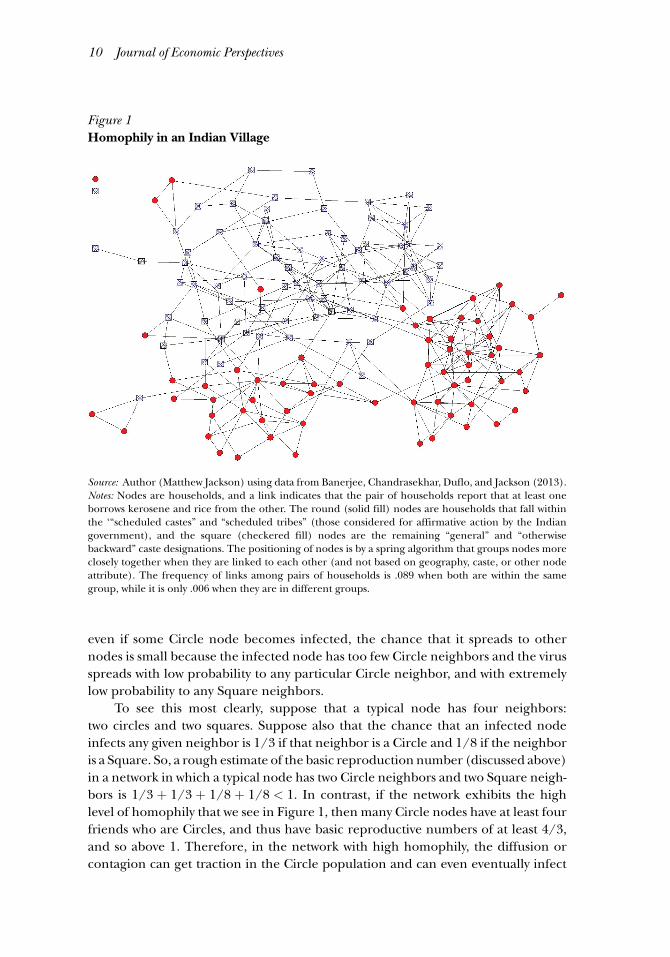
Beyond the density of a network, another fundamental network property that has far-reaching implications concerns segregation patterns. In particular, a feature observed in many social networks, referred to as “homophily” (a term due to Lazarsfeld and Merton 1954), is that similar individuals tend to be linked to each other. For example, consider the network pictured in Figure 1, which is a network of connections between households in one of the villages from the Banerjee et al. (2013) study. A connection in this network is based on the borrowing and lending of kerosene and rice. The round (solid fill) nodes are households that fall within the “scheduled castes” and “scheduled tribes” (those considered for affirmative action by the Indian government), and the square (checkered fill) nodes are the remaining “general” and “otherwise backward” caste designations. We see strong patterns of association by caste designation. Although it may not be surprising to see some segregation in the network given the history of castes in India, the strength of the division is striking. Moreover, such strong homophily is not unusual, and is observed in network data based on all sorts of attributes, including age, race, gender, profession, religion, education level, and others (for background, see McPherson, Smith-Lovin, and Cook 2001).
Such segregation patterns have profound consequences for behaviors within a network. Such segregation could clearly slow or impede diffusion or contagion that begins in one group from reaching others. However, there are more subtle implications. To see this most starkly, consider two groups, Circles and Squares, as in Figure 1. Suppose that Circles are more susceptible to becoming infected (by a virus or opinion), while Squares have a lower probability of becoming infected, and that the virus or opinion is relatively difficult to transmit. For example, older people might be more susceptible to flu; similarly, some new idea or product, news of which spreads via word-of-mouth, might be more attractive to people of a partic-ular age, ethnic background, religion, profession, or other shared characteristic. If a network is well-integrated, then that diffusion may never gain traction, because
10 Journal of Economic Perspectives
even if some Circle node becomes infected, the chance that it spreads to other nodes is small because the infected node has too few Circle neighbors and the virus spreads with low probability to any particular Circle neighbor, and with extremely low probability to any Square neighbors.
To see this most clearly, suppose that a typical node has four neighbors: two circles and two squares. Suppose also that the chance that an infected node infects any given neighbor is 1/3 if that neighbor is a Circle and 1/8 if the neighbor is a Square. So, a rough estimate of the basic reproduction number (discussed above) in a network in which a typical node has two Circle neighbors and two Square neigh-bors is 1/3 + 1/3 + 1/8 + 1/8 < 1. In contrast, if the network exhibits the high level of homophily that we see in Figure 1, then many Circle nodes have at least four friends who are Circles, and thus have basic reproductive numbers of at least 4/3, and so above 1. Therefore, in the network with high homophily, the diffusion or contagion can get traction in the Circle population and can even eventually infect
Figure 1 Homophily in an Indian Village
Source: Author (Matthew Jackson) using data from Banerjee, Chandrasekhar, Duflo, and Jackson (2013).Notes: Nodes are households, and a link indicates that the pair of households report that at least one borrows kerosene and rice from the other. The round (solid fill) nodes are households that fall within the ‘“scheduled castes” and “scheduled tribes” (those considered for affirmative action by the Indian government), and the square (checkered fill) nodes are the remaining “general” and “otherwise backward” caste designations. The positioning of nodes is by a spring algorithm that groups nodes more closely together when they are linked to each other (and not based on geography, caste, or other node attribute). The frequency of links among pairs of households is .089 when both are within the same group, while it is only .006 when they are in different groups.
Networks in the Understanding of Economic Behaviors 11
some of the Squares. The homophily helps to “incubate” the contagion or diffusion process, allowing it to gain hold, and then, once it becomes prevalent enough in one of the groups, it can spread more widely in the society.6
The implications of homophily reach well beyond basic diffusion processes. For example, consider the choice of an individual to pursue higher education or even just to participate in the labor force. The payoff from doing either of these is dependent on the decisions of a person’s friends and acquaintances. For example, it is well-documented that social contacts play an important role in obtaining jobs.7 Thus, if an individual’s friends and acquaintances are educated and employed, the individual has a greater incentive to become educated and be part of the work force as he or she will have greater opportunities to take advantage of the educa-tion and/or participation in the labor force. This is further amplified by other complementarities in decisions: having friends who study, take entrance exams, complete high school, apply and go to college, interview for jobs, and so forth, not only raises one’s prospects for future employment from following suit, but also provides an individual with valuable sources of information about how to do so. All of these factors tie friends’ and acquaintances’ decisions together, and produce network effects whereby individuals who are connected in the network tend to make decisions that are correlated, beyond the influence of any of their characteristics. When we couple this with homophily, we then end up with strong correlations by ethnicity, age, gender, religion, and other characteristics in decisions to acquire human capital and participate in the work force, well beyond what would be predicted by other channels such as parental influence and investment, discrimi-nation, and the like. Network segregation patterns, and homophily in particular, allow multiple conventions to endure in a society and can be an important factor in understanding sustained differences in employment and educational attainment across groups. This has important policy implications, because of the dependence of behaviors among linked-individuals. For example, understanding that decisions are tied to each other means that subsidizing education individual-by-individual can be less effective than targeting subsidies in ways that take advantage of local network effects, a point discussed in Calvó-Armengol and Jackson (2004, 2007).
Beyond the macro patterns of networks, there are two particularly promi-nent aspects of networks from the micro or individual side that are very useful in
6 Diffusion and learning processes in networks with homophily suggest particular measures of segre-gation (Morris 2000; Golub and Jackson 2012), and the effects can depend on heterogeneity in the population (Dandekar, Goel, and Lee 2013; Jadbabaie, Molavi, and Tahbaz-Salehi 2013), and the interac-tion structure (Reluga 2009; Galeotti and Rogers 2013; Jackson and López-Pintado 2013).7 The extensive literature on this subject dates to Rees (1966); see Ioannides and Loury (2004) for an overview. For example, Beaman (2012) takes clever advantage of a program to resettle political refugees in the United States to study the impact of social connections on employment outcomes. She finds that if refugees were randomly placed into an area where there was a relatively larger group of residents with similar ethnic backgrounds who had been in place for sufficient time, then the resettled refugees had a significantly higher employment rate than similar refugees placed into areas with smaller groups of tenured residents.
12 Journal of Economic Perspectives
understanding economic behaviors: one concerns the “centrality” of individual nodes in a network, and the other concerns local “clustering” patterns.
Let us begin with centrality, as that sheds substantial light on the puzzle of why there was substantial variation in participation in microfinance across villages—ranging from 7 to 44 percent. As we have already discussed, differences in network densities across villages do not seem to vary enough across villages to be the expla-nation in this instance. Also, even though there is substantial (even extreme) homophily in the villages, the bank initially approached enough households (roughly between 5 and 15) in each village that it tended to end up “seeding” the diffusion process within the different main groups in each village. As it turns out, centrality of the first-informed households does vary substantially across villages and in ways that account for a substantial amount of the variation in participation across villages—especially when coupled with whether those first-informed households participate (which affects how likely they are to tell other households).
The idea that centrality of individuals impacts what information they have access to, how they behave, and how their behavior affects that of others was an early one in the literature (for example, Simmel 1908; Katz and Lazarsfeld 1955). This has led to many different measures of the centrality or influence of nodes in a network, ranging from just counting a node’s number of connections, to more sophisticated and iterative methods that track how well connected a node’s friends are (for background, see Jackson 2008).
In the context of the diffusion of microfinance, the centrality concepts that are strong predictors of participation measure the first-informed nodes’ positions in the network based on their reach, where reach is naturally defined based on a diffusion process (for details, see Banerjee, Chandrasekhar, Duflo, and Jackson 2013, 2014). The fact that centrality helps explain the variation in diffusion does not contradict our earlier observation that the basic reproduction numbers in the villages were all above one. The basic reproduction number is, in essence, a limit concept, and with a relatively small number of first-informed households, there is still significant randomness in the diffusion of information, and so the first-informed households’ positions in their village networks can matter significantly.
Beyond diffusion processes, centrality also plays an important role in peer influ-ence. For example, better-connected individuals can have greater opportunities for complementarities in behaviors and exude greater influence. For example, an indi-vidual’s decision to undertake a given behavior can have ripple effects well beyond his or her immediate neighbors, operating via a sort of social multiplier. That social multiplier naturally translates into a centrality measure. Ballester, Calvó-Armengol, and Zenou (2006) and Bramoullé, Kranton, and D’Amours (2014) show that a specific centrality measure based on such a social multiplier calculation captures the influence of individuals in networks with complementarities in actions. Moreover, Calvó-Armengol, Patacchini, and Zenou (2009) find evidence that an individual’s centrality can have significant effects on an individual’s education attainment as well as the education of others. Similarly, more general models of interactions with complementarities (as in Galeotti, Goyal, Jackson, Vega-Redondo, and Yariv 2010)
Matthew O. Jackson 13
make broad predictions about how individual behavior depends on position in a network as well as how that translates into overall behavior in the network, and some of those predictions have recently been confirmed in a laboratory setting (Charness, Feri, Meléndez-Jiménez, and Sutter forthcoming).
“Clustering” is our last example of a prominent network property that has important implications for economic behaviors. This is another property that is prevalent in social networks (see, for example, Watts and Strogatz 1998), like homophily, but its implications are some of the most intricate that we have discussed. Clustering, and various related measures, track whether an individual’s friends form a tightly knit group rather than being separate from each other. For example, one measure of clustering in a network is the frequency with which two friends of a given person are friends with each other. If household A borrows/lends kerosene and rice with households B and C, does that mean that B and C are also likely to borrow/lend kerosene with each other? The answer is often yes; and for a variety of reasons, connections in social networks tend to be correlated, so that friendships are significantly clustered.
Theories of the implications of, and some reasons for, clustering are related to theories of social capital, such as those of Coleman (1988) and Putnam (2000). Those theories suggest that having high interconnectivity in a network on a local level is important in encouraging “cooperative” or “pro-social” behaviors. Recent game-theoretic models have helped clarify how local network patterns relate to behavior, and they shed light on measures related to clustering. Three main insights have emerged. First, in a highly-clustered network, if an individual misbehaves, then news of the misbehavior can quickly spread among that individual’s friends—because the friends are also likely to be friends with each other—and so they can cooperate in retaliating against the misbehavior. Networks without such clustering patterns can insulate an individual from retaliation for bad behavior (Raub and Weesie 1990; Bloch, Genicot, and Ray 2008; Lippert and Spagnolo 2011; Ali and Miller 2012, 2013). Second, a pair of individuals who exchange favors, or who engage in any informal relationship that is not completely contractible, can have stronger incen-tives to behave efficiently if they have friends in common. Those common friends can react to misbehavior by ostracizing the individual, thereby providing incentives for that individual to behave cooperatively/efficiently ( Jackson, Rodriguez-Barraquer, and Tan 2012). Third, high clustering can also affect diffusion. For instance, it may be that an individual will only undertake a new behavior if “enough” of his or her friends also do. For example, a choice of a video game platform may depend on whether one’s friends are using the same platform. High clustering can allow groups of friends to coordinate on their behavior: as one example, all adopting a new technology that requires interaction with others (Centola 2011).
Some of the recent game-theoretic models of how local network patterns impact behavior are being examined in emerging empirical investigations. There is evidence consistent with some of the basic predictions, finding that various local link patterns are important predictors of money transfers and borrowing behavior (Karlan 2007; Karlan, Mobius, Rosenblat, and Szeidl 2009a, b; Blumenstock, Eagle,
14 Journal of Economic Perspectives
and Fafchamps 2013; Kinnan and Townsend 2012); favor exchange ( Jackson, Rodriguez-Barraquer, and Tan 2012); patterns of risk-sharing (Ambrus, Mobius, and Szeidl 2012); and product adoption (Centola 2010).
A Challenge: Endogenous Networks
Our discussion of clustering brings into focus another aspect of how social networks relate to behavior: networks are not only conduits for information or influ-ence, but also adjust in reaction to behaviors. As one example, social norms can be very robust when people fear losing friends and their position in a network if they do not behave in prescribed ways. This symbiosis presents particular challenges for analyses of behaviors in social contexts because the coevolution means that it may be difficult to find exogenous sources of variation. One implication is that it becomes very important to understand how networks form. It is thus no surprise that the other broad branch of the economic networks literature, besides the one studying how network patterns of interactions determine behavior, concerns how networks form.
Network formation is important for various reasons, a couple of which are particularly germane to our discussion here. First, there is a fundamental question of whether the “right” networks form. Given that networks have important implica-tions for behaviors, and that relationships have externalities, we need to know the extent to which networks that form in a decentralized manner end up being effi-cient from society’s perspective. For example, when a researcher undertakes a new collaboration, that collaboration affects what he or she learns and can pass on to other researchers as well as how much time he or she can devote to other collabora-tions. These positive and negative externalities are not always incorporated in the decision to form the new relationship. The early economics literature was focused on network formation models and this question in particular. For example, a central theme in Jackson and Wolinsky (1996) was the differences between networks that form when individuals choose their relationships and the networks that maximize overall welfare.8
A second reason for studying network formation has come to the forefront with the new wave of studies of how networks affect behavior. People often form rela-tionships because they wish to be connected to other individuals for economically relevant reasons like the benefits of collaboration, exchange, and sharing of infor-mation. As mentioned above, this endogeneity poses a huge challenge in analyzing how network structure affects behavior. Although selection and endogeneity issues
8 The early literature explored this theme under a variety of formation processes (for example, Jackson and Wolinsky 1996; Dutta and Mutuswami 1997; Bala and Goyal 2000; Dutta and Jackson 2000; Currarini and Morelli 2000) and ultimately with a variety of stability definitions and in many different settings. Overviews appear in Jackson (2005, 2008) and Goyal (2007).
Networks in the Understanding of Economic Behaviors 15
are well-known to economists working with observational data, the issues in network settings can be acute.
Although a researcher can control for observed characteristics, there could also be homophily driven by unobserved characteristics. For example, in the analysis of microfinance participation decisions in the Indian villages we discussed above, suppose that people who have similar levels of risk aversion are more likely to be friends with each other than people who have differing levels of risk aver-sion, all else held equal. Then correlations in loan-participation decisions across the network could be due to the correlations in risk preferences between linked indi-viduals, not social influence. In our analysis such confounds for peer influence were likely not a major issue, as we found no peer effects after correcting for information passing (for which we had some identification), but it might not always work out that way. Indeed, failing to properly account for such homophily has been shown to lead to major biases in some imputed peer effects: Aral, Muchnik, and Sundararajan (2009) find such a bias in a network of estimating peer influence among 27 million users of an instant messaging network; and studies by Hsieh and Lee (2011) and Badev (2013) find such effects in friendship networks and decisions to smoke in US high schools.
One approach to dealing with this is to perform controlled experiments. This can be done by fully controlling the network of relationships within a lab (for example, Choi, Gale, and Kariv 2005; Kearns, Judd, Tan, and Wortman 2009), or by assigning subjects in the field positions in a network through which they must communicate (for example, Centola 2010, 2011; Goeree, McConnell, Mitchell, Tromp, and Yariv 2010). These techniques can test theories of how networks impact behaviors, which can then help inform further research as well as policy.
Although controlling networks themselves is not always possible, especially when dealing with the large-scale networks upon which some of the most inter-esting research questions apply, one can still exert some control over the interaction patterns and obtain robust conclusions. For example, Cai, de Janvry, and Sadoulet (forthcoming) examine the diffusion of a new form of insurance in rural China. After mapping out social networks, these researchers select some individuals to receive some financial education and then examine how that education (or lack thereof) affects decisions to participate in an insurance program by friends of farmers. By controlling who receives the education and the level of that education, they are able to see that the impact of having an additional “educated” friend is substantial—about half as much as the impact of directly receiving the education, and equivalent to a 15 percent drop in the price of insurance. Moreover, they are able to separate the effect of a friend’s education from that friend’s own decision to buy insurance and find that it is the information from the education, not the purchase decision, that impacts the friend’s decision.
Of course, field experiments that appropriately control interactions or treat-ments are often impractical, especially in some very interesting areas for networks research: financial markets, crime, international alliances, and many others. Rather than giving up on research in these areas, or waiting for some lucky source of
16 Journal of Economic Perspectives
exogenous variation or a powerful instrument, we must still make progress as the importance of the applications require it. This requires modeling network forma-tion and handling the endogeneity issue head-on.
One innovative technique is based on the “latent space” (meaning unob-served characteristic space) estimation that has roots in statistics and has seen some limited use in network settings before (as in Hoff, Raftery, and Handcock 2002). The ideas behind these techniques were recently put to new use in network settings by Goldsmith-Pinkham and Imbens (2013) to account for unobserved homophily.
As a simple illustration, suppose that we are interested in how networks of student friendships affect scholastic achievement and that two traits influence how they form friendships: their ethnicity and how ambitious they are. To keep the illus-tration simple, suppose that there are two ethnicities and two levels of ambition. Suppose that a student has a high probability of forming a friendship with another student who is the same on both traits, a medium probability of forming a friend-ship with another student who is the same on one trait and different on the other, and a low probability of forming a friendship with another student who is different on both traits. Now consider a researcher who observes the ethnicities of students and the friendship network but not the students’ ambition level. Without correcting for ambition, which could affect scholastic achievement, we might misattribute some achievement effects to the network interactions and even to the ethnicities.
The key idea in this approach is that homophily can help us to draw inferences about the unobserved trait of ambition. For instance, if we see two students who are friends but of different ethnicities, then that helps us to infer something about their similarity with regards to ambition. Since they differ in ethnicity, it would be very unlikely for the friendship to have formed if they also differed on ambition levels. So, observing the friendship in spite of their difference in ethnicity leads us to believe it is more likely that these two have similar ambition levels than two people picked at random in the population. Similarly, if we see two people who are not friends but who are of the same ethnicity, then they are less likely to be similar on the ambition dimension than two individuals chosen at random from the popula-tion. The next step is then to use this insight to help in estimating peer effects. This method thus allows one to see whether the inferred missing characteristic correlates with achievement, and then accounting for that correction eliminates some of the bias in the attribution to other factors, such as peer influence. Even without fully estimating the impact of the unobserved characteristics, as Goldsmith-Pinkham and Imbens (2013) discuss, one can still use these ideas to test for possible missing correlated attributes.
This latent-space technique can be powerful, but is particularly sensitive to the way in which the model is specified. We need not know which unobserved factors might affect network formation and behavior. In the example, the unobserved factor was called “ambition,” but it could have been any set of variables that acted similarly. The tricky part is that one has to guess the right specification, for instance the form that unobserved variables take (discrete, continuous) and how they impact behav-iors (linearly, nonlinearly, in concert with other variables, or some other choice),
Matthew O. Jackson 17
and (to date) the approach is a parametric one.9 The technique can be thought of as an analog to revealed preference theory: we do not observe consumers’ prefer-ences, but can estimate them assuming that consumers are maximizing some class of utility function subject to errors, similar to here presuming that homophily along some unobserved traits exists and takes some functional form, subject to errors. The inferred traits and homophily, just as the inferred utility function and preference maximization, can then be used to help understand behaviors. The quality of the inference then depends on the appropriateness and versatility of the models.
This brings us back to one of the most important areas of network research: developing richer, but still tractable, models of network formation. By richer, I mean the following. In the latent-space example, formation took place entirely at the link level: the decisions by two individuals to form a friendship was based solely on their characteristics. However, as we saw in our discussion of clustering, link formation in a network is generally correlated. For example, people meet each other through friends of friends; there are advantages to having friends be friends with each other; networks with local clique structures are better suited for enforcing behaviors; and, most basically, the value of a relationship generally depends on to whom the other party is linked.
So, ideally, we would like a model of network formation to do three things: i) allow for network effects and admit dependencies at more than the link level; ii) capture endogenous decisions to form relationships; and iii) be tractable enough to take to data.
Satisfying all three desiderata is challenging, and models that do so are only now emerging. With interdependencies in relationships, a model can no longer be specified at the link level but must involve a more holistic view of the network. Specifying the likelihood at a network level then runs into tractability issues, as the number of possible networks is exponential in the number of nodes, and so even with a tiny number of nodes it is impossible to calculate the relative likelihood of different networks. The model that has become a workhorse in the sociology literature, the exponential random graph model, allows for quite rich sets of depen-dencies in relationships and can be adapted to allow for endogenous decisions to form relationships as functions both of network position and node characteristics. Unfortunately, in the raw form, these models have severe computability issues and deficiencies in accuracy even though there is software that provides estimates.10
Some models do satisfy all of the above desiderata, either by building the network in a sequential fashion that allows new links to depend on the network existing at the time of a new node’s entry (Barabasi and Albert 1999; Jackson and
9 For more discussion of this technique and other issues related to modeling and estimating peer interac-tions with endogenous relationships, see the comments that follow the Goldsmith-Pinkham and Imbens (2013) paper.10 The Markov Chain Monte Carlo simulations used in the estimation procedures generally do not mix in less than exponential time (Bhamidi, Bresler, and Sly 2008), and so even though estimates are offered by the software, the estimates and the bootstrapped random errors can be inaccurate (see the discussion in Chandrasekhar and Jackson 2014).
18 Journal of Economic Perspectives
Rogers 2007; Christakis, Fowler, Imbens, and Kalyanaraman 2010; Chaney forth-coming); building the network in such a way that very specific dependencies are admitted but are restricted in ways so as to not cause estimation problems (Mele 2010); or by modeling at a “subgraph level,” allowing for local interdependencies but allowing for sufficient independence on a larger scale so as to enable easy esti-mation (Chandrasekhar and Jackson 2014).
In addition, one needs models that address homophily and help sort out the various forces that mold individual decisions to associate with others with similar characteristics. Homophily depends not only on preferences, but also depends on opportunities to form relationships, on norms, and on other factors. There are some emerging models of network formation that pay particular attention to under-standing homophily (for example, Currarini, Jackson, and Pin 2009, 2010; Baccara and Yariv 2010; Tarbush and Teytelboym 2014; Graham 2014), and such models may be useful as steps in building models suited for general application.
The Future
Economists cannot ignore that many human decisions are made in the context of, and shaped by, networks of interactions. The variety of settings in which network analyses are providing deep insights is already substantial and continues to expand, including: development economics, labor markets, risk sharing, local public good provision, crime, education, social learning, bargaining and exchange, technology adoption, marketing, international trade, financial markets, and political economy. As such, it is inevitable that economic research on social networks will continue to grow and become part of an economist’s basic toolbox. Many models of networked interactions are not difficult to simulate, and thus can be estimated in ways that are quite familiar to social scientists who work with data. The main novelty is including information about network structure, such as density, homophily, centralities, or details of who interacts with whom; and such data is increasingly easy to find or collect. The healthy interface between empirical observation and theory is helping us develop richer network models that are tractable and versatile—helping us to answer questions as to why certain patterns of behavior appear and what the ulti-mate welfare and policy implications are.
Our changing world makes such analyses imperative. Indeed, advances in technology make it possible not only to interact with greater numbers of people, but also for niche groups built around specific interests to attract and maintain critical masses. News can spread around the globe in minutes, people can very cheaply keep in touch with others and collaborate on projects at great distances, and one can find a wanting audience for almost any type of knowledge or opinion. These potentially profound changes can lead to an increasingly dense network of interactions, but also could result in more segregated interactions, as it becomes easier to locate and stay in communication with others who have similar charac-teristics or interests. As we have seen, network density and homophily are network
Networks in the Understanding of Economic Behaviors 19
properties that have different implications for behavior. Which one will win out: will the world become more interconnected or polarized? The answer may depend on context, since as we glimpsed above, these changes may have different implica-tions for a pure contagion process, such as the spread of a disease, compared to one that is more interactive like collective action or political activism. Understanding the ultimate impact of such changes on our beliefs, decisions, and behaviors, will draw on a well-developed science of networked interactions and provides a rich agenda for an exciting field.
■ Thank you to Arun Chandrasekhar, Ben Golub, Yiqing Xing, and the editors of the journal for helpful conversations and detailed comments on earlier drafts. Financial support from the NSF under grant SES-1155302, from the AFOSR and DARPA under grant FA9550-12-1-0411, and from ARO MURI under award No. W911NF-12-1-0509 is gratefully acknowledged.
References
Acemoglu, Daron, Asuman Ozdaglar, and Alireza Tahbaz-Salehi. Forthcoming. “Systemic Risk and Stability in Financial Networks.” American Economic Review.
Alatas, Vivi, Abhijit Banerjee, Arun G. Chandrasekhar, Rema Hanna, and Benjamin A. Olken. 2012. “Network Structure and the Aggrega-tion of Information: Theory and Evidence from Indonesia.” NBER Working Paper 18351.
Ali, S. Nageeb, and David A. Miller. 2012. “Ostracism.” https://dl.dropboxusercontent.com /u/1258389/Website/ostracism.pdf.
Ali, S. Nabeeb, and David Miller. 2013. “Enforcing Cooperation in Networked Societies.” http://www-personal.umich.edu/~econdm/files /AliMiller-Cooperation.html.
Allen, Franklin, and Ana Babus. 2009. “Networks in Finance.” In The Network Challenge: Strategy, Profit, and Risk in an Interlinked World, edited by P. R. Kleindorfer and Y. Gerry, 367–82. Wharton School Publishing.
Ambrus, Attila, Markus Mobius, and Adam Szeidl. 2012. “Consumption Risk-Sharing in Social Networks.” NBER Working Paper 15719.
Anderson, Roy M., and Robert M. May. 1991. Infectious Diseases of Humans. Oxford University Press.
Aral, Sinan, Lev Muchnik, and Arun Sundararajan. 2009. “Distinguishing Influence-Based Contagions from Homophily-Driven Diffusion in Dynamic Networks.” PNAS 106(51): 21544–49.
Baccara, Mariagiovanna, and Leeat Yariv. 2013. “Homophily in Peer Groups.” American Economic Journal: Microeconomics 5(3): 69–96.
Badev, Anton. 2013. “Discrete Games in Endog-enous Networks: Theory and Policy.” PSC Working Paper PSC 13-05, Population Studies Center, University of Pennsylvania.
Bala, Venkatesh, and Sanjeev Goyal. 2000. “A Noncooperative Model of Network Formation.” Econometrica 68(5): 1181–29.
Ballester, Coralio, Antoni Calvó-Armengol, and Yves Zenou. 2006. “Who’s Who in Networks, Wanted: the Key Player.” Econometrica 74(5): 1403–17.
Banerjee, Abhijit, Arun G. Chandrasekhar, Esther Duflo, and Matthew O. Jackson. 2013. “The Diffusion of Microfinance.” Science 341(6144).
20 Journal of Economic Perspectives
Banerjee, Abhijit, Arun G. Chandrasekhar, Esther Duflo, and Matthew O. Jackson. 2014. “Gossip: Identifying Central Individuals in a Social Network.” NBER Working Paper 20422.
Barabasi, Albert-László, and Réka Albert. 1999. “Emergence of Scaling in Random Networks.” Science 286(5439): 509–512.
Beaman, Lori A. 2012. “Social Networks and the Dynamics of Labour Market Outcomes: Evidence from Refugees Resettled in the U.S.” Review of Economic Studies 79(1): 128–61.
Benhabib, Jess, Alberto Bisin, and Matthew O. Jackson. 2011. Handbook of Social Economics, 2 vols. North-Holland.
Bhamidi, Shankar, Guy Bresler, and Allan Sly. 2008 “Mixing Time of Exponential Random Graphs.” Foundations of Computer Science, 2008, IEEE 49th Annual IEEE Symposium on. IEEE, pp. 803–812.
Bloch, Francis, Garance Genicot, and Debraj Ray. 2008. “Informal Insurance in Social Networks.” Journal of Economic Theory 143(1): 36–58.
Blumenstock, Joshua, Nathan Eagle, and Marcel Fafchamps. 2013. “Motives for Mobile Phone-Based Giving: Evidence in the Aftermath of Natural Disas-ters.” http://www.jblumenstock.com/files/papers /jblumenstock_mobilequakes.pdf.
Bramoullé, Yann, Habiba Djebbari, and Bernard Fortin. 2009. “Identification of Peer Effects through Social Networks.” Journal of Econo-metrics 150(1): 41–55.
Bramoullé, Yann, Rachel Kranton, and Martin D’Amours. 2014. “Strategic Interaction in Networks.” American Economic Review 104(3): 898–930.
Burt, Ronald S. 1992. Structural Holes: The Social Structure of Competition. Harvard University Press.
Cai, Jing, Alain de Janvry, and Elisabeth Sadoulet. Forthcoming. “Social Networks and the Decision to Insure.” American Economic Journal: Applied Economics.
Calvó-Armengol, Antoni, and Matthew O. Jackson. 2004. “The Effects of Social Networks on Employment and Inequality.” American Economic Review 94(3): 426–54.
Calvó-Armengol, Antoni, and Matthew O. Jackson. 2007. “Networks in Labor Markets: Wage and Employment Dynamics and Inequality.” Journal of Economic Theory 132(1): 27–46.
Calvó-Armengol, Antoni, Eleonara Patacchini, and Yves Zenou. 2009. “Peer Effects and Social Networks in Education.” Review of Economic Studies 76(4): 1239–67.
Campbell, Arthur. 2013. “Word-of-Mouth Com-munication and Percolation in Social Networks.” American Economic Review 103(6): 2466–98.
Centola, Damon. 2010. “The Spread of Behavior in an Online Social Network Experiment.” Science 329(5996): 1194–97.
Centola, Damon. 2011. “An Experimental Study of Homophily in the Adoption of Health Behavior.” Science 334(6060): 1269–72.
Chandrasekhar, Arun, and Matthew O. Jackson. 2014. “Tractable and Consistent Random Graph Models.” Available at SSRN: http://ssrn.com /abstract=2150428.
Chaney, Thomas. Forthcoming. “The Network Structure of International Trade.” American Eco-nomic Review.
Charness, Gary, Francesco Feri, Miguel Meléndez-Jiménez, and Matthias Sutter. Forth-coming. “Experimental Games on Networks: Underpinnings of Behavior and Equilibrium Selection.” Econometrica.
Choi, Syngjoo, Doublas Gale, and Shachar Kariv. 2005. “Behavioral Aspects of Learning in Social Networks: An Experimental Study.” Advances in Applied Microeconomics: A Research Annual, vol. 13, pp. 25–61.
Christakis, Nicholas A., James H. Fowler, Guido W. Imbens, and Karthik Kalyanaraman. 2010. “An Empirical Model for Strategic Network Formation.” NBER Working Paper 16039.
Coleman, James S. 1988. “Social Capital in the Creation of Human Capital.” American Journal of Sociology 94(Supplement): S95–S120.
Currarini, Sergio, Matthew O. Jackson, and Paolo Pin. 2009. “An Economic Model of Friend-ship: Homophily, Minorities, and Segregation.” Econometrica 77(4): 1003–1045.
Currarini, Sergio, Matthew O. Jackson, and Paolo Pin. 2010. “Identifying the Roles of Race-based Choice and Chance in High School Friendship Network Formation.” Proceedings of the National Academy of Sciences 107(11): 4857–61.
Currarini, Sergio, and Massimo Morelli. 2000. “Network Formation with Sequential Demands.” Review of Economic Design 5(3): 229–50.
Dandekar, Pranav, Ashish Goel, and David T. Lee. 2013. “Biased Assimilation, Homophily, and the Dynamics of Polarization.” Proceedings of the National Academy of Sciences 110(15): 5791–96.
Demange, Gabrielle, and Myrna Wooders. 2005. Group Formation in Economics; Networks, Clubs and Coalitions. Cambridge University Press.
Dutta, Bhaskar, and Matthew O. Jackson. 2000. “The Stability and Efficiency of Directed Commu-nication Networks.” Review of Economic Design 5(3): 251–72.
Dutta, Bhaskar, and Suresh Mutuswami. 1997. “Stable Networks.” Journal of Economic Theory 76(2): 322–44.
Elliott, Matthew, Benjamin Golub, and Matthew O. Jackson. Forthcoming. “Financial Networks and Contagion.” American Economic Review.
Furusawa, Taiji, and Hideo Konishi. 2007. “Free
Matthew O. Jackson 21
Trade Networks.” Journal of International Economics 7(2): 310–35.
Gai, Prasanna, and Sujit Kapadia. 2010. “Conta-gion in Financial Networks.” Proceedings of the Royal Society A, 466(2120): 2401–23.
Galeotti, Andrea, Sanjeev Goyal, Matthew O. Jackson, Fernando Vega-Redondo, and Leeat Yariv. 2010. “Network Games.” Review of Economic Studies 77(1): 218–44.
Galeotti, Andrea, and Brian W. Rogers. 2013. “Strategic Immunization and Group Structure.” American Economic Journal: Microeconomics 5(2): 1–32.
Goeree, Jacob K., Margaret A. McConnell, Tiffany Mitchell, Tracey Tromp, and Leeat Yariv. 2010. “The 1/d Law of Giving.” American Economic Journal: Microeconomics 2(1): 183–203.
Goldsmith-Pinkham, Paul, and Guido W. Imbens. 2013. “Social Networks and the Identi-fication of Peer Effects.” Journal of Business and Economic Statistics 31(3): 253–64.
Golub, Benjamin, and Matthew O. Jackson. 2012. “How Homophily Affects the Speed of Learning and Best-Response Dynamics.” Quarterly Journal of Economics 127(3): 1287–1338.
Goyal, Sanjeev 2007. Connections: An Intro-duction to the Economics of Networks. Cambridge University Press.
Graham, Bryan S. 2014. “An Empirical Model of Network Formation: Detecting Homophily when Agents Are Heterogeneous.” Berkeley.
Granovetter, Mark. 2005 “The Impact of Social Structure on Economic Outcomes.’’ Journal of Economic Perspectives 19(1): 33–50.
Hagenbach, Jeanne, and Frédéric Koessler. 2010. “Strategic Communication Networks.” Review of Economic Studies 77(3): 1072–99.
Hoff, Peter, Adrian E. Raftery, and Mark S. Handcock. 2002. “Latent Space Approaches to Social Network Analysis.” Journal of the American Statistical Association 97(460): 1090–98.
Hsieh, Chih-Sheng, and Lung-fei. Lee. 2011. “A Social Interactions Model with Endogenous Friendship Formation and Selectivity.” https://www.american.edu/cas/economics/info-metrics /pdf/upload/Chin-Sheng-Hsieh-paper-March -2012-conference.pdf.
Ioannides, Yannis M., and Linda Datcher Loury. 2004. “Job Information Networks, Neighborhood Effects and Inequality.” Journal of Economic Litera-ture 42(4): 1056–93.
Jackson, Matthew O. 2005. “A Survey of Network Formation Models: Stability and Effi-ciency.” Chap. 1 in Group Formation in Economics; Networks, Clubs, and Coalitions, edited by Gabrielle Demange and Myrna Wooders. Cambridge University Press.
Jackson, Matthew O. 2008. Social and Economic Networks. Princeton University Press.
Jackson, Matthew O. 2011 “An Overview of Social Networks and Economic Applications.” Chap. 12 in Handbook of Social Economics, vol. 1, edited by Jess Benhabib, Alberto Bisin, and Matthew O. Jackson. San Diego: North Holland.
Jackson, Matthew O., and Dunia López-Pintado. 2013. “Diffusion and Contagion in Networks with Heterogeneous Agents and Homophily.” Network Science 1(1): 49–67.
Jackson, Matthew O., Tomas Rodriguez-Barraquer, and Xu Tan. 2012. “Social Capital and Social Quilts: Network Patterns of Favor Exchange.” American Economic Review 102(5): 1857–97.
Jackson, Matthew O., and Brian W. Rogers. 2007. “Meeting Strangers and Friends of Friends: How Random Are Social Networks?” American Economic Review 97(3): 890–915.
Jackson, Matthew. O., Brian W. Rogers, and Yves Zenou. 2014. “Economic Consequences of Social Network Structure.” Available soon at SSRN.
Jackson, Matthew O., and Asher Wolinsky. 1996. “A Strategic Model of Social and Economic Networks.” Journal of Economic Theory 71(1): 44–74.
Jackson, Matthew O., and Yves Zenou. 2014. “Games on Networks.” In [Handbook of ] Game Theory with Economic Applications, vol. 4, edited by Young, H. Peyton and Shmuel Zamir. Elsevier.
Jadbabaie, Ali, Pooya Molavi, and Alireza Tahbaz-Salehi. 2013. “Information Heterogeneity and the Speed of Learning in Social Networks.” Columbia Business School Research Paper 13-28.
Karlan, Dean S. 2007. “Social Connections and Group Banking.” Economic Journal 117(517): F52–F84.
Karlan, Dean, Markus M. Mobius, Tanya S. Rosenblat, and Adam Szeidl. 2009a. “Measuring Trust in Peruvian Shantytowns.” http://www .personal.ceu.hu/staff/Adam_Szeidl/papers /trust_peru.pdf.
Karlan, Dean, Markus Mobius, Tanya Rosenblat, and Adam Szeidl. 2009b. “Trust and Social Collateral.” Quarterly Journal of Economics 124(3): 1307–61.
Katz, Elihu, and Paul F. Lazarsfeld. 1955. Personal Influence: The Part Played by People in the Flow of Mass Communication. Glencoe, IL: Free Press.
Kearns, Michael, Stephen Judd, Jinsong Tan, and Jennifer Wortman. 2009. “Behavioral Experiments on Biased Voting in Networks.” PNAS 106(5): 1347–52.
Kinnan, Cynthia, and Robert Townsend. 2012. “Kinship and Financial Networks, Formal Financial Access, and Risk Reduction.” American Economic Review 102(3): 289–93.
Lazarsfeld, Peter F., and Robert K. Merton.
22 Journal of Economic Perspectives
1954. “Friendship as a Social Process: A Substan-tive and Methodological Analysis.” In Freedom and Control in Modern Society, edited by Morroe Berger, 18–66. New York: Van Nostrand.
Lippert, Steffen, and Giancarlo Spagnolo. 2011. “Networks of Relations and Word-of-Mouth Communication.” Games and Economic Behavior 72(1): 202–17.
Manski, Charles F. 1993. “Identification of Endogenous Social Effects: The Reflection Problem.” Review of Economic Studies 60(3): 531–42.
Marvel, Seth A., Travis Martin, Charles R. Doering, David Lusseau, and M. E. J. Newman. 2013. “The Small-World Effect is a Modern Phenomenon.’’ arXiv:1310.2636 [physics.soc-ph].
McPherson, Miller, Lynn Smith-Lovin, and James M. Cook. 2001. “Birds of a Feather: Homophily in Social Networks.” Annual Review of Sociology 27: 415–44.
Mele, Angelo. 2010. “A Structural Model of Segregation in Social Networks.” NET Institute Working Paper 10-16.
Morris, Stephen. 2000. “Contagion.” Review of Economic Studies 67(1): 57–78.
Newman, M. E. J. 2010. Networks: An Introduc-tion. Oxford University Press.
Putnam, Robert D. 2000. Bowling Alone: The
Collapse and Revival of American Community. New York: Simon and Schuster.
Raub, Werner, and Jeroen Weesie. 1990. “Repu-tation and Efficiency in Social Interactions: An Example of Network Effects.” American Journal of Sociology 96(3): 626–54.
Rees, Albert. 1966. “Information Networks in Labor Markets.” American Economic Review 56(1/2): 559–66.
Reluga, Timothy C. 2009. “An SIS Epidemi-ology Game with Two Subpopulations.” Journal of Biological Dynamics 3(5): 515–31.
Simmel, Georg. 1908. Sociology: Investigations on the Forms of Sociation. Leipzig: Duncker and Humblot.
Tarbush, Bassel, and Alexander Teytelboym. 2014. “Friending.” http://t8el.com/wp-content/uploads /2013/11/TarbushTeytelboymFriending.pdf.
Vega-Redondo, Fernando. 2007. Complex Social Networks. (Econometric Society Monographs.) Cambridge University Press.
Wasserman, Stanley, and Katherine Faust. 1994. “Social Network Analysis: Methods and Applica-tions.” Cambridge University Press.
Watts, Duncan J., and Steven H. Strogatz. 1998. “Collective Dynamics of ‘Small-World’ Networks.” Nature, 393( June, 4): 440–42.
Journal of Economic Perspectives—Volume 28, Number 4—Fall 2014—Pages 23–48
A modern economy is an intricately linked web of specialized production units, each relying on the flow of inputs from their suppliers to produce their own output, which in turn is routed towards other downstream units.
In this essay, I argue that the structure of this production network is key in deter-mining whether and how microeconomic shocks—affecting only a particular firm or technology along the chain—propagate throughout the economy and shape aggregate outcomes. Therefore, understanding the structure of this production network can better inform both academics on the origins of aggregate fluctuations and policy makers on how to prepare for and recover from adverse shocks that disrupt these production chains.
Two recent events have brought to the forefront the importance of intercon-nections between firms and sectors in aggregate economic performance. Consider first the 2011 earthquake in Japan. While the triple tragedy of the earthquake, the ensuing tsunami, and the near nuclear meltdown at Fukushima surely resulted in a significant destruction of human and physical capital, its effects would have been largely restricted to the affected areas were it not for the disruption of national
From Micro to Macro via Production Networks†
■ Vasco M. Carvalho is a Reader in Economics, University of Cambridge, Cambridge, United Kingdom and a Research Affiliate, Center for Economic and Policy Research, London, United Kingdom. He is on leave as a Junior Researcher, Centre de Recerca en Economia Internacional (CREi), Adjunct Professor, Universitat Pompeu Fabra, and Affili-ated Professor, Barcelona Graduate School of Economics, all in Barcelona, Spain.† To access the Data Appendix, visithttp://dx.doi.org/10.1257/jep.28.4.23 doi=10.1257/jep.28.4.23
Vasco M. Carvalho
24 Journal of Economic Perspectives
and global supply chains that it entailed. As Kim and Reynolds (2011) reported for Reuters in the aftermath of the earthquake:
Supply chain disruptions in Japan have forced at least one global automaker to delay the launch of two new models and are forcing other industries to shutter plants. . . . The automaker is just one of dozens, if not hundreds, of Japanese manufacturers facing disruptions to their supply chains as a result of the quake, the subsequent tsunami and a still-unresolved nuclear threat.
On a grander scale, the financial crisis, the 2007–2009 recession, and its after-math have brought with them a renewed emphasis on the complex web of linkages that constitute the backbone of the US economy. Terms like “too interconnected to fail” or “systemically important firms” have become commonplace in public discourse. While this network lingo originated in the confines of an intertwined financial sector, it is increasingly used to describe the transmission of disturbances across individual actors in the economy. One prime example is the reasoning offered in the congressional testimony of Ford’s chief executive officer, Alan Mulally (2008), when requesting the government to bail out Ford’s key competi-tors, General Motors and Chrysler:
If any one of the domestic companies should fail, we believe there is a strong chance that the entire industry would face severe disruption. Ours is in some significant ways an industry that is uniquely interdependent—particularly with respect to our supply base, with more than 90 percent commonality among our suppliers. Should one of the other domestic companies declare bankruptcy, the effect on Ford’s production operations would be felt within days—if not hours. Suppliers could not get financing and would stop shipments to custom-ers. Without parts for the just-in-time inventory system, Ford plants would not be able to produce vehicles.
The common theme across these two examples is that the organization of production along supply chain networks exposes the aggregate economy to disruptions in critical nodes in these chains. In particular, whenever the linkage structure in the economy is dominated by a small number of hubs supplying inputs to many different firms or sectors, aggregate fluctuations may arise for two related, but distinct, reasons. First, fluctuations in these hub-like production units can propagate throughout the economy and affect aggregate performance, much in the same way as a shutdown at a major airport has a disruptive impact on scheduled flights throughout a country. In either case, there are no close substi-tutes in the short run and every user is affected by disturbances at the source. Second, the presence of these hubs provides shortcuts through which these supply chain networks become easily navigable. That is, hubs shorten distances between otherwise disparate parts of the economy that do not directly trade inputs. The
Vasco M. Carvalho 25
upshot of this is that these production hubs act as powerful shock conductors, helping to transmit shocks originating elsewhere in the network.
In this essay, I argue that these production networks, by facilitating the propa-gation of otherwise localized disturbances, provide a bridge between the micro, involving the myriad of unforeseen events affecting individual production deci-sions, and the macro, i.e., their synchronized behavior defining the business cycle.
This synchronization of production decisions over time has led most of modern macroeconomics to assume the presence of some sort of aggregate shock, at times lifting all boats, at times generating widespread recessions. In doing so, however, modern business cycle theory has assumed—rather than explained—comovement across producers from the outset. Moreover, after decades of research, the origins of these aggregate shocks remain elusive, thus casting doubt on their assumed exis-tence. Against this backdrop, the promise of production networks is to open the black-box of comovement by viewing it as the endogenous outcome of micro shocks propagating across input linkages.
I will begin by showing how this novel view can be easily mapped to a standard multisector general equilibrium setting where different sectors are interlinked by input-output relations. In particular, through a series of stylized examples, I will explore how the propagation of sectoral shocks—and hence aggregate volatility—depends on different arrangements of production, that is, on different “shapes” of the underlying production network.
The natural follow-up question is whether we can discipline the set of admis-sible “shapes” by looking at actual data on production networks. I will do this by exploring, from a network perspective, the empirical properties of a large-scale production network as given by detailed US input-output data.
Given the properties we observe in the data, I then use the model to ask a range of questions: Is the organization of the economy along production networks a source of aggregate fluctuations? Can we understand empirical patterns of sectoral comovement through this lens? Is the level of sectoral comovement a func-tion of how far apart the different sectors are in the production network? Do central sectors in the production network comove more with the aggregate? In short, can traditional tools of network analysis—such as distance across nodes or centrality of a given node—help to further our understanding of what shapes comovement?
Finally, I show that the structure of the production network and the strength of the propagation mechanism it entails is crucial when confronting a deep-seated and influential logic which, to this day, justifies the continued appeal to an exogenous synchronization device, in the form of aggregate shocks. This argument, dating back at least to Lucas (1977), goes as follows: given that uncorrelated micro disturbances, by definition, occur randomly across production nodes, won’t these micro-shocks tend to average out as we disaggregate the economy into finer and finer definitions of what a production unit is? In other words, won’t these local disturbances tend to be diversified away? In turn, doesn’t this imply that we must resort to the convention of aggregate shocks? By bringing theory and empirics together, I will argue that the answer to these questions is likely to be “no.”

26 Journal of Economic Perspectives
A Simple Model of Production Networks
I start by showing how these production networks can be mapped into a basic general equilibrium setting—a static variant of a textbook multisector model without aggregate shocks, following closely the methods we used in Acemoglu, Carvalho, Ozdaglar, and Tahbaz-Salehi (2012). I then discuss how different ways of organizing these production networks can generate different magnitudes of aggregate volatility.
Networks of Input Flows: A General Equilibrium BenchmarkConsider an economy where production takes place at n distinct nodes, each
specializing in a different good. These goods serve a dual role in the economy: on the one hand, each good is potentially valued by households as final consump-tion; on the other hand, the same good can be used as an intermediate input to be deployed in the production of other goods. Here I will focus on this latter role and simplify the final demand side of this economy substantially by assuming that households value the different goods equally and, as a consequence, consume them in equal proportions. In the same spirit, I will assume households provide labor services inelastically to the goods’ producers in the economy and spend all the resulting wage income in the consumption of the n goods.1
A natural interpretation for these production nodes is to equate them with the different sectors of an economy. I assume that the production process at each of these sectors is well approximated by a Cobb–Douglas technology with constant returns to scale, combining a primary factor—which in this case is labor—and inter-mediate inputs. The output of sector i is then given by:
xi = (zi li ) 1−α ( ∏ i=1
n
x ij ω ij )
α
.
In this Cobb–Douglas production function, the first term shows the contribution from primary factors to production. The amount of labor hired by sector i is given by li , while 1 − α is the share of labor in production. The added element in this first term is zi, a sector-specific productivity disturbance, shifting the production possibil-ities frontier of sector i in a random fashion. This is the only source of uncertainty in this simple economy. I assume further that these productivity shocks are inde-pendent across producers of goods in the economy. The absence of any exogenous correlating device—that is, the lack of any aggregate technology shocks—allows us to focus solely on the question of interest: can interconnections across produc-tion technologies, in the form of intermediate inputs flows, generate endogenous comovement across otherwise unrelated producers of goods?
1 In other words, on the final demand side I will be assuming that the representative household has a Cobb–Douglas utility function with the same weights over the different goods and has no disutility of labor.
From Micro to Macro via Production Networks 27
These interconnections between production nodes come into play with the second term of the production function, which reflects the contribution of inter-mediate inputs from other sectors. Thus, the term xij denotes the amount of good j used in the production of good i. The exponent ωij (≥ 0) in the production function gives the share of good j in the total intermediate input use by sector i. 2 For a given sector i, the associated list of ωij’s thus encodes a sort of production recipe. Each nonzero element of this list singles out a good that needs to be sourced in order to produce good i. Whenever a ωij is zero, we are simply stating that sector i cannot usefully incorporate j as input in production, no matter what input prices sector i is currently facing. Note further that all production technologies are, deliberately, being kept largely symmetric: all goods are equally valued by final consumers and all production technologies are equally labor-intensive (specifically, they all share the same α). 3 The only difference across sectors then lies in the bundle of intermediate inputs specified by their production recipe—that is, which goods are necessary as inputs in the production process of other goods.
When we stack together all production recipes in the economy, we obtain a collection of n lists, or rows, each row giving the particular list of ωij’s associated with the production technology in sector i. This list-of-lists is nothing other than an input-output matrix, W, summarizing the structure of intermediate input relations in this economy. Crucially for this paper, all information in W can be equivalently represented by a network, something that has been acknowledged at least since Solow (1952) but rarely put to use. The production network, W, which is the central object of this essay, is then defined by three elements: i) a collection of n vertices or nodes, each vertex corresponding to one of the sectors in the economy; ii) a collection of directed edges, where an edge between any two vertices denotes an input-supplying relationship between two sectors; and iii) a collection of weights, each of which is associated with a particular directed edge and given by the expo-nent ωij in the production function.
The question is now whether different production networks—that is, different arrangements of who sources inputs from whom—matter for comovement and aggregate fluctuations. An initial clue is provided by the general equilibrium solu-tion of the economy just described. In equilibrium, (the logarithm of) aggregate
2 I will further assume that these shares sum to one for any sector i. As a consequence of the Cobb–Douglas constant-returns-to-scale assumption and competitive factor markets, these shares are constant over time. Anticipating the discussion below, they can be read off the entries of input-output tables, measuring the value of spending on input j as a share of total intermediate input purchases of sector i.3 Additionally, it should be stressed that by imposing a convenient, but nevertheless particular, Cobb–Douglas structure to aggregate across intermediate inputs, I am also imposing a unit elasticity of substitution across inputs. In reality, for any given technology, there will be some inputs that are crucial and difficult to substitute away from, even if their price rises substantially—think fresh fish for sushi restaurants in Japan in the aftermath of the Fukushima disaster and the ensuing contamination scare—while others would seem more substitutable—advertising seems like a prime example. Unfortunately, at least at very disaggregated levels, we have little evidence regarding the likely range of these elasticities. At intermediate levels of aggregation—for example, two-digit industries—Atalay (2014) provides evidence in favor of strong complementarity across intermediate inputs.
28 Journal of Economic Perspectives
value added, y, is simply a weighted sum of the (logarithm of) micro-level produc-tivity shocks, εi :
y = ∑ i=1
n
vi εi ,
where the weights, vi , are determined by the production network, W. 4 This charac-terization has two important consequences. First, aggregate output is itself random, which means that we now have a simple theory of why aggregate output might fluc-tuate over time. Second, the magnitude of these aggregate fluctuations can now be traced back to the production network, in particular, how strongly the underlying network propagates micro-shocks across sectors, as encoded by the weights vi .
To understand the specific propagation mechanism at play in this setting, it is perhaps useful to go through a thought experiment. Imagine that a favor-able productivity shock hits one sector in the economy, leaving the productivity of all others unchanged. To be concrete, think for example of a major, unan-ticipated, breakthrough in the production technology of semiconductors which decreases the marginal cost of production significantly. Clearly, this supply shock will increase the production and decrease the price of semiconductors. As a result of this shock, the electronic components sector, which is the key sector down-stream of semiconductors, also sees its marginal cost decline as one of its key inputs has just become cheaper. Electronic component producers will react to this by expanding production and decreasing their own price. A second round of adjustment now ensues as the many sectors downstream of electronic compo-nents—computers, precision machines, or communication devices among many others—adjust in the same way. As the original shock percolates further through the production network, a cascade of adjustments is underway. Ultimately, every sector that is directly or indirectly downstream of semiconductors will find it optimal to increase production by some amount, potentially leading to a synchro-nized expansion of economic activity across the board.
Notice that an outside observer focusing solely on aggregate measurements of the economy and ignoring the structure of intermediate input trade would conclude that a mysterious aggregate productivity shock had just occurred, the source of which would necessarily be elusive. In fact, only one of the many production technologies
4 The competitive equilibrium solution of this basic model economy yields an expression for the loga-rithm of aggregate value added (that is, GDP), y , given by:
y = v′ ε, and
v = (1 − α)
_ n [ I − αW ′ ] −1 1, where 1 is a n × 1 vector of ones and ε is a n × 1 vector of the (logarithm of) sector specific productivity shocks, that is, εi ≡ log(zi). Aggregate GDP, y, is a weighted sum of the underlying micro shocks and hence a random variable itself. The n × 1 vector v gives the appropriate weight to each sector. When a productivity shock hits a given sector, all of the adjustments described in the main text are encapsulated in the term [ I − αW ′ ] −1 . The latter object is nothing other than the celebrated “Leontief inverse” matrix of input-output analysis.
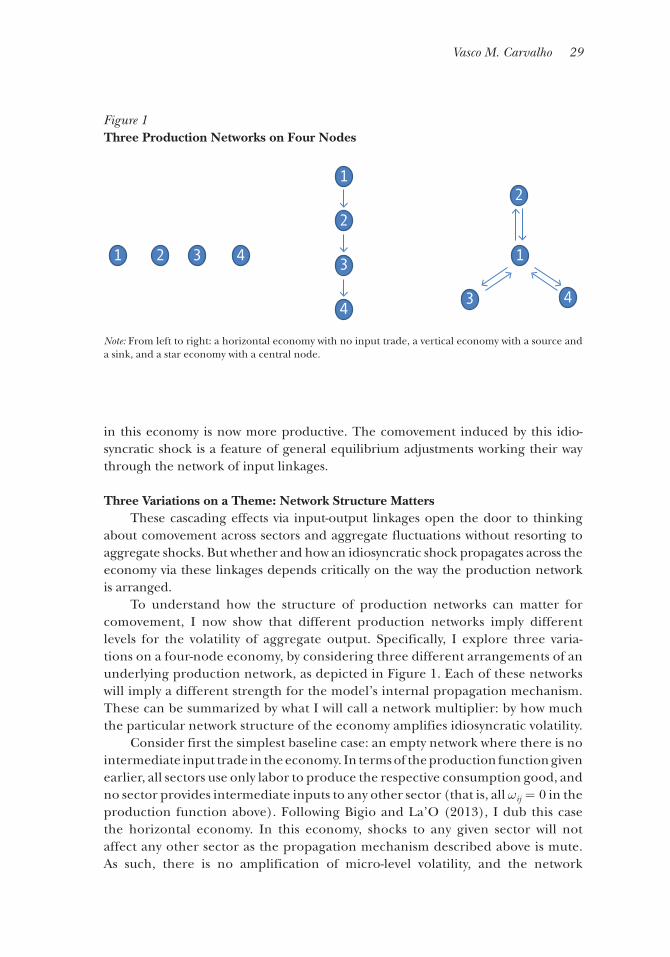
Vasco M. Carvalho 29
in this economy is now more productive. The comovement induced by this idio-syncratic shock is a feature of general equilibrium adjustments working their way through the network of input linkages.
Three Variations on a Theme: Network Structure MattersThese cascading effects via input-output linkages open the door to thinking
about comovement across sectors and aggregate fluctuations without resorting to aggregate shocks. But whether and how an idiosyncratic shock propagates across the economy via these linkages depends critically on the way the production network is arranged.
To understand how the structure of production networks can matter for comovement, I now show that different production networks imply different levels for the volatility of aggregate output. Specifically, I explore three varia-tions on a four-node economy, by considering three different arrangements of an underlying production network, as depicted in Figure 1. Each of these networks will imply a different strength for the model’s internal propagation mechanism. These can be summarized by what I will call a network multiplier: by how much the particular network structure of the economy amplifies idiosyncratic volatility.
Consider first the simplest baseline case: an empty network where there is no intermediate input trade in the economy. In terms of the production function given earlier, all sectors use only labor to produce the respective consumption good, and no sector provides intermediate inputs to any other sector (that is, all ωij = 0 in the production function above). Following Bigio and La’O (2013), I dub this case the horizontal economy. In this economy, shocks to any given sector will not affect any other sector as the propagation mechanism described above is mute. As such, there is no amplification of micro-level volatility, and the network
Figure 1 Three Production Networks on Four Nodes
Note: From left to right: a horizontal economy with no input trade, a vertical economy with a source and a sink, and a star economy with a central node.
1 2 3 4
1
2
3
4
1
2
3 4
30 Journal of Economic Perspectives
multiplier, mH , is equal to 1. 5 If this example seems of little practical relevance, it is worth remembering that this horizontal economy closely corresponds to the modeling of intermediate goods in most of the macroeconomics literature. Typi-cally, these models assume that intermediate goods are produced with primary inputs alone—that is, there are no flows across intermediate inputs producers—and are then combined into a final consumption good by a so-called “final good aggregator.” In our horizontal economy, the different consumption goods are combined into an aggregate consumption bundle through the household’s utility function.
In the context of supply chains, it is perhaps more intuitive to consider what Bigio and La’O (2013) call a vertical economy, one in which inputs flow unidirec-tionally from a well-defined upstream sector (think mining of rare earth minerals, for example), whose output is successively transformed (magnets made from such minerals, which in turn are an input into speakers), and ultimately incorporated in the final downstream sector (your smartphone). In network parlance, this is a tree or line structure with a single source (the upstream node, with no incoming links) and a single sink (the downstream node, with no outgoing links).6 Just as in the horizontal economy, shocks to each sector’s productivity growth have a direct contribution to aggregate output and hence to aggregate volatility. But because sectors are now interlinked, further indirect contributions to aggregate vola-tility arise. For example, productivity fluctuations at the most upstream source, sector 1, now have a first-round effect on its immediate downstream customer, sector 2; a smaller, second-round effect on sector 3; and an even smaller third round effect on sector 4. Sectors 2, 3, and 4 will then contribute to aggregate vola-tility in a similar manner as sector 1 except, being closer to the sink node, they contribute with fewer higher-order indirect effects. Taken together, the presence of these indirect effects—absent in the horizontal economy—implies that the production network amplifies idiosyncratic volatility leading to a network multi-plier mV > mH = 1. This source-sink arrangement of the production network also
5 In the horizontal economy, equilibrium aggregate output is given by y = (1 − α)
_ n ∑ i=1 n εi (using the
equation from the previous footnote). Given that, by assumption, there is no correlation in the
productivity shocks across technologies, the variance of aggregate output is simply σ y 2 =
(1 − α ) 2 σ ε 2 _
4 mH ,
where mH , the network multiplier associated to the horizontal economy, is equal to 1. In the
vertical economy, aggregate output volatility is now given by σ y 2 =
(1 − α)2 σ ε 2 _
4 mV , where the network
multiplier for this vertical economy is mV = [(1 + α + α2 + α3)2 + (1 + α + α2)2 + (1 + α)2 + 1]/4. Clearly mV > mH for any positive share of intermediate inputs. Aggregate output volatility in the
star economy is equal to σ y 2 =
(1 − α)2 σ ε 2 _
4 ms where the network multiplier is now given by mS
= [ ( 3α + 1 _
1 − α 2 )
2 + 3 ( 1 + α/3
_ 1 − α2
) 2 ] /4. Comparing expressions, it is straightforward to show that
mS > mV > mH .6 See Antràs, Chor, Fally, and Hillberry (2012) for a related discussion on how to extract upstreamness measures from input-output data.
From Micro to Macro via Production Networks 31
highlights the disproportionate role of fluctuations occurring in more central technologies. In this example, sector 1 is the main source of fluctuations in the economy, as every other sector in the economy is (directly or indirectly) down-stream of it.
Finally, consider a more exotic configuration in which a single general purpose technology functions as a hub in the network, its output being used as the sole intermediate input of all other sectors. Each of the other sectors are now populated by specialized input producers, each of which is necessary for the general purpose technology to operate. Call this the star economy. While necessarily stylized, this star economy captures an important feature of the input-output data I analyze below, where general purpose inputs—real estate and construction, banking and finance, energy sectors, or various forms of infor-mation technologies—emerge as hubs in the production network. Perhaps not surprisingly, this particular shape of the production network yields the highest volatility across the three example economies just described, that is, the associ-ated network multiplier mS > mV > mH . This heightened volatility comes from two sources. First, productivity fluctuations in the hub sector now have a direct, first-round, impact on every sector in the economy. Second, despite the fact that the remaining technologies are now peripheral, fluctuations in these sectors now propagate to all other sectors, as a second-order effect through their effect on the hub sector. Thus, hub technologies contribute to aggregate volatility in two ways. First, and similarly to the source nodes in the vertical economy, hub sectors act as an important source of shocks. However, in this star economy, a new role emerges: hub sectors act also as an important conductor of shocks occurring elsewhere in the economy.
These three examples demonstrate the possibility that the particular shape of the production network may have a bearing on aggregate volatility. But these are just a few out of the many configurations possible, even in a highly stylized economy with only four nodes. What happens when we take the number of nodes to be very large? How are we to choose among this rich menu of possibilities? How can we summarize the relevant features of these production networks in data? To make progress on these questions, it is necessary to take this network perspective to data on disaggregated input flows.
Mapping Production Networks to Data
The empirical counterpart to a network of production technologies consisting of nodes that represent different sectors and directed flows that capture input trans-actions between sectors is given by input-output data. To investigate the network structure of sector-to-sector input flows, I use the US Bureau of Economic Analysis Commodity-by-Commodity Direct Requirements Detailed Tables. While the data is available from 1972 to 2002 (at five-year intervals) here I only make use of the 2002 vintage of this data. This breaks down the US economy into 417 sectors, which I will
32 Journal of Economic Perspectives
take as nodes in the sectoral input-network. Each nonzero (i, j ) entry is a directed edge of this network—that is, a flow of inputs from supplying sector j to customer i.7 It is worth keeping in mind that the total dollar value of these flows is of the same order of magnitude as aggregate GDP itself. While, for double-counting reasons, these transactions do not show up in GDP figures, a very large amount of resources are devoted yearly to intermediate-input transactions.
For some of the empirical analysis below, I will be focusing only on proper-ties of the extensive margin of input trade across sectors. To do this, I use only the binary information contained in this input-output data—that is, who sources inputs from whom—and disregard the weights associated with such input linkages. More specifically, I only consider a link to be present if the associated input transac-tion is above 1 percent of a sector’s total input purchases. With this threshold rule, I am discarding very small transactions between sectors and focusing on the main components of the bill of goods necessary to the production of any given sector. Following this rule, I account for about 80 percent of the total value of intermediate input trade in the US economy in 2002. Whenever I bring in the intensive margin, I will be using all of the input-output data in the form of intermediate input shares. Note that these shares conveniently map to the Cobb–Douglas coefficients for inter-mediate goods in the production functions introduced in the previous section. The 2002 matrix of all such intermediate input shares W02 = {ωij } i, j=1
n is then the
directed, weighted network under scrutiny.Figure 2 provides a network representation of the input-output data in 2002.
Despite its apparent complexity, we can provide some order by focusing on some key statistics summarizing this network. Thus, a first-order characterization of this network is its sparsity or low “density”8: there are only 5,217 nonzero edges out of a possible 4172, yielding a network density of 0.03. To put it another way: at this level of disaggregation, most sectors consist of very specialized technologies that only supply inputs to a handful of other sectors. As a result, the number of sectors supplied by the average sector—that is, the average “degree” of this network—is relatively low at about 11 relative to the total number of sectors in the network.
The Small World of Production NetworksLooking more closely at the figure, another first-order feature emerges: there
is extensive heterogeneity across sectors in their role as input suppliers. In the data, highly specialized input suppliers coexist alongside general purpose input suppliers,
7 This constitutes the least coarse sectoral data available worldwide and underlies the network analysis in Carvalho (2010) and Acemoglu, Carvalho, Ozdaglar, and Tahbaz-Salehi (2012). Input-output tables are available for a large cross-section of countries at a considerably coarser level. In particular, the input-output accounts from the STAN database (OECD) consist of 47 sectors and are benchmarked for 37 countries near the year 2000. Based on this data, Blöchl, Theis, Vega-Redondo, and Fisher (2011) and McNerney, Fath, and Silverberg (2013) provide a cross-country comparative perspective on the network structure of intersectoral flows.8 Network density is defined by the fraction of edges that are present in the network relative to the total number of possible edges, n2. See, for example, Jackson (2008) for textbook definitions of this and other network objects.
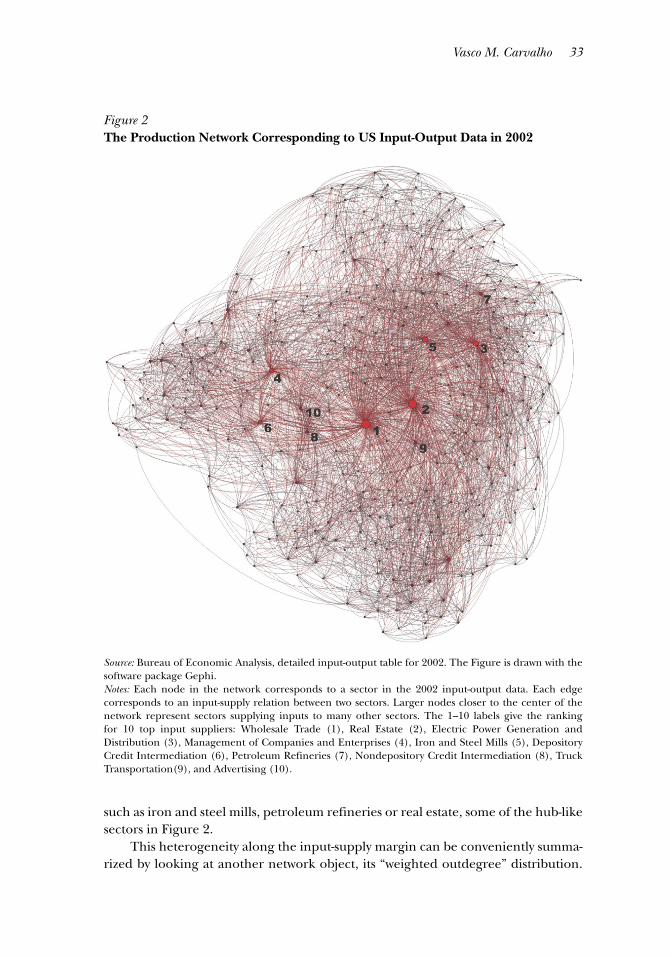
Vasco M. Carvalho 33
such as iron and steel mills, petroleum refineries or real estate, some of the hub-like sectors in Figure 2.
This heterogeneity along the input-supply margin can be conveniently summa-rized by looking at another network object, its “weighted outdegree” distribution.
Figure 2 The Production Network Corresponding to US Input-Output Data in 2002
Source: Bureau of Economic Analysis, detailed input-output table for 2002. The Figure is drawn with the software package Gephi.Notes: Each node in the network corresponds to a sector in the 2002 input-output data. Each edge corresponds to an input-supply relation between two sectors. Larger nodes closer to the center of the network represent sectors supplying inputs to many other sectors. The 1–10 labels give the ranking for 10 top input suppliers: Wholesale Trade (1), Real Estate (2), Electric Power Generation and Distribution (3), Management of Companies and Enterprises (4), Iron and Steel Mills (5), Depository Credit Intermediation (6), Petroleum Refineries (7), Nondepository Credit Intermediation (8), Truck Transportation(9), and Advertising (10).
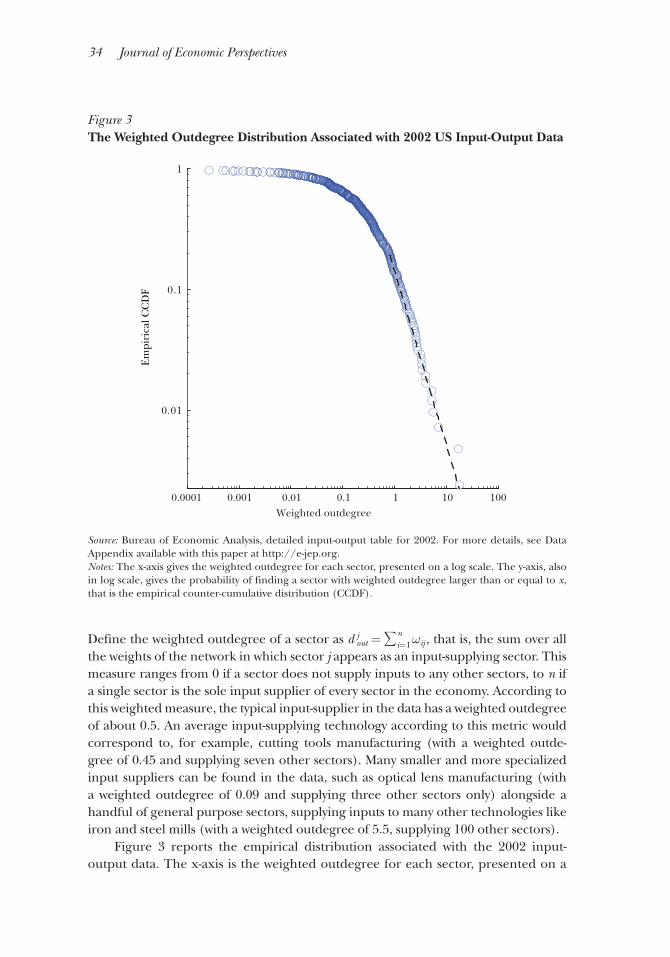
34 Journal of Economic Perspectives
Define the weighted outdegree of a sector as d out j = ∑ i=1
n ωij , that is, the sum over all
the weights of the network in which sector j appears as an input-supplying sector. This measure ranges from 0 if a sector does not supply inputs to any other sectors, to n if a single sector is the sole input supplier of every sector in the economy. According to this weighted measure, the typical input-supplier in the data has a weighted outdegree of about 0.5. An average input-supplying technology according to this metric would correspond to, for example, cutting tools manufacturing (with a weighted outde-gree of 0.45 and supplying seven other sectors). Many smaller and more specialized input suppliers can be found in the data, such as optical lens manufacturing (with a weighted outdegree of 0.09 and supplying three other sectors only) alongside a handful of general purpose sectors, supplying inputs to many other technologies like iron and steel mills (with a weighted outdegree of 5.5, supplying 100 other sectors).
Figure 3 reports the empirical distribution associated with the 2002 input-output data. The x-axis is the weighted outdegree for each sector, presented on a
Figure 3 The Weighted Outdegree Distribution Associated with 2002 US Input-Output Data
Source: Bureau of Economic Analysis, detailed input-output table for 2002. For more details, see Data Appendix available with this paper at http://e-jep.org.Notes: The x-axis gives the weighted outdegree for each sector, presented on a log scale. The y-axis, also in log scale, gives the probability of finding a sector with weighted outdegree larger than or equal to x, that is the empirical counter-cumulative distribution (CCDF).
0.0001 0.001 0.01 0.1 1 10 100
0.01
0.1
1
Weighted outdegree
Em
piri
cal C
CD
F
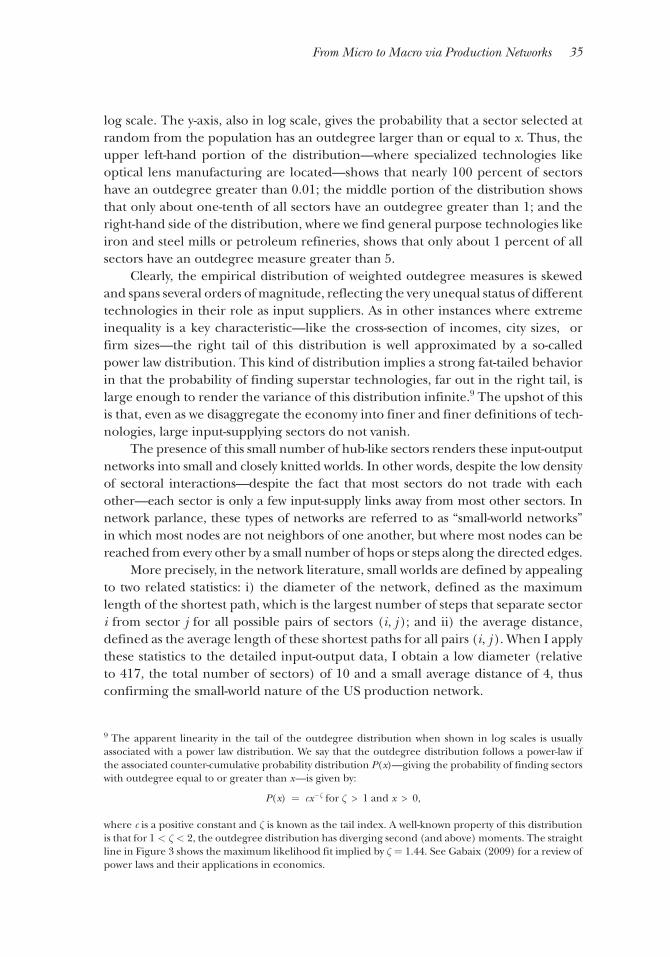
From Micro to Macro via Production Networks 35
log scale. The y-axis, also in log scale, gives the probability that a sector selected at random from the population has an outdegree larger than or equal to x. Thus, the upper left-hand portion of the distribution—where specialized technologies like optical lens manufacturing are located—shows that nearly 100 percent of sectors have an outdegree greater than 0.01; the middle portion of the distribution shows that only about one-tenth of all sectors have an outdegree greater than 1; and the right-hand side of the distribution, where we find general purpose technologies like iron and steel mills or petroleum refineries, shows that only about 1 percent of all sectors have an outdegree measure greater than 5.
Clearly, the empirical distribution of weighted outdegree measures is skewed and spans several orders of magnitude, reflecting the very unequal status of different technologies in their role as input suppliers. As in other instances where extreme inequality is a key characteristic—like the cross-section of incomes, city sizes, or firm sizes—the right tail of this distribution is well approximated by a so-called power law distribution. This kind of distribution implies a strong fat-tailed behavior in that the probability of finding superstar technologies, far out in the right tail, is large enough to render the variance of this distribution infinite.9 The upshot of this is that, even as we disaggregate the economy into finer and finer definitions of tech-nologies, large input-supplying sectors do not vanish.
The presence of this small number of hub-like sectors renders these input-output networks into small and closely knitted worlds. In other words, despite the low density of sectoral interactions—despite the fact that most sectors do not trade with each other—each sector is only a few input-supply links away from most other sectors. In network parlance, these types of networks are referred to as “small-world networks” in which most nodes are not neighbors of one another, but where most nodes can be reached from every other by a small number of hops or steps along the directed edges.
More precisely, in the network literature, small worlds are defined by appealing to two related statistics: i) the diameter of the network, defined as the maximum length of the shortest path, which is the largest number of steps that separate sector i from sector j for all possible pairs of sectors (i, j ); and ii) the average distance, defined as the average length of these shortest paths for all pairs (i, j ). When I apply these statistics to the detailed input-output data, I obtain a low diameter (relative to 417, the total number of sectors) of 10 and a small average distance of 4, thus confirming the small-world nature of the US production network.
9 The apparent linearity in the tail of the outdegree distribution when shown in log scales is usually associated with a power law distribution. We say that the outdegree distribution follows a power-law if the associated counter-cumulative probability distribution P(x)—giving the probability of finding sectors with outdegree equal to or greater than x—is given by:
P(x) = cx−ζ for ζ > 1 and x > 0,
where c is a positive constant and ζ is known as the tail index. A well-known property of this distribution is that for 1 < ζ < 2, the outdegree distribution has diverging second (and above) moments. The straight line in Figure 3 shows the maximum likelihood fit implied by ζ = 1.44. See Gabaix (2009) for a review of power laws and their applications in economics.
36 Journal of Economic Perspectives
The small-world property has obvious implications for the dynamics of processes taking place on networks. In the context of social networks, if it takes only six steps for a rumor to spread from any person to any other in society, a rumor will likely spread much faster than if it takes 100 steps. Similarly, as I will argue further below, if one considers the effect of a production disturbance, shutdown, or default, to a specific firm or technology, the small-world effect implies that the original shock will spread quickly to most sectors, thus affecting the performance of the aggregate economy.
Searching for Central Nodes in the Production NetworkUntil now I have focused attention on key technologies as defined by their
weighted outdegree ranking. These superstar technologies are certainly impor-tant both as sources of volatility and when propagating shocks occurring in other sectors. However, a sector can be key in other ways. For example, consider a sector that looks average by its weighted outdegree ranking, but that nevertheless is a key input supplier to a widely used general purpose technology. Despite the fact that the immediate customers downstream of this sector are few, indirectly—through the downstream hub—many production processes can potentially be affected by distur-bances in the specialized upstream node.10
Identifying the central input-supplying technologies and ranking their roles in an economy requires applying an appropriate measure of “node centrality” to the production network. While network analysis has developed a variety of centrality measures, here I will focus on so-called “influence measures” of centrality, where nodes are considered to be relatively more central in the network if their neighbors are themselves well-connected nodes. The best known of these recursively defined centrality measures is called “eigenvector centrality.” Variants of it have been deployed in the sociology literature, notably Bonacich (1972) and Katz (1953), in computer science with Google’s PageRank algorithm (Brin and Page 1998), or in social networks literature within economics (for example, Ballester, Calvo-Armengol, and Zenou 2006). In our setting, the Katz–Bonacich measure assigns to each sector a centrality score that is the sum of some baseline centrality level (equal across sectors), and the centrality score of each of its downstream sectors, defined in the same way.11 Thus, as in the example above, a sector’s
10 Much in the same way as the impact of an academic article need not be evaluated by its citation count alone but also by the impact of the (downstream) articles citing it.11 To derive the Katz–Bonacich eigenvector centrality measure in our setting consider assigning, to each sector j, a centrality weight, cj > 0, which is defined by some baseline centrality level η, equal across all sectors, plus a term which is proportional to the weighted sum of the centrality weights of its down-stream sectors: cj = λ∑i Wij ci + η, for some parameter λ > 0. In matrix form, c = λW ′ c + η1, where W is the matrix representation of our production network, 1 is a vector of ones, and c is the vector of centrality scores, c′j s. This implies that the vector of centralities is given by:
c = η(I − λW ′)−1 1. Recalling the expression for equilibrium log GDP in the basic model, the vector c is nothing but the vector of Katz–Bonacich centralities given an input-output network W where we restrict η = 1 − α _ n , λ = α (and where α was the share of intermediate inputs in production).
Vasco M. Carvalho 37
centrality need not be dictated by its outdegree alone, but will also be deter-mined by its customers’ outdegree, its customers’ customers’ outdegree, and so on ad infinitum.
Remarkably, the sector-centrality scores obtained in this way exactly coincide with the sector-specific weights, vi , appearing in the expression for equilibrium aggregate output obtained in the previous section. As a result, aggregate growth and volatility in our simple multisector model now depends on a well-defined network object: the collection of network centralities of the different production technologies. Intuitively, more central production technologies in the production network—those having more direct or indirect downstream customers—are relatively more impor-tant in determining aggregate volatility.
On the x-axis of Figure 4 is the (Bonacich) measure of centrality of sectors in the 2002 input-output data. The y-axis gives the probability of finding a sector with a centrality score larger than or equal to x. Thus, 100 percent of the sectors have a centrality measure that is greater than or equal to the most peripheral node in the
Figure 4 The Distribution of Sector Centralities Associated with 2002 US Input-Output Data
Source: Bureau of Economic Analysis, detailed input-output tables for 2002. For more details, see the Data Appendix available with this paper at http://e-jep.org.Notes: On the x-axis is the Bonacich centrality score of the different sectors in the 2002 input-output data, where I have imposed a baseline centrality measure of η = (1 − 0.5)/417 and a parameter for weighting downstream sectors of λ = 0.5. The y-axis gives the probability of finding a sector with a centrality score larger than or equal to x, that is, the empirical counter-cumulative distribution (CCDF).
0.001 0.01 0.1
0.01
0.1
1
Centrality
Em
piri
cal C
CD
F
38 Journal of Economic Perspectives
network—hunting and trapping—with a centrality score of 0.001; about 10 percent of the sectors in the network have a centrality measure greater than 0.004, that of warehousing and storage; and only about 1 percent have a centrality measure greater 0.01, that of truck transportation.
As in the outdegree distribution, there is large variation in the network centrality of different nodes, again in the form of a power-law distribution.12 Far out in the right tail, we find the central production nodes in the network. Through the lenses of our model, sectors such as real estate, management of companies and enterprises, advertising, wholesale trade, telecommunications, iron and steel mills, truck transportation, and depository credit intermediation alongside a variety of energy-related sectors—petroleum refineries, oil and gas extraction, and electric power generation and distribution—are seemingly key to US aggregate volatility as they sit at the center of the production network.13
Production Networks, Comovement, and Aggregate Fluctuations
Our model of production networks stresses the role of input-supply linkages: an idiosyncratic shock affecting a single sector will be transmitted to its downstream neighbors in the network and, via the latter, propagate further downstream to other production nodes which are only indirectly connected with the original sector. Does this model generate testable implications? Can this network perspective shed new light on the comovement patterns at the heart of business cycle fluctuations?
Networked Perspectives on ComovementComovement across sectors is the hallmark of cyclical fluctuations. As stressed
throughout this essay, comovement is endogenous from a production networks perspective: synchronization arises from micro shocks propagating across input linkages. Importantly, this perspective also implies that a very particular pattern of comovement should hold in the data. To see this note that, as an original sectoral shock to productivity makes its way downstream, its effect should weaken. Intui-tively, a shock generating a given response in the output and price of the original input-supplying sector will generate more muted responses further downstream as that input is a smaller part of the total input bill of these sectors. Thus, two sectors that are closer in terms of their network distance should comove more.
12 As discussed in note 9, with regard to Figure 3, the straight line plotted in the figure gives the power-law fit to this data with a tail parameter ξ = 1.48.13 Clearly, many of these sectors are the superstar sectors that also rank high according to the out degree measure. Accordingly, the rank correlation between centrality and outdegree is a very high 0.95. Nevertheless, some sectors do change their ranking substantially between these measures. Oil and gas extraction, together with other mining activities such as coal, provide the best examples of highly central sectors in the network that are nevertheless middling according to their weighted outdegree measure. This is because they are key suppliers of downstream general purpose technologies such as petroleum refineries or electric power generation.
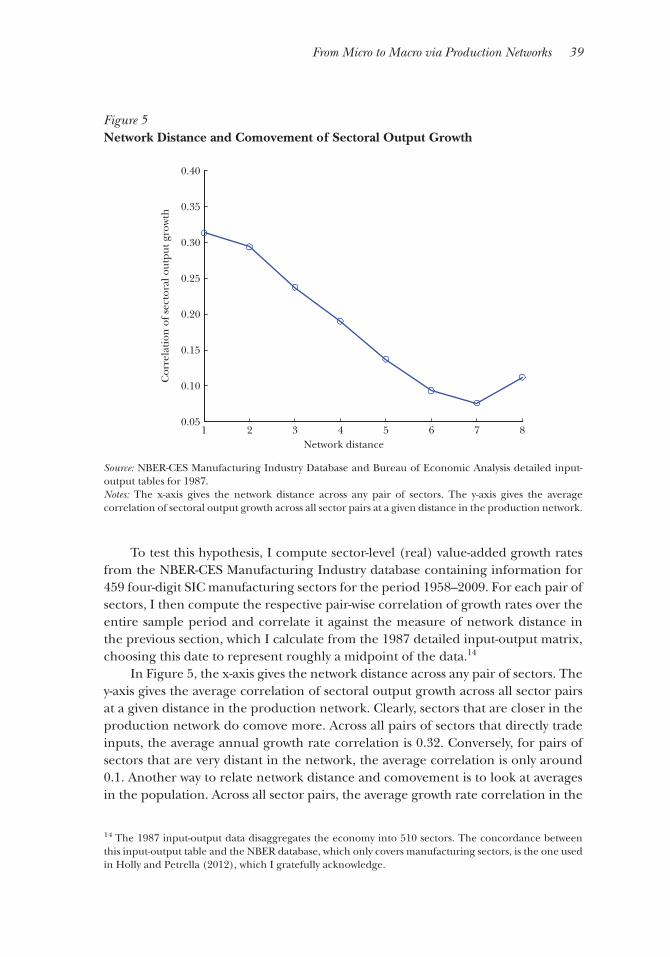
From Micro to Macro via Production Networks 39
To test this hypothesis, I compute sector-level (real) value-added growth rates from the NBER-CES Manufacturing Industry database containing information for 459 four-digit SIC manufacturing sectors for the period 1958–2009. For each pair of sectors, I then compute the respective pair-wise correlation of growth rates over the entire sample period and correlate it against the measure of network distance in the previous section, which I calculate from the 1987 detailed input-output matrix, choosing this date to represent roughly a midpoint of the data.14
In Figure 5, the x-axis gives the network distance across any pair of sectors. The y-axis gives the average correlation of sectoral output growth across all sector pairs at a given distance in the production network. Clearly, sectors that are closer in the production network do comove more. Across all pairs of sectors that directly trade inputs, the average annual growth rate correlation is 0.32. Conversely, for pairs of sectors that are very distant in the network, the average correlation is only around 0.1. Another way to relate network distance and comovement is to look at averages in the population. Across all sector pairs, the average growth rate correlation in the
14 The 1987 input-output data disaggregates the economy into 510 sectors. The concordance between this input-output table and the NBER database, which only covers manufacturing sectors, is the one used in Holly and Petrella (2012), which I gratefully acknowledge.
Figure 5 Network Distance and Comovement of Sectoral Output Growth
Source: NBER-CES Manufacturing Industry Database and Bureau of Economic Analysis detailed input-output tables for 1987.Notes: The x-axis gives the network distance across any pair of sectors. The y-axis gives the average correlation of sectoral output growth across all sector pairs at a given distance in the production network.
1 2 3 4 5 6 7 80.05
0.10
0.15
0.20
0.25
0.30
0.35
0.40
Network distance
Cor
rela
tion
of s
ecto
ral o
utpu
t gro
wth
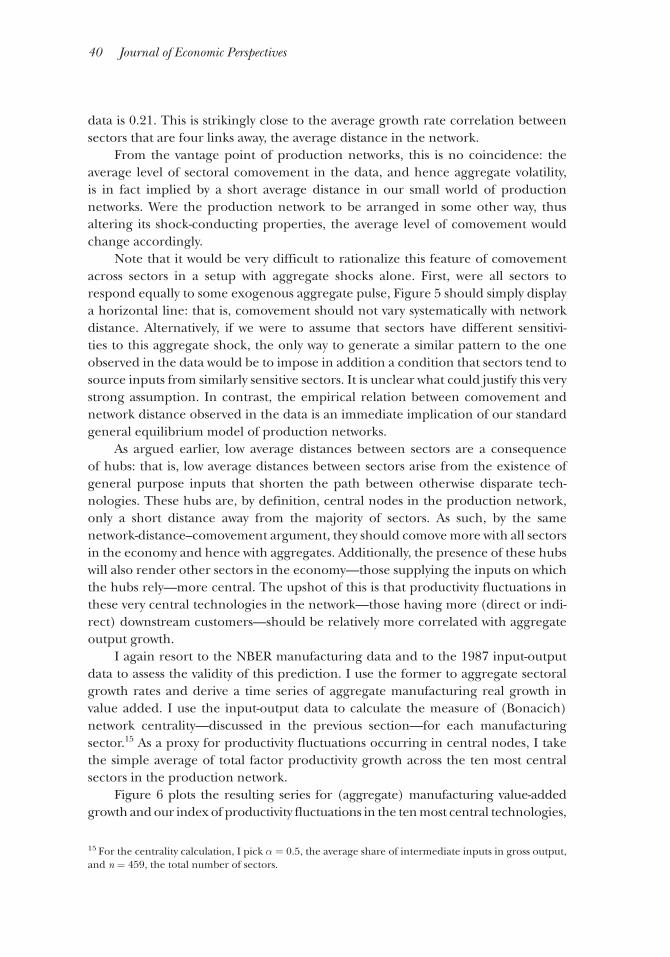
40 Journal of Economic Perspectives
data is 0.21. This is strikingly close to the average growth rate correlation between sectors that are four links away, the average distance in the network.
From the vantage point of production networks, this is no coincidence: the average level of sectoral comovement in the data, and hence aggregate volatility, is in fact implied by a short average distance in our small world of production networks. Were the production network to be arranged in some other way, thus altering its shock-conducting properties, the average level of comovement would change accordingly.
Note that it would be very difficult to rationalize this feature of comovement across sectors in a setup with aggregate shocks alone. First, were all sectors to respond equally to some exogenous aggregate pulse, Figure 5 should simply display a horizontal line: that is, comovement should not vary systematically with network distance. Alternatively, if we were to assume that sectors have different sensitivi-ties to this aggregate shock, the only way to generate a similar pattern to the one observed in the data would be to impose in addition a condition that sectors tend to source inputs from similarly sensitive sectors. It is unclear what could justify this very strong assumption. In contrast, the empirical relation between comovement and network distance observed in the data is an immediate implication of our standard general equilibrium model of production networks.
As argued earlier, low average distances between sectors are a consequence of hubs: that is, low average distances between sectors arise from the existence of general purpose inputs that shorten the path between otherwise disparate tech-nologies. These hubs are, by definition, central nodes in the production network, only a short distance away from the majority of sectors. As such, by the same network-distance–comovement argument, they should comove more with all sectors in the economy and hence with aggregates. Additionally, the presence of these hubs will also render other sectors in the economy—those supplying the inputs on which the hubs rely—more central. The upshot of this is that productivity fluctuations in these very central technologies in the network—those having more (direct or indi-rect) downstream customers—should be relatively more correlated with aggregate output growth.
I again resort to the NBER manufacturing data and to the 1987 input-output data to assess the validity of this prediction. I use the former to aggregate sectoral growth rates and derive a time series of aggregate manufacturing real growth in value added. I use the input-output data to calculate the measure of (Bonacich) network centrality—discussed in the previous section—for each manufacturing sector.15 As a proxy for productivity fluctuations occurring in central nodes, I take the simple average of total factor productivity growth across the ten most central sectors in the production network.
Figure 6 plots the resulting series for (aggregate) manufacturing value-added growth and our index of productivity fluctuations in the ten most central technologies,
15 For the centrality calculation, I pick α = 0.5, the average share of intermediate inputs in gross output, and n = 459, the total number of sectors.
Vasco M. Carvalho 41
for the period 1959–2009. Clearly, the two series track each other very closely. Over the entire sample period the coefficient of correlation is 0.80 and highly significant. As our network perspective predicts, this correlation is much higher than that obtaining for the average centrality sector in the economy (0.29). From an applied perspective, this suggests that analysts and policymakers looking to predict the short-run behavior of macroeconomic aggregates could benefit from tracking economic activity in only a handful of central or systemic sectors.
Several concerns can be raised about this calculation. First, perhaps causality runs the other way: not from key sectors to aggregate economic performance as a networked perspective implies, but instead from aggregate shocks affecting key sectors disproportionately. For this to be the case, productivity in relatively more central technologies would need to be more cyclically sensitive. While it is a priori unclear why “cyclical sensitivity” should correlate with this very particular and nonobvious network centrality measure, this identification problem has not been conclusively dealt with in the literature.
An alternative critique is that this correlation simply reflects an underlying accounting identity and contains no economic meaning beyond that. After all,
Figure 6 Comovement of Productivity Growth in Central Sectors and Aggregate Output Growth
Source: NBER-CES Manufacturing Industry Database and Bureau of Economic Analysis detailed input-output tables for 1987.Notes: The solid line gives manufacturing real value added growth for the period 1959–2009. The dashed line gives the simple average of total factor productivity growth across the ten most central sectors in the production network.
1960 1965 1970 1975 1980 1985 1990 1995 2000 2005−0.20
−0.15
−0.10
−0.05
0
0.05
0.10
0.15
0.20
Gro
wth
rat
e
42 Journal of Economic Perspectives
high-centrality sectors are likely among the larger sectors in the economy. Hence movements in economic activity in these large sectors, for which productivity might be acting as a proxy, would mechanically translate into movement in aggregates. If this critique is valid, were we to remove the contribution of these key sectors to aggregate growth, we should then observe a much lower correlation between productivity growth in high-centrality nodes and aggregate output growth. This can be easily tested by constructing a counterfactual aggregate manufacturing output growth series where we zero out the contribution of the ten most central technolo-gies. Reassuringly, the correlation between this counterfactual aggregate series and our index of productivity fluctuations in these ten most central technologies is still a very high 0.76. This is consistent with our network perspective: hub sectors are important sources of aggregate fluctuations not because they are large but because they synchronize economic activity across the board.
Confronting the (Other) Lucas CritiqueWhile promising as a way to understand the origins of comovement and
aggregate fluctuations, a skeptic might still reasonably argue that all the intuition and results above are just a figment of aggregation. Surely, as we disaggregate the economy into finer and finer sectors, independent disturbances across nodes will tend to average out, leaving aggregates unchanged and thus yielding a weak prop-agation mechanism. In fact, this “diversification” argument has a distinguished pedigree in macroeconomics and was invoked, for example, by Lucas (1977) to do away with the entire outlook proposed in these pages:
In a complex modern economy, there will be a large number of such shifts in any given period, each small in importance relative to total output. There will be much “averaging out” of such effects across markets. Cancellation of this sort is, I think, the most important reason why one cannot seek an explana-tion of the general movements we call business cycles in the mere presence, per se, of unpredictability of conditions in individual markets.
This intuitive yet powerful indictment has been playing out over the years in the modern equilibrium business cycle literature and underlies much of its continued appeal to aggregate taste shifters or technology shocks. Can a production network perspective undo this argument? How does aggregate volatility behave when we take the number of nodes in the production network to be very large—as it surely is in the economy—while keeping the assumption of no aggregate shocks?
We can recreate Lucas’s (1977) “diversification” argument in our networked economy. To see it at play, recall the horizontal economy example introduced above. From that discussion it is immediate that, for a generic number of sectors, n, aggregate volatility in horizontal economies, σy is of the order of magnitude of σ ε _ √
_ n .
That is, as we disaggregate the horizontal economy further, into more and more production nodes, aggregate volatility declines to zero at very rapid rate of √
_ n .
This implies that, holding micro-volatility (σε) fixed, as we move from an economy
From Micro to Macro via Production Networks 43
populated by 100 sectors to one with, say, 10,000 sectors, the implied standard devia-tion of aggregate GDP will be an order of magnitude lower.
However, the network perspective on input flow data renders clear what is mistaken about this argument: the US economy looks nothing like a horizontal economy where intermediate input producers exist in isolation of each other. Instead, the production of each good in the economy relies on a complex set of linkages across sectors. As we have seen, these linkages function as a potential propagation mechanism of idiosyncratic shocks throughout the economy. How strong is this propagation mechanism once we take on board empirical properties of production networks? How strong is the multiplier associated with the actual US production network?
To answer this question we need two ingredients. First, recall that generi-cally the aggregate volatility is a function of the centrality scores of the different technologies in the US production network. Second, as we have seen, there is extensive heterogeneity in these centrality scores: a relatively small number of hub-like sectors are far more central than the vast majority of nodes in the produc-tion network. Based on these two observations, it is possible to show that, for empirically relevant production networks, aggregate volatility is of the order of magnitude of σ ε _
n 1−1/ξ rather than σ ε _ √
_ n , where ξ is nothing else than the slope
of the centrality score distribution in Figure 4. 16 This parameter governs the degree of “inequality” in this distribution: the more unequal is this distribution—which is to say, the more important is the role of a few central input-suppliers in the network—the closer ξ is to 1. The upshot of this is that, in a world where superstar technologies act as powerful shock conductors, aggregate volatility decays much more slowly with the number of sectors, rendering Lucas’s (1977) diversification arguments second order.
To understand the power of this seemingly abstruse distinction, consider the following back-of-the-envelope calculation. From the NBER manufacturing data, the standard deviation of total factor productivity growth for a typical narrowly defined sector is 0.06. For, say, 500 sectors, the horizontal economy would then imply aggre-gate volatility of the order of magnitude of 0.003, a non-starter as a theory of the aggregate business cycle, as Lucas (1977) had argued. Instead, if we use the estimate for ξ associated with Figure 3, which is approximately 1.4 (see footnotes 9 and 12), our theory of production networks now implies non-negligible aggregate volatility of the order of 0.01. In a nutshell, sizeable aggregate fluctuations may originate
16 Under the assumption of idiosyncratic shocks, aggregate volatility in our simple model of production networks is given by:
σy = σε √ _
∑ i=1
n
υ i 2 ,
where υi is the centrality of node i in the production network. Based on a power law distribution of centrality scores, it is possible to show, by applying Gabaix’s (2011) theorem (on the asymptotic behavior of sums of independent random variables with power law weights) that for the empirically relevant fat-
tailed regime (1 < ξ < 2) aggregate volatility is of the order of magnitude of σε _
n 1−1/ε rather than
σε _ √
_ n .
44 Journal of Economic Perspectives
from microeconomic shocks once salient characteristics of the production network are incorporated into the analysis.
Taken together, the networked structure of production is consistent with distinctive patterns of comovement in the data and opens the way for a deeper understanding of the sources of aggregate fluctuations without resorting to conve-nient, but ultimately elusive, aggregate shocks.17
Looking Ahead
Viewing the economy as a complex production network may seem, at least initially, as little more than a fuzzy analogy coated in big words. In this essay, I have attempted to show that this perspective can indeed offer testable hypotheses and insights by mapping it to a standard general equilibrium setup and showing how this provides guidance for empirical explorations of input-output data. Looking at sectoral comovement from this vantage point, I have shown that the immediate implications of this networked perspective cannot be reasonably refuted. Further-more, as I have discussed, theory and empirics together provide a challenge to a long-standing “irrelevance” indictment in the literature. To go beyond these sugges-tive possibility results, a small but fast-expanding literature on production networks is hard at work on a number of important challenges.
First, while throughout this essay I have equated nodes to sectors, input sourcing decisions actually take place at the level of the plant or of the firm. So what constitutes the relevant node: firms, sectors, or both? Relative to sectors, progress on firm-level production networks needs to deal with several added complications. On the theory side, it is more difficult to brush aside the complexities of market structure (as I have done here by appealing to identical, perfectly competitive firms inside each sector). Also, at this level of disaggregation it is clear that we have to distinguish between easily substitutable inputs and crucial, hard-to-substitute inputs where firms are locked-in and switching costs are large. On the empirical side, rela-tive to sector-level data, input-output information at the firm-level is in very short supply. Recent advances in developing a theory of firm-level networks (Oberfield 2013) and the availability of novel data sources provide important first steps in this direction. For examples of firm-level data sources, see Bernard, Moxnes, and
17 These conclusions are related to and reinforce the results of an earlier strand of the literature on cascading behavior in production networks. One of the early papers is Bak, Chen, Scheinkman, and Woodford (1993), where the authors describe the distribution of production avalanches triggered by random independent demand events. See also Jovanovic (1987) for a notable antecedent to this line of research and La’O (2013) for a thought provoking follow-up. These different contributions are not based on an empirical description of the network structure, but instead assume very simple interaction structures across agents, such as circle networks or periodic lattices.
Vasco M. Carvalho 45
Saito (2014) and Carvalho, Nirei, and Saito (2014) for data on Japan, and Atalay, Hortacsu, Roberts, and Syverson (2011) for US data.18
Second, the quantification and empirical validation of the network viewpoint is another active area of research. Work with calibrated dynamic extensions of the simple multisector model set forth here (Carvalho 2010; Atalay 2014) finds a far from negligible role for idiosyncratic shocks, echoing the earlier findings of Horvath (1999). Our results in Carvalho and Gabaix (2013) regarding the dynamics of aggregate volatility are consistent with these findings, although we work with a much simpler setting. In Carvalho (2010), I generalize the theoretical findings on the decay of aggregate volatility (discussed in the previous section of this essay) to a class of dynamic multisector general equilibrium models. In another strand of the literature, Foerster, Sarte, and Watson (2011) and Holly and Petrella (2012) explore econometrically the equilibrium structure of these models and conclude that input-output linkages serve as a powerful amplifier of otherwise independent shocks. At the firm-level, a variety of methods have been deployed—reduced-form correlations, model-derived decompositions of aggre-gate volatility, and natural experiments—to argue that the network structure of production matters quantitatively (Kelly, Lustig, and Van Nieuwerburgh 2013; di Giovanni, Levchenko, and Medjean 2014; and Carvalho, Nirei, and Saito 2014). Finally, the explicit incorporation of the spatial dimension of these production networks—that is, acknowledging the uneven distribution of production nodes across space—holds the promise of both better understanding the mechanics of shock propagation and of potentially isolating arguably exogenous shocks affecting only small parts of the network (Caliendo, Parro, Rossi-Hansberg, and Sarte 2014; Carvalho, Nirei, and Saito 2014).
Third, production network considerations may have a bearing on other areas of research in economics. Perhaps the most immediate candidate would be an open economy extension of the setup considered here. Can comovement across coun-tries be the result of the international transmission of shocks through global supply chain networks? The recent contributions of di Giovanni and Levchenko (2010) and Johnson (forthcoming) are encouraging early steps in this broad direction, but there is still nearly everything to explore from a network perspective. Relatedly, recent theoretical work on global supply chains and the network structure of inter-national trade can be another fruitful source of cross-talk on production networks (Antràs and Chor 2013; Chaney forthcoming; Costinot, Vogel, and Wang 2013).
In light of the recent financial and economic crisis, another promising agenda is to look at financial frictions from a production network perspective. Despite the seminal contribution of Kyotaki and Moore (1997), the possibility of cascading liquidity shocks in a network of producers has been consistently overlooked. Recent work by Bigio and La’O (2013) showing that production networks can serve as a
18 A burgeoning micro-literature on pricing and intermediation in networks can offer additional insights on the theory side. For recent contributions in this area see, for example, Choi, Galeotti, and Goyal (2014); Kotowski and Leister (2014); Manea (2014); and Nava (2014).
46 Journal of Economic Perspectives
powerful amplification mechanism for liquidity shocks represents an important step in this under-researched direction, but more remains to be done.
Finally, once one recognizes that network structure is linked to macroeconomic outcomes, a more ambitious question emerges: what determines these structures? This requires developing a theory where the network of input flows is the endoge-nous outcome of a well-defined economic model. This research direction is virtually unexplored, but see Oberfield (2013) and Carvalho and Voigtländer (2014) for some first steps.
■ I would like to thank David Autor, Chang-Tai Hsieh, Ulrike Malmendier, and Timothy Taylor for detailed comments. I would like to acknowledge the financial support of the European Research Council under the grant “Production Networks in Macroeconomics,” #337054, the Cambridge-INET Institute, and the Keynes Fellowship at the University of Cambridge.
References
Acemoglu, Daron, Vasco M. Carvalho, Asuman Ozdaglar, and Alireza Tahbaz-Salehi. 2012. “The Network Origins of Aggregate Fluctuations.” Econometrica 80(5): 1977–2016.
Antràs, Pol, and Davin Chor. 2013. “Organizing the Global Value Chain.” Econometrica 81(6): 2127–2204.
Antràs, Pol, Davin Chor, Thibault Fally, and Russell Hillberry. 2012. “Measuring the Upstream-ness of Production and Trade Flows.” American Economic Review 102(3): 412–16.
Atalay, Enghin. 2014. “How Important Are Sectoral Shocks?” US Census Bureau Working Papers no. 14-31.
Atalay, Enghin, Ali Hortacsu, James Roberts, and Chad Syverson. 2011. “Network Structure of Production.” PNAS 108(3): 5199–5202.
Bak, Peter, Kan Chen, Jose Scheinkman, and Michael Woodford. 1993. “Aggregate Fluctuations from Independent Sectoral Shocks: Self-Organized Criticality in a Model of Production and Inventory Dynamics.” Ricerche Economiche 47(1): 3–30.
Ballester, Corallo, Antoni Calvo-Armengol, and Yves Zenou. 2006. “Who’s Who in Networks. Wanted: The Key Player.” Econometrica 74(5): 1403–17.
Bernard, Andrew B., Andreas Moxnes, and Yukiko U. Saito. 2014. “Geography and
Firm Performance in the Japanese Production Network.” RIETI Discussion Paper 14-E-034.
Bigio, Saki, and Jennifer La’O. 2013. “Financial Frictions in Production Networks.” https://docs .google.com/viewer?a=v&pid=sites&srcid=ZGVmYXVsdGRvbWFpbnxqZW5sYW9yZXNlYXJjaHxneDo1MGEwYTc5MThjOWVmYWJh.
Blöchl, Florian, Fabian J. Theis, Fernando Vega-Redondo, and Eric O’N. Fisher. 2011. “Vertex Centralities in Input-Output Networks Reveal the Structure of Modern Economies.” Physical Review E, 83, 046127. http://journals.aps .org/pre/abstract/10.1103/PhysRevE.83.046127.
Bonacich, Phillip. 1972. “Factoring and Weighing Approaches to Status Scores and Clique Identification. Journal of Mathematical Sociology 2(1): 113–20.
Brin, Sergey, and Lawrence Page. 1998. “The Anatomy of a Large-Scale Hypertextual Web Search Engine.” Computer Networks 30: 107–117.
Caliendo, Lorenzo, Fernando Parro, Esteban Rossi-Hansberg, Pierre-Daniel Sarte. 2014. “The Impact of Regional and Sectoral Productivity Changes on the U.S. Economy.” NBER Working Paper 20168.
Carvalho, Vasco M. 2010. “Aggregate Fluctua-tions and the Network Structure of Intersectoral Trade.” Department of Economics and Business,
From Micro to Macro via Production Networks 47
Universitat Pompeu Fabra Economics Working Papers 1206.
Carvalho, Vasco M., and Xavier Gabaix. 2013. “The Great Diversification and Its Undoing.” American Economic Review 103(5): 1697–1727.
Carvalho, Vasco M., Makoto Nirei, and Yukiko U. Saito. 2014. “Supply Chain Disruptions: Evidence from the Great East Japan Earthquake.” Unpublished paper.
Carvalho, Vasco M., and Nico Voitgländer. 2014. “Input Diffusion and the Evolution of Production Networks.” NBER Working Paper 20025.
Chaney, Thomas. Forthcoming. “The Network Structure of International Trade.” American Economic Review.
Choi, Syngjoo, Andrea Galeotti, and Sanjeev Goyal. 2014. “Trading in Networks: Theory and Experiments.” Working Paper 2014/08, Cambridge-INET Institute.
Costinot, Arnaud, Jonathan Vogel, and Su Wang. 2013. “An Elementary Theory of Global Supply Chains.” Review of Economic Studies 80(1): 109–144.
di Giovanni, Julian, and Andrei A. Levchenko. 2010. “Putting the Parts Together: Trade, Vertical Linkages, and Business Cycle Comovement.” American Economic Journal: Macroeconomics 2(2): 95–124.
di Giovanni, Julian, Andrei A. Levchenko, and Isabelle Medjean. 2014. “Firms, Destinations, and Aggregate Fluctuations.” Econometrica 82(4): 1303–40.
Foerster, Andrew, Pierre-Daniel Sarte, and Mark W. Watson. 2011. “Sectoral versus Aggregate Shocks: A Structural Factor Analysis of Industrial Produc-tion.” Journal of Political Economy 119(1): 1–38.
Gabaix, Xavier. 2009. “Power Laws in Economics and Finance.” Annual Reviews of Economics 1: 255-293.
Gabaix, Xavier. 2011. “The Granular Origins of Aggregate Fluctuations.” Econometrica 79(3): 733–72.
Holly, Sean, and Ivan Petrella. 2012. “Factor Demand Linkages, Technology Shocks, and the Business Cycle.” Review of Economics and Statistics 94(4): 948–63.
Horvath, Michael. 1999. “Sectoral Shocks and Aggregate Fluctuations.” Journal of Monetary Economics 45(1): 69–106.
Jackson, Matthew O. 2008. Social and Economic Networks. Princeton University Press.
Johnson, Robert C. Forthcoming. “Trade in
Intermediate Inputs and Business Cycle Comove-ment.” American Economic Journal: Macroeconomics.
Jovanovic, Boyan. 1987. “Micro Shocks and Aggregate Risk.” Quarterly Journal of Economics 102(2): 395–409.
Katz, Leo. 1953. “A New Status Index Derived from Sociometric Analysis.” Psychometrika 18(1): 39–43.
Kelly, Bryan T., Hanno N. Lustig, and Stijn Van Nieuwerburgh. 2013. “Firm Volatility in Granular Networks.” Chicago Booth Research Paper no. 12-56.
Kim, Chang-Ran, and Isabel Reynolds. 2011. “Supply Chain Disruptions Force More Delays in Japan.” Reuters, March 23. http://www.reuters .com/article/2011/03/23/us-japan-supplychain -idUSTRE72M21J20110323.
Kotowski, Maciej H., and C. Matthew Leister. 2014. “Trading Networks and Equilibrium Intermediation.” http://econgrads.berkeley.edu /leister/files/2013/07/Trading-Networks-and -Equilibrium-Intermediation-6-10-14.pdf.
Kyotaki, Nobuhiro, and John Moore. 1997. “Credit Chains.” https://www.princeton.edu /~kiyotaki/papers/creditchains.pdf.
La’O, Jennifer. 2013. “A Traffic Jam Theory of Recessions.” 2013 Meeting papers no. 412, Society for Economic Dynamics.
Lucas, Robert E. 1977. “Understanding Busi-ness Cycles.” Carnegie–Rochester Conference Series on Public Policy 5(1): 7–29.
Manea, Mihai. 2014. “Intermediation in Networks.” http://economics.mit.edu/files/8933.
McNerney, James, Brian D. Fath, and Gerald Silverberg. 2013. “Network Structure of Inter-Industry Flows.” Physica A: Statistical Mechanics and its Applications 392(24): 6427–41.
Mulally, Alan. 2008. “Examining the State of the Domestic Automobile Industry.” Hearing, United States Senate Committee on Banking, Housing, and Urban Affairs, November 18.
Nava, Francesco. 2014. “Efficiency in Decentral-ized Oligopolistic Markets.” http://personal.lse .ac.uk/nava/Cournot%20Trade%20Networks.pdf.
Oberfield, Ezra. 2013. “Business Networks, Production Chains, and Productivity: A Theory of Input-Output Architecture.” https://sites.google .com/site/ezraoberfield/working-papers-1/Input Network.pdf?attredirects=0.
Solow, Robert. 1952. “On the Structure of Linear Models.” Econometrica 20(1): 29–46.

48 Journal of Economic Perspectives
Journal of Economic Perspectives—Volume 28, Number 4—Fall 2014—Pages 49–76
A nyone who has spent time in a developing country knows the importance of social connections, which can help individuals land jobs, and provide them with credit and other forms of support. At first glance, it might
appear that such connections distort the economy by giving select individuals an unfair advantage. However, modern economics provides another perspective on this phenomenon, arguing that when markets function imperfectly, networks of socially connected individuals can enhance economic efficiency. For example, when the ability of new hires cannot be observed by the firm, incumbent workers will refer competent members of their community to their employers. These new hires will work diligently both so as not to let down the workers that referred them, and also to avoid the social sanctions they would face from their network if they were caught shirking. In this example, social connections solve information and commitment problems.
Unlike information networks, which can be organized around casual acquain-tances or even anonymous online communities, networks that solve commitment problems must be based on strong social ties to support the sanctions that are needed to maintain cooperative behavior (Karlan, Mobius, Rosenblat, and Szeidl 2009; Dhillon, Iverson, and Torsvik 2013). Commitment networks will thus typi-cally be organized around close-knit communities that have been in place for long periods of time, sometimes spanning multiple generations. Depending on the context, these communities could be based on kinship (for example, castes in India
Community Networks and the Process of Development†
■ Kaivan Munshi is Frank Ramsey Professor of Economics, University of Cambridge, Cambridge, United Kingdom. His email address is [email protected].† To access the Data Appendix, visithttp://dx.doi.org/10.1257/jep.28.4.49 doi=10.1257/jep.28.4.49
Kaivan Munshi
50 Journal of Economic Perspectives
and clans in sub-Saharan Africa) or on geographical proximity (neighborhoods or villages). Members of these well-established communities will work together success-fully to achieve common objectives, sacrificing immediate individual gain when they are sufficiently patient and when the threat of social sanctions is sufficiently severe.
Although community networks may improve outcomes for their members, a major limitation of these informal institutions is that their benefits are restricted to select populations. For example, individuals from a small number of communi-ties that have established business networks (by historical good-fortune) will find it easier to receive the credit and support that they need to start a new business. However, other and possibly more-deserving individuals from other communities will be shut out. This misallocation of resources and talents when commu-nity networks are active was first documented in Banerjee and Munshi (2004). It explains, in part, why less-efficient firms may continue to operate in developing economies (Hsieh and Klenow 2009). It also has obvious consequences for the dynamics of development.
When credit markets function imperfectly, modern growth theory tells us that wealth inequality can persist over many generations (Galor and Zeira 1993; Banerjee and Newman 1993). Once networks are added to the mix, new opportunities for mobility open up at the level of the community. Members of communities that are fortuitously able to establish new networks work together to overcome credit and other constraints, moving as a group to new locations and new occupations (Munshi 2011). The dynamics of the wealth distribution in the overall population will now be more complex, with networks forming and dissipating within and across communi-ties over the course of the development process. How this process actually unfolds will depend not only on the initial wealth distribution, but also on the commu-nity structure and the exogenous sequence of events that triggers the formation of new networks.
My objective in this paper is to lay the groundwork for a new network-based theory of economic development. The first step is to establish that community-based networks are active throughout the developing world. Plenty of anecdotal and descriptive evidence supports this claim. However, showing that these networks improve the economic outcomes of their members is more of a challenge. Over the course of the paper I will present multiple strategies that have been employed to directly or indirectly identify network effects. The second step is to look beyond a static role for community networks, one of overcoming market failures and improving the outcomes of their members in the short-run, to examine how these informal institutions can support group mobility. A volu-minous literature documents the involvement of communities in internal and international migration, both historically and in the contemporary economy. As with the static analysis, the challenge here is to show statistically that community networks directly support the movement of groups of individuals. I will show how predictions from the theory can be used to infer a link between networks and migration in very different contexts.
Kaivan Munshi 51
While community networks may provide important group benefits to their members, these benefits may come with some undesirable welfare consequences. Individuals belonging to other communities may be shut out of new employment opportunities. Individual mobility could, moreover, be severely restricted in existing networks. The third step in laying the groundwork for the new theory is to provide empirical support for this aspect of network-based development, namely that independent individual mobility will be constrained, both in communities where networks have formed as well as in other communities. I do this drawing on recent research from India (Munshi and Rosenzweig 2006, 2014). This paper concludes by discussing how the standard growth model could be augmented to incorporate community networks, and what consequences these additions might have for our understanding of the development process.
Community Networks in Developing Economies
Social networks are a ubiquitous feature of developing economies. A first very visible role for networks is to support business activity, with a small number of communities typically dominating trade and manufacturing. For example, expatriate Indian communities dominated East African business during and after colonial rule until their members were forced to leave in the 1970s. Ethnic Chinese have controlled business in South East Asia for centuries. A similar story is true in India, the setting for a number of studies discussed in this paper, where a small number of Hindu castes and non-Hindu communities have historically dominated and continue to dominate business activity (Gadgil 1959; Nafziger 1978).
This concentration of business activity in the hands of a few communities does not, however, imply that opportunities are never available to outsiders. Indeed, all the communities listed above took advantage of fortuitous historical events to make their start in business. Indians took advantage of British colonial rule to enter busi-ness in East Africa, while communities such as the Bohris and the Parsis did the same in India. More recently, Damodaran (2008) describes how a number of agricultural castes have taken advantage of the restructuring of the Indian economy over the past three decades to move into business. This group mobility will be central to the discussion of network-based development that follows. For the moment, it suffices to note that business activity continues to be heavily networked in developing coun-tries; supporting evidence can be provided by studies from Vietnam (McMillan and Woodruff 1999), India (Munshi 2011), and various countries in sub-Saharan Africa (Fafchamps 1997, 1999, 2003; Fisman 2003).
A second role for social networks in developing economies is to find and secure jobs for their members. To take one example, numerous accounts by contempo-rary observers and an extensive social history literature indicate that friends and kin from the origin community in Europe helped secure jobs for migrants to the American Midwest in the 19th century and the first quarter of the 20th century
52 Journal of Economic Perspectives
when this region was developing (Conzen 1976; Hoerder 1991). As discussed in greater detail below, African-American networks were also forming in northern US cities at this time. Halfway around the world, caste-based labor market networks were forming in the Indian cities that grew under British colonial rule. The pres-ence of these networks has been documented in Mumbai’s textile mills (Gokhale 1957), docks (Cholia 1941), railway workshops (Burnett-Hurst 1925), and transpor-tation facilities (Chandravarkar 1994).
Although these networks may no longer be as active, they have evolved or have been replaced by new networks. Labor market networks continue to be active in cities throughout the world, most often among migrant populations. Depending on the context, these networks can be organized around the family, the kin group (caste or clan), the origin village, or the destination neighborhood. Once the networks have established a niche in the destination economy, they will consoli-date their position over time, making it difficult for newcomers to enter. However, new groups are nevertheless continually entering the labor market in these econo-mies. This process of group mobility is described in greater detail below. For the moment, it suffices to note that labor markets in developing countries continue to be heavily networked, as documented, for example, in studies from China (Bian 1994; Zhang and Li 2003; Giles, Park, and Cai 2006; Wang 2013), South Africa (Magruder 2010), and India (Munshi and Rosenzweig 2006).
A third role for social networks in developing economies is to provide social insurance for their members. Traditional agrarian economies are characterized by wide fluctuations in income. Under these conditions, risk-averse individuals benefit substantially from institutions that smooth their consumption. Without access to market credit or government safety nets, mutual insurance arrangements naturally emerge within well-established communities. The commitment problem that arises in such arrangements is that individuals with a positive income shock in a given period, who must make a transfer to individuals who received a negative shock, will be tempted to renege on their obligation. The threat of exclusion from the insurance arrangement in the future will sometimes be sufficient to deter such devi-ations from cooperative behavior. However, additional pressure may be required, which typically takes the form of social sanctions. Well-established communities are well positioned to implement such social sanctions. Not surprisingly, insurance networks are organized around close-knit social groups throughout the world; as for example, in India (Townsend 1994; Ligon 1998; Mazzocco and Saini 2012; Munshi and Rosenzweig 2014); the Philippines (Fafchamps and Lund 2003); Mexico (Angelucci, Di Giorgi, and Rasul 2014); and Cote d’Ivoire (Grimard 1997).
The central thesis of the new literature on informal institutions is that these institutions provide a range of benefits and services to their members when markets function imperfectly. To document the benefits that social networks provide their members, it is first necessary to define the relevant community—that is, the popu-lation from which the network is drawn. In China, urban networks appear to be restricted to relatives and friends (Bian 1994; Zhang and Li 2003; Wang 2013).
Community Networks and the Process of Development 53
In sub-Saharan Africa and India, more elaborate networks are organized at the level of the clan and the caste, respectively (Luke and Munshi 2006; Munshi and Rosenzweig 2006; 2014). In Mexico and the United States, the village or neighbor-hood appears to be the social unit around which networks are organized (Massey, Alarcón, Durand, and González 1987; Munshi 2003; Sampson, Raudenbush, and Earls 1997). Although individuals select into networks, the domain of the commu-nity is treated as predetermined in most analyses of networks. Examples from India feature prominently in the discussion that follows, so it will be useful at this point to introduce the reader to the Indian caste system and the caste-community around which networks are organized in that country.
The caste system is a distinctive feature of Hindu society. A central tenet of this system is that individuals must marry within their own (sub)caste or jati. Non-Hindu communities follow the same rules of endogamous marriage as Hindus, as do converts to Christianity who continue to marry within their original jatis. Sample surveys from rural and urban India indicate that close to 95 percent of Indian marriages continue to follow these traditional rules (Munshi and Rosenzweig 2006, 2014; Munshi 2011; Luke and Munshi 2011). The longevity of the caste system has been the subject of intense debate, with some social scientists arguing that this system was put in place as recently as the colonial period as a way of dividing the native population (de Zwart 2000). Recent genetic evidence, however, indicates that the rules of endogamous marriage were put in place from 1,900–4,200 years ago, and that the Indian population today consists of 4,635 distinct genetic groups (Moorjani et al. 2013). A dense web of marriage ties, formed over many generations, links members of each caste (directly or indirectly) to each other. The spatial segre-gation by caste that continues to characterize the Indian village further strengthens local caste connections. Not surprisingly, networks serving different functions have historically been organized, and continue to be organized, around the caste in India. What distinguishes caste networks from networks in other countries is their scope (extending over multiple villages) and their size (consisting of thousands of individuals). I will return to this point towards the end of the paper when linking social structure to the dynamics of development. For the moment, we will focus on the static benefits that (caste) networks provide their members.
The first role played by India’s caste networks, going back many centuries, would have been to provide mutual insurance for their members. In Munshi and Rosenzweig (2014), we use data from the Rural Economic Development Survey (REDS), conducted at multiple points in time over the past four decades, to show that transfers from caste members are important and preferred mechanisms through which consumption is smoothed in rural India. Participation in caste-based insurance is relatively high, with 25 percent of the households in the 1982 survey and 20 percent in 1999 reporting that they gave or received caste transfers (gifts or loans) in the year prior to the survey. The amount received is 20–40 percent of the receiving household’s annual income. This is a substantial amount and so multiple households will support a receiving household when it is in need of
54 Journal of Economic Perspectives
support. Consistent with this view, sending households contribute 5–8 percent of their annual income on average. An important role for the caste networks is to help households meet major contingencies like illness or marriage, which are relatively infrequent. The fraction of participating households would thus expand signifi-cantly if the time-window was increased to five or ten years.
Transfers within the caste include gifts and loans. Despite the fact that loans account for just 23 percent of all transfers by value, we see in Table 1 that caste loans make up 14 percent of the total credit received by households in the year prior to the 1982 survey. Caste loans are the dominant source of informal (nonbank) credit, exceeding the amount received from moneylenders, friends, and employers. They are the dominant source of finance across all sources, including the bank, for meeting contingencies. Data from the 2005 Indian Human Develop-ment Survey (IHDS), reported in Munshi and Rosenzweig (2014), indicate that these credit patterns have remained relatively stable over time. One reason why caste loans have maintained their importance is that they are obtained on easier terms than other sources of credit. In Munshi and Rosenzweig, we report that over 20 percent of caste loans by value require no interest payment and no collateral (as is true for all gifts, which account for the bulk of within-caste transfers).
While caste-based rural insurance networks might have been in place for centu-ries, urbanization in India is a relatively recent phenomenon. When India’s cities started to grow under colonial rule in the 18th and 19th centuries, the new networks that formed were also organized around the caste, supporting the movement of rural–urban migrants and finding them jobs once they arrived (Morris 1965; Chandavarkar 1994; Rudner 1994). This widespread use of caste-based networks led to the fragmentation of urban labor markets along caste lines. Although most
Table 1 Percent of Loans by Source and Purpose in India
Purpose: InvestmentOperating expenses Contingencies
Consumption expenses All
Source:Bank 64.11 80.80 27.58 25.12 64.61Caste 16.97 6.07 42.65 23.12 13.87Friends 2.11 11.29 2.31 4.33 7.84Employer 5.08 0.49 21.15 15.22 5.62Moneylender 11.64 1.27 5.05 31.85 7.85Other 0.02 0.07 1.27 0.37 0.22Total 100.00 100.00 100.00 100.00 100.00
Source: Munshi and Rosenzweig (2014). Data are from the 1982 Rural Economic Development Survey (REDS).Notes: Statistics are weighted by the value of the loan and sample weights. Investment includes land, house, business, etc. Operating expenses are for agricultural production. Contingencies include marriage, illness, and others.
Kaivan Munshi 55
historical accounts of caste-based networking in Indian cities are situated prior to independence in 1947, a few studies conducted over the subsequent decades in India indicate that these patterns persisted over many generations. For example, Patel (1963) surveyed 500 mill workers in Mumbai in 1961–62 and found that 81 percent had relatives or members of their caste in the textile industry. Half of the workers got jobs in the mills through the influence of their relatives and 16 percent through their friends, many of whom would have belonged to the same caste. Forty years later, my colleague and I (Munshi and Rosenzweig 2006) surveyed the parents of school children residing in the same area of the city, and 68 percent of the fathers employed in working class occupations reported that they received help from a rela-tive or member of their caste in finding their first job, while 44 percent of fathers in white-collar occupations reported such help.
Labor market networks are active throughout the world, and similar referral patterns have been documented in other economies. For example, Rees (1966) reports that informal sources accounted for 80 percent of all hires in blue-collar occupations and 50 percent of all hires in white-collar occupations in an early study set in Chicago. We would expect social ties to play an even stronger role for migrants in the United States. Indeed, over 70 percent of the undocumented Mexican immigrants, and a slightly higher proportion of the Central Americans, that Chavez (1992) interviewed in 1986 found work through referrals from friends and relatives. Similar patterns have been found in contemporary studies of Salvadoran immigrants (Menjivar 2000), Guatemalan immigrants (Hagan 1994), and Chinese immigrants (Nee and Nee 1973; Zhou 1992). Individual respondents in the Mexican Migration Project, discussed in greater detail below, were asked how they obtained employment on their last visit to the United States; relatives (35 percent) and friends or paisanos from the origin village in Mexico (35 percent) account for the bulk of job referrals (Massey et al. 1987).
Estimating Network Effects
There will be many contexts in which individual outcomes and community clustering can be observed but direct information on community support is unavail-able. Consider the clustering by a small number of communities in business that is observed throughout the developing world. One interpretation of these commu-nity clusters is that they are active networks, with firms belonging to these networks supporting each other from one generation to the next. A second interpretation is that community networks only support first-generation businessmen; once a community has established itself in business, then from the next generation onward individuals inherit the business and can operate independently of the network. We would observe a positive correlation between a firm’s performance and the number of firms from its community (a standard measure of network size) in either case, but this correlation would be spurious if the second interpretation was valid. The
56 Journal of Economic Perspectives
size of the community cluster would simply proxy for the number of generations that its member-firms had been in business in that case. To identify the effect of the network on individual or firm performance, more sophisticated research designs are required.
Panel data can be used to control for fixed firm or individual characteristics, in which case we would be effectively studying the effect of changes in the size of the community network on change in firm performance. However, this approach would create a new problem, with changes in network size proxying for changes in the environment that directly determine performance. Continuing with the business example, firms would exit the business when times are bad. It could thus appear as if a decline in network size results in a decline in the performance of the firms that remain, when in fact the correlation is spurious once again. The same identi-fication problem would arise if we estimated the relationship between network size and labor market outcomes with panel data. In addition to firm or individual fixed effects, a statistical instrument is needed that predicts changes in network size but does not directly determine outcomes.
In Munshi (2003), I show how this can be done in the context of immigrant Mexican labor networks in the United States. Migration from Mexico tends to be recurrent, with individuals working in the United States for spells of three to four years and then returning. Panel data from the Mexican Migration Project (MMP) can be used to study the labor market outcomes in the United States of a sample of indi-viduals drawn from different Mexican origin communities (villages) over multiple migration spells. The idea is to assess whether the same individual does better in spells where he has access to a larger network in the United States.
The Mexican Migration Project collected information from a large number of Mexican origin communities. Each community was surveyed once only, and retrospective information over many years was collected from approximately 200 individuals. This information included the location of the individual in each year (US or Mexico) and his labor market outcome (employment, job-type). I measure the size of the community network in the United States in a given year by the frac-tion of sampled individuals in the community who were located in the United States in that year. To test for network effects, the sample is restricted to person-years in the United States. In the most basic specification, we would regress each individual’s labor market outcome on the contemporaneous size of his US community network, including fixed effects in the regression.
Once fixed effects are included, we are effectively assessing the effect of changes in network size on changes in labor market outcome. Is the individual more likely to be employed (and holding a better job) in years in which his network in the United States is relatively large? However, we know from the discussion above that even if a positive correlation is obtained, this correlation could be entirely spurious if indi-vidual labor market outcomes and the size of the community network are jointly determined by (unobserved) economic conditions in the United States. To estimate the causal effect of networks on individual outcomes, we need to find a statistical
Community Networks and the Process of Development 57
instrument for network size. A valid instrument will generate changes in network size but will be uncorrelated with direct determinants of individual labor market outcomes in the United States. My innovation is to use rainfall in Mexican origin communities, or more correctly rainfall shocks once fixed effects are included, as instruments for network size in the United States.
In practice, network effects will depend on their size and their vintage, since migrants who have been in the United States longer are more established and better positioned to provide referrals. Instead of simply including the size of the network as the key regressor, a more sophisticated specification would thus include the fraction of sampled individuals who recently arrived in the United States and the corre-sponding fraction for established migrants, separately as regressors. Recent migrants would have moved to the United States partly in response to recent-past rainfall shocks, while established migrants would have moved in response to distant-past rainfall shocks. Because rainfall shocks in Mexico are the exogenous source of varia-tion in the size of the network in the United States, it will be convenient to describe the main results in terms of these shocks. It will then be straightforward to reinter-pret the results in terms of network size.
Figure 1 reports the estimated rainfall coefficients (with single standard error bands) for two regressions. The first regression restricts the sample to person-years in the United States. The dependent variable is employment in the United States and the regressors are current and lagged rainfall, going back six years, in Mexico. The second, supporting, regression, restricts the sample to person-years in Mexico. The regressors remain the same, but the dependent variable is now employment in Mexico. Both regressions include individual fixed effects. With employment in the United States as the dependent variable, the coefficients on lagged rainfall in Mexico are negative and significant; notice that they get larger in magnitude and more significant as we go further back in time. In contrast, with employment in Mexico as the dependent variable, the coefficients on current and recent rainfall are positive and significant, weakening as we go further back.
These results can be interpreted as follows. When rainfall in the Mexican origin community is relatively low, the demand for labor declines, hence the positive coef-ficient on current and lagged rainfall with employment in Mexico as the dependent variable. The negative demand shock of low rainfall (remember we have individual fixed effects, so everything is in terms of deviations from the mean) encourages individuals to move from Mexico to the United States. Results reported in Munshi (2003) indicate, as expected, that a negative rainfall shock in Mexico results in an immediate increase in the size of the network (number of migrants) in the United States. Over time, these migrants get established and build a reputation with their employers. This allows them to provide information and job referrals to members of their network, explaining why low rainfall in Mexico results in positive labor market outcomes in the United States with a long lag. If we replaced recent-past and distant-past rainfall with the number of recent and established migrants as regres-sors, and then instrumented appropriately, we could estimate the magnitude of the
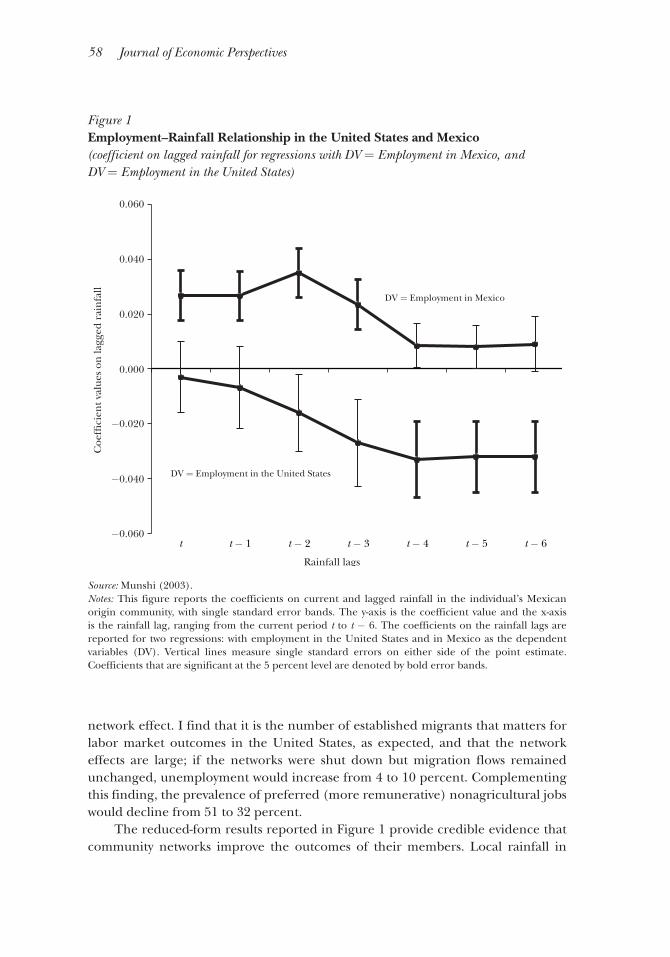
58 Journal of Economic Perspectives
network effect. I find that it is the number of established migrants that matters for labor market outcomes in the United States, as expected, and that the network effects are large; if the networks were shut down but migration flows remained unchanged, unemployment would increase from 4 to 10 percent. Complementing this finding, the prevalence of preferred (more remunerative) nonagricultural jobs would decline from 51 to 32 percent.
The reduced-form results reported in Figure 1 provide credible evidence that community networks improve the outcomes of their members. Local rainfall in
Figure 1 Employment–Rainfall Relationship in the United States and Mexico (coefficient on lagged rainfall for regressions with DV = Employment in Mexico, and DV = Employment in the United States)
Source: Munshi (2003).Notes: This figure reports the coefficients on current and lagged rainfall in the individual’s Mexican origin community, with single standard error bands. The y-axis is the coefficient value and the x-axis is the rainfall lag, ranging from the current period t to t − 6. The coefficients on the rainfall lags are reported for two regressions: with employment in the United States and in Mexico as the dependent variables (DV). Vertical lines measure single standard errors on either side of the point estimate. Coefficients that are significant at the 5 percent level are denoted by bold error bands.
−0.060
−0.040
−0.020
0.000
0.020
0.040
0.060
t t − 1 t − 2 t − 3 t − 4 t − 5 t − 6
Coe
f�ci
ent v
alue
s on
lagg
ed r
ain
fall
Rainfall lags
DV = Employment in Mexico
DV = Employment in the United States
Kaivan Munshi 59
Mexican communities far from the border has no impact on the US labor market. However, it has a strong effect on the number of migrants, and these migrants, in turn, improve outcomes for their network-members years later when they are established. One alternative interpretation of Figure 1 is that it reflects an indi-vidual experience effect; the individuals who moved in response to the negative rainfall shock years ago are now doing better themselves. However, when in Munshi (2003), I restrict the sample to individuals who arrived recently in the United States, I find that the estimated network effects are even larger. This is exactly what the theory would predict, since newcomers to the foreign labor market benefit the most from referrals.
The preceding example provides a framework for identifying network effects. Panel data (and fixed effects) allow the econometrician to control for selection into the network. Rainfall shocks in the origin location generate exogenous variation in the size and the vintage of the network in the destination labor market. Finally, the theory is used to place additional restrictions on the data; as predicted, recent arrivals benefit more from the network, while established migrants contribute disproportionately to the network. The setting of Munshi (2003) is exception-ally well-suited to testing for network effects because both panel data and a clean source of variation in network size (by vintage) is available. It is, however, possible to identify network effects even when this is not the case, as long as there is exog-enous variation across networks or communities, by deriving and testing additional predictions from the theory. This approach has also been followed by an emerging literature on community networks in economics (for example, Luke and Munshi 2006; Magruder 2010; Beaman 2012; Wang 2013).
While community networks may provide useful benefits to their members, a recurring message of this paper is that they can give rise to inefficiencies of their own. One such inefficiency is paradoxically a consequence of the very mechanism that gives community networks their strength; while strong social ties may solve commitment problems within communities, capable individuals outside these communities can be left out. In Banerjee and Munshi (2004), we show that this can result in a substantial misallocation of resources.
The Banerjee and Munshi (2004) analysis is situated in the South Indian town of Tirupur, a production cluster that supplies 70 percent of India’s knitted garment exports. The textile industry in Tirupur was initially controlled by a local trading community. However, after a prolonged period of labor unrest in the 1960s, it was taken over by the Gounders, a community whose previous economic activity had been confined to agriculture (Swaminathan and Jeyaranjan 1994). For the next 20 years, the industry continued to be dominated by the Gounders and catered almost exclusively to the domestic market. Starting from the mid-1980s, however, the export of knitted garments from Tirupur started to grow extremely rapidly and by the early 1990s the growth rate exceeded 50 percent. This growth gener-ated an influx of entrepreneurs from outside Tirupur. In 1996, when Banerjee and I conducted a survey of firms in the industry, collecting retrospective panel
60 Journal of Economic Perspectives
data on investment and production for each firm, about half the entrepreneurs were Gounders while the rest belonged to traditional business communities drawn from all over the country. Banerjee and I exploit this heterogeneity in the socio-logical composition of Tirupur’s production cluster to identify a mismatch between (network-based) credit and entrepreneurial ability in this industry.
Two facts uncovered by our survey motivate the theory and the empirical strategy used to identify misallocation. First, as shown in Figure 2A, the Gounders hold more capital stock than the Outsiders at all levels of experience. Adjusting for differences in production, the Gounders use roughly twice as much capital per unit of production than the Outsiders, as reported in Banerjee and Munshi (2004). Second, as shown in Figure 2B, production grows faster for the Outsiders than for the Gounders at all levels of experience. Let the growth in production be deter-mined by entrepreneurial ability and capital, with the standard assumption that these inputs are complements. If production grows faster for the Outsiders despite having lower capital stock, they must have higher ability. If ability and capital are complements, and the Outsiders have higher ability, then the Gounders will only invest more if the cost of capital is lower for them. The inefficiency that we identify is that relatively cheap Gounder capital failed to reach more capable individuals outside the community.
One alternative explanation for these empirical findings, which does not imply that resources are allocated inefficiently or that interest rates vary across communi-ties, is that ability and capital are substitutes in this industry. The Outsiders, who are endowed with higher ability on average for historical reasons or due to selec-tion pressures, would then invest less, but could still end up growing faster than the Gounders. To examine this possibility, in Banerjee and Munshi (2004), we look within each community. Among the Gounders and, separately, among the Outsiders, firms who invest more grow faster consistent with the assumption that ability and capital are complements. It is only across communities that less-capitalized firms grow faster. Variation in investment and production across communities, together with restrictions from the theory, allow us to infer that community networks are active (without actually observing these networks) and that they result in a misal-location of resources.
Community Networks and Group Mobility
My analysis of Mexican migrant networks describes the inner workings of a remarkable institution. Passel, Cohn, and Gonzales-Barrera (2012) estimate 12 million Mexican-born people living in the United States in 2011, about half of whom are unauthorized. As noted, migration from Mexico tends to be recur-rent—the typical migration spell in the MMP data is four years. This implies that many millions of Mexicans must form the pool that supplies short-term labor to the United States. Established members of the network provide referrals and support
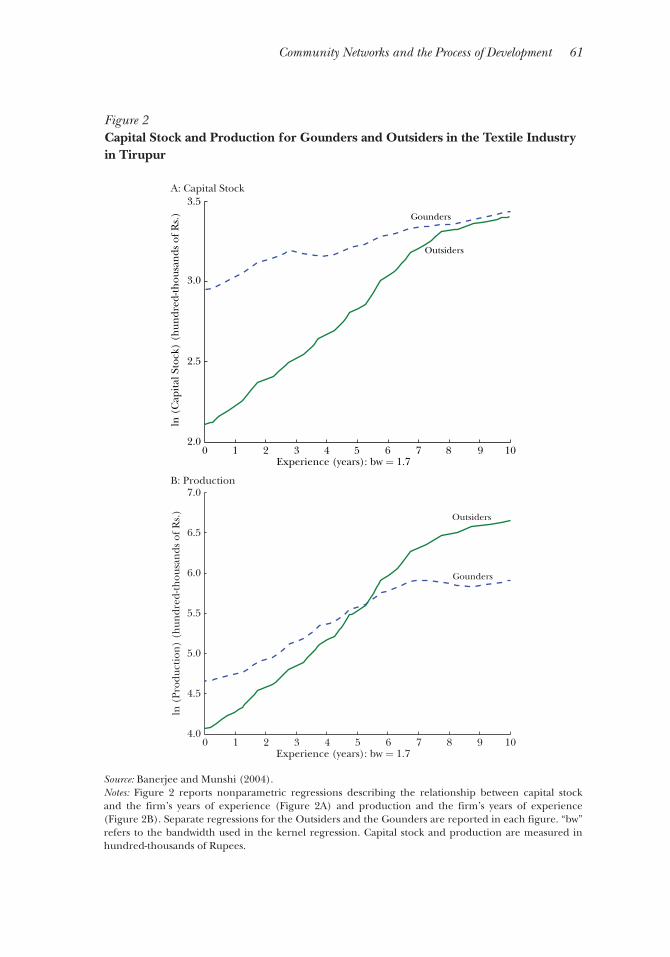
Community Networks and the Process of Development 61
Figure 2 Capital Stock and Production for Gounders and Outsiders in the Textile Industry in Tirupur
Source: Banerjee and Munshi (2004).Notes: Figure 2 reports nonparametric regressions describing the relationship between capital stock and the firm’s years of experience (Figure 2A) and production and the firm’s years of experience (Figure 2B). Separate regressions for the Outsiders and the Gounders are reported in each figure. “bw” refers to the bandwidth used in the kernel regression. Capital stock and production are measured in hundred-thousands of Rupees.
7.0
6.0
5.0
4.0
ln (
Prod
ucti
on)
(hun
dred
-thou
san
ds o
f Rs.
)
0 2 4 6 8 10Experience (years): bw = 1.7
Gounders
Outsiders
6.5
5.5
4.5
97531
A: Capital Stock
B: Production
3.5
3.0
2.5
2.0
ln (
Cap
ital
Sto
ck)
(hun
dred
-thou
san
ds o
f Rs.
)
0 2 4 6 8 10Experience (years): bw = 1.7
Gounders
Outsiders
1 3 5 7 9
62 Journal of Economic Perspectives
new arrivals from this pool, with each migrant typically matched with a completely different group from his community from one trip to the next. Strong pre-existing community ties are needed for the network to function so well without long-term interactions between individuals at the destination.
While these ties may give individuals access to the US labor market, with its higher wages, it is worth noting that members of these communities have remained in low-skill occupations (with low levels of human capital) for generations. From a growth perspective, what is needed is movement into more skilled occupations and greater investments in human capital, and while this may not have been achieved in the Mexican case, community networks have achieved this objective in other contexts. I have already discussed how caste-based networks supported the move-ment of their members from agriculture into skilled industrial occupations during British colonial rule in India. Similar patterns of occupational mobility have been documented for Europeans who arrived in the United States in the 19th and early 20th centuries. While German bakers and British miners may have carried their traditional occupations with them, most arriving migrants found niches in new occupations (Gordon, Edwards, and Reich 1982). These patterns of occupational mobility continue to this day as evidenced by the rapidly growing literature on community-based migration to the United States (for example, Kotkin 1992; Fairlie and Meyer 1996; McKenzie and Rapoport 2007, 2010; Patel and Vella 2013).
The main challenge when a person attempts to enter a new occupation is that the individual is an outsider without connections to employers, workers, buyers, or suppliers. Community networks substitute for these individual connections, allowing their members to help each other and bootstrap their way out of traditional occupa-tions into more remunerative occupations. It is tempting to infer from the variation in levels of migration across origin communities and the occupational clustering that is typically observed at the destination that migrants move as a group, typically into new occupations. However, additional evidence is needed to support this claim. For example, levels of migration were much higher from Southern counties in the United States where labor-intensive plantation crops were grown during the Great Migration (the mass movement of African-Americans to the North early in the twen-tieth century). One explanation for the higher level of migration, discussed below, is that black networks formed in Southern plantation counties, supporting the move-ment of groups of individuals to Northern destinations. An alternative explanation is that economic and social conditions were disadvantageous to blacks in the planta-tion counties, leading to the independent departure by many individuals. To identify group mobility supported by underlying networks, I will once again exploit exog-enous variation in community characteristics, together with predictions from the theory. The following examples show how this can be done in very different contexts.
My first example describes how a historically disadvantaged caste moved from agriculture into the international diamond business with the support of an under-lying community network over the course of a single generation. India does not produce rough diamonds. The rough diamonds are imported, for the most part
Kaivan Munshi 63
from Antwerp, then cut and polished in domestic factories, before being sold on the Mumbai market to foreign buyers or shipped directly abroad. Most Indian diamond exporters buy their rough diamonds in Antwerp. A packet of rough diamonds costs thousands of dollars, so diamond exporters (without deep pockets) typically receive the packets on supplier credit. The commitment problem that arises here is that the exporter will not repay the supplier if there is little chance that the supplier will do business with the exporter in the future.
One solution to this commitment problem is to write formal contracts, but such contracts are difficult to verify in the diamond industry. An alternative solu-tion, which is only available to well-established wealthy firms, is to set up a branch in Antwerp and operate simultaneously as a rough diamond supplier in Antwerp and a polished diamond exporter from India. The permanent presence of these firms in Antwerp allows them to build up a reputation in the market and to buy rough diamonds on credit from other suppliers (for their diamond export business) when the need arises. Yet another solution, which is chosen by most Indian diamond exporters, is to visit Antwerp for a few days each month and to use their community network to access rough diamonds on credit from a variety of suppliers. Firms who follow this strategy establish long-term relations with a small number of suppliers. When they need to buy rough diamonds from other suppliers, members of the community who have close ties with those suppliers stand guarantor for them. The recipients of these referrals will repay the rough diamond suppliers, even if they do not expect to do business in the future, because they will face severe social sanctions and lose the support of the entire network if they renege on these obligations.
The preceding discussion indicates that a first-generation diamond exporter could operate profitably in the industry with his community network substituting for the parental support (connections and resources) that entrepreneurs from estab-lished business families receive. In Munshi (2011), I examine the dynamics of such a network. As it grows stronger, it will attract more first-generation businessmen into the industry. If there is positive selection on ability into this industry, the marginal ability of entrants into the network, measured by their educational attainment, will decline over time. The novel insight from this dynamic theory of group mobility is that once they form, new networks will strengthen most rapidly in communities with the worst outside options (least-remunerative traditional occupations). It follows that intergenerational occupational mobility will be correspondingly greater in those communities. The theory can be summarized as follows:
weak outside options → larger changes in network size → greater intergenerational mobility.
In Munshi (2011), I take advantage of an exogenous shock to the world diamond industry—the discovery of massive diamond deposits in Australia’s Argyle mines in 1979—to test this theory. Two traditional business communities, the Palanpuris and the Marwaris, initially controlled the business end of the diamond industry,
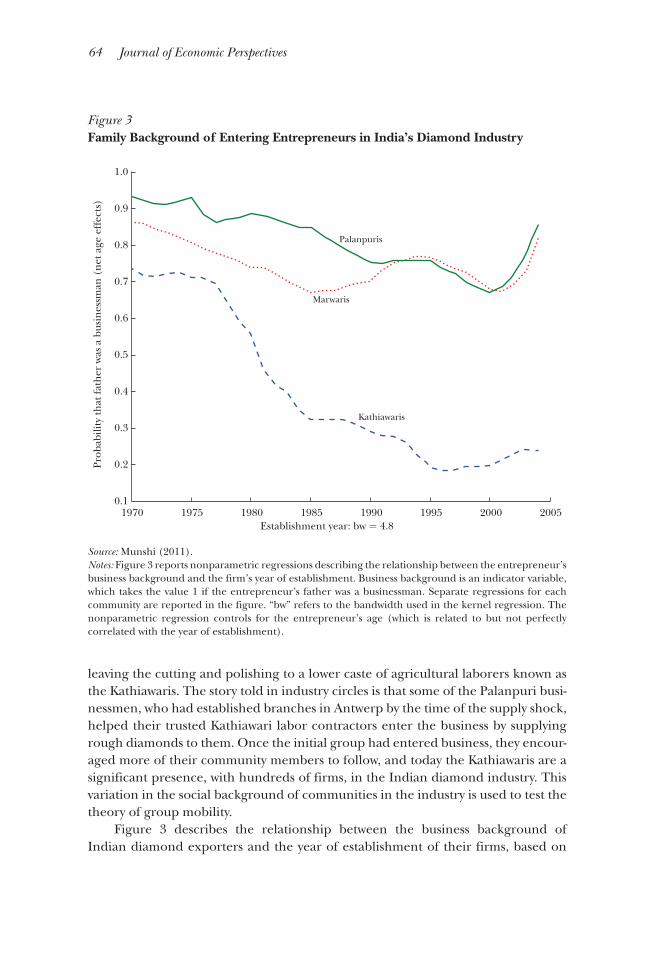
64 Journal of Economic Perspectives
leaving the cutting and polishing to a lower caste of agricultural laborers known as the Kathiawaris. The story told in industry circles is that some of the Palanpuri busi-nessmen, who had established branches in Antwerp by the time of the supply shock, helped their trusted Kathiawari labor contractors enter the business by supplying rough diamonds to them. Once the initial group had entered business, they encour-aged more of their community members to follow, and today the Kathiawaris are a significant presence, with hundreds of firms, in the Indian diamond industry. This variation in the social background of communities in the industry is used to test the theory of group mobility.
Figure 3 describes the relationship between the business background of Indian diamond exporters and the year of establishment of their firms, based on
Figure 3 Family Background of Entering Entrepreneurs in India’s Diamond Industry
Source: Munshi (2011).Notes: Figure 3 reports nonparametric regressions describing the relationship between the entrepreneur’s business background and the firm’s year of establishment. Business background is an indicator variable, which takes the value 1 if the entrepreneur’s father was a businessman. Separate regressions for each community are reported in the figure. “bw” refers to the bandwidth used in the kernel regression. The nonparametric regression controls for the entrepreneur’s age (which is related to but not perfectly correlated with the year of establishment).
1970 1975 1980 1985 1990 1995 2000 2005Establishment year: bw = 4.8
Kathiawaris
Palanpuris
Marwaris
1.0
0.9
0.8
0.7
0.6
0.5
0.4
0.3
0.2
0.1
Prob
abili
ty th
at fa
ther
was
a b
usin
essm
an (
net
age
eff
ects
)
Community Networks and the Process of Development 65
nonparametric regressions using data obtained from a survey of nearly 800 firms conducted in 2004–2005. While there is a mild decline in the fraction of Marwaris and Palanpuris who report that their father was a businessman over time, this decline is particularly steep for the Kathiawaris from the late 1970s onwards. Although 70 percent of the Kathiawaris who entered the industry in 1970, before the supply shock, report that their father was a businessman, this statistic declines steadily and drops below 20 percent by 2000. In Munshi (2011), I show that most of the occupational mobility documented for entering Kathiawari entrepreneurs in Figure 3 was driven by the dramatic shift out of agriculture in this community over a single generation.
The theory of group mobility generates specific predictions for the selection of new entrants into business, across communities, as underlying networks strengthen. Figure 3 provides empirical support for these predictions; there is greater occupa-tional mobility in the historically disadvantaged Kathiawari community, reflected by the increasing share of first-generation businessmen, over time. However, an alterna-tive explanation for these patterns, which does not require networks to be active, is that outside options (returns in the traditional occupation) were declining rela-tively steeply over time for the Kathiawaris. This would have encouraged individual Kathiawaris to move independently, with an accompanying increase in the proportion of first-generation businessmen. But without the support of a community network, these new entrants would have fared increasingly poorly in the diamond business.
In Munshi (2011), I provide two pieces of evidence supporting the hypothesis that an underlying network supported the movement of the Kathiawaris as a group into the diamond business. First, I use administrative data on diamond exports, avail-able annually for 95 percent of the surveyed firms over the 1995–2004 period (or as long as they had been exporting) to show that Kathiawari firms grow at least as fast as firms from other communities on average. This result is inconsistent with the alternative (non-network) explanation provided above, and is obtained despite the fact that entering Kathiawari entrepreneurs are increasingly disadvantaged over time (more likely to be first-generation businessmen and less educated). Indeed, once we control for compositional change in the industry with firm fixed effects, exports grow significantly faster for the Kathiawaris than for the other communities. There is a community-level force that is improving the performance of Kathiawari firms relatively rapidly over time, and our interpretation of this force is that it reflects the support that is being provided by a rapidly strengthening community network.
Providing direct support for this hypothesis, a second piece of evidence in Munshi (2011) is that the frequency of intraindustry (and intra-caste) marriages, which reduce commitment problems within the network, increases relatively steeply for the Kathiawaris. Almost none of the early Kathiawari entrants who established their firms before 1975 married within the industry. By 2004, however, 50 percent of the entrants were marrying within the industry, surpassing the corresponding marriage rates for the Palanpuris and Marwaris, which remained roughly constant over time. These intercommunity differences are robust to including the number of firms, by
66 Journal of Economic Perspectives
community, in the industry to account for the size of the marriage pool at each point in time, and are also obtained for the entrepreneurs’ children. Complementing the marriage results, Kathiawaris are more likely to organize their production in ways that leave them more dependent on the network; that is, they are less likely to have a branch in Antwerp, and these differences in organizational structure widen over time.
The preceding example exploited variation in outside options (returns to traditional occupations) across communities, together with predictions from the theory, to show that individuals moved as a group into business. The next example takes the same approach, except that communities now vary with respect to their social connectedness, and are based on geography rather than kinship. The setting for this example is the American South in the decades of the late 19th century after Emancipation. In Chay and Munshi (2014), the objective is to assess whether and where African Americans were able to overcome centuries of social dislocation and form new networks once they were free.
The point of departure for the analysis in Chay and Munshi’s (2014) is the observation that black spatial proximity varied substantially across Southern coun-ties, during and after slavery, depending on the crops that were grown in the local area. Where labor-intensive plantation crops such as tobacco, cotton, rice, and sugarcane were grown, blacks worked (and lived) in close proximity to each other. Where crops such as wheat and corn were grown, blacks were dispersed more widely. Restricted social interaction across plantations and forced separation would have prevented black networks from forming during slavery. Black networks could have formed without restriction after Emancipation, but their size would have been determined by spatial proximity—that is, the connectedness of the population in the local area. Greater connectedness would have supported higher levels of cooperation, resulting in larger networks. These larger networks would, in turn, have allowed blacks to work more effectively as a group to achieve common objectives in the decades after Emancipation.
Southern blacks had two significant opportunities to work together at this time. First, blacks were able to vote and to elect their own leaders during and just after Reconstruction, 1870–1890. Second, blacks were able to leave the South and find jobs in Northern cities during the Great Migration, whose initial phase ran from 1916 to 1930. Based on the theory, more-connected populations would have supported the formation of larger networks of black activists during Reconstruction and larger networks of black workers moving together to Northern cities during the Great Migration. This, in turn, would have given rise to greater overall political participation and migration. The theory can this be summarized as follows:
population connectedness → network size → political participation and migration.
While a positive relationship between population connectedness and partic-ular outcomes during Reconstruction and the Great Migration is consistent with
Kaivan Munshi 67
the presence of underlying (unobserved) black networks, other explanations are available. For example, racial conflict could have been greater in counties where labor-intensive plantation crops were grown, encouraging individual black voters to turn out during Reconstruction and to move independently to Northern cities during the Great Migration. Alternatively, adverse economic conditions in these counties could have encouraged greater migration, without requiring a role for black cooperation. In Chay and Munshi (2014), our strategy to identify the pres-ence of underlying networks takes advantage of an additional prediction of our theory, which is that networks will only form above a threshold level of popula-tion connectedness. There should thus be no association between the outcomes of interest—political participation and migration—and population connectedness up to a threshold and a positive association thereafter.
Figure 4 reports the relationship between population connectedness and (separately) black political participation and migration. Population connected-ness is measured by the fraction of cultivated land in the county that was allocated to labor-intensive plantation crops in 1890, midway between Reconstruction and the Great Migration, adjusting for differences in labor intensity across those crops. Black political participation is measured by the number of Republican votes in the 1872 presidential election, since blacks would have voted almost exclusively for the Republican Party (the party of the Union) at that time (Morrison 1987). The black migration measure is derived from intercensus changes in the black population between 1910 and 1930 (recall that the Great Migration commenced around 1916), adjusting for natural changes due to births and deaths. It appears from Figure 4 that the specific nonlinearity implied by the theory, characterized by a slope discon-tinuity at a threshold, is obtained for both political participation and migration.
In Chay and Munshi (2014), we construct a statistical estimator that allows us to test whether the data-generating process underlying a particular outcome is consis-tent with the theory. Based on this test, we verify that both relationships reported in Figure 4 are consistent with the theory. In addition, we show formally that the specific nonlinearity implied by our theory of network formation is also obtained for the following outcomes: 1) the election of black leaders during Reconstruction, which complements the pattern of voting; 2) church congregation size in black denominations, which is the most direct available measure of network size; and 3) the clustering of black migrants in Northern destination cities. In contrast, this nonlinearity is not obtained for 1) Republican votes after Reconstruction when blacks were effectively disfranchised; 2) black migration prior to 1916; 3) white migration; or 4) church congregation size in nonblack denominations.
No single alternative can explain the specific nonlinear relationship between population connectedness and outcomes associated with underlying networks obtained for blacks alone at particular points in time. The nonlinear relationship that is obtained for black church congregation size and the clustering of black migrants in Northern destinations, in particular, provides direct support for the hypothesis that blacks were able to work together to achieve common objectives in
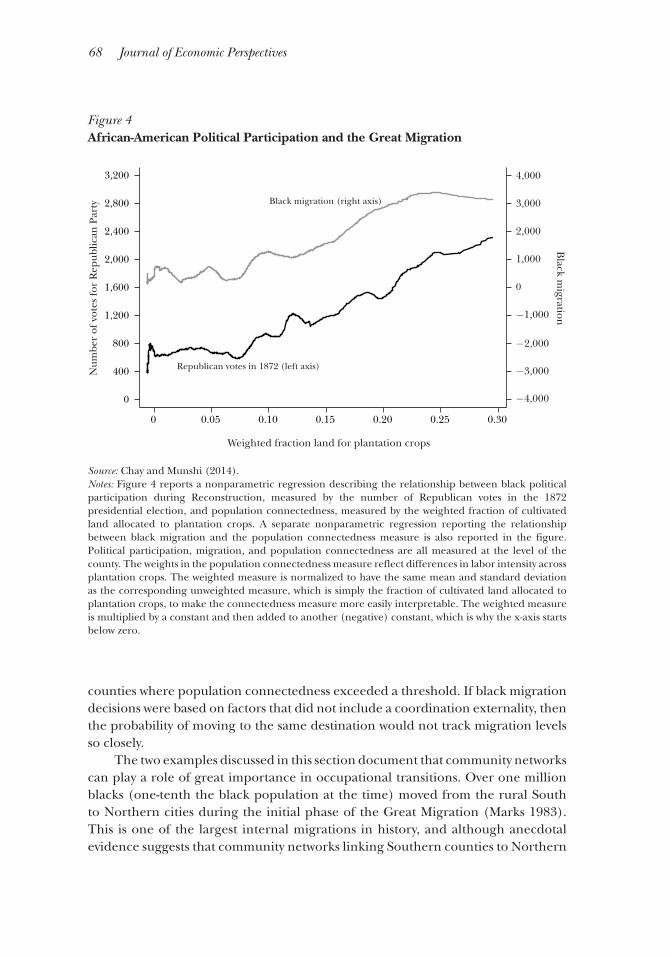
68 Journal of Economic Perspectives
counties where population connectedness exceeded a threshold. If black migration decisions were based on factors that did not include a coordination externality, then the probability of moving to the same destination would not track migration levels so closely.
The two examples discussed in this section document that community networks can play a role of great importance in occupational transitions. Over one million blacks (one-tenth the black population at the time) moved from the rural South to Northern cities during the initial phase of the Great Migration (Marks 1983). This is one of the largest internal migrations in history, and although anecdotal evidence suggests that community networks linking Southern counties to Northern
Figure 4 African-American Political Participation and the Great Migration
Source: Chay and Munshi (2014).Notes: Figure 4 reports a nonparametric regression describing the relationship between black political participation during Reconstruction, measured by the number of Republican votes in the 1872 presidential election, and population connectedness, measured by the weighted fraction of cultivated land allocated to plantation crops. A separate nonparametric regression reporting the relationship between black migration and the population connectedness measure is also reported in the figure. Political participation, migration, and population connectedness are all measured at the level of the county. The weights in the population connectedness measure reflect differences in labor intensity across plantation crops. The weighted measure is normalized to have the same mean and standard deviation as the corresponding unweighted measure, which is simply the fraction of cultivated land allocated to plantation crops, to make the connectedness measure more easily interpretable. The weighted measure is multiplied by a constant and then added to another (negative) constant, which is why the x-axis starts below zero.
0
400
800
1,200
1,600
2,000
2,400
2,800
3,200
0 0.05 0.10 0.15 0.20 0.25 0.30
Weighted fraction land for plantation crops
Num
ber
of v
otes
for
Rep
ublic
an P
arty
Republican votes in 1872 (left axis)
Black migration (right axis)
Black m
igration
4,000
3,000
2,000
1,000
0
−1,000
−2,000
−3,000
−4,000
Community Networks and the Process of Development 69
cities did emerge (Gottlieb 1991; Grossman 1989), the Chay and Munshi (2014) paper is the first to identify and quantify network effects in the Great Migration. Our estimates of these network effects are large; for example, over half of the migrants to the North came from the third of Southern blacks who lived in the most connected counties, while less than 15 percent came from the third in the least-connected counties.
The movement of Kathiawaris from agriculture into business, described earlier in this section, is also an occupational transition of considerable impor-tance. The diamond industry accounts for roughly 14 percent of India’s total merchandize exports and has competed with textiles, and more recently with computer software, as the country’s top export industry over the past three decades. It is estimated that approximately 1,000 Indian diamond export firms employ over a million workers. The diamond industry is associated with a high degree of community networking throughout the world because of the difficulty in enforcing legal contracts (Coleman 1988; Richman 2006). Apart from their static role in solving commitment problems, in Munshi (2011), I show that community networks have also supported an extremely high level of intergenerational occu-pational mobility in the Indian diamond industry. This role is not restricted to this industry. Damodaran (2008) documents the emergence of a new business class in postcolonial India, drawn from a select group of agricultural castes and from castes that historically dominated the bureaucracy and various white-collar professions. Community (caste) networks very likely played a major role in these occupational transitions as well.
Community Networks and Misallocation
We have seen how inefficiencies can arise when community networks are active because resources fail to cross community boundaries. While community networks will support the economic activity and the mobility of their members, outsiders will be shut out. The discussion that follows highlights a second inefficiency that arises within these networks. Community networks will support the mobility of groups of individuals, but they will restrict the mobility of individual members.
Consider a rural network providing mutual insurance to its members. House-holds with migrant members will have reduced access to these networks for two reasons. First, migrants cannot be as easily punished by the network, and their family back home now has superior outside options (in the event that the house-hold is excluded from the network). It follows that households with migrants cannot credibly commit to honoring their future obligations at the same level as households without migrants. Second, an information problem arises if the migrant’s income cannot be observed. If the household is treated as a collective unit by the network, it always has an incentive to misreport its urban income so that transfers flow in its direction. If the loss in network insurance from having a migrant in the family
70 Journal of Economic Perspectives
exceeds the income gain, then large wage gaps could persist without generating a flow of workers to higher-wage areas. This misallocation of labor is paradoxically amplified when the informal insurance networks work exceptionally well, because rural households then have more to lose by sending their members to the city.
One way to circumvent these restrictions on mobility would be for the members of the rural community to move to the city as a group. Members of the group could monitor each other and enforce collective punishments, solving the information and commitment problems described above. They would also help each other find jobs at the destination. A limitation of this strategy is that a sufficiently large (common) shock is needed to jump-start the new network at the destination and such group-level opportunities occur relatively infrequently. A second strategy to reduce the information and enforcement problems that restrict mobility is for individuals to migrate temporarily. The principal limitation of this strategy is that it will not fill the large number of (permanent) jobs that require firm-specific or task-specific learning. Both strategies described above are used by rural households to facili-tate mobility, as discussed in this paper. Individuals will nevertheless be discouraged from migrating permanently and the labor market will not clear, potentially giving rise to large rural–urban wage gaps. As noted, this misallocation is exacerbated when rural networks are well-functioning. This is the basis for our claim in Munshi and Rosenzweig (2014) that exceptionally well-functioning caste-based rural insur-ance networks, together with the absence of formal insurance, are responsible for the exceptionally large rural–urban wage gap in India.
The most direct test of this hypothesis, in line with the examples discussed earlier, would be to compare migration rates in populations with access to rural insurance networks of different quality (size and connectedness). However, an exogenous source of variation in the quality of insurance networks across castes is unavailable. What we do instead in Munshi and Rosenzweig (2014) is look within the caste-community and theoretically identify which households benefit more or less from caste-based insurance. We then test whether those households are less or more likely to have migrant members.
When an insurance network is active, the income generated by its members is pooled in each period and then distributed on the basis of a pre-specified sharing rule. This smooths consumption over time, making risk-averse individuals better off. The literature on mutual insurance is concerned with how much risk-sharing occurs, taking the size of the network and the income-sharing rule as given. To derive the connection between networks in the rural origin and rural–urban migra-tion, however, it is necessary to take a step back and derive the income-sharing rule. The rule that is chosen in equilibrium determines which households choose to participate in the network and therefore, forego the gains from migration. The first theoretical prediction of Munshi and Rosenzweig (2014) is that the income-sharing rule that maximizes the surplus generated by the insurance network will involve some amount of redistribution. This implies that relatively wealthy house-holds within their caste benefit less from the network and so will be more likely
Kaivan Munshi 71
to have migrant members. Our second theoretical prediction is that households who face greater rural income risk, and therefore benefit more from the insur-ance network, will be less likely to have migrant members. The latter result would not be obtained if the network treated migrants and the rest of their family that remained in the village independently. It would also not be obtained if rural insur-ance networks did not offer substantial benefits. By not sending their members to the city, households would forego substantially higher income and the gain from income diversification.
Using a variety of data sources and empirical techniques, in Munshi and Rosenzweig (2014) we obtain evidence consistent with both predictions of our theory. We then estimate the structural parameters of a model of insurance and migration in which the income-sharing rule and migration are determined simulta-neously. Counterfactual simulations of the model that quantify the effect of formal insurance on migration indicate that a 50 percent improvement in risk sharing for households with migrant members (who lose network insurance) would increase the migration rate from 4 to 9 percent. In contrast, halving the rural–urban wage gap, which is currently as high as 20 percent in India, would reduce migration by just one percentage point. The analysis of migration in economics has tradition-ally focused on average differences in wages at the origin and the destination. As discussed above, a literature documenting the role played by networks in supporting migration is rapidly emerging. The analysis in Munshi and Rosenzweig (2014) adds a new perspective to the relationship between networks and migration, showing how networks at the origin can constrain the movement of individual members.
Migration is dampened in the preceding analysis because it results in a loss in origin-network services, not because movers face explicit sanctions or restric-tions. There are certain circumstances, however, under which networks will actively restrict the movement of their members. To illustrate this phenomenon, consider an urban network providing job referrals for its members. Recall that the analysis in Munshi (2003) shows that larger networks are more effective. When a member of the network leaves the market that the network operates in to find a job in a different location or a different occupation, the migrant will not internalize the cost imposed consequently on the rest of the network through his or her departure. This cost will be especially large when multiple networks are competing for scarce jobs. Social sanctions will have little effect once the individual has moved on, and under these circumstances it may be optimal for the community to place restric-tions on mobility. These restrictions could take the form of a culture that builds loyalty to the community and a strong identification with traditional lifestyles. This type of culture is often associated with farming and blue-collar communities where cooperation was historically important (for example, Elder and Conger 2000; Gans 1962; Kornblum 1974).
While a culture that restricts mobility may have been welfare-enhancing when it was put in place, its persistence can result in a dynamic inefficiency if the returns to new occupations increase sufficiently. There is a common perception that farming
72 Journal of Economic Perspectives
and blue-collar communities stubbornly resist change. This perception has even made its way into the media, as for example, the portrayal of the Boston-Irish working class in the 1997 film Good Will Hunting or Polish dockworkers on cable TV shows like The Wire. Munshi and Rosenzweig (2006) provide a more formal anal-ysis of such resistance to change in Mumbai’s working class communities even as the returns to white-collar occupations grew with the restructuring of the Indian economy in the 1990s.
I have already described how caste networks established niches in urban labor markets during the colonial period and how these networks maintained their posi-tion in the market over many generations. These networks typically formed in working class (blue-collar) occupations, which provided stable employment with relatively high wages from the 19th and through much of the 20th century. This situ-ation changed dramatically in the 1990s, with the growth of the corporate sector in cities like Mumbai where the traditional working class jobs had been simultaneously declining over time. Adult workers were already locked into the occupations they had selected. In Munshi and Rosenzweig (2006), we examine occupational mobility in this environment by studying the schooling choices made by their children.
Schooling in Mumbai can be in English or Marathi, which is the local language. English schooling channels students into white-collar jobs, while Marathi schooling, which is less expensive, channels them into working class jobs. The increase in the returns to white-collar occupations, which was effectively an increase in the returns to English schooling, resulted in a shift into English schools from 1990 onwards. However, this response to economic change varied substantially across castes and by gender. Among the boys, schooling choice was strongly determined by the fraction of adult men (the preceding generation) from the student’s caste in working class jobs, after controlling for parental and household characteristics. This intergenerational persistence did not weaken across successive cohorts entering school over the 1990s, even as the returns to English grew over time, indicating that the traditional networks were restricting occupational mobility. These restrictions on mobility help explain the absence of convergence in schooling choice across castes documented in Munshi and Rosenzweig (2006). In contrast, there is no intergenerational persistence for the girls. Women did not benefit from the traditional working class networks. While girls from (male) working-class castes also start with lower rates of English schooling in 1990, unlike the boys, convergence across castes is complete by 2000.
Towards a Theory of Network-Based Growth
The preceding sections describe a world in which community networks support their members in a variety of ways when markets are incomplete. In addition to these services in the immediate term, networks also play a dynamic role, supporting the permanent movement of groups of individuals from the community across space and occupations. However, this community-based support comes at a cost.
Community Networks and the Process of Development 73
Competent individuals without access to a community network are shut out of jobs and economic activities. For those individuals with a network, there is a different cost, which is that independent mobility is discouraged. The relationship between networks and mobility, a key ingredient in the process of development, is thus complex. Despite this complexity, there might be substantial gains to incorporating networks in models of growth.
When credit markets are imperfect and there is a fixed cost to investing in human capital, or when inherited (parental) human capital is occupation-specific, families can get locked into occupations from one generation to the next. Families in low-skill occupations with low levels of human capital stay poor, while families in high-skill occupations with correspondingly high levels of human capital stay wealthy, despite being endowed with the same level of ability on average (Galor and Zeira 1993; Banerjee and Newman 1993; Maoz and Moav 1999; Hassler and Mora 2000; Mookherjee and Ray 2003). A strong implication of what is sometimes known as the “new classical” growth model is that initial wealth will have long-term conse-quences, resulting in occupational traps and permanent wealth inequality. Once we add networks to the mix, however, the outcome is not so certain. A community-based network effectively substitutes for parental wealth and human capital, allowing groups of individuals to bootstrap their way into new occupations over the course of a single generation. Therefore, what matters for long-term outcomes is not just initial household wealth, but also the social structure and the distribution of shocks (both positive and negative) across communities and over time.
Consider a country such as India, where the population is stratified into large and cohesive communities. These communities are well positioned to support well-connected and well-functioning networks, and so the development process in such a country will be characterized by groups of individuals belonging to the same community making occupational transitions. Large common shocks will be needed to generate movement, but once a transition is initiated, it will involve large numbers of individuals. In countries with smaller communities, there may be greater individual flexibility, but transitions that involve a major mobilization of resources, such as the move from trade to capital-intensive manufacturing, may be difficult to achieve. Growth may thus be rapid initially in these countries, but the long-term outcome is less clear. A complete characterization of the relationship between networks and growth might well go a long way in explaining differences in the development trajectory and the dynamics of inequality we observe across countries.
Growth theory has always been responsive to advances in microeconomic theory. The canonical growth model with its prediction of convergence, was based on neoclassical microfoundations: in particular, perfect markets. When these strong assumptions began to be relaxed by microeconomists in the 1980s, the new growth model, based on credit market imperfections, followed with its predic-tions for the persistence of inequality. Given recent advances in the economics of networks at the micro level, it may be time for an augmented growth model that incorporates networks.
74 Journal of Economic Perspectives
■ Support for the research was obtained from the National Institutes of Health and the National Science Foundation.
References
Angelucci, Manuela, Gicomo De Giorgi, and Imran Rasul. 2014. “Resource Pooling within Family Networks: Insurance and Investment.” Unpublished paper, University of Michigan.
Banerjee, Abhijit, and Kaivan Munshi. 2004. “How Efficiently is Capital Allocated? Evidence from the Knitted Garment Industry in Tirupur.” Review of Economic Studies 71(1): 19–42.
Banerjee, Abhijit, and Andrew Newman. 1993. “Occupational Choice and the Process of Develop-ment.” Journal of Political Economy 101(2): 274–98.
Beaman, Lori. 2012. “Social Networks and the Dynamics of Labor Market Outcomes: Evidence from Refugees Resettled in the U.S.” Review of Economic Studies 79(1): 128–61.
Bian, Yanjie. 1994. “Guanxi and the Allocation of Urban Jobs in China.” China Quarterly 140(4): 971–99.
Burnett-Hurst, A. R. 1925. Labour and Housing in Bombay: A Study in the Economic Conditions of the Wage-Earning Classes of Bombay. London: P. S. King and Son.
Chandavarkar, Rajnarayan. 1994. The Origins of Industrial Capitalism in India: Business Strategies and the Working Classes in Bombay, 1900–1940. Cambridge University Press.
Chavez, Leo. 1992. Shadowed Lives: Undocu-mented Immigrants in American Society. Harcourt Brace Jovanovich College Publishers.
Chay, Kenneth, and Kaivan Munshi. 2014. “Black Networks after Emancipation: Evidence from Reconstruction and the Great Migration.” Unpublished paper, University of Cambridge.
Cholia, Rasiklal P. 1941. Dock Labourers in Bombay. Calcutta, London, New York: Longmans, Green, and Co.
Coleman, James S. 1988. “Social Capital in the Creation of Human Capital.” American Journal of Sociology 94(Supplement: Organizations and Insti-tutions: Sociological and Economic Approaches to the Analysis of Social Structure): S95–S120.
Conzen, Kathleen Neils. 1976. Immigrant
Milwaukee 1836–1860: Accommodation and Commu-nity in a Frontier City. Harvard University Press.
Damodaran, Harish. 2008. India’s New Capital-ists: Caste, Business, and Industry in Modern India. New York, NY: Palgrave Macmillan.
de Zwart, Frank. 2000. “The Logic of Affirma-tive Action: Caste, Class and Quotas in India.” Acta Sociologica 43(3): 235–49.
Dhillon, Amrita, Vegard Iverson, and Gaute Torsvik. 2013. “Employee Referral, Social Prox-imity, and Worker Discipline.” CESifo Working Paper 4309.
Elder, Glen H., Jr., and Rand D. Conger. 2000. Children of the Land: Adversity and Success in Rural America. University of Chicago Press.
Fafchamps, Marcel. 1997. “Trade Credit in Zimbabwean Manufacturing.” World Development 25(5): 795–815.
Fafchamps, Marcel. 1999. “Ethnicity and Credit in African Manufacturing.” Stanford University, Department of Economics, typescript.
Fafchamps, Marcel. 2003. “Ethnicity and Networks in African Trade.” Contributions in Economic Analysis and Policy 2(1): Article 14.
Fafchamps, Marcel, and Susan Lund. 2003. “Risk Sharing Networks in Rural Philippines.” Journal of Development Economics 71(2): 261–87.
Fairlie, Robert W., and Bruce D. Meyer. 1996. “Ethnic and Racial Self-Employment Differences and Possible Explanations.” Journal of Human Resources 31(4): 757–93.
Fisman, Raymond J. 2003. “Ethnic Ties and the Provision of Credit: Relationship-Level Evidence from African Firms.” Advances in Economic Analysis and Policy 3(1): Article 4.
Gadgil, Dhananjaya R. 1959. Origins of the Modern Indian Business Class. New York: Institute of Pacific Relations.
Galor, Oded, and Joseph Zeira. 1993. “Income Distribution and Macroeconomics.” Review of Economic Studies 60(1): 35–52.
Gans, Herbert J. 1962. The Urban Villagers: Group
Kaivan Munshi 75
and Class in the Life of Italian-Americans. New York: Free Press, Simon & Schuster.
Giles, John, Albert Park, and Fang Cai. 2006. “Reemployment of Dislocated Workers in Urban China: The Roles of Information and Incentives.” Journal of Comparative Economics 34(3): 582–607.
Gokhale, R. G. 1957. The Bombay Cotton Mill Worker. Bombay: Millowner’s Association.
Gordon, David M., Richard Edwards, and Michael Reich. 1982. Segmented Work, Divided Workers: The Historical Transformation of Labor in the United States. Cambridge University Press.
Gottlieb, Peter. 1991. “Rethinking the Great Migration: A Perspective from Pittsburgh.” In The Great Migration in Historical Perspective: New Dimen-sions of Race, Class, and Gender, edited by Joe William Trotter, Jr. Bloomington: Indiana University Press.
Grimard, Franque. 1997. “Household Consumption Smoothing through Ethnic Ties: Evidence from Cote d’Ivoire.” Journal of Develop-ment Economics 53(3): 319–422.
Grossman, James R. 1989. Land of Hope: Chicago, Black Southerners, and the Great Migration. Chicago: The University of Chicago Press.
Hagan, Jacqueline Maria. 1994. Deciding to be Legal: A Maya Community in Houston. Philadelphia: Temple University Press.
Hassler, John, and José V. Rodríguez Mora. 2000. “Intelligence, Social Mobility, and Growth.” American Economic Review 90(4): 888–908.
Hoerder, Dirk. 1991. “International Labor Markets and Community Building by Migrant Workers in the Atlantic Economies.” In A Century of European Migrants, 1830–1930, edited by Rudolph J. Vecoli and Suzanne M. Sinke. Urbana: University of Illinois Press.
Hsieh, Chang-Tai, and Peter J. Klenow. 2009. “Misallocation and Manufacturing TFP in China and India.” Quarterly Journal of Economics 124(4): 1403–48.
Karlan, Dean, Markus Mobius, Tanya Rosenblat, and Adam Szeidl. 2009. “Trust and Social Collateral.” Quarterly Journal of Economics 124(3): 1307–61.
Kornblum, William. 1974. Blue Collar Commu-nity. University of Chicago Press.
Kotkin, Joel. 1992. Tribes: How Race, Religion, and Identity Determine Success in the New Global Economy. New York: Random House.
Ligon, Ethan. 1998. “Risk-Sharing and Informa-tion in Village Economies.” Review of Economic Studies 65(4): 847–64.
Luke, Nancy, and Kaivan Munshi. 2006. “New Roles for Marriage in Urban Africa: Kinship Networks and the Labor Market in Kenya.” Review of Economics and Statistics 88(2): 264–82.
Luke, Nancy, and Kaivan Munshi. 2011. “Women as Agents of Change: Female Income and Mobility in India.” Journal of Development Economics 94(1): 1–17.
Magruder, Jeremy. 2010. “Intergenerational Networks, Unemployment, and Persistent Inequality in South Africa.” American Economic Journal: Applied Economics 2(1): 62–85.
Maoz, Yishay D., and Omer Moav. 1999. “Intergenerational Mobility and the Process of Development.” Economic Journal 109(458): 677–97.
Marks, Carole. 1983. “Lines of Communica-tion, Recruitment Mechanisms, and the Great Migration of 1916–1918.” Social Problems 31(1): 73–83.
Massey, Douglas, Rafael Alarcón, Jorge Durand, and Humberto González. 1987. Return to Aztlan: The Social Process of International Migration from Western Mexico. Berkeley: University of California Press.
Mazzocco, Maurizio, and Shiv Saini. 2012. “Testing Efficient Risk Sharing with Heteroge-neous Risk Preferences.” American Economic Review 102(1): 428–68.
McKenzie, David, and Hillel Rapoport. 2007. “Network Effects and the Dynamics of Migration and Inequality: Theory and Evidence from Mexico.” Journal of Development Economics 84(1): 1–24.
McKenzie, David, and Hillel Rapoport. 2010. “Self-Selection Patterns in Mexico–U.S. Migra-tion: The Role of Migration Networks.” Review of Economics and Statistics 92(4): 811–21.
McMillan, John, and Christopher Woodruff. 1999. “Interfirm Relationships and Informal Credit in Vietnam.” Quarterly Journal of Economics 114(4): 1285–1320.
Menjivar, Cecilia. 2000. Fragmented Ties: Salva-doran Immigrant Networks in America. Berkeley: University of California Press.
Mookherjee, Dilip, and Debraj Ray. 2003. “Persistent Inequality.” Review of Economic Studies 70(2): 369–93.
Moorjani, Priya, Kumarasamy Thangaraj, Nick Patterson, Mark Lipson, Po-Ru Loh, Periyasamy Govindaraj, Bonnie Berger, David Reich, and Laiji Singh. 2013. “Genetic Evidence for Recent Popula-tion Mixture in India.” American Journal of Human Genetics 93(3): 422–38.
Morris, Morris David. 1965. The Emergence of an Industrial Labor Force in India: A Study of the Bombay Cotton Mills, 1854–1947. Berkeley: University of California Press.
Morrison, Minion K. C. 1987. Black Political Mobilization: Leadership, Power, and Mass Behavior. Albany: State University of New York Press.
Munshi, Kaivan. 2003. “Networks in the Modern
76 Journal of Economic Perspectives
Economy: Mexican Migrants in the U.S. Labor Market.” Quarterly Journal of Economics 118(2): 549–97.
Munshi, Kaivan. 2011. “Strength in Numbers: Networks as a Solution to Occupational Traps.” Review of Economic Studies 78(3): 1069–1101.
Munshi, Kaivan, and Mark Rosenzweig. 2006. “Traditional Institutions Meet the Modern World: Caste, Gender, and Schooling Choice in a Global-izing Economy.” American Economic Review 96(4): 1225–52.
Munshi, Kaivan, and Mark Rosenzweig. 2014. “Networks and Misallocation: Insurance, Migration, and the Rural–Urban Wage Gap.” Unpublished paper, University of Cambridge.
Nafziger, E. Wayne. 1978. Class, Caste, and Entrepreneurship: A Study of Indian Industrialists. Honolulu: University Press of Hawaii.
Nee, Victor G., and Brett de Bary Nee. 1973. Longtime Californ’: A Documentary Study of an American Chinatown. New York: Pantheon Books.
Passel, Jeffrey S., D’Vera Cohn, and Ana Gonzalez-Barrera. 2012. “Net Migration from Mexico Falls to Zero—And Perhaps Less.” Pew Research Center Report, April 23.
Patel, Kunj. 1963. Rural Labor in Industrial Bombay. Bombay: Popular Prakashan.
Patel, Krishna, and Francis Vella. 2013. “Immigrant Networks and Their Implications for Occupational Choice and Wages.” Review of Economics and Statistics 95(4): 1249–77.
Rees, Albert. 1966. “Information Networks in Labor Markets.” American Economic Review 56(1/2): 559–66.
Richman, Barak. 2006. “How Community Institutions Create Economic Advantage: Jewish Diamond Merchants in New York.” Law and Social Inquiry 31(2): 383–420.
Rudner, David West. 1994. Caste and Capitalism in Colonial India: The Nattukottai Chettiars. Berkeley: University of California Press.
Sampson, Robert J., Stephen W. Raudenbush, and Felton Earls. 1997. “Neighborhoods and Violent Crime: A Multilevel Study of Collective Efficacy.” Science 277(5328): 918–24.
Swaminathan, Padmini, and J. Jeyaranjan. 1994. “The Knitwear Cluster in Tiruppur: An Indian Industrial District in the Making?” Working Paper 126, Madras Institute of Develop-ment Studies.
Townsend, Robert M. 1994. “Risk and Insur-ance in Village India.” Econometrica 62(3): 539–91.
Wang, Shing-Yi. 2013. “Marriage Networks, Nepotism and Labor Market Outcomes in China.” American Economic Journal: Applied Economics 5(3): 91–112.
Zhang, Xiaobo, and Guo Li. 2003. “Does Guanxi Matter to Nonfarm Employment?” Journal of Comparative Economics 31(2): 315–331.
Zhou, Min. 1992. Chinatown: The Socioeconomic Potential of an Urban Enclave. Philadelphia: Temple University Press.
Journal of Economic Perspectives—Volume 28, Number 4—Fall 2014—Pages 77–98
A merican visitors to Scandinavian countries are often puzzled by what they observe: despite large income redistribution through distortionary taxes and transfers, these are very high-income countries. They rank among the
highest in the world in terms of income per capita, as well as most other economic and social outcomes. The economic and social success of Scandinavia poses impor-tant questions for economics and for those arguing against large redistribution based on its supposedly detrimental effect on economic growth and welfare.
To form a basis for the discussion, Table 1 shows tax revenues and income tax rates in the three Scandinavian countries—Denmark, Norway, and Sweden—as compared to other European countries and the United States. We see that the tax-to-GDP ratio and the tax rates on income are much higher in Scandinavia than elsewhere. The top marginal tax rates are about 60–70 percent in the Scandinavian countries as opposed to only 43 percent in the United States. The contrast is even more striking when considering the so-called “participation tax rate,” which is the effective average tax rate on labor force participation when accounting for the distortions due to income taxes, payroll taxes, consumption taxes, and means-tested transfers. This tax rate is around 80 percent in the Scandinavian countries, implying that an average worker entering employment will be able to increase consumption by only 20 percent of earned income due to the combined effect of higher taxes and lower transfers. By contrast, the average worker in the United States gets to keep 63 percent of earnings when accounting for the full effect of the tax and welfare system.
How Can Scandinavians Tax So Much?†
■ Henrik Jacobsen Kleven is Professor of Economics, London School of Economics, London, United Kingdom. His email address is [email protected].† To access the online Appendix and Data Appendix, visithttp://dx.doi.org/10.1257/jep.28.4.77 doi=10.1257/jep.28.4.77
Henrik Jacobsen Kleven
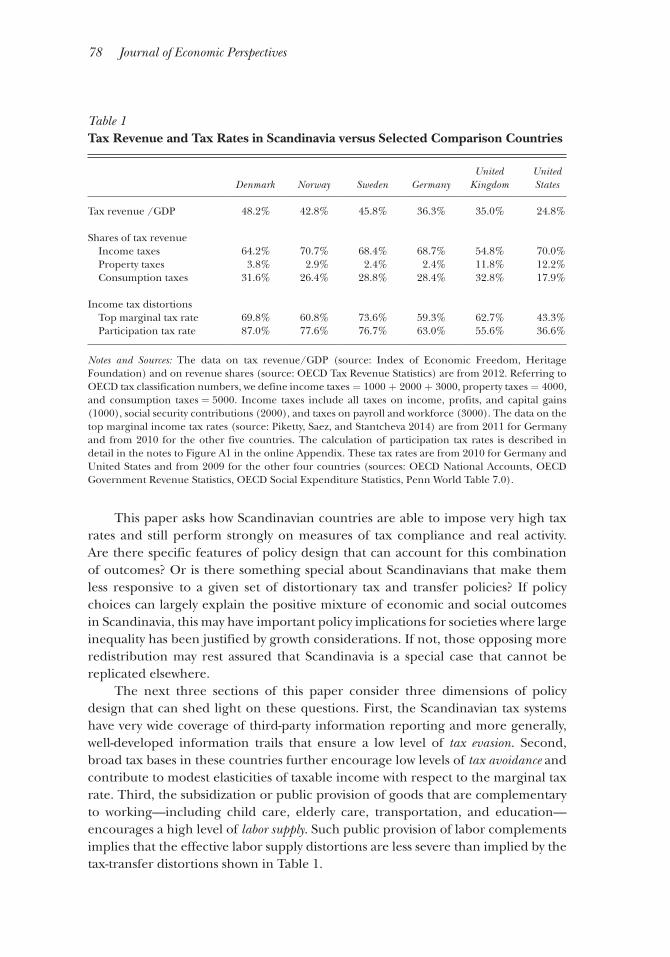
78 Journal of Economic Perspectives
This paper asks how Scandinavian countries are able to impose very high tax rates and still perform strongly on measures of tax compliance and real activity. Are there specific features of policy design that can account for this combination of outcomes? Or is there something special about Scandinavians that make them less responsive to a given set of distortionary tax and transfer policies? If policy choices can largely explain the positive mixture of economic and social outcomes in Scandinavia, this may have important policy implications for societies where large inequality has been justified by growth considerations. If not, those opposing more redistribution may rest assured that Scandinavia is a special case that cannot be replicated elsewhere.
The next three sections of this paper consider three dimensions of policy design that can shed light on these questions. First, the Scandinavian tax systems have very wide coverage of third-party information reporting and more generally, well-developed information trails that ensure a low level of tax evasion. Second, broad tax bases in these countries further encourage low levels of tax avoidance and contribute to modest elasticities of taxable income with respect to the marginal tax rate. Third, the subsidization or public provision of goods that are complementary to working—including child care, elderly care, transportation, and education—encourages a high level of labor supply. Such public provision of labor complements implies that the effective labor supply distortions are less severe than implied by the tax-transfer distortions shown in Table 1.
Table 1 Tax Revenue and Tax Rates in Scandinavia versus Selected Comparison Countries
Denmark
Norway
Sweden
Germany
United Kingdom
United States
Tax revenue /GDP 48.2% 42.8% 45.8% 36.3% 35.0% 24.8%
Shares of tax revenue Income taxes 64.2% 70.7% 68.4% 68.7% 54.8% 70.0% Property taxes 3.8% 2.9% 2.4% 2.4% 11.8% 12.2% Consumption taxes 31.6% 26.4% 28.8% 28.4% 32.8% 17.9%
Income tax distortions Top marginal tax rate 69.8% 60.8% 73.6% 59.3% 62.7% 43.3% Participation tax rate 87.0% 77.6% 76.7% 63.0% 55.6% 36.6%
Notes and Sources: The data on tax revenue/GDP (source: Index of Economic Freedom, Heritage Foundation) and on revenue shares (source: OECD Tax Revenue Statistics) are from 2012. Referring to OECD tax classification numbers, we define income taxes = 1000 + 2000 + 3000, property taxes = 4000, and consumption taxes = 5000. Income taxes include all taxes on income, profits, and capital gains (1000), social security contributions (2000), and taxes on payroll and workforce (3000). The data on the top marginal income tax rates (source: Piketty, Saez, and Stantcheva 2014) are from 2011 for Germany and from 2010 for the other five countries. The calculation of participation tax rates is described in detail in the notes to Figure A1 in the online Appendix. These tax rates are from 2010 for Germany and United States and from 2009 for the other four countries (sources: OECD National Accounts, OECD Government Revenue Statistics, OECD Social Expenditure Statistics, Penn World Table 7.0).
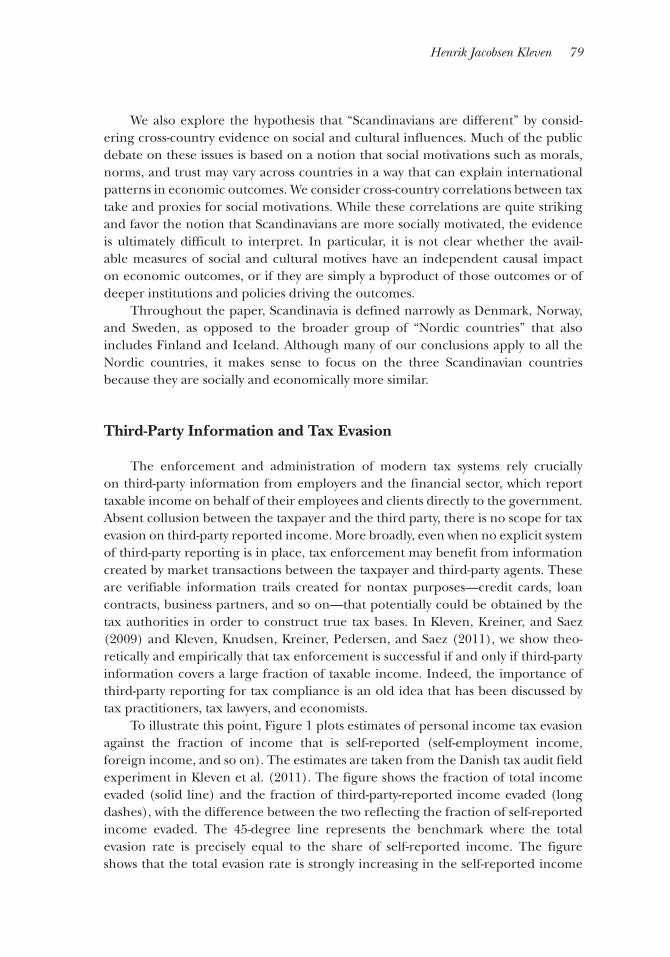
Henrik Jacobsen Kleven 79
We also explore the hypothesis that “Scandinavians are different” by consid-ering cross-country evidence on social and cultural influences. Much of the public debate on these issues is based on a notion that social motivations such as morals, norms, and trust may vary across countries in a way that can explain international patterns in economic outcomes. We consider cross-country correlations between tax take and proxies for social motivations. While these correlations are quite striking and favor the notion that Scandinavians are more socially motivated, the evidence is ultimately difficult to interpret. In particular, it is not clear whether the avail-able measures of social and cultural motives have an independent causal impact on economic outcomes, or if they are simply a byproduct of those outcomes or of deeper institutions and policies driving the outcomes.
Throughout the paper, Scandinavia is defined narrowly as Denmark, Norway, and Sweden, as opposed to the broader group of “Nordic countries” that also includes Finland and Iceland. Although many of our conclusions apply to all the Nordic countries, it makes sense to focus on the three Scandinavian countries because they are socially and economically more similar.
Third-Party Information and Tax Evasion
The enforcement and administration of modern tax systems rely crucially on third-party information from employers and the financial sector, which report taxable income on behalf of their employees and clients directly to the government. Absent collusion between the taxpayer and the third party, there is no scope for tax evasion on third-party reported income. More broadly, even when no explicit system of third-party reporting is in place, tax enforcement may benefit from information created by market transactions between the taxpayer and third-party agents. These are verifiable information trails created for nontax purposes—credit cards, loan contracts, business partners, and so on—that potentially could be obtained by the tax authorities in order to construct true tax bases. In Kleven, Kreiner, and Saez (2009) and Kleven, Knudsen, Kreiner, Pedersen, and Saez (2011), we show theo-retically and empirically that tax enforcement is successful if and only if third-party information covers a large fraction of taxable income. Indeed, the importance of third-party reporting for tax compliance is an old idea that has been discussed by tax practitioners, tax lawyers, and economists.
To illustrate this point, Figure 1 plots estimates of personal income tax evasion against the fraction of income that is self-reported (self-employment income, foreign income, and so on). The estimates are taken from the Danish tax audit field experiment in Kleven et al. (2011). The figure shows the fraction of total income evaded (solid line) and the fraction of third-party-reported income evaded (long dashes), with the difference between the two reflecting the fraction of self-reported income evaded. The 45-degree line represents the benchmark where the total evasion rate is precisely equal to the share of self-reported income. The figure shows that the total evasion rate is strongly increasing in the self-reported income
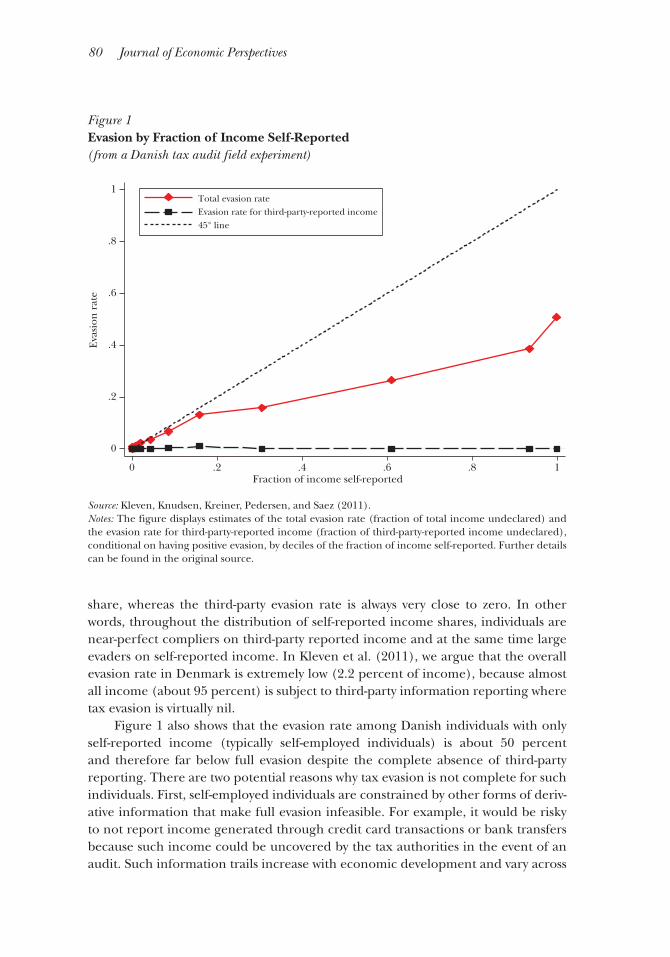
80 Journal of Economic Perspectives
share, whereas the third-party evasion rate is always very close to zero. In other words, throughout the distribution of self-reported income shares, individuals are near-perfect compliers on third-party reported income and at the same time large evaders on self-reported income. In Kleven et al. (2011), we argue that the overall evasion rate in Denmark is extremely low (2.2 percent of income), because almost all income (about 95 percent) is subject to third-party information reporting where tax evasion is virtually nil.
Figure 1 also shows that the evasion rate among Danish individuals with only self-reported income (typically self-employed individuals) is about 50 percent and therefore far below full evasion despite the complete absence of third-party reporting. There are two potential reasons why tax evasion is not complete for such individuals. First, self-employed individuals are constrained by other forms of deriv-ative information that make full evasion infeasible. For example, it would be risky to not report income generated through credit card transactions or bank transfers because such income could be uncovered by the tax authorities in the event of an audit. Such information trails increase with economic development and vary across
Figure 1 Evasion by Fraction of Income Self-Reported (from a Danish tax audit field experiment)
Source: Kleven, Knudsen, Kreiner, Pedersen, and Saez (2011).Notes: The figure displays estimates of the total evasion rate (fraction of total income undeclared) and the evasion rate for third-party-reported income (fraction of third-party-reported income undeclared), conditional on having positive evasion, by deciles of the fraction of income self-reported. Further details can be found in the original source.
0
.2
.4
.6
.8
1
Eva
sion
rat
e
0 .2 .4 .6 .8 1Fraction of income self-reported
Total evasion rate Evasion rate for third-party-reported income45° line
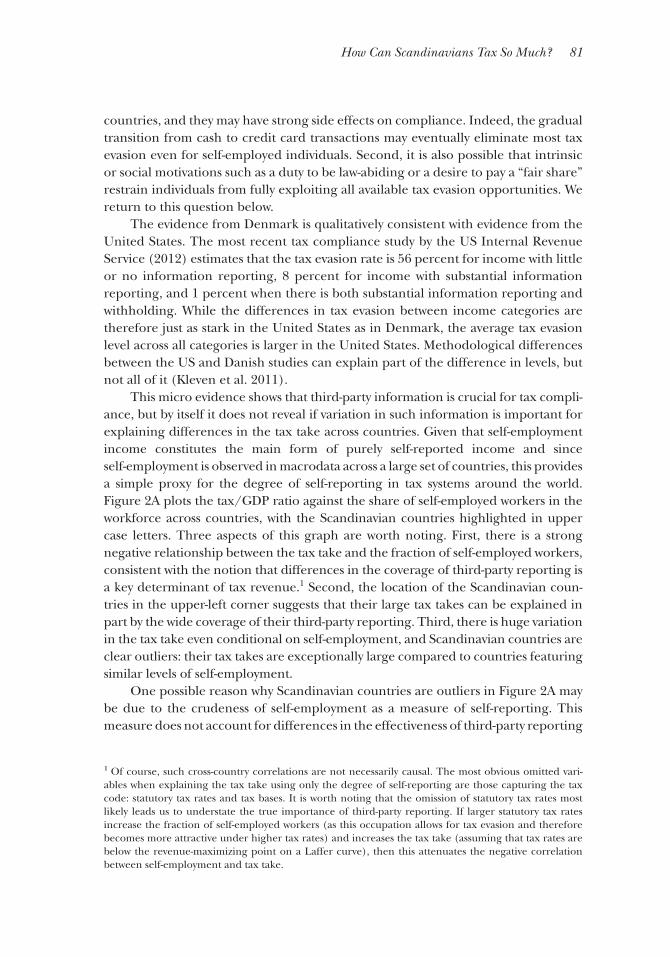
How Can Scandinavians Tax So Much? 81
countries, and they may have strong side effects on compliance. Indeed, the gradual transition from cash to credit card transactions may eventually eliminate most tax evasion even for self-employed individuals. Second, it is also possible that intrinsic or social motivations such as a duty to be law-abiding or a desire to pay a “fair share” restrain individuals from fully exploiting all available tax evasion opportunities. We return to this question below.
The evidence from Denmark is qualitatively consistent with evidence from the United States. The most recent tax compliance study by the US Internal Revenue Service (2012) estimates that the tax evasion rate is 56 percent for income with little or no information reporting, 8 percent for income with substantial information reporting, and 1 percent when there is both substantial information reporting and withholding. While the differences in tax evasion between income categories are therefore just as stark in the United States as in Denmark, the average tax evasion level across all categories is larger in the United States. Methodological differences between the US and Danish studies can explain part of the difference in levels, but not all of it (Kleven et al. 2011).
This micro evidence shows that third-party information is crucial for tax compli-ance, but by itself it does not reveal if variation in such information is important for explaining differences in the tax take across countries. Given that self-employment income constitutes the main form of purely self-reported income and since self-employment is observed in macrodata across a large set of countries, this provides a simple proxy for the degree of self-reporting in tax systems around the world. Figure 2A plots the tax/GDP ratio against the share of self-employed workers in the workforce across countries, with the Scandinavian countries highlighted in upper case letters. Three aspects of this graph are worth noting. First, there is a strong negative relationship between the tax take and the fraction of self-employed workers, consistent with the notion that differences in the coverage of third-party reporting is a key determinant of tax revenue.1 Second, the location of the Scandinavian coun-tries in the upper-left corner suggests that their large tax takes can be explained in part by the wide coverage of their third-party reporting. Third, there is huge variation in the tax take even conditional on self-employment, and Scandinavian countries are clear outliers: their tax takes are exceptionally large compared to countries featuring similar levels of self-employment.
One possible reason why Scandinavian countries are outliers in Figure 2A may be due to the crudeness of self-employment as a measure of self-reporting. This measure does not account for differences in the effectiveness of third-party reporting
1 Of course, such cross-country correlations are not necessarily causal. The most obvious omitted vari-ables when explaining the tax take using only the degree of self-reporting are those capturing the tax code: statutory tax rates and tax bases. It is worth noting that the omission of statutory tax rates most likely leads us to understate the true importance of third-party reporting. If larger statutory tax rates increase the fraction of self-employed workers (as this occupation allows for tax evasion and therefore becomes more attractive under higher tax rates) and increases the tax take (assuming that tax rates are below the revenue-maximizing point on a Laffer curve), then this attenuates the negative correlation between self-employment and tax take.
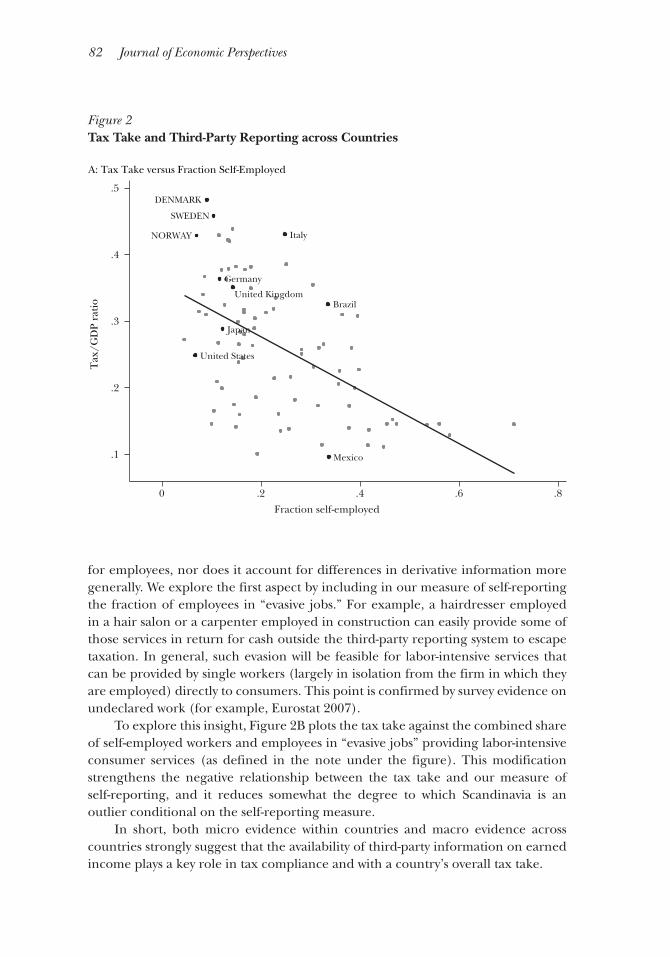
82 Journal of Economic Perspectives
for employees, nor does it account for differences in derivative information more generally. We explore the first aspect by including in our measure of self-reporting the fraction of employees in “evasive jobs.” For example, a hairdresser employed in a hair salon or a carpenter employed in construction can easily provide some of those services in return for cash outside the third-party reporting system to escape taxation. In general, such evasion will be feasible for labor-intensive services that can be provided by single workers (largely in isolation from the firm in which they are employed) directly to consumers. This point is confirmed by survey evidence on undeclared work (for example, Eurostat 2007).
To explore this insight, Figure 2B plots the tax take against the combined share of self-employed workers and employees in “evasive jobs” providing labor-intensive consumer services (as defined in the note under the figure). This modification strengthens the negative relationship between the tax take and our measure of self-reporting, and it reduces somewhat the degree to which Scandinavia is an outlier conditional on the self-reporting measure.
In short, both micro evidence within countries and macro evidence across countries strongly suggest that the availability of third-party information on earned income plays a key role in tax compliance and with a country’s overall tax take.
Figure 2 Tax Take and Third-Party Reporting across Countries
Brazil
Germany
Italy
Japan
Mexico
United Kingdom
United States
DENMARK
NORWAY
SWEDEN
.1
.2
.3
.4
.5
0 .2 .4 .6 .8
Fraction self-employed
A: Tax Take versus Fraction Self-Employed
Tax
/GD
P ra
tio
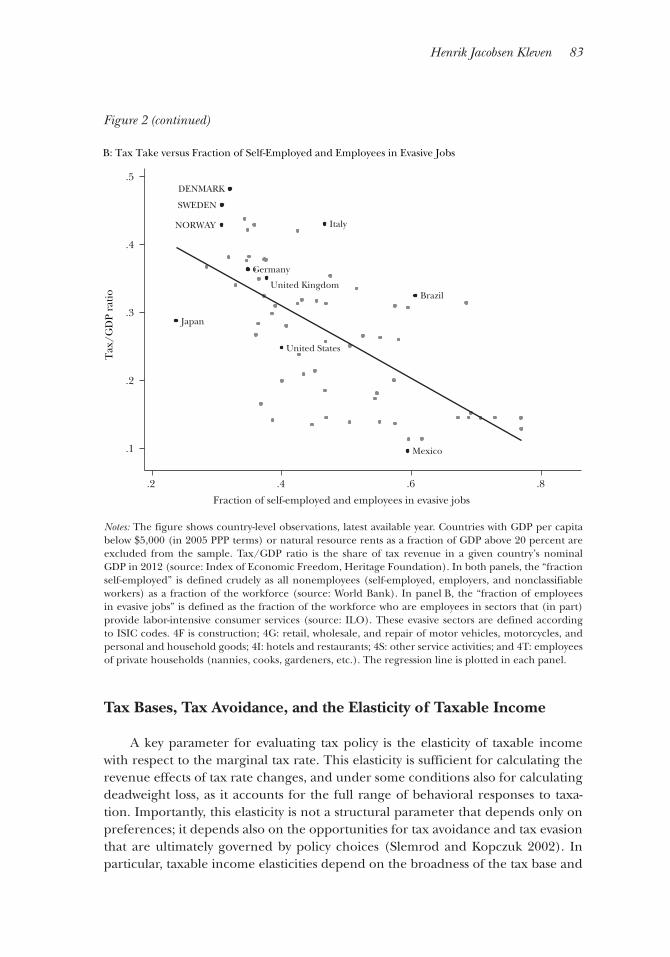
Henrik Jacobsen Kleven 83
Tax Bases, Tax Avoidance, and the Elasticity of Taxable Income
A key parameter for evaluating tax policy is the elasticity of taxable income with respect to the marginal tax rate. This elasticity is sufficient for calculating the revenue effects of tax rate changes, and under some conditions also for calculating deadweight loss, as it accounts for the full range of behavioral responses to taxa-tion. Importantly, this elasticity is not a structural parameter that depends only on preferences; it depends also on the opportunities for tax avoidance and tax evasion that are ultimately governed by policy choices (Slemrod and Kopczuk 2002). In particular, taxable income elasticities depend on the broadness of the tax base and
Notes: The figure shows country-level observations, latest available year. Countries with GDP per capita below $5,000 (in 2005 PPP terms) or natural resource rents as a fraction of GDP above 20 percent are excluded from the sample. Tax/GDP ratio is the share of tax revenue in a given country’s nominal GDP in 2012 (source: Index of Economic Freedom, Heritage Foundation). In both panels, the “fraction self-employed” is defined crudely as all nonemployees (self-employed, employers, and nonclassifiable workers) as a fraction of the workforce (source: World Bank). In panel B, the “fraction of employees in evasive jobs” is defined as the fraction of the workforce who are employees in sectors that (in part) provide labor-intensive consumer services (source: ILO). These evasive sectors are defined according to ISIC codes. 4F is construction; 4G: retail, wholesale, and repair of motor vehicles, motorcycles, and personal and household goods; 4I: hotels and restaurants; 4S: other service activities; and 4T: employees of private households (nannies, cooks, gardeners, etc.). The regression line is plotted in each panel.
Figure 2 (continued)
Brazil
Germany
Italy
Japan
Mexico
United Kingdom
United States
DENMARK
NORWAY
SWEDEN
.1
.2
.3
.4
.5
.2 .4 .6 .8
Fraction of self-employed and employees in evasive jobs
B: Tax Take versus Fraction of Self-Employed and Employees in Evasive Jobs
Tax
/GD
P ra
tio
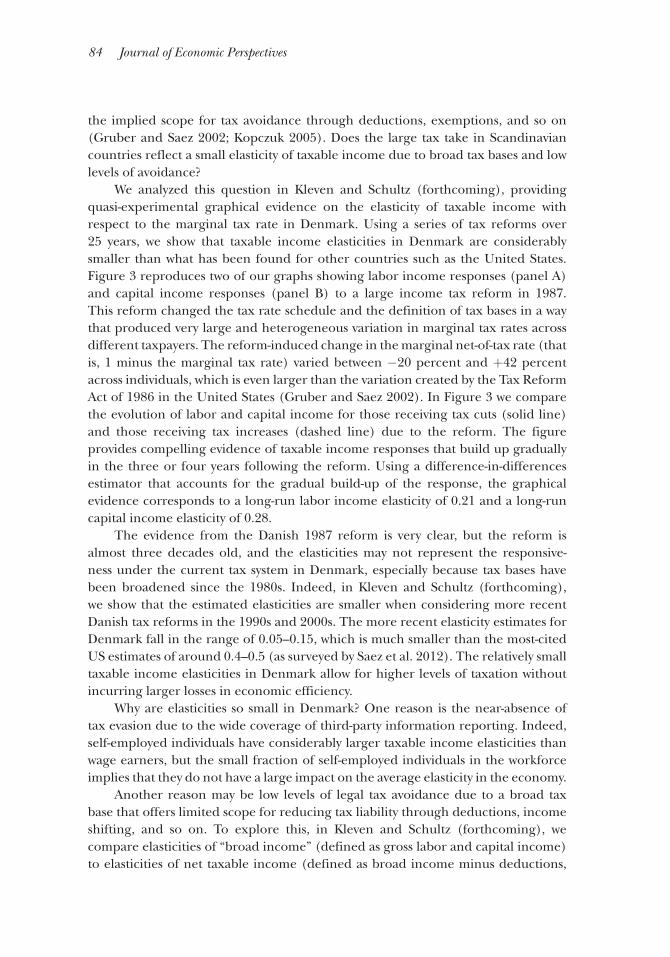
84 Journal of Economic Perspectives
the implied scope for tax avoidance through deductions, exemptions, and so on (Gruber and Saez 2002; Kopczuk 2005). Does the large tax take in Scandinavian countries reflect a small elasticity of taxable income due to broad tax bases and low levels of avoidance?
We analyzed this question in Kleven and Schultz (forthcoming), providing quasi-experimental graphical evidence on the elasticity of taxable income with respect to the marginal tax rate in Denmark. Using a series of tax reforms over 25 years, we show that taxable income elasticities in Denmark are considerably smaller than what has been found for other countries such as the United States. Figure 3 reproduces two of our graphs showing labor income responses (panel A) and capital income responses (panel B) to a large income tax reform in 1987. This reform changed the tax rate schedule and the definition of tax bases in a way that produced very large and heterogeneous variation in marginal tax rates across different taxpayers. The reform-induced change in the marginal net-of-tax rate (that is, 1 minus the marginal tax rate) varied between −20 percent and +42 percent across individuals, which is even larger than the variation created by the Tax Reform Act of 1986 in the United States (Gruber and Saez 2002). In Figure 3 we compare the evolution of labor and capital income for those receiving tax cuts (solid line) and those receiving tax increases (dashed line) due to the reform. The figure provides compelling evidence of taxable income responses that build up gradually in the three or four years following the reform. Using a difference-in-differences estimator that accounts for the gradual build-up of the response, the graphical evidence corresponds to a long-run labor income elasticity of 0.21 and a long-run capital income elasticity of 0.28.
The evidence from the Danish 1987 reform is very clear, but the reform is almost three decades old, and the elasticities may not represent the responsive-ness under the current tax system in Denmark, especially because tax bases have been broadened since the 1980s. Indeed, in Kleven and Schultz (forthcoming), we show that the estimated elasticities are smaller when considering more recent Danish tax reforms in the 1990s and 2000s. The more recent elasticity estimates for Denmark fall in the range of 0.05–0.15, which is much smaller than the most-cited US estimates of around 0.4–0.5 (as surveyed by Saez et al. 2012). The relatively small taxable income elasticities in Denmark allow for higher levels of taxation without incurring larger losses in economic efficiency.
Why are elasticities so small in Denmark? One reason is the near-absence of tax evasion due to the wide coverage of third-party information reporting. Indeed, self-employed individuals have considerably larger taxable income elasticities than wage earners, but the small fraction of self-employed individuals in the workforce implies that they do not have a large impact on the average elasticity in the economy.
Another reason may be low levels of legal tax avoidance due to a broad tax base that offers limited scope for reducing tax liability through deductions, income shifting, and so on. To explore this, in Kleven and Schultz (forthcoming), we compare elasticities of “broad income” (defined as gross labor and capital income) to elasticities of net taxable income (defined as broad income minus deductions,
How Can Scandinavians Tax So Much? 85
Figure 3 Graphical Evidence on Taxable Income Responses in Denmark
Source: Kleven and Schultz (forthcoming).Notes: The figure shows the evolution of labor income (panel A) and capital income (panel B) between 1982 and 1993 for groups that experienced, respectively, tax cuts or tax increases as a result of the 1987 reform. The figure is based on a balanced panel of individuals who are observed throughout the period. The vertical line at 1986 denotes the last pre-reform year (as the reform was passed in parliament during 1986 and changed tax rates starting from 1987), and income levels in 1986 are normalized to 100 in all groups. Both panels show that income trends are completely parallel in the years prior to the reform and then start to diverge precisely in 1987, the first year of reform-induced tax changes. Most of the effect of the tax reform materializes within three years. The figure reports difference-in-differences (DD) estimates of the elasticities of labor and capital income, comparing groups of individuals facing tax cuts or tax increases over the three-year interval 1986–1989 (with standard error in parentheses). The DD estimates in both panels are based on two-stage least squares regressions of log income on an after-reform time dummy, a tax-cut-group dummy and the log marginal net-of-tax rate, the latter variable being instrumented by the interaction between the after-reform and tax-cut-group dummies. Further details can be found in the original source.
DD Elasticity = 0.214 (0.011)
90
95
100
105
110
115
120
Inco
me
leve
ls (
inco
me
in 1
986
= 1
00)
1982 1983 1984 1985 1986 1987 1988 1989 1990 1991 1992 1993
DD Elasticity = 0.278 (0.063)
80
90
100
110
120
130
Inco
me
leve
ls (
inco
me
in 1
986
= 1
00)
1982 1983 1984 1985 1986 1987 1988 1989 1990 1991 1992 1993
A: Labor Income Responses to 1987 Reform
B: Capital Income Responses to 1987 Reform
Tax cutsTax increases
Tax cutsTax increases
86 Journal of Economic Perspectives
exemptions, losses, and other provisions). The literature using US data finds that taxable income elasticities are much larger than broad income elasticities, a differ-ence that has been interpreted as reflecting the additional avoidance opportunities in the narrower taxable income base (Gruber and Saez 2002; Saez, Slemrod, and Giertz 2012). By contrast, in Kleven and Schultz (forthcoming), we find that taxable income elasticities are only slightly larger than broad income elasticities in Denmark, which suggests that avoidance responses are much smaller in Denmark. We argue that this is the result of a broad base offering relatively few deductions and exemp-tions along with an asymmetric tax treatment of different income components, with a much smaller tax rate on negative income and deductions than on positive income. The asymmetric treatment of positive and negative tax base components substantially weakens the incentive to pursue avoidance strategies.
Finally, it should be emphasized that the estimates discussed above represent intensive margin responses—that is, earnings responses conditional on working—and therefore do not account for extensive responses such as labor force participation, retirement, and migration. On the latter, a potential cost of large tax rates at the top of the income distribution is international migration by high-skilled individuals, as analyzed in Kleven, Landais, Saez, and Schultz (2014). We find that the migration elasticity of foreign immigrants in Denmark is large but that the migration elasticity of Danish natives is very small. That is, while higher taxes do discourage high-income foreigners from moving into Denmark, they do not encourage Danish natives to leave to a very large extent. This is important for overall tax capacity, because natives represent the overwhelming share of the population and tax collections.
Expenditure Policy: Transfers and Work Subsidies
The efficiency of a tax system cannot be fully understood without considering how the revenue is spent. The spending of tax revenue may either reinforce or alleviate tax distortions depending on the structure of spending. On the one hand, the Scandinavian countries spend relatively large amounts on means-tested transfer programs that create implicit taxes on working and therefore reinforce the distor-tions coming from the tax system. On the other hand, these countries also spend relatively large amounts on the public provision and subsidization of goods that are complementary to working, including child care, elderly care, and transportation. Such policies represent subsidies to the costs of market work, which encourage labor supply and make taxes less distortionary (Rogerson 2007; Blomquist, Christiansen, and Micheletto 2010). Furthermore, Scandinavian countries spend heavily on education, which is complementary to long-run labor supply and potentially offsets some of the distortionary effects of taxation (for example, Bovenberg and Jacobs 2005; Heckman and Jacobs 2011). This section presents cross-country evidence on these points and draws some policy implications.
In this section, we focus on the extensive margin of labor supply—that is, on whether people are working or not—which is typically viewed as the key margin
Henrik Jacobsen Kleven 87
for understanding aggregate labor supply (for example, Rogerson 1988; Rogerson and Wallenius 2009; Chetty, Guren, Manoli, and Weber 2013). Before turning to government spending on work subsidies, we consider the distortion of labor force participation due to taxes and transfers. As discussed above, the appropriate measure of this distortion is the participation tax rate that accounts for all labor taxes, consumption taxes, and means-tested or work-tested transfers. Because the partici-pation tax rate is an average tax rate, it can be measured more precisely in macro data than the marginal tax rate relevant for hours worked.
Specifically, we calculate the participation tax rate in each OECD country as follows. Using OECD revenue and national accounts statistics, we calculate income tax rates, payroll tax rates on employees and employers, and consumption tax rates that include value-added taxes, sales taxes, and excise taxes. Using OECD social expenditure statistics, we calculate a social benefit rate defined as expenditures on means-tested and work-tested transfers per nonworking person as a fraction of labor income per working person. We include in the benefit rate all social assistance benefits (cash and in kind), unemployment insurance, and disability insurance. Having obtained these tax and benefit rates, we combine them into a single tax rate measure τ that captures the difference between the consumption of the worker and the labor cost of the firm. That is, if a worker enters into employment and receives wages such that the employer labor cost equals 1, then the worker is able to increase her consumption by 1 − τ. 2
A key advantage of our tax rate estimates is that they can be obtained for a large number of countries and over many years using readily available macroeconomic statistics. An important question, however, is how well they line up with more exact measures of tax distortions that would be obtained by modeling the tax-benefit system of each country and using micro data. Using such a micro approach, in Immervoll, Kleven, Kreiner, and Saez (2007), we estimated participation tax rates in 15 EU countries in 1998, and so we can compare the micro-based tax rates with the macro-based tax rates for this particular set of countries and year. Figure A1 in the online Appendix shows that the two tax rate measures are very closely corre-lated, and this is true both when we compare to micro-based tax rates on the average
2 The participation tax rate is calculated as follows. We denote the income tax rate by τi, the payroll tax rate on employees (workers) by τpw, the payroll tax rate on employers (firms) by τpf, the consumption tax rate by τc, and the benefit rate by b. The extra consumption Δc induced by labor market entry
is governed by a budget constraint (1 + τc ) ∙ Δc = 1 − τi − τpw − b
__ (1 + τpf )
∙ Wf where Wf ≡ W ∙ (1 + τpf ) is the
total labor cost of firms and W is the before-tax earnings of workers. Hence, the participation tax rate τ can be defined as
1 − τ ≡ Δc _ Wf
= 1 − τi − τpw − b
__ (1 + τpf )(1 + τc )
.
This formula (and the budget constraint on which it is based) use the fact that the underlying tax and benefit rates τi, τpw, τpf, and b are calculated from macro statistics as fractions of the before-tax earnings of workers W. Further details are provided in the notes to Figure A1 in the online Appendix available with this paper at http://e-jep.org.
88 Journal of Economic Perspectives
worker and to micro-based tax rates at the bottom of the earnings distribution. The reason why the macro-based participation tax rates provide good approximations in different places of the earnings distribution is that participation tax rates have a very flat structure in most countries due to the combined effect of means-tested transfers (creating distortions mostly at the bottom) and progressive income taxes (creating distortions mostly at the top). The flatness of participation tax rates across the income distribution further strengthens the relevance of the macro tax rates.
Figure 4 plots employment rates among the 20–59 year olds against the net-of-tax rate on participation 1 − τ. Figure 4A considers total employment while Figure 4B considers female employment. Ignoring potential confounders, employ-ment rates and net-of-tax rates should of course be positively related, but the figure shows that these variables are in fact negatively correlated across countries. In particular, Scandinavian countries impose exceptionally large participation tax rates due to the interaction between taxes and social assistance, and yet those coun-tries feature very high employment. The surprising correlation between tax-transfer incentives and employment is even stronger for females than for the full population even though females are normally considered to be the most responsive to such incentives. Although the graph cannot be given a causal interpretation, it does raise questions about the enormous focus on extensive responses to taxes and transfers in the public finance literature. It suggests either that micro estimates of extensive responses to tax-transfer distortions are swamped by other factors, or that those locally estimated effects (for example, based on effects from past tax reform legis-lation) have no global validity. In either case, the literature seems to be missing a bigger picture.
The relationships shown in these graphs stand in sharp contrast to a large macro literature, which argues that labor supply is positively correlated with net-of-tax rates across countries and implies very large labor supply elasticities (for example, Prescott 2004; Davis and Henrekson 2005; Rogerson 2007; Ohanian, Raffo, and Rogerson 2008). Much of this literature considers aggregate hours worked (thereby conflating the intensive and extensive margins), but some of it separately considers the extensive margin as we do here. A meta-study of the macro literature by Chetty, Guren, Manoli, and Weber (2013) calculates an extensive margin elasticity with respect to the net-of-tax rate equal to 0.17, and argues that this is fairly consistent with the micro literature. By contrast, our data would imply a strongly negative elas-ticity at the extensive margin.
Why are our results so different from those in the previous macro literature? There are two main reasons. First, the macro studies do not account for the effect of means-tested transfers on the effective distortion of labor supply. Second, much of the macro literature used data from the 1990s, a time period in which low-tax countries had comparatively stronger labor market outcomes than they do today.3 Interestingly,
3 Figure A2 in the online Appendix available with this paper at http://e-jep.org demonstrates the impor-tance of these two points by showing how the regression line in Figure 4 is affected by omitting transfers and considering a different year.
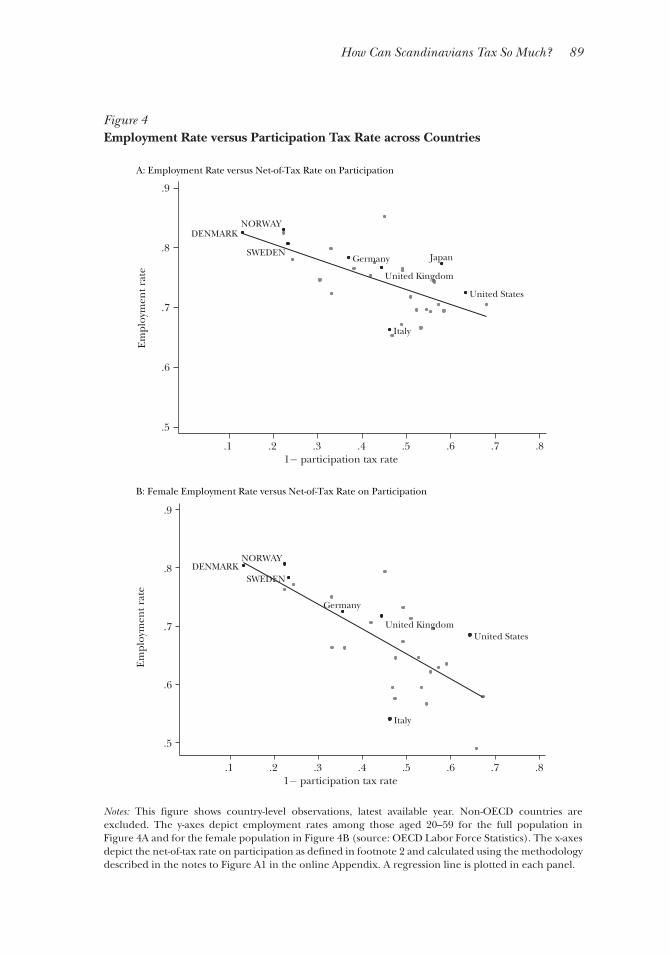
How Can Scandinavians Tax So Much? 89
Figure 4 Employment Rate versus Participation Tax Rate across Countries
Notes: This figure shows country-level observations, latest available year. Non-OECD countries are excluded. The y-axes depict employment rates among those aged 20–59 for the full population in Figure 4A and for the female population in Figure 4B (source: OECD Labor Force Statistics). The x-axes depict the net-of-tax rate on participation as defined in footnote 2 and calculated using the methodology described in the notes to Figure A1 in the online Appendix. A regression line is plotted in each panel.
A: Employment Rate versus Net-of-Tax Rate on Participation
Germany
Italy
Japan
United Kingdom
United States
DENMARKNORWAY
SWEDEN
.5
.6
.7
.8
.9
Em
ploy
men
t rat
e
.1 .2 .3 .4 .5 .6 .7 .81− participation tax rate
Germany
Italy
United KingdomUnited States
DENMARKNORWAY
SWEDEN
.5
.6
.7
.8
.9
Em
ploy
men
t rat
e
.1 .2 .3 .4 .5 .6 .7 .81− participation tax rate
B: Female Employment Rate versus Net-of-Tax Rate on Participation
90 Journal of Economic Perspectives
the correlation between the total employment rate and the net-of-tax rate on partici-pation becomes weakly positive when considering 1995 and leaving out transfers. This suggests that the apparently “realistic” relationship between taxes and labor supply in the macro literature is largely a coincidence driven by mismeasured incentives and the time period that was studied. Finally, it is worth noting that much of the macro literature considers aggregate employment rather than male and female employment separately. When we focus on females alone, if we exclude transfers and consider the 1990s, this is not sufficient to overturn the negative cross-country relationship between employment and net-of-tax rates.4
How do Scandinavian countries perform so strongly on employment despite imposing very large tax-transfer distortions at the extensive margin? Broadly speaking, there can be two reasons: culture or incentives. That is, either Scandinavian culture favors labor force participation independent of incentives, or there are nontax incentives in the Scandinavian countries that favor participa-tion. Figure 5 explores the role of nontax incentives by showing the cross-country relationship between employment rates and “participation subsidies” due to public spending on the provision of child care, preschool, and elderly care. Even though these programs are typically universal (and therefore available to both working and nonworking families), they effectively subsidize labor supply by lowering the prices of goods that are complementary to working. That is, working families have greater need for support in taking care of their young children or elderly parents, and so demand more of those services other things equal. From this perspective, the cross-country correlations shown in Figure 5 have the expected sign; higher public support for preschool, child care, and elder care is positively associated with the rate of employment. Moreover, the Scandinavian countries are strong outliers as they spend more on such participation subsidies (about 6 percent of aggregate labor income) than any other country. Since childcare subsidies are targeted to women with young children who have the largest elasticities of labor force participation, the average correlations in the figure (based on either the full population or all women) potentially understate the importance of these subsidies for employment.
Broadly speaking, countries tend to be divided into those with relatively small tax-transfer distortions and at the same time small subsidies to child care and elderly care (such as the United States and countries of southern Europe) and those with a lot of both (like the countries of Scandinavia). This naturally raises the question of what is the optimal policy. The literature on optimal income taxation in the pres-ence of extensive labor supply responses argues for having low or even negative participation tax rates at the bottom of the income distribution (Saez 2002), as implemented for example by the Earned Income Tax Credit (EITC) to low-income working families in the United States. The EITC and similar programs in other countries have been hailed as successes by economists and policymakers, and yet we
4 The surprising correlation between taxes and labor supply at the extensive margin shown above does not carry over to the intensive margin. Figure A3 in the online Appendix shows that average annual hours worked among the employed is positively associated with (1 − top marginal tax rate) across countries.
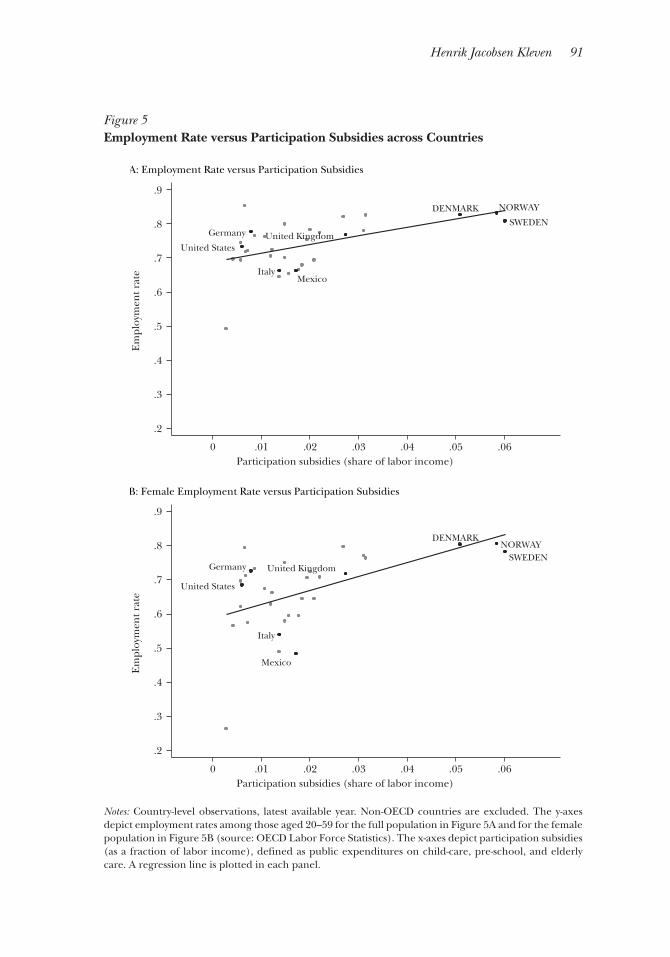
Henrik Jacobsen Kleven 91
Figure 5 Employment Rate versus Participation Subsidies across Countries
Notes: Country-level observations, latest available year. Non-OECD countries are excluded. The y-axes depict employment rates among those aged 20–59 for the full population in Figure 5A and for the female population in Figure 5B (source: OECD Labor Force Statistics). The x-axes depict participation subsidies (as a fraction of labor income), defined as public expenditures on child-care, pre-school, and elderly care. A regression line is plotted in each panel.
Em
ploy
men
t rat
e
Germany
ItalyMexico
United KingdomUnited States
DENMARK NORWAY
SWEDEN
.2
.3
.4
.5
.6
.7
.8
.9
0 .01 .02 .03 .04 .05 .06Participation subsidies (share of labor income)
Em
ploy
men
t rat
e
Germany
Italy
Mexico
United Kingdom
United States
DENMARKNORWAY
SWEDEN
.2
.3
.4
.5
.6
.7
.8
.9
0 .01 .02 .03 .04 .05 .06Participation subsidies (share of labor income)
A: Employment Rate versus Participation Subsidies
B: Female Employment Rate versus Participation Subsidies
92 Journal of Economic Perspectives
have seen that Scandinavian countries have strong labor market outcomes without any significant program of this type. An issue with the theoretical literature on these questions is that it ignores the possibility of subsidizing child care and other fixed costs of work, which limits the suitability of this research for fully evaluating the normative argument for an EITC or low participation tax rates more generally.
To evaluate the desirability of an Earned Income Tax Credit as compared to subsidized child care, in Kleven (2014), I develop an extensive-margin optimal tax model that allows for both policy instruments. The paper presents two simple and intuitive findings. First, assuming that childcare demand is positively related to working, subsidies to child care boost labor supply and thus enhance the efficiency of income redistribution. The optimality of subsidizing child care within this frame-work corresponds to classic insights from optimal tax theory, which calls for low or negative tax rates on goods that are complementary to labor supply (for example, Corlett and Hague 1953; Atkinson and Stiglitz 1976; Christiansen 1984). Second, because childcare subsidies represent a subsidy to labor force participation (by lowering the total effective distortion of labor supply on the extensive margin), it directly reduces the need for a low or negative tax rate on labor force participation through a policy like the EITC. If the optimal childcare subsidies are large, then it becomes very difficult to justify a policy like the EITC under realistic parameters.
Of course, there may be other reasons for publicly provided child care and preschool than these optimal tax considerations: for example, the argument that these activities represent investments in early education. Such aspects would increase the optimal subsidy and therefore serve to reinforce our argument.
To conclude, the empirical and theoretical arguments above suggest that public spending on work complements such as child care, preschool, and elder care allows for a more efficient provision of low-income support and at the same time weakens the argument for low participation tax rates at the bottom of the distribution through an Earned Income Tax Credit. In this sense, it is conceivable that Scandinavian countries (with their large subsidies to work complements and no EITC) got it right, while the United States (with its small subsidies to work comple-ments and a large EITC) got it wrong. At the very least, when thinking about how to ameliorate the efficiency costs of income redistribution, it would be useful to expand the conversation beyond tax and transfer instruments to include the expen-diture-side instruments emphasized here.
Social and Cultural Influences
A common perception is that Scandinavian countries collect more tax in part because of intrinsic or social motivations such as morals, norms, and trust. In the literature, these motivations are often grouped under the heading of “tax morale” (a subject discussed in more detail in the paper by Luttmer and Singhal in this symposium). There is some micro evidence that social incentives matter for tax compliance (for example, Dwenger, Kleven, Rasul, Rincke 2014) and for public
How Can Scandinavians Tax So Much? 93
goods contributions more broadly (for example, DellaVigna, List, Malmendier 2012). However, it is a considerably stronger statement to say that tax morale varies across countries in a way that can explain cross-country variation in tax collections. This section presents some descriptive and suggestive evidence on the possible role of social and cultural factors for tax collections and redistribution in the Scandinavian countries.
Figure 6 shows cross-country evidence on the relationship between the tax/GDP ratio and different social and cultural indicators. Panel A considers a stan-dard attitudinal measure of trust from the World Values Survey, namely the average response to the question of “whether or not most people can be trusted.” The posi-tive correlation between trust and tax take is quite striking and so is the location of the Scandinavian countries in the graph: Scandinavia features higher levels of trust than anywhere else in the world. This evidence is consistent with the notion that social cohesion is larger in Scandinavian countries, which may explain their willing-ness to pay large taxes. Two caveats are worth noting about this relationship. First, Glaeser, Laibson, Scheinkman, and Soutter (2000) argue that such survey measures of trust predict trustworthy behavior better than they predict trusting behavior. This insight is not necessarily a problem for tax compliance questions, as trustworthiness may be a more appropriate measure of intrinsic motivation to comply. Second, a fundamental question is whether beliefs about trust represent “structural” cultural attitudes, or whether these beliefs are endogenous outcomes of deeper institu-tions and the economic equilibrium we are trying to understand (for example, Fehr 2009). Indeed, the fact that trust is higher in Scandinavian countries than elsewhere is consistent with rational expectations given that tax evasion and crime more broadly are lower in Scandinavia.
Panel B explores the idea that willingness to pay taxes that finance redistribu-tion to the poor is driven in part by beliefs about the poor. Here we consider a question from the World Values Survey that probes views on whether people live in need because of laziness or lack of willpower, or if they live in need because of social injustices, bad luck, or other factors outside individual control. The belief that the poor are lazy displays a weak negative correlation with tax take, and the relationship would be stronger if we control for income per capita or if we dropped low-income countries from the sample. The location of the Scandinavian countries in the graph is again striking: the view that poor people are lazy is held by only 10–15 percent of the population in Denmark, Norway, and Sweden, a smaller share than anywhere else in the world. At the other end of the spectrum, more than 60 percent of Americans hold the view that people are poor as a result of their own laziness.
The two bottom panels of Figure 6 turn from attitudinal measures to behav-ioral measures of social motivation. Panel C considers a social capital index in the spirit of the one constructed by Rupasingha and Goetz (2008) and used for example by Putnam (2007) and Chetty, Hendren, Kline, and Saez (2014). Specifi-cally, we consider an index that combines civic participation, voter turnout, and crime (as proxied by the homicide rate). We include only democratic countries as voter turnout is meaningful only for those countries. As shown in panel C, our
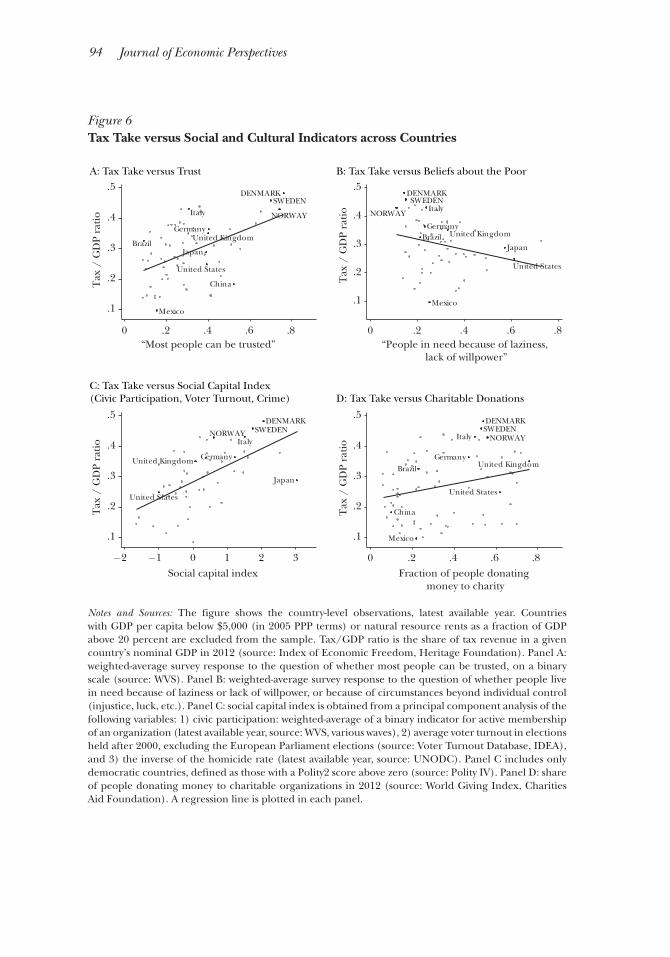
94 Journal of Economic Perspectives
Figure 6 Tax Take versus Social and Cultural Indicators across Countries
Notes and Sources: The figure shows the country-level observations, latest available year. Countries with GDP per capita below $5,000 (in 2005 PPP terms) or natural resource rents as a fraction of GDP above 20 percent are excluded from the sample. Tax/GDP ratio is the share of tax revenue in a given country’s nominal GDP in 2012 (source: Index of Economic Freedom, Heritage Foundation). Panel A: weighted-average survey response to the question of whether most people can be trusted, on a binary scale (source: WVS). Panel B: weighted-average survey response to the question of whether people live in need because of laziness or lack of willpower, or because of circumstances beyond individual control (injustice, luck, etc.). Panel C: social capital index is obtained from a principal component analysis of the following variables: 1) civic participation: weighted-average of a binary indicator for active membership of an organization (latest available year, source: WVS, various waves), 2) average voter turnout in elections held after 2000, excluding the European Parliament elections (source: Voter Turnout Database, IDEA), and 3) the inverse of the homicide rate (latest available year, source: UNODC). Panel C includes only democratic countries, defined as those with a Polity2 score above zero (source: Polity IV). Panel D: share of people donating money to charitable organizations in 2012 (source: World Giving Index, Charities Aid Foundation). A regression line is plotted in each panel.
Brazil
China
Germany
Italy
Japan
Mexico
United Kingdom
United States
DENMARK
NORWAY
SWEDEN
.1
.2
.3
.4
.5
Tax
/ G
DP
rati
o
0 .2 .4 .6 .8“Most people can be trusted”
Brazil
DENMARK
Germany
Italy
Japan
Mexico
United Kingdom
United States
NORWAY
SWEDEN
.1
.2
.3
.4
.5
Tax
/ G
DP
rati
o0 .2 .4 .6 .8
“People in need because of laziness, lack of willpower”
A: Tax Take versus Trust
D: Tax Take versus Charitable DonationsC: Tax Take versus Social Capital Index(Civic Participation, Voter Turnout, Crime)
B: Tax Take versus Beliefs about the Poor
Germany
Italy
Japan
United Kingdom
United States
DENMARK
NORWAY SWEDEN
.1
.2
.3
.4
.5
Tax
/ G
DP
rati
o
−2 −1 0 1 2 3Social capital index
Brazil
China
Germany
Italy
Mexico
United Kingdom
United States
DENMARK
NORWAYSWEDEN
.1
.2
.3
.4
.5
Tax
/ G
DP
rati
o
0 .2 .4 .6 .8Fraction of people donating
money to charity
Henrik Jacobsen Kleven 95
social capital index is strongly positively related to tax take, with the Scandinavian countries scoring very high.
Finally, panel D explores the hypothesis that mandatory contributions to public goods and redistribution through tax payments might crowd out voluntary contribu-tions through charitable donations. For example, Alesina, Glaeser, and Sacerdote (2001) highlight the importance of such effects when evaluating the difference in welfare states between the United States and Europe. If such crowding-out is significant, that would weaken the argument that countries with large tax takes and generous social welfare have populations that are more socially motivated than others. Ideally, one would like to consider the amount of charitable contributions across countries, but unfortunately such information is not available for a large set of countries. Panel D instead plots tax take against the fraction of people donating money to charity using data from the World Giving Index. Perhaps surprisingly, the figure shows no negative relationship between coercive taxation and voluntary donations, nor does it indicate that Scandinavians are less involved in charity than populations facing smaller tax takes. We obtain similar findings when using related questions from the World Values Survey or the International Social Survey Program (such as the fraction of people who are members of charitable organizations).
The absence of tax-charity crowd-out may not survive if we instead consider donation amounts. For example, Americans contribute larger amounts to charity (and pay less in taxes) than European countries. According to the Charities Aid Foundation (2006), charitable giving as a fraction of GDP is equal to 1.67 percent in the United States, 0.73 percent in the United Kingdom, 0.22 percent in Germany, and 0.14 percent in France. The Scandinavian countries were unfortunately not part of this study. Although these numbers are consistent with the existence of some tax-charity crowd-out across countries, it is important to note that the charity-to-GDP ratios are extremely small compared to tax-to-GDP ratios. Even if we assume that all of the cross-country variation in charitable giving is a reflection of tax-charity crowd-out (an upper bound), the evidence on charitable donations would have no quantitatively important implications for understanding the variation in tax take and public goods contributions across countries.
The cross-country evidence that the Scandinavian countries share some distinc-tive social and cultural attitudes and norms that could contribute to the willingness to pay taxes is suggestive but of course falls short of being conclusive. However, we can say that large tax collections go hand in hand with a number of measures of social cohesiveness like civic participation, voter turnout, trust, low crime, and so on, and so these different factors may deserve a more integrated treatment than they normally receive.
Conclusion
How are Scandinavian countries able to combine exceptionally large tax takes with some of the strongest economic outcomes in the world? The wider question
96 Journal of Economic Perspectives
extends beyond Scandinavia. Is it in general possible to design a tax and enforce-ment system that raises large amounts of revenue while keeping tax evasion and labor market distortions at a modest level, or is there something special about the Scandinavian countries that make it hard to replicate their successful outcomes in other settings?
We do not claim to provide an exhaustive or conclusive treatment of these big questions. The descriptive cross-country evidence is consistent with social and cultural factors playing a role, although we are far from being able to interpret this evidence fully. But the discussion has also identified a set of concrete policies that can go some way towards explaining the Scandinavian puzzle, namely the use of far-reaching information trails that facilitate tax compliance, broad tax bases that limit the scope of legal tax avoidance, and large public spending focused on complements to work. Indeed, these factors may intertwine: that is, the social and cultural factors may make it easier to enact these kinds of policies, and in turn the social and cultural norms may themselves be driven by the design of policies and institutions.
As we continue our efforts to understand and draw lessons from the social and economic success of the Scandinavian countries, it is worth remembering that these countries have some specific traits. They are small and homogenous, racial and religious diversity is limited, human capital is high, and they have been largely unaffected by violent conflict. It is not clear to what degree lessons learned from Scandinavia carry policy implications for large, diverse, and unequal countries such as the United States. Certainly the political economy surrounding the implementa-tion of the policies proposed here would be different in the United States—indeed this is partly why we observe stark policy differences to begin with—and conditional on political feasibility, the effects and appropriate design of those policies might be different in the United States. Hence, replicating the Scandinavian policies and institutions in societies that are fundamentally different is unlikely to be achievable or perhaps even desirable. The point is instead for countries everywhere to think carefully about how to collect taxes and redistribute income with less distortion from tax evasion, tax avoidance, and reduced labor supply, and the Scandinavian experience may provide ideas on how to expand the conversation about these important questions.
■ I am grateful to Raj Chetty, Bas Jacobs, Lawrence Katz, Claus Kreiner, James Poterba, Emmanuel Saez, and the JEP editorial team for helpful comments and discussions. I also thank Jan Luksic for outstanding research assistance.
How Can Scandinavians Tax So Much? 97
References
Alesina, Alberto, Edward Glaeser, and Bruce Sacerdote. 2001. “Why Doesn’t the United States Have a European-Style Welfare State?” Brookings Papers on Economic Activity, no. 2, pp. 187–254.
Atkinson, Anthony B., and Joseph E. Stiglitz. 1976. “The Design of Tax Structure: Direct versus Indirect Taxation.” Journal of Public Economics 6(1–2): 55–75.
Blomquist, Sören, Vidar Christiansen, and Luca Micheletto. 2010. “Public Provision of Private Goods and Nondistortionary Marginal Tax Rates.” American Economic Journal: Economic Policy 2(2): 1–27.
Bovenberg, A. Lans, and Bas Jacobs. 2005. “Redistribution and Education Subsidies Are Siamese Twins.” Journal of Public Economics 89(11–12): 2005–2035.
Charities Aid Foundation. 2006. “International Comparisons of Charitable Giving.” CAF Briefing Paper, November 2006.
Chetty, Raj, Adam Guren, Day Manoli, and Andrea Weber. 2013. “Does Indivisible Labor Explain the Difference between Micro and Macro Elasticities? A Meta-Analysis of Extensive Margin Elasticities.” NBER Macroeconomics Annual, vol. 27, pp. 1–56.
Chetty, Raj, Nathaniel Hendren, Patrick Kline, and Emmanuel Saez. 2014. “Where is the Land of Opportunity? The Geography of Intergenerational Mobility in the United States.” NBER Working Paper 19843, January.
Christiansen, Vidar. 1984. “Which Commodity Taxes Should Supplement the Income Tax?” Journal of Public Economics 24(2): 195–220.
Corlett, W. J., and D. C. Hague. 1953. “Comple-mentarity and the Excess Burden of Taxation.” Review of Economic Studies 21(1): 21–30.
Davis, Steven J., and Magnus Henrekson. 2005. “Tax Effects on Work Activity, Industry Mix and Shadow Economy Size: Evidence from Rich-Country Comparisons.” Chap. 2 in Labour Supply and Incentives to Work in Europe, edited by Ramón Gómez Salvador, Ana Lamo, Barbara Petrongolo, Melanie Ward, and Etienne Wasmer. Northampton, MA: Edward Elgar Press.
DellaVigna, Stefano, John A. List, and Ulrike Malmendier. 2012. “Testing for Altruism and Social Pressure in Charitable Giving.” Quarterly Journal of Economics 127(1): 1–56.
Dwenger, Nadja, Henrik Jacobsen Kleven, Imran Rasul, and Johannes Rincke. 2014. “Extrinsic and Intrinsic Motivations for Tax Compliance: Evidence from a Field Experiment in Germany.” Unpublished paper, May 2014. Available at: http://personal.lse.ac.uk/kleven/WorkingPapers.htm.
Eurostat. 2007. “Undeclared Work in the Euro-pean Union.” Special Eurobarometer 284, European Commission.
Fehr, Ernst. 2009. “On the Economics and Biology of Trust.” Journal of the European Economic Association 7(2–3): 235–66.
Glaeser, Edward L., David I. Laibson, José A. Scheinkman, and Christine L. Soutter. 2000. “Measuring Trust.” Quarterly Journal of Economics 115(3): 811–46.
Gruber, Jon, and Emmanuel Saez. 2002. “The Elasticity of Taxable Income: Evidence and Impli-cations.” Journal of Public Economics 84(1): 1–32.
Heckman, James J., and Bas Jacobs. 2011. “Policies to Create and Destroy Human Capital in Europe.” In Perspectives on the Performance of the Continent’s Economies, edited by Edmund Phelps and Hans-Werner Sinn. Cambridge, MA: MIT Press.
Internal Revenue Service. 2012. Tax Year 2006 Tax Gap Estimates. FS-2012-6, January 2012, Washington, DC.
Immervoll, Herwig, Henrik Jacobsen Kleven, Claus Thustrup Kreiner, and Emmanuel Saez. 2007. “Welfare Reform in European Countries: A Microsimulation Analysis.” Economic Journal 117(516): 1–44.
Kleven, Henrik Jacobsen. 2014. “EITC or Subsidized Child Care? An Optimal Tax Analysis.” Preliminary Draft.
Kleven, Henrik Jacobsen, Martin B. Knudsen, Claus Thustrup Kreiner, Søren Pedersen, and Emmanuel Saez. 2011. “Unwilling or Unable to Cheat? Evidence from a Tax Audit Experiment in Denmark.” Econometrica 79(3): 651–92.
Kleven, Henrik Jacobsen, Claus Thustrup Kreiner, and Emmanuel Saez. 2009. “Why Can Modern Governments Tax So Much? An Agency Model of Firms as Fiscal Intermediaries.” NBER Working Paper 15218.
Kleven, Henrik Jacobsen, Camille Landais, and Emmanuel Saez. 2013. “Taxation and Inter-national Migration of Superstars: Evidence from the European Football Market.” American Economic Review 103(5): 1892–1924.
Kleven, Henrik Jacobsen, Camille Landais, Emmanuel Saez, and Esben Schultz. 2014. “Migra-tion and Wage Effects of Taxing Top Earners: Evidence from the Foreigners’ Tax Scheme in Denmark.” Quarterly Journal of Economics 129(1): 333–78.
Kleven, Henrik Jacobsen, and Esben Anton Schultz. Forthcoming. “Estimating Taxable Income Responses Using Danish Tax Reforms.” American Economic Journal: Economic Policy.
98 Journal of Economic Perspectives
Kopczuk, Wojciech. 2005. “Tax Bases, Tax Rates, and the Elasticity of Reported Income.” Journal of Public Economics 89(11–12): 2093–2119.
Ohanian, Lee, Andrea Raffo, and Richard Rogerson. 2008. “Long-Term Changes in Labor Supply and Taxes: Evidence from OECD Coun-tries, 1956–2004.” Journal of Monetary Economics 55(8): 1353–62.
Piketty, Thomas, Emmanuel Saez, and Stefanie Stantcheva. 2014. “Optimal Taxation of Top Labor Incomes: A Tale of Three Elasticities.” American Economic Journal: Economic Policy 6(1): 230–71.
Prescott, Edward C. 2004. “Why Do Americans Work So Much More Than Europeans?” Federal Reserve Bank of Minneapolis Quarterly Review 28(1): 2–13.
Putnam, Robert D. 2007. “E Pluribus Unum: Diversity and Community in the Twenty-first Century. The 2006 Johan Skytte Prize Lecture.” Scandinavian Political Studies 30(2): 137–74.
Rogerson, Richard. 1988. “Indivisible Labor, Lotteries and Equilibrium.” Journal of Monetary Economics 21(1): 3–16.
Rogerson, Richard. 2007. “Taxation and Market Work: Is Scandinavia an Outlier?” Economic Theory 32(1): 59–85.
Rogerson, Richard, and Johanna Wallenius. 2009. “Micro and Macro Elasticities in a Life Cycle Model with Taxes.” Journal of Economic Theory 144(6): 2277–92.
Rupasingha, Anil, and Stephan J. Goetz. 2008. “US County-Level Social Capital Data, 1990–2005.” Dataset. The Northeast Regional Center for Rural Development, Penn State University, University Park, PA.
Saez, Emmanuel. 2002. “Optimal Income Transfer Programs: Intensive versus Extensive Labor Supply Responses.” Quarterly Journal of Economics 117(3): 1039–73.
Saez, Emmanuel, Joel Slemrod, and Seth H. Giertz. 2012. “The Elasticity of Taxable Income with Respect to Marginal Tax Rates: A Critical Review.” Journal of Economic Literature 50(1): 3–50.
Slemrod, Joel, and Wojciech Kopczuk. 2002. “The Optimal Elasticity of Taxable Income.” Journal of Public Economics 84(1): 91–112.
Journal of Economic Perspectives—Volume 28, Number 4—Fall 2014—Pages 99–120
T he power to tax is taken for granted in a great deal of mainstream public finance. In considering limits to taxation, traditional research in the field focuses on limits imposed by incentive constraints, which are tied to asym-
metric information or to politics and political institutions. The limits to taxation are rarely tied to the administrative capacity of the state. But incentive constraints alone cannot explain the vast differences in the levels of taxation that we see across the world and across time. Low-income countries typically collect taxes of between 10 to 20 percent of GDP, while the average for high-income countries is more like 40 percent.
In essence, our view on these patterns is similar to that taken by Joseph Schumpeter (1918) almost a century ago, when he noted: “The fiscal history of a people is above all an essential part of its general history. An enormous influence on the fate of nations emanates from the economic bleeding which the needs of the state necessitates, and from the use to which the results are put.” In order to under-stand taxation, economic development, and the relationships between them, we need to think about the forces that drive the development process. Poor countries
Why Do Developing Countries Tax So Little? †
■ Timothy Besley is School Professor of Economics and Political Science, London School of Economics, London, United Kingdom, Torsten Persson is Torsten and Ragnar Söderberg Chair in Economic Sciences, Institute for International Economic Studies, Stockholm University, Sweden. Besley is Gluskin-Granovsky Fellow and Persson is Senior Fellow at the Canadian Institute for Advanced Research (CIFAR), Toronto, Canada. Their email addresses are [email protected] and [email protected].† To access the Data Appendix and disclosure statements, visithttp://dx.doi.org/10.1257/jep.28.4.99 doi=10.1257/jep.28.4.99
Timothy Besley and Torsten Persson
100 Journal of Economic Perspectives
are poor for certain reasons and these reasons can also help to explain their weak-ness in raising tax revenue.
We begin by laying out some basic relationships regarding how tax revenue as a share of GDP varies with per capita income and with the breadth of a coun-try’s tax base. We sketch a baseline model of what determines a country’s tax revenue as a share of GDP. Like many baseline models in economics, it is useful not because it applies very directly to the real world, but because it helps orga-nize our thinking about what departures from the model are likely to be useful. We then turn to our primary focus: why do developing countries tax so little? We begin with factors related to the economic structure of these economies. But we argue that there is also an important role for political factors, such as weak institutions, fragmented polities, and a lack of transparency due to weak news media. Moreover, sociological and cultural factors—such as a weak sense of national identity and a poor norm for compliance—may stifle the collection of tax revenue. In each case, we suggest the need for a dynamic approach that encompasses the two-way interactions between these political, social, and cultural factors and the economy.
Of course the study of taxation in low-income countries teaches us about the general forces driving higher and lower levels of taxation, but it does much more. The evolution of taxing power is central not only to the state’s capacity to raise revenue, but also to its capacity to provide goods and services and to support a market economy. Moreover, political development goes hand in hand with economic devel-opment, as citizens in participatory political systems demand sound management of increasing public resources. Thus, the power to tax is about much more than raising tax revenues—it is at the core of state development.1
Empirical Patterns
It is useful to begin the discussion with some broad facts in hand. Throughout the paper we will be considering taxation at the national level, not including state and local taxes. Figure 1 illustrates how the level and structure of taxation—the share of tax revenue in aggregate income and the share of income taxes in revenue—has changed over the twentieth century in a sample of 18 coun-tries (Argentina, Australia, Brazil, Canada, Chile, Colombia, Denmark, Finland, Ireland, Japan, Mexico, the Netherlands, New Zealand, Norway, Sweden, Switzer-land, United Kingdom, and the United States) drawing on data from Mitchell (2007). For 15 of these countries, the figure also illustrates the introduction of direct tax withholding of income taxes from pay, an important technical inno-vation for raising income taxes by making use of firms in the collection of tax
1 Discussions of taxation and development by noneconomists frequently emphasise this theme (for example, Bräutigam, Fjeldstad, and Moore 2008; Levi 1988).
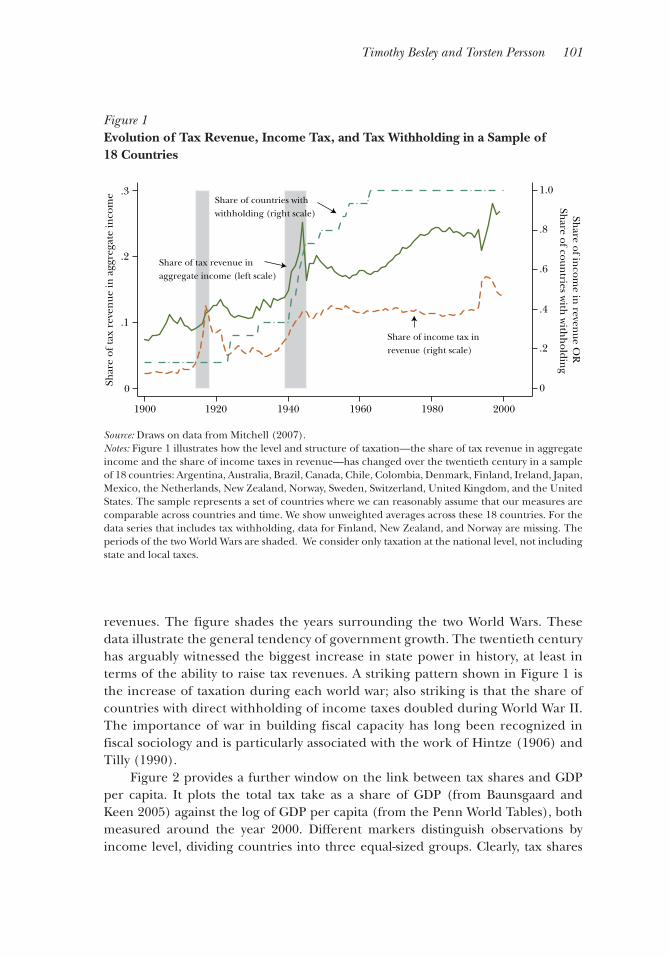
Timothy Besley and Torsten Persson 101
revenues. The figure shades the years surrounding the two World Wars. These data illustrate the general tendency of government growth. The twentieth century has arguably witnessed the biggest increase in state power in history, at least in terms of the ability to raise tax revenues. A striking pattern shown in Figure 1 is the increase of taxation during each world war; also striking is that the share of countries with direct withholding of income taxes doubled during World War II. The importance of war in building fiscal capacity has long been recognized in fiscal sociology and is particularly associated with the work of Hintze (1906) and Tilly (1990).
Figure 2 provides a further window on the link between tax shares and GDP per capita. It plots the total tax take as a share of GDP (from Baunsgaard and Keen 2005) against the log of GDP per capita (from the Penn World Tables), both measured around the year 2000. Different markers distinguish observations by income level, dividing countries into three equal-sized groups. Clearly, tax shares
Figure 1 Evolution of Tax Revenue, Income Tax, and Tax Withholding in a Sample of 18 Countries
Source: Draws on data from Mitchell (2007).Notes: Figure 1 illustrates how the level and structure of taxation—the share of tax revenue in aggregate income and the share of income taxes in revenue—has changed over the twentieth century in a sample of 18 countries: Argentina, Australia, Brazil, Canada, Chile, Colombia, Denmark, Finland, Ireland, Japan, Mexico, the Netherlands, New Zealand, Norway, Sweden, Switzerland, United Kingdom, and the United States. The sample represents a set of countries where we can reasonably assume that our measures are comparable across countries and time. We show unweighted averages across these 18 countries. For the data series that includes tax withholding, data for Finland, New Zealand, and Norway are missing. The periods of the two World Wars are shaded. We consider only taxation at the national level, not including state and local taxes.
0
.2
.4
.6
.8
1.0
Share of in
come in
revenue O
R
Share of coun
tries with
with
holdin
g
0
.1
.2
.3
Shar
e of
tax
reve
nue
in a
ggre
gate
inco
me
1900 1920 1940 1960 1980 2000
Share of income tax in revenue (right scale)
Share of tax revenue in aggregate income (left scale)
Share of countries with withholding (right scale)
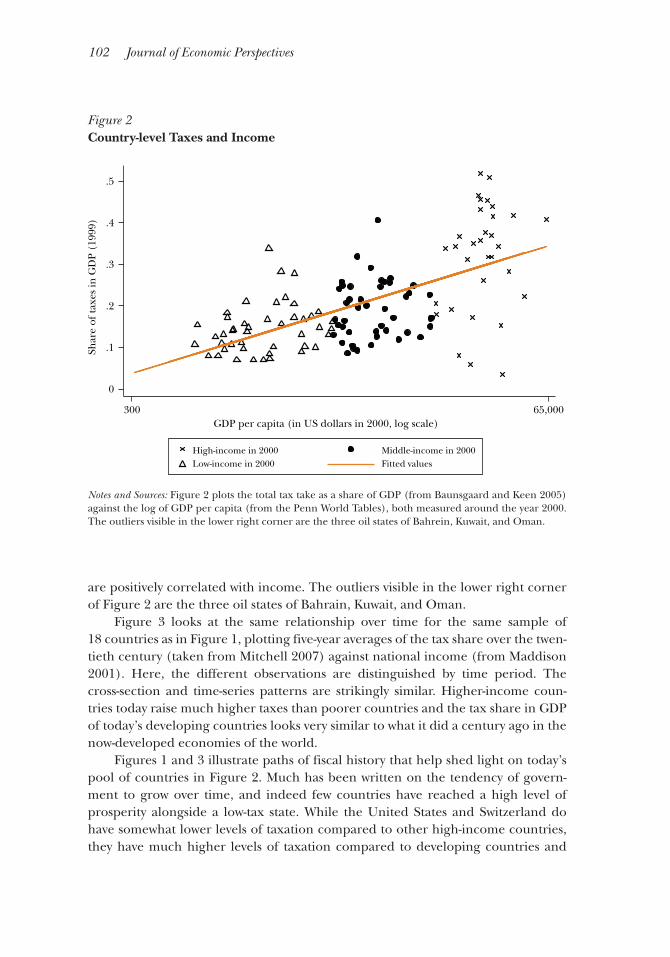
102 Journal of Economic Perspectives
are positively correlated with income. The outliers visible in the lower right corner of Figure 2 are the three oil states of Bahrain, Kuwait, and Oman.
Figure 3 looks at the same relationship over time for the same sample of 18 countries as in Figure 1, plotting five-year averages of the tax share over the twen-tieth century (taken from Mitchell 2007) against national income (from Maddison 2001). Here, the different observations are distinguished by time period. The cross-section and time-series patterns are strikingly similar. Higher-income coun-tries today raise much higher taxes than poorer countries and the tax share in GDP of today’s developing countries looks very similar to what it did a century ago in the now-developed economies of the world.
Figures 1 and 3 illustrate paths of fiscal history that help shed light on today’s pool of countries in Figure 2. Much has been written on the tendency of govern-ment to grow over time, and indeed few countries have reached a high level of prosperity alongside a low-tax state. While the United States and Switzerland do have somewhat lower levels of taxation compared to other high-income countries, they have much higher levels of taxation compared to developing countries and
Figure 2 Country-level Taxes and Income
Notes and Sources: Figure 2 plots the total tax take as a share of GDP (from Baunsgaard and Keen 2005) against the log of GDP per capita (from the Penn World Tables), both measured around the year 2000. The outliers visible in the lower right corner are the three oil states of Bahrein, Kuwait, and Oman.
0
.1
.2
.3
.4
.5
Shar
e of
taxe
s in
GD
P (1
999)
300 65,000GDP per capita (in US dollars in 2000, log scale)
High-income in 2000Low-income in 2000
Middle-income in 2000Fitted values
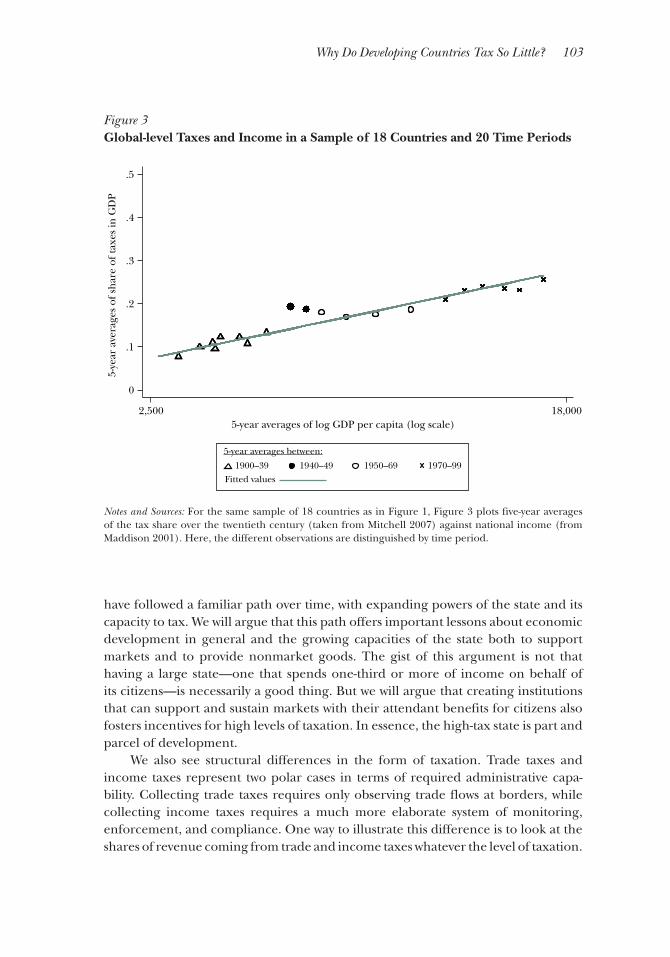
Why Do Developing Countries Tax So Little? 103
have followed a familiar path over time, with expanding powers of the state and its capacity to tax. We will argue that this path offers important lessons about economic development in general and the growing capacities of the state both to support markets and to provide nonmarket goods. The gist of this argument is not that having a large state—one that spends one-third or more of income on behalf of its citizens—is necessarily a good thing. But we will argue that creating institutions that can support and sustain markets with their attendant benefits for citizens also fosters incentives for high levels of taxation. In essence, the high-tax state is part and parcel of development.
We also see structural differences in the form of taxation. Trade taxes and income taxes represent two polar cases in terms of required administrative capa-bility. Collecting trade taxes requires only observing trade flows at borders, while collecting income taxes requires a much more elaborate system of monitoring, enforcement, and compliance. One way to illustrate this difference is to look at the shares of revenue coming from trade and income taxes whatever the level of taxation.
Figure 3 Global-level Taxes and Income in a Sample of 18 Countries and 20 Time Periods
Notes and Sources: For the same sample of 18 countries as in Figure 1, Figure 3 plots five-year averages of the tax share over the twentieth century (taken from Mitchell 2007) against national income (from Maddison 2001). Here, the different observations are distinguished by time period.
0
.1
.2
.3
.4
.5
5-ye
ar a
vera
ges
of s
har
e of
taxe
s in
GD
P
2,500 18,0005-year averages of log GDP per capita (log scale)
1900–39 1940–49 1950–69 1970–99Fitted values
5-year averages between:
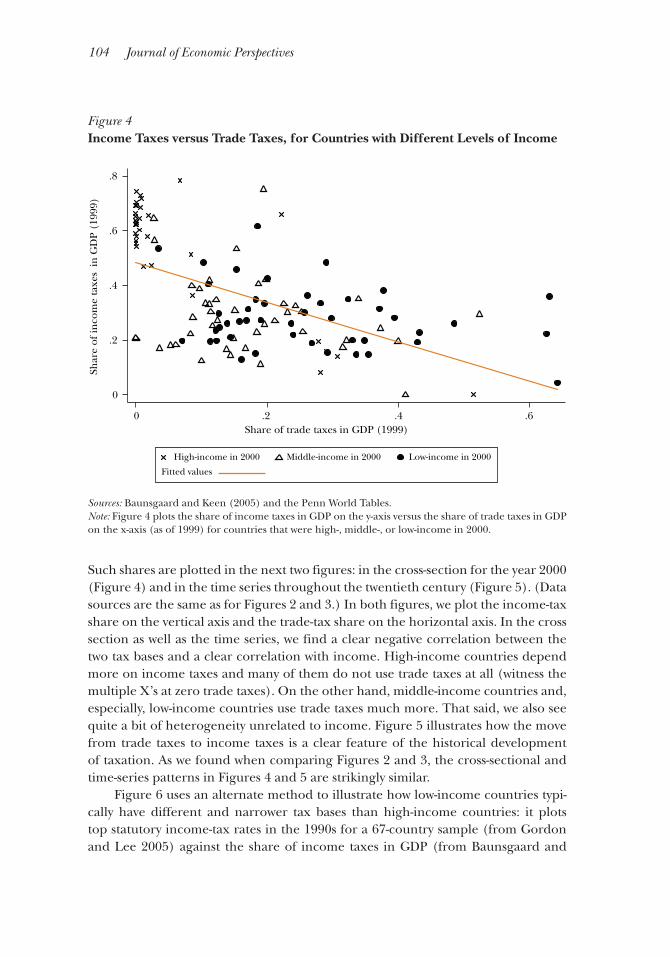
104 Journal of Economic Perspectives
Such shares are plotted in the next two figures: in the cross-section for the year 2000 (Figure 4) and in the time series throughout the twentieth century (Figure 5). (Data sources are the same as for Figures 2 and 3.) In both figures, we plot the income-tax share on the vertical axis and the trade-tax share on the horizontal axis. In the cross section as well as the time series, we find a clear negative correlation between the two tax bases and a clear correlation with income. High-income countries depend more on income taxes and many of them do not use trade taxes at all (witness the multiple X’s at zero trade taxes). On the other hand, middle-income countries and, especially, low-income countries use trade taxes much more. That said, we also see quite a bit of heterogeneity unrelated to income. Figure 5 illustrates how the move from trade taxes to income taxes is a clear feature of the historical development of taxation. As we found when comparing Figures 2 and 3, the cross-sectional and time-series patterns in Figures 4 and 5 are strikingly similar.
Figure 6 uses an alternate method to illustrate how low-income countries typi-cally have different and narrower tax bases than high-income countries: it plots top statutory income-tax rates in the 1990s for a 67-country sample (from Gordon and Lee 2005) against the share of income taxes in GDP (from Baunsgaard and
Figure 4 Income Taxes versus Trade Taxes, for Countries with Different Levels of Income
Sources: Baunsgaard and Keen (2005) and the Penn World Tables.Note: Figure 4 plots the share of income taxes in GDP on the y-axis versus the share of trade taxes in GDP on the x-axis (as of 1999) for countries that were high-, middle-, or low-income in 2000.
0
.2
.4
.6
.8
Shar
e of
inco
me
taxe
s in
GD
P (1
999)
0 .2 .4 .6Share of trade taxes in GDP (1999)
High-income in 2000 Middle-income in 2000 Low-income in 2000
Fitted values
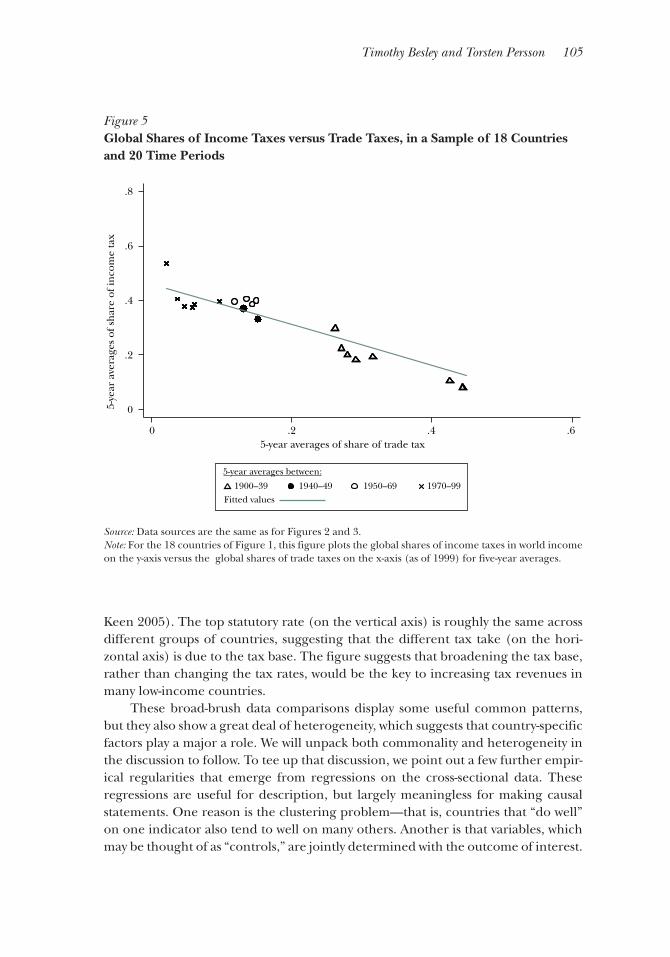
Timothy Besley and Torsten Persson 105
Keen 2005). The top statutory rate (on the vertical axis) is roughly the same across different groups of countries, suggesting that the different tax take (on the hori-zontal axis) is due to the tax base. The figure suggests that broadening the tax base, rather than changing the tax rates, would be the key to increasing tax revenues in many low-income countries.
These broad-brush data comparisons display some useful common patterns, but they also show a great deal of heterogeneity, which suggests that country-specific factors play a major a role. We will unpack both commonality and heterogeneity in the discussion to follow. To tee up that discussion, we point out a few further empir-ical regularities that emerge from regressions on the cross-sectional data. These regressions are useful for description, but largely meaningless for making causal statements. One reason is the clustering problem—that is, countries that “do well” on one indicator also tend to well on many others. Another is that variables, which may be thought of as “controls,” are jointly determined with the outcome of interest.
Figure 5 Global Shares of Income Taxes versus Trade Taxes, in a Sample of 18 Countries and 20 Time Periods
Source: Data sources are the same as for Figures 2 and 3.Note: For the 18 countries of Figure 1, this figure plots the global shares of income taxes in world income on the y-axis versus the global shares of trade taxes on the x-axis (as of 1999) for five-year averages.
0
.2
.4
.6
.8
5-ye
ar a
vera
ges
of s
har
e of
inco
me
tax
0 .2 .4 .65-year averages of share of trade tax
1900–39 1940–49 1950–69 1970–99Fitted values
5-year averages between:
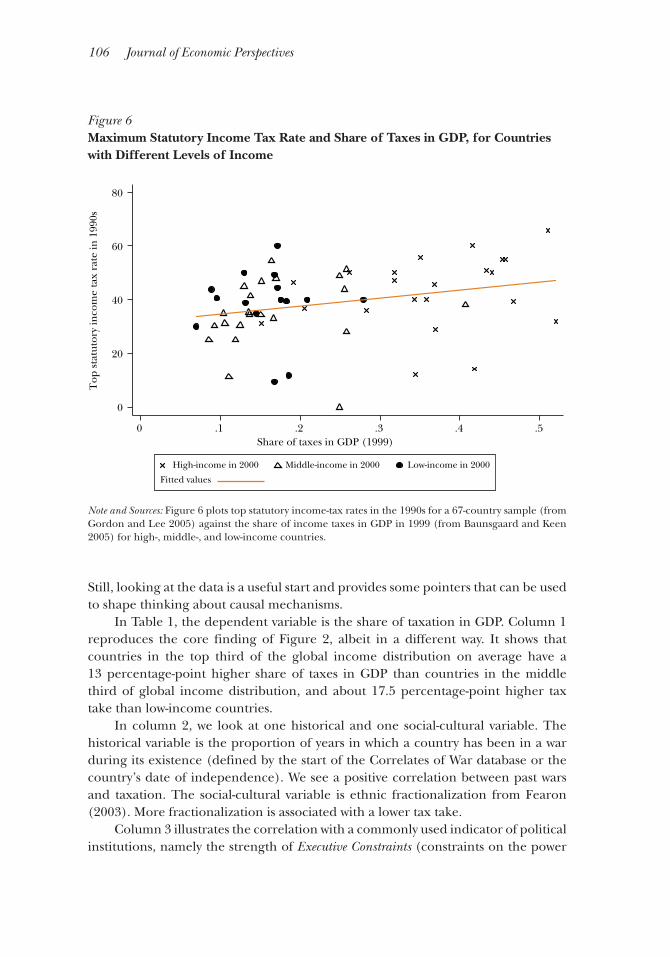
106 Journal of Economic Perspectives
Still, looking at the data is a useful start and provides some pointers that can be used to shape thinking about causal mechanisms.
In Table 1, the dependent variable is the share of taxation in GDP. Column 1 reproduces the core finding of Figure 2, albeit in a different way. It shows that countries in the top third of the global income distribution on average have a 13 percentage-point higher share of taxes in GDP than countries in the middle third of global income distribution, and about 17.5 percentage-point higher tax take than low-income countries.
In column 2, we look at one historical and one social-cultural variable. The historical variable is the proportion of years in which a country has been in a war during its existence (defined by the start of the Correlates of War database or the country’s date of independence). We see a positive correlation between past wars and taxation. The social-cultural variable is ethnic fractionalization from Fearon (2003). More fractionalization is associated with a lower tax take.
Column 3 illustrates the correlation with a commonly used indicator of political institutions, namely the strength of Executive Constraints (constraints on the power
Figure 6 Maximum Statutory Income Tax Rate and Share of Taxes in GDP, for Countries with Different Levels of Income
Note and Sources: Figure 6 plots top statutory income-tax rates in the 1990s for a 67-country sample (from Gordon and Lee 2005) against the share of income taxes in GDP in 1999 (from Baunsgaard and Keen 2005) for high-, middle-, and low-income countries.
0
20
40
60
80
Top
sta
tuto
ry in
com
e ta
x ra
te in
199
0s
0 .1 .2 .3 .4 .5Share of taxes in GDP (1999)
High-income in 2000 Middle-income in 2000 Low-income in 2000
Fitted values
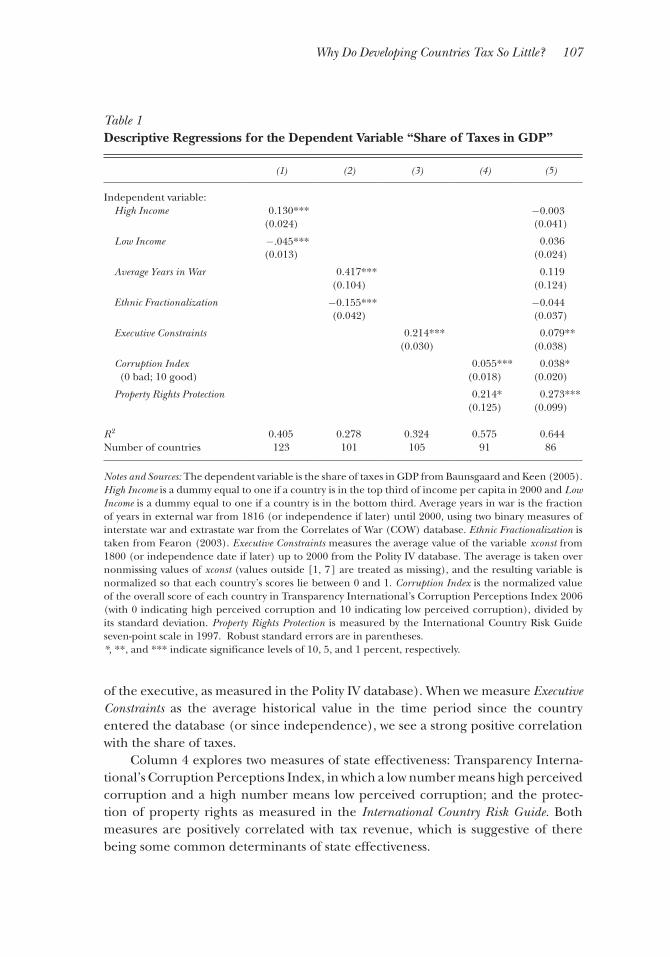
Why Do Developing Countries Tax So Little? 107
of the executive, as measured in the Polity IV database). When we measure Executive Constraints as the average historical value in the time period since the country entered the database (or since independence), we see a strong positive correlation with the share of taxes.
Column 4 explores two measures of state effectiveness: Transparency Interna-tional’s Corruption Perceptions Index, in which a low number means high perceived corruption and a high number means low perceived corruption; and the protec-tion of property rights as measured in the International Country Risk Guide. Both measures are positively correlated with tax revenue, which is suggestive of there being some common determinants of state effectiveness.
Table 1 Descriptive Regressions for the Dependent Variable “Share of Taxes in GDP”
(1) (2) (3) (4) (5)
Independent variable: High Income 0.130*** −0.003
(0.024) (0.041)
Low Income −.045*** 0.036 (0.013) (0.024)
Average Years in War 0.417*** 0.119(0.104) (0.124)
Ethnic Fractionalization −0.155*** −0.044(0.042) (0.037)
Executive Constraints 0.214*** 0.079**(0.030) (0.038)
Corruption Index 0.055*** 0.038* (0 bad; 10 good) (0.018) (0.020)
Property Rights Protection 0.214* 0.273*** (0.125) (0.099)
R2 0.405 0.278 0.324 0.575 0.644Number of countries 123 101 105 91 86
Notes and Sources: The dependent variable is the share of taxes in GDP from Baunsgaard and Keen (2005). High Income is a dummy equal to one if a country is in the top third of income per capita in 2000 and Low Income is a dummy equal to one if a country is in the bottom third. Average years in war is the fraction of years in external war from 1816 (or independence if later) until 2000, using two binary measures of interstate war and extrastate war from the Correlates of War (COW) database. Ethnic Fractionalization is taken from Fearon (2003). Executive Constraints measures the average value of the variable xconst from 1800 (or independence date if later) up to 2000 from the Polity IV database. The average is taken over nonmissing values of xconst (values outside [1, 7] are treated as missing), and the resulting variable is normalized so that each country’s scores lie between 0 and 1. Corruption Index is the normalized value of the overall score of each country in Transparency International’s Corruption Perceptions Index 2006 (with 0 indicating high perceived corruption and 10 indicating low perceived corruption), divided by its standard deviation. Property Rights Protection is measured by the International Country Risk Guide seven-point scale in 1997. Robust standard errors are in parentheses.*, **, and *** indicate significance levels of 10, 5, and 1 percent, respectively.
108 Journal of Economic Perspectives
Finally, in column 5, we include all these variables at the same time. Now, the per capita income variables are insignificant, while the correlations with executive constraints and property rights protection remain strong. Of course, this does not give the stronger correlations any special status in explaining the patterns in the data, and even the conditional income correlations do not rule out concerns about reverse causality and joint determination of key variables. Making sense of these findings requires a discussion of economic and political mechanisms leading to two-way interactions among the variables at hand.
A Benchmark Model
To think about why taxation is so low in developing countries, we begin from a simple benchmark. Suppose that policy making is controlled by a group of citizens. This incumbent group has access to a set of tax instruments for raising revenue that can be spent on transfer programs and/or goods and services. Then, we expect taxes to be raised to the point where the marginal benefit to the ruling group of raising more tax for higher government expenditures is equal to the marginal cost of raising more tax, which depends on the elasticity of the tax base. This elasticity can include standard considerations of deadweight loss, as well as leakage from tax avoidance and evasion.
The best-known workhorse model in this spirit is probably the one laid out in the seminal paper by Meltzer and Richards (1981; see also the preceding papers by Romer 1975 and Roberts 1977). These authors assume a redistributive motive for raising taxation—the only tax base is income, with no avoidance/evasion margin—and a median voter in control of policy. In this case, the marginal benefit of taxation depends upon the difference between mean income, which determines how much revenue goes up with the tax, and median income, which determines the rate at which the pivotal group of voters lose earnings when the tax is raised. The marginal cost depends upon the aggregate labor-supply elasticity, which is the only source of deadweight loss. In this setting, countries with greater inequality (defined by the distance of median to mean income) will tax more.
One useful purpose of a benchmark model is to clarify what specific assump-tions imply a certain result and so help organize thinking about whether those assumptions actually apply or need to be modified. For example, it is highly debatable whether this benchmark model is a useful starting point for thinking about the size of government in the United States. With median household income around $50,000 and mean income around $70,000, a model driven by taxation-for-redistribution and a median voter suggests that US tax revenue should be one of the highest relative to GDP among the high-income countries, rather than one of the smallest. Thus, while the redistributive motive for taxa-tion might still matter, it seems that a more sophisticated approach is needed for understanding the effects of this motive.
Timothy Besley and Torsten Persson 109
Applied to developing countries, the central assumptions of the Meltzer and Richards (1981) framework appear even more problematic. First, policy making may not reflect the interest of a median voter, not least because many low-income coun-tries do not have democratic institutions. Second, characterizing the redistributive motive as transferring resources away from the rich towards the poor and middle class may not do justice to the redistributive politics of many developing countries; for example, transfers may instead be directed at key political constituencies, who often are not at the lowest income levels. Third, leaving out nonredistributive motives for taxation—especially priorities for building infrastructure and spending on education, health care, and social security—may distort the picture. Fourth, as noted earlier, the income-tax base is relatively less important than in developed countries. Fifth, the margin of activity for tax avoidance and evasion are key factors for developing coun-tries. In the following sections, we show how consideration of these five issues provides a way of understanding why taxation is so low in developing countries.
The motive for holding power extends far beyond the ability to determine taxes. Moreover, in situations where the ruling group is less constrained by checks and balances, the range of ways it may enrich itself or its cronies can be vast. Indeed, the type of politics conducted in advanced countries based on tax-funded redistribu-tive programs are much less destructive than the forms of government intervention that are typical in low-tax environments. The fact that protection of property rights is positively correlated with taxation, and the level of corruption is negatively corre-lated with taxation, is indicative of this. The genius of fiscal redistribution is the way in which it encourages a relatively open process where the rule of law is imposed and policies do not apply selectively or arbitrarily.
Finally, the Meltzer and Richards (1981) framework is inherently static, taking as given the structure of taxation and the level of economic development. Schumpeter’s (1918) view of taxation, mentioned at the start, instead emphasizes how the nature of taxation is embedded in—and interacting with—economic, polit-ical, and cultural institutions. We turn next to a discussion of these institutions.
Economic Structure
Low-income countries typically have a large informal sector and many small-scale firms. They are also more likely to be dependent on a few natural resources or commodities and to receive foreign aid. This constellation of factors often pushes low-income countries toward a lower level of tax collections and a narrower tax base.
Informal and Small-Scale FirmsThe large informal sectors in poor economies are inherently hard to tax
(La Porta and Shleifer 2014, in this journal, discuss the desire to avoid taxes as an important motive for informality). Consider the preponderance of small-scale informal firms, such as street vendors or village shops, found through the
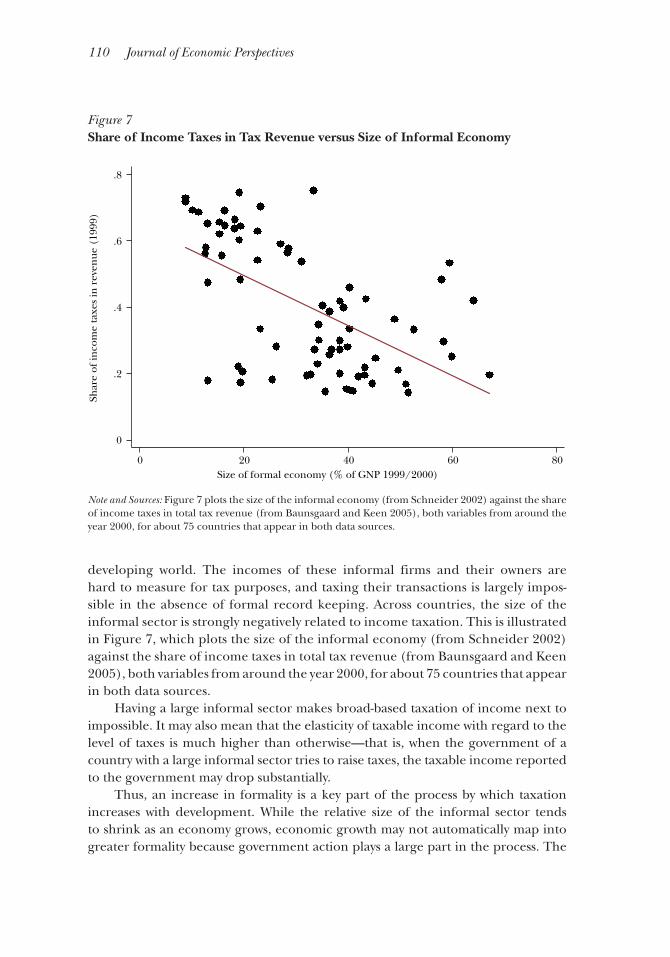
110 Journal of Economic Perspectives
developing world. The incomes of these informal firms and their owners are hard to measure for tax purposes, and taxing their transactions is largely impos-sible in the absence of formal record keeping. Across countries, the size of the informal sector is strongly negatively related to income taxation. This is illustrated in Figure 7, which plots the size of the informal economy (from Schneider 2002) against the share of income taxes in total tax revenue (from Baunsgaard and Keen 2005), both variables from around the year 2000, for about 75 countries that appear in both data sources.
Having a large informal sector makes broad-based taxation of income next to impossible. It may also mean that the elasticity of taxable income with regard to the level of taxes is much higher than otherwise—that is, when the government of a country with a large informal sector tries to raise taxes, the taxable income reported to the government may drop substantially.
Thus, an increase in formality is a key part of the process by which taxation increases with development. While the relative size of the informal sector tends to shrink as an economy grows, economic growth may not automatically map into greater formality because government action plays a large part in the process. The
Figure 7 Share of Income Taxes in Tax Revenue versus Size of Informal Economy
Note and Sources: Figure 7 plots the size of the informal economy (from Schneider 2002) against the share of income taxes in total tax revenue (from Baunsgaard and Keen 2005), both variables from around the year 2000, for about 75 countries that appear in both data sources.
0
.2
.4
.6
.8
Shar
e of
inco
me
taxe
s in
rev
enue
(19
99)
0 20 40 60 80Size of formal economy (% of GNP 1999/2000)
Why Do Developing Countries Tax So Little? 111
gradual construction of a functioning legal system makes it more attractive for firms to operate in the daylight of the formal economy, and if they wish utilize the benefits of the formal legal system, they cannot also remain invisible for tax purposes. In addition, the creation of credit and land registries to improve property-rights and contract enforcement may bring economic activity into the purview of tax authori-ties. This is particularly clear in the case of cadastral surveys (showing ownership and value of land), which typically began with tax purposes in mind. For example, the modern Swedish cadastral survey goes back to 1530, when it was introduced by King Gustav Vasa for the purposes of taxation. Scott (1998) emphasizes the impor-tance of mapping land ownership in the history of European taxation.
Informal firms tend to be small: it is hard to take advantage of scale economies, to export and become multiplant—or eventually multinational—without relying on the formal legal system. Formal firms can be the basis for raising tax revenue because these firms operate on formal financial markets—they have bank accounts or outside investors who demand transparent accounting—and because tax authori-ties can use them to collect taxes from employees through income withholding. As Kleven, Kreiner, and Saez (2009) emphasize, income withholding also facilitates cross-checking of tax records between individuals and firms.
Aid and Resource DependenceIn the standard framework for tax determination, the government is solely
responsible for financing of its spending needs. Another reason why the tax take is low in poor countries is that many countries receive significant aid flows, which are a significant fraction of GDP and often larger than domestically generated tax revenues. Moreover aid flows to the poorest countries of the world are large. For example, according to the World Development Indicators, the average share of aid in gross national income in a sample of low-income countries from 1962 to 2006 was around 10 percent. Availability of aid diminishes the incentive to take actions that would increase the domestic revenue base.
This argument is strengthened further in countries with endowments of easy-to-tax natural resources where taxation can use royalty payments. Around a quarter of the same sample of low-income countries (as defined in the figures above) have, in 2000, a share of petroleum exports that is more than 20 percent of GDP. The share of countries with economies heavily dependent on primary prod-ucts is greater still.
Taxes from broad-based sources such as the value-added tax and income taxes will be lower where there is a greater access to other forms of revenue. In support of this idea, Jensen (2011) finds that a 1 percent increase in the share of natural resource rents in total government income is associated with a 1.4 percent lower share of taxation in GDP. While we do not know of research that convincingly demonstrates this conclusion, it is entirely possible that high foreign aid inflows and abundant natural resources have similar consequences, reducing the incentive to generate taxation from domestic sources. As an integral part of IMF stabilization
112 Journal of Economic Perspectives
programs, the IMF Fiscal Affairs Department actively encourages governments to invest in legal and record-keeping steps that can help to build fiscal capacity. If aid dependence does indeed reduce domestically generated taxation, then the actions of the IMF could be viewed as second-best policy that counters some of the negative consequences of its aid.
Failure to Take Government ActionTaken together, these economic factors suggest reasons why poor countries
have a smaller share of revenue in GDP: the combination of an informal economic structure, income from natural resources or specific commodities, and the avail-ability of aid (for some countries) pushes many low-income countries into a situation of a low tax/GDP ratio levied on a narrow tax base and a narrow set of individuals. As economies grow, governments face the political challenge of restructuring and expanding tax bases.
Even though economic growth is important in widening the tax net and increasing the tax base, it does not mechanically translate into a higher tax take. For example, Piketty and Qian (2009) argue that increasing exemptions have led income-tax revenues in India to stagnate at around 0.5 percent of GDP since 1986. Widening the scope of taxation to broad bases, like income and value added, require conscious decisions to collect revenues and to modify the tax system to reflect developments in the wider economy. In China, tax revenues—especially at the central level of government—declined between 1978 and 1994, because govern-ment revenues had been dependent on funds generated in the state-owned sector, which was shrinking in relative size. However, China’s tax revenues then increased since the major tax reform in 1994 (for example, World Bank 2012, Ch. 3).
To take advantage of growth and economic development requires the govern-ment to invest in improvements in the tax system. Figure 1 gave an example of a major fiscal innovation, the introduction of withholding of taxes from pay. This step requires a change a government policy along with a determination to ensure compli-ance. Without such measures, income-tax revenues may not increase significantly with development. Increasing the breadth of the sales-tax base or even introducing a value-added tax to widen the tax base also require direct policy change and are not an automatic by-product of economic growth.
That being said, structural change and the greater use of formal markets and formal firms reduce the costs of making such investments. Economic develop-ment yields a prospective tax-revenue dividend, as more economic activity becomes taxable in practical terms. But whether this change will actually generate more tax revenue also depends on government decisions. These decisions reflect the political institutions in place, to which we turn next.
Some structural change can also lead to losses of government revenues. Govern-ments that try to control inflation lose access to seigniorage. Attempts to deregulate or privatize the economy may also lower implicit taxes that were previously avail-able to the government, especially if the determination of wages and prices are
Timothy Besley and Torsten Persson 113
liberalized. This has been a particular issue for countries that are moving away from socialist towards market economies. Thus, China has yet to move towards a modern tax system using sales and to stop using the leasing of land as a means of raising state revenue. When transitions are accompanied by economic growth, such issues can be masked for some time. Ultimately, however, conscious reform is needed to build an effective tax system.
Political Institutions
On the surface, it seems obvious that low-income countries have much larger needs than high-income countries for investments in infrastructure and basic public goods and services. Indeed, the international aid movement since World War II is premised on this belief. Moreover, the World Bank and regional development banks exist in large measure to provide resources to developing countries to invest in public programs. As a corollary, the motive for raising tax revenues to fund basic services should, in theory at least, be extremely powerful in developing countries.
But whether revenues raised are channeled towards the highest needs depends upon the political equilibrium. In turn, this depends on how the political institu-tions in place determine the identity of the ruling group that decides on policy and the constraints faced by rulers once power has been acquired. The question of who has political control directly affects decisions about the level and type of taxa-tion, and is based on political costs and benefits as perceived by incumbent groups. Additionally, politics influences how the proceeds of taxation are distributed, which feeds back to affect the political support for higher taxes.
Low Contestability of PowerWhile one should be wary of generalizations, political control by a wealthy
elite is a fact in many low-income countries. These elites are protected by a variety of institutional mechanisms, including hereditary successions of power, military governments, and elite control of political parties. With such incumbent groups, policy will tend to cater to those with above-median incomes, reducing the motive for progressive taxation. Control of government by elite groups will also affect the use to which revenues are put. If contests for power become more open, we would expect the demand for redistributive progressive taxation to increase, as suggested by the Meltzer–Richards (1981) framework and the empirical evidence in Husted and Kenny (1997). According to Acemoglu and Robinson (2006), historical reforms to widen the voting franchise often reflected the fears of rich ruling elites that they would otherwise bear the economic cost of revolution.
The benchmark Meltzer–Richards (1981) model assumes that the proceeds of taxation are equally shared. However, redistribution can be selective in many ways. For example, spending on tertiary education tends to favor elites and their families, while basic health services are more likely to help the poor. To the extent that rich
114 Journal of Economic Perspectives
ruling elites prefer private alternatives, the demand for using the fiscal system to redistribute is diminished. In those circumstances, we expect elite control to favor less public spending.
Weak Checks and BalancesChecks and balances on incumbent groups can help create a preference for
more common-interest spending. A strong legislature will often find the need to generate broad-based coalitions, which can offset the narrow focus of the execu-tive. An independent judiciary can also promote broad-based access to public services through statutory-service obligations or rights-based arguments and rulings. However, many low-income countries have contests for power that are highly restricted, with limits on who can vote as well as who can run for office. Low-income countries also tend to have weaker checks and balances on the execu-tive. For example, according to the often-used Polity IV database, only 7 percent of the countries with the lowest one-third of per capita GDP had the strongest score (on a scale from 1 to 7) for the extent to which political institutions imposed execu-tive constraints in 2000, compared to around 40 percent amongst countries ranked in the upper two-thirds by per capita GDP.
Whatever benefit–cost case economists can make for investing in broad-based spending programs like infrastructure, health, and education, in many low-income countries there is little problem identifying the need for such public programs; the problem comes in delivering them. Problems of service delivery reflect the twin problems of inefficiency and corruption. The broad macro fact is that coun-tries with strong executive constraints at the national level tend to have lower levels of corruption. Of course, such correlations may not have a fully persuasive causal interpretation, but the logic supporting them is straightforward. Checks and balances should provide a stronger basis for scrutinizing public spending decisions and initiating systems of auditing that are essential for eliminating corruption. Therefore, it is perhaps not so surprising to find a strong positive correlation between less corruption and the level of taxation, as already shown in Table 1 and as further illustrated in Figure 8 (keep in mind, a higher Corruption Perception Index corresponds to less perceived corruption). This correlation is partly due to the fact that corrupt systems of government are likely to face greater resistance to increasing the power to tax. However, it also reflects the common determinants of state effectiveness in multiple dimensions—what, in Besley and Person (2011), we refer to as development clusters. Different capacities of the state coevolve both because state competence increases in general and because of common underlying determinants, including institutions.
A growing number of microeconomic studies have looked at whether stronger monitoring may reduce corruption and improve service delivery in low-income countries. The results are mixed. Among these studies, Olken (2007) presents evidence from a randomized field experiment on approaches to reducing corrup-tion in more than 600 road projects in Indonesia with systematic discrepancies
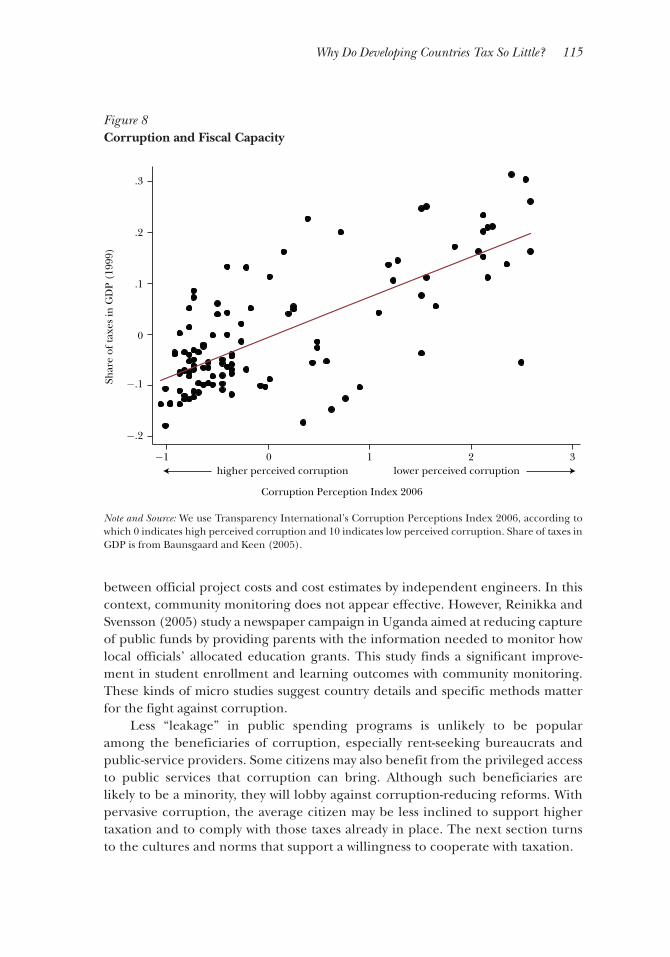
Why Do Developing Countries Tax So Little? 115
between official project costs and cost estimates by independent engineers. In this context, community monitoring does not appear effective. However, Reinikka and Svensson (2005) study a newspaper campaign in Uganda aimed at reducing capture of public funds by providing parents with the information needed to monitor how local officials’ allocated education grants. This study finds a significant improve-ment in student enrollment and learning outcomes with community monitoring. These kinds of micro studies suggest country details and specific methods matter for the fight against corruption.
Less “leakage” in public spending programs is unlikely to be popular among the beneficiaries of corruption, especially rent-seeking bureaucrats and public-service providers. Some citizens may also benefit from the privileged access to public services that corruption can bring. Although such beneficiaries are likely to be a minority, they will lobby against corruption-reducing reforms. With pervasive corruption, the average citizen may be less inclined to support higher taxation and to comply with those taxes already in place. The next section turns to the cultures and norms that support a willingness to cooperate with taxation.
Figure 8 Corruption and Fiscal Capacity
Note and Source: We use Transparency International’s Corruption Perceptions Index 2006, according to which 0 indicates high perceived corruption and 10 indicates low perceived corruption. Share of taxes in GDP is from Baunsgaard and Keen (2005).
−.2
−.1
0
.1
.2
.3
Shar
e of
taxe
s in
GD
P (1
999)
−1 0 1 2 3higher perceived corruption
Corruption Perception Index 2006
lower perceived corruption
116 Journal of Economic Perspectives
Culture, Norms, and Identity
Intrinsic motives to pay taxes and to follow the law are also important deter-minants for tax compliance, in addition to the material costs and benefits of tax compliance emphasized by economists since the seminal paper by Allingham and Sandmo (1972). A variety of authors in different social sciences have discussed the ethics of tax-paying in various terms: for example, Gordon (1989) refers to indi-vidual morality, Cowell (1990) to stigma, Erard and Feinstein (1994) to feelings of guilt and shame, Posner (2000) to tax-compliance norms, and Torgler (2007) to tax morale. (In this symposium, the paper by Luttmer and Singhal focuses on these tax-morale issues.) What unites these approaches is an argument that creating a culture of compliance may be central to raising revenue. Thus, one reason why low-income countries have lower levels of taxation may be a weaker ethic of tax-paying than the one that has evolved in high-income countries. The absence of a strong compliance norm means that any given statutory level of taxation will raise less revenue than would otherwise be expected.
However, there is little consensus on these ideas and their empirical importance, especially in the context of low-income countries. For example, high corruption or the perception that a tax system is unfair may hinder the emergence of a norm of compliance—but then the underlying problem is the corruption and unfairness, not the social norm as such. One interesting implication is that norms can intro-duce strategic complementarities in individual compliance decisions as they become established. There could even be tipping points in compliance if the emergence of a norm depends on believing that paying taxes is a virtuous act. Such multiplier effects may result in big returns to investments in an improved legal code, greater impor-tance of formal firms, tax monitoring, property registries, and the like.
But to evaluate such possibilities properly requires more research on the interac-tions between individual material motives and social motives for paying taxes, which have so far been studied separately almost without exception. To make empirical progress on the importance of social norms for tax compliance also requires devel-oping models with clear predictions—especially on interactions between individual and social motives to pay taxes—that can be taken to the data.
Benabou and Tirole (2011) provide a useful starting point by providing a general model where social motives tied to norms—emanating from a desire to acquire a social reputation—can alternatively strengthen (crowd in) or weaken (crowd out) stronger individual motives tied to laws. In Besley, Jensen, and Persson (2014), we consider a dynamic extension of that model and apply it empirically to compliance with local property taxes in the United Kingdom. Exploiting natural experiments both at the aggregate and local levels, we find evidence for consider-able persistence in the social norms for tax compliance, as well as for significant interactions between individual incentives and social norms.
Tax-compliance norms may also emerge in part from a strengthened sense of national identity. Many weak states also exhibit a weak sense of national identity
Timothy Besley and Torsten Persson 117
among their citizens. This is one way of understanding the classic Hintze (1906) and Tilly (1990) argument linking war and taxation discussed above. It is also consistent with a positive correlation in the data between tax revenue and years spent in war. Figure 1 also showed a marked increase in taxation around the time of the two world wars that was not reversed after the war. In some countries, it has been argued that conducting war has been a source of common interests, both in terms of persuading citizens of the need for higher taxation and in establishing a norm of taxpaying (for example, Feldman and Slemrod 2009). If norms of tax compliance are indeed persistent, the revenue effects may last long after the war has ended. The patterns in Figure 1 suggest a persistent rather than a transitory effect of the two world wars.
A similar argument also applies to the negative correlation between ethnic frac-tionalization and tax revenue. This mirrors the well-known argument that country borders contrived by colonial powers in Africa created ethnically fragmented poli-ties with detrimental developmental consequences (for example, Easterly and Levine 1997). But fragmentation is unlikely to be given and immutable, so the ques-tion relevant for policy is what factors might alter ethnic identification over time. As Bates (1974) argued, the creation of independent post-colonial states in Africa drove stronger identification with pre-existing ethnic groups to compete for the spoils of state patronage. When ethnic tensions are strong enough to promote civil war, such war—in contrast to wars between nation states—could increase animosity between groups and reduce national identity.
State Building
For low-income countries, extending the scope for taxation is a dynamic process that requires forward-looking investments in institutions. Governments make decisions about what tax bases to operate and what administrative and compliance structures to put in place. One good example is the decision to introduce direct withholding from pay, which is central to broad-based income taxation (as illustrated earlier in Figure 1). Another good example would be the resources spent on organization and training in tax authorities. Because these choices have long-term consequences, in Besley and Persson (2009, 2011), we refer to them as fiscal-capacity investments.
In this dynamic view, current decisions to introduce or modify tax systems affect the level of taxation in the future. An investment that reduces the leakage from income taxes due to base-broadening will both yield higher tax revenue in the future and change the incentives for future governments to raise revenues from the income tax. This insight suggests that one can think of investments in fiscal capacity as (partly) strategic and forward looking.
Taxation and Weak StatesTaxation has played a central role in the development of states. Throughout
history, struggles over revenue have been at the heart of state power. One of the
118 Journal of Economic Perspectives
founding documents of modern constitutional governments, the 1215 Magna Carta in England, had the authority to raise tax at its very core. It enabled the state of that time to move towards a centralized system of tax setting, in which Parliament had a role. Historical accounts of development of the fiscal state in France (such as Dincecco 2011) argue that centralization of tax-setting power was a more recent phenomenon. On this view, taxation is a key aspect of the coercive power of the state. As such, it is intimately linked to establishing law and order within a territory.
States that fail to raise significant revenues in GDP also commonly fail to protect property rights effectively (as illustrated earlier in Table 1). Taxation is a rule-based form of revenue extraction that suits a market economy. Market relations become the base of revenue generation. Hence, any government that desires to tax will also have an incentive to build those institutions that support formal markets. For example, building a formal financial system will create the basis for more effec-tive taxation of firms and individuals. Because the establishment of the rule of law helps improve the functioning of markets, the building of fiscal capacity is tied in a complementary way to building state effectiveness along other dimensions.
In the end, taxation is therefore not just about building the coercive power of the state but changing the way in which that coercion is channeled. Expropriation and other more damaging forms of extraction by the state are replaced by the more benign case of rules-based taxation.
But the tax/GDP ratio in modern high-income countries is high for reasons that go beyond coercion. In these countries, government faces a number of legal and practical constraints—including a real possibility of being voted out of office. Economic institutions, political institutions, and social and cultural norms have all evolved in a way that supports a broad tax base and a reasonable degree of tax compliance. The demand for accountable and transparent government is fueled by citizens who are aware of the need to ensure that tax revenues are wisely spent.
For modern low-income countries, the problem of raising more tax reve-nues is ultimately a wider issue than having the right kind of technical expertise. Government institutions and tax systems evolve together, and taxation may feed back to the development of political systems (as argued for example, by Levi 1988). Weak and unaccountable states are unlikely to have strong motives to build fiscal capacity, and their citizens are unlikely to evolve strong norms of compli-ance. This is a classic problem of positive feedbacks, which can yield good and bad equilibrium paths.
What Sequence for State-BuildingMany organizations offer technical assistance to countries that wish to improve
the operation of their tax authorities. Some aspects of policy may soon be informed by evidence based on randomized interventions. For example, Khan, Khwaja, and Olken (2014) work with the property-tax department in Punjab, Pakistan, to assign property-tax units into one of three performance-pay schemes or a control group. They find that incentivized units display average revenue growth 9 percent
Why Do Developing Countries Tax So Little? 119
higher than the control group. As with much evidence generated from randomized control trials, a key issue is whether governments are willing to change in the wake of empirical evidence.
Ultimately the most striking observation is the basic fact, stressed at the begin-ning of this paper, that developing countries today are not so different—in terms of the tax share in GDP, and the structure of taxation—from modern high-income countries at a similar stage of development. This pattern suggests that low taxation may reflect a range of factors that also help to explain why low-taxing countries are poor. From this perspective, the most important challenge is taking steps that encourage development, rather than special measures focused exclusively on improving the tax system.
References
Acemoglu Daron, and James Robinson. 2006. Economic Origins of Dictatorship and Democracy. Cambridge University Press.
Allingham, Michael G., and Agnar Sandmo. 1972. “Income Tax Evasion: A Theoretical Anal-ysis.” Journal of Public Economics 1(3–4): 323–38.
Bates, Robert H. 1974. “Ethnic Competition and Modernization in Contemporary Africa.” Comparative Political Studies 6(4): 457–84.
Baunsgaard, Thomas, and Michael Keen. 2005. “Tax Revenue and (or?) Trade Liberalization.” Mimeo, IMF.
Benabou, Roland, and Jean Tirole. 2011. “Laws and Norms.” NBER Working Paper 17579.
Besley, Timothy, Anders Jensen, and Torsten Persson. 2014. “Norms, Enforcement and Tax Evasion.” http://people.su.se/~tpers/papers /Draft_140302.pdf.
Besley, Timothy, and Torsten Persson. 2009. “The Origins of State Capacity: Property Rights, Taxation, and Policy.” American Economic Review 99(4): 1218–44.
Besley, Timothy, and Torsten Persson. 2011. Pillars of Prosperity: The Political Economics of Develop-ment Clusters. Princeton University Press.
Bräutigam, Deborah A., Odd-Helge Fjeldstad, and Mick Moore, eds. 2008. Taxation and State-Building in Developing Countries: Capacity and Consent. Cambridge University Press.
Cowell, Frank Alan. 1990. Cheating the
Government: The Economics of Evasion. Cambridge, MA: MIT Press.
Dincecco, Mark. 2011. Political Transformations and Public Finances: Europe, 1650–1913. Cambridge University Press.
Easterly, William, and Ross Levine. 1997. “Africa’s Growth Tragedy: Policies and Ethnic Divisions.” Quarterly Journal of Economics 112(4): 1203–50.
Erard, Brian, and Jonathan Feinstein. 1994. “The Role of Moral Sentiments and Audit Perceptions on Tax Compliance.” Public Finance 49(Special Issue on Public Finance and Irregular Activities): 70–89.
Fearon, James D. 2003. “Ethnic and Cultural Diversity by Country.” Journal of Economic Growth 8(2): 195–222.
Feldman, Naomi E., and Joel Slemrod. 2009. “War and Taxation: When Does Patriotism Over-come the Free-Rider Impulse?” Chap. 8 in The New Fiscal Sociology: Taxation in Comparative and Historical Perspective, edited by I. W. Martin, A. K. Mehrotra, and M. Prasad. Cambridge University Press.
Gordon, James P. F. 1989. “Individual Morality and Reputation Costs as Deterrents to Tax Evasion.” European Economic Review 33(4): 797–804.
Gordon, Roger, and Young Lee. 2005. “Tax Structure and Economic Growth.” Journal of Public Economics 89(5–6): 1027–43.
120 Journal of Economic Perspectives
Hintze, Otto. 1906. “Military Organization and the Organization of the State.” (Reprinted in 1970 as chap. 5 in The Historical Essays of Otto Hintze, edited by Felix Gilbert. New York: Oxford University Press.)
Husted, Thomas A., and Lawrence W. Kenny. 1997. “The Effect of the Expansion of the Voting Franchise on the Size of Government.” Journal of Political Economy 105(1): 54–81.
Jensen, Anders. 2011. “State-Building in Resource-Rich Economies.” Atlantic Journal of Economics 39(2): 171–93.
Khan, Adnan Q., Asim I. Khwaja, and Benjamin A. Olken. 2014. “Tax Farming Redux: Experimental Evidence on Performance Pay for Tax Collectors.” http://economics.mit.edu/files/9646.
Kleven, Henrik, Claus Thustrup Kreiner, and Emmanuel Saez. 2009. “Why Can Modern Governments Tax So Much? An Agency Model of Firms as Fiscal Intermediaries.” NBER Working Paper 15218.
La Porta, Rafael, and Andrei Shleifer. 2014. “Informality and Development.” Journal of Economic Perspectives 28(3): 109–26.
Levi, Margaret. 1988. Of Rule and Revenue. Berkeley: University of California Press.
Maddison, Angus. 2001. The World Economy: A Millennial Perspective. Paris: Organization for Economic Co-operation and Development.
Mitchell, Brian R. 2007. International Historical Statistics: Volume 1: Africa, Asia and Oceania 1750–2005; Volume 2: The Americas, 1750–2005; Volume 3: Europe, 1750–2005, Palgrave Macmillan.
Meltzer, Alan, and Scott Richards. 1981. “A Rational Theory of the Size of Government.” Journal of Political Economy 89(5): 914–27.
Olken, Benjamin A. 2007. “Monitoring Corruption: Evidence from a Field Experiment in Indonesia.” Journal of Political Economy 115(2): 200–249.
Olken, Benjamin A. and Monica Singhal. 2011. “Informal Taxation.” American Economic Journal: Applied Economics 3(4): 1–28.
Piketty, Thomas, and Nancy Qian. 2009. “Income Inequality and Progressive Income Taxa-tion in China and India, 1986–2015.” American Economic Journal: Applied Economics 1(2): 53–63.
Posner, Eric A. 2000. “Law and Social Norms: The Case of Tax Compliance.” Virginia Law Review 86(8, Symposium on the Legal Construction of Norms): 1781–1819.
Reinikka, Ritva, and Jakob Svensson. 2005. “Fighting Corruption to Improve Schooling: Evidence from a Newspaper Campaign in Uganda.” Journal of the European Economic Associa-tion 3(2–3): 259–67.
Roberts, Kevin W. S. 1977. “Voting over Income Tax Schedules.” Journal of Public Economics 8(3): 329–40.
Romer, Thomas. 1975. “Individual Welfare, Majority Voting and the Properties of the Linear Income Tax.” Journal of Public Economics 4(2): 163–68.
Schneider, Friedrich. 2002. “Size and Measure-ment of the Informal Economy in 110 Countries around the World.” Unpublished paper.
Schumpeter, Joseph A. 1918. “The Crisis of the Tax State.” In International Economic Papers, vol. 4, pp. 5–38.
Scott, James C. 1998. Seeing Like a State: How Certain Schemes to Improve the Human Condition Have Failed. Yale University Press.
Tilly, Charles. 1990. Coercion, Capital and European States, AD 990–1992. Oxford: Blackwell.
Torgler, Benno. 2007. Tax Morale and Tax Compliance: A Theoretical and Empirical Analysis. Cheltenham, UK: Edward Elgar.
World Bank. 2012. China 2030: Building a Modern, Harmonious, and Creative Society. Washington, DC: World Bank.
Journal of Economic Perspectives—Volume 28, Number 4—Fall 2014—Pages 121–148
G lobalization is making it increasingly easy for corporations to shift profits to low-tax countries. Modern technology has also made it simpler for wealthy individuals to move funds to undeclared bank accounts in offshore tax
havens. Both issues have featured prominently in the news and global economic debates since the financial crisis, but the arguments tend to be based on relatively little empirical evidence.
Measuring the costs of tax havens to foreign governments is fraught with difficulties. However, balance of payments data and corporate filings show that US companies are shifting profits to Bermuda, Luxembourg, and similar countries on a large and growing scale. About 20 percent of all US corporate profits are now booked in such havens, a tenfold increase since the 1980s. This profit-shifting is typically done within the letter of the law and thus would be best described as tax avoidance rather than fraud. I attempt to quantify its cost for government coffers by taking a fresh look at the most recent macroeconomic evidence and combining it in a systematic manner. Over the last 15 years, the effective corporate tax rate of US companies has declined from 30 to 20 percent, and about two-thirds of this decline can be attributed to increased profit-shifting to low-tax jurisdictions.
Wealthy individuals, too, use tax havens, sometimes legally—to benefit from banking services not available in their home country—and sometimes illegally—to evade taxes. A number of changes have sought, with some success, to curb that form of tax evasion over the last years. Yet the available evidence from Switzerland and
Taxing across Borders: Tracking Personal Wealth and Corporate Profits†
■ Gabriel Zucman is Assistant Professor, London School of Economics, London, United Kingdom. During the 2013–14 year, he was a Postdoctoral Scholar, University of California at Berkeley, Berkeley, California. His email address is [email protected].† To access the online Appendix and Data Appendix, visithttp://dx.doi.org/10.1257/jep.28.4.121 doi=10.1257/jep.28.4.121
Gabriel Zucman
122 Journal of Economic Perspectives
Luxembourg, as well as systematic anomalies in the international investment data of countries, show that offshore personal wealth is growing fast and that the bulk of it seems to be evading taxes.
To improve tax enforcement in the global economy of the 21st century, I make the case for a world financial registry. Such a registry would make it possible to both fix the loopholes of the corporate tax and make personal tax evasion much more difficult. I also discuss how some key challenges could, in the meantime, be addressed by reforms involving little to no international cooperation.
Multinational Corporations, Profit-Shifting, and Tax Avoidance
The corporate income tax is a key component of the tax systems of developed countries because it is one of the primary ways of taxing capital. In the United States, about one-third of total tax revenues at all levels of government came from capital taxes in 2013. Close to 30 percent of these taxes came from the corporate income tax ($350 billion), while the rest is accounted for by property taxes ($450 billion) and taxes on personal capital income and estates ($450 billion).1 In Europe, the average capital share of government tax revenues is 20 percent, which is less than in the United States because consumption taxes play a larger role; but like the United States, Europe’s corporate tax accounts for about one-third of its capital taxes (Eurostat 2014). Yet despite its important role, the practicality and enforceability of the corporate income tax is seriously challenged by globalization, and if the current trends are sustained it could well become relatively much less important in the next two or three decades.
The Three Pillars of International TaxationIn most high-income countries, the corporate income tax was born just before
or during World War I at about the same time as the personal income tax (Ardant 1972). That correspondence of timing is not a coincidence. Absent corporate taxes, personal taxation could be dodged or greatly postponed by people who would incorporate and shareholders who would keep their income within companies. The easiest way to prevent that scenario is to tax profits directly at the corporate level. The corporate tax is thus fundamentally a backstop, although it has also come to serve other purposes over time (as Bank 2010 shows in the US case). When corporate profits are paid out, the tax authorities recognize that shareholders have already been subject to corporate taxation and thus typically tax income from this source at a lower rate than earned income. In the United States, for instance, the
1 These round-number figures are calendar year estimates that I computed using data from the Census Bureau, the Bureau of Economic Analysis, the Office of Management and Budget, and the OECD. The $350 billion corporate tax total includes state taxes ($53.6 billion) and the federal corporate tax ($273.5 billion based on estimates for the fiscal year that ended on September 2013, about $300 billion on a calendar year basis). See the online Appendix to this article for complete methodological details.
Gabriel Zucman 123
top federal income tax rate on capital gains and dividends paid by domestic and qualified foreign corporations is 20 percent, compared to 39.6 percent for ordinary income in 2013. In fact, the recognition that corporate profits are taxed twice was one of the key arguments put forward for reducing dividend taxation in 2003.2 The 2003 dividend tax cut was originally set to expire in 2009 but has now been made permanent (Yagan 2014). In a similar vein, in Canada, Australia, and Mexico, when profits are paid out to shareholders as dividends, all corporate taxes previ-ously withheld are credited against the amount of personal income tax owed. Until recently, many European countries had a similar imputation system. However, most of them now have adopted an approach similar to that of the United States: France stopped crediting corporate taxes in 2005, as did Germany in 2001 (for details of how high-income countries have taxed corporate profits since 1981, see OECD 2013a, table C-II-4).
Corporate taxation is relatively straightforward in a closed economy, but it becomes more complicated when companies operate in different countries. US citizens are required to pay US taxes on all income, wherever it comes from. Because the corporate tax is essentially a prepayment for the personal income tax, US-owned corporations should also pay taxes on all their profits, whether they originate from US operations or abroad. But what is to be done when two countries seek to tax the same profits? In the 1920s, concerned with such double taxation, the League of Nations asked four economists to think about how best to avoid it (Bruins, Einaudi, Seligman, and Stamp 1923). They articulated three principles, which since then have been the pillars of international taxation.
First, the corporate tax is to be paid to the source country’s government. If a US person owns a Brazilian coffee producer—call it Coffee Rio—then Brazil ought to levy the tax. In formulating that rule, the League of Nations group was heavily influenced by the tax laws of 19th-century Europe, when different sources of income—wages, rents, dividends, and so on—were all subject to what were known as different “schedular” taxes. To many economists back in the 1920s, corporate profits were just another type of income to which a tax was attached, and the ulti-mate bearer of the tax burden did not matter much.
Source-based taxation works fine when a corporation owns a branch in another country that does all of its production and sales in that country. But imagine that Coffee Rio is the subsidiary of Coffee America, a US company whose activity involves importing and distributing Coffee Rio’s products in the United States. Where do Coffee America’s profits come from, the United States or Brazil? Here the League of Nations experts in the 1920s came up with a second principle known as “arm’s length pricing.” Both entities must compute their own profits separately, as if they were unrelated. Thus, Coffee Rio must compute its profits as if it sold its coffee at
2 For example, here’s a comment from President George W. Bush (2003): “The IRS taxes a company on its profit. Then it taxes the investors who receive the profits as dividends. The result of this double taxation is that for all the profit a company earns, shareholders who receive dividends keep as little as 40 cents on the dollar. Double taxation is bad for our economy. Double taxation is wrong.”
124 Journal of Economic Perspectives
the world market price, and the American parent must compute its profits as if it purchased the products of Coffee Rio at the market price for coffee. For decades, arm’s length pricing is how the profits of multinationals have been allocated across countries.
Third, the League of Nations group decided that international tax issues ought to be addressed not by a multilateral, global agreement, but at the bilateral level. As a result, since the 1920s countries have signed thousands of bilateral “double-tax treaties” that follow the general League of Nations guidelines of source-based taxation and arm’s length pricing, but differ in a myriad of specific ways. While international trade has been governed by a multilateral agreement since 1947—the General Agreement on Tariffs and Trade (GATT)—to date no such multilateral treaty exists for corporate taxes.
The League of Nations experts foresaw many of the deficiencies of their plan. British economists were particularly skeptical (for a prime example, see Coates 1925). But just as the corporate tax principles were agreed upon in the 1920s, globalization retreated. From the Great Depression to the 1960s, foreign profits accounted for roughly 5 percent of total US corporate profits, as shown in Figure 1. So for almost half a century, the decisions of the League of Nations experts turned out to be mostly inconsequential, applying only to this low percentage of corporate profits.
The situation started changing in the 1970s, but slowly. It is only in the 21st century that a surge in international investments brought the problems to the frontlines. Globalization is back on a broader scale than in the late 19th and early 20th century, and the choices made by the League of Nations are coming back to haunt the tax authorities.
Treaty Shopping and Transfer PricingEach of the three core principles for international taxation of corporate earn-
ings agreed upon in the 1920s—source-based taxation, arm’s length pricing, and bilateral agreements—raises its own issues.
First, the choice of thousands of bilateral treaties over a multilateral agreement has created a web of inconsistent rules. Multinationals firms can exploit these incon-sistencies to avoid taxes by carefully choosing the location of their affiliates—what is known as “treaty shopping.”
One prominent example is Google’s “double Irish Dutch sandwich” strategy, so named because it involves two Irish affiliates and a Dutch shell company squeezed in between. A similar strategy is used by other multinationals; in the case of Google, it was first analyzed by reporter Jesse Drucker (2010) and then by academics (for example, Kleinbard 2011, p. 707–714) and international organizations (for example, IMF 2013). It starts with Google US transferring part of its intangible capital—specifically, its search and advertisement technologies—to “Google Hold-ings,” which is a subsidiary incorporated in Ireland, but for Irish tax purposes, it is a resident of Bermuda (where its “mind and management” are supposedly located). The transfer took place in 2003, a few months before Google’s initial public offering, and at the time presumably generated a taxable income for Google
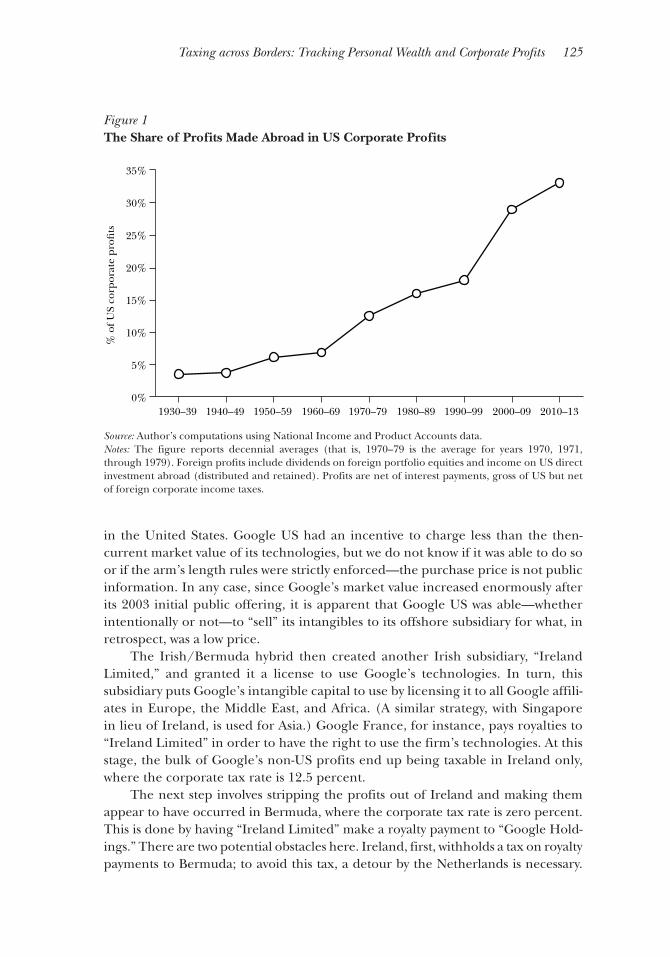
Taxing across Borders: Tracking Personal Wealth and Corporate Profits 125
in the United States. Google US had an incentive to charge less than the then-current market value of its technologies, but we do not know if it was able to do so or if the arm’s length rules were strictly enforced—the purchase price is not public information. In any case, since Google’s market value increased enormously after its 2003 initial public offering, it is apparent that Google US was able—whether intentionally or not—to “sell” its intangibles to its offshore subsidiary for what, in retrospect, was a low price.
The Irish/Bermuda hybrid then created another Irish subsidiary, “Ireland Limited,” and granted it a license to use Google’s technologies. In turn, this subsidiary puts Google’s intangible capital to use by licensing it to all Google affili-ates in Europe, the Middle East, and Africa. (A similar strategy, with Singapore in lieu of Ireland, is used for Asia.) Google France, for instance, pays royalties to “Ireland Limited” in order to have the right to use the firm’s technologies. At this stage, the bulk of Google’s non-US profits end up being taxable in Ireland only, where the corporate tax rate is 12.5 percent.
The next step involves stripping the profits out of Ireland and making them appear to have occurred in Bermuda, where the corporate tax rate is zero percent. This is done by having “Ireland Limited” make a royalty payment to “Google Hold-ings.” There are two potential obstacles here. Ireland, first, withholds a tax on royalty payments to Bermuda; to avoid this tax, a detour by the Netherlands is necessary.
Figure 1 The Share of Profits Made Abroad in US Corporate Profits
Source: Author’s computations using National Income and Product Accounts data.Notes: The figure reports decennial averages (that is, 1970–79 is the average for years 1970, 1971, through 1979). Foreign profits include dividends on foreign portfolio equities and income on US direct investment abroad (distributed and retained). Profits are net of interest payments, gross of US but net of foreign corporate income taxes.
0%
5%
10%
15%
20%
25%
30%
35%
1930–39 1940–49 1950–59 1960–69 1970–79 1980–89 1990–99 2000–09 2010–13
% o
f US
corp
orat
e pr
o�ts
126 Journal of Economic Perspectives
“Ireland Limited” pays royalties to a Dutch shell company (“Google BV”)—which is a tax-free payment because Ireland and the Netherlands are both part of the European Union. The Dutch shell then pays back everything to the Irish/Bermuda holding—tax-free again because to the Dutch tax authorities the holding is Irish, not Bermudian. The second problem is that the United States, like other high-income countries, has a number of anti-avoidance rules—known as “controlled foreign corporations” provisions—designed to immediately tax income such as royalties paid by Ireland Limited to the Irish/Bermuda holding. However, in the US case, these rules can be avoided by choosing to treat “Ireland Limited” and the Dutch shell company as if they were not corporations but divisions of Google Holdings, a move called “checking the box” because that is all that needs to be done on IRS form 8832 to make this work.
The end result is that from the viewpoint of the United States tax authorities, “Ireland Limited” and “Google BV” do not exist, but for Europe they are real. For Ireland, “Google Holdings” is Bermudian but for the United States it is Irish. Playing tax treaties against each other—and in particular exploiting their inconsistent defi-nitions of residency—Google thus generates stateless income, nowhere taxed in the year it is generated (Kleinbard 2011, 2012, 2013). In recent years, according to Google’s company filings, its effective tax rate on foreign profits has ranged from 2 to 8 percent.
In the United States, contrary to what happens in most other OECD countries, when offshore profits are repatriated, they are taxed; the tax is at a corporate income tax rate of 35 percent with a credit for all foreign corporate taxes previously paid. In practice, the incentives to repatriate are weak because funds retained offshore can be used in various ways. One use is to purchase foreign companies—in 2011, Microsoft bought Skype for $8.5 billion, and cross-border mergers and acquisitions have been booming since then. Another use is to secure loans—Apple has issued dozens of billions in bonds to finance a large share buyback program. Yet a more extreme move is for a company to shift its head offices overseas by merging with a foreign corporation, what is known as a “tax inversion”—in 2014, Minnesota-based Medtronic announced plans to buy Dublin-based Covidien and convert into an Irish-domiciled entity. All of this makes it possible for US-owned firms to use their unrepatriated offshore profits without incurring US tax liabilities.
The issues raised by treaty shopping are compounded by the growing ability of multinational firms to choose the location of their profits, and thus exploit treaty inconsistencies, irrespective of where they produce or sell. A popular method to shift profits offshore is the use of intragroup loans, whereby subsidiaries in low-tax countries grant loans to subsidiaries in high-tax countries. Another method—and according to a recent meta-analysis of the literature, the most important one (Heckemeyer and Overesch 2013)—is the manipulation of transfer prices, the prices at which companies exchange goods and services internally.
In principle, intragroups transactions should be conducted at the market price of the goods and services traded, as if the subsidiaries were unrelated. In practice, arm’s length pricing faces severe limitations. In the hypothetical earlier example of
Gabriel Zucman 127
Coffee Rio, imagine that it sells its output to Coffee America at artificially high prices to make the profits appear in Brazil (where the corporate tax rate is 25 percent) rather than in the United States (where the corporate tax rate is 35 percent). With billions of intragroup transactions every year, tax authorities cannot conceivably check that they are all correctly priced. Clausing (2003) finds compelling evidence of transfer mispricing by US firms: controlling for other variables that affect trade prices, US firms appear to export goods and services to their low-tax subsidiaries at relatively low prices, and to import from them at high prices.
More important, in many cases the relevant market prices simply do not exist. What was the fair market value of Google’s technologies when it transferred them to its Bermuda subsidiary in 2003 before Google was even listed as a public company? The issue is growing in importance, as a rising number of international transactions within international divisions of a single company—such as the sale of proprie-tary trademarks, logos, and algorithms—are not replicated between third parties. Indeed, for a number of multinational companies, where the profits derive in part from synergies of being present across the globe, the very notion of arm’s length pricing is conceptually flawed. In this case, there is no clear-cut way to attribute a portion of its income to any particular subsidiary.
The last core problem of today’s international tax environment stems from the rule that profits should primarily be taxed in source countries. Absent that rule, there would be no point in trying to make profits appear as if they were earned in zero-tax Bermuda. Source-based taxation provokes two types of inefficiencies. First, it causes a wasteful expenditure of resources: multinational companies spend billions of dollars in treaty shopping and transfer pricing (the tax department of General Electric employs close to 1,000 individuals), and when tax authorities devote effort to curb avoidance practices, this in turn triggers even bigger corporate expenses. The end result is that non-tax-haven countries have lower tax revenues and welfare (Slemrod and Wilson 2009). Source-based taxation also gives firms incentives to move real activity—factories, headquarters, and workers—to where taxes are low.3 While many analysts worry about the costs of tax competition for real investment, the available evidence suggests that artificial profit-shifting has a much larger effect in reducing corporate income tax payments, and thus the focus on this article is on profit-shifting.
The Revenue Loss Due to Corporate Tax Avoidance by US-Owned FirmsQuantifying the government revenue losses caused by profit-shifting to
lower-tax jurisdictions is fraught with difficulties. A number of attempts, in partic-ular by Sullivan (2004) and Clausing (2009), rely on Bureau of Economic Analysis data on US multinational firm operations. Here, I take a different approach by
3 Ironically, in a pure source-based tax environment, artificial profit-shifting and tax competition for real investments cannot be fought simultaneously. Every time the tax authorities attempt to limit shifting financial profits to Bermuda, it becomes more valuable for firms to relocate to Singapore or Dublin (Hong and Smart 2010; Johannesen 2010). This would not be the case in the reform scenario I describe later in the paper.
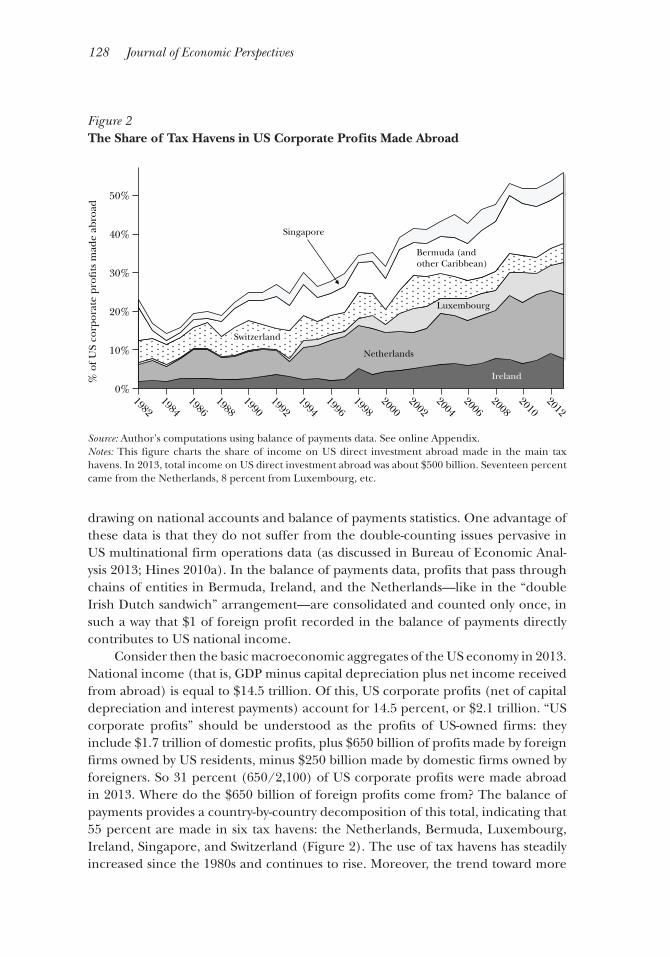
128 Journal of Economic Perspectives
drawing on national accounts and balance of payments statistics. One advantage of these data is that they do not suffer from the double-counting issues pervasive in US multinational firm operations data (as discussed in Bureau of Economic Anal-ysis 2013; Hines 2010a). In the balance of payments data, profits that pass through chains of entities in Bermuda, Ireland, and the Netherlands—like in the “double Irish Dutch sandwich” arrangement—are consolidated and counted only once, in such a way that $1 of foreign profit recorded in the balance of payments directly contributes to US national income.
Consider then the basic macroeconomic aggregates of the US economy in 2013. National income (that is, GDP minus capital depreciation plus net income received from abroad) is equal to $14.5 trillion. Of this, US corporate profits (net of capital depreciation and interest payments) account for 14.5 percent, or $2.1 trillion. “US corporate profits” should be understood as the profits of US-owned firms: they include $1.7 trillion of domestic profits, plus $650 billion of profits made by foreign firms owned by US residents, minus $250 billion made by domestic firms owned by foreigners. So 31 percent (650/2,100) of US corporate profits were made abroad in 2013. Where do the $650 billion of foreign profits come from? The balance of payments provides a country-by-country decomposition of this total, indicating that 55 percent are made in six tax havens: the Netherlands, Bermuda, Luxembourg, Ireland, Singapore, and Switzerland (Figure 2). The use of tax havens has steadily increased since the 1980s and continues to rise. Moreover, the trend toward more
Figure 2 The Share of Tax Havens in US Corporate Profits Made Abroad
Source: Author’s computations using balance of payments data. See online Appendix.Notes: This figure charts the share of income on US direct investment abroad made in the main tax havens. In 2013, total income on US direct investment abroad was about $500 billion. Seventeen percent came from the Netherlands, 8 percent from Luxembourg, etc.
0%
10%
20%
30%
40%
50%
1982 1984
1986 1988
1990 1992
1994 1996
1998 2000
2002 2004
2006 2008
2010 2012
% o
f US
corp
orat
e pr
o�ts
mad
e ab
road
Singapore
Ireland
Netherlands
Luxembourg
Bermuda (and other Caribbean)
Switzerland
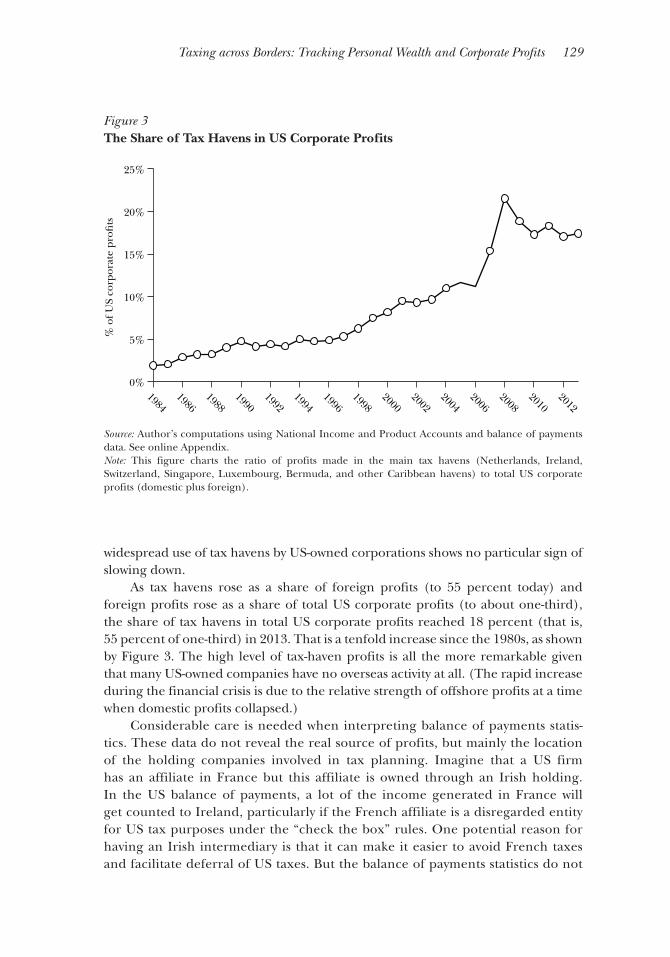
Taxing across Borders: Tracking Personal Wealth and Corporate Profits 129
widespread use of tax havens by US-owned corporations shows no particular sign of slowing down.
As tax havens rose as a share of foreign profits (to 55 percent today) and foreign profits rose as a share of total US corporate profits (to about one-third), the share of tax havens in total US corporate profits reached 18 percent (that is, 55 percent of one-third) in 2013. That is a tenfold increase since the 1980s, as shown by Figure 3. The high level of tax-haven profits is all the more remarkable given that many US-owned companies have no overseas activity at all. (The rapid increase during the financial crisis is due to the relative strength of offshore profits at a time when domestic profits collapsed.)
Considerable care is needed when interpreting balance of payments statis-tics. These data do not reveal the real source of profits, but mainly the location of the holding companies involved in tax planning. Imagine that a US firm has an affiliate in France but this affiliate is owned through an Irish holding. In the US balance of payments, a lot of the income generated in France will get counted to Ireland, particularly if the French affiliate is a disregarded entity for US tax purposes under the “check the box” rules. One potential reason for having an Irish intermediary is that it can make it easier to avoid French taxes and facilitate deferral of US taxes. But the balance of payments statistics do not
Figure 3 The Share of Tax Havens in US Corporate Profits
Source: Author’s computations using National Income and Product Accounts and balance of payments data. See online Appendix.Note: This figure charts the ratio of profits made in the main tax havens (Netherlands, Ireland, Switzerland, Singapore, Luxembourg, Bermuda, and other Caribbean havens) to total US corporate profits (domestic plus foreign).
0%
5%
10%
15%
20%
25%
1984 1986
1988 1990
1992 1994
1996 1998
2000 2002
2004 2006
2008 2010
2012
% o
f US
corp
orat
e pr
o�ts
130 Journal of Economic Perspectives
directly tell us how much the increased use of haven-based subsidiaries costs various governments.
To make progress on this issue, we need an estimate of the taxes paid by US-owned firms on the profits recorded in tax havens. Data from the Bureau of Economic Analysis (2013, table II-D-1, p. 46) suggest that US multinationals pay about 3 percent in taxes to foreign governments on the profits booked in the main low-tax jurisdictions displayed in Figure 2. Corporate filings are consistent with this result. In 2014, in Microsoft’s 10-K filing with the Securities and Exchange Commission,4 the firm disclosed that it had $92.9 billion of accumulated offshore profits—mostly from its subsidiaries in Puerto Rico, Ireland, and Singapore—and that it would face a $29.6 billion tax bill in the United States should it repatriate them—that is, a 31.9 percent rate. Since upon repatriation Microsoft would be able to deduct the foreign taxes previously paid from the 35 percent US corporate tax rate, this disclosure implies that the company paid at most 3.1 percent in taxes to foreign governments.
Microsoft also made it clear that it had no intention of repatriating the $92.9 billion, which it views as being “permanently reinvested outside the United States.” Admittedly, firms sometimes bring back a fraction of their overseas profits; others might do so in the future. But repatriations from low-tax jurisdictions are small today and seem unlikely to increase much in the near future, at least under current law. In 2004, Congress granted a repatriation tax holiday, letting multinationals bring their accumulated foreign profits back home if they paid a rate of 5.25 percent. Most companies used the tax holiday in 2005. Available evidence suggests that the holiday failed to increase domestic employment, investment, or research and development (Dharmapala, Foley, and Forbes 2011). Moreover, it gave a boost to the share of the foreign profits of US-owned firms not only made, but also retained in tax havens (Figure 4). In 2013, 80 percent of the profits made in the key tax havens (that is, 45 percent of all foreign profits) were retained there, with 20 percent brought back to the United States. Expectations of a new holiday may further increase this share in the near future.
Thus, not only do the profits made in the main havens bear negligible foreign taxes, they also mostly go untaxed by the IRS. Since these profits account for about 20 percent of all US corporate profits, I conclude that profit-shifting to low-tax jurisdictions reduces the tax bill of US-owned companies by about 20 percent.
The Decline in the Effective Corporate Tax Rate of US-Owned FirmsAnother way to assess the total government revenue losses is to study the evolu-
tion of the effective tax rate on the profits made by US-owned corporations all over the world. I compute the effective tax rate by dividing all the corporate taxes paid by these firms (to US and foreign governments) by US corporate profits, as recorded in the national accounts. (A more comprehensive analysis would take
4 Available at http://www.sec.gov/Archives/edgar/data/789019/000119312514289961/d722626d10k.htm.
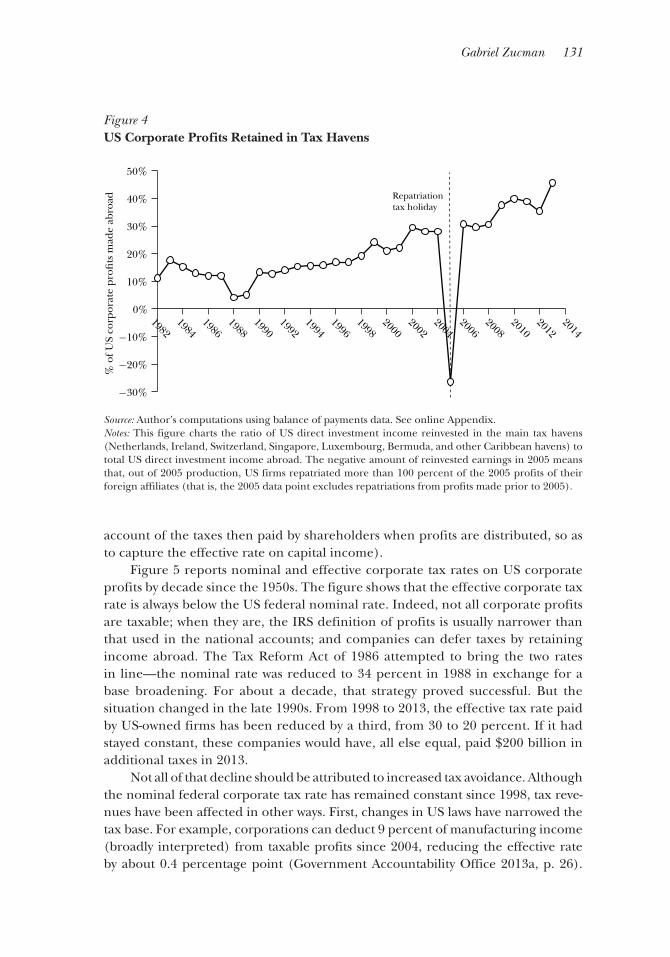
Gabriel Zucman 131
account of the taxes then paid by shareholders when profits are distributed, so as to capture the effective rate on capital income).
Figure 5 reports nominal and effective corporate tax rates on US corporate profits by decade since the 1950s. The figure shows that the effective corporate tax rate is always below the US federal nominal rate. Indeed, not all corporate profits are taxable; when they are, the IRS definition of profits is usually narrower than that used in the national accounts; and companies can defer taxes by retaining income abroad. The Tax Reform Act of 1986 attempted to bring the two rates in line—the nominal rate was reduced to 34 percent in 1988 in exchange for a base broadening. For about a decade, that strategy proved successful. But the situation changed in the late 1990s. From 1998 to 2013, the effective tax rate paid by US-owned firms has been reduced by a third, from 30 to 20 percent. If it had stayed constant, these companies would have, all else equal, paid $200 billion in additional taxes in 2013.
Not all of that decline should be attributed to increased tax avoidance. Although the nominal federal corporate tax rate has remained constant since 1998, tax reve-nues have been affected in other ways. First, changes in US laws have narrowed the tax base. For example, corporations can deduct 9 percent of manufacturing income (broadly interpreted) from taxable profits since 2004, reducing the effective rate by about 0.4 percentage point (Government Accountability Office 2013a, p. 26).
Figure 4 US Corporate Profits Retained in Tax Havens
Source: Author’s computations using balance of payments data. See online Appendix.Notes: This figure charts the ratio of US direct investment income reinvested in the main tax havens (Netherlands, Ireland, Switzerland, Singapore, Luxembourg, Bermuda, and other Caribbean havens) to total US direct investment income abroad. The negative amount of reinvested earnings in 2005 means that, out of 2005 production, US firms repatriated more than 100 percent of the 2005 profits of their foreign affiliates (that is, the 2005 data point excludes repatriations from profits made prior to 2005).
−30%
−20%
−10%
0%
10%
20%
30%
40%
50%
1982 1984
1986 1988
1990 1992
1994 1996
1998 2000
2002 2004
2006 2008
2010 2012
2014
% o
f US
corp
orat
e pr
o�ts
mad
e ab
road
Repatriationtax holiday
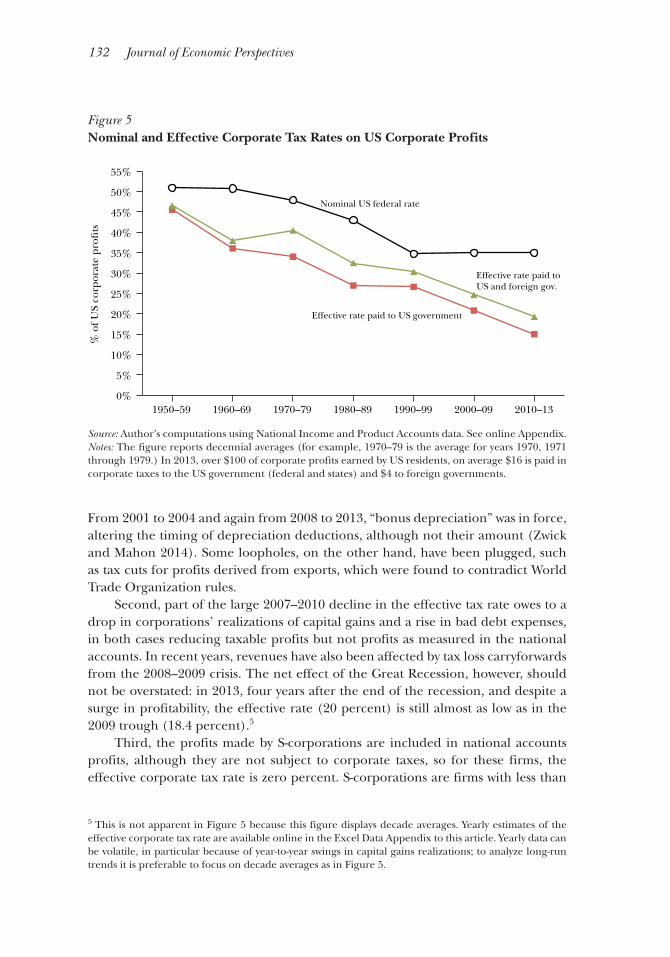
132 Journal of Economic Perspectives
From 2001 to 2004 and again from 2008 to 2013, “bonus depreciation” was in force, altering the timing of depreciation deductions, although not their amount (Zwick and Mahon 2014). Some loopholes, on the other hand, have been plugged, such as tax cuts for profits derived from exports, which were found to contradict World Trade Organization rules.
Second, part of the large 2007–2010 decline in the effective tax rate owes to a drop in corporations’ realizations of capital gains and a rise in bad debt expenses, in both cases reducing taxable profits but not profits as measured in the national accounts. In recent years, revenues have also been affected by tax loss carryforwards from the 2008–2009 crisis. The net effect of the Great Recession, however, should not be overstated: in 2013, four years after the end of the recession, and despite a surge in profitability, the effective rate (20 percent) is still almost as low as in the 2009 trough (18.4 percent).5
Third, the profits made by S-corporations are included in national accounts profits, although they are not subject to corporate taxes, so for these firms, the effective corporate tax rate is zero percent. S-corporations are firms with less than
5 This is not apparent in Figure 5 because this figure displays decade averages. Yearly estimates of the effective corporate tax rate are available online in the Excel Data Appendix to this article. Yearly data can be volatile, in particular because of year-to-year swings in capital gains realizations; to analyze long-run trends it is preferable to focus on decade averages as in Figure 5.
Figure 5 Nominal and Effective Corporate Tax Rates on US Corporate Profits
Source: Author’s computations using National Income and Product Accounts data. See online Appendix.Notes: The figure reports decennial averages (for example, 1970–79 is the average for years 1970, 1971 through 1979.) In 2013, over $100 of corporate profits earned by US residents, on average $16 is paid in corporate taxes to the US government (federal and states) and $4 to foreign governments.
0%
5%
10%
15%
20%
25%
30%
35%
40%
45%
50%
55%
1950–59 1960–69 1970–79 1980–89 1990–99 2000–09 2010–13
% o
f US
corp
orat
e pr
o�ts
Nominal US federal rate
Effective rate paid to US government
Effective rate paid toUS and foreign gov.
Taxing across Borders: Tracking Personal Wealth and Corporate Profits 133
100 shareholders that pass their profits through to their owners to be taxed at ordi-nary individual income tax rates (up to 39.6 percent in 2013). S-corporations’ profits have been rising from close to zero in the early 1980s to about 15 percent of US corporate profits in the late 1990s, and have remained at that level since then. Thus, S-corporations account for 2 percentage points of the fall in the effective tax rate from the 1980s to the 1990s, but they do not contribute to the 1998–2013 decline.
Last, foreign corporate taxes have tended to fall, but this reduction does not drive a wedge between the nominal and effective rate because lower foreign taxes are offset by lower tax credits when foreign profits are repatriated to the United States, and unrepatriated profits face almost no foreign taxes at all.
In sum, out of the 10 points decline in the effective tax rate between 1998 and 2013, 2 to 4 points can be attributed to changes in the US tax base and the Great Recession, leaving two-thirds or more of the decline to increased tax avoid-ance in low-tax countries. The cost of tax avoidance by US firms is borne by both the US government and the governments of other countries. Much of Google’s profits shifted to Bermuda are made in Europe; absent tax havens, Google would pay more taxes in France and Germany. On the other hand, some US corpora-tions also use tax havens to avoid taxes on their US-source income. With national accounts data, it is hard to know which government loses most. In both cases, US shareholders win. Since equity ownership is very concentrated, even after including the equities owned by broad-based pension funds (Saez and Zucman 2014), so too are the benefits.
How can we reconcile the sharp decline in the effective corporate tax rate with the widely noted fact that corporate tax revenues have not declined as a share of US national income over the last 30 years—they still amount to about 3 percent today? The answer is that corporate profits have risen as a share of national income over time, from about 9 percent in the 1980s—when interest rates were high, and the capital share of corporate value-added low—to about 14 percent in 2010–2013.6 This increase has offset the fall in the effective tax rate. In the United States like in other high-income countries, “capital is back” (Piketty and Zucman 2014)—but capital taxes, not at all.
Corporate Tax ReformsThere is no shortage of plans to fix the corporate tax. Some commentators
argue that it should simply be abolished. A repeal would undermine the individual income tax, as people would shift income to companies and try to consume within firms; therefore in its most radical—and coherent—form, this proposal comes along with the suggestion to abolish the income tax as well and to tax consumption instead (Mankiw 2014). Toder and Viard (2014) suggest replacing the corporate tax by increased shareholder taxes: nonpublicly traded businesses would be taxed on a flow-through basis, just like S-corporations today; shareholders of publicly-traded
6 See Supplementary Figure S.1 in the online Appendix available with this paper at http://e-jep.org.
134 Journal of Economic Perspectives
corporations would be taxed each year on the rise in the value of their shares, even if the gains have not been realized. However, as the authors acknowledge, the reform would raise only half the revenue of the current corporate tax, a tax cut that would primarily benefit rich households at a time when income and wealth inequality are rising; and since equity prices are very volatile, it would result in unpredictable tax bills. In fact, no country in the world has a well-functioning individual income tax and no corporate tax at all.
For those committed to keeping a form of corporate taxation, reform proposals differ in their willingness to reconsider the three pillars of international taxation: decentralized rules through bilateral treaties, arm’s length pricing, and source-based taxation.
A first class of reforms pushes for more harmonization of treaty rules. Advo-cates acknowledge that the thousands of bilateral tax treaties have created scope for treaty shopping and transfer mispricing, but they remain committed to the princi-ples of source-based taxation and arm’s length pricing. As one example, the OECD (2013b) has disclosed an ambitious “action plan on base erosion and profit shifting” along those lines. In recent years, one of the main steps taken by governments has been to strengthen existing transfer pricing rules by bringing them in line with OECD guidelines (Lohse and Riedel 2013).
A second class of proposals suggests abandoning arm’s length pricing. The profits of multinational companies would instead be apportioned to each country according to some formula, perhaps using some combination of sales, capital, and employment—analogous to the way that corporations are taxed by the states within the United States (Clausing 2014, evaluates the US experience across states with formula apportionment). For instance, if Google makes half of its sales and has half of its capital and workers in the United States, then half of its profits would be taxable there. This method would address the issue of artificial profit shifting. If capital and employment entered the formula, there would remain incentives for firms to move real activity to low-tax countries. A more radical proposal thus allocates a multination-al’s profits to each country based only on where it makes its sales. After all, a company like Starbucks can easily shift its headquarters to Ireland, but not its customers. Profit apportionment based on sales would therefore address both artificial profit shifting and tax competition. Yet sales, capital, or employment, are only mildly correlated with profits (Hines 2010b). So if one considers that corporate taxes ought to be paid to the countries from which profits originate—the third key League of Nations principle—then formula apportionment would misattribute taxing rights.
A third class of proposals abandons source-based taxation. If the corporate tax is only a prepayment for the personal income tax, profits should not be attributed to the countries from which they originate, or where sales are made, but to the countries where shareholders live. To understand the differences here, imagine that a French resident fully owns a company that has all its capital and employment in Germany but sells all its products in China. In today’s tax system, all the taxing rights are allocated to Germany, because that is where production occurs. With formula apportionment based on sales, the corporate taxes would be allocated to
Gabriel Zucman 135
China. If one regards the corporate tax as essentially a prepayment for the French income tax, then with a French owner the profits should be attributed to France. However, the corporate tax is more than a prepayment: it is also a way to tax rents, like in the case of extractive industries; and foreign shareholders (French-owners of a Berlin-based firm, for example) benefit from the public goods provided by Germany, giving Germany a right to tax at least part of the profits made there. Clearly, source-based taxation has some legitimacy.
Rather than abandoning source-based taxation altogether, its pitfalls can be addressed by integrating the corporate and individual income taxes, like European countries used to do and countries like Australia and Canada, among others, still do. In this system, once profits are paid out to shareholders, the government allows any corporate tax previously withheld to be credited against the amount of personal income tax owed. Imagine that Microsoft had managed to avoid taxation entirely: in an imputation system, its shareholders would get no credits and pay up to 48 percent (the combined federal corporate tax and top dividend tax rate on $1 of corporate profit in 2013) on the dividends they receive. Any dollar paid by Microsoft would reduce the tax bill at the shareholder level. Such an imputation system combines source- and shareholder-based taxation in the most logical way, and, most impor-tant, removes incentives for firms to relocate to Ireland or shift profits to Bermuda, since shareholders would recognize that it’s a wash.
Shareholders could still eschew taxation by investing in firms paying little or no dividends, and so it would remain important to ensure that large enough amounts of taxes are withheld at the corporate level. A number of multinational companies have low effective tax rates today, but this problem could probably be addressed by abandoning arm’s length pricing and using an apportionment formula instead. In an imputation system, it does not matter that sales (or any of the factors entering in the formula) are uncorrelated to profits, since the corporate tax is eventually credited back to shareholders. What matters is that the corporate tax be levied at approximately the same rate for large and small, high-tech, and manufacturing companies alike, and that this prepayment be fairly distributed across countries.
The imputation system worked well in Europe during most of the 20th century, but ultimately failed for two reasons. First, it became apparent that shareholders received credits for taxes that had never been paid in the first place, because credits were given on the assumption that corporations had paid the nominal rate while they often had paid less. This problem could be easily addressed by asking corpora-tions to disclose their effective tax rate at the time they distribute dividends. The more fundamental issue is that governments found it unacceptable to give credits to domestic shareholders for corporate taxes levied by foreign countries, an issue that became important with the surge of cross-border dividend flows in the 1990s and 2000s. In 2004, the European Court of Justice ruled that the uneven treat-ment of foreign dividends was discriminatory, leading France, among others, to abandon its imputation system in 2005 (Graetz and Warren 2007). Today, a main challenge is to find a way to make an integrated individual–corporate tax work in a globalized world.
136 Journal of Economic Perspectives
A World Financial RegistryThe United States could thoroughly reform its corporate taxation system
without a lot of international cooperation. For example, the United States could unilaterally abandon arm’s length pricing, tax corporations on their global profits (using some apportionment formula), raise the personal dividend tax rate, and credit corporate taxes back to shareholders—and do all of this in a revenue neutral way. In particular, instead of giving a credit to US multinationals for previously paid foreign taxes upon repatriation (at a cost of $118 billion in 2010), the federal government would give a credit to shareholders receiving foreign dividends. The United States might be reluctant to take such a step if foreign countries do not reciprocate, but this issue could be dealt with through bilateral treaties.
The European Union and the United States—which together account for close to 50 percent of world GDP—are currently engaged in talks to create a transatlantic free-trade area; as part of these talks, they could jointly decide to move to formula apportionment and an integrated individual–corporate tax with reciprocal cred-iting. During the transition, the United States could also unilaterally tax the stock of unrepatriated offshore profits of US-owned firms, at say a 1 percent rate per year. This tax on corporate wealth would trigger virtuous behavioral responses: at a minimum it would generate extra tax revenues which could be used to cut distor-tionary taxes or lower the tax burden of the middle class; on top of this, it might also spur employment and investment in the United States.
Many observers believe that taxing rights are badly allocated across countries today; for instance, that Google and Starbucks dodge their tax duties to the UK or French governments, or that both Europe and the United States deprive developing countries from their fair share of revenues. In itself, formula apportionment would not necessarily help, as evidence suggests that the allocation of taxable income across countries is very sensitive to the choice of the apportionment factors (IMF 2014, p. 39–40), and there is no guarantee, therefore, that a fair distribution is achieved. For example, an apportionment based on sales only may be detrimental to developing countries where companies produce goods for export and sale elsewhere. Tax policy in this area needs a benchmark—what would be a fair distribution of corporate tax revenues across countries?—and a tool to assess whether the benchmark is met.
One reasonable benchmark is that governments primarily want to tax the corpo-rate profits—whether originating from domestic or foreign firms—that accrue to resident households, in particular because they attempt to redistribute income from high- to low- income people, like in the canonical model of optimal income taxation. There might be reasons for deviating from this benchmark (in particular for devel-oping countries), but it is a useful and well-defined starting point.
With regard to the tool, a world financial registry would enable countries to assess how the actual distribution of revenues compares to the benchmark alloca-tion. The registry would include information on the residence and nationality of corporate shareholders, thus making it possible for countries to check whether the total taxes they levy on corporate profits—at both the corporate and shareholder level, net of credits—are in line with the corporate profits that indeed accrue to
Taxing across Borders: Tracking Personal Wealth and Corporate Profits 137
resident taxpayers. A world financial registry is not necessary to fix some of the most pressing issues, but in the long run it is a transparent way to enforce a fair distribu-tion of corporate tax revenue globally and thus make an imputation system work in a globalized world.
Is a world financial registry workable? There are a number of practical obsta-cles: toward the end of the paper, I will also touch on some political obstacles like concerns over privacy.
First, a world financial registry would have costs—but such costs should not be overstated. In each country, a central securities depository already keeps track of who owns the equities and bonds issued by domestic firms (the Depository Trust Corporation in the United States, for example, or Clearstream, in Luxembourg). A global registry would merge these partial, privately managed registries to create a comprehensive one.
Second, a large fraction of the world’s equities might not initially be attributable to any well-identified beneficial owner. Equities are largely held through intertwined finan-cial intermediaries, like investment funds, pension funds, and the like. To identify the residence of the ultimate owner, it would be necessary to know the relationships of the different entities involved in the wealth-holding chain. Progress has started in this area since the recent financial crisis, under the auspices of a committee of authorities from around the world working to create a global system of legal entity identification: for some details, see the website of the Regulatory Oversight Committee (ROC) of the Global Legal Entity Identifier System at http://www.leiroc.org.
Third, a growing fraction of US equities (and equities in other high-income countries) are managed by intermediaries located in offshore financial centers. Figure 6 reports data collected by the US Treasury on the residence of the owners of US equities; the US Treasury International Capital dataset is a high-quality dataset and one of the main pillars of US international statistics (Bertaut, Griever, and Tryon 2006). In 2013, 9 percent of all US-listed equities belonged to tax-haven-based individuals and firms, such as hedge funds in the Cayman Islands, insurance compa-nies in Bermuda, Luxembourg mutual funds, Swiss banks, and so on. Who are the ultimate owners of the shares managed by these intermediaries? Some of them are investors who make legal use of offshore intermediaries. But many, as the next section discusses, are individuals using offshore banks to evade taxes. To pierce this veil of secrecy, international cooperation would be necessary, which might involve sanctions against tax havens that are reluctant to disclose information about foreign customers and their accounts.
Offshore Tax Evasion by Wealthy Individuals
Switzerland, Singapore, Hong Kong, and the Bahamas, among others, have attracted a large offshore private banking industry. Banks located in these countries cater to wealthy individuals from around the world. They provide a variety of finan-cial services to these individuals, many of which are legal and useful to people who
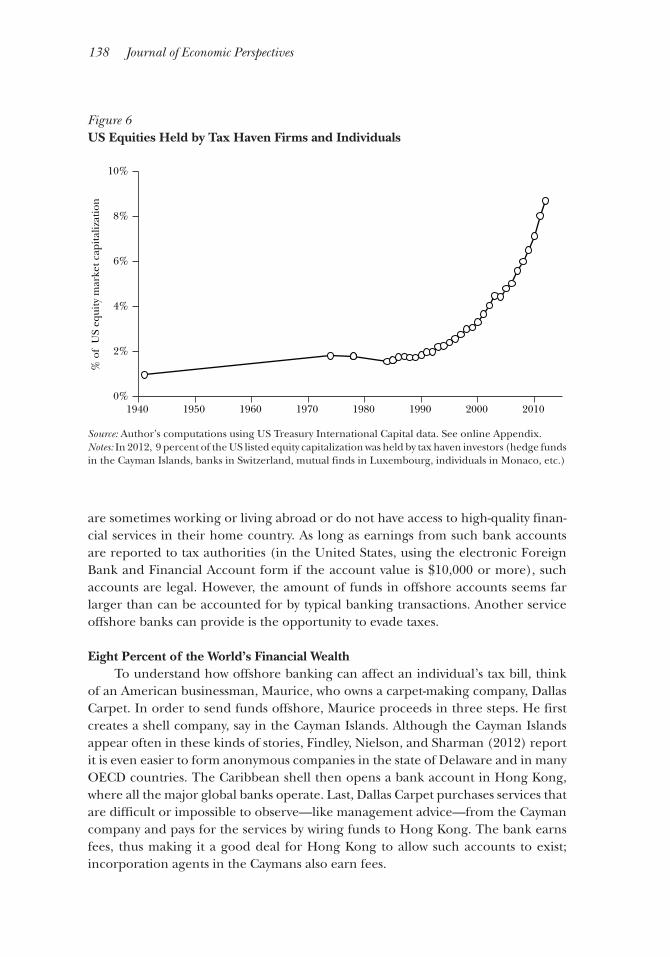
138 Journal of Economic Perspectives
are sometimes working or living abroad or do not have access to high-quality finan-cial services in their home country. As long as earnings from such bank accounts are reported to tax authorities (in the United States, using the electronic Foreign Bank and Financial Account form if the account value is $10,000 or more), such accounts are legal. However, the amount of funds in offshore accounts seems far larger than can be accounted for by typical banking transactions. Another service offshore banks can provide is the opportunity to evade taxes.
Eight Percent of the World’s Financial WealthTo understand how offshore banking can affect an individual’s tax bill, think
of an American businessman, Maurice, who owns a carpet-making company, Dallas Carpet. In order to send funds offshore, Maurice proceeds in three steps. He first creates a shell company, say in the Cayman Islands. Although the Cayman Islands appear often in these kinds of stories, Findley, Nielson, and Sharman (2012) report it is even easier to form anonymous companies in the state of Delaware and in many OECD countries. The Caribbean shell then opens a bank account in Hong Kong, where all the major global banks operate. Last, Dallas Carpet purchases services that are difficult or impossible to observe—like management advice—from the Cayman company and pays for the services by wiring funds to Hong Kong. The bank earns fees, thus making it a good deal for Hong Kong to allow such accounts to exist; incorporation agents in the Caymans also earn fees.
Figure 6 US Equities Held by Tax Haven Firms and Individuals
Source: Author’s computations using US Treasury International Capital data. See online Appendix. Notes: In 2012, 9 percent of the US listed equity capitalization was held by tax haven investors (hedge funds in the Cayman Islands, banks in Switzerland, mutual finds in Luxembourg, individuals in Monaco, etc.)
0%
2%
4%
6%
8%
10%
1940 1950 1960 1970 1980 1990 2000 2010
% o
f U
S eq
uity
mar
ket c
apit
aliz
atio
n
Gabriel Zucman 139
The transaction generates a paper trail that appears legitimate, and in at least some cases actually is legitimate. It is unlikely to trigger any anti-money-laundering alarms inside the banks because there are billions of electronic transfers out of the United States each year, making it is almost impossible to distinguish in real time those that are legal (such as payments made to real exporters) from those condu-cive to tax evasion.
For Maurice, the tax benefits of this arrangement are twofold. By overpaying for actual services, or just paying for false services, he (fraudulently) reduces Dallas Carpet’s profits and thus its corporate tax in the United States. Then, once the funds have arrived in Hong Kong, they can be invested in global bonds, equities, and mutual funds and generate interest, dividends, and capital gains. The IRS can only tax that income if Maurice self-reports it, or if Hong Kong banks inform the US authorities. Otherwise, Maurice can evade US federal income tax as well.
How big are the sums held in offshore accounts? Until recently, evidence on that issue was lacking. Tax havens rarely publish informative statistics. There are two exceptions, however. Thanks to an exhaustive, detailed, monthly survey conducted by the Swiss National Bank, we know the amount of wealth held by foreigners in Switzerland. The latest data point, for June 2014, puts the total at $2.46 trillion.7 Luxembourg has also recently released similar information, showing that foreign households have $370 billion there (Adam 2014, p. 8).8 (Luxembourg, a country of half a million inhabitants, has an annual national income of about $35 billion.) But no other country publishes similar data. The United States, for example, does not disclose the assets held by, say, Latin American residents in Florida banks.
To obtain a sense of the global amount of offshore wealth, one has to use indi-rect methods. My own attempt relies on the anomalies in global investment statistics caused by offshore fortunes (Zucman 2013a, 2013b). Take the hypothetical case of Elizabeth, a UK resident who owns stock in Google through her Swiss account. In the United States, statisticians observe that a foreign investor owns US securities and record a liability. UK statisticians should record an asset held by a UK resident but they don’t, because they have no way to observe Elizabeth’s offshore holdings. Because Elizabeth’s equity holdings are neither assets nor liabilities for Switzerland, over there nothing is recorded in the investment statistics. In the end, more liabili-ties than assets show up in global investment data. Strikingly, more than 20 percent of the world’s cross-border equities have no identifiable owner.
By analyzing these anomalies, I estimate that 8 percent of the global financial wealth of households is held in tax havens, about $7.6 trillion at the end of 2013. Other estimates are generally larger. Based on interviews with wealth managers, the Boston Consulting Group (2014) has an $8.9 trillion figure for 2013. Henry’s (2012) estimate is as high as $32 trillion.
7 For details, see Table S1 of the online Appendix to this article.8 This figure understates the true amount of offshore wealth in Luxembourg because it excludes some $350 billion not directly held by households but through family offices and other intermediaries.
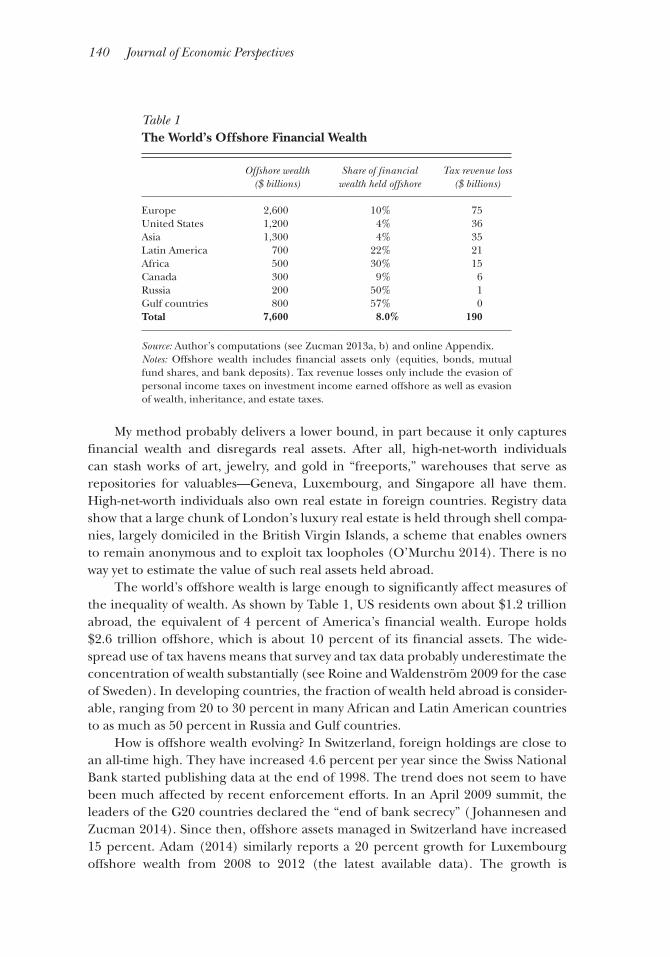
140 Journal of Economic Perspectives
My method probably delivers a lower bound, in part because it only captures financial wealth and disregards real assets. After all, high-net-worth individuals can stash works of art, jewelry, and gold in “freeports,” warehouses that serve as repositories for valuables—Geneva, Luxembourg, and Singapore all have them. High-net-worth individuals also own real estate in foreign countries. Registry data show that a large chunk of London’s luxury real estate is held through shell compa-nies, largely domiciled in the British Virgin Islands, a scheme that enables owners to remain anonymous and to exploit tax loopholes (O’Murchu 2014). There is no way yet to estimate the value of such real assets held abroad.
The world’s offshore wealth is large enough to significantly affect measures of the inequality of wealth. As shown by Table 1, US residents own about $1.2 trillion abroad, the equivalent of 4 percent of America’s financial wealth. Europe holds $2.6 trillion offshore, which is about 10 percent of its financial assets. The wide-spread use of tax havens means that survey and tax data probably underestimate the concentration of wealth substantially (see Roine and Waldenström 2009 for the case of Sweden). In developing countries, the fraction of wealth held abroad is consider-able, ranging from 20 to 30 percent in many African and Latin American countries to as much as 50 percent in Russia and Gulf countries.
How is offshore wealth evolving? In Switzerland, foreign holdings are close to an all-time high. They have increased 4.6 percent per year since the Swiss National Bank started publishing data at the end of 1998. The trend does not seem to have been much affected by recent enforcement efforts. In an April 2009 summit, the leaders of the G20 countries declared the “end of bank secrecy” ( Johannesen and Zucman 2014). Since then, offshore assets managed in Switzerland have increased 15 percent. Adam (2014) similarly reports a 20 percent growth for Luxembourg offshore wealth from 2008 to 2012 (the latest available data). The growth is
Table 1 The World’s Offshore Financial Wealth
Offshore wealth ($ billions)
Share of financial wealth held offshore
Tax revenue loss ($ billions)
Europe 2,600 10% 75United States 1,200 4% 36Asia 1,300 4% 35Latin America 700 22% 21Africa 500 30% 15Canada 300 9% 6Russia 200 50% 1Gulf countries 800 57% 0Total 7,600 8.0% 190
Source: Author’s computations (see Zucman 2013a, b) and online Appendix.Notes: Offshore wealth includes financial assets only (equities, bonds, mutual fund shares, and bank deposits). Tax revenue losses only include the evasion of personal income taxes on investment income earned offshore as well as evasion of wealth, inheritance, and estate taxes.
Taxing across Borders: Tracking Personal Wealth and Corporate Profits 141
stronger in the emerging Asian centers, Singapore and Hong Kong, so that globally, according to my estimate, offshore wealth has increased 28 percent from end-2008 to end-2013.
The post-2008 growth in offshore wealth reflects both valuation effects—world equity markets have largely recovered from their trough in 2008 and 2009—and also net new inflows. In the case of Luxembourg, the 20 percent growth in offshore assets is despite a 20 percent drop in the EuroStoxx 500, Europe’s leading equity index. In Switzerland, the 15 percent growth since April 2009 is comparable to the growth of Europe’s financial wealth. Inflows seem to be coming largely from developing coun-tries; as their share of global wealth rises, so too does their share of offshore wealth. More than half of offshore assets still belong to residents of high-income countries (as shown in Table 1), but if the current trend is sustained, emerging countries will overtake Europe and North America by the end of the decade.
Two other recent developments are worth noting. First, while offshore assets are rising, the number of clients is falling, and so the average wealth per client is booming. The main Swiss banks have been refocusing their activities on their “key private banking” clients, those with more than $50 million in assets. Recent policy changes (discussed below) are indeed making it more difficult for moder-ately wealthy individuals to use offshore banks to dodge taxes: for them, the era of bank secrecy is coming to an end. But more fundamentally, offshore banks are responding to the increasing concentration of global fortunes.9 The banks know that “ultra-high net worth” clients are prospering—a number of them publish annual world wealth reports in which fortunes of dozens of millions of dollars are described as rising much faster than average and are projected to continue to do so in the future (for example, Credit Suisse 2013).
Offshore banking is also becoming more sophisticated. Wealthy individuals increasingly use shell companies, trusts, holdings, and foundations as nominal owners of their assets. This is apparent in Switzerland, where more than 60 percent of foreign-owned deposits “belong” to the British Virgin Islands, Jersey, and Panama—the leading centers for the domiciliation of shell vehicles. In Luxembourg as well, “assets are moving to legal structures such as family wealth-holding companies” (Adam 2014, p. 8).
The revenue costs of offshore tax dodging are sizable. Of course, some taxpayers duly declare their Swiss or Cayman holdings. Yet in Switzerland, about 80 percent of the wealth held by Europeans seems to be evading taxes, according to data published by the Swiss tax authority. On the assumption of a like basis for other tax havens, Table 1 provides estimates of the revenue losses for the main economies. Globally, the reduction in tax revenues amount to about $200 billion annually. This
9 In Saez and Zucman (2014), wealth is estimated by capitalizing flows of capital income. By this measure, the share of US wealth held by the top 0.1 percent—families with more than $20 million in net wealth in 2012—was 8 percent in 1980; it is now 22 percent and as much as 23 percent when making allowance for unrecorded offshore assets. For the top 0.01 percent (those holding more than $100 million), the rise has been spectacular, from less than 3 to more than 11 percent of all wealth. By contrast, households between the top 10 percent and the top 0.1 percent have seen their share of total US wealth decrease.
142 Journal of Economic Perspectives
is about 1 percent of the total revenues raised by governments worldwide, and this reduction in tax revenues accrues almost entirely to the wealthiest. In the United States, according to IRS data, the top 0.1 percent highest income earners pay about $200 billion in federal income taxes (16 percent of all federal income tax revenues, which totaled $1.3 trillion in 2013). Assuming that all unrecorded offshore wealth belongs to the top 0.1 percent, eradicating offshore evasion (which would yield at least $36 billion) would raise as much revenues as increasing the top 0.1 percent’s federal income tax bill by close to 18 percent. (These computations only include the cost of tax evasion on investment income earned offshore and on inheritances.)
As with any attempt at quantifying unreported aspects of the economy, a margin of error is involved. While it seems clear that global offshore wealth is on the rise, the main uncertainty relates to the fraction of those funds that evade taxes. A couple of US Senate (2008, 2014) reports found that up to 2008, 85 to 95 percent of US-owned accounts at UBS and Credit Suisse were undeclared. Thus, my assumption that 80 percent of offshore funds is undeclared to tax authorities suggests that some improvement has been made in recent years. Some observers believe that enforcement has improved much more dramatically, but this view is inconsistent with the fact that the funds declared to tax authorities in recent years, though not negligible, have been quite modest ( Johannesen and Zucman 2014, Section V). The share of offshore wealth that is dodging taxes may decrease more substantially in the future. To compute it, we would ideally like to compare the data published by the Swiss National Bank (and other tax haven authorities) to the assets that taxpayers report to the IRS (and other tax agencies). But very few havens publish any useful statistics and tax authorities do not systematically disclose the amounts declared to them. Filling in these data gaps should be among the highest priorities in this area for researchers and policymakers.
The Automatic Exchange of Bank Information and BeyondSince the financial crisis of 2008–2009, remarkable progress has been achieved in
curbing bank secrecy. Prior to 2008, tax havens refused to share any information with foreign tax authorities. But in 2010, the US Congress enacted and President Obama signed into law the Foreign Account Tax Compliance Act, which compels foreign banks to disclose accounts held by US taxpayers to the IRS automatically each year, under the threat of economic sanctions—a 30 percent tax on all US-source income (Grinberg 2012). Other high-income countries are following suit, as discussed in OECD (2014), and the automatic sharing of bank data is becoming the global stan-dard. Key havens, including Switzerland, Singapore, and Luxembourg, have already indicated they would participate. In 2008, the vast majority of tax experts would have deemed such worldwide cooperation utopian. Apparently, tax havens can be forced to cooperate if threatened with large enough penalties.
The Foreign Account Tax Compliance Act has been criticized on a number of grounds: for example, it asserts US government power over foreign-based financial firms; it invades privacy; and it creates difficulties for ordinary Americans overseas because foreign banks may choose simply not to offer or to sharply limit accounts
Gabriel Zucman 143
to Americans rather than to deal with its requirements. Whatever the merits and demerits of these issues, FATCA has been the starting point toward changing the ground rules that previously governed offshore banking.
However, current enforcement efforts face three main potential obstacles: 1) obtaining compliance from offshore bankers, 2) addressing the opacity of inter-national financial record-keeping, 3) making sure offshore banking does not move to uncovered jurisdictions.
With regard to the first concern, not all bankers in Switzerland, the Caymans, and elsewhere may truthfully report to foreign authorities. For decades, some of them have been hiding their clients behind shell companies, smuggling diamonds in toothpaste tubes, and handing out bank statements concealed in sports magazines, all of this in violation of the law and the banks’ stated policies (as reported in US Senate, 2008, 2014). More than a handful of rogue employees were involved: in 2008, over 1,800 Credit Suisse bankers were servicing Swiss accounts for US customers. Can offshore wealth managers now be trusted to assist the tax authorities?
Securing their cooperation will partly depend on the penalties that financiers will face for noncompliance and the rewards that whistleblowers will be able to claim. In the United States, the IRS has paid as much as $104 million to the employee who denounced wrongdoings at UBS. The Justice Department has imposed fines for abuses of offshore banking, and regulators have threatened to revoke banking charters a number of times over the last years. However, the US approach has also been weak in some ways, according to a bipartisan US Senate staff report (2014). While the US has put pressure on Switzerland, it has largely failed so far to pressure other tax havens.10 Among the US taxpayers who have voluntarily disclosed previ-ously hidden assets in recent years, 42 percent reported a Swiss account, 8 percent a UK account, but almost no US taxpayers reported any holdings in Hong Kong (3 percent), the Caymans (1 percent), or Singapore (1 percent), where the bulk of US offshore money lies (Government Accountability Office, 2013b, 2014). Only about one-quarter of the funds that left Credit Suisse between 2008 and 2012 have been repatriated to the United States, while half have stayed in Switzerland, and the remaining quarter have moved to other countries (US Senate 2014, p. 114). As for other rich economies, the European Union has about 30 times more wealth hidden in Switzerland than the United States, yet has done much less than the United States to fight this type of evasion.
Looking forward, countries unwilling or unable to impose sanctions on offshore banks and reward informants about systematic legal violations will remain vulner-able—this includes nations with corrupt governments, small economies, most of the
10 As of August 2014, only two banks (Wegelin and Credit Suisse) had been indicted, and the United States had obtained few names and little account information: Credit Suisse sent less than 1 percent of its 22,000 American accountholders; Wegelin, none. Accounts disclosed have also tended to be small, with a median amount of $570,000. Overall, just $6 billion in back taxes, interest, and penalties had been paid with regard to offshore bank accounts by January/February 2014—which pales in comparison to the yearly losses for the IRS.
144 Journal of Economic Perspectives
developing world, and, as it stands, the European Union. Another important factor will be the evolution of the size distribution of banks. Whistleblowing by rational (or moral) employees is more likely to occur in big than small firms (Kleven, Kreiner, and Saez 2009). If tax evasion activities move to small boutique banks, shielded from US outreach, then enforcement might prove increasingly difficult. Even some large banks may straggle in a way that hinders enforcement, if they believe that they are too big to indict—that is, they believe that regulators will hesitate to charge them because it might pose a danger to financial stability. In 2014, Credit Suisse pleaded guilty of a criminal charge of conspiracy to defraud the IRS, yet it was able to keep its US banking license (US Department of Justice 2014).11
With regard to the second concern, there is a fundamental problem that many assets cannot easily be traced to their real owners, so even the automatic sharing of bank information may bump into problems of financial opacity. Take the Hong Kong account of hypothetical Maurice, mentioned earlier: on paper, it belongs to a Cayman corporation managed by nominees with addresses in that country. Imagine that Maurice’s Hong Kong bankers enquire about who owns the Cayman shell company. Will they find out? Findley, Nielson, and Sharman (2012) attempted to create anonymous companies by asking 3,700 incorporation agents in 182 coun-tries: in about a quarter of cases, they were able to do so without providing any identification document. But the problems don’t stop there. Imagine now that certain documents show that the Cayman company belongs to a Jersey discretionary trust. When asked, the trustees, who were chosen by Maurice, say the beneficial owner is Chang, Maurice’s business partner in China. The Hong Kong account, then, does not belong to a foreign person and no information is sent to the IRS. Even that example is much simplified. In the real world, tax evaders can combine countless holding entities in numerous havens, generating de jure ownerless assets or effectively disconnecting them from their holdings. The prevalence of deriva-tive financial instruments can also make it difficult to discern the value of financial holdings clearly. Thus, even though the Foreign Account Tax Compliance Act and similar laws are broad in scope, they may prove unable to catch even moderately sophisticated tax dodgers. Evasion opportunities are disappearing for those who do not use more complex administrative structures like shell corporations and trusts, but may remain for those who do.
The third concern is that a crackdown on offshore evasion needs to be global. Cooperative efforts coordinated through the OECD have convinced many offshore centers to share bank information automatically. Yet the more havens agree to coop-erate, the bigger the incentives for the remaining ones not to do so (Elsayyad and Konrad 2012). In Johannesen and Zucman (2014), we show that when two coun-tries like Switzerland and France agree to share banking information, French tax
11 In 2012, US authorities decided against indicting HSBC despite evidence the bank enabled Mexican drug cartels to move money through its American subsidiaries in violation of basic anti-money-laundering regulations. Instead, the bank was fined $1.92 billion. For comparison, HSBC’s pre-tax profits were $22.6 billion in 2013.
Taxing across Borders: Tracking Personal Wealth and Corporate Profits 145
evaders move their assets to less-cooperative places like Hong Kong. Such transfers are child’s play, because the funds remain within the same banks that have subsid-iaries all over the world. A handful of noncooperative financial centers can quickly attract a lot of money.
The obstacles to current enforcement actions are not insuperable, though. Recent experience since the G20 summit in April 2009 shows that diplomacy can go a long way in securing commitments from countries to encourage bank reporting of foreign accounts. A number of tax havens derive a large fraction of their income from illegal activities; at this stage they have little incentive to give up this lucra-tive business, but global cooperation might be achieved by threatening tax havens with sanctions proportional to the income they generate in abetting tax dodgers. Such incentives may also foster cooperation on the part of the havens that have already promised to implement the automatic exchange of bank information. In addition to fines, criminal charges, and the revocation of banking licenses, cred-ible threats include trade tariffs. A 30 percent tariff jointly imposed by Germany, France, and Italy on Swiss exports, for instance, would cost Switzerland more than what Swiss banks gain by managing the evaded wealth from these three countries (Zucman 2013b).
Progress can also be made in curbing financial opacity by using the world financial registry described above. For enforcing an efficient and fair corporate income tax, the world financial registry only needs to include equities. For tax enforcement purposes concerning individuals, it would be necessary to include other types of financial claims, including bank deposits, bonds, and derivatives. A world financial registry would make it possible for tax authorities to check that taxpayers duly report their assets and income, independently of what information offshore bankers are willing to provide. One common response to proposals for a world financial registry is that it would threaten individual privacy. But countries have public property records for land and real estate and there seems to be little misuse. Anybody, for example, can connect to http://a836-acris.nyc.gov/ and find out who owns real estate on Park Avenue (although one sometimes stumbles upon faceless corporate titles) or if a particular person owns anything in Brooklyn. Of course, these records about real estate only capture part of people’s wealth, but when the records were created, centuries ago (for example, in 1791 in France), land accounted for the bulk of private wealth, so they indeed recorded most of peoples’ fortunes. In addition, not all countries have the same attitudes toward transparency, and such attitudes change over time. In some Scandinavian coun-tries, taxpayers’ income and wealth is made public (Bø, Slemrod, and Thoresen 2014). Even in the United Sates, income tax payments were required to be publicly disclosed in 1923 and 1924 (Marcin 2014). But there might be a case for starting such a world financial registry only with those countries sharing similar attitudes toward transparency, or to initially keep the information confidentially in the hands of tax and regulatory authorities.
While progress has undoubtedly been achieved over the last few years in curbing tax avoidance and evasion, much more could be done to illuminate the
146 Journal of Economic Perspectives
dark sides of international capital mobility. The stakes go beyond tax enforcement, as the ability to move large sums of money without leaving a footprint also facilitates money laundering, bribery, and the financing of terrorism.
■ I thank the editors, Annette Alstadsæter, Alan Auerbach, Kimberly Clausing, Michael Devereux, Jim Hines, Niels Johannesen, Edward Kleinbard, Henrik Kleven, Emmanuel Saez, Joel Slemrod, Danny Yagan, and Francis Weyzig for helpful comments and reactions.
References
Adam, Ferdy. 2014. “Impact de l’échange automatique d’informations en matière de produits financiers: une tentative d’évaluation macro-économique appliquée au Luxembourg.” STATIC working paper n° 73.
Ardant, Gabriel. 1972. Histoire de l’impôt, Livre II, du XVIIIe siècle au XXIe siècle. Fayard, Paris.
Bank, Steven A. 2010. From Sword to Shield: The Transformation of the Corporate Income Tax, 1861 to Present. Oxford University Press.
Bertaut, Carol C., William L. Griever, and Ralph W. Tryon. 2006. “Understanding U.S. Cross-Border Securities Data.” Federal Reserve Bulletin, p. A59–A75.
Bø, Erlend E., Joel Slemrod, and Thor O. Thoresen. 2014. “Taxes on the Internet: Deterrence Effects of Public Disclosure.” Discussion Paper no. 770, Statistics Norway Research Department.
Boston Consulting Group, The. 2014. “Global Wealth Report 2014: Riding a Wave of Growth”.
Bush, George W. 2003. “President Discusses Taking Action to Strengthen America’s Economy.” Remarks at the Economic Club of Chicago, January 7. http://georgewbush-whitehouse.archives.gov /news/releases/2003/01/20030107-5.html.
Bruins, G. W. J., Luigi Einaudi, Edwin Robert Anderson Seligman, and Josiah Charles Stamp. 1923. League of Nations Report on Double Taxation.
Bureau of Economic Analysis. 2013. “U.S. Direct Investment Abroad: Operations of U.S. Parent Companies and Their Foreign Affiliates, Preliminary 2011 Statistics.” Available at http://www.bea.gov/iTable/index_MNC.cfm.
Clausing, Kimberly A. 2003. “Tax-motivated Transfer Pricing and US Intrafirm Trade Prices.” Journal of Public Economics 87(9–10): 2207–23.
Clausing, Kimberly A. 2009. “Multinational Firm Tax Avoidance and Tax Policy.” National Tax Journal 62(4): 703–725.
Clausing, Kimberly A. 2014. “Lessons from the U.S. State Experience under Formulary Apportionment for International Tax Reform.” ICTD Research Report 2, available at SSRN: http://papers.ssrn.com/sol3/papers.cfm?abstract _id=2437362.
Coates, W. H. 1925. “Double Taxation and Tax Evasion.” Journal of the Royal Statistical Society 83(3): 403–427.
Credit Suisse. 2013. Global Wealth Report 2013.Dharmapala, Dhammika, C. Fritz Foley, and
Kristin J. Forbes. 2011. “Watch What I Do, Not What I Say: The Unintended Consequences of the Homeland Investment Act.” Journal of Finance 66(3): 753–787.
Drucker, Jesse. 2010. “Google 2.4% Rate Shows How $60 Billion Is Lost to Tax Loopholes.” Bloomberg, October 21, 2010. http://www .bloomberg.com/news/2010-10-21/google-2-4 -rate-shows-how-60-billion-u-s-revenue-lost-to-tax -loopholes.html.
Elsayyad, May, and Kai A. Konrad. 2012. “Fighting Multiple Tax Havens.” Journal of Interna-tional Economics 86(2): 295–305.
Eurostat. 2014. “Taxation Trends in the European Union.” Eurostat Statistical Books, 2014 Edition. http://epp.eurostat.ec.europa.eu /cache/ITY_OFFPUB/KS-DU-14-001/EN/KS-DU -14-001-EN.PDF.
Findley, Michael, Daniel Nielson, and Jason Sharman. 2012. “Global Shell Games: Testing Money Launderers’ and Terrorist Financiers’ Access to Shell Companies.” http://www.gfintegrity
Gabriel Zucman 147
.org/wp-content/uploads/2014/05/Global-Shell -Games-2012.pdf.
Government Accountability Office. 2013a. “Corporate Tax Expenditures, Information on Estimated Revenue Losses and Related Federal Spending Programs.” GAO-13-339.
Government Accountability Office. 2013b. “Offshore Tax Evasion: IRS Has Collected Billions of Dollars, But May Be Missing Continued Evasion.” GAO-13-318.
Government Accountability Office. 2014. “IRS’s Offshore Voluntary Disclosure Program: 2009 Participation by State and Location of Foreign Bank Accounts.” GAO-14-265R.
Graetz, Michael J. and Alvin C. Warren, Jr. 2007. “Dividend Taxation in Europe: When the ECJ Makes Tax Policy.” Common Market Law Review 44: 1577–1623.
Grinberg, Itai. 2012. “The Battle over Taxing Offshore Accounts.” UCLA Law Review 60(2): 305–383.
Heckemeyer, Jost H., and Michael Overesch. 2013. “Multinationals’ Profit Response to Tax Differentials: Effect Size and Shifting Channels.” ZEW Discussion Papers 13-045, Zentrum für Europäische Wirtschaftsforschung.
Henry, James S. 2012. “The Price of Offshore Revisited: New Estimates for ‘Missing’ Global Private Wealth, Income, Inequality, and Lost Taxes.” Tax Justice Network. http://www.tax justice.net/cms/upload/pdf/Price_of_Offshore _Revisited_120722.pdf.
Hines, James R., Jr. 2010a. “Treasure Islands.” Journal of Economic Perspectives 24(4): 103–126.
Hines, James R., Jr. 2010b. “Income Misattribu-tion under Formula Apportionment.” European Economic Review 54(1): 108–120.
Hong, Qing, and Michael Smart. 2010. “In Praise of Tax Havens: International Tax Planning and Foreign Direct Investment.” European Economic Review 54(1): 82–95.
IMF. 2013. Fiscal Monitor: Taxing Times. World Economic and Financial Surveys. International Monetary Fund.
IMF. 2014. Spillovers in International Corporate Taxation. IMF Policy Paper, May 9. International Monetary Fund.
Johannesen, Niels. 2010. “Imperfect Tax Competition for Profits, Asymmetric Equilibrium and Beneficial Tax Havens.” Journal of International Economics 81(2): 253–64.
Johannesen, Niels, and Gabriel Zucman. 2014. “The End of Bank Secrecy? An Evaluation of the G20 Tax Haven Crackdown.” American Economic Journal: Economic Policy 6(1): 65–91.
Kleinbard, Edward D. 2011. “Stateless Income.” Florida Tax Review 11(9): 699–774.
Kleinbard, Edward D. 2012. “The Lessons of Stateless Income.” (Tax Law Review, vol. 65; 2011; USC CLEO Research Paper No. C11-2; USC Law Legal Studies Paper No. 11-7.) Available at SSRN: http://papers.ssrn.com/sol3/papers .cfm?abstract_id=1791783.
Kleinbard Edward D. 2013. “Through a Latte, Darkly: Starbuck’s Stateless Income Planning.” Tax Notes, June 24, pp. 1515–35. Available at SSRN: http://papers.ssrn.com/sol3/papers.cfm?abstract _id=2264384.
Kleven, Henrik, Claus Kreiner, and Emmanuel Saez. 2009. “Why Can Modern Governments Tax So Much? An Agency Model of Firms as Fiscal Intermediaries.” NBER Working Paper 15218.
Lohse, Theresa, and Nadine Riedel. 2013. “Do Transfer Pricing Laws Limit International Income Shifting? Evidence from European Multi-nationals.” Oxford University Center for Business Taxation working paper WP 13/07.
Mankiw, N. Gregory. 2014. “One Way to Fix the Corporate Tax: Repeal It.” New York Times, August 23. http://www.nytimes.com/2014/08/ 24/upshot/one-way-to-fix-the-corporate-tax-repeal -it.html?_r=0&abt=0002&abg=1.
Marcin, Daniel. 2014. “Essays on the Revenue Act of 1924.” PhD thesis dissertation, University of Michigan.
OECD. 2013a. “OECD Revenue Statistics, 2013 edition.” Data available at http://www.oecd.org /tax/tax-policy/tax-database.htm#A_Revenue Statistics.
OECD. 2013b. “Action Plan on Base Erosion and Profit Shifting.” OECD Publishing. Available at: http://dx.doi.org/10.1787/9789264202719-en.
OECD. 2014. “Automatic Exchange of Financial Account Information.” Background Information Brief.
O’Murchu, Cynthia. 2014. “Tax Haven Buyers Set off Property Alarm in England and Wales.” Financial Times, July 31. http://www.ft.com/intl /cms/s/0/6cb11114-18aa-11e4-a51a-00144 feabdc0.html.
Piketty, Thomas, and Gabriel Zucman. 2014. “Capital is Back: Wealth-Income Ratios in Rich Countries, 1700–2010.” Quarterly Journal of Economics 129(3): 1255–1310.
Roine, Jesper, and Daniel Waldenström. 2009. “Wealth Concentration over the Path of Develop-ment: Sweden, 1873–2006.” Scandinavian Journal of Economics 111(1): 151–87.
Saez, Emmanuel, and Gabriel Zucman. 2014. “Wealth Inequality in the United States since 1913: Evidence from Capitalized Income Tax Data.” http://gabriel-zucman.eu/files/Saez Zucman2014.pdf.
Slemrod, Joel, and John D. Wilson. 2009. “Tax
148 Journal of Economic Perspectives
Competition with Parasitic Tax Havens.” Journal of Public Economics 93(11–12): 1261–70.
Sullivan, Martin A. 2004. “Data Show Dramatic Shift of Profits to Tax Havens.” Tax Notes, September 13, pp. 1190–1200.
Toder, Eric, and Alan D. Viard. 2014. “Major Surgery Needed: A Call for Structural Reform of the U.S. Corporate Income Tax.” Available at the Tax Policy Center: http://www.taxpolicycenter .org/publications/url.cfm?ID=413090.
US Department of Justice. 2014. “Credit Suisse Pleads Guilty to Conspiracy to Aid and Assist U.S. Taxpayers in Filing False Returns.” Press Release, May 19. http://www.justice.gov/opa/pr/2014/May /14-ag-531.html.
US Senate. 2008. Tax Haven Banks and US Tax Compliance. Staff Report of the Permanent Subcommittee on Investigations, July.
US Senate. 2014. Offshore Tax Evasion: The
Effort to Collect Unpaid Taxes on Billions in Hidden Offshore Accounts. Staff Report of the Permanent Subcommittee on Investigations. Washington, DC, February.
Yagan, Danny. 2014. “Capital Tax Reform and the Real Economy: The Effects of the 2003 Divi-dend Tax Cut.” http://eml.berkeley.edu/~yagan /DividendTax.pdf.
Zucman, Gabriel. 2013a. “The Missing Wealth of Nations: Are Europe and the U.S. Net Debtors or Net Creditors?” Quarterly Journal of Economics 128(3): 1321–64.
Zucman, Gabriel. 2013b. La Richesse Cachée des Nations. Paris: Le Seuil. (Forthcoming, University of Chicago Press).
Zwick, Eric, and James Mahon. 2014. “Do Financial Frictions Amplify Fiscal Policy? Evidence from Business Investment Stimulus.” http://www .ericzwick.com/stimulus/stimulus.pdf.
Journal of Economic Perspectives—Volume 28, Number 4—Fall 2014—Pages 149–168
F or over 40 years, the benchmark economic model of tax evasion has been the Allingham and Sandmo (1972) model, in which self-interested taxpayers choose how much income to report to the tax authority by trading off the
benefits of evasion (lower tax payments) against the costs of evasion (the possibility of being caught and punished). In this model, the key policy parameters affecting tax evasion are the tax rate, the detection probability, and the penalty imposed conditional on the evasion being detected.
However, there is an apparent disconnect between much of the academic literature on tax compliance and the administration of tax policy. While tax admin-istrators are obviously concerned about enforcement, they also tend to place a great deal of emphasis on improving “tax morale,” by which they generally mean increasing voluntary compliance with tax laws and creating a social norm of compli-ance. The OECD (2001), for example, noted that “[t]he promotion of voluntary compliance should be a primary concern of revenue authorities” in its principles for good tax administration, and it has highlighted the importance of tax morale more generally (OECD 2013).
Tax authorities around the world pursue policies that reflect their belief that nonpecuniary factors are important in tax compliance decisions. More than half of US states have or have had “name and shame” programs in which the names of top tax debtors are revealed publicly on state websites. In a more colorful example, the
Tax Morale
■ Erzo F. P. Luttmer is Professor of Economics, Dartmouth College, Hanover, New Hampshire. Monica Singhal is Associate Professor of Public Policy, Harvard Kennedy School, Cambridge, Massachusetts. Their email addresses are [email protected] and Monica [email protected].
http://dx.doi.org/10.1257/jep.28.4.149 doi=10.1257/jep.28.4.149
Erzo F. P. Luttmer and Monica Singhal
150 Journal of Economic Perspectives
city of Patna in Bihar, India, deployed “singing eunuchs” to shame shopkeepers into paying their taxes (BBC News 2006).1 An alternative to shaming tax evaders is to recog-nize compliant or high-paying taxpayers publicly, a strategy adopted by an increasing number of developing countries. Some nations have instituted public campaigns to change attitudes towards tax evasion. For example, recent television and print adver-tising campaigns in Italy have highlighted the need to reduce widespread tax evasion in order to better cope with the European debt crisis (Povoledo 2011).
The term “tax morale” is often used in reference to these types of influences on tax compliance. We will define tax morale broadly as an umbrella term capturing nonpe-cuniary motivations for tax compliance as well as factors that fall outside the standard, expected utility framework. For example, individuals may have some intrinsic motiva-tion to pay taxes or feel guilt or shame for failure to comply. They may comply due to reciprocal motivations: the willingness to pay taxes in exchange for benefits that the state provides to them or to others even though their pecuniary payoff would be higher if they didn’t pay taxes. Individuals may be influenced by peer behavior and the possibility of social recognition or sanctions from peers. Cultural or social norms can affect the strength of these intrinsic motivations, reciprocal motivations, or the sensitivity to peers. We will also include deviations from standard expected utility maximization, such as loss aversion, in our definition of tax morale.
Michael Waweru (2004), then the head of Kenya’s revenue authority, captured many of the tax morale channels we have in mind during a presentation to the President of Kenya. Waweru said:
KRA [Kenya Revenue Authority] has organised a Taxpayers’ week from 18th to 23rd October throughout the country. The period was carefully chosen to coincide with Kenyatta Day celebrations in honour of our national heroes. The running theme throughout the celebrations will be “Kulipa Ushuru ni kulinda Uhuru” or “Pay your Taxes and set your country free” as a way of paying glowing tribute to those who dedicated their lives to free our beloved country from the humiliation of colonialism. Present taxpayers are taking a leading role in freeing their country from donor dependency to economic independence. The climax of these celebrations will be on 21st October 2004, when we will be recognizing Distinguished Taxpayers.
The linkage of tax compliance with honoring national heroes is clearly meant to prompt intrinsically motivated compliance, and the reference to compliance reducing donor dependence highlights the notion that tax payments have a direct benefit for society. The potential importance of peer effects and social norms is illustrated through the decision to recognize “Distinguished Taxpayers” and the adoption of a slogan that seems designed to change the overall social attitude toward tax compliance. Notice that some of these policies may confer private pecuniary
1 The article uses the term “eunuch” for the community in South Asia referred to as “hijras,” who are not necessarily eunuchs in the technical sense.
Erzo F. P. Luttmer and Monica Singhal 151
rewards. For example, public recognition could improve firms’ reputations and therefore revenues. Isolating the components of behavior that are attributable to tax morale is therefore an empirical challenge.
We argue that tax morale is indeed an important component of tax compliance decisions, though we view enforcement as the primary driver of compliance. We then demonstrate that tax morale operates through a variety of underlying mecha-nisms, drawing on evidence from laboratory studies, natural experiments, and an emerging literature employing randomized field experiments. We do not attempt to provide a comprehensive review of the literature. Rather, we highlight a few studies that illustrate specific channels through which tax morale can affect compli-ance behavior. Finally, we consider the implications for tax policy and attempt to understand why recent interventions designed to improve morale, and thereby compliance, have had mixed results to date.
How Important is Tax Morale?
The standard Allingham and Sandmo model (1972) is a straightforward appli-cation of the Becker (1968) model of crime to the tax-evasion context: risk-averse individuals weigh the utility benefits and costs of evasion to optimize their compli-ance behavior. The model yields intuitive comparative statics—for example, that a larger penalty or a greater probability of detection should lead to a reduction in tax evasion. However, Allingham and Sandmo were also the first to recognize that their model does not capture all motivations for tax compliance, writing: “This is a very simple theory, and it may perhaps be criticized for giving too little attention to nonpecuniary factors in the taxpayer’s decision on whether or not to evade taxes.” Again, we use the term “tax morale” as a shorthand for any such nonpecuniary factors as well as deviations from expected utility maximization.
A natural question is how important tax morale is for compliance: Is it a major determinant of compliance or does it only have a trivial impact? A first sense of the importance of tax morale comes from surveys that directly ask individuals about attitudes towards tax evasion. For example, the World Values Survey asks respon-dents to rate the justifiability of “cheating on taxes if you have a chance.” Over 60 percent of respondents worldwide answer that cheating is never justifiable, and over 80 percent give a response of 8 or higher on a 10-point scale where 10 denotes that cheating is never justifiable.2 Similarly, over 80 percent of respondents to the 2004 wave of the European Social Survey “agreed” or “strongly agreed” with the statement that “citizens should not cheat on their taxes.” These survey ques-tions indicate a strong overall view that tax evasion is wrong, suggesting that the Allingham and Sandmo (1972) model does not capture the full range of factors relevant for compliance.
2 Calculated from the 2005–2007 wave of the World Values Survey using data from 53 countries. Data from Ghana and Serbia were omitted due to data quality issues.
152 Journal of Economic Perspectives
We would of course want to know whether these self-reported attitudes translate into actual compliance behavior. Some studies have attempted to measure evasion at the country level and relate this to survey measures of tax morale. However, constructing valid proxies of tax evasion across countries is very challenging. In addition, relating constructed proxies for tax evasion to tax morale (or other predic-tive variables) typically requires strong assumptions about how to measure untaxed economic activity, assumptions which are unlikely to hold in practice (for a detailed discussion, see Slemrod and Weber 2012).3
A second way to assess the importance of tax morale is indirectly, by attempting to determine the degree of compliance that would be predicted given the charac-teristics of the enforcement environment. Additional residual compliance is then attributed to tax morale. The Allingham and Sandmo (1972) model of tax evasion does not take into account that audit rates could be conditional on discrepancies between self-reported income and reports from third parties, such as employers (Kleven, Knudsen, Kreiner, Pedersen, and Saez 2011). For example, individuals in the United States are unlikely to evade on income that employers are required to report to the IRS using a W-2 form because they know that such evasion will be detected with near certainty. This situation can lead to low observed tax evasion, as well as low audit and penalty rates in equilibrium. Hence, inferring tax morale as residual compliance in the Allingham and Sandmo (1972) model is credible only in settings without third-party reporting.
Even on forms of income not subject to third-party reporting, compliance often appears higher than would be predicted under observed audit rates, realistic penalties, and plausible levels of risk aversion. Alm, McClelland, and Schulze (1992) calibrate the Allingham and Sandmo model for reasonable parameter values for the United States. They find that a mid-range estimate of the coefficient of relative risk aversion (γ = 3) implies compliance of 13 percent, well below audit-based estimates of compliance for most forms of business income (where third-party reporting is limited) in the United States. For example, compliance on nonfarm proprietor income in 2001 was 43 percent (Slemrod 2007). A recent audit study in Denmark was able to distinguish third-party and self-reported income at the line-item level (Kleven et al. 2011). The study found even higher compliance (in the range of 80–95 percent) for most sources of self-reported income. To put this in context, the Alm, McClelland, and Schulze (1992) calibrations require the coefficient of relative
3 Perhaps the most commonly used proxies of tax evasion are measures of the shadow economy constructed using a MIMIC (Multiple Indicators Multiple Causes) approach (for example, Schneider 2005, and subsequent measures derived from it). The resulting shadow economy measure is a weighted sum of predictors such as per capita GDP, indicators of fiscal burden, quality of institutions, and some-times even tax morale itself. While this measure can be informative about variation across countries and over time, regressing the shadow economy measure on a predictor such as tax morale leads to a mechanical relationship if tax morale was used to construct the shadow economy variable. Even if tax morale isn’t used to construct the shadow economy measure, this regression ultimately uncovers a corre-lation between one predictor of the shadow economy (tax morale) and other predictors of the shadow economy (that is, a weighted average of predictors such as GDP, fiscal burden and quality of institutions).
Tax Morale 153
risk aversion to be quite high (γ = 5) to achieve 44 percent compliance and extraor-dinarily high (γ = 10) to achieve 71 percent compliance.4
There are at least three caveats to these calibration exercises. First, audit studies reveal detected evasion, which is likely to be a lower bound on true evasion. Second, underreporting income or overreporting deductions is likely to invite scrutiny by the tax authorities, even absent third-party reporting, so that audit rates are not random but rather a function of misreporting. Finally, some residual compliance could be driven by private pecuniary benefits from compliance, such as improved access to credit or productivity gains from not needing to keep double books. Nevertheless, these calibration exercises do suggest a nontrivial role for nonpecuniary factors in encouraging tax compliance.
A third avenue for learning about the importance of tax morale is to examine compliance behavior in environments where tax enforcement is limited or nonexis-tent and private pecuniary benefits of compliance are likely to be minimal. Dwenger, Kleven, Rasul, and Rincke (2014), focus on such an environment in studying compli-ance with the local Protestant church tax in a metropolitan area in Bavaria. When collecting the local church tax, the Protestant church makes clear that this tax is legally obligated as specified by the German tax code. However, this tax is not enforced and knowledge of the lack of enforcement appears widespread: a treatment in which the collection letter explicitly stated that collection would not be enforced had no statistically or economically significant effect on compliance. Despite the lack of enforcement, about 20 percent of individuals pay at least as much tax as is owed, indicating an important role for tax-morale-driven compliance in this setting.
Whether this finding generalizes is unclear for at least two reasons (which work in opposite directions). First, the use of funds from the local church tax is associated with a particular type of service, which individuals may value more than the services funded by other types of taxes. Second, the fact that there was zero enforcement, despite the fact that the tax is easily enforceable, is unusual. It could signal to individuals that, while the church tax is technically a legal obligation, the church/government does not actually consider it an important civic obligation. This in turn could undermine tax morale.
A fourth way to shed light on the importance of tax morale on compliance is to examine compliance behavior of taxpayers that measurably differ in tax morale but all face the same enforcement environment. DeBacker, Heim, and Tran (2012) relate corporate tax evasion of foreign-held corporations in the United States to corruption levels in the owners’ countries of origin. Given that the enforcement environment is common, the corruption levels in the countries of origin can affect compliance only through a tax morale channel. An important strength of this study is that it uses data from over 25,000 IRS corporate tax audits; it is rare that a study’s
4 To illustrate the degree of risk aversion an individual exhibits at γ = 5 and γ = 10, consider whether an individual is willing to take a gamble that offers a 50 percent chance of doubling one’s income and a 50 percent chance of losing X percent of income. The individual with γ = 5 finds this gamble too risky to accept if X ≥ 16 percent whereas an individual with γ = 10 declines this gamble whenever X ≥ 8 percent.
154 Journal of Economic Perspectives
information on tax evasion is available at the taxpayer level and is derived from actual audit data. DeBacker, Heim, and Tran (2012) find that corporations with owners from more corrupt countries evade more US tax. This effect is both statis-tically significant and economically sizable: an average-sized firm with an owner from a country with the level of corruption of Nigeria has an evasion level that is 8 percent of the tax obligation higher than a similar firm with an owner from a country with the level of corruption of Sweden. The authors control for firm characteristics and a number of other source-country characteristics (such as per capita GDP), which reduces the scope for omitted variable bias to drive their results. Given that corruption in the country of origin does not capture all aspects of the owner’s tax morale (that is, owners from the same country may have different tax morale), the estimated magnitude of tax morale is likely to be a lower bound of the total effect of tax morale. Hence, this study suggests a sizable role for tax morale in compliance decisions.
Our reading of these four sources of evidence taken together is that tax morale plays a meaningful role in tax compliance behavior, at least in the developed-country settings on which this evidence was largely based. It would be useful to quantify the importance of tax morale relative to the importance of tax enforcement, but implementing such a decomposition faces both conceptual and practical challenges. Conceptually, the importance of tax morale depends on the enforcement environment because tax morale and enforcement generally interact. At one extreme, if enforcement is so draconian that compliance is perfect, there is no role for tax morale. At the other extreme of no enforcement whatsoever, tax morale may be eroded because the lack of enforcement efforts signals that compli-ance is unimportant.
One practical challenge is that—even in the absence of enforcement inter-actions—we would expect the relative importance of tax morale to vary across countries and even across types of taxes within a country. Even in the rare cases in which we are able to measure the role of tax morale (for example, in the German church tax case), resulting estimates are unlikely to generalize. A further chal-lenge when attempting to decompose cross-country variation in compliance is that we measure tax morale on a scale that does not have a well-defined zero. In the DeBacker, Heim, and Tran (2012) study of US corporate tax evasion mentioned above, for example, we can compare compliance at different observed levels of tax morale, but cannot assess what compliance would have been if tax morale were zero. While we cannot quantify the relative importance of enforcement and tax morale, our view is that enforcement is the primary driver of tax compliance but that tax morale meaningfully enhances compliance.
It is important to note that what matters for policy is not so much what role tax morale plays in current compliance, but whether it is feasible to improve tax morale on the margin and whether a given increase in compliance can be achieved at a lower cost by improving tax morale than by increasing enforcement. Before consid-ering which policies could affect tax morale, it is therefore important to understand the mechanisms through which tax morale may operate.
Erzo F. P. Luttmer and Monica Singhal 155
Tax Morale Mechanisms
While tax morale is commonly used as a single concept, it can be more accu-rately thought of as a set of underlying motivations for tax compliance. Identifying the channels through which tax morale operates is both important for under-standing individual preferences and for designing appropriate policy responses. We consider five broadly defined potential mechanisms through which tax morale could operate, recognizing that these channels are not mutually exclusive and are in fact likely to overlap and interact with each other.
The five classes of mechanisms are: 1) intrinsic motivation, which can be viewed as an additional term in the utility function that increases in the amount of taxes that the individual decides to pay (with, possibly, a discontinuous upward jump for paying the required amount); 2) reciprocity, in which an additional utility term for paying taxes depends in some way on the individual’s relationship to the state (for example, on public goods provided by the state or perceptions about the fair-ness of the tax system); 3) peer effects and social influences, in which the additional utility term for paying taxes depends on views or behaviors of other individuals; 4) long-run cultural factors that may affect the willingness to pay taxes; and 5) infor-mation imperfections and deviations from utility maximization (for example, individuals may misperceive the probability of being detected in evading taxes or may exhibit loss aversion).
Forms of Intrinsic MotivationWhen considering how tax morale might influence taxpayer decisions, one
possibility is forms of intrinsic motivation that may induce people to comply with laws and expectations. Other forms of intrinsic motivation are feelings of pride and positive self-image that are often associated with honesty and the fulfillment of civic duties, and altruism toward others, which could result in a willingness to contribute to public goods through the tax system. Cheating on taxes may cause feelings of guilt or shame (Andreoni, Erard, and Feinstein 1998).
Direct evidence on the role of intrinsic motivations comes from Dwenger, Kleven, Rasul, and Rincke (2014). As discussed above, this study documents some degree of compliance with the local German Protestant church tax, even in an envi-ronment in which both actual and perceived enforcement is nonexistent. While this overall compliance effect could be driven by several underlying components of tax morale, we see sharp bunching at the exact level of owed tax. One interpre-tation of this bunching (if individuals are truly unconcerned about enforcement) is that it reflects one specific form of intrinsic motivation: a desire to comply with the law.
Indirect evidence on the role of intrinsic motivations comes from field experi-ments that have attempted to prime intrinsic motivations. These interventions take the form of “moral suasion” letters to taxpayers that include text emphasizing various elements of tax morale. The effects of these letters are generally compared to some type of baseline letter to address the possibility that receiving a letter related to taxes
156 Journal of Economic Perspectives
might directly affect compliance by signaling a change in the enforcement regime. If we observe treatment effects in response to such letters, this indicates that the particular underlying channel of tax morale that was primed is operating. However, it is important to stress that a lack of treatment effects does not necessarily imply that the underlying channel does not influence compliance: it may exist, but be inelastic to the particular intervention.
Indeed, many field interventions that have attempted to prime tax morale have failed to find effects on compliance. An example of an intervention approximating pure moral suasion is an experiment conducted by Fellner, Sausgruber, and Traxler (2013), who examine evasion of TV and radio licensing fees in Austria. One of the treatment arms added the following language to a baseline letter: “Those who do not conscientiously register their broadcasting receivers not only violate the law, but also harm all honest households. Hence, registering is also a matter of fairness.” The study found that this moral suasion letter did not improve compliance relative to the baseline letter. Other studies using this methodology include information about how tax revenues are used or about the compliance of others. Since these interventions seek to trigger motives like reciprocity or peer effects, we will discuss them in the subsections below.
If tax payments are partially intrinsically motivated, then the extrinsic incen-tives of tax enforcement could potentially crowd out intrinsic motivation. This possibility is predicted by theoretical models in which external incentives crowd out prosocial behavior (for example, Bénabou and Tirole 2006). It is also consistent with the authors’ own conversations with tax officials in developing countries, in which the officials repeatedly expressed the view that heavy-handed tax enforce-ment could backfire by reducing “voluntary” compliance. But at least in the context of local German church taxes—where we see clear evidence of intrinsically moti-vated payment—enforcement interventions have indicated that this type of crowd out appears limited. Dwenger, Kleven, Rasul, and Rincke (2014) show that inter-ventions with audit threats increase compliance of those who evaded in the prior year but do not have a significant effect on payments by those initially paying at or above the owed amount. Boyer, Dwenger, and Rincke (2014) conduct a related randomized evaluation, in a setting similar to Dwenger et al. (2014), but focusing on the local Catholic church tax rather than the local Protestant church tax. Letters emphasizing that the church tax is a compulsory payment rather than a donation appear to result in some crowd out for individuals who donated infrequently in previous years, but have a small and insignificant effect on those who consistently donated in the past.
While we do not wish to generalize too far from this specific context, the church tax findings overall do suggest that enforcement does not erode intrinsic motiva-tion. It thus can be a useful tool for compliance including in settings where some individuals are intrinsically motivated. In theory, enforcement could even amplify intrinsic motivation by signaling that tax compliance is an important legal or civic duty, although field interventions to date have not been designed in a way that would allow us to test for such effects.
Tax Morale 157
ReciprocityWe use the term reciprocity broadly for situations in which willingness to pay
taxes depends on the individual’s relationship with the state other than direct tax–benefit linkages (where a tax payment directly causes benefits to the individual to increase). Individuals may view taxes as part of a social contract: tax payments are made in exchange for services provided by the state. This view of tax compli-ance suggests that compliance may be affected by perceptions of the legitimacy of the state (Levi 1989) as well as by attitudes toward government or perceptions about the fairness of the tax schedule (for example, Feld and Frey 2002; Hofmann, Hoelzl, and Kirchler 2008). Compliance may also be affected by the types of government services that are funded by tax revenues and how these are viewed by the taxpayer.5
A number of studies have documented positive correlations between survey measures of institutional quality, trust in government, and satisfaction with public services and survey measures of tax morale (for a review, see OECD 2013), as well as relationships between institutions and tax morale (for example, Torgler 2005). However, specific causal channels can be difficult to isolate. Some studies have manipulated these elements in a laboratory setting using student subjects, with parameters approximating the US income tax system, and have found that partici-pants are less likely to evade taxes when funds are given to an organization that they support and when they feel active in the decision-making process (for example, Alm, Jackson, and McKee 1993).
Changing the decision-making process or actual use of tax revenues is obviously much more challenging outside the laboratory setting. Existing randomized field studies have therefore attempted to prime reciprocal motivations by highlighting the beneficial uses of tax revenues. One early study included a treatment arm that described the types of social programs on which tax revenues in Minnesota are spent, noting that “when taxpayers do not pay what they owe, the entire commu-nity suffers” (Blumenthal, Christian, and Slemrod 2001). Dwenger et al. (2014) included a treatment arm emphasizing that local German church tax revenues fund work in the parish, and Castro and Scartascini (2013) gave taxpayers in Argentina information about specific public goods in their community that had recently been provided by the local government. None of these studies found significant effects of these treatments on tax compliance. Together with the Fellner, Sausgruber, and Traxler (2013) findings, the literature to date thus suggests limited power of a variety of types of moral suasion. Ariel (2012) even finds suggestive evidence of moral suasion letters backfiring in a field experiment on value-added tax compli-ance by small corporations in Israel.
5 One channel that we include with reciprocity is the possibility that the individual’s willingness to comply depends on the use of raised revenue. This channel could operate because the individual feels “pure” altruism towards the beneficiaries of government spending. Despite the fact that pure altruism is strictly speaking an intrinsic motivation, we discuss this channel in the current subsection because we cannot empirically distinguish it from reciprocal motivations.
158 Journal of Economic Perspectives
However, there are some counterexamples. Bott, Cappelen, Sørensen, and Tungodden (2014) examine compliance with foreign-income reporting require-ments in a field experiment involving Norwegian taxpayers who had evaded taxes on foreign income in a prior year. They find positive effects when the results of their four moral suasion treatments are pooled. Three of these treatments high-lighted the public goods on which tax revenues are spent while the fourth noted that the majority of taxpayers comply fully, so compliance is a matter of fairness. Hence, these treatments may have triggered other aspects of tax morale in addi-tion to reciprocal motivations. Finally, Hallsworth, List, Metcalfe, and Vlaev (2014) examine a different margin of compliance, showing that late payment of taxes in the United Kingdom falls in response to reminder letters that emphasize the ways in which tax revenue finances public goods.
One possible interpretation for the predominance of null findings is that reciprocal motivations have little relevance for tax compliance decisions outside the laboratory. However, it is also possible—and in our view, likely—that such inter-ventions are often not powerful enough to affect compliance. Individuals’ views of the competence of the government and the value of the public services it provides are formed through a lifetime of personal experience: a few lines of text in a mailed letter may just not be sufficient to cause taxpayers to update their beliefs or attitudes in many contexts.
Manipulating other potential reciprocal motivations, such as attitudes about the fairness of the tax system or trust in government, is difficult to do in the context of a laboratory or field experiment. Some direct evidence on perceptions of fairness and tax compliance comes from Besley, Jensen, and Persson (2014), who examine the poll tax imposed in the United Kingdom starting in 1989–1990 under the Thatcher government. The poll tax replaced a tax based on property values. A massive back-lash against this tax forced its repeal only three years later and resulted in a return to a property-value-based tax (the “council tax”). The authors argue that the back-lash reflected a widespread perception that the poll tax system was unfair because it was not related to ability to pay, and they document a sharp spike in evasion at the time the poll tax was introduced.
While the move to a poll tax is an extreme example, the findings do suggest that compliance decisions can be affected by government policy, conditional on a given enforcement environment. If tax payment is motivated—at least in part—by the benefits provided by taxation or perceptions of the legitimacy of the state, the possibility of multiple equilibria arises. Weak tax morale could lead to low compli-ance, low revenue, and poor state capacity and provision of services, thereby further reducing tax morale.
Peer Effects and Social InfluencesWe now turn to ways in which an individual’s compliance could be directly
affected by others. Individuals may wish to conform to the behavior of others, so that peer compliance directly affects the individual’s own compliance. Individuals may also wish to signal something about their type to their peers through their

Erzo F. P. Luttmer and Monica Singhal 159
compliance behavior. The value of this signal may depend on peer compliance: for example, paying taxes may only be a positive signal to others who are also compliant, or inference about type could depend on the number of compliant taxpayers. Finally, if individuals imperfectly perceive the enforcement environment, the behavior of peers may influence individuals’ own beliefs about the consequences of tax evasion.
One implication of these models is that a shock to individual compliance can be amplified through social influences. The Besley, Jensen, and Persson (2014) study of Britain’s poll tax presents a model that includes both reciprocity arising from perceptions of fairness of the tax schedule (defined as intrinsic motiva-tion by the authors) as well as a social norm effect arising from a desire to signal prosocial motivations to others. As noted above, the temporary shift to a poll tax sharply increases evasion, arguably due to a reduction in reciprocity motivations. However, higher levels of evasion persist well after the poll tax is replaced with the property-value-based council tax, particularly in councils that had high evasion during the poll tax period, consistent with a social norm effect.
These findings raise the question of whether governments have the capacity to influence social norms for compliance in a positive way. As discussed in the intro-duction, tax authorities around the world have undertaken policies with this goal in mind. A recent set of field experiments has begun to evaluate the causal impact of such interventions on compliance. A first channel through which governments could leverage social interactions is by providing information on peer behavior. However, field experiments in high-compliance contexts notifying taxpayers that over 90 percent of individuals comply have failed to find significant treatment effects (Blumenthal, Christian, and Slemrod 2001; Fellner, Sausgruber, and Traxler 2013).
It is possible that these studies have not found treatment effects because indi-viduals already had a clear sense of overall compliance. One study that examines this possibility is Del Carpio (2014). In a field experiment on property tax collection in Peru, she also collected perceptions of tax compliance and enforcement in the treatment and control groups after the interventions had been administered.6 She finds that an intervention combining information about peer compliance and a payment reminder leads to a small and statistically insignificant increase in compli-ance relative to a baseline intervention consisting of only a payment reminder. However, this combined intervention did not significantly influence perceptions of peer compliance relative to the baseline intervention. At least in this experiment, it is plausible that information on peer compliance failed to affect own compliance because this information did not sufficiently alter perceptions of peer compliance.
One study that did find effects of providing information on peer behavior is Hallsworth, List, Metcalfe, and Vlaev (2014), who examine the effects of a variety of interventions on the timely payment of taxes in the United Kingdom. In addition
6 Examining responses relative to priors is also important because of the possibility of perverse effects. If individuals realize that compliance is actually lower than they thought, they may reduce their own compli-ance behavior. This possibility is particularly important in developing economies, where tax compliance is often low.
160 Journal of Economic Perspectives
to the “reciprocity” interventions discussed above, this study gave some participants one of the following three messages about compliance norms: 1) “9 out of 10 people pay their tax on time”; 2) “9 out of 10 people in the U.K. pay their tax on time”; or 3) “9 out of 10 people in the U.K. pay their tax on time. You are currently in the very small minority of people who have not paid us yet.” They find significant effects on early payment from all three messages, with the largest effects from the final message. In a subsequent experiment, the authors test the “descriptive” norms from the first experiment (what other individuals are doing) against “injunctive” norms (what others believe should be done) and find that descriptive norms appear to be more powerful overall. It is possible that these interventions did change individual priors in this context; it may also be that this compliance margin (timely payment) is more sensitive to such treatments than the evasion decision.
Another way in which governments could leverage social forces is to facilitate social recognition for compliant taxpayers. Emerging evidence from field experi-ments suggests that recognition can in fact encourage compliance, at least under some conditions. Dwenger et al. (2014) include a treatment arm in which those paying at least the required amount of the German church tax have a probability of having their names published in a local newspaper if they wish to do so. This treatment reduces payments for those who had evaded the church tax in the past, indicating that social recognition can backfire for those who lack intrinsic moti-vation to pay the church tax. In contrast, they find suggestive evidence that the treatment further increases payments among those who were already motivated to pay more than the required amount in the past.
These heterogeneous findings are perhaps not surprising: we would expect the effects of social norms and recognition to depend on how individuals update their priors about peer compliance and how they view the signaling value of compli-ance. These factors may vary both across contexts and across types of taxpayers. Treatment effects may also cancel out in aggregate, if, for example, an intervention causes some taxpayers to positively update their views about compliance but causes others to update negatively. We view this body of evidence as indicative of a role for peer effects and social influences in tax compliance but much remains to be learned about the circumstances under which interventions targeting these motiva-tions are effective in changing behavior.
CultureCulture refers to broad social norms that persist over long periods of time
and across generations. Such persistence is one of the primary characteristics that distinguishes “culture” from contemporaneous peer effects, though the two are obviously related. The parameters of the additional utility term for paying taxes, whether it is conditional on the state’s behavior or on the behaviors and views of other individuals, can be considered part of one’s culture if these parameters reflect (internalized) social norms that persist over long periods and across generations.
The obvious empirical challenge in discerning a causal effect of culture is to sepa-rate the effects of culture from other aspects of the environment. Studies examining
Tax Morale 161
the effect of culture on tax compliance have therefore attempted to examine the behavior of individuals from different cultural backgrounds when placed in a similar environment. One strand of literature has compared tax evasion in similar labora-tory experiments across two or three countries (for example, Alm, Sanchez, and de Juan 1995; Cummings, Martinez-Vazquez, McKee, and Torgler 2009; Gërxhani and Schram 2006; Lefebvre, Pestieau, Riedl, and Villeval 2011). These studies generally find differences across countries in tax evasion despite similar subject pools and experimental protocols. However, given the limited number of countries in each of these studies (three at most), these studies cannot credibly relate country-level evasion to any measure of country-level tax morale. Hence, they measure culture as a “residual”—that is, attribute whatever gap cannot be explained by the observable factors in their study to the effect of culture or tax morale.
An alternative strategy to examine the effect of culture is to exploit variation arising from individuals who reside in the same country (and are therefore argu-ably subject to the same current institutions and environment) but have varying countries of origin. Using survey-based measures of tax morale, Halla (2012) finds that American-born individuals in the United States have higher tax morale when their country of ancestry has higher average tax morale, controlling for individual demographics. Individuals in the United States with ancestors from a country with a 10-percentage point higher tax morale have about a 4-percentage point higher tax morale, where both tax-morale questions are measured as binary variables. Kountouris and Remoundou (2013) find similarly sized effects among first-generation immigrants in a large sample of European countries. A potential concern with these findings is that culture could simply affect the interpretation of or response to such survey questions. Thus, evidence on the role of culture is more credible when tax morale can be related to other outcome measures, ideally direct measures of tax evasion.7 The DeBacker, Heim, and Tran (2012) study of US corporations with owners from different countries, discussed above, is able to relate culture to actual compliance behavior in an analogous setting. Their finding that corruption in firm owners’ countries of origin affects evasion even in a common enforcement environment is a convincing demonstration that culture does influ-ence real behavior.
Taken together, these results suggest that there are indeed cultural differences across countries, both in attitudes toward evasion and compliance behavior. This
7 Because Halla (2012) has no measures of tax evasion of his General Social Survey respondents, he cannot directly relate culture to outcomes for respondents. However, he ingeniously uses a “reverse” strategy. He examines whether current evasion outcomes in the countries of ancestry can be explained by tax morale as measured by respondents in the United States from the corresponding countries of ancestry. As a proxy for evasion, he uses a widely used measure of underground production (also referred to as “shadow economy”). However, as we noted earlier in footnote 3, it is generally not valid to relate measures of the shadow economy that are constructed as combinations of predictors to measures of tax morale. The particular measure of the shadow economy that Halla borrows from the literature is constructed using tax morale data, so regressing it on tax morale can uncover a mechanical relationship.
162 Journal of Economic Perspectives
implies that we may see persistent differences in compliance across countries even if they have similar enforcement environments.
Information Imperfections and Deviations from Expected UtilityInformation imperfections and decision-making biases are not always consid-
ered in the context of tax morale, but they clearly represent deviations from a fully rational model of tax compliance. Such factors could affect individuals making compliance decisions in several ways: taxpayers might misperceive parameters of the optimization problem (for example, the likelihood or consequences of an audit); fail to comply due to limited attention or costs of complexity; or be subject to system-atic biases in their decision process (for example, loss aversion or overweighting of small probabilities).
Most tax authorities deliberately limit information on their auditing and enforcement procedures. It would therefore not be surprising for individuals to have incomplete information about true audit rates or penalties. Using matched IRS-survey data from the United States, Scholz and Pinney (1995) find that individuals report a subjective probability of getting caught (conditional on underreporting income) that is on average an order of magnitude higher than the probability that the IRS will actually audit an individual’s return. Further, they find that variation in actual audit probabilities across individuals is not predictive of the variation in subjective prob-abilities of getting caught. However, these results come with a caveat: the subjective probabilities of getting caught were based on a hypothetical case where the indi-vidual underreports income, which were then compared to IRS audit probabilities that were based on all tax returns, not just those with underreported incomes. Natu-rally, the objective IRS audit probabilities would likely have been higher if they had been based only on tax returns with underreported income.
In contrast, the Del Carpio (2014) study mentioned earlier finds that individ-uals in Peru perceive tax enforcement to be weaker than it actually is, which implies that disclosure of true enforcement could enhance tax collection. Del Carpio finds that a combination of a payment reminder and information about enforce-ment of a local property tax both increases perceived enforcement and results in increased tax compliance. Interestingly, the effects appear to be largely driven by the payment reminder, which suggests a failure of individual optimization due to limited attention rather than through misperceptions of the probability of enforce-ment efforts.8 This is consistent with Hallsworth, List, Metcalfe, and Vlaev (2014), which finds a direct effect of payment reminders on timely remittance of owed UK income taxes. A role for limited attention is also found by Dwenger et al. (2014). A “salience” treatment that shortens the standard German church tax mailing and increases the focus on the church tax payment obligation, schedules, and deadline
8 Another possible interpretation is that the payment reminder itself increased enforcement perceptions and the specific enforcement information did not have an incremental effect. Del Carpio (2014) finds that the payment reminder on its own did not significantly increase perceived enforcement, although it is possible that the lack of significance reflects lack of power in measured perceptions.
Erzo F. P. Luttmer and Monica Singhal 163
significantly decreases the fraction of people who evade the church tax. Together, these results suggest that tax payment may be subject to the same types of behav-ioral biases we observe in many other contexts: individuals may simply forget to make payments or procrastinate in remitting owed taxes. In very low-enforcement environments, such behavior not only delays tax payments but may in fact reduce overall revenue collection if the tax authority lacks the capacity to follow up with nonpayers. Individuals may also have limited information about the rules of the tax code. Recent testimony to Congress from the US General Accountability Office (2011), for example, argued that complexity contributes to the “tax gap” between what tax is owed and what is paid. However, it is difficult to know the extent to which complexity leads to honest errors in reporting versus facilitates deliberate evasion.
Finally, people may in some cases deviate from the behavior predicted by expected utility theory in the Allingham and Sandmo (1972) model. A first indica-tion of such deviation comes from Alm, McClelland, and Schulze (1992), who find in a laboratory setting that student subjects react remarkably strongly to a small audit probability and that their behavior cannot be rationally explained at any level of risk-aversion. Of course, the notion that individuals may overweight small probabilities is predicted by prospect theory. More recently, two studies using large administra-tive datasets find evidence that individuals are much more likely to seek tax shelters if they have a balance due than if they are to receive a tax refund. Rees-Jones (2014) finds a shift in the mass of the balance-due distribution in the United States away from positive amounts. This shift is particularly pronounced for taxpayers with greater access to tax shelters. The author demonstrates that such behavior could be driven by loss-averse individuals pursuing sheltering options more aggressively when they have a balance due and rules out other plausible explanations for the observed patterns. While tax sheltering need not imply illegality, it seems likely that at least some of the increased use of tax shelters stems from tax evasion. Engström, Nordblom, Ohlsson, and Persson (2013) pursue a related strategy using data from Sweden. They demonstrate that the balance due prior to adjustments affects the rate at which individuals claim deductions for “other expenses for earning employment income” in a manner predicted by a model of loss aversion. This type of deduction is a plausible proxy for tax evasion because it is notorious for high rates of claimed deductions that are rejected if audited (around 90 percent of audited deductions in this category are disallowed).
Policy Lessons
What policy lessons can we draw from the evidence on tax morale? The most obvious lesson is that the extent of tax evasion can be affected by policies beyond standard tax enforcement actions, such as detection probabilities and punishments. Clearly, an Allingham and Sandmo–type model does not fully capture individual motivations for tax compliance. This finding should not be surprising: channels such as intrinsic motivation, social norms, peer effects, and limits to rationality are
164 Journal of Economic Perspectives
known to be important in a variety of other domains, including in the contexts of charitable giving and private provision of public goods, which are closely related to tax compliance.
The potential importance of tax morale in determining evasion suggests that policymakers may have access to a broader range of instruments to affect compli-ance than implied by a standard enforcement model. Simple nudges to taxpayers, such as presenting information in a more accessible form or providing payment reminders, can reduce tax evasion (for example, Del Carpio 2014; Dwenger et al. 2014; Hallsworth et al. 2014). In addition, some evidence suggests policies that might be helpful even though the effect of the policy itself has not yet been directly tested. For example, the evidence from Engström et al. (2013) and Rees-Jones (2014) on loss aversion indicates that tax compliance could potentially be improved through over-withholding—because those who are likely to receive refunds are less likely to be motivated by loss aversion to seek out tax shelters.
On the other hand, the direct evidence from field experiments attempting to manipulate intrinsic motivation, reciprocity, and social norms to improve tax compliance has been decidedly mixed. To the extent that such interventions have been successful in changing behavior, they often appear to act primarily on “small stakes” decisions like paying taxes on time or paying relatively small taxes and fees. There are several ways to interpret these findings.
First, it could be that these channels do exist but are small in magnitude rela-tive to the factors in the standard model. As discussed, assessing relative magnitudes is very challenging. While many of the field experiments include an enforcement treatment, it is generally extremely difficult to compare the “strength” of the enforcement versus tax morale interventions or to know how they shift individuals’ beliefs relative to their priors. Note that it is also important to be cautious when comparing the costs and benefits of threats of enforcement and social notifications. Threat-of-audit letters (or more generally, letters that prime individuals to focus on enforcement) are often not backed up by actual increases in enforcement. While threatening enforcement is cheap, such threats must ultimately be backed up by greater and potentially quite costly enforcement in equilibrium. In contrast, social interventions may be relatively cheap in equilibrium.
Second, it could be that tax morale is important, but fairly inelastic. For example, in a model with honest taxpayers and strategic taxpayers, intrinsic motiva-tion may have a large effect on overall compliance (for the honest taxpayers), but moral suasion interventions may not affect behavior for either group. Also, many tax morale channels may be inelastic to the types of interventions that are feasible for researchers to test experimentally. For example, designing field experiments to affect culture would be very difficult. Interventions may also not be powerful enough to overcome individual priors: a letter arguing that tax revenue is impor-tant for funding public goods may not be effective if individuals have a strong (and perhaps accurate) belief that revenues are often expropriated or inefficiently spent. However, these arguments do not imply that tax morale cannot be affected by actual policies undertaken by governments: as the Besley, Jensen, and Persson (2014)
Tax Morale 165
paper on the poll tax experience in the United Kingdom indicates, even temporary policies that affect tax morale can have lasting effects on compliance.
Finally, the evidence strongly indicates heterogeneous treatment effects in response to interventions intended to affect tax morale. The effects of these inter-ventions appear to be influenced by both the context (for example, are existing levels of compliance high or low?) as well as characteristics of the individual taxpayer (for example, does the taxpayer appear to be intrinsically or extrinsi-cally motivated?). Obviously, heterogeneity makes designing appropriate policy responses challenging: interventions targeting tax morale could be ineffective or potentially even have perverse effects in some environments or for some popu-lation subgroups, and identifying the groups for which interventions are likely to be effective (for example, the intrinsically motivated) may be quite difficult in practice.
More broadly, what does it mean for tax policy if tax morale exists as a determi-nant of compliance and can be affected by government decisions? Conditional on a given enforcement environment, there is at least the possibility for tax morale to improve compliance. However, we do not see the potential importance of tax morale as being limited solely to reducing the tax gap between what is owed and what is paid: the possibility of tax-morale-driven compliance has broader implications for optimal tax policy. For example, the structure of the tax schedule itself could influence compliance through a tax morale channel, as indicated in the poll tax study. While the switch to a poll tax is an extreme example, this study suggests that perceived fairness of the tax schedule can affect compliance. This finding may hold true more generally, even in cases in which isolating the causal effect of the tax schedule on compliance is challenging. Tax morale could also affect how behavior responds to taxation, depending on the specific channel of tax morale. If the channel is pure altruism, for example, then individuals receive a direct utility benefit from an addi-tional tax payment, which at least partly offsets the utility loss of the consumption reduction due to the additional tax payment. Thus, pure altruism can reduce labor supply responses to taxes. Tax-morale-driven compliance could also reduce individ-uals’ incentives to engage in costly behavior to avoid or evade taxes.
Directions for Future Research
Policymakers, practitioners, and researchers are developing a better under-standing of the channels through which policies can leverage tax morale to improve compliance, but there is clearly still much to learn. Here, we emphasize some of the areas that could prove especially productive for research.
First, it would be useful to examine why similar interventions have produced varying results in different contexts. In many cases, it is difficult to determine whether the lack of effect of an intervention resulted because the intervention was too weak to affect tax morale or because there truly was no meaningful effect of this tax morale channel on compliance.
166 Journal of Economic Perspectives
Second, field studies of tax morale to date have been one-shot in nature. From an academic perspective, observing dynamic effects could help to provide direct evidence on specific channels of tax morale. From a policy perspective, the poten-tial of ratchet effects alters the cost–benefit calculus of tax morale (and potentially enforcement) interventions. For example, increases in compliance could be rein-forced if individuals feel that they are getting better public services or if they respond positively to peer compliance. Similarly, negative shocks to morale or to compliance could lead to a downward spiral in tax morale and compliance.
Third, some of the most important channels of tax morale may be inelastic to the types of interventions that are feasible in randomized trials, but elastic to actual policies undertaken by governments. We applaud the recent move towards field experiments conducted in collaboration with tax authorities around the world. However, researchers should also consider other approaches to investigate compo-nents of tax morale, particularly those that cannot be easily manipulated in the field. Some examples discussed in this paper include taking advantage of natural experi-ments, as in the Besley, Jensen, and Persson (2014) study of the United Kingdom poll tax, and other creative identification strategies, like the paper by DeBacker, Heim, and Tran (2012) that used variation in firm ownership to identify a culture channel for tax morale.
Finally, existing empirical studies of tax morale have generally not attempted to estimate the welfare effects of tax morale—which is unsurprising given that welfare analysis can be challenging in settings where utility maximization does not fully explain behavior or where the utility function depends on social effects. Moreover, the welfare effects likely depend on the exact channels through which tax morale operates; for example, do peer effects operate by giving people more warm-glow utility from paying taxes or do they operate through a social sanction on being caught evading? Despite the challenges of welfare analysis in the context of tax morale, we see this as an important area for further research.
■ We thank Timothy Taylor, David Autor, Chang-Tai Hsieh, and Ulrike Malmendier for many helpful comments and Elizabeth Spink for outstanding research assistance.
References
Allingham, Michael G., and Agnar Sandmo. 1972. “Income Tax Evasion: A Theoretical Anal-ysis.” Journal of Public Economics 1(3–4): 323–38.
Alm, James, Betty R. Jackson, and Michael McKee. 1993. “Fiscal Exchange, Collective Decision Institutions, and Tax Compliance.”
Erzo F. P. Luttmer and Monica Singhal 167
Journal of Economic Behavior & Organization 22(3): 285–303.
Alm, James, Gary H. McClelland, and William D. Schulze. 1992. “Why Do People Pay Taxes?” Journal of Public Economics 48(1): 21–38.
Alm, James, Isabel Sanchez, and Ana de Juan. 1995. “Economic and Noneconomic Factors in Tax Compliance.” Kyklos 48(1): 3–18.
Andreoni, James, Brian Erard, and Jonathan Feinstein. 1998. “Tax Compliance.” Journal of Economic Literature 36(2): 818–60.
Ariel, Barak. 2012. “Deterrence and Moral Persuasion Effects on Corporate Tax Compliance: Findings from a Randomized Controlled Trial.” Criminology 50(1): 27–69.
BBC News. 2006. “India Eunuchs Turn Tax Collectors.” November 9. http://news.bbc.co.uk /2/hi/south_asia/6134032.stm.
Becker, Gary S. 1968. “Crime and Punishment: An Economic Approach.” Journal of Political Economy 76(2): 169–217.
Bénabou, Roland, and Jean Tirole. 2006. “Incentives and Prosocial Behavior.” American Economic Review 96(5): 1652–78.
Besley, Timothy, Anders Jensen, and Torsten Persson. 2014. “Norms, Enforcement, and Tax Evasion.” http://people.su.se/~tpers/papers/Draft _140302.pdf.
Blumenthal, Marsha, Charles Christian, and Joel Slemrod. 2001. “Do Normative Appeals Affect Tax Compliance? Evidence from a Controlled Experiment in Minnesota.” National Tax Journal 54(1): 125–38.
Bott, Kristina, Alexander W. Cappelen, Erik Ø. Sørensen, and Bertil Tungodden. 2014. “You’ve Got Mail: A Randomized Field Experiment on Tax Evasion.” Discussion Paper 26/2014, Department of Economics, Norwegian School of Economics.
Boyer, Pierre, Nadja Dwenger, and Johannes Rincke. 2014. “Do Taxes Crowd Out Intrinsic Motivation? Field-Experimental Evidence from Germany.” Unpublished manuscript, University of Mannheim.
Castro, Lucio, and Carlos Scartascini. 2013. “Tax Compliance and Enforcement in the Pampas: Evidence from a Field Experiment.” Inter-Amer-ican Development Bank Working Paper 472.
Cummings, Ronald G., Jorge Martinez-Vazquez, Michael McKee, and Benno Torgler. 2009. “Tax Morale Affects Tax Compliance: Evidence from Surveys and an Artefactual Field Experiment.” Journal of Economic Behavior & Organization 70(3): 447–57.
DeBacker, Jason, Bradley T. Heim, and Anh Tran. 2012. “Importing Corruption Culture From Overseas: Evidence From Corporate Tax Evasion in the United States.” Published online in the
Journal of Financial Economics. http://dx.doi .org/10.1016/j.jfineco.2012.11.009.
Del Carpio, Lucia. 2014. “Are the Neighbors Cheating? Evidence from a Social Norm Experi-ment on Property Taxes in Peru.” http://scholar .princeton.edu/sites/default/files/Are_the _neighbors_cheating_Apr2014_0.pdf.
Dwenger, Nadja, Henrik Kleven, Imran Rasul, and Johannes Rincke. 2014. “Extrinsic and Intrinsic Motivations for Tax Compliance: Evidence from a Field Experiment in Germany.” http://www .henrikkleven.com/uploads/3/7/3/1/37310663 /dwengeretal_churchtax_may2014.pdf.
Engström, Per, Katarina Nordblom, Henry Ohlsson, and Annika Persson. 2013. “Tax Compli-ance and Loss Aversion.” Unpublished Manuscript, Uppsala University.
Feld, Lars P., and Bruno S. Frey. 2002. “Trust Breeds Trust: How Taxpayers Are Treated.” Economics of Governance 3(2): 87–99.
Fellner, Gerlinde, Rupert Sausgruber, and Christian Traxler. 2013. “Testing Enforcement Strategies in the Field: Threat, Moral Appeal and Social Information.” Journal of the European Economic Association 11(3): 634–60.
Gërxhani, Klarita, and Arthur Schram. 2006. “Tax Evasion and Income Source: A Comparative Experimental Study.” Journal of Economic Psychology 27(3): 402–22.
Halla, Martin. 2012. “Tax Morale and Compli-ance Behavior: First Evidence on a Causal Link.” B.E. Journal of Economic Analysis & Policy 12(1): Article 13.
Hallsworth, Michael, John A. List, Robert D. Metcalfe, Ivo Vlaev. 2014. “The Behavioralist as Tax Collector: Using Natural Field Experiments to Enhance Tax Compliance.” NBER Working Paper 20007.
Hofmann, Eva, Erik Hoelzl, and Erich Kirchler. 2008. “Preconditions of Voluntary Tax Compli-ance: Knowledge and Evaluation of Taxation, Norms, Fairness, and Motivation to Cooperate.” Journal of Psychology 216(4): 209–217.
Kleven, Henrik Jacobsen, Martin B. Knudsen, Claus Thustrup Kreiner, Søren Pedersen, and Emmanuel Saez. 2011. “Unwilling or Unable to Cheat? Evidence from a Tax Audit Experiment in Denmark.” Econometrica 79(3): 651–92.
Kountouris, Yiannis, and Kyriaki Remoundou. 2013. “Is There a Cultural Component in Tax Morale? Evidence from Immigrants in Europe.” Jour-nal of Economic Behavior & Organization 96: 104–19.
Lefebvre, Mathieu, Pierre Pestieau, Arno Riedl, and Marie Claire Villeval. 2011. “Tax Evasion, Welfare Fraud, and ‘The Broken Windows’ Effect: An Experiment in Belgium, France and the Netherlands.” IZA Discussion Paper 5609.
168 Journal of Economic Perspectives
Levi, Margaret. 1989. Of Rule and Revenue. University of California Press.
OECD. 2001. “Principles of Good Tax Admin-istration—Practice Note.” Organization for Economic Co-operation and Development.
OECD. 2013. “Tax and Development: What Drives Tax Morale?” Organization for Economic Co-operation and Development. http://www.oecd .org/ctp/tax-global/TaxMorale_march13.pdf.
Povoledo, Elisabetta. 2011. “Italy Tries to Get Tax Cheats to Pay Up.” New York Times, August 8. http://www.nytimes.com/2011/08/09/business /global/italy-tries-to-get-tax-cheats-to-pay-up .html?_r=0.
Rees-Jones, Alex. 2014. “Loss Aversion Moti-vates Tax Sheltering: Evidence From U.S. Tax Returns.” Unpublished Manuscript, University of Pennsylvania.
Schneider, Friedrich. 2005. “Shadow Economies around the World: What Do We Really Know?” European Journal of Political Economy 21(3): 598–642.
Scholz, John T., and Neil Pinney. 1995. “Duty,
Fear, and Tax Compliance: The Heuristic Basis of Citizenship Behavior.” American Journal of Political Science 39(2): 490–512.
Slemrod, Joel. 2007. “Cheating Ourselves: The Economics of Tax Evasion.” Journal of Economic Perspectives 21(1): 25–48.
Slemrod, Joel, and Caroline E. Weber. 2012. “Evidence of the Invisible? Measurement Issues in Analyzing Tax Evasion and the Informal Economy.” International Tax and Public Finance 19(1): 25–53.
Torgler, Benno. 2005. “Tax Morale and Direct Democracy.” European Journal of Political Economy 21(2): 525–31.
US Government Accountability Office. 2011. “Tax Gap: Complexity and Taxpayer Compliance.” United State Government Accountability Office, June 28. GAO-11-747T.
Waweru, Michael G. 2004. “Remarks by Commis-sioner General of Kenya Revenue Authority Mr. M. G. Waweru.” Kenya Revenue Authority. October 8. http://www.revenue.go.ke/speeches /cgspeechnationaldisasterfund081004.htm.
Journal of Economic Perspectives—Volume 28, Number 4—Fall 2014—Pages 169–192
O ccupational guilds have been observed for thousands of years in many economies: ancient Egypt, Greece, and Rome; medieval and early modern India, Japan, Persia, Byzantium, and Europe; and nineteenth-century
China, Latin America, and the Ottoman Empire.1 Guilds were most prevalent in manufacturing. Almost all urban craftsmen were guilded and, in parts of central and southern Europe, many rural artisans as well. But the service sector also had many guilds. Nearly all premodern economies had guilds of merchants and retailers, and some also had guilds of painters, musicians, physicians, prostitutes, or chimney-sweeps. Guilds were rarest in primary production, but some places had guilds of farmers, gardeners, wine-growers, shepherds, miners, or fishermen.
Although guilds have existed for millennia in economies across the world, the analysis of guilds as economic institutions is largely based on Europe between about 1000 and about 1800. This is partly because empirical findings on guilds are richest there, and partly because guilds showed interesting variation across Europe, gradu-ally weakening after 1500 in some societies but surviving long past 1800 in others. Most significantly, Europe is where sustained economic growth first arose, raising
1 Broadly speaking, a guild is an association formed by people who share certain characteristics and wish to pursue mutual purposes. Historically, guilds have also included religious fraternities for common worship and insurance, foreigners’ guilds to represent migrants and visitors from the same place of origin, neighborhood guilds for local improvements and sociability, and militia guilds for public order and emergencies. However, the vast majority of guilds were formed around shared occupations, even if they also engaged in religious or social activities.
The Economics of Guilds
■ Sheilagh Ogilvie is Professor of Economic History, Faculty of Economics, University of Cambridge, Cambridge, United Kingdom. Her email address is [email protected].
http://dx.doi.org/10.1257/jep.28.4.169 doi=10.1257/jep.28.4.169
Sheilagh Ogilvie
170 Journal of Economic Perspectives
obvious questions about the relationship between guilds and growth. For these reasons, this paper also focuses on guilds in Europe since the later Middle Ages.
Guilds in medieval and early modern Europe offered an effective institutional mechanism whereby two powerful groups, guild members and political elites, could collaborate in capturing a larger slice of the economic pie and redistributing it to themselves at the expense of the rest of the economy. Guilds provided an organi-zational mechanism for groups of businessmen to negotiate with political elites for exclusive legal privileges that allowed them to reap monopoly rents. Guild members then used their guilds to redirect a share of these rents to political elites in return for support and enforcement. In short, guilds enabled their members and political elites to negotiate a way of extracting rents in the manufacturing and commercial sectors, rents that neither party could have extracted on its own.
My assessment of occupational guilds begins with an overview of where and when European guilds arose, what occupations they encompassed, how large they were, and how they varied across time and space. Against this background, I then examine how guild activities affected market competition, commercial security, contract enforcement, product quality, human capital, and technological innova-tion. In some of these spheres, some of the time, guilds took actions that may have helped to boost economic growth. However, I will argue that in each of these arenas the behavior of guilds can best be understood as being aimed at securing rents for guild members; guilds then transferred a share of these rents to political elites in return for granting and enforcing the legal privileges that enabled guilds to engage in rent extraction.
Debates about guilds are not just historical quibbles, but have wider implications for a very modern topic: the role of institutions in economic growth. The conclusion to this paper considers what we can learn from guilds about this question. Guilds, I will argue, provide strong support for the view that institutions arise and survive as a result of political conflicts over distribution (Acemoglu, Johnson, and Robinson 2005; Ogilvie 2007b).
A Brief History of European Guilds
Guilds existed in Europe under the ancient Roman Empire and appeared occa-sionally during the Dark Ages (c. 400–c. 1000), but came definitively back into view with the resurgence of trade and industry, together with public record-keeping, after about 1000. They had their heyday in the later Middle Ages, from about 1000 to about 1500, although they survived in some societies long past 1800 (for surveys, see Ogilvie 2007a, 2011). Local guilds of wholesale merchants reappeared in most European societies after the Dark Ages, from the early eleventh century onwards. A bit later, as long-distance trade expanded during the medieval Commercial Revolution, some local merchant guilds formed branches abroad as alien merchant guilds or “merchant communities” in foreign trading centers. Sometimes the merchant guilds of a group of towns formed a long-distance trading association called a “universitas” or a “hansa”;
Sheilagh Ogilvie 171
the most famous was the German Hansa, which by around 1300 encompassed merchant guilds from a core group of 70 north German, Dutch, and Baltic cities and a penumbra of about 100 smaller towns (Dollinger 1970; Ogilvie 2011). Guilds of craftsmen reappeared after the Dark Ages a bit later, typically from around 1100 onwards (Epstein 1991). Some places, especially in Italy, also developed “sectoral” guilds, combining the merchants and craftsmen of a particular industry (Caracausi 2014). The date that different types of guild emerged (or re-emerged) varied greatly across Europe (although the dates are sometimes confused by accidents of what documents have survived). But by the thirteenth century, guilds of local traders, long-distance merchants, and craftsmen were to be found across much of Europe. For the next 300–600 years, to practice industry or commerce in most European towns, it was necessary to obtain a license from the relevant guild, although there were also some guild-free towns and enclaves (discussed below).
Around 1500, the European guild landscape began to change. In the dynamic North Atlantic economies, especially England and the Low Countries (modern Belgium and the Netherlands), merchant guilds declined, with a proliferation of individual entrepreneurs who did not belong to any formal associations (Harreld 2004; Ogilvie 2011; Gelderblom 2013). Craft guilds also began to weaken, as trade and industry moved to the countryside where no individual city could thoroughly enforce its guild regulations because of the many other cities whose inhabitants also wanted to operate there (de Vries 1976; Coleman 1977; Ogilvie 2000; Davids 2008). Competition from guild-free rural artisans and traders in turn weakened urban guilds. At about this time, the greatest European trading city, Amsterdam, barred merchant guilds altogether; the greatest Dutch textile city, Leiden, abol-ished its craft guilds; and Flanders developed huge rural industrial zones such as Hondschoote with tens of thousands of unguilded producers and traders.
In England, guilds declined in many towns during the sixteenth century, with only a quarter of the guilds in existence in 1500 surviving to 1600 (Muldrew 1993). Many lost an important part of their finances and their functions during the Reformation of the 1530s and 1540s, when the crown dissolved all primarily religious guilds and confiscated the religious property of primarily occupational ones (Harding 2000). The crown became very reluctant to grant state charters to guilds outside London; this left provincial guilds heavily dependent on local urban authorities in the old corporate “borough” towns which were entitled to establish guilds but whose writ did not extend beyond the town walls (Clark and Slack 1976; Coleman 1977). By 1600, even the powerful London guilds (the so-called “livery companies”) were increasingly unable to prevent London citizens from practicing any occupation freely, to control nonguilded producers in jurisdictional enclaves and suburbs just outside the city center, and to regulate their own members systematically; instead, they increasingly redeployed towards sociability and busi-ness networking (Kellett 1958; Rappaport 1989; Archer 1991). Only about half of a sample of 850 merchants active in late-seventeenth-century London even bothered to obtain municipal citizenship, which was necessary for livery-company member-ship, and only 38 percent actually joined a company (Gauci 2002). In England more
172 Journal of Economic Perspectives
widely, guilds remained important only in the economically stagnant borough towns, which quickly lost ground to the fast-growing industrial towns such as Birmingham, Leeds, Sheffield, and Manchester where guilds were nonexistent or powerless; even in many of the old corporate boroughs, guilds were in decay by 1650 (Clark and Slack 1976; Coleman 1977; Pollard 1997; Ogilvie 2005; Lis and Soly 2008).
But England and the Low Countries were exceptional. In most other European societies, guilds retained economic influence into the late eighteenth or early nineteenth century (Ogilvie 1996b, 1997; Ehmer 2008). When industry and commerce moved to the countryside, urban guilds did not relax their restric-tions to remain competitive but lobbied successfully for government protection against rural competitors in exchange for a share of their rents (de Vries 1976; Amelang 1986; Ogilvie 2000). New guilds continued to form during the eighteenth century in Germany, Austria, Spain, France, and even the Netherlands, whose sixteenth-century loosening of guild constraints gradually gave way to institutional and economic petrefaction after about 1670 (de Vries and van der Woude 1997; Davids 2008; van den Heuvel and Ogilvie 2013; Ogilvie and Carus 2014). Spain and Portugal even exported their guilds overseas, establishing powerful “consulados” which survived in Latin America into the nineteenth century (Woodward 2007). Many European guilds only broke down in the wake of the French Revolution, as France abolished its own guilds in 1791 and forcibly exported this institutional reform to the other European countries it invaded and occupied (Kisch 1989; Horn 2006; Fitzsimmons 2010; Acemoglu, Cantoni, Johnson, and Robinson 2011; van den Heuvel and Ogilvie 2013).
The number and size of guilds covered a wide spectrum. Some cities had many: London had 72 livery companies and 14 other occupational associations in 1500 (Rappaport 1989); Paris had 103 guilds in 1250, 124 in 1700, and 133 in 1766 (Saint-Léon 1922; Bourgeon 1985). But other cities had very few: Florence, one of the largest cities in Europe, had only 21 guilds in 1300 (Najemy 1979). Some guilds had only a handful of members: in seventeenth-century Paris, with half a million inhabitants, the metal-engravers’ guild permitted a maximum of 20 masters, the clockmakers a maximum of 72 (Saint-Léon 1922). Other guilds did not have a formal upper limit, but nonetheless restricted entry via a required career track of apprenticeship, journeymanship, and mastership with strict conditions for admis-sion (discussed below). Even in Florence, with 100,000 inhabitants in 1300, each of the 21 guilds averaged only about 350 members, ranging from 100 in the smallest to 1,600 in the largest (Najemy 1979). In the small German town of Fulda in 1784, with just 8,500 inhabitants, the 21 guilds averaged only 13 members apiece, ranging from the four dyers to the 60 shoemakers (Walker 1971).
No matter how numerous or large a town’s guilds, guild members typically made up only a minority of inhabitants. Half the population was inherently excluded, since very few guilds allowed female members other than the second-class status permitted to masters’ widows (Wiesner 2000; Ogilvie 2003; van den Heuvel 2007). Even for males, guild membership usually required town “citizenship,” a costly privi-lege enjoyed by less than half the inhabitants of a typical premodern European
The Economics of Guilds 173
town: in sixteenth-century London or ’s-Hertogenbosch it was an unusually high 75 percent, in most other English and Dutch towns 30–50 percent, in medieval Venice 5–10 percent, in other Italian cities 2–3 percent (Clark and Slack 1976; Rappaport 1989; Spruyt 1994; van Zanden and Prak 2006; Ogilvie 2011).
Most guilds also excluded Jews, bastards, migrants, laborers, farmers, proper-tiless men, former serfs and slaves, gypsies, members of other guilds, adherents of minority religions, men of “impure” ethnicity, and those who couldn’t afford the admission fees (La Force 1965; Walker 1971; Ogilvie 1997; Caracausi 2014). As one nineteenth-century Spaniard put it, those without funds “called in vain at the door of the guild, for it was opened only with a silver key” (as quoted in La Force 1965, p. 92).
Guild membership was reserved to a privileged minority, even in towns. At the high end lay sixteenth-century London or Augsburg, where guild masters made up 50–60 percent of householders and 12–13 percent of inhabitants (Rappaport 1989; Roper 1989). In the middle range lay Barcelona, Rouen, or Venice, with guild masters comprising 40–50 percent of householders and 9–10 percent of inhabitants (Amelang 1986; Hafter 1989; Rapp 1976). But in Paris, Florence, or Turin, guild masters made up at most 20 percent of householders and 5 percent of inhabit-ants (Bourgeon 1985; Becker 1962; Cerutti 2010). Guilds were not all-encompassing workers’ associations but exclusive organizations for middle-class businessmen.
As such findings show, however, guilds manifested interesting variation across societies, cities, and time-periods. This can help us assess their economic effects.
What Did Guilds Do?
Guilds engaged in multiple activities, so they provide an excellent demonstra-tion of the principle that in analyzing the net economic effect of an institution, it is imprudent to focus on any one of its activities in isolation (Ogilvie and Carus 2014; Caracausi 2014). This section considers five areas in which guilds were active: 1) competition and market structure; 2) security and contract enforcement; 3) information asymmetries and quality standards; 4) human capital investment; and 5) technological innovation.
The effects of guilds in these key economic spheres have always attracted controversy (for surveys, see Ogilvie 2005, 2011; Epstein and Prak 2008). Contem-poraries held strong views about them, with guild members (and the political elites they supported) extolling their virtues, while customers, employees, and competi-tors lamented their abuses. Many early economic thinkers praised guilds, as with the French government minister Jean-Baptiste Colbert who ordered all French crafts to form guilds, “so as to compose by this means a group and organization of capable persons, and close the door to the ignorant” (as quoted in Cole 1939, p. 419), or the Austrian imperial councillor, Johann Joachim Becher (1688, pp. 111–3), who argued that the authorities of old had invented the guilds because “competition weakens the livelihood of the community.” Others, such as Adam Smith (1776
174 Journal of Economic Perspectives
[1976], ch. X, pt. II, p. 152), censured guilds as “a conspiracy against the public.” Modern scholars are also deeply divided on guilds. Some claim that guilds were so widespread and long-lived that they must have been generating economic benefits. They might, for example, have enhanced commercial security, facilitated contract enforcement, solved information asymmetries between producers and consumers, overcome imperfections in markets for human capital, created incentives favoring technological innovation, or generated social capital and trust. Others argue that guilds caused inefficiencies via monopolies and monopsonies, rationed access to human capital investment, stifled innovation, engaged in costly rent-seeking, harmed outsiders such as women, Jews, and the poor, and redistributed resources to their members at the expense of the wider economy.
My own reading of the evidence is that a common theme underlies guilds’ activities: guilds tended to do what was best for guild members. In some cases, what guilds did brought certain benefits for the broader public. But overall, the actions guilds took mainly had the effect of protecting and enriching their members at the expense of consumers and nonmembers; reducing threats from innovation, competition, and audacious upstarts; and generating sufficient rents to pay off the political elites that enforced guild arrangements and might otherwise have inter-fered with them.
Competition and Market StructureGuilds regulated market competition. Each guild possessed legal privileges
endowing its members with exclusive rights to practice particular economic activities in a particular geographical area. These privileges typically consisted of a monopoly over producing specific goods and services, together with a monopsony over purchasing particular inputs. The merchant guild of a particular town secured for its members exclusive rights over trade in particular wares, transaction types, trade routes, or trading destinations. The weavers’ guild of a particular place reserved for its members the exclusive right to weave fabrics made of particular materials, to sell them to consumers or merchants, to purchase raw or semifinished inputs such as wool and yarn, to employ the relevant labor including apprentices, journeymen, and freelance spinners, and to use the relevant equipment such as looms, fulling-mills, and bleaching-fields. A guild’s exclusive privileges typically applied within a partic-ular geographical area, sometimes consisting only of the town itself, often reaching into its immediate circumference, and sometimes extending more widely across a district or province. In many regions of central, southern, and eastern Europe, rural artisans defended themselves against urban harassment (and sought to corner monopoly rents of their own) by setting up purely rural guilds or forming “regional” guilds alongside urban craftsmen (Ogilvie 1996b, 1997; Ehmer 2008; Lis and Soly 2008). To establish and defend their monopolies and monopsonies, guilds excluded entrants, restricted trade volumes, set output prices above the competitive level, fixed input costs below the competitive level, and imposed costs on competitors (La Force 1965; Walker 1971; Clark and Slack 1976; Coleman 1977; Ogilvie 2004a, 2005, 2011; Lindberg 2008, 2009; Boldorf 2009; Caracausi 2014).
Sheilagh Ogilvie 175
Some of a guild’s exclusive entitlements were laid down explicitly, usually in a charter or ordinance issued by the town or state government. But guilds often enforced privileges that were not embodied in any legislation but were simply “well-known” to be part of their entitlements (Walker 1971; Ogilvie 2004a, 2011; Ehmer 2008). This led to constant demarcation conflicts—between guilds governing adjacent trades, merchant guilds and craft guilds, guilds of different towns, or guilds and nonguilded outsiders (Rosenband 1997; Ogilvie 1997, 2011; Trivellato 2006; Hafter 2007; van den Heuvel 2007; Lindberg 2008; Caracausi 2014).
Guild monopolies were shielded in a variety of ways. Some limits on competi-tion arose from geographic factors such as high transportation costs, raw material endowments, urban agglomeration economies, or limits on migration (Ogilvie 1997, 2011). Others came from political protection. Guilds often secured government barriers to trade, as when the Venetian state blocked imports of French mirrors to protect the Murano glassblowers’ guild (Trivellato 2006) or the governments of most European states blocked imports of cheap ribbons from the Netherlands or Basel produced on the forbidden innovation of the multi-shuttle ribbon frame (Davids 2008; Pfister 2008). Guilds also obtained direct enforcement of their privileges from municipal and state governments (La Force 1965; Bossenga 1988; Rosenband 1997; Ogilvie 1997, 2003; Wiesner 2000; Trivellato 2006; Horn 2006; Hafter 2007). Archival records are replete with cases of guild members penalized by the public authorities for producing above their guild quota, using prohibited techniques, or employing women. In 1669, for instance, when the weaver Hannss Schrotter broke his guild’s rules by employing a female servant to weave, his town court fined him the equivalent of a maidservant’s average annual wage (Ogilvie 2003). Public law-courts also punished black-market producers for illegally infringing on guild monopolies, as in 1711 when the Württemberg state responded to complaints by the retailers’ guild against a converted Jew’s widow by closing down her village shop, or in 1742 when a town court jailed a villager’s wife after a complaint by the local nailsmith that she was “dealing in foreign nails, which violated the nailsmiths’ guild ordi-nance, and damaged him in his craft” (as quoted in Ogilvie 2003). Governments also supported guilds in regulating labor markets, as in 1781, when the pinmakers’ guild of a Normandy town fined a journeyman five years’ wages for quitting his job counter to guild regulations, and the municipal authorities supported the guild on the grounds that “if workers could leave their masters when they please, insub-ordination and anarchy will result, and ruin manufacturing” (as quoted in Horn 2006, p. 45). The authorities also punished consumers who purchased wares from nonguilded craftsmen, as in Bohemia when the count of Friedland’s court responded to complaints by the local tailors’ guild in 1662 by fining three villagers for buying cheap garments from nonguilded interlopers, by which they had “premeditatedly tried to deceive the authorities and the court, and sought their own advantage” (Státní Oblastní Archiv Litomerice, Pobocka Decín 1662).
Guilds could seldom defend their cartel privileges perfectly, which has led to occasional claims that these privileges had no real economic effects (Epstein 1998; Epstein 2008; Epstein and Prak 2008; Greif, Milgrom, and Weingast 1994;
176 Journal of Economic Perspectives
Greif 2006). Guild regulations were certainly violated both by free-riding insiders and cartel-breaking outsiders, creating a black-market informal sector. But this did not mean that the guild had no economic effects, only that these effects consisted partly of excluding competitors altogether and partly of pushing them into the black market. Even where a particular guild’s cartel privileges were not perfectly enforced, they affected the economy by creating an informal sector of illegal trade where costs and risks were higher because of the threat of persecution (De Soto 1989; Boldorf 2009; Ogilvie 2011).
Although not all guilds have been investigated in detail, where documents survive they show that people at the time were willing to pay money to obtain, defend, attack, circumvent, or subcontract into guild privileges, suggesting strongly that those privileges were enforced sufficiently to have a real economic impact (Kisch 1989; Rosenband 1997; Wiesner 2000; Ogilvie 2005, 2011; Horn 2006; Boldorf 2009; Lindberg 2009; Caracausi 2014). Applicants paid high fees to get into guilds: the sixteenth-century Parisian grocers’ guild charged a journeyman the equivalent of about nine years of wages for mastership (Larmour 1967); the eighteenth-century Parisian furriers’ guild charged even a master’s son (who paid the lowest fees) the equivalent of over nine years of wages (Kaplan 1981). Outsiders spent large sums circumventing guild monopolies or subcontracting into them, as in 1706 when illegal wigmakers were bribing Paris guild officials with sums equivalent to 1–2 years’ journeyman’s wages to let them practice without a license (Gayne 2004). Guilds them-selves engaged in costly political lobbying and interguild conflicts to obtain, defend, and extend their privileges: one German weavers’ guild spent a sum equivalent to 115 days of earnings for a guild master on lobbying and external conflicts every year between 1598 and 1760 (Ogilvie 1997). The willingness of so many contempo-raries to spend resources attacking, defending, or gaining access to guild privileges suggests that those privileges exercised real economic effects (Ogilvie 1997, 2011; Boldorf 2009; Lindberg 2009; Caracausi 2014).
The documentary record provides only occasional snapshots of the direct effect of guilds on markets. But for the times and places where figures survive, they indicate that guild monopolies exerted real effects. When the German Hansa obtained exclusive rights over the Swedish Skåne fairs after 1370, participation by English and Dutch merchants declined, the fairs contracted, and the range of goods narrowed (Ogilvie 2011). After 1440, when the Norwegian crown began to reduce the privileges of the German Hansa in Bergen, there was an influx of merchants from Holland and the Norwegian trade expanded (Wubs-Mrozewicz 2005). In 1650, when the Württemberg state granted the guild-like “company” of the Calw merchant-dyers a monopoly over finishing and exporting worsted textiles, partici-pation by weavers, women, and rural traders declined and the industry contracted (Ogilvie 1997). In the 1750s, when some Dutch town governments compelled guilds to lower their entry barriers, crafts and trades saw a huge influx of poorer entrants, especially women (van den Heuvel 2007). In the 1760s, when the woolen-weavers’ guilds of the Bohemian town of Brno lost their power to regulate entry and tech-nology, the industry immediately took off (Freudenberger 1960). In 1778, when
The Economics of Guilds 177
the Spanish consulados lost their monopoly, legal trade expanded hugely in Central America, the Río de la Plata, Chile, Cuba, and Venezuela (Woodward 2007). In 1791, when France abolished its guilds in the wake of the Revolution, tens of thousands of women and men applied for permission to practice previously guilded occupa-tions (Fitzsimmons 2010). In the early nineteenth century, when the German city of Aachen abolished guilds, the textile industry expanded in the countryside and factories sprang up in neighboring Burtscheid and Monschau (Kisch 1989).
The history of guilds shows that occupational licensing, with its far-reaching effects, is not a modern phenomenon. Professional organizations enforcing barriers to entry were the default in all but the poorest occupations before the Industrial Revolution; what is new in modern economies is the existence of so many occupa-tions where no license is required. Guilds demonstrate how occupational licensing, even when imperfectly enforced, has real economic effects, if only by pushing economic activity into the informal sector where growth is often stifled by insecure property rights, poor contract enforcement, high risks, short time horizons, infor-mation scarcity, consumer fraud, and labor exploitation (De Soto 1989; Trivellato 2006; Ogilvie 2007b).
Security and Contract EnforcementEconomic growth requires markets, and markets require supporting insti-
tutions that guarantee property rights and contract enforcement (Ogilvie and Carus 2014). Guilds, as closed social networks, might have been able to provide these guarantees by generating a social capital of trust and collective action. The historical evidence for Europe during the eight centuries before industrialization, however, indicates that property rights and contract enforcement were guaranteed primarily via private business practices (written records, pledges, brokers, notaries, firms) supported by public-order institutions (legal systems, town administrations, royal governments). Private-order institutions such as guilds occasionally provided informal supplements to these mechanisms, typically on a particularized basis for their own members. But they did not substitute for public institutions in providing generalized property rights and contract enforcement to the economy more widely (Edwards and Ogilvie 2012; Ogilvie and Carus 2014). Indeed, in some cases the actions of guilds in pursuit of rents for their members tended to reduce the secu-rity of property and contracts for others in the economy (Katele 1988; Tai 1996; Lindberg 2009, 2010; Ogilvie 2011).
For security of property rights, public-order institutions were far more important than private-order networks such as guilds. Very early in the medieval Commer-cial Revolution, rulers demonstrably had good security incentives. As the ruler of Champagne declared in 1148, he would not tolerate attacks on foreign merchants traveling to trade at the famous Champagne fairs, since this “tends to nothing less than the ruin of my fairs” (as quoted in Edwards and Ogilvie 2012, p. 132). He and his successors backed up these security guarantees with highway police, diplomatic penal-ties, and military force, which provided generalized protection to “all merchants, merchandise, and all manner of persons coming to the fair,” thereby creating the
178 Journal of Economic Perspectives
most important long-distance trading centers in western Europe (Edwards and Ogilvie 2012, p. 136). The most successful medieval and early modern trading locations—the Champagne fairs, Venice, Bruges, Antwerp, Amsterdam, London—were ones where the political authorities made such generalized security guarantees to all merchants rather than issuing particularized safe-conducts as privileges to members of favored guilds (Ogilvie 2011; Edwards and Ogilvie 2012; Gelderblom 2013).
Guilds sometimes took on tasks that related to providing public order, such as security, contract enforcement, and even military action. This has sometimes been interpreted as guilds effectively replacing the state in the provision of such goods (Greif, Milgrom, and Weingast 1994; Greif 2006). However, when the specific actions of guilds are examined and put in context, the lesson is that guilds only supplemented institutions of public order to a modest extent, only for their own members, and only when it suited the interests of the guild to do so (Ogilvie 2011).
As one example, craft guilds were occasionally used by town governments to organize municipal militias (Hickson and Thomson 1991). But guilds were neither necessary nor sufficient for such militias, and the majority of medieval and early modern towns and territories organized defense without directly involving guilds (Ogilvie 2011). Guilds of long-distance merchants also sometimes organized convoys, caravans, or fortifications in foreign trading locations (Volckart and Mangels 1999). But again, these club goods provided by guilds appear to have been an occasional convenience rather than a universal necessity, since in the same economies and time-periods convoys, caravans, and fortifications were organized by individual merchants, merchant firms, town governments, and princes (Ogilvie 2011).
Merchant guilds also sometimes put pressure on foreign rulers to grant security guarantees (Greif, Milgrom, and Weingast 2004). But guilds also lobbied foreign rulers for all sorts of other favors, including guaranteeing their cartel privileges and discriminating against competitors (Ogilvie 2011). Merchants who were not members of guilds also easily got security guarantees from rulers; indeed, guilded merchants often sought supplementary security guarantees as individuals, rather than as guild members (Harreld 2004; Ogilvie 2011). In all these cases, the actual security itself—whether guaranteed to individuals, to guilds, or to the entire economy—was provided by the public authorities (Ogilvie 2011; Gelderblom 2013). Furthermore, the security guarantees that rulers granted to guilds were particular-ized: they applied only to members of the guild that obtained them, typically in return for payments and favors to the ruler, and thus did not create generalized security to support economic growth more widely (Lindberg 2010; Ogilvie 2011; Ogilvie and Carus 2014).
Contract enforcement is another sphere in which guilds were sometimes active. Some guilds operated internal courts that decided conflicts among members, and this has inspired claims that guilds offered a private-order alternative to inade-quate or nonexistent public legal systems (Greif 2006). But many guilds had no internal courts, those that existed operated under devolved authority from town or state governments, guild tribunals usually referred complicated conflicts to public courts, and guilded merchants often voted with their feet by taking contracts before
Sheilagh Ogilvie 179
public jurisdictions—even when their guilds forbade it (Harreld 2004; Sachs 2006; Woodward 2007; Ogilvie 2011; Gelderblom 2013).
Guilds also sometimes provided contract enforcement via a “community respon-sibility system,” whereby if a member of one guild defaulted on a contract with a member of another, the injured party’s guild would impose collective reprisals on all members of the defaulter’s guild, giving the latter an incentive to penalize the defaulter (Greif 2006). Collective interguild “reprisals” (as contemporaries called them) certainly occurred in medieval Europe. But such action greatly increased trading risks for all, including innocent third parties. Businessmen and govern-ments therefore disliked them intensely and viewed them as a last resort. From the very beginning of the medieval Commercial Revolution, European trading centers sought to limit reprisals by embedding them in the public legal system (Boerner and Ritschl 2002; Edwards and Ogilvie 2012). Merchants often demanded that rulers outlaw reprisals as a condition of trading in their territories, as the Scandinavian and German merchants demanded from Russian rulers in 1191 or the Flemish rulers demanded from the King of France in 1193 (Ogilvie 2011).
Finally, to secure rents for their members, guilds also engaged in other activi-ties that incidentally—or sometimes deliberately—reduced security of property rights and contracts. Merchant guilds attacked the trade of rival merchants directly or lobbied their governments to do so in order to protect their own monopolies and other privileges (Katele 1988; Tai 1996). In 1162, for instance, 1,000 members of the Pisan merchant guild in Constantinople attacked the 300-strong Genoese merchant guild with the intention, according to a contemporary account, of “despoiling and killing them” (as quoted in Ogilvie 2011, p. 226). This led to a two-day battle, the looting of 30,000 bezants’ worth of merchandise, the bankruptcy of a major Genoese firm, and at least one fatality. Such attacks reduced security not only for guilds’ competitors, but also for uninvolved third parties caught in the crossfire. The economic impact of guilds’ security activities is therefore questionable. Guilds of merchants often (though not always) increased security for their members, but they also often decreased security for outsiders.
Overall, the empirical findings suggest that impersonal exchange in medieval and early modern Europe was sustained not by particularized arrangements such as guild jurisdictions or interguild reprisals, but by generalized institutions: private business practices backed up by public-order municipal or state institutions, which were open to all traders, not just members of privileged guilds.
Information Asymmetries and Quality StandardsInformation asymmetries between producers and consumers concerning the
quality of goods raises the possibility of a market failure which could be solved through standards set by a producer organization such as a guild. However, the problem of “quality” under asymmetric information is solved not by having producers fix a specific standard, but rather by providing consumers with reliable information about quality so they can choose the quality–price combination they prefer (Ogilvie 2004a, 2007a, 2008).
180 Journal of Economic Perspectives
Guilds of craftsmen often regulated raw materials, production processes, training, and output characteristics, which has inspired some to argue that guilds offered an efficient solution to market failures concerning product quality (Gustafsson 1987; Richardson 2004). Indeed, a monopolistic organization such as a guild might be better able than a range of competing producers to guarantee a single, standard quality. But those same characteristics typically made a guild less able and willing to undertake the flexible response to changes in demand neces-sary to deliver the combinations of quality and price desired by a varied and changing population of customers (Ogilvie 2004a; Boldorf 2009; Caracausi 2014). This was recognized by contemporaries such as the French economist and indus-trial inspector Simon Clicquot-Blervache who in 1758 ruefully contrasted stagnant French industries with vibrant foreign (especially English) competitors, observing that “although it is useful to make perfect things, it is no less advantageous to make mediocre things, or even bad things, providing that the low price invites and brings about consumption . . . Our regulations and our guilds fix merchandise at the same quality level and the same form, and elevate our merchandise to a value that is too high to compete” (as quoted in Minard 2000, p. 486).
Moreover, guild guarantees of quality were often weak because guilds existed not primarily to constrain or penalize their members, but rather to secure and defend those members’ rents. As a result, guilds typically penalized their members’ quality violations too mildly to deter them (Homer 2002; Forbes 2002; Ogilvie 2005). Customers often described guild quality controls as inadequate, and wholesale merchants added their own quality inspections at point of purchase. As one German guild inspector declared in 1660, “the cloth-sealing takes place very badly, and when one says anything about it, one incurs great enmity” (as quoted in Ogilvie 2004a, p. 295). Guild inspectors lacked the incentive to develop the skills and deploy the effort necessary to detect low-quality work beyond superficial features (such as size), which were readily apparent to wholesale merchants and consumers anyway (Ogilvie 2005; Boldorf 2009).
Guild actions to secure rents for their members could also inflict unintended harm on the quality of guild output. Guilds often set price ceilings for raw materials, so suppliers would sometimes seek to earn profits by lowering quality (Ogilvie 1997). Guilds imposed piece-rate ceilings on subcontractors (such as spinners), depriving them of incentives to work more carefully (Ogilvie 2003; Boldorf 2009). Guilds some-times enforced collective interguild “monopoly contracting,” outlawing sales and purchases by individual craftsmen and merchants. This created a rigid regime of collec-tive prices and quotas that removed individual craftsmen’s incentives to do better work and individual merchants’ incentives to experiment with new quality–price ratios that might better suit consumer demand (Ogilvie 2004a; Boldorf 2009). To defend their monopoly prices, guilds used their quality regulations to prevent their own members from producing the quality levels that some consumers actually demanded. In 1661, for instance, one German guild justified refusing to seal one of its member’s cloths on the grounds that “Old Jacob Zeyher makes absolutely terrible cloths, but sells them very cheap and thereby causes the guild great injury,” to which Zeyher replied that
The Economics of Guilds 181
he “sells such cloth in Offenburg, the people want it like that from him; but the guild sealers will not seal it for him” (as quoted in Ogilvie 2004a, pp. 296–97).
Comparisons across countries show that many strongly guilded industries produced goods and services of a quality—measured in terms of what consumers wanted—that compared poorly with similar industries where guilds were weak or absent. From the fourteenth to the mid-sixteenth century, for instance, the Flemish rural industrial agglomeration of Hondschoote grew rapidly, exported its textiles to satisfied customers all over Europe, and outcompeted the Flemish urban textile guilds—all without guild quality regulations. In the eighteenth century, the West Riding of Yorkshire developed the most successful worsted industry in Europe by producing “cheap and nasty” cloths subject to no quality controls by guilds, but also no price controls; instead, quality was monitored by merchants and customers at the point of purchase (Heaton 1965). Unguilded industries did not merely produce attractive-but-cheap goods, but also fine products well-known for their high quality, as in the case of the all-female Venetian lace-making industry, the Franconian wire-drawing industry, or the north Bohemian fine linen industry (Ogilvie 2005). In many successful European industries, quality control was solved through alterna-tive institutions—merchant, town, or state inspections—that provided information about quality to potential purchasers without the rigidities imposed by guilds (Heaton 1965; Ogilvie 2004a; Boldorf 2009; Caracausi 2014).
Guilds were certainly often active in regulating quality. But there is little empir-ical support for the idea that they were efficient institutions for solving information asymmetries between producers and consumers. Their other incentives, particu-larly the desire to generate rents for their members, interfered with their ability to guarantee the appropriate standards: the variation in quality level desired by consumers, not producers (Ogilvie 2004a; Caracausi 2014).
Human Capital InvestmentGuilds are often seen as synonymous with human capital investment, as many
of them operated training systems. Any institution that fosters skills is interesting, since modern theories of economic growth postulate that investing in human capital makes people work more productively, invent better techniques, and substi-tute quality for quantity of offspring.
Guilds of merchants and retailers seldom regulated training, even though commerce demanded literacy, numeracy, and geographical and linguistic skills (van den Heuvel 2007; Ogilvie 2011). Guilds of craftsmen, however, did often operate mandatory training programs. Most required “apprenticeship,” a minimum number of years of unpaid (or low-paid) on-the-job training with a guild master. After that, many guilds also mandated “journeymanship,” a minimum number of years of day-laboring for guild masters, usually at capped wages, often involving compulsory “wandering” from town to town. Guilds often required an apprentice or journeyman to pass an examination or produce a “masterpiece,” a piece of work used to judge his fitness to become a “master.” Only masters, who had obtained the full guild license, were permitted to practice a guilded occupation independently.
182 Journal of Economic Perspectives
While craft guilds often made apprenticeship and journeymanship compul-sory—at least on paper—the extent of actual training sheds bleak light on the incentives of monopolistic professional associations with regard to human capital investment. Contemporaries often complained that guilds failed to penalize neglectful masters of apprentices, issued certificates to apprentices without exami-nation, or granted mastership without training or examination to masters’ relatives and well-off youths who paid for “privileges” (La Force 1965; Kaplan 1981; Horn 2006). A Thuringian merchant explained in 1681 that he preferred to buy textiles from nonguilded rural producers because among the guilded urban weavers, “masters’ sons hardly ever went traveling [as journeymen], were not required to demonstrate their knowledge through any masterpiece, and hence did not know how to do anything” (as quoted in Ogilvie 2004a, p. 312). In the mid-eighteenth century, the Paris goldsmiths’ guild admitted one-quarter of its new masters via special “privileges,” one-third as nonapprenticed masters’ offspring, and less than half by proper apprenticeship (Kaplan 1981). The Rouen ribbon-makers’ guild admitted one-third of its masters via “privileges,” over one-half as nonapprenticed masters’ sons, and less than one-tenth after guild apprenticeship (Hafter 2007). Situations such as these were widespread because guilds, as associations of masters, had an incentive to certify the relatives of members regardless of skill and to reap rents by selling admission to untrained entrants who could afford to pay for privi-leges (Kaplan 1981; Ogilvie 2007a; Hafter 2007).
Cross-country comparisons also cast doubt on whether guilds were essential institutions for ensuring appropriate levels of human capital investment. Many occupations were guilded in some premodern European societies and unguilded in others. Linen weaving, worsted weaving, cotton production, scythe making, ribbon making, knitting, lace making, and the making of small iron goods were guilded in many regions of Germany, Austria, Italy, Spain, Bohemia, Serbia, Bulgaria, and Greece, but unguilded in many parts of England, the Low Countries, Scotland, Switzerland, and Ireland (Ogilvie 1997, 2004a, 2007a). What decided whether an activity would be guilded was not its skill requirements but whether a group of practitioners was politically able to secure and maintain guild privi-leges over that activity. In many European crafts, apprenticeships were entered into as private agreements between trainees and masters that were enforced like other contracts without the need for guild regulations (Davids 2003; Ogilvie 2007a; Wallis 2008; Caracausi 2014). In many other crafts, formal apprenticeships were irrelevant. Black-market “interlopers” who failed to obtain guild training—often, as in the case of women and Jews, because guilds excluded them—were vigorously opposed by guilds precisely because they had skills indistinguishable from those of guild members and were willingly hired by customers (Wiesner 2000; Ogilvie 2003, 2004b, 2007a; Hafter 2007; van den Heuvel 2007). For some premodern occupa-tions, skilled training was clearly required, and in some, formal apprenticeship was the best method to provide it. But comparisons across premodern Europe suggest that guilds were neither necessary nor sufficient for ensuring that people invested in their own human capital.
Sheilagh Ogilvie 183
Guilds did not just administer a training system which was open to all capable applicants. Instead, to secure rents for their members, guilds decided who was allowed to get training, and kept most people out. As one German jurist put it in 1780, “Anyone who wants to learn a craft has to possess particular qualities, which are necessary because without them no-one can be accepted as an apprentice and enrolled in a guild. Among these qualities are included . . . masculine sex, since no female may properly practise a craft, even if she understands it just as well as a male person” (as quoted in Ogilvie 2003, p. 97). Guilds denied apprenticeship not just to females, but to many males—Jews, bastards, gypsies, former serfs, and slaves; most members of other religions, ethnicities, and nationalities; those without the right parentage in the guild or community; those with an ancestor who had practiced a “defiling” occupation; and anyone who couldn’t afford the entrance fees (Walker 1971; Wiesner 2000; Horn 2006; Ogilvie 2007a).
It might be argued that sexist, anti-Semitic, and racist cultural norms were universal in premodern societies, so guild barriers against women, Jews, and minority ethnic groups did not matter (for example, Epstein 2008; Epstein and Prak 2008). But cultural norms could only exert economic impact via institutions, such as guilds, that penalized those who deviated from the norms, for instance by admitting women or Jews to training. In markets where guilds were weak or absent, the individual self-interest of trainers, employers, and consumers made the enforce-ment of cultural norms much less effective (Ogilvie 2003, 2004b; Trivellato 2006).2
Craft guilds are sometimes portrayed as institutions that corrected failures in markets for human capital that made it difficult for individuals to choose the right training, for good trainers and good trainees to identify one another, and for consumers to identify well-trained producers (Epstein 1998; Pfister 1998; Epstein and Prak 2008). Did guilds ensure higher, or more economically relevant, levels of human capital investment for the small numbers of insider males whom they admitted than those individuals would have obtained otherwise? The deficiencies in guild training discussed above, the high drop-out rates among guild apprentices, the eagerness with which consumers bought goods and services from non-guild-trained “interlopers,” and the success of so many nonguilded industries suggests that in many cases the answer was “no” (Heaton 1965; Rappaport 1989; Ogilvie 2007a; Wallis 2008).
Technological InnovationHow did guilds affect technological innovation? The most visible way in which
guilds interacted with new techniques was when, as often happened, they opposed them. Many guild members thought there was a limited lump of labor to go around. Innovations that squeezed more output from existing inputs would flood markets,
2 A 2007 estimate suggests that restrictions on women’s access to education and training cost modern Asian economies $16–$30 billion a year, and that increasing female education and training by 1 percentage point would increase GDP growth by 0.2 percentage points (United Nations Economic and Social Commission for Asia and the Pacific 2007, pp. 105–6). Such findings for modern developing economies suggest that when guilds in preindustrial Europe restricted the access of women to training, they inflicted wider economic damage (Ogilvie 2003).
184 Journal of Economic Perspectives
depress prices, and put guild masters out of work. As one fourteenth-century Catalan intellectual put it, “If a shoemaker comes along with new tools and makes 70 shoes in a day where others make 20 . . . that would be the ruin of 100 or 200 shoemakers” (as quoted in Casey 1999, p. 65). Guilds therefore often opposed innovations that seemed to threaten their rents in this zero-sum world. They lobbied against new devices and products, forbade their members to adopt new processes, blocked imports embodying new ideas, and boycotted wares and workers from places that used forbidden techniques (La Force 1965; Amelang 1986; Ogilvie 2004a; Davids 2008).
On the other hand, guilds did not always oppose innovation, and a number of new techniques were invented by guild masters or adopted within guilds (Epstein 1998; Epstein and Prak 2008). To some extent, this was inevitable because such a large percentage of specialized industrial producers were organized into guilds (Ogilvie 2007a, 2008). However, one can also propose theoretical models in which guilds provided institutional mechanisms to support invention and diffusion of new technology. For example, by providing monopoly rents in output markets, guilds might have allowed innovators to capture a portion of the gains from innovation. By monopolizing the labor market in a particular occupation, guilds might help to ensure transmission of techniques across generations (via compulsory years of apprenticeship) and across space (via compulsory traveling by journeymen). By promoting spatial clustering of craftsmen in towns, guilds might facilitate tech-nology transfer among masters (Epstein 1998; Epstein and Prak 2008).
Of course, the fundamental issue is what institutional arrangements best address the potential for market failure posed by the fact that technological infor-mation is a public good. While the theoretical models of how guilds might foster innovation doubtless capture part of the truth, almost any market structure can be shown to have superior innovative qualities, depending on the choice of assump-tions (Scherer and Ross 1990). Moreover, the assumptions in these models often do not fit the facts on the ground. Guilds, as we have seen, enjoyed legal monopolies with strong barriers to entry. Very high levels of industrial concentration, such as those fostered by guilds, rarely show any positive effect on technological progress, more often tending to impede it by limiting the number of independent sources of innovation, reducing incentives to improve market position by devising new techniques, and blocking entry by venturesome upstarts (Scherer and Ross 1990; Ogilvie 2004a).
Nor did the diffusion of technical information require guilds. As discussed above, outsiders who had been denied guild training managed to learn the rele-vant technical expertise without it, masters’ widows who never had any formal guild training practiced the techniques legally, and many successful European industries transmitted their techniques across generations without relying on guilds (Ogilvie 2004a; Hafter 2007; Davids 2008; Caracausi 2014). Communicating innovations geographically did not require guild journeymanship: some of the most innovative industrial societies in premodern Europe (such as the Low Countries and England) did not require journeymen to travel, while some of the most backward did (such
The Economics of Guilds 185
as the German and Austrian territories) (Ogilvie 2007a; Davids 2008). In any case, premodern workers were highly mobile even in unguilded occupations such as agriculture and laboring (Lucassen and Lucassen 1997; Ogilvie 2003). Horizontal transmission of technical expertise may have benefited from spatial clustering, but for this, guilds were neither necessary nor sufficient. After all, industrial agglom-eration is widely observed in many guild-free economies, including modern ones, because of its recognized economic advantages (Marshall 1920; Ogilvie 2007a, 2008).
Guild actions to secure rents for their members also had unintended, but negative, consequences for innovation. Guilds regulated production processes in detail as part of their overall goals of monitoring unlicensed production. But stip-ulating precisely how a product was supposed to be made also deterred innovation by ossifying production methods and excluding even desirable deviations (Daumas 1953; Trivellato 2006; Caracausi 2014). Guilds fixed minimum prices to protect their members from low-cost competitors, but this also deterred innovators by forbidding them to profit by finding ways to charge less than competitors (Ogilvie 2004a, 2007a). Guilds restricted admissions and prohibited mobility to exclude entrants, but these regulations also deterred innovation, because migration of practitioners embodying innovative industrial and commercial practices was the most common form of technological transfer in premodern societies (de Vries 1976; Amelang 1986; Boldorf 2009; Caracausi 2014). Guilds justified their entry barriers partly by their apprenticeship and journeymanship regulations which obliged practitioners to spend many years investing in learning a particular set of techniques; but this endowed masters with a heavy investment in human capital specific to that technology, creating incentives to resist any technical change that threatened the value of masters’ investment (Daumas 1953; Ogilvie 2007a; Mokyr 2009). Guilds imposed demarcations between different crafts to protect their members’ monopoly rents, but this deterred innovation by preventing the productive exchange of ideas between adjacent bodies of knowledge (Rosenband 1997; Ogilvie 2004a; Fitzsimmons 2010). The eighteenth-century English preci-sion-instrument industry, for instance, was the most advanced in Europe partly because the London “livery companies” of the clockmakers and spectacle-makers no longer regulated entry or production practices, facilitating an influx of venturesome newcomers and innovative methods from adjacent occupations; in France, by contrast, the industry was stifled by guild regulations fixing occupa-tional demarcations, workshop size, employee numbers, division of labor, output quotas, prices, and selling practices, which even royal and seigneurial protection could only partly counteract (Daumas 1953).
Comparisons within and between European societies suggest that, although guilds sometimes permitted or even pioneered new practices and products, their net effect on technological innovation was negative. In Normandy, one of the most highly industrialized French provinces, guild obstacles to new techniques and prac-tices meant that by 1782, 85 percent of cotton manufacturing and the entirety of the woolen, stocking, metallurgical, paper, glass, chemical, and ceramics indus-tries were sheltered in small, scattered guild-free enclaves (Horn 2012). Within
186 Journal of Economic Perspectives
the Netherlands, Leiden distinguished itself from other cities by limiting or alto-gether banning textile guilds, yet its flourishing industries were at the forefront of technological innovation, introducing hundreds of new fabrics and a vast array of innovative methods and devices between 1580 and 1797 (Ogilvie 2007a; Davids 2008; Lis and Soly 2008). Within England, the mechanical innovations of the Industrial Revolution were introduced not in the guilded “borough” towns but in fast-growing centers such as Birmingham, Manchester, Leeds, Halifax, Sheffield, and Wolverhampton, which had no guilds (Clark and Slack 1976; Coleman 1977; Pollard 1997). Across German-speaking central Europe, English textile machinery was introduced first in the Rhineland where territorial fragmentation enabled local entrepreneurs to evade guild opposition by securing factory permits from neighboring states; and in Saxony, where rulers had systematically weakened guild institutions since the sixteenth century (Kisch 1989; Tipton 1976). Territories such as Austria, Württemberg, Bavaria, and Silesia, by contrast, retained powerful guilds of merchants and craftsmen which used government protection to block inno-vations in the hope of protecting their members’ rents long into the nineteenth century (Freudenberger 1960; Tipton 1976; Ogilvie 1996a; Boldorf 2009).
Across Europe, as we have seen, the same industry could be strongly guilded in some societies, weakly guilded in others, and wholly unguilded in still others. There is no evidence that technological innovation was greater in the strongly guilded ones. On the contrary: in many cases unguilded or weakly guilded industries were at the forefront of inventing, adopting, and diffusing new techniques. Evidence on the level of both political regions and specific industries thus indicates that the net effect of guilds was to intensify, rather than to correct, imperfections in markets relating to innovations—not just markets for ideas, but the factor and product markets neces-sary for putting new ideas to work in practical business settings (Ogilvie 2000).
What Do Guilds Tell Us about Institutions and Growth?
Some models of markets and economic growth point out the importance of institutions that generate trust and “social capital.” The empirical findings on European guilds suggest that trust and social capital take two distinct forms, which play fundamentally different roles in economic performance (Ogilvie 2005). A guild typically generated a particularized trust among its own members, as insiders in the closed and multiplex social network of that guild. But broader economic growth requires a generalized trust that makes people willing to transact on an equal footing with everyone, even strangers (Ogilvie 2011; Ogilvie and Carus 2014). There is no evidence that a particularized trust in people who were members of the same guild encouraged a generalized trust across the wider economy. On the contrary, as we have seen, the particularized social capital of guilds gave rise to rent-seeking, demarca-tion struggles, and hostility towards outsiders, diminishing rather than fostering the trust in strangers that might have made markets and states work better. Indeed, the history of European guilds suggests that the existence of entrenched social
Sheilagh Ogilvie 187
networks fostering a particularized trust among members can block the rise of more productive institutional arrangements such as impersonal markets and impartial states that enable gains from trade among people who are dissimilar and do not already know one another (Ogilvie 2005, 2011; Ogilvie and Carus 2014).
Even more fundamentally, guilds hold lessons for explaining the emergence, survival, and decline of economic institutions themselves. Guilds existed in a vast range of geographically variegated locations, European and non-European, from the Arctic Circle to the equator, from huge maritime cities such as Venice and Istanbul to tiny landlocked villages in the Black Forest or northern Bohemia. These included societies of widely differing languages, religions, and value systems, from the Roman Empire to Egypt, India, China, Japan, Persia, Turkey, Europe, and Central and South America. This range strongly suggests that the formation of guilds is not an outcome of accident, geography, cultural beliefs, population density, or the technical require-ments of particular occupations.
Instead, the historical findings on guilds provide strong support for explana-tions according to which institutions arise and survive for centuries not mainly because they address market failures, but because they serve the distributional interests of powerful groups (Acemoglu, Johnson, and Robinson 2005; Ogilvie and Carus 2014). Guilds illustrate the long historical interdependence between economic and political institutions in regulating markets. Guilds could sustain their members’ collective monopoly against internal free-riding and external compe-tition only by getting support from political authorities in exchange for a share of the rents. Premodern urban and royal governments drew on multiple sources of taxes, loans, and political support. But special-interest groups such as guilds offered highly attractive bribes, gifts, loans, fiscal services, and regulatory collaboration that enabled rulers and their officials to obtain funds in advance of tax receipts, to induce merchants and craftsmen to reveal information about business conditions through their bids for privileges, to put pressure on businessmen to make higher loans than would otherwise have been forthcoming, to benefit from businessmen’s knowl-edge and expertise in collecting industrial and commercial taxes, and to mobilize political support from the bourgeoisie (Ogilvie 2011; Rapp 1976; Bourgeon 1985; Hafter 1989; Lindberg 2009; Caracausi 2014). Guilds were institutions whose total costs were large but were spread over a large number of people—potential entrants, employees, consumers—who faced high transaction costs in resisting a politically entrenched institution. The total benefits of guilds, by contrast, were small, but were concentrated within a small group—guild members, political elites—who faced low costs of organizing alliances to keep them in being. Guilds survived for so long in so many places because of this logic of collective action (Ogilvie 2004a). As the Minister of Finance Anne-Robert-Jacques Turgot wrote to the King on the eve of his unsuccessful attempt to abolish the French guilds in 1776, “Many people have great interest in retaining the guilds, both the heads of the guilds themselves and those who benefit along with them, for the conflicts to which the guild system gives rise are one of the most abundant sources of profits for the people of the Palace” (Schelle 1913–23, vol. 5, p. 159).
188 Journal of Economic Perspectives
So why did guilds ever disappear? Even in the medieval and early modern heyday of guilds, there were enclaves—the Champagne fair towns, Douai, Hondschoote, Nürnberg, Leiden, the Zaanstreek, Krefeld, Normandy, Birmingham, Manchester—where businessmen and governments primarily used generalized rather than particularized institutions (Edwards and Ogilvie 2012; Ogilvie and Carus 2014). The period after roughly 1500 saw a widening divergence across Europe in the relationship between governments and guilds. In societies such as the Low Coun-tries and England, the political authorities gradually ceased to grant and enforce guilds’ privileges, while in “corporatist-absolutist” European states, such as France, Spain, Austria, Scandinavia, and the German and Italian territories, political elites continued to profit from their particularistic bargain with guilds for much longer (Ogilvie 2000, 2011).
The reasons for the gradual breakdown of the coalition between guilds and governments in some parts of western Europe remain a matter of lively debate. But current scholarship suggests a complex of factors that created a new equilibrium in which both the political authorities and the owners of industrial and commercial businesses gradually discovered they could do better for themselves by departing from the particularist path and beginning to use more generalized institutional mechanisms. These factors included stronger representative institutions (parlia-ments) that increasingly constrained how rulers could raise revenues and grant privileges to special interest-groups; a more highly diversified urban system in which towns did not act in concert, but rather competed and limited each other’s ability to secure privileges from the public authorities; a more variegated social structure including prosperous, articulate, and politically influential individuals who wanted to practice trade and industry and objected to its being monopolized by members of exclusive organizations; and governments that gradually made taxation more gener-alized and developed markets for public borrowing, reducing the attractiveness of short-term fiscal expedients such as selling privileges to special-interest groups (de Vries 1976; Lindberg 2008, 2010; Mokyr 2009; Ogilvie 2011; Gelderblom 2013; Ogilvie and Carus 2014).
In the “corporative-absolutist” societies of central, Nordic, southern and eastern Europe, by contrast, the distributional coalition between guilds and governments only broke down through political conflict, always bitter and sometimes violent. France only abolished its guilds in 1791 after a national revolution and then imposed this institutional reform as it conquered neighboring polities such as the Southern Netherlands (modern Belgium and Luxembourg), the Northern Netherlands, many Italian states, and parts of Germany (Acemoglu, Cantoni, Johnson, and Robinson 2011). But there were also many European societies—Austria, Hungary, Portugal, Spain, the Scandinavian countries, and numerous German states—that did not abolish guilds until the 1860s or even later, in most cases only after long and bitter sociopolitical conflict.
The historical findings on guilds thus provide strong support for the view that institutions arise and survive for centuries not because they are efficient but because they serve the distributional interests of powerful groups.
The Economics of Guilds 189
■ I would like to thank Andrea Caracausi and André Carus for their stimulating suggestions on an earlier version of this paper, and Jeremy Edwards for his thoughtful comments on the final text. I am also very grateful for wide-ranging feedback and concrete suggestions from the editors: David Autor, Chang-Tai Hsieh, and Timothy Taylor.
References
Acemoglu, Daron, Davide Cantoni, Simon Johnson, and James A. Robinson. 2011. “The Consequences of Radical Reform: The French Revolution.” American Economic Review 101(7): 3286–3307.
Acemoglu, Daron, Simon Johnson, and James A. Robinson. 2005. “Institutions as a Fundamental Cause of Long-Run Growth.” In Handbook of Economic Growth, vol. 1, edited by Philippe Aghion and Steven N. Durlauf, 385–472. Elsevier.
Amelang, James S. 1986. Honored Citizens of Barcelona: Patrician Culture and Class Relations, 1490–1714. Princeton University Press.
Archer, Ian W. 1991. The Pursuit of Stability: Social Relations in Elizabethan London. Cambridge University Press.
Becher, Johann Joachim. 1688. Politische Discurs, 3rd edition. Frankfurt: Zunner.
Becker, Marvin B. 1962. “Florentine Popular Government (1343–1348).” Proceedings of the American Philosophical Society 106(4): 360–82.
Boerner, Lars, and Albrecht Ritschl. 2002. “Individual Enforcement of Collective Liability in Premodern Europe.” Journal of Institutional and Theoretical Economics 158(1): 205–13.
Boldorf, Marcel. 2009. “Socio-Economic Institu-tions and Transaction Costs: Merchant Guilds and Rural Trade in Eighteenth-Century Lower Silesia.” European Review of Economic History 13(2): 173–98.
Bossenga, Gail. 1988. “Protecting Merchants: Guilds and Commercial Capitalism in Eighteenth-Century France.” French Historical Studies 15(4): 693–703.
Bourgeon, Jean-Louis. 1985. “Colbert et les corporations: l’exemple de Paris.” In Un nouveau Colbert: Actes du colloque pour le tricentenaire de la mort de Colbert, edited by Roland Mousnier, 241–53. Paris: Sedes.
Caracausi, Andrea. 2014. “Textiles Manufac-turing, Product Innovations and Transfers of Technology in Padua and Venice between the
Sixteenth and Eighteenth Centuries.” In Creativity and Innovation in Late Medieval and Early Modern European Cities, edited by Karel Davids and Bert De Munck, 131–60. Aldershot: Ashgate.
Casey, James. 1999. Early Modern Spain: A Social History. London: Routledge.
Cerutti, Simona. 2010. “Travail, mobilité et légitimité. Suppliques au roi dans une société d’Ancien Régime (Turin, XVIIIe siècle).” Annales. Histoire, Sciences Sociales 65(3): 571–611.
Clark, Peter, and Paul Slack. 1976. English Towns in Transition 1500–1700. Oxford University Press.
Cole, Charles Woolsey. 1939. Colbert and a Century of French Mercantilism. New York: Columbia University Press.
Coleman, Donald C. 1977. The Economy of England 1450–1750. Oxford University Press.
Daumas, Maurice. 1953. Les instruments scien-tifiques aux XVIIe et XVIIIe siècles. Paris: Presses universitaires de France.
Davids, Karel. 2003. “Guilds, Guildsmen and Technological Innovation in Early Modern Europe: The Case of the Dutch Republic.” Economy and Society of the Low Countries Working Papers 2003-2.
Davids, Karel. 2008. The Rise and Decline of Dutch Technological Leadership: Technology, Economy, and Culture in the Netherlands, 1350–1800, 2 vols. Leiden: Brill.
De Soto, Hernando. 1989. The Other Path: The Invisible Revolution in the Third World. New York: Harper & Row.
de Vries, Jan. 1976. The Economy of Europe in an Age of Crisis, 1600–1750. Cambridge University Press.
de Vries, Jan, and Ad van der Woude. 1997. The First Modern Economy: Success, Failure, and Persever-ance of the Dutch Economy, 1500–1815. Cambridge University Press.
Dollinger, Philippe. 1970. The German Hansa. London: Macmillan.
Edwards, Jeremy, and Sheilagh Ogilvie. 2012.
190 Journal of Economic Perspectives
“What Lessons for Economic Development Can We Draw from the Champagne Fairs?” Explorations in Economic History 49(2): 131–48.
Ehmer, Josef. 2008. “Rural Guilds and Urban-Rural Guild Relations in Early Modern Central Europe.” International Review of Social History 53(S16): 143–58.
Epstein, S. R. 1998. “Craft Guilds, Apprentice-ship, and Technological Change in Preindustrial Europe.” Journal of Economic History 58(3): 684–713.
Epstein, S. R. 2008. “Craft Guilds in the Premodern Economy: A Discussion.” Economic History Review 61(1): 155–74.
Epstein, S. R., and Maarten Prak. 2008. “Intro-duction: Guilds, Innovation and the European Economy, 1400–1800.” In Guilds, Innovation and the European Economy, 1400–1800, edited by Stephan R. Epstein and Maarten Prak, 1–24. London: Routledge.
Epstein, Steven A. 1991. Wage Labor and Guilds in Medieval Europe. Chapel Hill, NC: University of North Carolina Press.
Fitzsimmons, Michael P. 2010. From Artisan to Worker: Guilds, the French State, and the Organization of Labor, 1776–1821. Cambridge University Press.
Forbes, John. 2002. “Search, Immigration and the Goldsmiths’ Company: A Study in the Decline of Its Powers.” In Guilds, Society, and Economy in London, 1450–1800, edited by Ian A. Gadd and Patrick Wallis, 115–26. London: Centre for Metro-politan History.
Freudenberger, Herman. 1960. “The Woolen-Goods Industry of the Habsburg Monarchy in the Eighteenth Century.” Journal of Economic History 20(3): 383–406.
Gauci, Perry. 2002. “Informality and Influence: The Overseas Merchant and the Livery Compa-nies, 1660–1702.” In Guilds, Society, and Economy in London, 1450–1800, edited by Ian Anders Gadd and Patrick Wallis, 127–39. London: Centre for Metropolitan History.
Gayne, Mary K. 2004. “Illicit Wigmaking in Eighteenth-Century Paris.” Eighteenth-Century Studies 38(1): 119–37.
Gelderblom, Oscar. 2013. Cities of Commerce: The Institutional Foundations of International Trade in the Low Countries, 1250–1650. Princeton University Press.
Greif, Avner. 2006. Institutions and the Path to the Modern Economy: Lessons from Medieval Trade. Cambridge University Press.
Greif, Avner, Paul Milgrom, and Barry Weingast. 1994. “Coordination, Commitment, and Enforcement: The Case of the Merchant Guild.” Journal of Political Economy 102(4): 912–50.
Gustafsson, Bo. 1987. “The Rise and Economic Behavior of Medieval Craft Guilds: An
Economic-Theoretical Interpretation.” Scandina-vian Economic History Review 35(1): 1–40.
Hafter, Daryl M. 1989. “Gender from a Working Class Viewpoint in Eighteenth Century France.” Proceedings of the Western Society for French History 16: 415–22.
Hafter, Daryl M. 2007. Women at Work in Prein-dustrial France. University Park, PA: Penn State University Press.
Harding, Vanessa. 2000. “Reformation and Culture 1540–1700.” In The Cambridge Urban History of Britain. Vol. 2: 1540–1840, edited by Peter Clark, 263–88. Cambridge University Press.
Harreld, Donald J. 2004. High Germans in the Low Countries: German Merchants and Commerce in Golden Age Antwerp. Leiden: Brill.
Heaton, Herbert. 1965. The Yorkshire Woollen and Worsted Industries from Earliest Times to the Industrial Revolution, 2nd edition. Oxford: Clarendon Press.
Hickson, Charles R., and Earl A. Thompson. 1991. “A New Theory of Guilds and European Economic Development.” Explorations in Economic History 28(2): 127–68.
Homer, Ronald F. 2002. “The Pewterers Company’s Country Searches and the Company’s Regulation of Prices.” In Guilds, Society, and Economy in London, 1450–1800, edited by Ian Anders Gadd and Patrick Wallis, 101–13. London: Centre for Metropolitan History.
Horn, Jeff. 2006. The Path Not Taken: French Industrialization in the Age of Revolution, 1750–1830. Cambridge, MA: MIT Press.
Horn, Jeff. 2012. “‘A Beautiful Madness’: Privilege, the Machine Question and Industrial Development in Normandy in 1789.” Past & Present 217(1): 149–85.
Kaplan, Steven L. 1981. “The Luxury Guilds in Paris in the Eighteenth Century.” Francia 9: 257–98.
Katele, Irene B. 1988. “Piracy and the Venetian State: The Dilemma of Maritime Defense in the Fourteenth Century.” Speculum 63(4): 865–89.
Kellett, J. R. 1958. “The Breakdown of Guild and Corporation Control of the Handicraft and Retail Trades in London.” Economic History Review 10(3): 381–94.
Kisch, Herbert. 1989. From Domestic Manufacture to Industrial Revolution: The Case of the Rhineland Textile Districts. Oxford University Press.
La Force, James Clayburn. 1965. The Develop-ment of the Spanish Textile Industry, 1750–1800. University of California Press.
Larmour, Ronda. 1967. “A Merchant Guild of Sixteenth-Century France: The Grocers of Paris.” Economic History Review 20(3): 467–81.
Lindberg, Erik. 2008. “The Rise of Hamburg as a Global Marketplace in the Seventeenth Century: A Comparative Political Economy Perspective.”
Sheilagh Ogilvie 191
Comparative Studies in Society and History 50(3): 641–62.
Lindberg, Erik. 2009. “Club Goods and Inef-ficient Institutions: Why Danzig and Lübeck Failed in the Early Modern Period.” Economic History Review 62(3): 604–28.
Lindberg, Erik. 2010. “Merchant Guilds in Hamburg and Königsberg: A Comparative Study of Urban Institutions and Economic Development in the Early Modern Period.” Journal of European Economic History 39(1): 33–66.
Lis, Catharina, and Hugo Soly. 2008. “Subcontracting in Guild-Based Export Trades, Thirteenth–-Eighteenth Centuries.” In Guilds, Innovation and the European Economy, 1400–1800, edited by S. R. Epstein and Maarten Prak, 81–113. London: Routledge.
Lucassen, Jan, and Leo Lucassen, eds. 1997. Migration, Migration History, History: Old Paradigms and New Perspectives. Bern: Peter Lang.
Marshall, Alfred. 1920. Principles of Economics. 8th edition. London: Macmillan & Co.
Minard, Philippe. 2000. “Colbertism Continued? The Inspectorate of Manufactures and Strategies of Exchange in Eighteenth-Century France.” French Historical Studies 23(3): 477–96.
Mokyr, Joel. 2009. The Enlightened Economy: An Economic History of Britain, 1700–1850. Princeton University Press.
Muldrew, Craig. 1993. “Interpreting the Market: The Ethics of Credit and Community Relations in Early Modern England.” Social History 18(2): 163–83.
Najemy, John M. 1979. “Guild Republicanism in Trecento Florence: The Successes and Ultimate Failure of Corporate Politics.” American Historical Review 84(1): 53–71.
Ogilvie, Sheilagh. 1996a. “The Beginnings of Industrialization.” In Germany: A New Social and Economic History, Vol. II: 1630–1800, edited by Sheilagh Ogilvie, 263–308. London: Edward Arnold.
Ogilvie, Sheilagh. 1996b. “Social Institu-tions and Proto-Industrialization.” In European Proto-Industrialization, edited by Sheilagh Ogilvie and Markus Cerman, 23–37. Cambridge University Press.
Ogilvie, Sheilagh. 1997. State Corporatism and Proto-Industry: The Württemberg Black Forest, 1580–1797. Cambridge University Press.
Ogilvie, Sheilagh. 2000. “The European Economy in the Eighteenth Century.” In The Short Oxford History of Europe, Vol. XII: The Eighteenth Century: Europe 1688–1815, edited by T. W. C. Blanning, 91–130. Oxford University Press.
Ogilvie, Sheilagh. 2003. A Bitter Living: Women, Markets, and Social Capital in Early Modern Germany. Oxford University Press.
Ogilvie, Sheilagh. 2004a. “Guilds, Efficiency and Social Capital: Evidence from German Proto- Industry.” Economic History Review 57(2): 286–333.
Ogilvie, Sheilagh. 2004b. “How Does Social Capital Affect Women? Guilds and Communities in Early Modern Germany.” American Historical Review 109(2): 325–59.
Ogilvie, Sheilagh. 2005. “The Use and Abuse of Trust: The Deployment of Social Capital by Early Modern Guilds.” Jahrbuch für Wirtschaftsgeschichte. Economic History Yearbook, no. 1: 15–52.
Ogilvie, Sheilagh. 2007a. “Can We Rehabilitate the Guilds? A Sceptical Re-Appraisal.” Cambridge Working Papers in Economics 0745.
Ogilvie, Sheilagh. 2007b. “‘Whatever Is, Is Right’? Economic Institutions in Pre-Industrial Europe.” Economic History Review 60(4): 649–84.
Ogilvie, Sheilagh. 2008. “Rehabilitating the Guilds: A Reply.” Economic History Review 61(1): 175–82.
Ogilvie, Sheilagh. 2011. Institutions and European Trade: Merchant Guilds, 1000–1800. Cambridge University Press.
Ogilvie, Sheilagh, and André W. Carus. 2014. “Institutions and Economic Growth in Historical Perspective.” In Handbook of Economic Growth, vol. 2, edited by Stephen Durlauf and Philippe Aghion, 405–514. Amsterdam: Elsevier.
Pfister, Ulrich. 1998. “Craft Guilds and Proto-Industrialization in Europe, 16th to 18th Centuries.” In Guilds, Economy and Society, edited by S. R. Epstein, H. G. Haupt, Carlo Poni, and Hugo Soly, 11–24. Seville: International Economic History Conference.
Pfister, Ulrich. 2008. “Craft Guilds and Technological Change: The Engine Loom in the European Silk Ribbon Industry in the Seventeenth and Eighteenth Centuries.” In Guilds, Innovation and the European Economy, 1400–1800, edited by S. R. Epstein and Maarten Prak, 172–98. London: Routledge.
Pollard, Sidney. 1997. Marginal Europe: The Contribution of Marginal Lands since the Middle Ages. Oxford: Clarendon Press.
Rapp, Richard Tilden. 1976. Industry and Economic Decline in Seventeenth-Century Venice. Cambridge, MA: Harvard University Press.
Rappaport, Steve. 1989. Worlds within Worlds: Structures of Life in Sixteenth-Century London. Cambridge University Press.
Richardson, Gary. 2004. “Guilds, Laws, and Markets for Manufactured Merchandise in Late-Medieval England.” Explorations in Economic History 41(1): 1–25.
Roper, Lyndal. 1989. The Holy Household: Women and Morals in Reformation Augsburg. Oxford: Clarendon.
192 Journal of Economic Perspectives
Rosenband, Leonard N. 1997. “Jean-Baptiste Réveillon: A Man on the Make in Old Regime France.” French Historical Studies 20(3): 481–510.
Sachs, Stephen E. 2006. “From St. Ives to Cyber-space: The Modern Distortion of the Medieval ‘Law Merchant.’” American University International Law Review 21(5): 685–812.
Saint-Léon, Étienne Martin. 1922. Histoire des corporations de métiers, depuis leurs origines jusqu’à leur suppression en 1791, 3rd revised edition. Paris: F. Alcan.
Schelle, Gustave, ed. 1913–23. Œuvres de Turgot et documents le concernant. Paris: Alcan.
Scherer, Frederic M., and David March Ross. 1990. Industrial Market Structure and Economic Performance, 3rd edition. Boston: Houghton Mifflin.
Smith, Adam. 1776 [1976]. An Inquiry into the Nature and Causes of the Wealth of Nations. London: W. Strahan and T. Cadell, 1776. Reprint, Oxford: Oxford University Press, 1976.
Spruyt, Hendrik. 1994. The Sovereign State and Its Competitors: An Analysis of Systems Change. Princeton University Press.
Státní Oblastní Archiv Litomerice, Pobocka Decín [Czech Republic]. 1662. Archive file “Fond Rodinný archiv Clam-Gallasu, Historická sbírka,” Carton 80, folio 59, legal case dated 1 August 1662.
Tai, Emily Sohmer. 1996. “Honor among Thieves: Piracy, Restitution, and Reprisal in Genoa, Venice, and the Crown of Catalonia-Aragon, 1339–1417.” PhD Dissertation, Harvard University.
Tipton, Frank B. 1976. Regional Variations in the Economic Development of Germany During the Nineteenth Century. Middletown, CT: Wesleyan University Press.
Trivellato, Francesca. 2006. “Murano Glass, Continuity and Transformation (1400–1800).” In At the Centre of the Old World: Trade and Manufacturing in Venice and the Venetian Mainland (1400–1800),
edited by Paola Lanaro, 143–84. Toronto: Centre for Reformation and Renaissance Studies.
United Nations Economic and Social Commis-sion for Asia and the Pacific. 2007. Economic and Social Survey of Asia and the Pacific: Surging Ahead in Uncertain Times. New York: United Nations.
van den Heuvel, Danielle. 2007. Women and Entrepreneurship: Female Traders in the Northern Netherlands, C. 1580–1815. Amsterdam: Aksant.
van den Heuvel, Danielle, and Sheilagh Ogilvie. 2013. “Retail Development in the Consumer Revolution: The Netherlands, C. 1670–C. 1815.” Explorations in Economic History 50(1): 69–87.
van Zanden, Jan Luiten, and Maarten Prak. 2006. “Towards an Economic Interpretation of Citizenship: The Dutch Republic between Medieval Communes and Modern Nation-States.” European Review of Economic History 10(2): 111–47.
Volckart, Oliver, and Antje Mangels. 1999. “Are the Roots of the Modern Lex Mercatoria Really Medieval?” Southern Economic Journal 65(3): 427–50.
Walker, Mack. 1971. German Home Towns: Community, State, and General Estate 1648–1871. Ithaca, NY: Cornell University Press.
Wallis, Patrick. 2008. “Apprenticeship and Training in Premodern England.” Journal of Economic History 68(3): 832–61.
Wiesner, Merry E. 2000. Women and Gender in Early Modern Europe, 2nd revised edition. Cambridge University Press.
Woodward, Ralph Lee, Jr. 2007. “Merchant Guilds (Consulados De Comercio) in the Spanish World.” History Compass 5(5): 1576–84.
Wubs-Mrozewicz, Justyna. 2005. “The Bergen-fahrer and the Bergenvaarders: Lübeck and Amsterdam in a Study of Rivalry c. 1440–1560.” In Das Hansische Kontor zu Bergen und die Lübecker Bergenfahrer: International Workshop Lübeck 2003, edited by Antjekathrin Grassmann, 206–30. Lübeck: Schmidt-Römhild.
Journal of Economic Perspectives—Volume 28, Number 4—Fall 2014—Pages 193–212
R oughly 12 percent of humans are left-handed, with somewhat higher rates among males than females (Vuoksimaa, Koskenvuoa, Rosea, and Kaprio 2009). For much of history, left-handedness was viewed with deep suspi-
cion. During the Middle Ages, left-handed writers were thought to be possessed by the Devil, generating the modern sense of the word sinister from sinistra, the Latin word for left. The English word left itself comes from the Old English lyft, meaning idle, weak, or useless. The French word for left, gauche, also means clumsy or awkward. Similarly negative connotations of the word left are found in numerous languages, including German, Italian, Russian, and Mandarin (Coren 1992).
Superstitions about left-handedness take numerous forms (Perelle and Ehrman 2005). In many Middle Eastern countries, food and drink should be taken with the right hand and bodily functions performed with the left. Hindu tradi-tion forbids the left hand from performing many of the central religious rituals. Left-handedness suggested to Eskimos that the individual was a sorcerer and to colo-nial Americans that the individual might be a witch. The Jewish scholar Maimonides listed left-handedness among the 100 blemishes that disqualified someone from being a Jewish priest.
Left-handers have often been compelled by their parents and schools to use their right hand for writing and other tasks. Such practices are now more common in developing countries so that, for example, 11 percent of Turks and 16 percent of Nigerians report attempts to switch their handedness earlier in life (Medland, Perelle, De Monte, and Ehrman 2004). Such compelled switching is increasingly rare
The Wages of Sinistrality: Handedness, Brain Structure, and Human Capital Accumulation†
■ Joshua Goodman is Assistant Professor of Public Policy, Harvard Kennedy School, Cambridge, Massachusetts. His email address is [email protected].† To access the Appendix and Data Appendix, visithttp://dx.doi.org/10.1257/jep.28.4.193 doi=10.1257/jep.28.4.193
Joshua Goodman
194 Journal of Economic Perspectives
in the United States and other high-income nations. If anything, left-handedness has come into vogue, with modern proponents who argue that left-handedness is overrepresented among highly talented individuals. Proponents of this view cite either anecdotal evidence, such as the fact that four of the last seven US presidents have been left-handed (Gerald Ford, George H. W. Bush, Bill Clinton, and Barack Obama), or studies that purport to demonstrate unusual intelligence (Perelle and Ehrman 1983) or creativity among left-handers (Coren 1995).
In this paper, I argue that the phenomenon of handedness can provide insight into some of the issues surrounding economists’ recent exploration of early biolog-ical and environmental influences on people’s long-run outcomes. I review prior research showing that left- and right-handed individuals have different brain struc-tures, particularly with regard to language processing. Using five datasets from the United States and the United Kingdom, I show that, consistent with prior research, both maternal left-handedness and poor infant health increase the likelihood of a child being left-handed. Thus, handedness can be used to explore the long-run effects of differential brain structure generated in part by genetics and in part by poor infant health.
Lefties exhibit economically and statistically significant human capital defi-cits relative to righties, even conditional on infant health and family background. Compared to righties, lefties score a tenth of a standard deviation lower on measures of cognitive skill and, contrary to popular wisdom, are not overrepresented at the high end of the distribution. Lefties have more emotional and behavioral problems, have more learning disabilities such as dyslexia, complete less schooling, and work in occupations requiring less cognitive skill. Differences between left- and right-handed siblings, which offer a way of controlling for qualities of family upbringing, are similar in magnitude. Interestingly, lefties with left-handed mothers show no cognitive defi-cits relative to righties. Some of these facts have been documented previously, though not across the range of datasets used here.
Lefties also have 10–12 percent lower annual earnings than righties, roughly equivalent to the return to a year of schooling in these samples. A large fraction of this gap can be explained by observed differences in cognitive skills and emotional or behavioral problems. Lefties work in more manually intensive occupations than do righties, further suggesting that their primary labor market disadvantage is cognitive rather than physical. This paper is the first to document these patterns.
These findings touch on three strands in the prior research literature. First, previous work on handedness has either focused on short-run outcomes ( Johnston, Nicholls, Shan, and Shields 2009, 2010) or used single datasets to explore long-run outcomes (Ruebeck, Harrington, and Moffitt 2007; Denny and O’Sullivan 2007). I explore both short- and long-run outcomes in multiple datasets and show that prior mixed results on earnings appear less ambiguous than previously docu-mented. Second, the burgeoning drive to integrate neuroscience into the modeling of cognitive and noncognitive skill formation is impeded by the absence in most datasets of measures of neurological wiring (Heckman 2007). Handedness may provide such a measure. Third, research on the fetal origins hypothesis stresses the
Joshua Goodman 195
long-run impact of shocks to fetal and infant health (Almond and Currie 2011). Handedness is related in part to neural developments triggered by such early shocks and thus deserves attention.
Handedness
The Biology of HandednessModern biological and medical evidence points to differentiation of the left
and right hemispheres of the brain as the primary source of hand preference given that each hemisphere controls the opposite side of the body. Such hemispheric differentiation generates early hand preferences in humans in the form of fetal thumb sucking (Vuoksimaa et al. 2009), as well as hand, foot, and eye preferences not only in humans but also in primates, rodents, birds, fishes, and lizards (Bisazza, Rogers, and Vallortigara 1998). Because the left hemisphere processes language, studies of handedness and brain function focus on linguistic differences between left- and right-handed individuals. Functional magnetic resonance imaging reveals that, when exposed to language, only 4 percent of right-handed individuals show any right hemisphere activity, compared to 24 percent of left-handed individuals (Pujot, Deus, and Losilla 1999). Relatedly, brain lesions on the right hemisphere are more than twice as likely to cause language disorders in the left-handed as in the right-handed (Hardyck and Petrinovich 1977). This pattern of greater bilateral activation among the left-handed may be related to the corpus callosum, the bundle of neural fibers connecting the two hemispheres, which is on average 11 percent larger in the left-handed than the right-handed (Witelson 1985).
In short, left-handedness appears to be related to differential brain structure and usage, particularly with respect to language processing. This differentiated brain structure appears to have both genetic and environmental origins. Genetic evidence comes from two sets of facts. First, the rate of left-handedness is 10 percent for children of two right-handed parents, 20 percent for children of one left- and one right-handed parent, and about 26 percent for children of two left-handed parents (McManus and Bryden 1991). Children are also more likely to share hand-edness with their mother than with their father (Harkins and Michel 1988). Though suggestive of genetic influence, these facts could also be explained by children learning handedness from their parents, given that most children spend more time in early childhood with their mothers than with their fathers. The second set of evidence for genetic origins comes from comparison of mono- and dizygotic twin pairs, which yields estimates that genes account for 24 percent of the variance in left-handedness (Medland et al. 2009).
Genetic factors do not, however, entirely explain handedness, given that 20–25 percent of identical twins differ in their handedness (Carter-Salzman, Scarr-Salapatek, Barker, and Katz 1975). Evidence on the specific environ-mental factors affecting handedness come largely from studies of “pathological” left-handedness, which refers to the theory that stress during gestation or birth
196 Journal of Economic Perspectives
may induce normally left hemispheric functions to shift to the right hemisphere. Left-handedness is, for example, more prevalent among infants requiring resuscita-tion after delivery, infants born as twins or triplets, and infants with low birthweights (Medland et al. 2009; Vuoksimaa et al. 2009). These facts are consistent with the theory that stressors during pregnancy or birth may contribute to the differential brain structures typical of left-handed individuals.
Handedness and Human Capital AccumulationCoren (1995) has helped popularize the notion that left-handedness is associ-
ated with creativity, arguing that the larger corpus callosum and greater bilateral activation exhibited by the left-handed allows for faster connection between ideas. According to this theory, the left-handed should excel at tasks requiring divergent thinking, where the individual begins from prior knowledge and works outwards toward new concepts. In a series of experiments, he found that left-handed males performed better on some divergent thinking tasks. The effect was, however, neither consistent across tasks nor significant for left-handed females. The empir-ical evidence for greater creativity among the left-handed turns out to be fairly weak. Also weak is the evidence that the left-handed are disproportionately represented at the high end of the cognitive spectrum. Studies arguing that left-handed individuals are overrepresented among precocious SAT takers, high-performing MCAT takers, and Mensa Society members all suffer from one or more problems such as selection bias, small sample size, or mixed results (Benbow 1986; Halpern, Haviland, and Killian 1998; Perelle and Ehrman 2005).
Evidence that the left-handed are overrepresented at the low end of the cognitive spectrum is clearer. The rate of left-handedness among those consid-ered intellectually disabled is between 20 and 28 percent, roughly twice the rate in the general population (Perelle and Ehrman 2005). Prior work with the National Child Development Survey has observed that the left-handed fare worse than the right-handed on tests of overall cognitive ability, even when the lowest performing 5 percent are excluded (McManus and Mascie-Taylor 1983). These lower cognitive skills may be at least partly explained by higher rates of learning disabilities like dyslexia among the left- and mixed-handed, as well as higher rates of behavioral problems such as attention-deficit/hyperactivity disorder (Rodriguez, Kaakinen, Moilanen, Tannila, McGough, Loo, and Järvelin 2010). Patients suffering from schizophrenia also display high rates of left-handedness (Dragovic and Hammond 2005). Studies of young children in Australia and the United States also find that left-handed children have significantly lower cognitive and noncognitive skills than right-handed children ( Johnston et al. 2009, 2010).
There are two primary reasons to think that handedness might relate to labor market outcomes. The first is that the physical preference for one hand over the other may create a comparative advantage or disadvantage in the labor market. The Book of Judges records the story of the left-handed Ehud, who assassinated an oppressive king by sneaking a sword past the king’s guards on his right thigh. The guards never searched that thigh because no right-hander could draw a weapon from
Handedness, Brain Structure, and Human Capital Accumulation 197
the right side. Modern examples come from the overrepresentation of left-handers among top performing athletes in interactive sports such as table tennis, fencing, and baseball, in which their opponents more frequently play against right-handed competitors (Raymond, Pontier, Dufour, and Moller 1996). Other than interactive sports, it seems difficult to devise examples of occupations where left-handedness would provide a comparative advantage.
The second reason that handedness may impact longer-run outcomes is that it may indicate differential brain structure. If the structure of lefties’ brains affects the accumulation of skills, this may be reflected in labor market outcomes and measures of productivity. Left-handed individuals might fare poorly in the labor market not due to the manual nature of left-handedness, but as a consequence of the underlying neurological wiring that leads to it.
Data and Determinants of Handedness
Measuring HandednessI use five longitudinal datasets. Two from the United States—the National Longi-
tudinal Survey of Youth 1979 (NLSY79) and 1997 (NLSY97) cohorts—follow teenagers through adulthood, so I pool these and refer to them as the US sample. A third dataset, the Children and Young Adults survey (NLS-C), follows all children born to the women in the NLSY79, though many of those children have not yet reached adult-hood. The two British datasets are the National Child Development Study (NCDS58) and the British Cohort Study (BCS70), which respectively follow all people born in Great Britain in one week in March 1958 and April 1970. I pool these and refer to them as the UK sample.1 All five datasets contain information on handedness, as well as measures of cognitive skill and other evidence of human capital accumulation.2
Each of the five datasets asks somewhat different questions regarding hand-edness. Some ask adults; some ask mothers; some use data from interviewers who observed children. For each question asked about handedness, I assign a value of one to answers that clearly favor the left hand (such as “always left” or “usually left”) and a value of zero to answers that clearly favor the right hand. I assign a value of one-half to answers indicating mixed-handedness or a lack of hand preference. I compute for each individual in each year the mean response to handedness ques-tions and also compute the mean of these values across all years. Most individuals can be easily categorized as right- or left-handed. To construct a binary measure of left-handedness, I round this continuous measure to the nearest integer.
1 Because sample sizes differ across these individual datasets, estimates using these pooled datasets are generated using weights that accord each individual dataset equal weight.2 An online Appendix available with this article at http://e-jep.org provides more detailed background. The structure and content of these datasets is described in more detail in online Appendix 1.1. The specific questions each dataset asks about handedness are described in more detail in online Appendix 1.2. Online Appendix Figure 1 shows the distribution of the continuous measure of handed-ness in each sample.
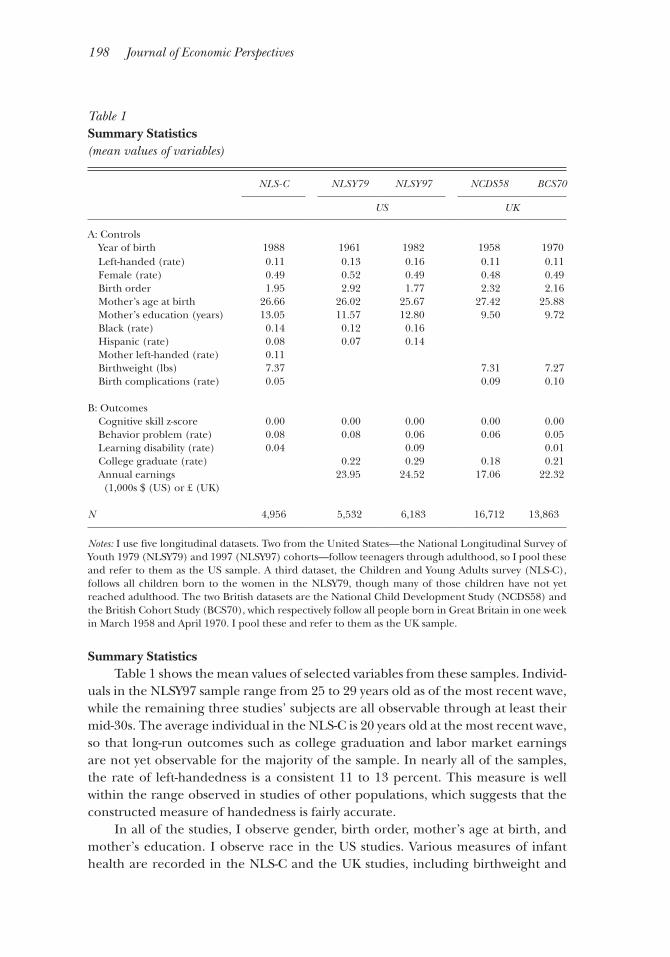
198 Journal of Economic Perspectives
Summary StatisticsTable 1 shows the mean values of selected variables from these samples. Individ-
uals in the NLSY97 sample range from 25 to 29 years old as of the most recent wave, while the remaining three studies’ subjects are all observable through at least their mid-30s. The average individual in the NLS-C is 20 years old at the most recent wave, so that long-run outcomes such as college graduation and labor market earnings are not yet observable for the majority of the sample. In nearly all of the samples, the rate of left-handedness is a consistent 11 to 13 percent. This measure is well within the range observed in studies of other populations, which suggests that the constructed measure of handedness is fairly accurate.
In all of the studies, I observe gender, birth order, mother’s age at birth, and mother’s education. I observe race in the US studies. Various measures of infant health are recorded in the NLS-C and the UK studies, including birthweight and
Table 1 Summary Statistics (mean values of variables)
NLS-C NLSY79 NLSY97 NCDS58 BCS70
US UK
A: Controls Year of birth 1988 1961 1982 1958 1970 Left-handed (rate) 0.11 0.13 0.16 0.11 0.11 Female (rate) 0.49 0.52 0.49 0.48 0.49 Birth order 1.95 2.92 1.77 2.32 2.16 Mother’s age at birth 26.66 26.02 25.67 27.42 25.88 Mother’s education (years) 13.05 11.57 12.80 9.50 9.72 Black (rate) 0.14 0.12 0.16 Hispanic (rate) 0.08 0.07 0.14 Mother left-handed (rate) 0.11 Birthweight (lbs) 7.37 7.31 7.27 Birth complications (rate) 0.05 0.09 0.10
B: Outcomes Cognitive skill z-score 0.00 0.00 0.00 0.00 0.00 Behavior problem (rate) 0.08 0.08 0.06 0.06 0.05 Learning disability (rate) 0.04 0.09 0.01 College graduate (rate) 0.22 0.29 0.18 0.21 Annual earnings (1,000s $ (US) or £ (UK)
23.95 24.52 17.06 22.32
N 4,956 5,532 6,183 16,712 13,863
Notes: I use five longitudinal datasets. Two from the United States—the National Longitudinal Survey of Youth 1979 (NLSY79) and 1997 (NLSY97) cohorts—follow teenagers through adulthood, so I pool these and refer to them as the US sample. A third dataset, the Children and Young Adults survey (NLS-C), follows all children born to the women in the NLSY79, though many of those children have not yet reached adulthood. The two British datasets are the National Child Development Study (NCDS58) and the British Cohort Study (BCS70), which respectively follow all people born in Great Britain in one week in March 1958 and April 1970. I pool these and refer to them as the UK sample.
Joshua Goodman 199
indications of infant health challenges around the time of birth.3 Because the NLS-C children can be connected to their mothers in the NLSY79, I can construct a dummy for each child indicating whether his or her mother was left-handed.
Panel B shows selected outcomes, the construction of which is discussed in more detail below. For all samples, I observe a measure of cognitive skill that I trans-form into an age-normed Z-score (that is, a measure showing how many standard deviations the measure is from the mean), as well as an indicator for the preva-lence of behavioral problems. For the samples in which I observe individuals into adulthood, I observe educational attainment and hourly wages (as measured in 2009 US dollars or UK pounds sterling). Below panel B is listed each sample’s size, which refers to the number of individuals for whom handedness is observed. Most outcomes are observed for slightly smaller numbers of individuals due to attrition and missing data.
Determinants of Left-HandednessBefore studying the relationship between handedness and human capital
accumulation, I first explore some observable determinants of left-handedness by looking at sample means in Table 2.4 Gender and maternal left-handedness are strongly related to left-handedness in this data, consistent with previous studies. Across all samples, men are roughly 3 percentage points more likely than women to be left-handed. Rates of left-handedness in these samples thus range from 9–13 percent for females and from 12–16 percent for males. In the NLS-C sample, nearly 16 percent of children with left-handed mothers are themselves left-handed, compared to fewer than 11 percent of those with right-handed mothers. Maternal left-handedness therefore raises the probability of child left-handedness by about 50 percent. Maternal education and age at birth, conversely, bear little relation to a child’s handedness. The strong correlation between maternal- and child-handedness suggests a genetic component of handedness. The possibility remains, however, that left-handed mothers influence their children’s handedness through their own behavior if, for example, children try to imitate their parents’ physical gestures.
Other evidence from the sample means in the data suggests an environmental component of left-handedness. Complications around the time of birth are also associated with an increase in the rate of left-handedness. US babies that remain more than a week in the hospital post-birth are 5 percentage points more likely to be left-handed, while UK babies whose labors were complicated are 1.5 percentage points more likely to be left-handed. In the UK datasets, lower birthweight babies are more likely to be left-handed, with each additional pound at birth associated with a 0.6 percentage point decrease in the rate of left-handedness. Similar estimates
3 For the NLCS samples, the dummy for birth complications indicates that the child remained in the hospital for more than a week after being born. For the UK samples, it indicates that the birth was a breech birth or that forceps or a vacuum were used during delivery.4 The sample means presented here are quite similar to the coefficients from linear probability models that regress an indicator for left-handedness on a vector of possible explanatory variables. Detailed results of these regressions are available in online Appendix Table 2.
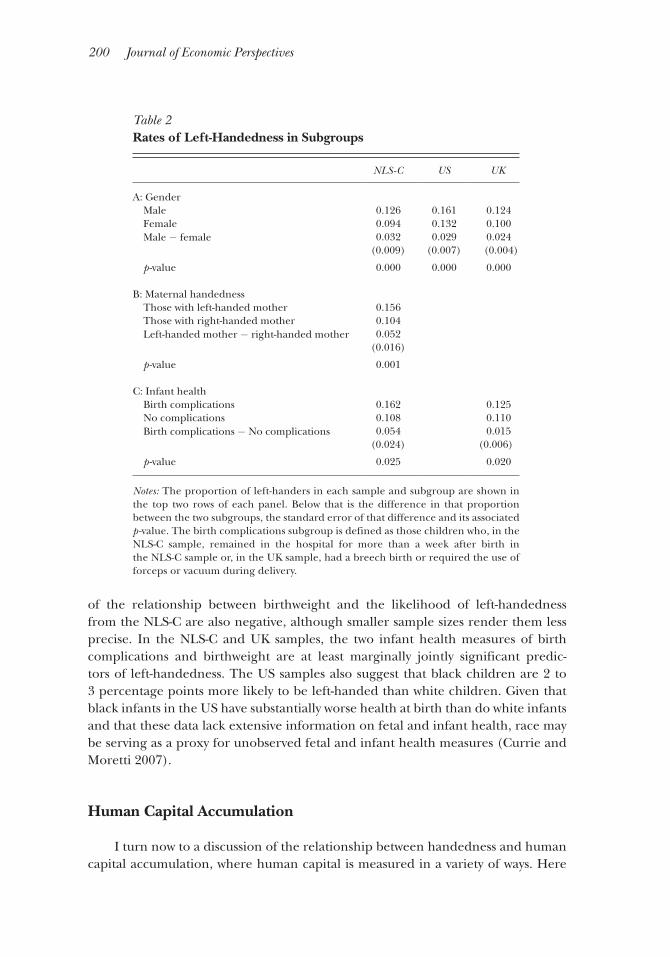
200 Journal of Economic Perspectives
of the relationship between birthweight and the likelihood of left-handedness from the NLS-C are also negative, although smaller sample sizes render them less precise. In the NLS-C and UK samples, the two infant health measures of birth complications and birthweight are at least marginally jointly significant predic-tors of left-handedness. The US samples also suggest that black children are 2 to 3 percentage points more likely to be left-handed than white children. Given that black infants in the US have substantially worse health at birth than do white infants and that these data lack extensive information on fetal and infant health, race may be serving as a proxy for unobserved fetal and infant health measures (Currie and Moretti 2007).
Human Capital Accumulation
I turn now to a discussion of the relationship between handedness and human capital accumulation, where human capital is measured in a variety of ways. Here
Table 2 Rates of Left-Handedness in Subgroups
NLS-C US UK
A: Gender Male 0.126 0.161 0.124 Female 0.094 0.132 0.100 Male − female 0.032 0.029 0.024
(0.009) (0.007) (0.004)
p -value 0.000 0.000 0.000
B: Maternal handedness Those with left-handed mother 0.156 Those with right-handed mother 0.104 Left-handed mother − right-handed mother 0.052
(0.016)
p -value 0.001
C: Infant health Birth complications 0.162 0.125 No complications 0.108 0.110 Birth complications − No complications 0.054 0.015
(0.024) (0.006)
p -value 0.025 0.020
Notes: The proportion of left-handers in each sample and subgroup are shown in the top two rows of each panel. Below that is the difference in that proportion between the two subgroups, the standard error of that difference and its associated p -value. The birth complications subgroup is defined as those children who, in the NLS-C sample, remained in the hospital for more than a week after birth in the NLS-C sample or, in the UK sample, had a breech birth or required the use of forceps or vacuum during delivery.
Handedness, Brain Structure, and Human Capital Accumulation 201
I present evidence based solely on differences in sample means and medians between lefties and righties. In more detailed analysis, I run ordinary least squares regressions of the form
Yi = β0 + β1 Leftyi + β2 Xi + εi ,
where Y is the outcome of interest, Lefty indicates left-handedness for individual i, and X is a vector of control variables, including gender, race, infant health measures, and maternal characteristics. The coefficient of interest, β1, represents the differ-ence in the outcome between left- and right-handed people, controlling for those other covariates. However, the regression analyses yields very similar results to the sample means.5
Cognitive SkillsI construct a standardized measure of cognitive skill as the average of math
and reading scores generated by a variety of tests administered to subjects in these datasets. Table 3 shows that, across the samples, lefties show statistically significantly lower cognitive skills than righties. In the NLS-C, for example, lefties have cogni-tive skills 0.13 standard deviations lower than righties.6 In both the US and UK samples, lefties score 0.07–0.08 standard deviations lower than righties on average. These cognitive gaps appear to be quite similar in magnitude across both math and reading, which suggests that, even if differential language processing is responsible for these cognitive gaps, such differences affect math and reading skills similarly.
The tails of the skill distribution also vary between lefties and righties. Across all samples, lefties are 3–4 percentage points more likely to be in the bottom 10 percent of the distribution than are righties. In the US sample, lefties are also 2 percentage points less likely to be in the top 10 percent of the distribution, though that difference is smaller and statistically insignificant in the other samples. Tests of the probability of being in the top 5 or 1 percent of the distribution show similar results. These estimates are inconsistent with claims that lefties are unusually skilled, at least as measured by math and reading tests.
Further evidence of cognitive gaps comes from tests administered in only some of the studies. In the US sample, subjects took a coding speed test in which subjects matched words to numbers based on a key. Given that the task requires nearly no prior knowledge and that subjects have only seven minutes to complete as many matches as possible, the test is thought to measure raw mental speed or “fluid intel-ligence” (Heckman 1995; Segal 2012). By this measure, lefties in both samples score
5 The online Appendix available with this paper at http://e-jep.org offers regression-adjusted versions of the estimates discussed here. The tables in the main body of this paper are numbered so that each has an equivalent regression-adjusted version in the online Appendix. The online Appendix also offers additional details, such as plots of the kernel density estimates of the full distribution of cognitive skills and earnings, in online Appendix Figures 2 and 3.6 The gap between left- and right-handed siblings, shown in the online Appendix, is an even larger 0.16 standard deviations.
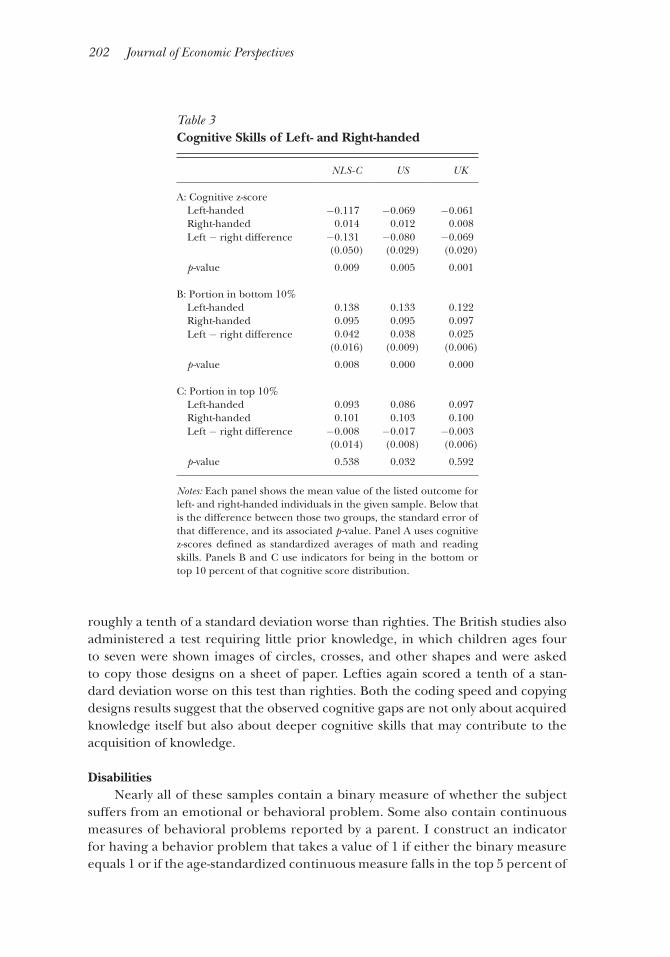
202 Journal of Economic Perspectives
roughly a tenth of a standard deviation worse than righties. The British studies also administered a test requiring little prior knowledge, in which children ages four to seven were shown images of circles, crosses, and other shapes and were asked to copy those designs on a sheet of paper. Lefties again scored a tenth of a stan-dard deviation worse on this test than righties. Both the coding speed and copying designs results suggest that the observed cognitive gaps are not only about acquired knowledge itself but also about deeper cognitive skills that may contribute to the acquisition of knowledge.
DisabilitiesNearly all of these samples contain a binary measure of whether the subject
suffers from an emotional or behavioral problem. Some also contain continuous measures of behavioral problems reported by a parent. I construct an indicator for having a behavior problem that takes a value of 1 if either the binary measure equals 1 or if the age-standardized continuous measure falls in the top 5 percent of
Table 3 Cognitive Skills of Left- and Right-handed
NLS-C US UK
A: Cognitive z-score Left-handed −0.117 −0.069 −0.061 Right-handed 0.014 0.012 0.008 Left − right difference −0.131 −0.080 −0.069
(0.050) (0.029) (0.020)
p -value 0.009 0.005 0.001
B: Portion in bottom 10% Left-handed 0.138 0.133 0.122 Right-handed 0.095 0.095 0.097 Left − right difference 0.042 0.038 0.025
(0.016) (0.009) (0.006)
p -value 0.008 0.000 0.000
C: Portion in top 10% Left-handed 0.093 0.086 0.097 Right-handed 0.101 0.103 0.100 Left − right difference −0.008 −0.017 −0.003
(0.014) (0.008) (0.006)
p -value 0.538 0.032 0.592
Notes: Each panel shows the mean value of the listed outcome for left- and right-handed individuals in the given sample. Below that is the difference between those two groups, the standard error of that difference, and its associated p -value. Panel A uses cognitive z-scores defined as standardized averages of math and reading skills. Panels B and C use indicators for being in the bottom or top 10 percent of that cognitive score distribution.
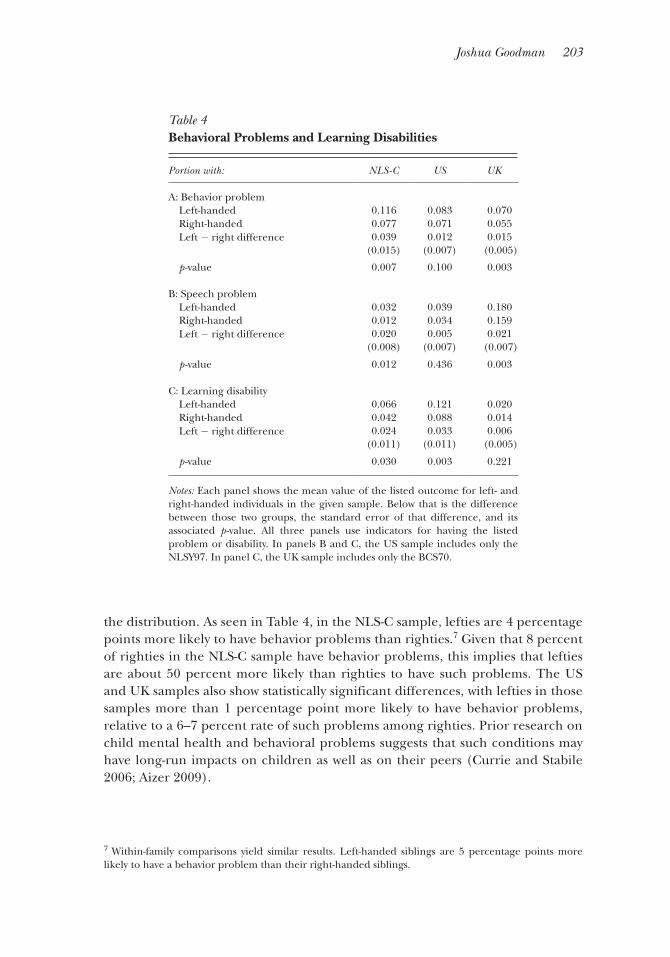
Joshua Goodman 203
the distribution. As seen in Table 4, in the NLS-C sample, lefties are 4 percentage points more likely to have behavior problems than righties.7 Given that 8 percent of righties in the NLS-C sample have behavior problems, this implies that lefties are about 50 percent more likely than righties to have such problems. The US and UK samples also show statistically significant differences, with lefties in those samples more than 1 percentage point more likely to have behavior problems, relative to a 6–7 percent rate of such problems among righties. Prior research on child mental health and behavioral problems suggests that such conditions may have long-run impacts on children as well as on their peers (Currie and Stabile 2006; Aizer 2009).
7 Within-family comparisons yield similar results. Left-handed siblings are 5 percentage points more likely to have a behavior problem than their right-handed siblings.
Table 4 Behavioral Problems and Learning Disabilities
Portion with: NLS-C US UK
A: Behavior problem Left-handed 0.116 0.083 0.070 Right-handed 0.077 0.071 0.055 Left − right difference 0.039 0.012 0.015
(0.015) (0.007) (0.005)
p -value 0.007 0.100 0.003
B: Speech problem Left-handed 0.032 0.039 0.180 Right-handed 0.012 0.034 0.159 Left − right difference 0.020 0.005 0.021
(0.008) (0.007) (0.007)
p -value 0.012 0.436 0.003
C: Learning disability Left-handed 0.066 0.121 0.020 Right-handed 0.042 0.088 0.014 Left − right difference 0.024 0.033 0.006
(0.011) (0.011) (0.005)
p -value 0.030 0.003 0.221
Notes: Each panel shows the mean value of the listed outcome for left- and right-handed individuals in the given sample. Below that is the difference between those two groups, the standard error of that difference, and its associated p -value. All three panels use indicators for having the listed problem or disability. In panels B and C, the US sample includes only the NLSY97. In panel C, the UK sample includes only the BCS70.
204 Journal of Economic Perspectives
Previous research has suggested that left-handedness is unusually common among individuals with an intellectual disability.8 This fact is sometimes cited in support of the theory of “pathological” left-handedness, the idea that some left-handedness can be thought of as brain damage, perhaps due to fetal trauma. Each of the datasets used in this paper allow construction of an indicator for intel-lectual disability, either through parental reporting, self-reporting, or interviewers’ observations of the subject. Although it is not reported on Table 4, in all of the samples, a high proportion of those with intellectual disabilities are left-handed. Across the samples, lefties are consistently 1 percentage point more likely to exhibit intellectual disability than righties. Given the low rate of intellectual disability among righties in these samples, this represents somewhere between a 50 and 300 percent increase in that likelihood.
Given the biological evidence that lefties process language differently than righties, I construct two further measures of disability related to language, shown in panels B and C of Table 4. In the NLS-C and UK samples, lefties are 2 percentage points more likely to have speech problems, such as a stutter or other speech impair-ment. In the US sample, the difference is a statistically insignificant half a percentage point. The second measure is an indicator for having a learning disability, survey questions about which often mention dyslexia specifically. In both the NLS-C and US samples, lefties are 2–3 percentage points more likely to report such a learning disability than righties. In the UK sample, the difference is a statistically insignifi-cant half a percentage point. Across all of these samples, the estimated differences suggest that left-handers are roughly 50 percent more likely than right-handers to have a learning disability.
Finally, though not shown here, the NLS-C and BCS70 administered to children ages 7–11 a “digit span test” to find the maximum number of digits a subject can memorize and recite forward (in both studies) or backward (in the NLS-C only). There is little evidence that lefties are worse at reciting digit lists in the forward direc-tion, which is generally considered a test of short-term auditory memory. Lefties are, however, substantially worse at reciting the digits backwards, which is thought to measure the child’s ability to manipulate verbal information in temporary storage (NLSY79 Child & Young Adult Data Users Guide, 2009, p. 103). This inability to reverse the order of a list may be further evidence of a dyslexia-like impairment or other difficulties with language processing.
Education, Occupation, and EarningsThese observed differences in cognitive skills, behavioral problems, and
learning disabilities are also associated with differences in education, occupation, and earnings. Table 5 shows mean differences in educational attainment and occu-pational characteristics between lefties and righties for the US and UK samples.
8 These studies often use the term “mental retardation” in their survey questions. However, it is now more common to describe such individuals as having an “intellectual disability,” and I follow that convention here.
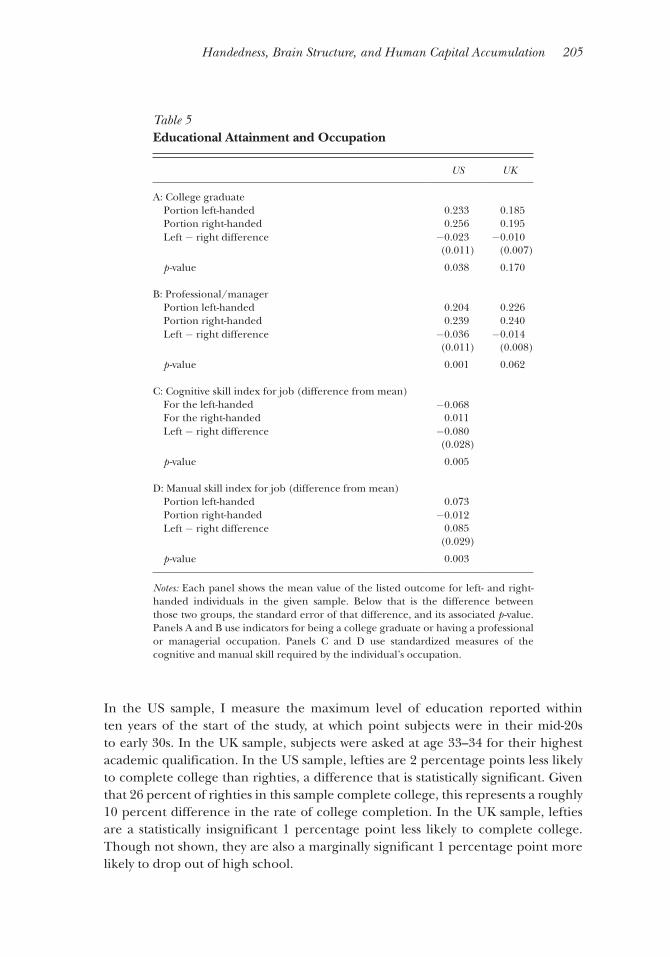
Handedness, Brain Structure, and Human Capital Accumulation 205
In the US sample, I measure the maximum level of education reported within ten years of the start of the study, at which point subjects were in their mid-20s to early 30s. In the UK sample, subjects were asked at age 33–34 for their highest academic qualification. In the US sample, lefties are 2 percentage points less likely to complete college than righties, a difference that is statistically significant. Given that 26 percent of righties in this sample complete college, this represents a roughly 10 percent difference in the rate of college completion. In the UK sample, lefties are a statistically insignificant 1 percentage point less likely to complete college. Though not shown, they are also a marginally significant 1 percentage point more likely to drop out of high school.
Table 5 Educational Attainment and Occupation
US UK
A: College graduate Portion left-handed 0.233 0.185 Portion right-handed 0.256 0.195 Left − right difference −0.023 −0.010
(0.011) (0.007)
p -value 0.038 0.170
B: Professional/manager Portion left-handed 0.204 0.226 Portion right-handed 0.239 0.240 Left − right difference −0.036 −0.014
(0.011) (0.008)
p -value 0.001 0.062
C: Cognitive skill index for job (difference from mean) For the left-handed −0.068 For the right-handed 0.011 Left − right difference −0.080
(0.028)
p -value 0.005
D: Manual skill index for job (difference from mean) Portion left-handed 0.073 Portion right-handed −0.012 Left − right difference 0.085
(0.029)
p -value 0.003
Notes: Each panel shows the mean value of the listed outcome for left- and right-handed individuals in the given sample. Below that is the difference between those two groups, the standard error of that difference, and its associated p -value. Panels A and B use indicators for being a college graduate or having a professional or managerial occupation. Panels C and D use standardized measures of the cognitive and manual skill required by the individual’s occupation.
206 Journal of Economic Perspectives
All of the datasets record the occupations of individuals, coded by a standardized scheme. I construct three mutually exclusive categories of professional/managerial occupations, other occupations, and missing occupation. In panel B of Table 5, lefties in the US sample are a significant 4 percentage points less likely to have professional or managerial occupations, which is not unexpected given their lower rates of college completion. Though not shown, lefties are strikingly more likely to be missing occupational information. This is not due to differential attrition within the dataset, but instead from the fact that lefties are more likely not to report having any occupation at all, even over multiple waves. A similar but weaker pattern is seen in the UK samples.
I also take advantage of the US Department of Labor’s Occupational Information Network (ONET), which contains measures of various skills required by each occupa-tion in the Standard Occupational Classification scheme. ONET groups such skills into four categories: cognitive, psychomotor, physical, and sensory. Each category contains multiple sub-skills, the importance of which to each occupation is measured on a scale from 1 to 5. For each occupation, I construct a measure of cognitive skill from the mean of all cognitive sub-skills and a measure of manual skill by averaging all sub-skills that mention hands, including “arm-hand steadiness,” “finger dexterity,” “manual dexterity,” and “wrist-finger speed.” I standardize all of these occupational skill measures across the population of individuals for whom I observe occupation and show mean differences in these measures in panels C and D.
Consistent with, and nearly identical to the gaps in cognitive test scores, lefties in the US work in occupations requiring 0.08 standard deviations less cogni-tive skill. Though not shown here, I find a nearly identical gap if cognitive skill is instead constructed only from the two sub-skills that plausibly measure creativity, namely “originality” and “inductive reasoning.” This suggests that lefties work in occupations requiring less, not more, creativity than righties. Finally, if lefties are at a manual disadvantage due to the fact that they use different hands to work, such a disadvantage is not apparent in occupational choice. Lefties work in occupations requiring 0.09 standard deviations more manual skill than righties. These occupa-tional skill measures strengthen the case that the primary disadvantage of being a lefty involves cognitive deficits, not manual ones.
I construct annual earnings in a way that makes the US samples comparable to each other and the UK samples comparable to each other. For the US sample, I define earnings by the last nonmissing value observed from ages 25–29. In the UK sample, I construct earnings at age 33–34 for all respondents reporting earnings, including full-time workers, part-time workers, and the self-employed. The constructed distri-butions include nonworking individuals as having zero earnings or wages. US and UK earnings are expressed in 2009 dollars and pounds sterling, respectively.
Table 6 shows the median handedness earnings gap across the entire samples in panel A and by gender in panels B and C.9 The median US lefty earns $1,300
9 I use median differences here to diminish the influence of outliers. Mean differences yield very similar results, as do specifications using the logarithm of earnings, as shown in online Appendix Table 6.
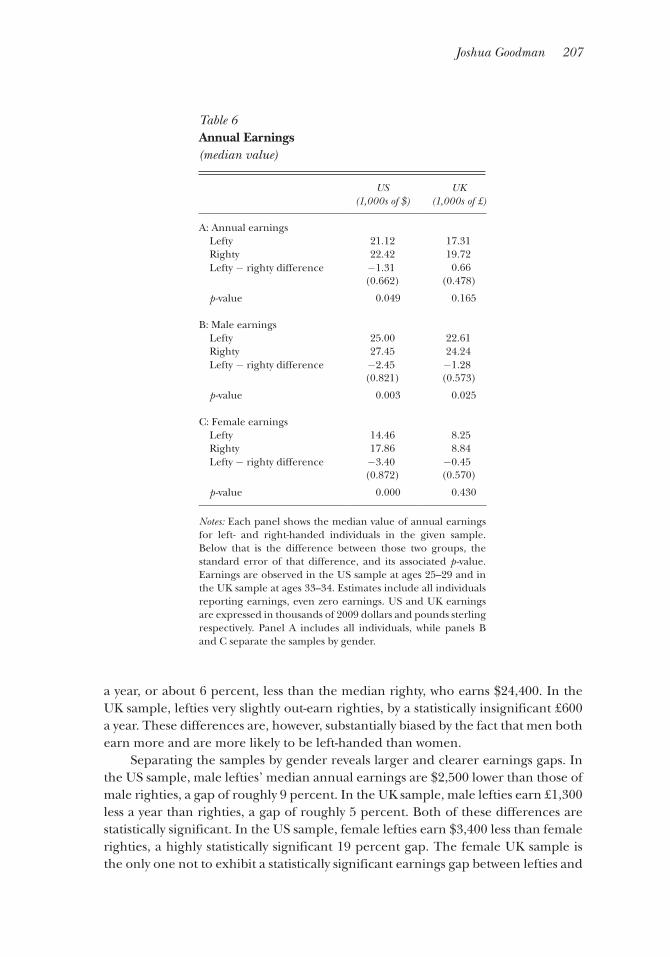
Joshua Goodman 207
a year, or about 6 percent, less than the median righty, who earns $24,400. In the UK sample, lefties very slightly out-earn righties, by a statistically insignificant £600 a year. These differences are, however, substantially biased by the fact that men both earn more and are more likely to be left-handed than women.
Separating the samples by gender reveals larger and clearer earnings gaps. In the US sample, male lefties’ median annual earnings are $2,500 lower than those of male righties, a gap of roughly 9 percent. In the UK sample, male lefties earn £1,300 less a year than righties, a gap of roughly 5 percent. Both of these differences are statistically significant. In the US sample, female lefties earn $3,400 less than female righties, a highly statistically significant 19 percent gap. The female UK sample is the only one not to exhibit a statistically significant earnings gap between lefties and
Table 6 Annual Earnings (median value)
US(1,000s of $)
UK(1,000s of £)
A: Annual earnings Lefty 21.12 17.31 Righty 22.42 19.72 Lefty − righty difference −1.31 0.66
(0.662) (0.478)
p -value 0.049 0.165
B: Male earnings Lefty 25.00 22.61 Righty 27.45 24.24 Lefty − righty difference −2.45 −1.28
(0.821) (0.573)
p -value 0.003 0.025
C: Female earnings Lefty 14.46 8.25 Righty 17.86 8.84 Lefty − righty difference −3.40 −0.45
(0.872) (0.570)
p -value 0.000 0.430
Notes: Each panel shows the median value of annual earnings for left- and right-handed individuals in the given sample. Below that is the difference between those two groups, the standard error of that difference, and its associated p -value. Earnings are observed in the US sample at ages 25–29 and in the UK sample at ages 33–34. Estimates include all individuals reporting earnings, even zero earnings. US and UK earnings are expressed in thousands of 2009 dollars and pounds sterling respectively. Panel A includes all individuals, while panels B and C separate the samples by gender.
208 Journal of Economic Perspectives
righties, although the regression-adjusted logarithmic specification shows a margin-ally significant left-handedness penalty of about 7 percent.
Similar to the cognitive skill gap, a substantial difference in earnings is partic-ularly visible at the low end of the distribution. I identify people as having low earnings if their annual earnings are below $3,000 or £2,000. The majority of such people have zero earnings. Though not shown here, in all samples but the NCDS58, lefties are 4 percentage points, or 25 percent, more likely to have low earnings. These observed gaps are not gender-specific.
The disproportionate number of lefties with low or no earnings partly explains why the previous study by Ruebeck, Harrington, and Moffitt (2007) found little earnings gap by handedness. That study, which also used the NLSY79, excluded individuals with particularly low earnings and thus missed an important part of the earnings distribution. Their earnings analysis also controlled for cognitive skill and schooling, covariates I have shown are endogenous. Including such controls causes underestimation of the handedness gap in earnings, as those are channels through which the gap at least partially arises. I also note that the earnings gap that I observe in the UK sample is driven almost entirely by the BCS70 sample, with the NCDS58 showing no statistically significant gaps. This is consistent with the findings of Denny and O’Sullivan (2007), who also find no earnings gaps in that same data. Of the four adult samples used here (two each underlying the US and UK samples), the NCDS58 is the only one not to show such earnings gaps. Within the US sample, both the NLSY79 and NLSY97 show gaps that are remarkably similar in magnitude.
Robustness and HeterogeneityThese estimated handedness gaps in cognitive skills and earnings are robust
to a number of alternate specifications, including using the continuous instead of the binary measure of left-handedness, excluding the few individuals identi-fied as intellectually disabled, and removing mixed-handed individuals from the sample. All of the results discussed here in terms of mean or median differences are substantially similar to those generated by the multivariate regression analysis, as discussed previously.
Given that left-handedness has both genetic and environmental origins, I also attempt to determine whether the “type” of left-handedness matters. In one approach, I divide lefties into those with good infant health, who were born with neither complications nor low birthweight, and those with poor infant health, who were born with either complications or low birthweight. Although this method of dividing the sample is crude, those with good infant health are more likely to be left-handed due to genetics and those with poor infant health are more likely to be left-handed due to environmental causes such as health shocks. I find no evidence of differences in the handedness gap in cognitive skills by infant health status. This could be evidence that the environmental factors generating left-handedness, and not the genetic factors, are responsible for the observed earnings gap. Left-handedness may thus be an indicator of even poorer infant health than the measures available in these datasets suggest.
Handedness, Brain Structure, and Human Capital Accumulation 209
The NLS-C provides another way potentially to separate the two types of left-handedness. Lefties born to left-handed mothers are more likely than other lefties to carry left-handed genes. A regression analysis in which I interact the child’s and mother’s left-handedness suggests that lefties born to right-handed mothers have cogni-tive skills roughly two-tenths of a standard deviation lower than righties. Lefties born to left-handed mothers exhibit, however, no statistically significant cognitive skill defi-cits. This could be evidence that left-handedness of genetic origin is substantially less associated with human capital deficits than left-handedness of environmental origin.
Alternatively, this could suggest that left-handed children benefit from being raised by left-handed mothers, perhaps because those mothers model the physical act of writing or perform other cognitive tasks in styles that match their children’s capacities more closely. Intriguingly, the right-handed children of left-handed mothers exhibit cognitive gaps similar to those of left-handed children. In short, mismatch between parental and child handedness appears to be a key factor in the association between handedness and cognitive deficits. This may suggest that nurture is an important component of the handedness penalty, though other expla-nations cannot be ruled out.
Discussion and Conclusion
Across the multiple samples used in this paper, left-handed individuals show consistently lower cognitive skills and higher rates of mental and behavioral disabil-ities. This finding has been documented in previous research. This paper is the first to demonstrate that lefties also have consistently lower labor market earnings than right-handed individuals. The evidence on occupational choice suggests that the primary disadvantage of left-handedness is not manual but cognitive. In ordi-nary least squares regressions, the cognitive and behavioral gaps observed explain one-third of the estimated handedness gap in earnings.
The magnitudes of these handedness gaps are economically substantial. In these samples, the handedness gaps in cognitive skill and college graduation rates are equivalent to having a mother with two-thirds of a year less schooling. The earn-ings gap is even larger, the equivalent of having one less year of schooling or a mother with two fewer years of schooling.
This paper documents the gaps between left- and right-handed individuals but leaves for future work the question of whether such gaps are caused by left-handedness or instead arise from other factors for which left-handedness is simply a proxy. Identi-fying left-handedness as the cause of these gaps would be difficult for a host of reasons, not least of which is that we do not have a clear way to manipulate handedness (Rubin 1974). More importantly, handedness is generated by neurological wiring that may affect a number of important channels relevant to labor market outcomes. Isolating the impact of any one of these channels would be challenging.
The patterns discussed in this paper nonetheless raise a number of questions for future research, including the following.

210 Journal of Economic Perspectives
First, the cognitive and behavioral gaps observed in these datasets statistically explain at most one-third of the earnings gap. What unobserved factors might explain the rest of that gap? Could differences in mental health explain why the left-handed are more likely to have no meaningful earnings or occupation?
Second, to what extent is handedness simply a proxy for fetal health differences that happen to have rewired the brain? Would some form of early health interven-tions, such as those discussed in this journal by Almond and Currie (2011), reduce the incidence of left-handedness or otherwise diminish its long-run impact?
Third, why do left-handed children of left-handed mothers exhibit no cogni-tive deficits while right-handed children of left-handed mothers do? Why should the match between child and maternal handedness matter? Does this imply something important about the behavioral interactions between parents and children? If such interactions matter, could schools tailor pedagogy in a way that benefits left-handed children?
Fourth, although most left-handed children will not experience substantial cognitive or behavioral problems, left-handedness does increase the odds of such problems substantially. Would paying added attention to left-handed children at early developmental stages improve the chance that those with learning disabilities are diagnosed early or at all?
Finally, the handedness gaps documented here and in previous research prompt an interesting question about the extent to which historical biases against the left-handed were grounded in some small, albeit highly exaggerated, truth. It seems unlikely that small mean differences in cognitive skill could drive this. High rates of left-handedness among the intellectually disabled or those with substantial behavioral problems might, however, have been sufficiently clear to early observers to encourage such prejudices.
Ultimately, the fact that this easily observable proxy for brain structure has a substantial relationship to human capital accumulation is itself noteworthy. Recent scholarship in this journal has reviewed research on the question of the extent to which human genetic endowments are intimately connected to economic behaviors, as well as the pitfalls of attributing such behaviors to specific genes (Beauchamp et al. 2011). We know even less about how genes or environmental factors affect human neurological wiring and the other biological systems that contribute to such behaviors. The facts about handedness documented here suggest that such research is worth pursuing.
■ For their very helpful comments, I am grateful to David Autor, Chris Avery, Caroline Hoxby, Ed Glaeser, Amitabh Chandra, Larry Katz, and Felipe Barrera-Osorio, as well as participants in the NBER Education Group, CESIfo, the Association for Education Finance and Policy, and the Harvard Kennedy School Faculty Seminar. Heather Sarsons, Napat Jatusripitak, and especially Colin Sullivan provided outstanding research assistance. Finally, I thank my left-handed wife, Anna Lumelsky, for encouraging this work even when the coefficients troubled her.
Joshua Goodman 211
References
Aizer, Anna. 2009. “Peer Effects, Institutions and Human Capital Accumulation: The Externali-ties of ADD.” Brown University Working Paper.
Almond, Douglas, and Janet Currie. 2011. “Killing Me Softly: The Fetal Origins Hypothesis.” Journal of Economic Perspectives 25(3): 153–72.
Beauchamp, Jonathan P., David Cesarini, Magnus Johannesson, Matthijs J. H. M. van der Loos, Philipp D. Koellinger, Patrick J. F. Groenen, James H. Fowler, J. Niels Rosenquist, A. Roy Thurik, and Nicholas A. Christakis. 2011. “Molecular Genetics and Economics.” Journal of Economic Perspectives 25(4): 57–82.
Benbow, Camilla Persson. 1986. “Physiological Correlates of Extreme Intellectual Precocity.” Neuropsychologia 24(5): 719–25.
Bisazza, Angelo, L. J. Rogers, and Giorgio Vallortigara. 1998. “The Origins of Cerebral Asymmetry: A Review of Evidence of Behavioural and Brain Lateralization in Fishes, Reptiles and Amphibians.” Neuroscience and Biobehavioural Reviews 22(3): 411–26.
Carter-Saltzman, Louise, Sandra Scarr-Salapatek, William B. Barker, and Solomon Katz. 1975. “Left-Handedness in Twins: Incidence and Patterns of Performance in an Adolescent Sample.” Behavior Genetics 6(2): 189–203.
Coren, Stanley. 1995. “Differences in Divergent Thinking as a Function of Handedness and Sex.” American Journal of Psychology 108(3): 311–25.
Currie, Janet, and Enrico Moretti. 2007. “Biology as Destiny? Short-and Long-Run Determi-nants of Intergenerational Transmission of Birth Weight.” Journal of Labor Economics 25(2): 231–64.
Currie, Janet, and Mark Stabile. 2006. “Child Mental Health and Human Capital Accumulation: The Case of ADHD.” Journal of Health Economics 25(6): 1094–1118.
Denny, Kevin, and Vincent O’Sullivan. 2007. “The Economic Consequences of Being Left-Handed: Some Sinister Results.” Journal of Human Resources 42(2): 353–74.
Dragovic, M., and G. Hammond. 2005. “Hand-edness in Schizophrenia: A Quantitative Review of Evidence.” Acta Psychiatrica Scandinavica 111(6): 410–419.
Gabrieli, John D. E. 2009. “Dyslexia: A New Synergy between Education and Cognitive Neuro-science.” Science 325(5938): 280–83.
Halpern D. F., M. G. Haviland, and C. D. Killian. 1998. “Handedness and Sex Differences in Intelligence: Evidence from the Medical College Admission Test.” Brain and Cognition 38(1): 87–101.
Hardyck, Curtis, and Lewis F. Petrinovich. 1977.
“Left-Handedness.” Psychological Bulletin 84(3): 385–404.
Harkins, Debra A., and George F. Michel. 1988. “Evidence for a Maternal Effect on Infant Hand-Use Preferences.” Developmental Psychobiology 21(6): 535–41.
Heckman, James J. 2007. “The Economics, Technology, and Neuroscience of Human Capa-bility Formation.” PNAS 104(33): 13250–55.
Johnston, David W., Michael E. R. Nicholls, Manisha Shah, and Michael A. Shields. 2009. “Nature’s Experiment? Handedness and Early Childhood Development.” Demography 46(2): 281–301.
Johnston, David W., Michael E. R. Nicholls, Manisha Shah, and Michael A. Shields. 2010. “Handedness, Health and Cognitive Development: Evidence from Children in the NLSY.” IZA Discus-sion Papers 4774.
McManus, I. C., and M. P. Bryden. 1991. “Geschwind’s Theory of Cerebral Lateralization: Developing a Formal, Causal Model.” Psychological Bulletin 110(2): 237–53.
McManus, I. C., and C. G. N. Mascie-Taylor. 1983. “Biosocial Correlates of Cognitive Abilities.” Journal of Biosocial Science 159(3): 289–306.
Medland, Sarah E., David L. Duffy, Margaret J. Wright, Gina M. Geffen, David A. Hay, Florence Levy, Catherina E. M. van-Beijsterveldt, Gonneke Willemsen, Grant C. Townsend, Vicki White, Alex W. Hewitt, David A. Mackey, J. Michael Bailey, Wendy S. Slutske, Dale R. Nyholt, Susan A Treloar, Nicholas G. Martin, Dorret I. Boomsma. 2009. “Genetic Influences on Handedness: Data from 25,732 Australian and Dutch Twin Families.” Neuropsychologia 47(2): 330–37.
Medland, Sarah E., Ira Perelle, Veronica De Monte, and Lee Ehrman. 2004. “Effects of Culture, Sex, and Age on the Distribution of Handedness: An Evaluation of the Sensitivity of Three Measures of Handedness.” Laterality: Asymmetries of Body, Brain and Cognition 9(3): 287–97.
NLSY79 Child & Young Adult Data Users Guide. 2009. Center for Human Resource Research, Ohio State University, June. http://www.nlsinfo.org /pub/usersvc/Child-Young-Adult/2006ChildYA -DataUsersGuide.pdf.
Perelle, Ira B., and Lee Ehrman. 1983. “The Development of Laterality.” Behavioral Science 28(4): 284–97.
Perelle, Ira B., and Lee Ehrman. 2005. “On the Other Hand.” Behavior Genetics 35(3): 343–50.
Pujot, Jesus, Joan Deus, and Josep M. Losilla. 1999. “Cerebral Lateralization of Language in
212 Journal of Economic Perspectives
Normal Left-handed People Studied by Functional MRI.” Neurology 52(5): 1038–43.
Raymond, Michel, Dominique Pontier, Anne-Beatrice Dufour, and Anders Pape Moller. 1996. “Frequency-Dependent Maintenance of Left Handedness in Humans.” Proceedings of the Royal Society B: Biological Sciences 263(1377): 1627–33.
Rodriquez, Alina, Marika Kaakinen, Irma Moilanen, Anja Taanila, James J. McGough, Sandra Loo, and Marjo-Riita Järvelin. 2010. “Mixed-Handedness is Linked to Mental Health Problems in Children and Adolescents.” Pediatrics 125(2): 340–48.
Rubin, Donald B. 1974. “Estimating Causal Effects of Treatments in Randomized and
Nonrandomized Studies.” Journal of Educational Psychology 66(5): 688–701.
Ruebeck, Christopher S., Joseph E. Harrington Jr., and Robert Moffitt. 2007. “Handedness and Earnings.” Laterality 12(2): 101–120.
Segal, Carmit. 2012. “Working When No One is Watching: Motivation, Test Scores, and Economic Success.” Management Science 58(8): 1438–57.
Vuoksimaa E., Koskenvuoa M., Rosea R.J., Kaprio J. 2009. “Origins of Handedness: A Nation-wide Study of 30,161 Adults.” Neuropsychologia 1294–1301.
Witelson, S. F. 1985. “The Brain Connection: The Corpus Callosum is Larger in Left-Handers.” Science 229: 665–68.
Journal of Economic Perspectives—Volume 28, Number 4—Fall 2014—Pages 213–226
This feature addresses the history of economic terms and ideas. The hope is to deepen the workaday dialogue of economists, while perhaps also casting new light on ongoing questions. If you have suggestions for future topics or authors, please write to Joseph Persky of the University of Illinois at Chicago at [email protected].
Introduction
The value of statistical life (VSL) is a concept used in benefit–cost analysis by government and intergovernmental agencies around the world to place monetary values on changes in premature deaths. Common applications include the estima-tion of benefits of highway traffic safety measures and reductions in air pollution. Typically, these mortality values comprise the lion’s share of the estimated benefits of such investments (for example, US EPA 2011). For introductions to the VSL literature, useful starting points are Ashenfelter (2006), Blomquist (forthcoming), Hammitt (2000), Viscusi (2011), and Viscusi and Aldy (2003).
The “value of statistical life” terminology was introduced by Thomas Schelling (1968) in his essay, “The Life You Save May Be Your Own.” To that point, when econo-mists grappled with tradeoffs involving loss of life, they had basically two approaches
Retrospectives The Cold-War Origins of the Value of Statistical Life
■ Spencer Banzhaf is Professor of Economics, Georgia State University, Atlanta, Georgia. He is also Senior Fellow, Property and Environment Research Center, Bozeman, Montana, and Research Associate, National Bureau of Economic Research, Cambridge, Massachusetts. His email address is [email protected].
http://dx.doi.org/10.1257/jep.28.4.213 doi=10.1257/jep.28.4.213
H. Spencer Banzhaf
214 Journal of Economic Perspectives
available. The first was a human capital approach, which valued the life of an indi-vidual according to the value of that person’s wages. The second looked to the revealed social values from policymakers. Both approaches were unsatisfactory: the first was plagued with ethical problems; the second seemed circular, as it would use policy decisions to inform policy decision making (Banzhaf 2009).
Schelling’s (1968) crucial insight was that economists could evade the moral thicket of valuing “life” and instead focus on people’s willingness to trade off money for small risks. For example, a policy to reduce air pollution in a city of one million people that reduces the risk of premature death by one in 500,000 for each person would be expected to save two lives over the affected population. But from the individuals’ perspectives, the policy only reduces their risks of death by 0.0002 percentage points. This distinction is widely recognized as the critical intellectual move supporting the introduction of values for (risks to) life and safety into applied benefit–cost analysis (Ashenfelter 2006; Hammitt and Treich 2007). Although it is based on valuing risk reductions, not lives, the value of a statistical life concept maintains an important rhetorical link to the value of life insofar as it normalizes the risks to value them on a “per-life” basis. By finessing the distinction between lives and risks in this way, the VSL concept overcame the political problems of valuing life while remaining relevant to policy questions.
Though widely used, the concept of the value of a statistical life has never been without controversy. For example, in 2003 the US Environmental Protection Agency (EPA) set a lower value for the VSLs of elderly citizens than for younger citizens, to account for their fewer remaining life-years. Popular outcry against this “senior death discount,” given full voice in the US Congress, forced the EPA to retreat.
In this paper, I trace the history of the value of a statistical life and show that such controversies are nothing new. Although the first use of the term was by Schelling (1968), the intellectual origins of the VSL can be traced back another 20 years to a controversy in which the US Air Force (USAF) forced the RAND Corporation to think about the role of lives in its optimization framework for military decisions, a problem that eventually would attract Schelling’s attention. Thus, not only is the VSL well acquainted with political controversy, it was born from such controversy.
RAND’s “Criterion Problem”
To understand the origins of the value of statistical life, we must back up some two decades before Schelling’s essay to the early years of the RAND Corporation. RAND began in 1946 inside the Douglas Aircraft Company and then became inde-pendent in 1948 with support from the Ford Foundation. RAND wanted to reimagine the nascent operations research methods of World War II on a grand scale, with modern technical expertise. From its early focus on science and engineering, it expanded to include economics and policy studies. Under Warren Weaver, it soon established a research section on the “evaluation of military worth.” The idea, explained Weaver (as quoted in Kaplan 1983, p. 72), was to explore “to what extent
H. Spencer Banzhaf 215
it is possible to have useful quantitative indices for a gadget, a tactic or a strategy, so that one can compare it with available alternatives and guide decisions by anal-ysis . . .” A new economics division, led by Charles Hitch, was constituted inside the evaluation of military worth division. RAND also expanded its technical capacity, for example constructing a special Aerial Combat Research Room to simulate aerial maneuvers in a game-theoretic context and acquiring, with help from John von Neumann, one of the first EDVAC binary computers to crunch the numbers.1
RAND’s first big opportunity to showcase its new analytical capabilities came in 1949, shortly after the Soviet Union detonated its first atomic bomb. The US Air Force asked RAND to apply systems analysis to design a first strike on the Soviets. The “Strategic Bombing Systems Analysis,” led by Edwin Paxson, attempted to use operations research methods to find the optimal mix of atomic bombs and bombers ( Jardini 1996; Hounshell 1997). Specifically, it sought to solve a classic problem formulated in terms of choosing bombs and bombers to maximize damage, subject to a fixed dollar budget (to procure, operate, and maintain the force) and fixed budget of fissile material ( Jardini 1996, p. 54).
Paxson and RAND were initially proud of their optimization model and the computing power that they brought to bear on the problem, which crunched the numbers for over 400,000 configurations of bombs and bombers using hundreds of equations (Kaplan 1983; Jardini 1996). The massive computations for each configuration involved simulated games at each enemy encounter, each of which had first been modeled in RAND’s new aerial combat research room. They also involved numerous variables for fighters, logistics, procurement, land bases, and so on. Completed in 1950, the study recommended that the United States fill the skies with numerous inexpensive and vulnerable propeller planes, many of them decoys carrying no nuclear weapons, to overwhelm the Soviet air defenses. Though losses would be high, the bombing objectives would be met.
While RAND was initially proud of this work, pride and a haughty spirit often go before a fall. RAND’s patrons in the US Air Force, some of whom were always skeptical of the idea that pencil-necked academics could contribute to military strategy, were apoplectic. RAND had chosen a strategy that would result in high casualties, in part because the objective function had given zero weight to the lives of airplane crews (Hirshleifer 1950; Jardini 1996). In itself, this failure to weigh the lives of crews offended the US Air Force brass, many of whom were former pilots. But moreover, that failure led RAND’s program to select cheap propeller bombers rather than the newer turbojets the US Air Force preferred.2 For all of RAND’s
1 For background on the history of RAND, useful starting points are Hounshell (1997), Jardini (1996), Kaplan (1983), and Smith (1966). Leonard (1991) and Mirowski (2002) discuss its role in shaping modern economics.2 The problem was also compounded by what the US Air Force perceived as other errors. RAND’s analysis had unnecessarily (indeed, unrealistically) restricted the bombers to North American bases, even though actual plans called for using America’s many forward bases as refueling points (Kaplan 1983). Addition-ally, it had assumed the “game” was over after the first strike, so crews did not have value for additional flights. Both assumptions tilted the analysis in favor of propeller planes.
216 Journal of Economic Perspectives
scientific equations and modern computing power, in the eyes of its US Air Force patrons its first product was a classic case of garbage in, garbage out.
RAND adapted to this debacle in three ways. First, recognizing that its first major study could prove to be its last, RAND quickly retreated and adopted a more humble posture. It rushed a follow-up study, this one from Paxson’s assis-tant Edward Quade, which incorporated some of the criticism from the Pentagon. In particular, it narrowed the question to the choice of bomber type, adopted the US Air Force’s attack plan, and assumed the possibility of additional strikes after the first strike ( Jardini 1996, p. 64). Likewise, RAND quickly altered course for its proposed second major project, this one on air defense systems analysis. Headed by Edward Barlow, the first draft of this project proposal had been a massive 100-page document filled with lots of math, but with dangerously simple assumptions, such as a single strike and a lack of submarines. As RAND began to feel the full force of the US Air Force’s displeasure, the proposal was cut to a slim 16 pages, devoid of arrogance (Barlow 1950). Indeed, Barlow now admitted that “the great dangers inherent in the systems analysis approach are that factors which we aren’t yet in a position to treat quantitatively tend to be omitted from serious consideration” (as quoted in Jardini 1996, p. 67).
Second, as a matter of long-run strategy, RAND began to diversify its research portfolio beyond military work, into natural resources, health, education, and other areas of social policy.3 The earliest nonmilitary work seriously occupying RAND staff appears to have been applied work on water resources (DeHaven and Hirshleifer 1957; Hirshleifer, DeHaven, and Milliman 1960), followed by projects in transporta-tion and education begun around 1960 (Goldstein 1961). Interestingly—and likely not coincidentally—when RAND economists took up water resources, they were explicitly entering a research area where the problem of using nonmarket valuation to fill in missing prices was one of the main problems motivating contemporary literature (Banzhaf 2009, 2010).
Most importantly for this story, RAND’s third response to the debacle was to try to put actual weights on airplane crews in its objective functions, applying nonmarket valuation to this very problem. Inside RAND, this came to be known as the “criterion problem”—essentially the problem of specifying what today are often called “indicators” for imperfectly observed or measured objectives, on both the cost and the benefit side. RAND’s economists were quick to argue that this was fundamentally an economic problem (Leonard 1991).
Jack Hirshleifer was particularly fast off the mark, expressing his opinions on the debacle in internal memoranda almost immediately (Hirshleifer 1950). He emphasized two issues. First, the bombing study imposed unnecessary constraints on the problem, especially the available quantity of fissile material. From the long-run
3 Jardini (1996) explores these moves in some detail, dating the decisive steps as occurring in the mid to late 1960s. However, in fact they occurred earlier. As early as 1952, the Ford Foundation provided RAND with a $1 million grant to begin a new program, known as RAND-Sponsored Research, to take up nonmilitary topics “in the public interest” as well as military and geopolitical topics.

The Cold-War Origins of the Value of Statistical Life 217
perspective of strategic planning, one could acquire more fissile material given the overall resource constraints. The needless constraint on fissile material contributed to the use of numerous decoy planes serving little purpose except to be shot down.
The second problem Hirshleifer (1950) emphasized was missing prices. Hirshleifer reasoned analogously from profit maximization, but whereas profits involve sales and inputs, both priced in the common coin of dollars, in military appli-cations like the bombing study, prices were missing from both sides of the ledger. On the benefits side, there was the question of quantifying damage to the enemy. But, argued Hirshleifer, the main question raised by the bombing study centered on the “cost concept (dollars, crews, or planes) to be used.”
Hirshleifer (1950 p. 5) noted that airplane crews can be priced by the cost of training and replacing them, but added:
[We may] set a value on human life higher than the mere training cost of a replacement. A man may cost $10,000 in terms of a training cost to replace, but we may prefer to lose $15,000 in materials or machines if we can save the man. This sentence points the way to costing loss of men, if the condition described actually holds true. Obviously, there is a limit to the materials or machines we will sacrifice to save the man, and our losses in men should be valued in terms of this limit, cold-blooded as it may sound. In many respects lives and dollars are incommensurable, but unfortunately the planners must compare them.
Hirshleifer followed up on this issue along with other economists (including Armen Alchian, Stephen Enke, and Charles Hitch) a few months later. Alchian et al. (1951, p. 20) wrote:
In our society, personnel lives do have intrinsic value over and above the investment they represent. This value is not directly represented by any dol-lar figure because, while labor services are bought and sold in our society, human beings are not. Even so, there will be some price range beyond which society will not go to save military lives. In principle, therefore, there is some exchange ratio between human lives and dollars appropriate for the historical context envisioned to any particular systems analysis. Needless to say, we would be on very uncertain ground if we attempted to predict what this exchange ratio should be.
In the short term, RAND’s response to this dilemma was to drop its goal of a general theory of air warfare, avoid incommensurables, and focus on smaller subsid-iary problems where apples could be compared to apples (Alchian et al. 1951). The idea, known as “sub-optimization,” was to isolate a smaller portion of the system and maximize the objective over those variables, taking the other variables as fixed constraints in the problem. In other words, the analyst could trace out the efficient frontier between dollars and lives. Decision makers in the Pentagon or the civilian

218 Journal of Economic Perspectives
government could eventually make the call (Alchian et al. 1951; Hitch and McKean 1960, chap. 10).4 This notion of sub-optimization was a major theme in much of Hitch’s work and his colleagues’ for the next decade, and the example of the lives of bomber crews remained the quintessential example motivating the work into the 1960s (Hitch 1953, 1955; Hitch and McKean 1960; McKean 1963).
Although it was no longer on the front burner, clearly the problem raised by Paxson’s strategic bombing study was still simmering at RAND ten years later. That said, the wisdom of seeking “missing prices” so that incommensurables like dollars and human lives could be put into the same equation was not a settled matter at RAND. For their part, Hitch and McKean thought it ought not be attempted. They recommended several variations on the vector approach of calculating the efficient frontier, identifying the tradeoffs among incommensurables, rather than optimizing by choosing from the frontier.
Others were more hopeful that the seemingly incommensurable dollars and lives could be made commensurate by examining the revealed preferences of the US Air Force. Alchian et al. (1951, p. 29) argued that, once the efficient frontier is identified,
Presumably it will be the responsibility of the Air Force or the [ Joint Chiefs of Staff] to select one of the points as the most sensible one. Of course, any such selection implies a definite exchange ratio between lives and dollars. If this ratio could be revealed to the designers of bombing systems at an early stage they could explicitly determine the most effective system in terms of job done for a combined cost. While probably impossible in this particu-lar case, we ought to avoid whenever possible the presentation of results only in efficient combination form. This yields the weakest possible ordering of the results given minimum rationality assumptions. All effort should be made to utilize whatever information we have about the relative values of the various inputs.
Alchian et al. presumed that ultimately it is the responsibility of the US Air Force to make the tradeoffs between lives and machines, not RAND. Nevertheless, they argued “all effort” should be made to understand those “exchange ratios” and build them into the design phase, rather than merely to present decision makers with an efficient frontier from which to choose. That effort would soon come from Thomas Schelling and his student Jack Carlson.
4 This approach, sometimes referred to as multiobjective benefit–cost analysis, would also be developed in the context of water resources, where it was quite controversial (Banzhaf 2009). The parallel develop-ments between these two fields, RAND’s participation in both, and the Ford Foundation’s backing of both, is striking.
H. Spencer Banzhaf 219
Carlson and Schelling
Thomas Schelling (b. 1921) is a Nobel prize–winning economist famous for his work on strategy, conflict, and cooperation.5 Schelling received his BA from Berkeley in 1944 and his PhD from Harvard in 1951. During the last years of World War II, he served in the fiscal division at the Bureau of the Budget under Harvard economist Arthur Smithies, an advisor to many second-generation architects of applied welfare economics. Schelling joined RAND as an adjunct fellow in 1956 and spent the summer of 1957 there, followed by a whole year during 1958–59 with Hitch as his host, a year which he recalled as the most productive in his career (Schelling 2009). He also had direct connections to the Pentagon, working with it in the early 1960s to construct war games and advising on the Vietnam conflict (Sent 2007). Thus, Schelling joined RAND a few years after the debacle of the stra-tegic bombing analysis, and visited with Hitch during years when Hitch continued to reflect on the criterion problem and continued to illustrate it with the formative example of valuing the lives of airplane crews.
Jack Carlson (1933–1992) was a former Air Force fighter pilot who completed his dissertation, entitled “The Value of Life Saving,” in 1963 under Schelling and Smithies. After beginning his academic career at the Air Force Academy, Carlson went on to a career in government—in the Council for Economic Advisors, the Office of Management and Budget, and as an assistant secretary of the interior—then as head of the National Association of Realtors. Whether the idea to address the question of valuing life-saving came to Carlson and Schelling via RAND or via Carlson’s experience in the Air Force is not clear, though to the best of Schelling’s recollection the initial idea for the dissertation topic was Carlson’s.6 What is clear is that the issue had been one of considerable policy relevance to the US Air Force for some time.
At the time Carlson and Schelling were turning their attention to the problem, seemingly the only approach to valuation of life was the human capital approach, in which a person’s life was valued either by their gross earnings or their net earn-ings after subtracting personal consumption. The approach was used by the courts and some economists (for example, Weisbrod 1961), but on the whole, economists in the 1960s seemed to feel it was inappropriate for valuing a life. Human capital might reflect the material contribution of a person to the market economy, but it evidently ignored nonmarket contributions, not to mention a person’s own valua-tion of his or her life. (Is a retiree of no value to society? Or a homemaker? Do the person’s own feelings count?)
How this problem could be overcome was not clear. Nevertheless, both public and private investments in life saving have associated opportunity costs.
5 For background on Schelling and appraisals of his career, see Sent (2007) and Zeckhauser (1989). For interviews, see Schelling (2009) and Carvalho (2007).6 Personal correspondence with Thomas Schelling, November 16, 2013.
220 Journal of Economic Perspectives
Consequently, there are trade-offs to be made, and therefore economic choices (Fromm 1965; Spengler 1968; Weisbrod 1961).
But if economists were clear on the idea that there were choices to be made, they were less clear on what the precise nature of that choice was and who was making it. A number of economists recognized that individuals make tradeoffs between risks and money (for example, Fromm 1965; Mushkin 1962). Reading back in light of Schelling (1968) and the subsequent literature, it is tempting to view that work as a proto-value-of-statistical-life literature. Until Schelling’s (1968) essay, however, there was no clear connection between those individual’s tradeoffs over risks and the apparent policy-relevant question of the value of lives. To illustrate the point, consider an applied problem like measuring the benefits of a highway safety improvement. For a policymaker standing outside the risk pool, it is entirely natural to approach that problem by asking how many lives it would save. The next logical question would be, what is the value of those lives? How individual values for risks came into it was by no means obvious.
The issue was also tied up with evolving views during the period about the rela-tive roles of consumer sovereignty and political or social sovereignty (Banzhaf 2009, 2011). Though economists could agree that there were tradeoffs to be made, they were not of one mind about who was making those tradeoffs. For private goods, it was clear that individuals decided. For public questions about national defense, public safety, clean air and water, or the distribution of income, the decision maker was not so clear. Some economists felt consumers should be sovereign and that their values for these things should be aggregated up to a social value. From this perspec-tive, benefit–cost analysis could be used to judge or evaluate public policies.
Others felt these were inherently social questions that only the political process could answer. Consequently, political representatives were sovereign and their will-ingness to trade off among these goods was what mattered. From this perspective, benefit–cost analysis could be used to inform decision-making. First, economists could present the political authorities with an efficient frontier. Once those authori-ties revealed their willingness to trade off lives for other goods by choosing points on the frontier, in later phases those “exchange ratios” could be built into the design. This latter view seemed especially compelling in the case of human lives. No individual would be willing to trade his or her own life for other social goods. But because that was the relevant policy choice, apparently society had to make the choice as a moral matter. Wrestling with this dilemma, the literature in the 1950s and 1960s was quite vague about whose values were at stake (for example, Fromm 1965; Mushkin 1962; Valavanis 1958; Weisbrod 1961).
All these issues arose in Carlson’s (1963) dissertation. Life saving, he wrote, is an economic activity because it involves making choices with scarce resources. For example, he noted that the construction of certain dams resulted in a net loss of lives (more than were expected to be saved from flood control), but, in proceeding with the projects, the public authorities revealed that they viewed those costs as justified by the benefit of increased hydroelectric power and irrigated land. In considering how to evaluate those tradeoffs in formal benefit–cost analysis, Carlson considered
The Cold-War Origins of the Value of Statistical Life 221
the human capital approach to be “usable as a first approximation” (p. 86) but to fall short of the full contributions of a person to society. A better approach was to find people making actual choices that revealed their willingness to trade lives for other social goods.
Not surprisingly given his own career and Schelling’s RAND connections, Carlson considered choices about life-saving within the context of US Air Force applications. Taking the approach Hirshleifer had outlined ten years earlier, Carlson considered the willingness of the US Air Force to trade off costs and machines to save men in two specific applications. One was the recommended emergency procedures when pilots lost control of the artificial “feel” in their flight control systems. A manual provided guidance on when to eject and when to attempt to land the aircraft, procedures which were expected to save the lives of some pilots at the cost of increasing the number of aircraft that would be lost. This approach yielded a lower bound on the value of life of $270,000, which Carlson concluded was easily justified by the human capital cost of training pilots. (Note the estimate was a lower bound, as the manual revealed, in specifying what choices to make, that lives were worth at least that much.) Carlson’s other application was the capsule ejection system for a B-58 bomber. The US Air Force had initially estimated that it would cost $80 million to design an ejection system. Assuming a range of typical cost over-runs and annual costs for maintenance and depre-ciation, and assuming 1–3 lives would be saved by the system annually, Carlson (p. 92) estimated that in making the investment the USAF revealed its “money valuation of pilots’ lives” to be at least $1.17 million to $9.0 million. (Although this was much higher than the estimate from the ejection manual, the two estimates, being lower bounds, were not necessarily inconsistent.)
Importantly, as the RAND economists did earlier, Carlson took the public perspective: it was a matter of either the government generally, or the US Air Force specifically, to make tradeoffs between lives and equipment. This perspective seems natural for military applications. An Air Force general would certainly factor casu-alty rates into decision making, but the general would hardly weight those casualties by the preferences of the airmen involved. It would be the general’s decision to make based on the general’s personal willingness to trade off damage to the enemy for lives. Again, I emphasize “lives” here because from the standpoint of the public agency, the outcome is the number of lives saved in the aggregate population, not risks. Consequently, it was perfectly natural for Carlson (1963) to call these esti-mates the value of “life saving” or the “value of human life” (pp. 89, 96) and even the “costs and benefits . . . of preserving a particular life or lives” (p. 1).
Interestingly, however, Carlson had earlier in his dissertation briefly consid-ered the case of hazardous duty pay, in which an individual reveals information about willingness to accept added on-the-job risk for a compensating increment to income. Here, the decision maker was not a public agency, but an individual choosing a job. Carlson gave examples from the private sector as well as volunteer positions in the military. For example, he figured that a pilot willingly increases the annual risk of dying (during peace-time) by 0.00232 to 0.00464 percentage points,
222 Journal of Economic Perspectives
for some $2,280 of increased pay.7 If Carlson had followed the methodology he had used when considering the public choice applications, he might have divided $2,280 by those risks to estimate a per-life value of $491,000 to $983,000. Tellingly, Carlson did not do so in this case: he left it as $2,280, the willingness to accept for that range of risks.
The fundamental (albeit implicit) distinction here appears to be the individual perspective versus the social perspective. For the individual as a decision maker, it was only a matter of evaluating risk, so there was no point in aggregating up to per-life values. In contrast, when the public agency was the decision maker, it was a matter of the realizations of the individuals’ risks aggregated over the group (expected lives), hence it made sense to convert the values to dollars per life.
Taking up the subject five years after his student, Schelling’s (1968) crucial move was to finesse this distinction. At the outset of his essay, Schelling wanted to make clear that he was by no means tackling the question of the “worth of human life” itself. That question, he suggested, was rightfully tied up in moral questions and was too “awesome” for an economist to even begin to address. Rather, Schelling made clear that his more modest objective was to value the postponement of deaths; and not the death of a particular, known person, but “statistical death.” “What is it worth,” he asked (p. 127), to reduce the frequency of death—the statistical prob-ability of death?”
After defining the question in these terms, Schelling (1968) next asked, “Worth to whom?” Now, Schelling was clearly addressing the problem of evaluating public investments (indeed, his essay was part of a conference and book volume dedicated to this topic). Although writing about public investments, he took the view that those investments should be evaluated in terms of the private worth they had to the individuals who would be affected (p. 127): “Worth to whom? . . . I shall propose that it is to the people who may die.”
Elaborating on this point, Schelling addressed the oft-articulated view that life and death are moral—or at least intangible—matters that cannot be priced. Responding to Reynolds (1956), who had argued that it is beyond the compe-tence of economists to assign values to pain, fear, and suffering, Schelling (1968, pp. 128–129) argued:
The same is true of cola and Novocain . . . If they were not for sale it would be beyond our competence, as economists, to put an objective value on them, at least until we took the trouble to ask people. Death is indeed different from most consumer events, and its avoidance different from most commodities. . . . But people have been dying for as long as they have been living; and where life and death are concerned we are all consumers. We nearly all want our lives extended and are probably willing to pay for it. It is worth while to remind
7 Economists remain interested in such decisions. Recently Greenstone, Ryan, and Yankovich (2014) have computed the willingness of soldiers to re-enlist in the US Army based on the hazards and compen-sation associated with specific duties.
H. Spencer Banzhaf 223
ourselves that the people whose lives may be saved should have something to say about the value of the enterprise and that we analysts, however detached, are not immortal ourselves.
In other words, consumers’ sovereignty should reign when evaluating public invest-ments: it is their preferences which count, not the preferences of public officials. Because it was recognized that individuals do make choices over risk, consumer sovereignty could be embraced by looking to choices over risk as the basis of social values. These exchange ratios can be observed, Schelling (1968) suggested, from either the price system itself or through surveys (pp. 142–43), both methods that were followed up on in the coming years (for example, Thaler and Rosen 1976; Jones-Lee 1976). While public policies would still have the effect of costing or saving lives in the population, from the individual’s perspective, these effects were measured as risks, and that was what mattered for valuation.
Conclusion
Until Schelling’s (1968) essay, the implicit perspective in discussions of valuing life for purposes of public investments was that of a public agency trading off lives for other goods. The question of individual risks to life and limb was restricted to individual decisions. Schelling brought these two contexts together by evaluating the public benefits as the sum of private benefits. In so doing, he essentially merged one perspective that thought in terms of lives with another that thought in terms of risks. Synthesizing the two perspectives, Schelling coined the term “statistical lives,” as a way to capture both perspectives. This synthesis was critical because valuing lives was, as he put it, too “awesome” a problem, but valuing risks had not, up to that point, seemed relevant to many public investments. Schelling was still talking about lives, but a peculiar kind of lives—”statistical lives.” This was a new coinage, but it would have had a familiar ring. For several decades, it had been common in journals of statistics, engineering, and economics to write about the “statistical life” of a product—how long a light bulb, for example, could be expected to live. Only in this case, consumers were not evaluating the lives of light bulbs, but of themselves.
Familiar or not, Schelling’s (1968) synthesis was not necessarily appreciated by people working within each perspective. Initial comments on Schelling’s essay were stunningly dismissive, criticizing Schelling for lacking a rigorous analysis of risk, on one hand, as well as for overlooking the existing value-of-life literature on the other (Bailey 1968; Fromm 1968). The economics and wider policy literature has continued to grapple with the distinction between lives and risks ever since: for examples of such discussion, see Broome (1978); the essays in Jones-Lee (1982), particularly Linnerooth (1982); and Heinzerling (2000). Given these interpretive debates within the policy community, it is not surprising that the value of statis-tical life concept would be confusing and controversial to the general public, as the senior death discount episode back in 2003 attested.
224 Journal of Economic Perspectives
Accordingly, Cameron (2010) has called for “euthanizing” the term “value of a statistical life” and statistical lives as a unit of account. She argues that this unap-pealing term is a colossal failure of marketing. It misleads the public, who interpret “value” as intrinsic worth rather than a monetary measure, and who understand-ably interpret “lives” as just that, rather than risks. It is, after all, a lot to ask of the adjective “statistical” to not only modify the noun “life” but to transform it into “risk”! Inevitably, this conflation of the notion of “lives” and “risk” leads to misun-derstanding and, in turn, to political controversy. Cameron suggests replacing the VSL terminology with “willingness to swap” money for “microrisks.”
Thus, although Cameron (2010) may well be right to suggest that, as a term of art, “value of statistical life” is unnecessarily confusing to the public today, it made sense in Schelling’s historical context. Indeed, it more than made sense. By bridging the gap between the value for lives, which was what seemingly was required for social benefit–cost analysis, and the value for risks, which was what consumers could reveal either through the market or through surveys, the VSL terminology was an appealing and persuasive way to make the case for introducing those values into benefit–cost analysis. In other words, conflating “lives” and “risks” may have been exactly what it took at the time for economists to persuade government offi-cials and the public on the idea of pricing those policy impacts.
As Cameron (2010), Fourcade (2009), Viscusi (2009a,b), and others have discussed, economists’ use of the value of statistical life in benefit–cost analysis often becomes tied up in ethical and political debates, in which economists are but one voice. But this was always so. Economists did not “discover” the idea of the VSL (or of estimating tradeoffs between money and risks) on their own. They were forced to consider the problem because of political pressure. Going back to 1949, when RAND economists had recommended the use of cheap propeller planes, the US Air Force objected to their answer and brought political pres-sure on RAND to change it. Recognizing that one reason they had come to the “wrong” answer was their ignoring the lives of bomber crews, RAND economists turned their attention to this problem of valuation of life, a problem that eventu-ally attracted the attention of Schelling. Schelling’s (1968) key rhetorical strategy, in turn, was to soothe fears about the awesomeness of valuing life by turning the terms of the debate, ever so subtly, to valuing risk. Judging by today’s discussions, economists today may be ready to make that turn a little less subtle, but in doing so they are responding to broader political context in the same way they have always done.
■ I thank the RAND Corporation and especially Vivian Arterbery for valuable assistance with using the RAND archives. I thank Glenn Blomquist, Trudy Ann Cameron, Thomas Schelling, Timothy Taylor, and Thomas Stapleford for helpful comments. I also thank the National Science Foundation (NSF #0750610) for financial support. An earlier version of this paper was presented at the History of Economics Society meetings, Vancouver, British Columbia, in June 2013.
The Cold-War Origins of the Value of Statistical Life 225
References
Alchian, A. A., G. D. Bodenhorn, S. Enke, C. H. Hitch, J. Hirshleifer, and A. W. Marshall. 1951. “What is the Best System?” January 4. RAND Archives D-860.
Ashenfelter, Orley. 2006. “Measuring the Value of Statistical Life: Problems and Prospects.” Economic Journal 116(510): C10–23.
Bailey, Martin J. 1968. “Comments.” In Problems in Public Expenditure Analysis, edited by Samuel B. Chase, Jr., 162–66. Washington, DC: Brookings Institution.
Banzhaf, H. Spencer. 2009. “Objective or Multi-Objective? Two Historically Competing Visions for Benefit-Cost Analysis.” Land Economics 85(1): 3–23.
Banzhaf, H. Spencer. 2010. “Consumer Surplus with Apology: A Historical Perspective on Nonmarket Valuation and Recreation Demand.” Annual Review of Resource Economics 2: 183–207.
Banzhaf, H. Spencer. 2011. “Consumer Sover-eignty in the History of Economic Thought.” History of Political Economy 43(2): 339–45.
Barlow, E. J. 1950. “Preliminary Proposal for Air Defense Study.” October. RAND Archives D(L)-816-2.
Blomquist, Glenn C. Forthcoming. “Value of Life, Economics of.” International Encyclopedia of Social and Behavioral Sciences, 2nd edition. Oxford: Elsevier.
Broome, John. 1978. “Trying to Value a Life.” Journal of Public Economics 9(1): 91–100.
Cameron, Trudy Ann. 2010. “Euthanizing the Value of a Statistical Life.” Review of Environmental Economics and Policy 4(2): 161–78.
Carlson, Jack. 1963. Valuation of Life Saving. Dissertation, Harvard University.
Carvalho, Jean-Paul. 2007. “An Interview with Thomas Schelling.” Oxonomics 2(1–2): 1–8.
DeHaven, James C., and Jack Hirshleifer. 1957. “Feather River Water for Southern California.” Land Economics 33(3): 198–209.
Fourcade, Marion. 2009. “The Political Valu-ation of Life: A Comment on W. Kip Viscusi’s ‘The Devaluation of Life.’” Regulation and Gover-nance 3(3): 291–97.
Fromm, Gary. 1965. “Civil Aviation Expen-ditures.” In Measuring Benefits of Government Investments, edited by Robert Dorfman, 172–216. Washington, DC: Brookings Institution.
Fromm, Gary. 1968. “Comments.” In Problems in Public Expenditure Analysis, edited by Samuel B. Chase, Jr., 166–76. Washington, DC: Brookings Institution.
Goldstein, J. R. 1961. “RAND: The History, Operations, and Goals of a Nonprofit Corporation.”
http://www.rand.org/content/dam/rand/pubs /papers/2008/P2236-1.pdf.
Greenstone, Michael, Stephen P. Ryan, and Michael Yankovich. 2014. “The Value of a Statistical Life: Evidence from Military Retention Incentives and Occupation-Specific Mortality.” Unpublished paper.
Hammitt, James K. 2000. “Valuing Mortality Risk: Theory and Practice.” Environmental Science and Technology 34(8): 1396–1400.
Hammitt, James K., and Nicolas Treich. 2007. “Statistical vs. Identified Lives in Benefit–Cost Analysis.” Journal of Risk and Uncertainty 35(1): 45–65.
Heinzerling, Lisa. 2000. “The Rights of Statis-tical People.” Harvard Environmental Law Review 24: 189–207.
Hirshleifer, Jack. 1950. “Remarks on Bombing Systems Analysis.” Memorandum to C. J. Hitch, June 15. RAND Archives D-893-PR.
Hirshleifer, Jack, James C. DeHaven, and Jerome W. Milliman. 1960. Water Supply: Economics, Technology, and Policy. University of Chicago Press.
Hitch, Charles. 1953. “Sub-Optimization in Operations Problems.” Journal of the Operations Research Society of America 1(3): 87–99.
Hitch, Charles. 1955. “An Appreciation of Systems Analysis.” Journal of the Operations Research Society of America 3(4): 466–81.
Hitch, Charles J., and Roland N. McKean. 1960. Economics of Defense in the Nuclear Age. Harvard University Press.
Hounshell, David. 1997. “The Cold War, RAND, and the Generation of Knowledge, 1946–1962.” Historical Studies in the Physical and Biological Sciences 27(2): 237–67.
Jardini, David R. 1996. Out of the Blue Yonder: The Rand Corporation’s Diversification into Social Welfare Research, 1946–1968. Dissertation, Carnegie-Mellon University.
Jones-Lee, M. W. 1976. The Value of Life: An Economic Analysis. University of Chicago Press.
Jones-Lee, M. W, ed. 1982. The Value of Life and Safety. Amsterdam: North-Holland.
Kaplan, Fred. 1983. The Wizards of Armageddon. New York: Simon and Schuster.
Leonard, Robert J. 1991. “War as a ‘Simple Economic Problem’: The Rise of an Economics of Defense.” In Economics and National Security: A History of Their Interaction, edited by Craufurd D. Goodwin, 261–84. Durham, NC: Duke University Press.
Linnerooth, Joanne. 1982. “Murdering Statistical
226 Journal of Economic Perspectives
Lives … ?” In The Value of Life and Safety, edited by M. W. Jones-Lee, pp. 229–61. Amsterdam: North-Holland.
McKean, Roland N. 1963. “Cost-Benefit Analysis and British Defence Expenditure.” Scottish Journal of Political Economy 10(1): 17–35.
Mirowski, Philip. 2002. Machine Dreams: Economics Becomes a Cyborg Science. Cambridge University Press.
Mushkin, Selma J. 1962. “Health as an Invest-ment.” Journal of Political Economy 70(5, Part 2): 129–57.
Reynolds, D. J. 1956. “The Cost of Road Acci-dents.” Journal of the Royal Statistical Society 119(4): 393–408.
Schelling, Thomas C. 1968. “The Life You Save May Be Your Own.” In Problems in Public Expenditure Analysis, edited by Samuel B. Chase, Jr., 127–62. Washington, DC: Brookings Institution.
Schelling, Thomas C. 2009. “Thomas C. Schelling.” In The Lives of the Laureates, 5th ed., edited by William Breit and Barry T. Hirsch, pp. 393–420. MIT Press.
Sent, Esther-Mirjam. 2007. “Some Like It Cold: Thomas Schelling as a Cold Warrior.” Journal of Economic Methodology 14(4): 455–71.
Smith, Bruce L. R. 1966. The RAND Corpora-tion: Case Study of a Nonprofit Advisory Corporation. Cambridge, MA: Harvard University Press.
Spengler, Joseph J. 1968. “The Economics of Safety.” Law and Contemporary Problems 33(3): 619–38.
Thaler, Richard, and Sherwin Rosen. 1976. “The Value of Saving a Life: Evidence from the Labor Market.” In Household Production and Consumption, edited by Nestor E. Terleckyj, pp. 265–. New York: Columbia University Press for NBER.
Valavanis, Stefan. 1958. “Traffic Safety from an Economist’s Point of View.” Quarterly Journal of Economics 72(4): 477–84.
Viscusi, W. Kip. 2009a. “The Devaluation of Life.” Regulation and Governance 3(2): 103–27.
Viscusi, W. Kip. 2009b. “Reply to the Comments on ‘The Devaluation of Life.’” Regulation and Governance 3(3): 306–309.
Viscusi, W. Kip. 2011. “What’s to Know? Puzzles in the Literature on the Value of Statistical Life.” Journal of Economic Surveys 26(5): 763–68.
Viscusi, W. Kip, and Joseph E. Aldy. 2003. “The Value of a Statistical Life: A Critical Review of Market Estimates throughout the World.” Journal of Risk and Uncertainty 27(1): 5–76.
Weisbrod, Burton A. 1961. Economics of Public Health: Measuring the Economic Impact of Diseases. Philadelphia: University of Pennsylvania Press.
Zeckhauser, Richard. 1989. “Distinguished Fellow: Reflections on Thomas Schelling.” Journal of Economic Perspectives 3(2): 153–64.
Journal of Economic Perspectives—Volume 28, Number 4—Fall 2014—Pages 227–234
This section will list readings that may be especially useful to teachers of under-graduate economics, as well as other articles that are of broader cultural interest. In general, with occasional exceptions, the articles chosen will be expository or integrative and not focus on original research. If you write or read an appropriate article, please send a copy of the article (and possibly a few sentences describing it) to Timothy Taylor, preferably by email at [email protected], or c/o Journal of Economic Perspectives, Macalester College, 1600 Grand Ave., Saint Paul, MN, 55105.
Smorgasbord
The Bank of International Settlements discusses “The Costs of Deflation: What Does the Historical Record Say?” within a chapter of its 84th Annual Report. “First, the record is replete with examples of ‘good’, or at least ‘benign’, deflations in the sense that they coincided with output either rising along trend or undergoing only a modest and temporary setback. . . . The second important feature of deflation dynamics revealed by the historical record is the general absence of an inherent deflation spiral risk—only the Great Depression episode featured a deflation spiral in the form of a strong and persistent decline in the price level; the other episodes did not. . . . The evidence, especially in recent decades, argues against the notion that deflations lead to vicious deflation spirals. . . . Third, it is asset price deflations rather
■ Timothy Taylor is Managing Editor, Journal of Economic Perspectives, based at Macalester College, Saint Paul, Minnesota. He blogs at http://conversableeconomist.blogspot.com.
http://dx.doi.org/10.1257/jep.28.4.227 doi=10.1257/jep.28.4.227
Recommendations for Further Reading
Timothy Taylor
228 Journal of Economic Perspectives
than general deflations that have consistently and significantly harmed macroeco-nomic performance. Indeed, both the Great Depression in the United States and the Japanese deflation of the 1990s were preceded by a major collapse in equity prices and, especially, property prices. These observations suggest that the chain of causality runs primarily from asset price deflation to real economic downturn, and then to deflation, rather than from general deflation to economic activity. . . . Fourth, recent deflation episodes have often gone hand in hand with rising asset prices, credit expansion and strong output performance. Examples include episodes in the 1990s and 2000s in countries as distinct as China and Norway.” June 29, 2014. http://www .bis.org/publ/arpdf/ar2014e.pdf.
Donald J. Marples and Jane G. Gravelle offer an overview of “Corporate Expatri-ation, Inversions, and Mergers: Tax Issues.” “News reports in the late 1990s and early 2000s drew attention to a phenomenon sometimes called corporate ‘inversions’ or ‘expatriations’: instances where U.S. firms reorganize their structure so that the ‘parent’ element of the group is a foreign corporation rather than a corporation chartered in the United States. The main objective of these transactions was tax savings and they involved little to no shift in actual economic activity. Bermuda and the Cayman Islands (countries with no corporate income tax) were the loca-tion of many of the newly created parent corporations. These types of inversions largely ended with the enactment of the American Jobs Creation Act of 2004 . . . [which] effectively ended shifts to tax havens where no real business activity took place. However, two avenues for inverting remained. The act allowed a firm to invert if it has substantial business operations in the country where the new parent was to be located . . . Firms could also invert by merging with a foreign company if the original U.S. stockholders owned less than 80% of the new firm. Two features made a country an attractive destination: a low corporate tax rate and a territo-rial tax system that did not tax foreign source income. Recently, the UK joined countries such as Ireland, Switzerland, and Canada as targets for inverting when it adopted a territorial tax.” Congressional Research Service, September 25, 2014. http://fas.org/sgp/crs/misc/R43568.pdf.
Luigi Guiso, Paola Sapienza, and Luigi Zingales inquire into “Monnet’s Error?” “Europe seems trapped in catch-22: there is no desire to go backward, no interest in going forward, but it is economically unsustainable to stay still. . . . On the one hand, Monnet’s chain reaction theory seems to have worked. In spite of limited support in some countries, European integration has moved forward and has become almost irreversible. On the other hand, the strategy has worked so far at the cost of jeopardizing the future sustainability. The key word is ‘almost.’ Europe and the euro are not irreversible, they are simply very costly to revert. As long as the political dissension is not large enough, Monnet’s chain reaction theory delivered the desired outcome, albeit in a very non-democratic way. The risk of a dramatic reversal, however, is real. The European project could probably survive a United Kingdom’s exit, but it would not survive the exit of a country from the euro, espe-cially if that exit is not so costly as everybody anticipates. The risk is that a collapse of the euro might bring also the collapse of many European institutions, like the
Timothy Taylor 229
free movement of capital, people and goods. In other words, as all chain reactions, also Monnet’s one has an hidden cost: the risk of a meltdown.” Brookings Papers on Economic Activity, Fall 2014. http://www.brookings.edu/~/media/Projects/BPEA /Fall%202014/Fall2014BPEA_Guiso_Sapienza_Zingales.pdf.
Robleh Ali, John Barrdear, Roger Clews, and James Southgate discuss “Innova-tions in Payment Technologies and the Emergence of Digital Currencies.” “This article considers recent innovations in payments technology, focusing on the emer-gence of privately developed, internet-based digital currencies such as Bitcoin. Digital currency schemes combine both new payment systems and new currencies. Users can trade digital currencies with each other in exchange for traditional currency or goods and services without the need for any third party (like a bank). And their creation is not controlled by any central bank. Bitcoin—currently the largest digital currency—was set up in 2009 and several thousand businesses worldwide currently accept bitcoins in payment for anything from pizza to webhosting. . . . This article argues, however, that the key innovation of digital currencies is the ‘distributed ledger’ which allows a payment system to operate in an entirely decentralised way, without intermediaries such as banks. This innovation draws on advances from a range of disciplines including cryptography (secure communication), game theory (strategic decision-making) and peer-to-peer networking (networks of connections formed without central co-ordination).” The article has perhaps the best nontech-nical step-by-step description of how Bitcoin transactions actually work that I’ve seen. A companion article, “The Economics of Digital Currencies,” by the same authors goes on to say: “Digital currencies do not, at present, play a substantial role as money in society. But they may have the potential to come to exhibit at least some of the functions of money over time. There is little incentive for the pricing of goods and services to change from traditional currencies, however, unless these currencies were to suffer from a wholesale collapse in confidence. . . . A variety of potential risks to financial stability could emerge if a digital currency attained systemic status as a payment system, most of which could be addressed through regulatory supervision of relevant parties.” Quarterly Bulletin of the Bank of England (2014, Q3), pp. 262–75 and 276–86. At http://www.bankofengland.co.uk/publications/Documents/quarterly bulletin/2014/qb14q301.pdf and http://www.bankofengland.co.uk/publications /Documents/quarterlybulletin/2014/qb14q302.pdf.
The IMF devotes a chapter in its Global Financial Stability Report to “Shadow Banking Around the Globe: How Large, and How Risky?” “Many indications there point to the migration of some activities—such as lending to firms—from tradi-tional banks to the nonbank sector. Shadow banking can play a beneficial role as a complement to traditional banking by expanding access to credit or by supporting market liquidity, maturity transformation, and risk sharing. It often, however, comes with banklike risks, as seen during the 2007–08 global financial crisis. . . . So far, the (imperfectly) measurable contribution of shadow banking to systemic risk in the financial system is substantial in the United States but remains modest in the United Kingdom and the euro area. In the United States, the risk contributions of shadow banking activities have been rising, but remain slightly below precrisis
230 Journal of Economic Perspectives
levels.” October 2014, https://www.imf.org/external/pubs/ft/gfsr/2014/02/pdf /c2.pdf.
Steven Garber, Susan M. Gates, Emmett B. Keeler, Mary E. Vaiana, Andrew W. Mulcahy, Christopher Lau, and Arthur L. Kellermann discuss Redirecting Innovation in U.S. Health Care: Options to Decrease Spending and Increase Value. “A leading cause of high and growing spending is new medical technologies. Previous studies aimed at reining in spending considered changing the ways in which existing technolo-gies are used. Our work for this project focused on identifying promising policy options to change which medical technologies are created in the first place . . . We argue that the best way to further our twin policy goals is by altering the finan-cial incentives of inventors, private investors, payers, providers, and patients. . . . We also conducted case studies of eight medical products: three drugs (including one biologic), three devices (a diagnostic, an implantable, and a costly machine), and two types of HIT [Health Information Technology] (electronic health records [EHRs] and telemedicine).” RAND Corporation. 2014, http://www.rand.org /content/dam/rand/pubs/research_reports/RR300/RR308/RAND_RR308.pdf.
Craig Gundersen and James P. Ziliak document “Childhood Food Insecurity in the U.S.: Trends, Causes, and Policy Options.” “In 2012, nearly 16 million U.S. children, or over one in five, lived in households that were food-insecure, which the U.S. Department of Agriculture defines as ‘a household-level economic and social condition of limited access to food.’ Even when we control for the effects of other factors correlated with poverty, these children are more likely than others to face a host of health problems, including but not limited to anemia, lower nutrient intake, cognitive problems, higher levels of aggression and anxiety, poorer general health, poorer oral health, and a higher risk of being hospitalized, having asthma, having some birth defects, or experiencing behavioral problems.” The Future of Chil-dren Research Report, Fall 2014. http://futureofchildren.org/futureofchildren /publications/docs/ResearchReport-Fall2014.pdf.
Edited E-books
Coen Teulings and Richard Baldwin have edited a useful e-book of 13 short essays with a variety of perspectives on Secular Stagnation: Facts, Causes and Cures. In the overview, they write: “This eBook gathers the views of leading economists including Larry Summers, Paul Krugman, Bob Gordon, Olivier Blanchard, Richard Koo, Barry Eichengreen, Ricardo Caballero, Ed Glaeser and a dozen others. It is too early to tell whether secular stagnation is really secular, but if it is, current policy tools will be obsolete. Policymakers should start thinking about potential solutions. . . . As Barry Eichengreen observes: ‘But while the term “secular stagnation” was widely repeated, it was not widely understood. Secular stagnation, we have learned, is an economist’s Rorschach Test. It means different things to different people.’ Fortunately, Macroeconomics 101 provides a straightforward way of structuring the various views. . . . Basic macroeconomics provides a three-pillar framework for
Recommendations for Further Reading 231
thinking about an economy’s future growth. First is the economy’s long-run poten-tial growth rate. Second is the deviation of actual growth from its potential. Third is one-off changes in the level of GDP without a change in the long-run growth rate. All the various contributions stress one or more of these.” 2014. http://www.voxeu .org/sites/default/files/Vox_secular_stagnation.pdf.
Melissa S. Kearney and Benjamin H. Harris have edited the e-book Policies to Address Poverty in America, which includes 14 short essays on subjects like expanding preschool access and early childhood development programs, mentoring and summer employment programs, building education and skills for low-income workers, the Earned Income Tax Credit, child care tax credits, the minimum wage, and more. As one example, Robert I. Lerman lays out the issues and possibilities in “Expanding Apprenticeship Opportunities in the United States.” “Today appren-tices make up only 0.2 percent of the U.S. labor force, far less than in Canada (2.2 percent), Britain (2.7 percent), and Australia and Germany (3.7 percent). . . . Two studies of the earnings gains of apprentices and government costs in the United States find that the social benefits outweigh the social and government costs by ratios of 20:1 to 30:1 . . . Stimulating a sufficient increase in apprenticeship slots is the most important challenge. Although it is easy to cite examples of employer reluctance to train, the evidence from South Carolina and Britain suggests that a sustained, business-oriented marketing effort can persuade a large number of employers to participate in apprenticeship training. Both programs were able to more than quadruple apprenticeship offers over about five to six years.” Brookings Institution, Hamilton Project, June 2014. http://www.hamiltonproject.org/files /downloads_and_links/policies_address_poverty_in_america_full_book.pdf.
Interviews with Economists
Michael Woodford is interviewed by Douglas Clement: “I had specifically suggested that announcing a target path for nominal GDP would be a desirable way to make an advance statement about the criteria that you would be looking at later. Now, I wasn’t saying that to suggest that that’s the only formula that would be valuable, but I thought it was useful to give a concrete example showing how the thing that I was talking about could be undertaken in practice. . . . A nominal GDP target path would have the advantage of being a single criterion, yet one that conveyed concern both about the real economy and about the price level and nominal variables at the same time. It would have given an explanation for which substantial stimulus would have continued to be appropriate for some time to come. But it was also a criterion that was intended to reassure people that what looked like very aggressive monetary policy was not going to allow inflation to get out of hand. . . . We have yet to reach the point where they [the Federal Reserve] do want to raise interest rates, but assuming that things evolve as everyone is currently anticipating, we are likely to reach it within the coming year. . . . It will be an interesting experiment in mone-tary economics because the Fed will be attempting to control short-term interest
232 Journal of Economic Perspectives
rates in a situation where almost certainly its balance sheet is going to be unusu-ally large. That means that there are going to be extraordinary quantities of excess reserves in existence, and this means that Fed control of short-term interest rates will not be achievable in the way that it always was in the past: through rationing the supply of reserves. . . . I think the fact that interest rates can be and are currently being paid on excess reserves is very important . . . probably the most important tool that they are going to have when the moment arises.” The Region, Federal Reserve Bank of Minneapolis, September 2014, pp. 12–27, http://www.minneapolisfed.org /publications_papers/pub_display.cfm?id=5379&&.
Richard Timberlake is interviewed by Renee Haltom: “Until maybe 10 or 20 years ago, economists who studied money felt that they could prescribe some logical policy for the Federal Reserve, and ultimately the Fed would see the light and follow it. That proved illusory. A central bank is essentially a government agency, no matter who ‘owns’ it. The Fed’s titular owners are the member banks, but the national government has all the controls over the Fed’s policies and profits. And as with all government agencies, the Fed is subject to public choice pressures and motives.” Timberlake also tells a nice story about his graduate school experience: “I recall the time when I presented a potential Ph.D. thesis proposal at Chicago to the economics department. The audience included professors and many able graduate students. I could feel that my presentation was not going over very well. After the ordeal was over, Friedman said to me, ‘Come back up to my office.’ When we were there, he said, ‘The committee and the department think that your thesis proposal has less than a 0.5 probability of acceptance.’ I knew that was coming, and I despondently replied that I had had a very frustrating time ‘finding a thesis.’ My words suggested that a thesis was a bauble that one found in a desert of intel-lect that no one else had discovered. It was then that Milton Friedman turned me around and started me on the road to being an economist. ‘Dick,’ he said, ‘theses are formed, not found.’ It was the single most important event in my professional life. I finally could grasp what economic research was supposed to be.” Econ Focus, Federal Reserve Bank of Richmond, First Quarter 2014, pp. 24–29, http://www .richmondfed.org/publications/research/econ_focus/2014/q1/pdf/interview.pdf.
Discussion Starters
Ed Dolan explores “The Pragmatic Case for a Universal Basic Income.” “The concept goes by many names: unconditional basic income, basic income guarantee, demo-grant. I prefer ‘universal basic income,’ or UBI for short. Whatever you call it, though, the feature that distinguishes a UBI from other sorts of social safety nets is its universality. Unlike other income-support programs, it is not means-tested. Instead, a UBI would provide subsistence-level grants to everyone, regardless of need, earned income, age or job status. . . . Hardly anyone sees a UBI as a perfect safety net. It offends conservatives by offering something for nothing. And it raises serious questions for progressives who worry there is more to poverty than a lack
Timothy Taylor 233
of income—that a UBI would not do enough to transform the culture of poverty that weighs down the underclass. But it has pragmatic advocates (including me) who believe that a UBI offers a better compromise than do other income-support programs among the mutually incompatible criteria of effectiveness in reducing poverty, maintenance of work incentives, administrative efficiency and accurate targeting. A big worry, of course, is that a UBI would end up as budget-buster or require a raid on private wealth to finance it. However, as shown, it need be nothing of the sort—provided it were part of a bargain in which other antipoverty efforts (save medical care) were abandoned, and middle-income earners traded in a hodgepodge of tax breaks for the universal basic income grant.” Milken Institute Review, Third Quarter 2014, pp. 14-23, http://assets1b.milkeninstitute.org/assets /Publication/MIReview/PDF/14-23-MR63.pdf.
Stephen M. Bainbridge and M. Todd Henderson present a vision of “Boards-R-Us: Reconceptualizing Corporate Boards.” “Despite the long and zealous efforts of corpo-rate law reformers to understand and improve the board of directors, there is a gaping hole in the corporate governance literature. No one has yet questioned a fundamental assumption of the current corporate governance model—that is, only individuals, acting as sole proprietors, should provide professional board services. . . . In other words, just as companies outsource their external audit function to an accounting firm rather than multiple individuals, the board of directors function would be outsourced to a professional services company. To see our idea, imagine a firm, Boards-R-Us, Inc., serving as the board of Acme Co. Instead of Acme shareholders hiring a dozen or so individual sole proprietors to provide board functions, they instead hire one firm—a BSP—to provide those functions, whatever they may be. Boards-R-Us would still act through individual agents, but the responsibility for managing a particular firm, within the meaning of state corporate law, would be that of Boards-R-Us the entity.” Stanford Law Review, May 2014, vol. 66, pp. 1051–1120, http://www.stanfordlawreview .org/sites/default/files/66_Stan_L_Rev_1051_BainbridgeHenderson.pdf.
Markus Krajewski tells the story of “The Great Lightbulb Conspiracy: The Phoebus Cartel Engineered a Shorter-Lived Lightbulb and Gave Birth to Planned Obsolescence.” The Convention for the Development and Progress of the Inter-national Incandescent Electric Lamp was signed in 1924 by the world’s major light bulb manufacturers. “[T]he group founded the Phoebus cartel, a supervisory body that would carve up the worldwide incandescent lightbulb market, with each national and regional zone assigned its own manufacturers and production quotas. It was the first cartel in history to enjoy a truly global reach.” The cartel did not only seek to set prices and quantities, but also collaborated to make light bulbs that would reliably burn out after about 1,000 hours. “The household lightbulb in 1924 was already technologically sophisticated: The light yield was considerable; the burning time was easily 2,500 hours or more. By striving for something less, the cartel would systematically reverse decades of progress. . . . [W]e found meticu-lous correspondence between the cartel’s factories and laboratories, which were researching how to modify the filament and other measures to shorten the life span of their bulbs. The cartel took its business of shortening the lifetime of bulbs every

234 Journal of Economic Perspectives
bit as seriously as earlier researchers had approached their job of lengthening it. Each factory bound by the cartel agreement—and there were hundreds, including GE’s numerous licensees throughout the world—had to regularly send samples of its bulbs to a central testing laboratory in Switzerland. There, the bulbs were thor-oughly vetted against cartel standards. If any factory submitted bulbs lasting longer or shorter than the regulated life span for its type, the factory was obliged to pay a fine.” IEEE Spectrum, October 2014, http://spectrum.ieee.org/geek-life/history /the-great-lightbulb-conspiracy.
Journal of Economic Perspectives—Volume 28, Number 4—Fall 2014—Pages 235–236
The Missing Middle
Chang-Tai Hsieh and Benjamin Olken argue that, contrary to received wisdom, there is no “missing middle” in the plant size distributions of develop-ing countries (“The Missing ‘Missing Middle,’” Summer 2014, pp. 89–108). They base their case on the fact that these distributions are unimodal in Indonesia, India, and Mexico. And they attribute the common perception of a missing middle to the focus of earlier studies on employment shares that have been constructed in a particular way.
I write to comment on two issues raised by their paper. The first is whether a general misperception about the shape of the plant size distribution can be traced to employment share figures. The second is whether the unimodal plant size distributions documented by Hseih and Olken really imply the absence of a missing middle.
The fifth section of their paper, titled “How Did the ‘Missing Middle’ Misconception Arise?” deals with the first issue. Here, Hseih and Olken char-acterize earlier studies of the missing middle as referring “to the fact that in most developing coun-tries, there is substantially lower employment share in the mid-sized category (that is, 10–49 employ-ees) than in either the small category (fewer than 10 employees) or the large category (50 or more employees).” This sets up their observations that 1) the relative share of the middle category reflects the size cutoffs that define it, and 2) when bins are constrained to have equal width, plant size distri-butions in Indonesia, India, and Mexico do not exhibit bimodal shapes. It further leads them to suggest that earlier studies erroneously inferred the existence of a missing middle because they over-looked these facts.
This is a coherent story, but Hseih and Olken do not tell their readers where in the literature this misperception can be found. They state only that “the main evidence typically cited for the missing middle is Table 1 of Tybout (2000).” However, that paper uses Table 1 solely to establish an emphasis on small-scale manufacturing in low-income coun-tries, and it makes no attempt to infer a missing middle from intracountry comparisons of employ-ment shares. I could be convinced otherwise, but sans supporting citations, I am disinclined to pre-sume a general confusion about the implications of the employment shares reported in my survey. Rather, I would venture that most people who ref-erence Tybout (2000) in the context of a missing middle discussion do so simply because it summa-rizes some of the relevant literature.
Let me turn now to the second issue. Hseih and Olken do not discuss whether unimodal distribu-tions disprove the missing middle; they take this as axiomatic. But in my view, the central thesis of the missing middle literature is not bimodality. Instead, it is that policies and market conditions in some developing countries have discouraged produc-tion at mid-sized firms, as opposed to small or large firms, relative to an undistorted plant size distribu-tion. By this definition, a missing middle is quite consistent with a unimodal shape, and the evidence presented by Hseih and Olken does not speak to the relevance of the earlier literature.
Of course, it is difficult to say what an undis-torted firm size distribution should look like, since low-income countries tend to have small firms for a variety of reasons that have little to do with distortions, including the mix of products they consume and their relatively low degree of urban-ization. But drawing on the firm size literature, it
Correspondence
To be considered for publication in the Correspondence section, letters should be relatively short—generally less than 1,000 words—and should be sent to the journal offices at [email protected]. The editors will choose which letters will be published. All published letters will be subject to editing for style and length.
236 Journal of Economic Perspectives
seems reasonable to approximate undistorted size distributions as Pareto. Then, allowing the shape parameter of this distribution to vary across coun-tries, and thus crudely controlling for the general tendency toward small-scale production in low-income regions, one can ask whether deviations from the Pareto shape imply a missing middle in the developing world. This exercise, repeated for a variety of countries, suggests they do. Details can be found in a short paper available online with this comment at http://e-jep.org. Using the same data as Hseih and Olken, I find mid-sized firms are underrepresented in India and Indonesia, while small and large firms are not. Further, I find the Pareto shape obtains in Mexico, which enjoys a substantially higher per capita income. And using additional data sources, I find an overrepresenta-tion of mid-sized firms in countries that are still more developed, including South Korea, Taiwan,
and (especially) the United States. Interestingly, despite its modest per capita income, China in 2004 also showed an overrepresentation of mid-sized firms, perhaps because its eastern provinces were already extraordinarily industrialized and much of its output was destined for high-income mar-kets. Admittedly, my assumption that undistorted distributions of firm size are Pareto is restrictive. But I think it is reasonable to conjecture that one would find similar cross-country contrasts in labor shares for the 10–50 worker category under a variety of other distributional assumptions. Accord-ingly, I am inclined to believe that the notion of a missing middle is empirically relevant after all.
James TyboutPennsylvania State UniversityState College, [email protected]

Please mention The Journal of Economic Perspectives when writing to advertisers237
N E M M E R S P R I Z E S
2 0 1 4 R E C I P I E N T
E R W I N P L E I N
N E M M E R S P R I Z E
I N E C O N O M I C S
J E A N T I R O L E Foundation Jean-Jacques
Laffont/Toulouse School of Economics and Institute for
Industrial Economics, University of Toulouse
Capitole
“for various contributions to economic theory and its application to finance,
industrial organization and behavioral economics”
THE TWELFTH
NEMMERS PRIZE IN
ECONOMICS WILL BE
AWARDED IN 2016
WITH NOMINATIONS
DUE BY DECEMBER 1 ,
2015 . FOR FURTHER
INFORMATION,
CONTACT:
OR
SECRETARY
NEMMERS PRIZES
SELECTION COMMITTEE
OFF ICE OF THE PROVOST
NORTHWESTERN
UNIVERSITY
633 CLARK STREET
EVANSTON, ILL INOIS
60208-11 19
U.S .A.
www.nemmers.northwestern.edu
THE ERWIN PLE IN
NEMMERS PRIZE
IN ECONOMICS
$200,000 AWARD
PRESENTED BY
NORTHWESTERN
UNIVERSITY
Previous recipients:
2012 DARON ACEMOGLU
2010 ELHANAN HELPMAN
2008 PAUL R. MILGROM
2006 LARS PETER HANSEN
2004 ARIEL RUBINSTEIN
2002 EDWARD C. PRESCOTT
2000 DANIEL L. MCFADDEN
1998 ROBERT J. AUMANN
1996 THOMAS J. SARGENT
1994 PETER A. DIAMOND

Please mention The Journal of Economic Perspectives when writing to advertisers238
HARDBACK $15.95 • EBOOK $9.99
AVAILABLE AT CATO.ORG/STORE AND BOOKSTORES NATIONWIDE.
Professor Hall has written a masterful treatise on how well-intended government policiescan have unforeseen side effectsthat reduce the general welfare ...and how economic theorymight be used to pre dict theseadverse consequences and design policies that minimizetheir impact.
“
“
—T. WINDSOR FIELDS Professor of Economics, James Madison University
N E W F R O M T H E C A T O I N S T I T U T E
Aftermath_JEP_BW.qxp_Layout 1 9/17/14 11:14 AM Page 1
The American Economic AssociationAttention
All
Students!
Take advantage of valuable information for students on the AEA website:
• Economic career options and earnings potential• Skills required for success in the �eld• Details about the �elds of study in economic thought• Descriptions and rankings of graduate programs/schools• Discussion on current issues in economics• Information on published scholarly resources you should know about• Job market research and job search process for economists
Check it Out! www.vanderbilt.edu/AEA/students
or www.vanderbilt.edu/AEA/gradstudents
*Maybe not everything . . . but it’s a great place to start!
*Everything You Need To Know…
About Economics for College Students

Please mention The Journal of Economic Perspectives when writing to advertisers239
This hiring season, take advantage of the AEA’s new enhanced JOE (Job Openings for Economists)
targeted to the comprehensive needs of all participants in the annual economics job market cycle.
The JOE Network automates the hiring process. Users share materials, communicate confidentially,
and take advantage of new features to easily manage their files and personal data. Everything is securely
maintained and activated in one location. The JOE Network is accessible right from your desktop at the
AEA website.
The new JOE Network fully automates the hiring process for the annual economics job market cycle.
Try the new JOE Network today!
• Manage Letter Requests
• Upload Custom or Default Letters
• Track Task Completion Status
• Assign Surrogate Access
• Minimize Time Investment
FACULTY
• Post and Manage Job Openings
• Search Candidate Profiles
• Manage Applications and Materials
• Collect Reference Letters
• Download Applicant Data
• Share Candidate Materials
EMPLOYERS
www.aeaweb.org/JOE
Experience the same great results with more features, more time savings, and a beginning-to-end process.
• Search and Save Jobs
• Create a Custom Profile
• Manage Your CV and Applications
• Get the Attention of Hiring Committees
• Apply for Multiple Jobs from One Site
• Request Reference Letters
JOB CANDIDATES
For:

Please mention The Journal of Economic Perspectives when writing to advertisers240
ASSAALLIED SOCIAL SCIENCE ASSOCIATIONS
OF THE
AMERICAN ECONOMIC ASSOCIATION(In conjunction with Allied Social Science Associations)
To be held in
BOSTON, MAJanuary 3–5, 2015
2015 Registration will open in mid-September
Come for the Annual Meeting . . .
. . . Stay for the Continuing EducationJanuary 5–7, 2015
2015 Continuing Education Program LecturersMonetary Policy
GAUTI B. EGGERTSSON Brown University JEFF FUHRER Federal Reserve Bank of Boston ELLEN McGRATTAN University of Minnesota
Health Economics JONATHAN GRUBER MIT ADRIANA LLERAS-MUNEY UCLA JONATHAN SKINNER Dartmouth College
Time Series Econometrics JAMES H. STOCK Harvard University MARK W. WATSON Princeton University
All previous year webcasts are also on our website atwww.aeaweb.org/cont_education/
MARK YOUR CALENDARS TODAY!
Webcasts of selected presentations from past ASSA events available at www.aeaweb.org/webcasts/index.php
The American Economic AssociationFounded in 1885
EXECUTIVE COMMITTEE
Elected Officers and MembersPresidentWILLIAM D. NORDHAUS, Yale University
President-electRICHARD H. THALER, University of Chicago
Vice PresidentsDAVID CARD, University of California at BerkeleyN. GREGORY MANKIW, Harvard University
MembersANIL K KASHYAP, University of ChicagoROSA L. MATZKIN, University of California at Los AngelesAMY N. FINKELSTEIN, Massachusetts Institute of TechnologyJONATHAN LEVIN, Stanford UniversityDORA L. COSTA, University of California at Los AngelesGUIDO W. IMBENS, Stanford University
Ex Officio MembersCLAUDIA GOLDIN, Harvard UniversityCHRISTOPHER A. SIMS, Princeton University
Appointed MembersEditor, The American Economic ReviewPINELOPI KOUJIANOU GOLDBERG, Yale University
Editor, The Journal of Economic Literature STEVEN N. DURLAUF, University of Wisconsin
Editor, The Journal of Economic PerspectivesDAVID H. AUTOR, Massachusetts Institute of Technology
Editor, American Economic Journal: Applied EconomicsESTHER DUFLO, Massachusetts Institute of Technology
Editor, American Economic Journal: Economic PolicyMATTHEW D. SHAPIRO, University of Michigan
Editor, American Economic Journal: MacroeconomicsJOHN LEAHY, New York University
Editor, American Economic Journal: MicroeconomicsANDREW POSTLEWAITE, University of Pennsylvania
Secretary-TreasurerPETER L. ROUSSEAU, Vanderbilt University
OTHER OFFICERSEditor, Resources for EconomistsWILLIAM GOFFE, Pennsylvania State University
Director of AEA Publication Services JANE EMILY VOROS, Pittsburgh
Managing Director of EconLit Product Design and ContentSTEVEN L. HUSTED, University of Pittsburgh
Assistant Secretary-TreasurerJOHN J. SIEGFRIED, Vanderbilt University and University of Adelaide
CounselTERRY CALVANI, Freshfields Bruckhaus Deringer LLP Washington, DC
ADMINISTRATORSAdministrative DirectorREGINA H. MONTGOMERY
Convention ManagerMARLENE HIGHT
Correspondence relating to advertising, business matters, permission to quote, or change of address should be sent to the AEA business office: [email protected]. Street address: American Economic Associ-ation, 2014 Broadway, Suite 305, Nashville, TN 37203. For membership, subscriptions, or complimentary JEP for your e-reader, go to the AEA website: http://www.aeaweb.org. Annual dues for regular membership are $20.00, $30.00, or $40.00, depending on income; for an additional fee, you can re-ceive this journal, or any of the Association’s journals, in print. Change of address notice must be received at least six weeks prior to the publication month.
Copyright © 2014 by the American Eco-nomic Association. Permission to make dig ital or hard copies of part or all of this work for personal or classroom use is grant-ed without fee provided that copies are not made or distributed for profit or direct commercial advantage and that copies show this notice on the first page or initial screen of a display along with the full citation, in-cluding the name of the author. Copyrights for components of this work owned by oth-ers than AEA must be honored. Abstract-ing with credit is permitted. The author has the right to republish, post on servers, redistribute to lists, and use any component of this work in other works. For others to do so requires prior specific permission and/or a fee. Per missions may be requested from the American Economic Association, 2014 Broadway, Suite 305, Nashville, TN 37203; e-mail: [email protected].
The following Statement of Ownership, Management and Circulation is provided in accordance with the requirements, as contained in 39 U.S.C. 3658. The Journal of Economic Perspectives is owned, managed and published by the American Economic Asso-ciation, a nonprofit scientific organization, located at 2014 Broadway, Suite 305, Nash-ville, Davidson County, TN 37203-2425. The Editor is Professor David H. Autor, Journal of Economic Perspectives, Department of Eco-nomics, Massachusetts Institute of Technol-ogy, 50 Memorial Drive E52-371, Cambridge, MA 02142-1347. During the preceding twelve months the average number of copies printed for each issue was 7,812; the average paid circulation, 6,086; the average free dis-tribution, 203; the average number of cop-ies distributed 6,286. Corresponding figures for May 2014, the issue published nearest to filing date: total number of copies printed, 7,269; total paid circulation, 5,756; total free distribution, 187; total distribution, 5,943.
Related Documents