THE JOKE’S ON YOU: THE EFFECTS OF DISPARAGING POLITICAL HUMOR ON YOUNG CITIZENS’ ATTITUDES AND BEHAVIORS Jason Adam Moldoff A dissertation submitted to the faculty of the University of North Carolina at Chapel Hill in partial fulfillment of the requirements for the degree of Doctor of Philosophy in the School of Journalism and Mass Communication. Chapel Hill 2010 Approved by: Anne Johnston Rhonda Gibson Sri Kalyanaraman Keith Payne Andrew Perrin

Welcome message from author
This document is posted to help you gain knowledge. Please leave a comment to let me know what you think about it! Share it to your friends and learn new things together.
Transcript

THE JOKE’S ON YOU: THE EFFECTS OF DISPARAGING POLITICAL HUMOR ON YOUNG CITIZENS’ ATTITUDES AND BEHAVIORS
Jason Adam Moldoff
A dissertation submitted to the faculty of the University of North Carolina at Chapel Hill in partial fulfillment of the requirements for the degree of Doctor of Philosophy in the School of Journalism and Mass Communication.
Chapel Hill 2010
Approved by:
Anne Johnston
Rhonda Gibson
Sri Kalyanaraman
Keith Payne
Andrew Perrin

ii
© 2010 Jason Adam Moldoff
ALL RIGHTS RESERVED

iii
ABSTRACT
JASON MOLDOFF: The Joke’s on You: The Effects of Disparaging Political Humor on Young Citizens’ Attitudes and Behaviors (Under the direction of Anne Johnston)
Two experiments were run to test whether young voters were susceptible to stereotype threat
effects under a variety of conditions. Results for Experiment 1 indicate that making the age
of young citizens salient before taking a political knowledge test did not affect their sense of
political information efficacy or performance. Making the diagnostic nature of the test salient
did result in a significant decrease in performance, but this difference was eliminated when
the age salience manipulation was also included. Results for Experiment 2 revealed a
significant 2-way interaction between the expectation of humor, exposure to disparaging
humor, and performance on the political knowledge test. Participants performed significantly
worse on the political knowledge test when they were unexpectedly exposed to humorous as
compared to non-humorous disparagement. Participants made to expect humor performed
significantly worse on the political knowledge test when they did not receive humor than
when they did receive humor. Implications for the study of political humor are discussed and
opportunities for future research are detailed.
iv
ACKNOWLEDGEMENTS
I grew up surrounded by humor. Whereas some children ask their fathers to read them
the same bedtime stories night after night, I cherished memorizing the jokes and stories my
father told, and just as importantly, the way he told them. I copied his mannerisms, the way
he set up his jokes, his pacing, and his vocal tones, all of which were key to a successful
delivery. Success in our family was making my mother give a high-pitched squeal while she
laughed, “I’m going to pee in my pants!” Mom was the barometer of what was funny and
what was an appropriate target for parody or ridicule. As part of our cultural upbringing, my
parents introduced my brother and I to Borscht Belt comedians like Mel Brooks. While I
didn’t realize it then, this style of humor taught us a valuable lesson: that comedy could be
used as a social corrective, to put down the abuser (e.g. Brooks’ constant mockery of the
Nazis) without taking up arms. Together, my parents raised two boys with strong values and
quick wits.
I am fortunate that humor continues to be an important part of my life, in my
scholarship, and in my relationships. To be able to study what you love is a precious gift for
which I am grateful. This project in particular benefited from the generosity of my doctoral
committee, led by my chair, Anne Johnston. Anne, thank you for sticking with me these past
three years: keeping me grounded and focused, and challenging me to express myself clearly
on paper. To Sri Kalyanaraman, your class on experimental design was undoubtedly the most
intense and worthwhile experience I had in the Journalism School. Learning to improve and

v
defend my research has made me a better scholar. Rhonda Gibson, thank you for your
support from Day 1 in so many ways and for being a fantastic editor. Keith Payne, the
theoretical justification for this research stems from the work I did in your Social Cognition
class. I am so proud to have you on my committee and thank you for helping make this
project successful. Andrew Perrin, thank you for taking a chance to serve on my committee. I
truly believe that this project and my future research will be improved because of the work I
did for your comprehensive exam question.
My thanks to Tab and Jon at Odum for their statistical assistance and to Scott Dunn
for being my mentor here and at Virginia Tech. Thank you to Cindy Anderson for your
masterful command of the graduate program. Thank you to my students in JOMC 101 and
240 for two enlightening and fulfilling semesters.
Finally, I am so blessed to have someone in my life that shares my love for learning
and laughter. To my wife, Talya: you are my social calendar, my therapist, and my tour
guide. Thank you for joining me in the foreign lands of western Virginia (Hokies?) and North
Carolina (Grits?) as we pursued our graduate degrees together. I don’t know where we’ll end
up next, but wherever it is, it’ll be home, and it’ll be funny.

vi
TABLE OF CONTENTS
LIST OF TABLES…………………………………………………………………………..vii LIST OF FIGURES…………………………………………………………………………...x Chapter
I. INTRODUCTION AND LITERATURE REVIEW….……………………………..….1
II. EXPERIMENT 1 METHOD…………….…………………………………….………34
III. EXPERIMENT 1 RESULTS………………………………………………………..…39
IV. EXPERIMENT 1 DISCUSSION………………………………………………………58
V. EXPERIMENT 2 METHOD…………………………………………………………...60
VI. EXPERIMENT 2 RESULTS……………………………………………………….…..63
VII. DISCUSSION………………………………………………………………………….84
APPENDICES…………………….…………………………………………………………92
REFERENCES……………………………………………………………….…………….104

vii
LIST OF TABLES
Experiment 1 Tables
1. Means and Standard Deviations for each Condition on the Dependent Variables..40
2. Means and Standard Deviations for each Condition on the Mediating Variables...40
3. Means and Standard Deviations for each Condition on the Moderating Variables.41
4. Summary of Multiple Regression Analysis for PIE Scores (N=63)………………43
5. Summary of Multiple Regression Analysis for Political Knowledge Scores (N=63)……………….…………………..………….44
6. Summary of Regression Analysis for Political Knowledge Scores (N=62)………46
7. Summary of Multiple Regression Analysis for PIE Scores (N=62)………………47
8. Summary of Multiple Regression Analysis for Political Knowledge Scores (N=62)…………….………………………………...49
9. Summary of Regression Analysis for PIE Scores (N=62)………………………...50
10. Summary of Regression Analysis for PIE Scores (N=62)………………………..50
11. Summary of Regression Analysis for Motivation Measure (N=68)………………52
12. Summary of Multiple Regression Analysis for PIE Scores (N=68)………………53
13. Summary of Multiple Regression Analysis for Political Knowledge Scores (N=68)…………………………..…………………...53
14. Summary of Regression Analysis for Political Knowledge Scores (N=67)………54
15. Summary of Multiple Regression Analysis for PIE Scores (N=67)………………55
16. Summary of Multiple Regression Analysis for Political Knowledge Scores (N=67)……………………………………………....55
17. Summary of Multiple Regression Analysis for
Political Knowledge Scores (N=130)……………………………………………56
18. Summary of Multiple Regression Analysis for Political Knowledge Scores (N=130)…………………………………...……….56

viii
19. Summary of Hypotheses for Experiment 1………………………………………57
Experiment 2 Tables
20. Summary of Multiple Regression Analysis for How Funny (N=118)..…………65
21. Summary of Multiple Regression Analysis for How Clever (N=118)….………66
22. Summary of Multiple Regression Analysis for How Confusing (N=118)……...66
23. Summary of Multiple Regression Analysis for How Negative (N=118)……….66
24. Summary of Regression Analysis for Humor Expectancy Score (N=118)……..67
25. Summary of Multiple Regression Analysis for Humor Expectancy (N=118)..…68
26. Means and Standard Deviations on Dependent Variables for each Condition….68
27. Means and Standard Deviations on Mediating Variables for each Condition…..69
28. Means and Standard Deviations on Moderating Variables for each Condition....69
29. Summary of Regression Analysis for Anxiety2 Scores (N=90)………………...73
30. Summary of Regression Analysis for Anxiety2 Scores (N=92)………………...73
31. Summary of Regression Analysis for Anxiety2 Scores (N=91)……………...…74
32. Summary of Regression Analysis for Anxiety2 Scores (N=91)………………...74
33. Summary of Multiple Regression Analysis for Political Knowledge Scores (N=118)…….………………………..…………..…75
34. Summary of Multiple Regression Analysis for PIE Scores (N=118)….………..75
35. Summary of Multiple Regression Analysis for Political Knowledge Scores (N=118)…………………………………………...76
36. Summary of Multiple Regression Analysis for PIE Scores (N=118)…………...76
37. Summary of Multiple Regression Analysis for PIE Scores (N=92)…………….77
38. Summary of Multiple Regression Analysis for Political Knowledge Scores (N=118)………….………………………………..78
39. Summary of Multiple Regression Analysis for PIE Scores (N=118)…………...78

ix
40. Summary of Multiple Regression Analysis for PIE Scores (N=118)………...…79
41. Summary of Multiple Regression Analysis for Political Knowledge Scores (N=118)…………………………………………...79
42. Summary of Multiple Regression Analysis for
Political Knowledge Scores (N=118)…………………………………………...80 43. Summary of Multiple Regression Analysis for
Political Knowledge Scores (N=59)…………………………………………….81
44. Summary of Multiple Regression Analysis for Political Knowledge Scores (N=59)…………………………………………….82
45. Summary of Multiple Regression Analysis for
Political Knowledge Scores (N=150)………………………………………...…82
46. Summary of Hypotheses for Experiment 2…………………………......……….83

x
LIST OF FIGURES
Experiment 1 Figures
1. Analysis of relationship between age salience, anxiety, motivation, and PIE scores……43
2. Analysis of relationship between age salience, anxiety, motivation, and political knowledge scores……………………………………………...45
3. Analysis of relationship between diagnostic salience,
anxiety, motivation, and PIE scores……………………………………………………..48
4. Analysis of relationship between diagnostic salience, anxiety, motivation, and political knowledge scores……………………………………51
Experiment 2 Figures
5. Graph of mean political knowledge scores by condition…………………………….…70
6. Graph of mean PIE scores by condition………………………………………………...70

1
CHAPTER I
INTRODUCTION AND LITERATURE REVIEW
Every once in a while, a news story appears that includes the results of a survey
showing some startling findings about the lack of political knowledge among Americans in
general, and young Americans in particular. For instance, several media outlets picked up on
a Pew Research report released in 2007 that found only 61% of Americans age 18-29 could
name the vice-president (Pew, 2007), while in the lead-up to the invasion of Iraq in 2003, a
widely cited National Geographic-Roper survey reported that only 13% of young people
could locate Iraq on a map (National Geographic, 2002).
News coverage of young voters as poorly informed continued through the 2008
presidential campaign. In an opinion piece for The Tundra Drums, an Alaskan newspaper,
Richard Brake reported that a political knowledge survey found, “our future voters and
leaders are graduating with little knowledge about how our system works and how it has
performed over time” (Brake, 2008, para. 13). Among the statistics cited, Brake noted that
less than half the college-age respondents knew the meaning of federalism, while “fewer than
40 percent knew the basics of monetary and fiscal policy.” (Brake, 2008, para. 14). As part of
a segment on the television show 20/20, host John Stossel conducted an informal survey and
came to the conclusion that “many of the young voters didn’t seem very informed,” leading
him to propose that perhaps uninformed voters should stay away from the polls on Election
Day (Stossel, 2008).

2
In addition to news and editorial coverage, the stereotype of young voters as
politically uninformed figures prominently in the entertainment media. Americans seems
fascinated with the seeming idiocy of their countrypersons. There are popular television
programs and late-night segments dedicated to fulfilling our desire to poke fun at the not-so-
bright side of all of us (e.g., Are You Smarter than a Fifth Grader, Jaywalking segment on
The Tonight Show with Jay Leno and The Jay Leno Show). One of the most popular outlets
for political information amongst young people, The Daily Show with Jon Stewart, has
repeatedly mocked young people for their lack of knowledge and engagement.
For instance, on February 28th, 2008, in a segment called “Trendspotting-
Youthquake,” Demetri Martin interviewed Itay Hod from CBS News about the tactics
political candidates need to use to reach young voters. Had says that as opposed to speaking
logically and rationally to young voters about issues, “the more graphics you have on the
screen, the more appealing it is to kids” (Stewart, 2008). Additionally, candidates need to
“learn how to speak their language,” which according to Had includes saying “What’s up?”
instead of “Hey, you’ve got to vote for Obama” (Stewart, 2008). The scene then shifts to a
group of “correspondents” as they relentlessly and fruitlessly ask young people at a bar about
their political opinions (Stewart, 2008).
It seems commonplace now for news and entertainment programming to address or
poke fun at young voters’ low levels of political knowledge. While there are a few studies on
the effects of late-night humor about politicians on young voters’ attitudes (e.g.,
Baumgartner, 2007; Baumgartner & Morris, 2006; 2008; Young; 2004; 2006), there is little
research to date examining the effects of political humor about young voters on young voters.
Articles written by young people during the election indicate an awareness of the way their

3
age group is portrayed in the press and perceived by the public. In an opinion piece to the
Raleigh News and Observer, Ph.D. student Justin Martin noted, “Oh, how common are
lamentations about young Americans’ lack of political knowledge. Young people in this
country, we often hear, are abysmally uninformed and would rather punch messages on i-
Phones, listen to MP3s or hit bunker shots on a Wii than consume political news” (Martin,
2008, para. 1). Richard Wood, a columnist for the University of South Carolina’s paper The
Daily Gamecock, wrote, “What good is it to encourage young people to vote if they don’t
know much about the candidates or their positions? Or what if they lack an even more basic
knowledge of how American government works?” (Wood, 2008, para. 3). While these
anecdotes are interesting, little systematic evidence exists to determine if or how negative
portrayals of young voters in humorous and non-humorous outlets affect young voters. This
research seeks to fill that void in the literature.
For political scientists and scholars of political communication, the representation of
voters as politically inept has serious implications. Delli Carpini (1999, p. 6) argued that the
continued recitation of the notion of an ill-informed public has detrimental effects:
Books such as Allan Bloom’s The Closing of the American Mind (1987), Diane Ravitch’s and Chester Finn’s What Do Our 17-Year-Olds Know? (1987), and E. D. Hirsch’s Cultural Literacy (1988) have also contributed to our negative image of the American public.1 Indeed, D. Charles Whitney and Ellen Wartella conclude that a ‘virtual cottage industry has arisen in the past few years in making out the American public as a bunch of ignoramuses’ (1989, p. 99). This characterization is so well-established that, according to John Ferejohn, ‘Nothing strikes the student of public opinion and democracy more forcefully than the paucity of information most people posses about politics’ (Ferejohn, 1990, p. 3).
1 Three more recent examples of these books are Richard Shenkman’s Just How Stupid Are We? (2008), Mark Bauerlein’s The Dumbest Generation (2008), and Susan Jacoby’s The Age of American Unreason (2008).

4
As a review of the literature will attest, many scholars are particularly concerned
about the effects of political humor on young voters, as this generation increasingly turns to
late-night comedy for political information. In a national survey conducted by the Pew
Internet and Life Project (Pew, 2004), 44% of young people ages 18-29 reported at least
sometimes if not regularly learning about the presidential campaign and the candidates from
late-night shows such as The Late Show with David Letterman or The Tonight Show with Jay
Leno, while 50% of this age demographic reported the same for comedy shows such as The
Daily Show with Jon Stewart or Saturday Night Live. As young voters are exposed to
disparaging humor about their age group, they may come to learn how little is expected of
them. The question is whether exposure to disparaging political humor has different effects
on young voters’ attitudes and behaviors than exposure to non-humorous disparagement or
whether either has any effect at all.
This research tested whether exposure to nearly identical disparaging messages told
in a humorous or non-humorous manner had different effects on young voters’ political
attitudes and performance on a political knowledge test, using the growing psychological
literature on stereotype threat (Steele & Aronson, 1995) as its theoretical foundation. This
theory states that when presented with threatening information about the stereotypical
inability of one’s group to perform a skill, one tends to perform in accordance with that
stereotype to a greater degree than one would without exposure to the threat. While young
people are disparaged for performing poorly on political knowledge tests, this research
sought to determine if exposure to such disparagement actually causes poor performance.
Young voters’ level of political knowledge is an important object of study because it is

5
strongly correlated with positive civic outcomes, including voting (Delli Carpini & Keeter,
1996).
One of the reasons why performance may decrease upon exposure to disparaging
messages may be due to decreased self-esteem. There is some research to suggest that one of
the reasons young people do not vote in greater numbers is that they lack political
information efficacy, or the feeling that they know enough to participate in politics. Using
national survey data from 2000 and 2002, Kaid, McKinney, and Tedesco (2007) found that
confidence in one’s level of political knowledge accounted for a small but significant amount
of the variance (between 6% and 10%) in determining whether a young voter would turn up
at the polls. Therefore, this research examined the effects of exposure to disparaging
messages on political information efficacy.
Although young voters are disparaged in humorous and non-humorous outlets for
their often unreliable, uninspired and uninformed civic behavior, little evidence exists that
this disparagement causes apathetic attitudes or inhibits civic participation. To understand
why these portrayals could affect young voters, one first needs to understand the literature on
the effects of political humor. Second, to test whether messages about young voters’ low
levels of political knowledge affect their attitudes and behaviors, one must review the
literature on stereotype threat.
Political Humor
Throughout recorded history, the effects and functions of humor have been the
subject of great debate. As young voters turn to late-night shows for political information,
scholars continue to study the effects of political humor. How large or negative an influence
is exposure to political humor on democracy in general or on young voters in particular?

6
Plato (Philebus 48-50, cited in Morreall, 1987, p. 11) argued that laughter and humor
provide us with feelings of superiority that rational humans should not experience. In
laughing at politicians’ mistakes or at the foibles of the press, we erroneously imagine
ourselves to be better persons. The superiority theory of humor, as it is referred to in the
literature, gained prominence in the work of Thomas Hobbes. In summary of his treatise, he
wrote, “the passion of laughter is nothing else but the sudden glory arising from some sudden
conception of some eminency in ourselves, by comparison with the infirmity of others, or
with our own formerly…” (Hobbes, 1840, summarized in Morreall, 1987, p. 19). One of the
main criticisms of contemporary political humor is that the targets of ridicule are often
elected officials or government institutions, and exposure to this type of humor may create a
cynical, distrustful, or perhaps apathetic citizenry. Hart and Hartelius (2007) argue that Jon
Stewart in particular makes being cynical popular. Through mockery of the political system,
Stewart invites viewers to unite behind his anti-political diatribes. As a unified group of
cynics, his audience holds an imagined sense of superiority over the political sphere they
mock. It is quite plausible that people who watch late-night political humor shows enjoy the
camaraderie and feelings of superiority associated with the constant disparagement of the
political process at the expense of more positive civic participation.
There is scant empirical data about the effects of political humor on political attitudes.
The studies that do exist often employ surveys, thus leaving open the issue of causality. In an
exploration of political humor on the Internet, Baumgartner (2007) had survey participants at
two universities answer questions about their use of Internet humor sites (e.g., jibjab.com)
and their attitudes about politics and government. He found that participants who reported
visiting these sites regularly were more likely to express feelings of political distrust.

7
Whether exposure to political humor caused these feelings could not be determined through
use of a survey.
There are some experiments that purport to show negative effects of political humor
on citizens’ attitudes. Baumgartner and Morris (2006) randomly assigned participants to
watch either eight minutes of edited jokes or news about President George W. Bush and John
Kerry or no video (control group). The authors found that exposure to jokes about
presidential candidates made participants more cynical, and paradoxically, more efficacious
about politics. The weakness of this design is that the degree of equivalence between the two
stimuli is questionable. It is unclear what about the humorous material affected the
participants. Among the potential factors are the messages themselves, the presence of
audience laughter, and the expectation of humor that comes with attention to late-night
shows. Baumgartner and Morris (2006) note that the degree of equivalence is merely
“adequate” (p. 348).
Similarly, Baumgartner and Morris (2008) had participants answer questions about
their attitudes towards both political parties after watching a series of clips of either The
Colbert Report (TCR), the show it was fashioned after, The O’Reilly Factor, or watching no
clips (control group). While the subject of the clips was similar between the two programs,
the language, delivery and technical features of the clips contained numerous differences.
Still, noting a significantly higher level of self-reported trust in Republicans after viewing a
series of clips from TCR as opposed to the no video control group, the authors surmised that,
“Exposure to TCR is positively associated with one’s tendency to agree that they trust the
Republicans in Congress to do the right thing” (p. 632). As should be evident, it is not
necessarily the show itself that causes these attitudes but the types and topics of humor

8
present on late-night shows, along with variables such as audience laughter, visual cues, and
humor expectancy.
In addition to creating a culture of cynicism, critics of humor note that disparaging
jokes often rely on stereotypes, and thus contribute to misunderstandings and social division
(Berger, 1993). Janes and Olson (2000) provide a general definition of disparagement humor
as “any humor that derogates or provides negative information about someone or something”
(p. 474). Ferguson and Ford (2008) define disparaging humor as, “remarks that (are intended
to) elicit amusement through the denigration, derogation, or belittlement of a given target
(e.g., individuals, social groups, political ideologies, material possessions) (pp. 283-284). The
comic conception of groups based on exaggeration and caricature is theorized to likely
continue to foster the “isms” of race, class, gender, age and American isolation (Ross &
York, 2007). If this is correct, then exposure to disparaging humor about their age group may
influence young citizens’ self-perception, though prior to the present research little empirical
evidence exists to support this idea.
Most of the research in this area examines the effects of disparaging humor about
others on one’s attitude towards the group being disparaged. For instance, Olson, Maio and
Hobden (1999) found virtually no relationship between exposure to disparaging humor and
the accessibility or extremity of stereotypical beliefs as compared to exposure to neutral
humor or non-humorous disparagement, although the targets of the humor in their
experiments were socially accepted as powerful, men and lawyers. However, Ford and
Ferguson (2004) found that exposure to disparaging humor resulted in an increased
acceptance of discrimination, particularly for people already prejudiced in some way.

9
Contemporary critics also argue that in addition to creating cynical citizens, laughing
about society’s problems may release the energy needed to motivate people to actually solve
them (Purdie, 1993). According to the relief or catharsis theory of humor, most commonly
attributed to the work of Sigmund Freud (1905/1960), humor serves as a means of expressing
hostile feelings in a socially acceptable manner. Laughter and smiling, the physical
manifestations of the enjoyment of humor, are physiological responses to the dissipation of
psychological tension. It is possible that following these cathartic responses to humor, people
are less inclined to give serious thought to the substance of the message behind the jokes.
Therefore, laughing at disparaging humor about oneself or a group to which one belongs
might diminish the recipient’s motivation to take any action to correct whatever fault was
highlighted in the joke.
However, data indicate that rather than giving up on politics, citizens exposed to late-
night political humor are likely to subsequently seek out more traditional news coverage.
Feldman and Young (2008) examined a series of cross sectional surveys from the National
Annenberg Election Survey (NAES) to assess the relationship between late-night viewership
and traditional news viewership. After controlling for demographic variables, the researchers
found increased attention to late-night humor (Leno, Letterman, or The Daily Show) was
positively associated with a subsequent increase in attention to traditional campaign
coverage. Young and Tisinger (2006) and Cao and Brewer (2008) reported similar findings
using Pew and NAES data, respectively.
In an experiment, Xenos and Becker (2009) tested whether exposure to humorous
information about an issue resulted in greater information-seeking behavior or learning than
exposure to a “more serious” version of that information. Subjects watched a 5-minute clip

10
constructed by the experimenters from nightly newscasts about the troop surge in Iraq, and/or
a 5-minute clip from The Daily Show that “featured much of the same footage” as the news
broadcasts (Xenos & Becker, 2009, p. 321). Participants were then given the opportunity to
use a web browser to read stories about Iraq and foreign policy, domestic issues, sports, or
entertainment after watching the clip. Participants who watched the comedy clip tended to
spend more time reading stories about Iraq and foreign policy than the other groups, leading
the authors to give moderate support to the idea that humor can act as a gateway to greater
information seeking. However, once again the degree of equivalence between the two sets of
stimuli is questionable.
Not all philosophers and scholars see humor as detrimental to democracy and
discourse (For a review of philosopher’s thoughts on humor throughout the 18th and 19th
centuries, see Morreall, 1987). For example, Kant (1892/1987) argued that rather than
attending to humor to feel relieved of the need to act or to feel good about oneself in relation
to others, people are often amused and prone to laughter when contrary or seemingly
incompatible ideas are juxtaposed. The incongruity theory of humor posits that laugher
results from a violation of expectations, which may be manifest in surprise, in wordplay, or
in creative juxtaposition. Contemporary proponents of political humor argue that in attending
to comedic messages, people are engaging in creative and critical thinking, exploring new
ways of understanding the world, and may, as a result, find themselves motivated to learn
more or engage with the issue involved (Bennett, 2007; Hariman, 2007; 2008). For instance,
when Jon Stewart plays a series of edited video clips of politicians making contradictory
statements side by side, the audience may learn while it laughs. While the lesson learned
from exposure to such a series of clips might influence one’s opinions of a particular

11
politician in a negative manner, the act of learning from political humor can be a positive
democratic outcome.
The idea that exposure to political humor can lead to positive outcomes such as
increased political knowledge has received some attention in the form of survey research. In
2004, the Annenberg Public Policy Center found that survey respondents who indicated
watching The Daily Show in the week prior answered an average of 3.59 out of six political
knowledge questions correctly, as compared to 2.62 for people who watched no late-night
shows that week, and 2.91 and 2.95 for those who reported watching Letterman and Leno,
respectively (NAES, 2004). Similarly, a 2007 report from Pew found that 54% of regular
Daily Show viewers scored in the high knowledge group (answering at least 15 out of 23
political knowledge questions correctly), as compared with 35% of the general population,
38% of regular network news viewers, and 43% of regularly daily newspaper readers (Pew,
2007). Using Pew data, Cao (2008) found that young people who regularly watched late-
night shows scored modestly higher on the political knowledge questions than non-regular
viewers. However, the four “political knowledge” questions pulled from the Pew data dealt
with candidate familiarity more than knowledge per se. Also using Pew data, Hollander
(2005) found that viewing late-night programming contributed a small degree to recognition
but not recall of campaign information. It is unclear from these survey data the degree to
which watching late-night humor caused an increase in political knowledge or whether those
who scored higher on such tests tended to watch these shows.
There are other reasons to believe that humor can be a powerful force for good. In
bringing to light the incongruities in politics, humor can show us the way life ought to be.

12
Nachman (2004) details the careers of comedians such as Mort Sahl and Lenny Bruce, who
challenged the status quo in the 1950s and 1960s with their aggressive brand of humor.
Satirists maintain a critical distance from the newsmakers often too familiar with ways of
manipulating the traditional press (Baym, 2005, p. 265). In the words of author Murray
Davis, “Satire, in short, focuses on social units that fall short of their ideal” (Davis, 1993, p.
219). In Peterson’s (2008) opinion, satire can “raise awareness,” “function as democracy’s
feedback loop,” and “sound the alarm” about problems with its targets, be they the
government, private industry, the press, or members of the public (p. 19). Similarly, Gray,
Jones, and Thompson (2009) argue that satire is “provocative” and “empowering” (p. 13).
Furthermore, while not everyone is interested in understanding the finer points of political
arguments, many people can enjoy and engage in political humor, thus broadening the public
sphere to include voices and audiences that otherwise would be disenfranchised (Hariman,
2008).
Contemporary scholars of political communication and political science remain
divided over whether exposure to political humor benefits or harms positive democratic
outcomes such as level of political knowledge, political attitudes, or voting intention.
According to the relief theory, people expend their energy being entertained instead of being
active in the expression of hostility through laughter, while the superiority theory predicts
that humor is a likely cause of citizen apathy and disdain for politics and a source of social
divisions. On the other hand, the incongruity theory posits that exposure to political humor
can increase political knowledge.
There is some evidence from surveys and experiments that exposure to political
humor is associated with and perhaps increases both political knowledge and political

13
information-seeking behaviors. There is scant yet mixed evidence about the effects of
exposure to political humor on attitudes towards politics and one’s own ability to affect
change.
The majority of the research on the subject is based on survey data, leaving open the
question of whether exposure to political humor affects political knowledge or political
attitudes or whether these variables influence people’s interest in and exposure to political
humor. Additionally, the stimuli used to assess the effects of political humor in experimental
research tend to have numerous differences in their humorous vs. non-humorous stimuli,
making comparisons between groups suspect.
Next, studies about the effects of political humor fail to take into account the idea that
people tend to approach humor with a different mindset. In other words, when people tune in
to political humor, they are more likely to expect to be entertained. Wouldn’t the effect of
humorous messages about young citizens or politicians be different if the humorous intent of
the speaker was cued in advance? If a humorous mindset leads to dismissal of disparaging
messages, then negative portrayals of groups on late-night humor programs may not be as
harmful as originally thought.
Humor Expectancy
Literature in psychology suggests that expectations can influence the way information
is interpreted and even unconsciously taken in through the senses (e.g., Balcetis & Dunning,
2006). For instance, according to the Affective Expectation Model (Wilson, Lisle, Kraft &
Wetzel, 1989), our beliefs about how much we will like or dislike an impending event are
key determinants of how we experience and interpret the event. Unless a discrepancy

14
between expectation and reality is noticed, people will assimilate their attitudes in line with
their expectations. (Geers & Lassiter, 2005).
Similarly, it is thought that people engage in different types of information processing
when cues about the impending presence of humor are evident. Research indicates that
people may disregard a message that is unclear or incongruous when made to interpret that
information in a playful way (McGhee, 1972). Likewise, any perceived threat can be
interpreted playfully and dismissed when the humorous mindset is activated (Zillmann,
1983). Research by Pexman and colleagues (Katz & Pexman, 1997; Pexman & Olineck,
2002) found that information was more likely to be interpreted ironically if presented from a
humorous source. Similarly, Nabi, Moyer Guse, and Byrne (2007) found that messages about
social issues purportedly from comedian Chris Rock were judged to be funnier than the same
messages from an anonymous source. Increased perception of humorousness resulted in
reduced counterarguing, deeper processing and increased message discounting as reported in
post-test measures.
This research adds to the literature on the effects of humor expectancy. Cues that
forthcoming information will be humorous will affect how information is processed in at
least three measurable ways. First, the expectation of humor will result in an increased desire
to “get the joke,” thus leading people to give the information that follows greater attention.
Second, people expect humor to be “based on truth,” and thus will tend to accept the
message’s underlying meaning with less counterarguing than they would without the
expectation of humor. Third, people made to expect humor will be more likely to dismiss
threatening information as “just a joke.” Concerns about the negative effects of political
humor, in this case disparaging humor about young people, may be supported if people are

15
shown to give greater attention and credence to information that they believed was going to
be funny, and negated if it is shown that the expectation of humor reduces or eliminates the
impact of the message on political attitudes and behaviors through message dismissal.
Finally, little research to date has assessed the effects of humor about young voters on
young voters. It seems plausible that the type of humor most likely to affect young voters’
political attitudes and voting intentions would be that which addresses young voters’ ability
to function as proper citizens. As newcomers to the world of political participation, young
voters may be particularly influenced by negative humor about their age group. Hertlzer
(1970) wrote that, “When newcomers are in the process of assimilation in a new community
of society, the individuals try to avoid being laughed at because of their ignorance or
clumsiness” (pp. 162-63).
Stereotype Threat
One way to test whether messages about a group of people affect members of that
group is through a theory called stereotype threat. Stereotype threat theory (Steele, 1997;
Steele & Aronson, 1995) posits that when one’s membership in a negatively stereotyped
group is made salient, one tends to inadvertently confirm the stereotype. Stereotype threat
theory builds off research in social identity theory (Tajfel & Turner, 1986), which predicts
that when a group to which one belongs is threatened by comparison with a superior group,
one actively works to minimize the negative and restore positive in-group distinctiveness.
Stereotype threat theory states that this added motivation and stress actually inhibit
performance. Acknowledgement of the threat to one’s identity tends to result in a self-
fulfilling prophecy. Self-fulfilling prophecies occur when “people hold expectancies that lead
them to alter their behavior which in turn causes the expected behaviors to be exhibited by

16
people who are targets of the expectancies” (Hilton & von Hippel, 1996, p. 244). In other
words, people behave in accordance with the salient expectations of how they will behave.
The most frequent subjects of stereotype threat research are women and minorities.
There exists an “achievement gap” in applied settings between how these groups perform in
comparison to men and white people, respectively. For instance, the initial study (Steele &
Aronson, 1995) focused on the stereotype that African Americans do not perform as well on
IQ tests as their white counterparts. Researchers are interested in identifying the causes of
these gaps and any remedies for reducing them. The stereotype of young voters also has
applied and as yet unexplored implications. This research will examine if young voters
experience stereotype threat effects when exposed to political humor about their
stereotypically low levels of political knowledge.
While there are scattered criticisms of the theory, particularly in the way results are
reported in the press (e.g., Sackett, Hardison, & Cullen, 2004) and general real world
applicability (e.g., Cullen, Hardison, & Sackett, 2004; Cullen, Waters, & Sackett, 2006), the
majority of articles serve as extensions and refinements of the original study (Steele &
Aronson, 1995). Sometimes journalists report that the gap between, say, African Americans
and Caucasian Americans is eliminated in the absence of stereotype threat, or that the
removal of stereotype threat would be a panacea for the stereotyped group. The research
tends to more specifically indicate only that the stereotyped group performs better than it
does in the absence of that threat. In other words, the gap between the performance of the
stereotyped and the majority group often still exists in the absence of threat, though it may be
reduced. Furthermore, scholars readily acknowledge that there are larger societal issues at
play that cause these stereotypes to exist. Similarly, it is unclear whether or how frequently

17
people are primed about or asked to give information about their affiliation with a
stereotyped group before taking tests such as the SAT, GRE, etc., leading skeptics to
question the generalizability of the studies’ findings. Even with these criticisms
acknowledged, what Steele and Aronson (1995) found, and researchers in the fields of
gender (e.g., Cadinu, Maass, Lombardo & Frigerio, 2006; Marx & Stapel, 2006; McGlone,
Aronson & Kobrynowicz, 2006), race (e.g., Shih, Ambady, Richeson, & Fujita, 2002; Stone,
Lynch, Sjomeling, & Darley, 1999), and age (senior citizens) (e.g., Abrams, Eller, & Bryant,
2006; Andreolleti & Lachman, 2004; Chasteen, Bhattacharyya, Horhota, Tam, & Hasher,
2005) have confirmed, is that stereotype threat can create a significant amount of variation in
performance on measures where people feel threatened about what their performance will say
about themselves and their group.
The vast majority of studies on stereotype threat examine the effects on performance
on math tests. Among the other dependent variables used in stereotype threat research are
scores on social sensitivity in men (Koenig & Eagly, 2005), political knowledge in women
(McGlone et al., 2006), ability to balance (Chalabaev, Stone, Sarrazin, & Croizet, 2008) and
performance at soccer (Chalabaev, Sarrazin, Stone, & Cury, 2008) and golf (Stone et al.,
1999; Stone & McWhinnie, 2008).
The way threat is manipulated in stereotype threat research varies widely. For
instance, Steele and Aronson (1995) had half of their African American participants select
their race from a list before beginning their math test, thus subtly making that part of their
identity more salient. Having participants select their age (“18-24/young voter”) prior to
taking part in a political knowledge test may similarly make that part of their identity more
salient, resulting in a decrease in performance. Other ways of inducing feelings of threat

18
include having women take a test with a group of men present (Inzlicht & Ben Zeev, 2000),
placing a derogatory cartoon about women’s math skills in the room with women as they
took a test (Oswald and Harvey, 2000/2001), and varying the race and gender of the
experimenter (Marx & Goff, 2005; Stone & McWhinnie, 2008).
Another way of creating threat is by telling participants that the test they are about to
take is a powerful and reliable diagnostic tool, one whose results will reveal something
important about the test taker. By increasing the perceived diagnosticity of the test, theorists
argue that stereotype threat effects are more likely to occur (Frantz, Cuddy, Burnett, Ray, &
Hart, 2004; Kray, Thompson, & Galinsky, 2001; Marx, Stapel, & Muller, 2005; Steele &
Aronson, 1995).
Although the results continue to be replicated, the precise mechanisms of the theory
remain unclear. This review details several of the purported mediators and moderators of
stereotype threat effects. Although calls for greater attention to the mediating factors in
stereotype threat research are often made, studies employing mediational designs produce
non-significant or even contradictory results (Smith, 2004). Generally, theorists take the
position that task achievement is challenged when people are cognitively or affectively
occupied. In their summary of the literature, Schmader, Johns, and Forbes (2008) note that
whatever the mechanism (e.g., stress, self monitoring, counterarguing), the underlying
phenomenon causing inhibited performance may be a reduction in working memory capacity.
One of the most frequently used mediators examined in stereotype threat research is
anxiety. It would seem that the natural and most observable response to a threat would be
anxiety. However, as frequently as it is used, results indicate a lack of consistent evidence
that self-reported anxiety levels mediate stereotype threat effects (Aronson, Quinn, &

19
Spencer, 1998; Osborne, 2001; Spencer, Steele, & Quinn, 1999; Steele & Aronson, 1995;
Stone et al., 1999). For instance, Aronson et al. (1998) found that although participants in a
stereotype threat condition did perform worse on a math test than participants in a no threat
condition, there was no difference in the level of state anxiety between conditions. However,
Osborne (2001) found that controlling for state anxiety did reduce the differences in scores
between black and white math test takers and also between male and female test takers.
Although not frequently used as a mediator in stereotype threat research, message
counterarguing may cause performance detriments. In accordance with the working memory
model, counterarguing increases cognitive load thus leading to decreased performance on a
task requiring cognition (For research on cognitive load manipulation effects, see for
example Gilbert & Hixon, 1991; Pontari & Schlenker, 2000).
Another mediator of interest is motivation/effort (Aronson et al., 1999; Beilock,
Rydell, & McConnell, 2007; Jamieson & Harkins, 2007; Osborne, 2007; Schmader & Johns,
2003; Stone, 2002). On the one hand, decreased effort may be a sign of self-handicapping
(Stone, 2002). People may give up on a task as a means of protecting themselves from the
possibility of performing poorly on a task that is important to their identity. Stone (2002)
found that participants who cared about sports practiced golf swings for an upcoming task for
far less time when under stereotype threat.
Too much motivation can also inhibit performance, through what is commonly
referred to as “choking” (Baumeister, 1984). Although it might seem that trying harder on a
test would correlate with higher test scores, some researchers posit that too much pressure to
act appropriately or diminish the feeling of threat can interfere with optimal performance, as
when a basketball player misses clutch free throws.

20
The final mediator of interest to the present research is attitudes about the self, in this
case political information efficacy. However, in prior research self-esteem was not found to
mediate the relationship between stereotyping and performance detriments in elderly people
(Levy & Langer, 1994) or between gender and performance on a math test (Heatherton &
Polivy, 1991).
In addition to mediating variables, scholars are interested in understanding the
individual differences that predict how people will react to stereotype threat. The moderators
of most interest here are the related concepts of group and domain/topic identification, belief
and awareness of the stereotype, and overall efficacy. Domain identification refers to the
degree to which a person feels that the topic or issue being stereotyped is important to his or
her sense of self. For instance, performance on a math test may be a more important domain
for some people than for others. Some research indicates that stronger identification with a
group or domain/topic being threatened will result in more dramatic effects (e.g., Aronson et
al., 1999; Luhtanen & Crocker, 1992; Schmader, 2002; Smith & White, 2002). However,
other research indicates that simply priming or exposing individuals to cues about groups
with stereotypes can influence individuals’ behavior in accordance with that stereotype (e.g.,
Ambady, Pail, Steele, Owen-Smith, & Mitchell, 2004; Bergeron, Block, & Echtenkamp,
2006; Levy, 1996). These studies find that one does not necessarily need to belong to or feel
a close sense of affiliation with a stereotyped group or domain for effects to occur. In terms
of belief and awareness of the stereotype, research does indicate that being “chronically self
conscious” of the stereotype in question may moderate the strength of stereotype threat
effects (Brown & Pinel, 2003; Pinel, 1999). Finally, one’s overall sense of confidence, or

21
efficacy (Schwarzer & Jerusalem, 1995) may influence the way that stereotype threat effects
influence a person’s attitudes or behaviors.
As noted, the most frequently used dependent variable in stereotype threat research is
performance on a math test. The present research focuses on political knowledge as its
outcome variable of interest, though it is not the first to do so (McGlone et al., 2006). If
stereotype threat is found to affect young voters’ attitudes and performance on a political
knowledge test, then interventions could be designed to prevent or reduce these effects. For
instance, stereotype threat effects can be reduced by having people think about what makes
them an individual, separate from the group (Ambady et al., 2004). McGlone et al. (2006)
determined that having women focus on another part of their identity (e.g., where they were
from) reduced the effects of stereotype threat. If political knowledge and attitudes are
affected by negative portrayals of young voters, it is possible that encouraging newcomers to
the political sphere to think of themselves in terms other than “young voters” may reduce
stereotype effects.
Stereotype threat research is related to a larger stream of inquiry in psychology,
wherein subjects’ attitudes and behaviors are influenced by exposure to subliminal or
supraliminal information. It is argued that information that precedes an object or behavior
can “prime” the way one feels toward that object or conducts that behavior. The outcomes
may change in accordance with the prime (e.g., performing better on a knowledge test after
being primed with “professor”), or in opposition to the prime (e.g., performing worse on the
test after being primed with “Einstein”). Attitudinal or behavioral assimilation is said to
occur when people’s attitudes or behaviors are found to be in closer alignment with the
prime. On the other hand, when people’s behavior is diametrically opposite from that

22
expected by exposure to a prime, contrast effects are said to have occurred (Dijksterhuis,
Spears, Postmes, Stapel, Koomen, von Knippenberg, & Scheepers, 1998). Research indicates
that exposure to trait primes or stereotypes (professor) often leads to assimilation effects
(better performance, e.g., Bargh, Chen, & Burrows, 1996), whereas exposure to exemplar
primes (Einstein) leads to contrast effects (worse performance, e.g., Dijksterhuis et al., 1998).
The present research contributes to the literature on assimilation effects by testing whether
general stereotypical information about young voters’ stereotypical low levels of political
knowledge affects their behavior in accordance with that stereotype.
Political Knowledge and Political Information Efficacy
Virtually every journal article and book chapter dealing with political knowledge
includes a statement about the importance of this concept as an indicator of a healthy
democracy. For instance, Berelson, Lazarsfeld and McPhee (1954) argued, “The democratic
citizen is expected to be well-informed about political affairs. He is supposed to know what
the issues are, what their history is, what the relevant facts are, what alternatives are
proposed, what the party stands for, what the likely consequences are” (p. 308). According
to this early philosophy, it is imperative that as proper citizens, people be as well informed
about as many issues as possible.
When we say that someone is politically knowledgeable, what do we mean? As
Shenkman (2008) argues “If, say, half the respondents do not know that the Constitution was
drafted in Philadelphia, as happens to be the case, does that entitle one to conclude that The
People are stupid? Or is a higher percentage required –say, 51 percent? And if we are to
grade the public in this manner, what shall we say constitutes a passing or failing grade?”
(p.16). Mondak and Davis (2001) offered four “levels” of political knowledge:

23
(1) fully informed (i.e., the respondent truly does know the answer to our question); (2) partially informed (the respondent either possesses an incomplete understanding, or the respondent can rule out an incorrect choice option on a multiple-choice item); (3) misinformed (the respondent believes he or she knows the correct answer, but is mistaken); and (4) uninformed (the respondent holds no knowledge pertinent to the question) (p. 201, 202).
Throughout the 1950s, researchers refrained from studying political knowledge more
thoroughly for several reasons (Lambert, Curtis, Kay, & Brown, 1988). First, the earliest
voting studies found low levels of political knowledge as it was measured among
respondents (Berelson et al., 1954; Campbell, Converse, Miller & Stokes, 1960; Campbell,
Gurin & Miller, 1954; Campbell & Kahn, 1952; Lazarsfeld, Berelson & Gaudet, 1944), and
an insignificant correlation was evident between these levels and either overall attitudes
towards politics or political behaviors. Through interviews and surveys of voters in
Michigan, Campbell and colleagues (1952, 1960) found that few people knew a lot about
politics, about half knew enough to answer basic questions, while the rest knew little at all.
Worse still, the percentage of people falling into the latter category was growing, particularly
among young people. With low levels of political knowledge and insignificant relationships
between the concept and other attitudes and behaviors, this area of research was mostly
abandoned.
A second reason is also cited for the decrease in the study of political knowledge. In
order to maintain a respectful relationship with participants, researchers refrained from
posing questions about what people knew about politics for fear that this could demoralize or
confuse participants and hinder their willingness to answer other questions (Lambert et al.,
1988). To compensate for this belief, some researchers prefaced their questions with
statements such as, “Many people are unfamiliar with <insert issue or politician>.”

24
A final reason focused on research designs. It was believed that people who may not
have any real opinion or knowledge about an issue may feel inclined to give an opinion
anyway, what Neuman (1986) called a “pseudo opinion” (p. 22), either to satisfy their desire
to please the researcher or to feel better about themselves.
Although political knowledge became the focus of scholarly research again in the
1980s, to this day ways to measure political knowledge remain in serious dispute. Zaller
(1990) wrote, “variables purporting to measure ‘political awareness,’ ‘political expertise,’
‘political sophistication,’ ‘cognitive sophistication,’ ‘political information,’ ‘political
involvement,’ ‘media exposure,’ and ‘political interest’ appear regularly in the public opinion
literature and are used (along with education) more or less interchangeably to explain the
same family of dependent variables” (p. 126). Kuklinksi and Quirk (2001) described the
creative ways scholars assess citizens’ political knowledge (competence in their language):
They have considered whether citizens hold consistent positions across issues; whether they hold stable positions across time; whether they know relevant facts from a policy debate; whether they maintain their positions when given different framings of the same issue; whether their preferences are correlated with their values; whether their preferences resemble those of others who are well informed; and whether they effectively take cues from parties, politicians, interest group, and other citizens (Kuklinski & Quirk, 2001, p.286).
A lot of research focuses on political knowledge trends, with a goal of identifying if
there are significant differences between generations or groups of people (e.g. Delli Carpini
& Keeter, 1991; Jennings, 1996). Ideally, researchers would be able to compare levels of
political knowledge across generations and between groups of people. However, researchers
often fail to use items that allow for these comparisons. For instance, Jennings (1996) divided
political knowledge into textbook knowledge, surveillance knowledge, and historical
25
knowledge. For textbook knowledge, he included measures about government mechanics
such as, “About how many years does a U.S. Senator serve? Do you happen to know how
many members there are on the United States Supreme Court?” These are consistent
measures of political knowledge. As measures of surveillance or “current events” knowledge,
he asked, “Marshall Tito is a leader of what country? Who is governor of [name of state]
now?” Finally, to assess historical knowledge he asked, “Do you happen to remember
whether President Franklin Delano Roosevelt was a Republican or a Democrat? During
World War II, which nation had a great many concentration camps for Jews? Who succeeded
John Kennedy as president? Do you know a country that borders on North or South
Vietnam?” As is evident, the current events are subject to changes over time, and the
historical questions become more and more distant to each generation.
At the most basic level, political knowledge is an understanding of “what government
is and does” (Barber, 1969, p. 38). To be politically knowledgeable, one must know “the
basic structure of government – its basic values, such as citizen participation, majority rule,
separation of powers, civil liberties, and its basic elements, such as the two-party system, the
two houses of Congress, the role of the judiciary, and the organization of the cabinet”
(Neuman, 1986, p. 186). Delli Carpini and Keeter (1993) surveyed political scientists to
assess what was believed to be important for the average citizen to know about politics. The
“essential” and “important” topics to political scientists were 1) institutions and processes, 2)
issues and policies, 3) history, and 4) current political alignments.
In any given study, the conceptualization and measurement of a concept such as
political knowledge are open to the interpretation of the author. While there is certainly a
large amount of subjectivity of opinion with regard to issues, there also exist certain

26
undeniable truths. Knowledge for the purposes of this paper refers to the accumulation of
proven, objective facts and concepts. Therefore, a core measure of political knowledge must
include awareness or recognition of political parties or of candidates, the mechanics of
government, and cognizance of personally relevant issues (Delli Carpini & Keeter, 1993).
(See Appendix A for scale).
There is serious debate about whether political knowledge as measured this way
accurately reflects what a person knows about politics, or whether it is important for a
functioning citizenry. First, measuring political knowledge as a collection of facts limits the
way we define a knowledgeable citizen. People are often able to make accurate decisions in
their own best interest with limited information, using cues or heuristics such as party
affiliation when making political judgments (Brady & Sniderman, 1985; Popkin, 1991).
Whether or not someone can name the Secretary of State may not say much about his or her
level of political interest or involvement. In addition, other outcomes (political talk,
volunteerism, democratic imaginations) may be even more valuable (Perrin, 2006), but are
less easily quantified or measured in experiments. This research does not make the case that
political knowledge as measured is a valid construct, only that as a carefully crafted,
standardized product, it might reveal some quantifiable difference between groups of people.
In addition to measuring political knowledge, this research examined the effect of
exposure to disparaging political statements on young citizens’ perceived level of political
knowledge. Confidence in one’s abilities to perform the functions of a citizen may be just as
important an indicator of likely civic behavior as more objectively measured political
knowledge.

27
Political efficacy is defined as “the feeling that individual political action does have
or can have an impact upon the political process…”(Campbell, Gurin & Miller, 1954, p.
187). Kaid, McKinney, and Tedesco (2007) recently developed a related scale to assess how
confident people are in their level of political knowledge. Kaid et al. (2007) state that political
information efficacy, “focuses soles on the voter’s confidence in his or her own political
knowledge and its sufficiency to engage in the political process (to vote)” (p. 1096). These
authors found that “young voters who do not feel confident in their knowledge levels are less
likely to vote than those who feel more confident” (p. 1103). Other research indicates that
confidence in one’s abilities is strongly related to political participation. Solhaug (2006)
found that self-efficacy, knowledge, and motivation all have significant impacts on young
people’s political participation and political attitudes. Bandura (1986; 1997) found a strong
positive correlation between a person’s level of efficacy and his or her participation in
politics. Similarly, McClusky, Deshpande, Shah & McLeod (2004) found that the size of the
“gap” between a person’s desired and perceived level of efficacy influenced whether he or
she was politically active.
Political knowledge and political information efficacy may be strong predictors of
political engagement. To this point there has been little research comparing performance on a
political knowledge test with political information efficacy scores. As a measure of one’s
self-confidence, it fits in well with the stereotype threat research as a possible mediator of the
effects of disparaging statements on performance on a political knowledge test.
Young voters are commonly disparaged for their low levels of political knowledge in
both the traditional press as well as in entertainment programming. This is a concern since
some young voters feel that they do not know enough to participate in politics, possibly

28
inhibiting their motivation to be politically active. It is possible that the way young voters are
discussed and represented in the media may cause feelings of inadequacy. While there are
several studies about the effects of political humor about candidates on young voters’
attitudes, little research to date has examined the effects of disparaging messages about
young voters on young voters. While some scholars argue that late-night political humor
shows create cynical and ill-informed citizens, it is possible that people dismiss information
from these shows as “just jokes,” or their attitudes towards the material is influenced by their
affective expectations. This research examined the mediating role of humor expectancy on
political attitudes and the mechanisms thought to increase stereotype threat effects.
The present experiments add to the literature by testing the effects of stereotype threat
on young adults with regards to their levels of political knowledge. Stereotype threat is a
phenomenon whereby people made cognizant of a negative stereotype about a group
unintentionally confirm that stereotype in a subsequent task. Experiment 1 was run to
document the phenomenon of stereotype threat in young voters with regard to their level of
political knowledge. The research question for experiment 1 was as follows:
RQ1: For young people, what is the relationship between having one’s age made
salient and the purported diagnosticity of the test on political information efficacy and
performance on a political knowledge test?
Prior literature indicates that indicating affiliation with a stereotyped group (salience)
can increase stereotype threat effects, as can performing a task described as indicative of
one’s abilities (purported diagnosticity) (e.g., Steele & Aronson, 1995). Based on the
literature on stereotype threat, the following hypotheses were offered:

29
H1a: Making the age group of young voters salient prior to a political knowledge test will
negatively affect political information efficacy and political knowledge scores.
H1b: Anxiety and motivation will mediate the effects of age salience on political information
efficacy and performance on the political knowledge test.
The presence of the age salience manipulation will increase scores on the anxiety and
motivation measures. Increases in these mediating variables will in turn result in decreases in
political information efficacy and performance on the political knowledge test. The inclusion
of anxiety and motivation in the regression models will reduce or eliminate the effects of the
age salience manipulation on the dependent variables.
H1c: Political information efficacy will mediate the effects of age salience on the
political knowledge test.
The presence of the age salience manipulation will cause a decrease in scores on the
political information efficacy scale. This decrease will lead to subsequent decreases in
performance on the political knowledge test. The inclusion of PIE in the regression model
will reduce or eliminate the effects of the age salience manipulation on performance on the
political knowledge test.
H1d: Belief in the stereotype, awareness of the stereotype, and group and domain
identification will moderate the influence of age salience on political information efficacy
scores and political knowledge performance.
People who report lower scores on any of the moderating variables will not be as
affected by the presence of the age salience manipulation as people who report higher scores
on those variables.

30
H2a: Describing the test as diagnostic will negatively affect political information efficacy
and political knowledge scores.
H2b: Anxiety and motivation will mediate the effects of the diagnostic salience manipulation
on political information efficacy and performance on the political knowledge test.
The presence of the diagnostic salience manipulation will increase scores on the
anxiety and motivation measures. Increases in these mediating variables will in turn result in
decreases in political information efficacy and performance on the political knowledge test.
The inclusion of anxiety and motivation in the regression models will reduce or eliminate the
effects of the diagnostic salience manipulation on the dependent variables.
H2c: Political information efficacy will mediate the effects of diagnostic salience on the
political knowledge test.
The presence of the diagnostic salience manipulation will cause a decrease in scores
on the political information efficacy scale. This decrease will lead to subsequent decreases in
performance on the political knowledge test. The inclusion of PIE in the regression model
will reduce or eliminate the effects of the diagnostic salience manipulation on performance
on the political knowledge test.
H2d: Belief in the stereotype, awareness of the stereotype, and group and domain
identification will moderate the influence of diagnostic salience on political information
efficacy scores and political knowledge performance.
People who report lower scores on any of the moderating variables will not be as
affected by the presence of the diagnostic salience manipulation as people who report higher
scores on those variables.

31
H3: The presence of both the age salience and diagnostic salience manipulations together
will affect attitudes and performance more than either independent variable in isolation.
Experiment 2
The goal of the second experiment was to test whether exposure to disparaging political
humor or political statements influenced young citizens’ attitudes and performance in a
similar manner as the first experiment and whether the expectation of humor influences these
effects.
For experiment 2, the following research question was asked:
RQ2: For young voters, what is the relationship between exposure to disparaging political
statements or political humor on political information efficacy and performance on a political
knowledge test?
Prior theorizing indicates that exposure to political humor may have negative effects
on individuals’ political attitudes (e.g., Hart & Hartelius, 2007). There is some evidence that
exposure to political humor about politicians may cause feelings of cynicism (e.g.,
Baumgartner & Morris, 2006; 2008). Therefore, the following hypothesis was offered:
H4: Exposure to humorous disparagement will have a greater negative effect on political
information efficacy and performance on the political knowledge test than will exposure to
non-humorous disparagement.
However, there is reason to think that concerns about the effects of political humor on
young citizens are unwarranted, since people cued about the presence of humor (as are late-
night humor viewers) approach messages with different expectations (Katz & Pexman, 1997;
McGhee, 1972; Pexman & Olineck, 2002; Zillmann, 1983). Therefore, the following
hypothesis was offered:

32
H5: Participants in the humor expectancy conditions will indicate greater political
information efficacy and perform better on the political knowledge test than will participants
in the no expectation conditions.
H6: Anxiety, motivation, and message counterarguing will mediate the effects of humor
expectancy and exposure to disparaging political statements or humor on political
information efficacy and performance on the political knowledge test.
Hypothesis 6 sought to identify the mechanisms through which expected or
unexpected exposure to humor affects attitudes and performance on the political knowledge
test. Participants exposed to humorous disparagement will indicate higher scores on the
mediating variables than will participants exposed to non-humorous disparagement only
when the humor is unexpected. This difference will account for the lower scores in the
humorous disparagement conditions (Hypothesis 4). In other words, if humor is a negative
force on individuals’ attitudes and behaviors, then people exposed to humorous
disparagement will feel anxious, feel motivated, and engage in more counterarguing than
people exposed to non-humorous disparagement, and thus perform worse on the political
knowledge test. On the other hand, participants in the humor expectancy conditions will have
lower scores on the mediating variables than will participants in the no expectation
conditions. This difference will account for the greater efficacy and better performance on
the political knowledge test in the expectancy conditions (Hypothesis 5). In other words, the
cue that humor is forthcoming cues people that the information to follow is not to be taken
seriously, thereby reducing anxiety, motivation, and counterarguing, and in s doing, eliminate
or reduce stereotype threat effects.

33
H7: Political information efficacy will mediate the effects of humor expectancy and exposure
to disparaging political statements or humor on performance on a political knowledge test.
Participants exposed to humorous disparagement will report lower political
information efficacy than will participants in the non-humorous disparagement conditions,
only when it is unexpected. This decrease in efficacy will account for the subsequent
decrease in performance on the political knowledge test (Hypothesis 4). Participants in the
humor expectancy conditions will report higher levels of efficacy than will participants in the
no expectation conditions, and this difference will account for the improved performance on
the political knowledge test (Hypothesis 5).
H8: Belief in the stereotype, awareness of the stereotype, and group and domain
identification will moderate the influence of the disparaging statements or humor on political
information efficacy and political knowledge performance.
People who report lower scores on any of the moderating variables will not be as
affected by exposure to disparaging political statements or political humor as will people
who report higher scores on those variables.
H9: An interaction effect between humor expectancy and exposure to disparaging political
humor on political knowledge and political information efficacy is predicted. Regardless of
whether participants are exposed to the disparaging humor or statement, participants in the
humor expectancy conditions will perform equally as well on the political knowledge test
and indicate equal levels of PIE. The effect of political humor will only be significant
(resulting in a decrease in scores on both dependent measures) under the condition where it is
unexpected.

34
CHAPTER II
EXPERIMENT 1 METHOD
Two experiments were run to test the effects of disparaging political humor on young
voters’ political attitudes and performance on a political knowledge test. Participants in both
experiments were drawn from undergraduate classes at the University of North Carolina at
Chapel Hill to take part in a “Media Diet” study. Subjects entered the lab, were greeted by
the principal investigator, asked to sign in to receive course credit, handed an informed
consent document with a random letter (A through D) written prominently on top, and
directed to an available computer terminal. The sessions began a few minutes after their
scheduled time, with groups as small as five and as a large as 25 participating at any time.
Experiment 1 asked, “what is the relationship between having one’s age made salient
and the purported diagnosticity of the test on political information efficacy and performance
on a political knowledge test?” This experiment used a between subjects factorial design,
with age salience (present vs. absent) and diagnosticity (present vs. absent) as the
independent variables in the 2x2 design. Four separate computers “surveys” were
constructed, with the only differences being the independent variables of age and diagnostic
salience. On the screen of each computer terminal was a Word document with A, B, C & D
listed in blue letters. Participants were instructed to look at the top of their informed consent
document to find out which of these four surveys they had been randomly assigned to take.
Upon clicking the letter on their computer screen, all participants read the following

35
message: “Thank you for participating in this research. You have been assigned to a study
about politics and political knowledge. To proceed, please click the forward arrow.”
Participants in the age salience conditions (A & B) were then asked the following question:
To begin, please select the age category to which you belong; (18-24) (Young voter), 25-39
(Adult voter), 40-60 (Middle Age voter), or 61+ (Senior voter). In the age salience absent
conditions (C & D), participants did not see this question.
Participants in the diagnostic conditions (A & C) then read the following message:
“The political knowledge test you are about to take is a useful tool for comparing the
intelligence of groups. At the end of this study, you will receive feedback about your
performance. To begin the experiment, please click the forward arrow.” In the conditions
without diagnostic salience (B & D), there was no mention of the tests’ diagnostic nature. A
table indicating the cells is below.
Experiment 1 Design
Age Salience No Age Salience
Diagnostic (A) High Threat (C) Mod Threat
No mention of Diagnostics (B) Mod Threat (D) Control
A pre-test of an earlier version of this experiment was conducted the summer before
this experiment was run. Half of the subjects were randomly assigned to select their age and
then read the following statement before taking a political knowledge test.
“It is widely believed that people your age are less informed about politics than most people. It has been shown that people your age are less politically informed than prior generations. The media often cover stories about how young voters like you do very poorly on political knowledge tests.

36
We would like for you to take a test of your level of political knowledge. Your results will be compared with those of people of other age groups.”
Results of the pre-test indicated that participants exposed to this threat answered
fewer questions correctly than those not exposed to the threat, although the difference was
not statistically significant, F(1, 50) = 3.44, p=.069. The present research built off the pre-
test by separating the test diagnosticity from the age salience factor and making changes to
the political knowledge test.
The dependent measures for both experiments were political knowledge and political
information efficacy. Smith (1989) argued that political knowledge indices and scales
typically are structured in one of two ways. First, researchers may count the total number or
percentage of correct responses (forced choice) to get a measure of a respondents’ political
knowledge. Secondly, they might enlist free recall or memory measures, such as asking
respondents for the names of political candidates, who controls the House of Representatives,
the differences between Republicans and Democrats, or the ability to recognize the meaning
of terms such as “conservative” or “liberal.” This research counted as correct or incorrect a
series of fill in the blank, recall questions based on rules developed a priori. Appendix A lists
the 13 questions that were used in the political knowledge test along with the answers that
were accepted as correct. Test anxiety effects are more likely to be found when the test is
cognitively taxing (Baumeister, 1984), therefore having people recall from memory without
the aid of multiple choice should increase the likelihood that the hypothesized effects occur.
The questions used to assess political knowledge build off the work of Delli Carpini and
Keeter (1993) and National Election Studies questionnaires.
After completing the political knowledge test, participants completed the political
information efficacy scale (Appendix B). The political information efficacy scale (Kaid et al.,

37
2007) consists of four, five-point Likert scale measures. These four items showed high levels
of reliability (Cronbach’s Alpha of .87) and together accounted for up to ten percent of the
variance in youth voting behavior in 2000 and 2002 (Kaid et al., 2007).
After completing the two dependent measures, participants answered questions about
what mental processes occurred while they were taking the political knowledge test. The
most common state anxiety measures are intended to be taken before the test of performance
abilities or they lack the specificity needed to provide a real understanding of the process.
The present research measured anxiety using two scales. The first was a five measure
semantic differential scale created by Mattson (1960), and used in stereotype threat research
by Stone et al. (1999). For instance, participants were asked to indicate on a seven-point scale
how they felt during the test from uneasy to easy, and uncomfortable to comfortable. The
scale was tested for reliability and the items summed to create an anxiety score.
The second scale of anxiety consisted of eight exploratory items created for this
research. Participants were asked their level of agreement on a five-point Likert scale with
statements such as “While taking the test, I was worried about confirming the stereotype that
young voters are uninformed about politics,” and, “When I didn’t know the answer to a
question, I was able to stay calm” (reverse scored). This scale was also tested for reliability
and a score created for each participant.
Motivation and effort have been measured by self report, by the time spent on each
question, and by the number of questions attempted, with mixed results (e.g., Aronson et al.,
1999; Beilock, Rydell, & McConnell, 2007; Jamieson and Harkins, 2007; Osborne, 2007;
Schmader & Johns, 2003). The present research used a five-item Likert type scale to assess
how much effort participants put into completing the test. Among the questions in the scale

38
(Appendix C) were, “When I didn’t know the answer to a question, I tried harder on the next
one,” and, “I felt the need to distance myself from the stereotype that young voters are
uninformed about politics.”
The belief in stereotype scale consisted of three questions to assess how strongly
people believed prior to taking the test that young people are typically uninformed about
politics. The awareness of stereotype scale, created by Pinel (1999), is capable of assessing
awareness of any stereotype about any demographic group. For instance, one of the
statements participants are asked about reads, “Before taking the test, I believed the
stereotype that blank tend to be blank.” In this case the phrases “young voters” and
“uninformed about politics” makes the scale applicable to the present research. Appendix E
contains the scales for the moderating variables of belief in and awareness of the stereotype.
The next two moderators were the degree to which participants felt that the group or
domain in question was an important part of their identity. To assess group identification,
Luhtanen and Crocker’s (1992) scale of collective self-esteem was adapted. Participants were
asked their level of agreement on a five-point Likert scale with questions such as, “In
general, being a young voter is an important part of my self-image.”
The domain identification scale was adapted from Spencer et al. (1999) and Aronson
et al. (1999). Participants were asked to identify on a five item, five-point Likert scale their
level of agreement with statements such as, “Knowledge of politics is important to me,” and
“I like politics.” Next, participants answered questions designed to assess their overall level
of efficacy, using a widely used and reliable scale (Schwarzer & Jerusalem, 1995). Finally,
participants in all conditions answered basic demographic questions about their age, gender
and political affiliation (See Appendix E).

39
CHAPTER III
EXPERIMENT 1 RESULTS
Sample
One hundred and thirty subjects participated in experiment 1. Participants ranged in
age from 18 to 23, with a mean age of 20.39. The sample was largely female (84.6%).
Participants identified themselves as Caucasian (80.7%), of mixed race (8.5%), Black
(3.8%), Asian (3.8%), and Hispanic (3%). Most participants identified themselves as
Democrats (47%), followed by the Republicans (29%), Independent (14%), Libertarians
(6%), Other (2%), and Socialists (2%).
Scale Reliability
The political knowledge scale showed moderate reliability, Cronbach’s alpha =.679.
The PIE scale exhibited strong reliability (α=.837). The established anxiety scale (Mattson,
1960, referred to as Anxiety1) was highly reliable (α=.905), while the measure created for
this study (Anxiety2) was weaker but still strong (α=.773). The scale for motivation exhibited
very low reliability (α=.420). Three items on that scale were highly correlated and served as
the basis of a more reliable scale (α=.695). These were, “I felt the need to counter the
stereotype that young voters are uninformed about politics,” “I tried to counter the stereotype
that young voters are uninformed about politics,” and “When I didn’t know the answer to a
question, I tried harder on the next one.” The three question index of participants’ belief in
the stereotype was the least reliable (α=.640). The stereotype awareness scale was reliable

40
(α=.754), as was the measure of group identification (α=.731). The domain identification
scale was reliable (α=.811), as was the index of overall efficacy (α=.822).
Descriptive Statistics
Table 1 displays the means and standard deviations for each of the three experimental
conditions and the control group on the dependent variables of political knowledge and PIE.
Table 1
Means and Standard Deviations for each Condition on the Dependent Variables Political knowledge (out of 15) PIE (out of 20)
Age Salience (N=33) (10.82, 1.91) (13.03, 3.32)
Diagnostic Salience (N=32) (9.19, 3.11) (12.38, 3.36)
Age+Diag (N=35) (10.86, 2.43) (13.49, 3.28)
Control (N=30) (10.40, 2.01) (12.30, 3.37)
Total (N=130) (10.33, 2.48) (12.82, 3.37)
Table 2 displays the means and standard deviations for each condition on the
mediating variables.
Table 2
Means and Standard Deviations for each Condition on the Mediating Variables
Anxiety 1 (out of 35) Anxiety 2 (out of 40) Motivation (out of 15)
Age Salience (N=33) (17.03, 7.57) (23.52, 3.89) (8.67, 2.34)
Diagnostic Salience (N=32) (18.00, 6.90) (23.75, 5.06) (9.34, 1.62)
Age+Diag (N=35) (17.09, 7.37) (24.40. 4.52) (10.00, 2.17)
Control (N=30) (18.53, 6.16) (24.77, 5.11) (9.53, 1.94)
Total (N=130) (17.63, 6.99) (24.1, 4.62) (9.39, 2.08)

41
Table 3 displays the means and standard deviations for each condition on the
moderating variables.
Table 3
Means and Standard Deviations for each Condition on the Moderating Variables Awareness (50) Belief (17) Domain (25) Group (20) Efficacy (40)
Age Salience (N=33) (27.58, 5.20) (9.55, 2.55) (14.49, 3.67) (8.91, 3.21) (32.58, 3.48)
Diagnostic Salience (N=32) (29.47, 4.44) (10.13, 2.89) (14.53, 3.93) (9.66, 2.96) (32.50, 3.45)
Age+Diag (N=35) (28.71, 4.85) (10.51, 2.21) (15.23, 3.92) (9.11, 2.03) (33.17, 3.29)
Control (N=30) (29.7, 6.02) (10.20, 2.65)
(13.90, 3.21) (9.40, 2.74) (30.90, 2.58)
Total (N=130) (28.84, 5.15) (10.10, 2.57) (14.56, 3.69) (9.26, 2.74) (32.33, 3.30)
Hypothesis Testing
Hypothesis 1a stated that making age salient to participants would result in a decrease
in political information efficacy and political knowledge scores. Hypothesis 1a was not
supported. As Table 4 indicates, participants in the age salience condition scored slightly
higher on the political knowledge test (M=10.82) and PIE measure (M=13.03) than
participants in the control condition (M=10.40 for political knowledge and 12.30 for PIE).
Results indicate that, contrary to Hypothesis 1a, the presence of age salience resulted in
increases in scores on the PIE measure (β=.730, t=.842, p=.403), and political knowledge
measure (β=.418, t=.846, p=.401) as compared to the control group, though neither increase
was significant.2
While age salience alone did not have a significant direct effect on the dependent
variables, it is possible that it could have influenced the mediators. Recently, scholars have
2 In order to remain consistent throughout this paper, regressions were used whenever appropriate. The same results would be attained through ANOVA or ANCOVA.
42
argued that the absence of direct effects does not preclude mediation or “indirect effects”
from occurring (Hayes, 2009). Hypothesis 1b posited that the anxiety and motivation scores
would mediate the relationship between the presence of the age salience manipulation and
scores on the dependent measures. Hypothesis 1b was not supported. The means in Table 2
show that whereas participants in the age salience condition were predicted to have higher
scores on the mediating variables, participants in the control group actually indicated higher
scores on these measures. To test whether these differences were significant, the mediators of
anxiety (two measures) and motivation were regressed on the age salience manipulation. The
presence of age salience led to non-significant decreases on Anxiety1 (β=-1.50, t=-.859,
p=.394), Anxiety2 (β=-1.25, t=1.1, p=.276), and motivation (β=-.867, t=-1.59, p=.117) as
compared to the control group.
To determine if the presence of age salience interacted with the mediating variables in
predicting PIE and political knowledge scores, several regression models were run. Since the
two anxiety measures were highly correlated (r=.567, p<.01), only the established scale was
used in the full regressions. The models in Tables 4 and 5 indicate that regardless of whether
the analysis included any or all of the mediating variables, age salience did not have a
significant impact on PIE scores or political knowledge scores as compared to the control
group. Similarly, Hypothesis 1c, which predicted the PIE would mediate the effects of age
salience on political knowledge scores, is not supported. Figures 1 and 2 displays the lack of
mediation predicted in Hypotheses 1b and 1c.
Results for Hypothesis 1a, 1b, and 1c indicate that the presence of age salience alone
did not directly affect PIE, political knowledge scores or the proposed mediating variables.

43
Neither did the addition of the mediating variables to the models reduce or change the effect
of the age salience manipulation on the dependent variables.
Table 4
Summary of Multiple Regression Analysis for PIE Scores (N=63) a b c d e VARIABLES (Constant) 12.3*** 9.67*** 15.42** 14.96** 11.93*** Age_alone .730 .875 .478 .596 .686 Motivation .276 .426* Anx1Score -.168** -.199** Anx2Score -.108 - R2=.19
Note: Model a contains age only, b contains age and motivation, c contains age and anx1, d contains age and anx2, e contains age, motivation, and anx1. *p<.05; **p<.01; ***p<.001
Figure 1: Analysis of relationship between age salience, anxiety, motivation, and PIE scores
β=.730, ns
*p<.05; **p<.01; ***p<.001
Age Salience
PIE Score
Age Salience
PIE Score
Anxiety1
Anxiety2
Motivation
Motivation
β=-1.25, ns
β=.686, ns
β=-1.5, ns β=-.199**
β=-.867, ns β=.426*

44
Table 5
Summary of Multiple Regression Analysis for Political Knowledge Scores (N=63)
Note: Model a contains age only, b contains age and motivation, c contains age and anx1, d contains age and anx2, e contains age and PIE score, f contains age, motivation, anx1, and PIE score. *p<.05; **p<.01; ***p<.001
Next, Hypothesis 1d stated that the effect of age salience on PIE and political
knowledge scores would be stronger as scores on the moderating variables increased.
Hypothesis 1d was not supported. First, it was determined that the presence of the age
salience manipulation alone did not cause a significant change in any of the moderators
(stereotype belief or awareness, domain or group identification), except for overall efficacy
(β=1.68, t=2.15, p=.035). Participants in the age salience condition indicated higher levels of
overall efficacy than participants in the control condition.
The effect of age salience on political knowledge scores was no different for
participants regardless of their scores on the domain identification scale (β=-.094, t=-.671,
p=.505), group identification scale (β=-.192, t=-1.12, p=.266), stereotype awareness scale
(β=.136, t=1.518, p=.134), or stereotype belief scale (β=-.208, t=-1.082, p=.284).
Subsequent analyses were performed to test the effects of these individual difference
variables on the relationship between exposure to the age salience manipulation and PIE
scores. The effect of age salience on PIE scores was no different for participants regardless of
a b c d e f VARIABLES (Constant) 10.4*** 10.85*** 12.06*** 12.08*** 6.71*** 8.45*** Age salience .418 .377 .283 .333 .199 .069 Motivation -.047 -.101 Anx1Score -.089* -.034 Anx2Score -.068 PIE_Score .300*** .288*** R2=.32

45
their scores on the domain identification scale (β=.042, t=.221, p=.826), group identification
scale (β=.081, t=.299, p=.766), stereotype awareness scale (β=.118, t=.737, p=.464), or
stereotype belief scale (β=.042, t=.127, p=.899).
Figure 2: Analysis of relationship between age salience, anxiety, motivation, and political knowledge scores
β=.418, ns
β=.069, ns
β=-1.5, ns β=-.034
β=-1.25, ns
β=-.867, ns β=-.101, ns
β=.426*
β=.730, ns β=.288***
*p<.05; **p<.01; ***p<.001
Hypothesis 2a stated that making the diagnostic nature of the test salient would result
in a decrease in both the PIE and political knowledge measures. Hypothesis 2a was partially
supported. The means on the PIE measure were nearly identical (M=12.38 for the diagnostic
Age Salience
Political knowledge score
Anxiety1
Anxiety2
Motivation
Age Salience
Political knowledge score
PIE scores

46
condition and 12.30 for the control condition). Participants in the diagnostic condition
averaged 9.19 correct answers to the political knowledge test, as compared to 10.40 for
participants in the control group. These differences were tested using linear regression.
Results indicate that the presence of the diagnostic salience manipulation did not effect PIE
scores (β=.075, t=.085, p=.932), but did cause a marginally significant decrease in scores on
the political knowledge test (β=-1.213, t=-1.81, p=.075, See Table 6) as compared to the
control group.
Table 6
Summary of Regression Analysis for Political Knowledge Scores (N=62) VARIABLES B SE(β) β t Sig.(p) (Constant) 10.40 .481 21.63 .000 Diagnostic Salience Alone
-1.213 (0.669) -0.228 -1.81 0.075
R2=0.052
While diagnostic salience alone did not have a significant direct effect on PIE scores,
it had a marginal effect on the political knowledge scores. It is possible that either of these
relationships was mediated by the effect of diagnostic salience on the mediating variables.
Hypothesis 2b posited that the anxiety and motivation scores would mediate the relationship
between the presence of the diagnostic salience manipulation and scores on the dependent
measures. Hypothesis 2b was not supported. First, the means in Table 1 show that whereas
participants in the diagnostic salience condition were predicted to have higher scores on the
mediating variables, participants in the control group actually indicated higher scores on
these measures. To test whether these differences were significant, the mediators of anxiety
(two measures) and motivation were regressed on the diagnostic salience manipulation. The
presence of diagnostic salience led to non-significant decreases on the established anxiety

47
measure (β=-5.33, t=-.310, p=.750), new anxiety measure (β=-1.017, t=-.787, p=.435) and
the motivation score (β=-.190, t=-.418, p=.677) as compared to the control group.
The models in Table 7 indicate that regardless of whether the analysis included any or
all of the mediating variables, diagnostic salience did not have a significant impact on PIE
scores as compared to the control group. Figure 3 displays this lack of mediation graphically.
Anxiety and motivation did not mediate the relationship between diagnostic salience and PIE
scores.
Table 7
Summary of Multiple Regression Analysis for PIE Scores (N=62) a b c d e VARIABLES (Constant) 12.3*** 9.097*** 15.19*** 14.53*** 11.35*** Diagnostic_alone .075 .139 -.008 -.017 .065 Motivation .336 .44 Anxiety1Score -.156* -.175*** Anxiety2Score -.090 - R2=.14
Note: Model a contains diagnostic only, b contains diagnostic and motivation, c contains diagnostic and anx1, d contains diagnostic and anx2, e contains diagnostic, motivation, and anx1. *p<.05; **p<.01; ***p<.001
Table 8 shows that when controlling for the anxiety measures or PIE scores, the
coefficient for diagnostic salience became more negative and crossed the p<.05 threshold for
significance. This is likely an instance of statistical suppression due to correlations between
the mediators and the dependent variable of political knowledge. Therefore, Hypotheses 2b
and 2c are not supported. Figure 4 displays the relationship between diagnostic salience, the
mediating variables, and political knowledge scores.

48
Figure 3: Analysis of relationship between diagnostic salience, anxiety, motivation, and PIE scores
β=.075, ns
β=.065, ns
β=-5.33, ns β=-.175***
β=-1.017, ns
β=-.190, ns β=.44, ns
*p<.05; **p<.01; ***p<.001
Results for Hypothesis 2a, 2b, and 2c indicate that the presence of diagnostic salience
alone did not directly affect PIE or the proposed mediating variables. However, as compared
to the control group, the presence of diagnostic salience did result in a marginally significant
decrease in political knowledge scores.
Next, Hypothesis 2d stated that the effect of diagnostic salience on PIE and political
knowledge scores would be stronger as scores on the moderating variables increased.
Hypothesis 2d received partial support. As with age salience, the presence of diagnostic
salience did not cause a significant change in any of the other mediators or moderators except
for overall efficacy (β=1.6, t=2.06, p=.044). Participants told that the test was diagnostic
Diagnostic Salience
PIE Score
Diagnostic Salience
PIE Score
Anxiety1
Anxiety2
Motivation
Motivation

49
performed worse on the political knowledge test, particularly when controlling for anxiety
and PIE scores, yet surprisingly reported significantly higher levels of overall efficacy than
participants in the control group.
Table 8
Summary of Multiple Regression Analysis for Political Knowledge Scores (N=62)
Note: Model a contains diagnostic only, b contains diagnostic and motivation, c contains diagnostic and anx1, d contains diagnostic and anx2, e contains diagnostic and PIE score, f contains diagnostic, motivation, anx1, and PIE score. *p<.05; **p<.01; ***p<.001
The effect of diagnostic salience on political knowledge scores was no different for
participants regardless of their scores on the domain identification scale (β=.241, t=1.49,
p=.140), group identification scale (β=-.278, t=-1.16, p=.253), stereotype awareness scale
(β=-.086, t=-.658, p=.513), or stereotype belief scale (β=.158, t=.631, p=.530). The effect of
diagnostic salience on PIE scores did not differ for participants with higher levels of domain
identification (β=-.11, t=-.544, p=.589). Stronger identification with young voters resulted in
a marginal change in the effect of diagnostic salience on PIE scores (β= -.599, t=-1.95,
p=.057, See Table 9). Increased awareness of the stereotype did not affect the relationship
between diagnostic salience and PIE scores (β=.111, t=.625, p=.535), but higher self-reported
belief in the stereotype did have a marginal effect on the relationship (β=.612, t=1.92,
p=.060, See Table 10 ).
a b c d e f VARIABLES (Constant) 10.4*** 11.77*** 13.78*** 13.06*** 4.61*** 9.18*** Diagnostic_alone -1.213 -1.24 -1.31* -1.32* -1.25* -1.34** Motivation -.144 -.227 Anxiety1Score -.182*** -.105 Anxiety2Score -.108*** - PIE_Score .471*** .423*** R2=.51

50
Table 9
Summary of Regression Analysis for PIE Scores (N=62) VARIABLES B SE(β) β t Sig.(p) (Constant) 7.74 2.24 3.45 .000 Diagnostic Salience Alone
5.74 (3.05) .842 1.88 .065
Group Score .485 (.229) .401 2.12 .039 Diagnostic*Group -.599 (.308) -.926 -1.95 .057 R2=0.076
Table 10
Summary of Regression Analysis for PIE Scores (N=62) VARIABLES B SE(β) β t Sig.(p) (Constant) 16.87 2.51 6.71 .000 Diagnostic Salience Alone
-6.15 (3.35) -.903 -1.84 .072
Belief Score -.448 (.239) -.359 -1.88 .066 Diagnostic*Belief .612 (.319) .981 1.92 .060 R2=0.066
Hypothesis 3 stated that the presence of both independent variables would result in
the strongest decreases in the dependent variables. While a review of Table 1 clearly
indicates that Hypothesis 3 is not supported (participants receiving both treatments averaged
higher scores on both dependent measures than participants receiving only one of the two
treatments), the data were reviewed to see if the two independent variables interacted with
one another to influence PIE or political knowledge scores. Scores on the dependent
measures were compared between participants receiving both treatments and those receiving
only one or neither treatment.

51
Figure 4: Analysis of relationship between diagnostic salience, anxiety, motivation, and political knowledge scores
β=-1.213
β=-1.34**
β=-5.33, ns β=-.105
β=-1.017, ns
β=-.190, ns β=-.227, ns
β=.426*
β=.075, ns β=.423***
*p<.05; **p<.01; ***p<.001
First, scores on the PIE and political knowledge measures were compared between
participants in the age salience only condition to the age/diagnostic condition. Adding
diagnostic salience did not result in the predicted decrease in PIE scores (β=.455, t=.569,
p=.571) or political knowledge scores (β=.039, t=.073, p=.942). Adding diagnostic salience
to age salience did not result in an increase in the established anxiety scale (Mattson, 1960)
(β=.055, t=.031, p=.976), or new anxiety scale (β=.885, t=.863, p=.391). However, the
Diagnostic Salience
Political knowledge score
Anxiety1
Anxiety2
Motivation
Diagnostic Salience
Political knowledge score
PIE scores

52
addition of diagnostic salience did increase the motivation of the participants significantly,
(β=1.33, t=2.44, p=.017; See Table 11).
Table 11
Summary of Regression Analysis for Motivation Measure (N=68) VARIABLES B SE(β) β t Sig.(p) (Constant) 8.67 .392 22.09 .000 Adding Diagnostic Salience to Age
1.33 (.547) .287 2.44 .017
R2=0.083
The increase in motivation caused by adding diagnostic salience did not translate into
differences in scores on the PIE or political knowledge measures. The presence of the
mediating variables in the model did not change the effect of adding diagnostic salience to
participants in the age salient conditions (See Tables 12 and 13).
Next, this analysis compared the scores of participants in the diagnostic salience
alone condition and the age/diagnostic condition. What was the impact of having had ones’
age made salient on the effect of diagnostic salience? Participants asked to select their age
before being told that the test was diagnostic indicated slightly higher PIE scores than
participants not first asked to select their age (β=1.11, t=1.37, p=.175) and performed
significantly better on the political knowledge test (β=1.67, t=2.46, p=.016; See Table 14).
The negative effect of diagnostic salience was significantly stronger in the absence of
the age salience manipulation. In other words, participants in the condition with both
treatments performed significantly better on the political knowledge test than participants in
the diagnostic treatment alone condition. Therefore, a closer examination of the scores on the
mediating variables in these two groups was warranted.

53
Table 12
Summary of Multiple Regression Analysis for PIE Scores (N=68) a b c d e VARIABLES (Constant) 13.03*** 11.19*** 16.58*** 15.51*** 13.73*** Adding Diagnostic Salience to Age
.455 .172 .467 .549 -.033
Motivation .213 .376 Anxiety1Score -.209*** -.233*** Anxiety2Score -.106 - R2=.29
Note: Model a contains age only, b contains age and motivation, c contains age and anx1, d contains age and anx2, e contains age, motivation, and anx1. *p<.05; **p<.01; ***p<.001
Table 13
Summary of Multiple Regression Analysis for Political Knowledge Scores (N=68) a b c d e f VARIABLES (Constant) 10.82*** 11.83*** 13.33*** 14.25*** 5.59*** 8.710*** Adding Diagnostic Salience to Age
.039 .194 .047 .168 -.144 .076
Motivation -.116 -.143 Anxiety1Score -.147*** -.067* Anxiety2Score -.146* - PIE_Score .400*** .344*** R2=.44
Note: Model a contains diagnostic only, b contains diagnostic and motivation, c contains diagnostic and anx1, d contains diagnostic and anx2, e contains diagnostic and PIE score, f contains diagnostic, motivation, anx1, and PIE score. *p<.05; **p<.01; ***p<.001

54
Table 14
Summary of Regression Analysis for Political Knowledge Scores (N=67) VARIABLES B SE(β) β t Sig.(p) (Constant) 9.19 .490 18.76 .000 Adding Age Salience to Diagnostic
1.67 (.678) .292 2.46 .016
R2=0.085
Adding age salience to diagnostic salience did not result in the differences on the
established anxiety scale (β=-.914, t=-.523, p=.603), new anxiety scale (β=.650, t=.555,
p=.581), or motivation scale (β=.656, t=1.39, p=.168). The addition of the mediators to the
model did not change the effect of adding age salience to participants in the diagnostic
condition on PIE scores (Table 15) or reduce the effect on political knowledge scores (Table
15). Therefore, while participants in the age salience/diagnostic salience condition performed
significantly better on the political knowledge test than participants in the no age
salience/diagnostic condition, this difference is unaccounted for by the mediating variables.
Results indicate that there is an effect of having both manipulations as opposed to either in
isolation. However, the data show that rather than working together to decrease performance
or increase anxiety and motivation, the presence of age salience removed the negative effect
of diagnostic salience on scores on the political knowledge test.
Next, an omnibus regression model with both independent variables and the
mediating variables was run. As Table 17 indicates, participants in the diagnostic alone
condition performed significantly worse on the political knowledge test even when the other
factors were included in the model.
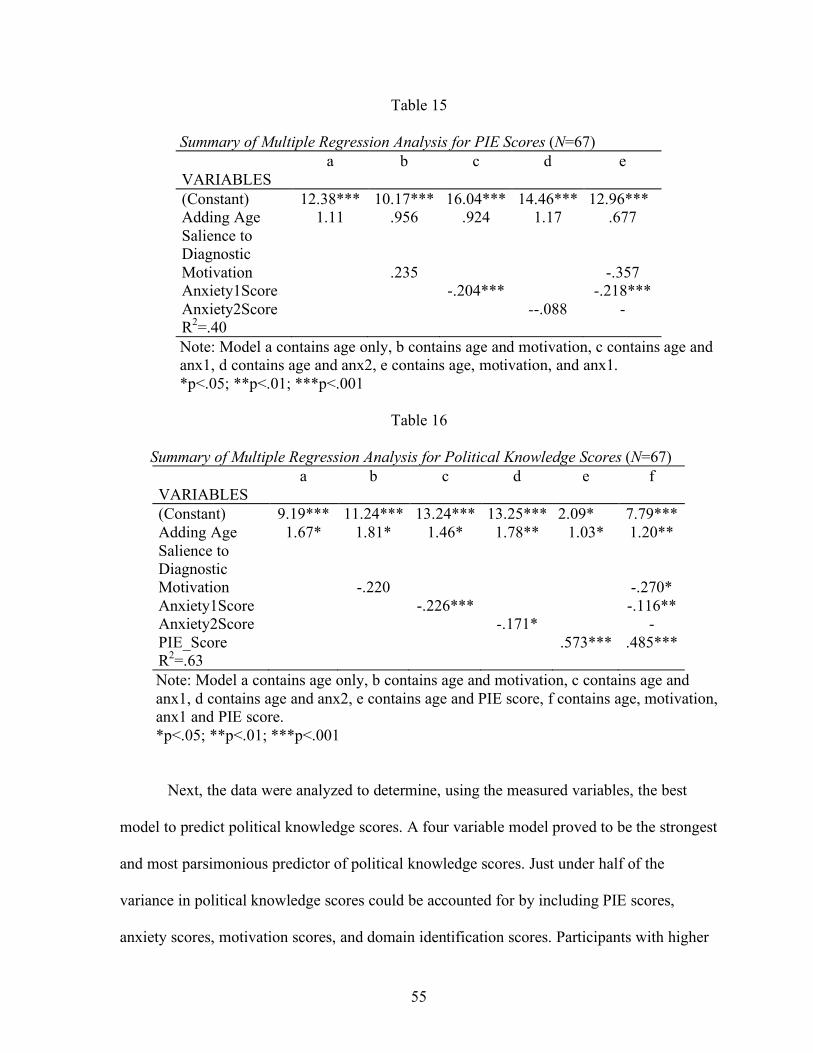
55
Table 15
Summary of Multiple Regression Analysis for PIE Scores (N=67) a b c d e VARIABLES (Constant) 12.38*** 10.17*** 16.04*** 14.46*** 12.96*** Adding Age Salience to Diagnostic
1.11 .956 .924 1.17 .677
Motivation .235 -.357 Anxiety1Score -.204*** -.218*** Anxiety2Score --.088 - R2=.40 Note: Model a contains age only, b contains age and motivation, c contains age and anx1, d contains age and anx2, e contains age, motivation, and anx1. *p<.05; **p<.01; ***p<.001
Table 16
Summary of Multiple Regression Analysis for Political Knowledge Scores (N=67) a b c d e f VARIABLES (Constant) 9.19*** 11.24*** 13.24*** 13.25*** 2.09* 7.79*** Adding Age Salience to Diagnostic
1.67* 1.81* 1.46* 1.78** 1.03* 1.20**
Motivation -.220 -.270* Anxiety1Score -.226*** -.116** Anxiety2Score -.171* - PIE_Score .573*** .485*** R2=.63 Note: Model a contains age only, b contains age and motivation, c contains age and anx1, d contains age and anx2, e contains age and PIE score, f contains age, motivation, anx1 and PIE score. *p<.05; **p<.01; ***p<.001
Next, the data were analyzed to determine, using the measured variables, the best
model to predict political knowledge scores. A four variable model proved to be the strongest
and most parsimonious predictor of political knowledge scores. Just under half of the
variance in political knowledge scores could be accounted for by including PIE scores,
anxiety scores, motivation scores, and domain identification scores. Participants with higher

56
PIE and domain scores and lower anxiety and motivation scores performed better on the
political knowledge test. Finally, a summary of hypotheses and findings for Experiment 1 is
found in Table 19.
Table 17
Summary of Multiple Regression Analysis for Political Knowledge Scores (N=130) VARIABLES B SE(β) β t Sig.(p) (Constant) 8.76 1.09 8.05 .000 Age_alone -.135 (.462) -.024 -.292 .771 Diagnostic_alone -1.32 (.458) -.230 -2.88 .005 Age*Diagnostic -.037 (.453) -.007 -.081 .936 PIE Score .387 (.053) .527 7.26 .000 Anxiety1Score -.080 (.026) -.225 -3.09 .002 Motivation -.173 (.083) -.145 -2.09 .038 R2=0.497
Table 18
Summary of Multiple Regression Analysis for Political Knowledge Scores (N=130) VARIABLES B SE(β) β t Sig.(p) (Constant) 7.48 1.10 6.80 .000 PIE Score .299 (.068) .407 4.37 .000 Anxiety1Score -.065 (.027) -.183 -2.41 .018 Motivation -.218 (.085) -.183 -2.58 .011 Domain Score .151 (.064) .225 2.34 .020 R2=0.472

57
Table 19
Summary of Hypotheses for Experiment 1
+= supported, +?=limited support, - no support
Hypothesis Table 1
Table 4
Table 5
Tables 6, 17
Table 7
No Table
H1a Making the age group of young voters salient prior to a pk test will negatively affect PIE and pk scores
-
H1b Anxiety and motivation will mediate the effects of age salience on PIE and performance on the pk test.
- -
H1c PIE will mediate the effects of age salience on the pk test
-
H1d Belief in the stereotype, awareness of the stereotype, and group and domain identification will moderate the influence of age salience on PIE and pk scores.
-
H2a Describing the test as diagnostic will negatively affect PIE and pk scores
+ for pk
H2b Anxiety and motivation will mediate the effects of the diagnostic salience manipulation on PIE and performance on the pk test.
-
H2c PIE will mediate the effects of diagnostic salience on the pk test.
-
H2d Belief in the stereotype, awareness of the stereotype, and group and domain identification will moderate the influence of diagnostic salience on PIE scores and pk performance.
-
H3 The presence of both the age salience and diagnostic salience manipulations together will affect attitudes and performance more than either independent variable in isolation.
-

58
CHAPTER IV
EXPERIMENT 1 DISCUSSION
Experiment 1 sought to determine if young voters’ attitudes or performance on a
political knowledge test could be affected by stereotype threat, induced by making group
membership and test diagnosticity salient. Results for experiment 1 indicate that for this
sample of participants making age salient did not result in the predicted decrease in scores on
the political knowledge or PIE measures. Nor did age salience result in an increase in any of
the mediating variables. In fact, when participants in the diagnostic condition (who
performed worse on the political knowledge test than the control group) were first asked their
age, the effect of diagnostic salience disappeared. It appears that the tests’ purported power to
reliably find differences between groups did affect performance, though not through the
mediators explored in this study, and not in combination with increased age salience. It is
likely that some other aspect of the participants’ identity (e.g., their race or gender) was
threatened in the diagnostic condition, though this is merely speculation, as strength of
identification with these groups was not measured. It does appear, however, that whereas
making the test’s diagnostic nature salient after making age salient did not affect
performance, the presence of age salience removed the negative effect of diagnostic salience.
There are at least two ways to interpret these results. First, for the participants
involved, age salience may not have served as a symbol of personal weakness with regard to
political knowledge. On the other hand, the strength of the age salience manipulation may

59
have been too weak to find the hypothesized effects. The second experiment sought to
determine if exposing young voters to more explicit threatening information about their age
group had different effects on their performance and attitudes.

60
CHAPTER V
EXPERIMENT 2 METHOD
Experiment 2 asked, “what is the relationship between exposure to disparaging
political statements or political humor on political information efficacy and performance on a
political knowledge test?” This experiment used a 2x2 between subjects factorial design with
1 control group. The manipulated independent variables were humor expectancy (Jon Stewart
vs. Minneapolis Star Tribune3) and humorousness of content (humorous vs. non-humorous).
Participants (N=150) were randomly assigned to one of four experimental groups or the
control group.
As with experiment 1, subjects participated in this study using a computer in a lab.
On the screen of each computer was a Microsoft Word document with the letters E, F, G, H
or I in blue letters. Clicking on any of the letters directed the subject to one of the five
conditions. Each of the participants was given an informed consent document upon entering
the lab with a randomly assigned letter written prominently on top of the page.. Upon
clicking the letter on their computer screen, all participants read the following message:
“Thank you for participating in this research. You have been assigned to a study about
politics and political knowledge. To proceed, please click the forward arrow.”
3 The Minneapolis Star Tribune is a nationally recognizable name yet it does not have with it the “baggage” of being associated with a political philosophy or any memorable scandals (e.g. The New York Times).

61
Participants assigned to the humor expectancy conditions read the following
statement: “Before you begin the survey, please read this recent quote from Jon Stewart, host
of The Daily Show on Comedy Central.” Participants in the no expectation of humor
condition read, “Before you begin the survey, please read this recent quote from David
Jennings, journalist for The Minneapolis Star Tribune.” The control group was not made to
expect a quote nor read a quote prior to taking the political knowledge test. (See table below).
Experiment 2 Design
Humorous Non-humorous Jon Stewart (Humor expectancy) Expect+Receive Expect+Don’t receive Minneapolis Star Tribune Don’t Expect+ Receive Don’t Expect+Don’t Receive
Participants then read either a humorous or non-humorous disparaging quote about
young voters purportedly from the source. This experiment involved the creation of two
“content equivalent” quotes disparaging young people for their stereotypically low levels of
political knowledge and involvement. This procedure is widely used in humor and
advertising research and is becoming more popular in political communication research as
well (e.g., Nabi et al., 2007).
The non-humorous version of the disparaging statement read as follows:
“When it comes to politics, young people have no clue what’s going on, they’ve got no actual
opinion, they’ve never affected the outcome, and they’d rather be sleeping.”
The humorous version of the statement read:
“When it comes to politics, young people are like Punxsutawney Phil on Groundhog’s Day.
They have no clue what’s going on, they’ve got no actual opinion, they’ve never affected the
outcome, and they’d rather be sleeping.”
62
A pre-test was run on this quote with 40 undergraduate students. Participants were
told they were reading a quote from Jon Stewart. Results indicate that participants found the
humorous statement to be significantly more humorous (M=5.35/9) than the non-humorous
statement (M=3.33/9), F(1, 39)=11.345, p=.002. This indicates that humor expectancy might
have limited ability to influence perceptions of humorousness, although a comparison with a
source other than Jon Stewart was not conducted. The post-test of the present experiment
included manipulation checks of humor expectancy (Appendix G) and statement
humorousness (Appendix F).
After reading the quote, participants read the following statement, “Next, we’d like to
ask you some political knowledge questions.” Participants then took the political knowledge
test, followed by the PIE scale as in Experiment 1.
In addition to the mediators from experiment 1, a new factor, statement
counterarguing, was included in the analysis. Counterarguing of the message was assessed
with a set of six items adapted from research by Nabi et al. (2007). Participants were asked to
indicate the degree to which they agreed or disagreed with statements such as, “I thought of
reasons why what Jon Stewart/David Jennings said was wrong,” and “The statement popped
into my head while I was taking the test.” (See Appendix D). Greater counterarguing was
hypothesized to lead to inhibited performance.
As with the first experiment, participants then completed the measures of individual
difference variables, were thanked for their participation and debriefed before leaving the lab.

63
CHAPTER VI
EXPERIMENT 2 RESULTS
Sample
One hundred and fifty subjects participated in experiment 2. Participants ranged in
age from 18 to 24, with a mean age of 20.62. The sample was largely female (79%).
Participants identified themselves as Caucasian (84%), Black (5%), Hispanic (5%), Asian
(4%), and of mixed race (2%). Most participants identified themselves as Democrats (42%),
followed by the Republicans (31%), Independent (14%), Other (6%), Libertarians (5%),
Green (1%) and Socialists (1%).
Scale Reliability
The political knowledge scale showed moderate reliability, Cronbach’s alpha =.652.
The PIE scale exhibited strong reliability (α=.814). The established anxiety scale (Mattson,
1960, Anx1) was highly reliable (α=.901), while the measure created for this study (Anx2)
was weaker but still strong (α=.747). The scale for motivation exhibited very low reliability
(α=.474). As with the first experiment, three items on that scale were highly correlated and
served as the basis of a more reliable scale (α=.742). These were, “I felt the need to counter
the stereotype that young voters are uninformed about politics,” “I tried to counter the
stereotype that young voters are uninformed about politics,” and “When I didn’t know the
answer to a question, I tried harder on the next one.” The counterarguing scale exhibited
weak reliability (.393). A two-item measure was constructed using “I actively disagreed with

64
what Jon Stewart/David Jennings said,” and “I thought of reasons why what Jon
Stewart/David Jennings said was wrong.” This scale exhibited a reliability of .729.
Factor analyses were subsequently conducted to further determine whether the scales
used for the mediating variables were uni-dimensional. As theorized, each of the mediating
variables was found to load on a single factor with an eigenvalue greater than one.
Furthermore, an omnibus factor analysis of all of the questions used to measure the
mediating variables produced five distinct factors, corresponding well to the five proposed
mediators (PIE, anxiety1, anxiety2, motivation, counterarguing).
The belief in the stereotype scale was the least reliable (α=.533). The stereotype
awareness scale was reliable (α=.728), as was the group identification scale, α=.824). The
domain identification scale was reliable (α=.799), as was the established index of overall
efficacy (α=.835).
Manipulation Checks
To ensure that the manipulations of humor expectancy and stimulus humorousness
did work, several analyses were run. First, towards the end of the experiment, participants
were asked to recall the quote to the best of their ability. Three subjects were unable to recall
the quote at all, and were eliminated from the subsequent analysis.
Participants in the humorous/expected condition reported that the quote was
somewhat funny (M=4.38/9). This is quite lower than it was in the initial pre-test (M=5.35).
It is conceivable that this difference comes from the fact that while in the pre-test,
participants were simply asked to read and rate the quote; in the present experiment,
participants rated the quote after a long series of political knowledge and attitude questions.
Perception of the quote’s humorousness may have been as high during the taking of the

65
political knowledge test, which immediately followed the manipulation, but trailed off as the
experiment went on. Participants in the humorous/unexpected condition scored the quote as a
little funny (M=3.59/9). In the non-humorous conditions, the quote was rated 3.27 when
humor was expected and 2.50 when unexpected. In summary, participants in the humorous
conditions rated the quote as significantly funnier (M=3.98) than participants in the non-
humorous conditions (M=2.88), (β=1.09, t=3.37, p=.001). Participants in the humor
expectancy condition also rated the quote as funnier (M=3.81) than participants in the no
expectation conditions (M=3.03), (β=.780, t=2.34, p=.021). However, there was not a
significant interaction between the two independent variables and perceived humorousness.
As another check, participants were asked how clever they considered the quote. The
results mirror those of the humorousness check, with slightly higher means. The tables below
show the effect of the two conditions combined on the perceptions of humorousness and
cleverness.
Table 20
Summary of Multiple Regression Analysis for How Funny (N=118) VARIABLES B SE(β) β t Sig.(p) (Constant) 2.49 .275 9.08 .000 Humorous Disparagement
1.09 (.319) .299 3.45 .001
Humor Expected .780 (.319) .212 2.44 .016 R2=0.134
There was no difference in how complicated or informative the quote was considered
in the conditions. However, there was a marginally significant interaction between the two
independent variables on perceptions of how confusing the quote was (See Table 22).
Participants found the non-humorous quote from the MST more confusing than the humorous

66
quote from Jon Stewart. Also, the expectation of humor was associated with a significant
decrease in the perceived negativity of the quote. Participants in the humor expectancy
conditions considered the quote less negative than participants in the no expectation
conditions (Table 23).
Table 21
Summary of Multiple Regression Analysis for How Clever (N=118) VARIABLES B SE(β) β t Sig.(p) (Constant) 2.69 .296 9.11 .000 Humorous Disparagement
1.23 (.344) .305 3.58 .001
Humor Expected 1.10 (.344) .272 3.2 .002 R2=0.167
Table 22
Summary of Multiple Regression Analysis for How Confusing (N=118) VARIABLES B SE(β) β t Sig.(p) (Constant) 1.67 .208 8.01 .000 Humorous Disparagement
.333 (.297) .146 1.12 .264
Humor Expected .133 (.294) .058 .45 .651 Humorous*Expect -.789 (.419) -.297 -1.88 .063 R2=0.427
Table 23
Summary of Multiple Regression Analysis for How Negative (N=118) VARIABLES B SE(β) β t Sig.(p) (Constant) 6.91 .297 23.23 .000 Humorous Disparagement
-.335 (.345) -.085 -.97 .335
Humor Expected -1.22 (.345) -.312 -3.53 .001 R2=0.105

67
Altogether, the humorous stimulus was rated as significantly funnier than the non-
humorous stimulus. The non-humorous quote in the MST condition was rated as more
confusing than the quote in the humorous/expected condition. Participants expecting humor
rated the quote as less negative than participants not expecting humor.
The next manipulation check focused on whether stating the source of the quote
influenced participants’ mindsets before reading the quote. A humor expectancy scale with
strong reliability (α=.783) was created using the following items: “I expected the quote to be
funny,” “I expected to have to work through a joke,” “I was looking forward to reading the
quote,” “I assumed I would enjoy the quote,” and “I expected the quote to be lighthearted.”
Participants in the expectation conditions reported expecting humor significantly more than
participants in the no expectation conditions, (β=3.89, t=8.06, p<.001; See Table 24).
Table 24
Summary of Regression Analysis for Humor Expectancy Score (N=118) VARIABLES B SE(β) β t Sig.(p) (Constant) 12.88 .342 37.67 .000 Jon Stewart (Humor Expected)
3.89 (.484) .599 8.06 .000
R2=0.359
There was a marginally significant negative interaction between humor and
expectancy on the humor expectancy score (See Table 25). Participants in the humor
expectancy condition that did not get humor reported expecting humor more than participants
that did get humor. Participants in the no expectation condition that did not get humor
reported expecting humor less than participants given humor.

68
Table 25
Summary of Multiple Regression Analysis for Humor Expectancy (N=118) VARIABLES B SE(β) β t Sig.(p) (Constant) 12.3 .476 25.86 .000 Humorous Disparagement
1.18 (.678) .182 1.74 .084
Humor Expected 4.8 (.673) .738 7.14 .000 Humorous*Expect -1.84 (.959) -.243 -1.91 .058 R2=0.381
Altogether, participants told that Jon Stewart was the source of the forthcoming quote
indicated significantly higher levels of humor expectancy. Participants reported expecting
humor slightly more when it was expected but not received or unexpected and received.
Descriptive Statistics
Tables 26, 27, and 28 display the means and standard deviations of the groups’ scores
on each of the dependent, mediating, and moderating variables, respectively.
Table 26
Means and Standard Deviations on Dependent Variables for each Condition PK (out of 15) PIE (out of 20)
Humor/Expect (N=29) 10.52, 1.88 12.86, 2.63
Humor/No Expect (N=29) 9.62, 2.51 12.55, 3.69
No Humor/No Expect (N=30) 10.53, 1.93 12.83, 2.89
No Humor/Expect (N=30) 9.37, 2.34 12.77, 2.81
Control (N=32) 10.53, 2.50 13.28, 3.28
Total (N=150) 10.12, 2.28 12.87, 3.05

69
Table 27
Means and Standard Deviations on Mediating Variables for each Condition
Table 28
Means and Standard Deviations on Moderating Variables for each Condition Awareness
(out of 50) Belief (out
of 17) Domain (out
of 25) Group (out
of 20) Efficacy (out
of 40) Humor/Expect (N=29)
29.76, 5.20 10.07, 2.67 15.07, 3.24 9.48, 3.65 33.31, 3.52
Humor/No Expect (N=29)
30.07, 4.59 10.00, 2.41 14.59, 3.77 9.66, 3.29 32.52, 3.25
No Humor/No Expect (N=30)
29.97, 5.89 10.23, 2.25 14.80, 3.81 9.37, 2.95 31.90, 3.36
No Humor/Expect (N=30)
30.07, 5.02 10.07, 1.99 14.57, 3.99 9.37, 2.79 32.17, 4.19
Control (N=32) 29.75, 5.09 10.47, 2.82 14.84, 3.72 9.69, 3.04 32.53, 3.42
Total (N=150) 29.92, 5.11 10.17, 2.42 14.77, 3.67 9.51, 3.12 32.38, 3.54
Hypothesis Testing
Figures 5 and 6 display the means of the four experimental conditions on measures of
political knowledge and PIE, respectively.
Anxiety 1 (out of 35)
Anxiety 2 (out of 40)
Motivation (out of 15)
Counterarguing (out of 10)
Humor/Expect (N=29) 19.48, 6.69 25.48, 4.52 10.17, 2.00 6.14, 2.13
Humor/No Expect (N=29) 18.24, 6.27 25.10, 4.59 9.62, 2.87 6.79, 1.69
No Humor/No Expect (N=30) 19.63, 5.97 25.60, 4.46 10.07, 2.39 6.73, 1.41
No Humor/Expect (N=30) 17.57, 7.55 24.60, 5.00 10.00, 1.93 6.33, 1.85
Control (N=32) 18.97, 6.93 23.16, 4.03 9.39, 2.08 -
Total (N=150) 18.78, 6.66 24.76, 4.55 9.95, 2.31 6.50, 1.79

70
Figure 5: Graph of mean political knowledge scores by condition
Figure 6: Graph of mean PIE scores by condition
Hypothesis 4 stated that exposure to disparaging political humor would have a greater
negative effect on political information efficacy and performance on the political knowledge
test than exposure to non-humorous disparagement. Hypothesis 4 was not supported.
Polit
ical
kno
wle
dge
(out
of 1
5)
PIE
Scor
es (o
ut o
f 20)

71
To begin, scores were compared between participants exposed to either form of
disparagement and the control group. First, political knowledge and PIE were compared
between participants in the humorous disparagement conditions and the control group.
Results indicate exposure to humorous disparagement resulted in a non-significant decrease
in scores on the political knowledge test (β=-.462, t=-.897, p=.372) and PIE (β=-.574, t=-
.811, p=.420) as compared to the control group. Next, scores were compared between
participants in the non-humorous conditions and the control group. Results indicate that
exposure to non-humorous disparagement also resulted in a non-significant decrease in
scores on the political knowledge test (β=-.581, t=-1.15, p=.254) and PIE (β=-.481, t=-.736,
p=.464) as compared to the control group. Participants in the humorous and non-humorous
disparagement conditions all scored lower on the political knowledge and PIE measures than
the control group, though these effects were not significant.
Next, scores were compared between participants in the humorous and the non-
humorous conditions. Results indicate that there was no statistically significant difference
between the political knowledge scores of participants based on this variable alone (β=.119,
t=.290, p=.772). Similarly, there was no significant difference in political information
efficacy between participants exposed to humorous versus non-humorous disparagement (β=-
.093, t=-.168, p=.867).
Hypothesis 5 stated that participants in the humor expectancy conditions would
indicate greater political information efficacy and perform better on the political knowledge
test than participants in the no expectation conditions. Hypothesis 5 was not supported. First,
scores were compared between participants made to expect humor and the control group.
Results indicate humor expectancy resulted in a non-significant decrease in scores on the

72
political knowledge test (β=-.599, t=-1.19, p=.239) and PIE (β=-.468, t=-.731, p=.467) as
compared to the control group.
Next, scores were compared between participants told that “David Jennings” was the
source of the forthcoming quote (no expectation) and the control group. Results indicate
participants not expecting humor performed slightly worse on scores on the political
knowledge test (β=-.447, t=-.866, p=.389) and PIE (β=-.586, t=-.814, p=.418) as compared to
the control group, although these differences were not significant.
Participants in the humor expectation and no expectation conditions all scored lower
on the political knowledge and PIE measures than the control group, though these effects
were not significant. Next, scores were compared between participants made to expect humor
and those not expecting humor. Results indicate that participants in the expectation of humor
conditions performed virtually the same as participants not made to expect humor (β=-.153,
t=-.372, p=.710) and indicated similar attitudes as well (β=.119, t=.214, p=.831).
To test whether the effects of humor expectancy or exposure to humorous or non-
humorous disparagement were mediated (Hypotheses 6 and 7) scores on the mediating
variables were also compared between these groups. It was previously shown that the
expectation of or exposure to disparaging humor or statements did not affect PIE, so
Hypothesis 7 was rejected. Hypothesis 6 was also rejected. Results indicate that participants
exposed to disparaging political humor scored no different on the first anxiety measure (β=-
.107, t=-.073, p=.942) or motivation measure (β=.022, t=.040, p=.968) than the control
group, but did report significantly more anxiety using the second measure (See Table 29).

73
Table 29
Summary of Regression Analysis for Anxiety2 Scores (N=90) VARIABLES B SE(β) β t Sig.(p) (Constant) 23.16 .769 30.10 .000 Humorous Disparagement
2.14 (.958) .231 2.23 .028
R2=0.053
Similarly, participants exposed to non-humorous political disparagement scored no
different on the first anxiety measure (β=-.369, t=-.245, p=.807) or motivation measure
(β=.158, t=.325, p=.746), but did report significantly more anxiety using the second measure
than the control group (See Table 30).
Table 30
Summary of Regression Analysis for Anxiety2 Scores (N=92) VARIABLES B SE(β) β t Sig.(p) (Constant) 23.16 .795 29.12 .000 Non-humorous Disparagement
1.94 (.985) .204 1.97 .051
R2=0.041
Participants in the humorous disparagement conditions did not report significantly
different scores on the anxiety measures (Anx1, β=.262, t=.214, p=.831, Anx2, β=.193,
t=.227, p=.821) motivation measure (β=-.137, t=-.321, p=.749) or counterarguing measure
(β=-.068, t=-.205, p=.838) than participants in the non-humorous disparagement conditions.
Participants made to expect humor scored no different on the first anxiety measure
(β=-.460, t=-.297, p=.767) or motivation measure (β=.210, t=.455, p=.650) than the control
group, but did report a nearly significant increase in anxiety using the second measure (See
Table 31).

74
Table 31
Summary of Regression Analysis for Anxiety2 Scores (N=91) VARIABLES B SE(β) β t Sig.(p) (Constant) 23.16 .798 29.03 .000 Humor Expected 1.88 (.991) .197 1.89 .061 R2=0.039
Results indicate that participants in the no expectation conditions scored no different
on the first anxiety measure (β=-.020, t=-.014, p=.989) or motivation measure (β=-.028, t=-
.050, p=.961) than the control group, but did report a significant increase in anxiety using the
second measure (See Table 32).
Table 32
Summary of Regression Analysis for Anxiety2 Scores (N=91) VARIABLES B SE(β) β t Sig.(p) (Constant) 23.16 .767 30.21 .000 No Expectation of Humor
2.20 (.952) .238 2.31 .023
R2=0.057
Participants in the humor expectancy conditions did not report significantly different
scores on the anxiety measures (Anx1, β=-.441, t=.360, p=.719, Anx2, β=-.322, t=-.378,
p=.706) motivation measure (β=.237, t=.557, p=.578) or counterarguing measure (β=-.525,
t=-1.61, p=.111) than participants in the no expectation conditions.
Seeing as the independent variables all affected Anxiety2 scores, two sets of
regression equations were run to test whether the effects of expecting or experiencing
humorous or non-humorous disparagement were mediated by anxiety. Tables 33 and 34
show that anxiety did not mediate or change the effects of exposure to disparaging humor
versus disparaging political statements on political knowledge scores or PIE.

75
Table 33
Summary of Multiple Regression Analysis for Political Knowledge Scores (N=118) VARIABLES B SE(β) β t Sig.(p) (Constant) 12.25 1.14 10.73 .000 Humorous Disparagement
.137 (.404) .031 .338 .736
Anxiety2 -.092 (.044) -.190 -2.08 .040 R2=0.037
Table 34
Summary of Multiple Regression Analysis for PIE Scores (N=118) VARIABLES B SE(β) β t Sig.(p) (Constant) 13.30 1.57 8.47 .000 Humorous Disparagement
-.089 (.556) -.015 -.160 .873
Anxiety2 -.020 (.061) -.031 -.331 .741 R2=0.001
Tables 35 and 36 indicate that the addition of anxiety did not affect the difference
between participants in the expectation of humor conditions and no expectation conditions.
Therefore, while anxiety was affected the independent variables, these effects did not
influence political knowledge or PIE scores.
Hypothesis 8 predicted that the effect of humorous disparagement on political
knowledge would be different for participants along dimensions of the moderator variables.
Hypothesis 8 was not supported. Results indicate that no difference was found for
participants exposed to humorous disparagement along levels of the measures of stereotype
belief (β=.182, t=.941, p=.349), stereotype awareness (β=-.045, t=-.429, p=.669), group
identification (β=-.214, t=-1.30, p=.197), domain identification (β=-.048, t=-.377, p=.707) or
efficacy (β=.033, t=.214, p=.831).

76
Table 35
Summary of Multiple Regression Analysis for Political Knowledge Scores (N=118) VARIABLES B SE(β) β t Sig.(p) (Constant) 12.42 1.15 10.76 .000 Humor Expected -.182 (.404) -.041 -.451 .653 Anxiety2 -.092 (.044) -.191 -2.09 .039 R2=0.036
Table 36
Summary of Multiple Regression Analysis for PIE Scores (N=118) VARIABLES B SE(β) β t Sig.(p) (Constant) 13.19 1.58 8.31 .000 Humor Expected .112 (.556) .019 .202 .840 Anxiety2 -.020 (.061) -.031 -.327 .744 R2=0.001
Similarly, the effect of non-humorous disparagement on political knowledge as
compared to the control group was no different for participants along levels of the measures
of stereotype belief (β=.238, t=1.18, p=.250), stereotype awareness (β=-.079, t=-.805,
p=.423), group identification (β=-.052, t=-.302, p=.763), domain identification (β=-.081, t=-
.667, p=.507) or efficacy (β=-.146, t=-1.00, p=.320).
The effect of humorous disparagement on PIE was no different for participants along
dimensions of stereotype belief (β=.101, t=.381, p=.704), stereotype awareness (β=.157,
t=1.09, p=.227), group identification (β=-.273, t=-1.25, p=.213), or domain identification
(β=-.099, t=-.618, p=.538).
The effect of non-humorous disparagement on PIE was no different for participants
along dimensions of the stereotype belief measure (β=.341, t=1.29, p=.200), stereotype
awareness measure (β=.155, t=1.21, p=.228), or group identification measure (β=-.153, t=-

77
.731, p=.467), but was different depending on how strongly participants identified politics as
an important domain (See Table 37).
Table 37
Summary of Multiple Regression Analysis for PIE Scores (N=92) VARIABLES B SE(β) β t Sig.(p) (Constant) 4.39 1.90 2.31 .023 Non-humorous disparagement
4.36 (2.31) .701 1.89 .063
Domain Score -.599 (.124) .762 4.81 .000 Non-humor*Domain -.323 (.152) -.834 -2.13 .036 R2=0.279
Hypothesis 9 predicted an interaction effect between humor expectancy and exposure
to disparaging political humor on political knowledge and PIE scores. It was hypothesized
that participants would score equally well on the political knowledge and PIE measures
under conditions of humor expectancy, regardless of whether the stimulus was humorous or
not. When unexpectedly exposed to humor, they were predicted to perform worse and
indicate lower PIE scores than when unexpectedly exposed to non-humorous disparagement.
Hypothesis 9 revealed an interesting interaction of the two independent variables on political
knowledge scores, though the predicted interaction was only partly supported.
First, political knowledge was regressed on both independent variables and no effect
was found for either variable alone, controlling for the other (See Tables 38 and 39).

78
Table 38
Summary of Multiple Regression Analysis for Political Knowledge Scores (N=118) VARIABLES B SE(β) β t Sig.(p) (Constant) 10.02 .354 28.30 .000 Humorous Disparagement
.119 (.411) .027 .289 .773
Humor Expected -.153 (.411) -.035 -.371 .711 R2=0.002
Table 39
Summary of Multiple Regression Analysis for PIE Scores (N=118) VARIABLES B SE(β) β t Sig.(p) (Constant) 12.74 .479 26.6 .000 Humorous Disparagement
-.093 (.556) -.016 -.167 .867
Humor Expected .119 (.556) .020 .213 .831 R2=0.001
Next, the dependent variables were regressed on the independent variables and the
interaction term. Table 40 shows that the two independent variables did not have a significant
interaction effect on PIE scores.
However, a significant interaction was found between the two independent variables
and political knowledge scores (See Table 41). As Table 41 indicates, at each level of the
humor expectation variable, political knowledge scores decreased for people that got humor
as compared to people who did not get humor, though this difference was not significant (β=-
.913, t=-1.61, p=.111). Interestingly, the inclusion of the interaction term reveals that
regardless of whether the participants received humorous or non-humorous disparagement,
scores were significantly lower for people made to expect humor as compared to people not
made to expect humor (β=-1.17, t=-2.07, p=.041).

79
Table 40
Summary of Multiple Regression Analysis for PIE Scores (N=118) VARIABLES B SE(β) β t Sig.(p) (Constant) 12.83 .554 23.181 .000 Humorous Disparagement
-.282 (.790) -.047 -.357 .722
Humor Expected -.067 (.783) -.011 -.085 .932 Humorous*Expect .377 (1.12) .054 .338 .736 R2=0.002
Table 41
Summary of Multiple Regression Analysis for Political Knowledge Scores (N=118) VARIABLES B SE(β) β t Sig.(p) (Constant) 10.53 .398 26.5 .000 Humorous Disparagement
-.913 (.568) -.207 -1.61 .111
Humor Expected -1.17 (.563) -.264 -2.07 .041 Humorous*Expect 2.06 (.803) .402 2.57 .012 R2=0.057
Whereas by themselves the expectation and presence of humor, controlling for the
other, resulted in significant and nearly significant decreases in political knowledge
respectively, the combination of both humor expectancy and a humorous stimulus negated
these decreases. In other words, although participants who expected humor performed
significantly worse than participants not expecting humor, and participants exposed to
humorous disparagement performed slightly worse than participants exposed to non-
humorous disparagement, participants who both expected and received humor performed as
well as participants not expecting humor and exposed to non-humorous disparagement, and
better than those participants who either expected and did not receive humor or did not
expect and did receive humor. The data indicate that the interaction counteracts the negative

80
effects of expecting or receiving humor. Thus, these apparent negative effects are only
proxies for either (a) not receiving humor when it was expected, or (b) receiving humor when
it was not expected.
Next, a full model regression was run to see if the interaction term was affected by
any of the mediating variables. As Table 42 indicates, the strength of this interaction was
unaffected by the inclusion of the mediators in the model.
Table 42
Summary of Multiple Regression Analysis for Political Knowledge Scores (N=118) VARIABLES B SE(β) β t Sig.(p) (Constant) 8.78 1.39 6.33 .000 Humorous Disparagement
-.854 (.496) -.193 -1.72 .088
Humor Expected -1.26 (.494) -.285 -2.55 .012 Humorous*Expect 2.05 (.703) .399 2.91 .004 PIE .341 (.062) .460 5.52 .000 Motivation .020 (.095) .020 .208 .836 Anx2 -.099 (.047) -.205 -2.11 .037 Counterargue -.043 (.102) -.035 -.420 .675 R2=0.057
So, how can one explain why participants unexpectedly exposed to humorous
disparagement performed slightly worse on a political knowledge test than participants
unexpectedly exposed to non-humorous disparagement? Participants in the no
expectation/non-humorous condition indicated they were more relaxed (M=4.03) than
participants in the no expectation/humorous condition (M=3.34), a nearly significant
difference (β=.689, t=1.83, p=.073). Scores on one of the questions used to assess stereotype
awareness were also different between these two groups. Participants in the humorous/no
expectation condition reported significantly stronger disagreement with the statement
“Stereotypes about young voters have not affected me personally” than participants in the

81
non-humorous/no expectation condition (β=.461, t=1.87, p=.067). However feeling relaxed
and that one has been personally affected did not reduce the effect of unexpected exposure to
humor (See Table 43).
Table 43
Summary of Multiple Regression Analysis for Political Knowledge Scores (N=59) VARIABLES B SE(β) β t Sig.(p) (Constant) 11.55 1.53 7.53 .000 Humor when Unexpected
-1.10 (.615) -.245 1.79 .079
Relaxed -.334 (.204) -.218 -1.64 .108 Affected Personally .091 (.312) .039 .291 .772 R2=0.090
How can one explain the difference in scores between people expecting and receiving
humor and expecting and not receiving humor? As compared to participants who expected
and did not receive humor, participants who expected and received humor indicated that they
more strongly agreed that they were relaxed, (β=.768, t=1.70, p=.094), that they “put a lot of
effort into answering the questions on the test,” (β=.321, t=1.62, p=.112), and more strongly
disagreed that “when I didn’t know the answer to a question, I didn’t care,” (β=-.424, t=-
1.59, p=.118). The inclusion of these variables did not reduce the effect of exposure to non-
humorous disparagement when humor was expected (See Table 44).
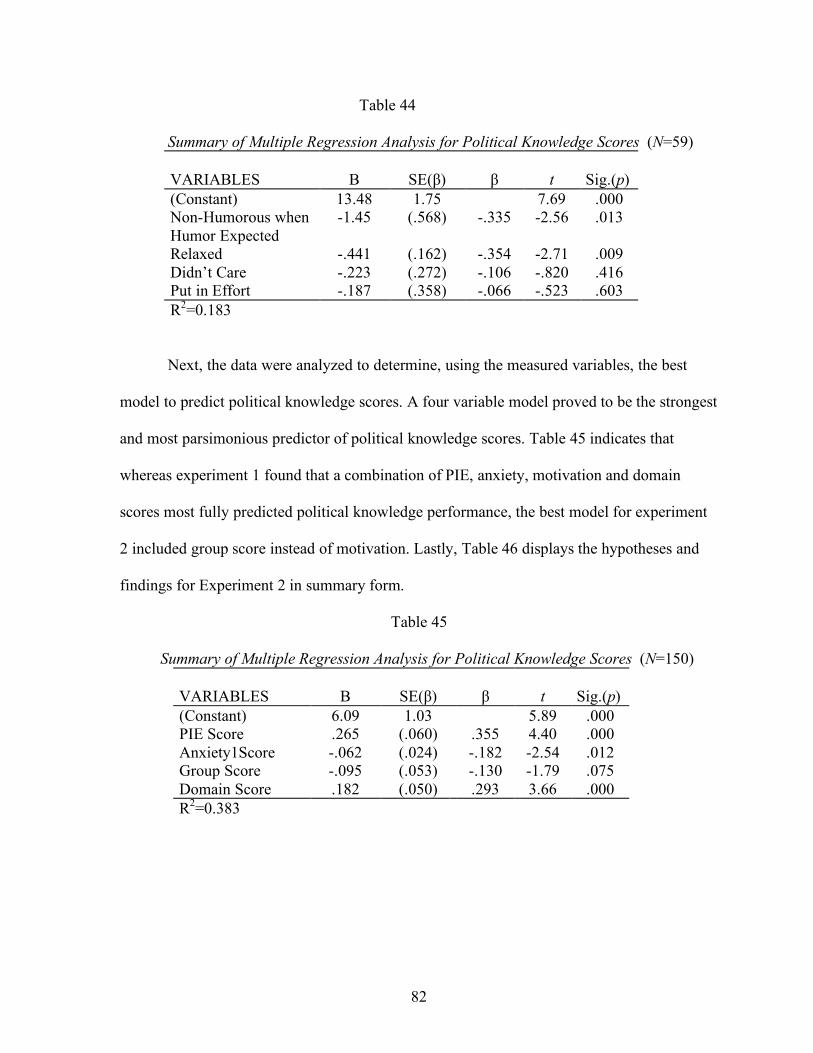
82
Table 44
Summary of Multiple Regression Analysis for Political Knowledge Scores (N=59) VARIABLES B SE(β) β t Sig.(p) (Constant) 13.48 1.75 7.69 .000 Non-Humorous when Humor Expected
-1.45 (.568) -.335 -2.56 .013
Relaxed -.441 (.162) -.354 -2.71 .009 Didn’t Care -.223 (.272) -.106 -.820 .416 Put in Effort -.187 (.358) -.066 -.523 .603 R2=0.183
Next, the data were analyzed to determine, using the measured variables, the best
model to predict political knowledge scores. A four variable model proved to be the strongest
and most parsimonious predictor of political knowledge scores. Table 45 indicates that
whereas experiment 1 found that a combination of PIE, anxiety, motivation and domain
scores most fully predicted political knowledge performance, the best model for experiment
2 included group score instead of motivation. Lastly, Table 46 displays the hypotheses and
findings for Experiment 2 in summary form.
Table 45
Summary of Multiple Regression Analysis for Political Knowledge Scores (N=150) VARIABLES B SE(β) β t Sig.(p) (Constant) 6.09 1.03 5.89 .000 PIE Score .265 (.060) .355 4.40 .000 Anxiety1Score -.062 (.024) -.182 -2.54 .012 Group Score -.095 (.053) -.130 -1.79 .075 Domain Score .182 (.050) .293 3.66 .000 R2=0.383

83
Table 46
Summary of Hypotheses for Experiment 2
+= supported, +?=limited support, - no support
Hypothesis Tables 33-36
Table 37
Table 41
No Table
H4
Exposure to humorous disparagement will have a greater negative effect on PIE and performance on the political knowledge test than will exposure to non-humorous disparagement.
-
H5 Participants in the humor expectancy conditions will indicate greater PIE and perform better on the political knowledge test than will participants in the no expectation conditions.
-
H6 Anxiety, motivation, and message counterarguing will mediate the effects of humor expectancy and exposure to disparaging political statements or humor on PIE and performance on the political knowledge test.
-
H7 PIE will mediate the effects of humor expectancy and exposure to disparaging political statements or humor on performance on a political knowledge test.
-
H8 Belief in the stereotype, awareness of the stereotype, and group and domain identification will moderate the influence of the disparaging statements or humor on PIE and political knowledge performance.
+? for domain and pk
H9 An interaction effect between humor expectancy and exposure to disparaging political humor on pk and PIE is predicted. Regardless of whether participants are exposed to the disparaging humor or statement, participants in the humor expectancy conditions will perform equally as well on the pk test and indicate equal levels of PIE. The effect of political humor will only be significant (resulting in a decrease in scores on both dependent measures) under the condition where it is unexpected.
+?

84
CHAPTER VII
DISCUSSION
Every night, millions of young citizens tune in to late-night television shows, where
they watch and potentially learn as they laugh at the foibles of the press, politicians, and the
public. In academic and journalistic circles, this trend towards infotainment as information
source has scholars questioning the role of humor in a democracy (e.g., Hart & Hartelius,
2007). This research sought to determine whether exposure to disparaging political humor
about their age group affected young voters’ attitudes and performance on a political
knowledge test.
Experiment 1 failed to support the hypothesis that young voters would feel less
politically efficacious or perform worse as a result of exposure to a manipulation that made
their membership in a stereotypically less knowledgeable demographic salient. While
participants did perform significantly worse when the test was described as diagnostic, this
effect was eliminated when age was made salient. It was reasoned that either being a young
voter was not seen by the participants as a sign of weakness or that the manipulation of
stereotype threat was not strong enough to find the anticipated effects. In both experiments,
participants tended to neither agree nor disagree with the statements on the awareness, belief,
domain, and group identification scales, and the effect of age and diagnostic salience or
either form of disparagement was rarely found to differ along levels of these measures.
Therefore, at least for the participants in this sample, being a young voter was not a strong or

85
negative part of their identity. However, since there were significant effects of disparagement
in experiment 2 under certain conditions, it seems that the age salience manipulation was too
weak to bring about the anticipated effects.
Something akin to stereotype threat effects did occur in experiment 2. Participants’
performance on the political knowledge test assimilated towards the stereotype when humor
was unexpectedly received or expected and not received. Humor therefore had two effects.
Humor when expected aided in the dismissal of disparaging messages. Humor when
unexpected aided in the fulfillment of the threat behind the disparaging message. Another
way of looking at these results is that non-humorous disparagement had no effect on political
knowledge scores when humor was unexpected, but did when humor was expected.
Therefore, the absence of humor when expected also led to stereotype threat effects.
What caused participants to perform worse when unexpectedly exposed to humor
may be different than what caused other participants to perform worse when not receiving the
humor they expected. Participants not expecting humor were able to dismiss the threat in the
non-humorous condition, but performed worse in the humorous condition, even though they
rated the joke as more humorous. Humor here had a significant negative effect on
performance, but not on attitudes. The data do not offer a clear answer for why performance
was inhibited. Controlling for anxiety, motivation and counterarguing, or political
information efficacy did not reduce the effects found in the interaction. More research is
necessary to determine what factors contributed to the declines in performance.
Similarly, more research is needed to determine why people performed worse in the
humor expectancy condition when humor was absent. The literature on affective expectations
led to the prediction that all statements from Jon Stewart would be interpreted the same way.

86
Although statements from Jon Stewart were found to be more humorous than the statements
coming from the journalist, participants who expected and did not receive humor rated the
joke as less humorous than participants who expected and did receive humor, and performed
worse on the political knowledge test. What the results indicate is that the absence of humor
was noticed on some level in the humor expectancy/non-humorous condition. The
expectation of humor (or a humorous mindset) was not enough to alleviate stereotype threat
effects. The presence of humor was needed to resolve whatever unaccounted for feelings or
thoughts were stirred up by the disparagement. Although affective expectations did influence
explicit ratings of humorousness to some degree, expectations, at least of humor, were not
found to be foolproof predictors of the way information affects behavior.
Although experiment 1 found that age salience did not create stereotype threat effects,
even without an expressed allegiance or sense of connection with young voters, the more
explicit disparagement in experiment 2 did cause stereotype threat effects under certain
conditions. This provides further evidence that stereotype threat effects may be induced in
people with little to no feelings of affiliation towards the stereotyped group or domain, or
little belief in or awareness of the stereotype.
Another possibility exists to explain the results of experiment 2. It may be that the
cause of the decrease in performance was due not to the presence or absence of humor but
merely the violation of expectations. Prior research indicates that experiencing a violation of
expectations can have dramatic effects on both physiological measures and task performance
(e.g., Mendes, Hunter, Jost, Blascovich, & Lickel, 2007). Perhaps any violation of
expectation, humorous or non-humorous, would have caused such a decrease. One way to
test this in additional experiments could be to include conditions in which participants read

87
unexpected nonsensical or gibberish quotes about young voters or other subjects from either
David Jennings or Jon Stewart. It could then be determined if a violation of expectations is
sufficient for performance inhibition or whether humor is the key ingredient.
Limitations and Future Research
There are several limitations to these experiments. First, people are not typically
exposed to disparaging humor in a laboratory setting, nor do they take political knowledge
tests (or any measure of performance) immediately after being exposed to disparagement.
Second, people typically watch, rather than read statements from Jon Stewart. It is likely that
different types of information processing occur when watching political humor as opposed to
reading it. Additionally, the statements are not identical, as the non-humorous one contains
37 words and the humorous one 28.
One weakness of the designs of these experiments is that all of the potential mediators
and moderators were completed after responses were given to the two main dependent
variables of interest, political knowledge and political information efficacy. The political
information efficacy measure was also in the position of coming after the main dependent
variable, but serving as both a mediator of that variable and a dependent variable all its own.
Another version of these experiments could isolate one mediator and have half of the
participants answer those questions immediately before completing the dependent measures.
The problem with doing so is that answering questions about anxiety for instance prior to
taking the political knowledge test would seem to prime the participants about the purpose of
the study. Additionally, the use of self-report in assessing the mediators of interest may be
unreliable (Wilson & Nisbett, 1978). It would be interesting to include more physiological

88
measures of anxiety (e.g., blood pressure, skin conductance) and humor enjoyment or
appreciation (e.g., smiling).
Another limitation that offers areas for future research is the homogeneity of the
sample. In both experiments, participants were mostly white females, and all participants
were college students at a highly competitive public university. The present research does not
make the case that all young citizens would react the same to humorous or non-humorous
disparagement, and thus leaves open the possibility for exploration of effects in other groups
of young people. It is important to test these effects with groups that might be less likely to
vote in the first place, including young citizens not enrolled in college. Along those same
lines, future research should include post-test measures of how strongly participants identify
with any number of social categories to which they might belong (e.g., race, gender, class).
In experiment 1, it is unclear why participants in the diagnostic condition performed worse
on the political knowledge test, yet this effect was removed when age salience was added. It
was theorized that the general statement about test diagnosticity triggered gender-related
stereotype threat in the largely female sample, as was found through more explicit means in
prior research (McGlone et al., 2006). With proper measurement, this could be verified.
These studies mark the beginning of a line of research into the ways that young voters
are affected by portrayals of their age group in the media. Experiment 2 lends strong support
to the idea that stereotype threat research can be used as a foundation for this research.
Before running experiment 2, additional disparaging jokes were considered for inclusion.
The rationale was that significant effects would not be expected from exposure to one joke.
Similarly, critics of humor might have argued that one joke was not enough show the
deleterious effects that humor can have. However, it was reasoned that stereotype threat

89
literature is full of examples wherein scholars found support for the theory simply by asking
people to select their age or gender from a drop-down box, or by flashing words associated
with a stereotyped group at a subliminal level. Therefore, if effects were not found based on
one instance of disparagement, it would not mean that disparaging humor does not have
negative effects in the short or certainly long term, but that more research would be needed.
Similarly, if effects of exposure to one joke were found to have a significant effect on young
citizens’ attitudes or performance on a political knowledge test, it could be argued that they
may not reveal the extent of the effect of continued exposure.
Having found an interesting interaction between the expectation of humor, exposure
to disparaging humor and performance on a political knowledge test, this research area can
expand to include more and different types of humor. It would be interesting to compare the
effects of the moderately humorous comments used as the stimulus for experiment 2 with
more humorous stimuli. Do the effects of unexpected exposure to disparaging humor
increase as the stimuli become more humorous? Are people more likely to dismiss
disparagement from a humorous source as it gets more humorous? Additionally, future
research should include post-test measures of attitudes towards the source (e.g. source liking,
credibility).
Finally, it would also be fitting to combine the two experiments and test the effects of
exposure to disparagement in the high threat (age salience/diagnostic salience) condition as
compared to the low threat (neither age nor diagnostic salience) condition.
Conclusion
Although the candidate for whom the majority of young voters cast their ballots in
2008 was elected, the stereotype of an ill-informed youth did not end. A report (Ladner,

90
2009) issued by the Oklahoma Council of Public Affairs, a conservative think tank, and
picked up by online sources such as Digg.com and Dailykos.com, detailed striking gaps in
political knowledge amongst high school students in the state of Oklahoma. The survey
found that less than three percent of those surveyed were able to correctly answer at least six
out of ten questions from a United States citizenship exam. Notably, fourteen percent of
respondents were able to name the author of the Declaration of Independence, and 23%
correctly named the first George Washington as the first president of the United States.
Similarly, the election of Barack Obama did not mark the end of the stereotypical
portrayal of an uninformed and unengaged youth in political satire. In the May 12th, 2009
episode of The Daily Show, Jason Jones traveled to Arizona State University after school
officials refused to grant President Obama an honorary degree when he acted as
commencement speaker. Three male students defended their university on camera. One
student says honorary degrees should be reserved for important people and “heads of state.”
When asked if they believe that Ben Franklin was a worthy enough president to receive an
ASU honorary degree, two out of the three students say yes, not knowing he never held the
office. When the third student catches their mistake, Jones congratulates him, then asks him
about Alexander Hamilton. The student mistakenly agrees that Hamilton would have been a
worthy enough president to receive an honorary degree at ASU.
This research found that concerns about the effects of humor on late-night shows on
young citizens may not be warranted, since as long as the programs’ content is humorous, the
expectation of humor that comes with attention to the program aids in the dismissal of
information as “just joking.” However, Jon Stewart and other late-night hosts often make
impassioned, non-humorous pleas during their programs. Audiences may notice that these

91
statements are non-humorous, and as a result interpret them differently. Non-humorous
statements from humorous sources may be more persuasive or influential than they would be
if they were humorous. Similarly, news broadcasts frequently include humorous material as a
way to increase their audience size and seem more relatable. When young citizens’ read the
latest poll or news story about their age group’s lack of political knowledge, they may not be
susceptible to stereotype threat effects. However, if a journalist uses clever language or
imagery, these news stories may impact future political performance. It is here, in the blurred
line between news and entertainment, where concerns about humor may be appropriate. It is
unclear when or how people make the decision that a certain program is to be attended to in a
serious or non-serious manner, or whether they do so at all. Assuming that people approach
their news and entertainment programming with certain expectations of what the tone of the
content will be, this research found that the violation of those expectations can have dramatic
effects.

92
Appendix A
Political knowledge test
What is the name of the U.S. Senate majority leader? _________________ (Harry Reid, Reid) What specific position is held by John Roberts? _________________________ (Chief Justice, Chief Justice of the Supreme Court, Supreme Court Justice) Please list the three branches of government.
___________________ ___________________ ___________________ (legislative, judicial, executive)
How much of a majority is required for the U.S. Senate and House to override a presidential veto? _______ (2/3) (66%) (67%)
Whose responsibility is it to determine if a law is constitutional or not? _______________________ (The Supreme Court) Which political party has the most members in the House of Representatives in Washington? ___________ (Democrat, Democrats, Democratic) What is the term commonly used to refer to the first ten amendments of the U.S. Constitution? __________ (Bill of Rights) How many years is the term of office for a U.S. Senator? _______ (Six, 6) Which political party has the most members in the U.S. Senate? ________________ (Democrat, Democrats, Democratic) What state do you consider to be your home state? _________________(not counted as right/wrong) Please name one U.S. Senator from your home state. _____________________ (Will be verified individually) What political party does this Senator belong to? ____________________ (Will be verified individually) What is the name of the current Secretary of State? _______________________ (Hillary Clinton, Clinton) Which of the following issues is most important to you? ______Abortion/Reproductive Rights ______Education ______Environment ______Gun Control ______Taxes

93
For the issue selected as important, the person answered a question about which party traditionally held a
certain viewpoint. If they selected Abortion, they were asked, “Which party traditionally supports a woman’s
right to choose to have an abortion?” (Democratic) For education, “Which party traditionally supports the
privatization of education?” (Republican) For those who choose environment, they were asked, “Which party
traditionally supports tougher government regulations on emissions?” (Democratic) For gun control, “Which
party traditionally supports stricter gun laws?” (Democratic) For taxes, “Which party traditionally supports
lower taxes? (Republican)

94
Appendix B
Political information efficacy scale (From Kaid, McKinney, & Tedesco, 2007)
I consider myself well-qualified to participate in politics. 1 2 3 4 5 Strongly Disagree Strongly Agree I think that I am better informed about politics and government than most people. 1 2 3 4 5 Strongly Disagree Strongly Agree I feel that I have a pretty good understanding of the important political issues facing our country. 1 2 3 4 5 Strongly Disagree Strongly Agree If a friend asked me about the election, I feel I would have enough information to help my friend figure out who to vote for. 1 2 3 4 5 Strongly Disagree Strongly Agree

95
Appendix C
Mediators for Experiments 1 and 2
Anxiety/Threat (From Mattson (1960), used in Stone et al. (1999))
Please indicate how you felt while taking the test
1 2 3 4 5 6 7 (Reversed) Uneasy At ease 1 2 3 4 5 6 7 Comfortable Uncomfortable 1 2 3 4 5 6 7 (Reversed) Upset Peaceful 1 2 3 4 5 6 7 Relaxed Tense 1 2 3 4 5 6 7 In Control Not in Control
Please answer the following questions about how you felt while taking the political knowledge test.
I was worried about confirming the stereotype that young voters are uninformed about politics.
1 2 3 4 5 Strongly Disagree Strongly Agree
I was worried about how my performance would represent other young people.
1 2 3 4 5 Strongly Disagree Strongly Agree
I was worried about performing up to my abilities.
1 2 3 4 5 Strongly Disagree Strongly Agree
When I didn’t know the answer to a question, I felt like I was confirming the stereotype that young voters are uninformed about politics.
1 2 3 4 5 Strongly Disagree Strongly Agree
When I didn’t know the answer to a question, I was able to stay calm. (reverse scored)
1 2 3 4 5 Strongly Disagree Strongly Agree
When I didn’t know the answer to a question, I was able to focus. (reverse scored)

96
1 2 3 4 5 Strongly Disagree Strongly Agree
I thought the test got harder as it went along.
1 2 3 4 5 Strongly Disagree Strongly Agree
When I didn’t know the answer to a question, I didn’t care. (reverse scored)
1 2 3 4 5 Strongly Disagree Strongly Agree
Motivation/Effort
Please answer the following questions about how you felt while taking the political knowledge test.
I felt the need to distance myself from the stereotype that young voters are uninformed about politics.
1 2 3 4 5 Strongly Disagree Strongly Agree
I tried to distance myself from the stereotype that young voters are uninformed about politics.
1 2 3 4 5 Strongly Disagree Strongly Agree
I wanted to finish the test as quickly as possible.
1 2 3 4 5 Strongly Disagree Strongly Agree
When I didn’t know the answer to a question, I tried harder on the next one.
1 2 3 4 5 Strongly Disagree Strongly Agree
I put a lot of effort into answering the questions on the test.
1 2 3 4 5 Strongly Disagree Strongly Agree
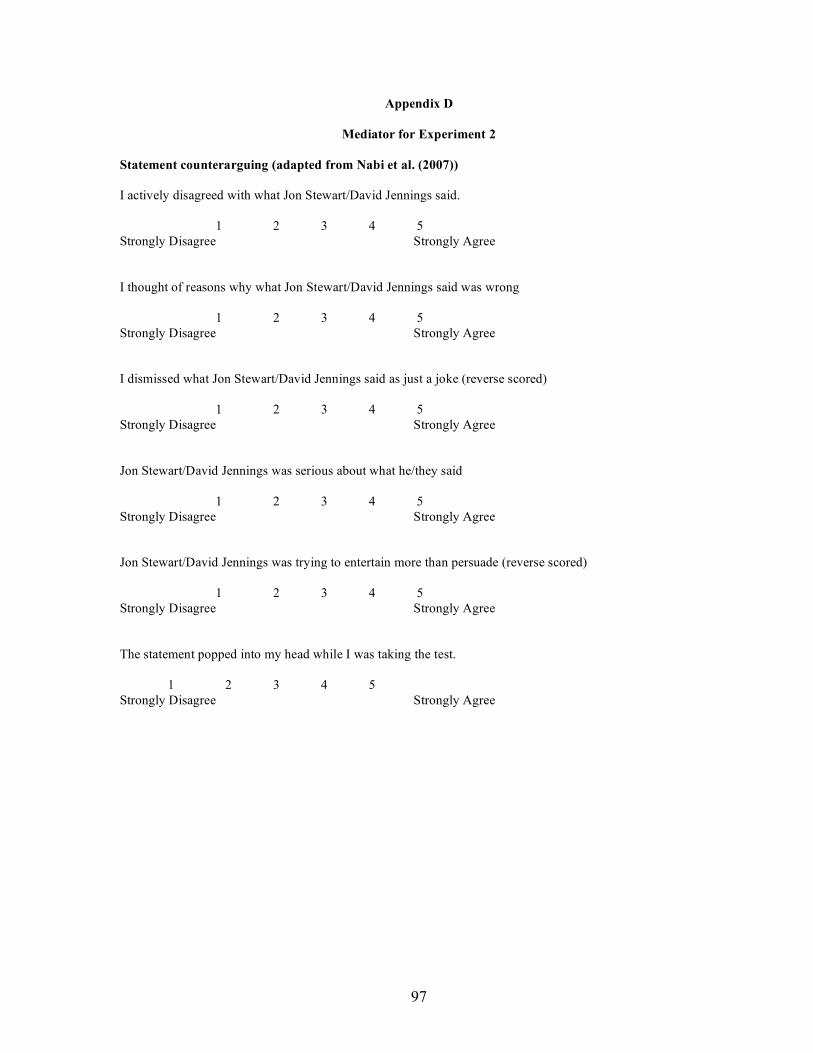
97
Appendix D
Mediator for Experiment 2
Statement counterarguing (adapted from Nabi et al. (2007))
I actively disagreed with what Jon Stewart/David Jennings said.
1 2 3 4 5 Strongly Disagree Strongly Agree
I thought of reasons why what Jon Stewart/David Jennings said was wrong
1 2 3 4 5 Strongly Disagree Strongly Agree
I dismissed what Jon Stewart/David Jennings said as just a joke (reverse scored)
1 2 3 4 5 Strongly Disagree Strongly Agree
Jon Stewart/David Jennings was serious about what he/they said
1 2 3 4 5 Strongly Disagree Strongly Agree
Jon Stewart/David Jennings was trying to entertain more than persuade (reverse scored)
1 2 3 4 5 Strongly Disagree Strongly Agree
The statement popped into my head while I was taking the test.
1 2 3 4 5 Strongly Disagree Strongly Agree

98
Appendix E
Moderators for Experiments 1 and 2
Belief in Stereotype
Before taking the test, I believed the stereotype that young voters tend to be uninformed about politics.
1 2 3 4 5 Strongly Disagree Strongly Agree
As a group, young voters are less informed about politics than the average citizen.
1 2 3 4 5 Strongly Disagree Strongly Agree
What percentage of young voters is poorly informed about politics?
20% 30% 40% 50% 60% 70% 80%
Awareness of Stereotype (Adapted from Pinel (1999))
Stereotypes about young voters have not affected me personally. (R)
0 1 2 3 4 5 6 strongly disagree neither agree nor disagree strongly agree
I never worry that my level of political knowledge will be viewed as stereotypical of young voters. (R)
0 1 2 3 4 5 6 strongly disagree neither agree nor disagree strongly agree
When interacting with older Americans, I feel like they interpret all of my political opinions in terms of the fact
that I am a young voter.
0 1 2 3 4 5 6 strongly disagree neither agree nor disagree strongly agree
Most older Americans do not judge young voters on their level of political knowledge. (R)
0 1 2 3 4 5 6 strongly disagree neither agree nor disagree strongly agree
My being a young voter does not influence how other young voters act with me. (R)

99
0 1 2 3 4 5 6 strongly disagree neither agree nor disagree strongly agree I almost never think about the fact that I am a young voter. (R)
0 1 2 3 4 5 6 strongly disagree neither agree nor disagree strongly agree
My being a young voter does not influence how older Americans act with me. (R)
0 1 2 3 4 5 6 strongly disagree neither agree nor disagree strongly agree
Most older Americans have more anti- young voter thoughts than they actually express.
0 1 2 3 4 5 6 strongly disagree neither agree nor disagree strongly agree
I often think that older Americans are unfairly accused of being anti-young voter. (R)
0 1 2 3 4 5 6 strongly disagree neither agree nor disagree strongly agree
Most older Americans have a problem viewing young voters as equals.
0 1 2 3 4 5 6 strongly disagree neither agree nor disagree strongly agree
Group Identification (Adapted from Luhtanen and Crocker (1992))
Overall, being a young voter has very little to do with how I feel about myself (reverse coded)
1 2 3 4 5 Strongly Disagree Strongly Agree
Being a young voter is an important reflection of who I am
1 2 3 4 5 Strongly Disagree Strongly Agree
Being a young voter is unimportant to my sense of what kind of person I am (reverse coded)
1 2 3 4 5 Strongly Disagree Strongly Agree
In general, being a young voter is an important part of my self-image
1 2 3 4 5 Strongly Disagree Strongly Agree

100
Domain Identification (Adapted from Spencer et al. (1999) and Aronson et al. (1999))
I like politics.
1 2 3 4 5 Strongly Disagree Strongly Agree
Knowledge of politics is important to me.
1 2 3 4 5 Strongly Disagree Strongly Agree
I want to seek a career in politics.
1 2 3 4 5 Strongly Disagree Strongly Agree
I would describe myself as politically informed.
1 2 3 4 5 Strongly Disagree Strongly Agree
I would be embarrassed if I did not do well on a political knowledge test.
1 2 3 4 5 Strongly Disagree Strongly Agree General self-efficacy (From Schwarzer & Jerusalem, 1995) How true are these statements for you? 1. I can always manage to solve difficult problems if I try hard enough.
Not at all true Hardly True Moderately True Exactly True
2. If someone opposes me, I can find the means and ways to get what I want. Not at all true Hardly True Moderately True Exactly True
3. It is easier for me to stick to my aims and accomplish my goals. Not at all true Hardly True Moderately True Exactly True
4. I am confident that I could deal efficiently with unexpected events. Not at all true Hardly True Moderately True Exactly True
5. Thanks to my resourcefulness, I know how to handle unforeseen situations. Not at all true Hardly True Moderately True Exactly True
6. I can solve most problems if I invest the necessary effort. Not at all true Hardly True Moderately True Exactly True
7. I can remain calm when facing difficulties because I can rely on my coping abilities. Not at all true Hardly True Moderately True Exactly True
8. When I am confronted with a problem, I can usually find several solutions.

101
Not at all true Hardly True Moderately True Exactly True
9. If I am in trouble, I can usually think of a solution. Not at all true Hardly True Moderately True Exactly True
10. I can usually handle whatever comes my way. Not at all true Hardly True Moderately True Exactly True
Demographics
Were you eligible to vote in the 2008 election?
Did you vote in the 2008 election?
Do you intend to vote in the 2012 election?
Please list your age ___
Please list your gender ____
Please list your race ____
Which of the following political parties best exemplifies your political beliefs?
Republican
Democrat
Independent
Green
Libertarian
Other

102
Appendix F
Humorousness manipulation check
How funny would you rate that statement?
0 1 2 3 4 5 6 7 8 Not at all A little Somewhat Very Extremely How clever would you rate that statement? 0 1 2 3 4 5 6 7 8 Not at all A little Somewhat Very Extremely How confusing would you rate that statement?
0 1 2 3 4 5 6 7 8 Not at all A little Somewhat Very Extremely
How complicated would you rate that statement?
0 1 2 3 4 5 6 7 8 Not at all A little Somewhat Very Extremely
How informative would you rate that statement?
0 1 2 3 4 5 6 7 8 Not at all A little Somewhat Very Extremely
How negative would you rate that statement?
0 1 2 3 4 5 6 7 8 Not at all A little Somewhat Very Extremely

103
Appendix G
Humor expectancy manipulation check
I expected the statement to be funny.
1 2 3 4 5 Strongly Disagree Strongly Agree
I expected to have to figure out/work through a joke.
1 2 3 4 5 Strongly Disagree Strongly Agree
I was looking forward to reading the statement.
1 2 3 4 5 Strongly Disagree Strongly Agree
I assumed I would enjoy the statement.
1 2 3 4 5 Strongly Disagree Strongly Agree
I assumed the statement would be important. (reverse coded)
1 2 3 4 5 Strongly Disagree Strongly Agree
I assumed the statement would be lighthearted.
1 2 3 4 5 Strongly Disagree Strongly Agree
I assumed the statement would be complex. (reverse coded)
1 2 3 4 5 Strongly Disagree Strongly Agree
104
References
Ambady, N., Paik, S. K., Steele, J., Owen-Smith, A., & Mitchell, J. P. (2004). Deflecting negative self-relevant stereotype activation: The effects of individuation. Journal of Experimental Social Psychology, 40, 401-408.
Aronson, J., Lustina, M. J., Good, C., Keough, K., Steele, C. M., & Brown, J. (1999). When
white men can’t do math: Necessary and sufficient factors in stereotype threat. Journal of Experimental Social Psychology, 35, 29-46.
Aronson, J., Quinn, D., & Spencer, S. (1998). Stereotype threat and the academic
underperformance of minorities and women. Prejudice: The target's perspective (pp. 83-103). San Diego, CA US: Academic Press.
Abrams, D., Eller, A., & Bryant, J. (2006). An age apart: The effects of intergenerational
contact and stereotype threat on performance and intergroup bias. Psychology and Aging, 21, 691-702.
Andreoletti, C., & Lachman, M. E. (2004). Susceptibility and resilience to memory aging
stereotypes: Education matters more than age. Experimental Aging Research, 30, 129–148.
Balcetis, E., & Dunning, D. (2006). See what you want to see: Motivational influences on
visual perception. Journal of Personality & Social Psychology, 91(4), 612-625. Bandura, A. (1986). Social foundations of thought and action: A social cognitive theory.
Englewood Cliffs, NJ: Prentice Hall. Bandura, A. (1997). Self-efficacy: The exercise of control. New York: Freeman. Barber, J. D. (1969). Citizen politics. Chicago: Markham. Bargh, J. A., Chen, M., & Burrows, L. (1996). Automaticity of social behavior: Direct effects
of trait construct and stereotype activation on action. Journal of Personality and Social Psychology, 71(2), 230-244.
Baron, R. M., & Kenny, D. A. (1986). The moderator-mediator variable distinction in social
psychological research: Conceptual, strategic and statistical considerations. Journal of Personality and Social Psychology, 51(6), 1173-1182.
Baumeister, R. F. (1984). Choking under pressure: Self-consciousness and paradoxical
effects of incentives on skillful performance. Journal of Personality and Social Psychology, 46(3), 610-620.
Baumgartner, J. C. (2007). Humor on the next frontier: Youth, online political humor, and
the JibJab effect. Social Science Computer Review, 25(3), 319-338.

105
Baumgartner, J. C., & Morris, J. S. (2006). The Daily Show effect: Candidate evaluations, efficacy, and American youth. American Politics Research, 34(3), 341-367.
Baumgartner, J. C., & Morris, J. S. (2008). One ‘Nation,’ under Stephen? The effects of The
Colbert Report on American youth, Journal of Broadcasting and Electronic Media, 52(4), 622-643.
Baurelein, M. (2008). The dumbest generation: How the digital age stupefies young
Americans and jeopardizes our future (Or, don’t trust anyone under 30). New York: Penguin Books.
Baym, G. (2005). The Daily Show: Discursive integration and the reinvention of political
journalism. Political Communication, 22, 259-76. Beilock, S. L., Rydell, R. J., & McConnell, A. R. (2007). Stereotype threat and working
memory: Mechanisms, alleviations, and spillover. Journal of Experimental Psychology: General, 136, 256-276.
Bennett, W. L. (2007). Relief in hard times: A defense of Jon Stewart’s comedy in an age of
cynicism. Critical Studies in Media Communication, 24(3), 278-283. Berelson, B. R., Lazarsfeld, P. F., & McPhee, W. N. (1954). Voting: A study of opinion
formation in a presidential campaign. Chicago: University of Chicago Press. Berger, A. A. (1993). An anatomy of humor. New Brunswick: New Jersey. Transaction. Bergeron, D. M., Block, C. J., & Echtenkamp, B. A. (2006). Disabling the able: Stereotype
threat and women's work performance. Human Performance, 19, 133-158. Boskin, J. (1990). American political humor: Touchables and taboos. International Political
Science Review, 11(4), 473-482. Brake, R. (2008, February 15). Civic literacy better foundation for political process. The
Tundra Drums. Retrieved from http://www.thetundradrums.com. Brown, R. P., & Pinel, E. C. (2003). Stigma on my mind: Individual differences in the
experience of stereotype threat. Journal of Experimental Social Psychology, 39, 626–633.
Cadinu, M., Maass, A., Lombardo, M., & Frigerio, S. (2006). Stereotype threat: The
moderating role of locus of control beliefs. European Journal of Social Psychology, 36, 183-197.
Campbell, A., Converse, P. E., Miller, W. E., & Stokes, D. E. (1960). The American voter.
New York: John Wiley and Sons.

106
Campbell, A., Gurin, G., & Miller, W. E. (1954). The voter decides. Evanston, IL: Row, Peterson and Company.
Campbell, A., & Kahn, R. L. (1952). The people elect a president: A study of the presidential
vote. Ann Arbor: University of Michigan Survey Research Center. Cao, X. (2008). Political comedy shows and knowledge about primary campaigns: The
moderating effects of age and education. Mass Communication and Society, 11, 43-61.
Cao, X., & Brewer, P. R. (2008). Political comedy shows and public participation in politics.
International Journal of Public Opinion Research, 20(1), 90-99. Chalabaev, A., Sarrazin, P., Stone, J., & Cury, F. (2008). Do achievement goals mediate
stereotype threat?: An investigation on females' soccer performance. Journal of Sport & Exercise Psychology, 30(2), 143-158.
Chalabaev, A., Stone, J., Sarrazin, P., & Croizet, J. (2008). Investigating physiological and
self-reported mediators of stereotype lift effects on a motor task. Basic & Applied Social Psychology, 30(1), 18-26.
Chasteen, A. L., Bhattacharyya, S., Horhota, M., Tam, R., & Hasher, L. (2005). How feelings
of stereotype threat influence older adults' memory performance. Experimental Aging Research, 31, 235-260.
Cullen, M. J., Hardison, C. M., & Sackett, P. R. (2004). Using SAT-grade and ability-job
performance relationships to test predictions derived from stereotype threat theory. Journal of Applied Psychology, 89, 220-230.
Cullen, M. J., Waters, S. D., & Sackett, P. R. (2006). Testing stereotype threat theory
predictions for math-identified and non-math-identified students by gender. Human Performance, 19, 421-440.
Davis, M. S. (1993). What’s so funny? The comic conception of culture and society. Chicago:
University of Chicago Press. Delli Carpini, M. X. (1999). In search of the informed citizen: What Americans know about
politics and why it matters. Paper presented at conference on “The Transformation of Civic Life,” Middle Tennessee University.
Delli Carpini, M. X., & Keeter, S. (1991). Stability and change in the U.S. public’s
knowledge of politics. Public Opinion Quarterly, 55(4), 583-612. Delli Carpini, M. X., & Keeter, S. (1993). Measuring political knowledge: Putting first things
first. American Journal of Political Science, 37(4), 1179-1206.

107
Dijksterhuis, A., Spears, R., Postmes, T., Stapel, D. A., Koomen, W., van Knippenberg, A., & Scheepers, D. (1998). Seeing one thing and doing another: Contrast effects in automatic behavior. Journal of Personality and Social Psychology, 75(4), 862-871.
Feldman, L., & Young D. G. (2008). Late-night comedy as a gateway to traditional news: An
analysis of time trends in new attention among late-night comedy viewers during the 2004 presidential primaries. Political Communication, 25(4), 401-422.
Ferguson, M. A., & Ford, T. E. (2008). Disparagement humor: A theoretical and empirical
review of psychoanalytic, superiority, and social identity theories. Humor, 21(3), 283-312.
Fiske, S., & Taylor, S. (1991). Social cognition (2nd ed.). New York, NY England: Mcgraw-
Hill Book Company. Ford, T. E., & Ferguson, M. A. (2004). Social consequences of disparagement humor: A
prejudiced norm theory. Personality and Social Psychology Review, 8(1), 79-94. Frantz, C. M., Cuddy, A. J. C., Burnett, M., Ray, H., & Hart, A. (2004). A threat in the
computer: The race implicit association test as a stereotype threat experience. Personality and Social Psychology Bulletin, 30, 1611-1624.
Freud, S. (1905/1960). Jokes and their relation to the unconscious. (J. Strachey, Trans.). New
York: W. W. Norton. Fox, J. R., Koloen, G., & Sahin, V. (2007). No joke: A comparison of substance in The Daily
Show with Jon Stewart and broadcast network television coverage of the 2004 presidential campaign. Journal of Broadcasting and Electronic Media, 51(2), 213-227.
Geers, A. L., & Lassiter, G. D. (2005). Affective assimilation and contrast: Effects of
expectations and prior stimulus exposure. Basic and Applied Social Psychology, 25, 313-325.
Gilbert, D. T., & Hixon, J. G. (1991). The trouble of thinking: Activation and application of
stereotypic beliefs. Journal of Personality and Social Psychology, 60(4), 509-517. Goldfarb, J. C. (2001). The cynical society: The culture of politics and the politics of culture
in American life. Chicago: University of Chicago Press. Gray, J., Jones, J. P., & Thompson, E. (2009). The state of satire, the satire of state. In J.
Gray (Ed.) Satire TV: Politics and comedy in the post-network era. (pp. 3-36). New York: New York University Press.
Hariman, R. (2008). Political parody and public culture. Quarterly Journal of Speech, 94(3),
247-272.

108
Hart, R. P., & Hartelius, E. J. (2007). The political sins of Jon Stewart. Critical Studies in Media Communication, 24(3), 263-272.
Hayes, A. F. (2009). Beyond Baron and Kenny: Statistical mediation analysis in the new
millennium. Communication Monographs, 76, 408-420. Heatherton, T., & Polivy, J. (1991). Development and validation of a scale for measuring
state self-esteem. Journal of Personality & Social Psychology, 60(6), 895-910. Hertzler, J. (1970). Laugher: A socio-scientific analysis. New York: Exposition Press. Hilton, J., & von Hippel, W. (1996). Stereotypes. Annual Review of Psychology, 47, 237-271. Hirsch, E. D. (1988). Cultural literacy: What every American needs to know. Boston:
Houghton Mifflin. Hollander, B. (2005). Late-night learning: Do entertainment programs increase political
campaign knowledge for young voters? Journal of Broadcasting & Electronic Media, 49, 402-415.
Inzlicht, M., & Ben-Zeev, T. (2000). A threatening intellectual environment: Why females
are susceptible to experiencing problem-solving deficits in the presence of males. Psychological Science, 11, 365-371.
Jacoby, S. (2008). The age of American unreason. New York: Pantheon Books. Jamieson, J. P., & Harkins, S. G. (2007). Mere effort and stereotype threat performance
effects. Journal of Personality and Social Psychology, 93, 544-564. Janes, L. M., Olson, J. M. (2000). Jeer pressure: The behavioral effects of observing ridicule
of others. Personality and Social Psychology Bulletin, 26(4), 474-485. Jennings, M. (1996). Political knowledge over time and across generations. Public Opinion
Quarterly, 60(2), 228-252. Jones, J. P. (2005). Entertaining politics: New political television and civic culture. Lanham,
MD: Rowman & Littlefield. Kaid, L. L., McKinney, M., & Tedesco, J. (2007). Introduction: Political information efficacy
and young voters. American Behavioral Scientist, 50(9), 1093-1111. Kant, I. (1892/1987). Critique of judgment. (W. S. Pluhar, Trans). Indianapolis, Ind: Hackett
Pub. Co. Katz, A., & Pexman, P. (1997). Interpreting figurative statements: Speaker occupation can
change metaphor to irony. Metaphor and Symbol, 12(1), 19-41.

109
Koenig, A. M., & Eagly, A. H. (2005). Stereotype threat in men on a test of social sensitivity. Sex Roles, 52, 489-496.
Kohut, A. (2000). Audiences fragmented & skeptical: The tough job of communicating with
voters. Pew Research Center for the People & the Press. Retrieved October 30, 2009 from http://people-press.org/reports/pdf/46.pdf
Kray, L. J., Thompson, L., & Galinksy, A. (2001). Battle of the sexes: Gender stereotype
confirmation and reactance in negotiations. Journal of Personality and Social Psychology, 80, 942–958.
Kuklinski, J., & Quirk, P. (2001). Conceptual foundations of citizen competence. Political
Behavior, 23(3), 285-311. Lambert, R. D., Curtis, J. E., Kay, B. J., & Brown, S. D. (1988). The social sources of
political knowledge. Canadian Journal of Political Science, 21(2), 359-374. Lazarsfeld, P. F., Berelson, B., & Gaudet, H. (1948). The people’s choice: How the voter
makes up his mind in a presidential campaign. New York: Columbia University Press.
Levy, B. (1996). Improving memory in old age through implicit self stereotyping. Journal of
Personality and Social Psychology, 71, 1092-1107. Levy, B., & Langer, E. (1994). Aging free from negative stereotypes: Successful memory in
China among the American deaf. Journal of Personality and Social Psychology, 66(6), 989-997.
Luhtanen, R., & Crocker, J. (1992). A collective self-esteem scale: Self-evaluation of one's
social identity. Personality and Social Psychology Bulletin, 18(3), 302-318. Martin, J. (2008, April 18). Young voters: What they know. Raleigh News and Observer.
Retrieved from http://www.newsobserver.com Marx, D. M., & Goff, P. A. (2005). Clearing the air: The effect of experimenter race on
target's test performance and subjective experience. British Journal of Social Psychology, 44, 645-657.
Marx, D. M., & Stapel, D. A. (2006). Distinguishing stereotype threat from priming effects:
On the role of the social self and threat-based concerns. Journal of Personality and Social Psychology, 91, 243-254.
Mendes, W., Hunter, S., Jost, J., Blascovich, J., & Lickel, B. (2007). Threatened by the
unexpected: Physiological responses during social Interactions with expectancy-violating partners. Journal of Personality & Social Psychology, 92(4), 698-716.

110
Marx, D. M., Stapel, D. A., & Muller, D. (2005). We can do it: The interplay of construal orientation and social comparison under threat. Journal of Personality and Social Psychology, 88, 432-446.
McCluskey, M. R., Deshpande, S., Shah, D. V., & McLeod, D. M. (2004). The efficacy gap
and political participation: When political influence fails to meet expectations. International Journal of Public Opinion Research, 16(4), 437-455.
McGhee, P. E. (1972). On the cognitive origins of incongruity humor: Fantasy assimilation
versus reality assimilation. In J. H. Goldstein & P. E. McGhee (Eds.), The psychology of humor (pp. 61-79). New York: Academic.
McGlone, M., Aronson, J., & Kobrynowicz, D. (2006). Stereotype threat and the gender gap
in political knowledge. Psychology of Women Quarterly, 30(4), 392-398. Mondak, J., & Davis, B. (2001). Asked and answered: Knowledge levels when we will not
take “Don't know” for an answer. Political Behavior, 23(3), 199-224. Morreall, J. (1987). The philosophy of humor and laughter. Albany: State University of New
York Press. Nabi, R. L., Moyer-Guse, E., & Byrne, S. (2007). All joking aside: A serious investigation
into the persuasive effect of funny social issue messages. Communication Monographs, 74(1), 29-54.
Nachman, G. (2004). Seriously funny: The rebel comedians of the 1950s and 1960s. New
York: Back Stage Books. National Annenberg Election Survey. (2004). Daily Show viewers knowledgeable about
presidential campaign, national Annenberg election survey Shows. Press release. Retrieved October 30, 2009 from http://www.annenbergpublicpolicycenter.org/Downloads/Political_Communication/naes/2004_03_late-night-knowledge-2_9-21_pr.pdf
National Geographic Education Foundation. (2002). National Geographic – Roper 2002 global geographic literacy survey. Retrieved April 20, 2008 from http://www.nationalgeographic.com/foundation/pdf/NGS-Roper-
GeoLitReport2002.pdf. Nestruck, J. K. (2004, October 30). Voting under the influence: Campaign jokes are no
laughing matter. Montreal Gazette. Neuman, W. R. (1986). The paradox of mass politics: Knowledge and opinion in the
American electorate. Cambridge, MA: Harvard University Press.

111
Nisbett, R. E., & Wilson, T. D. (1978). The accuracy of verbal reports about the effects of stimuli on evaluations and behavior. Social Psychology, 41(2), 118-131.
Niven, D., Lichter, S. R., & Admunson, D. (2003). The political content of late night
comedy. Harvard International Journal of Press/Politics, 8, 118-133. Olson, J. M., Maio, G. R., & Hobden, K. L. (1999). The (null) effects of exposure to
disparagement humor on stereotypes and attitudes. Humor, 12(2), 195-219. Osborne, J. W. (2001). Testing stereotype threat: Does anxiety explain race and sex
differences in achievement? Contemporary Educational Psychology, 26, 291-310. Osborne, J. W. (2007). Linking stereotype threat and anxiety. Educational Psychology, 27,
135-154. Oswald, D. L., & Harvey, R. D. (2000-2001). Hostile environments, stereotype threat, and
math performance among undergraduate women. Current Psychology: Developmental, Learning, Personality, Social, 19, 338-356.
Perrin, A. J. (2006). Citizen speak: The democratic imagination in American life. Chicago:
University of Chicago Press. Peterson, R. L. (2008). Strange bedfellows: How late-night comedy turns democracy into a
joke. New Brunswick: Rutgers University Press. Pew Research Center for the People and the Press. (2004). Cable and Internet loom large in
fragmented political news universe. Retrieved October 12, 2007, from http://people-press.org/reports/display.php3?ReportID=200
Pew Research Center for the People & the Press. (2007). What Americans know: 1989- 2007. Public knowledge of current affairs little changed by news and information
revolutions. Retrieved April 20, 2008 from http://people-press.org/reports/pdf/319.pdf Pexman, P., & Olineck, K. (2002). Understanding irony: How do stereotypes cue speaker
intent?. Journal of Language & Social Psychology, 21(3), 245-274. Pinel, E. C. (1999). Stigma consciousness: The psychological legacy of social stereotypes. Journal of Personality and Social Psychology, 76(1), 114 – 128. Pontari, B. A., & Schlenker, B. R. (2000). The influence of cognitive load on self-
presentation: Can cognitive busyness help as well as harm social performance? Journal of Personality and Social Psychology, 78(6), 1092-1108.
Purdie, S. (1993). Comedy: The mastery of discourse. London: Harvester Wheatsheaf.

112
Ross, M. L., & York, L. (2007). “First, they’re foreigners”: The Daily Show with Jon Stewart and the limits of dissident laughter. Canadian Review of American Studies, 37(3), 351-370.
Sackett, P. R., Hardison, C. M., & Cullen, M. J. (2004). On interpreting stereotype threat as
accounting for African American – White differences on cognitive tests. American Psychologist, 59, 7–13.
Schmader, T. (2002). Gender identification moderates stereotype threat effects on women's
math performance. Journal of Experimental Social Psychology, 38, 194-201. Schmader, T., & Johns, M. (2003). Converging evidence that stereotype threat reduces
working memory capacity. Journal of Personality and Social Psychology, 85, 440-452.
Schmader, T., Johns, M., & Forbes, C. (2008). An integrated process model of stereotype
threat effects on performance. Psychological Review, 115, 336-356. Schwarzer, R., & Jerusalem, M. (1995). Generalized self-efficacy scale. In J. Weinman, S.
Wright, & M. Johnston. Measures in health psychology: A user’s portfolio. Causal and control beliefs (pp. 35-37). Windsor, England: NFER-NELSON.
Shenkman, R. (2008). Just how stupid are we? Facing the truth about the American voter. New York: Basic Books. Shih, M., Ambady, N., Richeson, J., Fujita, K., & Gray, H. (2002). Stereotype performance
boosts: The impact of self-relevance and the manner of stereotype activation. Journal of Personality and Social Psychology, 83(3), 638-647.
Smith, E. R. A. N. (1989). The unchanging American voter. Berkeley: University of
California Press. Smith, J. L. (2004). Understanding the process of stereotype threat: A review of mediational
variables and new performance goal directions. Educational Psychology Review, 16(3), 177-206.
Smith, J. L., & White, P. H. (2002). An examination of implicitly activated, explicitly
activated, and nullified stereotypes on mathematical performance: It's not just a woman's issue. Sex Roles, 47, 179-191.
Solhaug, T. (2006). Knowledge and self-efficacy as predictors of political participation and
civic attitudes: With relevance for educational practice. Policy Futures in Education, 4(3), 265-278.
Spencer, S. J., Steele, C. M., & Quinn, D. M. (1999). Stereotype threat and women's math
performance. Journal of Experimental Social Psychology, 35, 4-28.

113
Steele, C. M. (1997). A threat in the air: How stereotypes shape intellectual identity and performance. American Psychologist, 52, 613-629.
Steele, C. M., & Aronson, J. (1995). Stereotype threat and the intellectual test performance of
African-Americans. Journal of Personality and Social Psychology, 69, 797-811. Stewart, J. (Writer), & Barsh, A. (Director). (2008). Trendspotting. [Television series
segment]. In J. Stewart (Executive producer), The Daily Show with Jon Stewart. New York, NY: Viacom.
Stone, J. (2002). Battling doubt by avoiding practice: The effect of stereotype threat on self-
handicapping in white athletes. Personality and Social Psychology Bulletin, 28, 1667-1678.
Stone, J., Lynch, C. I., Sjomeling, M., & Darley, J. M. (1999). Stereotype threat effects on
black and white athletic performance. Journal of Personality and Social Psychology, 77, 1213-1227.
Stone, J. & McWhinnie, C. (2008). Evidence that blatant versus subtle stereotype threat cues
impact performance through dual processes. Journal of Experimental Social Psychology, 44, 445-452.
Stossel, J. (2008, October 9). Maybe it’s your civic duty not to vote. 20/20. ABC. Transcript
retrieved from http://abcnews.go.com/Politics/Vote2008/story?id=5985719&page=1 Tajfel, H., & Turner, J. C. (1986). The social identity theory of intergroup behavior. In W. G.
Austin and S. Worcheland (Eds.), Psychology of intergroup relations (pp. 7-24). Chicago: Nelson-Hall.
Test, G. A. (1991). Satire: Spirit and art. Tampa: University of South Florida Press. Whitney, D. C., and Wartella E. (1988). The public as dummies. Knowledge:
creation, diffusion, utilization. Science Communication 10(2), 99-110. Wilson, T. D., Lisle, D. J., Kradt, D., & Wetzel, C. G. (1989). Preferences as expectation-
driven inferences: Effects of affective expectations on affective experience. Journal of Personality and Social Psychology, 56, 519-530.
Wood, R. (2008, September 26). Students need to be informed on election issues. The Daily
Gamecock. Retrieved from http://www.dailygamecock.com Xenos, M. A., & Becker, A. B. (2009). Moments of Zen: Effects of The Daily Show on
information seeking and political learning. Political Communication, 26(3), 317-332. Young, D. G. (2004). Late-night comedy in election 2000: Effects of political knowledge and
partisanship. Journal of Broadcasting & Electronic Media, 48, 1-22.

114
Young, D. G. (2006). Late-night comedy and the salience of candidate’s caricatured traits in the 2000 election. Mass Communication and Society, 9, 339-366.
Young, D. G., & Tisinger, R. M. (2006). Dispelling late-night myths: News consumption
among late-night comedy viewers and the predictors of exposure to various late-night shows. Harvard International Journal of Press/Politics, 11(3), 113-134.
Zaller, J. (1990). Political awareness, elite opinion leadership, and the mass survey response.
Social Cognition, 8(1), 125-153. Zillmann, D. (1983). Disparagement humor. In P. E. McGhee & J. H. Goldstein (Eds.)
Handbook of humor research: Vol. 1. Basic issues (pp. 85-107). New York: Springer-Verlag.
Related Documents