The Italian NPL market What’s next…?! June 2018 www.pwc.com/it/npl

Welcome message from author
This document is posted to help you gain knowledge. Please leave a comment to let me know what you think about it! Share it to your friends and learn new things together.
Transcript

The Italian NPL marketWhat’s next…?!
June 2018www.pwc.com/it/npl


The Italian market for Non Performing Exposures (“NPE”) over the year 2017 and the first months of 2018 met expectations in terms of vitality and fervor. With regard to Bad Loans, volumes lie at €165 billion (GBV) and €64 billion (NBV) as at December 2017. Their massive reduction, occurred from December 2016 to December 2017 (less 18% in terms of GBV and less 26% in terms of NBV), has been driven mainly by a few mega deals of loans derecognition (€17.7 billion disposed by Unicredit through Project Fino, €16.8 billion disposed by Banca Popolare di Vicenza and Veneto Banca through their bailout). Eventually the NPL disposals in 2017 reached a volume of €64 billion.
The reduction trend even continued over the first quarter of 2018 featuring further mega deals such as the disposal of €24 billion of Bad loans sold by MPS through securitisation and the disposal of €10.8 billion of Bad Loans sold by Intesa Sanpaolo in the context of the sale of their NPL platform to Intrum.
Alongside the circa €37 billion of transactions already closed in 2018 from 1st January, we foresee a pipeline for further NPE transactions to be announced in the year equal to circa €28 billion, including several securitisation operations under GACS (supported by the Italian Government guarantee on the senior notes) and the disposals of some Unlikey to Pay (“UtP”) portfolios. These announced transactions will even fuel the NPL secondary market. UtP exposures reached €94 billion of GBV as at December 2017 (vs. €117 billion one year before) definitively surpassing the level of Bad Loans in terms of NBV (€66 billion vs €64 billion respectively). Italian banks are still pondering over how to best structure the management of their UtP (internally by their specialised departments or externally by specialised servicers), and effectively implement disposal plans of their UtP exposures (sales of UtP, net of the disposals associated to several bailouts, were limited in terms of numbers of transactions and in EUR volumes in 2017).
The first months of 2018 also witnessed a significant increase in the NPE provisions within the Italian banks led by the application of IFRS9 for the first time. The adoption of the international accounting principle led the average NPE provision of the top ten Italian banks as at March 2018 to 59% from 54% as at December 2017 (in particular Bad Loans’ provision achieved 66% from 61% and the Unlikely to Pay’s provision reached 38% from 35%).
Over the last eighteen months, the real trendsetter of the NPL market was the consolidation path of the servicing arena through the acquisition of several workout platforms by big players.
The transactions included either the captive units of some Italian banks (e.g. the platform of MPS, Carige and Intesa Sanpaolo acquired respectively by Cerved/Quaestio, Credito Fondiario and Intrum) and some independent players (e.g. CAF, Phoenix Asset Management, Parr Credit, FBS acquired respectively by Intrum, Anacap/Pimco, Arrow and Banca IFIS). We believe that new players could enter the market in 2018 for further platform disposals, mainly driven by the future opportunities of the servicing market such as i) the forecasted rise in the volumes of Bad Loans outsourced by the Italian banks to external servicers, ii) the management of the Unlikely to Pay exposures which actually represent the next frontier of NPE servicing.
In the context of consolidation, a leading role could be held by the “challenger banks”. These players, leveraging their banking license, their in-house workout management expertise and restructuring capabilities, could offer a wide range of services in the market either in the consolidated field on Bad Loans’ collection and in pioneering the field of Unlikely to Pay loans’ management. We believe that the challenger banks could represent the evolution of the traditional banking business model. Through i) new lending to UtP, sub-performing and subprime borrowers, ii) specialty finance and iii) expertise in restructuring measures, the challenger banks could massively affect the dynamics of these portions of NPE portfolios that at least up until now did not result in significant positive outcome within the Italian banking system.
The maneuvers we see in the market even reflect the requests of the Regulators addressed to the Italian banks. These recommendations aim, on the one hand, at redefining their NPE strategies to reduce the NPE ratios and on the other hand, at reshaping their operating model to progress towards a further industrialization of the overall loans management. Regulatory pressure on the Italian banks aimed at reducing their NPE ratio is focusing even on UtP that always more frequently are under investigation in the course of the audit of the Regulators. ECB guidelines, whose application will be extended in Italy to the Less Significant banks, the calendar provisioning (within the ECB Addendum) and the aforementioned first time adoption of IFRS9, will continue to drive the strategic decisions of the Italian banks in the near future.
Despite the political turmoil currently perceived by the market, in light of all the movements occurred over the last year, we believe that the Italian NPE market is still rich with interesting opportunities and new potential and innovative initiatives. Thus we wonder what’s next…?!
Foreword & Content
Fedele PascuzziBusiness Recovery Services [email protected]
Pier Paolo MasenzaFinancial Services Deals [email protected]
Vito RuscignoCo-Head [email protected]
Alessandro BiondiCo-Head [email protected]

4 | The Italian NPL market - What's next...?!
Content
Macroeconomic Scenario
Italian Real Estate Market
Legal and regulatory framework update
Italian NPL Market
Italian Banks overview
Focus on UtP Italian Market
The Servicing Market
Reulatory changes
Recent market activity and outlook
Appendix
5
8
12
16
20
27
34
43
52
55
The terms of NPL (“Non Performing Loans”) and NPE (“Non Performing Exposures”) are used interchangeably within this study. This recommendation was even explained in the “Guidance to banks on non-performing loans (March 2017)” released by ECB – Banking Supervision*
* “Guidance to banks on non-performing loans (March 2017)” by ECB, par. 1.2, pag.6 “Scope of this Guidance”and par. 5.1, pag. 47 “Purpose and Overview”

PwC | 5
Macroeconomic Scenario
Key Message: Following the 2017 positive trend, the European economic performance is expected to be shown robust also in 2018, with inflation set to remain stable. During 2018, total investments should continue growing, since they could still benefit from supportive financing conditions, a stronger business sentiment and higher corporate profitability.
6 | The Italian NPL market - What's next...?!
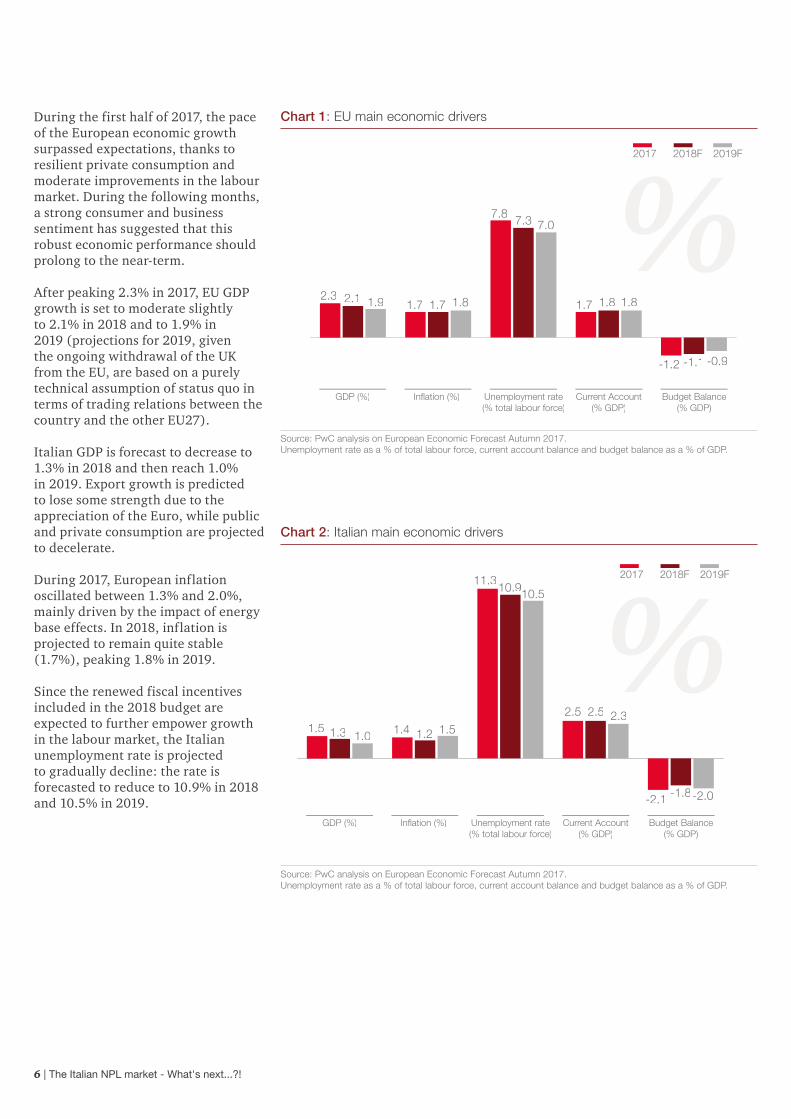
During the first half of 2017, the pace of the European economic growth surpassed expectations, thanks to resilient private consumption and moderate improvements in the labour market. During the following months, a strong consumer and business sentiment has suggested that this robust economic performance should prolong to the near-term.
After peaking 2.3% in 2017, EU GDP growth is set to moderate slightly to 2.1% in 2018 and to 1.9% in 2019 (projections for 2019, given the ongoing withdrawal of the UK from the EU, are based on a purely technical assumption of status quo in terms of trading relations between the country and the other EU27).
Italian GDP is forecast to decrease to 1.3% in 2018 and then reach 1.0% in 2019. Export growth is predicted to lose some strength due to the appreciation of the Euro, while public and private consumption are projected to decelerate.
During 2017, European inflation oscillated between 1.3% and 2.0%, mainly driven by the impact of energy base effects. In 2018, inflation is projected to remain quite stable (1.7%), peaking 1.8% in 2019.
Since the renewed fiscal incentives included in the 2018 budget are expected to further empower growth in the labour market, the Italian unemployment rate is projected to gradually decline: the rate is forecasted to reduce to 10.9% in 2018 and 10.5% in 2019.
Chart 1: EU main economic drivers
Chart 2: Italian main economic drivers
Source: PwC analysis on European Economic Forecast Autumn 2017. Unemployment rate as a % of total labour force, current account balance and budget balance as a % of GDP.
Source: PwC analysis on European Economic Forecast Autumn 2017. Unemployment rate as a % of total labour force, current account balance and budget balance as a % of GDP.
GDP (%) Inflation (%) Current Account (% GDP)
Unemployment rate(% total labour force)
Budget Balance(% GDP)
2017 2018F 2019F
2.3 2.1 1.9 1.7 1.71.7 1.8 1.8 1.8
7.8 7.3 7.0
-1.2 -1.1 -0.9
GDP (%) Inflation (%) Current Account (% GDP)
Unemployment rate(% total labour force)
Budget Balance(% GDP)
2017 2018F 2019F
1.31.51.0 1.4 1.2 1.5
11.310.910.5
2.5 2.5 2.3
-2.1 -1.8-2.0
-4
GDP (%) Inflation Current Account (% GDP)
Unemployment rate(% total labour force)
Budget Balance(% GDP)
2015 2016F 2017F
0.6 0.9 1.0
0.10.2
1.1
11.911.4 11.3
2.2 2.1 2.1
-2.6 -2.5-1.5

PwC | 7
Chart 3: Total investments volume trend
Table 1: Government Gross Debt Ratio per country
Source: PwC analysis on European Economic Forecast Autumn 2017.
Source: PwC analysis on European Economic Forecast Autumn 2017.
The EU current account surplus is set to exhibit a stable trend (1.8% for both 2018 and 2019): in fact, notwithstanding robust import growth, net trade should contribute only marginally to growth over the next 2 years. In Italy the surplus is forecasted to reach 2.5% in 2018 and 2.3% in 2019.
In the first half of 2017, higher demand expectations, supportive financing conditions, lower uncertainty, strong business sentiment and increasing corporate profitability contributed to a positive setting for corporate investment. Investments are forecast to go on growing at this robust pace, before slowing down in 2019.
The improved outlook for nominal GDP growth and low interest rate levels generate favourable snowball effects in the public sector deleveraging process, with Government Gross Debt Ratios projected to follow a downward trend in almost all Member States (for example, for Italy, this Ratio is set to be 130.8% in 2018 and 130.0% in 2019).
Government Gross Debt Ratio (% GDP)
2014 2015 2016 2017 2018F 2019FTrend
2018-2019F
Italy 131.8 131.5 132.0 132.1 130.8 130.0
EU 88.2 86.1 84.8 83.5 81.6 79.8
Spain 100.4 99.4 99.0 98.4 96.9 95.5
France 95.0 95.8 96.5 96.9 96.9 96.9 =
UK 87.4 88.2 88.3 86.6 85.3 84.2
Germany 74.6 70.9 68.1 64.8 61.2 57.9
2014 2015 2016 2017 2018F 2019F
EUItaly
3.53.0
-2.3
3.43.8
3.73.1
2.71.9
2.8 2.5
3.8
-4.0
-2.0
0.0
2.0
4.0

8 | The Italian NPL market - What's next...?!
Italian Real Estate Market
Key Message: In 2017, the Italian Real Estate market registered a 2.1% growth compared to 2016, mainly driven by transactions related to residential assets. Investments in Real Estate reached €11.1 billion in 2017, with offices continuing to represent the major asset class for investment.

PwC | 9
Volume of Real Estate transactions in 2017
In 2017, the Italian real estate market has been continuing on its positive trend, driven mainly by sales of residential and industrial properties.
The most significant percentage growth, compared to the previous year, was recorded in the industrial building sector (+6.7%). See Table 2.
Residential sales in 2017 have increased throughout each region of Italy with respect to 2016. The North showed the greatest positive results, with a 3.4% increase over 2016, followed by the Centre and South with +1.9% and +1.4%, respectively. See Table 3.
During 2017, non residential asset classes showed a slight decrease, accounting for 2.5% compared to 2016. While continuing to account for a small proportion of the total, the industrial segment is the sector registering the highest growth rate, at 6.7%. See Table 4.
Appurtenances (which include garages, basements and parking spots) and other sectors are showing a strong decrease, due to provisional data.
Table 2: Italian NTN1 comparison by sector
Source: PwC publication “Real Estate Market Overview – Italy 2017”. 1. NTN is the number of standardized real estate units sold, taking into account the share of the property transferred. 2. Appurtenances comprehend properties such as basements, garages or parking spots. 3. The sector “Other” includes hospitals, clinics, barracks, telephone exchanges and fire stations.
Asset typeQ1
2016Q2
2016Q3
2016Q4
2016Q1
2017Q2
2017Q3
2017Q4
20172016 2017
Delta (%) 2016-2017
Residential 115,194 143,298 123,476 146,896 121,972 145,527 122,373 152,608 528,865 542,480 2.6%
Office 2,025 2,413 2,510 3,000 2,362 2,486 2,584 2,922 9,946 10,354 4.1%
Retail 6,776 7,598 7,188 9,024 6,215 7,176 6,340 8,384 30,586 28,115 -8.1%
Industrial 2,121 2,897 2,565 3,704 2,329 2,996 2,894 3,818 11,287 12,038 6.7%
Total 126,116 156,206 135,738 162,624 132,878 158,186 134,191 167,732 580,684 592,987 2.1%
Appurtenances2 87,554 110,015 94,007 119,427 85,291 101,566 85,386 111,646 411,003 383,889 -6.6%
Other3 10,792 13,400 12,726 15,660 12,663 14,464 12,661 16,963 52,578 56,751 7.9%

10 | The Italian NPL market - What's next...?!
Table 3: Residential NTN by geographic area
Source: PwC publication “Real Estate Market Overview – Italy 2017".
Area Region Year 2015 Year 2016 Year 2017Delta (%)
2015-2016Delta (%)
2016-2017
NorthProvinces 72,648 89,901 93,060 23.7% 3.5%
No Provinces 157,819 192,015 198,394 21.7% 3.3%
Total 230,467 281,916 291,454 22.3% 3.4%
CenterProvinces 45,425 51,577 53,027 13.5% 2.8%
No Provinces 49,041 58,159 58,805 18.6% 1.1%
Total 94,466 109,736 111,832 16.2% 1.9%
SouthProvinces 33,931 38,921 40,385 14.7% 3.8%
No Provinces 85,771 98,292 98,809 14.6% 0.5%
Total 119,703 137,214 139,194 14.6% 1.4%
ItalyProvinces 152,004 180,400 186,472 18.7% 3.4%
No Provinces 292,632 348,465 356,008 19.1% 2.2%
Total 444,636 528,865 542,480 18.9% 2.6%
Table 4: Non residential NTN by geographic area
Source: PwC publication “Real Estate Market Overview – Italy 2017”.
NTN YE 2017 Office Q1 2017 Q2 2017 Q3 2017 Q4 2017 2016 2017Delta (%)
2016-2017North 1,385 1,455 1,528 1,777 6,096 6,145 0.8%
Center 573 527 541 586 1,969 2,227 13.1%
South 404 504 515 559 1,881 1,982 5.3%
9,946 10,354 4.1%
NTN YE 2017 Retail Q1 2017 Q2 2017 Q3 2017 Q4 2017 2016 2017Delta (%)
2016-2017
North 2,843 3,400 3,081 4,052 15,003 13,376 (10.8%)
Center 1,434 1,629 1,485 2,002 6,822 6,550 (4.0%)
South 1,938 2,147 1,774 2,330 8,761 8,189 (6.5%)
30,586 28,115 (8.1%)
NTN YE 2017 Industrial
Q1 2017 Q2 2017 Q3 2017 Q4 2017 2016 2017Delta (%)
2016-2017
North 1,536 1,997 1,919 2,620 7,344 8,072 9.9%
Center 381 501 424 622 1,871 1,928 3.1%
South 412 498 550 577 2,073 2,037 (1.7%)
11,287 12,038 6.7%

PwC | 11
Chart 5: Investments in the non residential Real Estate industry – Asset type
Source: PwC publication “Real Estate Market Overview – Italy 2017”. *”Other” includes banks, public administration and sovereign funds.
Investments in the non residential Real Estate market
In 2017, the Italian commercial real estate market recorded a transaction volume of €11.1 billion, 22% more compared to 2016, confirming the increasing investor confidence and demand for Italian real estate. The investment recovery has started in 2013 reaching the highest point in 2017, the best year ever for Italian real estate investment since the record level of €10 billion in 2007.
The strong growth was driven by the Office sector, €3.9 billion invested, which represent 35% of the total volumes of transactions. However, there is a reduction in the Office sector relative share on total (44% in 2016), in favor of other types of investments such as the Industrial, Hotel and “Other” ones. The Retail sector registered an increase by 6% over the same period. Industrial estates (+255) is growing fast, but the lack of supply across the country obliges the investors to widen their areas of interest and to concentrate on value added operations.
Milan and Rome still represent key markets for investments, accounting for 32% and 11% of the total investment volume in 2017, respectively. However, some investors have adapted their strategies to the dynamic market and started to consider secondary locations as well.
Chart 4: Investments in the non residential Real Estate industry - Investor type
Source: PwC publication “Real Estate Market Overview – Italy 2017”.
2010 2011 2012 2013 2014 2015 2016 2017
73%
27%
74%
26%
30%
70%
22%
78%
27%
40%
73%60%83%
17%
413
4,383
1,744
5,130
5,221
8,100 9,100
11,100
Italian investors Foreign investors Total investments (€m)
30%
70%
Tourist
Mixed
Other*
Retail
Offices
Industrial
44%
35%
12%
10%
5%
22%
16%
25%
7%
7%
12%
2017
20165%
€9,100 mln
€11,100 mln

12 | The Italian NPL market - What's next...?!
Constant waves of regulatory evolutions are putting the financial industry players under pressure

PwC | 13
The regulatory framework is on an ongoing evolution which keeps shaping and influencing the entire financial industry. It no longer concerns only significant institu-tions and banks: the scope is extended to include the less significant institutions as well financial intermediaries and credit servicers and purchasers.
Most importantly, each wave of regulatory reforms affects the industry in a dynamic way, meaning that besides any one-off impact the true impact has a forward looking dimension leading towards an adoption of comprehensive strategies and measures in an innovative and structured manner.
Calendar Provisioning (ECB Addendum) vs European Commission Proposal
Timely NPL provisioning and write-offs continue to be a matter of constant elaboration and a critical element in the shaping of the institutions’ strategy and operating plan. Following the initial draft of the Addendum to the ECB NPL Guidelines (the final addendum was published on 15th March 2018) the European Commission also published a consultation on the regulation of the minimum NPE Coverage on the 14th March 2018.
While the Addendum of the ECB is a Pillar 2 requirement and applicable to all significant banks supervised by the ECB, the European Commission proposal is a Pillar 1 requirement, therefore binding, and is applicable to all banks based on the update of the Capital Requirement Regulation (CRR).
Guidelines on NPL Management for the Less Significant Institutions
The Bank of Italy, published in January 2018, the final version of the NPL Guidelines addressed to the Less Significant Institutions. The final version of the Guidelines is mostly* in line with the consultation published on September 2017, providing clear indications to banks on issues concerning strategy, governance and rules of conduct (as evidenced on PwC NPL Report Dec. 17 - Ready for the Breakthrough).
Ongoing regulatory pressures
Key potential impacts of the Addendum
Calendar Provisioning (ECB Addendum) & EU Commission Proposal
Guidelines for Less Significant Institutions
IFRS 9 First Time Adoption
Credit Servicers Directive Proposal
A
C
B
B
D
A
Increased capital / P&L charges for the banks, taking into consideration an impairment equal to 100% of the residual amount of the loan.
Acceleration of the recovery activity with the objective to reduce the impairment levels.
Increase in the number of disposal operations aimed at reducing total impairment levels as well as the level of sustainable losses.
Potential reduction in price expectations deriving from the combination of: increase in the number of disposal operations and increase of the negotiating power of the potential NPL buyers.
* Indicatively in the final version statistical methods for the valuation of real estate collateral can be used for Gross exposures under €300k instead of €150k when in consultation.
14 | The Italian NPL market - What's next...?!
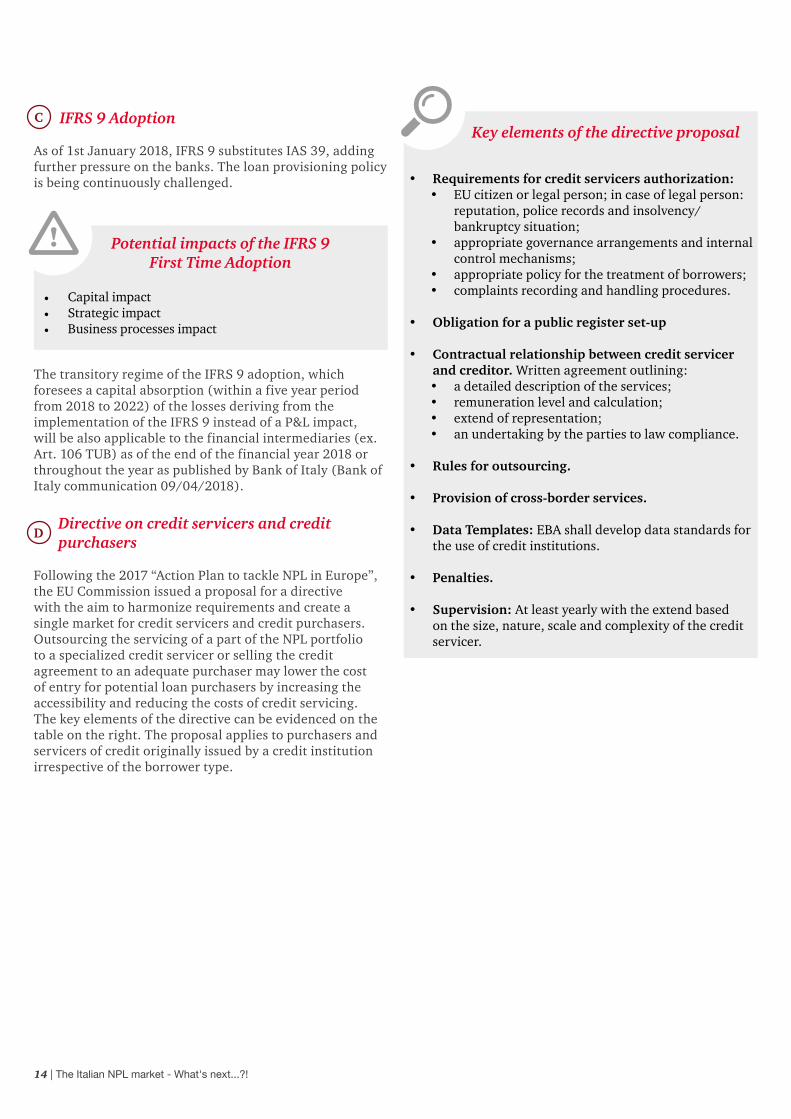
IFRS 9 Adoption
As of 1st January 2018, IFRS 9 substitutes IAS 39, adding further pressure on the banks. The loan provisioning policy is being continuously challenged.
The transitory regime of the IFRS 9 adoption, which foresees a capital absorption (within a five year period from 2018 to 2022) of the losses deriving from the implementation of the IFRS 9 instead of a P&L impact, will be also applicable to the financial intermediaries (ex. Art. 106 TUB) as of the end of the financial year 2018 or throughout the year as published by Bank of Italy (Bank of Italy communication 09/04/2018).
Directive on credit servicers and credit purchasers
Following the 2017 “Action Plan to tackle NPL in Europe”, the EU Commission issued a proposal for a directive with the aim to harmonize requirements and create a single market for credit servicers and credit purchasers. Outsourcing the servicing of a part of the NPL portfolio to a specialized credit servicer or selling the credit agreement to an adequate purchaser may lower the cost of entry for potential loan purchasers by increasing the accessibility and reducing the costs of credit servicing. The key elements of the directive can be evidenced on the table on the right. The proposal applies to purchasers and servicers of credit originally issued by a credit institution irrespective of the borrower type.
C
D
Potential impacts of the IFRS 9 First Time Adoption
• Capital impact• Strategic impact• Business processes impact
Key elements of the directive proposal
• Requirements for credit servicers authorization:• EU citizen or legal person; in case of legal person:
reputation, police records and insolvency/bankruptcy situation;
• appropriate governance arrangements and internalcontrol mechanisms;
• appropriate policy for the treatment of borrowers;• complaints recording and handling procedures.
• Obligation for a public register set-up
• Contractual relationship between credit servicerand creditor. Written agreement outlining:• a detailed description of the services;• remuneration level and calculation;• extend of representation;• an undertaking by the parties to law compliance.
• Rules for outsourcing.
• Provision of cross-border services.
• Data Templates: EBA shall develop data standards forthe use of credit institutions.
• Penalties.
• Supervision: At least yearly with the extend basedon the size, nature, scale and complexity of the creditservicer.

PwC | 15
Key Potential impacts of the IFRS 9 FTA
Capital impact* Strategic impact Business processes impact• ECB: According to a study
performed by the ECB a 40bps impact is estimated for the significant banks while a 59bps impact on the CET1 Ratio for the less significant institutions.
• Bank of Italy: As it concerns the Italian banks the equivalent CET 1 impact is estimated to be equal to 37 bps for the significant institutions, while for the less significant institutions equal to 47 bps.
• Client selection: Exposures will be more vulnerable to deteriorating status migration.
• Collateral Management: The presence of high quality collaterals can mitigate the effects of a Stage migration.
• Duration: The probability of default of the exposures is potentially greater with the increase of the duration of the same exposure.
• Origination: necessity to adopt a forward looking view on loan origination.
• Decision making powers.
• Pricing Risk – Adjusted models: will need to be adjusted to consider the increased cost of risk.
• Credit monitoring: increased importance of EWIs.
• People Management: increased responsibility will fall on the retail network.
*Source: ECB press release 24/11/2017; Bank of Italy financial stability Report November 2017.

16 | The Italian NPL market - What's next...?!
Challenger Banks value proposition Key Message: banking and financial services are
undergoing a radical transformation.The so-called challenger banks are spreading across the market, thanks to their slim structure that allows them to focus on niche segments not covered by the traditional banking market.

PwC | 17
Overview
The banking credit crunch that hit the Italian market over the last years generated an amplified effect in terms of lack of credit facilities on the SME segment, which represent 95% of Italian enterprises. In spite of the economic recovery, banks continue to curb financing.
The traditional banks seem to be unsuited to revive the situation as: • traditional credit processes are no more suitable for
SME’s firm as the typical credit deals are not profitablefor the bank;
• credit origination is still based on traditional channels:no digital experience for SME’s;
• the traditional banking system is unable to providean efficient exploitation of credit enhancementopportunities;
• SME is tracked as “high risk profile counterpart” fortraditional banks.
Both the obsolescence of Traditional Banks’ credit processes and SME’s high risk profile give rise to the need for alternative finance players (challenger banks / specialized lenders), able to focus on specific market segments rather than the entire retail banking value chain.
The goal of challenger banks is to disrupt the traditional banking system with innovative models, mostly based on “state of the art” technology, and to obtain profits in niche segments, without pursuing a “generalist” approach. In particular the suggested model leverages on:• sectors not covered comprehensively by traditional
banks;• business model for all economic cycles (during the crisis
NPL sector boomed and some players setup new nichebusiness lines);
• highly scalable business (through digital channelsavoided physical network constraints);
• low risk assets: if risk is mitigated via creditor/debtorselectivity or Public Government warranty.
Chart 6: Some attractive aspects of challenger banks
+20% -30% +15% +2%
ROECost Income
ratioDividend Pay Out
Divident Yield
Traditional Bank -4% -63% -45% -3%
Challenger Bank -24% -30-35% -60% -5%
18 | The Italian NPL market - What's next...?!
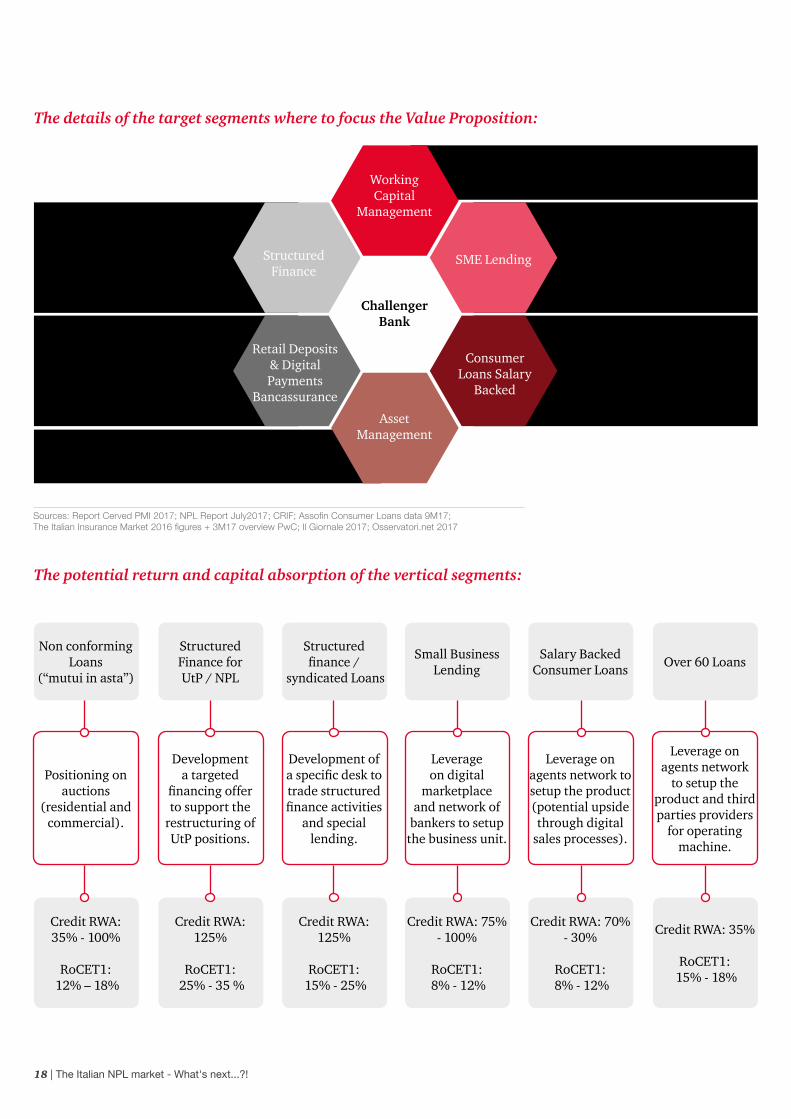
The details of the target segments where to focus the Value Proposition:
The potential return and capital absorption of the vertical segments:
Non conforming Loans
(“mutui in asta”)
Credit RWA: 35% - 100%
RoCET1: 12% – 18%
Positioning on auctions
(residential and commercial).
Structured Finance for UtP / NPL
Credit RWA: 125%
RoCET1: 25% - 35 %
Development a targeted
financing offer to support the
restructuring of UtP positions.
Structured finance /
syndicated Loans
Credit RWA: 125%
RoCET1: 15% - 25%
Development of a specific desk to trade structured finance activities
and special lending.
Salary Backed Consumer Loans
Credit RWA: 70% - 30%
RoCET1: 8% - 12%
Leverage on agents network to setup the product (potential upside through digital
sales processes).
Small Business Lending
Credit RWA: 75% - 100%
RoCET1: 8% - 12%
Leverage on digital
marketplace and network of
bankers to setup the business unit.
Over 60 Loans
Credit RWA: 35%
RoCET1: 15% - 18%
Leverage on agents network
to setup the product and third parties providers
for operating machine.
Working Capital
Management
Challenger Bank
SME Lending
Consumer Loans Salary
Backed
Asset Management
Retail Deposits & Digital Payments
Bancassurance
Structured Finance
€ 559 billion Working Capital Management market size. IFRS9 will enhance WCM services provided by banks.
The Italian market is consolidating in the segment and new initiatives that leverage on digital channels are emerging.
+ 5000 new SMEs+9.7% new microenterprises +7.8% SME new investments
Low Capital Absorption if eligible for the Central Warranty Government Fund (up to 80% guaranteed)
40% of the new finance needed in the UtP market (€104 billion) for forbearance activities come from structured finance10 operations of the biggest independent servicing platforms closed
+ 11,6% of loans are granted by Consumer Backed Loans+9.8% new contracts’ value+8.8% new contracts in place
Low Capital Absorption(RWA 70%-30%)
Source of funding alternative to traditional banks, with higher deposit rate thanks to a lower cost/income Ratio.Bancassurance services provided through cross-selling strategies.
Sources: Report Cerved PMI 2017; NPL Report July2017; CRIF; Assofin Consumer Loans data 9M17; The Italian Insurance Market 2016 figures + 3M17 overview PwC; Il Giornale 2017; Osservatori.net 2017

PwC | 19
Key Success Factors
Even if the potentiality of the Challenger Banks sector in Italy is huge due to its low level of maturity – as perfectly understood by some foreign Private Equity Funds and National Entrepreneurial initiatives – , the setup of the right business model (commercial and operational) it’s not easy, considering the relatively easy way to collect retail funds and the difficulty in selecting the right counterpart to finance (SME, NPL / UtP, Public Government Factoring etc.).
Main Key Success factors that an investor must consider during the setup of the initiative:
• define the target Value Proposition of the Challenger Bank: focus on few solid initiatives and avoid a wide spread catalogue of banking services;
• select the right team: the initiative is highly based on industrial rationales and the right skills in place together with the right experience can guarantee a successful execution of the plan;
• develop a capability of “Fast Prototyping”: the whole operating structure of the player must be able to quickly evaluate opportunities, implement products and value propositions for the customers, beat the competition on time-to-market ( for example “time-to-yes” less than a day in SME lending activities);
• focus on scalability: build an operating model that
is easily scable based on the success of the initiatives (leverage on cloud technologies and Business Process Outsourcing);
• extensive use of innovative technology: invest in innovation where the benefits are tangible (for example, on the Customers Front End to speed up the commercial offering or Robotics to obtain a “best in class” cost/income Ratio) and select the core components that guarantee the full regulatory compliance at “almost zero” implementation cost for the player.

20 | The Italian NPL market - What's next...?!
Italian NPL Market
Key Message: NPL volumes in the Italian market recorded a massive decrease over the last year. The NPL stock, starting from a volume of €324 billion (GBV) at the end of 2016, declined reaching €264 billion at the end of 2017. All the categories, Bad Loans, UtP and Past Due illustrate this positive trend.

PwC | 21
Asset quality
Chart 7 illustrates the reduction in the NPL stock. After reaching its maximum at YE 2015 (€341 billion of GBV), the stock consistently reduced over the last two years, reaching €264 billion at YE 2017.
At the end of 2017 Gross Bad Loans decreased to €165 billion, reducing by €35 billion over the last year. Unlikely to Pay and Past Due showed the same declining trend standing at €94 billion (from €117 billion at YE-2016) and €5 billion (from €7 billion at YE-2016).
Chart 8 demonstrates that the net Bad Loans amount followed the same positive trend that invested the Italian NPL market of the last two years. Their net amount reached €64 billion at YE 2017 (€87 billion at YE-2016). The Bad Loans’ Net NPL Ratio declined to 4.3% (5.6% at YE-2016).
Chart 7: Gross NPE and Bad Loans trend
Chart 8: Net Bad Loans Trend
Source: PwC analysis data of ABI Monthly Outlook. Data referred to the Italian Banking system only (excluded Cassa Depositi e Prestiti).
Source: PwC analysis data of Bollettino Statistico di Banca d'Italia and ABI Monthly Outlook Data referred to the Italian Banking system only (excluded Cassa Depositi e Prestiti).
4259
78
201020092008 2011 2012 2013 2014 2015 2016 2017
107
156
33
9 5766
74
91
184200
200
109
131117
165
94
1612
13
21
18
12 14 7
2.5%
4.9%
3.5%
7.8%
4.6%
9.3%
6.3%
11.3%
7.5%
14.3%
9.8%
17.8%
11.8%
21.0%
12.9%
22.0%
13.0% 11.0%
21.1% 17.6%
324341326
283
237
194
157132
85
CAGR: +22%
CAGR: -12%
5
125
127
264
Gross NPL / Loans to Customers (%)Total NPE (€bn) Gross Bad Loans / Loans to Customers (%)
Bad Loans (€ bn) Unlikely to Pay (€ bn) Past Due (€ bn)
Net Bad Loans (€bn)
Net Bad Loans/Loans to Customers (%)
Bad Loans coverage ratio (%)201020092008 2011 2012 2013 2014 2015 2016 2017
24
3947
60
60
8084
89 87
1.4%
42.9%
34.0%39.7%
43.7%
50.3% 48.7%
2.3% 2.8% 3.5% 3.8% 5.4% 5.7% 5.6% 4.3%
54.0% 55.6% 56.5%61.0%
62 64
5.0%

22 | The Italian NPL market - What's next...?!
Looking at the Bad Loans stock composition:
• the breakdown of Gross Bad Loans shows that Lombardy and Lazio regions have the highest concentration of stock with 21.9% and 11.1%;
• at the same time, these two regions have a Gross Bad Loans Ratio equal to, respectively, 10.5% and 12.0%;
• the northern regions have a lower Gross Bad Loans Ratios compared to the ones in the Centre and South of the Country;
• the percentage of secured Bad Loans is increasing from the 48% of 2016 to the 50% of YE-2017;
• at the end of 2017, the “Corporate & SME” sector continues to represent the greatest share of Gross Bad Loans, standing at 66% and followed by the "Consumer" sector (24%).
Chart 9a: Breakdown of Gross Bad Loans by region* (YE 2017)
Chart 9b: Breakdown of Gross Bad Loans Ratio by region* (YE 2017)
Source: PwC analysis on data of “Bollettino Statistico” of Bank of Italy. * Unique percentage for 1) Valle d’Aosta and Piemonte, 2) Abruzzo and Molise, 3) Puglia and Basilicata.
Source: PwC analysis on data of "Bollettino Statistico" of Bank of Italy. * Unique percentage for 1) Valle d’Aosta and Piemonte, 2) Abruzzo and Molise, 3) Puglia and Basilicata.
1.5%
8.9%
1.5%
9.8%
2.9%
2.5%
6.7%
1.8%5.4%
>5% - 10%
<3%
>10%
>3% - 5%
9.2%
6.0%
1.8%
11.1%
21.9%
2.0%
2.3%5.0%
6.3%
9.2%
10.5%
11.4%
9.2%
12.2%
17.1%
15.1%
10.0%
13.9%
12.0%
15.9%
16.0%
14.3%
18.0%
16.2%
16.7%
>16% -18%
<14%
>18%
>14% - 16%

PwC | 23
Chart 11: Secured Gross Bad Loans trend (% on total Bad Loans)
Source: PwC analysis on data of "Bollettino Statistico" of Bank of Italy. ** “Other” includes PA and financial institutions.
Chart 10: Breakdown of Gross Bad Loans by counterparty (YE 2017)
Source: PwC analysis on data of "Bollettino Statistico" of Bank of Italy. “Other” includes PA and financial institutions.
12%
2008 2009 2010 2011 2012 2013 2014 2015 2016
67%
11%
20%
69%
10%
20%
70%
9%
20%
70%
9%
19%
71%
8% 8% 7% 8%
18% 16% 16% 17%
73% 75% 74% 73%
Corporate & SME Small family business Consumer Other**
21%
8%
70%
2017
20%
1% 1% 1% 1% 1% 2% 2% 2% 2%1%
2008
36% 36%
38% 38%39%
42%45%
47%48% 66%
24%
8%
2%
2009 2010 2011 2012 2013 2014 2015
Corporate & SME
Counterparty
Individual
Family business
Other**
2016
50%
2017

24 | The Italian NPL market - What's next...?!
Source: PwC analysis on data of “Bollettino Statistico” of Bank of Italy. Source: PwC analysis on data of “Bollettino Statistico” of Bank of Italy.
The breakdown of Gross Bad Loans by economic macrosector (Chart 12) shows that Real Estate, Constructions and Manufacture account for over 71% of the Italian NPL market.
On the other side, the Breakdown of Gross Bad Loans by ticket size (Chart 13) illustrates that the 31% of the NPL Italian market is represented by exposures with a value of more than €5 million.
Chart 12: Breakdown of Gross Bad Loans by macrosector Chart 13: Breakdown of Gross Bad Loans by ticket size
3%4%
6%
12%
8%
9%
15%
12%
21%
10%
2.5mln to 5mln €
125k to 250k €
500k to 1mln € 50 to 30k €
1mln to 2.5mln €30k to 75k €
75k to 125k €
5mln to 25mln €
250k to 500k € More than 25mln €
Agriculture, forestry and fishing
Electricity, gas, steam and air-conditioning supply
Wholesale and retail trade
Information and communication
Professional, scientific and technical activities
Waste-management and remediation products
Transportation and storage
Administrative and support services
Manufacturing products
Construction
Accomodation services
Real estate
Other
3%
31%
1%1%
24%
15%
2%
5%
1%
16%2% 2%1%

PwC | 25
Focus: UtP
The UtP stock composition at YE-2017 shows that:
• the UtP breakdown by region highlights the highest UtP levels in Lombardy (27.3%) and Lazio (13.2%), with a UtP Ratio equal, respectively, to 7.4% and 8.0%;
• Friuli Venezia Giulia, Trentino Alto Adige, Umbria, Marche, Abruzzo and Molise, Calabria and Sardegna each own a percentage of UtP lower than 3%.
Chart 14a: Breakdown of UtP by region* (YE 2017)
Chart 14b: Breakdown of UtP Ratio by region* (YE 2017)
Source: PwC analysis on data of “Bollettino Statistico” of Bank of Italy. * Unique percentage for 1) Valle d’Aosta and Piemonte, 2) Abruzzo and Molise, 3) Puglia and Basilicata.
Source: PwC analysis on data of “Bollettino Statistico” of Bank of Italy. * Unique percentage for 1) Valle d’Aosta and Piemonte, 2) Abruzzo and Molise, 3) Puglia and Basilicata.
5.6%
10.6%
7.4%
6.2%
4.2%
6.7%
6.9%
7.0%
3.9%
7.5%
8.0%
6.1%
8.3%
5.4%
5.2%
6.9%
7.6%
>7% - 9%
<5%
> 9%
>5% - 7%
2.4%
8.6%
1.2%
9.6%
2.7%
1.7%
6.2% 3.3%
0.9%
4.1%
>5% - 10%
<3%
>10%
>3% - 5%
7.6%
13.2%
27.3%
1.6%
1.7%
4.2%
3.6%

26 | The Italian NPL market - What's next...?!
Key Message: At the end of 2017 data on firms’ closures confirmed the dropping trend emerged in the previous quarters: the most remarkable reduction pertains to bankruptcies, which stand now back to the levels recorded during the early 2000s.
During 2017, 93,000 Italian companies started an insolvency procedure, highlighting a 5% drop with respect to the previous year, a result which is quite distant from the negative peak recorded in 2013 (that scored an overall amount of 109,000 procedures) (Chart 15).
Data on the number of bankruptcies shows that the improvement observed in the first half of 2017 has strengthened: in fact, as for YE-2017, 12,009 Italian firms went bankrupt (a 11.3% reduction with respect to 2016) and, in particular, in the last quarter the year, they are estimated to amount to 3,242 (-4.8% if compared to the same period of 2016). The decrease involves all firms’ legal status, especially companies other than share capital companies and partnerships (-14.4% with respect to the previous year) (Chart 16). Moreover, this downturn is shared among all Italian regions (firstly Piemonte, Liguria and Lombardy) and all economic sectors, with a particularly positive tendency for the industrial ones and that of construction.
The drop in the number of not-bankruptcy procedures, started 3 years ago, is still continuing. The amount of insolvency procedures started in 2017 (and different from bankrupt) registered a reduction, compared to 2016, mostly concentrated within the construction sector, then followed by industrial firms and services companies (Chart 17).
Following the decreasing trend observed during the first half of the year, at the end of 2017 79,587 Italian firms overall started a voluntary liquidation procedure, highlighting a 4% drop with respect the same period of 2016. The decrease mostly pertains to partnerships (-11.3%), which have reached the bottom level since 2001 (Chart 18).
Chart 15: Insolvency procedures
Chart 16: Bankruptcies by type of company
Bankruptcy
YE-2016 YE-2017
Liquidation Other procedures
-8.5%-11.3%
9.2%
-4.0%
-35.1%
-5.1%
Share capital company Partnership Others
-8.5%-11.7%
-8.2% -6.4% -6.2%
-14.4%
YE-2016 YE-2017
Source: Osservatorio su fallimenti, procedure e chiusure di imprese, Cerved.
Chart 17: Non-bankruptcy procedures
Chart 18: Liquidations by type of company
Arrangement with creditors Others
-42.3%
-29.2%-25.9%
-18.8%
YE-2016 YE-2017
Share capital company Partnership
8.5%
-11.3%
-2.0%
7.0%
YE-2016 YE-2017

PwC | 27
Italian Banks’ Overview
Key Message: For the Italian banking industry, 2017 was a turnaround year, in terms of net aggregated earnings, capital strengthening and mergers. Along with these results, the improvements in credit quality have been significant: indeed Italian banks overall reduced the stock of their Gross Non Performing Exposures and 2018 is expected to be characterised by the same deleveraging attitude as well.

28 | The Italian NPL market - What's next...?!
Recent Events
• During the last quarter of 2017, Banca Carige closedthe disposal of a €1,2 billion mixed secured - unsecuredportfolio of Bad Loans with Credito Fondiario, DavidsonKempner acquired a €320 million Bad Loans portfoliofrom Banca Popolare di Bari and Cassa Centrale Bancaclosed with Seer Capital Management and Locam S.p.A.the sale of a mixed secured – unsecured portfolio of BadLoans for a total value of €885 million.
• In October 2017, the ECB issued an Addendum to itsguidance to banks on exposures included in the NonPerforming category after January 1st, 2018: European
banks will be required to automatically depreciate these loans for the 100% of their book value, after 2 years if unsecured, after 7 years if secured. If confirmed, this measure could eventually produce a stiffening effect on the NPL disposal policies of many Italian banks.
• Following some other significant events occurred in 2017,like the struggles of Carismi, Carim and CariCesena,those of Veneto Banca and Popolare di Vicenza, of MPS,Carige and Creval, and like Unicredit €13 billion capitalincrease, for the Italian banking system year 2018promises to be as rich of changes and occurrences as theprevious one.
Chart 19: Net Bad Loans and Equity for the Top 10 Italian Banks
Chart 20: Gross NPE and Texas Ratio for the Top 10 Italian Banks
Souce: Financial Statements as of YE-2017. Data affected by different write-off policies.
Source: Financial Statements as of YE-2017. Data affected by different write-off policies. * Texas Ratio defined as the Ratio between total Gross NPE and the sum of CET1 and provisions.
12.7 11.3 10.5
4.2
119%115%104%
Gross NPE (€bn)
Texas Ratio (%)
50.352.7
23.1
45.1
105% 109%
92%
54%
88%
5.1 1.3
65%
81%
MPSISPUCG UBI BNL CariparmaBPER Pop. Sondrio CredemBanco BPM
Net Bad Loans (€billion)
Net Bad Loans Equity Ratio (%)
MPSISPUCG UBI BNL CariparmaBPER Pop. Sondrio Credem
16%
9.7
22%
72%
12.6
7.56.5
4.13.1 2.9
1.20.8
0.3
55%
41%
56% 57%
20%29%
12%
Banco BPM

PwC | 29
Chart 21: Recoveries / Gross Bad Loans for the Top 10 Italian Banks
Chart 22: Sales Proceeds / (Sales Proceeds + Losses on disposals) for the Top 10 Italian Banks
Chart 23: (Sales Proceeds + Losses on disposals + Recoveries) / Gross Bad Loans for the Top 10 Italian Banks
Source: Financial Statements as of YE-2017. Data affected by different write-off policies
Source: Financial Statements as of YE-2017. Data affected by different write-off policies.
Source: Financial Statements as of YE-2017. Data affected by different write-off policies.
Recoveries (€ billion)
Recoveries / Gross Bad Loans (%)
MPSISPUCG UBI BNL CariparmaBPER Pop. Sondrio Credem
4.6%
2.36
4.5%
3.2%1.71
0.950.68
0.460.31 0.27 0.18
0.14 0.05
6.2% 6.3%
3.5% 3.8%
6.1% 6.3% 6.1%
Banco BPM
Sales Proceeds + Losses on disposals + Recoveries (€ billion) (Sales Proceeds + Losses on disposals + Recoveries) / Gross Bad Loans (%)
MPSISPUCG UBI BNL CariparmaBPER Pop. Sondrio Credem
11.5%
5.85
6.0%
3.3%
2.26
0.96
1.52
0.88 0.350.47
0.73 0.14 0.06
13.9%12.1%
3.9%
6.7%
24.9%
6.4% 7.1%
Banco BPM
Sales Proceeds (€ billion) Sales proceeds / (Sales Proceeds+Losses on disposals) (%)
MPSISPUCG UBI BNL CariparmaBPER Pop. Sondrio Credem
74.0%
2.58
0.91
0.14
75.3%
91.4%
0.41 0.01 0.49
0.35
0.400.02
0.04 0.080.13
0.210.33
0.0 0.01
58.6%
96.0% 93.7%
36.7% 38.9%
0.0%
100%
Losses on disposals (€ billion)
Banco BPM

Chart 24: Top 10 Italian Banks – NPE Peer Analysis as of YE-2017
Chart 25: Top 10 Italian Banks – Bad Loans Peer Analysis as of YE-2017
Source: Financial statements as of YE-2017. Data affected by different write-off policies.
Source: Financial statements as of YE-2017. Data affected by different write-off policies.
Chart 24 focuses the Gross NPL Ratio and the NPL Coverage Ratio for the Top 10 Italian banks. As shown, the average for the two Ratios is respectively 16.0% and 49.4%. The differences comparing the different banks are clear. On one side, MPS shows the highest Gross NPL Ratio with 37.3% while, on the other side, Credem stands at the lower extreme of 5.2%. Considering the NPL Coverage Ratio, MPS again shows the highest value (67.2%) and UBI the lowest (35.4%). The Coverage Ratio is not directly comparable as it is influenced by several factors different from every bank: policies on write-offs, level of collateralization of the loans, vintage of the portfolio.
The same analysis is reproduced considering the Gross Bad Loans Ratio and the Bad Loans Coverage Ratio (Chart 25). Also in this case there are significant differences comparing the Top 10 banks. MPS reaches the peak with a Gross Bad Loans Ratio of 27.0% and Credem represents the lowest (3.2%) the top 10 average stands at 10.3%. The relative Coverage Ratio indicates two opposite peaks: 77.2% with MPS and 44.8% with UBI (the average stands at (61.1%).
30 | The Italian NPL market - What's next...?!
Gross Bad Loans Ratio (%)
Average= 10.3%
Average= 61.1% B
ad L
oans
Cov
erag
e R
atio
(%)
0% 5% 10% 15% 20% 25%40%
45%
50%
55%
60%
65%
70%
75%
80%
85%
UCG
ISP
Pop. Sondrio
MPS
BNLBPER
BPER Banco BPM
ISPCredem
Cariparma
UBI
Bubble size: Gross Bad Loans
Bubble size: Gross NPL
0 5% 10% 15% 20% 25% 30% 35% 40%
30%
35%
40%
45%
50%
55%
60%
65%
70%
Gross NPL Ratio (%)
NP
L C
over
age
Rat
io (%
)
MPS
BNL
UCG
Pop. Sondrio
Banco BPM
BPER
Average= 16.0%
Average= 49.4%
ISPCredem
Cariparma
UBI
PwC | 31
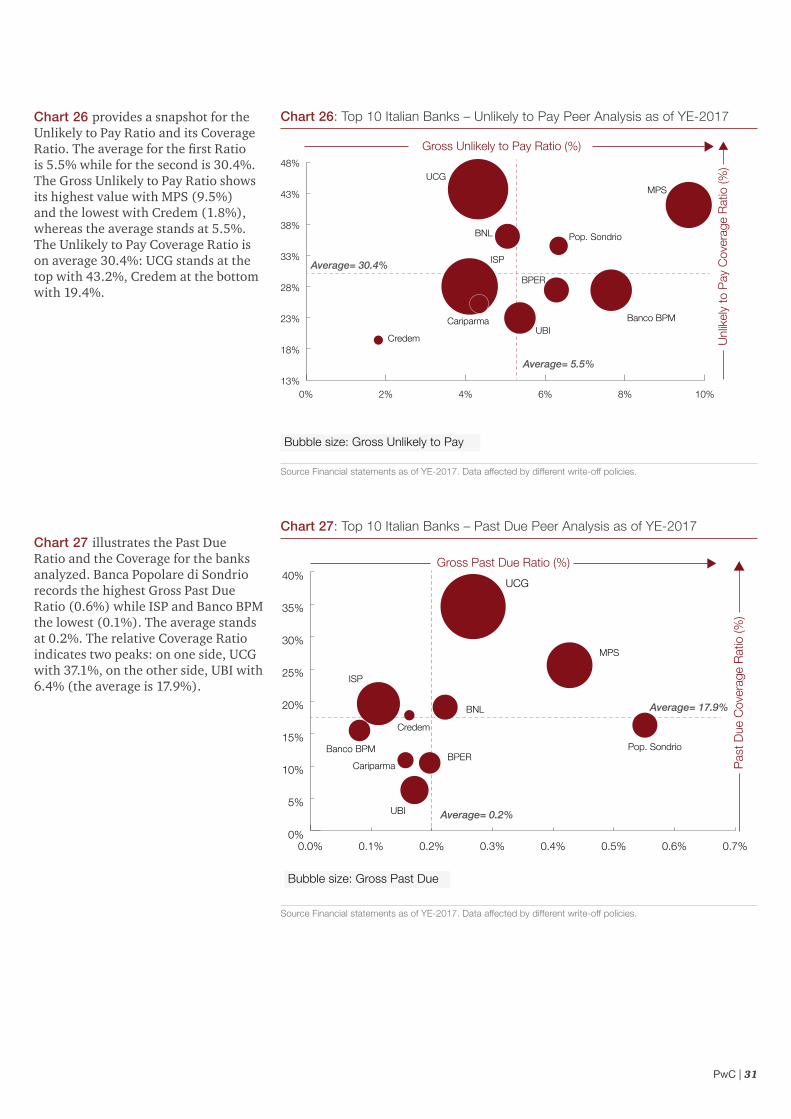
Chart 26: Top 10 Italian Banks – Unlikely to Pay Peer Analysis as of YE-2017
Chart 27: Top 10 Italian Banks – Past Due Peer Analysis as of YE-2017
Source Financial statements as of YE-2017. Data affected by different write-off policies.
Source Financial statements as of YE-2017. Data affected by different write-off policies.
Chart 26 provides a snapshot for the Unlikely to Pay Ratio and its Coverage Ratio. The average for the first Ratio is 5.5% while for the second is 30.4%. The Gross Unlikely to Pay Ratio shows its highest value with MPS (9.5%) and the lowest with Credem (1.8%), whereas the average stands at 5.5%. The Unlikely to Pay Coverage Ratio is on average 30.4%: UCG stands at the top with 43.2%, Credem at the bottom with 19.4%.
0.0% 0.1% 0.2% 0.3% 0.4% 0.5% 0.6% 0.7%0%
5%
10%
15%
20%
25%
30%
35%
40%UCG
BNL
MPS
Credem
ISP
Banco BPM
UBI
CariparmaBPER
Pop. Sondrio
Average= 17.9%
Average= 0.2%
Gross Past Due Ratio (%)
Pas
t Due
Cov
erag
e R
atio
(%)
Bubble size: Gross Past Due
Chart 27 illustrates the Past Due Ratio and the Coverage for the banks analyzed. Banca Popolare di Sondrio records the highest Gross Past Due Ratio (0.6%) while ISP and Banco BPM the lowest (0.1%). The average stands at 0.2%. The relative Coverage Ratio indicates two peaks: on one side, UCG with 37.1%, on the other side, UBI with 6.4% (the average is 17.9%).
Bubble size: Gross Unlikely to Pay
Gross Unlikely to Pay Ratio (%)
Unl
ikel
y to
Pay
Cov
erag
e R
atio
(%)
0% 2% 4% 6% 8% 10%13%
18%
23%
28%
33%
38%
43%
48%UCG
BNL
MPS
ISP
UBIBanco BPM
Pop. Sondrio
BPER
Cariparma
Credem
Average= 30.4%
Average= 5.5%

32 | The Italian NPL market - What's next...?!
Chart 28 analyzes the movements in the Gross Bad Loans Ratio and the Bad Loans Coverage Ratio between 2016 and 2017. At YE-2017 the average Bad Loans Ratio reaches 10.3%, whereas the Coverage Ratio stands at 61.1%. The snapshot indicates that most of the top 10 Italian Banks have improved their Gross Bad Loans Ratio during 2017.
Chart 29 shows that, all the banks analyzed experienced a decrease in the Unlikely to Pay NPL Ratio. At YE-2017 the average Unlikely to Pay NPL Ratio stands at 5.5%, while the Unlikely to Pay Coverage Ratio is 30.4%. The Unlikely to Pay Coverage Ratio decreased for Banco BPM (40.2%), UBI (1.5%) and BNL (1.2%).
Chart 28: Top Italian Banks – Bad Loans movements (YE-2016 vs YE-2017)
Chart 29: Top Italian Banks – Unlikely to Pay movements (YE-2016 vs YE-2017)
Source: Financial Statements as of YE-2017. Data affected by different write-off policies.
Source: Financial Statements as of YE-2017. Data affected by different write-off policies.
0% 5% 10% 15% 20% 25%
35%
40%
45%
50%
55%
60%
65%
70%
75%
80%
UCG
Credem
Cariparma
ISPBNLPop. Sondrio
UBI
BPER
Banco BPM
MPS
Average= 61.1%
Average= 10.3%
Gross Bad Loans Ratio (%)
Bad
Loa
ns C
over
age
Rat
io (%
)
YE 2016 YE 2017
0% 2% 4% 6% 8% 10% 12% 14% 16% 18%0%
15%
30%
45%UCG
BNL
UBI
ISP
CariparmaCredem
BPER
Banco BPM
Pop. Sondrio MPS
Average= 5.5 %
Gross Unlikely to Pay Ratio (%)
Unl
ikel
y to
Pay
Cov
erag
e R
atio
(%)
YE 2016 YE 2017

PwC | 33
Chart 30 illustrates the movements in the Past Due Ratio and Past Due Coverage Ratio. At YE-2017, the average Past Due Ratio stands at 0.2%, whereas the Past Due Coverage Ratio is 17.9%. In 2017 all the banks, except for UBI, experienced a decrease in their Past due Ratio (the average decrease is 38.3%). The average decrease of the Past Due Coverage Ratio is instead of 5.4%.
Chart 30: Top Italian Banks – Past Due movements (YE 2016 vs YE 2017)
Chart 31: Top Italian Banks – Relation between MarketCap/TBV and NPL Ratio
Source: Financial Statements as of YE-2017. Data affected by different write-off policies.
Source: Financial Statements as of YE-2017.
UCG
ISP
Banco BPM
Credem
Cariparma
UBI
BPER
MPS
BNL
Pop. Sondrio
Average= 0.2%
Average= 17.9%
Past Due Ratio (%)
Pas
t Due
Cov
erag
e R
atio
(%)
0.0% 0.1% 0.2% 0.3% 0.4% 0.5% 0.6% 0.7% 0.8% 0.9% 1.0% 1.1% 1.2%0%
15%
30%
YE 2016 YE 2017
0% 5% 10% 15% 20% 25%
0%
20%
40%
60%
80%
100%
120%
140%
160%
Mkt
/ T
BV
Gross NPE ratio
CREDEM
ISP
IFIS
UCG
UBI
Pop. Sondrio
BPER
Banco BPM
Carige
Creval
MPS

34 | The Italian NPL market - What's next...?!
Focus on UtP Italian market
Key Message: At the end of FY 2017, the total Italian UtP exposure amounted to €94 billion, the 80% of which is concentrated within the top 10 banks. Despite the declining trend, the UtP magnitude is still huge.

PwC | 35
Our view
UtP is a major issue for the Italian banking system for several reasons. The NPE figures at the end of 2017 still show a huge amount of UtP (€94 billion of GBV), of which 80% is concentrated within the top 10 banks.
The recent requirements mandated by the European Regulators (the ECB guidelines, the calendar provisioning, within the ECB Addendum, and the application of IFRS9 from 1 January 2018) will undoubtedly drive the Italian banks’ management of the current stock, next wave of NPE and the UtP deleveraging plans as well.
Capital requirements and short/medium-term plans of reducing their NPE Ratio could lead to massive UtP sale opportunities (single names and/or small portfolios).
Industrial capabilities’ self-assessment along with identification of potential upside coming from the proper restructuring of the UtP could even lead the banks to internal management or external management (through specialised servicers) of the UtP.
UtP distribution (€ billion) - Top 10 Italian banks
Source: PwC analysis of banks’ financial statements as at 31/12/17. The list of Top 10 Italian banks is based on the Gross Book Value of Total Exposure as at 31/12/16 (source: ABI). ICCREA exposure as at 30/06/17.
94
17.9
11.6
53%
€bn
9.05.2
3.43.3 2.0 1.8 0.5
-10% vs. PY
19%
20.3-17% vs. PY
22%
12%
-24% vs. PY
10%
-22% vs. PY
6%4%
-15% vs. PY
2%
+1% vs. PY
4%
-17% vs. PY
2%
-11% vs. PY
0.5%
-8% vs. PY
20%
19.0
+1% vs. PY
Total UniCredit MPS UBIBanco BPM BNL BPER CredemBP SondrioCariparma OthersIntesaSanpaolo
40% 34% 26% 39% 41% 30% 32% 40% 42% 35% Gross UtP/Gross NPE
11% 12% 37% 20% 13% 17% 20% 11% 15% 5% Gross NPE Ratio
Carige 3.1 3%
Creval 2.2 2%
ICCREA 1.2 1%
Banca IFIS 0.7 0.7%
C.R. Bolzano 0.4 0.4%
Others 10.5 11%
36 | The Italian NPL market - What's next...?!
*Ratios of Banco BPM as at 31/12/16 were calculated as sum of the figures of Banco Popolare and BPM(merged together in Banco BPM from 1/01/2017).
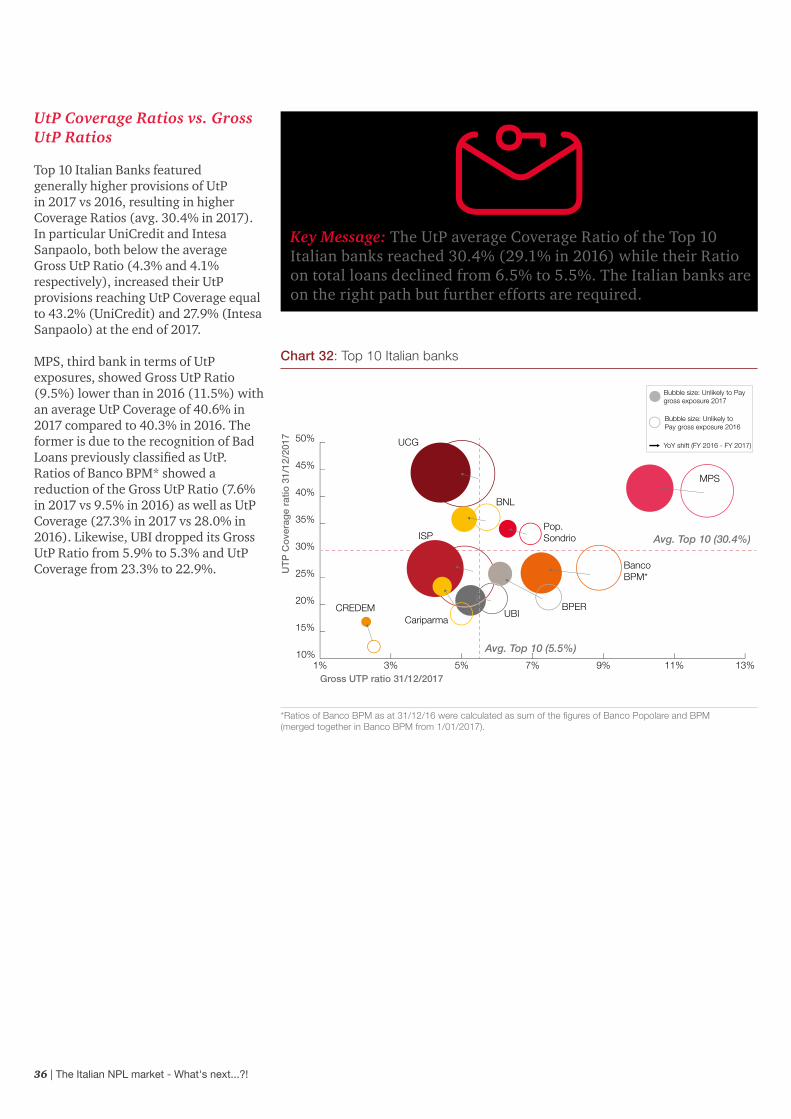
UtP Coverage Ratios vs. Gross UtP Ratios
Top 10 Italian Banks featured generally higher provisions of UtP in 2017 vs 2016, resulting in higher Coverage Ratios (avg. 30.4% in 2017). In particular UniCredit and Intesa Sanpaolo, both below the average Gross UtP Ratio (4.3% and 4.1% respectively), increased their UtP provisions reaching UtP Coverage equal to 43.2% (UniCredit) and 27.9% (Intesa Sanpaolo) at the end of 2017.
MPS, third bank in terms of UtP exposures, showed Gross UtP Ratio (9.5%) lower than in 2016 (11.5%) with an average UtP Coverage of 40.6% in 2017 compared to 40.3% in 2016. The former is due to the recognition of Bad Loans previously classified as UtP.Ratios of Banco BPM* showed a reduction of the Gross UtP Ratio (7.6% in 2017 vs 9.5% in 2016) as well as UtP Coverage (27.3% in 2017 vs 28.0% in 2016). Likewise, UBI dropped its Gross UtP Ratio from 5.9% to 5.3% and UtP Coverage from 23.3% to 22.9%.
Chart 32: Top 10 Italian banks
1% 3% 5% 7% 9% 11% 13%10%
15%
20%
25%
30%
35%
40%
45%
50%
MPS
CREDEMCariparma
BNL
BPERUBI
UT
P C
ove
rag
e ra
tio 3
1/12
/201
7
Gross UTP ratio 31/12/2017
UCG
Banco BPM*
Pop. SondrioISP
Bubble size: Unlikely to Pay gross exposure 2017
Bubble size: Unlikely to Pay gross exposure 2016
YoY shift (FY 2016 - FY 2017)
Avg. Top 10 (30.4%)
Avg. Top 10 (5.5%)
Key Message: The UtP average Coverage Ratio of the Top 10 Italian banks reached 30.4% (29.1% in 2016) while their Ratio on total loans declined from 6.5% to 5.5%. The Italian banks are on the right path but further efforts are required.

PwC | 37
Inflows and outflows
In 2017, total outflows of the Top 10 Italian banks remained stable at around €44 billion, despite lower outflows to Bad Loans: 21% in 2016 vs 16% in 2017.
The inflows in 2017 decreased from €33 billion to €30 billion, mainly due to the lower inflows from performing and Past Due exposures.
In particular, UtP gauged a firm decline of inflows from performing loans over the last 2-year period: 16% in 2016 vs 14% in 2017.
UtP which remained UtP during 2017 amounted to €44.5 billion (i.e. 50% out of €89 billion), indicating how the main issue for the Italian UtP lies mainly in their massive stock and a management not yet able to target deleverage solutions.
Chart 33: Unlikely to Pay inflows and outflows from 2015 to 2017 - Top 10 banks FY17 (€ billion)
Source: PwC analysis of banks’ financial statements as at 31/12/17 and 31/12/16.
(5%)
(13%)
(21%)
(4%) 16%
8%
9% (7%)
(13%)
(16%)
(14%) 14%
5%
15%
UtPExposure31/12/15
ToPerforming
Collected To Bad Loans OthersOutflows
FromPerforming
From nonNPL
OtherInflows
UtPExposure31/12/16
ToPerforming
Collected To Bad Loans OthersOutflows
FromPerforming
From OtherNPL
OtherInflows
UtPExposure31/12/17
(43) 33
(44) 30
Outflows
Outflows
99
89
75
Rem
ain
UtP
56%Remain UtP
Rem
ain
UtP
50%Remain UtP
% flows =In/Outflow
Initial Exposure
Inflows
Inflows
Key Message: At the end of 2017, despite the decreased outflows to Bad Loans (-5%) and inflows from performing (-2%) compared to 2016, 50% of UtP remained as such. The UtP issue for 2018 still lies in the management of their massive stock.

38 | The Italian NPL market - What's next...?!
Our view on the available strategies for UtP
The strategic options identified through the on going due diligence carried out by the bank on the borrower’s case could result in the return of the loan to the performing category through the implementation of internal forbearance measures or via the sale of the loan or by the classification of the exposure as Bad Loans (thus requiring the prompt liquidation of the borrower’s asset through judicial procedures).
Sale of UtP could even be executed through portfolios transactions which require preliminary strategic segmentation to maximize loans’ value for the banks. Alternatively, banks may decide to outsource the management on NPE (such as UtP) to a specialised credit servicer.
Inte
rnal
M
anagement Servicing
Loan saleInvestor’s equit
y in
ject
ion/
underwriting o
f sen
ior
debt
UtPs’ adding value strategy
• Forbearance measures- Grace period/Payment moratorium- Extension of maturity/term- Debt consolidation- New credit facilities- Recovery plan by Italian Bankruptcy
Law (e.g. art. 67 & 182 bis)• Segmenting by industry/type of UtP
(overdue / restructured / defaulted)
• New opportunities of value creation• New market opportunities• Mandatory will be the transition from
Past Due management to a proactivemanagement of the UtP (e.g. new creditfacilities)
• Part of the industrial managementrequired by ECB
• Best practices’ implementation
• True sale/securitisation• Single names’ sale on a best offer basis
(opportunistic criteria)• Single names’ sale based on a structured
plan (strategic criteria)• Sale of UtP portfolios
• Industrial partner to revampandestablish the underlying borrower’sbusiness (long term approach)
• Financial partner to inject cash within astrategic exit plan (short/medium termapproach)
Key Message: Following improved proactive management, banks could identify the most effective and efficient solutions to deleverage their UtP (e.g. return to performing, collection) among several strategic options. Solely a proactive management of UtP could lead to the right “tailor made” strategic solution.

PwC | 39
Interventionarea
Adoption of short-term measures Adoption of long-term measures
Interest
• Temporaryfinancial difficultyof minor entityto be overcomewithin 24 months
• Temporarypayment ofinterest only(no capitalreimbursement)
• Excessively highinterest rates forthe debtor
• Permanent reductionof interest rates
Instalments
• Temporary financialdifficulty ofmoderate entity tobe overcome within24 months
• Temporaryreduction ofinstalmentamount
• Full interestpayment
• Misalignmentbetweenrepayment planand reimbursementcapacity of thedebtor
• Rescheduling ofamortization plan(e.g. partial, bullet,step-up)
Maturity
• Temporaryfinancial difficultyof moderate/serious entity tobe overcome within24 mo.
• “Grace period”for the paymentof interests andcapital
• Excessively highinstalments for thedebtor
• Extension of debtmaturity
Collateral
• Voluntary disposalof collateral by thedebtor
Forbearance as a relevant measure for the proactive management of UtP
The ECB guidance emphasizes that the main objective of forbearance measures is to allow debtors to exit their non-performing status or to prevent performing borrowers from reaching a non-performing status. Therefore, the guidance actively addresses the theme, by guiding banks in the identification of the optimal balance of forbearance measures aimed at granting the exit from short- and long-term difficulty status of the debtor. In particular, on the basis of the type of difficulty of the debtor, either short- or long-term forbearance measures (or a combination of the two) maximizing recoveries shall be identified, by granting, simultaneously, the sustainability of the adopted measures (e.g. debt service capacity).
Main forbearance measures(1) – Application examples
= financial situation of the debtor = applicable forbearance measure
(1) In addition to debt forgiveness and/or arrears capitalisation options.
In particular cases it is possible to adopt new credit facilities or debt consolidation measures
Key Message: Italian banks should improve their loans’ restructuring procedures throughout an appropriate and more effective “case by case” analysis of the financial difficulty of the borrower.

40 | The Italian NPL market - What's next...?!
Servicing of UtP as a new market opportunity
Outsourcing the UtP is the next frontier of NPE servicing. The specialized servicers must migrate from a traditional management of overdue UtP exposures to a proactive management of UtP, thus entailing new lending and restructuring measures as strategic management options.
The UtP servicing could increase significantly over the next four years along with the volumes of NPE outsourced by banks and investors to external specialised servicers.
Conditions to be satisfied by the Servicers for the management of UtP
% of NPE stock outsourced to specialists
New lending – Through the on going management of the existing loan contracts, servicers must secure: 1) new injection of cash (debt and/or equity) into the UtP borrowers’ capital structure, directly (e.g. challenger banks) or indirectly (through third party investors) and 2) support in defining restructuring plans.
Management – Servicers must carry on a proactive management of the UtP borrowers on a daily basis. Essential is the relationship established with the borrowers and the knowledge of their local market.
IT Platform – Servicers must migrate the UtPs management on advanced IT platform aiming at promptly managing the relevant information about the borrowers.
Strategies – Servicers must identify the proper management strategy of the UtP borrowers through the continuous assessment of their performance, early warning indicators, KPI.
2017Banks NPE management outsourcing
20%
>40%
10-20%UtP
5-10%UtP
2021E
2x

PwC | 41
Market transactions of UtP portfolios and single names in 2017
Key Message: In 2017 UtP transactions, excluding the ones realised in context of banks’ bailouts, have been limited in terms of amount and volumes. We believe that the market of UtP transactions is starting in 2018.
Veneto Banca, Banca Popolare di Vicenza
Seller Buyer € million
Banca Marche, Etruria, Chieti
Quaestio Capital SGR+ Credito Fondiario 2,200 (¹)
CRC – Carim – Carismi Quaestio Capital SGR (mezzanine) + FIDT (junior) 2,800 (¹)
Carife Quaestio Capital SGR+ Credito Fondiario 376 (¹)
CreVal Credito Fondiario 104
CreVal Algebris Investments 245 (²)
CreVal Cerberus 105
Hypo Alpe Adria Bank S.p.A. Bain Capital Credit 750(1)
UniCredit S.p.A. Stinger SPV Srl 35
CreVal Hoist Finance 24
UniCredit S.p.A. DeVar Claims SPV Srl n.a.
Commerzbank Fortress Inv. Group 234 (¹)
CRC – Carim – Carismi Algebris Investments 286
SGA 9,000
Banks' bailouts
Other transactions
(1) Mixed portfolio of UtP and Bad Loans. (2) Transaction closed in Q1 2018.

42 | The Italian NPL market - What's next...?!
Investor’s equity injection/underwriting of senior debt
The UtP market features structured transactions where specialized investors (distressed and turnaround) inject new equity or debt in distressed companies within a strategic exit plan in the short-medium run (speculative view) or in the long run (industrial view).
Specialized players are introducing new solutions for the banks to inject new finance in their borrowers and to reduce their NPE Ratios.
Deal Structure Type of investor Derecognition for the bank
Buyout of single-named UtP aimed at revamping the business throughout
debt consolidation and proactive management of target company
Synthetic securitisation of non-performing exposures, potentially
secured by GACS
Acquisition of target company with debtor-in-possession (DIP) financing
to realise new investments. Often the investment vehicle / fund is
participated in selling banks
Creation of an all-equity SPV, fully provided with cash; merger of
the SPV with target bank; use of SPV’s raised cash to underwrite senior debt/
equity of distressed companies with the purpose of business recovery
Private Equity Funds (distressed value investing in equity)
Acquirers of asset-backed securities (including the banks originators
underwriting the SPV notes) along with investors with different risk
profile
Private Debt Funds investing in distressed companies
SPAC (Special Purpose Acquisition Company)
Banks can derecognise the loan through a true sale
Banks cannot derecognize the loan if they hold the credit risk through the
junior notes of the SPV
Banks can derecognise the loan and replace it with shares of the
investment vehicle/ fund
Banks can derecognise the loan through a true sale
PwC | 43
The Servicing Market
Executive SummaryThe NPL servicing industry continues its positive growth through the beginning of 2018 with newcomers joining the market. We expect more than €100 billion of disposals for the period 2018-2021 driven by the increasing banks’ NPL platforms sales. Increasing market and regulatory pressure will also push banking groups to consider possible strategic partnerships with NPL specialists.

44 | The Italian NPL market - What's next...?!
Key recent dynamics
The NPL servicing industry continues its positive growth through the beginning of 2018 based on outsourcing of recovery activities by Banks and continuous increase of Banks’ portfolio disposals to investors. Market, competitive and regulatory dynamics that characterized 2017 and first half of 2018 have driven the evolution of the servicing industry:
• newcomers are joining the industry with big international investors entering the market. We have observed the consolidation of big international players’ presence: first of all Intrum/Lindorff, acquiring CAF at the end of 2017 and the NPL platform of Intesa Sanpaolo in April 2018, which will become the second operator by volumes in the Italian market after doBank; furthermore we should mention the partnership of Anacap with Pimco for the acquisition of Phoenix;
• strategic outsourcing of NPL banking platforms is driving the growth of specialized NPL servicers. Following Creval, MPS, Bari, Carige and Intesa Sanpaolo deals, other banking groups may consider partnerships for their NPL platforms with the main market participants;
• strong evolution in business models reflected in new market participants such as SGA and Spaxs. SGA, the former “bad bank” of Banco di Napoli, owned by the Italian government is conceived as debt purchaser but will also be involved in the credit management and collection activities, while Spaxs is an innovative initiative that aims to enter the market acquiring a set of companies to participate actively in the UtP market providing financing for restructuring SMEs;
• regulation is shaping the market field: Calendar Provisioning, IFRS9 and the EBA consultation Guidelines on how to manage NPL -which specifies a 5% threshold on NPL Ratio above which banks will be classified as “High NPL banks”- is pushing NPL disposals.
Our outlook for 2018 / 2019
In our outlook for the following 12 months we see an additional increase of the share of the market managed by NPL specialists in particular connected to the shift of Bad Loans ownership from Banks to specialized investors. We expect more than €100 billion of disposals for the period 2018-2021 to be driven by the increasing banks’ NPL platforms sales.
We expect the following dynamics to characterize sector growth:
• the proactive management of Banks’ UtP portfolios promoted by the ECB Guidelines, will increase the disposal of these portfolios attracting a wider investor base with subsequent outsourcing of servicing activities;
• evolution of the business and regulatory model of NPL servicers, mainly driven by UtPs that require different skills and capabilities more similar to traditional banking activities;
• value creation with strategic carve-out opportunities of NPL banking platforms: increasing market and regulatory pressure will push banking groups to consider possible strategic partnerships with NPL specialists;
• a second wave of consolidation will be driven on one hand by the new directive of the European Parliament on credit servicers that aims to harmonize the European market facilitating cross-border scale-up activities, while on the other hand by the pressure on margins that will increase competitive pressures on DCAs;
• decreasing market space for smaller independent NPL servicers, vertical integration between investors and servicers and carve-out of NPL platforms are likely to have a downward impact onmanaged volumes of players not involved in these deals.
Is carve-out the best alternative?
The sale or outsourcing of NPL banking platforms appear to be on the headlines of Banks’ strategic initiatives. Following Creval, MPS, Bari, Carige and Intesa Sanpaolo deals, market rumours are emerging around possible further carve-out initiatives of Italian banking players.
We consider it crucial to identify value creation drivers based on efficiency (recovery rates) and effectiveness (cost) improvements.
In our view, three fundamental ingredients characterize a successful platform carve-out transaction, each of them should be based on few strategic drivers:
1. deal features: transaction structure, perimeter (stock, forward flows) and Strategic Governance Model (including delegation of authorities) are crucial for the success of the deal negotiation phase;
2. operating model: the definition of to-be IT platform and transition model and of important operating functions is the necessary element for the launch of platform’ operations;
3. reporting and control model: data quality and KPI & SLA establishment is decisive to maximize value extraction, in the short and/or medium-long term, from workout units.
PwC | 45
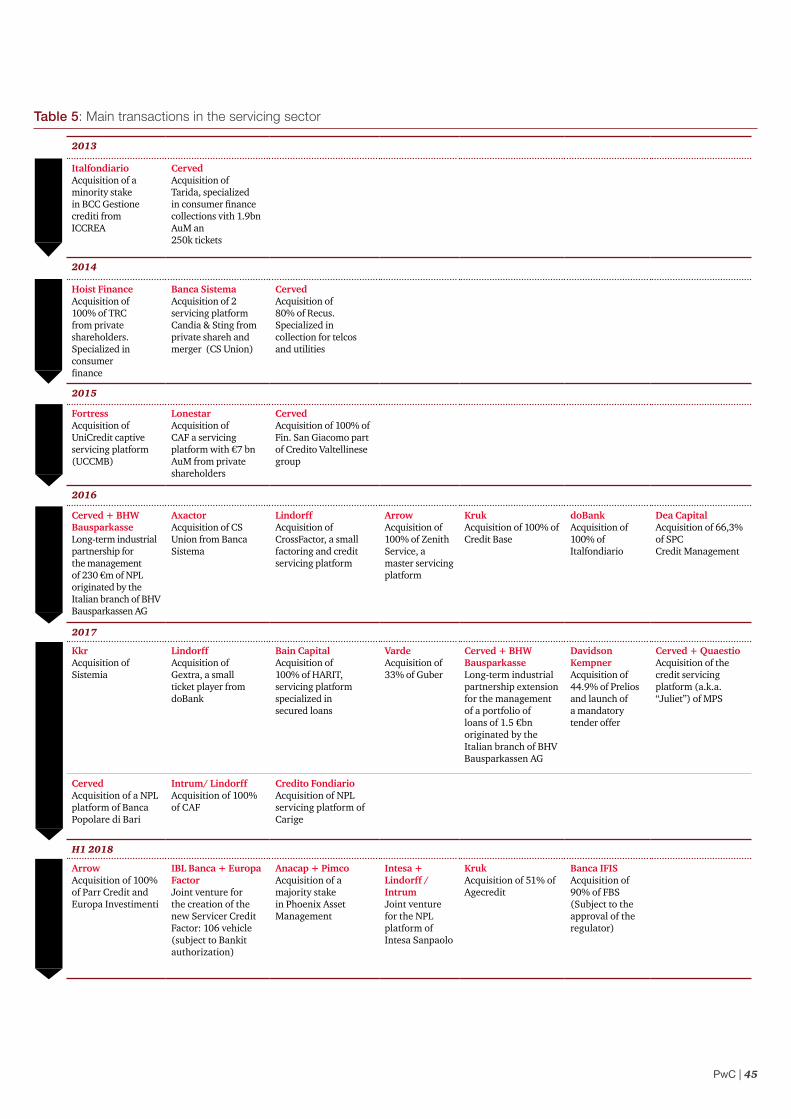
Table 5: Main transactions in the servicing sector
2013
ItalfondiarioAcquisition of aminority stakein BCC Gestionecrediti fromICCREA
CervedAcquisition ofTarida, specialized in consumer finance collections vith 1.9bn AuM an 250k tickets
2014
Hoist FinanceAcquisition of100% of TRCfrom privateshareholders.Specialized inconsumerfinance
Banca SistemaAcquisition of 2servicing platform Candia & Sting from private shareh and merger (CS Union)
CervedAcquisition of80% of Recus.Specialized in collection for telcos and utilities
2015
FortressAcquisition ofUniCredit captive servicing platform (UCCMB)
LonestarAcquisition ofCAF a servicingplatform with €7 bn AuM from private shareholders
CervedAcquisition of 100% of Fin. San Giacomo part of Credito Valtellinese group
2016
Cerved + BHW Bausparkasse Long-term industrial partnership for the management of 230 €m of NPL originated by the Italian branch of BHV Bausparkassen AG
AxactorAcquisition of CS Union from Banca Sistema
LindorffAcquisition ofCrossFactor, a small factoring and credit servicing platform
ArrowAcquisition of100% of ZenithService, a master servicing platform
KrukAcquisition of 100% of Credit Base
doBankAcquisition of100% of Italfondiario
Dea CapitalAcquisition of 66,3% of SPCCredit Management
2017
KkrAcquisition ofSistemia
LindorffAcquisition ofGextra, a smallticket player from doBank
Bain CapitalAcquisition of100% of HARIT,servicing platformspecialized insecured loans
VardeAcquisition of 33% of Guber
Cerved + BHW Bausparkasse Long-term industrial partnership extension for the management of a portfolio of loans of 1.5 €bn originated by the Italian branch of BHV Bausparkassen AG
Davidson KempnerAcquisition of 44.9% of Prelios and launch of a mandatory tender offer
Cerved + QuaestioAcquisition of the credit servicing platform (a.k.a. “Juliet”) of MPS
CervedAcquisition of a NPL platform of Banca Popolare di Bari
Intrum/ LindorffAcquisition of 100% of CAF
Credito FondiarioAcquisition of NPL servicing platform of Carige
H1 2018
ArrowAcquisition of 100% of Parr Credit and Europa Investimenti
IBL Banca + Europa FactorJoint venture for the creation of the new Servicer Credit Factor: 106 vehicle (subject to Bankit authorization)
Anacap + PimcoAcquisition of a majority stake in Phoenix Asset Management
Intesa + Lindorff / IntrumJoint venture for the NPL platform of Intesa Sanpaolo
KrukAcquisition of 51% of Agecredit
Banca IFISAcquisition of 90% of FBS (Subject to the approval of the regulator)

46 | The Italian NPL market - What's next...?!
Table 6: Overview of main servicers (data at 31/12/2017) – Ranking by Revenues
Source: PwC analysis on data provided by Servicers as of 31/12/2017; data have been directly provided by Servicers and have not been verified by PwC. Servicers present highly heterogeneous organizational, industrial and operating structures. Comparing the information presented above requires a correct analysis and understanding of the competitive landscape and servicers business model. 1 Includes both owned and third parties portfolios. 2 Includes Unlikely to Pay + Past Due more than 90 days. 3 doBank group figures include Italfondiario. 4 AuM at 31/05/2018. 5 EBITDA Adjusted. 6 Debt purchasing activities are conduced via Special Purpose Vehicles.
CompanyBank of Italy Surveillance
Revenues (€ million)
Special Servicing Servicing Performing AuM
(€ billion)
Master Servicing AuM (€ billion)11
Ebitda (€ million)Total Bad Loans1
AuM (€ billion)Other NPL AuM2
(€ billion)
doBank3 Bank 213.0 74.3 1.5 0.9 44.9 70.1
Cerved Credit Management 106 94.8 34.9 1.4 9.5 27.6
MBCredit Solutions 106 70.312 5.5 - - 28.712
Credito Fondiario Bank 41.6 6.34 1.34 1.44 42.54 n.a.
Fire 115 40.3 3.2 4.0 9.0 1.1
Advancing Trade 106/115 35.0 3.1 0.9 1.0 10.05
Guber Bank 30.9 7.9 - - n.a.
Cribis Credit Management 115 25.2 2.1 12.9 7.6 n.a.
CAF (Intrum Italy) 115 22.7 8.2 - 0.2 8.9
Serfin 115 22.0 0.5 0.3 0.7 n.a.
Hoist Italia 115 21.3 6.8 - - n.a.
Securitisation Services 106 20.7 0.6 1.0 2.5 37.4 11.4
FBS 106 20.4 8.0 - - 10.1
Sistemia 115 20.3 6.5 - - 5.5
Europa Factor 106/115 20.1 2.6 - 0.5 2.5
Parr Credit (Arrow Group) 115 17.6 0.5 0.4 - 1.0
Gruppo Frascino7 115 15.0 2.1 - 0.2 4.8
Officine CST 115 14.6 1.7 - 1.4 5.4
Bcc Gestione Crediti 115 14.4 4.0 - - 3.8
Prelios Credit Servicing 106 13.5 4.6 - - 6.4 0.5
Aquileia Capital 106/115 13.5 1.3 0.2 - n.a.
Frontis NPL 115 12.4 2.5 0.3 - 9.8
Fides 115 12.0 1.1 0.2 0.2 n.a.
Axactor Italy 106 9.2 1.0 0.3 - n.a.
AZ Holding 115 8.5 1.9 - - n.a.
CSS 115 7.5 2.2 0.4 - 0.6
Finint Revalue 115 6.9 2.8 0.6 - n.a.
SiCollection 115 6.4 1.0 - - 0.7
Phoenix Asset Management 115 6.0 8.9 - - 2.9
Link Financial 115 4.6 2.2 0.1 - n.a.
Aurora RE 115 4.2 0.2 0.7 0.2 n.a.
Centotrenta Servicing 106 4.2 - - - 8.1 1.1
Gextra (Intrum Italy) 115 3.6 0.5 0.1 - 0.3
Certa Credita 115 2.9 0.2 - 0.1 0.59
Blue Factor 106 2.0 1.6 - - 0.7
Bayview Italia 115 -10 3.6 - - n.a.
Zenith Service (Arrow Group) 106 -10 - 0.8 8.4 25.6 n.a.

PwC | 47
7 Includes Credit Network Finance and Z1s. 8 Officine CST is specialised mainly in PA credit servicing. 9 EBITDA refers to 2016. 10 2017 data have not been provided by Servicers, at 31/12/2016 revenues were equal to: Zenith Service 12€m; Not available data for Bayview. 11 Master Servicing services can be qualified in order to provide an advanced KPIs monitoring activity, which uses powerful algorithms, performance trend analysis and the best recovery strategies ("Special Servicing Oversight"). 12 Revenues and EBITDA normalized at 31/12/2017. Note: Double counting may arise when adding NPL AuM as some servicers outsource part of their portfolios to others due to capacity and/or specialization issues.
Main activities
RatingNPL servicing Debt Collection Debt purchasing Master servicing
a a a
a a a
a a a
a a a a
a a a a
a a a
a a a
a
a a
a
a a a6
a a a a
a a a
a
a a a
a
a a a
a8
a a
a a a
a a6
a a
a
a a
a a
a a
a
a a
a
a a
a
a a
a
a
a a
a
a a a

48 | The Italian NPL market - What's next...?!
Table 7: Breakdown of servicers’ Total Bad Loans AuM1 (data at 31/12/2017) – Ranking by Revenues
CompanyRevenues
YE 2017 (€ million)Total Bad Loans AuM (€ billion)1
Average Ticket (€k)
Secured2 (%) Unsecured2 (%)
doBank3 213.0 74.3 115
Cerved Credit Management 94.8 34.9 88
MBCredit Solutions 70.37 5.5 3
Credito Fondiario 41.6 6.34 384
Fire 40.3 3.2 5
Advancing Trade 35.0 3.1 6
Guber 30.9 7.9 63
Cribis CM 25.2 2.1 18
CAF (Intrum Italy) 22.7 8.2 31
Serfin 22.0 0.5 1
Hoist Italia 21.3 6.8 10
Securitisation Services 20.7 0.6 13
FBS 20.4 8.0 32
Sistemia 20.3 6.5 22
Europa Factor 20.1 2.6 1
Parr Credit (Arrow Group) 17.6 0.5 2
Gruppo Frascino5 15.0 2.1 14
Officine CST 14.6 1.7 13
Bcc Gestione Crediti 14.4 4.0 124
Prelios Credit Servicing 13.5 4.6 310
Aquileia Capital 13.5 1.3 330
Frontis NPL 12.4 2.5 1,089
Fides 12.0 1.1 6
Axactor Italy 9.2 1.0 7
AZ Holding 8.5 1.9 7
CSS 7.5 2.2 6
Finint Revalue 6.9 2.8 11
SiCollection 6.4 1.0 6
Phoenix Asset Management 6.0 8.9 344
Link Financial 4.6 2.2 6
Aurora RE 4.2 0.2 25,620
Centotrenta Servicing 4.2 - 5
Gextra (Intrum Italy) 3.6 0.5 7
Certa Credita 2.9 0.2 6
Blue Factor 2.0 1.6 8
Bayview Italia - 6 3.6 59
Zenith Service (Arrow Group) - 6 - 10
Source: PwC analysis on data provided by Servicers as of 31/12/2017; data have been directly provided by Servicers and have not been verified by PwC. Servicers present highly heterogeneous organizational, industrial and operating structures. Comparing the information presented above requires a correct analysis and understanding of the competitive landscape and servicers business model. 1 Includes both owned and third parties portfolios. 2 Percentages are based on total NPL portfolio: breakdown for Master and Special servicing activities have not been provided.
79% 21%
51%
97%
49%
3%
99%1%
99%1%
99%1%
95%5%
95%5%
55% 45%
89%
100%
100%
100%
100%
100%
100%
100%
100%
n.a. n.a.
n.a. n.a.
11%
83%
62%
34% 66%
18%
23%
82%
77%
14% 86%
10% 90%
52% 48%
71% 29%
57%
86%
92%
43%
81% 19%
35% 65%
43% 57%
12% 88%
14%
8%
76% 24%
17%
38%

PwC | 49
Owned 2 (%) Banks2 (%) Investors2 (%) Others2 (%)
3 doBank group figures include Italfondiario – Secured AuM: 30% if referred only to “first lien” secured Bad loans. 4 AuM at 31/05/2018. 5 Includes Credit Network Finance and Z1s. 6 2017 data have not been provided by Servicers, at 31/12/2016 revenues were equal to: Zenith Service 12€m; Not available data for Bayview. 7 Revenues normalized at 31/12/2017.
36%
63%
8%
1%
77% 23%
37% 63%
17% 83%
58%
98%
33%
99%
40% 6%
46%
43% 57%
36%
13%
21%
7%
15% 64% 20%
23% 11%58%
1%
87%
18%
38%
59%
4%
35% 6%
1% 1%
48% 52%
11%
80%
76%
64%
25% 75%
n.a. n.a. n.a. n.a.
n.a. n.a. n.a. n.a.
20%
24%
36%
27% 64% 8%
89%
1%
77% 6% 9%
17% 74%10%
58% 37%6%
18% 55%27%
35% 46%17%
30%
14%
58%13%
55% 5% 26%
100%
100%
100%
100%
100%
64%
37%
n.a. n.a. n.a. n.a.

50 | The Italian NPL market - What's next...?!
Table 8: Geographical NPL breakdown (data at 31/12/2017) – Ranking by Revenues
In term of AuM
CompanyRevenues
YE 2017 (€m)Total Bad Loans AuM (€ billion)1 North2 Centre3 South - Islands4
doBank5 213.0 74.3
Cerved Credit Management 94.8 34.9
MBCredit Solutions 70.310 5.5
Credito Fondiario 41.6 6.36
Fire 40.3 3.2
Advancing Trade 35.0 3.1
Guber 30.9 7.9
Cribis Credit Management 25.2 2.1
CAF (Intrum Italy) 22.7 8.2
Serfin 22.0 0.5
Hoist Italia 21.3 6.8
Securitisation Services 20.7 0.6
FBS 20.4 8.0
Sistemia 20.3 6.5
Europa Factor 20.1 2.6
Parr Credit (Arrow Group) 17.6 0.5
Gruppo Frascino8 15.0 2.1
Officine CST 14.6 1.7
Bcc Gestione Crediti 14.4 4.0
Prelios Credit Servicing 13.5 4.6
Aquileia Capital 13.5 1.3
Frontis NPL 12.4 2.5
Fides 12.0 1.1
Axactor Italy 9.2 1.0
AZ Holding 8.5 1.9
CSS 7.5 2.2
Finint Revalue 6.9 2.8
SiCollection 6.4 1.0
Phoenix Asset Management 6.0 8.9
Link Financial 4.6 2.2
Aurora RE 4.2 0.2
Centotrenta Servicing 4.2 -
Gextra (Intrum Italy) 3.6 0.5
Certa Credita 2.9 0.2
Blue Factor 2.0 1.6
Bayview Italia -9 3.6
Zenith Service (Arrow Group) -9 -
Source: PwC analysis on data provided by Servicers as of 31/12/2017; data have been directly provided by Servicers and have not been verified by PwC; Servicers present highly heterogeneous organizational, industrial and operating structures. Comparing the information presented above requires a correct analysis and understanding of the competitive landscape and servicers business model. 1 Includes both owned and third parties portfolios. 2 Includes: Piemonte, Valle d’Aosta, Lombardia, Veneto, Trentino Alto Adige, Friuli Venezia Giulia, Liguria, Emilia Romagna. 3 Includes: Toscana, Umbria, Marche, Lazio.
45% 32%23%
35% 42%23%
39% 38%23%
53%7 15%33%
34% 44%22%
36% 48%16%
42% 18%40%
47% 28%25%
49% 20%31%
30% 20%50%
47% 33%19%
40% 33%27%
27% 36%38%
48% 17%35%
28% 46%26%
37% 38%25%
38% 38%24%
35% 43%21%
52% 26%22%
25% 53%22%
99%
63% 10%26%
1%
14% 72%14%
33% 33%34%
51% 32%17%
33% 25%42%
41% 43%16%
21% 21%59%
21% 43%36%
48% 6%46%
44% 25%31%
44% 34%23%
28% 55%17%
33% 36%31%
53% 19%28%
54% 27%20%
n.a. n.a. n.a.
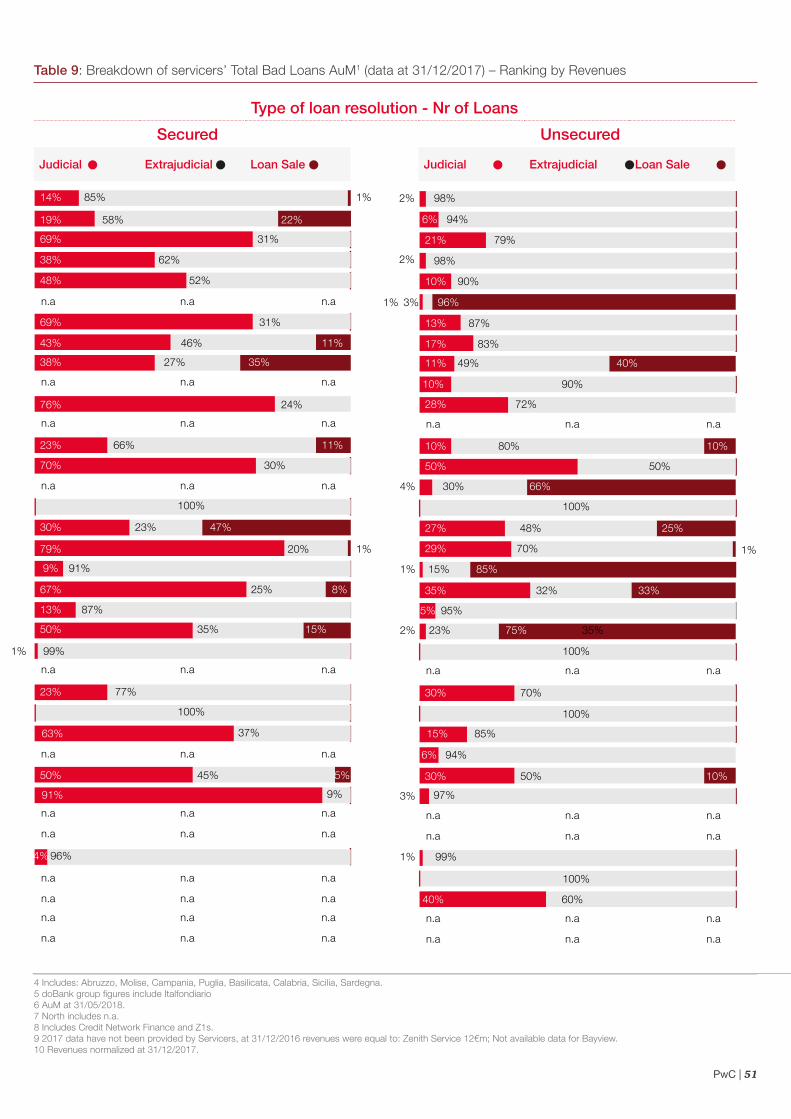
PwC | 51
Table 9: Breakdown of servicers’ Total Bad Loans AuM1 (data at 31/12/2017) – Ranking by Revenues
Type of loan resolution - Nr of Loans
Secured Unsecured
Judicial Extrajudicial Loan Sale Judicial Extrajudicial Loan Sale
4 Includes: Abruzzo, Molise, Campania, Puglia, Basilicata, Calabria, Sicilia, Sardegna. 5 doBank group figures include Italfondiario 6 AuM at 31/05/2018. 7 North includes n.a. 8 Includes Credit Network Finance and Z1s. 9 2017 data have not been provided by Servicers, at 31/12/2016 revenues were equal to: Zenith Service 12€m; Not available data for Bayview. 10 Revenues normalized at 31/12/2017.
14% 1%
1%
n.a n.a n.a
n.a n.a n.a
n.a n.a
100%
1% 99%
100%
n.a
n.a n.a n.a
n.a n.a n.a
n.a n.a n.a
n.a n.a n.a
n.a
96%
n.a n.a
n.a n.a n.a
n.a n.a n.a
n.a n.a n.a
n.a n.a n.a
85%
19% 22%58%
69% 31%
38% 62%
48% 52%
69% 31%
76% 24%
70% 30%
79% 20%
43% 11%46%
38% 35%27%
23% 11%66%
30% 47%23%
9% 91%
67%
87%13%
8%25%
50% 15%35%
50% 5%45%
63% 37%
91%
4%
9%
23% 77%
2%
2%
1%
1% 3%
10% 90%
n.a n.a
100%
94%6%
100%
2%
100%
n.a
n.a n.a n.a
n.a n.a n.a
n.a
99%
n.a n.a
100%
40% 60%
n.a n.a n.a
n.a n.a n.a
98%
6% 94%
21% 79%
98%
10%
96%
90%
13% 87%
28% 72%
50% 50%
29% 70%
30%
17% 83%
11% 40%49%
10% 10%80%
27% 25%48%
85%15%1%
35% 33%
95%
23%
5%
4% 66%
32%
75% 35%
30% 10%50%
15% 85%
3%
1%
97%
30% 70%

52 | The Italian NPL market - What's next...?!
Recent market activity and outlook
Key Message: The Italian banking sector is demonstrating higher willingness to actively manage the amount of Non Performing Loans present on banks’ balance sheets and to promote credit recovery. The latest NPL disposals and the recent regulatory changes confirm that the general attitude tends to reduce the weight of Italian deteriorated loans and to restore higher performance levels for Italian banks. Transaction volumes in 2018 are expected to peak €70 billion.

PwC | 53
Compared to what has been done in previous years, Italian banks are now carrying out larger NPL sales and write-downs, looking for buyers for their deteriorated loans and managing NPL portfolios in a more proactive way.
For example, among the most relevant and recent events which have characterized the Italian NPL market, the last two quarters of 2017 registered the disposals of the €1.2 billion Bad Loans portfolio of Banca Carige, the €320 million one of Banca Popolare di Bari and the €885 million one of Cassa Centrale Banca.
The new accounting rules set out by the IFRS 9, which replaces IAS 39 for the recognition of financial instruments and has come into force from January 1st, 2018, will require Italian banks to consider expected losses on their loan books as well as realized losses. The migration from the old approach will therefore produce substantial effects on banks’ balance sheets, in particular with reference to the First Time Adoption (FTA) fiscal year.
Moreover, the ECB Addendum to its guidelines to banks on Non Performing Exposures (which requires write-downs on NPL for 100% of their book value, to be realized in 7 years from their transition to the non performing state for secured loans, 2 years for unsecured ones) could make it less convenient for Italian banks to extend the permanence of NPL on their balance sheets and this is likely to reinforce the power of their NPL disposal policies.
Table 10: Closed NPL transactions in 2018 YTD
Date SellerVolume 2018
(€ million)Performing/Non
PerformingMacro asset class Buyer
2018 Q2 UniCredit S.p.A. 140 Non Performing Unsecured MBCredit Solutions S.p.A.
2018 Q2 Alba Leasing 100 Bad Loans Secured Bain Capital
2018 Q2 Banca MPS S.p.A. 24,100 Bad Loans Mixed secured/unsecured Quaestio Capital SGR S.p.A.
2018 Q2 Findomestic Banca S.p.A. 35 Non Performing Unsecured Banca IFIS S.p.A.
2018 Q2 Banca IFIS S.p.A. 40 Non Performing Unsecured Pinkerton SPV Srl
2018 Q2 Sicilcassa S.p.A. 1,700 Non Performing Secured MB Finance S.r.l.
2018 Q2 Intesa San Paolo 10,800 Non Performing Mixed secured/unsecured Intrum
2018 Q2 UniCredit S.p.A. 38 Non Performing Secured Due Securitisation SPV S.r.l.
2018 Q2 Agos Ducato S.p.A. 30 Non Performing Unsecured Hoist Finance
2018 Q2 Creval 245 Bad Loans & UtP Secured Algebris Investments
2018 Q1 Confidential 55 Non Performing Secured IDea NPLs
2018 Q1 TI SPV S.r.l. 38 Non Performing Mixed secured/unsecured At NPL's S.p.A.
2018 Q1 Banca Valsabbina Scpa 15 Non Performing Mixed secured/unsecured Sole SPV S.r.l.
2018 Q1 Banca Popolare di Bari 82 Consumer Loans Consumer ViViBanca
Chart 34: NPL transactions trend in the Italian market (€ billion)
5 4
19
1.5
1.2 0.1
9
64
37
Consumer Unsecured Secured Mixed Secured/Usecured Mainly Unsecured Other Total GBV
30
0.8
2012 2013 2014 2015 2016 2017 2018 YTD2.1
0.0
35.0
7.5
9.77.4
4.0 6.5
3.70.8
5.4
1.2
4.40.2
0.62.6
3.80.2
2.62.1
1.8
1.2
9.3
0.0
3.0
Source: PwC market analysis.

54 | The Italian NPL market - What's next...?!
Table 11: Announced NPL transactions for 2018
Seller Volume (€ million) Portfolio type Macro asset class Project name
UBI Banca 3,000 / 4,000 NPL securitisation Mainly secured -
Multioriginator 1,700 NPL securitisation Mainly secured Project Multioriginator
ICCREA 1,000 NPL securitisation Mainly secured -
Creval 1,600 NPL securitisation Mainly secured -
Banco Desio 1,110 NPL securitisation Mainly secured -
Credit Agricole 6,000 Bad Loans Unsecured Project Poppy
Banco BPM 5,100 NPL securitisation Mainly secured Project Exodus
Banca di Sassari 1,100 NPL securitisation Mainly secured Project Banca di Sassari
BPER 2,900 NPL securitisation Mainly secured Project BPER
Gruppo Delta 2,200 Bad loans Unsecured Project Arcade
Cariparma 435 UtP Secured Project Valery
Carige 1,400 UtP Secured Project Isabella
Carige 500 UtP Secured Project Carige
As displayed in Chart 34, the first five months of 2018 feature €37.4 billion of closed transactions, including the €24.1 billion Bad Loan securitization completed by Monte dei Paschi di Siena Group and the €10.8 billion sale of Non Performing Loans (both secured and unsecured) by Intesa San Paolo to Intrum.
More NPL transactions are expected for the remaining part of the year (the main ongoing disposal operations announced for 2018 are displayed in the table below): the efforts to reduce the NPL burden and to accelerate the recovery are a 2018 strategic priority for Italian banks.

PwC | 55
Gross Bad Loans volume (€ billion)
Net Bad Loans volume (€ billion)
Bad Loans Coverage Ratio (%)
Source: Financial Statements as of YE-2017, YE-2016, YE-2015, YE-2014, YE-2013.
UCG ISP MPS Banco BPM UBI BNL BPER Cariparma Pop. Sondrio
49.0 53
.253
.9
51.0
34.6 39
.238
.2
21.6
21.6 26
.624
.3
11.5 13
.813
.6
0.7
0.8
0.9
0.9
Credem
37.9
29.4
19.1
28.6 34
.2
33.0
14.0
0.8
YE 2013 YE 2014 YE 2015 YE 2016 YE 2017 5
.9
6.6
7
.0
7.3
7
.3
5.8
7.1
8
.1
8.
9 7
.7
5.5
6
.5
7.
1
7.0
7.
1 2.2
2
.6
2.7
2
.9
3.0
1.2
1
.6
1.9
2
.1
2.3
Banco BPM
18.7 20
.820
.4
13.6
13.0 15
.014
.2
8.9
8.4 9.
710
.4
14.9
9.7
12.6
7.5
6.7
7
.3
7.9
6
.2
6.5
3.4
4
.0
4.3
4
.0
4.1
2.4
2
.7
3.0
3
.2
3.1
2.5
2
.8
3.0
3
.0
2.9
1.0
1
.1
1.2
1
.2
1.2
0.5
0
.6
0.7
0
.8
0.8
0.3
0
.3
0.4
0
.3
0.3
UCG ISP MPS UBI BNL BPER Cariparma Pop. Sondrio Credem
YE 2013 YE 2014 YE 2015 YE 2016 YE 2017
UCG ISP MPS UBI BNL BPER Cariparma Pop. Sondrio Credem
YE 2013 YE 2014 YE 2015 YE 2016 YE 2017
61.
8 6
2.2
61.
0
73.3
66.
2
62.
5 6
2.8
61.
8 6
0.7
63.
1
58.
8
65.
3
63.
4
64.
8
77.2
41.
9 4
5.9
42.
2
6
7.3
53.
8
41.
6 3
8.8
38.
6
45.
1
44.
8
59.
1 6
2.0
63.
3 6
4.6
59.
7
55.
0 5
6.5
58.
2 5
7.2
5
9.3
55.
0 5
6.5
57.
6 5
7.9
5
9.5
60.
9 6
1.1
61.
9 6
3.4
6
6.1
58.
2 5
8.6
60.
8 5
9.6
61.
1
Banco BPM
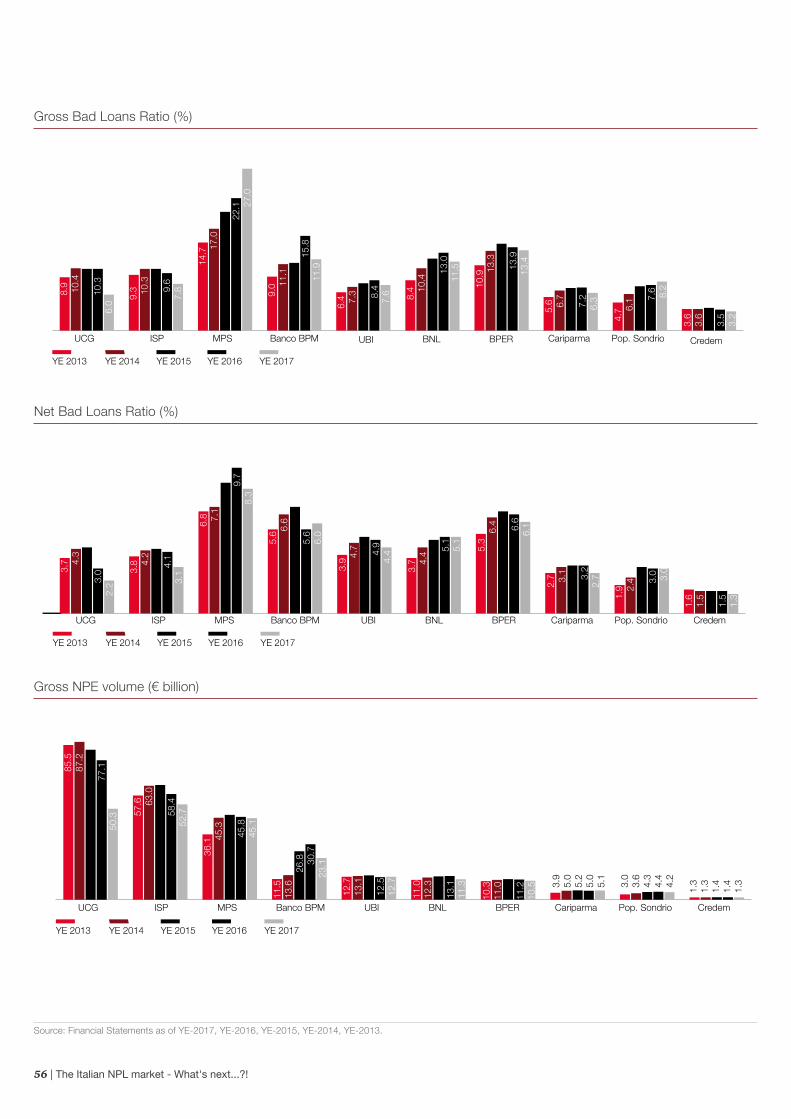
56 | The Italian NPL market - What's next...?!
Gross Bad Loans Ratio (%)
Source: Financial Statements as of YE-2017, YE-2016, YE-2015, YE-2014, YE-2013.
Net Bad Loans Ratio (%)
Gross NPE volume (€ billion)
Banco BPMUCG ISP MPS UBI BNL BPER Cariparma Pop. Sondrio Credem
YE 2013 YE 2014 YE 2015 YE 2016 YE 2017
8.9
10.4
10.3
1
0.3
6.0
9.3
10.3
10.
3
9.6
7
.8
14.
7
1
7.0
19.
8
22.1
2
7.0
9.0
11.
1
11
.3
1
5.8
11.
9
6.4
7.3
7
.9
8
.4
7.
6
8.4
10.
4
1
2.0
1
3.0
11.
5
10.
9
1
3.3
14
.5
13.
9
13
.4
5
.6
6.7
7.1
7.
2
6.3
4.7
6.1
7
.4
7.
6
8.2
3.6
3
.6
3.8
3
.5
3.2
YE 2013 YE 2014 YE 2015 YE 2016 YE 2017
UCG ISP MPS UBI BNL BPER Cariparma Pop. Sondrio Credem
3
.7
4.3
4
.4
3.0
2.2
3
.8
4.2
4
.3
4.1
3.1
6.8
7.1
8
.7
9.7
8.3
5.6
6.
6
7.1
5.6
6
.0
3.9
4.
7
5
.1
4.9
4.4
3.7
4.4
4
.9
5.
1
5.1
5.3
6
.4
6
.8
6.
6
6
.1
2.7
3.1
3
.2
3
.2
2.7
1.9
2.4
3
.1
3.0
3
.0
1.6
1
.5
1.5
1
.5
1.3
Banco BPM
UCG ISP MPS UBI BNL BPER Cariparma Pop. Sondrio Credem
YE 2013 YE 2014 YE 2015 YE 2016 YE 2017
85.
5
8
7.2
8
2.9
77.
1 5
0.3
5
7.6
63
.0
63
.4
5
8.4
52.
7
36.
1
4
5.3
46
.9
45.
8
4
5.1
11.
5 1
3.6
2
6.8
30.
7
23.1
12.
7 1
3.1
13.
5 1
2.5
12.
7
11.
0 1
2.3
12.
9 1
3.1
11.
3
10.
3 1
1.0
11.
4 1
1.2
10.
5 3.9
5
.0
5.2
5
.0
5.1
3.0
3
.6
4.3
4
.4
4.2
1.3
1
.3
1.4
1
.4
1.3
Banco BPM

PwC | 57
Source: Financial Statements as of YE-2017, YE-2016, YE-2015, YE-2014, YE-2013.
Gross NPE Ratio (%)
Net NPE volume (€ billion)
NPE Coverage Ratio (%)
UCG ISP MPS UBI BNL BPER Cariparma Pop. Sondrio Credem
YE 2013 YE 2014 YE 2015 YE 2016 YE 2017
41.1
4
2.6
4
0.5
2
8.7
22.
0
31.
1
33.
6
33.
3
30
.0
26.
0
21
.0
23.1
2
4.2
2
0.3
14.
8
6
.7
7
.3
1
7.8
12
.6
1
3.1
9.3
9.5
9.7
8.
1
8.2
6
.2
6
.4
6.
3
5.8
5.4
6.4
6
.5
6.4
6
.2
5.4
2.3
3
.0
3.1
2
.9
2.8
1.8
2
.1
2.4
2
.4
2.1
0.8
0
.8
0.8
0
.8
0.7
Banco BPM
UCG ISP MPS UBI BNL BPER Cariparma Pop. Sondrio Credem
YE 2013 YE 2014 YE 2015 YE 2016 YE 2017
51.
9 5
1.1
51.
1
62.8
56.
1
46.
0
46.7
47.
5
48.
7
50
.7
41.
8
4
8.9
48.
5
55
.6
6
7.2
41
.9
45.9
3
3.6
59.1
43.
3
26.
5 2
7.3
27
.8
3
5.7
3
5.4 4
3.7
4
8.1
51.
5
55.
3
5
2.0
37.
3 4
0.7
44.
2
4
4.5
4
8.7
39.
6 3
8.6
40.
5
42.
2
4
4.9
39.
2 4
3.2
4
4.5
46.2
51.
0
38.
7 4
0.7
4
4.6
4
2.5
45.
1
Banco BPM
YE 2013 YE 2014 YE 2015 YE 2016 YE 2017
UCG ISP MPS UBI BNL BPER Cariparma Pop. Sondrio Credem
15.
6
16.
9
16.
0
15.6
1
0.5
15
.4
17.
0
16.
6
1
4.8
1
2.0
24.
5
3
1.7
34.8
3
4.5
3
7.0
9.0
11.1
21.9
25.
4
19.
5
13.
7
14.6
15.
2
14.5
1
3.0
15.
9
18.
0
1
9.2
19.
0
16.
8
20.
3
22
.6
23.3
22.
1 1
9.8
10.
2
12.
6
13
.3
1
2.4
10.
8
12.
0
14.
2
1
6.3
16.
1
15
.1
6.3
6
.0
6.0
5
.8
5.2
Banco BPM
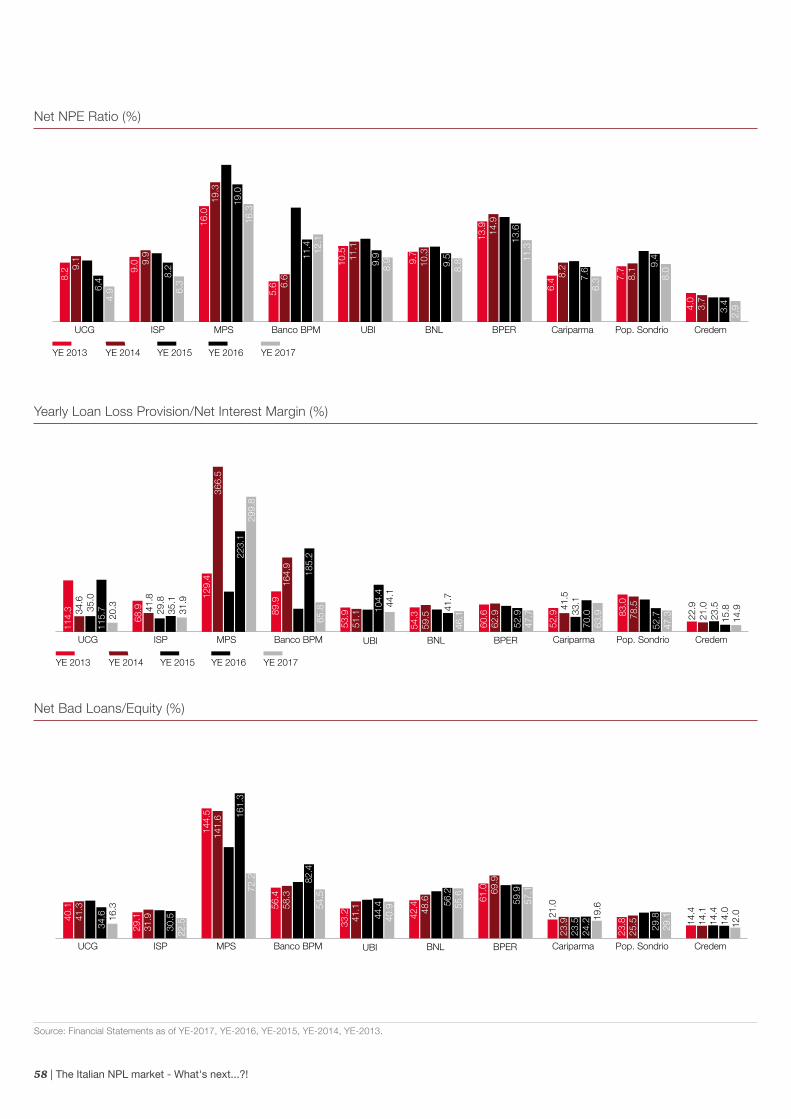
58 | The Italian NPL market - What's next...?!
Net NPE Ratio (%)
Yearly Loan Loss Provision/Net Interest Margin (%)
Source: Financial Statements as of YE-2017, YE-2016, YE-2015, YE-2014, YE-2013.
Net Bad Loans/Equity (%)
UCG ISP MPS UBI BNL BPER Cariparma Pop. Sondrio Credem
YE 2013 YE 2014 YE 2015 YE 2016 YE 2017
8.
2
9
.1
8
.5
6
.4
4.9
9.
0
9.
9
9.5
8
.2
6.3
16.
0
19.
3
21.7
19.
0
16.3
5.6
6.6
15.
8
11.
4
12
.1
1
0.5
11.1
11
.5
9
.9
8.9
9.7
1
0.3
1
0.4
9
.5
8.
8
6.4
8
.2
8.4
7.
6 6
.3
13
.9
1
4.9
1
4.5
13.
6 1
1.3
7.7
8
.1
9.8
9.4
8.0
4
.0
3
.7
3.
4
3.4
2.9
Banco BPM
UCG ISP MPS UBI BNL BPER Cariparma Pop. Sondrio Credem
YE 2013 YE 2014 YE 2015 YE 2016 YE 2017
114
.3
34.
6
3
5.0
115
.7
2
0.3
6
8.9
41.
8
2
9.8
35.
1
3
1.9
129.
4
366.
5 8
9.3
223.
1
2
99.8
89.9
164
.9
51.
3
185.
2
65.8
53.
9 5
1.1
49.
2
1
04.4
44.1
54.
3 5
9.5
49.
7
4
1.7
46.
1
60.
6 6
2.9
57.
5 5
2.9
47.
7
52.
9
4
1.5
33.1
7
0.0
63.
9
83.0
78.
5
71.
8 5
2.7
47.
3
22.
9 2
1.0
23.
5 15
.8
14.9
Banco BPM
UCG ISP MPS UBI BNL BPER Cariparma Pop. Sondrio Credem
YE 2013 YE 2014 YE 2015 YE 2016 YE 2017
40.
1
4
1.3
42.
0
34.
6
1
6.3
29
.1
31
.9
31
.3
30
.5
22.
5
144
.5
141.
6
1
01.4
1
61.3
7
2.2
56.
4 5
8.3
6
2.6
8
2.4
54.
5
33.
2
41.1
43.
0
44.
4
40.9
42.
4
48.6
52.
4
56
.2
5
5.6
61.
0
69.
9 5
9.2
59.
9 5
7.1
21.
0 2
3.9
23.
5 2
4.2
19.
6
23.
8 2
5.5
28
.7
29
.8
29
.1
14.
4 1
4.1
14.
4 1
4.0
12.0
Banco BPM

PwC | 59
Pier Paolo Masenza Financial Services Deals [email protected]
Vito RuscignoCo-Head of NPL [email protected]
Gianluigi BenettiFinancial Services | Deals Strategy [email protected]
Antonio MartinoReal Estate Deals [email protected]
Matteo D'Alessio Financial Services Deals [email protected]
Francesco [email protected]
Fedele PascuzziBusiness Recovery Services [email protected]
Alessandro Biondi Co-Head of [email protected]
Gabriele GuggiolaRegulatory Deals [email protected]
Emanuele EgidioAssociate Partner (Challenger Banks) [email protected]
Edoardo [email protected]
Contacts List / Contributors

60 | The Italian NPL market - What's next...?!
AustriaJens Roennberg+49 699 585 [email protected]
Bernhard Engel+43 150 188 [email protected]
BulgariaBojidar Neytchev+35 929 355 [email protected]
CEEPetr Smutny+42 025 115 [email protected]
Edward Macnamara+42 731 635 [email protected]
CroatiaSinisa Dusic+38 516 328 [email protected]
CyprusStelios Constantinou+35 725 555 [email protected]
Czech Republic and SlovakiaPetr Smutny+42 025 115 [email protected]
DenmarkBent Jørgensen+45 39 459 [email protected]
FranceHervé Demoy+33 156 577 [email protected]
GermanyChristopher Sur+49 699 585 [email protected]
Thomas Veith+49 699 585 [email protected]
Jörg Jünger+49 699 585 [email protected]
GreeceThanassis Panopoulos+30 210 687 [email protected]
HungaryCsaba Polacsek+36 14 619 [email protected]
IrelandAidan Walsh+35 317 926 [email protected]
ItalyPierpaolo Masenza+39 065 7025 [email protected]
Fedele Pascuzzi+39 028 064 [email protected]
Vito Ruscigno+39 02 8064 [email protected]
Alessandro Biondi+39 02 [email protected]
The NetherlandsPeter Wolterman+31 887 925 [email protected]
Wilbert van den Heuvel+31 887 923 [email protected]
Jessica Lombardo+31 887 925 [email protected]
NorwayLars Johansson+47 48 161 792 [email protected]
PolandPawel Dzurak+48 227 464 [email protected]
PortugalAntonio Rodrigues+35 121 359 [email protected]
SerbiaMarko Fabris+38 111 330 [email protected]
SpainJaime Bergaz+34 915 684 [email protected]
Guillermo Barquin+34 915 685 [email protected]
Pablo Martinez-Pina+34 915 684 [email protected]
Richard Garey+34 915 684 [email protected]
SwedenPer Storbacka +46 855 533 [email protected]
TurkeySerkan Tamur+90 212 376 [email protected]
Kadir Köse+90 212 355 [email protected]
UkraineOleg Tymkiv+38 044 4906 [email protected]
United KingdomRichard Thompson+44 20 7213 [email protected]
Robert Boulding+44 20 7804 [email protected]
Ben May+44 20 7212 [email protected]
Panos Mizios+44 20 7804 [email protected]
Christina Zarifi+44 20 7213 [email protected]
Natasha Firman+44 20 7212 [email protected]
North AmericaMitchell Roschelle+1 646 471 [email protected]
Asia PacificTed Osborn+85 222 892 [email protected]
Chiara Lombardi+65 6236 [email protected]
James Dilley+85 222 892 [email protected]
Huong Dao Thi [email protected]
Lee Chui Sum+60(3) 2173 [email protected]
Michael [email protected]
Masaya Koto+81 906 512 [email protected]
Latin AmericaNico Malagamba +55 119 9976 [email protected]
Middle EastMatthew Wilde+971 4 304 [email protected]
Portfolio Advisory Group

PwC | 61

62 | The Italian NPL market - What's next...?!

PwC | 63

© 2018 PricewaterhouseCoopers Advisory SpA. All rights reserved. PwC refers to PricewaterhouseCoopers Advisory SpA and may sometimes refer to the PwC network. Each member firm is a separate legal entity. Please see www.pwc.com/structure for further details. This content is for general information purposes only, and should not be used as a substitute for consultation with professional advisors.
www.pwc.com/it/npl
Related Documents