Continental Shelf Research 26 (2006) 1775–1793 The Irish coastal current: A seasonal jet-like circulation L. Fernand a, , G.D. Nolan b , R. Raine c , C.E. Chambers a,d , S.R. Dye a , M. White c , J. Brown a,1 a Centre for Environment Fisheries and Aquaculture Science (CEFAS), Pakefield Rd., Lowestoft, Suffolk NR33 0HT, UK b Marine Institute, Galway Technology Park, Ballybrit, Galway, Ireland c Martin Ryan Institute, National University of Ireland, Galway, Ireland d Geography Department, University College of London, Chandler House, 2 Wakefield Street, London WC1N 1PG, UK Received 21 October 2005; received in revised form 10 March 2006; accepted 11 May 2006 Available online 27 July 2006 Abstract During 25 July–3 August 2001 a comprehensive cruise was undertaken along the western coast of the Republic of Ireland to resolve the three-dimensional density field and circulation. Towed undulating CTD revealed the strong thermocline beyond the 60 m contour with more diffuse stratification inshore. Argos drifters deployed in the late summer of 1999, 2000 and 2001 demonstrated strongly northward flow, their motion was uncorrelated with wind forcing but was consistent with the predicted geostrophic currents generated by the bottom fronts intersecting the seabed. These flows were evident in the data from the vessel mounted 153.6 kHz acoustic Doppler current profiler (ADCP) although the jets are relatively narrow (15–20 km). This region is heavily influenced by storm events and Atlantic influence with high salinity contributing to strong vertical and horizontal density gradients particularly in the south of the region. However, the seasonal heating cycle coupled with tidal mixing is the dominant force of buoyancy production that ensures that the frontal features occur every year. In combination with similar features found in the Celtic Sea [Brown, J., et al., 2003. Observations of the physical structure and seasonal jet-like circulation of the Celtic Sea and St. George’s Channel of the Irish Sea. Continental Shelf Research 23, 533–561] these observations demonstrate the existence of a continuous pathway in summer from the north Cornish coast to Malin Head with average residual velocities 47.5 cm s 1 . The data set described here provides the necessary basis for environmental management and knowledge of the pathway for contaminants, the dynamics of nutrients and an understanding of the movement of larvae and juvenile fish, in a geographic location that had previously been little studied. Crown Copyright r 2006 Published by Elsevier Ltd. All rights reserved. Keywords: Density fronts; Drifters; Density driven; Coastal currents; Jets; Shelf fronts 1. Introduction Situated at the western margin of the northwest European Continental Shelf the waters of western Ireland exhibit hydrographic and biological proper- ties characteristic of both coastal and Atlantic regimes. In the south and northwest the edge of ARTICLE IN PRESS www.elsevier.com/locate/csr 0278-4343/$ - see front matter Crown Copyright r 2006 Published by Elsevier Ltd. All rights reserved. doi:10.1016/j.csr.2006.05.010 Corresponding author. Tel.: +44 1502 524538; fax: +44 1502 513865. E-mail address: [email protected] (L. Fernand). 1 Current address: British Oceanographic Data Centre (BODC), Joseph Proudman Building, 6 Brownlow Street, Liverpool L35DA, UK.

Welcome message from author
This document is posted to help you gain knowledge. Please leave a comment to let me know what you think about it! Share it to your friends and learn new things together.
Transcript
Continental Shelf Research 26 (2006) 1775–1793
The Irish coastal current: A seasonal jet-like circulation
L. Fernanda,!, G.D. Nolanb, R. Rainec, C.E. Chambersa,d, S.R. Dyea,M. Whitec, J. Browna,1
aCentre for Environment Fisheries and Aquaculture Science (CEFAS), Pakefield Rd., Lowestoft, Suffolk NR33 0HT, UKbMarine Institute, Galway Technology Park, Ballybrit, Galway, IrelandcMartin Ryan Institute, National University of Ireland, Galway, Ireland
dGeography Department, University College of London, Chandler House, 2 Wakefield Street, London WC1N 1PG, UK
Received 21 October 2005; received in revised form 10 March 2006; accepted 11 May 2006Available online 27 July 2006
Abstract
During 25 July–3 August 2001 a comprehensive cruise was undertaken along the western coast of the Republic ofIreland to resolve the three-dimensional density field and circulation. Towed undulating CTD revealed the strongthermocline beyond the 60m contour with more diffuse stratification inshore. Argos drifters deployed in the late summerof 1999, 2000 and 2001 demonstrated strongly northward flow, their motion was uncorrelated with wind forcing but wasconsistent with the predicted geostrophic currents generated by the bottom fronts intersecting the seabed. These flows wereevident in the data from the vessel mounted 153.6 kHz acoustic Doppler current profiler (ADCP) although the jets arerelatively narrow (15–20 km).This region is heavily influenced by storm events and Atlantic influence with high salinity contributing to strong vertical
and horizontal density gradients particularly in the south of the region. However, the seasonal heating cycle coupled withtidal mixing is the dominant force of buoyancy production that ensures that the frontal features occur every year.In combination with similar features found in the Celtic Sea [Brown, J., et al., 2003. Observations of the physical
structure and seasonal jet-like circulation of the Celtic Sea and St. George’s Channel of the Irish Sea. Continental ShelfResearch 23, 533–561] these observations demonstrate the existence of a continuous pathway in summer from the northCornish coast to Malin Head with average residual velocities 47.5 cm s!1.The data set described here provides the necessary basis for environmental management and knowledge of the pathway
for contaminants, the dynamics of nutrients and an understanding of the movement of larvae and juvenile fish, in ageographic location that had previously been little studied.Crown Copyright r 2006 Published by Elsevier Ltd. All rights reserved.
Keywords: Density fronts; Drifters; Density driven; Coastal currents; Jets; Shelf fronts
1. Introduction
Situated at the western margin of the northwestEuropean Continental Shelf the waters of westernIreland exhibit hydrographic and biological proper-ties characteristic of both coastal and Atlanticregimes. In the south and northwest the edge of
ARTICLE IN PRESS
www.elsevier.com/locate/csr
0278-4343/$ - see front matter Crown Copyright r 2006 Published by Elsevier Ltd. All rights reserved.doi:10.1016/j.csr.2006.05.010
!Corresponding author. Tel.: +441502 524538;fax: +441502 513865.
E-mail address: [email protected] (L. Fernand).1Current address: British Oceanographic Data Centre (BODC),
Joseph Proudman Building, 6 Brownlow Street, LiverpoolL35DA, UK.

the continental shelf (defined by the 200m contour)approaches within 30 and 60 km of the coast,respectively (Fig. 1). Exposed to Atlantic weathersystems, average wind speeds in January are12m s!1 and even during the calmest month ofJune the average is 7m s!1 (Anon, 1999). Conse-quently, wind plays a significant role in determiningthe residual circulation of the region (e.g. Pingree
and Griffiths, 1980; Pingree and Le Cann, 1989). Inrecent years, the strength and extent of thepredominantly density-driven European continentalslope current has been established (e.g. Pingree etal., 1999; White and Bowyer, 1997), but a descrip-tion of the coastal circulation remains elusive.
Typically, topography shelves rapidly to80–100m within 20 km of the coast where it extends
ARTICLE IN PRESS
12°W
56°N
52°N
54°N
10°W 8°W 6°W
261146372637321576(99)240172401824020265464384797121576(01)240582611827231
Buoy number deployment dates
14.07.98 - 11.09.9810.07.99 - 11.08.9910.07.99 - 07.08.9910.07.99 - 16.08.9910.07.99 - 01.09.9909.07.99 - 11.08.9911.07.99 - 03.08.9909.07.99 - 17.08.9929.07.01 - 09.08.0127.07.01 - 13.08.0128.07.01 - 17.08.0128.07.01 - 12.08.0127.07.01 - 12.09.0128.07.01 - 05.08.01
= 5 cm s-1
= 1 cm s-1
MalinShelf
Malin Head
LoughSwillyBloodyForeland
DonegalBayErrisHead20
0m
ER1
ClareIs
AranIs
150m
W3
W2
W1
Pl12
R.Shannon
Loop Head
BlasketIs
BantryBay
SW3
SW7
SW9
Crease Line
100m
CELTICSEA
50m25m
1411
8
4
3
10
5
x
x
x
x
x
Fig. 1. Location of Scanfish sections and CTD stations (+) occupied during 25 July–3 August 2001. Solid red lines and associatednumbers denote the sections presented in Figs. 3–9, whilst the remaining sections are indicated as broken lines. Deployment positions andthe identity (Table 1) of the drogued satellite-tracked drifters are indicated by K. CTD transects by a m. Locations of current meters usedfor detiding the ship mounted ADCP data are denoted as red"with arrows indicating the residual current magnitude (length of arrow)and direction.
L. Fernand et al. / Continental Shelf Research 26 (2006) 1775–17931776

to the shelf edge as a relatively flat plateau (Fig. 1).Generally, tidal current amplitudes are weak(springs tidal current amplitudes o0.3m s–1) andthe region stratifies thermally during summer(June–September) (Huang et al., 1991; McMahon,et al., 1995). This occurs where there is insufficienttidally generated turbulent energy to maintainmixing against the input of surface buoyancythrough solar heating (Simpson and Hunter, 1974;Fernhead, 1975). However, in the vicinity of head-lands and in shallow water tidal flows approach1m s!1. The conventional view of the circulation ofthis region is one of a relatively quiescent dense(cold and salty) pool of bottom water beneath awarm and largely wind-driven surface layer. Ana-lysis of infra-red satellite imagery suggests that theplume of the River Shannon forms a northwardbuoyancy flow in Galway Bay (Huang et al., 1991),the velocity of which is regulated by wind.
Recent work in the Celtic Sea (Carrillo, 2001;Brown et al., 2003; Young et al., 2004) has describedthe presence of fast (40.2m s!1), narrow (10–20 kmwide) baroclinic jets associated with cold (or salty),dense pools of bottom water which remain trappedbeneath the summer thermocline. The ‘cold pooljets’ flow in a cyclonic sense (dense water to the leftin the northern hemisphere), with peak speeds at orabove the thermocline level consistent with thedynamics described by Garrett and Loder (1981)relevant to bottom-dominant fronts. The well-organised anti-clockwise circulation is essentiallyimpervious to wind events, extending continuously#700 km from the Scilly Isles toward St. George’sChannel and skirting the coast of southern Ireland.The trajectory of a satellite-tracked drifter droguedat 30m suggested that the flow extended around thesouthwestern tip of Ireland. Evidence for this alsoappears in data from current meters moored in thevicinity of Fastnet during 19 May–13 August 1994(Raine and McMahon, 1998). Inshore of what wastermed the Irish Shelf front, delineated by the 35.3isohaline, mean flows were observed of order8 cm s!1 toward approximately 3251 relative to truenorth. This was consistent with the location ofbottom fronts determined by a conductivity tem-perature depth (CTD) section. Correlation of thisrecord and other current meter data with wind data(Nolan, 2004) suggests that wind is not the principledriving force.
Whilst there is evidence that circulation continuesaround the south-western tip of Ireland, there areinsufficient data to determine its ultimate extent.
However, comparatively weak tidal amplitudes westof the Aran Islands, might suggest tidal mixing, atleast in this region, is insufficient to support bottomfronts north of the River Shannon. Nevertheless, inorder to resolve the scope of the summertimecirculation, following pilot studies in 1999 and2000, we undertook a comprehensive hydrographicsurvey of the region between the Celtic Sea and theMalin Shelf during the summer of 2001.
Such knowledge is important as it determines theadvection and dispersion of nutrients and phyto-plankton and is likely to play a significant role in thedetermining the timing and location of harmfulalgal events in the region (Raine et al., 1993).Several species of fish and shellfish of commercialimportance (e.g. herring, plaice, sole and Nephropsnorvegicus) spawn in the region and knowledge ofthe factors controlling egg and larval drift arenecessary for an understanding of their recruitmentvariability. Significant quantities of migrating sal-mon are also caught in the coastal waters andknowledge of migration pathways might help tounderstand factors affecting recruitment variability.
2. Observations and instrumentation
Observations of the water column structure wereundertaken from the R.V. Celtic Voyager during 25July–3 August 2001 (CV34) through a series oftowed undulating and conventional profiling CTDtransects (Fig. 1). Contemporaneous measurementsof the velocity field were made with a RDInstruments 153.6 kHz broad band acoustic Dop-pler current profiler (ADCP), set to record with aresolution in the vertical of 2m (bin size) andhorizontal of approximately 300m (1min averages).During the cruise six satellite-tracked Argos driftingbuoys were deployed to make direct measurementsof the Lagrangian flow field. Additional measure-ments were available from seven instrumentsdeployed during July and August 1999 and onefrom July–September 1998. In the absence ofsuitable meteorological observations, hourly valuesof wind speed and direction (Fig. 2) were availablefrom a mesoscale meteorological model (Cullen,1993) at 10m above sea level.
2.1. Towed undulating CTDs
Towed undulating CTD sections (Fig. 1) wereperformed using Scanfish, a computer-controlledvehicle towed at 3.0–4.5m s!1. A comprehensive
ARTICLE IN PRESSL. Fernand et al. / Continental Shelf Research 26 (2006) 1775–1793 1777

description of its use and the subsequent dataanalysis can be found in Brown et al. (1996) andFernand (1999). Nominally, the instrument was setto profile from 4m below the surface to within 5mof the seabed, a height controlled by an onboardaltimeter. Separation of profiles was equivalent toconventional CTD profiles at approximately300–800m horizontal separation, dependent onbottom depth. The Scanfish vehicle was fitted witha Falmouth Scientific Inc. Integrated (FSI) CTD.Calibration of the temperature sensor was per-formed pre- and post-cruise in the laboratory, andafter calibration values were found to be accurate to70.002 1C. Salinity calibration of the Scanfish CTDwas undertaken at sea with comparison to under-way sample, using the practical salinity scale(UNESCO, 1978) leading to an off set of !0.043with the 1st standard deviation being 0.020.
2.2. Profiling CTDs
The conventional discrete instrument rosettepackage was fitted with a Seabird 911 CTD.Temperature was calibrated against reversing digitalthermometers and salinity calibrated with watersamples collected from the rosette and subsequentlyanalysed in the laboratory.
2.3. Drifters
The free-floating satellite-tracked drifters weredeployed and subsequently tracked via ServiceArgos. The instruments were fitted with holey sockdrogues 5.5m long and 1.5m diameter and centredat 30m depth. Position fixes during the deploymentswere obtained at a rate of 8–12 per day with astandard deviation in the position estimate ofbetween 150 and 1000m, dependent on the quality
of the signal received at the satellite. The drag arearatio of the system was greater than 50 whichrestricts wind slip to less than 1 cm s!1 for winds of10m s!1 (Niiler et al., 1995). Buoy deploymentdetails are summarised in Table 1. Drifter trajec-tories were determined by using linear interpolationto transform latitude and longitude on to a uniform3-h time series, and applying a lowpass filter(Horsburgh, 1999; Horsburgh et al., 2000) toremove the semidiurnal tidal signal and ‘noise’introduced by inaccuracy in position fixes. Zonal (u)and meridional (v) residual velocities were obtainedfrom central spatial differences of the filtered timeseries over 24 h.
Drifter records were examined to determine whendrogue loss had occurred, by investigation in thechange of the wind: drifter velocity ratio, if thisbehaviour was subsequently maintained then it wasassumed the drogue had been lost and the recordcut at that point. To determine quantitatively theeffect of wind forcing on the drifters, flow variabilityof each drifter; wind and current variability werecorrelated after the data were lowpass filtered andthe mean removed. The applied technique isadapted from that described by Brown and Gmi-trowicz (1995). The wind velocity W at some angleyw anticlockwise of the flow direction forces acurrent C, which at time t is given by
C$t% & RW $t! L%,
where R is the regression coefficient between windand current, and L is the time lag of currentresponse to forcing. Flows were resolved along theeast (U) and north (V) components of currentvariability at each drifter and yw and L were variedto identify the peak correlation between wind andcurrent. The dimensions of the meteorologicalmodel grid from which wind estimates were derived
ARTICLE IN PRESS
200 210 220 230 240 250 260 270Julian day 2001
-20
-10
0
10
20
ms-1
Fig. 2. Wind vectors from 53100N 10100W from the meteorological model (Cullen, 1993) at 6-hourly intervals at the 10m heightequivalent. North is toward the top of the page.
L. Fernand et al. / Continental Shelf Research 26 (2006) 1775–17931778

ARTICLE IN PRESS
Tab
le1
Relationshipsbetweenbuoyspeedsan
dlocalwindforcing
Drifter
PTT
number
Start
time
Start
date
End
time
Enddate
Daysof
drogu
eddata
(days)
Average
residual
velocity
(cms!
1)
Ucomponent
Vcomponent
y wr
RL
%va
ry w
rR
L%
var
26114
1055
14/7/98
901
11/9/98
58.9
7.5
500.46
2150
0.53
028
6372
302
10/7/99
1647
11/8/99
32.6
4.5
550.74
0.53
655
355
0.34
011
6373
301
10/7/99
1006
7/8/99
28.3
3.9
285
0.21
04
350.33
011
21576
443
10/7/99
1816
16/8/99
37.6
4.7
300.44
0.29
019
550.67
0.62
645
24017
623
10/7/99
1621
1/9/99
53.4
9.9
800.17
03
650.40
0.68
616
24018
2037
9/7/99
1648
11/8/99
32.8
3.1
150.53
029
00.64
0.51
641
24020
848
10/7/99
1133
3/8/99
24.1
6.8
300
0.53
0.60
628
110
0.75
0.69
656
26546
1719
9/7/99
1553
17/8/99
38.9
8.6
145
0.06
00
400.59
1.09
635
27231
2000
28/7/01
1538
5/8/01
7.8
13.1
170
0.52
027
305
0.33
038
4384
2204
28/7/01
1454
9/8/01
11.7
7.5
750.55
0.80
2130
300.63
1.53
040
7971
626
27/7/01
1703
13/8/01
17.4
7.7
150
0.55
1.42
330
270
0.04
01
21576
351
28/7/01
1852
17/8/01
20.6
8.4
355
0.36
611
315
0.36
611
24058
1815
28/7/01
1905
12/8/01
15.0
10.1
130
0.61
0.86
637
550.77
2.16
059
26118
1115
27/7/01
1857
12/9/01
47.3
9.4
450.47
0.82
322
200.72
0.73
052
y wisthean
gleofthewindrelative
totruenorththat
bestcorrelates
withthecurrent.risthecorrelationcoefficient,R
theregressioncoefficient,Lthelagin
hours
and%
varisthe
percentage
ofthetotalcurrentva
rian
ceexplained.Only
those
correlationssign
ificantat
X95
%arepresented.
L. Fernand et al. / Continental Shelf Research 26 (2006) 1775–1793 1779
is approximately 0.061 in latitude and 0.0661 inlongitude. For each drifter a time series of wind wasconstructed by extracting the data from the gridelement relating to each 3 h position of the drifter.Results are summarised in Table 1, where the winddirection giving the best response and the associatedlags and correlation coefficients are presented alongwith the regression coefficient for those drifters,which are statistically significant. Drifters which aresignificant at X95% are presented in bold, withaccount taken for autocorrelation of the time series(Sciremammano, 1979). The regression coefficientgives the induced drifter flow in cm s!1 for a wind inm s!1, i.e. 0.8 is 80 cm s!1 for a 10m s!1 wind.
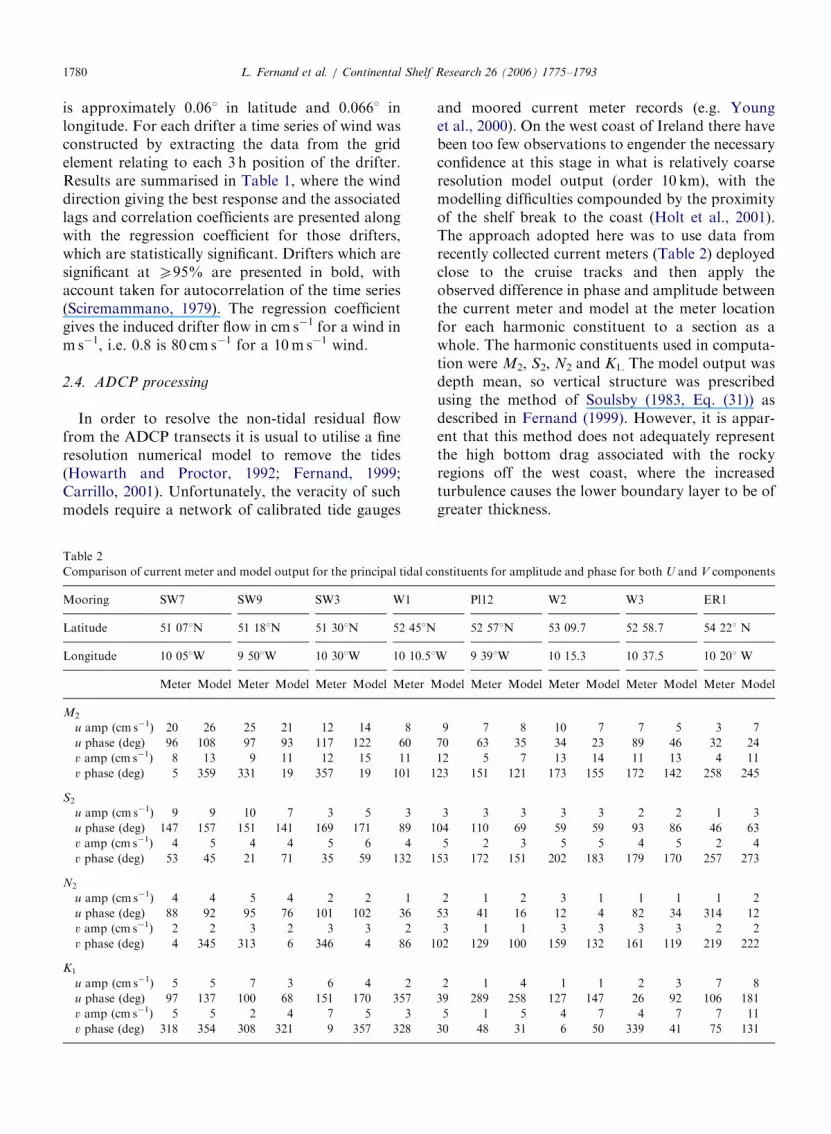
2.4. ADCP processing
In order to resolve the non-tidal residual flowfrom the ADCP transects it is usual to utilise a fineresolution numerical model to remove the tides(Howarth and Proctor, 1992; Fernand, 1999;Carrillo, 2001). Unfortunately, the veracity of suchmodels require a network of calibrated tide gauges
and moored current meter records (e.g. Younget al., 2000). On the west coast of Ireland there havebeen too few observations to engender the necessaryconfidence at this stage in what is relatively coarseresolution model output (order 10 km), with themodelling difficulties compounded by the proximityof the shelf break to the coast (Holt et al., 2001).The approach adopted here was to use data fromrecently collected current meters (Table 2) deployedclose to the cruise tracks and then apply theobserved difference in phase and amplitude betweenthe current meter and model at the meter locationfor each harmonic constituent to a section as awhole. The harmonic constituents used in computa-tion were M2, S2, N2 and K1. The model output wasdepth mean, so vertical structure was prescribedusing the method of Soulsby (1983, Eq. (31)) asdescribed in Fernand (1999). However, it is appar-ent that this method does not adequately representthe high bottom drag associated with the rockyregions off the west coast, where the increasedturbulence causes the lower boundary layer to be ofgreater thickness.
ARTICLE IN PRESS
Table 2Comparison of current meter and model output for the principal tidal constituents for amplitude and phase for both U and V components
Mooring SW7 SW9 SW3 W1 Pl12 W2 W3 ER1
Latitude 51 071N 51 181N 51 301N 52 451N 52 571N 53 09.7 52 58.7 54 221 N
Longitude 10 051W 9 501W 10 301W 10 10.51W 9 391W 10 15.3 10 37.5 10 201 W
Meter Model Meter Model Meter Model Meter Model Meter Model Meter Model Meter Model Meter Model
M2
u amp (cm s!1) 20 26 25 21 12 14 8 9 7 8 10 7 7 5 3 7u phase (deg) 96 108 97 93 117 122 60 70 63 35 34 23 89 46 32 24v amp (cm s!1) 8 13 9 11 12 15 11 12 5 7 13 14 11 13 4 11v phase (deg) 5 359 331 19 357 19 101 123 151 121 173 155 172 142 258 245
S2
u amp (cm s!1) 9 9 10 7 3 5 3 3 3 3 3 3 2 2 1 3u phase (deg) 147 157 151 141 169 171 89 104 110 69 59 59 93 86 46 63v amp (cm s!1) 4 5 4 4 5 6 4 5 2 3 5 5 4 5 2 4v phase (deg) 53 45 21 71 35 59 132 153 172 151 202 183 179 170 257 273
N2
u amp (cm s!1) 4 4 5 4 2 2 1 2 1 2 3 1 1 1 1 2u phase (deg) 88 92 95 76 101 102 36 53 41 16 12 4 82 34 314 12v amp (cm s!1) 2 2 3 2 3 3 2 3 1 1 3 3 3 3 2 2v phase (deg) 4 345 313 6 346 4 86 102 129 100 159 132 161 119 219 222
K1
u amp (cm s!1) 5 5 7 3 6 4 2 2 1 4 1 1 2 3 7 8u phase (deg) 97 137 100 68 151 170 357 39 289 258 127 147 26 92 106 181v amp (cm s!1) 5 5 2 4 7 5 3 5 1 5 4 7 4 7 7 11v phase (deg) 318 354 308 321 9 357 328 30 48 31 6 50 339 41 75 131
L. Fernand et al. / Continental Shelf Research 26 (2006) 1775–17931780

3. Results
3.1. Drifter observations
Satellite-tracked drifter observations were madeduring 1998, 2000 and 2001 (Table 1; Fig. 1). Thedrifter deployed during 1998 (26114) formed part ofan experiment to resolve the summer circulation ofthe Celtic Sea (Brown et al., 2003) and is includedhere as it provides a measure of the circulationwithin the region of this study. Deployed for almost60 days from mid-July, the filtered drifter trajectoryshows an initial westward movement before movingnorth and then becoming entrained in a near coastalcirculation. The average velocity during deploymentwas 7.5 cm s!1 (6.5 kmday!1), with a peak dailyaverage of 20 cm s!1 in the region of longitude91350W. While this drifter was significantly corre-lated with the wind it only accounted for 21% and28% of the variance in the U and V components,respectively. The mean wind speed was 3.8m s!1
from a direction of 651, opposing the direction ofinstrument motion, except during a period of strongsouth-westerly winds that resulted in the beachingof the buoy.
In 1999, seven drifters (Table 1; Fig. 1) weredeployed between latitude 52 and 531N, thetrajectories were northward at mean speeds ofbetween 3.5 and 10 cm s!1, with the exception ofinstrument 24018, which moved onshore andstranded on Loop Head. The southern mostinstruments (26546 and 24017) exhibited the great-est movement, following essentially the same pathto the west of the Aran Islands, with 26546grounding in shallow water. However, 24017 witha mean velocity of 10.0 cm s!1 (#8.5 kmday!1)travelled 450 km into Donegal Bay before datatransmission ceased. Both of these drifters weresignificantly correlated with wind in the V compo-nent but only accounted for 35% and 16% of thevariance for 26546 and 24017, respectively. Buoy24020 was significantly correlated with the wind inboth components at 28% and 56% for U and V,respectively.
In the vicinity of the mouth of the River Shannon(drifters 6373, 6372 and 24018) velocities wererelatively weak and directions variable, drifter6372 was correlated with the wind along withdrifter 24018. A northward flow associated withthe buoyancy plume from the River Shannon couldbe expected inshore, but as the drifters weredrogued at 30m they would not necessarily demon-
strate this flow. The CTD data indicated a shallowpycnocline with the buoys drogued at a greaterdepth. Outside of this region the overall pattern offlow was northward parallel to the coast.
During 2001 a further six drifters were deployedin the coastal region to the north of latitude 531N(Table 1; Fig. 1 ). With the exception of 24058,which grounded on the coast, the overall movementwas again parallel to the coast and toward the northat average speeds of between 7.5 and 13.1 cm s!1.Instruments 4384, 27231 and 21576 described asimilar pathway to 24017 during 1999, with 21576skirting Donegal Bay before grounding. To the westof Erris Head, 27231 moved at an average speed of21 cm s!1 for the 5 days of its deployment beforebecoming lodged in the near coastal region. Of thetwo northern most instruments, 7971 becametrapped in the vicinity of Malin Head whilst 26118stagnated at the northern most limit of its trajectorybefore moving south in response to a large wind-driven event. Drifters 4384 and 24058 were sig-nificantly wind driven but were both short records.
In summary, 5 buoys out of the 14 deployed weresignificantly wind driven in both U and V compo-nents, with the V component being more stronglycorrelated than the U. To assess the overallimportance of wind-driven flow, along the westcoast, the variance derived for each drifter wasweighted by the deployment duration. The averageover all the drifters using this weighting was 25% inthe V and 13% in the U. In comparison for thosedrifters that were significantly correlated with thewind, 40% of the variance in the V direction wasdue to wind forcing with the most common time lagbeing 6 h.
The stronger correlation in the V is reflective ofthe bathymetry of the west coast of Ireland that willtend to steer wind-driven currents along the coast.This analysis suggests that overall in the Irishcoastal region wind contributes between 13% and25% of the flow in this period of observations, withthe remainder due to a more persistent underlyingflow field.
3.2. Water column structure
Overall, the drifters provide evidence of a degreeof coherence in the movement of Irish coastalwaters from the Celtic Sea to the Malin Shelf at amean speed of approximately 7.3 cm s!1
(6.5 kmday!1). In order to explore how thestructure of the water column might contribute to
ARTICLE IN PRESSL. Fernand et al. / Continental Shelf Research 26 (2006) 1775–1793 1781
this forcing, 12 Scanfish sections were performedduring 2001, augmented by two sections of rela-tively coarse resolution CTD’s in the vicinity of theBlasket Islands and Loop Head (Fig. 1) followingoperational difficulties with the Scanfish. Here weconcentrate on seven of the sections to illustrate theprincipal features of the water column borderingthe western coast of Ireland.
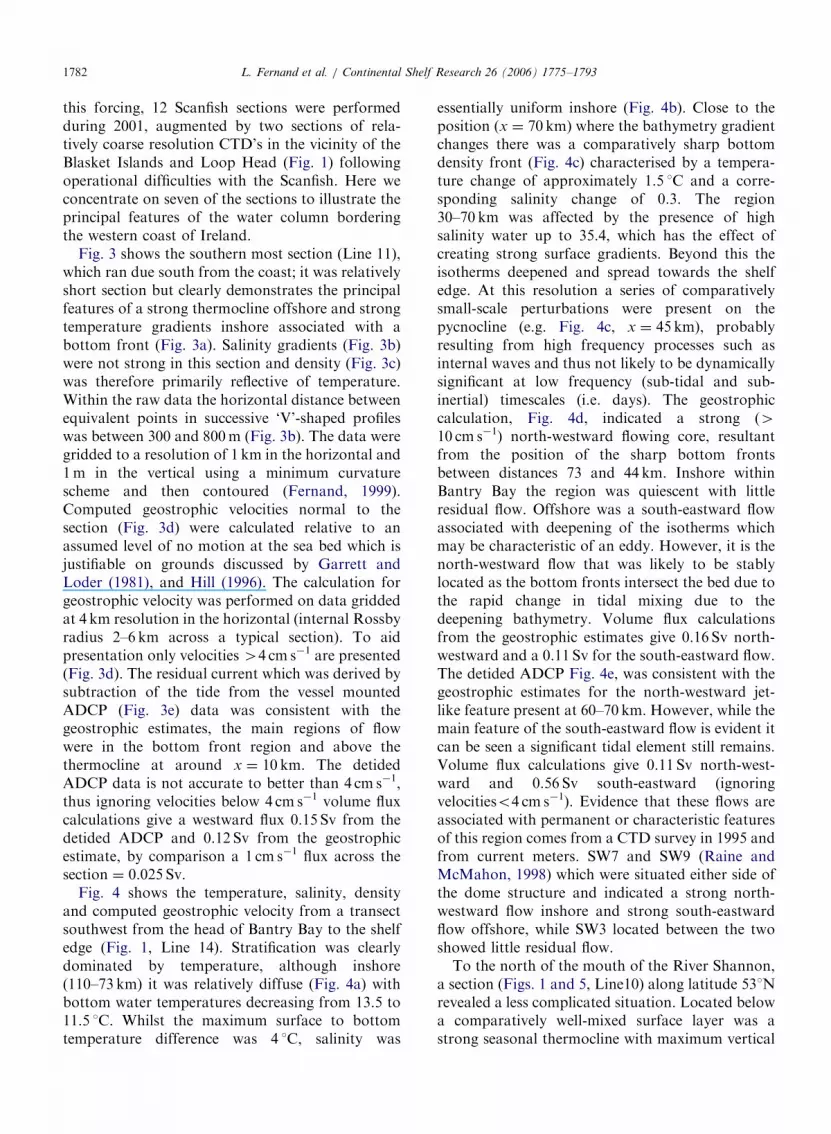
Fig. 3 shows the southern most section (Line 11),which ran due south from the coast; it was relativelyshort section but clearly demonstrates the principalfeatures of a strong thermocline offshore and strongtemperature gradients inshore associated with abottom front (Fig. 3a). Salinity gradients (Fig. 3b)were not strong in this section and density (Fig. 3c)was therefore primarily reflective of temperature.Within the raw data the horizontal distance betweenequivalent points in successive ‘V’-shaped profileswas between 300 and 800m (Fig. 3b). The data weregridded to a resolution of 1 km in the horizontal and1m in the vertical using a minimum curvaturescheme and then contoured (Fernand, 1999).Computed geostrophic velocities normal to thesection (Fig. 3d) were calculated relative to anassumed level of no motion at the sea bed which isjustifiable on grounds discussed by Garrett andLoder (1981), and Hill (1996). The calculation forgeostrophic velocity was performed on data griddedat 4 km resolution in the horizontal (internal Rossbyradius 2–6 km across a typical section). To aidpresentation only velocities 44 cm s!1 are presented(Fig. 3d). The residual current which was derived bysubtraction of the tide from the vessel mountedADCP (Fig. 3e) data was consistent with thegeostrophic estimates, the main regions of flowwere in the bottom front region and above thethermocline at around x & 10 km. The detidedADCP data is not accurate to better than 4 cm s!1,thus ignoring velocities below 4 cm s!1 volume fluxcalculations give a westward flux 0.15 Sv from thedetided ADCP and 0.12 Sv from the geostrophicestimate, by comparison a 1 cm s!1 flux across thesection & 0.025 Sv.
Fig. 4 shows the temperature, salinity, densityand computed geostrophic velocity from a transectsouthwest from the head of Bantry Bay to the shelfedge (Fig. 1, Line 14). Stratification was clearlydominated by temperature, although inshore(110–73 km) it was relatively diffuse (Fig. 4a) withbottom water temperatures decreasing from 13.5 to11.5 1C. Whilst the maximum surface to bottomtemperature difference was 4 1C, salinity was
essentially uniform inshore (Fig. 4b). Close to theposition (x & 70 km) where the bathymetry gradientchanges there was a comparatively sharp bottomdensity front (Fig. 4c) characterised by a tempera-ture change of approximately 1.5 1C and a corre-sponding salinity change of 0.3. The region30–70 km was affected by the presence of highsalinity water up to 35.4, which has the effect ofcreating strong surface gradients. Beyond this theisotherms deepened and spread towards the shelfedge. At this resolution a series of comparativelysmall-scale perturbations were present on thepycnocline (e.g. Fig. 4c, x & 45 km), probablyresulting from high frequency processes such asinternal waves and thus not likely to be dynamicallysignificant at low frequency (sub-tidal and sub-inertial) timescales (i.e. days). The geostrophiccalculation, Fig. 4d, indicated a strong (410 cm s!1) north-westward flowing core, resultantfrom the position of the sharp bottom frontsbetween distances 73 and 44 km. Inshore withinBantry Bay the region was quiescent with littleresidual flow. Offshore was a south-eastward flowassociated with deepening of the isotherms whichmay be characteristic of an eddy. However, it is thenorth-westward flow that was likely to be stablylocated as the bottom fronts intersect the bed due tothe rapid change in tidal mixing due to thedeepening bathymetry. Volume flux calculationsfrom the geostrophic estimates give 0.16 Sv north-westward and a 0.11 Sv for the south-eastward flow.The detided ADCP Fig. 4e, was consistent with thegeostrophic estimates for the north-westward jet-like feature present at 60–70 km. However, while themain feature of the south-eastward flow is evident itcan be seen a significant tidal element still remains.Volume flux calculations give 0.11 Sv north-west-ward and 0.56 Sv south-eastward (ignoringvelocitieso4 cm s!1). Evidence that these flows areassociated with permanent or characteristic featuresof this region comes from a CTD survey in 1995 andfrom current meters. SW7 and SW9 (Raine andMcMahon, 1998) which were situated either side ofthe dome structure and indicated a strong north-westward flow inshore and strong south-eastwardflow offshore, while SW3 located between the twoshowed little residual flow.
To the north of the mouth of the River Shannon,a section (Figs. 1 and 5, Line10) along latitude 531Nrevealed a less complicated situation. Located belowa comparatively well-mixed surface layer was astrong seasonal thermocline with maximum vertical
ARTICLE IN PRESSL. Fernand et al. / Continental Shelf Research 26 (2006) 1775–17931782
ARTICLE IN PRESS
0 5 10 15 20 25 30 35 40-120
-100
-80
-60
-40
-20
0
0 5 10 15 20 25 30 35 40-120
-100
-80
-60
-40
-20
0
0 5 10 15 20 25 30 35 40-120
-100
-80
-60
-40
-20
0
Temperature (°C)
Salinity
Density !t (kg m-3)
0 5 10 15 20 25 30 35 40Distance South - North (km)
-120
-100
-80
-60
-40
-20
0
Dep
th (m
)
0 5 10 15 20 25 30 35 40-120
-100
-80
-60
-40
-20
Geostrophic Velocity (cm s-1)
Detided VM ADCPU velocity (cm s-1)
(A)
(B)
(C)
(D)
(E)
10
10 1112
13
Fig. 3. Scanfish section (11 on 31 July; Fig. 1) the Crease Line (a) temperature (1C); (b) salinity; (c) density st (kgm!3); and (d) componentof geostrophic velocity (cm s!1) normal to the section and relative to a reference level at the deepest common depth between adjacent CTDprofiles. (e) Detided Vessel Mount ADCP data u velocity (cm s!1). Negative velocities indicate westward flow into the page. The horizontalscale represents distance in km from the Northern end of the section, whilst the profile of the seabed is derived from the ships echosounder. Included on (b) is the profile of the Scanfish (the location of every 60th data point) illustrating the along track horizontal andvertical spatial resolution of the survey.
L. Fernand et al. / Continental Shelf Research 26 (2006) 1775–1793 1783

gradients of #0.5 1C m!1. In the west this capped apool of cold bottom water (o 9.5 1C), which wasbounded in the east by a series of bottom fronts
coincident with the shallowing bathymetry. Abovethe thermocline surface salinity reflected the influ-ence of the River Shannon (Fig. 5b) with near
ARTICLE IN PRESS
0 5 10 15 20 25 30 35 40 45 50 55 60 65 70 75 80 85 90 95 100105110-120
-100
-80
-60
-40
-20
0
0 5 10 15 20 25 30 35 40 45 50 55 60 65 70 75 80 85 90 95 100105110-120
-100
-80
-60
-40
-20
0
0 5 10 15 20 25 30 35 40 45 50 55 60 65 70 75 80 85 90 95 100105110-120
-100
-80
-60
-40
-20
0
0 5 10 15 20 25 30 35 40 45 50 55 60 65 70 75 80 85 90 95 100105110-120
-100
-80
-60
-40
-20
Temperature (°C)
Geostrophic Velocity (cm s-1)
Density !t (kg m-3)
Salinity
BantryBay
NorthwestwardFlow
South EastwardFlow
0 10 20 30 40 50 60 70 80 90 100Distance South west - North east (km)
-120
-100
-80
-60
-40
-20
0
Dep
th (
m)
Detided VM ADCPU velocity (cm s-1)
(E)
(D)
(C)
(B)
(A)
Fig. 4. Scanfish section (14 on 1 August 2001; Fig. 1) south from Bantry Bay: (a) temperature (1C); (b) salinity; (c) density st (kgm!3); and(d) component of geostrophic velocity (cm s!1) normal to the section and relative to a reference level at the deepest common depth betweenadjacent CTD profiles. (e) Detided Vessel Mount ADCP data velocity (cm s!1). Positive velocities indicate north westward flow andnegative are south-eastward. The horizontal scale represents distance in km from the western end of the section, whilst the profile of theseabed is derived from the ships echo sounder.
L. Fernand et al. / Continental Shelf Research 26 (2006) 1775–17931784

coastal watero34.6 and a distinct offshore halinefront approximately 11 km from the western edge ofthe section. Nevertheless, temperature providedthe dominant control on the density distribution(Fig. 5c). Geostrophic estimates (Fig. 5d) indicateda broad northward flow associated with the flank ofthe dense central pool.
The Clare Island section (Figs. 1 and 6, Line 8)leading west from the Mayo coast, showed thatthermal stratification (Fig. 6a) was again theprincipal determinant for water column structure.Inshore, the thermocline was comparatively diffuse,with bottom fronts at between 30 and 35 km alongthe section. West of the distinct pinnacle
ARTICLE IN PRESS
0 5 10 15 20 25 30 35 40 45 50 55 60 65 70-120
-100
-80
-60
-40
-20
0
0 5 10 15 20 25 30 35 40 45 50 55 60 65 70-120
-100
-80
-60
-40
-20
0
0 5 10 15 20 25 30 35 40 45 50 55 60 65 70-120
-100
-80
-60
-40
-20
0
0 5 10 15 20 25 30 35 40 45 50 55 60 65 70Distance West-East (km)
-120
-100
-80
-60
-40
-20
Dep
th (m
)
Geostrophic Velocity (cm s-1)
Salinity
Temperature (°C)
Density (!t kg m-3)
(D)
(C)
(B)
(A)
Fig. 5. Scanfish section (10 on 29 July 2001; Fig. 1) across 531N (a) temperature (1C); (b) salinity; (c) density st (kgm!3); and (d)component of geostrophic velocity (cm s!1) normal to the section and relative to a reference level at the deepest common depth betweenadjacent CTD profiles. Positive velocities indicate northward flow and negative are southward. The horizontal scale represents distance inkm from the western end of the section, whilst the profile of the sea bed is derived from the ships echo sounder.
L. Fernand et al. / Continental Shelf Research 26 (2006) 1775–1793 1785
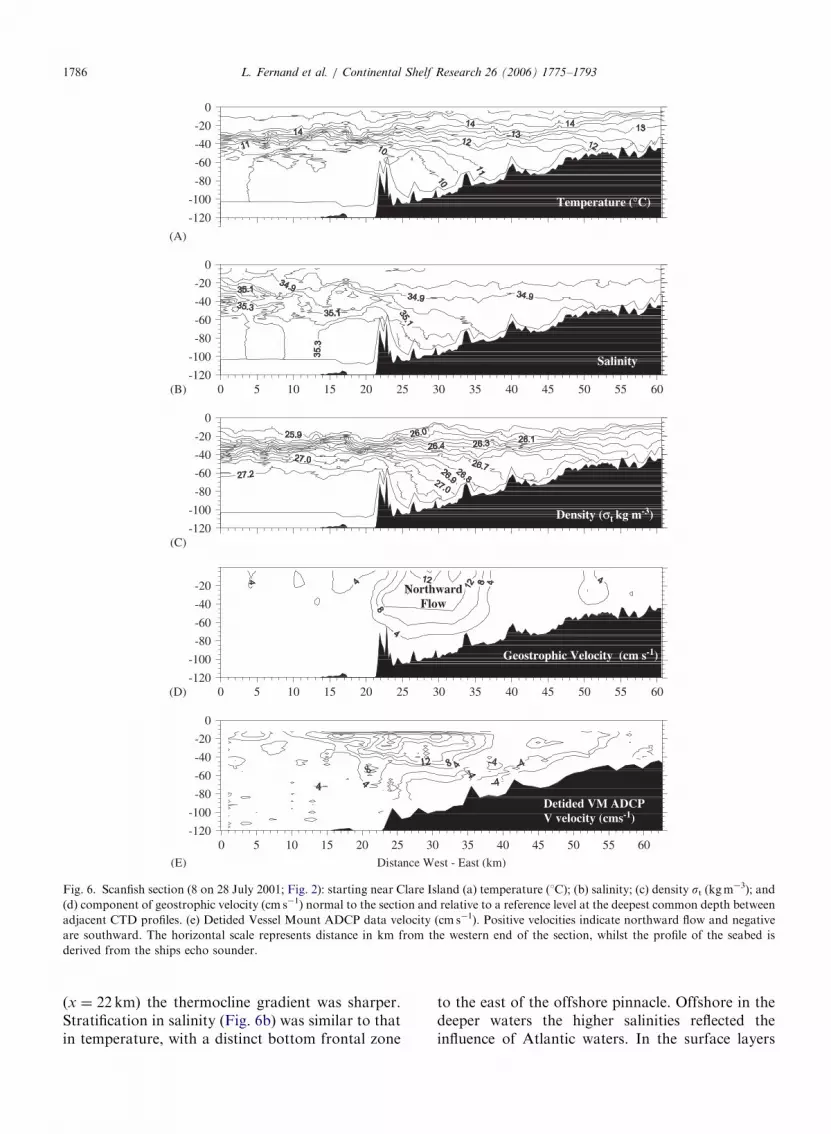
(x & 22 km) the thermocline gradient was sharper.Stratification in salinity (Fig. 6b) was similar to thatin temperature, with a distinct bottom frontal zone
to the east of the offshore pinnacle. Offshore in thedeeper waters the higher salinities reflected theinfluence of Atlantic waters. In the surface layers
ARTICLE IN PRESS
-120
-100
-80
-60
-40
-20
0
-120
-100
-80
-60
-40
-20
0
0 5 10 15 20 25 30 35 40 45 50 55 60-120
-100
-80
-60
-40
-20
0
0 5 10 15 20 25 30 35 40 45 50 55 60-120
-100
-80
-60
-40
-20
(A)
Temperature (°C)
D) Geostrophic Velocity (cm s-1)
Salinity
Density (!t kg m-3)
NorthwardFlow
Geostrophic Velocity (cm s-1)
0 5 10 15 20 25 30 35 40 45 50 55 60Distance West - East (km)
-120
-100
-80
-60
-40
-20
0
(E)
Detided VM ADCPV velocity (cms-1)
(D)
(C)
(B)
Fig. 6. Scanfish section (8 on 28 July 2001; Fig. 2): starting near Clare Island (a) temperature (1C); (b) salinity; (c) density st (kgm!3); and(d) component of geostrophic velocity (cm s!1) normal to the section and relative to a reference level at the deepest common depth betweenadjacent CTD profiles. (e) Detided Vessel Mount ADCP data velocity (cm s!1). Positive velocities indicate northward flow and negativeare southward. The horizontal scale represents distance in km from the western end of the section, whilst the profile of the seabed isderived from the ships echo sounder.
L. Fernand et al. / Continental Shelf Research 26 (2006) 1775–17931786

(upper 50m) density (Fig. 6c) reflected the tempera-ture, but salinity played a role in strengtheningthe bottom frontal region, associated with whichwas a distinct and northward flow in excessof 14 cm s!1 (Fig. 6d). This core flow was alsoevident in the detided ADCP data (Fig. 6e)suggesting maximum speeds of 16 cm s!1, ignoringflows below 4 cm s!1 the northward volume flux is0.24 Sv while the estimated the geostrophic estimateis 0.15 Sv.
Further around the coast in Donegal Bay, asouth-eastward section (Figs. 1 and 7: Line 5)revealed a relatively diffuse thermocline (Fig. 7a)with a distinct bottom frontal region at x & 55 km.Further offshore there was a pool of colder near bedwater between x & 9 and 40 km, bounded bycomparatively weak fronts. Also of note, was adistinct uplift of the thermocline centred atx & 46 km. The salinity distribution (Fig. 7b)indicates the influence of Atlantic water at thenorthern end of the transect. Between x & 0 and10 km near-bed salinity is greatest and coincideswith an increase in water temperature with respectto the pool of cooler water. The rather confusinggeostrophic velocity field (Fig. 7d) reflects thevariability in the pycnocline (Fig. 7c). The north-eastward flow associated with the bottom frontcentred at x & 55 km provides a distinct core of flowin excess of 10 cm s!1. However, the apparent south-westward flow centred at x & 42.5 km is associatedwith the uplifted pycnocline and may be a short-term feature. Similarly, with the eastward flow atx & 10–25 km a large proportion relates to pertur-bations in the thermocline not associated with abottom frontal feature that might be expected to beformed by the balance between tidal stirring andsurface heating.
The importance of bathymetry in defining thestrength of bottom fronts was demonstrated in thesection from Bloody Foreland (Fig. 1 and 8: Line 3),where the bathymetry changed from 50–100mdepth across x & 15–25 km, thus constraining thebottom front region and producing estimates of jet-like flows of up to 16 cm s!1 (Fig. 8d).
The most northerly of our sections (Figs. 1 and 9:Line 4) was positioned to the west of what is termedthe Islay Front (Hill and Simpson, 1989). Againthermal stratification was pronounced (Fig. 9a)with, in this instance, a weak surface front(x & 50–55 km) and a region of well-mixed wateroffshore of the salinity stratification due to thesignificant fresh water input from Loch Swilly.
Bottom fronts exist as in the previous section, but asthe bathymetry gradient was not as strong the frontsand associated flows were more diffuse. At thenorthern end of the section was a distinct pool ofcooler water and more saline water and where thetopography shelves into the Minch the thermoclinebecame more diffuse.
4. Discussion
The observations reported here constitute the firstcomprehensive spatial coverage of hydrographicproperties in the coastal waters of western Irelandusing high-resolution instrumentation. These datasuggest the presence of a well-defined and persistentbaroclinic coastal current along the western coast ofIreland. However, it could be argued that baro-tropic processes play some role in the transport.Residual transports due to island and headlines canbe significant, however they are only localisedeffects (e.g. Pingree and Maddock, 1979) and couldnot be responsible for large scale coherent trans-port. Tidal rectification associated with the slopingbathymetry might be expected to play some role,however, such flows are expected to be at least anorder of magnitude smaller than the amplitude ofthe prevailing tidal currents, which are quite weakmax M2o40 cm s!1.
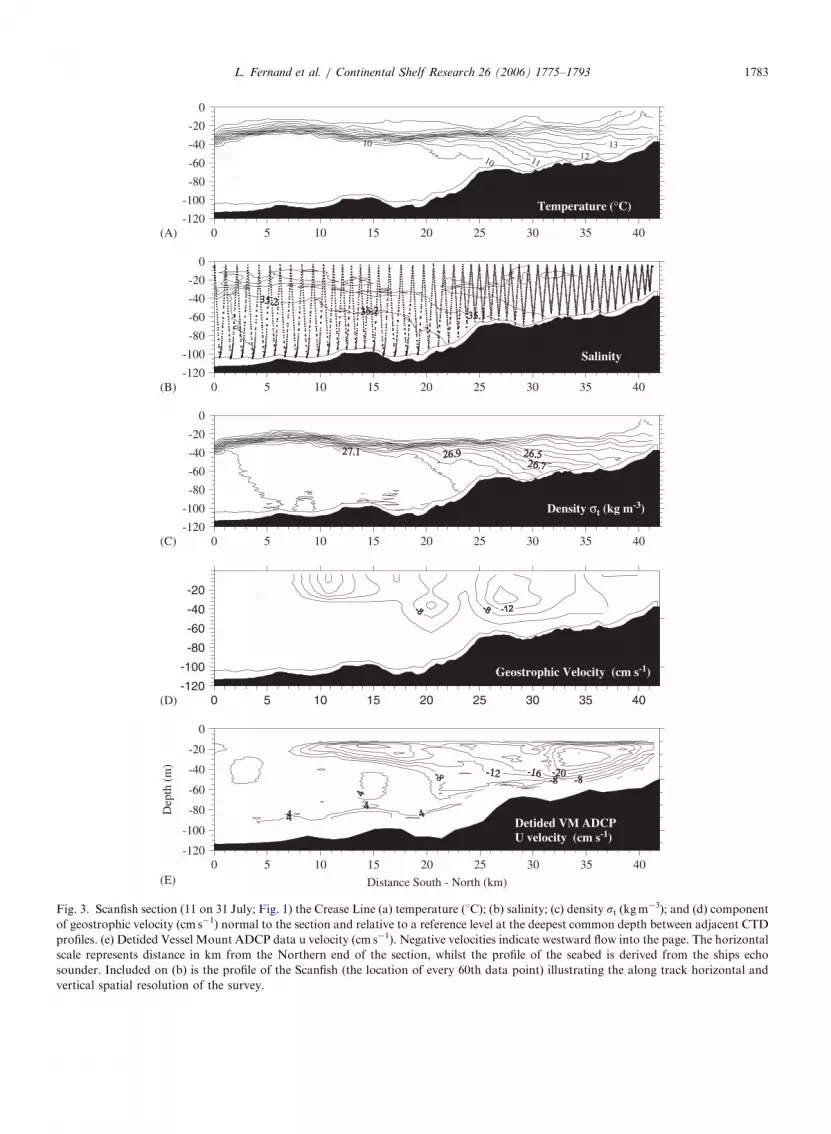
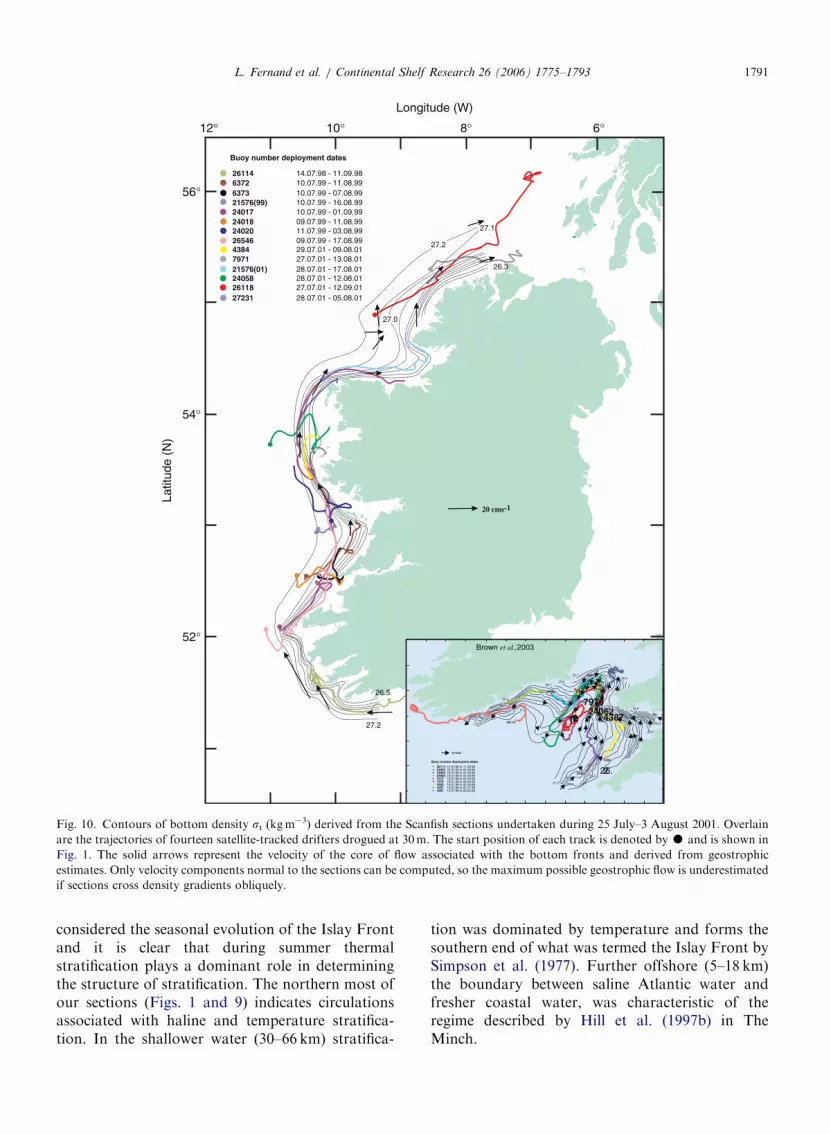
Evident from Fig. 10 is the linkage between themaximum bottom density gradients, the geostrophicestimates and the trajectories of the drifters. Volumeflux estimates indicate that the flow is typicallyaround 0.12–0.24 Sv, with the geostrophic estimatesgenerally lower than the detided ADCP, however,both indicate similar features. Similarly the driftersindicate that the wind induced flow plays somerole—but it is small—, therefore some of thediscrepancy between the total observed flow andgeostrophic estimate could be due to wind inducedflow which is then rectified by the bathymetry.
These observations highlight the significance ofthe baroclinic component of the circulation asso-ciated with the bottom fronts that fringe the densebottom water isolated by the onset of summerstratification. Key to understanding the circulationis the recognition that it is the bottom density frontsthat are dynamically significant. This is importantbecause in many tidal mixing systems surface andbottom fronts do not coincide and indeed there maybe a bottom front without an attendant surfacefront. In this respect, infra-red satellite imagery isnot a reliable means of identifying associated flows.
ARTICLE IN PRESSL. Fernand et al. / Continental Shelf Research 26 (2006) 1775–1793 1787

Moreover, bottom fronts appear more stable thansurface fronts and are persistent, remaining geo-graphically fixed because of the stabilising influenceof associated bottom slopes and tidally generatedbottom friction (James, 1989).
The fronts and associated jet-like flows extendcontinuously along the western seaboard of Ireland.
Due to the weak tidal currents wind-mixing candominate over tidal-mixing producing a relativelydeep thermocline compared to other parts of theshelf around the UK. Bo Pedersen (1994) suggestthat this aids the formation of bottom fronts in theshallower waters so that bottom fronts gradientsdominate over the surface fronts.
ARTICLE IN PRESS
0 5 10 15 20 25 30 35 40 45 50 55 60-120
-100
-80
-60
-40
-20
0
0 5 10 15 20 25 30 35 40 45 50 55 60-120
-100
-80
-60
-40
-20
0
0 5 10 15 20 25 30 35 40 45 50 55 60-120
-100
-80
-60
-40
-20
0
0 5 10 15 20 25 30 35 40 45 50 55 60Distance North west - South east (km)
-120
-100
-80
-60
-40
-20
Dep
th (m
)
Temperature (°C)
Salinity
Density !t (kg m-3)
Geostrophic Velocity (cm s-1)
(A)
(B)
(C)
(D)
Fig. 7. Scanfish section (5 on 27 July 2001; Fig. 2): across Donegal Bay (a) temperature (1C); (b) salinity; (c) density st (kgm!3); and (d)component of geostrophic velocity (cm s!1) normal to the section and relative to a reference level at the deepest common depth betweenadjacent CTD profiles. Positive velocities indicate eastward flow and negative are westward. The horizontal scale represents distance in kmfrom the western end of the section, whilst the profile of the seabed is derived from the ships echo sounder.
L. Fernand et al. / Continental Shelf Research 26 (2006) 1775–17931788

The domination of this baroclinic flow over wind-driven flow is demonstrated in Table 1, withbetween 13% and 25% of the flow due to the wind.The drifters were deployed from mid summer toearly autumn, however none of the drifters surviveduntil the breakdown of stratification, late Autumn(end of September). During the breakdown period,
it is expected that the density-driven circulation willcease and the flow would revert to a primarily wind-driven situation.
Whilst the ‘Irish Coastal Current’ had previouslygone unnoticed, its existence fits with recentdescriptions of circulation in the Celtic Sea and tothe west of Scotland. A detailed survey of the Celtic
ARTICLE IN PRESS
0 5 10 15 20 25 30 35-110
-90
-70
-50
-30
-10
0 5 10 15 20 25 30 35-110
-90
-70
-50
-30
-10
0 5 10 15 20 25 30 35-110
-90
-70
-50
-30
-10
0 5 10 15 20 25 30 35Distance North west - South east (km)
-120
-100
-80
-60
-40
-20
Dep
th (m
)
Temperature (°C)
Salinity
Density !t (kg m-3)
Geostrophic Velocity (cm s-1)
(D)
(C)
(B)
(A)
Fig. 8. Scanfish section (3 on 26 July 2001; Fig. 2) from Bloody Foreland: (a) temperature (1C); (b) salinity; (c) density st (kgm!3); and (d)component of geostrophic velocity (cm s!1) normal to the section and relative to a reference level at the deepest common depth betweenadjacent CTD profiles. Positive velocities indicate eastward flow and negative are westward. The horizontal scale represents distance in kmfrom the western end of the section, whilst the profile of the seabed is derived from the ships echo sounder, no seabed data is recorded forthe last 9 km of the section.
L. Fernand et al. / Continental Shelf Research 26 (2006) 1775–1793 1789

Sea during the summer of 1998 (Carrillo, 2001;Brown et al., 2003) and subsequent 3-D baroclinicmodelling (Young et al., 2004) describe a cyclonicjet-like baroclinic circulation fringing the coastalmargins of the Celtic Sea extending continuouslyfor #700 km. To the north of Ireland, observationsin April/May 1995 (Hill et al., 1997b) describe a
cyclonic circulation about the deep channel ofThe Minch, consistent with a baroclinic flow ofbuoyant fresh coastal water around a tongueof dense, saline Atlantic water which intruded fromthe south. The flow is characterised as part of theScottish coastal current (Hill, 1987; Simpson andHill, 1986). However, Hill and Simpson (1989)
ARTICLE IN PRESS
0 5 10 15 20 25 30 35 40 45 50 55 60 65-120
-100
-80
-60
-40
-20
0
0 5 10 15 20 25 30 35 40 45 50 55 60 65-120
-100
-80
-60
-40
-20
0
0 5 10 15 20 25 30 35 40 45 50 55 60 65-120
-100
-80
-60
-40
-20
0
0 5 10 15 20 25 30 35 40 45 50 55 60 65Distance North - South (km)
-120
-100
-80
-60
-40
-20
Dep
th (m
)
EastwardFlow
LoughSwilly
Temperature (°C)
Salinity
Density !t ( kg m-3)
Geostrophic Velocity (cm s-1)
Cold Pool
TheMinch
(D)
(C)
(B)
(A)
Fig. 9. Scanfish section (4 on 26 July 2001; Fig. 2) from Lough Swilly in the region of Malin Head: (a) temperature (1C); (b) salinity; (c)density st (kgm!3); and (d) component of geostrophic velocity (cm s!1) normal to the section and relative to a reference level at the deepestcommon depth between adjacent CTD profiles. Positive velocities indicate eastward flow and negative are westward. The horizontal scalerepresents distance in km from the western end of the section, whilst the profile of the seabed is derived from the ships echo sounder.
L. Fernand et al. / Continental Shelf Research 26 (2006) 1775–17931790
considered the seasonal evolution of the Islay Frontand it is clear that during summer thermalstratification plays a dominant role in determiningthe structure of stratification. The northern most ofour sections (Figs. 1 and 9) indicates circulationsassociated with haline and temperature stratifica-tion. In the shallower water (30–66 km) stratifica-
tion was dominated by temperature and forms thesouthern end of what was termed the Islay Front bySimpson et al. (1977). Further offshore (5–18 km)the boundary between saline Atlantic water andfresher coastal water, was characteristic of theregime described by Hill et al. (1997b) in TheMinch.
ARTICLE IN PRESS
27.1
27.0
27.2
27.2
20 cms-1
26.5
Buoy number deployment dates
26114 14.07.98 - 11.09.986372 10.07.99 - 11.08.996373 10.07.99 - 07.08.9921576(99) 10.07.99 - 16.08.9924017 10.07.99 - 01.09.9924018 09.07.99 - 11.08.9924020 11.07.99 - 03.08.9926546 09.07.99 - 17.08.994384 29.07.01 - 09.08.017971 27.07.01 - 13.08.0121576(01) 28.07.01 - 17.08.0124058 28.07.01 - 12.08.0126118 27.07.01 - 12.09.0127231 28.07.01 - 05.08.01
10°12°
52°
56°
54°
6°8°Longitude (W)
Latit
ude
(N)
26.3
797024062
43877927
26.2
Brown et al.,2003
Fig. 10. Contours of bottom density st (kgm!3) derived from the Scanfish sections undertaken during 25 July–3 August 2001. Overlainare the trajectories of fourteen satellite-tracked drifters drogued at 30m. The start position of each track is denoted by K and is shown inFig. 1. The solid arrows represent the velocity of the core of flow associated with the bottom fronts and derived from geostrophicestimates. Only velocity components normal to the sections can be computed, so the maximum possible geostrophic flow is underestimatedif sections cross density gradients obliquely.
L. Fernand et al. / Continental Shelf Research 26 (2006) 1775–1793 1791

In the context of the northwest Europeancontinental shelf these observations conform tothose reported in a recent series of papers Hill et al.,1994, 1996, 1997a, Horsburgh et al., 2000) whichdescribed a gyre in the western Irish Sea. Subse-quently, similar features were found in Minch (Hillet al., 1997b; Pizzamei 2002), the Celtic Sea (Brownet al., 2003), and North Sea, (Brown et al., 1999,2001) the principle characteristic is that of fast(40.2m s!1), narrow (10–20 km wide) baroclinicjets associated with cold (or salty), dense pools ofbottom water which remain trapped in deep basinson the continental shelf during the summer months.These ‘cold pool jets’ flow in a cyclonic sense (coldpool waters to the left in the northern hemisphere)with peak current speeds at or above thermoclinelevel consistent with the dynamics described byGarrett and Loder (1981) relevant to bottom-dominant fronts.
In this paper we have demonstrated the evidenceof coupling from the Celtic Sea, along the west coastof Ireland and then North to The Minch. Thispathway is potentially a rapid transport mechanismfor contaminants and exotic species of plankton.For instance, Alexandrium Tamaranse was detectedoff the Mayo coast in 2001, further north thanpreviously seen, and blooms of Karenia Mikimotoioccurred all along the west coast in July 2005.
Acknowledgements
CEFAS staff were funded by the DEFRA(Department for Environment, Food and RuralAffairs) under Contracts AE1021, AE1214 andAE1225. Glen Nolan was funded by the MarineEnvironment and Food Safety Services group of theIrish Marine Institute.
The expertise and good-humoured support of theofficers and crew of the R.V. Celtic Voyager helpedmake the work possible with funding provided bythe Irish Marine Institute. Wind speeds were derivedfrom the UK Meteorological Office mesoscalemodel. Thank you to Irene Gooch who helped inpreparation of the figures. This work has beenimproved by the contributions of two anonymousreferees.
References
Anon, 1999. Ireland’s Marine and Coastal Areas and AdjacentSeas: An Environmental Assessment. Published by TheMarine Institute, pp. 338.
Bo Pedersen, F., 1994. The oceanographic and biological tidalcycle succession in shallow sea fronts in the North Sea and theEnglish Channel. Estuarine, Coastal and Shelf Science 38,249–269.
Brown, J., Gmitrowicz, E.M., 1995. Observations of thetransverse structure and dynamics of the low frequency flowthrough the North Channel of the Irish Sea. Continental ShelfResearch 15, 1133–1156.
Brown, J., Brander, K., Fernand, L., Hill, A.E., 1996. Scanfish:high performance towed undulator. Sea Technology 37 (9),23–27.
Brown, J., Fernand, L., Horsburgh, K.J., Hill, A.E., Read, J.W.,2001. PSP on the east coast of the UK in relation to seasonaldensity-driven circulation. Journal of Plankton Research 23,105–116.
Brown, J., Carillo, L., Fernand, L., Horsburgh, K.J., Hill, A.E.,Young, E.F., 2003. Observations of the physical structure andseasonal jet-like circulation of the Celtic Sea and St. George’sChannel of the Irish Sea. Continental Shelf Research 23,533–561.
Brown, J., Hill, A.E., Fernand, L., Horsburgh, K.J., 1999.Observations of a seasonal jet-like circulation at the centralNorth Sea cold pool margin. Estuarine, Coastal and ShelfScience 44, 343–355.
Carrillo, 2001. Observations of cold pool jets in the continentalshelf of the Celtic Sea. Ph.D. Thesis, University of Wales,Bangor, 249pp.
Cullen, M.J.P., 1993. The unified climate forecast model.Meteorological Magazine 122, 81–94.
Fernand, L., 1999. High-resolution observations of the velocityfield and thermohaline structure of the western Irish Sea gyre.Ph.D.Thesis, University of Wales, Bangor, 93pp.
Fernhead, P.G., 1975. On the formation of fronts by tidal mixingaround the British Isles. Deep-Sea Research 22, 311–321.
Garrett, C.J.R., Loder, J.W., 1981. Dynamical aspects of shallowsea fronts. Philosophical Transactions of the Royal Society ofLondon A 302, 653–681.
Hill, A.E., 1987. The dynamics and variability of the ScottishCoastal Current. Ph.D. Thesis, University of Wales, Bangor.
Hill, A.E., Simpson, J.H., 1989. On the interaction of thermaland haline fronts: the Islay front revisited. Estuarine, Coastaland Shelf Science 28, 495–505.
Hill, A.E., 1996. Spin-down and the dynamics of dense pool gyresin shallow seas. Journal of Marine Research 54, 471–486.
Hill, A.E., Durazo, R., Smeed, D.A., 1994. Observations of acyclonic gyre in the western Irish Sea. Continental ShelfResearch 14, 479–490.
Hill, A.E., Brown, J., Fernand, L., 1996. The western Irish Seagyre: a retention system for Norway lobster (Nephrops
norvegicus)? Oceanologica Acta 19, 357–368.Hill, A.E., Brown, J., Fernand, L., 1997a. The summer gyre in the
western Irish Sea: shelf sea paradigms and managementimplications. Estuarine Shelf and Coastal Sciences 44 (Suppl.A), 83–95.
Hill, A.E., Horsburgh, K.J., Garvine, R.W., Gillibrand, P.A.,Slesser, G., Turrell, W.R., Adams, R.D., 1997b. Observationsof a density-driven recirculation of the Scottish coastalcurrent in The Minch. Estuarine, Coastal and Shelf Science45, 473–484.
Holt, J.T., James, ID., Jones, J.E., 2001. An s coordinate densityevolving model of the northwest European continental shelf 2,
ARTICLE IN PRESSL. Fernand et al. / Continental Shelf Research 26 (2006) 1775–17931792

seasonal currents and tides. Journal of Geophysical Research106, 14,035–14,053.
Horsburgh, K.J., 1999. Observations and modelling of theWestern Irish Sea gyre. Ph.D Thesis, University of Wales,Bangor, 174pp.
Horsburgh, K.J., Hill, A.E., Brown, J., Fernand, L., Garvine,R.W., Angelico, M.M.P., 2000. Seasonal Evolution of thecold pool gyre in the western Irish Sea. Progress inOceanography 46, 1–58.
Howarth, M.J., Proctor, R., 1992. Ship ADCP measurementsand tidal models of the North Sea. Continental ShelfResearch 12, 601–623.
Huang, W.G., Cracknell, A.P., Vaughan, R.A., Davies, P.A.,1991. A satellite and field view of the Irish shelf fronts.Continental Shelf Research 11, 543–562.
James, I.D., 1989. A three-dimensional model of circulation in afrontal region in the North Sea. Deutsche HydrographischeZeitschrift 42, 231–247.
McMahon, T., Raine, R., Titov, O., Boychuk, S., 1995. Someoceanographic features of northeastern Atlantic waterswest of Ireland. ICES Journal of Marine Science 52,221–232.
Nolan, G., 2004. Observations of the seasonality in hydrographyand current structure on the western Irish Shelf. Ph.D. Thesis,University of Galway, Ireland, 198pp.
Niiler, P.P., Sybrandy, A.S., Bi, K., Poulain, P.M., Bitterman,D., 1995. Measurements of the water following capacity ofholey-sock and tristar drifters. Deep Sea Research 42,1951–1964.
Pingree, R.D., Griffiths, D.K., 1980. Currents driven by a steadyuniform windstress on the shelf seas around the British Isles.Oceanologica Acta 3, 227–236.
Pingree, R.D., Le Cann, B., 1989. Celtic and Armorican slopeand shelf residual currents. Progress in Oceanography 23,303–338.
Pingree, R.D., Maddock, L., 1979. Tidal physics of headlandflows and offshore tidal bank formation. Marine Geology 32,269–289.
Pingree, R.D., Sinha, B., Griffiths, C.R., 1999. Seasonality of theEuropean slope current (Goban Spur) and ocean marginexchange. Continental Shelf Research 19, 929–975.
Pizzamei, M., 2002. Seasonal modelling of circulation andtransport on the Scottishwest. coast. Unpublished Ph.D.Thesis, University of Wales, Bangor, 267pp.
Raine, R., McMahon, T., 1998. Physical dynamics on thecontinental shelf off soutwestern Ireland and their influenceon coastal phytoplankton blooms. Continental Shelf Re-search 18, 883–914.
Raine, R., Joyce, B., Richard, J., Pazos, Y., Moloney, M., Jone, K.,Patching, J.W., 1993. The development of an exceptional bloomof the dinoflagellate Gyrodinium aureolum on the southwestIrish coast. ICES Journal of Marine Science 50, 461–469.
Sciremammano, F., 1979. A suggestion for the presentation ofcorrelations and their significance levels. Journal of PhysicalOceanography 9, 1273–1276.
Simpson, J.H., Hunter, J.R., 1974. Fronts in the Irish Sea. Nature(London) 250, 404–406.
Simpson, J.H., Hill, A.E., 1986. The Scottish Coastal Current. In:Skreslet, S. (Ed.), The Role of Freshwater Outflow in CoastalMarine Ecosystems (NATO ASI Series), vol. G7. Springer,Berlin, Heidelberg, pp. 295–308.
Simpson, J.H., Edleston, D.J., Edwards, A., Morris, N.G.C.,Tett, P.B., 1977. The Islay front: physical structure andphytoplankton distribution. Estuarine, Coastal and MarineScience 9, 713–726.
Soulsby, R.L., 1983. The bottom boundary layer of shelf seas. In:John, B. (Ed.), Physical Oceanography of Coastal and ShelfSeas. Elsevier, Amsterdam, pp. 205–241.
UNESCO, 1978. Eighth Report of the Joint Panel on Oceano-graphic Tables and Standards. UNESCO Technical Papers inMarine Science, No. 28 (35pp).
White, M., Bowyer, P., 1997. The shelf edge current northwest ofIreland. Annales Geophysicae 15, 1076–1083.
Young, E.F., Aldridge, J.N., Brown, J., 2000. Development andvalidation of a three-dimensional curvilinear model for thestudy of fluxes through the North Channel of the Irish Sea.Continental Shelf Research 20, 997–1035.
Young, E.F., Brown, J., Aldridge, J.N., Horsburgh, K.J.,Fernand, L., 2004. Development and application of a three-dimensional baroclinic: model to the study of the seasonalcirculation in the Celtic Sea. Continental Shelf Research 24,13–36.
ARTICLE IN PRESSL. Fernand et al. / Continental Shelf Research 26 (2006) 1775–1793 1793
Related Documents