ACPD 10, 3893–3936, 2010 The invigoration of deep convective clouds over the Atlantic I. Koren et al. Title Page Abstract Introduction Conclusions References Tables Figures Back Close Full Screen / Esc Printer-friendly Version Interactive Discussion Atmos. Chem. Phys. Discuss., 10, 3893–3936, 2010 www.atmos-chem-phys-discuss.net/10/3893/2010/ © Author(s) 2010. This work is distributed under the Creative Commons Attribution 3.0 License. Atmospheric Chemistry and Physics Discussions This discussion paper is/has been under review for the journal Atmospheric Chemistry and Physics (ACP). Please refer to the corresponding final paper in ACP if available. The invigoration of deep convective clouds over the Atlantic: aerosol effect, meteorology or retrieval artifact? I. Koren 1 , G. Feingold 2 , and L. A. Remer 3 1 Department of Environmental Science and Energy Research, Weizmann Institute of Science, Rehovot 76100, Israel 2 NOAA Earth System Research Laboratory, Boulder, CO, USA 3 Laboratory for Atmospheres, NASA Goddard Space Flight Center, Greenbelt, MD, USA Received: 11 January 2010 – Accepted: 25 January 2010 – Published: 10 February 2010 Correspondence to: I. Koren ([email protected]) Published by Copernicus Publications on behalf of the European Geosciences Union. 3893

Welcome message from author
This document is posted to help you gain knowledge. Please leave a comment to let me know what you think about it! Share it to your friends and learn new things together.
Transcript

ACPD10, 3893–3936, 2010
The invigoration ofdeep convectiveclouds over the
Atlantic
I. Koren et al.
Title Page
Abstract Introduction
Conclusions References
Tables Figures
J I
J I
Back Close
Full Screen / Esc
Printer-friendly Version
Interactive Discussion
Atmos. Chem. Phys. Discuss., 10, 3893–3936, 2010www.atmos-chem-phys-discuss.net/10/3893/2010/© Author(s) 2010. This work is distributed underthe Creative Commons Attribution 3.0 License.
AtmosphericChemistry
and PhysicsDiscussions
This discussion paper is/has been under review for the journal Atmospheric Chemistryand Physics (ACP). Please refer to the corresponding final paper in ACP if available.
The invigoration of deep convectiveclouds over the Atlantic: aerosol effect,meteorology or retrieval artifact?
I. Koren1, G. Feingold2, and L. A. Remer3
1Department of Environmental Science and Energy Research, Weizmann Institute of Science,Rehovot 76100, Israel2NOAA Earth System Research Laboratory, Boulder, CO, USA3Laboratory for Atmospheres, NASA Goddard Space Flight Center, Greenbelt, MD, USA
Received: 11 January 2010 – Accepted: 25 January 2010 – Published: 10 February 2010
Correspondence to: I. Koren ([email protected])
Published by Copernicus Publications on behalf of the European Geosciences Union.
3893
ACPD10, 3893–3936, 2010
The invigoration ofdeep convectiveclouds over the
Atlantic
I. Koren et al.
Title Page
Abstract Introduction
Conclusions References
Tables Figures
J I
J I
Back Close
Full Screen / Esc
Printer-friendly Version
Interactive Discussion
Abstract
The effects of the aerosol on convective clouds in the tropical Atlantic Ocean are ex-plored using satellite remote sensing, a chemical transport model, and a reanalysisof meteorological fields. Two of the most challenging problems are addressed: thepotential for elements of the cloud field to be erroneously ascribed to aerosol opti-5
cal depth; and the potential for correlations between aerosol and cloud parameters tobe erroneously considered to be causal. Results show that there is a robust positivecorrelation between cloud fraction or cloud top height and the aerosol optical depth,regardless of whether a stringent filtering of aerosol measurements in the vicinity ofclouds is applied, or not. These same positive correlations emerge when replacing the10
observed aerosol field with that derived from a chemical transport model. A correlationexercise between the full suite of meteorological fields derived from model reanaly-sis and satellite-derived cloud fields shows that observed cloud top height and cloudfraction correlate best with pressure updraft velocity and relative humidity. Observedaerosol optical depth does correlate with meteorological parameters but usually differ-15
ent parameters from those that correlate with observed cloud fields. The result is anear-orthogonal influence of aerosol and meteorological fields on cloud top height andcloud fraction. The results strengthen the case that the aerosol does play a role ininvigorating convective clouds.
1 Introduction20
Aerosol effects on clouds are recognized as contributing substantially to anthropogeniceffects on climate and the water cycle. Understanding the different cloud feedbacks ini-tiated by changes in aerosol properties poses one of the greatest challenges in climate,cloud and precipitation physics and radiative transfer (Ramanathan et al., 2001; Kauf-man, 2002). The strong sensitivity of the climate system to clouds, and the steadily25
3894
ACPD10, 3893–3936, 2010
The invigoration ofdeep convectiveclouds over the
Atlantic
I. Koren et al.
Title Page
Abstract Introduction
Conclusions References
Tables Figures
J I
J I
Back Close
Full Screen / Esc
Printer-friendly Version
Interactive Discussion
increasing pressure on water resources, makes this a problem of major importance(IPCC, 2007).
But why are aerosol-cloud interactions so difficult to quantify? Some of the importantaspects of this problem are enumerated below:
Complexity: The inherent complexity of clouds is such that the system is not5
amenable to analytical solution, nor to observation or model simulation at the full rangeof temporal and spatial scales. The sensitivity to initial and boundary conditions in theform of thermodynamic, radiative, and aerosol properties is inherently non-linear, sothat small changes in the initial conditions can propagate to large ones in the size,shape, microphysical properties and evolution of the cloud. It is not always clear which10
of the non-linear feedbacks will be ignited by changes in the initial or boundary condi-tions of the system. The aerosol can modify cloud radiative properties (Twomey, 1977)but also the ability of the cloud to precipitate (Albrecht, 1989; Rosenfeld et al., 1999;Andreae et al., 2004) and the pathways via which precipitation develops (e.g., Khain etal., 2001; Lee et al., 2008). Modification to precipitation influences the dynamics of the15
environment by changing the vertical distribution of latent heat. It has been suggestedthat clouds growing in polluted environments are characterized by more vigorous con-vection owing to a combination of suppression of early rainout of the cloud and itsattendant stabilization, together with suppression of freezing, and the eventual releaseof latent heat at higher altitudes (Koren et al., 2005; Khain et al., 2005). Aerosol per-20
turbations to deep convective systems may influence secondary convection (Seifert etal., 2006; van den Heever and Cotton, 2007; Lee et al., 2008) and other dynamicalresponses that magnify the initial microphysical perturbation. Conversely, the feed-backs sometimes exhibit multiple microphysical, dynamical and radiative effects thatcounter one another (Kaufman and Koren, 2006; Jiang and Feingold 2006; Koren et25
al., 2008a) and yield a relatively small overall effect. It has been suggested recentlythat aerosol-cloud interactions occur within a buffered system so that the response ofthe system to the aerosol is much smaller than might have been expected had internalinteractions not been accounted for (Stevens and Feingold, 2009). The challenge is to
3895

ACPD10, 3893–3936, 2010
The invigoration ofdeep convectiveclouds over the
Atlantic
I. Koren et al.
Title Page
Abstract Introduction
Conclusions References
Tables Figures
J I
J I
Back Close
Full Screen / Esc
Printer-friendly Version
Interactive Discussion
identify geographical regions or distinct regimes where the aerosol effect is likely to belargest.
Measurement Uncertainties: Clouds are extremely inhomogeneous and form com-plex, three-dimensional (3-D) structures, making them difficult to characterize from insitu measurements and causing remote sensing retrievals to be a true challenge (Plat-5
nick et al., 2003). The aerosol may be more homogeneous than clouds, but its mea-sureable signal is weak relative to the background and instrument noise (Tanre et al.,1996, 1997; Kahn et al., 2005). The challenge grows even larger when measuringaerosol properties in the vicinity of clouds. When attempting to study cloud-aerosolinteractions from observations, we often ask for the impossible: on the one hand we10
strive to measure the aerosol as close as possible to clouds in order to reflect the rel-evant aerosol properties that interact with the cloud. On the other hand, we ask forvery accurate measurements of aerosol loading and properties, which is very difficultto achieve in the vicinity of clouds, especially by satellite remote sensing.
The inter-cloud region, sometimes referred to as the “cloud twilight zone”, is usually15
considered cloud-free, but has been shown to comprise sheared cloud fragments, tinygrowing or decaying clouds, and hydrated aerosol. Thus the aerosol measured in thisregion is significantly different from the aerosol far-removed from cloud fields (Korenet al., 2007; Charlson et al., 2007). This difference introduces a series of complex-ities in interpreting remotely sensed aerosol properties near clouds. The likelihood20
of the remotely sensed aerosol properties being contaminated by a contribution fromundetectable clouds (the abovementioned small clouds or clouds with weak opticalsignature) increases as a function of the distance from detectable clouds (Koren et al.,2008b, 2009). Moreover, aerosol particles may change their (true and apparent) opticalproperties near clouds as the humidity increases (Charlson et al., 2007; Twohy et al.,25
2009) and due to enhancement in the mean photon flux as a result of the clouds servingas secondary photon sources illuminating the cloud field from their edges (Marshak etal., 2006; Wen et al., 2007). All of the above effects: undetectable clouds, aerosol hu-midification and the 3-D cloud effects, yield an apparent larger Aerosol Optical Depth
3896

ACPD10, 3893–3936, 2010
The invigoration ofdeep convectiveclouds over the
Atlantic
I. Koren et al.
Title Page
Abstract Introduction
Conclusions References
Tables Figures
J I
J I
Back Close
Full Screen / Esc
Printer-friendly Version
Interactive Discussion
(AOD) measured from space, and interfere with properly characterizing the aerosolmeasured from ground-based remote sensing or even in situ measurements.
Causality: Even assuming that clouds and aerosol can be measured correctly, thelast and the ultimate problem is the strong coupling of clouds and aerosols to meteorol-ogy (environmental properties). Are the observed aerosol-cloud relationships a result5
of the aerosol effect on clouds or does meteorology drive the changes in both aerosoland clouds properties? Meteorological conditions control most of the cloud properties.Variables such as temperature, humidity, surface fluxes and winds largely determinethe depth of convection and the size of clouds. The major challenge is to find thecloud response to perturbations in the aerosol properties buried beneath the signifi-10
cant natural variability due to meteorology. Numerical models that simulate the samescenario and change only the aerosol properties are often used to establish causalitybut it is difficult to generalize the results for different regimes. It is not always clear ifthe observed relationships are applicable to a wide variety of meteorological regimes,requiring great effort to decouple basic meteorological properties (humidity and tem-15
perature) from aerosol effects (Teller and Levin, 2008; Altaratz et al., 2008).An extreme test: Detecting the interaction between aerosol and convective clouds is
an extreme test of all of the above challenges. Convective clouds exhibit the highestinhomogeneity and are extremely sensitive to changes in the environmental condi-tions (e.g. level of instability). Due to their high variability, in a given convective cloud20
field one can expect to find clouds at various stages of their lifecycle, which causesmeasuring/retrieving cloud properties difficult and introduces artifacts to aerosol mea-sured/retrieved in the vicinity of detectable clouds. Lastly, convective clouds serve asa secondary photon source, illuminating the area between them thus making the 3-Dcloud effects a significant consideration to both cloud and aerosol measurements and25
retrievals. Nevertheless, convective clouds are a major source for precipitation andtheir radiative effect can vary from cooling for low cumulus to warming in the deep con-vective cells and their related anvils. Therefore any change in their properties has thepotential for a strong climate impact.
3897

ACPD10, 3893–3936, 2010
The invigoration ofdeep convectiveclouds over the
Atlantic
I. Koren et al.
Title Page
Abstract Introduction
Conclusions References
Tables Figures
J I
J I
Back Close
Full Screen / Esc
Printer-friendly Version
Interactive Discussion
1.1 Aerosol effects on deep convective clouds
Deep convective clouds are manifestations of strong forcing in a potentially very un-stable atmosphere. When changes in the aerosol properties affect microphysical pro-cesses they may modify the vertical distribution of condensate and energy, and thusmodify cloud development.5
Several observational and modeling studies support a hypothesis that suggests thathigher aerosol loading leads to invigoration of convective clouds (Andreae et al., 2004;Khain et al., 2008). More aerosol particles provide more cloud condensation nuclei(CCN). Larger concentrations of CCN result in more, and smaller cloud droplets withsmaller size variance (Twomey, 1977) that are less likely to collide and coalesce, and10
more likely to be lofted higher in the cloud because their fall velocities are smaller.Conversely, clean aerosol conditions promote the formation of larger droplets that canovercome updrafts, collecting enough droplets to form precipitation and its attendantsurface cooling, which acts to stabilize the atmosphere. Therefore, polluted clouds areless likely to form early (warm) precipitation (Gunn and Phillips, 1957; Warner, 1968)15
and the updrafts are more likely to carry the smaller drops upwards and higher intothe atmosphere, resulting in taller clouds that last longer (Koren et al., 2005; Fan etal., 2009). Once the cloud passes the freezing level (supercooled water), a chain ofevents is ignited in the mixed- and cold-phases. Heterogeneous ice nucleation is lessefficient for smaller droplets. Therefore, heterogeneous freezing (and in colder envi-20
ronments, homogeneous freezing) is likely to take place higher in the atmosphere ina colder environment (Rosenfeld and Woodley, 2000). Less effective ice nucleation willfurther delay precipitation initiated by cold processes (Andreae et al., 2004). Thus itis thought that cold rain suppression may lead to longer cloud lifetime and larger coldcloud fraction (Koren et al., 2005; Lindsey and Fromm, 2008). Another positive feed-25
back is expected to be initiated when the larger number of droplets (and larger net watermass) eventually freezes at colder temperatures releasing the latent heat at higher al-titudes, enhancing buoyancy, and therefore, again promoting stronger updrafts that loft
3898
ACPD10, 3893–3936, 2010
The invigoration ofdeep convectiveclouds over the
Atlantic
I. Koren et al.
Title Page
Abstract Introduction
Conclusions References
Tables Figures
J I
J I
Back Close
Full Screen / Esc
Printer-friendly Version
Interactive Discussion
the ice phase higher (Rosenfeld and Woodley, 2000; Jenkins and Pratt, 2008). Finally,the stronger evaporative cooling associated with aerosol-perturbed clouds results instronger cold-pool development and more intense secondary convection (Seifert et al.,2006; van den Heever and Cotton, 2007; Lee et al., 2008). The net result of this hy-pothesis is that higher concentrations of aerosol generate larger and taller convective5
clouds. The fact that microphysical and dynamical processes in convective clouds areso complex, and that systems cycle through multiple stages of convection begs thequestion: is there an imprint of the aerosol on the macroscale features of clouds suchas cloud top height and cloud fraction, and is it measureable with current tools?
Because of their global coverage and ability to observe literally millions of clouds10
in a variety of aerosol regimes, satellites provide a substantial source of data for in-vestigation of the concept of invigoration. Analyses of these data provide evidence insupport of the hypothesis of aerosol invigoration of convective clouds (Devasthale etal., 2005; Koren et al., 2005, 2008a; Meskhidze et al., 2009; Quaas et al., 2009). Thesestudies identify correlative relationships between satellite-retrieved cloud and aerosol15
products that show cloud fraction and cloud top height systematically increasing asaerosol loading increases. The studies interpret these associations between variablesas indicators of possible cause and effect, and conclude that aerosol has a detectableinfluence on the strength of the convection.
This conclusion is often challenged because of two of the most difficult problems20
associated with satellite-based studies of aerosol-cloud interaction: contamination ofthe retrieved aerosol product (Yang et al., 2008; Tian et al., 2008; Loeb and Manalo-Smith 2005; Zhang et al., 2005; Kaufman et al., 2005b), and the case for causality(Matsui et al., 2006; Loeb and Schuster, 2008; Mauger and Norris, 2007; Stevens andBrenguier, 2009). We define “contamination” as any influence on the retrieved AOD25
that would interfere with its ability to provide a stable proxy for CCN. “Proving causality”implies separating the cloud response due to aerosol from the response due to naturalmeteorological factors. The cloud type of interest will be deep convective clouds, andspecifically the ITCZ region of the tropical Atlantic. While the difficulties we address
3899

ACPD10, 3893–3936, 2010
The invigoration ofdeep convectiveclouds over the
Atlantic
I. Koren et al.
Title Page
Abstract Introduction
Conclusions References
Tables Figures
J I
J I
Back Close
Full Screen / Esc
Printer-friendly Version
Interactive Discussion
here have universal application to a wide variety of measurement-based studies ofaerosol-cloud interaction, we focus on satellite-based studies and specifically the useof MODIS and MODIS-like imagers on polar-orbiting satellites that provide snapshotviews of the Earth in multiple channels from the visible through the near-infrared andout to the thermal infrared.5
The intent of this study is to attempt to discern a clear and significant net aerosoleffect embedded within the large convective cloud variance that cannot be explainedby contamination or meteorology. The study does not attempt to quantify the net effectof the aerosol, which depends strongly on the location, season, and type of clouds.
2 Methods10
2.1 Analysis of aerosol-cloud interactions from satellite observations
There is a solid body of scientific literature addressing aerosol-cloud interaction us-ing satellites as the primary tool (Coakley Jr. et al., 1987; Kaufman and Nakajima,1993; Kaufman and Fraser, 1997; Wetzel and Stowe, 1999; Nakajima et al., 2001;Breon et al., 2002; Feingold et al., 2001; Koren et al., 2004, 2005; Kaufman et al.,15
2005a; Berg et al., 2008; L’Ecuyer et al., 2009). Before the year 2000 these studieswere based mostly on AVHRR reflectances, but beginning in 2000, after the launchof the NASA Terra satellite, aerosol-cloud studies mostly switched to using the EarthObserving System (EOS) satellite sensors including the MODerate resolution Imag-ing Spectroradiometer (MODIS) that flies on NASA’s Terra and Aqua satellites. Other20
EOS sensors have been used in these studies, as well, including the active sensors(lidar and radar) CALIOP and CloudSat. While the challenges we address here haveuniversal application to a wide variety of measurement-based studies of aerosol-cloudinteraction, the current investigation and analysis focuses on the use of MODIS andMODIS-like imagers such as AVHRR that view the Earth in multiple channels from the25
3900

ACPD10, 3893–3936, 2010
The invigoration ofdeep convectiveclouds over the
Atlantic
I. Koren et al.
Title Page
Abstract Introduction
Conclusions References
Tables Figures
J I
J I
Back Close
Full Screen / Esc
Printer-friendly Version
Interactive Discussion
visible through the near-infrared and out to the thermal infrared. These imagers areonboard polar orbiting satellites that provide instantaneous views of the aerosol cloudfield at relatively coarse temporal resolution. MODIS views the Earth in 36 channelsfrom 0.41 µm to 14 µm at a variety of spatial resolutions (250 m, 500 m and 1000 m).Among the hundreds of products derived from MODIS-measured radiances is a suite of5
aerosol products (Remer et al., 2005; Levy et al., 2007) and another set of cloud prod-ucts (King et al., 2003; Platnick et al., 2003), including aerosol optical depth (AOD),cloud top pressure and cloud fraction.
Often the AOD is used as a proxy for the cloud condensation nucleus (CCN) con-centration (Andreae, 2009). The reliability of this proxy depends on the uniformity of10
the aerosol size, composition, vertical distribution, but may in many cases be used asa first approximation. AOD is provided as a 10 km product, and the cloud products areprovided at either 5 km or 1 km resolution.
To study the interactions between aerosol and clouds from satellite observations,information on both is needed, for the same time and location. However, aerosol cannot15
be retrieved beneath clouds under cloudy conditions by most satellite sensors, andcannot be retrieved above clouds by MODIS. To solve such a problem the characteristicspatial scale of the aerosol field is assumed to be larger than the scale of a cloud sothat it is sufficient to measure aerosols in the vicinity of clouds. Often the retrievedresolution is decreased so the grid square size covers a much larger area compared20
with the retrieval resolution, increasing the likelihood of information on clouds from thecloudy part and on aerosol from the cloud-free part within the larger grid square.
Grid squares with larger coverage are also useful for variance reduction. Due to thehigh instability and the high thermodynamic energy involved, convective clouds exhibitlarge variance in their physical properties. This adds great difficulty to the detection25
and estimation of aerosol impacts on such clouds. To reduce the complexity, datasetsthat average millions of clouds are needed. To simplify the data handling and analysisand to reduce the variance, pixels with large spatial area (1 degree) are used (King etal., 2003). Although lower resolution increases the likelihood of having both significant
3901

ACPD10, 3893–3936, 2010
The invigoration ofdeep convectiveclouds over the
Atlantic
I. Koren et al.
Title Page
Abstract Introduction
Conclusions References
Tables Figures
J I
J I
Back Close
Full Screen / Esc
Printer-friendly Version
Interactive Discussion
cloud and aerosol information, it may suffer from unavoidable mixing between cloudtypes, and increase the possibility of contamination.
2.2 Cloud contamination
The MODIS aerosol algorithm was designed to minimize cloud contamination by usinga sensitive cloud detection algorithm (Martins et al., 2002; Gao et al., 2002). Further-5
more, the aerosol algorithm removes inadvertent cloudy pixels and cloud shadows thatescape the cloud mask by eliminating the darkest and brightest 25% of every clus-ter of 400 pixels after all detectable clouds have been removed (Remer et al., 2005).Nevertheless it has been shown that the MODIS AOD retrievals may contain residualartifacts introduced by clouds (Kaufman et al., 2005b; Zhang et al., 2005), by 3-D ef-10
fects near clouds (Marshak et al., 2006; Wen et al., 2007) and by physical changes tothe “aerosol” in the vicinity of clouds (Tackett and Di Girolamo, 2009).
The consequences of potential contamination in the MODIS aerosol product are in-vestigated in two independent ways. First by rejecting aerosol measurements witha higher likelihood to be in the vicinity of clouds, and second by using aerosol informa-15
tion taken from the GOCART transport model (Chin et al., 2000a,b) instead of MODISdata.
2.2.1 Filtering AOD pixels with high cloud content
To estimate possible effects of cloud contamination on the aerosol retrieval we use col-located cloud and aerosol retrievals over the ITCZ (tropical Atlantic) for the months of20
July and August 2007 (0–10◦ N and 20–30◦ W). Two aerosol data bases are created.The first is parallel to the operational MODIS product and is constructed from all MODISLevel 2, 10-km AOD retrievals, no matter how cloudy the original 10 km product. Thesecond data base starts from the same initial 10 km aerosol retrievals, but includes onlythose retrievals that report less than 20% cloud fraction within the 10 km box. Previ-25
ous studies have suggested that the likelihood for cloud contamination or other biases
3902

ACPD10, 3893–3936, 2010
The invigoration ofdeep convectiveclouds over the
Atlantic
I. Koren et al.
Title Page
Abstract Introduction
Conclusions References
Tables Figures
J I
J I
Back Close
Full Screen / Esc
Printer-friendly Version
Interactive Discussion
in the retrieved AOD is proportional to the distance from detectable clouds (Koren etal., 2007). We note that the 20% cloud fraction cut-off corresponds to an averagedistance of 5 km between a pixel used by the AOD retrieval and an identified cloudypixel. There is no guarantee that this procedure eliminates all possible cloud contam-ination by imposing this arbitrary cloudiness cutoff, however most of the pixels likley5
to be cloud-contaminated are filtered out (Fig. 1). Other thresholds that range from80% to 20% were tested and all showed similar results. Here the results pertaining tothe most stringent (20%) filter are shown. The 20% cutoff is therefore a conservativemeasure that should eliminate most, if not all, artificial relationships between retrievedAOD and retrieved cloud parameters. However, such filtering while reducing cloud ef-10
fects on the aerosol retrieval can result in significant loss of useful data. Because thetropical sky is very cloudy such filtering results in a rejection of more than 40% of the10-km aerosol retrievals and often a whole aerosol outbreak that is not necessarilycloud contaminated is rejected (Fig. 1).
The MODIS aerosol algorithm retrieves directly two aerosol parameters namely the15
AOD and the fine-fraction (fraction of the optical thickness at 550 nm contributed byfine particles). Often, the fine-fraction information allows classification of aerosol types(Kaufman et al., 2005c). Cloud contamination in the aerosol retrievals is expected todecrease the fine-fraction, by introducing larger particles in the form of cloud dropletsand decreasing the Angstrom exponent. Figure 2 shows a scatter plot of the mean20
fine-fraction from each 1-degree×1-degree grid of the aerosol products subjected tothe 20% cloud fraction cut-off plotted against the standard retrieval. The regressionslope is 1.043 with an intersect of 0.0075, and a correlation of R=0.91. The averageAOD and fine-fraction are 0.246 and 0.446, respectively, for the standard retrieval,and 0.227 and 0.473 for the stringently less cloudy data set. The less cloudy data25
set does have smaller average AOD and larger fine-fraction than the standard product,consistent with cloud contamination in the standard product. However, even the aerosolretrievals with the 20% cloud fraction threshold exhibit a physical, negative correlationbetween AOD and fine-fraction and therefore, part of the ∼5% reduction in fine-fraction
3903
ACPD10, 3893–3936, 2010
The invigoration ofdeep convectiveclouds over the
Atlantic
I. Koren et al.
Title Page
Abstract Introduction
Conclusions References
Tables Figures
J I
J I
Back Close
Full Screen / Esc
Printer-friendly Version
Interactive Discussion
can be attributed to true rejection of cloud contaminated pixels but part is likely due torejection of non-contaminated pixels with higher AOD. We note the strong correlationbetween the data sets, the nearly 1:1 slope and small offset, despite the less cloudydata set losing 40% of the original retrievals, suggesting that the properties of theaerosol retrieval are not strongly affected by the close proximity of clouds. The real5
question is not the relationship between the aerosol retrievals in the two data sets, buthow the aerosol-cloud correlations differ when using either the standard or filtered datasets.
2.2.2 Selection of deep convective clouds
High resolution analysis of the cloud top pressure (CTP) height distribution over the10
study area (Fig. 3) suggests the existence of 3 cloud classes: Low boundary layerclouds with tops less than 850 hPa; clouds of medium height – free tropospheric cloudswith cloud-top height between 850 and 600 hPa; and high clouds with heights above600 hPa. The data are analyzed first for all clouds and then only for high clouds.
The data are divided into four subsets:15
1. “All data”: data is gathered into 1-degree grid squares (similar to the operationalMODIS level 3 product).
2. “All data filtered”: only those retrievals that were retained after the imposition ofthe 20% cloud fraction cut-off (at the 10 km pixel resolution) are aggregated into1-degree grid squares.20
3. “High only mode” – only those retrievals of clouds with CTP <600 hPa (highclouds) were averaged into the 1-degree resolution grid squares.
4. “High, filtered mode”: only those retrievals of clouds with CTP<600 mb and cloudfraction <20% were gathered into the 1-degree resolution grid.
Each of the above datasets is further divided into 3 AOD levels of 0<AOD<0.15,25
0.15<AOD<0.35 and 0.35<AOD<1. The levels were selected to represent clouds in3904

ACPD10, 3893–3936, 2010
The invigoration ofdeep convectiveclouds over the
Atlantic
I. Koren et al.
Title Page
Abstract Introduction
Conclusions References
Tables Figures
J I
J I
Back Close
Full Screen / Esc
Printer-friendly Version
Interactive Discussion
relatively clean, moderately polluted and heavy aerosol conditions, with bins definedsuch that there are comparable numbers of samples in each one.
3 Results
3.1 Correlations between MODIS-derived cloud top pressure, cloud fractionand aerosol optical depth5
The histograms as well as the mean of the CTP and cloud fraction (CFR) are cal-culated for each AOD subset and presented in Fig. 4 for all clouds, and Fig. 5 forthe high-only subset. Note that the CFR presented here is a standard MODIS cloudproduct, produced independently from the aerosol algorithm using a separate set ofMODIS channels (Platnick et al., 2003). This means that the filtering of potentially10
cloud-contaminated aerosol products using a diagnostic of the aerosol algorithm (Re-mer et al., 2005), does not affect the cloud fraction calculation.
The all-data have higher cloud tops (lower CTP) and higher CFR than the data setsubjected to the 20% cloud fraction filter. However, the relationships between cloudparameters and AOD is robust. Higher aerosol loading tends to push the distributions15
and means toward higher clouds and larger cloud fractions, regardless of whether theAOD is calculated from all-data, or the stringently less cloudy data sets.
When focusing on the high-cloud data sets, the data are noisier due to the significantreduction in the sample size. Nevertheless, there is a clear, increase in cloud topheight associated with increased aerosol loadings, regardless of whether the data set20
includes all-data or only the data after the 20% cloud fraction filter is applied. There aresubtle differences between the data sets; the less-cloudy filtered data show a strongerrelationship between CTP for high clouds and increasing AOD than do the all-data, buta weaker relationship between cloud fraction and AOD.
3905
ACPD10, 3893–3936, 2010
The invigoration ofdeep convectiveclouds over the
Atlantic
I. Koren et al.
Title Page
Abstract Introduction
Conclusions References
Tables Figures
J I
J I
Back Close
Full Screen / Esc
Printer-friendly Version
Interactive Discussion
3.2 Correlations between GOCART AOD and MODIS cloud properties
The satellite aerosol loading measured over the same area of the clouds is now re-placed with numerical simulations of aerosol loading calculated by the Goddard Chem-istry Aerosol Radiation Transport (GOCART) model (Chin et al., 2000a,b). Similarattempts to investigate aerosol effects on clouds using a chemical transport model to5
represent the aerosol and satellite measurements of clouds have been performed byChameides et al. (2002) and Schwartz et al. (2002). The GOCART model simulatesemission, chemistry, turbulent mixing, advection, moist convection, dry and wet deposi-tion for major tropospheric aerosol types, including sulfate, dust, organic carbon, blackcarbon, and sea salt aerosols (Chin et al., 2002). The model has a horizontal resolution10
of 2◦ latitude by 2.5◦ longitude and 20–30 vertical sigma layers, and uses the assimi-lated meteorological fields generated from the Goddard Earth Observing System DataAssimilation System (GEOS DAS, Schubert et al., 1993).
The use of simulated instead of measured AOD depends heavily on the accuracy ofthe assimilated dynamical data and the aerosol processes. The model and measure-15
ments have shown good agreement on seasonal and higher variations on daily scales(Yu et al., 2004). However the big advantage of model output, in our case, is that it iscompletely free of any cloud contamination.
In order to increase the sampling statistics both GOCART and MODIS data wereincluded and the study area was increased from the Atlantic ITCZ only, to a box en-20
compassing (0◦ N to 14◦ N; 18◦ W to 45◦ W) for August 2007. The GOCART AOD modeloutput was interpolated from 2◦ by 2.5◦ to 1◦ spatial resolution to match the MODISlevel-3 data, which corresponds to the “all-data” data set of the previous analysis.
While significant differences in the magnitudes of the parameters are expected, thetrends between cloud properties and AOD are similar regardless of whether the AOD is25
retrieved from MODIS measurements (Figs. 4 and 5) or GOCART similations (Fig. 6).The above analyses give strong indication that cloud contamination of the aerosol prod-uct is not artificially producing correlations between aerosol and cloud parameters in
3906

ACPD10, 3893–3936, 2010
The invigoration ofdeep convectiveclouds over the
Atlantic
I. Koren et al.
Title Page
Abstract Introduction
Conclusions References
Tables Figures
J I
J I
Back Close
Full Screen / Esc
Printer-friendly Version
Interactive Discussion
the MODIS data sets, for the region and season of interest. The observed relationshipsof increasing cloud top height and cloud fraction with increasing AOD holds whetheror not all data or only data selected for low cloud fraction are analyzed, and this isequally true for all clouds in the region or applied to only the highest clouds. More-over the trends are similar when using modeled AOD suggesting a clear increase in5
cloud cover and cloud vertical development with increasing AOD. The above analysisis not a definitive result for all regions and seasons, nor is it a statement about cloudcontamination in the MODIS AOD product. The analysis only shows that using theMODIS AOD product to find associations between aerosols and clouds in this partic-ular situation will not lead to false conclusions due to cloud contamination in the AOD10
retrieval.
3.3 Causality
When performing analysis from observations one can detect correlations but an un-derstanding of the causal relationships is much more elusive. Often numerical cloudmodels are used to isolate aerosol effects, while controlling all other variables, and to15
resolve the physical explanation for the observed relationships. Another way to try toseparate variables that may control cloud properties is to narrow the variability in indi-vidual components of the system. This process is analogous to running a model forthe same conditions of one variable set (say meteorology) and comparing the results tothose obtained when changing the other one (aerosol loading). Here we have used the20
NOAA-NCEP Global Data Assimilation System (GDAS) at 1◦ resolution to define themeteorology of the region of interest. The GDAS data set is assimilated 4 times a day,for 13 pressure levels from the surface to 20 hPa using surface and satellite observa-tions with model data (Kanamitsu, 1989; Parrish and Derber, 1992). The GDAS is thefinal run in the series of NCEP operational model runs. We have used the 12 UTC set25
which, on average, covers a period of time less than 2 h from the satellite observationtime.
3907
ACPD10, 3893–3936, 2010
The invigoration ofdeep convectiveclouds over the
Atlantic
I. Koren et al.
Title Page
Abstract Introduction
Conclusions References
Tables Figures
J I
J I
Back Close
Full Screen / Esc
Printer-friendly Version
Interactive Discussion
Reanalysis data have previously been used to define the meteorology in aerosol-cloud studies from satellite and to estimate the meteorological contribution to cloudproperties (e.g., Kaufman et al., 2005a; Brioude et al., 2009; Savtchenko, 2009). Herewe use this approach to find the variables that best describe the ITCZ convective cloudproperties (vertical development and cloud fraction) as measured by MODIS. After find-5
ing the meteorological variables that have the most statistically significant correlationswith the measured cloud properties, the meteorological variance will be restricted bylimiting the allowed range of the selected variables. Since convective systems are ex-pected to have a well-defined set of meteorological properties (Jakob and Tselioudis,2003), such a direct approach is preferred to a multi-regression analysis (Kaufman10
et al., 2005a) where many meteorological variables are mixed together to completelyspan the meteorological variance space. The multi-regression approach may yieldbetter overall correlations with the free (convective cloud) variables but when mixingmany different variables with different units one may lose the physical reasoning andthe likelihood of statistically insignificant correlations appearing is higher.15
Since we seek meteorological variables that represent cloud properties at severalscales, ranging from the highest resolution that is limited by the assimilation resolution(1◦) to a synoptic scale, the same study area as for the GOCART analysis is used (At-lantic ITCZ; 0◦ N to 14◦ N; 18◦ W to 45◦ W; August 2007), along with the MODIS level-3data which is also given at 1◦ spatial resolution. By using this coarser resolution data20
we lose the ability to separate the three cloud modes seen in the Fig. 3 histogram thatwas constructed from much finer resolution retrievals (5 km). Thus, the specific focuson the highest cloud top category previously done in the analysis concerning cloudcontamination cannot be repeated in this study of causality. Still the Atlantic ITCZ re-gion offers a situation with deep convection comprising a prevalent component of the25
“all cloud” situation. Identifying robust relationships between aerosol and cloud prop-erties here, will provide indirect support that aerosol is affecting the deep convectiveelements in the system.
3908

ACPD10, 3893–3936, 2010
The invigoration ofdeep convectiveclouds over the
Atlantic
I. Koren et al.
Title Page
Abstract Introduction
Conclusions References
Tables Figures
J I
J I
Back Close
Full Screen / Esc
Printer-friendly Version
Interactive Discussion
The GDAS output has 286 meteorological variables. The key ones such as geopo-tential heights, temperature, winds (horizontal and vertical), relative humidity, vorticityand water mixing ratio are all given at 13 pressure levels. Other variables are specifiedat specific pressure levels (such as variables that pertain to the boundary layer) or asan average of a few levels (the complete list of GDAS variables is given in Appendix A).5
First we perform a correlation test over our study area between MODIS-derived CTP,CFR and AOD against all of the GDAS output variables. In order to check sensitivityto spatial and temporal scales this is done for the finest assimilation resolution (1◦)and also for coarser resolutions of (2◦, 4◦ and 8◦), and for data measured at the sametime as the GDAS output and at time lags of 1 day and 5 days. The significance10
of each correlation test was tested using the p-value test (Schervish, 1996). The p-value test is the probability of getting a correlation as large as the observed values byrandom chance, when the true correlation is zero (the null hypothesis). Lower p-valuescorrespond to more significant results . Often, p-value thresholds of <0.05 are used todefine correlations as truly significant (Wilks, 2005). In our study a p-value threshold of15
0.01 is used to be even more conservative.Figure 7 shows the correlations between MODIS CTP and all of the GDAS output
variables at 4 different spatial resolutions (1◦, 2◦, 4◦, 8◦). The plot area is divided bybackground color to signify the key variable regimes. The left part of each regimerefers to the lower part of the atmosphere, gradually increasing in height (decreas-20
ing in pressure). Note how two regimes present remarkably high correlations, namelythe pressure vertical velocity (ω) variables (53–73) and relative humidity (RH) vari-ables (74–94). Two of the other variables that show high correlations are related (var.228 precipitable water and var. 245–248 relative humidity at different pressure levelranges). Decreasing the spatial resolution from 1◦ to 4◦ to 8◦ sometimes has an ef-25
fect on the correlations, but not enough to change the basic finding: MODIS-observedcloud top pressure is most robustly linked to broad scale vertical velocity and humidityvariables, especially towards the upper troposphere.
3909

ACPD10, 3893–3936, 2010
The invigoration ofdeep convectiveclouds over the
Atlantic
I. Koren et al.
Title Page
Abstract Introduction
Conclusions References
Tables Figures
J I
J I
Back Close
Full Screen / Esc
Printer-friendly Version
Interactive Discussion
Similarly to Fig. 7, Fig. 8 shows the correlations between MODIS-derived CTP, CFRand AOD and all of the GDAS output variables at 1◦ spatial resolution. Indeed AODdoes correlate well with some of the meteorological parameters but the parameters aredifferent than those that correlate with the clouds. Moreover the correlation between ωand RH are of opposite sign, suggesting that the same meteorology that favors higher5
aerosol loading (say midlevel continental transport) will oppose development of deepconvective clouds. For example, the analysis suggests that the correlation betweenAOD and RH is negative in this region because aerosol transport to the tropical At-lantic is often accompanied by dry continental air masses. This appears to dominatethe otherwise expected positive correlation between AOD and RH due to water vapor10
uptake by the aerosol.Because ω (550 hPa) and RH (350 hPa) yielded the highest correlations with the
cloud properties, these parameters will be used to constrain the meteorological con-ditions. The CTP and CFR data were divided into 3 ω ranges: ω<−0.1 Pa/s for thestrong convective regime, −0.1<ω<0 Pa/s for the weak convective regime and 0<ω for15
the subsidence regime. Similarly the data were divided into 3 RH bins: 0%<RH<25%,25%<RH<55% and 55%<RH. The correlations with AOD are presented for CTP andCFR restricted by ω and RH in Fig. 9. Note how indeed stronger uplifting and RH cor-relates with taller clouds that have larger cloud fraction suggesting that these variablesdo reflect correctly their expected effect on the convective cloud properties. Note also20
how the general relationships between increasing AOD and cloud properties are notdramatically different between the different meteorological subsets and the original fulldata set (dotted blue lines). These curves suggest that the aerosol and meteorologyexert a near-orthogonal forcing on the convective cloud properties with the y-interceptindicating the meteorological effect that is represented by these GDAS variables and25
the slopes representing the aerosol effect.
3910

ACPD10, 3893–3936, 2010
The invigoration ofdeep convectiveclouds over the
Atlantic
I. Koren et al.
Title Page
Abstract Introduction
Conclusions References
Tables Figures
J I
J I
Back Close
Full Screen / Esc
Printer-friendly Version
Interactive Discussion
4 Discussion and conclusions
In this paper two of the most pernicious problems that emerge when studying aerosol-cloud interactions from satellite observations have been tackled. Whenever correla-tions between aerosol and cloud properties are observed in satellite data the first ques-tion that arises is: Are these correlations physically-based, or are they an artifact of the5
retrievals? The second question is: Are these correlations due to aerosol effects or isthe aerosol acting as a tracer for specific meteorological conditions that are the truemodifier of the cloud properties? The objective has been to present two methodologiesthat can help confront these important questions. The results strengthen the case thatthe observed increase in cloud top height and cloud fraction associated with higher10
aerosol loadings in convective clouds over the Atlantic ITCZ in the data set studied isdue to aerosol processes and not to retrieval artifacts or meteorology. The observedresponse to aerosol perturbations is referred to as “invigoration” and comprises com-plementary parts: a suppression of the stabilizing effects of surface rain generated bywarm processes; a delay in the freezing process that results in latent heat release at15
higher levels in the cloud (destabilization); and stronger secondary convection associ-ated with more vigorous cold pool outflow.
The first problem addressed is that of the potential bias in aerosol measurementsas a result of cloud contamination. Analyses have been performed with the standardMODIS retrieval products as well as eliminating all 10 km aerosol retrievals with in-20
ternal CFR>20%, representing an inordinate effort to remove contaminated aerosolretrievals. When removing these retrievals more than 40% of the AOD retrievals areremoved and information on complete aerosol regimes that are not necessarily affectedby clouds is lost (see example in Fig. 1).
For the “all-data set”, i.e., the standard MODIS products, the cloud top pressure for25
the highest AOD category (AOD=0.5) is 110±30 hPa lower (∼800 m higher) than for thelowest AOD category (AOD=0.1). After removing the aerosol data set with CFR>20%,height differences still exist, but are reduced to 60+/−30 hPa (∼480 m). Both all-data
3911

ACPD10, 3893–3936, 2010
The invigoration ofdeep convectiveclouds over the
Atlantic
I. Koren et al.
Title Page
Abstract Introduction
Conclusions References
Tables Figures
J I
J I
Back Close
Full Screen / Esc
Printer-friendly Version
Interactive Discussion
and the minimally-cloudy filtered data sets show similar magnitudes of increasing CFRwith increasing AOD; CFR is 0.35±0.05 higher for the highest AOD category as com-pared with the lowest AOD category for the all-data set and 0.30±0.08 for the <20%cloud fraction filtered subset. In the high-only cloud-top case the results suggest en-hancement of the high AOD/low AOD differences for the filtered subset, as compared5
with the all-data case. Here the average cloud tops rise 55±15 hPa higher (∼1000 m)when the AOD changes from 0.10 to 0.24 in the minimally-cloudy filtered subset andonly 25±10 hPa (∼500 m) in the all-data set. The saturation of the microphysical ef-fect after AOD>∼0.25 is also visible in the high-only data sets. The high-only CFRrelationships with AOD are reduced from 0.35±0.05 to 0.23±0.08, from the “filtered”10
to “all-data” analyses. Indeed the data for all clouds and high-only clouds show clearand significant positive correlations between cloud top height and CFR and aerosolloading, whether all-data or minimally-cloudy filtered aerosol data sets are used.
Use of the GOCART-modeled AOD output has the advantage of removing any con-cerns of cloud contamination in the reported AOD. Nevertheless correlations of CFR15
and CTP with AOD show similar trends with larger magnitude. When the AOD changesfrom 0.05 to 0.28 the cloud tops are higher by 330±30 hPa and the cloud fraction is sig-nificantly larger (0.4±0.1). Again this part of the analysis suggests that the correlationsbetween MODIS-derived aerosol and cloud products in this region and season of inter-est are not due to artifacts of the MODIS aerosol retrievals.20
The second problem addressed is that of causality. To this end GDAS assimilationdata are used to provide the context for the observed aerosol-cloud correlations. TheGDAS assimilation data are used as an approximation for the meteorological condi-tions at the same time and location of the satellite observations. The assimilation datainclude surface, radiosondes and space measurements in conjunction with an atmo-25
spheric general circulation model to represent a wide variety of meteorological data ona three-dimensional grid. The GDAS data may contain some information on aerosolradiative effects (if these affected the measurements used by the assimilation) but itshould be minor and will not contain direct information on the aerosol microphysical
3912
ACPD10, 3893–3936, 2010
The invigoration ofdeep convectiveclouds over the
Atlantic
I. Koren et al.
Title Page
Abstract Introduction
Conclusions References
Tables Figures
J I
J I
Back Close
Full Screen / Esc
Printer-friendly Version
Interactive Discussion
effects that are the focus of this paper. Therefore it is argued to be a suitable tool torepresent the dynamical component.
The differences in the correlation patterns between the cloud properties and AOD(Fig. 8) already suggest that, at least over this area, the positive correlations betweenAOD and deep convective vertical and horizontal development occur in spite of the5
meteorology. The aerosol does correlate with some of the assimilation variables butmostly with ones different than those that correlate with convective clouds, and in manycases if there is a joint correlation it is with opposite sign, suggesting that AOD will behigh in conditions that are not favorable for deep convective cloud development.
The potential for new insights into understanding deep convection based on cor-10
relations between the assimilation variables and satellite-derived cloud parameters isenormous. Each significant correlation should be explained and its scale-dependenceunderstood. Here we have used only a minor portion of this information to restrict thevariance of convective cloud meteorology. The variables that give the highest and themost consistent correlations with CTP and CFR are the large-scale pressure vertical15
velocities (ω) and the relative humidity (RH) of the upper troposphere. Intuitively thesevariables should have good agreement with convective clouds and so the fact that theircorrelations are the highest serves as a sanity check.
Restriction of the data to ω and RH regimes showed that, as expected, strongerbroad-scale rising motion (low level convergence) and RH correlate with taller clouds20
and higher cloud fraction. Relationships between the satellite-derived cloud propertiesand AOD have been shown here to be almost invariant to the meteorological binning.For any of the meteorological scenarios spanned by the ω and RH ranges, the ITCZconvective clouds are taller and larger when the aerosol loading increases. Moreover,the slopes (as a function of the AOD) are similar for all subsets (CTP moreso than25
CFR) suggesting that the aerosol and meteorology exert a near- orthogonal forcing onconvective invigoration. In such variable space, the aerosol effect defines a family oflines with a given slope and their intercept depends on the meteorology.
3913

ACPD10, 3893–3936, 2010
The invigoration ofdeep convectiveclouds over the
Atlantic
I. Koren et al.
Title Page
Abstract Introduction
Conclusions References
Tables Figures
J I
J I
Back Close
Full Screen / Esc
Printer-friendly Version
Interactive Discussion
The analysis does include a number of imperfections. First, the AOD, the basic metricused for aerosol loading cannot always be monotonically linked to aerosol concentra-tion, and suffers from ambiguity associated with water vapor uptake. In spite of thepositive correlation between AOD and surface CCN measurements, errors can be sub-stantial (Kapustin et al., 2006; Andreae, 2009). The quality of the AOD as a measure5
of CCN concentration depends on the aerosol type, uniformity and vertical distributionof the aerosol, and the merits of this approach may vary greatly. Second, it is notpossible to completely separate meteorological influences from aerosol influences onclouds. This work can therefore only provide further evidence of the aerosol playinga significant role in increasing cloud top height and cloud fraction, but cannot quantify10
the relative contributions with confidence.Often the suggested approach to the complex phenomena of convective cloud-
aerosol interaction is to use numerical models to answer all questions. The problemis, of course, that in reality it is very hard (likely impossible) to build a model with suffi-cient complexity to properly simulate all physical pathways, at all scales. Models need15
constraints from observations. Some constraints can and should be imposed basedon laboratory or field observations, but others that involve regional or seasonal scalescan and should be imposed from robust satellite observations. We have shown herethat aerosol-cloud relationships derived from satellite data can be held to strict scrutinyand still deliver robust, physically significant results. These robust relationships can be20
coupled with scientific insight to provide hypotheses from which models can start toexplore the detailed physics behind the observations, as well as to constrain the modelresults. Thus, to answer the difficult questions concerning aerosol-cloud interaction,and how particles can alter climate and the hydrological cycle through their modifi-cation of clouds, we need a comprehensive approach that includes modeling, in situ25
measurements and satellite-based observational studies.
3914

ACPD10, 3893–3936, 2010
The invigoration ofdeep convectiveclouds over the
Atlantic
I. Koren et al.
Title Page
Abstract Introduction
Conclusions References
Tables Figures
J I
J I
Back Close
Full Screen / Esc
Printer-friendly Version
Interactive Discussion
Appendix A
GDAS model parameters associated with the abscissae of Figs. 7 and 8
The model includes 26 pressure levels (P)5
(i=1, 26): P(1000, 975, 950, 925, 900, 850, 800, 750, 700, 650, 600, 550, 500, 450,400, 350, 300, 250, 200, 150, 100, 70, 50, 30, 20, 10) (hPa)
(i=27, 52): Temperature (at P levels i=1,26)
(i=53, 73): Pressure vertical velocity (at P levels i=1,20)
(i=74, 94): Relative humidity (at P levels i=1, 20)10
(i=95, 120): Absolute vorticity (at P levels i=1, 26)
(i=121, 126): Ozone mixing ratio (at P levels i=21, 26)
(i=127, 147): Cloud water mixing ratio (at P levels i=1, 20)
(i=148): 5-wave geopotential height at i=13 (P=500 mb)
(i=149, 200): (U; V) horizontal velocity pairs (at P levels i=1, 26)15
(i=201): Temperature at 30 hPa above ground
(i=202): Relative humidity at 30 hPa above ground
(i=203): Specific humidity at 30 hPa above ground
(i=204): U-wind at 30 hPa above ground
(i=205): V-wind at 30 hPa above ground20
(i=206): Temperature at 1829 m above MSL
(i=207): Temperature at 2743 m above MSL
3915
ACPD10, 3893–3936, 2010
The invigoration ofdeep convectiveclouds over the
Atlantic
I. Koren et al.
Title Page
Abstract Introduction
Conclusions References
Tables Figures
J I
J I
Back Close
Full Screen / Esc
Printer-friendly Version
Interactive Discussion
(i=208): Temperature at 3658 m above MSL
(i=209): U-wind at 1829 m above MSL
(i=210): V-wind at 1829 m above MSL
(i=211): U-wind at 2743 m above MSL
(i=212): V-wind at 2743 m above MSL5
(i=213): U-wind at 3658 m above MSL
(i=214): V-wind at 3658 m above MSL
(i=215, 216): Geopotential height, unknown height
(i=217, 218): Temperature, unknown
(i=219, 220): Pressure, unknown10
(i=221, 222): Vertical speed shear, unknown
(i=223, 226): (U; V) wind pairs, unknown
(i=227): Surface pressure
(i=228): Precipitable water
(i=229): Relative humidity, unknown15
(i=230): Geopotential height, tropopause
(i=231): Temperature, tropopause
(i=232): Pressure, tropopause
(i=233): Vertical speed shear, tropopause
(i=234): Surface Lifted Index, surface20
(i=235): Convective Available Potential Energy (CAPE), surface3916

ACPD10, 3893–3936, 2010
The invigoration ofdeep convectiveclouds over the
Atlantic
I. Koren et al.
Title Page
Abstract Introduction
Conclusions References
Tables Figures
J I
J I
Back Close
Full Screen / Esc
Printer-friendly Version
Interactive Discussion
(i=236): Convective Inhibition (CIN), surface
(i=237): Best (4-layer) lifted index, surface
(i=238): Convective Available Potential Energy (CAPE), 180 hPa above ground
(i=239): Convective Inhibition (CIN), 180 hPa above ground
(i=240): Geopotential height at max wind level5
(i=241): Temperature at max wind level
(i=242): Pressure at max wind level
(i=243): Geopotential height at surface
(i=244): Pressure reduced to MSL
(i=245): Relative humidity at sigma 0.44–1.0010
(i=246): Relative humidity at sigma 0.72–0.94
(i=247): Relative humidity at sigma 0.44–0.72
(i=248): Relative humidity at sigma 0.33–1.00
(i=249): Potential temperature at sigma=0.995
(i=250): Temperature at sigma=0.99515
(i=251): Pressure vertical velocity at sigma=0.995
(i=252): Relative humidity at sigma=0.995
(i=253): Total ozone
(i=254): Cloud water mixing ratio (unknown)
(i=255): Geopotential height at 0 ◦C isotherm20
3917

ACPD10, 3893–3936, 2010
The invigoration ofdeep convectiveclouds over the
Atlantic
I. Koren et al.
Title Page
Abstract Introduction
Conclusions References
Tables Figures
J I
J I
Back Close
Full Screen / Esc
Printer-friendly Version
Interactive Discussion
(i=256): Relative humidity at 0 ◦C isotherm
(i=257): Geopotential height (unknown)
(i=258): Relative humidity (unknown)
(i=259): U-wind (tropopause)
(i=260): V-wind (tropopause)5
(i=261): U-wind maximum
(i=262): V-wind maximum
(i=263): U-wind at sigma=0.995
(i=264): V-wind at sigma=0.995
(i=265): Temperature at surface10
(i=266): Volumetric soil moisture (0–10 cm down)
(i=267): Volumetric soil moisture (10–40 cm down)
(i=268): Volumetric soil moisture (40–100 cm down)
(i=269): Volumetric soil moisture (100–200 cm down)
(i=270): Temperature (0–10 cm down)15
(i=271): Temperature (10–40 cm down)
(i=272): Temperature (40–100 cm down)
(i=273): Temperature (100–200 cm down)
(i=274): Accumulated snow at surface
(i=275): Land cover fraction (land=1; sea=0)20
(i=276): Surface ice fraction (ice=1; no ice=0)3918

ACPD10, 3893–3936, 2010
The invigoration ofdeep convectiveclouds over the
Atlantic
I. Koren et al.
Title Page
Abstract Introduction
Conclusions References
Tables Figures
J I
J I
Back Close
Full Screen / Esc
Printer-friendly Version
Interactive Discussion
(i=277): Temperature at 2 m above ground
(i=278): Specific humidity at 2 m above ground
(i=279): Planetary boundary layer height
(i=280): Total cloud cover
(i=281): Relative humidity at 2 m above ground5
(i=282): U-wind at 10 m above ground
(i=283): V-wind at 10 m above ground
(i=284): Geopotential height anomaly at 1000 hPa
(i=285): Geopotential height anomaly at 500 hPa
(i=286): 5-wave Geopotential height anomaly at 500 hPa10
Acknowledgements. IK acknowledges a visiting fellowship from the Cooperative Institute forresearch in the Environmental Sciences (CIRES) for supporting this work. GF and IK ac-knowledge support from NOAA’s Climate Goal. LR and IK acknowledge support from NASA’sInterdisciplinary Science program.
References15
Albrecht, B. A.: Aerosols, cloud microphysics, and fractional cloudiness, Science, 245(4923),1227–1230, 1989.
Altaratz, O., Koren, I., and Reisin, T.: Humidity impact on the aerosol effect in warm cumulusclouds, Geophys. Res. Lett., 35, L17804, doi:10.1029/2008GL034178, 2008.
Andreae, M. O., Rosenfeld, D., Artaxo, P., Costa, A. A., Frank, G. P., Longo, K. M., and Silva-20
Dias, M. A. F.: Smoking rain clouds over the Amazon, Science, 303, 1337–1342, 2004.Andreae, M. O., Jones, C. D., and Cox, P. M.: Strong present-day aerosol cooling implies a hot
future, Nature, 435(3671), 1187–1190, 2005.
3919

ACPD10, 3893–3936, 2010
The invigoration ofdeep convectiveclouds over the
Atlantic
I. Koren et al.
Title Page
Abstract Introduction
Conclusions References
Tables Figures
J I
J I
Back Close
Full Screen / Esc
Printer-friendly Version
Interactive Discussion
Andreae, M. O.: Correlation between cloud condensation nuclei concentration and aerosoloptical thickness in remote and polluted regions, Atmos. Chem. Phys., 9, 543–556, 2009a,http://www.atmos-chem-phys.net/9/543/2009/.
Andreae, M. O.: A new look at aging aerosols, Science, 326(5959), 1493,doi:10.1126/science.1183158, 2009b.5
Berg, W., L’Ecuyer, T., and van den Heever, S. C.: Evidence for the impact of aerosols onthe onset and microphysical properties of rainfall from a combination of active and passivesatellite sensors, J. Geophy. Res., 113, D14S23, doi:10.1029/2007JD009649, 2008.
Breon, F.-M., Tanre, D., and Generoso, S.: Aerosol effect on cloud droplet size monitored fromsatellite, Science, 295, 834–838, 2002.10
Brioude, J., Cooper, O. R., Feingold, G., Trainer, M., Freitas, S. R., Kowal, D., Ayers, J. K.,Prins, E., Minnis, P., McKeen, S. A., Frost, G. J., and Hsie, E.-Y.: Effect of biomass burningon marine stratocumulus clouds off the California coast, Atmos. Chem. Phys., 9, 8841–8856,2009,http://www.atmos-chem-phys.net/9/8841/2009/.15
Chameides, W. L., Luo, C., Saylor, R., Streets, D., Huang, Y., Bergin, M., and Giorgi, F.:Correlation between model-calculated anthropogenic aerosols and satellite-derived cloudoptical depths: indication of indirect effect?, J. Geophys. Res., 107(D10), 4085,doi:10.1029/2000JD000208, 2002.
Charlson, R. J., Ackerman, A. S., Bender, F. A.-M., Anderson, T. L., and Liu, Z: On the climate20
forcing consequences of the albedo continuum between cloudy and clear air, Tellus B, 59,715–727, doi:10.1111/j.1600-0889.2007.00297.x, 2007.
Chin, M., Rood, R. B., Lin, S.-J., Muller, J. F., and Thompson, A. M.: Atmospheric sulfur cyclein the global model GOCART: model description and global properties, J. Geophys. Res.,105(D20), 24671–24687, doi:10.1029/2000JD900384, [AGU], 2000a.25
Chin, M., Savoie, D. L., Huebert, B. J., Bandy, A. R., Thornton, D. C., Bates, T. S., Quinn, P. K.,Saltzman, E. S., and De Bruyn, W. J.: Atmospheric sulfur cycle in the global model GOCART:comparison with field observations and regional budgets, J. Geophys. Res., 105(D20),24689–24712, doi:10.1029/2000JD900385, [AGU], 2000b.
Chin, M., Ginoux, P., Kinne, S., Torres, O., Holben, B., Duncan, B., Martin, R., Logan, J.,30
Higurashi, A., and Nakajima, T.: Tropospheric aerosol optical thickness from the GOCARTmodel and comparisons with satellite and sunphotometer measurements, J. Atmos. Sci., 59,461–483, doi:10.1175/1520-0469(2002)059, 2002.
3920
ACPD10, 3893–3936, 2010
The invigoration ofdeep convectiveclouds over the
Atlantic
I. Koren et al.
Title Page
Abstract Introduction
Conclusions References
Tables Figures
J I
J I
Back Close
Full Screen / Esc
Printer-friendly Version
Interactive Discussion
Coakley Jr., J. A., Bernstein, R. L., and Durkee, P. A.: Effect of ship-stack effluents on cloudreflectivity, Science, 237, 1020–1022, 1987.
Devasthale, A., Kruger, O., and Grassl, H.: Change in cloud-top temperatures over Europe,IEEE Geosci. Remote S., 2, 333–336, doi:10.1109/LGRS.2005.851736, 2005.
Fan, J., Yuan, T., Comstock, J. M., Ghan, S., Khain, A., Leung, L. R., Li, Z., Martins, V. J., and5
Ovchinnikov, M.: Dominant role by vertical wind shear in regulating aerosol effects on deepconvective clouds, J. Geophys. Res., 114, D22206, doi:10.1029/2009JD012352, 2009.
Feingold, G., Remer, L. A., Ramaprasad, J., and Kaufman, Y. J.: Analysis of smoke impacton clouds in Brazilian biomass burning regions: an extension of Twomey’s approach, J.Geophys. Res., 106(D19), 22907–22922, 2001.10
Gao, B.-C., Kaufman, Y. J., Tanre, D., and Li, R.-R.: Distinguishing tropospheric aerosol fromthin cirrus clouds for improved aerosol retrievals using the ratio of 1.38 µm and 1.24 µmchannels, Geophys. Res. Lett., 29(18), doi:10.1029/2002GL015475, 2002.
Gun, R. and Phillips, B. B.: An experimental investigation of the effect of air pollution on theinitiation of rain, J. Meteorol., 14, 272–280, 1957.15
IPCC, 2007: Summary for Policymakers, in: Climate Change 2007: The Physical ScienceBasis, Contribution of Working Group I to the Fourth Assessment Report of the Intergov-ernmental Panel on Climate Change, edited by: Solomon, S., Qin, D., Manning, M., Chen,Z., Marquis, M., Averyt, K. B., Tignor, M., and Miller, H. L., Cambridge University Press,Cambridge, UK and New York, NY, USA.20
Jakob, C. and Tselioudis, G.: Objective identification of cloud regimes in the tropical WesternPacific, Geophys. Res. Lett., 30, 2082, doi:2010.1029/2003GL018367, 2003.
Jenkins, G. S., Pratt, A. S., and Heymsfield, A. J.: Possible linkages between Saharan dust andtropical cyclone rain band invigoration in the Eastern Atlantic during NAMMA-06, Geophys.Res. Lett., 35, L08815, doi:10.1029/2008GL034072, 2008.25
Jiang, H. and Feingold, G.: Effect of aerosol on warm convective clouds: aerosol-cloud-surface flux feedbacks in a new coupled large eddy model, J. Geophys. Res., 111, D01202,doi:10.1029/2005JD006138, 2006.
Kahn, R. A., Li, W.-H., Martonchik, J., Bruegge, C., Diner, D., Gaitley, B., Abdou, W.,Dubovik, O., Holben, B., Smirnov, S., Jin, Z., and Clark, D.: MISR low-light-level calibra-30
tion, and implications for aerosol retrieval over dark water, J. Atmos. Sci., 62, 1032–1062,2005.
3921

ACPD10, 3893–3936, 2010
The invigoration ofdeep convectiveclouds over the
Atlantic
I. Koren et al.
Title Page
Abstract Introduction
Conclusions References
Tables Figures
J I
J I
Back Close
Full Screen / Esc
Printer-friendly Version
Interactive Discussion
Kanamitsu, M.: Description of the NMC global data assimilation and forecast system, WeatherForecast., 4, 334–342, 1989.
Kapustin, V. N., Clarke, A. D., Shinozuka, Y., Howell, S., Brekhovskikh, V., Nakajima, T., andHigurashi, A.: On the determination of a cloud condensation nuclei from satellite: challengesand possibilities, J. Geophys. Res., 111, D04202, doi:10.1029/2004JD005527, 2006.5
Kaufman, Y. J. and Nakajima, T.: Effect of Amazon smoke on cloud microphysics and albedo –analysis from satellite imagery, J. Appl. Meteorol., 32, 729–744, 1993.
Kaufman, Y. J. and Fraser, R. S.: The effect of smoke particles on clouds and climate forcing,Science, 277, 1636–1639, 1997.
Kaufman, Y. J., Tanre, D., and Boucher, O.: A satellite view of aerosols in the climate system,10
Rev. Nat., 419, 215–223, 2002.Kaufman, Y. J., Koren, I., Remer, L., Rosenfeld, D., and Rudich, Y.: The effect of smoke, dust,
and pollution aerosol on shallow cloud development over the Atlantic Ocean, P. Natl. Acad.Sci. USA, 102, 11207–11212, 2005a.
Kaufman, Y. J., Remer, L. A., Tanre, D., Li, R. R., Kleidman, R., Mattoo, S., Levy, R., Eck, T.,15
Holben, B. N., Ichoku, C., Martins, J., and Koren, I.: A critical examination of the residualcloud contamination and diurnal sampling effects on MODIS estimates of aerosol over ocean,IEEE T. Geosci. Remote, 43(12), 2886–2897, 2005b.
Kaufman, Y. J., Boucher, O., Tanre, D., Chin, M., Remer, L. A., and Takemura, T.: Aerosolanthropogenic component estimated from satellite data, Geophys. Res. Lett., 32, L17804,20
doi:10/1029/2005GL023125, 2005c.Kaufman, Y. J. and Koren, I.: Smoke and pollution aerosol effect on cloud cover, Science, 313,
655–658, doi:10.1126/science.1126232, 2006.Khain, A. P., Rosenfeld, D., and Pokrovsky, A.: Simulating convective clouds with sustained
supercooled liquid water down to −37.5 ◦C using a spectral microphysics model, Geophys.25
Res. Lett., 28, 3887–3890, 2001.Khain, A. P., Pokrovsky, A., BenMoshe, N., and Rosenfeld, D.: Simulating green-ocean-smoky
and pyro-clouds observed in the Amazon region during the LBA-SMOCC campaign, J. At-mos. Sci., 61, 2963–2982, 2005.
Khain, A. P., BenMoshe, N., and Pokrovsky, A.: Factors determining the impact of aerosols on30
surface precipitation from clouds: an attempt of classification, J. Atmos. Sci., 65, 1721–1748,2008.
3922

ACPD10, 3893–3936, 2010
The invigoration ofdeep convectiveclouds over the
Atlantic
I. Koren et al.
Title Page
Abstract Introduction
Conclusions References
Tables Figures
J I
J I
Back Close
Full Screen / Esc
Printer-friendly Version
Interactive Discussion
King, M. D., Menzel, W. P., Kaufman, Y. J., Tanre, D., Gao, B.-C., Platnick, S., Ackerman, S. A.,Remer, L. A., Pincus, R., and Hubanks, P. A.: Cloud and aerosol properties, precipitablewater, and profiles of temperature and humidity from MODIS, IEEE T. Geosci. Remote, 41,442–458, 2003.
Koren, I., Kaufman, Y. J., Remer, L. A., and Martins, J. V.: Measurement of the effect of Amazon5
smoke on inhibition of cloud formation, Science, 303, 1342–1345, 2004.Koren, I., Kaufman, Y. J., Rosenfeld, D., Remer, L. A., and Rudich, Y.: Aerosol invigo-
ration and restructuring of Atlantic convective clouds, Geophys. Res. Lett., 32, LI4828,doi:10.1029/2005GL023187, 2005.
Koren, I., Remer, L. A., Kaufman, Y. J., Rudich, Y., and Martins, J. V.: On the twilight zone be-10
tween clouds and aerosols, Geophys. Res. Lett., 34, L08805, doi:10.1029/2007GL029253,2007.
Koren, I., Martins, J. V., Remer, L. A., and Afargan, H.: Smoke invigoration versus inhibition ofclouds over the Amazon, Science, 321, 946, doi:10.1126/science.1159185, 2008a.
Koren, I., Oreopoulos, L., Feingold, G., Remer, L. A., and Altaratz, O.: How small is a small15
cloud?, Atmos. Chem. Phys., 8, 3855–3864, 2008b,http://www.atmos-chem-phys.net/8/3855/2008/.
L’Ecuyer, T. S., Berg, W., Haynes, J., Lebsock, M., and Takemura, T.: Global observationsof aerosol impacts on precipitation occurrence in warm maritime clouds, J. Geophys. Res.,114(D9), D09211, doi:10.1029/2008JD011273, 2009.20
Lee, S. S., Donner, L. J., Phillips, V. T. J., and Ming, Y.: The dependence of aerosol effects onclouds and precipitation on cloud-system organization, shear and stability, J. Geophys. Res.,113, D16202, doi:10.1029/2007JD009224, 2008.
Levy, R. C., Remer, L., Mattoo, S., Vermote, E., and Kaufman, Y. J.: Second-generation algo-rithm for retrieving aerosol properties over land from MODIS spectral reflectance, J. Geo-25
phys. Res., 112, D13211, doi:10.1029/2006JD007811, 2007.Lindsey, D. T. and Fromm, M.: Evidence of the cloud lifetime effect from wildfire-induced thun-
derstorms, Geophys. Res. Lett., 35, L22809, doi:10.1029/2008GL035680, 2008.Loeb, N. G. and Manalo-Smith, N.: Top-of-atmosphere direct radiative effect of aerosols
over global oceans from merged CERES and MODIS observations, J. Climate, 18, 3506,30
doi:10.1175%2FJCLI3504.1, 2005.
3923

ACPD10, 3893–3936, 2010
The invigoration ofdeep convectiveclouds over the
Atlantic
I. Koren et al.
Title Page
Abstract Introduction
Conclusions References
Tables Figures
J I
J I
Back Close
Full Screen / Esc
Printer-friendly Version
Interactive Discussion
Loeb, N. G. and Schuster, G. L.: An observational study of the relationship between cloud,aerosol and meteorology in broken low-level cloud conditions, J. Geophys. Res., 113,D14214, doi:10.1029/2007JD009763, 2008.
Marshak, A., Platnick, S., Varnai, T., Wen, G., and Cahalan, R. F.: Impact of 3-D radia-tive effects on satellite retrievals of cloud droplet sizes, J. Geophys. Res., 111, DO9207,5
doi:10.1029/2005JD006686, 2006.Martins, J. V., Tanre, D., Remer, L. A., Kaufman, Y. J., Mattoo, S., and Levy, R.: MODIS cloud
screening for remote sensing of aerosol over oceans using spatial variability, Geophys. Res.Lett., 29(12), 8009, doi:10.1029/2001GL01352, 2002.
Matsui, T., Masunaga, H., Kreidenweis, S. M., Pielke Sr., R. A., Tao, W.-K., Chin, M., and10
Kaufman, Y. J.: Satellite-based assessment of marine low cloud variability associatedwith aerosol, atmospheric stability, and the diurnal cycle, J. Geophys. Res., 111, D17204,doi:10.1029/2005JD006097, 2006.
Mauger, G. S. and Norris, J. R.: Meteorological bias in satellite estimates of aerosol-cloudrelationships, Geophys. Res. Lett., 34, L16824, doi:10.1029/2007GL029952, 2007.15
Meskhidze, N., Remer, L. A., Platnick, S., Negron Juarez, R., Lichtenberger, A. M., and Aiyyer,A. R.: Exploring the differences in cloud properties observed by the Terra and Aqua MODISSensors, Atmos. Chem. Phys., 9, 3461–3475, 2009,http://www.atmos-chem-phys.net/9/3461/2009/.
Nakajima, T., Higurashi, A., Kawamoto, K., and Penner, J. E.: A possible correlation be-20
tween satellite-derived cloud and aerosol microphysical parameters, Geophys. Res. Lett.,28, 1171–1174, 2001.
Parrish, D. and Derber, J.: The national meteorological center’s spectral statistical interpolationanalysis system, Mon. Weather Rev., 120, 1747–1763, 1992.
Platnick, S., King, M. D., Ackerman, S. A., Menzel, W. P., Baum, B. A., Riedi, J. C., and25
Frey, R. A.: The MODIS cloud products: algorithms and examples from Terra, IEEE T.Geosci. Remote, 41(2), 459–473, 2003.
Quaas, J., Ming, Y., Menon, S., Takemura, T., Wang, M., Penner, J. E., Gettelman, A., Lohmann,U., Bellouin, N., Boucher, O., Sayer, A. M., Thomas, G. E., McComiskey, A., Feingold, G.,Hoose, C., Kristjansson, J. E., Liu, X., Balkanski, Y., Donner, L. J., Ginoux, P. A., Stier, P.,30
Grandey, B., Feichter, J., Sednev, I., Bauer, S. E., Koch, D., Grainger, R. G., Kirkevag, A.,Iversen, T., Seland, Ø., Easter, R., Ghan, S. J., Rasch, P. J., Morrison, H., Lamarque, J.-F., Iacono, M. J., Kinne, S., and Schulz, M.: Aerosol indirect effects - general circulation
3924

ACPD10, 3893–3936, 2010
The invigoration ofdeep convectiveclouds over the
Atlantic
I. Koren et al.
Title Page
Abstract Introduction
Conclusions References
Tables Figures
J I
J I
Back Close
Full Screen / Esc
Printer-friendly Version
Interactive Discussion
model intercomparison and evaluation with satellite data, Atmos. Chem. Phys., 9, 8697–8717, 2009,http://www.atmos-chem-phys.net/9/8697/2009/.
Ramanathan, V., Crutzen, P. J., Kiehl, J. T., and Rosenfeld, D.: Aerosols, climate, and thehydrological cycle, Science, 294, 2119–2123, 2001.5
Remer, L. A., Kaufman, Y. J., Tanre, D., Mattoo, S., Chu, D. A., Martins, J. V., Li, R.-R.,Ichoku, C., Levy, R. C., Kleidman, R. G., Eck, T. F., Vermote, E., and Holben, B. N.: TheMODIS aerosol algorithm, products and validation, J. Atmos. Sci., 62, 947–973, 2005.
Rosenfeld, D.: TRMM observed first direct evidence of smoke from forest fires inhibiting rainfall,Geophys. Res. Lett., 26, 3105–3108, 1999.10
Rosenfeld, D. and Woodley, W. L.: Deep convective clouds withs sustaine highly supercooledliquid water until −37.5 ◦C, Nature, 405, 440–442, 2000.
Savtchenko, A.: Deep convection and upper-tropospheric humidity: a look from the A-train,Geophys. Res. Lett., 36, L06814, doi:10.1029/2009GL037508, 2009.
Schervish, M. J.: P values: what they are and what they are not, Am. Stat., 50, 203–206, 1996.15
Schubert, S. D., Rood, R. B., and Pfaendtner, J.: An assimilated dataset for earth scienceapplications, B. Am. Meteorol. Soc., 74, 2331–2342, 1993.
Schwartz, S., Harshvardhan, E., and Benkovitz, C. M.: Influence of anthropogenic aerosol oncloud optical properties and albedo shown by satellite measurements and chemical transportmodeling, P. Natl. Acad. Sci. USA, 99, 1784–1789, 2002.20
Seifert, A., Khain, A., Pokrovsky, A., and Beheng, K.: A comparison of spectral bin and two-moment bulk mixed-phase microphysics, Atmos. Res., 80, 44–66, 2006.
Stevens, B. and Feingold, G.: Untangling aerosol effects on clouds and precipitation ina buffered system, Nature, 461, 607–613, doi:10.1038/nature08281, 2009.
Stevens, B. and Brenguier, J.-L.: Cloud controlling factors – low clouds, in: Perturbed Clouds25
in the Climate System, edited by: Heintzenberg, J. and Charlson, R. J., Proceedings ErnstStrungmann Forum, MIT press, Cambridge, ISBN 978-0-262-01287-4, 576, 2009.
Tackett, J. L. and Di Girolamo, L.: Enhanced aerosol backscatter adjacent to tropicaltrade wind clouds revealed by satellite-based lidar, Geophys. Res. Lett., 36, L14804,doi:10.1029/2009GL039264, 2009.30
Tanre, D., Herman, M., and Kaufman, Y.: Information on the aerosol size distribution containedin the solar reflected spectral radiances, J. Geophys. Res., 101, 19043–19060, 1996.
3925

ACPD10, 3893–3936, 2010
The invigoration ofdeep convectiveclouds over the
Atlantic
I. Koren et al.
Title Page
Abstract Introduction
Conclusions References
Tables Figures
J I
J I
Back Close
Full Screen / Esc
Printer-friendly Version
Interactive Discussion
Tanre, D., Kaufman, Y. J., Herman, M., and Mattoo, S.: Remote sensing of aerosol proper-ties over oceans using the MODIS/EOS spectral radiances, J. Geophys. Res., 102, 16971–16988, 1997.
Tao, W.-K., Li, X., Khain, A., Matsui, T., Lang, S., and Simpson, J.: Role of atmospheric aerosolconcentration on deep convective precipitation: cloud-resolving model simulations, J. Geo-5
phys. Res., 112, D24S18, doi:10.1029/2007JD008728, 2007.Teller, A. and Levin, Z.: The effects of aerosols on precipitation and dimensions of subtropical
clouds: a sensitivity study using a numerical cloud model, Atmos. Chem. Phys., 6, 67–80,2006,http://www.atmos-chem-phys.net/6/67/2006/.10
Tian, B., Waliser, D. E., Kahn, R. A., Li, Q., Yung, Y. L., Tyranowski, T., Geogdzhayev, I. V.,Mishchenko, M. I., Torres, O., and Smirnov, A.: Does the Madden-Julian Oscillation influenceaerosol variability?, J. Geophys. Res., 113, D12215, doi:10.1029/2007JD009372, 2008.
Twohy, C. H., Coakley Jr., J. A., and Tahnk, W. R.: Effect of changes in relative humidity onaerosol scattering near clouds, J. Geophys. Res., 114, D05205, doi:10.1029/2008JD010991,15
2009.Twomey, S. A.: The influence of pollution on the shortwave albedo of clouds, J. Atmos. Sci., 34,
1149–1152, 1977.van den Heever, S. C. and Cotton, W. R.: Urban aerosol impacts on downwind convective
storms, J. Appl. Meteorol. Clim., 46, 828–850, 2007.20
Warner, J.: A reduction of rain associated with smoke from sugar-cane fires – an inadvertentweather modification, J. Appl. Meteorol., 7, 247–251, 1968.
Wen, G., Marshak, A., Cahalan, R. F., Remer, L. A., and Kleidman, R. G.: 3-D aerosol-cloudradiative interaction observed in collocated MODIS and ASTER images of cumulus cloudfields, J. Geophys. Res., 112, D13204, doi:10.1029/2006JD008267, 2007.25
Wetzel, M. A. and Stowe, L. L.: Satellite-observed patterns in stratus microphysics, aerosoloptical thickness, and shortwave radiative forcing, J. Geophys. Res., 104, 31287–31299,1999.
Wilks, D.: Statistical methods in the atmospheric sciences, Elsevier (Academic Press), NewYork, 133–137, 2005.30
Yang, Y. and Di Girolamo, L.: Impacts of 3-D radiative effects on satellite cloud detection andtheir consequences on cloud fraction and aerosol optical depth retrievals, J. Geophys. Res.,113, D04213, doi:10.1029/2007JD009095, 2008.
3926
ACPD10, 3893–3936, 2010
The invigoration ofdeep convectiveclouds over the
Atlantic
I. Koren et al.
Title Page
Abstract Introduction
Conclusions References
Tables Figures
J I
J I
Back Close
Full Screen / Esc
Printer-friendly Version
Interactive Discussion
Yu, H., Dickinson, R. E., Chin, M., Kaufman, Y. J., Zhou, M., Zhou, L., Tian, Y., Dubovik, O.,and Holben, B. N.: Direct radiative effect of aerosols as determined from a combina-tion of MODIS retrievals and GOCART simulations, J. Geophys. Res., 109, D03206,doi:10.1029/2003JD003914, 2004.
Zhang, J., Reid, J. S., and Holben, B. N.: An analysis of potential cloud artifacts in5
MODIS over ocean aerosol optical thickness products, Geophys. Res. Lett., 32, L15803,doi:10.1029/2005GL023254, 2005.
3927

ACPD10, 3893–3936, 2010
The invigoration ofdeep convectiveclouds over the
Atlantic
I. Koren et al.
Title Page
Abstract Introduction
Conclusions References
Tables Figures
J I
J I
Back Close
Full Screen / Esc
Printer-friendly Version
Interactive Discussion
Fig. 1. Example of the consequences of removing MODIS aerosol retrievals collocated withmore than 20% cloud fraction. Left – part of the 12 August 2007 MODIS visbile image over theAtlantic ITCZ. Center: the MODIS operational AOD retrieval for the scene. Right – the sameretrieval after eliminating all AOD retrievals collocated with higher than 20% cloud fraction.Note how AOD retrievals in the vicinity of any cloud are removed leaving only AOD in cloud-free islands.
3928
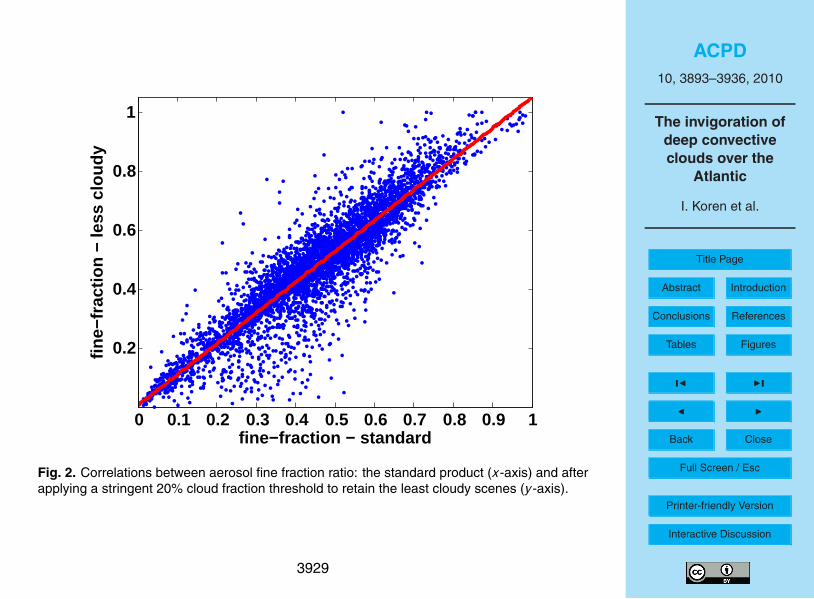
ACPD10, 3893–3936, 2010
The invigoration ofdeep convectiveclouds over the
Atlantic
I. Koren et al.
Title Page
Abstract Introduction
Conclusions References
Tables Figures
J I
J I
Back Close
Full Screen / Esc
Printer-friendly Version
Interactive Discussion
0 0.1 0.2 0.3 0.4 0.5 0.6 0.7 0.8 0.9 1
0.2
0.4
0.6
0.8
1
fine−fraction − standard
fine−
frac
tion
− le
ss c
loud
y
Fig. 2. Correlations between aerosol fine fraction ratio: the standard product (x-axis) and afterapplying a stringent 20% cloud fraction threshold to retain the least cloudy scenes (y-axis).
3929

ACPD10, 3893–3936, 2010
The invigoration ofdeep convectiveclouds over the
Atlantic
I. Koren et al.
Title Page
Abstract Introduction
Conclusions References
Tables Figures
J I
J I
Back Close
Full Screen / Esc
Printer-friendly Version
Interactive Discussion
Fig. 3. Distribution of cloud top heights over the study area constructed from 5-km retrievals.
3930

ACPD10, 3893–3936, 2010
The invigoration ofdeep convectiveclouds over the
Atlantic
I. Koren et al.
Title Page
Abstract Introduction
Conclusions References
Tables Figures
J I
J I
Back Close
Full Screen / Esc
Printer-friendly Version
Interactive Discussion
Fig. 4. Cloud properties vs. AOD for 3 AOD ranges: blue 0<AOD<0.15, red 0.15<AOD<0.35and black 0.35<AOD<1. Normalized by area histograms of (a) cloud top pressure for “all data”,(b) cloud fraction for “all data”, (c) as in (a) but for the data subjected to the 20% cloud fractionfilter (“all data filtered”) and (d) as in (b) but for the data subjected to the 20% cloud fraction filteronly (“all data filtered”). (e) the average cloud top pressure vs. the average AOD for all-data(cyan) and “all data filtered” (magenta). (f) average cloud fraction vs. the average AOD forall-data (cyan) and “all data filtered” (magenta). The vertical extent of the lines in (e) and (f)represents ± one standard error.
3931
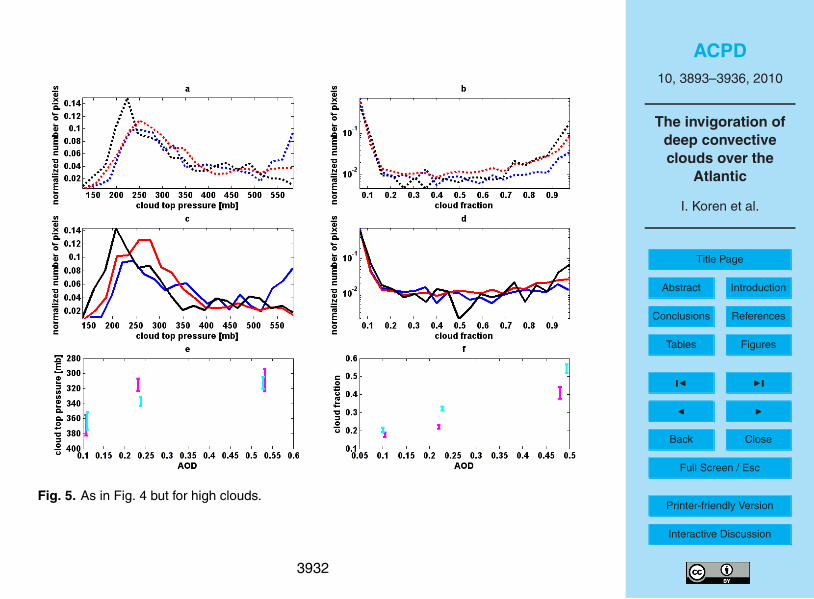
ACPD10, 3893–3936, 2010
The invigoration ofdeep convectiveclouds over the
Atlantic
I. Koren et al.
Title Page
Abstract Introduction
Conclusions References
Tables Figures
J I
J I
Back Close
Full Screen / Esc
Printer-friendly Version
Interactive Discussion
Fig. 5. As in Fig. 4 but for high clouds.
3932
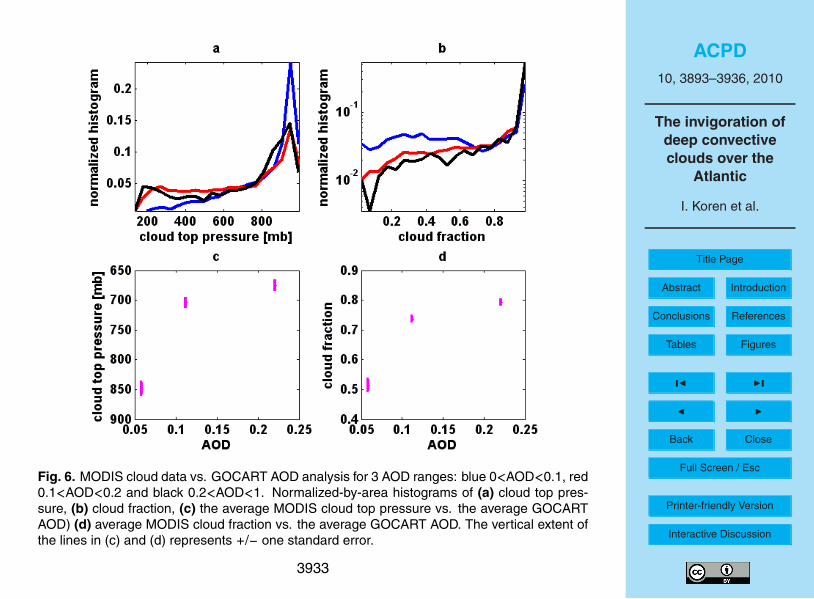
ACPD10, 3893–3936, 2010
The invigoration ofdeep convectiveclouds over the
Atlantic
I. Koren et al.
Title Page
Abstract Introduction
Conclusions References
Tables Figures
J I
J I
Back Close
Full Screen / Esc
Printer-friendly Version
Interactive Discussion
Fig. 6. MODIS cloud data vs. GOCART AOD analysis for 3 AOD ranges: blue 0<AOD<0.1, red0.1<AOD<0.2 and black 0.2<AOD<1. Normalized-by-area histograms of (a) cloud top pres-sure, (b) cloud fraction, (c) the average MODIS cloud top pressure vs. the average GOCARTAOD) (d) average MODIS cloud fraction vs. the average GOCART AOD. The vertical extent ofthe lines in (c) and (d) represents +/− one standard error.
3933

ACPD10, 3893–3936, 2010
The invigoration ofdeep convectiveclouds over the
Atlantic
I. Koren et al.
Title Page
Abstract Introduction
Conclusions References
Tables Figures
J I
J I
Back Close
Full Screen / Esc
Printer-friendly Version
Interactive Discussion
Fig. 7. Correlations between MODIS cloud top pressure and the GDAS assimilation outputs for4 model spatial resolutions: blue 1◦, red 2◦, black 4◦ and magenta 8◦. The zero correlation datapoints are the variables that did not pass the p-value<0.01 test.
3934
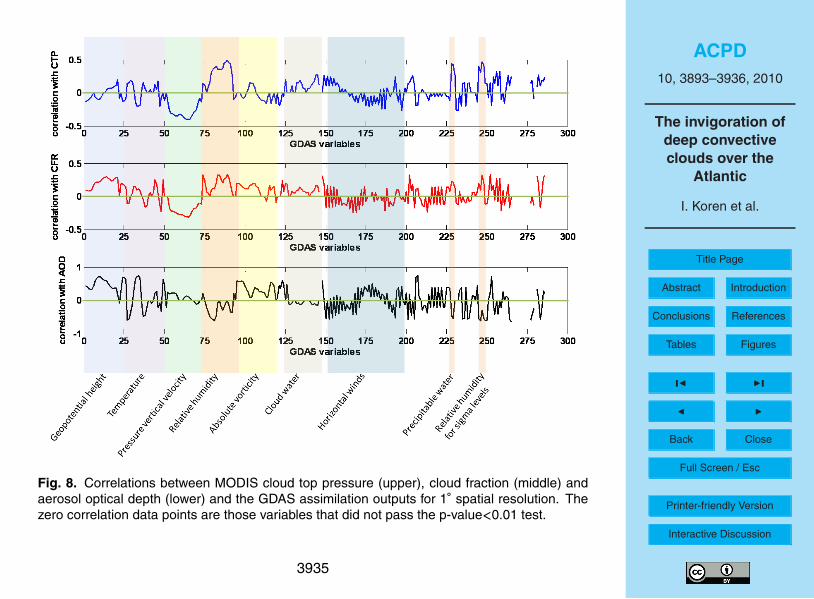
ACPD10, 3893–3936, 2010
The invigoration ofdeep convectiveclouds over the
Atlantic
I. Koren et al.
Title Page
Abstract Introduction
Conclusions References
Tables Figures
J I
J I
Back Close
Full Screen / Esc
Printer-friendly Version
Interactive Discussion
Fig. 8. Correlations between MODIS cloud top pressure (upper), cloud fraction (middle) andaerosol optical depth (lower) and the GDAS assimilation outputs for 1◦ spatial resolution. Thezero correlation data points are those variables that did not pass the p-value<0.01 test.
3935

ACPD10, 3893–3936, 2010
The invigoration ofdeep convectiveclouds over the
Atlantic
I. Koren et al.
Title Page
Abstract Introduction
Conclusions References
Tables Figures
J I
J I
Back Close
Full Screen / Esc
Printer-friendly Version
Interactive Discussion
Fig. 9. MODIS cloud properties plotted as a function of AOD restricted by ω (550 hPa) and RH(350 hPa). The ω subsets are all in [Pa/s] and divided as following: blue – all data, red ω<−0.1,black −0.1<ω<0 and magenta 0<ω. The RH subsets are: blue – all data, red 0%<RH<25%,black 25%<RH<55% and magenta 55%<RH. (a) CTP vs. AOD for ω subsets, (b) CFR vs. AODfor ω subsets, (c) CTP vs. AOD for RH subsets and (d) CFR vs. AOD for RH subsets. Notehow close to parallel the relationships are (more so for the CTP than for the CFR) suggestingthat the meteorology can be separated from aerosol effects. The offset of the lines (along they-axis) represents the meteorology effect while the slope is attributed to aerosols.
3936
Related Documents