Water and Environmental Engineering Department of Chemical Engineering Master esis 2019 Nathalie Roos e interplay between rapid gravity filter performance and its underdrain system - An assessment of an alternative filter underdrain design -

Welcome message from author
This document is posted to help you gain knowledge. Please leave a comment to let me know what you think about it! Share it to your friends and learn new things together.
Transcript

Water and Environmental EngineeringDepartment of Chemical EngineeringMaster Thesis 2019
Nathalie Roos
The interplay between rapid gravity filter performance and its underdrain system- An assessment of an alternative filter underdrain design -

Postal address Naturvetarvägen 14 +46 46-222 82 85SE-221 00 Lund, Sweden +46 46-222 00 00Web address Telefaxwww.vateknik.lth.se +46 46-222 45 26
The interplay between rapid gravity filter performance and its underdrain system
- An assessment of an alternative filter underdrain design -
by
Nathalie Roos
Master Thesis number: 2019-04
Water and Environmental EngineeringDepartment of Chemical Engineering
Lund University
June 2019
Supervisor: Senior Lecturer Michael CimbritzExaminer: Associate professor Åsa Davidsson
Picture on front page: Bubbles going upwards on a body of water. Photo by Jong Marshes on Unsplash

Preface
The author would like to direct a considerable thank you to everyone who has aided in the process of accomplishing this report. This assessment of an alternative filter underdrain design would not have been made possible without the information, advice and input of the many plant operators that have dedicated time and interest in this work to provide me with useful infor-mation and extensive data and who patiently have been answering my many questions and dis-pensed time from ordinary work hours to meet my requests. Although only four of the various treatment plants ended up being represented in this work, all input from all personnel at all plants has been much appreciated and most useful and I am very grateful for all the help and advice.
An extended thank you is being directed towards the personnel who invited me as a guest at their treatment plants and granted me the favor of having a tour as well as engaging in individual conversations. A further extended thank you is being directed towards Aqseptence Group em-ployees, who have supplied me with confidential information and applicable material specifi-cally devised to match this study, and to Elsevier Publications for permitting me to use figures originating in their publications.
Finally, this work would not have been completed without the assistance of my very competent and experienced supervisors whose inputs have been essential to the setup and readability of this report, or without the support and encouragement of friends and family. I would also like to direct many thanks to Malmberg Water AB who initiated this work and has allowed me the use of their resources to meet my aims and objectives and to accomplish this work.


Summary
The interplay between the performance of a rapid gravity filter and its underdrain system was to be assessed in order to evaluate the performance of an unconventional underdrain system that is installed in a number of water treatment plants in Sweden. The aim was to assess the influence of the underdrain system on the filtered water quality and the energy efficiency of the backwash process of the filter and use this information to evaluate the unconventional Triton Underdrain™ system. A thorough literature study showed that the design of the underdrain significantly affects the head loss in the filter, and thus also the energy efficiency, but that fil-tered water quality is most likely unaffected by the same. It was concluded that the Triton Un-derdrain™ system has a favorable design to decrease head loss and energy demand and that it provides an improved backwash efficiency due to its shape and screening technology. Data from various plants in Sweden operating their filters with the Triton Underdrain™ system was collected and evaluated and the results point to the suggestion that with proper operation of the backwash process, the underdrain system generates both water savings and energy savings. The matter should, however, be investigated further.

Sammanfattning
För att utvärdera en relativt ny typ av filterbottensystem som finns installerat i ett flertal vatten-verk i Sverige så gjordes en bedömning av samspelet mellan ett snabbfilters prestanda och dess filterbottensystem. Målet var att bedöma filterbottensystemets påverkan på kvaliteten av det filtrerade vattnet och på energikonsumtionen under backspolningsprocessen och att använda denna information för att utvärdera prestandan hos filterbottensystemet Triton. En utförlig lit-teraturstudie genomfördes som visade att utformningen av filterbottensystemet märkbart påver-kar tryckfallet i filtret, och därför också energikonsumtionen, men att utformningen inte i större grad påverkar kvaliteten av det filtrerade vattnet. Slutsatsen drogs att filterbottensystemet Tri-ton har en gynnsam utformning för att minska tryckfall i filtret, och därför också energiåt-gången, och att dess form och ytliga gallerdesign förbättrar backspolningsprocessen. Data från olika vattenverk i Sverige som använder sig av filterbottensystemet Triton samlades in för ut-värdering av filterbottens kapacitet och resultaten pekar på att med korrekta inställningar för backspolningsprocessen så verkar filterbottensystemet både vattensparande och energispa-rande.

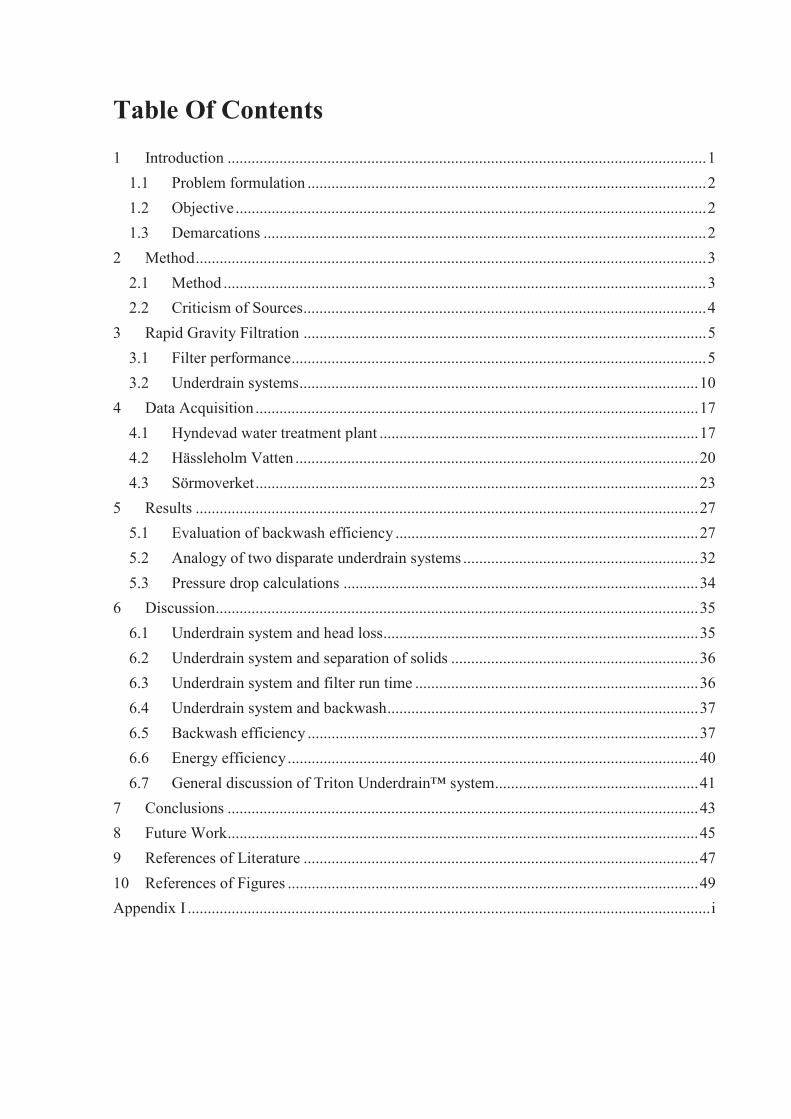
Table Of Contents
1 Introduction ........................................................................................................................1
1.1 Problem formulation ....................................................................................................2
1.2 Objective ......................................................................................................................2
1.3 Demarcations ...............................................................................................................2
2 Method................................................................................................................................3
2.1 Method .........................................................................................................................3
2.2 Criticism of Sources.....................................................................................................4
3 Rapid Gravity Filtration .....................................................................................................5
3.1 Filter performance........................................................................................................5
3.2 Underdrain systems....................................................................................................10
4 Data Acquisition ...............................................................................................................17
4.1 Hyndevad water treatment plant ................................................................................17
4.2 Hässleholm Vatten .....................................................................................................20
4.3 Sörmoverket...............................................................................................................23
5 Results ..............................................................................................................................27
5.1 Evaluation of backwash efficiency ............................................................................27
5.2 Analogy of two disparate underdrain systems ...........................................................32
5.3 Pressure drop calculations .........................................................................................34
6 Discussion.........................................................................................................................35
6.1 Underdrain system and head loss...............................................................................35
6.2 Underdrain system and separation of solids ..............................................................36
6.3 Underdrain system and filter run time .......................................................................36
6.4 Underdrain system and backwash..............................................................................37
6.5 Backwash efficiency ..................................................................................................37
6.6 Energy efficiency.......................................................................................................40
6.7 General discussion of Triton Underdrain™ system...................................................41
7 Conclusions ......................................................................................................................43
8 Future Work......................................................................................................................45
9 References of Literature ...................................................................................................47
10 References of Figures .......................................................................................................49
Appendix I ...................................................................................................................................i

Word list
Word(s) Explanation
Air scour The introduction of air to the backwash procedure
Backwash The process of cleaning the filter
Dead zones Zones that receive no backwash water flow
Filter media The media inside the filter, e.g. sand or granulatedactivated carbon
Filter run time The time between two backwash procedures
Header and lateral systemUnderdrain system consisting of a main pipe forcollection and distribution of water with multiplelaterals
Head loss The pressure drop over the filter and/or its auxiliaryelements, related to the energy demand of the filter
Rapid gravity filter Filter that utilizes gravity to let water pourthrough a granular media
Separation The removal of unwanted substances in the water
Streamline The path of a specific (water) particle in a certainflow
Turbidity The level of lucidity in filtered water
Underdrain systemSystem installed at the bottom of a filter,designed to collect filtered water and distributebackwash water

1
1 IntroductionEnergy consumption in drinking water production processes does not only affect the economic status of any treatment plant producing the water, it also has indirect environmental effects as most energy is still generated from fossil fuel, impacting our environment in a negative way. It is a general desire that new innovations and new technology will help improve the efficiency of treatment processes, energy efficiency included, and thus reduce the energy consumption and the costs of treatment and in the end reduce the demand of natural resources.
Water purification is generally conducted by means of filtration. The most common type of filters operated at water treatment plants today are the rapid sand filters (Davis 2011), which need to be cleaned regularly in order to maintain their function and efficiency. The cleaning, backwashing of the filters, is an energy demanding process affected by the design of the filter and its auxiliary elements such as the underdrain system.
It has been shown by Arbat et al. (2011) that 11% of the pressure drop in commercial microirrigation sand filters (pressure filters) is caused by the underdrain system, and by Bové et al.(2015) that the pressure drop is significantly affected by the design of the underdrain system.The bed construction of a pressure filter is similar to that in a rapid gravity filter (Ratnayaka et al. 2009) and thus it is reasonable to assume that the underdrain system and its design in a rapid gravity filter will have similar effects on the overall pressure drop.
Since energy demand is closely related to the pressure drop throughout the filtration process, it is feasible to investigate the potential possibility of energy saving by choosing the proper ele-ments for use in rapid gravity filters. Bové et al. (2015) point out that in terms of energy effi-ciency, improvement of the auxiliary elements in the filter is needed. The authors state that optimization of energy efficiency could be accomplished by reducing the energy required by the filter components. In a study carried out by Mesquita et al. (2012), it was shown that the internal auxiliary elements in the sand filter significantly affect the head loss and that the dif-ferent models may generate different removal efficiency for the same operational conditions. To improve irrigation performance, their study identifies the need to develop new procedures for design of the internal elements and it is the opinion of the author of this thesis that this reasoning might as well be applied to improve the performance of rapid gravity filters in water treatment plants.
A type of system that is asserted to show improved performance (Aqseptence Group 2017) as an underdrain system is the Triton Underdrain™, developed by Johnson Screens® and installed in a number of water treatment plants around Sweden and abroad. This system is alleged to,inter alia, increase filter capacity, elongate filter run time and improve backwash effectiveness (ibid.). In this work, the Triton Underdrain™ system will be used as reference object to discussthe relationship between underdrain design and filtration performance, and as a subject of in-vestigation to trace any potential differences in filter operation and backwash efficiency in wa-ter treatment plants in Sweden.

2
1.1 Problem formulationThe questions stated in this problem formulation have been chosen in relevance to what param-eters are usually the most observed in a water treatment plant, and to provide a basic foundation of information to plant operators who look to improve their rapid gravity filters and underdrain systems.
Does the filter underdrain design affect the performance of a rapid gravity porous media filter and its energy efficiency?
Is the alleged superior performance of the Triton Underdrain™ system, claimed by Aqseptence Group (2017), supported by the fundamental principles of rapid gravity filtration and back-wash?
Do rapid gravity filters that use the Triton Underdrain™ system show an improved performance when compared to typical values found in literature, such as:
- Head loss in underdrain system during filtration- Head loss in underdrain system during backwash- Ratio of water used for backwash to water being filtered- Filter run time
Do rapid gravity filters that use the Triton Underdrain™ system show an improved performance when compared to other underdrain designs?
1.2 ObjectiveThe intention of this study is to provide the groundwork and elemental ideas for continuous and more thorough studies on the effect that the filter underdrain system has on the filtration process in rapid gravity filters. The intention is to investigate the basic relationship between the perfor-mance of a rapid gravity porous media filter and its underdrain system. The dominant field of interest is the correlation between the design of the underdrain system and the filter performancein terms of head loss, separation efficiency and filter run time, with an additional interest in theperformance of the backwashing procedure.
The final purpose of this work is to evaluate the performance of the Triton Underdrain™ system and to assess the alleged advantages of its design and performance.
1.3 DemarcationsEvaluation of the Triton Underdrain™ system is performed with regards to only some of its alleged advantages mentioned in the product sheet. Due to large variability amongst the col-lected data, a thorough evaluation has not been practicable in this work and follow-up studies along the lines of what is suggested in chapter 8 are recommended.
All plants participating in this study run their backwash procedure on schedule and thus, the filter run time could not be evaluated with regard to any of the common parameters mentioned that typically initiate the backwash.
Out of 11 plants willing to participate in this study only 3 could supply adequate data that would generate actual results. The knowledge and input of operators of the other plants have been used as a guide to complete this work.

3
2 MethodThe method for implementation of this work is described below along with a subsequent section encompassing a critical review of the sources of literature used.
2.1 MethodThe first step to meet the objectives of this work was to carry out a thorough literature study on the subject of rapid gravity porous media filters and the factors that regulate their performance.This section was followed by a brief introduction to the various common underdrain systems used in water treatment plants along with an introduction to the Triton Underdrain™ system.With the immersed knowledge of the factors that influence the filtration performance an anal-ogy could be made between the design of the underdrain system and the filter performance,both for filtration and backwashing. The conclusions regarding the interplay between the un-derdrain system design and the filter head loss as well as the separation efficiency were used to evaluate the design and shape of the Triton Underdrain™ system.
The second step in meeting the objectives of this work was to collect data related to the Triton Underdrain™ system. The data was collected from various water treatment plants operating solely using the Triton™ system in their filters or using the Triton™ system in parallel with a conventional underdrain system. The plants supplied diverse data that required disparate han-dling to make them manageable and to make comparable in terms of monthly values of filtered water, water used for backwash and energy consumption.
The data was supplied in various resolutions and to make it manageable and comprehensible, the measurements were summarized and presented either as monthly averages or related to spe-cific filtration cycles. For each filter represented in this work, the data was processed and pre-sented as volume of filtered water, volume of water used for backwash and amount of energy consumed during backwash. Evaluation of the backwash efficiency was made by relating the energy consumption to the volumes of water filtered and used for backwash and by relating the volume of water used for backwash to the volume of water filtered.
The data acquired from plants operating using parallel underdrain systems was used to make a comparison of the efficiency of the backwash process of the disparate systems. Evaluation was carried out by analyzing and comparing the following:
- volume of water used for backwash- amount of energy utilized by the backwash pump in relation to backwash duration- amount of energy utilized by the backwash pump in relation to volume of water used
for backwash
The third step in this work was to use all the collected data from all plants to evaluate the performance of the Triton system. In this step, the real performance of the Triton Underdrain™ system was put in relation to the literature study previously made. In conformity with the ques-tions presented in the problem formulation, an extensive analysis and discussion of the results and their conformity and aberrations contra expected results was carried out.

4
2.2 Criticism of SourcesWater treatment including rapid gravity filtration is an aged technology that dates as far back as the 1920’s and thus, some of the original literature of the basic principles of filtration and filter design is very old. The behavior and operation of the conventional underdrain systems are common knowledge in the field and the information can be found in various sources of litera-ture. Newly developed underdrain systems, however, are essentially improved versions of the older systems and each manufacturer provides their own solution to the common problems ex-perienced. Most information about the new underdrain systems can thus only be found from each manufacturer’s own product sheets, leading to the conclusion that these sources of infor-mation must be reviewed extra critically as they are expected to be biased. The white paper written by Getting, Geibel and Eades is one such example, along with the product sheets sup-plied by De Nora and Johnson Screens.
The papers written on the subject of head loss in correlation to underdrain design and nozzle shape are primarily intended to aid in the field of micro irrigation and the tests were conducted in pressurized filters rather than in rapid gravity filters. However, as the basic principle of the two filters are the same, the results are deemed applicable in this study as well.
5
3 Rapid Gravity FiltrationIn the first part of this chapter, the basic principles of rapid gravity filtration will be introduced in analogy with some of the most common parameters measured to evaluate filter performance. The intention is to provide adequate information about the nature of rapid gravity filtration to further on present credible conclusions regarding its relationship to the filter underdrain system. The information presented will be used to evaluate the Triton Underdrain™ system.
In the second part of this chapter, a brief introduction to various common underdrain designs and their characteristics will be presented. The information will be used to evaluate the Triton Underdrain™ system in analogy to conventional underdrain designs.
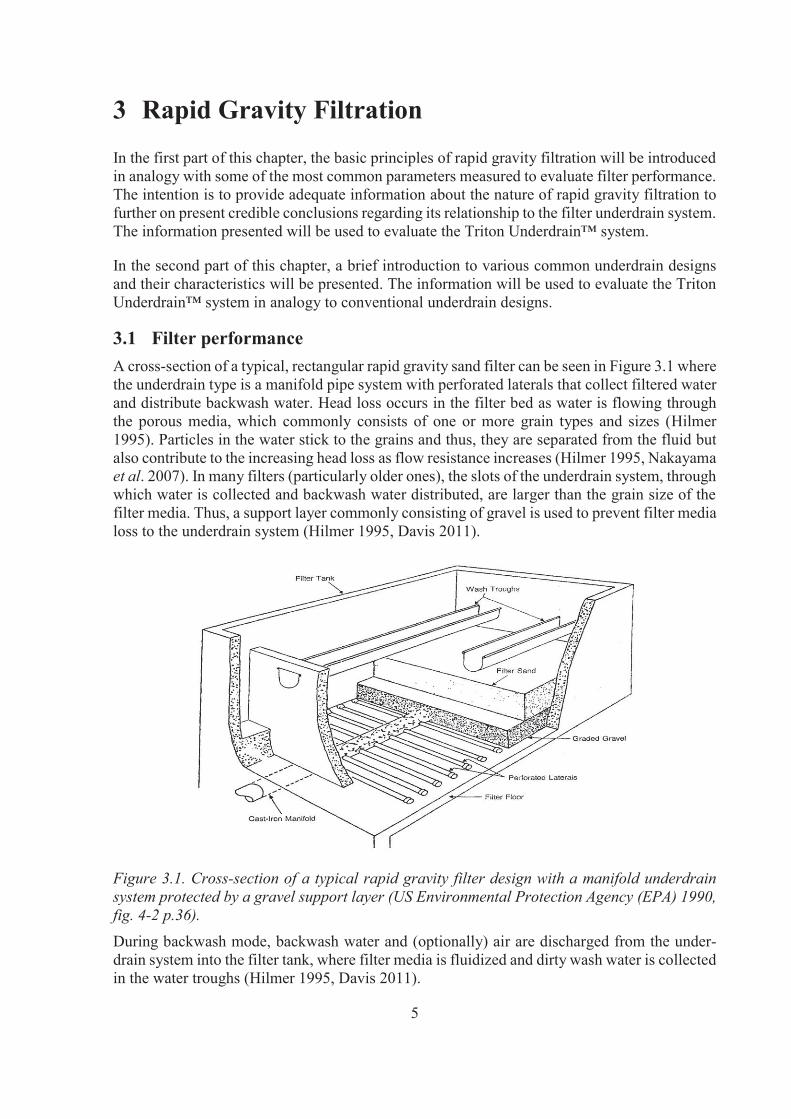
3.1 Filter performanceA cross-section of a typical, rectangular rapid gravity sand filter can be seen in Figure 3.1 where the underdrain type is a manifold pipe system with perforated laterals that collect filtered water and distribute backwash water. Head loss occurs in the filter bed as water is flowing through the porous media, which commonly consists of one or more grain types and sizes (Hilmer 1995). Particles in the water stick to the grains and thus, they are separated from the fluid butalso contribute to the increasing head loss as flow resistance increases (Hilmer 1995, Nakayamaet al. 2007). In many filters (particularly older ones), the slots of the underdrain system, through which water is collected and backwash water distributed, are larger than the grain size of the filter media. Thus, a support layer commonly consisting of gravel is used to prevent filter media loss to the underdrain system (Hilmer 1995, Davis 2011).
Figure 3.1. Cross-section of a typical rapid gravity filter design with a manifold underdrain system protected by a gravel support layer (US Environmental Protection Agency (EPA) 1990, fig. 4-2 p.36).
During backwash mode, backwash water and (optionally) air are discharged from the under-drain system into the filter tank, where filter media is fluidized and dirty wash water is collected in the water troughs (Hilmer 1995, Davis 2011).

6
The two main phases of a filtration cycle are the filtration phase itself, where water quality is improved by reduction of contaminants in the fluid, and the backwash phase where the filter media is cleaned off of accumulated particles (Hilmer 1995). The filtration process is normally regulated by one or more out of three conditions that determine when backwash should be ini-tiated (Hilmer 1995, Davis 2011):
- Amount of suspended solids in outgoing filtered water- Total head loss across the filter- Filter run time
Filter performance is generally evaluated by considering filtered water turbidity, filter run time and the ratio of volume of backwash water to the volume of filtered water (Davis 2011).
3.1.1 Head lossFrom the previous section we know that head loss is commonly one of the main regulators of the filtration process. The head loss results partly from the basic principle described by Ber-noulli’s equation, but is also due to head loss in the filter media as water flows through the pores as well as in the various elements of the filter such as the inlet and outlet pipe and the underdrain system (Davis 2011). The head loss in the filter media is highly dependent on the grain size of the media (Hilmer 1995), but also on the separation process throughout the media depth as particles in the water over time will stick to the surface of the filter media grains, affecting their size and thus also their separation ability (Hilmer 1995, Nakayama et al. 2007).
Head losses caused by the filter components (media and auxiliary elements) are relatively con-stant, whereas the most prominent variation in head loss is due to, and determined by, the ac-cumulation of separated particles in the filter media bed (Hilmer 1995). Thus, if intending to decrease head loss in rapid gravity porous media filters independent of incoming water qualityand filter media, it is the auxiliary elements that need to be modified, such as the underdrain system.
In a study carried out by Mesquita et al. (2012), it was shown that head loss in sand filters are significantly affected by parameters such as particle size, media bed depth, filtration velocity and the interaction between these, but Bové et al. (2015) also stresses that it is the auxiliaryelements of the filter (i.e. the underdrain system) that cause large part of the head loss. They suggest that this head loss could be reduced without reducing the effectiveness of the filtration process. However, Getting et al. (2001) argue that in order to prevent malfunction of the back-wash process, the head loss in the underdrain should be greater than that of the media at the design backwash flow, or uneven distribution will be accentuated.
In an analysis made with a computational fluid dynamics (CFD) software program, six filter models of various complexities were investigated regarding the hydraulic behaviour of their internal elements and their influence on the total head loss throughout the filter (Arbat et al.2011). It was shown that more than 15% of the head loss was caused by elements other than the filter media, whereof 11 percentage points were attributed to the underdrain system. The study was carried out by analysis of pressurized sand filters, but the general conclusions regarding the underdrains’ importance in contributing to the total head loss could as well be applied to rapid gravity filters as the fundamental functions of the two types are the same. Backwashing of pressurized filters is performed in the same manner as for rapid gravity filters (Hilmer 1995). It should also be noted that due to lack of precise equations and knowledge of the interaction between elements in the filter, the analytical head losses calculated by Arbat et al. (2011)
7
diverge from real filter behaviour. However, the results still demonstrate a noticeable head lossdue to auxiliary elements in the filtration process, which could be reduced by means of design.
Mesquita et al. (2012) strengthened the result of the work of Arbat et al. in an article where they concluded that “the different internal auxiliary elements significantly affected head loss”. Furthermore, the authors conclude that for identical operation conditions, different removal ef-ficiencies could be accomplished depending on the model of the internal auxiliary elements.
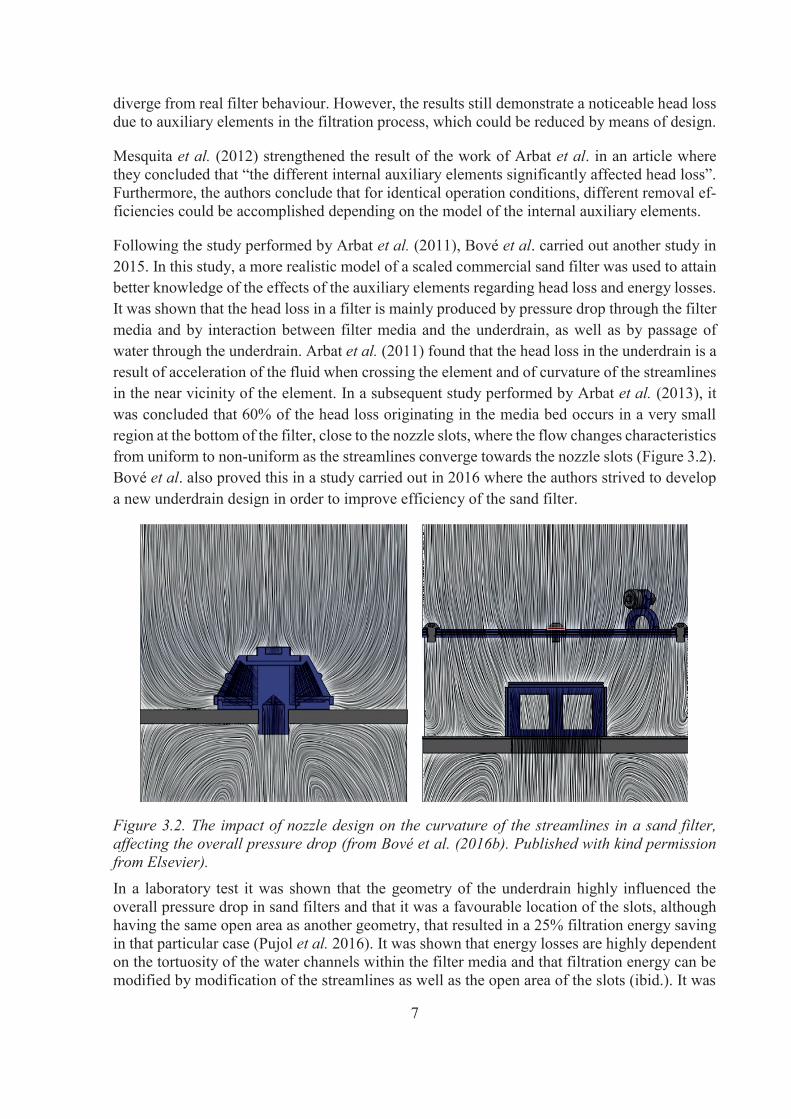
Following the study performed by Arbat et al. (2011), Bové et al. carried out another study in 2015. In this study, a more realistic model of a scaled commercial sand filter was used to attain better knowledge of the effects of the auxiliary elements regarding head loss and energy losses. It was shown that the head loss in a filter is mainly produced by pressure drop through the filter media and by interaction between filter media and the underdrain, as well as by passage of water through the underdrain. Arbat et al. (2011) found that the head loss in the underdrain is a result of acceleration of the fluid when crossing the element and of curvature of the streamlines in the near vicinity of the element. In a subsequent study performed by Arbat et al. (2013), it was concluded that 60% of the head loss originating in the media bed occurs in a very small region at the bottom of the filter, close to the nozzle slots, where the flow changes characteristics from uniform to non-uniform as the streamlines converge towards the nozzle slots (Figure 3.2).Bové et al. also proved this in a study carried out in 2016 where the authors strived to develop a new underdrain design in order to improve efficiency of the sand filter.
Figure 3.2. The impact of nozzle design on the curvature of the streamlines in a sand filter, affecting the overall pressure drop (from Bové et al. (2016b). Published with kind permission from Elsevier).
In a laboratory test it was shown that the geometry of the underdrain highly influenced the overall pressure drop in sand filters and that it was a favourable location of the slots, although having the same open area as another geometry, that resulted in a 25% filtration energy saving in that particular case (Pujol et al. 2016). It was shown that energy losses are highly dependent on the tortuosity of the water channels within the filter media and that filtration energy can be modified by modification of the streamlines as well as the open area of the slots (ibid.). It was
8
suggested that an affordable way of optimizing the energy efficiency of filter systems is to substitute underdrain components with optimised designs.
Arbat et al. (2011) implies that the relationship between the total passing area through the un-derdrain system is an important design parameter when aiming to reduce the total head loss through the filter. It is suggested by Bové et al. (2015) that increasing the section at the nozzle outlet, thus reducing the velocity of the flow, could reduce the head loss. In their study, this suggestion was proven to be correct when running filtration simulations of the two cases. In addition, it is also suggested that the introduction of a larger size material around the underdrain will reduce the head loss.
According to Davis (2011), the head loss during filtration and backwashing is in the order of 0.1 to 0.3 meters of modern underdrains whereas the head loss for pipe and lateral systems during backwash could be as high as 0.6 meters.
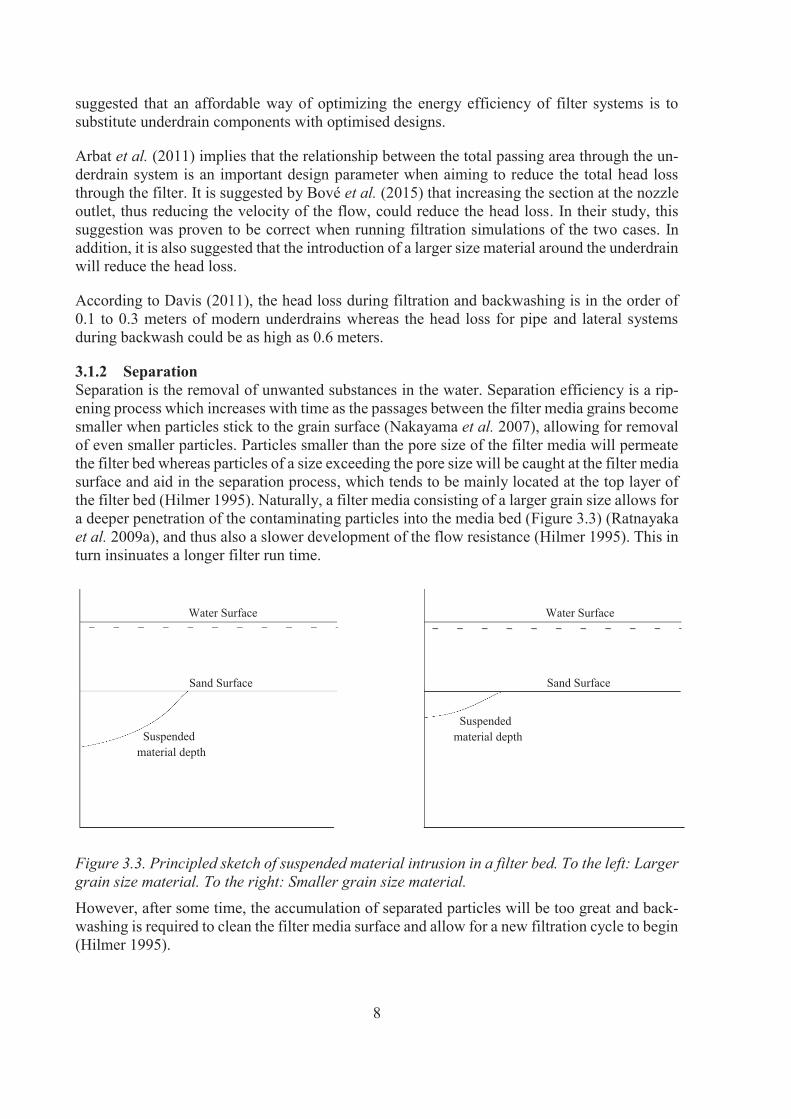
3.1.2 SeparationSeparation is the removal of unwanted substances in the water. Separation efficiency is a rip-ening process which increases with time as the passages between the filter media grains become smaller when particles stick to the grain surface (Nakayama et al. 2007), allowing for removal of even smaller particles. Particles smaller than the pore size of the filter media will permeate the filter bed whereas particles of a size exceeding the pore size will be caught at the filter mediasurface and aid in the separation process, which tends to be mainly located at the top layer of the filter bed (Hilmer 1995). Naturally, a filter media consisting of a larger grain size allows for a deeper penetration of the contaminating particles into the media bed (Figure 3.3) (Ratnayakaet al. 2009a), and thus also a slower development of the flow resistance (Hilmer 1995). This in turn insinuates a longer filter run time.
Figure 3.3. Principled sketch of suspended material intrusion in a filter bed. To the left: Larger grain size material. To the right: Smaller grain size material.
However, after some time, the accumulation of separated particles will be too great and back-washing is required to clean the filter media surface and allow for a new filtration cycle to begin (Hilmer 1995).
Sand Surface Sand Surface
Suspendedmaterial depth
Suspendedmaterial depth
9
Turbidity is a parameter related to separation processes, and one that is commonly measured in water treatment plants. It is a parameter that aids in determining the hygienic state of the wateras it measures the presence of suspended material in the water (i.e. bacteria that can cause wa-terborne diseases) (Davis 2011, World Health Organization (WHO) 2017). For drinking water quality, the turbidity level of water treated in a granular high-rate filtration process should not exceed 0.3 NTU in 95% of monthly measures, and never exceed a value of 1.0 (WHO 2017). The average value of turbidity should be 0.2 or less (ibid.). By measuring the turbidity level, backwashing can be initiated when the levels become too high.
3.1.3 Filter run timeThe filter run time is the time between two backwashing events occurring (Hilmer 1995). Sav-ings on backwash water and energy may be done by choosing long filtration runs, but the same will encourage bacterial growth in the filter bed (Ratnayaka et al. 2009a).
The generally desired filter run time is approximately 24-60 hours (Hilmer 1995, Ratnayaka et al. 2009a) but can be as long as 96 hours when treating water by coagulation and flocculation (Davis 2011).
Operation of a filter with high initial head loss will produce shorter filtration periods and fre-quent backwash procedures (Mesquita et al. 2012).
3.1.4 BackwashCleanliness of the filter media along with the cost of power and the volume of water that is required to perform a backwash procedure are generally the parameters that determine the ef-fectiveness of backwash operations (Getting et al. 2001). For a rapid gravity porous media filter to be effective and efficient at all loading conditions, effective cleaning of the filter media is of essence (Nakayama et al. 2007, De Nora 2015).
The flow velocity of backwash water must be sufficient to cause the grain material to separate and form individual particles, which can be cleaned from accumulated dirt by rubbing against each other (Hilmer 1995, Nakayama et al. 2007). This process is termed fluidization of the media bed and requires the filter bed to expand by 10 to 50 percent. The required flow rate to fluidize the bed depends on grain size and water temperature (Hilmer 1995, Davis 2011), but usually ranges from 40 to 60 m/h. The flow rate during backwash is increased until the filter bed expands and the flow is continued until the wash water is reasonably clear (Davis 2011). The backwash rate should be determined so that the 90th percentile largest diameter particles are fluidized, or by the overflow rate that determines whether the smallest/lightest particle is retained in the filter or washed out through the backwash trough (ibid.).
The volume of water typically used for backwashing is in the order of 2 to 3 percent of the total flow in the treatment plant (Ratnayaka et al. 2009a, Davis 2011) and could range from 1 to 5 percent of the total daily production (Hilmer 1995, Davis 2011). Ratnayaka et al. (2009a) sug-gest that the total backwash water consumption is equal to approximately 2.5 bed volumes if backwash is performed using an air scour. They also state that the amount of water used for backwash is an important factor in the economical status of the treatment plant. Increases in backwash water to filtered water ratio may imply difficulty in cleaning the filter, which may occur for example if the distribution of backwash water is malfunctioning (Davis 2011).
To prolong the performance of the filter and extend its life span, uniform water distribution is the key (Getting et al. 2001). When backwash water is unevenly distributed to the filter, dirt

10
and particles may accumulate in the voids between the grains in the dead zones (zones that receive no backwash flow) and will thus cause the filter to malfunction as it will result in an uneven flow both during filtration mode and backwash mode.
Backwashing may be conducted as water only backwash or combined water and air backwash,a so called air scour. Introducing air in the backwash process aids in the agitation of the filter media and results in more effectively loosening the dirt from the media surface. Air alone is introduced to the filter bed in the first step, followed by a simultaneous flow of air and increas-ing water flow rate to expand and fluidize the bed (Getting et al. 2001, Ratnayaka et al. 2009a). When using an air scour, the backwash flow rate must be adjustable to a lower rate to be used simultaneously as the air scour (Davis 2011). According to Hilmer (1995), the backwash rate could be reduced to circa 20 m/h compared to the 40-60 m/h required when not using additional air scour. Getting et al. (2001) claim that several studies show that this backwashing method provides cleaner media as well as consuming less backwash water. Savings on the operational costs could be done by introducing air to the backwash process as this significantly reduces the volume of backwash water (De Nora 2015).
Davis (2011) argues that backwash without air scour will not provide sufficient cleaning of the filter bed and Ratnayaka et al. (2009a) implies that deep filter beds rely on the simultaneous air scour and water wash followed by a water rinse to prevent hydraulic grading in the filter and maintain its homogeneity.
3.1.5 Energy consumptionTo treat water in a rapid gravity filter, energy is required. When water flows through a porous media there is an energy loss, a head loss, that can be calculated by various models and equa-tions (Davis 2011) and to transfer water from one level to another there is a need to overcome the disparity in potential energy, commonly by using a pump. Reducing the head losses in a filtration process and a backwash process thus results in reduction of the energy required to perform both processes.
3.2 Underdrain systemsThe main purposes of the underdrain system are to support the filter medium in the basin, to collect filtered water and to distribute backwash air and water (Shepherd 2007, Davis 2011).Getting et al. (2001) argue that the filtration process is one of the fundamental steps when pro-ducing drinking water, and many manufacturers of underdrain systems agree that the filter un-derdrain along with the filter medium support have a significant role in contributing to the over-all filter performance (Getting et al. 2001, Shepherd 2007, De Nora 2015). Shepherd furthersuggests that the filter performance, in terms of filtering and backwashing, is highly dependent on the underdrain design and the support it generates. Davis (2011) stresses that the underdrain needs to be physically strong as well as easy to install and maintain and he argues that many problems in the filtration process could be avoided by careful selection of proven technology.
Getting et al. (2001) point out that one of the underdrain system’s most critical applications is during the backwash mode and this statement is supported by Shepherd (2007) who claims thatevenness of the distribution of backwash air and water is a key factor in the operation of a rapid gravity filter. When backwashing is not performed correctly, or backwash water is unevenly distributed, dirt and particles accumulate in the filter, causing deterioration in its performance.The efficiency of the filter stands in close relation to the effectiveness of the backwash cycle
11
(Shepherd 2007). Distribution of the backwash air and water occurs through the underdrain system, and thus, it is of great importance that the underdrain system is designed to generate an even distribution of backwash air and water.
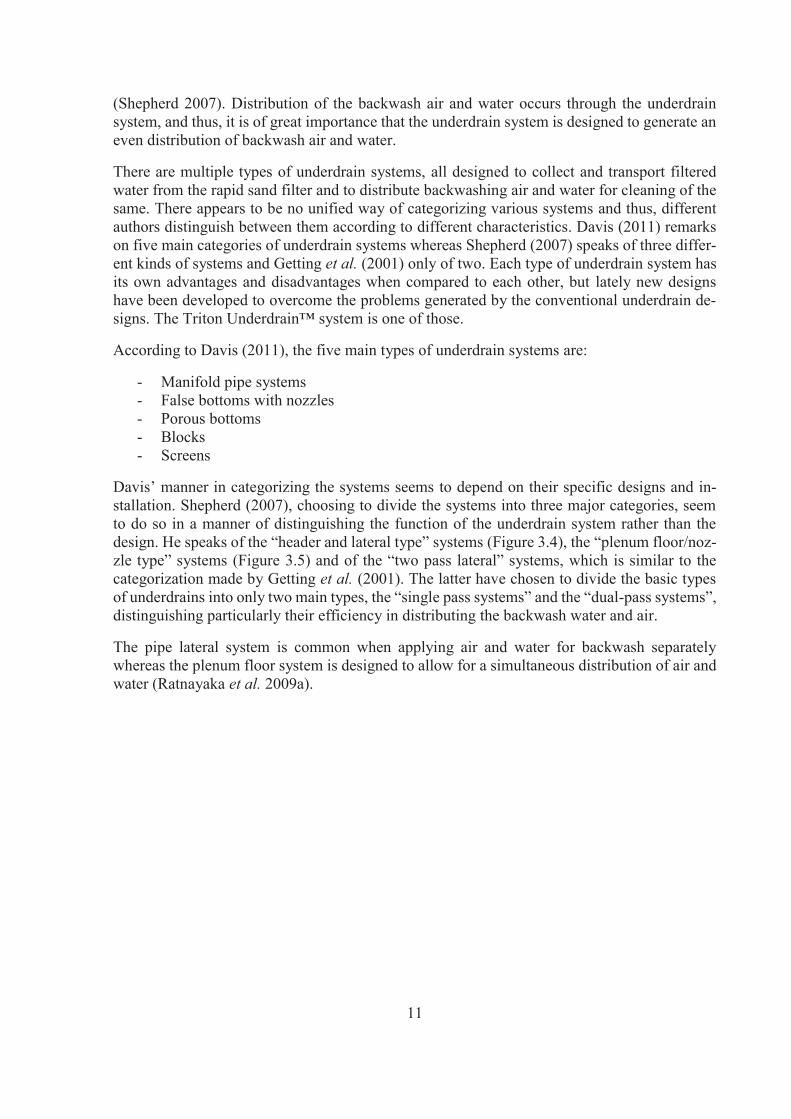
There are multiple types of underdrain systems, all designed to collect and transport filtered water from the rapid sand filter and to distribute backwashing air and water for cleaning of the same. There appears to be no unified way of categorizing various systems and thus, different authors distinguish between them according to different characteristics. Davis (2011) remarks on five main categories of underdrain systems whereas Shepherd (2007) speaks of three differ-ent kinds of systems and Getting et al. (2001) only of two. Each type of underdrain system has its own advantages and disadvantages when compared to each other, but lately new designs have been developed to overcome the problems generated by the conventional underdrain de-signs. The Triton Underdrain™ system is one of those.
According to Davis (2011), the five main types of underdrain systems are:
- Manifold pipe systems- False bottoms with nozzles- Porous bottoms- Blocks- Screens
Davis’ manner in categorizing the systems seems to depend on their specific designs and in-stallation. Shepherd (2007), choosing to divide the systems into three major categories, seem to do so in a manner of distinguishing the function of the underdrain system rather than the design. He speaks of the “header and lateral type” systems (Figure 3.4), the “plenum floor/noz-zle type” systems (Figure 3.5) and of the “two pass lateral” systems, which is similar to the categorization made by Getting et al. (2001). The latter have chosen to divide the basic types of underdrains into only two main types, the “single pass systems” and the “dual-pass systems”,distinguishing particularly their efficiency in distributing the backwash water and air.
The pipe lateral system is common when applying air and water for backwash separately whereas the plenum floor system is designed to allow for a simultaneous distribution of air and water (Ratnayaka et al. 2009a).

12
Figure 3.4. Cross-section of a typical pipe lateral underdrain system (From Ratnayaka et al. (2009b). Published with kind permission from Elsevier).
Figure 3.5. Cross-section of a typical plenum floor with nozzles underdrain system (From Ratnayaka et al. (2009b). Published with kind permission from Elsevier).

13
The header and lateral systems as well as the plenum floor/nozzle type systems are both types of single pass systems, meaning they utilize only a single passage in order to distribute back-wash water (Figure 3.6) whereas a dual-pass system utilizes two passages in order to even out the head losses across the system (Figure 3.7).
Figure 3.6. Principled sketch of flow distribution in a single pass underdrain system, utilizing only one lateral for distribution of backwash water.
Figure 3.7. Principled sketch of flow distribution in a dual pass underdrain system, utilizing two laterals to compensate the uneven distribution of backwash water in a single lateral.Blocks are made with orifices of a determined diameter on its upper surface. In some block systems using polyethylene, air scour may be used for backwashing but otherwise not (Davis 2011). Screens are designed to be used without support gravel and air scour may not be used with this system (ibid.). Porous bottoms are created from plates of aluminum oxide, which has very small pore size and therefore high separation ability. However, porous bottoms are sensi-tive to plugging and should not be used where softening or iron/manganese removal is con-ducted (ibid.).
3.2.1 Header and lateral design (single pass system)The flow in a single pass system is dependent on a single series of orifices discharging the backwash water as shown in Figure 3.6 (Getting et al. 2001). One of the main obstacles en-countered when using this system is the uneven flow distribution of backwash water that occurs because pressure in the main conveyor is highest at its end, resulting in a greater flow of water in the laterals here (Shepherd 2007). To maintain an even flow distribution, the solution is to keep lateral lengths at a minimum, less than ten feet (Getting et al. 2001). Most often, the header
14
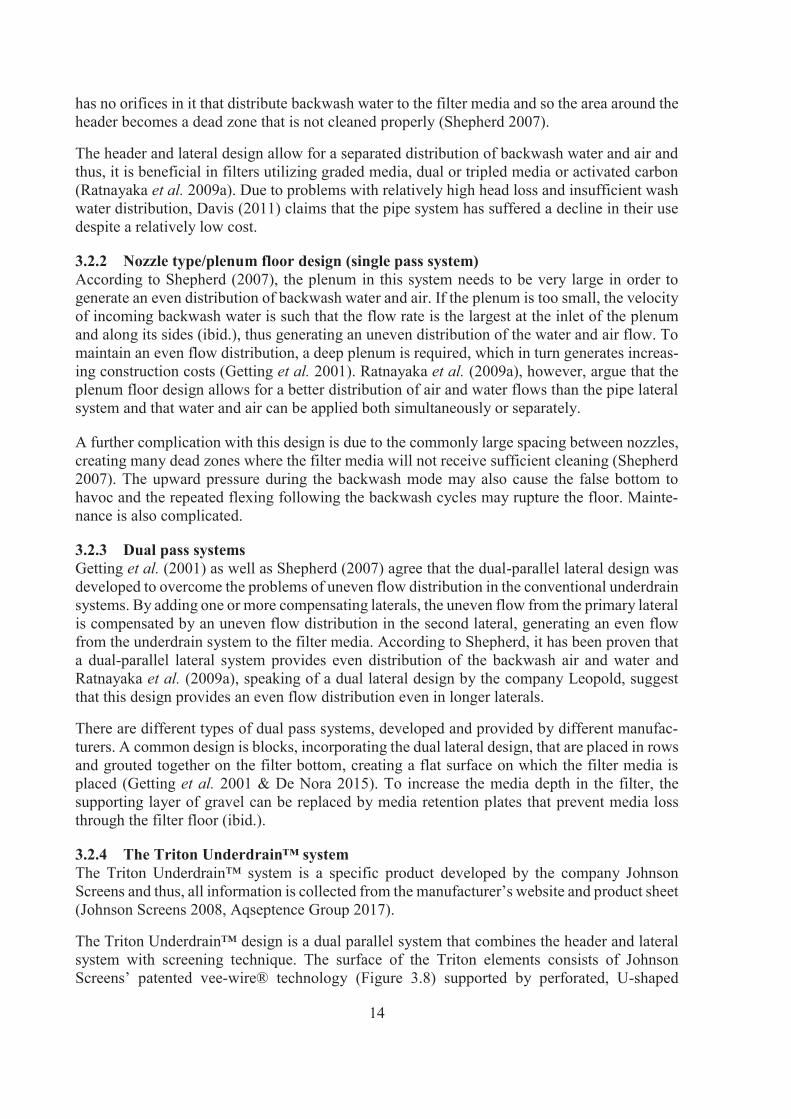
has no orifices in it that distribute backwash water to the filter media and so the area around the header becomes a dead zone that is not cleaned properly (Shepherd 2007).
The header and lateral design allow for a separated distribution of backwash water and air and thus, it is beneficial in filters utilizing graded media, dual or tripled media or activated carbon (Ratnayaka et al. 2009a). Due to problems with relatively high head loss and insufficient wash water distribution, Davis (2011) claims that the pipe system has suffered a decline in their use despite a relatively low cost.
3.2.2 Nozzle type/plenum floor design (single pass system)According to Shepherd (2007), the plenum in this system needs to be very large in order to generate an even distribution of backwash water and air. If the plenum is too small, the velocity of incoming backwash water is such that the flow rate is the largest at the inlet of the plenum and along its sides (ibid.), thus generating an uneven distribution of the water and air flow. Tomaintain an even flow distribution, a deep plenum is required, which in turn generates increas-ing construction costs (Getting et al. 2001). Ratnayaka et al. (2009a), however, argue that the plenum floor design allows for a better distribution of air and water flows than the pipe lateral system and that water and air can be applied both simultaneously or separately.
A further complication with this design is due to the commonly large spacing between nozzles, creating many dead zones where the filter media will not receive sufficient cleaning (Shepherd 2007). The upward pressure during the backwash mode may also cause the false bottom to havoc and the repeated flexing following the backwash cycles may rupture the floor. Mainte-nance is also complicated.
3.2.3 Dual pass systemsGetting et al. (2001) as well as Shepherd (2007) agree that the dual-parallel lateral design was developed to overcome the problems of uneven flow distribution in the conventional underdrain systems. By adding one or more compensating laterals, the uneven flow from the primary lateral is compensated by an uneven flow distribution in the second lateral, generating an even flow from the underdrain system to the filter media. According to Shepherd, it has been proven thata dual-parallel lateral system provides even distribution of the backwash air and water and Ratnayaka et al. (2009a), speaking of a dual lateral design by the company Leopold, suggest that this design provides an even flow distribution even in longer laterals.
There are different types of dual pass systems, developed and provided by different manufac-turers. A common design is blocks, incorporating the dual lateral design, that are placed in rows and grouted together on the filter bottom, creating a flat surface on which the filter media is placed (Getting et al. 2001 & De Nora 2015). To increase the media depth in the filter, the supporting layer of gravel can be replaced by media retention plates that prevent media loss through the filter floor (ibid.).
3.2.4 The Triton Underdrain™ systemThe Triton Underdrain™ system is a specific product developed by the company Johnson Screens and thus, all information is collected from the manufacturer’s website and product sheet(Johnson Screens 2008, Aqseptence Group 2017).
The Triton Underdrain™ design is a dual parallel system that combines the header and lateral system with screening technique. The surface of the Triton elements consists of Johnson Screens’ patented vee-wire® technology (Figure 3.8) supported by perforated, U-shaped

15
laterals that surround the main lateral (Figure 3.9). Because slots can be made to suit any filter media, direct media retention can be obtained without the need of support gravel and the un-derdrain is said to have non-plugging characteristics.
Due to the semicircle shape of the elements, the effective surface area of the filter bottom can be increased up to 108% of its original surface area, thus increasing the filter capacity in col-lecting water through the underdrain. Granted the screening technique, the large open area in combination with the small slot openings reduces the overall pressure drop caused by the un-derdrain system. The increased slot area further generates a reduced through slot-velocity of the filtered water, reducing the risk of breakthrough of fine filter media. The low profile allows for an increased depth of filter media, which said to generate more efficient filtration results.
Figure 3.8. Principal sketch of Johnson Screens patented vee-wire® screen technology that is implemented in the Triton Underdrain™ design (Figure published with kind permission from Aqseptence Group 2017).
Copyright 2004 All rights reserved to Johnson Screens (Aqseptence Group)
Copyright 2018 All rights reserved to Johnson Screens (Aqseptence Group)

16
Figure 3.9. Cross-section of a Triton Underdrain™ element with the perforated U-shaped lat-erals covered by Johnson Screens patented vee-wire® screen technology (Figure published with kind permission from Aqseptence Group 2017).
The main lateral has larger orifices in its lower area and smaller orifices at the top, as well as acustomized flow control assembly that is manufactured to fit each filter. During backwashing, air is distributed through the smaller orifices whereas water flows through the larger orifices at the bottom. A mix of air and water is then discharged to the filter through the slots of the vee-wire® screen surface.
Backwashing is said to be improved because of the simultaneous water and air backwash and because of the even flow distribution. Because of this, backwash cycles can be reduced in num-ber, thus generating longer filtration cycles and reduced energy demand.
Other alleged advantages of the Triton Underdrain™ system are reduced consumption of treated water for backwashing, reduced maintenance, reduced maintenance costs due to longer filtration cycles and savings in filter height and volume.
Copyright 2004 All rights reserved to Johnson Screens (Aqseptence Group)
17
4 Data AcquisitionThe data collected is representative of two different water treatment plants and one wastewater treatment plant. Personnel at the various plants have confided data in accordance to the objec-tives of this work at such extent possible. Below, a short introduction to each treatment plant will be presented along with the data provided, as well as a brief summary of how the data was processed to be made comprehensible and manageable.
Of the filters represented in this work, the secondary filters at Hyndevad are the sole ones to be operated using the Triton Underdrain™ system in parallel with another underdrain system.
4.1 Hyndevad water treatment plantThe foreman at Hyndevad water treatment plant, Jonas Lindberg1, provides information about the treatment plant.
At Hyndevad, approximately 27 000 m3 of surface water is treated every day. To remove large particles, the raw water initially passes through a latticework and subsequent micro sieves after which it is distributed through six rapid gravity filters containing the Triton Underdrain™ sys-tem. The filtered water is artificially infiltrated through an esker before being aerated and dis-tributed through an additional twelve rapid gravity filters, whereof five contain the Triton Un-derdrain™ system and the remaining utilise a header and lateral system of perforated plastic pipes. Here, chemical precipitation is added to the process to reduce iron and manganese in the water. Ultimately, the water is pH-adjusted and disinfected before distribution to the customers.
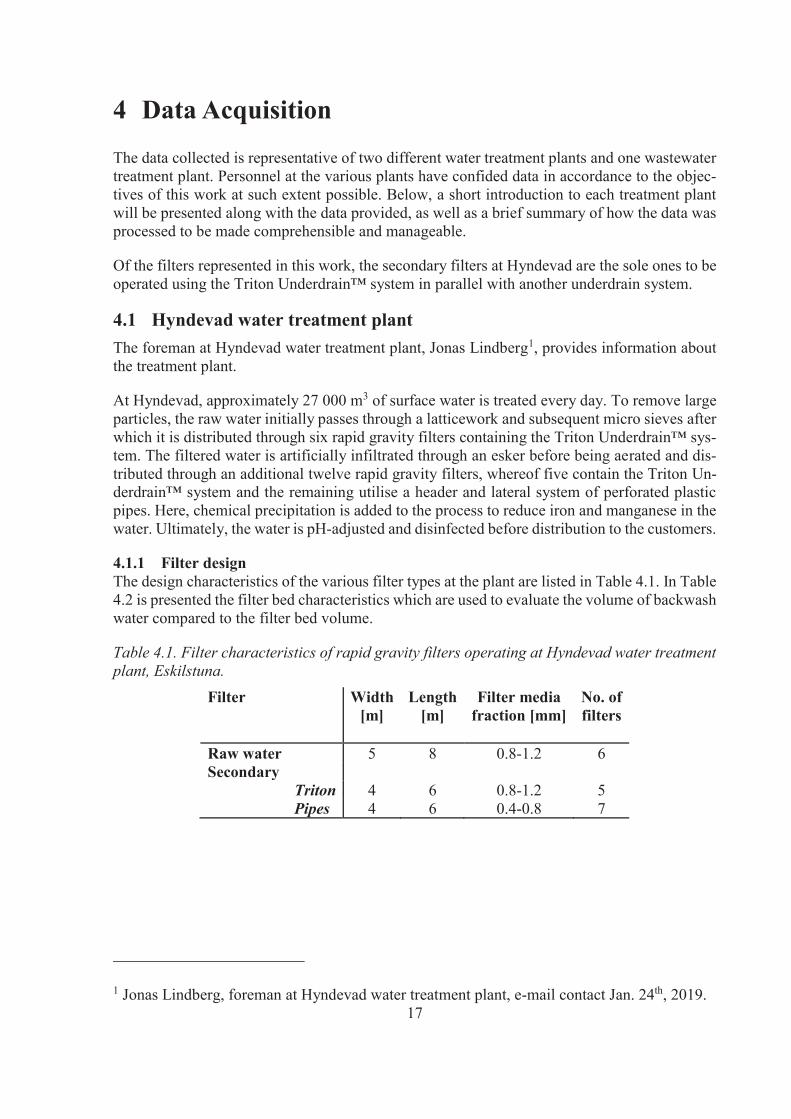
4.1.1 Filter designThe design characteristics of the various filter types at the plant are listed in Table 4.1. In Table 4.2 is presented the filter bed characteristics which are used to evaluate the volume of backwash water compared to the filter bed volume.
Table 4.1. Filter characteristics of rapid gravity filters operating at Hyndevad water treatment plant, Eskilstuna.
Filter Width[m]
Length[m]
Filter mediafraction [mm]
No. offilters
Raw water 5 8 0.8-1.2 6Secondary
Triton 4 6 0.8-1.2 5Pipes 4 6 0.4-0.8 7
1 Jonas Lindberg, foreman at Hyndevad water treatment plant, e-mail contact Jan. 24th, 2019.
18
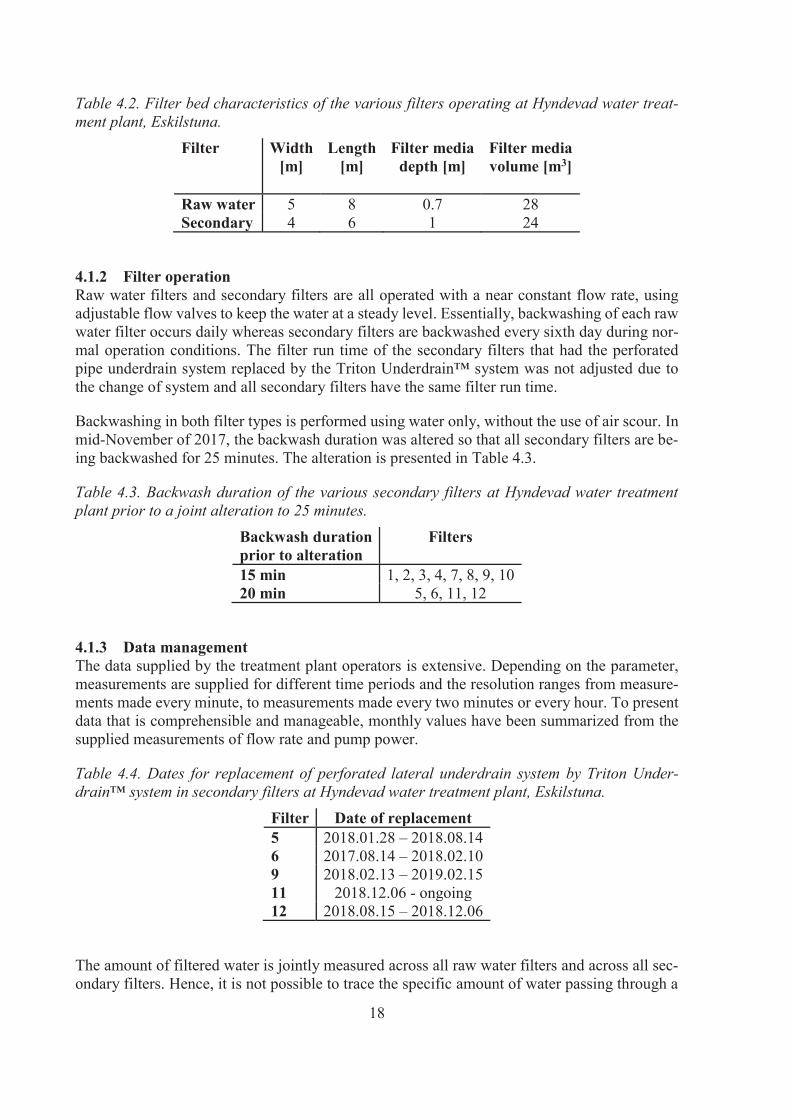
Table 4.2. Filter bed characteristics of the various filters operating at Hyndevad water treat-ment plant, Eskilstuna.
Filter Width[m]
Length[m]
Filter mediadepth [m]
Filter mediavolume [m3]
Raw water 5 8 0.7 28Secondary 4 6 1 24
4.1.2 Filter operationRaw water filters and secondary filters are all operated with a near constant flow rate, using adjustable flow valves to keep the water at a steady level. Essentially, backwashing of each raw water filter occurs daily whereas secondary filters are backwashed every sixth day during nor-mal operation conditions. The filter run time of the secondary filters that had the perforated pipe underdrain system replaced by the Triton Underdrain™ system was not adjusted due to the change of system and all secondary filters have the same filter run time.
Backwashing in both filter types is performed using water only, without the use of air scour. In mid-November of 2017, the backwash duration was altered so that all secondary filters are be-ing backwashed for 25 minutes. The alteration is presented in Table 4.3.
Table 4.3. Backwash duration of the various secondary filters at Hyndevad water treatment plant prior to a joint alteration to 25 minutes.
Backwash durationprior to alteration
Filters
15 min 1, 2, 3, 4, 7, 8, 9, 1020 min 5, 6, 11, 12
4.1.3 Data managementThe data supplied by the treatment plant operators is extensive. Depending on the parameter, measurements are supplied for different time periods and the resolution ranges from measure-ments made every minute, to measurements made every two minutes or every hour. To presentdata that is comprehensible and manageable, monthly values have been summarized from the supplied measurements of flow rate and pump power.
Table 4.4. Dates for replacement of perforated lateral underdrain system by Triton Under-drain™ system in secondary filters at Hyndevad water treatment plant, Eskilstuna.
Filter Date of replacement5 2018.01.28 – 2018.08.146 2017.08.14 – 2018.02.109 2018.02.13 – 2019.02.1511 2018.12.06 - ongoing12 2018.08.15 – 2018.12.06
The amount of filtered water is jointly measured across all raw water filters and across all sec-ondary filters. Hence, it is not possible to trace the specific amount of water passing through a
19
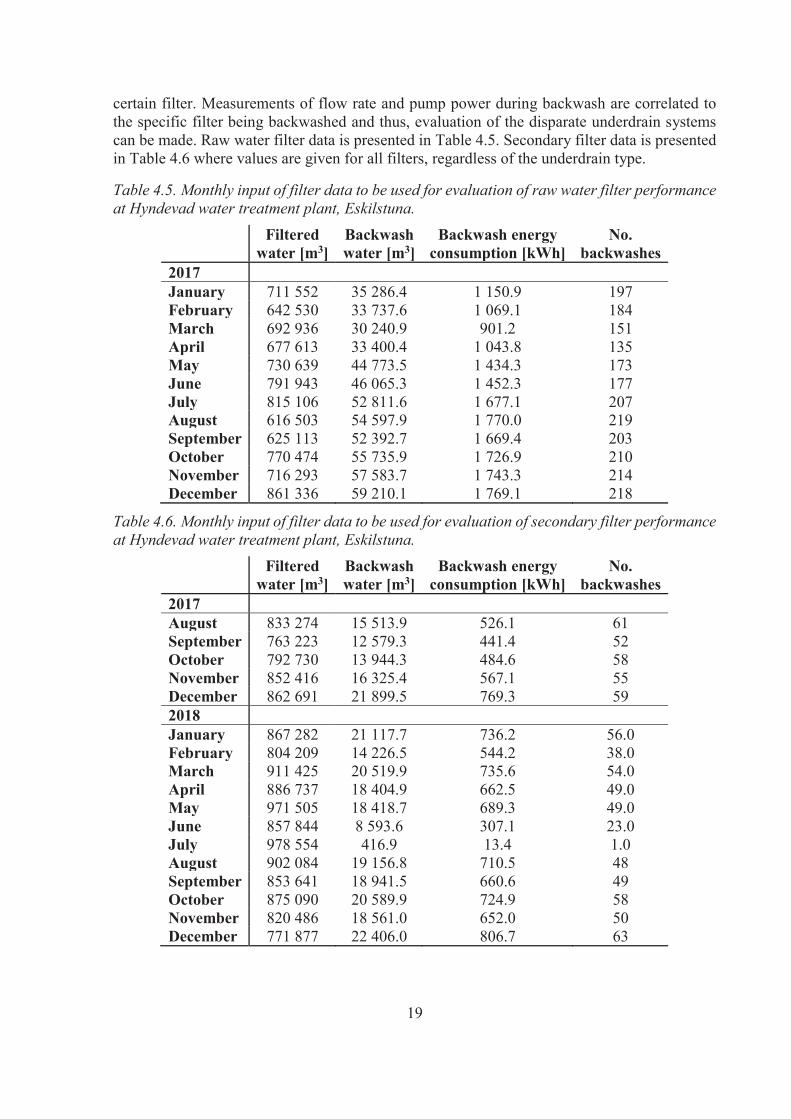
certain filter. Measurements of flow rate and pump power during backwash are correlated to the specific filter being backwashed and thus, evaluation of the disparate underdrain systems can be made. Raw water filter data is presented in Table 4.5. Secondary filter data is presented in Table 4.6 where values are given for all filters, regardless of the underdrain type.
Table 4.5. Monthly input of filter data to be used for evaluation of raw water filter performance at Hyndevad water treatment plant, Eskilstuna.
Filteredwater [m3]
Backwashwater [m3]
Backwash energyconsumption [kWh]
No.backwashes
2017January 711 552 35 286.4 1 150.9 197February 642 530 33 737.6 1 069.1 184March 692 936 30 240.9 901.2 151April 677 613 33 400.4 1 043.8 135May 730 639 44 773.5 1 434.3 173June 791 943 46 065.3 1 452.3 177July 815 106 52 811.6 1 677.1 207August 616 503 54 597.9 1 770.0 219September 625 113 52 392.7 1 669.4 203October 770 474 55 735.9 1 726.9 210November 716 293 57 583.7 1 743.3 214December 861 336 59 210.1 1 769.1 218
Table 4.6. Monthly input of filter data to be used for evaluation of secondary filter performance at Hyndevad water treatment plant, Eskilstuna.
Filteredwater [m3]
Backwashwater [m3]
Backwash energyconsumption [kWh]
No.backwashes
2017August 833 274 15 513.9 526.1 61September 763 223 12 579.3 441.4 52October 792 730 13 944.3 484.6 58November 852 416 16 325.4 567.1 55December 862 691 21 899.5 769.3 592018January 867 282 21 117.7 736.2 56.0February 804 209 14 226.5 544.2 38.0March 911 425 20 519.9 735.6 54.0April 886 737 18 404.9 662.5 49.0May 971 505 18 418.7 689.3 49.0June 857 844 8 593.6 307.1 23.0July 978 554 416.9 13.4 1.0August 902 084 19 156.8 710.5 48September 853 641 18 941.5 660.6 49October 875 090 20 589.9 724.9 58November 820 486 18 561.0 652.0 50December 771 877 22 406.0 806.7 63
20
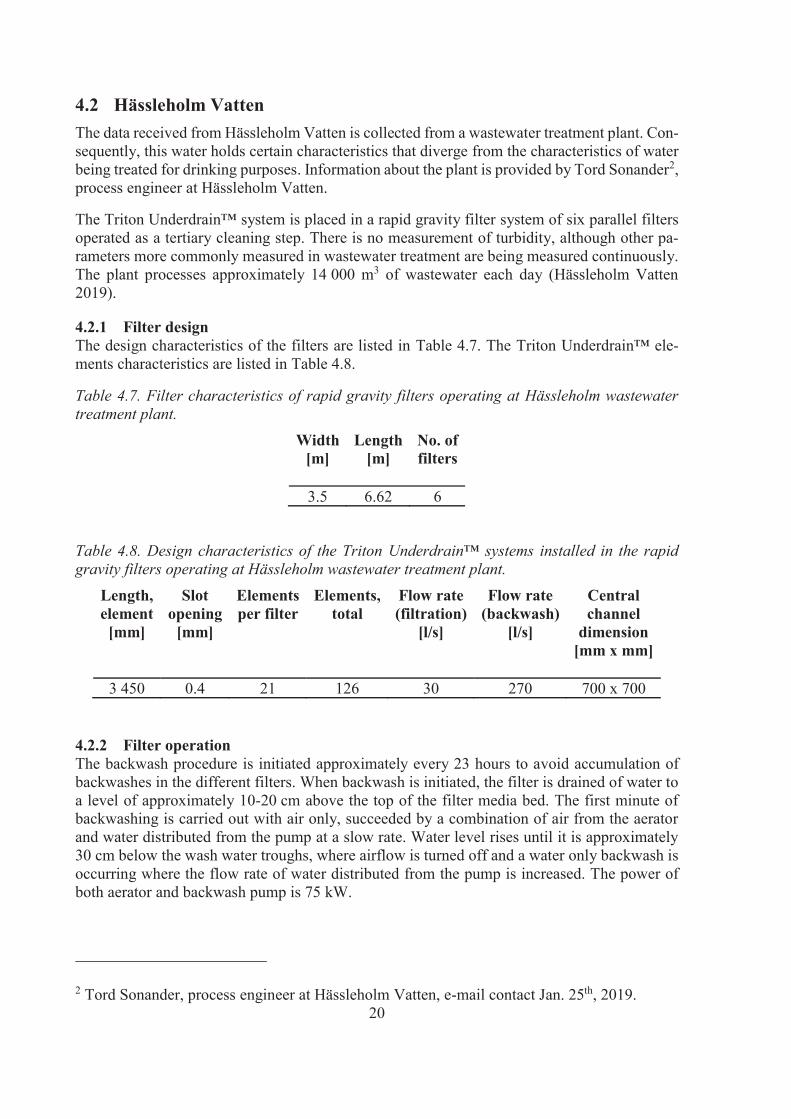
4.2 Hässleholm VattenThe data received from Hässleholm Vatten is collected from a wastewater treatment plant. Con-sequently, this water holds certain characteristics that diverge from the characteristics of water being treated for drinking purposes. Information about the plant is provided by Tord Sonander2,process engineer at Hässleholm Vatten.
The Triton Underdrain™ system is placed in a rapid gravity filter system of six parallel filters operated as a tertiary cleaning step. There is no measurement of turbidity, although other pa-rameters more commonly measured in wastewater treatment are being measured continuously.The plant processes approximately 14 000 m3 of wastewater each day (Hässleholm Vatten 2019).
4.2.1 Filter designThe design characteristics of the filters are listed in Table 4.7. The Triton Underdrain™ ele-ments characteristics are listed in Table 4.8.
Table 4.7. Filter characteristics of rapid gravity filters operating at Hässleholm wastewater treatment plant.
Width[m]
Length[m]
No. offilters
3.5 6.62 6
Table 4.8. Design characteristics of the Triton Underdrain™ systems installed in the rapid gravity filters operating at Hässleholm wastewater treatment plant.
Length,element[mm]
Slotopening
[mm]
Elementsper filter
Elements,total
Flow rate(filtration)
[l/s]
Flow rate(backwash)
[l/s]
Centralchannel
dimension[mm x mm]
3 450 0.4 21 126 30 270 700 x 700
4.2.2 Filter operationThe backwash procedure is initiated approximately every 23 hours to avoid accumulation of backwashes in the different filters. When backwash is initiated, the filter is drained of water to a level of approximately 10-20 cm above the top of the filter media bed. The first minute of backwashing is carried out with air only, succeeded by a combination of air from the aerator and water distributed from the pump at a slow rate. Water level rises until it is approximately 30 cm below the wash water troughs, where airflow is turned off and a water only backwash is occurring where the flow rate of water distributed from the pump is increased. The power of both aerator and backwash pump is 75 kW.
2 Tord Sonander, process engineer at Hässleholm Vatten, e-mail contact Jan. 25th, 2019.
21
With approximately six backwashes performed each day, water backwash duration ranges from7 to 9.6 minutes. Air scour duration ranges from 3.5 to 4 minutes.
4.2.3 Data ManagementThe data supplied comprises a period of one year, ranging from 2018-03-01 to 2019-02-28. As analysis is to be made on normal operation conditions, incongruous data is not being consideredin the results. They are, however, represented in the supplied data below.
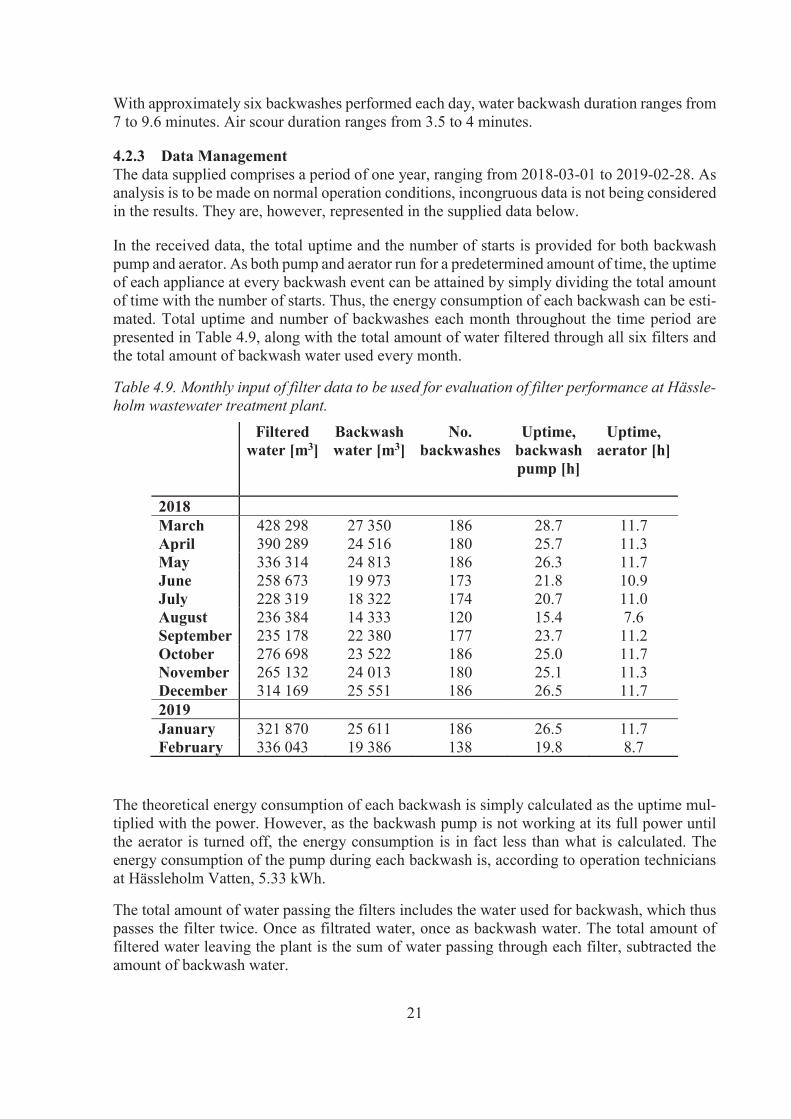
In the received data, the total uptime and the number of starts is provided for both backwash pump and aerator. As both pump and aerator run for a predetermined amount of time, the uptimeof each appliance at every backwash event can be attained by simply dividing the total amount of time with the number of starts. Thus, the energy consumption of each backwash can be esti-mated. Total uptime and number of backwashes each month throughout the time period are presented in Table 4.9, along with the total amount of water filtered through all six filters and the total amount of backwash water used every month.
Table 4.9. Monthly input of filter data to be used for evaluation of filter performance at Hässle-holm wastewater treatment plant.
Filteredwater [m3]
Backwashwater [m3]
No.backwashes
Uptime,backwashpump [h]
Uptime,aerator [h]
2018March 428 298 27 350 186 28.7 11.7April 390 289 24 516 180 25.7 11.3May 336 314 24 813 186 26.3 11.7June 258 673 19 973 173 21.8 10.9July 228 319 18 322 174 20.7 11.0August 236 384 14 333 120 15.4 7.6September 235 178 22 380 177 23.7 11.2October 276 698 23 522 186 25.0 11.7November 265 132 24 013 180 25.1 11.3December 314 169 25 551 186 26.5 11.72019January 321 870 25 611 186 26.5 11.7February 336 043 19 386 138 19.8 8.7
The theoretical energy consumption of each backwash is simply calculated as the uptime mul-tiplied with the power. However, as the backwash pump is not working at its full power until the aerator is turned off, the energy consumption is in fact less than what is calculated. The energy consumption of the pump during each backwash is, according to operation technicians at Hässleholm Vatten, 5.33 kWh.
The total amount of water passing the filters includes the water used for backwash, which thus passes the filter twice. Once as filtrated water, once as backwash water. The total amount of filtered water leaving the plant is the sum of water passing through each filter, subtracted the amount of backwash water.

22
Figure 4.1 displays the daily amount of filtered water and water used for backwash throughout the time period studied. A natural decrease in filtered water can be detected in the warmer months when inflow to the wastewater treatment is commonly decreased. A rather steady con-sumption of water for backwashing indicates that backwashing occurs continuously according to schedule, although occurring periods of anomaly affects the curve.
Figure 4.1. Yearly fluctuation in amount of water filtered and amount of backwash water used at Hässleholm wastewater treatment plant in the time period 2018-03-01 to 2019-02-28.
0
200
400
600
800
1000
1200
0
5000
10000
15000
20000
2018
-03-
0120
18-0
3-12
2018
-03-
2320
18-0
4-03
2018
-04-
1620
18-0
4-27
2018
-05-
0820
18-0
5-19
2018
-05-
3020
18-0
6-12
2018
-06-
2420
18-0
7-06
2018
-07-
1820
18-0
7-29
2018
-09-
1420
18-0
9-25
2018
-10-
0720
18-1
0-18
2018
-10-
2920
18-1
1-09
2018
-11-
2020
18-1
2-01
2018
-12-
1220
18-1
2-23
2019
-01-
0320
19-0
1-14
2019
-01-
2520
19-0
2-05
2019
-02-
16
Bac
kwas
h W
ater
[m3]
Filte
red
Wat
er [m
3]
Backwash water & Filtered water
Filtered water Backwash water
23
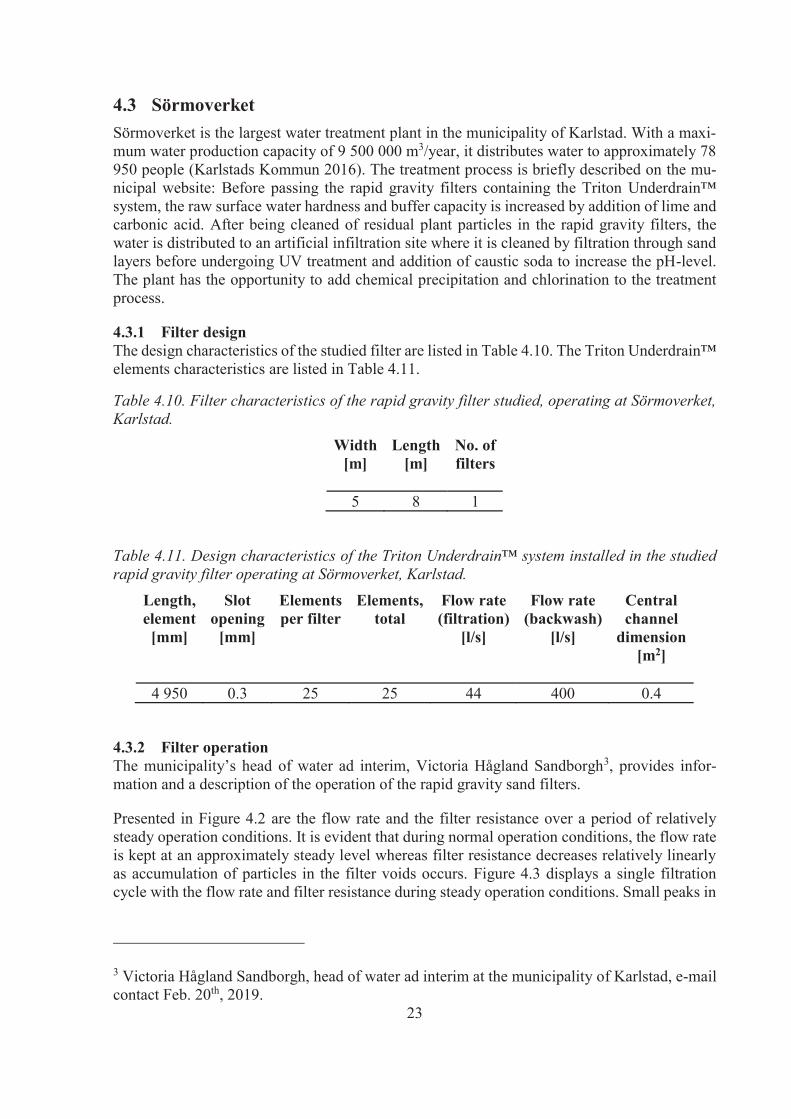
4.3 SörmoverketSörmoverket is the largest water treatment plant in the municipality of Karlstad. With a maxi-mum water production capacity of 9 500 000 m3/year, it distributes water to approximately 78950 people (Karlstads Kommun 2016). The treatment process is briefly described on the mu-nicipal website: Before passing the rapid gravity filters containing the Triton Underdrain™system, the raw surface water hardness and buffer capacity is increased by addition of lime and carbonic acid. After being cleaned of residual plant particles in the rapid gravity filters, the water is distributed to an artificial infiltration site where it is cleaned by filtration through sand layers before undergoing UV treatment and addition of caustic soda to increase the pH-level. The plant has the opportunity to add chemical precipitation and chlorination to the treatment process.
4.3.1 Filter designThe design characteristics of the studied filter are listed in Table 4.10. The Triton Underdrain™elements characteristics are listed in Table 4.11.
Table 4.10. Filter characteristics of the rapid gravity filter studied, operating at Sörmoverket, Karlstad.
Width[m]
Length[m]
No. offilters
5 8 1
Table 4.11. Design characteristics of the Triton Underdrain™ system installed in the studied rapid gravity filter operating at Sörmoverket, Karlstad.
Length,element[mm]
Slotopening
[mm]
Elementsper filter
Elements,total
Flow rate(filtration)
[l/s]
Flow rate(backwash)
[l/s]
Centralchannel
dimension[m2]
4 950 0.3 25 25 44 400 0.4
4.3.2 Filter operationThe municipality’s head of water ad interim, Victoria Hågland Sandborgh3, provides infor-mation and a description of the operation of the rapid gravity sand filters.
Presented in Figure 4.2 are the flow rate and the filter resistance over a period of relatively steady operation conditions. It is evident that during normal operation conditions, the flow rate is kept at an approximately steady level whereas filter resistance decreases relatively linearly as accumulation of particles in the filter voids occurs. Figure 4.3 displays a single filtration cycle with the flow rate and filter resistance during steady operation conditions. Small peaks in
3 Victoria Hågland Sandborgh, head of water ad interim at the municipality of Karlstad, e-mail contact Feb. 20th, 2019.

24
the flow rate indicate that another filter is being backwashed and thus, more water is distributed to the remaining filters for a short period of time.
Figure 4.2. Flow rate and filter resistance of filter 6, operating at Sörmoverket in Karlstad, during a period of relatively steady operation conditions. Small peaks in flow rate are part of the normal conditions when a filter is shortly loaded with the excess flow of a filter being back-washed.
Figure 4.3. Flow rate and filter resistance during a single filtration cycle of filter 6, operating during steady conditions at Sörmoverket in Karlstad. Temporary dips in filter resistance coin-cide with temporary increase in flow rate.
Of the parameters of interest, flow rate and filter resistance are the only ones with online meas-urement. Turbidity and separation of substances are not being measured continuously, but tur-bidity is measured weekly in a laboratory.
The backwash procedure is run on schedule with backwash of each filter occurring once a weekduring normal operation conditions. Backwashing is performed with water only according to
390400410420430440450460470
020406080
100120140160180200
2018
-01-
01 0
020
18-0
1-03
19
2018
-01-
06 1
420
18-0
1-09
09
2018
-01-
12 0
420
18-0
1-14
23
2018
-01-
17 1
820
18-0
1-20
13
2018
-01-
23 0
820
18-0
1-26
03
2018
-01-
28 2
220
18-0
1-31
17
2018
-02-
03 1
220
18-0
2-06
07
2018
-02-
09 0
220
18-0
2-11
21
2018
-02-
14 1
620
18-0
2-17
11
2018
-02-
20 0
620
18-0
2-23
01
2018
-02-
25 2
020
18-0
2-28
15
2018
-03-
03 1
020
18-0
3-06
05
2018
-03-
09 0
020
18-0
3-11
19
2018
-03-
14 1
420
18-0
3-17
09
2018
-03-
20 0
420
18-0
3-22
23
2018
-03-
25 1
820
18-0
3-28
13
2018
-03-
31 0
820
18-0
4-03
03
2018
-04-
05 2
2
Filte
r res
ista
nce
[mba
r]
Flow
rate
[m3/
h]
Filtration cycles during normal operation conditionsFlow rate Filter resistance
400410420430440450460470
020406080
100120140160180
2018
-04-
07 0
820
18-0
4-07
14
2018
-04-
07 2
020
18-0
4-08
02
2018
-04-
08 0
820
18-0
4-08
14
2018
-04-
08 2
020
18-0
4-09
02
2018
-04-
09 0
820
18-0
4-09
14
2018
-04-
09 2
020
18-0
4-10
02
2018
-04-
10 0
820
18-0
4-10
14
2018
-04-
10 2
020
18-0
4-11
02
2018
-04-
11 0
820
18-0
4-11
14
2018
-04-
11 2
020
18-0
4-12
02
2018
-04-
12 0
820
18-0
4-12
14
2018
-04-
12 2
020
18-0
4-13
02
2018
-04-
13 0
820
18-0
4-13
14
2018
-04-
13 2
020
18-0
4-14
02
2018
-04-
14 0
820
18-0
4-14
14 Filte
r res
ista
nce
[mba
r]
Flow
rate
[m3/
h]
Filtration cycle 2018-04-07 to 2018-04-14Flow rate Filter resistance
25
the postulations listed in Table 4.12. From this, the energy consumption per unit volume of backwash water can be calculated. No air scour is used during the backwash and no online measurement of the pump power is available. Thus, the energy consumption during backwash is simply calculated as the pump power times the uptime and the amount of backwash water is calculated as flow rate times the uptime.
Table 4.12. Postulations of backwash procedure in rapid gravity filters operating at Sörmoverket, Karlstad.
Backwashduration [min]
Flow rate[l/s]
Power,backwash pump [kW]
10 400 35
4.3.3 Data managementThe data supplied comprises flow rate and filter resistance of filter 6 at Sörmoverket, throughouta time period ranging from 2017-02-25 to 2019-02-19.
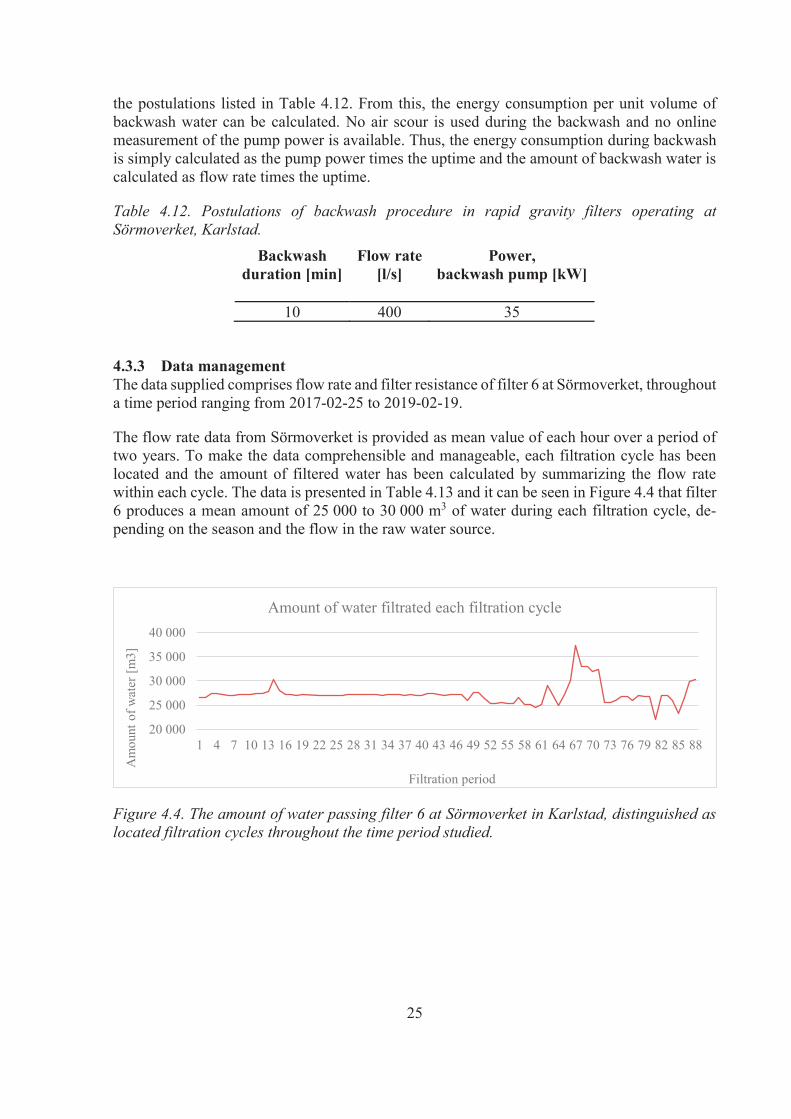
The flow rate data from Sörmoverket is provided as mean value of each hour over a period of two years. To make the data comprehensible and manageable, each filtration cycle has been located and the amount of filtered water has been calculated by summarizing the flow rate within each cycle. The data is presented in Table 4.13 and it can be seen in Figure 4.4 that filter 6 produces a mean amount of 25 000 to 30 000 m3 of water during each filtration cycle, de-pending on the season and the flow in the raw water source.
Figure 4.4. The amount of water passing filter 6 at Sörmoverket in Karlstad, distinguished as located filtration cycles throughout the time period studied.
20 000
25 000
30 000
35 000
40 000
1 4 7 10 13 16 19 22 25 28 31 34 37 40 43 46 49 52 55 58 61 64 67 70 73 76 79 82 85 88
Am
ount
of w
ater
[m3]
Filtration period
Amount of water filtrated each filtration cycle

26
Table 4.13. Located filtration cycles with corresponding amounts of filtered water of filter 6 at Sörmoverket in Karlstad, covering a time period of approximately two years.
Filtrationperiod
Filteredwater [m3]
Filtrationperiod
Filteredwater [m3]
Filtrationperiod
Filteredwater [m3]
12017/02/25-2017/03/04 26 677 31 2017/10/14-
2017/10/21 27 251 61 2018/05/26-2018/06/02 25 156
22017/03/04-2017/03/11 26 549 32 2017/10/21-
2017/10/28 27 220 62 2018/06/02-2018/06/09 29 067
32017/04/01-2017/04/08 27 345 33 2017/10/28-
2017/11/04 27 114 63 2018/06/09-2018/06/16 27 185
42017/04/08-2017/04/15 27 432 34 2017/11/04-
2017/11/11 27 302 64 2018/06/16-2018/06/23 25 033
52017/04/15-2017/04/22 27 258 35 2017/11/11-
2017/11/18 27 316 65 2018/06/23-2018/06/30 27 202
62017/04/22-2017/04/29 26 955 36 2017/11/18-
2017/11/25 27 310 66 2018/06/30-2018/07/07 30 057
72017/04/29-2017/05/06 27 096 37 2017/11/25-
2017/12/02 26 987 67 2018/07/07-2018/07/14 37 399
82017/05/06-2017/05/13 27 170 38 2017/12/02-
2017/12/09 27 201 68 2018/07/14-2018/07/21 33 031
92017/05/13-2017/05/20 27 308 39 2017/12/09-
2017/12/16 27 101 69 2018/07/21-2018/07/28 33 003
102017/05/20-2017/05/27 27 127 40 2017/12/16-
2017/12/23 27 029 70 2018/07/28-2018/08/04 32 042
112017/05/27-2017/06/03 27 499 41 2017/12/23-
2017/12/30 27 345 71 2018/08/04-2018/08/11 32 463
122017/06/03-2017/06/10 27 476 42 2017/12/30-
2018/01/06 27 399 72 2018/08/25-2018/09/01 25 553
132017/06/10-2017/06/17 27 870 43 2018/01/06-
2018/01/13 27 254 73 2018/09/01-2018/09/08 25 619
142017/06/17-2017/06/24 30 264 44 2018/01/13-
2018/01/20 27 097 74 2018/09/08-2018/09/15 25 914
152017/06/24-2017/07/01 27 988 45 2018/01/20-
2018/01/27 27 181 75 2018/09/29-2018/10/06 26 794
162017/07/01-2017/07/08 27 224 46 2018/01/27-
2018/02/03 27 168 76 2018/10/06-2018/10/13 26 889
172017/07/08-2017/07/15 27 232 47 2018/02/03-
2018/02/10 27 162 77 2018/10/13-2018/10/20 26 065
182017/07/15-2017/07/22 27 034 48 2018/02/10-
2018/02/17 25 872 78 2018/10/20-2018/10/27 26 985
192017/07/22-2017/07/29 27 178 49 2018/02/17-
2018/02/24 27 640 79 2018/10/27-2018/11/03 26 704
202017/07/29-2017/08/05 27 133 50 2018/02/24-
2018/03/03 27 595 80 2018/11/03-2018/11/10 26 803
212017/08/05-2017/08/12 27 095 51 2018/03/03-
2018/03/10 26 299 81 2018/11/10-2018/11/17 22 007
222017/08/12-2017/08/19 27 083 52 2018/03/10-
2018/03/17 25 432 82 2018/11/17-2018/11/24 27 004
232017/08/19-2017/08/26 27 100 53 2018/03/17-
2018/03/24 25 352 83 2018/11/24-2018/12/01 26 976
242017/08/26-2017/09/02 27 082 54 2018/03/24-
2018/03/31 25 555 84 2019/01/16-2019/01/23 25 899
252017/09/02-2017/09/09 26 911 55 2018/03/31-
2018/04/07 25 426 85 2019/01/23-2019/01/29 23 211
262017/09/09-2017/09/16 27 113 56 2018/04/07-
2018/04/14 25 263 86 2019/01/29-2019/02/05 26 562
272017/09/16-2017/09/23 27 217 57 2018/04/28-
2018/05/05 26 651 87 2019/02/05-2019/02/12 29 896
282017/09/23-2017/09/30 27 267 58 2018/05/05-
2018/05/12 25 152 88 2019/02/12-2019/02/19 30 232
292017/09/30-2017/10/07 27 144 59 2018/05/12-
2018/05/19 25 22630
2017/10/07-2017/10/14 27 240 60 2018/05/19-
2018/05/26 24 478
27
5 ResultsThe results of this study are divided into three main categories to better distinguish between the disparate nature of the results and what problem formulation they aim to answer.
5.1 Evaluation of backwash efficiencyEvaluation of backwash efficiency of the studied filters has been made from the following as-pects:
volume of backwash watero total volume of backwash water used for every backwash evento volume of backwash water to volume of filtered water ratio
energy consumptiono energy consumption per backwash evento energy consumption of backwash procedure in relationship to volume of filtered
water producedo energy consumption of backwash procedure in relationship to volume of back-
wash water used
Periods of anomalous filter operation are not being considered as it is only the filter operation during normal conditions that is of interest to this study.
5.1.1 Volume of backwash waterThe volume of water used for backwash to volume of filtered water ratios of the different filtersrepresented in this study are presented in Figure 5.1. The total volumes of water used for back-wash during each backwash event of the different filters in this study is presented in Figure 5.2.The presented values represent an average value of the results listed in Table 5.1 and in Table 0.1 - Table 0.4 in Appendix I.
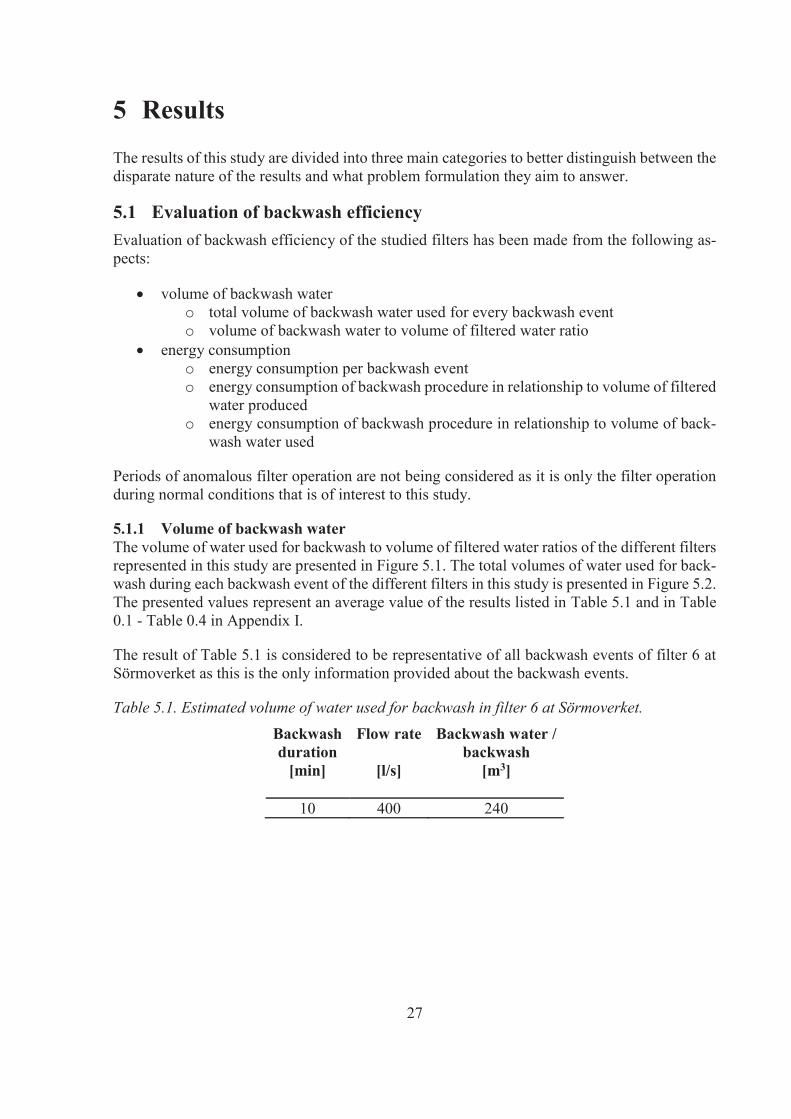
The result of Table 5.1 is considered to be representative of all backwash events of filter 6 at Sörmoverket as this is the only information provided about the backwash events.
Table 5.1. Estimated volume of water used for backwash in filter 6 at Sörmoverket.
Backwashduration
Flow rate Backwash water /backwash
[min] [l/s] [m3]
10 400 240

28
Figure 5.1. Analogy of the volume water used for backwash to volume filtered water ratio of the various filters represented in this study.
Figure 5.2. Analogy of the amount of water used during one backwash event in the different filters represented in this study.
6,44%
1,94%
7,57%
0,89%
0%1%2%3%4%5%6%7%8%
Hyndevad, rawwater
Hyndevad,secondary
Hässleholm Sörmoverket
Ratio of volume water used for backwashing to volume filtered water
241.5
349.7
130.3
240.0
0
50
100
150
200
250
300
350
400
Hyndevad, rawwater
Hyndevad,secondary
Hässleholm Sörmoverket
[m3]
Amount of water used for backwash
29
In Table 5.2 is presented the corresponding number of filter beds that make up the volume of water used for backwash. As can be seen, the numbers are higher than the 2.5 filter bed volumes mentioned by Ratnayaka et al. (2009).
Table 5.2. Filter bed volume, average volume of water used for backwash and the correspond-ing number of filter beds that make up the backwash water volume at Hyndevad water treatment plant, Eskilstuna.
Filter Filter bedvolume [m3]
Average volumebackwash water [m3]
Correspondingnumber of filter beds
Raw water 28 241.5 8.6Secondary 24 349.7 14.6
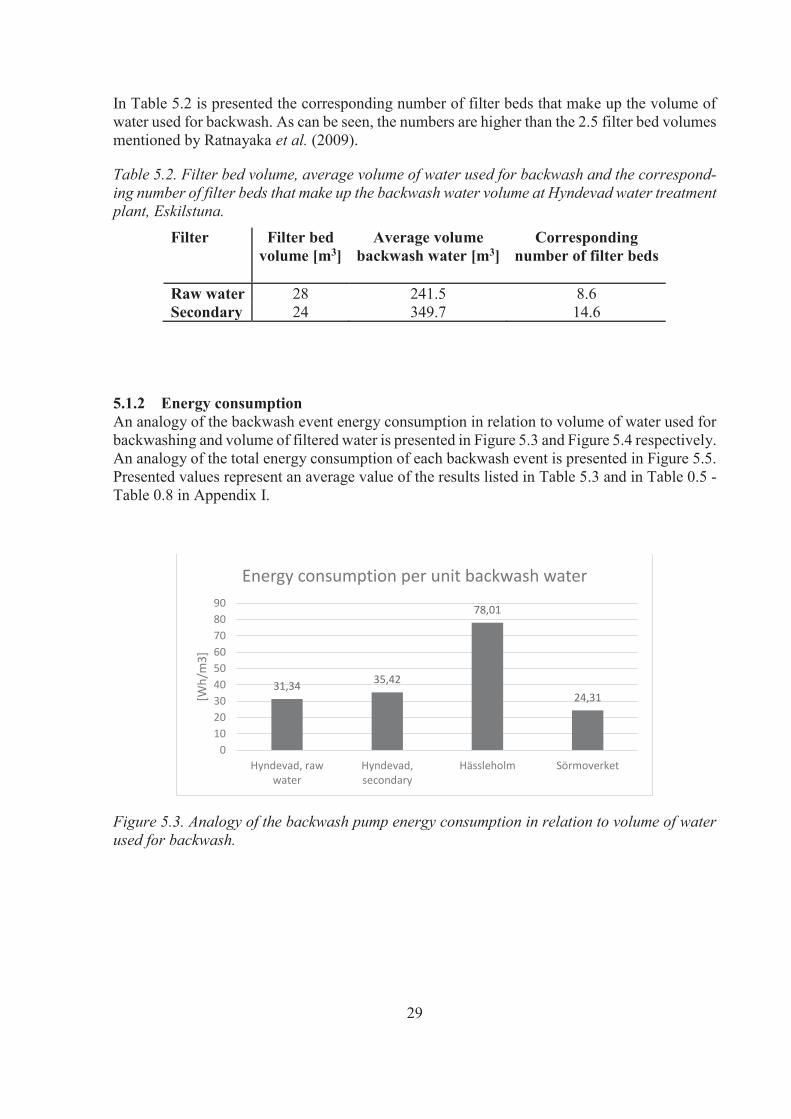
5.1.2 Energy consumptionAn analogy of the backwash event energy consumption in relation to volume of water used for backwashing and volume of filtered water is presented in Figure 5.3 and Figure 5.4 respectively. An analogy of the total energy consumption of each backwash event is presented in Figure 5.5.Presented values represent an average value of the results listed in Table 5.3 and in Table 0.5 -Table 0.8 in Appendix I.
Figure 5.3. Analogy of the backwash pump energy consumption in relation to volume of water used for backwash.
31,34 35,42
78,01
24,31
0102030405060708090
Hyndevad, rawwater
Hyndevad,secondary
Hässleholm Sörmoverket
[Wh/
m3]
Energy consumption per unit backwash water
30
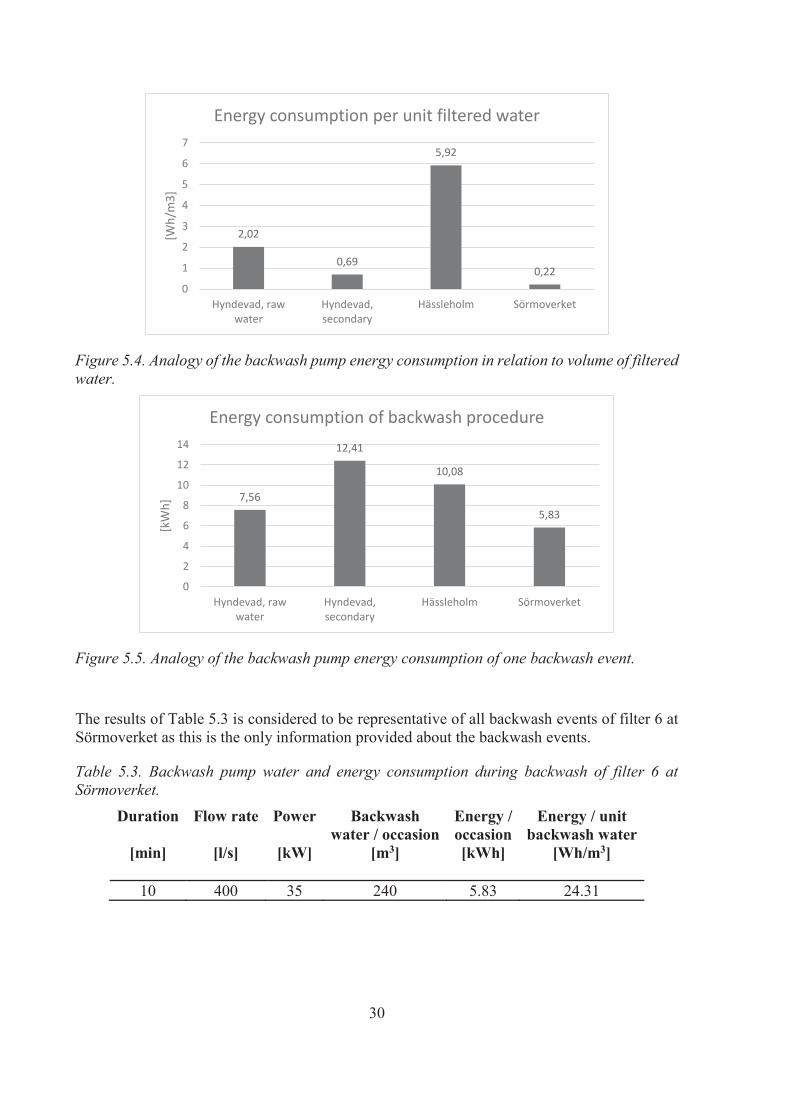
Figure 5.4. Analogy of the backwash pump energy consumption in relation to volume of filtered water.
Figure 5.5. Analogy of the backwash pump energy consumption of one backwash event.
The results of Table 5.3 is considered to be representative of all backwash events of filter 6 at Sörmoverket as this is the only information provided about the backwash events.
Table 5.3. Backwash pump water and energy consumption during backwash of filter 6 at Sörmoverket.
Duration Flow rate Power Backwashwater / occasion
Energy /occasion
Energy / unitbackwash water
[min] [l/s] [kW] [m3] [kWh] [Wh/m3]
10 400 35 240 5.83 24.31
2,02
0,69
5,92
0,220
1
2
3
4
5
6
7
Hyndevad, rawwater
Hyndevad,secondary
Hässleholm Sörmoverket
[Wh/
m3]
Energy consumption per unit filtered water
7,56
12,41
10,08
5,83
0
2
4
6
8
10
12
14
Hyndevad, rawwater
Hyndevad,secondary
Hässleholm Sörmoverket
[kW
h]
Energy consumption of backwash procedure

31
The total backwash energy consumption of filters operating at Hässleholm wastewater treat-ment plant is estimated from the uptime and the power of backwash pump and aerator. In Figure 5.6 is the energy consumption based on the assumption that the pump operates at full power throughout the entire backwash occasion.
However, as the pump does in fact not operate at full power throughout the entire backwash event due to a combination of water backwash and air scour, a more likely energy consumption is presented in Figure 5.7, where the energy consumption of the pump has the given value of 5.33 kWh per backwash occasion. The results presented in Table 0.7 in Appendix I are calcu-lated from a pump energy consumption of 5.33 kWh.
Figure 5.6. Energy consumption for each backwash event at Hässleholm wastewater treatment plant, based on the assumption that the backwash pump runs on full power throughout the entire backwash.
Figure 5.7. Energy consumption for each backwash event at Hässleholm wastewater treatment plant, based on the assumption that the pump energy consumption for each occasion is 5.33 kWh.
0.0000.0020.0040.0060.0080.0100.0120.0140.0160.018
2018
-03-
0120
18-0
3-11
2018
-03-
2120
18-0
3-31
2018
-04-
1020
18-0
4-20
2018
-04-
3020
18-0
5-10
2018
-05-
2020
18-0
5-30
2018
-06-
1020
18-0
6-20
2018
-06-
3020
18-0
7-10
2018
-07-
2020
18-0
7-30
2018
-08-
0920
18-0
8-21
2018
-08-
3120
18-0
9-10
2018
-09-
2020
18-1
0-01
2018
-10-
1120
18-1
0-21
2018
-10-
3120
18-1
1-10
2018
-11-
2020
18-1
1-30
2018
-12-
1020
18-1
2-20
2018
-12-
3020
19-0
1-09
2019
-01-
1920
19-0
1-29
2019
-02-
0820
19-0
2-18
[kW
h]
Energy consumption per backwash event (1)Backwash pump Aerator Total
0123456789
101112
2018
-03-
0120
18-0
3-11
2018
-03-
2120
18-0
3-31
2018
-04-
1020
18-0
4-20
2018
-04-
3020
18-0
5-10
2018
-05-
2020
18-0
5-30
2018
-06-
1020
18-0
6-20
2018
-06-
3020
18-0
7-10
2018
-07-
2020
18-0
7-30
2018
-08-
0920
18-0
8-21
2018
-08-
3120
18-0
9-10
2018
-09-
2020
18-1
0-01
2018
-10-
1120
18-1
0-21
2018
-10-
3120
18-1
1-10
2018
-11-
2020
18-1
1-30
2018
-12-
1020
18-1
2-20
2018
-12-
3020
19-0
1-09
2019
-01-
1920
19-0
1-29
2019
-02-
0820
19-0
2-18
[kW
h]
Energy consumption per backwash event (2)Backwash pump Aerator Total

32
5.2 Analogy of two disparate underdrain systemsWith the information provided in Table 0.9 - Table 0.12 in Appendix I, an analogy of the filter performance of the two disparate filter underdrain systems and the joint filter performance was made. The results are presented in Figure 5.8 - Figure 5.11. The backwash performance of the specific underdrain systems in relation to amount of filtered water could not be evaluated since measurement of filtered water is a joint measurement over all filters.
Figure 5.8. Energy consumption of the backwash pump in relation to volume water used for backwash in filters utilising the Triton underdrain system and a filter using a header and lateral system.
Figure 5.9. Energy consumption of the backwash pump in a single backwash event in filters utilising the Triton underdrain system and a filter using a header and lateral system.
05
1015202530354045
[Wh/
m3]
Time Period [August 2017 - December 2018]
Energy consumption per unit backwash waterAverage Filter 5 Filter 6 Filter 12 Filter 8 (header & lateral system)
02468
10121416
[kW
h]
Time Period [August 2017 - December 2018]
Energy consumption per backwash eventAverage Filter 5 Filter 6 Filter 12 Filter 8 (header & lateral system)
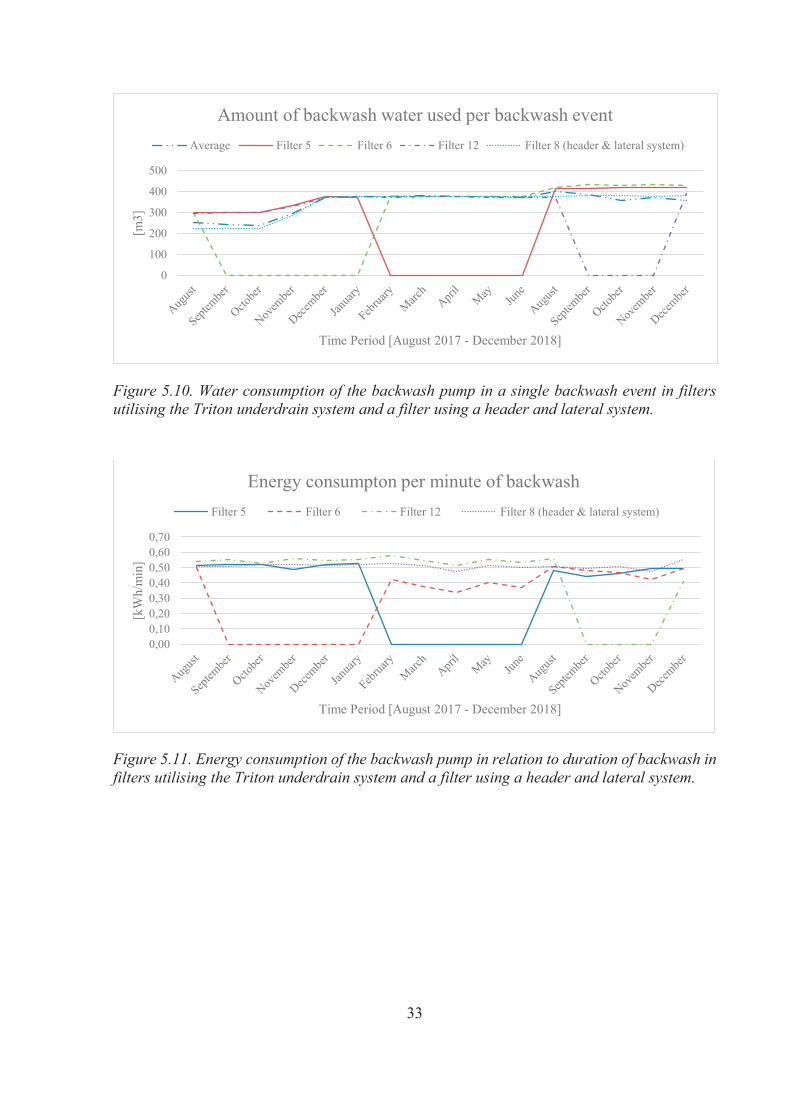
33
Figure 5.10. Water consumption of the backwash pump in a single backwash event in filters utilising the Triton underdrain system and a filter using a header and lateral system.
Figure 5.11. Energy consumption of the backwash pump in relation to duration of backwash in filters utilising the Triton underdrain system and a filter using a header and lateral system.
0
100
200
300
400
500
[m3]
Time Period [August 2017 - December 2018]
Amount of backwash water used per backwash eventAverage Filter 5 Filter 6 Filter 12 Filter 8 (header & lateral system)
0,000,100,200,300,400,500,600,70
[kW
h/m
in]
Time Period [August 2017 - December 2018]
Energy consumpton per minute of backwashFilter 5 Filter 6 Filter 12 Filter 8 (header & lateral system)

34
5.3 Pressure drop calculationsThe manufacturer of the Triton Underdrain™ system supplied graphs of the expected pressure drop at different flow rates during filtration and backwash. These are presented in Figure 5.12and Figure 5.13.
Figure 5.12. Expected pressure drop in the Triton Underdrain™ system at different flow rates during filtration. Graph published with kind permission from Aqseptence Group SAS (2019) and may not be reproduced.
Figure 5.13. Expected pressure drop in the Triton Underdrain™ system at different flow rates during a water only backwash. Graph published with kind permission from Aqseptence Group SAS (2019) and may not be reproduced.
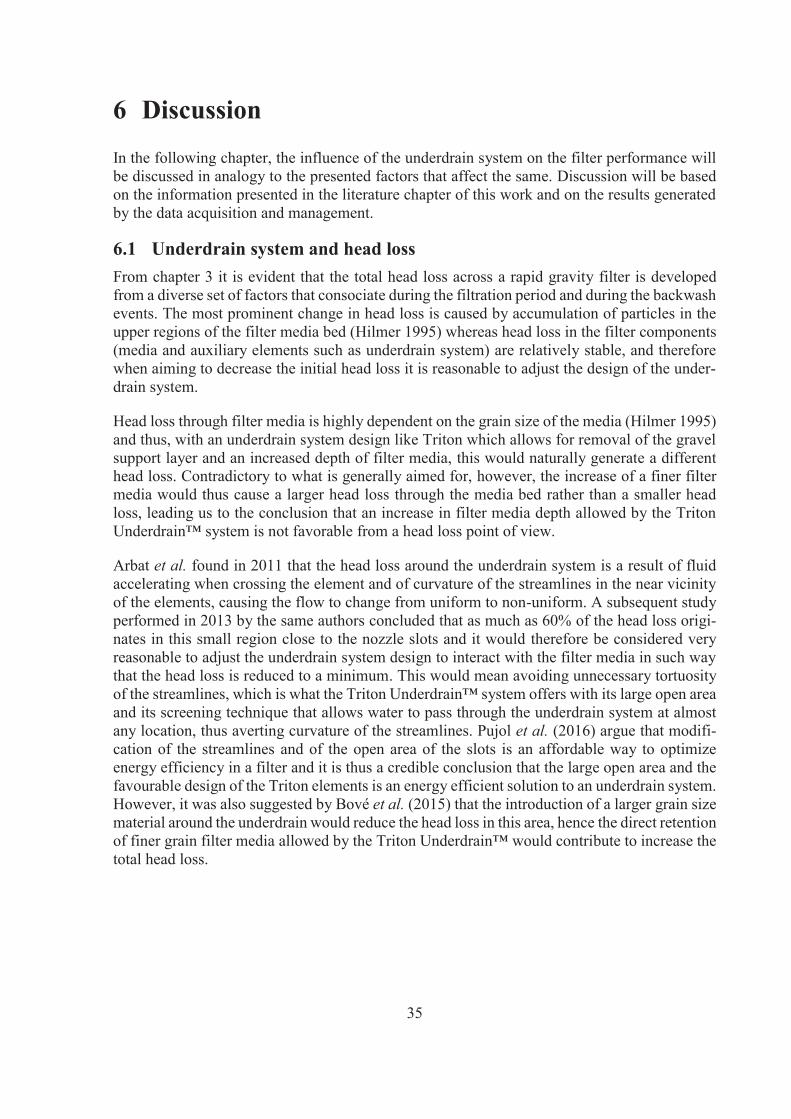
35
6 DiscussionIn the following chapter, the influence of the underdrain system on the filter performance will be discussed in analogy to the presented factors that affect the same. Discussion will be based on the information presented in the literature chapter of this work and on the results generated by the data acquisition and management.
6.1 Underdrain system and head lossFrom chapter 3 it is evident that the total head loss across a rapid gravity filter is developed from a diverse set of factors that consociate during the filtration period and during the backwash events. The most prominent change in head loss is caused by accumulation of particles in the upper regions of the filter media bed (Hilmer 1995) whereas head loss in the filter components (media and auxiliary elements such as underdrain system) are relatively stable, and therefore when aiming to decrease the initial head loss it is reasonable to adjust the design of the under-drain system.
Head loss through filter media is highly dependent on the grain size of the media (Hilmer 1995) and thus, with an underdrain system design like Triton which allows for removal of the gravel support layer and an increased depth of filter media, this would naturally generate a different head loss. Contradictory to what is generally aimed for, however, the increase of a finer filter media would thus cause a larger head loss through the media bed rather than a smaller head loss, leading us to the conclusion that an increase in filter media depth allowed by the Triton Underdrain™ system is not favorable from a head loss point of view.
Arbat et al. found in 2011 that the head loss around the underdrain system is a result of fluid accelerating when crossing the element and of curvature of the streamlines in the near vicinity of the elements, causing the flow to change from uniform to non-uniform. A subsequent study performed in 2013 by the same authors concluded that as much as 60% of the head loss origi-nates in this small region close to the nozzle slots and it would therefore be considered very reasonable to adjust the underdrain system design to interact with the filter media in such way that the head loss is reduced to a minimum. This would mean avoiding unnecessary tortuosity of the streamlines, which is what the Triton Underdrain™ system offers with its large open area and its screening technique that allows water to pass through the underdrain system at almost any location, thus averting curvature of the streamlines. Pujol et al. (2016) argue that modifi-cation of the streamlines and of the open area of the slots is an affordable way to optimize energy efficiency in a filter and it is thus a credible conclusion that the large open area and the favourable design of the Triton elements is an energy efficient solution to an underdrain system.However, it was also suggested by Bové et al. (2015) that the introduction of a larger grain size material around the underdrain would reduce the head loss in this area, hence the direct retentionof finer grain filter media allowed by the Triton Underdrain™ would contribute to increase the total head loss.
36
6.2 Underdrain system and separation of solidsThe separation of particles from the water occurs primarily in the top layer of the filter media bed (Hilmer 1995) and with the increasing ripening of the separation process as particles accu-mulate on the grain surfaces, it is not a probable conclusion that an already sufficient filter media depth would experience any improvement in separation ability following an increase in media depth alone. However, Mesquita et al. (2012) conclude that for identical operation con-ditions, different removal efficiencies could be accomplished depending on the model of the internal auxiliary elements, which is a contradiction to the statement made by Bové et al. (2015) who suggest that alternation of the underdrain system does not reduce the effectiveness of the filtration process. As none of the plants represented in this study allow for an analogy of sepa-ration efficiency between disparate underdrain systems, this could not be evaluated and more profound evaluations of the matter should be conducted.
Manufacturers of the Triton Underdrain™ system imply that the available increase in filter media depth results in a more efficient filtration but the basic principles of solids separation through filter media does not support this statement as the separation tends to be mainly located in the upper layers of media. However, as the slot width of the Triton Underdrain™ system is adjustable to suit the filter media and thus plays a valid role in the choice of the same, the underdrain system could be said to indirectly affect the separation efficiency of a filter.
6.3 Underdrain system and filter run timeIf backwash is not initiated after a pre-set amount of time, it is generally initiated due to either head loss becoming too great or turbidity level becoming too high. Thus, the filter run time could be dependent on the separation process taking place in the filter media bed, both in re-gards of an increasing head loss and of turbidity levels. Operation of a filter with high initial head loss will naturally produce shorter filtration periods and a filter containing finer grains of media will experience a faster accumulation of particles that increases the head loss. As dis-cussed above, the head loss in a filter can be remarkably modified by design of underdrain system whereas the separation ability is most likely not perceptibly affected by the same, thus leading to the conclusion that the underdrain system might affect the filter run time in regards of head loss but not in regard of turbidity.
As all of the contributing treatment plants in this study initiate backwash after a pre-set amount of time or manually, no relationship between the interplay of underdrain system performance and the filter run time could be assessed. In other plants, however, the filter run time may vary with the development of pressure drop and filtered water quality as any of these factors may initiate backwash.
It is suggested by Hilmer (1995) and Ratnayaka et al. (2009a) that the filter run time is kept at 24-60 hours, and by Davis (2011) that it should be no more than 96 hours when treating water by coagulation and flocculation. The secondary filters at Hyndevad water treatment plant, how-ever, are backwashed every 6th day and the filters at Sörmoverket are being backwashed every 7th day unless manual backwash is initiated. During normal operation conditions these long filter run times are no cause of malfunction in the filters.

37
6.4 Underdrain system and backwashThe provided graphs demonstrating the head loss as a function of flow rate during backwash suggests that the head loss in the Triton Underdrain™ system might be as large as 1.3 m, which is more than four times the value suggested by Davis. However, depending on filter media grain size and depth of the filter bed along with other factors, the head loss of a clean filter bed may vary. Getting et al. (2001) argue that during backwash, the head loss in the underdrain system need to be greater than that developing through the filter bed. If the head loss through the filter bed at the backwash rate is greater than that of the underdrain system, uneven distribution of backwash water and malfunction of the backwash procedure may occur. It would thus also be possible to design an underdrain system that would be “too efficient” in terms of reducing head loss.
Many of the experienced problems regarding malfunction of the backwash procedure in con-ventional systems may originate in having a greater head loss in the filter media than in the underdrain system during backwash, and the relatively high head loss in the Triton Under-drain™ system during backwash may very well imply an improved backwash effectiveness rather than the opposite
It is stated by Getting et al. (2001) that a uniform backwash water distribution is the key to extend the life span of a rapid gravity filter and to prolong its performance, as uneven distribu-tion will generate dirt and particles to accumulate in the areas where the backwash flow rate is not sufficient. The slots through which the underdrain system can collect water is also the same as through which backwash water can be distributed and with the large open area available with the Triton Underdrain™ system, there is also naturally a more even distribution of the backwash water as the slots cover a large range of the total filter bottom area. It also seems to be a general agreement that the addition of air to the backwash procedure will provide cleaner media as well as reduce the volume of water used in the process. Thus, it is probable that the Triton Under-drain™ system, which is designed to perform backwash with water and air both, is an effective solution to the many problems regarding the backwash efficiency that is commonly encountered in conventional underdrain systems.
6.5 Backwash efficiencyIt was mentioned by Davis (2011) that backwash water may represent 1 to 5 percent of the total production of water in a plant. Assuming that the amount of produced water is the same as the amount of water being filtered through the rapid gravity filters, we realize from Figure 5.1 thatonly one of the filter categories represented in this study falls within this range. The secondary filters at Hyndevad water treatment plant use an amount of backwash water that is representa-tive of approximately 2 percent of the total amount of water being filtered, which is a fairly low value indicating that in terms of backwash water consumption these filters are rather efficient.

38
Figure 5.1. Analogy of the volume water used for backwash to volume filtered water ratio of the various filters represented in this study.
The raw water filters at Hyndevad and the filters at Hässleholm wastewater treatment plant use an amount of backwash water that is representative of about 6.4 percent and 7.6 percent respec-tively of the total amount of filtered water passing the filters, thus exceeding the values recom-mended by Davis. The higher value of the raw water filters at Hyndevad indicates that more backwash water is being used than is recommended and that the backwash procedure should be evaluated and perhaps adjusted to decrease the amount of water used for backwash. Treating wastewater, the filters in Hässleholm operate under different circumstances than the other filters in this study and with the heavier grade of pollution it is to be expected that backwashing will occur more frequently, thus also increasing the amount of water used for backwash in correla-tion to the amount of water that is filtered.
However, as good as these numbers are to evaluate the backwash efficiency, a proper evaluation of the filter performance itself is not possible unless filters are run long enough to have back-wash initiated because of head loss or turbidity. The amount of water being filtered is deter-mined by the filter run time and when backwash is initiated on schedule, the amount of filtered water is not restricted by the filtration capacity. Thus, the amount of backwash water can only be related to the amount of water that has been allowed to pass the filter and not the true amount of water that could possibly be filtered before the filter has to be taken out of operation. The presented numbers in Figure 5.1 are therefore merely an evaluation of the current backwash processes being conducted rather than the true capacity of the filters and the effect of the un-derdrain system.
The amount of backwash water used in filter 6 at Sörmoverket in Karlstad is representative ofonly about 0.9 percent of the amount of water produced in the same filter. This value is less than what Davis suggests and indicates that the consumption of backwash water may be atten-uated well below the volumes commonly used if the backwash procedure was to be adjusted and improved. This would allow saving water and consequently also saving energy.
6,44%
1,94%
7,57%
0,89%
0,00%1,00%2,00%3,00%4,00%5,00%6,00%7,00%8,00%
Hyndevad, rawwater
Hyndevad,secondary
Hässleholm Sörmoverket
Ratio of volume water used for backwashing to volume filtered water
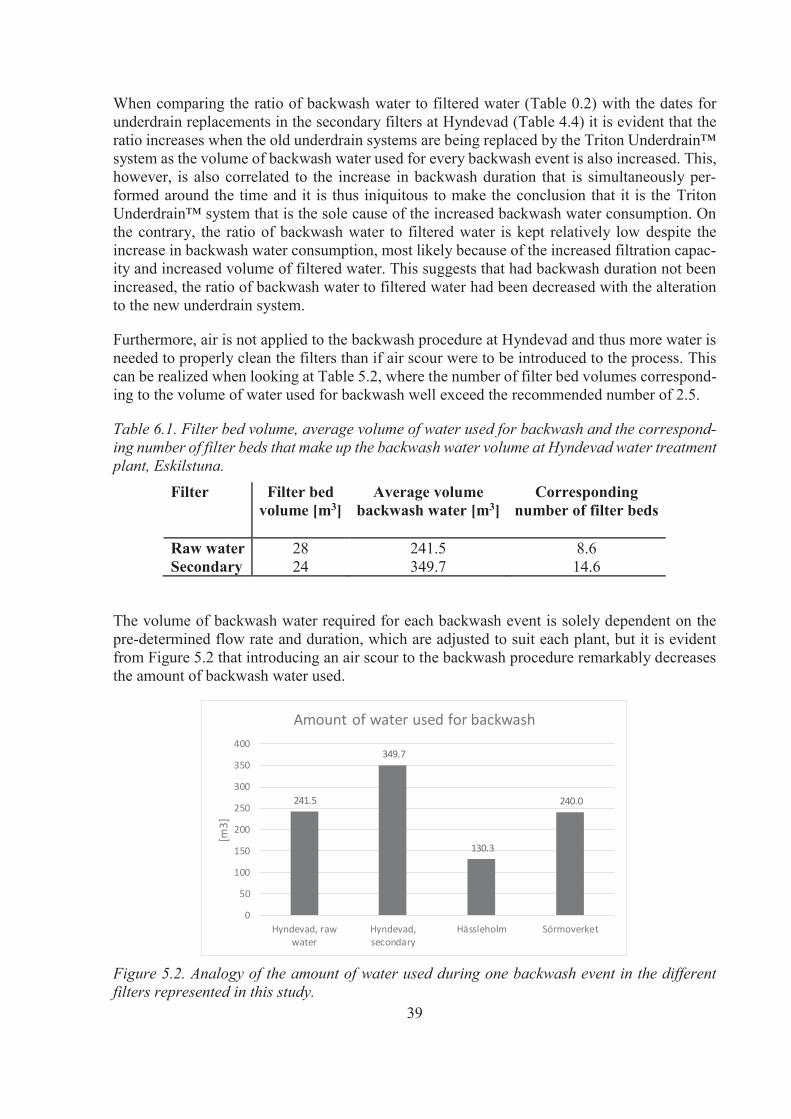
39
When comparing the ratio of backwash water to filtered water (Table 0.2) with the dates for underdrain replacements in the secondary filters at Hyndevad (Table 4.4) it is evident that the ratio increases when the old underdrain systems are being replaced by the Triton Underdrain™system as the volume of backwash water used for every backwash event is also increased. This,however, is also correlated to the increase in backwash duration that is simultaneously per-formed around the time and it is thus iniquitous to make the conclusion that it is the Triton Underdrain™ system that is the sole cause of the increased backwash water consumption. On the contrary, the ratio of backwash water to filtered water is kept relatively low despite the increase in backwash water consumption, most likely because of the increased filtration capac-ity and increased volume of filtered water. This suggests that had backwash duration not been increased, the ratio of backwash water to filtered water had been decreased with the alteration to the new underdrain system.
Furthermore, air is not applied to the backwash procedure at Hyndevad and thus more water is needed to properly clean the filters than if air scour were to be introduced to the process. This can be realized when looking at Table 5.2, where the number of filter bed volumes correspond-ing to the volume of water used for backwash well exceed the recommended number of 2.5.
Table 6.1. Filter bed volume, average volume of water used for backwash and the correspond-ing number of filter beds that make up the backwash water volume at Hyndevad water treatment plant, Eskilstuna.
Filter Filter bedvolume [m3]
Average volumebackwash water [m3]
Correspondingnumber of filter beds
Raw water 28 241.5 8.6Secondary 24 349.7 14.6
The volume of backwash water required for each backwash event is solely dependent on the pre-determined flow rate and duration, which are adjusted to suit each plant, but it is evident from Figure 5.2 that introducing an air scour to the backwash procedure remarkably decreases the amount of backwash water used.
Figure 5.2. Analogy of the amount of water used during one backwash event in the different filters represented in this study.
241.5
349.7
130.3
240.0
0
50
100
150
200
250
300
350
400
Hyndevad, rawwater
Hyndevad,secondary
Hässleholm Sörmoverket
[m3]
Amount of water used for backwash

40
6.6 Energy efficiencyTo evaluate the energy efficiency, the amount of energy consumed during backwash has been related to the amount of water being filtered, the amount of water used for backwash and the total amount of energy used for one backwash event. It is evident from Figure 5.3 as well as Figure 5.4 that in this study, a combined water and air backwash requires more energy per volume water, both used for backwash and filtered. Again, the volume of filtered water is de-termined by the pre-adjusted filter run time rather than the filter capacity itself, making the energy consumption in relation to filtered water a measure of the current filter operation settings rather than the filter capacity. Naturally, the energy consumption in relation to filtered water is less in filters operating with a longer filter run time. If the filters in Hässleholm were back-washed less frequently than each day, the energy consumption would probably be less unevenamong the different filters in this study.
From Figure 5.8, Figure 5.9 and Figure 5.11 it is obvious that the energy efficiency of the back-wash procedure has been improved with the new underdrain system.
Despite requiring more energy per volume water used for backwash and volume filtered water, it can be seen in Figure 5.5 that the total amount of energy consumed during one backwash event is not necessarily the highest when a combined water and air backwash is performed. The duration of the backwash, and of course the power of the pump, determines the energy con-sumption and as can be seen in Figure 5.5 a longer duration of water only backwashing requires more energy than a shorter duration of water and air combined. It is probable that the energy consumption of backwashing of the secondary filters at Hyndevad could be made even more efficient if air was to be introduced to the procedure and the backwash duration would be con-tracted.
Figure 5.3. Analogy of the backwash pump energy consumption of one backwash event.
7,56
12,41
10,08
5,83
0
2
4
6
8
10
12
14
Hyndevad, rawwater
Hyndevad,secondary
Hässleholm Sörmoverket
[kW
h]
Energy consumption of backwash procedure

41
6.7 General discussion of Triton Underdrain™ systemEach manufacturer utilizes their own methods for development and improvement of their un-derdrains and the full information about the function of a system is likely to be kept a business secret. It is thus problematic to extensively evaluate the performance of one such system if not all the evaluated factors are available for measurement.
Davis (2011) stresses that an underdrain system needs to be physically strong as well as easy to install and maintain. The Triton Underdrain™ system with its low profile, shape and fre-quency of laterals is typically a solid installation that resists many of the physical impacts that a conventional underdrain system might be exposed to and the installation of the system is simple as well as flexible as the system can be manufactured to fit any size and shape of filter basin. However, as the underdrain system is of custom design it is of great importance that the filter dimensions supplied for the design stage are correct and that recommended filtration flow rate and backwash flow rate are ensued.
Other new underdrain systems on the market collect water at the bottom of the filter through perforations in the underdrain surfaces. Thus, if one hole was to clog, this matter could simply be fixed by drilling in the underdrain. This is not possible with the Triton Underdrain™ system. Instead, replacement of underdrain elements is relatively simple as the Triton Underdrain™ system, unlike other products on the market, is not grouted together.
To maintain an even flow distribution in a header and lateral system the lateral lengths must be kept at a minimum, less than ten feet, and in a plenum floor design a deep plenum is required to maintain an even flow distribution (Getting et al. 2001). The one system restricts the filter dimensions whereas the other increases construction costs. The perforated U-shaped laterals of the Triton Underdrain™ system aids in the equalisation of the flow distribution throughout the system, allowing for the laterals to be made longer, and the low profile, semicircle-shaped ele-ments that are placed right onto the concrete floor reduces the required depth of the basin re-markably, allowing more filter media to be added.
As discussed above, the increased filter media depth may not affect the separation ability but when designing and building new treatment works, basins could be significantly made smaller with the lower profile underdrain elements.

42

43
7 ConclusionsStudies show that it is reasonable to believe that the head loss occurring in a rapid gravity filter is affected by the design of the underdrain system and that the head loss can be decreased by modifying the tortuosity of the streamlines in the near vicinity of the underdrain elements. How-ever, it is also pointed out that an underdrain system may be designed to be “too efficient” regarding head loss as the head loss in the underdrain system must exceed that of the head loss in the filter media bed during backwash, or distribution of backwash water will be uneven and inadequate. The computations on head loss in the secondary filters at Hyndevad water treatment plant clearly show that head loss in the Triton Underdrain™ system during filtration is miniscule whereas head loss during backwash is higher than suggested in literature, which with regard to the statement above is considered positive.
Head loss occurring in the underdrain system is only accountable of approximately 15% of the total head loss occurring in the filter and thus, when looking to make rapid gravity filtration processes more energy efficient, the adjustment of the underdrain system will only generate a small difference. On the other hand, head loss occurring in the filter media bed is mainly deter-mined by the size and shape of the media grains and their separation ability and it is generally challenging to affect, which is why adjustment of the underdrain system is a more efficient method of influencing the overall head loss.
From a theoretical point of view, the Triton Underdrain™ system has a favorable design in modifying the curvature of the streamlines in the near vicinity of the underdrain elements. The large open area allowed by the screening technique aids in the collection of filtered water and in the distribution of backwash water, as well as reducing the head loss.
The underdrain design has a considerable influence on the backwash efficiency and it is obvious that an even distribution of backwash water is the key to a successful backwash procedure. The Triton Underdrain™ system appears favorable in this matter due to its semi-circled shape and its screening technique that allow for backwash water to be distributed at almost any location and angle in the filter bed, but a more extensive study could be carried out on this matter.
Two out of four filters in this study are being backwashed on a daily rate but the remaining two filters are exceeding the recommended filter run times by days without seemingly experiencing any issues, suggesting that the Triton Underdrain™ system does in fact increase the filter run time. As all filters’ backwashes are initiated on schedule, the ratio of backwash water to filtered water cannot be related to the full capacity of the underdrain system, but the results in this work show that there is a possibility to decrease the ratio and thus use less water for backwash and consequently less energy.
There is no theoretical evidence supporting the statement that the increased filter media depth allowed by the Triton Underdrain™ system has a positive effect on the separation ability and thus the filtered water quality, but neither is there any theoretical evidence that suggest the op-posite. The suggestion of increasing the filter media depth would rather lead to an increase in head loss and thus the energy costs. However, the direct media retention allowed by the screening technique and the ablation of the support gravel layer could generate less construc-tion costs if a new filter was to be constructed, using the Triton Underdrain™ system.

44
45
8 Future WorkIn assessing the influence of the underdrain system on the performance of a rapid gravity filter, this work has been merely an introduction to how some of the various parameters commonly associated with filter performance may be affected. This work has provided some elemental ideas of how a filter underdrain system may be evaluated, both regarding its interplay with the filter performance and in analogy to a disparate system, but the circumstances under which this study has been undertaken have not been adequate in thoroughly assessing any of these perfor-mances. The results presented in this work are merely suggestions and indications to how a specific type of filter underdrain system may affect the filter performance and more thorough studies should be made to assess the true influence of the underdrain.
Many studies on the pressure drop in the filter media bed and the underdrain system in pressur-ized filters have already been undertaken and a number of these studies have been the founda-tion for some of the conclusions in this work. However, to accurately apply these results to the performance of rapid gravity filters and their underdrain system, similar computational fluid dynamics (CFD) simulations should be made, adjusted to fit the conditions of a rapid gravity filter rather than a pressurized filter. Conveniently, a comparative simulation of the Triton Un-derdrain™ design and a conventional underdrain design could me made to detect any major differences and variations in the pressure drop.
To evaluate the true influence of the design and shape of the underdrain system, various types(or at least two disparate systems) of underdrains should be tested parallelly, preferably in ho-mogeneous filters of the same dimensions. Filter media type should be the same in all filters, as should filtration rate and raw water quality in order to obtain results that can be effectivelycompared and correlated to shape and design with as few interfering factors as possible. The head loss through the underdrain system is a major parameter to be evaluated, specifically if one is looking to reduce energy consumption of the filtration and/or backwash process. Varia-tions in separation efficiency is most likely not perceptibly notable with different underdrain designs, but if it was to be evaluated it is of utmost importance that the filter media and the raw water quality characteristics are identical in the different cases as separation efficiency is fore-most dependent on the grain size and material.
To more thoroughly evaluate specifically the Triton Underdrain™ system, the same method as described above is recommended. A legitimate assessment of its performance in analogy to other underdrain systems can only be made when identical conditions are applied to the dispar-ate systems, eliminating as many interfering factors as viable. Filters of the same size and shape, preferably with the same type of filter media and operated with the same flow rate and treating the same water, would be optimal for such a study. During filtration, the development of head loss over time as well was turbidity should be measured as these are the most common param-eters that regulate the initiation of backwash and thus more interesting to the plant operators.During backwash, volume of water used to perform the backwash as well as energy consump-tion of the backwash pump until the filter bed is sufficiently cleaned, should be measured.
Optimally, a long term study of the filter performance and the influence of the underdrain sys-tem should be made to cover the possibility of having variations in raw water quality throughout the year and to allow stabilization of the filtration process, should any major adjustments have been made prior to the initiation of the study. Preferably, the disparate underdrain systems shall not diverge too much in age as an older system is likely to show inferior performance.

46
To evaluate the backwash efficiency and procedure, the main areas of interest are distribution of backwash water and required amount of water and energy. The amount of water and energy can commonly be attained from flow meters on the filter and from measurements of pump power and should be rather easy to obtain.
For a specific filter, the variation in consumption of backwash water and pump energy for a water only backwash and a combined water and air backwash is a most interesting assessment. How much water can be saved by introducing air to the backwash process and what effect will it have on the backwash energy consumption? Such a study should conveniently be carried out by measuring the volume of water used for backwash and the energy consumed by the back-wash pump, both for a water only backwash process and a combined water and air backwash process, required to attain a certain grade of cleanliness of the water being transported in the wash water troughs.
To assess the conceivable extent of the filter run time, a long term study should be conducted where the filter is allowed to run until either pressure variations become too great or turbidity levels too high. If the backwash process is initiated on schedule, the full capacity of the filter in terms of filter run time cannot be equitably evaluated. In this matter, however, careful observa-tion of the bacterial growth in the filter bed should be practiced.
47
9 References of LiteratureArbat, G., Pujol, T., Puig-Bargués, J., Duran-Ros, M., Barragán, J., Montoro, L. & Ramírez de Cartagena, F. (2011). Using computational fluid dynamics to predict head losses in the auxiliary elements of a microirrigation sand filter. Transactions of the American Society of Agricultural and Biological Engineers, 54(4), pp. 1367-1376.
doi:10.13031/2013.39038
Arbat, G., Pujol, T., Puig-Bargués, J., Duran-Ros, M., Montoro, L., Barragán, J. & Ramírez de Cartagena, F. (2013). An experimental and analytical study to analyze hydraulic behavior of nozzle-type underdrains in porous media filters. Agricultural Water Management, 126(2013), pp. 64-74.
https://doi.org/10.1016/j.agwat.2013.05.004
Aqseptence Group (2017). Johnson Screens Triton Underdrain™ System. https://www.aqsep-tence.com/app/en/products/johnson-screens-triton-underdrain-system/ [2019-02-10]
Bové, J., Arbat, G., Pujol, T., Duran-Ros, M., Ramírez de Cartagena, F., Velayos, J. & Puig-Bargués, J. (2015). Reducing energy requirements for sand filtration in microirrigation: Im-proving the underdrain and packing. Biosystems Engineering, 140(2015), pp. 67-78.
https://doi-org.ludwig.lub.lu.se/10.1016/j.biosystemseng.2015.09.008
Bové, J., Puig-Bargués, J., Arbat, G., Duran-Ros, M., Pujol, T., Pujol, J. & Ramírez de Carta-gena, F. (2016a). Development of a new underdrain for improving the efficiency of microirri-gation sand media filters. Agricultural Water Management, 179(2017), pp. 296-305.
https://doi.org/10.1016/j.agwat.2016.06.031
Davis, M. L. (2011). Water and wastewater engineering: Design principles and practice. Intl.Ed. New York: McGraw-Hill Education.
De Nora (2015). Tetra® LP Block™ dual parallel lateral underdrain: Efficient and effective drinking water filter floors (product sheet). https://www.tratamentodeagua.com.br/wp-con-tent/uploads/2018/08/TETRA®-LP-BLOCK™-DUAL-PARALLEL-LATERAL-UNDER-DRAIN.pdf [2019-01-30]
Getting, T. M., Geibel, J. & Eades, A. (n.d.). Rehabilitating gravity filter systems using the dual parallel lateral (white paper). http://www.fbleopold.com/library/pdf/wf11.pdf [2019-01-30]
Hässleholm Vatten (2019). Hässleholms Reningsverk. http://www.hassleholmsvatten.se/[2019-05-02]
Hilmer, A. (1995). Separationsprocesser. In Kompendium i VA-Teknik – Byggingenjörslinjen[internal material]. Lund: Väg & Vatten.
Johnson Screens (2008). TRITON® Underdrain systems (product sheet). []

48
Karlstads Kommun (2016). Sörmoverket. https://karlstad.se/Bygga-och-bo/Vatten-och-av-lopp/Dricksvatten/Vattenverk/Sormoverket/ [2019-03-21]
Mesquita, M., Testezlaf, R. & Ramirez, J.C.S. (2012). The effect of media bed characteristics and internal auxiliary elements on sand filter head loss. Agricultural Water Management, 115(2012), pp. 178-185.
https://doi.org/10.1016/j.agwat.2012.09.003
Nakayama, F. S., Boman, B. J. & Pitts, D. J. (2007). Maintenance. In Lamm, F. R., Ayars, J. E. & Nakayama, F. S. (eds.). Microirrigation for Crop Production – Design, Operation and Man-agement. Elsevier Publications, pp. 389-430.
Pujol, T., Arbat, G., Bové, J., Puig-Bargués, J., Duran-Ros, M., Velayos, J. & Ramírez de Car-tagena, F. (2016). Effects of the underdrain design on the pressure drop in sand filters. Biosys-tems Engineering, 150(2016), pp. 1-9.
https://doi.org/10.1016/j.biosystemseng.2016.07.005
Ratnayaka, D. D., Brandt, M. J. & Johnson, K. M. (2009a). Water Filtration Granular Media Filtration. In Ratnayaka, D. D., Brandt, M. J. & Johnson, K. M. (eds.). Water Supply. 6. Edn.,Elsevier Ltd, pp. 315-350.
https://doi.org/10.1016/B978-0-7506-6843-9.00016-0
Shepherd, D. (2007). Rapid gravity sand filters: Developments in filter floor design. Filtration & Separation, 44(5), pp. 14-16.
https://doi-org.ludwig.lub.lu.se/10.1016/S0015-1882(07)70142-8
World Health Organization (WHO) (2017). Guidelines for Drinking-water Quality: fourth edition incorporating the first addendum. Geneva: World Health Organization.
https://apps.who.int/iris/bitstream/handle/10665/254637/9789241549950-eng.pdf?sequence=1
49
10 References of FiguresFigure 3.1
US Environmental Protection Agency (EPA) (1990). Technologies for Upgrading Existing or Designing New Drinking Water Treatment Facilities. Cincinnati, OH: Center for Research In-formation
Figure 3.2
Reprinted from Agricultural Water Management, 179(2017), Bové, J., Puig-Bargués, J., Arbat, G., Duran-Ros, M., Pujol, T., Pujol, J. & Ramírez de Cartagena, F., Development of a new underdrain for improving the efficiency of microirrigation sand media filters, pp. 296-305., Copyright (2017), with permission from Elsevier.
Figure 3.4
Reprinted from Water Supply 6. Edn., Ratnayaka, D. D., Brandt, M. J. & Johnson, K. M., Water Filtration Granular Media Filtration, pp. 315-350, Copyright (2009b), with permission from Elsevier.
Figure 3.5
Reprinted from Water Supply 6. Edn., Ratnayaka, D. D., Brandt, M. J. & Johnson, K. M., Water Filtration Granular Media Filtration, pp. 315-350, Copyright (2009b), with permission from Elsevier.

50

i
Appendix ITable 0.1. Estimated volume of water used each backwash occasion and the ratio of volume backwash water to volume filtered water in the raw water filters at Hyndevad treatment plant.
Filteredwater
Backwashwater
No.backwashes
Ratiobackwash /
filtered
Backwash water /backwash
[m3] [m3] % [m3]
2017January 711 552 35 286 197 4.96 179.1February 642 530 33 738 184 5.25 183.4March 692 936 30 241 151 4.36 200.3April 677 613 33 400 135 4.93 247.4May 730 639 44 774 173 6.13 258.8June 791 943 46 065 177 5.82 260.3July 815 106 52 812 207 6.48 255.1August 616 503 54 598 219 8.86 249.3September 625 113 52 393 203 8.38 258.1October 770 474 55 736 210 7.23 265.4November 716 293 57 584 214 8.04 269.1December 861 336 59 210 218 6.87 271.6
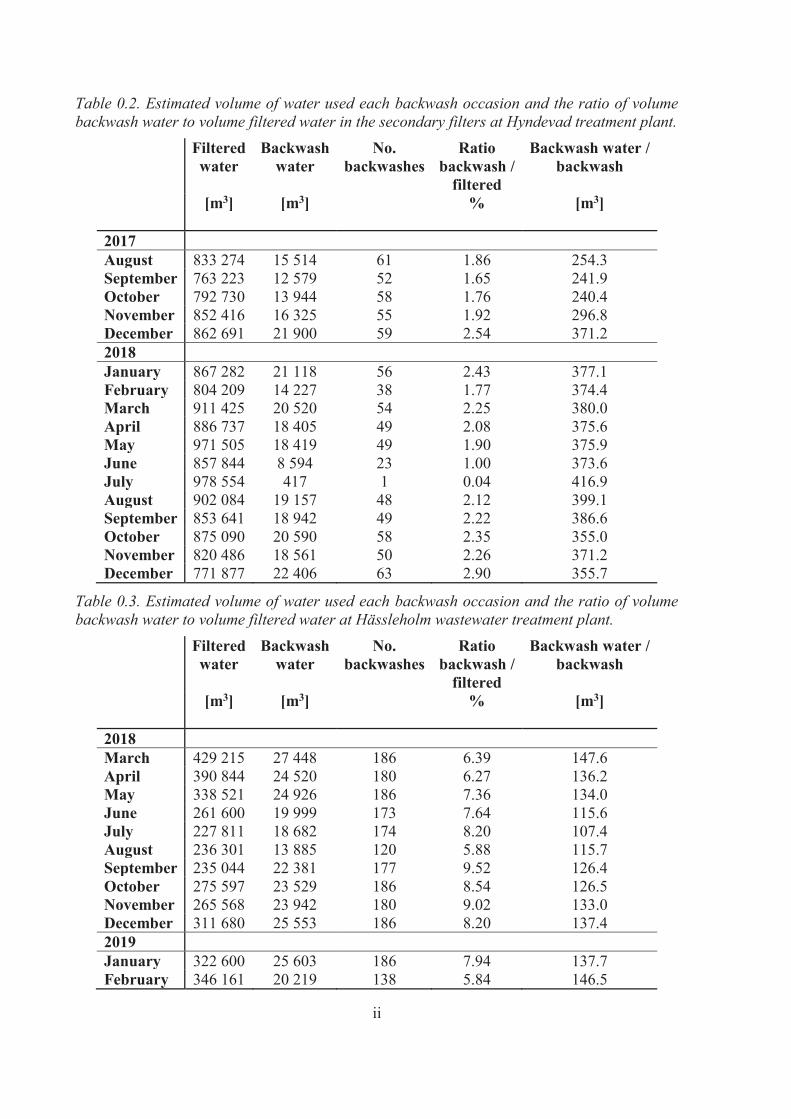
ii
Table 0.2. Estimated volume of water used each backwash occasion and the ratio of volume backwash water to volume filtered water in the secondary filters at Hyndevad treatment plant.
Filteredwater
Backwashwater
No.backwashes
Ratiobackwash /
filtered
Backwash water /backwash
[m3] [m3] % [m3]
2017August 833 274 15 514 61 1.86 254.3September 763 223 12 579 52 1.65 241.9October 792 730 13 944 58 1.76 240.4November 852 416 16 325 55 1.92 296.8December 862 691 21 900 59 2.54 371.22018January 867 282 21 118 56 2.43 377.1February 804 209 14 227 38 1.77 374.4March 911 425 20 520 54 2.25 380.0April 886 737 18 405 49 2.08 375.6May 971 505 18 419 49 1.90 375.9June 857 844 8 594 23 1.00 373.6July 978 554 417 1 0.04 416.9August 902 084 19 157 48 2.12 399.1September 853 641 18 942 49 2.22 386.6October 875 090 20 590 58 2.35 355.0November 820 486 18 561 50 2.26 371.2December 771 877 22 406 63 2.90 355.7
Table 0.3. Estimated volume of water used each backwash occasion and the ratio of volume backwash water to volume filtered water at Hässleholm wastewater treatment plant.
Filteredwater
Backwashwater
No.backwashes
Ratiobackwash /
filtered
Backwash water /backwash
[m3] [m3] % [m3]
2018March 429 215 27 448 186 6.39 147.6April 390 844 24 520 180 6.27 136.2May 338 521 24 926 186 7.36 134.0June 261 600 19 999 173 7.64 115.6July 227 811 18 682 174 8.20 107.4August 236 301 13 885 120 5.88 115.7September 235 044 22 381 177 9.52 126.4October 275 597 23 529 186 8.54 126.5November 265 568 23 942 180 9.02 133.0December 311 680 25 553 186 8.20 137.42019January 322 600 25 603 186 7.94 137.7February 346 161 20 219 138 5.84 146.5

iii
Table 0.4. Backwash water to filtered water ratio in filter 6 at Sörmoverket, Karlstad.
Filtrationperiod
Fil-teredwater
Ratiobackwash
/filtered
Filtrationperiod
Fil-teredwater
Ratiobackwash
/filtered
[m3] % [m3] %
12017/02/25-2017/03/04 26 677 0.90 45
2018/01/20-2018/01/27 27 181 0.88
22017/03/04-2017/03/11 26 549 0.90 46
2018/01/27-2018/02/03 27 168 0.88
32017/04/01-2017/04/08 27 345 0.88 47
2018/02/03-2018/02/10 27 162 0.88
42017/04/08-2017/04/15 27 432 0.87 48
2018/02/10-2018/02/17 25 872 0.93
52017/04/15-2017/04/22 27 258 0.88 49
2018/02/17-2018/02/24 27 640 0.87
62017/04/22-2017/04/29 26 955 0.89 50
2018/02/24-2018/03/03 27 595 0.87
72017/04/29-2017/05/06 27 096 0.89 51
2018/03/03-2018/03/10 26 299 0.91
82017/05/06-2017/05/13 27 170 0.88 52
2018/03/10-2018/03/17 25 432 0.94
92017/05/13-2017/05/20 27 308 0.88 53
2018/03/17-2018/03/24 25 352 0.95
102017/05/20-2017/05/27 27 127 0.88 54
2018/03/24-2018/03/31 25 555 0.94
112017/05/27-2017/06/03 27 499 0.87 55
2018/03/31-2018/04/07 25 426 0.94
122017/06/03-2017/06/10 27 476 0.87 56
2018/04/07-2018/04/14 25 263 0.95
132017/06/10-2017/06/17 27 870 0.86 57
2018/04/28-2018/05/05 26 651 0.90
142017/06/17-2017/06/24 30 264 0.79 58
2018/05/05-2018/05/12 25 152 0.95
152017/06/24-2017/07/01 27 988 0.86 59
2018/05/12-2018/05/19 25 226 0.95
162017/07/01-2017/07/08 27 224 0.88 60
2018/05/19-2018/05/26 24 478 0.98
172017/07/08-2017/07/15 27 232 0.88 61
2018/05/26-2018/06/02 25 156 0.95
182017/07/15-2017/07/22 27 034 0.89 62
2018/06/02-2018/06/09 29 067 0.83
192017/07/22-2017/07/29 27 178 0.88 63
2018/06/09-2018/06/16 27 185 0.88
202017/07/29-2017/08/05 27 133 0.88 64
2018/06/16-2018/06/23 25 033 0.96
212017/08/05-2017/08/12 27 095 0.89 65
2018/06/23-2018/06/30 27 202 0.88
222017/08/12-2017/08/19 27 083 0.89 66
2018/06/30-2018/07/07 30 057 0.80
232017/08/19-2017/08/26 27 100 0.89 67
2018/07/07-2018/07/14 37 399 0.64
242017/08/26-2017/09/02 27 082 0.89 68
2018/07/14-2018/07/21 33 031 0.73
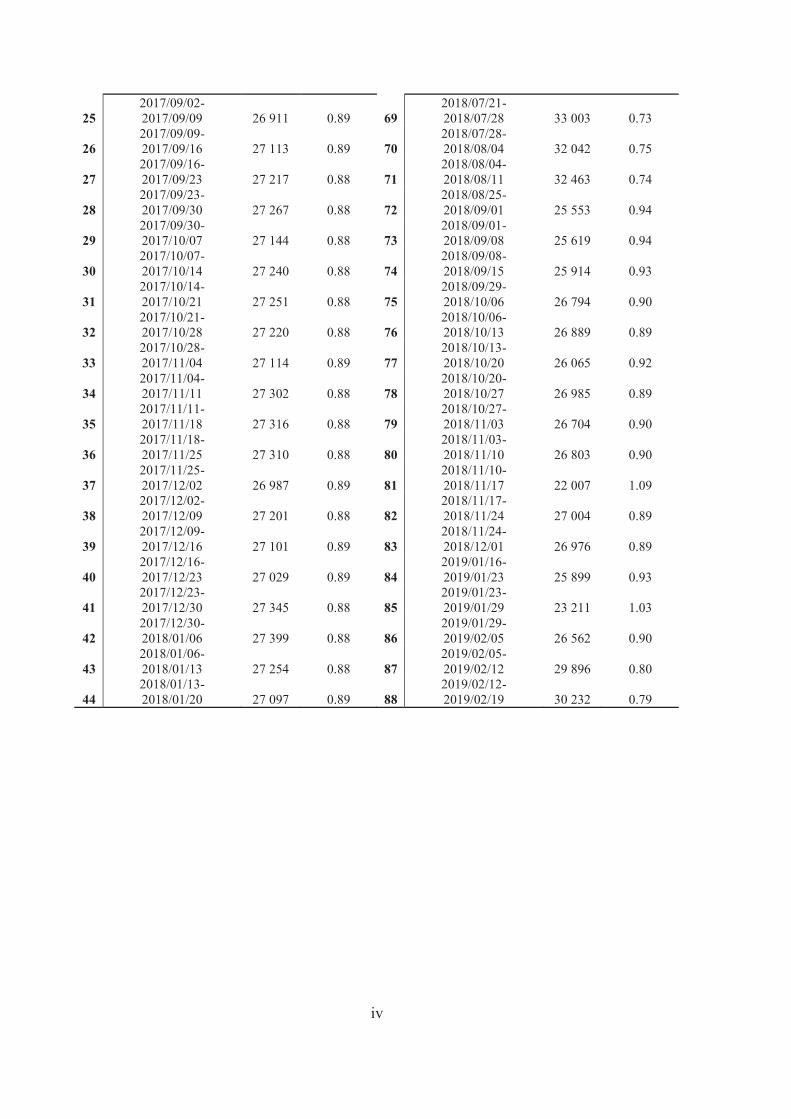
iv
252017/09/02-2017/09/09 26 911 0.89 69
2018/07/21-2018/07/28 33 003 0.73
262017/09/09-2017/09/16 27 113 0.89 70
2018/07/28-2018/08/04 32 042 0.75
272017/09/16-2017/09/23 27 217 0.88 71
2018/08/04-2018/08/11 32 463 0.74
282017/09/23-2017/09/30 27 267 0.88 72
2018/08/25-2018/09/01 25 553 0.94
292017/09/30-2017/10/07 27 144 0.88 73
2018/09/01-2018/09/08 25 619 0.94
302017/10/07-2017/10/14 27 240 0.88 74
2018/09/08-2018/09/15 25 914 0.93
312017/10/14-2017/10/21 27 251 0.88 75
2018/09/29-2018/10/06 26 794 0.90
322017/10/21-2017/10/28 27 220 0.88 76
2018/10/06-2018/10/13 26 889 0.89
332017/10/28-2017/11/04 27 114 0.89 77
2018/10/13-2018/10/20 26 065 0.92
342017/11/04-2017/11/11 27 302 0.88 78
2018/10/20-2018/10/27 26 985 0.89
352017/11/11-2017/11/18 27 316 0.88 79
2018/10/27-2018/11/03 26 704 0.90
362017/11/18-2017/11/25 27 310 0.88 80
2018/11/03-2018/11/10 26 803 0.90
372017/11/25-2017/12/02 26 987 0.89 81
2018/11/10-2018/11/17 22 007 1.09
382017/12/02-2017/12/09 27 201 0.88 82
2018/11/17-2018/11/24 27 004 0.89
392017/12/09-2017/12/16 27 101 0.89 83
2018/11/24-2018/12/01 26 976 0.89
402017/12/16-2017/12/23 27 029 0.89 84
2019/01/16-2019/01/23 25 899 0.93
412017/12/23-2017/12/30 27 345 0.88 85
2019/01/23-2019/01/29 23 211 1.03
422017/12/30-2018/01/06 27 399 0.88 86
2019/01/29-2019/02/05 26 562 0.90
432018/01/06-2018/01/13 27 254 0.88 87
2019/02/05-2019/02/12 29 896 0.80
442018/01/13-2018/01/20 27 097 0.89 88
2019/02/12-2019/02/19 30 232 0.79
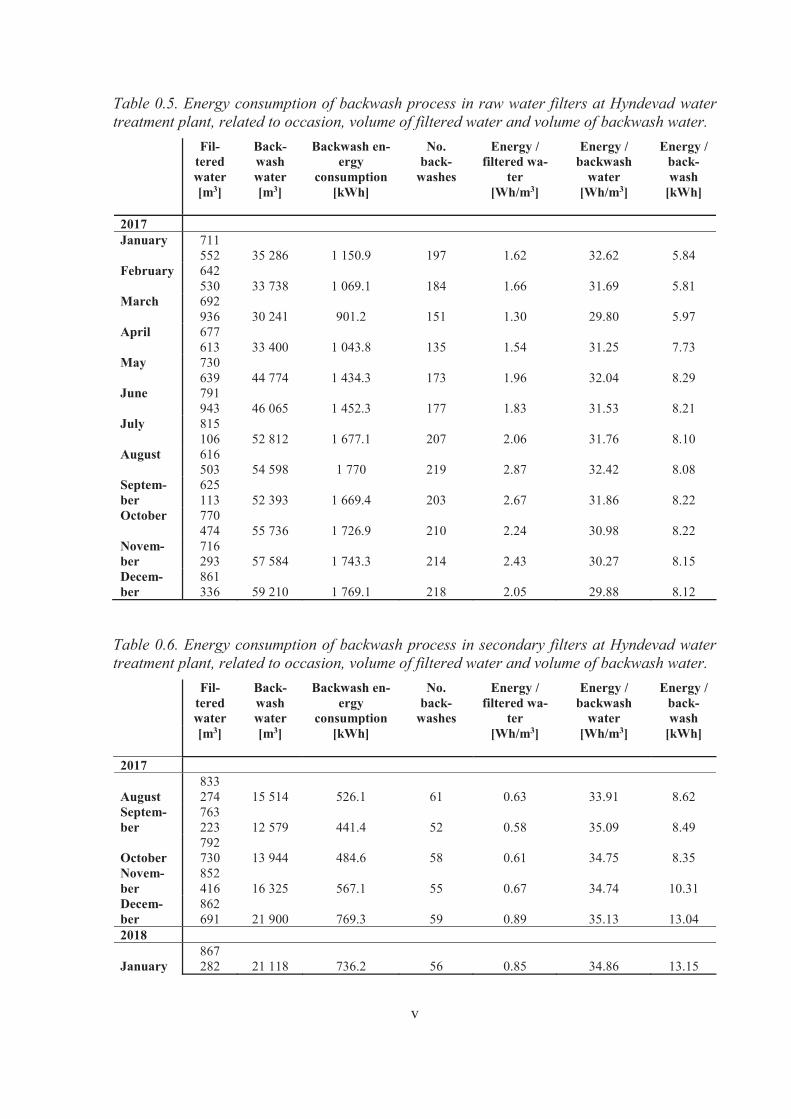
v
Table 0.5. Energy consumption of backwash process in raw water filters at Hyndevad water treatment plant, related to occasion, volume of filtered water and volume of backwash water.
Fil-teredwater
Back-washwater
Backwash en-ergy
consumption
No.back-
washes
Energy /filtered wa-
ter
Energy /backwash
water
Energy /back-wash
[m3] [m3] [kWh] [Wh/m3] [Wh/m3] [kWh]
2017January 711
552 35 286 1 150.9 197 1.62 32.62 5.84February 642
530 33 738 1 069.1 184 1.66 31.69 5.81March 692
936 30 241 901.2 151 1.30 29.80 5.97April 677
613 33 400 1 043.8 135 1.54 31.25 7.73May 730
639 44 774 1 434.3 173 1.96 32.04 8.29June 791
943 46 065 1 452.3 177 1.83 31.53 8.21July 815
106 52 812 1 677.1 207 2.06 31.76 8.10August 616
503 54 598 1 770 219 2.87 32.42 8.08Septem-ber
625113 52 393 1 669.4 203 2.67 31.86 8.22
October 770474 55 736 1 726.9 210 2.24 30.98 8.22
Novem-ber
716293 57 584 1 743.3 214 2.43 30.27 8.15
Decem-ber
861336 59 210 1 769.1 218 2.05 29.88 8.12
Table 0.6. Energy consumption of backwash process in secondary filters at Hyndevad water treatment plant, related to occasion, volume of filtered water and volume of backwash water.
Fil-teredwater
Back-washwater
Backwash en-ergy
consumption
No.back-
washes
Energy /filtered wa-
ter
Energy /backwash
water
Energy /back-wash
[m3] [m3] [kWh] [Wh/m3] [Wh/m3] [kWh]
2017
August833274 15 514 526.1 61 0.63 33.91 8.62
Septem-ber
763223 12 579 441.4 52 0.58 35.09 8.49
October792730 13 944 484.6 58 0.61 34.75 8.35
Novem-ber
852416 16 325 567.1 55 0.67 34.74 10.31
Decem-ber
862691 21 900 769.3 59 0.89 35.13 13.04
2018
January867282 21 118 736.2 56 0.85 34.86 13.15

vi
February804209 14 227 544.2 38 0.68 38.25 14.32
March911425 20 520 735.6 54 0.81 35.85 13.62
April886737 18 405 662.5 49 0.75 36.00 13.52
May971505 18 419 689.3 49 0.71 37.42 14.07
June857844 8 594 307.1 23 0.36 35.74 13.35
July978554 417 13.4 1 0.01 32.18 13.41
August902084 19 157 710.5 48 0.79 37.09 14.80
Septem-ber
853641 18 942 660.6 49 0.77 34.87 13.48
October875090 20 590 724.9 58 0.83 35.21 12.50
Novem-ber
820486 18 561 652.0 50 0.79 35.13 13.04
Decem-ber
771877 22 406 806.7 63 1.05 36.00 12.80
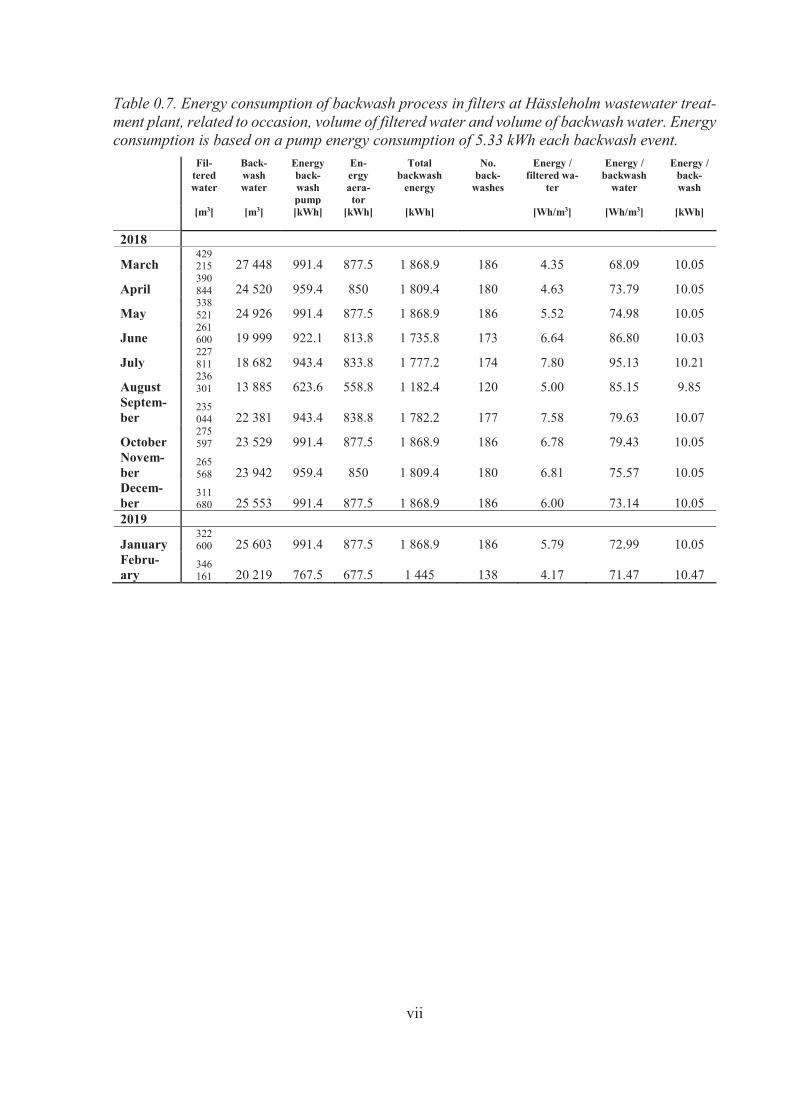
vii
Table 0.7. Energy consumption of backwash process in filters at Hässleholm wastewater treat-ment plant, related to occasion, volume of filtered water and volume of backwash water. Energy consumption is based on a pump energy consumption of 5.33 kWh each backwash event.
Fil-teredwater
Back-washwater
Energyback-washpump
En-ergyaera-tor
Total backwash
energy
No.back-
washes
Energy /filtered wa-
ter
Energy /backwash
water
Energy /back-wash
[m3] [m3] [kWh] [kWh] [kWh] [Wh/m3] [Wh/m3] [kWh]
2018
March429 215 27 448 991.4 877.5 1 868.9 186 4.35 68.09 10.05
April390 844 24 520 959.4 850 1 809.4 180 4.63 73.79 10.05
May338 521 24 926 991.4 877.5 1 868.9 186 5.52 74.98 10.05
June261 600 19 999 922.1 813.8 1 735.8 173 6.64 86.80 10.03
July227 811 18 682 943.4 833.8 1 777.2 174 7.80 95.13 10.21
August236 301 13 885 623.6 558.8 1 182.4 120 5.00 85.15 9.85
Septem-ber
235 044 22 381 943.4 838.8 1 782.2 177 7.58 79.63 10.07
October275 597 23 529 991.4 877.5 1 868.9 186 6.78 79.43 10.05
Novem-ber
265 568 23 942 959.4 850 1 809.4 180 6.81 75.57 10.05
Decem-ber
311 680 25 553 991.4 877.5 1 868.9 186 6.00 73.14 10.05
2019
January322 600 25 603 991.4 877.5 1 868.9 186 5.79 72.99 10.05
Febru-ary
346 161 20 219 767.5 677.5 1 445 138 4.17 71.47 10.47
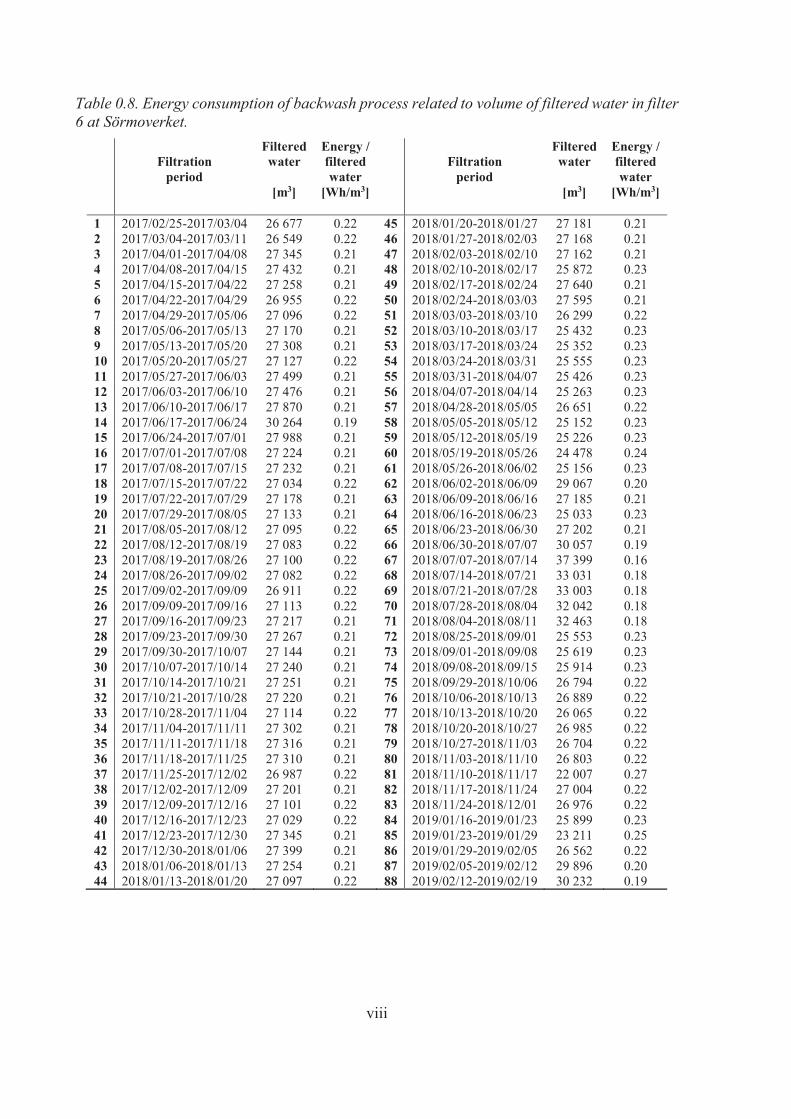
viii
Table 0.8. Energy consumption of backwash process related to volume of filtered water in filter 6 at Sörmoverket.
Filtrationperiod
Filteredwater
Energy /filteredwater
Filtrationperiod
Filteredwater
Energy /filteredwater
[m3] [Wh/m3] [m3] [Wh/m3]
1 2017/02/25-2017/03/04 26 677 0.22 45 2018/01/20-2018/01/27 27 181 0.212 2017/03/04-2017/03/11 26 549 0.22 46 2018/01/27-2018/02/03 27 168 0.213 2017/04/01-2017/04/08 27 345 0.21 47 2018/02/03-2018/02/10 27 162 0.214 2017/04/08-2017/04/15 27 432 0.21 48 2018/02/10-2018/02/17 25 872 0.235 2017/04/15-2017/04/22 27 258 0.21 49 2018/02/17-2018/02/24 27 640 0.216 2017/04/22-2017/04/29 26 955 0.22 50 2018/02/24-2018/03/03 27 595 0.217 2017/04/29-2017/05/06 27 096 0.22 51 2018/03/03-2018/03/10 26 299 0.228 2017/05/06-2017/05/13 27 170 0.21 52 2018/03/10-2018/03/17 25 432 0.239 2017/05/13-2017/05/20 27 308 0.21 53 2018/03/17-2018/03/24 25 352 0.2310 2017/05/20-2017/05/27 27 127 0.22 54 2018/03/24-2018/03/31 25 555 0.2311 2017/05/27-2017/06/03 27 499 0.21 55 2018/03/31-2018/04/07 25 426 0.2312 2017/06/03-2017/06/10 27 476 0.21 56 2018/04/07-2018/04/14 25 263 0.2313 2017/06/10-2017/06/17 27 870 0.21 57 2018/04/28-2018/05/05 26 651 0.2214 2017/06/17-2017/06/24 30 264 0.19 58 2018/05/05-2018/05/12 25 152 0.2315 2017/06/24-2017/07/01 27 988 0.21 59 2018/05/12-2018/05/19 25 226 0.2316 2017/07/01-2017/07/08 27 224 0.21 60 2018/05/19-2018/05/26 24 478 0.2417 2017/07/08-2017/07/15 27 232 0.21 61 2018/05/26-2018/06/02 25 156 0.2318 2017/07/15-2017/07/22 27 034 0.22 62 2018/06/02-2018/06/09 29 067 0.2019 2017/07/22-2017/07/29 27 178 0.21 63 2018/06/09-2018/06/16 27 185 0.2120 2017/07/29-2017/08/05 27 133 0.21 64 2018/06/16-2018/06/23 25 033 0.2321 2017/08/05-2017/08/12 27 095 0.22 65 2018/06/23-2018/06/30 27 202 0.2122 2017/08/12-2017/08/19 27 083 0.22 66 2018/06/30-2018/07/07 30 057 0.1923 2017/08/19-2017/08/26 27 100 0.22 67 2018/07/07-2018/07/14 37 399 0.1624 2017/08/26-2017/09/02 27 082 0.22 68 2018/07/14-2018/07/21 33 031 0.1825 2017/09/02-2017/09/09 26 911 0.22 69 2018/07/21-2018/07/28 33 003 0.1826 2017/09/09-2017/09/16 27 113 0.22 70 2018/07/28-2018/08/04 32 042 0.1827 2017/09/16-2017/09/23 27 217 0.21 71 2018/08/04-2018/08/11 32 463 0.1828 2017/09/23-2017/09/30 27 267 0.21 72 2018/08/25-2018/09/01 25 553 0.2329 2017/09/30-2017/10/07 27 144 0.21 73 2018/09/01-2018/09/08 25 619 0.2330 2017/10/07-2017/10/14 27 240 0.21 74 2018/09/08-2018/09/15 25 914 0.2331 2017/10/14-2017/10/21 27 251 0.21 75 2018/09/29-2018/10/06 26 794 0.2232 2017/10/21-2017/10/28 27 220 0.21 76 2018/10/06-2018/10/13 26 889 0.2233 2017/10/28-2017/11/04 27 114 0.22 77 2018/10/13-2018/10/20 26 065 0.2234 2017/11/04-2017/11/11 27 302 0.21 78 2018/10/20-2018/10/27 26 985 0.2235 2017/11/11-2017/11/18 27 316 0.21 79 2018/10/27-2018/11/03 26 704 0.2236 2017/11/18-2017/11/25 27 310 0.21 80 2018/11/03-2018/11/10 26 803 0.2237 2017/11/25-2017/12/02 26 987 0.22 81 2018/11/10-2018/11/17 22 007 0.2738 2017/12/02-2017/12/09 27 201 0.21 82 2018/11/17-2018/11/24 27 004 0.2239 2017/12/09-2017/12/16 27 101 0.22 83 2018/11/24-2018/12/01 26 976 0.2240 2017/12/16-2017/12/23 27 029 0.22 84 2019/01/16-2019/01/23 25 899 0.2341 2017/12/23-2017/12/30 27 345 0.21 85 2019/01/23-2019/01/29 23 211 0.2542 2017/12/30-2018/01/06 27 399 0.21 86 2019/01/29-2019/02/05 26 562 0.2243 2018/01/06-2018/01/13 27 254 0.21 87 2019/02/05-2019/02/12 29 896 0.2044 2018/01/13-2018/01/20 27 097 0.22 88 2019/02/12-2019/02/19 30 232 0.19
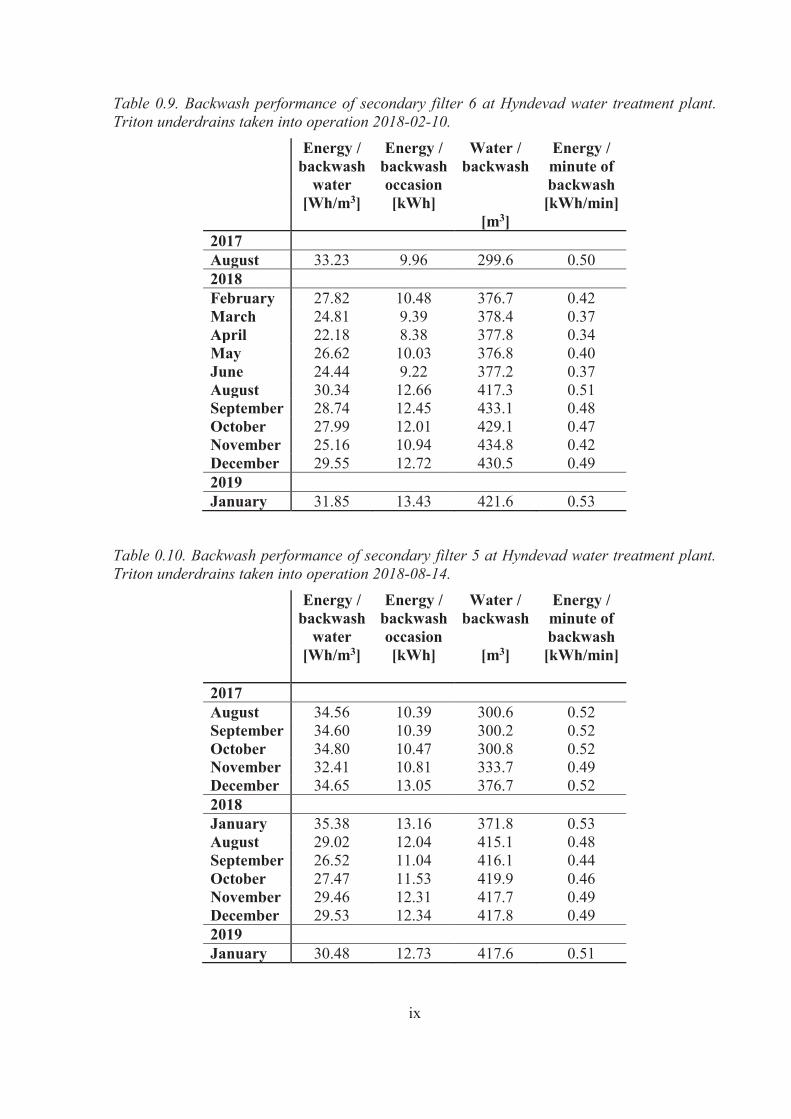
ix
Table 0.9. Backwash performance of secondary filter 6 at Hyndevad water treatment plant.Triton underdrains taken into operation 2018-02-10.
Energy /backwash
water
Energy /backwashoccasion
Water /backwash
Energy /minute ofbackwash
[Wh/m3] [kWh][m3]
[kWh/min]
2017August 33.23 9.96 299.6 0.502018February 27.82 10.48 376.7 0.42March 24.81 9.39 378.4 0.37April 22.18 8.38 377.8 0.34May 26.62 10.03 376.8 0.40June 24.44 9.22 377.2 0.37August 30.34 12.66 417.3 0.51September 28.74 12.45 433.1 0.48October 27.99 12.01 429.1 0.47November 25.16 10.94 434.8 0.42December 29.55 12.72 430.5 0.492019January 31.85 13.43 421.6 0.53
Table 0.10. Backwash performance of secondary filter 5 at Hyndevad water treatment plant. Triton underdrains taken into operation 2018-08-14.
Energy /backwash
water
Energy /backwashoccasion
Water /backwash
Energy /minute ofbackwash
[Wh/m3] [kWh] [m3] [kWh/min]
2017August 34.56 10.39 300.6 0.52September 34.60 10.39 300.2 0.52October 34.80 10.47 300.8 0.52November 32.41 10.81 333.7 0.49December 34.65 13.05 376.7 0.522018January 35.38 13.16 371.8 0.53August 29.02 12.04 415.1 0.48September 26.52 11.04 416.1 0.44October 27.47 11.53 419.9 0.46November 29.46 12.31 417.7 0.49December 29.53 12.34 417.8 0.492019January 30.48 12.73 417.6 0.51
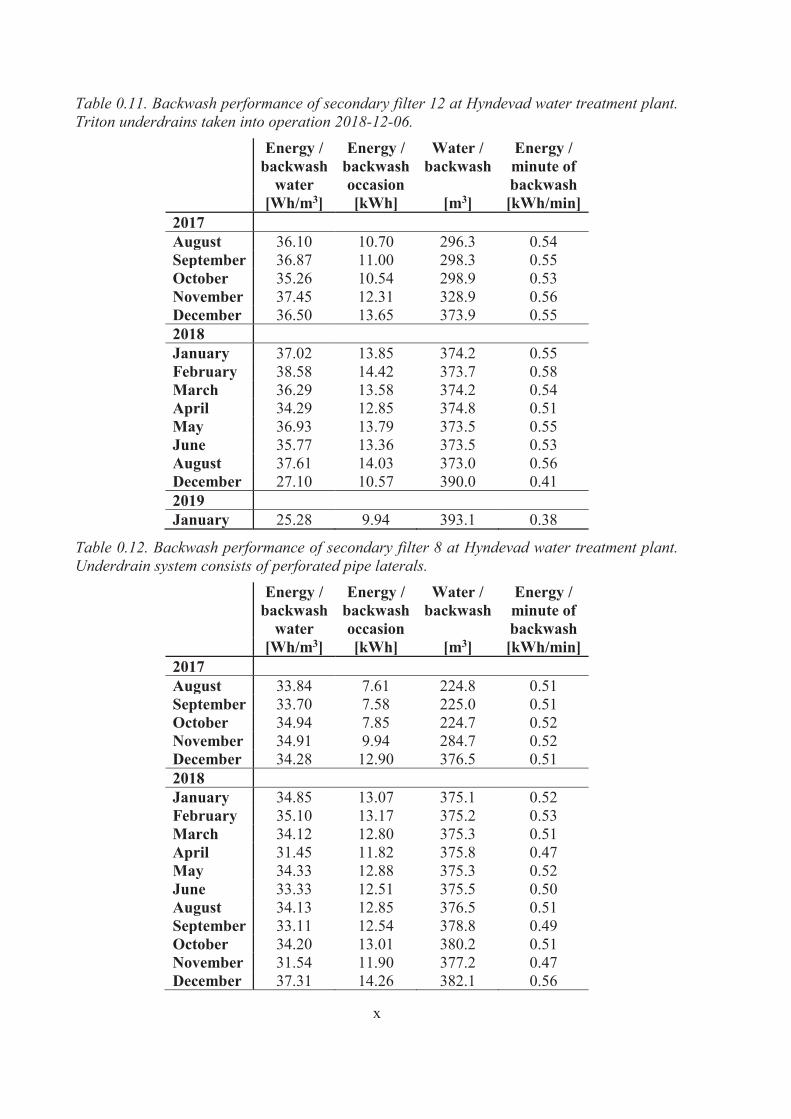
x
Table 0.11. Backwash performance of secondary filter 12 at Hyndevad water treatment plant. Triton underdrains taken into operation 2018-12-06.
Energy /backwash
water
Energy /backwashoccasion
Water /backwash
Energy /minute ofbackwash
[Wh/m3] [kWh] [m3] [kWh/min]2017August 36.10 10.70 296.3 0.54September 36.87 11.00 298.3 0.55October 35.26 10.54 298.9 0.53November 37.45 12.31 328.9 0.56December 36.50 13.65 373.9 0.552018January 37.02 13.85 374.2 0.55February 38.58 14.42 373.7 0.58March 36.29 13.58 374.2 0.54April 34.29 12.85 374.8 0.51May 36.93 13.79 373.5 0.55June 35.77 13.36 373.5 0.53August 37.61 14.03 373.0 0.56December 27.10 10.57 390.0 0.412019January 25.28 9.94 393.1 0.38
Table 0.12. Backwash performance of secondary filter 8 at Hyndevad water treatment plant. Underdrain system consists of perforated pipe laterals.
Energy /backwash
water
Energy /backwashoccasion
Water /backwash
Energy /minute ofbackwash
[Wh/m3] [kWh] [m3] [kWh/min]2017August 33.84 7.61 224.8 0.51September 33.70 7.58 225.0 0.51October 34.94 7.85 224.7 0.52November 34.91 9.94 284.7 0.52December 34.28 12.90 376.5 0.512018January 34.85 13.07 375.1 0.52February 35.10 13.17 375.2 0.53March 34.12 12.80 375.3 0.51April 31.45 11.82 375.8 0.47May 34.33 12.88 375.3 0.52June 33.33 12.51 375.5 0.50August 34.13 12.85 376.5 0.51September 33.11 12.54 378.8 0.49October 34.20 13.01 380.2 0.51November 31.54 11.90 377.2 0.47December 37.31 14.26 382.1 0.56
Related Documents


![FILTER OUT COOLANT FINES - Mayfran International · replacing it with clean media [2]. AVAILABLE MODELS The HPF is a deep-bed gravity filter that is available in a range of sizes](https://static.cupdf.com/doc/110x72/5fa54c167baf7c74b67117cb/filter-out-coolant-fines-mayfran-replacing-it-with-clean-media-2-available.jpg)