Full Year Results 2017 Media and Financial Analysts Conference Martin Schaufelberger – CEO COLTENE Holding AG Gerhard Mahrle – CFO COLTENE Holding AG Zurich - March 6, 2018 COLTENE – AN INTERNATIONALLY LEADING DEVELOPER, MANUFACTURER AND SELLER OF CONSUMABLES AND SMALL EQUIPMENT FOR DENTAL PRACTITIONERS. Upgrade Dentistry

Welcome message from author
This document is posted to help you gain knowledge. Please leave a comment to let me know what you think about it! Share it to your friends and learn new things together.
Transcript

Full Year Results 2017
Media and Financial Analysts Conference
Martin Schaufelberger – CEO COLTENE Holding AG
Gerhard Mahrle – CFO COLTENE Holding AG
Zurich - March 6, 2018
COLTENE – AN INTERNATIONALLY LEADING DEVELOPER, MANUFACTURER AND SELLER OF CONSUMABLES AND SMALL EQUIPMENT FOR DENTAL PRACTITIONERS.
Upgrade Dentistry

Safe Harbor Statement
The information made available in this presentation may include forward-
looking statements that reflect intentions, beliefs or current expectations
and projections of the COLTENE Group about future results of operations,
financial conditions, liquidity, performance and similar circumstances. Such
statements are made on the basis of assumptions and expectations which
may prove to be erroneous, although the COLTENE Group believes them
to be reasonable at this time.
2

3
COLTENE Annual Reporting 2017
Highlights 2017Martin Schaufelberger CEO
Financials 2017Gerhard Mahrle CFO
Upgrade DentistryMartin Schaufelberger CEO
Outlook & PrioritiesMartin Schaufelberger CEO

COLTENE – At a GlanceCOMPANY
PORTRAIT
COLTENE is a leading, innovative and
independent Company, operating
internationally in the dental industry focusing
on sustainable and profitable long-term
growth.
COLTENE develops, manufactures and
markets premium consumables in the dental
segments of Restoration, Endodontics,
Prosthetics, Rotary, Infection Control and
Auxiliaries.
Global setup: R&D and operations in Europe,
North America and Brazil; Sales with
worldwide over 220 sales reps via
Distributors.
Sales of COLTENE Group rose in all four
major regions of the world during
the 2017 fiscal year, both in Swiss francs and
in local currency.
160.0
162.3
154.5
160.7
168.0
2013
2014
2015
2016
2017
Net Sales
13.2
15.6
13.3
17.3
19.1
2013
2014
2015
2016
2017
Net Profit
4

PRODUCTSLaunch of BioSonic UC150 and BRILLIANT EverGlow Flow
R&D focus on digital dental treatment methods
SALES
Growth at faster pace than underlying market
Pleasing growth in all four major regions in Swiss francs and local currencies (LC)
headed by India, China and Brazil
Rotary Instruments delivered the highest growth rate
FINANCIALS
Net sales of CHF 168.0 million in 2017; +4.6% compared to 2016
EBIT margin passed the 15% target with a margin of 15.2% (2016: 14.5%)
Net profit grew by 10.4% to CHF 19.1 million (2016: CHF 17.3 million)
Higher Sales, EBIT and Net ProfitFY 2017
HIGHLIGHTS
5
OPERATIONS
2 strategic acquisitions: Diatech and KENDA
Ongoing optimization and efficiency gains
Strong commitment to Switzerland as head quarter and manufacturing location

Growth on Every Continent
EMEA
Latin America
Asia
North America
Net Sales in %
NET SALES
BY REGION
6
Total 2017: CHF 168.0 million
70.2
58.1
22.2
17.5
0
10
20
30
40
50
60
70
80
EMEA North America Asia Latin America
2015 2016 2017
Net Sales in
CHF million
+2.9%
+7.5%
+13.8%
+3.0%

24.6%
20.5%
20.7%
13.6%
8.5%
6.6%5.5% Restoration
Infection
Control
Rotary
Instruments
Prosthetics
41.3
34.4 34.7
22.8
14.3
11.19.3
0
5
10
15
20
25
30
35
40
45
2015 20162 2017
Treatment
Auxiliaries
Other
Restoration Strongest, Rotary with Highest Growth
NET SALES
BY PRODUCT
GROUP
Endodontics
7
+2.5%
+2.3% +4.5%
+10.4%
2017CHF 168.0 million
+14.0%
+1.1%+0.5%
Net Sales in
CHF million

Digitalization Opens up New Opportunities
CURRENCIES
MARKETS
TRENDS
Slight depreciation of USD to CHF
Supporting appreciation of EUR to CHF
Stronger BRL to CHF compared to 2016
EMEA: Pleasant growth in Southern Europe, France, Benelux countries and Switzerland
Asia: Continued dynamic growth in India and China
North America: Sales grew in line with underlying markets
Latin America: Pleasing top and bottom line performance in Brazil
Ongoing concentration among distributors
Digital technologies disrupting supply chains and revolutionizing dental treatments
Growing importance of emerging markets
DENTAL
CONSUMABLES
MARKETS
8

OPERATIONAL
EFFICIENCY
On-going optimizations and efficiency gains
Continued automatization and digitalization
Positive effects from modern Customer Relationship Management (CRM) and
Product Information Management (PIM) systems
STRATEGY
Ongoing implementation of strategic goals 2016-2018 focusing on
Sales & Marketing activities, Innovation management and Partnerships
Continued extension of sales force, plus 15 sales reps
2 strategic acquisitions, extension of Rotary Instruments segment
ORGANIZATION
Deepened customer relationships at IDS and European key opinion leader seminar
Intensified training courses and new research alliances
Astrid Waser elected as new member of the Board of Directors by the AGM in 2017
Increasing Operational EfficiencyMANAGEMENT
ACTIONS 2017
9

10
Financials 2017Gerhard Mahrle CFO

SALES
Net sales of CHF 168.0 million; +4.6% compared to 2016; +2.6% organic growth in LC
Asia and Latin America with high one digit growth in LC; North America in line with
markets, EMEA slightly below expectations
Brazil compensating weaker other Latin American markets
FINANCIALS
EBIT margin climbed to 15.2% and passed 15% mid term target
Net profit grew by 10.4% to CHF 19.1 million (2016: CHF 17.3 million)
Slightly lower free cash flow of CHF 16.0 million (2016: CHF 17.1 million)
-> acquisition of Diatech
High equity ratio of 72.7%; net cash position of CHF 13.8 million
Sales and Profit Increase - Solid Balance Sheet
FINANCIAL
SUMMARY
2017
11
Switch to Swiss GAAP FERAccounting

in CHF million 2017 % 2016 % % YoY
Net Sales 168.0 100.00% 160.7 100.00% 4.6%
Material expenses* -46.3 -27.6% -44.3 -27.5% 4.6%
Gross Profit 121.7 72.4% 116.4 72.5% 4.5%
Operating expenses -90.5 -53.9% -87.5 -54.5% 3.4%
Depreciation and
amortization-5.7 -3.4% -5.6 -3.5% 1.9%
EBIT 25.5 15.2% 23.3 14.5% 9.3%
Financial result -1.0 -0.6% 0.1 0.1% n.a.
Tax expenses -5.5 -3.2% -6.2 -3.8% -11.7%
Profit for the period 19.1 11.3% 17.3 10.7% 10.4%
* Raw materials used, changes in inventory and work performed capitalized
Comments
• Net sales growth of 4.6%
• Positive FX impact of CHF 1.7 million or
1.1% on net sales
• 2.6% organic growth in local currencies
• Diatech contributed CHF 1.8 million
• OPEX increase: 2/3 due to planned
increase of personnel expenses
• Negative financial result driven by
currency losses on IC loans
• Tax rate decreased from 26.3% to 22.2%
mainly due to the reduction of the income
tax rate in the US (lower DTL)
Substantial Increase in ProfitabilityINCOME
STATEMENT
12

Positive Development of EBIT and Net ProfitINCOME
STATEMENT
13
18
20
22
24
26
28
30
in CHF million
23.3
25.5
-0.1-3.0
5.3
10
12
14
16
18
20
22
24
17.3
in CHF million
-0.1-3.0
5.3
19.1
-1.1 0.7

Comments
• Balance sheet total increased by CHF
6.9 million or 4.3% (increase of NWC)
• High cash balance of CHF 22.0 million
and net cash position of CHF 13.8
million
• Increase of intangible assets on
account of the acquisition of Diatech
and positive currency effects
• Reduction of bank loans by CHF 4.6
million
• Reduction of US income tax rate leads
to a reduction of DTL
• Equity ratio increased from 70.0% to
72.7%.
in CHF million 31.12.17 31.12.16 YoY
Cash & cash equivalents 22.0 21.6 0.5
Receivables 40.5 36.0 4.5
Inventory 31.6 30.8 0.7
Property, plant & equipment 28.4 30.0 -1.5
Financial, intangible & tax assets 44.8 42.0 2.8
Total assets 167.3 160.4 6.9
31.12.17 31.12.16 YoY
Payables & short term liabilities 23.1 18.6 4.5
Bank loans 8.3 12.9 -4.6
Other long term liabilities 14.3 16.7 -2.4
Equity 121.7 112.3 9.5
Total liabilities & equity 167.3 160.4 6.9
Net cash 13.8 8.6 5.1
Solid Balance Sheet and High Equity RatioBALANCE
SHEET
14

Comments
• Drop of cash flow from operating
activities through an increase of the net
working capital and higher income
taxes paid despite a higher net income
• CHF 5.9 million cash flow from
investing activities including the
acquisition of Diatech
• Free cash flow CHF 1.1 million lower
than in the previous year
High Positive Free Cash FlowCASH FLOW
STATEMENT
in CHF million 2017 2016 % YoY
Net profit 19.1 17.3 10.4%
Depreciation and amortization 5.7 5.6 1.9%
Other non cash items 4.6 4.3 8.5%
Changes in NWC -1.0 0.6 n.a.
Interest, tax paid/received -6.5 -5.0 28.4%
Cash flow from operating activities 21.9 22.7 -3.4%
Purchase of PPE (net) -4.1 -5.1 -19.0%
Purchase of int./finan. assets (net) -1.8 -0.5 260%
Cash flow from investing activities -5.9 -5.6 4.7%
Cash flow from financing activities -15.7 -10.1 54.9%
Change in cash and cash equivalents 0.5 6.9 -93.2%
Free cash flow 16.0 17.1 -6.1%
In % of net sales 9.5% 10.6%
15

Attractive Share Performance and Dividend
0.00
1.00
2.00
3.00
4.00
5.00
2013 2014 2015 2016 2017*
Earnings per Share Dividendin CHF
SHARE
PERFORMANCE
16
*Board of Directors’ proposal to the AGM on March 28, 2018
40.00
50.00
60.00
70.00
80.00
90.00
100.00
110.00
05.0
1.2
01
5
05.0
3.2
01
5
05.0
5.2
01
5
05.0
7.2
01
5
05.0
9.2
01
5
05.1
1.2
01
5
05.0
1.2
01
6
05.0
3.2
01
6
05.0
5.2
01
6
05.0
7.2
01
6
05.0
9.2
01
6
05.1
1.2
01
6
05.0
1.2
01
7
05.0
3.2
01
7
05.0
5.2
01
7
05.0
7.2
01
7
05.0
9.2
01
7
05.1
1.2
01
7
05.0
1.2
01
8
COLTENE SPIin CHF

Re-election of the current members of the Board of Directors
Dividend to the AGM 2018
CHF 3.00 per share; Dividend yield of 3.2% based on year-end share price of CHF 94.9
Payout ratio of 66%
Compensation of the Board of Directors and Group Management
Maximum aggregated amount of compensation
- for the members of the Board of Directors for financial year 2019: CHF 560’000
- for the members of Group Management for financial year 2019: CHF 3’100’000
Consultative vote on the Compensation Report 2017
Re-election of EY as Group auditor
Proposals to the General AssemblyAGM 2017
17
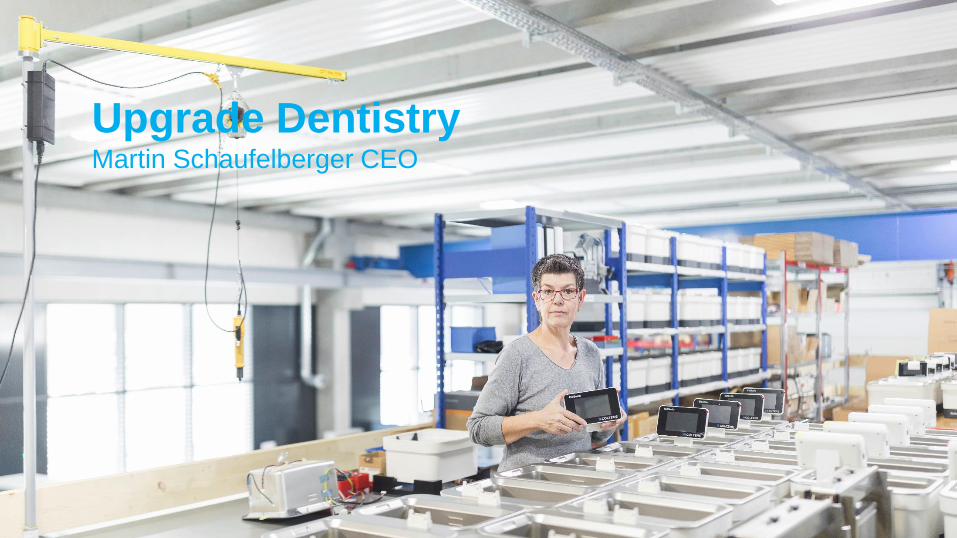
Upgrade DentistryMartin Schaufelberger CEO

COLTENE is convinced that everything can
always be a little bit better, easier and more
reliable.
With expertise and enthusiasm, we turned this
claim into reality. The Company knows exactly
what its end customers need and desire.
The teams work tirelessly to provide them with
innovative and smart solutions.
“Upgrade Dentistry”
This is not an empty promise, it is a mission.
Better Quality. Better Reliability. Better Practice.UPGRADE
DENTISTRY
19

Improve efficiency and effectiveness of the global sales teams:
Training of sales staff and use of new sales and marketing tools
Increase number of sales representatives pursuant to market potential:
15 to 20 new sales staff (recruiting process ongoing)
Reinforcement of key account management:
Focus on special markets (governments, group practices)
Increase awareness of COLTENE in major dental schools worldwide:
Intensify contact with universities and dental schools
R&D focus on digital dental treatment methods
Further acceleration of fast track development of new products
Using technology: Product Information Management System (PIM), Customer
Relationship Management (CRM), Digital Marketing (Internet, Social Media) are key
Growth StrategySTRATEGY
STRATEGY
REVIEW WITH
FOCUS ON
SUSTAINABLE
GROWTH
20

Tooth preservation: endodontic treatments and its procedures
Prevention and minimal invasive restoration
Practice infection control management
Auxiliaries for effective processes in dental treatment
Grow opportunities in emerging markets
Strategic cooperations with dental schools, dental institutions, universities and key
opinion leaders
Changes in the distribution channels
Trends – Strategy – InnovationSTRATEGY
TRENDS AND
OPPORTUNITIES
COLTENE IS
MONITORING
CONSTANTLY
21

S1/2016 S2/2016 S1/2017 S2/2017 S1/2018
Recently Launched Products INNOVATION
GuttaFlow® bioseal
Bioactive cold filling system
for root canals
BRILLIANT Crios
CAD/CAM composite blocs
for permanent restoration BRILLIANT EverGlow™ Flow
State-of-the-art universal
submicron hybrid composite
Diatech Z-Rex
Ceramic treatment diamond bur
and ShapeGuard polisher
BioSonic® UC150
Compact 5.7L (1.5 gal) ultrasonic cleaner
with heater and tracing functionality
22
KENDA
Polishette
Diatech
Burs in the US

2323
Outlook & PrioritiesMartin Schaufelberger CEO

Market Opportunities and Challenges
INDUSTRY
CUSTOMERS
SALES
MEGATRENDS
Ongoing consolidation of dealers, distribution and marketing power
More group practices and government business
Brands gain importance in maturing markets
Innovative treatments and shorter treatment times thanks to digital innovations
Growing importance of aesthetic dentistry
Dynamic Asian markets headed by China and India
Competitive environment in North America and some Western European markets
Growth potential in selected Asian countries
Further growth potential in Latin America
Demographic changes – ageing population, growing middle class
Globalization – rising importance of emerging markets
Increasing dental health conditions in developed markets
-
+/-
+
++
+
++
+/-
+
+
++
+
-
Impact
OUTLOOK AND
PRIORITIES
24

PRODUCTSFurther improvement of product portfolio and growth in COLTENE branded products
Market launch of new products supporting digital dental treatments
MARKETSParticipation in general market growth in dental consumables of 2-3%
Exploit growth opportunities spurred by megatrends such as ageing population, growing middle
class and increasing importance of emerging markets
FINANCIALS
Consolidation of EBIT margin at the current level of 15% or more
Focus on top-line growth
FX situation will remain a challenge
Healthy balance sheet with an equity ratio higher than 60%
Attractive payout ratio of at least 60% of consolidated net earnings
OUTLOOK AND
PRIORITIES
25
Exploit further market potential by hiring additional sales specialists
Further increase operational efficiency through modernizations of sites and continued
implementation of digital processes and tools
OPERATIONS
Focus on Profitable and Sustainable Growth

Many thanks for
your attention!
COLTENE – AN INTERNATIONALLY LEADING DEVELOPER, MANUFACTURER AND SELLER OF CONSUMABLES AND SMALL EQUIPMENT FOR DENTAL PRACTITIONERS.

2727
APPENDIXAPPENDIX

Full Spectrum of Dental CareCOMPANY
PORTRAIT
28
Treatment Auxiliaries
Treatment Auxiliaries comprises a broad
range of products for wound care and
treatment and moisture control. These
practical supplies and materials make work
easier and enhance patient comfort.
Endodontics
The Endodontics range is focused on products
for root canal therapy, which entails root canal
preparation, cleansing and obturation.
Infection Control
The Infection Control product category contains
ultrasonic cleaning systems, sterile covers and
face masks that provide an effective barrier
against infection in dental practices.
Prosthetics
In Prosthetics, COLTENE offers a broad range of
Condensation and addition silicon impression materials
with excellent flow properties. Highly precise dental
impressions improve the treatment outcomes of
prosthetic procedures.
Restoration
The Restoration product group offers a
comprehensive range of products for restorative
fillings, from complementary adhesive systems
and restorative filling materials to curing lights.
Rotary Instruments
COLTENE offers a comprehensive range of
carbide drills, diamond burs and polishing tools. Its
Rotary Instruments are distinguished by superior
stability and excellent cutting action.

Global Setup
USA, Cuyahoga Falls (OH)
BRAZIL, Rio de Janeiro
SWITZERLAND, Altstätten
GERMANY, Langenau
North America
Group companies 2
Production sites 1
Latin America
Group companies 1
Production sites 1
Europe
Group companies 10
Production sites 2
Asia Pacific
Group companies 3
Production sites 0
Middle East and Africa
Group companies 0
Production sites 0
COMPANY
PORTRAIT
29

Highly Experienced Group Management
Martin Schaufelberger Group CEO
Since 2012
Before:
• CEO Kunststoff Schwanden,
2007-2012
• Deputy CEO Kunststoff
Schwanden, 2001-2007
Gerhard MahrleGroup CFO
Since 2014
Before:
• CFO Kardex AG, 2009-2013
• CFO sia Abrasives Holding
AG, 2000-2009
• CFO Batigroup Holding AG,
1998-2000
• CFO Eugster/Frismag Group,
1992-1998
Christophe Loretan Vice President Sales
Since 2015
Before:
• Technical Service and Sales
Director EMEA, 2013-2015;
Customer Solutions Director
EMEA, 2006-2013; Global
Marketing Manager, 2003-2005,
Novozymes Switzerland AG,
• Business Development Manager
Pharma/Gastroenterology,
Tillotts Pharma AG, 2002-2003
Werner Barth Vice President Marketing
Since 2015
Before:
• Global Director Marketing
COLTENE/Whaledent AG, 2013-2015
• Vice President Sales, 2006-2013;
Head Marketing & Sales, 2005-2006,
Ziemer Ophthalmic Systems AG,
• Product manager and Sales manager
HMT High Medical Technologies AG,
2001-2004
Werner MannschedelVice President R&D and Regulatory Affairs
Since 2015
Before:
• Global R&D and Regulatory Manager,
2012-2015; Manager global operations,
2011-2012; President European Operations,
2007-2011; Manager European Operations,
2002-2007, COLTENE Group
• General Manager ROEKO
GmbH + Co. KG,1998-2002
COMPANY
PORTRAIT
30

5-Year Overview of the Key FiguresFINANCIALS
OVERVIEW
160.0162.3
154.5
160.7
168.0
140.0
150.0
160.0
170.0
2013 2014 2015 2016 2017
Net Salesin CHF million
13.2
15.6
13.3
17.3
19.1
8.0
12.0
16.0
20.0
2013 2014 2015 2016 2017
Net Profitin CHF million
19.4 22.4 20.4 23.3 25.5
12.1%
13.8%
13.2%
14.5%
15.2%
10.0%
12.0%
14.0%
16.0%
15.0
17.0
19.0
21.0
23.0
25.0
2013 2014 2015 2016 2017
EBIT EBIT Margin in %
-10.3 -2.5
0.9 8.6 13.6
17.016.7
13.7
17.1
16.0
12.0
14.0
16.0
18.0
-12.0
-7.0
-2.0
3.0
8.0
13.0
2013 2014 2015 2016 2017
Net debt/Net cash Free cash flow
in CHF million
in CHF million
31

COLTENE Holding AG
Feldwiesenstrasse 20
9450 Altstätten
Switzerland
www.coltene.com
Martin Schaufelberger Gerhard Mahrle
CEO CFO
[email protected] [email protected]
+41 71 757 53 60 +41 71 757 54 37
CONTACTS
32
Related Documents