The inter-generational transmission of cognitive abilities and early childhood development outcomes in Guatemala Preliminary Report Maria Cecilia Calderon (University of Pennsylvania) John Hoddinott (International Food Policy Research Institute) September 21, 2009

Welcome message from author
This document is posted to help you gain knowledge. Please leave a comment to let me know what you think about it! Share it to your friends and learn new things together.
Transcript

The inter-generational transmission of cognitive abilities and early childhood development outcomes in Guatemala
Preliminary Report
Maria Cecilia Calderon (University of Pennsylvania)
John Hoddinott (International Food Policy Research Institute)
September 21, 2009

2 | P a g e
Summary
This study will examine Early Childhood Development (ECD) outcomes and their association with family characteristics, investments and environmental factors. We are particularly interested in the inter-generational transmission of cognitive abilities. Given the strong causal links between cognitive abilities and economic productivity in adulthood, the inter-generational transmission of these abilities represents an important pathway by which economic advantage or poverty is perpetuated over time, an issue of especial salience in Latin America with its long history of inequality. While there are many associational studies on this topic, these cannot be considered causal given that the cognitive abilities of different generations reflect, in part, unobservable factors such as the genetic heritability of such abilities which are common across generations. We propose to examine the causal relationship between parental cognitive abilities and ECD outcomes of their offspring using a rich data set from rural Guatemala that can account for such unobservable factors.

3 | P a g e
1. Introduction
Ensuring sustainable reductions in poverty requires increasing both the economic opportunities and the
productive capacity of poor populations. Analytical work is continuously needed to identify how human
development traps evolve through the life cycle of poor children, especially in early childhood and in key
transitions though the schooling cycle, and which policies are needed to address them. For example,
recent evidence from Guatemala (Behrman et al, 2009) indicates that cognitive skills such as reading and
vocabulary skills and non-verbal problem solving skills (as measured by Ravens Progressive Matrices) are
causally linked to higher wages. Also, as noted in the RFP, many of these skills are formed early in life
(Heckman, 2000; Carneiro and Heckman, 2003; Heckman, 2005; and Cunha and Heckman, 2007). Thus,
understanding the causal links between factors perceived to be of importance and these early childhood
development (ECD) outcomes has considerable value in terms of informing policy and interventions
designed to improve child welfare and break the intergenerational transmission of poverty and
inequality.1
In our paper, we will examine Early Childhood Development outcomes and their association
with family characteristics, investments and environmental factors. We are particularly interested in the
inter-generational transmission of cognitive abilities. Given the strong causal links between cognitive
abilities and economic productivity in adulthood, the inter-generational transmission of these abilities
represents an important pathway by which economic advantage or poverty is perpetuated over time, an
issue of especial salience in Latin America with its long history of inequality. While there are many
associational studies on this topic, these cannot be considered causal given that the cognitive abilities of
different generations reflect, in part, unobservable factors such as the genetic heritability of such
abilities which are common across generations. We propose to examine the causal relationship between
parental cognitive abilities and ECD outcomes of their offspring using a rich data set from rural
Guatemala that can account for such unobservable factors.
In this preliminary report, we describe our approach to these issues, data sources and methods.
1 The final paper will provide a more detailed literature review.

4 | P a g e
2. Approach: Conceptual framework and estimation issues
There are numerous cross-sectional studies that document associations between parental resources and
measures of ECD. However, it is important to recognize that these are associations, not causal
relationships because these parental resources, such as their human capital, and the subsequent
attainments of their children both reflect long-term familial or dynastic decisions regarding investments
in children.
Consider a three generation dynasty (G1s – grandparents; G2s – children of G1s and parents of
G3s; and G3s – children of G2s and grandchildren of G1s). We observe this dynasty over two periods. In
period 1, G1s make investments in G2s. In period 2, G2s, and possibly G1s, make investments in G3s. An
outcome of period 1 is some measure of human capital – say cognitive skills - that reflects observable G1
decisions on investing in the human capital of G2s, observable G2 characteristics and unobservable G1
and G2 characteristics. An outcome of period 2 is a measure of ECD such as reading and vocabulary
skills. This too will be a function of observable, and unobservable, parental (G2, and possibly G1) and
household characteristics. For example, if aspects of cognitive ability are heritable, observed
associations between cognitive skills of G2s and measures of ECD in G3s cannot be interpreted as causal
because they also reflect correlated unobservables in inputs into ECD such as heritable cognitive
abilities.
This problem can be interpreted as one in which we wish to model the determinants of a vector
of outcomes, investments in human capital, resulting from a dynamic programming problem solved by a
dynasty subject to the constraints imposed by constrained dynastic resources. Given the focus of our
proposed work, we illustrate this approach as follows.2 Period 1 is the period where G1s invest in G2s;
while period 2 is the period on which G2s, and possibly G1s, invest in G3s. We presume that the
measure of a G2s cognitive skill in period 1 (K1, G2) reflects parental decisions on investing in his or her
human capital and is a function of a vector of observable prices, individual and dynastic characteristics
(Z1, G1) that determine the level and efficacy of investments in dimensions of human capital such as
cognitive skills. Consequently, we write a reduced form demand function for cognitive skills as:
K1, G2 = αZ,G2 Z1, G1 + ν1,G2 (1)
2 This discussion draws heavily on work by Alderman, Behrman, Lavy and Menon (2001), Alderman, Hoddinott and Kinsey (2006), Behrman et. al, (2008) and Glewwe, Jacoby and King (2001). Cunha, Heckman, Lochner and Masterov (2005) provide a detailed exposition of models of this form.

5 | P a g e
where ν1, G2 = εH + εk + ε1
is a disturbance term with three components: εH , representing the time invariant dynasty’s environment
and is common to all generations; εk , which captures time invariant G2 specific effects such as genetic
potential; and ε1, a white noise disturbance term.
In period 2, analogous to the presence of other stocks or assets the outcome from (1), K1, G2
appears on the right hand side of the reduced form linear achievement function:
A2, G3 = αK,G3 K1, G2 + αZ,G3Z2, G2 + ν2, G3 (2)
where ν2, G3 = ηH + ηk + η2
and A2, G3 is, say, the vocabulary skills of the G3 child (realized in period 2), Z2, G2 is a vector of other
prices, individual and household and dynastic characteristics that influence academic performance –
possibly, but not necessarily, with elements common to Z1, G1. Like ν1,G2 , ν2,G3 is a disturbance term with
three components: ηH , representing aspects of the dynasty’s environment which influence human
capital formation and are common to all members of the dynasty (this would capture, for example,
attitudes towards schooling); ηk , which captures G3 child specific effects such as innate ability and
motivation that are not controlled by their G2 parents; and η2, a white noise disturbance term. The basic
difficulty with a least squares regression of (2), as noted by Behrman (1996) is the likelihood that E(K1, G2
ν2, G3) ≠ 0 because of possible correlation between K1, G2 and ηH or between K1, G2 and ηk mediated
through either the correlation dynastic effects or individual effects or both. That is, either E(εHηH) ≠ 0 or
E(εkηk) ≠ 0. For example, dynasties with ‘high’ innate cognitive abilities will have children who will,
ceteris paribus, score higher on tests of cognitive ability in both periods 1 and 2. In cases such as these,
estimates of αK,G3 using ordinary least squares will be biased.
3. Study background and data
Study background
The setting for our proposed study is four villages in the eastern region of Guatemala, and the localities
to which people from these villages migrated. All four villages chosen were located relatively close to
the Atlantic Coast highway, connecting Guatemala City to Guatemala’s Caribbean coast. The closest to
Guatemala City was Santo Domingo, only 36 kilometers away; Espíritu Santo was furthest away, at 102

6 | P a g e
kilometers. Beginning in 1969, parents and children participated in a well-known longitudinal study
carried out by the Institute of Nutrition in Central America and Panama (INCAP).
The principal hypothesis of the study was that improved nutrition results in accelerated physical
growth and mental development of pre-school-aged children. This was tested by providing free
nutritional supplements, assigned at random within pairs stratified by village size. In two of the villages,
a high protein-energy drink (atole) was provided. In the other two villages, a zero-protein, low calorie
drink (fresco) was provided. The nutritional supplements were distributed in each village in centrally-
located feeding centers and were available twice daily, to all members of the village on a voluntary
basis, for two to three hours in the mid-morning and two to three hours in the mid-afternoon, times
selected to be convenient to mothers and children, but that did not interfere with usual meal times. All
residents of all villages also were offered high quality curative and preventative medical care free of
charge throughout the intervention.
The purpose of the protein-free supplement group was to control for social stimulation
associated with attending the feeding center; it was not expected to improve nutritional status. The
design reflected the prevailing view in the 1960’s that protein was the critically limiting nutrient in most
developing countries. Atole (163 kcal /11.5 g of protein per 180 ml cup) contained Incaparina (a
vegetable protein mixture developed by INCAP), dry skim milk, and sugar, while fresco contained no
protein and as little sugar and flavoring agents as necessary for palatability (59 kcal per 180 ml cup).
Both drinks were micronutrient-fortified in equal concentrations per unit of volume (Habicht and
Martorell 1992; Read and Habicht 1992).
The INCAP Longitudinal Study (1969–77) corresponding to the intervention, included all children
less than 7 years of age at any point during the intervention. Newborns were included for study until
September 1977 and children were followed through age 7 years or until study closeout, whichever
came first. All children in the sample, then, were born between 1962 and 1977. The associated surveys
carried out were rich in data about home environment and child growth, cognitive development, diet,
and morbidity. Subsamples of the original 2392 children surveyed during 1969–77, have been re-
surveyed periodically since then. The first of these was the Follow-up Study (1988–89), which collected
information on human capital and productivity on original sample members (of the INCAP Longitudinal
Study) who at the time of the follow-up were between 11–27 years of age (Martorell, Habicht, and
Rivera 1995). Original sample members were re-interviewed as part of the Human Capital Study (HCS) in
2002–04 (Grajeda et al. 2005; Martorell et al. 2005; Stein et al. 2008). By then, individuals from the

7 | P a g e
1969–77 survey were adults, and ranged from 25–42 years old.3 More recently, as part of the
Intergenerational Transfers Study (IGT), between January 2006 and August 2007, we undertook new
fieldwork interviewing:
• The biological parents and current partners of biological parents of the original sample member;
• The spouses or partners of the original sample member;4 and
• The children5 under 12 years old of the original sample member, living in the same household.
In short, the target sample included original sample members from the INCAP Longitudinal Study
who lived in the IGT study area and had participated in HCS, as well as their parents, spouses, and
children under 12 years old.6 (Melgar et al, 2008, provides a wealth of detail on how the sample was
operationalized, how respondents were traced and full details on the data that were collected.) We
designated parents of original sample members as the elder or grandparent generation, which we refer
to as the first generation or the “G1” generation. Next, we designated original sample members, their
siblings, and their spouses, as the middle or parent generation, i.e., the second generation referred to as
“G2s.” Finally, we designated children of original sample members as the child (or grandchild)
generation, i.e., the third generation referred to as “G3s.” Note that these designations correspond
precisely to those used in our conceptual framework.
Data: Outcomes
Crucially for our proposed study, these surveys contain the following data:
3 The HCS (2002–04), upon which IGT builds, targeted all sample members of the INCAP Longitudinal Study (1969–77) living in Guatemala. Of the original 2392 sample members, 1855 (78%) were determined to be alive and known to be living in Guatemala (11% had died—the majority in early childhood, 7% had migrated abroad, and 4% were not traceable). Of these 1855 individuals eligible for re-interview in 2002–04, 1113 lived in the original villages, 155 lived in nearby villages in the department of El Progreso, 419 lived in or near Guatemala City, and 168 lived elsewhere in Guatemala. For the 1855 traceable sample members living in Guatemala, 1051 (57%) finished the complete battery of applicable interviews and measurements and 1571 (85%) completed at least one interview during the HCS. Spouses of original sample members were also included in the survey (Grajeda et al. 2005). 4 Spouses included both formally married persons as well as cohabiting persons describing themselves as being in a union. 5 Children include biological or adopted children of either the original sample member or his/her spouse. To be considered adopted, the child had to consider the original sample member to be his or her parent and vice versa. All children (so-defined) under 12 years old that lived in the same household as the original sample member, or in the household of his or her spouse, were included. In addition, children of original sample members who lived with a former spouse who was not an original sample member also were included in the target sample. 6 See McNiven (2008) for further details.

8 | P a g e
Measures of ECD in G3s: In addition to detailed schooling histories for all children, three tests of
cognitive ability were administered: 1) the pre-school battery test (Engle et al. 1992); 2) the Spanish
version of the Peabody Picture Vocabulary Test (Test de Vocabulario en Imagenes Peabody or TVIP)
(Dunn et al. 1986); and 3) the Raven’s Colored Progressive Matrices (Raven 1989). The pre-school
battery measures language reception and expression, digit memory, and sentence memory and was
administered to children 3–4 years of age, taking approximately 20 minutes. The TVIP, a validated test in
Spanish used previously in Guatemala, evaluates receptive language and was performed on children 3–
11 years of age, and usually took 15–20 minutes. Many children under 5 years of age, however, did not
perform sufficiently well enough on the test to receive a valid score. The Raven’s test (a test of
nonverbal assessment of cognitive ability, Raven, Court, and Raven 1984) was given to children 5–11
years old, and took about 20–30 minutes. Raven’s Progressive Matrices are considered to be a measure
of eductive ability—“the ability to make sense and meaning out of complex or confusing data; the ability
to perceive new patterns and relationships, and to forge (largely nonverbal) constructs which make it
easy to handle complexity” (Harcourt Assessment 2008). The test consists of a series of pattern-
matching exercises with the respondent asked to supply a “missing piece” and with the patterns getting
progressively more complex and hence harder to match correctly. Because by their nature they require
concentration, all three tests were implemented in a private and quiet environment with minimal
distractions for the child. A total of 85% of the interviews were done in the field office in the village and
the remaining 15% in the home, but always under as private a set of conditions as possible. We have
data on ECD outcomes for 1,216 children.
Measures of parental cognitive ability: The HCS study obtained data on three measures of
parental ability: (1) attained (or completed) schooling; (2) reading comprehension skills; and (3)
nonverbal cognitive ability. Attained schooling is measured as the number of grades completed.7
Reading comprehension skills were measured via a two-part standardized test. Respondents who
reported having passed fewer than four years of schooling, or those who reported four to six years of
schooling but could not correctly read aloud the headline of a local newspaper article, were first given a
literacy test. Individuals who passed this literacy screen, or who reported more than six years of
7 The formal educational system in Guatemala is divided into primary, secondary, and post-secondary education. Primary school comprises grades one to six, and children are expected to enroll in the calendar year in which they turn seven years old. Secondary school consists of five to seven grades, divided into two parts. The first three years of lower secondary school (to grade nine) are the so-called “basic” grades, and instruction is expected to provide academic and technical skills necessary to join the labor force. The fourth through seventh years of upper secondary school are the so-called “diversified” grades, and students can choose from among several tracks.

9 | P a g e
schooling (and thus were presumed to be literate) then took the Inter-American Series test vocabulary
and reading comprehension modules (Serie Interamericana or SIA, for its acronym in Spanish). The SIA
was designed to assess reading abilities of Spanish-speaking children in Texas (Manuel 1967) and
includes several “levels” of difficulty. Level 2 for comprehension and Level 3 for vocabulary were used
(approximately 3rd and 4th grade equivalents). The reading comprehension module had 40 questions and
the vocabulary module 45 questions, yielding a maximum possible score of 85 points on the SIA.
Questions on the test become progressively harder. Those who did not pass the literacy screen pre-test
were given a zero (applicable to 18% of the sample). All individuals (regardless of results on the literacy
screen) were administered Raven’s Progressive Matrices. We administered three of the five scales (A, B,
and C with 12 questions each for a maximum possible score of 36), since pilot data suggested, and
subsequent survey data confirmed, that few respondents were able to progress beyond the third scale.
We have data on these outcomes for 733 mothers and 527 fathers.
In addition to these data, the SIA and Raven’s tests were also administered to these individuals
when they were younger, as part of the 1988-89 survey.
Other individual, parental, household, dynastic and locality characteristics: The INCAP data have
a rich set of covariates that can also be used in this analysis. These include:
For G1s: Basic demographic characteristics (e.g., age, education, religion, number of siblings),
current cognitive abilities, living arrangements, measures of health, self-reported perceptions of
disabilities , marital history, including the living arrangements and each partner’s asset holdings
at the time of marriage, income generation and work history, and wealth at the time of the
original intervention, proximity to the feeding centres.
For G2s: Basic demographic characteristics (e.g., age, education, religion, number of siblings),
living arrangements, measures of health, marital history, including the living arrangements and
each partner’s asset holdings at the time of marriage, income generation and work history,
exposure to the original intervention.
In addition to these ‘standard’ variables, a series of survey instruments focused attention on G2s
as caregivers, including their interactions with their G3 children. We used three standardized
questionnaires adapted to the local context, one to assess the level of stress related to caring for a
young child, and two others to assess the level of psychological resilience of the mother and of the
family. A locally adapted version of the Parental Stress Index (PSI) short version was applied (Abidin
1995). The PSI identifies sources of stress in parent-child subsystems in three areas: 1) the child domain

10 | P a g e
(e.g., child’s adaptability, mood); 2) the parent domain (e.g., role-related competence); and 3) the life
stress domain. Two additional questionnaires were administered to the G2 mothers to assess the level
of resilience of the mother and of the family. The information collected is used to evaluate how the
mother and the family handle stressful situations in daily life, and perceptions on the level of control
over their life situations and the cohesiveness of the family. Examples of questions assessing individual
resilience include whether mothers feel they can follow through on plans that they make, whether
believing in oneself helps during difficult times, and whether they are able to view situations from a
variety of perspectives. Questions assessing family resilience focused on the family’s ability to work
together, even during times of stress, the family feeling valued, and whether they are able to overcome
and survive difficult times. Mothers or main child caretakers also were interviewed regarding the
youngest child at home to assess the potential for physical, intellectual, and social-emotional
stimulation for that child. The information collected permits an assessment of how well the family is
organized to promote the current and future development of their children and who in the family is
involved in this process. Local adaptations of the HOME interview (Caldwell and Bradley 1984) and
observation items on the family environment to which the child is exposed, provide data on the support
that the members of the nuclear family and extended family provide when caring for the child.
Information was obtained on the emotional and verbal responsivity of the caregiver, avoidance of
restriction and punishment, organization of the physical and temporal environment, provision of
appropriate play materials, caregiver involvement with the child, and opportunities for variety in daily
stimulation. The Toddler HOME (0–36 months) was used with children up until the age of 3 years. The
Early Childhood HOME was used with children age 3–6 years of age and the Middle Childhood HOME
was used with children age 6–11 years.
Finally, we have detailed qualitative and archival data from Pivaral (1972) and Bergeron (1992),
as well as a specially commissioned studies undertaken in 2002 and 2005 (Estudio 1360, 2002 and 2005),
to control for community characteristics. Specifically, we can construct community-level covariates that
relate as closely as possible to the timing of key education-related decisions in a child’s development.
For example, we can include controls such as the availability of a permanent (cement-block) structure
for the primary school when the child was seven and 12 years old and primary school student-teacher
ratios when the respondent was seven and 12 years old. While these variables reflect community
characteristics, they vary by individual or, to be precise, by single-year age cohorts within each village.
This is an improvement over the more typical approach of including indicators about such factors at a
given time for a population with different ages at that point in time, since it more closely relates the
11 | P a g e
availability of schools to the periods in the child’s life when critical decisions about schooling were being
made.
Data: Basic descriptive statistics
Table 1 provides descriptive statistics on results from the TVIP and Raven’s Progressive Matrices tests.
For TVIP, we adjust the raw scores to account for the different ages of children who took this test. The
mean score, in percentile terms, is 30.18 for girls and 34.99 for boys, indicating that on average, children
in this sample perform less well relative to other children. While boys do slightly better and, the
difference is statistically significant, the magnitude of the difference is small. Figure 1 shows the
distribution of age-adjusted TVIP scores by age. There is a puzzling drop for children aged 4 and 5
relative to children age 3. This may reflect a selection effect (ie children who could not do the test at age
3 would have been dropped); this is something that we will explore further.
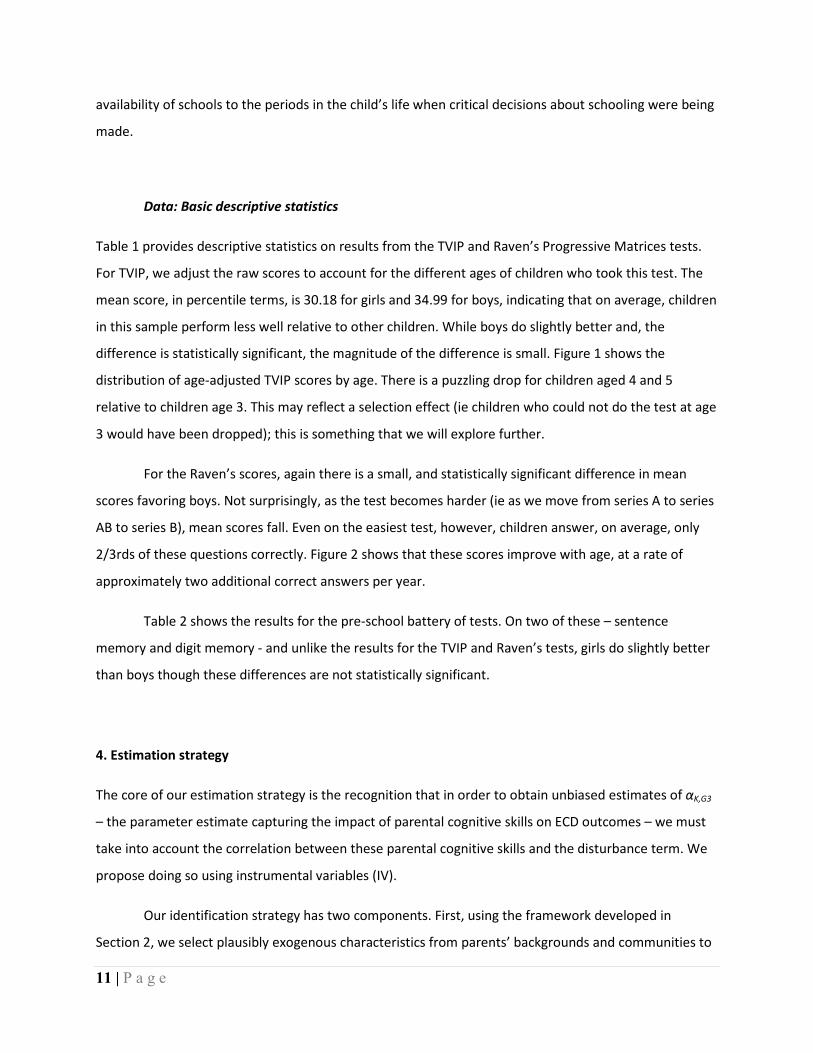
For the Raven’s scores, again there is a small, and statistically significant difference in mean
scores favoring boys. Not surprisingly, as the test becomes harder (ie as we move from series A to series
AB to series B), mean scores fall. Even on the easiest test, however, children answer, on average, only
2/3rds of these questions correctly. Figure 2 shows that these scores improve with age, at a rate of
approximately two additional correct answers per year.
Table 2 shows the results for the pre-school battery of tests. On two of these – sentence
memory and digit memory - and unlike the results for the TVIP and Raven’s tests, girls do slightly better
than boys though these differences are not statistically significant.
4. Estimation strategy
The core of our estimation strategy is the recognition that in order to obtain unbiased estimates of αK,G3
– the parameter estimate capturing the impact of parental cognitive skills on ECD outcomes – we must
take into account the correlation between these parental cognitive skills and the disturbance term. We
propose doing so using instrumental variables (IV).
Our identification strategy has two components. First, using the framework developed in
Section 2, we select plausibly exogenous characteristics from parents’ backgrounds and communities to
12 | P a g e
predict their adult cognitive skills. These include time-varying community-level variables derived from
the original nutritional supplementation intervention and the community histories. Specifically, in
Maluccio et al (2009), we show that exposure to the atole supplement between the ages of 0 to 36
months and school quality characteristics (student-teacher ratios when the parent (G2) was age 7) have
statistically significant effects on these cognitive skills observed in adulthood. We will use the Stock and
Yogo (2005), extended to allow for heteroscedastic error terms by Kleibergen and Paap (2006), to test
for the relevance of these instruments. We will use the Hansen J test to test the null hypothesis that the
overidentifying restrictions are valid (i.e., that the model is well specified and the instruments do not
belong in the second-stage equation) at any conventional significance levels. Note that failure to reject
the null hypothesis is evidence that that if any one of the instruments is valid, so are the others.
In addition, we will include exogenous controls that reflect child characteristics (age, sex),
exogenous parental characteristics variables (age at child’s birth) and representations of dynastic wealth
(for example, parental (G2) assets brought to marriage8 and grandparents’ (G1s) wealth at the time of
the original intervention). We will control for fixed village characteristics (by including dummy variables
for location) and time varying village characteristics such as availability of pre-schools and primary
school characteristics as observed when the child was of pre-school (school) age.
In our basic model, we will assess the impact of maternal cognitive skills on the ECD outcomes of
her children. Table 3 presents preliminary regressions for our basic specification. The outcome variable
is child’s raven score, a cognitive test that was implemented to children between 5 and 12 years. Our
explanatory variable of interest is mother’s raven score. Control variables included in the regressions are
mother’s date of birth, child sex, dummy variables for child age and dummy variables for maternal
village of origin. Column (1) shows the association between mother’s raven score and child’s raven score
estimated by ordinary least squares (OLS). As expected, this association appears positive and statistically
significant: an additional point in mother’s score is associated with an increase of 0.31 points in child’s
score.
Moreover, instrumental variable estimates, which attempt to establish the casual effect of
mother’s cognitive ability on child’s cognitive ability, are presented in column (2). We find that an
additional point in mother’s score increases child’s score in 0.705 points. Excluded instruments include
maternal grandmother’s and maternal grandfather’s years of schooling. The Hansen statistic tests for
8 While we have data on current parental (G2) wealth, this variable is likely to be endogenous.

13 | P a g e
whether or not the null hypothesis is valid (i.e., that the model is well specified: the instruments are
uncorrelated with the error term and do not belong in the second-stage equation) fails to reject the null
hypothesis, evidence that the instruments are valid. The underidentification test, also presented in
column (2), is a test of whether the excluded instruments are correlated with the endogenous
regressors. The null hypothesis of underidentification is rejected implying that the instruments are
relevant. Finally, the weak identification test suggests that the instruments are strong instruments (i.e.
strongly correlated with the endogenous variable) according to the Stock and Yogo weak identification
test critical values.
A comparison of columns (1) and (2) in Table 3 shows that the IV coefficient is more than 2 times
larger than the OLS association suggesting that the impact of maternal cognitive skills on ECD outcomes,
αK,G3, will be underestimated if the correlation between these parental cognitive skills and the
disturbance term is not taken into account.
Similar conclusions arise when maternal grandparent’s socioeconomic status (SES) in 1975 is
included in the regressions. Both, OLS and IV estimates, columns (3) and (4) respectively, show positive
and statistically significant coefficients for mother’s raven score. As expected, the IV estimate is larger
than the OLS. However, the OLS coefficient in column (3) does not change compare to model (1) that
excludes grandparental SES. On the other hand, the IV estimate in column (4) is smaller that the IV
coefficient in column (2) suggesting that controlling for grandparental SES reduced the impact of
maternal cognitive skills on ECD outcomes; in other words, grandparental SES and mother’s raven score
are positively correlated.
In addition, we will then estimate the following extensions to the basic model:
- The impact of fathers’ cognitive skills on the ECD outcomes of their children. This will allow
us to assess whether fathers’ cognitive skills have larger, or smaller, effects on ECD relative
to mothers’.
- Disaggregate the sample by sex of child and parent. This will allow us to assess whether the
impact of mothers’ (fathers’) cognitive skills on ECD outcomes differ by sex of child.
- Disaggregate by age (or age groups, depending on sample sizes) of child. Does the impact of
parental cognitive skills on ECD fade out as children age or does it increase.

14 | P a g e
- Does the presence of a grandparent affect ECD outcomes? This could improve these
outcomes, where for example grandparents undertake domestic tasks so as to make it
possible for mothers to spend more time with their children. Alternatively, if grandparents
require extensive care, then mothers might have less time to spend with their children.
- How robust are these estimates to the inclusion of other household characteristics such as
measures of wealth, school quality, location and so on. Our estimation strategy here will
involve starting with a relative parsimonious specification and gradually adding in additional
confounding factors.
- How are parenting skills affected by cognitive abilities? Recall that through the collection of
the PSI and HOME data, we have information on the quality of mother-child interactions.
These can also serve as outcomes and, using the same estimation strategy that we apply for
ECD outcomes, we can assess whether these interactions are affected by maternal cognitive
skills. This will provide information on one pathway by which ECD outcomes come about.
Tables 4 and 5 provide a first glimpse of our proposed analysis, showing correlation matrices
between maternal cognitive skills and ECD outcomes (Table 4) and paternal cognitive skills and ECD
outcomes (Table 5). There are three features worth noting. First, these correlations are all relatively
large in magnitude and are statistically significant. Second, correlations are typically higher for parental
cognitive skills as measured by their scores on the SIA and Raven’s tests than they are for grade
attainment. Third, when we compare the magnitude of the maternal and paternal correlations, there is
no obvious pattern. These appear slightly stronger for mothers for the TVIP and Raven’s and slightly
stronger for fathers when we look at the pre-school battery of tests.

15 | P a g e
References
Abidin, R. 1995. Parenting Stress Index, Third Edition. Professional Manual. Odessa, FL: Psychological
Assessment Resources, Inc.
Alderman, H., J. Behrman, V. Lavy and R. Menon, 2001, Child Health and School Enrollment: A
Longitudinal Analysis, Journal of Human Resources 36(1); 185–205.
Alderman, H., J. Hoddinott and B. Kinsey, 2006, Long term consequences of early childhood
malnutrition, Oxford Economic Papers 58: 450-474.
Behrman, J., 1996, The impact of health and nutrition on education, World Bank Research Observer,
11(1): 23-37.
Behrman, J., J. Hoddinott, J. Maluccio, and R. Martorell, 2009. Brains versus Brawn: Labor Market
Returns to Intellectual and Physical Human Capital in a Poor Developing Country, mimeo,
International Food Policy Research Institute, Washington DC.
Behrman, J., J. Hoddinott, J. Maluccio, E. Soler-Hampejsek, E. Behrman, R. Martorell, M. Ramirez-Zea,
and A. Stein, 2008. “What Determines Adult Cognitive Skills? Impacts of Pre-School, Schooling
and Post-School Experiences in Guatemala, mimeo, International Food Policy Research Institute,
Washington DC.
Bergeron, G. 1992. Social and economic development in four ladino communities of eastern Guatemala:
A comparative description. Food and Nutrition Bulletin 14 (3): 221–236.
Caldwell B.M., and R.H. Bradley. 1984. Administration Manual, Revised Edition, Home Observation for
Measurement of the Environment. Little Rock, AK: University of Arkansas.
Carneiro, P., and J. Heckman. 2003. Human Capital Policy, in Inequality in America: What Role for Human
Capital Policies? ed. By J. Heckman, A. B. Krueger, and B. Friedman. Chapter 2, MIT press.
Cunha, F., and J. Heckman. 2007. The technology of skill formation, American Economic Review, 97(2),
31-47.
Cunha, F., J. J. Heckman, L. Lochner, and D. V. Masterov. 2005. Interpreting the evidence on life cycle
skill formation. In Handbook of the economics of education, ed. E. Hanushek and F. Welch.
Amsterdam: North Holland.

16 | P a g e
Dunn, Lloyd M, E.R. Padilla, D.E. Lugo and Leota M. Dunn. 1986. Peabody Picture Vocabulary Test:
Hispanic-American Adaptation, Circle Pines, Minnesota: American Guidance Service.
Engle, P.L., K. Gorman, R. Martorell, and E. Pollitt. 1992. Infant and pre-school psychological
development, Food and Nutrition Bulletin 14 (3): 201–14.
Estudio 1360. 2002. Changes in the socioeconomic and cultural conditions that affect the formation of
human capital and economic productivity. Final report presented to The Institute of Nutrition of
Central America and Panama (INCAP), May 13. Photocopy.
Estudio 1360. 2005. Intergenerational exchanges in four communities in Guatemala. Final report
presented to The Institute of Nutrition of Central America and Panama (INCAP), Photocopy.
Glewwe, P., H. Jacoby and E. King, 2001, “Early childhood nutrition and academic achievement: A
longitudinal analysis”, Journal of Public Economics 81: 345-68.
Grajeda, R., J.R. Behrman, R. Flores, J.A. Maluccio, R. Martorell, and A.D. Stein. 2005. The Human Capital
Study 2002–04: Research design and implementation of the early nutrition, human capital, and
economic productivity study, Food and Nutrition Bulletin, 26(2) (Supplement 1): S15–S24.
Habicht, J.-P., and R. Martorell. 1992. Objectives, research design, and implementation of the INCAP
longitudinal study, Food and Nutrition Bulletin 14 (3): 176–90.
Harcourt Assessment. 2008. Raven’s progressive matrices. <http://www.harcourt-
uk.com/product.aspx?n=1342&s=1346&skey=3068>, accessed February 26, 2008.
Heckman, J. 2000. Policies to foster human capital, Research in Economics, 54(1).
Heckman, J. 2005. Lessons from the Technology of Skill Formation, NBER Working Papers 11142,
National Bureau of Economic Research.
Kleibergen, F., and R. Paap. 2006. Generalized reduced rank tests using the singular value decomposition. Journal of Econometrics 133: 97-126.
Manuel, H. T. 1967. Technical reports, tests of general ability and tests of reading, Interamerican series.
San Antonio, Tex., U.S.A.: Guidance Testing Associates.
Martorell, R., J.R. Behrman, R. Flores, and A.D. Stein. 2005. Rationale for a follow-up study focusing on
economic productivity, Food and Nutrition Bulletin, 26(2) (Supplement 1): S5–S14.

17 | P a g e
Martorell, R., J-P. Habicht, and J.A. Rivera. 1995. History and design of the INCAP longitudinal study
(1969–77) and its follow-up (1988–89), Journal of Nutrition, 125(4S): 1027S–41S.
McNiven, S. 2008. The February 2008 IGT data release. International Food Policy Research Institute,
Washington D.C. Photocopy.
Melgar, P., L. F. Ramírez, S. McNiven, R. M. Mejía, A. DiGirolamo, J. Hoddinott, and J. Maluccio, 2008.
Resource Flows Among Three Generations in Guatemala Study (2007–08): Definitions, tracking,
data collection, coverage and attrition, mimeo, International Food Policy Research Institute,
Washington DC.
Pivaral, V. M. 1972. Características Económicas y Socioculturales de Cuatro Aldeas Ladinas de
Guatemala. Ministerio de Educación Pública, Instituto Indigenista Nacional, Guatemala.
Raven, J.C. 1989. Test de Matrices Progresivas Escala Coloreada. Adaptación Argentina. Argentina: J.C.
Raven.
Raven, J. C., J. H. Court, and J. Raven. 1984. Manual for Raven’s Progressive Matrices and Vocabulary
Scales. Section 2: Coloured progressive matrices. London: H. K. Lewis.
Read, M. S., and J.-P. Habicht. 1992. History of the INCAP longitudinal study on the effects of early
nutrition supplementation in child growth and development. Food and Nutrition Bulletin 14 (3):
169–75.
Stein, A.D., P. Melgar, J. Hoddinott, and R. Martorell. 2008. Cohort profile: The Institute of Nutrition of Central America and Panama (INCAP) nutrition trial cohort study. International Journal of Epidemiology (2008 Feb 19, published on-line).
Stock, J. H., and M. Yogo. 2005. Testing for weak instruments in linear IV regression. In Identification and Inference for Econometric Models: Essays in Honor of Thomas Rothenberg, ed. D. W. K. Andrews and J. H. Stock, 80-108. Cambridge: Cambridge University Press.

18 | P a g e
Table 1: Means and standard deviations of results for TVIP and Raven’s Progressive Matrices, by sex
TVIP * Raven
Raw score
Age-specific standard-equivalent
score
Age-specific standard-equivalent
score - Percentile
Series A score [0-
12]
Series AB score [0-
12]
Series B score [0-
12]
Series A, AB, B
score [0-36]
Children ages >=3y, <12y Children ages >=5y, <12y
n = 572 n = 551 n = 481
Girls mean 48.12 89.03 30.18 7.66 5.53 4.4 17.58 sd 25.6 15.6 26.2 1.73 2.62 2.11 5.62 n = 568 n = 557 n = 479
Boys mean 51.4 91.63 34.99 7.96 6.1 4.55 18.62 Sd 25.73 17.14 29.08 1.82 2.77 2.08 5.83
Table 2: Means and standard deviations of results for pre-school battery of tests, by sex
Preschool battery
Naming index
Recognition index
Sentence memory
index
Digit memory
index
Children ages >=3y, <5y
Girls
n = 101 mean 16.36 32 37.09 28.05 sd 4.11 3.5 24.4 14.24 Boys
n = 96 mean 16.19 32.88 34.95 25.45 sd 4.02 3.71 23.98 13.68

19 | P a g e
Table 3: Mother’s raven score and child’s raven score: Ordinary least squares and instrumental variable estimates
OLS IVOLS +
grandparental SESIV + grandparental
SES(1) (2) (3) (4)
Mother's raven score 0.31*** 0.705*** 0.31*** 0.575***95% CI 0.24 - 0.37 0.448 - 0.962 0.23 - 0.38 0.262 - 0.888p-value 0 7.40e-08 0 0.000322SE 0.03 0.131 0.04 0.160Mother's date of birth -0.05 -0.086* -0.04 -0.07595% CI -0.12 - 0.02 -0.172 - 0.001 -0.14 - 0.06 -0.187 - 0.037p-value 0.201 0.0514 0.417 0.191SE 0.04 0.044 0.05 0.0571 if boy 0.91*** 0.921*** 0.95*** 0.928***95% CI 0.35 - 1.47 0.294 - 1.547 0.30 - 1.60 0.244 - 1.612p-value 0.00161 0.00400 0.00441 0.00786SE 0.29 0.320 0.33 0.349Grandparental SES in 1975 0.47** 0.28895% CI 0.06 - 0.88 -0.197 - 0.772p-value 0.0261 0.244SE 0.21 0.247Constant 9.76*** 5.003** 11.31*** 8.286***95% CI 7.05 - 12.48 0.568 - 9.438 7.63 - 15.00 3.182 - 13.390p-value 0 0.0270 3.66e-09 0.00146SE 1.38 2.263 1.87 2.604
Observations 872 872 649 649
Adj R2 0.433 0.305 0.421 0.366
F Test 60.721 46.071 43.215 35.807
Prob >F 0.000 0.000
N cluster 520 520 389 389
Log likelihood -2,507.55 -2,595.98 -1876.880 -1,906.19
Prob > F 0.000 0.000
Hansen statistic 0.243 1.922
Hansen p-value 0.622 0.166
Underidentification test 29.973 18.410
Underidentification test p-value 0.000 0.000
Stock-Yogo weak indentification test 17.420 10.575
Endogeneity test 14.737 4.017
Endogeneity test p-value 0.000 0.045
Included controls: Dummy variables for child's age and maternal village of origin.CIs and p-values were calculated allowing for clustering at the mother level.
Outcome variable: Child's raven score

20 | P a g e
Table 4: Correlations between mother and child scores on reading/vocabulary skills and Raven’s Progressive Matrices
Mother's Raven score
Mother's IA score
Mother's schooling
TVIP raw score
TVIP z score
TVIP age-specific standard-
equivalent score
TVIP raw score 0.1670* 0.2093* 0.1365* 1 1124 1134 1020 1140
TVIP z score 0.3385* 0.3858* 0.2963* 0.5298* 1 1124 1134 1020 1140 1140
TVIP age-specific standard-equivalent score
0.3526* 0.4052* 0.3416* 0.5287* 0.9491* 1
1092 1102 994 1108 1108 1108
TVIP age-specific standard-equivalent score-percentile
0.3553* 0.4077* 0.3475* 0.5213* 0.9316* 0.9609*
1092 1102 994 1108 1108 1108
Mother's Raven score
Mother's IA score
Mother's schooling
Raven score (a+ab+b)
Raven z score
Raven a z score
Raven score (a+ab+b)
0.2604* 0.2379* 0.2084* 1 949 954 858 960
Raven z score 0.3156* 0.3149* 0.2791* 0.7820* 1 949 954 858 960 960
Raven a z score
0.2641* 0.2403* 0.2099* 0.5841* 0.7415* 1 949 954 858 960 960 960
Raven ab z score
0.2680* 0.2822* 0.2527* 0.6853* 0.8708* 0.4784* 949 954 858 960 960 960
Raven b z score
0.2316* 0.2223* 0.2114* 0.6292* 0.7836* 0.4069* 949 954 858 960 960 960
* p<0.01

21 | P a g e
Mother's Raven score
Mother's IA score
Mother's schooling
Naming index z score 0.1672 0.2578* 0.1232 192 197 178
Recognition index z score 0.1636 0.2250* 0.1206 192 197 178
Sentence memory index z score
0.2205* 0.2400* 0.0162 192 197 178
Digit memory index z score
0.2192* 0.2076* -0.0238 192 197 178
* p<0.01

22 | P a g e
Table 5: Correlations between father and child scores on reading/vocabulary skills and Raven’s Progressive Matrices
Father's Raven score
Father's IA score
Father's schooling
TVIP raw score
TVIP z score
TVIP age-specific standard-
equivalent score
TVIP raw score 0.1276* 0.1253* 0.1368* 1 912 1083 870 1140
TVIP z score 0.2924* 0.3109* 0.3513* 0.5298* 1 912 1083 870 1140 1140
TVIP age-specific standard-equivalent score
0.2904* 0.2965* 0.3539* 0.5287* 0.9491* 1
890 1052 850 1108 1108 1108
TVIP age-specific standard-equivalent score-percentil
0.2936* 0.3130* 0.3697* 0.5213* 0.9316* 0.9609*
890 1052 850 1108 1108 1108
* p<0.01
Father's
Raven score Father's IA
score Father's schooling
Raven score (a+ab+b)
Raven z score
Raven a z score
Raven score (a+ab+b)
0.2565* 0.1753* 0.2347* 1 764 909 725 960
Raven z score 0.3380* 0.2462* 0.3176* 0.7820* 1 764 909 725 960 960
Raven a z score
0.2499* 0.2313* 0.2597* 0.5841* 0.7415* 1 764 909 725 960 960 960
Raven ab z score
0.3236* 0.2293* 0.2771* 0.6853* 0.8708* 0.4784* 764 909 725 960 960 960
Raven b z score
0.2213* 0.1332* 0.2207* 0.6292* 0.7836* 0.4069* 764 909 725 960 960 960
* p<0.01

23 | P a g e
Father's Raven
score Father's IA
score Father's schooling
Naming index z score 0.2844* 0.2676* 0.2992* 159 190 155
Recognition index z score 0.2396* 0.2002* 0.1739 159 190 155
Sentence memory index z score
0.2371* 0.2379* 0.2246* 159 190 155
Digit memory index z score
0.2559* 0.1849 0.2089* 159 190 155
* p<0.01

24 | P a g e
Figure 1
25 | P a g e
Figure 2
Related Documents


