The Insulin Receptor Substrate 1 (Irs1) in Intestinal Epithelial Differentiation and in Colorectal Cancer Diana L. Esposito 1,2 , Federica Aru 1 , Rossano Lattanzio 1 , Annalisa Morgano 1,3 , Michela Abbondanza 4 , Reza Malekzadeh 5 , Faraz Bishehsari 1,5 , Rosa Valanzano 6 , Antonio Russo 7 , Mauro Piantelli 1 , Antonio Moschetta 3 , Lavinia Vittoria Lotti 4 , Renato Mariani-Costantini 1,2 * 1 Unit of General Pathology, Aging Research Center, G. d’Annunzio University Foundation, Chieti, Italy, 2 Department of Medical, Oral and Biotechnological Sciences, G. d’Annunzio University, Chieti, Italy, 3 Laboratory of Lipid Metabolism and Cancer, Department of Translational Pharmacology, Consorzio Mario Negri Sud, Santa Maria Imbaro, Chieti, Italy, 4 Department of Experimental Medicine, University La Sapienza, Rome, Italy, 5 Digestive Disease Research Center, Shariati Hospital, University of Tehran, Tehran, Iran, 6 Department of Clinical Physiopathology, University of Florence, Florence, Italy, 7 Department of Surgical and Oncological Sciences, University of Palermo, Palermo, Italy Abstract Colorectal cancer (CRC) is associated with lifestyle factors that affect insulin/IGF signaling, of which the insulin receptor substrate 1 (IRS1) is a key transducer. We investigated expression, localization and pathologic correlations of IRS1 in cancer- uninvolved colonic epithelium, primary CRCs with paired liver metastases and in vitro polarizing Caco2 and HT29 cells. IRS1 mRNA and protein resulted higher, relative to paired mucosa, in adenomas of familial adenomatous polyposis patients and in CRCs that overexpressed c-MYC, ß-catenin, InsRß, and IGF1R. Analysis of IRS1 immunostaining in 24 cases of primary CRC with paired colonic epithelium and hepatic metastasis showed that staining intensity was significantly higher in metastases relative to both primary CRC (P,0.01) and colonic epithelium (P,0.01). Primary and metastatic CRCs, compared to colonic epithelium, contained significantly higher numbers of IRS1-positive cells (P = 0.013 and P = 0.014, respectively). Pathologic correlations in 163 primary CRCs revealed that diffuse IRS1 staining was associated with tumors combining differentiated phenotype and aggressive markers (high Ki67, p53, and ß-catenin). In Caco 2 IRS1 and InsR were maximally expressed after polarization, while IGF1R was highest in pre-polarized cells. No nuclear IRS1 was detected, while, with polarization, phosphorylated IRS1 (pIRS1) shifted from the lateral to the apical plasma membrane and was expressed in surface cells only. In HT29, that carry mutations constitutively activating survival signaling, IRS1 and IGF1R decreased with polarization, while pIRS1 localized in nuclear spots throughout the course. Overall, these data provide evidence that IRS1 is modulated according to CRC differentiation, and support a role of IRS1 in CRC progression and liver metastatization. Citation: Esposito DL, Aru F, Lattanzio R, Morgano A, Abbondanza M, et al. (2012) The Insulin Receptor Substrate 1 (Irs1) in Intestinal Epithelial Differentiation and in Colorectal Cancer. PLoS ONE 7(4): e36190. doi:10.1371/journal.pone.0036190 Editor: Venugopalan Cheriyath, Texas A&M University, United States of America Received November 15, 2010; Accepted April 1, 2012; Published April 27, 2012 Copyright: ß 2012 Esposito et al. This is an open-access article distributed under the terms of the Creative Commons Attribution License, which permits unrestricted use, distribution, and reproduction in any medium, provided the original author and source are credited. Funding: Associazione Italiana per la Ricerca sul Cancro (http://www.airc.it/), IG 9168 (2009); Italian Ministry for Scientific Research (http://www.istruzione.it/). The funders had no role in study design, data collection and analysis, decision to publish, or preparation of the manuscript. Competing Interests: The authors have declared that no competing interests exist. * E-mail: [email protected] Introduction Colorectal cancer (CRC) has been linked to lifestyle risk factors, most notably diets based on energy-dense foods and low physical activity [1–3]. Epidemiological and experimental evidences indicate that the hormone insulin and the insulin-like growth factors (IGFs) 1 and 2 play key role(s) in mediating the complex effect(s) of diet and exercise on CRC risk [4–10]. Over-expression of the insulin receptor (InsR) and of the closely related IGF1 receptor (IGF1R) is critical for insulin/IGF system over-activation in cancer [4,7,9]. Intestinal epithelium, that possesses one of the highest renewal rates among human tissues, expresses both the InsR and the IGF1R, and the levels of these receptors are higher in CRC relative to colonic mucosa [4,7,8,11]. Intestinal epithelial differentiation is regulated by several pathways, particularly ß-catenin-dependent WNT signaling [12,13]. Most CRCs appear to initiate after inactivating mutations in the adenomatous polyposis coli (APC) gene, encoding a central component of the cytosolic multi-protein complex that controls ß-catenin degradation [14–16]. APC-mutated cells show high cytoplasmic and nuclear ß-catenin; the latter, after binding to TCF/LEF transcription factors, forms complexes that, by switching on several cancer-related genes, impose a proliferative crypt progenitor phenotype (reviewed at http://www.stanford. edu/,rnusse/wntwindow.html) [17]. Interestingly, recent evidences link the ß-catenin and the insulin/IGFs signaling pathways. In fact, IRS1, encoding one of the two major insulin receptor substrates (IRS1 and IRS2), that integrate signaling from the InsR, IGF1R and other cytokine and growth factor receptors [18], is highly upregulated in cells with exogenously-induced or constitutive ß-catenin signaling [19]. This seems to depend on direct regulation of IRS1 by TCF/LEF-ß- catenin complexes. Furthermore, IRS1 is necessary for transfor- mation in cells that ectopically express oncogenic ß-catenin and for maintainance of the neoplastic phenotype in APC-mutated cells [19]. These findings are consistent with earlier evidence that ectopic IRS1 promotes transformation, while a dominant-negative IRS1 mutant acts as a tumor suppressor [20]. Furthermore, in the PLoS ONE | www.plosone.org 1 April 2012 | Volume 7 | Issue 4 | e36190

Welcome message from author
This document is posted to help you gain knowledge. Please leave a comment to let me know what you think about it! Share it to your friends and learn new things together.
Transcript

The Insulin Receptor Substrate 1 (Irs1) in IntestinalEpithelial Differentiation and in Colorectal CancerDiana L. Esposito1,2, Federica Aru1, Rossano Lattanzio1, Annalisa Morgano1,3, Michela Abbondanza4,
Reza Malekzadeh5, Faraz Bishehsari1,5, Rosa Valanzano6, Antonio Russo7, Mauro Piantelli1,
Antonio Moschetta3, Lavinia Vittoria Lotti4, Renato Mariani-Costantini1,2*
1 Unit of General Pathology, Aging Research Center, G. d’Annunzio University Foundation, Chieti, Italy, 2 Department of Medical, Oral and Biotechnological Sciences, G.
d’Annunzio University, Chieti, Italy, 3 Laboratory of Lipid Metabolism and Cancer, Department of Translational Pharmacology, Consorzio Mario Negri Sud, Santa Maria
Imbaro, Chieti, Italy, 4 Department of Experimental Medicine, University La Sapienza, Rome, Italy, 5 Digestive Disease Research Center, Shariati Hospital, University of
Tehran, Tehran, Iran, 6 Department of Clinical Physiopathology, University of Florence, Florence, Italy, 7 Department of Surgical and Oncological Sciences, University of
Palermo, Palermo, Italy
Abstract
Colorectal cancer (CRC) is associated with lifestyle factors that affect insulin/IGF signaling, of which the insulin receptorsubstrate 1 (IRS1) is a key transducer. We investigated expression, localization and pathologic correlations of IRS1 in cancer-uninvolved colonic epithelium, primary CRCs with paired liver metastases and in vitro polarizing Caco2 and HT29 cells. IRS1mRNA and protein resulted higher, relative to paired mucosa, in adenomas of familial adenomatous polyposis patients andin CRCs that overexpressed c-MYC, ß-catenin, InsRß, and IGF1R. Analysis of IRS1 immunostaining in 24 cases of primary CRCwith paired colonic epithelium and hepatic metastasis showed that staining intensity was significantly higher in metastasesrelative to both primary CRC (P,0.01) and colonic epithelium (P,0.01). Primary and metastatic CRCs, compared to colonicepithelium, contained significantly higher numbers of IRS1-positive cells (P = 0.013 and P = 0.014, respectively). Pathologiccorrelations in 163 primary CRCs revealed that diffuse IRS1 staining was associated with tumors combining differentiatedphenotype and aggressive markers (high Ki67, p53, and ß-catenin). In Caco 2 IRS1 and InsR were maximally expressed afterpolarization, while IGF1R was highest in pre-polarized cells. No nuclear IRS1 was detected, while, with polarization,phosphorylated IRS1 (pIRS1) shifted from the lateral to the apical plasma membrane and was expressed in surface cells only.In HT29, that carry mutations constitutively activating survival signaling, IRS1 and IGF1R decreased with polarization, whilepIRS1 localized in nuclear spots throughout the course. Overall, these data provide evidence that IRS1 is modulatedaccording to CRC differentiation, and support a role of IRS1 in CRC progression and liver metastatization.
Citation: Esposito DL, Aru F, Lattanzio R, Morgano A, Abbondanza M, et al. (2012) The Insulin Receptor Substrate 1 (Irs1) in Intestinal Epithelial Differentiation andin Colorectal Cancer. PLoS ONE 7(4): e36190. doi:10.1371/journal.pone.0036190
Editor: Venugopalan Cheriyath, Texas A&M University, United States of America
Received November 15, 2010; Accepted April 1, 2012; Published April 27, 2012
Copyright: � 2012 Esposito et al. This is an open-access article distributed under the terms of the Creative Commons Attribution License, which permitsunrestricted use, distribution, and reproduction in any medium, provided the original author and source are credited.
Funding: Associazione Italiana per la Ricerca sul Cancro (http://www.airc.it/), IG 9168 (2009); Italian Ministry for Scientific Research (http://www.istruzione.it/). Thefunders had no role in study design, data collection and analysis, decision to publish, or preparation of the manuscript.
Competing Interests: The authors have declared that no competing interests exist.
* E-mail: [email protected]
Introduction
Colorectal cancer (CRC) has been linked to lifestyle risk factors,
most notably diets based on energy-dense foods and low physical
activity [1–3]. Epidemiological and experimental evidences
indicate that the hormone insulin and the insulin-like growth
factors (IGFs) 1 and 2 play key role(s) in mediating the complex
effect(s) of diet and exercise on CRC risk [4–10]. Over-expression
of the insulin receptor (InsR) and of the closely related IGF1
receptor (IGF1R) is critical for insulin/IGF system over-activation
in cancer [4,7,9]. Intestinal epithelium, that possesses one of the
highest renewal rates among human tissues, expresses both the
InsR and the IGF1R, and the levels of these receptors are higher
in CRC relative to colonic mucosa [4,7,8,11].
Intestinal epithelial differentiation is regulated by several
pathways, particularly ß-catenin-dependent WNT signaling
[12,13]. Most CRCs appear to initiate after inactivating mutations
in the adenomatous polyposis coli (APC) gene, encoding a central
component of the cytosolic multi-protein complex that controls
ß-catenin degradation [14–16]. APC-mutated cells show high
cytoplasmic and nuclear ß-catenin; the latter, after binding to
TCF/LEF transcription factors, forms complexes that, by
switching on several cancer-related genes, impose a proliferative
crypt progenitor phenotype (reviewed at http://www.stanford.
edu/,rnusse/wntwindow.html) [17].
Interestingly, recent evidences link the ß-catenin and the
insulin/IGFs signaling pathways. In fact, IRS1, encoding one of
the two major insulin receptor substrates (IRS1 and IRS2), that
integrate signaling from the InsR, IGF1R and other cytokine and
growth factor receptors [18], is highly upregulated in cells with
exogenously-induced or constitutive ß-catenin signaling [19]. This
seems to depend on direct regulation of IRS1 by TCF/LEF-ß-
catenin complexes. Furthermore, IRS1 is necessary for transfor-
mation in cells that ectopically express oncogenic ß-catenin and for
maintainance of the neoplastic phenotype in APC-mutated cells
[19]. These findings are consistent with earlier evidence that
ectopic IRS1 promotes transformation, while a dominant-negative
IRS1 mutant acts as a tumor suppressor [20]. Furthermore, in the
PLoS ONE | www.plosone.org 1 April 2012 | Volume 7 | Issue 4 | e36190

Apc(Min/+) mouse model, intestinal tumorigenesis is attenuated by
irs1 knock-out [21].
In the present study we investigated the expression, localization
and clinicopathologic correlations of IRS1 ex vivo, in cancer-
uninvolved human colonic epithelium, primary CRCs and paired
liver metastases, and in vitro, in two CRC cell models capable of
spontaneous in vitro polarization, Caco2 and HT29 [22,23].
Materials and Methods
Patients and specimensA formalin-fixed, paraffin-embedded (FFPE) series of 24
primary CRCs with paired cancer-uninvolved colonic mucosa
and synchronous liver metastasis was retrospectively identified at
the Department of Surgical and Oncological Sciences, University
of Palermo, Palermo, Italy. For this series standard whole sections
were used for immunohistochemistry (IHC). An additional FFPE
series, consisting only of primary CRCs, provided by the Digestive
Disease Research Center (DDRC), Tehran University of Medical
Sciences, Tehran, Iran, included 163 of the 205 CRC cases
described in Bishehsari et al. and in Mahdavinia et al. [24,25],
selected based on tissue availability. These CRCs had been
previously characterized for microsatellite instability (MSI) status
and p53 and KRAS mutations [24,25]. Clinico-pathological data,
including age and sex, tumor size, stage and grade, were available
for all 163 patients. No follow-up and survival data were available.
Tissue microarrays (TMAs) were constructed by extracting
histologically-confirmed CRC cores from donor blocks with a
Beecher MTA 2-mm Punch Set (Beecher Instruments, Sun
Prairie, WI, USA). The cores were re-embedded into gridded
paraffin blocks and standard TMA sections were used for IHC.
Samples of tumor and paired colonic mucosa, snap-frozen or
rapidly fixed in RNAlater (Ambion, Applied Biosystems, Foster
City, CA), were collected at the Department of Clinical
Physiopathology, University of Florence, Florence, Italy, from 8
unselected CRC cases and 2 familial adenomatous polyposis (FAP)
patients with molecularly-identified germline APC mutation
(respectively Glu1309fsX1312 and Ser843fsX860). Collection
and analysis of samples and clinico-pathological data were
approved by the G. D’Annunzio University Ethical Committee
and by the Institutional Review Board of the DDRC, Shariati
Hospital, University of Tehran (protocol dated 17/03/2004). All
cases were anonymized.
IHCTMA and standard whole tissue sections were cut at 4 mm and
stained with anti-IRS1 rabbit polyclonal (C-20, sc-559, Santa Cruz
Biotechnology, Heidelberg, Germany) at 1:300 dilution for 30 min,
after antigen retrieval by microwave treatment at 750 W for 10 min
in 10 mM sodium citrate buffer pH 6.0 (Dako, Glostrup, Den-
mark). The anti-rabbit EnVision kit (K4003, Dako) was used for
signal amplification. Serial TMA sections were also incubated with
the following mouse monoclonal antibodies: anti-ß-catenin (17C2,
Novocastra Laboratories Ltd, Newcastle, UK), anti-p53 (DO7,
Novocastra) and anti-Ki67 (MIB-1, Dako), for which antigen
retrieval was performed by thermostatic bath at 96uC for 40 min in
sodium citrate buffer (Dako), and anti-EGFR pharmDx (2-18C9,
Dako), according to manufacturer’s instructions. All immunoreac-
tions were revealed by a streptavidin-biotin-enhanced peroxidase
system (Super Sensitive Link-Label IHC Detection System,
BioGenex, Milan, Italy). Positive and negative controls were
included for each antibody and in each batch of staining.
For each marker the percentages of positive cells were estimated
in four fields at 4006 magnification (<1000 cells). IRS1, Ki67,
p53, EGFR and ß-catenin were considered positive when .1% of
the tumor cells were stained, ß-catenin was scored separately for
immunostaining in the cytoplasm, nucleus and along the cell
membrane. The independent samples t-test was used to evaluate
differences in IRS1 expression (% of positive cells) according to
pathological and mutational features. Expression of IRS1 was
correlated to that of each of the other markers by Spearman’s rho
test. The SPSS (version 15.0) program (SPSS Inc., Chicago, IL,
USA) was used for all statistical analyses. All cited P values are
two-sided; P,0.05 was considered as statistically significant.
The density of IRS1 immunostaining in paired cancer-
uninvolved colonic epithelium, primary CRC and liver metastasis
was determined by semiquantitative digital analysis using ImageJ
software (http://rsbweb.nih.gov/ij/). Images were acquired at
standardized bright-field settings (4006 magnification). Captured
color jpeg images were converted to greyscale 8 bit images, then
the Region Of Interest manager function was used to outline
cytoplasmic areas, each comprising 5–15 cells. Unwanted nuclear
or stromal elements were edited out. The areas analyzed in 4
matched sets of crypt epithelium, primary CRC and liver
metastasis were 11 for bottom crypt epithelium, 10 for top crypt
epithelium, 78 for total colonic epithelium, 84 for primary CRC,
and 84 for metastatic CRC. Using default ImageJ settings, the
units measured for each area were density value, total area in
square pixels, average size and area fraction. Density values for
crypt epithelium, primary CRC and metastatic CRC, normalized
per area sizes, were analysed using unpaired Student’s t-test. A
value of P,0.05 was considered statistically significant [26].
Quantitative real-time PCR (RTqPCR)Total RNA from paired mucosa and CRC samples was isolated
with QIAzol (QIAGEN, Hilden, Germany), treated with DNAase-
1 (Ambion), checked by spectrophotometry and agarose gel
electrophoresis, and retro-transcribed with the High Capacity
DNA Archive Kit (Applied Biosystems), following manufacturer’s
instructions. RTqPCR assays were performed in duplicate using
96-well optical reaction plates and an ABI 7500HT machine
(Applied Biosystems). Baseline amplification plot values were set
automatically and thresholds were kept constant to obtain
normalized cycle times and linear regression data. The reaction
mix per well contained 10 ml Power Syber Green (Applied
Biosystems), 2.4 ml of primers (final concentration 150 nM),
4.6 ml RNAase-free water, 3 ml cDNA (60 ng). For all experiments
the PCR protocol was: denaturation at 95uC for 10 min, then 40
cycles at 95uC for 15 sec and at 60uC for 60 sec. Quantification
was performed relative to Cyclophilin [27] using the DDCT method.
Validated RTqPCR primers, designed with Primer Express 3.0
software, were: Cyclophilin, FW 59TTTCATCTGCACTGCCAA-
GA39; RV59TTGCAAAACACCACATGCT39; IRS1, FW 59GC-
AACCAGAGTGCCAAAGTGA39 RV59GGAGAAAGTCTCG-
GAGCTATGC39; c-MYC, FW59CCACCACCAGCAGCGACT39,
RV59CAGAAACAACATCGATTTCTTCCTC39.
Cell culturesModulation of IRS1 and of the insulin/IGF1 axis was
investigated in the Caco-2 and HT29 CRC cell lines, which,
under specific culture conditions, undergo spontaneous in vitro
differentiation [22,28,29]. Caco-2, developed from a primary
CRC excised from a 72 yrs old male Caucasian, is MSI-stable and
carries an inactivating APC point mutation, with second hit by loss
of heterozygosity (LOH), a missense mutation in ß-catenin exon 5
(which does not appear to affect degradation), and is wild-type for
KRAS, BRAF, PIK3CA and PTEN [23,30–32]. HT29, developed
from a primary CRC excised from a 44 yrs old female Caucasian,
IRS1 in Colorectal Cancer
PLoS ONE | www.plosone.org 2 April 2012 | Volume 7 | Issue 4 | e36190

is also MSI-stable and carries double-hit inactivating APC
mutations (which still allow limited ß-catenin phosphorylation
and ubiquitination), as well as mutations in SMAD4, BRAF, TP53,
and PI3KCA, encoding the p110a catalytic subunit of the class I
phosphatidylinositol 3-kinases (PI3K) [23,31] (see also the
Catalogue of Somatic Mutations in Cancer, http://www.sanger.
ac.uk/cosmic).
Caco-2 and HT29 cells were obtained from ATCC (ATCC-
LGC Promochem, London UK). Caco-2 cells were maintained in
Dulbecco’s modified Eagle’s medium (DMEM) with 10% fetal
bovine serum (FBS), L-glutamine (2 mM), penicillin (100 units/
ml), and streptomycin (100 mg/ml) under a humidified atmosphere
with 5% CO2 at 37uC. Cells were plated on 10 cm Petri dishes
and allowed to grow at confluency. Upon confluency (designated
as zero time point) Caco-2 culture was carried out in DMEM with
20% FBS. The entire time course was performed twice and whole
cell lysates were obtained at 3, 7 and 14 days from confluency.
HT29 cells were maintained in DMEM with 10% FBS and
allowed to grow for 3 (preconfluent), 7 (confluent) and 14 (post-
confluent) days, at which times whole cell lysates were obtained.
Western blottingWhole cell or whole tissue lysates were prepared using ice-cold
lysis buffer (100 mM NaCl, 10 mM EDTA, 1% TritonX-100,
50 mM Hepes pH 7.9, 10 mM NaF, 4 mM sodium pyrophos-
phate, 2 mM Na3VO4) supplemented with protease inhibitors
(1 mM phenylmethylsulphonylfluoride, 2 mg/ml aprotinin, 2 mg/
ml leupeptin). Lysates were cleared by centrifugation (100006 g
for 20 min) and protein content was determined by the Bradford
method. Fifty micrograms (50 mg) of total proteins were resolved
under reducing conditions on 7.5% SDS-PAGE and transferred to
reinforced nitrocellulose. The membrane was blocked with 3%
not-fat dry milk in PBS with 0.01% Tween 20 for 1 hr at room
temperature and then incubated overnight with the following
primary antibodies: anti-IRS1 rabbit polyclonal (C-20, Santa
Cruz), diluted 1:500; anti-tyrosine 632-phosphorylated IRS1
(pIRS1 Tyr632) polyclonal antibody (Santa Cruz), diluted 1:200;
anti-ß-catenin monoclonal (Ylem, Rome, Italy), diluted 1:50 or
anti-ß-catenin polyclonal (#9562, Cell Signaling, Danvers, MA,
USA), diluted 1:1000; polyclonal against the ß subunit of the InsR
(InsRß) (C-19, Santa Cruz) diluted 1:200; polyclonal against the ß
subunit of the IGF1R (anti-IGF1Rß, Cell Signaling Technology/
Euroclone, Milan, Italy) diluted 1:800; anti-actin monoclonal
(Sigma-Aldrich, Milan, Italy) diluted 1:10000. The membrane was
then washed in PBS and incubated for 1 h at room temperature
with the corresponding horseradish peroxidase-conjugated sec-
ondary antibody, diluted 1:2000 (Ge Healthcare, Milan, Italy).
Bound antibodies were detected using the enhanced chemilumi-
nescent (ECL) method (Pierce-Celbio, Pero, Italy). Quantification
of western blot signals (mean 6 SE from at least two independent
experiments) was obtained analyzing digitized signals with ImageJ
software (http://rsbweb.nih.gov/ij/). The data were normalized
for ß-actin and expressed as percentage of the maximum value.
ImmunofluorescenceCaco-2 and HT29 cells, grown on coverslips under the
conditions described above, were fixed in methanol (220uC) and
incubated with anti-ß-catenin monoclonal (BD Science, Franklin
Lakes, NJ, USA), anti-IRS1 rabbit polyclonal (C-20, Santa Cruz),
diluted 1:50; and anti-pIRS1 (Tyr632) polyclonal (Santa Cruz),
diluted 1:50. Nuclei were stained with 4,6-diamido-2-phenylindole
(DAPI, Sigma-Aldrich) and cell membranes with wheat germ
agglutinin (WGA, Sigma-Aldrich). Primary antibodies were
visualized using goat anti-mouse IgG fluorescein isothiocyanate-
conjugated (Cappel, MP Biomedicals Europe, Illkirch, France) or
goat anti-rabbit IgG-Texas-Red-conjugated (Jackson ImmunoR-
esearch Laboratories Europe, Newmarket, Suffolk, UK) for
30 min at room temperature. Cells were analyzed using an
Apotome Axio Observer Z1 inverted microscope (Zeiss, Oberko-
chen, Germany) equipped with an AxioCam MRM Rev.3 at 406magnification. Colocalization of the fluorescence signals was
analyzed with AxioVision 4.6.3 software. Image analysis was
performed using Adobe Photoshop.
Electron microscopyCells were fixed in a mixture of 2% paraformaldehyde-2%
glutaraldehyde in PBS (pH 7.4), post-fixed in 1% osmium
tetroxide in veronal acetate buffer (pH 7.4) for 1 h at 25uC,
stained with 0.1% tannic acid in the same buffer for 30 min at
25uC and with uranyl acetate (5 mg/ml) for 1 h at 25uC,
dehydrated in acetone and embedded in Epon 812. Thin sections
were finally examined under a Philips CM10 transmission electron
microscope, after post-staining with uranyl acetate and lead
citrate.
Results
IRS1 in CRCWe determined by RTqPCR the constitutive expression of IRS1
and of c-MYC, key WNT target and effector [17], in total RNA
from paired colorectal mucosa and CRC samples (Figure 1A). Five
CRCs overexpressed IRS1 relative to paired mucosa. Overall, the
mRNA levels of IRS1 were in good agreement with those of c-
MYC.
To explore the modulation of IRS1 and of other insulin/IGF
pathway components, we assessed by western blot the protein
levels of IRS1, InsRß, IGF1Rß and ß-catenin in 7 of the 8 above-
reported CRC cases (for which tissue was available), and in paired
colonic mucosa and adenoma samples from two unrelated FAP
patients [33]. In the primary CRCs the IRS1 protein levels
reflected the mRNA levels, being higher, relative to paired
mucosa, in 4 of the 5 cases that overexpressed IRS1 and c-MYC
mRNA. These CRCs also overexpressed InsRß, IGF1R, and ß-
catenin, while in the other cases the mucosal levels of InsRß,
IGF1R, and ß-catenin were similar or above those of the paired
CRC (Figure 1B–C). In the two FAP cases, IRS1 markedly
increased in the adenoma relative to mucosa, together with InsRß,
IGF1Rß and ß-catenin, and IHC showed diffuse IRS1 in
adenomas (Figure S1).
We further assessed IRS1 protein expression by IHC in
individually-matched paraffin-embedded sections of colonic mu-
cosa, primary and metastatic CRC. Twenty-four cases with paired
primary CRC and liver metastasis, also including cancer-
uninvolved colonic mucosa, were available for analysis. Immuno-
reactive IRS1 was clearly detectable in crypt epithelium, as well as
in primary and metastatic CRC (Figure 2A–E). Primary and
metastatic tumors, when compared to colonic epithelium,
contained higher numbers of cells expressing IRS1 (80.866.2%
for primary and 81.366.6% for metastatic CRC versus
59.165.6% for colonic epithelium, P = 0.013 and P = 0.014,
respectively, Figure 2F). Density values of pixels for IRS1, as
quantified using ImageJ software, did not differ between primary
CRC and colonic epithelium, but were significantly higher in liver
metastases compared to CRC (P,0.01) and colonic epithelium
(P,0.01) (Table 1). Differences in density values of IRS1 between
colonic epithelium of bottom and top crypt were not significant.
We further explored the pathologic correlations of IRS1
expression in a series of 163 primary CRCs tested by IHC on
IRS1 in Colorectal Cancer
PLoS ONE | www.plosone.org 3 April 2012 | Volume 7 | Issue 4 | e36190

Figure 1. mRNA and protein levels of IRS1, c-MYC, insRß, IGF1R and ß-catenin in paired colonic mucosa and primary colorectalcancer (CRC). Panel A shows histograms of the relative expression of IRS1 (left) and c-MYC (right) transcripts in paired samples of cancer-unaffectedcolorectal mucosa (white) and CRC (black), as determined by quantitative real-time PCR (RTqPCR). Mucosa samples were set equal to 100% andnormalized to the relative expression of the housekeeping gene, Cyclophilin. Cancer samples were expressed relative to mucosa and normalized tothe relative expression of the housekeeping gene. In pairs M1T1 to M4T4 and in M8T8, both c-MYC and IRS1 increase in CRC relative to mucosa, onlyin M5T5 and M6T6 IRS1 and c-MYC disagree (IRS1: P = 0.05, c-MYC: P,0.001, unpaired t test on the means of all differences, data not shown). Panel Bshows western blot analysis of IRS1, beta subunit of the insulin receptor (InsRß), beta subunit of the insulin-like growth factor 1 receptor (IGF1Rß), ß-catenin and ß-actin, as loading control, in the paired colonic mucosa and CRC samples shown in A (except M6T6, for which tissue for western blotanalysis was not available). The histograms in Panel C show quantitations, after normalization for ß-actin, of the IRS1, InsRß, IGF1Rß and ß-cateninsignals. Relative to paired mucosa, IRS1 is overexpressed in the CRCs of pairs M1T1-M4T4, together with InsRß, IGF1Rß and ß-catenin (IRS1: P = 0.017,InsRß: P = 0.044, IGF1Rß: P,0.001, ß-catenin: P,0.001, unpaired t test on the means of all differences, data not shown). Notably, the CRCs thatoverexpressed the IRS1, InsRß, IGF1Rß and ß-catenin proteins also overexpressed IRS1 and c-MYC mRNA.doi:10.1371/journal.pone.0036190.g001
IRS1 in Colorectal Cancer
PLoS ONE | www.plosone.org 4 April 2012 | Volume 7 | Issue 4 | e36190

TMA (Table 2). Overall 151/163 cases (92.6%) were IRS1-
positive. IRS1 expression did not significantly differ in relation to
age at diagnosis, gender, tumor location (right versus left colon),
Duke’s stage, and MSI status. However, CRCs with high/
moderate differentiation were more likely to show high percent-
ages of IRS1-positive cells than poorly-differentiated tumors
(P = 0.001), while CRCs with mucinous/signet-ring phenotype
were associated with focal or no IRS1 (P,0.001). Poorly
differentiated CRCs often manifested nuclear staining in addition
to cytoplasmic reactivity. Figure 3A–E exemplifies IRS1 staining
patterns.
As shown in Table 3, which reports Spearman’s correlations
between IHC markers, IRS1 was positively associated with Ki67
(P = 0.008), p53 (P = 0.032), membrane (P = 0.001) and cytoplas-
mic (P,0.001) ß-catenin. Other associations involved cell
membrane ß-catenin, positively correlated with cytoplasmic ß-
catenin (P,0.001) and EGFR (P = 0.005), and cytoplasmic ß-
catenin, positively correlated with nuclear ß-catenin (P,0.001),
Ki67 (P = 0.002) and p53 (P = 0.009), while nuclear ß-catenin
positively correlated with p53 (P = 0.049). Predictably, a positive
correlation was found between Ki67 and p53 (P = 0.029).
These results suggest that high IRS1 is associated with CRCs
combining well/moderately differentiated histological phenotype
with immunohistochemical markers of poor prognosis (expression
of Ki67, p53, and cytoplasmic ß-catenin).
IRS1 in Caco-2 polarizationCaco-2 carries an inactivating APC mutation with second hit by
LOH, but is known to be negative for mutations in KRAS, BRAF,
PIK3CA and PTEN [23,31] (see also COSMIC, http://www.
sanger.ac.uk/cosmic). Caco-2 cells are capable of spontaneous
differentiation, documented by the expression of microvilli,
enzymes and transporters characteristic of polarized enterocytes
and by the development of tight junctions, which, in the in vivo
Figure 2. IRS1 immunostaining in cancer-uninvolved colonic epithelium, primary colorectal cancer and paired synchronous livermetastases. Panel A shows IRS1 immunostaining in full-length longitudinal sections of cancer-uninvolved colonic crypts. Panels B–E provide anexample of IRS1 immunostaining in primary CRC (B–C) versus paired metastasis (liver biopsy core, D–E). Both show diffuse cytoplasmic IRS1, withmuch stronger immunostaining in metastatic cells. Panel F shows the histograms of the mean percentages of IRS1-positive cells in 24 cases ofmatching non-neoplastic colon epithelium, primary CRC and metastatic CRC (error bars mean 6 SEM). There were significant differences betweencolonic epithelium (59.165.6%) and primary CRC (80.866.2%, P = 0.013 by independent sample t test) and between epithelium (59.165.6%) andhepatic metastasis (81.366.6%, P = 0.014). The difference between primary and metastatic CRC was not significant (P = 0.964).doi:10.1371/journal.pone.0036190.g002
IRS1 in Colorectal Cancer
PLoS ONE | www.plosone.org 5 April 2012 | Volume 7 | Issue 4 | e36190
setting, are necessary for upward migration of crypt epithelial cells
toward the mucosal surface [28,29,34]. IRS1 expression and
activation was analyzed by western blot in Caco-2 cultures during
polarization at 3, 7 and 14 days after confluency, in presence and
in absence of serum, together with expression of InsRß and
IGF1Rß (Figure 4A). Under both culture conditions IRS1
decreased at day 7, but increased subsequently, with highest
expression at day 14. Notably, in both normal and serum-free
cultures, InsRß resulted weakly expressed at day 3 and
significantly increased at day 7, with maximum expression at
day 14. Inversely, again under both conditions, IGF1Rß was
highest at day 3 and dramatically decreased at days 7 and 14. To
assess IRS1 activation, Caco-2 cells at 3, 7 and 14 days from
confluency were serum-starved overnight and then stimulated with
or without insulin (100 nM) or IGF1 (10 nM) for 5 min. Total
protein lysates (80 mg) obtained after 5 min of treatment were
resolved and blotted with anti-pIRS1 Tyr632 (Figure 4G). IRS1
tyrosine phosphorylation was relevant at day 7 of polarization and
did not appear to be modulated by exogenous insulin or IGF1
(lane 4–6). However, at day 3, only exogenous IGF1 activated
IRS1. These data suggest that IRS1 could mediate autocrinely-
activated InsR signaling in polarized cells (where IRS1 and InsRß
are maximally expressed and IGF1Rß is lowest), and IGF1R
signaling, activated by exogenous IGFs, in pre-polarized cells
(where IRS1 is expressed at lower level and IGF1Rß and InsRß at
highest and lowest levels, respectively).
Transmission electron microscopy of the Caco-2 cultures
documented at day 3 the formation of localized electron-dense
areas of close opposition between adjacent lateral plasma
membranes, characteristic of forming tight junctions, and at day
14 the presence of complete intercellular junctional complexes, as
well as polarization of the absorptive apical brush border
(Figure 4B–F). Overall, this confirmed enterocytic polarization
during the culture time course [28].
Immunofluorescence analysis demonstrated differences in the
subcellular distribution of total IRS1 and of pIRS1 Tyr632 during
the Caco-2 culture time course (Figure 5). At day 3 IRS1
immunolabeling was distinctly less intense than at days 7 and 14,
and was predominantly localized along the lateral and basolateral
cell membranes. Merging of the ß-catenin and IRS1 images
confirmed the colocalization of the two proteins along the
basolateral membranes. At day 3 staining of pIRS1 Tyr632 was
relatively weak and had a distribution similar to that of total IRS1.
At day 7 pIRS1 Tyr632 increased and mostly appeared as
punctate staining on top of surface cells, suggestive of localization
beneath the plasma membrane on the apical side. Total IRS1
remained predominantly localized along the basolateral mem-
branes, together with ß-catenin. Notably, at day 14 pIRS1 Tyr632
was restricted to fewer surface cells, which, however, appeared
more strongly labeled than at day 7, with the typical apical plasma
membrane punctate pattern (the lower number of positive cells
was consistent with the decrease in pIRS1 Tyr632 at day 14 by
western blot). No nuclear staining for IRS1, pIRS1 Tyr632 or ß-
catenin was observed during Caco-2 cell polarization.
In conclusion, the immunofluorescence data indicate that in the
Caco-2 model the intensity of IRS1 and pIRS1 staining increases
with polarization, and that, during such process, pIRS1 Tyr632
becomes expressed in surface cells only, switching in subcellular
distribution from the cytoplasm and basolateral membranes, where
it colocalizes with ß-catenin, to the apical plasma membranes. This
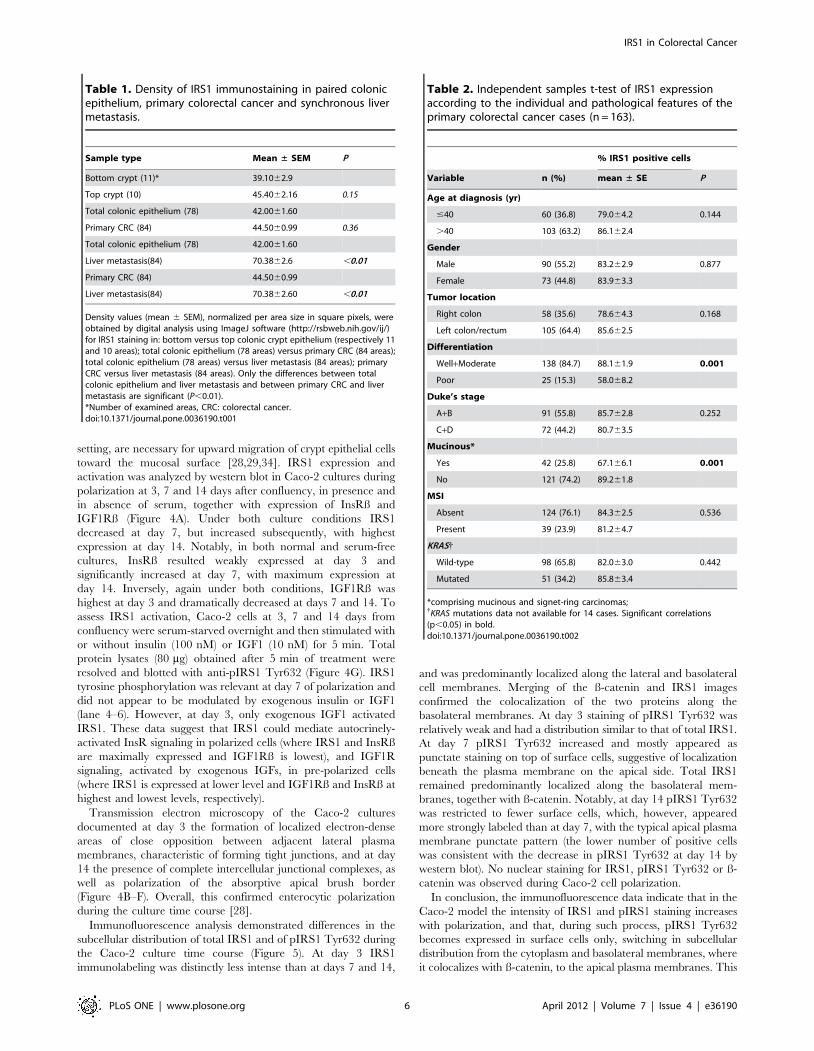
Table 1. Density of IRS1 immunostaining in paired colonicepithelium, primary colorectal cancer and synchronous livermetastasis.
Sample type Mean ± SEM P
Bottom crypt (11)* 39.1062.9
Top crypt (10) 45.4062.16 0.15
Total colonic epithelium (78) 42.0061.60
Primary CRC (84) 44.5060.99 0.36
Total colonic epithelium (78) 42.0061.60
Liver metastasis(84) 70.3862.6 ,0.01
Primary CRC (84) 44.5060.99
Liver metastasis(84) 70.3862.60 ,0.01
Density values (mean 6 SEM), normalized per area size in square pixels, wereobtained by digital analysis using ImageJ software (http://rsbweb.nih.gov/ij/)for IRS1 staining in: bottom versus top colonic crypt epithelium (respectively 11and 10 areas); total colonic epithelium (78 areas) versus primary CRC (84 areas);total colonic epithelium (78 areas) versus liver metastasis (84 areas); primaryCRC versus liver metastasis (84 areas). Only the differences between totalcolonic epithelium and liver metastasis and between primary CRC and livermetastasis are significant (P,0.01).*Number of examined areas, CRC: colorectal cancer.doi:10.1371/journal.pone.0036190.t001
Table 2. Independent samples t-test of IRS1 expressionaccording to the individual and pathological features of theprimary colorectal cancer cases (n = 163).
% IRS1 positive cells
Variable n (%) mean ± SE P
Age at diagnosis (yr)
#40 60 (36.8) 79.064.2 0.144
.40 103 (63.2) 86.162.4
Gender
Male 90 (55.2) 83.262.9 0.877
Female 73 (44.8) 83.963.3
Tumor location
Right colon 58 (35.6) 78.664.3 0.168
Left colon/rectum 105 (64.4) 85.662.5
Differentiation
Well+Moderate 138 (84.7) 88.161.9 0.001
Poor 25 (15.3) 58.068.2
Duke’s stage
A+B 91 (55.8) 85.762.8 0.252
C+D 72 (44.2) 80.763.5
Mucinous*
Yes 42 (25.8) 67.166.1 0.001
No 121 (74.2) 89.261.8
MSI
Absent 124 (76.1) 84.362.5 0.536
Present 39 (23.9) 81.264.7
KRAS{
Wild-type 98 (65.8) 82.063.0 0.442
Mutated 51 (34.2) 85.863.4
*comprising mucinous and signet-ring carcinomas;{KRAS mutations data not available for 14 cases. Significant correlations(p,0.05) in bold.doi:10.1371/journal.pone.0036190.t002
IRS1 in Colorectal Cancer
PLoS ONE | www.plosone.org 6 April 2012 | Volume 7 | Issue 4 | e36190

parallels the tightening of the intercellular junctions, as evidenced by
electron microscopy, which makes the basolateral membranes
inaccessible to freely-diffusing extracellular molecules.
IRS1 in HT29 polarizationHT-29 cells carry double-hit APC mutations, as well as
mutations in SMAD4, BRAF, TP53, and, particularly, PI3KCA,
which constitutively activate and deregulate intracellular signaling
[23,31] (see also COSMIC, http://www.sanger.ac.uk/cosmic).
Therefore HT29 cells provide a distinct in vitro model for the study
of intestinal epithelial differentiation and polarity [22,29].
IRS1 protein expression was analyzed by western blotting in
HT29 cultures during spontaneous polarization, together with the
InsRß and IGF1Rß subunit proteins. Western blot analysis
showed that IRS1 levels were highest at day 3 (pre-confluent)
and markedly decreased at day 7 (confluent), with only a slight
increase (relative to day 7) at day 14 (post-confluent) (Figure 6A).
IGF1Rß was similarly modulated, showing highest expression at
day 3, marked decrease at day 7, and only slight increase (relative
to day 7) at day 14. InsRß, low at day 3 and lowest at day 7,
strongly increased at day 14. ß-catenin demonstrated little
modulation, with slightly higher level at day 14 (post-confluent).
Transmission electron microscopy analysis of pre-confluent (day
3), confluent (day 7) and post-confluent (day 14) HT29 cells
demonstrated gradual polarization during the time course
(Figure 6B–D). Formation of localized electron-dense areas of
close opposition between the lateral plasma membranes of
adjacent cells, characteristic of forming intercellular junctions,
was evident at day 7, and tight junctions, including zonula
adherens and desmosomes, were evident at day 14, together with
functional apical polarization of the microvilli.
Immunofluorescence analysis clearly revealed that in pre-
confluent, and, with lesser intensity, post-confluent HT29 cells
IRS1 was detectable in the cytoplasm, particularly in the
perinuclear region, as well as in discrete spots within the nuclei
(Figure 7). Nuclear IRS1 was confirmed by double labeling with
Figure 3. IRS1 and tumor histotype in primary colorectal cancer. Panels A and B respectively show diffuse cytoplasmic IRS1 in non-mucinouscolorectal CRCs, including a moderately differentiated tumor, with strong immunostaining of cancer cells, and a poorly differentiated tumor, withweaker and possibly also nuclear IRS1 (arrowheads). Panels C–E show a poorly differentiated CRC with mucinous, mostly signet-ring phenotype.Notably, in the marginal area (single asterisk) detailed in panel D, tumor cells with non-mucinous phenotype show nuclear/perinuclear IRS1(arrowheads), whereas signet-ring cells floating in mucin (double asterisk), detailed in panel E, do not show IRS1 immunostaining.doi:10.1371/journal.pone.0036190.g003
Table 3. Spearman’s correlations among IRS1, Ki67, p53,EGFR and ß-catenin in the primary colorectal cancer cases(n = 163).
IRS-1 Ki-67 p53 EGFR ßCat M ßCat C ßCat N
IRS1
Rho 1 0.213 0.168 20.030 0.263 0.360 0.128
P 0.008 0.032 0.709 0.001 0.000 0.107
Ki67
Rho 0.213 1 0.176 20.049 0.082 0.251 0.074
P 0.008 0.029 0.554 0.311 0.002 0.361
p53
Rho 0.168 0.176 1 20.088 0.108 0.205 0.156
P 0.032 0.029 0.277 0.175 0.009 0.049
EGFR
Rho 20.030 20.049 20.088 1 0.222 0.037 0.156
P 0.709 0.554 0.277 0.005 0.645 0.050
ßCat M
Rho 0.263 0.082 0.108 0.222 1 0.509 20.088
P 0.001 0.311 0.175 0.005 0.000 0.267
ßCat C
Rho 0.360 0.251 0.205 0.037 0.509 1 0.491
P 0.000 0.002 0.009 0.645 0.000 0.000
ßCat N
Rho 0.128 0.074 0.156 20.157 20.088 0.491 1
P 0.107 0.361 0.049 0.050 0.267 0.000
Abbreviations: ßCat: ß-catenin; EGFR: epidermal growth factor receptor; M:membrane staining; C: cytoplasmic staining; N: nuclear staining; Rho:Spearman’s coefficient correlation. Significant correlations (P,0.05) in bold.doi:10.1371/journal.pone.0036190.t003
IRS1 in Colorectal Cancer
PLoS ONE | www.plosone.org 7 April 2012 | Volume 7 | Issue 4 | e36190

Figure 4. Expression of IRS1, insulin receptor, IGF1 receptor and ultrastructural differentiation in polarizing Caco-2 cells. Panel Ashows western blot analysis of IRS1, beta subunit of the insulin receptor (InsRß), beta subunit of the insulin-like growth factor 1 receptor (IGF1Rß) andß-actin, as loading control, in Caco-2 cells at days 3, 7 and 14 post-confluence, duplicated in absence (2) and presence (+) of serum in the culturemedium. The histograms show quantitations, after normalization for ß-actin, of the IRS1, InsRß and IGF1Rß signals (means 6 SE from the twoexperiments). Under both culture conditions increased espression of IRS1 and InsRß is clearly evident in polarized cells at day 14 (IRS1) and at days 7and 14 (InsRß), whereas maximum expression of IGF1Rß is detected only at day 3. Transmission electron microscopy of Caco-2 cells at day 3 of thespontaneous polarization time course reveals forming electron-dense junctions at the apex of the lateral membranes of adjacent cells (panel A,arrow). With progression of polarization, tight junctions and desmosomes (panels C–D, arrows) and adhesion junctions (panel D) become evident aselectron-dense plaques on adjacent lateral membranes at days 7 and 14, respectively. In addition, tight multicellular clusters, with differentiationfeatures, such as intracellular lumina rich of apical brush border (panels E–F), become evident at day 14. Abbreviations: tj, tight junction; ad, adhesionjunction; ds, desmosome. Panel G shows western blot levels of tyrosine 632-phosphorylated IRS1 (IRS1tyr632) and, as loading control, ß-actin, inserum-starved Caco-2 cells unstimulated (2) and stimulated (+) with insulin (100 nM) or IGF1 (10 nM). IRS1 tyrosine phosphorylation is relevant atday 7 of polarization, independently from the addition of exogenous insulin or IGF1. However, at day 3, only exogenous IGF1 determines IRS1phosphorylation.doi:10.1371/journal.pone.0036190.g004
IRS1 in Colorectal Cancer
PLoS ONE | www.plosone.org 8 April 2012 | Volume 7 | Issue 4 | e36190

IRS1 and the membrane marker WGA. Interestingly, pIRS1
Tyr632, which appeared as discrete dots, was almost exclusively
localized in the nuclei and did not change between pre- and post-
confluent cells. At both culture time points, ß-catenin was present
in the nucleus, as well as in the cytoplasm and along the lateral
membranes. IRS1 did not colocalize with ß-catenin in pre-
confluent cells, while some colocalization signals, only in the
cytoplasm, were observed in post-confluent cells.
These data indicate that in HT29 cells, known to carry
mutations that constitutively activate intracellular signaling, IRS1
Figure 5. Subcellular localizations of IRS1, p-IRS1 and ß-catenin during Caco-2 polarization. Apotome immunofluorescence analysis atdays 3, 7, and 14 postconfluency demonstrates differences in the cellular distribution of total IRS1 (IRS1, green), tyrosine 632-phosphorylated IRS1(pIRS1, green), and ß-catenin (red) during the Caco-2 culture time course. For each field, the nuclei are counterstained in blue with 49,6-diamidino-2-phenylindole (DAPI). Overlaps between red and green signals (merge) point to co-localizations (in yellow) of IRS1/pIRS1 and ß-catenin. Bar = 20 mm.doi:10.1371/journal.pone.0036190.g005
IRS1 in Colorectal Cancer
PLoS ONE | www.plosone.org 9 April 2012 | Volume 7 | Issue 4 | e36190

is highest in pre-confluent cells and pIRS1 localizes in discrete
nuclear spots, with little variation during the polarization course.
Discussion
Of the 3 human IRS genes, IRS1, IRS2 and IRS4, the
ubiquitously expressed IRS1 and IRS2 mediate the major
metabolic, proliferative and anti-apoptotic functions of InsR and
IGF1R signaling [18]. Tyrosine-phosphorylated IRS1/2 bind Src
homology 2 (SH2) proteins, such as the p85 subunit of the PI3K,
the phosphotyrosine phosphatase SHP-2, the Src-like kinases Fyn,
Grb-2, NCK, CRK, SHB, and others. These activate downstream
effectors, such as the mitogen-activated protein kinase (MAPK)
and the PI3K pathways, which promote survival, proliferation,
differentiation and metabolic responses [18].
We previously showed that IRS2 is directly controlled by the
caudal-related homeobox protein 2 (CDX2) and significantly
expressed in top crypt intestinal epithelium [27]. IRS2 RNA
increases with spontaneous differentiation in both HT29 and
Caco-2 cells and is downregulated in ß-catenin-dependent
intestinal tumorigenesis [33].
In contrast, several lines of evidence, summarized in the
introduction, implicate IRS1 in intestinal carcinogenesis, under
the direct control of TCF/LEF-ß-catenin complexes [19–21]. It is
also well known that endogenous IRS1 is overexpressed and
constitutively activated in a variety of human cancers [34].
In the present study, IRS1 mRNA and protein levels resulted
higher, relative to paired mucosa, in CRCs that overexpressed c-
MYC, ß-catenin, InsRß, and IGF1R. Overexpression of IRS1,
together with ß-catenin, InsRß, and IGF1R, in FAP-associated
adenomas was in agreement with data reported for the Apc(Min/+)
mouse model [21,35]. By IHC, IRS1 resulted expressed throughout
the colonic crypt, which could be consistent with a role of InsR/
IGF1R signaling in intestinal epithelial differentiation [36–37].
Figure 6. Expression levels of IRS1, insulin receptor, IGF1 receptor, ß-catenin and ultrastructural differentiation in polarizing HT29cells. Panel A shows western blot analysis of IRS1, beta subunit of the insulin receptor (InsRß), ß-catenin, beta subunit of the insulin-like growthfactor 1 receptor (IGF1Rß), and ß-actin, as loading control, in HT29 cells maintained in complete medium during spontaneous differentiation at days 3(pre-confluent), 7 (confluent) and 14 (post-confluent). The histograms show quantitations, after normalization for ß-actin, of the IRS1, InsRß, ß-cateninand IGF1Rß protein signals (means 6 SE from two independent experiments). Expression of IRS1 and IGF1Rß is highest at day 3 and markedlydeclines at days 7 and 14, whereas InsRß is maximally expressed at day 14. At day 3, transmission electron microscopy of HT29 cells reveals bundles ofintermediated filaments converging towards the plasma membrane to form electron-dense junctions between adjacent cell membranes (panel B–B1,arrow). With progression of the time-course, HT29 cells display differentiated features, such as desmosomes at days 7 and 14 (panel C–C1, arrow, andD–D1, arrow) and tight junctions at day 14 (D–D1, arrow). Abbreviations: tj, tight junction; ad, adhesion junction; ds, desmosome.doi:10.1371/journal.pone.0036190.g006
IRS1 in Colorectal Cancer
PLoS ONE | www.plosone.org 10 April 2012 | Volume 7 | Issue 4 | e36190

The immunostaining of the primary CRCs was in the range of
that of the cancer-uninvolved top crypt in terms of intensity, but
more diffuse in terms of percentages of positive cells, which may
account for the above-discussed higher mRNA and protein levels
in CRC relative to mucosa. In the hepatic metastases, IRS1
positivity was similar to that of the primary tumors in percentages
of stained cells, but the staining intensity resulted significantly
higher. The increase of IRS1 staining intensity in hepatic
metastases is consistent with the fact that the liver is the major
site of IGFs synthesis [38]. Furthermore, it has been shown that
metastatic CRC cells express high IGF1R and that IRS1 promotes
liver metastatization [38–41].
Human CRC is a molecularly heterogeneous disease [42–45].
To investigate associations with pathological characteristics, we
Figure 7. Subcellular localizations of IRS1, p-IRS1 and ß-catenin during HT29 polarization. Panels A–D show Apotomeimmunofluorescence analysis of HT29 cells at days 3 (pre-confluent), 7 (confluent) and 14 (post-confluent). This demonstrates differences in thecellular distribution of total IRS1 (IRS1, green), tyrosine 632-phosphorylated IRS1 (pIRS1, green, mainly nuclear dots), and ß-catenin (red) during theculture time course. For each field, the nuclei are counterstained in blue with 49,6-diamidino-2-phenylindole (DAPI). Overlaps between red and greensignals (yellow) point to co-localizations of IRS1/pIRS1 and ß-catenin. This does not appear to involve the nuclear localizations, where IRS1 mainlyappears as green dots and ß-catenin mainly as purple to bluish-violet blotches. Panel E highlights nuclear IRS1 (red, discrete dots) by double labelingof HT29 cells with the membrane marker wheat germ agglutinin (WGA, green). Bars = 20 mm.doi:10.1371/journal.pone.0036190.g007
IRS1 in Colorectal Cancer
PLoS ONE | www.plosone.org 11 April 2012 | Volume 7 | Issue 4 | e36190

evaluated a series of 163 primary CRCs for IRS1 expression by
TMA IHC. In terms of percentages of positive cells, IRS1
correlated with moderately/well-differentiated phenotype, but was
also associated with markers of proliferative activity/biological
aggressiveness (Ki67, p53, and cytoplasmic ß-catenin). In this
regard, it is well recognized that the moderately to well-
differentiated CRC subset includes tumors with a spectrum of
histological variation and with different metastatic potentials [46].
Moreover, it has been shown that resistance to apoptosis identifies
CRCs that, independently of clinicopathological variables (includ-
ing grade of histological differentiation), have poor outcomes [47].
Signaling through the IGF/INS/IRS axis has a key anti-apoptotic
role [48]. Further studies are needed to verify whether IRS1
concurs in identifying CRCs that, independently of classic
pathological variables, have poor prognosis because of selective
advantages during tumor progression [49].
Unlike Bommer et al. [19], who reported an enrichment of
mucinous histotype in their high-IRS1 CRC subset, in our study
mucinous/signet ring CRCs expressed significantly less IRS1 than
non-mucinous tumors. In this regard, our findings are coherent
with our evidence that IRS1 labeling correlates with moderately/
well-differentiated phenotype and with the fact that mucinous/
signet ring CRCs tend to be poorly differentiated [50].
To correlate IRS1 with differentiation in in vitro CRC models,
we investigated the expression of IRS1, InsRß and IGF1R in
Caco-2 and HT29 cells. In Caco-2, that mimics crypt to villus axis
differentiation [28–29], IRS1 and InsRß reached maximum levels
at completion of polarization, while IGF1Rß was maximally
expressed in pre-polarized cells. This suggests that IRS1 could
mainly mediate IGF1R signaling before polarization and InsR
signaling with polarization, together with IRS2, also highly
expressed in polarized Caco-2 cells [27,51]. No nuclear IRS1
was detected, while, with polarization, pIRS1 Tyr632 was
expressed only in surface cells, switching from the lateral to the
apical plasma membrane. This process paralleled the tightening of
the intercellular junctions evidenced by electron microscopy,
suggesting that IRS1 migrated from intercellular membranes that,
due to close-fitting contact, became inaccessible to exogenous
signaling, to free apical membranes. Notably, this sub-apical
localization is consistent with the fact that in polarized Caco-2 cells
InsR and IGF1R are implicated in the regulation of Na+ glucose
transport across the brush border, as in functional intestinal
epithelium, and with evidence that in polarized epithelia insulin is
in the apical fluid and InsR at the apical membrane [52–54]. Thus
the Caco-2 model supports the view that cytoplasmic IRS1
expression correlates with differentiation, as observed by immu-
nohistochemistry in primary CRCs.
In HT29 cells, where a gain of function PI3KCA mutation
cooperates with other mutations in increasing proliferative and
survival capacities [7,43,44,55], total IRS1 decreased with
polarization and pIRS1, that did not appreciably vary, localized
mainly in discrete nuclear spots, in contrast with the sub-apical
location seen in polarized Caco-2 cells. This nuclear localization
could be relevant, as IRS1 inhibition attenuates tumorigenicity in
HT29 cells, that express low cytoplasmic IRS1 [19]. Following
oncogene activation or IGF1 treatment, IRS1 is known to
translocate in the nucleus [56–60], where it might be involved in
ß-catenin translocation [61] and/or act as a transcription factor
[57]. Furthermore, activated IGF1R has been recently shown to
translocate to the nucleus in both non-malignant tissues and
cancers [62–63], although it remains to be determined whether
IRS1 and IGF1R interact in this subcellular location. Thus, the
low IRS1 expression seen in HT29 cells could reflect that observed
in the poorly differentiated primary CRCs, including mucinous/
signet ring tumors, and could be related to nuclear trafficking and
functions.
In conclusion, our results provide further evidence that IRS1 is
differentially modulated, together with InsRß, IGF1R, and ß-
catenin, during differentiation in the Caco-2 and HT29 cell
models and ex vivo in primary CRCs versus mucosa. Furthermore,
diffuse IRS1 appears to be associated with CRCs that, despite
their moderately to well differentiated histologic features, express
markers of biological aggressiveness. The increase in IRS1
immunostaining in hepatic secondaries is consistent with a possible
role in liver metastatization [38–41]. Unfortunately, follow-up
data for our patients were not available. Therefore, the prognostic
value of IRS1 expression in CRC could not be assessed. This is a
limitation of the present study, which needs to be addressed in
future investigations.
Supporting Information
Figure S1 IRS1, insulin receptor, IGF1 receptor and ß-catenin in colonic mucosa and adenomas from familialadenomatous polyposis coli (FAP) patients. Panel A
compares the western blot expression levels of IRS1, beta subunit
of the insulin receptor (InsRß), beta subunit of the insulin-like
growth factor 1 receptor (IGF1Rß), ß-catenin and, as loading
control, ß-actin, in paired mucosa (M) and adenoma (T) samples
from two unrelated FAP patients. In both cases, the levels of IRS1,
InsRß, IGF1Rß, and ß-catenin are distinctly higher in the
adenoma versus the paired mucosa sample. Panel B, detailing
the edge of an adenoma, highlights the difference in IRS1
immunostaining associated with the transition between normal-
appearing (downward pointing arrow) and dysplastic (upward
pointing arrow) colonic crypts. The hyperplastic and mucin-
depleted epithelium of the dysplastic crypts shows diffuse
cytoplasmic IRS1, while mostly perinuclear/nuclear IRS1 is
evident in non-dysplastic crypts. Panel C shows diffuse cytoplasmic
IRS1 in a severely dysplastic adenoma.
(TIF)
Acknowledgments
We thank Professor Luca Messerini, Department of Human Pathology and
Oncology, University of Florence, Florence, Italy, for kind cooperation in
providing paired samples of colorectal cancer and colonic mucosa.
Author Contributions
Conceived and designed the experiments: DLE MP A. Moschetta LVL
RMC. Performed the experiments: DLE FA RL A. Morgano MA FB.
Analyzed the data: DLE RL AR MP A. Morgano LVL RMC. Contributed
reagents/materials/analysis tools: RM FB RL AR MP A. Moschetta.
Wrote the paper: RMC LVL DLE. Obtained permission for use of
paraffin-embedded colorectal cancer samples: RM RV AR. Performed
western blot analyses: DLE FA. Prepared tissue microarrays and
performed immunohistochemistry: RL MP. Performed immunofluores-
cence and electron microscopy studies on cell lines: MA LVL. Performed
real-time quantitative PCR: A. Morgano.
References
1. Center MM, Jemal A, Smith RA, Ward E (2009) Worldwide variations in
colorectal cancer. CA Cancer J Clin 59: 366–78.
2. Johnson IT, Lund EK (2007) Review article: nutrition, obesity and colorectal
cancer. Aliment Pharmacol Ther 26: 161–81.
3. World Cancer Research Fund/American Institute for Cancer Research (2007)
Food, nutrition, physical activity, and the prevention of cancer: a global
perspective. Washington DC: AICR press.
IRS1 in Colorectal Cancer
PLoS ONE | www.plosone.org 12 April 2012 | Volume 7 | Issue 4 | e36190

4. Pollak M (2008) Insulin and insulin-like growth factor signalling in neoplasia.
Nat Rev Cancer 8: 915–28.
5. Haydon AM, Macinnis RJ, English DR, Morris H, Giles GG (2006) Physical
activity, insulin-like growth factor 1, insulin-like growth factor binding protein 3,
and survival from colorectal cancer. Gut 55: 689–94.
6. Ngo TH, R. Barnard RJ, Tymchuk CN, Cohen P, Aronson WJ (2002) Effect of
diet and exercise on serum insulin, IGF-I, and IGFBP-1 levels and growth of
LNCaP cells in vitro. Cancer Causes Control 13: 929–935.
7. Durai R, Yang W, Gupta S, Seifalian AM, Winslet MC (2005) The role of the
insulin-like growth factor system in colorectal cancer: review of current
knowledge. Int J Colorectal Dis 20: 203–20.
8. Giovannucci E (2001) Insulin, insulin-like growth factors and colon cancer: a
review of the evidence. J Nutr 131(11 Suppl): 3109S–20S.
9. Sandhu MS, Dunger DB, Giovannucci EL (2002) Insulin, insulin-like growth
factor-I (IGF-I), IGF binding proteins, their biologic interactions, and colorectal
cancer. J Natl Cancer Inst 94: 972–80.
10. Giovannucci E, Harlan DM, Archer MC, Bergenstal RM, Gapstur SM, et al.
(2010) Diabetes and Cancer: A Consensus Report. CA Cancer J Clin 60:
207–221.
11. Guo YS, Narayan S, Yallampalli C, Singh P (1992) Characterization of insulin
like growth factor I receptors in human colon cancer. Gastroenterology 102:
1101–8.
12. Bach SP, Renehan AG, Potten CS (2000) Stem cells: the intestinal stem cell as a
paradigm. Carcinogenesis 21: 469–476.
13. Clevers H (2006) Wnt/beta-catenin signaling in development and disease. Cell
127: 469–8.
14. Kinzler KW, Vogelstein B (1996) Lessons from hereditary colorectal cancer. Cell
87: 159–70.
15. Behrens J, Jerchow BA, Wurtele M, Grimm J, Asbrand C, et al. (1998)
Functional interaction of an axin homolog, conductin, with beta-catenin, APC,
and GSK3beta. Science 280: 596–9.
16. Yang J, Zhang W, Evans PM, Chen X, He X, et al. (2006) Adenomatous
polyposis coli (APC) differentially regulates beta-catenin phosphorylation and
ubiquitination in colon cancer cells. J Biol Chem 281: 17751–7.
17. van de Wetering M, Sancho E, Verweij C, de Lau W, Oving I, et al. (2002) The
beta-catenin/TCF-4 complex imposes a crypt progenitor phenotype on
colorectal cancer cells. Cell 111: 241–50.
18. White MF (2002) IRS proteins and the common path to diabetes. Am J Physiol
Endocrinol Metab 283: E413–22.
19. Bommer GT, Feng Y, Iura A, Giordano TJ, Kuick R, et al. (2010) IRS1
regulation by Wnt/beta-catenin signaling and varied contribution of IRS1 to the
neoplastic phenotype. J Biol Chem 285: 1928–38.
20. Dearth RK, Cui X, Kim HJ, Hadsell DL, Lee AV (2007) Oncogenic
transformation by the signaling adaptor proteins insulin receptor substrate
(IRS)-1 and IRS-2. Cell Cycle 6: 705–13.
21. Ramocki NM, Wilkins HR, Magness ST, Simmons JG, Scull BP, et al. (2008)
Insulin receptor substrate-1 deficiency promotes apoptosis in the putative
intestinal crypt stem cell region, limits Apcmin/+ tumors, and regulates Sox9.
Endocrinology 149: 261–7.
22. Rousset M (1986) The human colon carcinoma cell lines HT-29 and Caco-2:
two in vitro models for the study of intestinal differentiation. Biochimie 68:
1035–1040.
23. Jhawer M, Goel S, Wilson AJ, Montagna C, Ling YH, et al. (2008) PIK3CA
mutation/PTEN expression status predicts response of colon cancer cells to the
epidermal growth factor receptor inhibitor cetuximab. Cancer Res 68: 1953–61.
24. Bishehsari F, Mahdavinia M, Malekzadeh R, Verginelli F, Catalano T, et al.
(2006) Patterns of K-ras mutation in colorectal carcinomas from Iran and Italy (a
Gruppo Oncologico dell’Italia Meridionale study): influence of microsatellite instability
status and country of origin. Ann Oncol 17 Suppl 7: vii91–6.
25. Mahdavinia M, Bishehsari F, Verginelli F, Cumashi A, Lattanzio R, et al. (2008)
P53 mutations in colorectal cancer from northern Iran: Relationships with site of
tumor origin, microsatellite instability and K-ras mutations. J Cell Physiol 216:
543–50.
26. Wang Q, Symes AJ, Kane CA, Freeman A, Nariculam J, et al. (2010) A novel
role for Wnt/Ca2+ signaling in actin cytoskeleton remodeling and cell motility
in prostate cancer. PLoS One 5: e10456.
27. Modica S, Morgano A, Salvatore L, Petruzzelli M, Vanier MT, et al. (2009)
Expression and localisation of insulin receptor substrate 2 in normal intestine
and colorectal tumours. Regulation by intestine-specific transcription factor
CDX2. Gut 58: 1250–9.
28. Saaf AM, Halbleib JM, Chen X, Yuen ST, Leung SY, et al. (2007) Parallels
between global transcriptional programs of polarizing Caco-2 intestinal
epithelial cells in vitro and gene expression programs in normal colon and
colon cancer. Mol Biol Cell 18: 4245–60.
29. Chantret I, Barbat A, Dussaulx E, Brattain MG, Zweibaum A (1988) Epithelial
polarity, villin expression, and enterocytic differentiation of cultured human
colon carcinoma cells: a survey of twenty cell lines. Cancer Res 48: 1936–42.
30. Ilyas M, Tomlinson IP, Rowan A, Pignatelli M, Bodmer WF (1997) Beta-catenin
mutations in cell lines established from human colorectal cancers. Proc Natl
Acad Sci U S A 94: 10330–34.
31. Rowan AJ, Lamlum H, Ilyas M, Wheeler J, Straub J, et al. (2000) APC
mutations in sporadic colorectal tumors: A mutational ‘‘hotspot’’ and
interdependence of the ‘‘two hits’’. Proc Natl Acad Sci USA 97: 3352–57.
32. Yuan Z, Sotsky Kent T, Weber TK (2003) Differential expression of DOC-1 inmicrosatellite-unstable human colorectal cancer. Oncogene 22: 6304–10.
33. Half E, Bercovich D, Rozen P (2009) Familial adenomatous polyposis.
Orphanet J Rare Dis 4: 22.
34. Chang Q, Li Y, White MF, Fletcher JA, Xiao S (2002) Constitutive activation ofinsulin receptor substrate 1 is a frequent event in human tumors: therapeutic
implications. Cancer Res 62: 6035–38.
35. Simmons JG, Ling Y, Wilkins H, Fuller CR, D’Ercole AJ, et al. (2007) Cell-
specific effects of insulin receptor substrate-1 deficiency on normal and IGF-I-mediated colon growth. Am J Physiol Gastrointest Liver Physiol 293:
G995–1003.
36. Ewton DZ, Kansra S, Lim S, Friedman E (2002) Insulin-like growth factor-I hasa biphasic effect on colon carcinoma cells through transient inactivation of
forkhead1, initially mitogenic, then mediating growth arrest and differentiation.Int J Cancer 98: 665–73.
37. Howarth GS (2003) Insulin-like growth factor-I and the gastrointestinal system:
therapeutic indications and safety implications. J Nutr 133: 2109–12.
38. Reinmuth N, Fan F, Liu W, Parikh AA, Stoeltzing O, et al. (2002) Impact ofinsulin-like growth factor receptor-I function on angiogenesis, growth, and
metastasis of colon cancer. Lab Invest 82: 1377–89.
39. Fukuda R, Hirota K, Fan F, Jung YD, Ellis LM, et al. (2002) Insulin-like growthfactor 1 induces hypoxia-inducible factor 1-mediated vascular endothelial
growth factor expression, which is dependent on MAP kinase and phosphati-
dylinositol 3-kinase signaling in colon cancer cells. J Biol Chem 277: 38205–11.
40. Shaw LM (2001) Identification of insulin receptor substrate 1 (IRS-1) and IRS-2
as signaling intermediates in the alpha6beta4 integrin-dependent activation of
phosphoinositide 3-OH kinase and promotion of invasion. Mol Cell Biol 21:5082–93.
41. Yang GY, Xu KS, Pan ZQ, Zhang ZY, Mi YT, et al. (2008) Integrin alpha v
beta 6 mediates the potential for colon cancer cells to colonize in and metastasizeto the liver. Cancer Sci 99: 879–87.
42. Shen L, Toyota M, Kondo Y, Lin E, Zhang L, et al. (2007) Integrated genetic
and epigenetic analysis identifies three different subclasses of colon cancer. ProcNatl Acad Sci USA 104: 18654–59.
43. Samuels Y, Diaz LA, Jr., Schmidt-Kittler O, Cummins JM, Delong L, et al.
(2005) Mutant PIK3CA promotes cell growth and invasion of human cancercells. Cancer Cell 7: 561–73.
44. Wang J, Kuropatwinski K, Hauser J, Rossi MR, Zhou Y, et al. (2007) Colon
carcinoma cells harboring PIK3CA mutations display resistance to growth factordeprivation induced apoptosis. Mol Cancer Ther 6: 1143–50.
45. Shaw RJ, Cantley LC (2006) Ras, PI(3)K and mTOR signalling controls tumour
cell growth. Nature 441: 424–30.
46. Yokoyama S, Takifuji K, Hotta T, Matsuda K, Tominaga T, et al. (2010)Moderately differentiated colorectal adenocarcinoma as a lymph node
metastatic phenotype: comparison with well differentiated counterparts. BMC
Surgery 10: 8.
47. Kawasaki H, Altieri DC, Lu CD, Toyoda M, Tenjo T, et al. (1998) Inhibition of
apoptosis by survivin predicts shorter survival rates in colorectal cancer. Cancer
Res 58: 5071–74.
48. Peruzzi F, Prisco M, Dews M, Salomoni P, Grassilli E, et al. (1999) Multiplesignaling pathways of the insulin-like growth factor 1 receptor in protection from
apoptosis. Mol Cell Biol 19: 7203–15.
49. Sanchez-Arago M, Chamorro M, Cuezva JM (2010) Selection of cancer cellswith repressed mitochondria triggers colon cancer progression. Carcinogenesis
31: 567–76.
50. Chiang JM, Yeh CY, Changchien CR, Chen JS, Tang R, et al. (2010) Mucinousadenocarcinoma showing different clinicopathological and molecular charac-
teristics in relation to different colorectal cancer subgroups. Int J Colorectal Dis25: 941–47.
51. Zarrilli R, Pignata S, Romano M, Gravina A, Casola S, et al. (1994) Expression
of insulin-like growth factor (IGF)-II and IGF-I receptor during proliferation anddifferentiation of Caco-2 human colon carcinoma cells. Cell Growth Differ 5:
1085–91.
52. MacDonald RS, Thornton WH, Jr., Bean TL (1993) Insulin and IGF-1
receptors in a human intestinal adenocarcinoma cell line (Caco-2): regulation ofNa+ glucose transport across the brush border. J Recept Res 13: 1093–1113.
53. Serhan MF, Kreydiyyeh SI (2010) Insulin down-regulates the Na(+)/K(+)
ATPase in enterocytes but increases intestinal glucose absorption. Gen CompEndocrinol 167: 228–33.
54. Carraway CA, Carraway KL (2007) Sequestration and segregation of receptor
kinases in epithelial cells: implications for ErbB2 oncogenesis. Sci STKE2007(381): re3.
55. Remacle-Bonnet M, Garrouste F, el Atiq F, Roccabianca M, Marvaldi J, et al.
(1992) des-(1-3)-IGF-I, an insulin-like growth factor analog used to mimic apotential IGF-II autocrine loop, promotes the differentiation of human colon-
carcinoma cells. Int J Cancer 52: 910–17.
56. Wu A, Chen J, Baserga R (2008) Nuclear insulin receptor substrate-1 activatespromoters of cell cycle progression genes. Oncogene 27: 397–403.
57. Drakas R, Tu X, Baserga R (2004) Control of cell size through phosphorylation
of upstream binding factor 1 by nuclear phosphatidylinositol 3-kinase. Proc NatlAcad Sci USA 101: 9272–76.
58. Wu A, Sciacca L, Baserga R (2003) Nuclear translocation of insulin receptor
substrate-1 by the insulin receptor in mouse embryo fibroblasts. J Cell Physiol
195: 453–60.
IRS1 in Colorectal Cancer
PLoS ONE | www.plosone.org 13 April 2012 | Volume 7 | Issue 4 | e36190

59. Tu X, Wu A, Maiorana A, Baserga R (2003) Subcellular localization of IRS-1 in
cell proliferation and differentiation. Horm Metab Res 35: 734–39.60. Prisco M, Santini F, Baffa R, Liu M, Drakas R, et al. (2002) Nuclear
translocation of insulin receptor substrate-1 by the simian virus 40 T antigen and
the activated type 1 insulin-like growth factor receptor. J Biol Chem 277:32078–85.
61. Chen J, Wu A, Sun H, Drakas R, Garofalo C, et al. (2005) Functionalsignificance of type 1 insulin-like growth factor-mediated nuclear translocation of
the insulin receptor substrate-1 and beta-catenin. J Biol Chem 280: 29912–20.
62. Aleksic T, Chitnis MM, Perestenko OV, Gao S, Thomas PH, et al. (2010) Type
1 insulin-like growth factor receptor translocates to the nucleus of human tumor
cells. Cancer Res: 70: 6412–19.
63. Sehat B, Tofigh A, Lin Y, Trocme E, Liljedahl U, et al. (2010) SUMOylation
mediates the nuclear translocation and signaling of the IGF-1 receptor. Sci
Signal 2010 3: ra10.
IRS1 in Colorectal Cancer
PLoS ONE | www.plosone.org 14 April 2012 | Volume 7 | Issue 4 | e36190
Related Documents