1 The Informational Effects of Tightening Oil and Gas Disclosure Rules* MARC BADIA, IESE Business School MIGUEL DURO, IESE Business School BJORN N. JORGENSEN, London School of Economics and Political Science GAIZKA ORMAZABAL, IESE Business School & C.E.P.R. ABSTRACT We exploit two regulatory shocks to examine the informational effects of tightening pre- existing mandatory disclosure rules. Canadian Rule NI 51-101 and the US “Modernization of Oil and Gas Reporting” introduced a quasi-identical tightening of the rules governing oil and gas reserve disclosures in Canada and the US at different times. Both in Canada and the US, we document significant changes in firms’ reporting outcomes when the new regulation is introduced. We also find that the reserve disclosures filed under the new regulations are more closely associated with stock price changes and with decreases in bid-ask spreads. Our findings are robust to controlling for other confounding factors such as time trends, other information disclosed simultaneously, financial reporting incentives, and monitoring efforts. Keywords: Disclosure Rules, Disclosure of Oil and Gas Reserves. JEL Classifications: M41 * We thank Edward Riedl, two anonymous reviewers, Trevor Harris, Bob Herz, Colleen Honigsberg, Alon Kalay, Sharon Katz, Steve Rock, Gil Sadka, Cathy Schrand, and workshop participants at the 2015 EAA Conference, Chinese University of Hong Kong, IESE, LSE, and WHU Koblenz for helpful comments and suggestions. We thank Wanyi Chen, Tian Fu, Shisheng Jiang, Lichao Liu, Colin McGee, Du Nguyen, Joaquín Peris, Elie Toubiana, and Javier Sánchez Vázquez de Parga for their research assistance. We are grateful to The CanOils Database Ltd. for giving us access to its database and thank Jonathan Moore and Tracey Nabe for their continued help throughout this study. We also thank Nathan Hedley and his team for kindly giving us access to the Evaluate Energy database and for their technical support. We benefited from conversations with industry practitioners and regulators. Specifically, we are indebted to John Lee (SEC Academic Engineering Fellow); David Elliot, Carrie Nermo and Brian Banderk (Alberta Securities Commission); Gary Finnis (partner at Sproule Associates Ltd.); Douglas Isaac and Jim Saloman (partners at PriceWatehouseCoopers). Gaizka Ormazabal thanks the Marie Curie and Ramon y Cajal Fellowships. Marc Badia and Gaizka Ormazabal acknowledge financial contributions from the Spanish Ministry of Science and Innovation, grants ECO2010- 19314 and ECO2011-29533. Miguel Duro acknowledges support from Columbia University CIBER.

Welcome message from author
This document is posted to help you gain knowledge. Please leave a comment to let me know what you think about it! Share it to your friends and learn new things together.
Transcript
1
The Informational Effects of Tightening Oil and Gas Disclosure Rules*
MARC BADIA, IESE Business School
MIGUEL DURO, IESE Business School
BJORN N. JORGENSEN, London School of Economics and Political Science
GAIZKA ORMAZABAL, IESE Business School & C.E.P.R.
ABSTRACT We exploit two regulatory shocks to examine the informational effects of tightening pre-existing mandatory disclosure rules. Canadian Rule NI 51-101 and the US “Modernization of Oil and Gas Reporting” introduced a quasi-identical tightening of the rules governing oil and gas reserve disclosures in Canada and the US at different times. Both in Canada and the US, we document significant changes in firms’ reporting outcomes when the new regulation is introduced. We also find that the reserve disclosures filed under the new regulations are more closely associated with stock price changes and with decreases in bid-ask spreads. Our findings are robust to controlling for other confounding factors such as time trends, other information disclosed simultaneously, financial reporting incentives, and monitoring efforts. Keywords: Disclosure Rules, Disclosure of Oil and Gas Reserves. JEL Classifications: M41
* We thank Edward Riedl, two anonymous reviewers, Trevor Harris, Bob Herz, Colleen Honigsberg, Alon Kalay, Sharon Katz, Steve Rock, Gil Sadka, Cathy Schrand, and workshop participants at the 2015 EAA Conference, Chinese University of Hong Kong, IESE, LSE, and WHU Koblenz for helpful comments and suggestions. We thank Wanyi Chen, Tian Fu, Shisheng Jiang, Lichao Liu, Colin McGee, Du Nguyen, Joaquín Peris, Elie Toubiana, and Javier Sánchez Vázquez de Parga for their research assistance. We are grateful to The CanOils Database Ltd. for giving us access to its database and thank Jonathan Moore and Tracey Nabe for their continued help throughout this study. We also thank Nathan Hedley and his team for kindly giving us access to the Evaluate Energy database and for their technical support. We benefited from conversations with industry practitioners and regulators. Specifically, we are indebted to John Lee (SEC Academic Engineering Fellow); David Elliot, Carrie Nermo and Brian Banderk (Alberta Securities Commission); Gary Finnis (partner at Sproule Associates Ltd.); Douglas Isaac and Jim Saloman (partners at PriceWatehouseCoopers). Gaizka Ormazabal thanks the Marie Curie and Ramon y Cajal Fellowships. Marc Badia and Gaizka Ormazabal acknowledge financial contributions from the Spanish Ministry of Science and Innovation, grants ECO2010-19314 and ECO2011-29533. Miguel Duro acknowledges support from Columbia University CIBER.
2
1. Introduction
On January 9, 2004, Royal Dutch/Shell lost £8bn in market value after announcing a
20 percent negative restatement of its previously disclosed proved oil and gas (O&G)
reserves. The scandal was followed by the resignation of the CEO and a class-action lawsuit
with a subsequent settlement of $450 million. The business press began questioning the rules
on how O&G companies estimated reserves, echoing concerns raised by industry leaders over
the past several years.1 Shell’s reporting, along with other aggressive reporting behaviors,
paved the way for a regulatory tightening of O&G disclosures.2 This paper examines the
informational effects of tightening pre-existing mandatory disclosure rules by exploiting
regulatory changes in Canada and the US regarding mandatory disclosure rules for O&G
reserves.
We study the reporting and stock market consequences (price and bid-ask spread) of
two recent changes in the mandatory disclosure rules for O&G reserves in Canada and the
US. First, the Alberta Securities Commission (ASC) introduced National Instrument 51-101
“Standards for Oil and Gas Activities” (NI 51-101) in 2003 (CSA 2003). Second, the U.S.
Securities and Exchange Commission (SEC) introduced a similar regulation, “Modernization
of Oil and Gas Reporting” (MOGR) in 2009 (SEC 2009). The common feature in both was
the introduction of bright-line probability thresholds to the mandated estimation of reserves.
Specifically, both standards define “proved” reserves as “those with at least a 90%
probability of being actually recovered.” In contrast, prior rules did not use bright-line
probabilistic thresholds. Instead, Canadian regulators defined “proved” reserves as those
1 See, for example, “Needlessly murky” (The Economist, April 7, 2004), “Deloitte Calls on Regulators to Update Rules for Oil and Gas Reserves Reporting” (Business Wire Inc., February 9, 2005), “Oil Majors Back Attack on SEC Rules” (The Daily Telegraph, February 24, 2005), “Standard & Poor’s Urges SEC to Change Disclosure Rules” (International Oil Daily, December 3, 2007). 2 Other high-profile O&G firms such as Big Bear Exploration in Canada, and El Paso, Repsol YPF, and Stone Energy in the US also faced lawsuits due to reserve restatements.
3
“estimated as recoverable” while US regulators defined them as those with a “reasonable
certainty” of being recovered. According to prominent industry commentators, this tightening
of disclosure rules was a key regulatory innovation.3
The introductions of NI 51-101 and MOGR provide a unique opportunity to explore
the consequences of tightening disclosure rules. First, both Canada and the US maintain a
high level of enforcement and integration of securities regulation and financial reporting
incentives (Mittoo 1992; La Porta et al. 1998, 2006). These similarities mitigate concerns
about confounding effects of heterogeneous institutions. Second, the two regulatory changes
are remarkably similar, but were introduced at different times, thus facilitating identification.
Understanding the informational effects of these regulations is particularly important
given the economy’s significant dependence on oil and, hence, on the O&G industry.4 Off-
balance-sheet disclosures of reserves are of paramount importance for O&G firms as amounts
often exceed a firm’s book value of total assets. Investors and creditors use O&G reserve
disclosures for valuation and debt contracting. As a consequence, the introductions of NI 51-
101 and MOGR received considerable attention from market participants. For example,
Ryder Scott Petroleum Consultants (the second largest US O&G evaluator) referred to these
regulatory changes as “the most sweeping changes in petroleum reserves reporting rules in
more than 30 years.” However, the economic consequences of NI 51-101 and MOGR are still
not well understood.
A key potential benefit from tightening disclosure rules is that shifting towards more
bright-line disclosures could increase transparency and facilitate enforcement. Indeed, the
3 See for example the 2005 report “In Search of Reasonable Certainty, Oil and Gas Reserve Disclosure” by Cambridge Energy Research Associates, and comment letters to the SEC from Standard & Poor’s and the Society of Petroleum Evaluation Engineers. 4 According to the U.S. International Energy Agency, Canada and the US rank fifth and first, respectively, in O&G production worldwide. O&G production amounts to more than 7% of the GDP in Canada and around 2.5% in the US. In Canada, the Toronto Stock Exchange (TSX) and the TSX Venture Exchange list the largest number of O&G firms among all stock markets worldwide.
4
ASC stated that the intended benefit of the NI 51-101 was “to enhance the quality,
consistency, timeliness and comparability of public disclosure by reporting issuers
concerning their upstream O&G activities.”5 The ASC considers information on O&G
reserves essential “to enable investors to make informed investment decisions,” stating that
the new regulation was “a response to concerns expressed by market participants about the
quality and consistency of public O&G disclosure.” Similarly, the SEC stated that the
introduction of MOGR responded to concerns about the “quality, accuracy and reliability of
O&G disclosures” and, ultimately, “their usefulness to the market and investors.”6 Our paper
explores whether the ASC and the SEC appear successful in making disclosures of O&G
reserves more informative.
Prior survey evidence supports the hypothesis that shifting to bright-line rules for
O&G reserves might result in more comparable disclosures. A survey conducted for the 2007
Multidisciplinary Reserves Conference of the American Association of Petroleum Geologists
and the Society of Petroleum Engineers shows that commonly-used words and phrases,
without associated probabilities, have a broad range in meaning by individual professional
interpreters. The words “reasonable certainty” and “proved” were interpreted in a range
between the 50th to the 90th percentile of the probability distribution of reserves (McLane et
al. 2008). Also consistent with this notion, experimental research in accounting documents
significant variation in the interpretation of non-bright-line probability statements, especially
between users and producers of accounting information (e.g., Schultz and Reckers 1981;
Jiambalvo and Wilner 1985; Harrison and Tomassini 1989; Reimers 1992; Amer et al. 1994,
1995; Aharony and Dotan 2004; and related findings in psychology research, such as
5 Canadian Securities Administrators Notice, Sept. 26, 2003. 6 Modernization of Oil and Gas Reporting final rule (SEC): Release Nos. 33-8995; 34-59192; FR-78; File No. S7-15-08.
5
Budescu and Wallsten 1985). Prior literature also suggests that numerical thresholds are less
influenced by the context and framing, language diversity, and cultural characteristics (Stone
and Dilla 1994; Windschitl and Wells 1996; Price and Wallace 2001; Doupnik and Richter
2004). That said, other research in psychology shows that humans rely on a few heuristics to
simplify the task of assessing probabilities and that these heuristics can lead to systematic
biases (Tversky and Kahneman 1974, Kahneman and Tversky 1979). Ewert and Wagenhofer
(2005) identify theoretical conditions under which tighter standards lead to an increase in
earnings management and less informative accounting estimates. Thus, the informational
benefit of tightening disclosures rules with the use of bright-line definitions is an open
empirical question.
We empirically examine the informational effects of NI 51-101 and MOGR using a
comprehensive sample of Canadian and US O&G firms between 2002 and 2011. We
document large negative O&G reserve revisions in Canada and in the US in the year of the
introductions of NI 51-101 and MOGR, respectively. This exploratory evidence is consistent
with regulation having an impact on reporting outcomes. If the change in O&G reserve
disclosure requirements made these disclosures more informative, we would expect to
observe an increase in the price sensitivity to O&G reserve disclosures as well as a decrease
in information asymmetry.
In our first set of multivariate tests, we find evidence that the stock market sensitivity
to reserves increased substantially after the introductions of NI 51-101 and MOGR. In
particular, firms with lower pre-existing disclosure quality experience the largest increase in
the stock market sensitivity to reserves after the new regulations. These results are robust to
the potentially confounding effects of time trends.
6
In our second set of multivariate tests, we examine changes in bid-ask spreads in
narrow event windows around the specific dates on which each firm publicly disclosed O&G
reserves. We find that, after the implementation of the new regulations, changes in bid-ask
spreads around O&G reserve disclosure filing dates are more closely associated with the
magnitudes of reserves being disclosed. Prior literature generally interprets decreases in bid-
ask spreads around disclosures as evidence of lower information asymmetry and lower
transactions costs for uninformed traders (Welker 1995), that is, as evidence of higher
liquidity. We follow the recommendation of Christensen et al. (2013, 2016) who argue that
liquidity effects, measured through bid ask spreads, are important economic outcomes that
may result from regulation or enforcement leading to higher quality public information.
Lastly, we conduct additional tests to control for the potential confounding effect of
other simultaneously disclosed financial information, financial reporting incentives and
monitoring efforts. Overall, our evidence is consistent with NI 51-101 and MOGR increasing
the informativeness of O&G reserve disclosures.
Our paper contributes to prior research examining the cost-benefit tradeoffs associated
with disclosure regulation. As explained by Healy and Palepu (2001), Beyer et al. (2010), and
Leuz and Wysocki (2016), our understanding of the effects of mandatory disclosure
necessitates further empirical work. While this literature investigates the economic
consequences of additional mandatory disclosures such as those introduced by Regulation
Fair Disclosure and the Sarbanes-Oxley Act, our study extends this literature by focusing on
the tightening of a pre-existing mandatory disclosure requirement. Although O&G reserves
were required disclosures before the regulatory changes, regulators’ stated intent for both NI
51-101 and MOGR was to increase the precision of these disclosures. We contribute to this
7
literature by providing empirical evidence of the informational effects associated with
tightening off-balance-sheet disclosure rules.
Further, we also contribute to the literature on the interpretation of bright-line
disclosures. While prior research addresses bright-line standards using probability thresholds
in experimental settings (discussed above), our paper is the first to empirically examine the
consequences of shifting to more bright-line rules.7
Finally, this paper specifically adds to the O&G accounting literature examining the
information content of O&G disclosures. Prior research documents a weak association
between levels (changes) of security prices and levels (changes) of O&G valuation
disclosures required by ASC 932 (formerly SFAS 69) for US O&G firms (e.g., Magliolo
1986; Harris and Ohlson 1987; Doran et al. 1988; Alciatore 1993; Shaw and Wier 1993;
Spear 1994). Three plausible reasons might explain these results: unreliable estimates of
reserve quantities (Clinch and Magliolo 1992), flaws in the mandated valuation model (e.g.
use of spot prices and a fixed discount rate of 10%), and model misspecification (Boone
2002). Patatoukas et al. (2015) mitigate these shortcomings by focusing on royalty trusts and
find robust evidence supporting the incremental relevance of ASC 932 disclosures for
valuation. Using a comprehensive sample of North American O&G public firms, we
contribute to this literature by documenting that requiring more specific estimation guidelines
yields more informative O&G disclosures.
While O&G reserve disclosures may appear specific to the North American O&G
industry, we believe that our findings have broader implications. In the review of its
mandatory disclosure rules required by the Jumpstart Our Business (JOBS) Act, the SEC is
7 In prior literature, the probability threshold determines whether recognition, disclosure, or neither is required (e.g., for contingent liabilities). In contrast, our setting benefits from the fact that the introductions of NI 51-101 and MOGR did not change the mandatory nature of O&G reserve disclosures.

8
reconsidering the costs and benefits of imposing bright-line disclosure standards in industry-
specific guides. In addition, our evidence may inform regulators and standard setters outside
Canada and the US. For example, although International Financial Reporting Standards
(IFRS) does not contain requirements to disclose reserve estimates and each country decides
its own disclosure regime, an on-going International Accounting Standards Board (IASB)
project develops common reporting requirements for investigative, exploratory and
developmental activities across a wide range of activities.
The paper proceeds as follows. Section 2 explains the institutional setting. Section 3
describes the sample. Section 4 investigates the effect of NI 51-101 on Canadian firms and
MOGR on firms in the US. Section 5 presents additional evidence and robustness tests.
Section 6 concludes.
2. Institutional background
O&G reserves are generally defined as estimates of the remaining quantities of O&G
anticipated to be recoverable from known accumulations under current technological and
economic conditions (e.g., Petroleum Resources Management System, 2007). Traditionally,
Canadian and US regulations have required the disclosure of a conservative estimate of the
total amount of O&G reserves. This amount is known as “proved” reserves.
Before 2003, Canadian securities regulators defined proved reserves as “those
reserves estimated as recoverable under current technology and existing economic
conditions.”8 In the absence of a more clear definition, the ASC believed “there may be a
widespread and substantive difference” across firms’ disclosures of proved reserves.
Accordingly, in late 2003, the ASC introduced NI 51-101, which tightened the definition of
8 National Policy Statement No. 2-B Guide for Engineers and Geologists Submitting Oil and Gas Reports to Canadian Provincial Securities Administrators.
9
proved reserves to “those reserves that have a probability of being produced of at least 90%.”
That is, NI 51-101 introduced a bright-line probabilistic threshold in the definition of proved
reserves.
Similarly, before 2009, US regulation defined proved reserves as “the estimated
quantities of crude oil, natural gas, and natural gas liquids, which geological and engineering
data demonstrate with reasonable certainty to be recoverable from known reservoirs.” In the
absence of a definition of “reasonable certainty,” the SEC believed ambiguity and
inconsistency persisted in identifying and classifying proved O&G reserves. Accordingly, the
SEC introduced the MOGR in 2009. As did NI 51-101, the SEC rule adopted a definition of
proved reserves consistent with the Canadian Oil and Gas Evaluation Handbook (COGEH).
MOGR defined the term “reasonable certainty” by stating that “there should be at least a 90%
probability that the quantities actually recovered will equal or exceed the estimate.” MOGR
also recognized emerging technologies for extraction of O&G reserves and non-traditional
sources.9
Besides tightening the definition of proved reserves, NI 51-101 and MOGR also
redefined additional point estimates of the probability distribution of reserves. However,
proved reserves is the only estimate that all companies in our sample must disclose.10
9 The inclusion of reserves from emerging technologies and non-traditional sources was viewed by some commentators as a regulatory concession to O&G firms’ lobbying efforts in the US. The concern was that the possibility of including reserves from less certain alternative sources could be used by O&G firms to inflate their reserve estimates (see Urbina 2011). The effect of this change in MOGR, if any, would bias our results towards finding O&G reserves less informative. Canadian firms were already recognizing these sources of reserves before NI 51-101. 10 “Proved plus probable” reserves is defined as the amount of reserves that have more than 50% probability of being recovered (i.e., the 50th percentile or median of the reserves distribution). “Proved plus probable plus possible” reserves is defined as the amount of reserves that have more than 10% probability of being recovered (i.e., the 90th percentile of the reserves distribution). The disclosure of proved and proved plus probable reserves was already mandatory in Canada for many companies before the introduction of NI 51-101. In contrast, only the disclosure of proved reserves was mandated before MOGR in the US. The disclosure of proved plus probable reserves was actually prohibited in the US before MOGR, and was introduced as voluntary after MOGR. In reality, very few companies do disclose proved plus probable reserves in the US. The disclosure of proved plus probable plus possible reserves is voluntary in both countries and also very rare in practice.
10
Appendix A provides examples of O&G reserve disclosures in Canada and the US after the
regulatory changes.
In addition to enhanced disclosure requirements, NI 51-101 and MOGR introduced
other requirements related to monitoring that also varied slightly across the two countries. In
Canada, NI 51-101 allows (but does not require) the establishment of reserves committees,
and mandates the auditing of reserve disclosures by an external evaluator and the disclosure
of the evaluator’s identity. In the US, MOGR does not require hiring an external evaluator,
but does require disclosing the name of the person in charge of auditing reserve amounts.
MOGR also requires the disclosure of the processes used to produce the reserves estimation.
Finally, while NI 51-101 requires a specific declaration of endorsement of the reserve
disclosures by managers and directors, MOGR accepts the generic declaration regarding
financial information in the 10-K.11 Our robustness checks try to disentangle the effect of
monitoring efforts from the informational effect of increases in O&G estimates precision.
Appendix B provides a summary of the changes introduced by both regulations. There
are two other second-order differences regarding disclosures. First, NI 51-101 mandates
disclosures of the future capital required to convert non-producing and probable reserves into
producing reserves, development costs, acquisition costs, and abandonment and reclamation
costs. Second, NI 51-101 requires using spot O&G prices while MOGR required using
historical prices (i.e., the average price over the previous twelve months). Consistent with the
notion that both regulatory changes share important commonalities is the fact that Canadian
reserve disclosures are permitted in the US instead of MOGR. Moreover, rule-making in the
US explicitly mentioned their adoption of COGEH’s definition of reserves and convergence
with Canada (see MOGR Final Rule, pp. 45, 91).
11 Consistent with the Multijurisdictional Disclosure System (MJDS) between Canada and the United States.
11
3. Data and descriptive statistics
We study a comprehensive sample of publicly-traded exploration and production
O&G firms in Canada and the US for the fiscal years from 2002 to 2011. For Canadian firms
listed on the Toronto Stock Exchange (TSX) and the Toronto Venture Exchange (TSX-V) we
obtain O&G reserves data and other firm fundamentals from the CanOils Database Ltd., the
leading commercial database in the Canadian O&G market. We complete missing
information with data from the database the ASC uses to perform its annual review of
companies’ O&G disclosures and with hand-collected data from Annual Information Forms,
Annual Reports, and Forms 51-101F1, F2, and F3 obtained from the System for Electronic
Document Analysis and Retrieval (SEDAR).12 We download the release dates of the Annual
Information Forms and Annual Reports from SEDAR using a Python algorithm. For US
firms listed on the NYSE, NASDAQ and AMEX we obtain O&G reserves data and other
firm fundamentals from CapitalIQ and Evaluate Energy, a provider of financial data for US
O&G firms. We hand-collect missing information from 10K reports in EDGAR, the SEC
database. Our sources for stock market data are Datastream and Bloomberg for TSX firms,
TSX Venture Summary Trading Files for TSX-V firms,13 and the Center for Research and
Security Prices (CRSP) for firms listed on US exchanges.
12 Under NI 51-101, all reporting issuers in Canada with O&G activities must annually file an electronic version of the following forms to their respective securities regulatory authority: Form 51-101F1 (Statement of Reserves Data and Other Information), Form 51-101F2 (Report of Independent Qualified Reserves Evaluator or Auditor), and Form 51-101F3 (Report of Management and Directors). These forms are included in the Annual Information Form that TSX O&G firms have to file every year with information on their exploration and production operations. The current deadline is 90 and 120 days for TSX and TSX-V, respectively, after fiscal year-end. The annual financial statements are reported separately within the same deadlines. 13 To adjust prices for splits, we use the TSX Venture Listed Company Contacts, a TMX Group database that provides monthly outstanding shares, and we combine it with the information on the date of splits from CanOils. For dividends, we download all daily publications from the Toronto Stock Exchange FTP website with Python (http://www.tmx.com/en/listings/products_services/ir_data_solution/venture_market_information.html) to extract the ex-dividend date, the dividend amount for each company, and the currency. We thank Jill Scullion, from TMX group, for suggesting this idea.
12
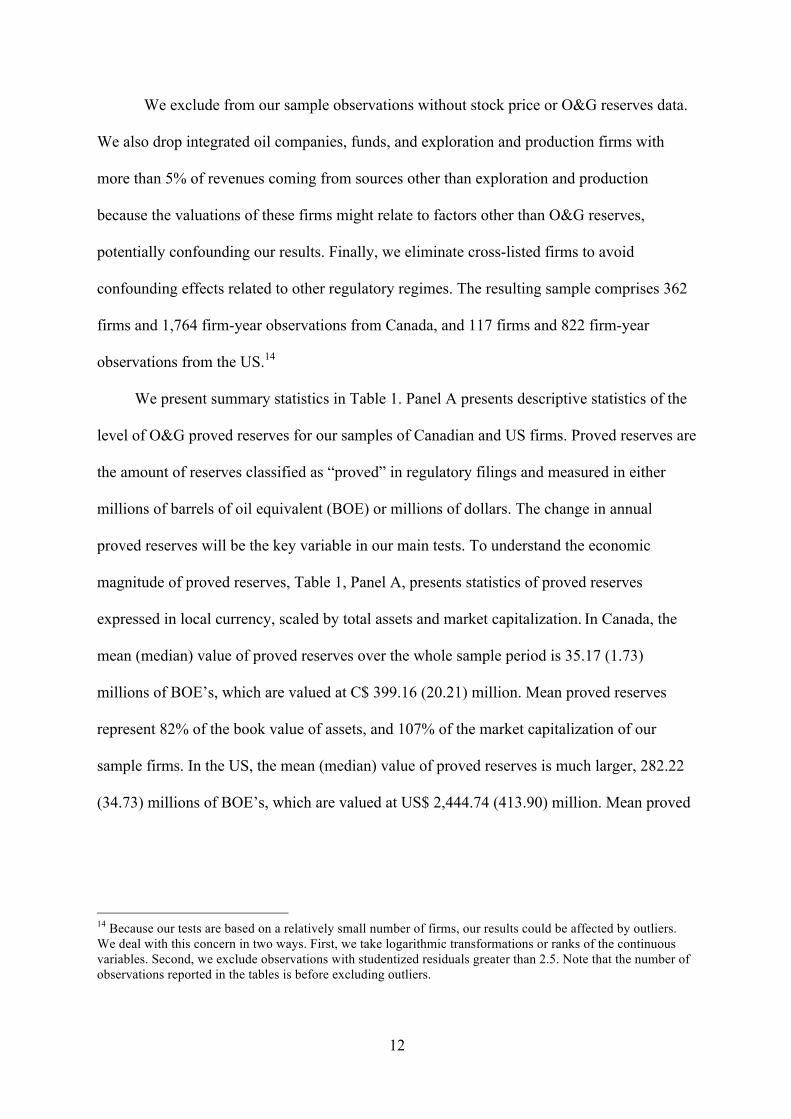
We exclude from our sample observations without stock price or O&G reserves data.
We also drop integrated oil companies, funds, and exploration and production firms with
more than 5% of revenues coming from sources other than exploration and production
because the valuations of these firms might relate to factors other than O&G reserves,
potentially confounding our results. Finally, we eliminate cross-listed firms to avoid
confounding effects related to other regulatory regimes. The resulting sample comprises 362
firms and 1,764 firm-year observations from Canada, and 117 firms and 822 firm-year
observations from the US.14
We present summary statistics in Table 1. Panel A presents descriptive statistics of the
level of O&G proved reserves for our samples of Canadian and US firms. Proved reserves are
the amount of reserves classified as “proved” in regulatory filings and measured in either
millions of barrels of oil equivalent (BOE) or millions of dollars. The change in annual
proved reserves will be the key variable in our main tests. To understand the economic
magnitude of proved reserves, Table 1, Panel A, presents statistics of proved reserves
expressed in local currency, scaled by total assets and market capitalization. In Canada, the
mean (median) value of proved reserves over the whole sample period is 35.17 (1.73)
millions of BOE’s, which are valued at C$ 399.16 (20.21) million. Mean proved reserves
represent 82% of the book value of assets, and 107% of the market capitalization of our
sample firms. In the US, the mean (median) value of proved reserves is much larger, 282.22
(34.73) millions of BOE’s, which are valued at US$ 2,444.74 (413.90) million. Mean proved
14 Because our tests are based on a relatively small number of firms, our results could be affected by outliers. We deal with this concern in two ways. First, we take logarithmic transformations or ranks of the continuous variables. Second, we exclude observations with studentized residuals greater than 2.5. Note that the number of observations reported in the tables is before excluding outliers.

13
reserves are equivalent to 188% of the book value of assets and 96% of the total market
capitalization.15
In our main tests, we use physical reserve amounts (i.e., BOE) to better capture the
effect of the increased precision in the definition of O&G reserves. An alternative measure is
reserve amounts in dollars, which is likely more sensitive to assumptions about future oil
prices and future extraction cost, future production schedules and discount rates. We repeated
our main tests using reserve disclosures expressed in dollars and obtain similar inferences.
Panels B and C of Table 1 present the descriptive statistics of main firm characteristics
for Canadian and US firms, respectively. The higher total number of observations for Canada
in panel B (1,764 firm years) reflects that the TSX is the world-leading exchange in mining
and O&G listings. The Canadian sample includes many O&G producers at early stages listed
on the TSX-V. This explains why Canadian firms are on average smaller, less profitable and
exhibit significantly higher bid-ask spreads than their US counterparts. However, the
Canadian sample has fewer firm-year observations in the pre-period because NI 51-101 was
implemented earlier than MOGR.
Panels B and C also reveal how the characteristics of our sample firms differ across the
periods prior and subsequent to the introductions of NI 51-101 and MOGR (with statistically
significant differences over time indicated in bold). Specifically, two economic outcomes are
significantly different over time. First, return performance (Past_Return) is significantly
lower in the periods after the regulatory changes, as these periods overlap with the economic
recession after the 2007-2008 Financial Crisis. Second, average levels of bid-ask spreads
(Past_Bidask) are significantly lower in the periods under the new regulations. Panels B and 15 That, on average, proved reserves can exceed both book value of assets and market value of equity is unsurprising. First, O&G assets on the balance sheet are recognized on a historical cost basis, subject to subsequent impairments. So, unlike off-balance-sheet O&G reserve disclosures, recognized O&G assets do not reflect the upside of new O&G discoveries or price increases under both Canadian and US GAAP. Second, these firms are leveraged so market value of equity is less than the enterprise value.
14
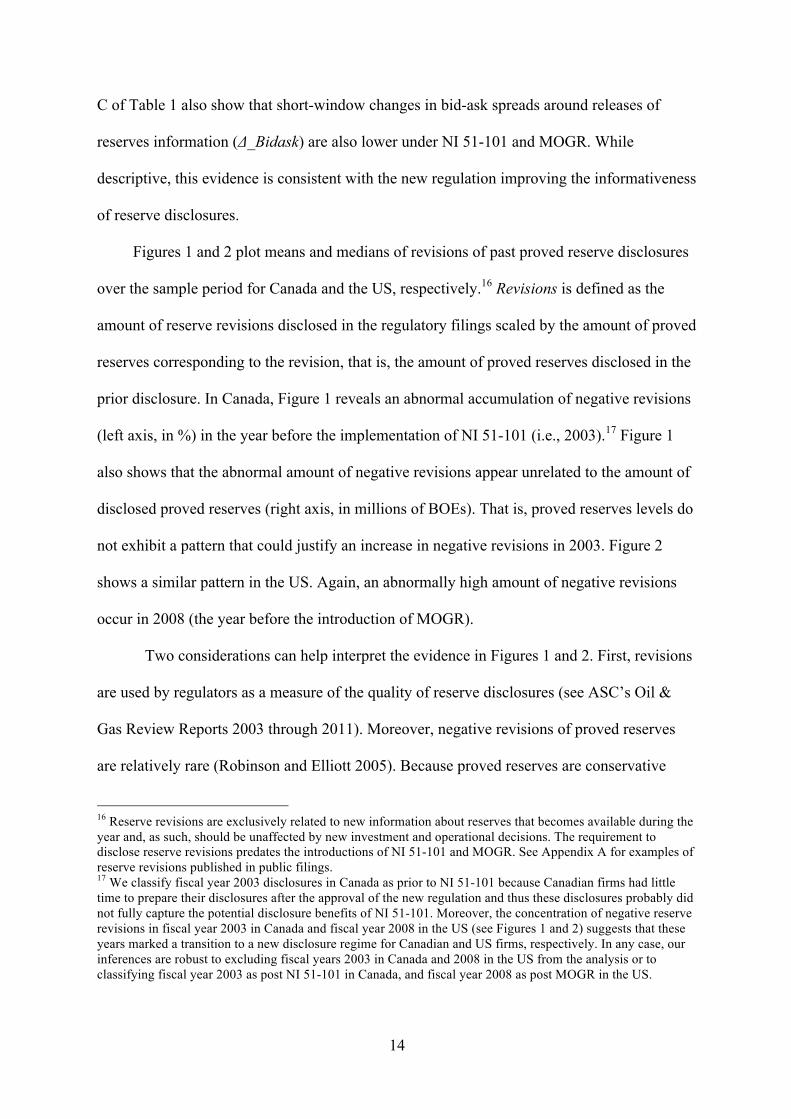
C of Table 1 also show that short-window changes in bid-ask spreads around releases of
reserves information (Δ_Bidask) are also lower under NI 51-101 and MOGR. While
descriptive, this evidence is consistent with the new regulation improving the informativeness
of reserve disclosures.
Figures 1 and 2 plot means and medians of revisions of past proved reserve disclosures
over the sample period for Canada and the US, respectively.16 Revisions is defined as the
amount of reserve revisions disclosed in the regulatory filings scaled by the amount of proved
reserves corresponding to the revision, that is, the amount of proved reserves disclosed in the
prior disclosure. In Canada, Figure 1 reveals an abnormal accumulation of negative revisions
(left axis, in %) in the year before the implementation of NI 51-101 (i.e., 2003).17 Figure 1
also shows that the abnormal amount of negative revisions appear unrelated to the amount of
disclosed proved reserves (right axis, in millions of BOEs). That is, proved reserves levels do
not exhibit a pattern that could justify an increase in negative revisions in 2003. Figure 2
shows a similar pattern in the US. Again, an abnormally high amount of negative revisions
occur in 2008 (the year before the introduction of MOGR).
Two considerations can help interpret the evidence in Figures 1 and 2. First, revisions
are used by regulators as a measure of the quality of reserve disclosures (see ASC’s Oil &
Gas Review Reports 2003 through 2011). Moreover, negative revisions of proved reserves
are relatively rare (Robinson and Elliott 2005). Because proved reserves are conservative
16 Reserve revisions are exclusively related to new information about reserves that becomes available during the year and, as such, should be unaffected by new investment and operational decisions. The requirement to disclose reserve revisions predates the introductions of NI 51-101 and MOGR. See Appendix A for examples of reserve revisions published in public filings. 17 We classify fiscal year 2003 disclosures in Canada as prior to NI 51-101 because Canadian firms had little time to prepare their disclosures after the approval of the new regulation and thus these disclosures probably did not fully capture the potential disclosure benefits of NI 51-101. Moreover, the concentration of negative reserve revisions in fiscal year 2003 in Canada and fiscal year 2008 in the US (see Figures 1 and 2) suggests that these years marked a transition to a new disclosure regime for Canadian and US firms, respectively. In any case, our inferences are robust to excluding fiscal years 2003 in Canada and 2008 in the US from the analysis or to classifying fiscal year 2003 as post NI 51-101 in Canada, and fiscal year 2008 as post MOGR in the US.
15
estimates (i.e., proved reserves are defined as those with at least a 90% probability of being
produced), the resolution of uncertainty about these reserves is usually favorable.
The accumulation of negative revisions shortly before the implementation of NI 51-
101 and MOGR is consistent with the claim that, before these regulatory changes, proved
reserves estimates exceeded the 10th percentile of the reserves distribution (e.g., Cronquist
2001). Perhaps more importantly, the patterns documented in Figures 1 and 2 also indicate
that the upcoming regulation elicited a significant reaction among O&G firms. This evidence
is consistent with the claim by some commentators that the new reserve disclosure rules
would cause some firms to restate their reserves and, hence, that implementation of NI 51-
101 and MOGR have a first-order effect on those firms’ reserves reporting practices.
4. The informativeness of reserve disclosures
4.1 Stock price reaction to reserve disclosures
We examine whether the introductions of NI 51-101 and MOGR resulted in enhanced
reserve disclosures by analyzing the stock price reaction to the release of reserves
information. If the change in disclosure rules introduced by the two regulations led to more
informative reserve disclosures, we expect stock prices to be more sensitive to the disclosed
amounts of proved reserves after the introductions of NI 51-101 and MOGR. We test this
hypothesis by estimating the following model in the periods before and after the changes:
Abn_Retit = a0 + a1*D_Proved_Reservesit + f*Controlsit + µi + eit (1)
where Abn_Retit is the market-adjusted return of firm i over the (−5, +5) day window around
the annual O&G reserve announcement date t.18 ∆_Proved_Reservesit is the percentage
change in proved reserves fractionally ranked by year. Controlsit is a vector of control
18 When O&G reserve announcement dates are missing, we use O&G reserves filing dates. In the US, O&G reserves are reported inside the annual report. In Canada, O&G reserves are reported in the Annual Information Form 51-101F1, which often is filed on the same day as the annual report.
16
variables found by the literature to be correlated with the cross-section of returns. Size is the
natural logarithm of the firm´s equity market value and BM is the Book-to-market ratio. Both
variables are measured at the end of the fiscal year prior to the disclosure date. Past_Return is
the compounded return over the 365 days prior to the end of the fiscal year prior to the
disclosure date. We also control for news on oil and gas prices. Oil_Return represents the
return of the oil index West Texas Intermediate (WTI) over the (−5, +5) day window around
the announcement. Gas_Return is the return of the gas index Henry Hub (HH) over the (−5,
+5) day window around the announcement. The specification includes firm fixed effects (µi)
to control for any time-invariant firm characteristic potentially associated with the trading
characteristics of the security such as the microstructural features of the stock exchange in
which the firm is listed, among other things.
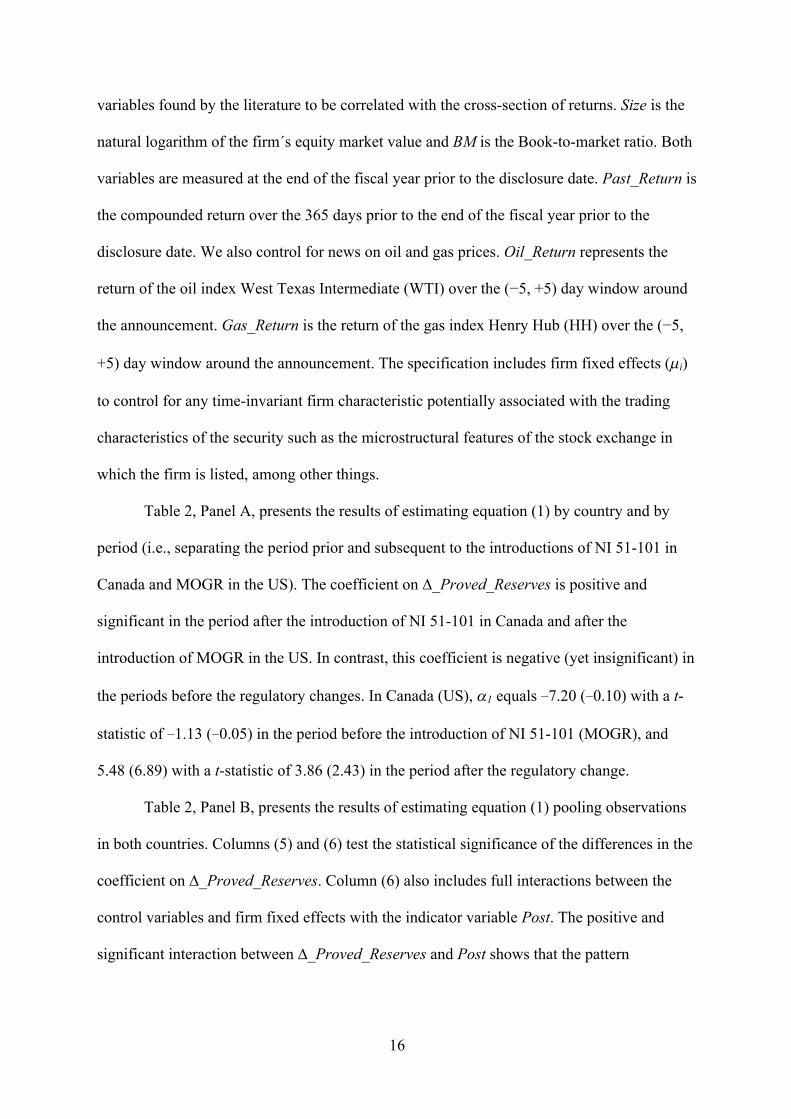
Table 2, Panel A, presents the results of estimating equation (1) by country and by
period (i.e., separating the period prior and subsequent to the introductions of NI 51-101 in
Canada and MOGR in the US). The coefficient on ∆_Proved_Reserves is positive and
significant in the period after the introduction of NI 51-101 in Canada and after the
introduction of MOGR in the US. In contrast, this coefficient is negative (yet insignificant) in
the periods before the regulatory changes. In Canada (US), a1 equals −7.20 (−0.10) with a t-
statistic of −1.13 (−0.05) in the period before the introduction of NI 51-101 (MOGR), and
5.48 (6.89) with a t-statistic of 3.86 (2.43) in the period after the regulatory change.
Table 2, Panel B, presents the results of estimating equation (1) pooling observations
in both countries. Columns (5) and (6) test the statistical significance of the differences in the
coefficient on ∆_Proved_Reserves. Column (6) also includes full interactions between the
control variables and firm fixed effects with the indicator variable Post. The positive and
significant interaction between ∆_Proved_Reserves and Post shows that the pattern
17
documented in Table 2, Panel A, is indeed statistically significant. The magnitude of the
coefficient on the interaction between ∆_Proved_Reserves and Post ranges from 3.57 to 5.60.
In terms of economic significance, a 10% increase in the magnitude of proved reserves is
associated with an increase in returns of close to 50 basis points around the reserve
announcement. This magnitude is substantial considering that the returns are measured over a
short window.19 Table 2, Panel C, reveals how using O&G reserves measured in dollars
instead of BOEs does not essentially alter our results.
4.2 Falsification tests
One potential concern regarding our inferences from Table 2 is that reserve
disclosures could be more informative in later years of the sample period for reasons
unrelated to the introductions of NI 51-101 and MOGR. For example, it is possible that the
pattern in Table 2 is driven by reserve disclosures becoming more relevant because of a
change in economic conditions or other regulatory developments unrelated to reserve
disclosures. Perhaps, the increase in O&G reserves informativeness is due to financial
markets reacting to prior reporting scandals. This challenge is likely partially alleviated by
the staggered introduction of the two regulations, and the long time between the major
reporting scandals and the regulations approval.20 However, we address this concern by
conducting falsification tests.
19 Untabulated tests using a (−3, +3) day window around the O&G reserve disclosure dates reveal a similar inference. Specifically, the coefficient (t-stats) on the interaction between ∆_Proved_Reserves and Post is 3.86 (2.32). Additionally, to ensure the small number of time clusters does not affect our t-statistics we bootstrap two-way-clustered standard errors by firm and disclosure date with 500 iterations. The resulting t-statistics are very similar to those we tabulate (t-stat= 2.51). 20 Another concern is self-selection. Firms might delist to avoid the new regulation (Leuz and Wysocky 2016). In our sample, no US firms delisted in the year after MOGR and only 1% of Canadian firms delisted in the year after NI 51-101. We re-run the tests requiring the firms to have observations in both the PRE and POST periods. The inferences are unchanged: the coefficient on ∆_Proved_Reserves*Post= 4.54 (t-stat= 2.05; number of observations= 1,544). We also re-run the tests requiring the firms to have at least eight out of ten years of data. The inferences are also unchanged: the coefficient on ∆_Proved_Reserves*Post= 5.25 (t-stat= 2.03; number of observations= 1,039).
18
We repeat our tests randomizing the dates of the introductions of NI 51-101 and
MOGR and the home country of the disclosing firm. If the pattern in Table 2 is driven by a
confounding time-trend rather than by the effect of the regulatory changes we study, we
should observe a similar pre-post empirical pattern when the treatment is randomly assigned
to firms. We conduct three randomization exercises to ensure that our inferences are not
sensitive to any specific research design choice.
First, we repeat our tests randomizing the year of the introductions of NI 51-101 and
MOGR. In particular, we assign a random year to the introduction of each regulation. For
example, if the random draw assigns 2007 and 2005 to the introductions of NI 51-101 and
MOGR, respectively, Post is re-defined as one if the firm is a Canadian firm and the
disclosure occurs after 2007 or if the firm is a US firm and the disclosure occurs after 2005,
and zero otherwise.
Second, we repeat the tests randomizing not only the dates of the regulatory changes,
but also the home country of the disclosing firm. That is, we randomly assign Canada or the
US as the country of peers’ headquarters. To ensure that this procedure does not alter the
sample composition, the randomization preserves the percentage of firms in each country as
in the actual data.
Third, we re-define Post for each firm as one if the disclosure occurs after a random
date assigned to that firm, and zero otherwise. Note that this third procedure does not
preserve the percentage of firms incorporated in each country. Rather, this procedure is
designed to capture whether there is a general increase in the value relevance of reserve
disclosures over time unrelated to any group of firms in a given date.
Table 3 presents the results of these falsification tests. Table 3 shows the mean of the
empirical distribution of b1, namely the coefficient on the interaction between D_Reserves
19
and Post obtained in each of the three randomization procedures. In all three randomization
procedures, the null hypothesis of equality of the coefficient b1 and the mean of this
distribution (E[b1]) is rejected. E[b1] is positive, suggesting that, there is indeed a time trend
in the value relevance of reserve disclosures. The increase in the relevance of these
disclosures over time could be driven not only by disclosure rules, but also by changes in the
economic conditions that increase the demand for this information. However, the results in
Table 3 suggest that, while the increase in the value relevance of reserve disclosures over
time cannot be uniquely attributed to NI 51-101 and MOGR, these regulatory changes
explain a substantial portion of the increase, over and above the general upward trend.
4.3 Cross-sectional variation
To further distinguish the effect of NI 51-101 and MOGR from economy-wide
contemporaneous economic changes, we exploit cross-sectional variation in firms’ disclosure
quality at the start of the year by measuring the firm’s average bid-ask spreads over the prior
fiscal year. We next explore cross-sectional variation in the effect of NI 51-101 and MOGR
on the informativeness of O&G reserves. Specifically, we partition our sample into firms
with above (High) and below (Low) median values of bid-ask spreads measured over the
fiscal year prior to the O&G reserve announcement date. This cross-sectional analysis is
premised on the assumption that the firms most likely affected by the regulatory changes are
those with low pre-existing disclosure quality.
Table 4 (columns 1 and 2) presents results of re-estimating equation (1) for each of
the two subsamples. Table 4 reveals that the coefficient on D_Proved_Reserves*Post is
positive and significant for the subsample of firms with relatively high bid-ask spreads (i.e.,
firms most likely affected by the regulation). In contrast, the magnitude of the coefficient on
20
D_Proved_Reserves*Post is smaller in the subsample of firms with relatively low bid-ask
spreads and is not statistically significant.21
To further confirm that our findings are related to firms most likely affected by the
regulatory changes, we partition the sample based on the pre-existing O&G reserve revisions,
an industry-specific metric of disclosure quality. Specifically, we partition our sample into
firms with above (High) and below (Low) median values of Reserves Revisions, defined as
the difference between the revised amounts and the previously disclosed reserves (in BOEs),
measured in the year of the regulation approval in the corresponding country. We only
include firms that were present before and after the approval, obtaining a sample of 1,554
observations. While this partition has a more direct link to the nature of the disclosure
regulation than a partition based on bid-ask spreads, it also has less power, as it does not use
all the information known by the market.
The results of this alternative partition (Table 4, models 3 and 4) confirm our
hypothesis that the firms most likely affected by the regulatory changes are those with lower
pre-existing disclosure quality. The coefficient on D_Proved_Reserves*Post is positive and
significant only for the subsample of firms with more negative (Low) pre-regulation reserve
revisions (coefficient=6.06, t-stat=1.92). In contrast, firms with more positive pre-regulation
reserve revisions (High) exhibit a substantially smaller and not significant coefficient on
D_Proved_Reserves*Post (coefficient=2.77, t-stat=1.00).
4.4. Changes in bid-ask spreads around reserve disclosures 4.4.1. Bid-ask spreads
21 Though we control for risk, size and book-to-market in our regressions, it may be possible that our partition variable, bid-ask spread, is correlated with these variables, and not only captures disclosure quality. To check for this possibility, we extend our regression including as control variable ranked variables of Past_Return, Size and BM and their interactions with our experimental variable (∆_Proved_Reserves*Controls). The inferences are unchanged: For the High partition, the coefficient on ∆_Proved_Reserves*Post= 8.00 (t-stat= 1.94), while for the Low partition, the coefficient on ∆_Proved_Reserves*Post= −0.75 (t-stat= −0.40).
21
To corroborate our inferences on the increase in informativeness of reserve
disclosures after the introductions of NI 51-101 and MOGR, we analyze changes in bid-ask
spreads around the release of reserve information in the years before and after the two
regulatory changes. We focus on stock market liquidity for several reasons (e.g., Christensen
et al. 2013). First, theory predicts that improving disclosure precision reduces information
asymmetries in financial markets and hence increases market liquidity (e.g., Glosten and
Milgrom 1985; Diamond and Verrecchia 1991; Verrecchia 2001). Second, we can measure
liquidity reliably over relatively short intervals. Third, liquidity is less anticipatory in nature
than other economic constructs like cost of capital. Thus, following prior literature we use
changes in bid-ask spreads around sample firms’ reserve disclosures to gauge the effect of the
informativeness of these disclosures.22
Specifically, we estimate the following model in the periods before and after the
introductions of NI 51-101 and MOGR in Canada and the US, respectively:
D_Bidask = b0 + b1*D_Proved_Reserves_Abs + f*Controls + e (2)
where ∆_Bidask is computed as the average bid-ask spreads over the (−5, +5) day window
around the announcement of reserves minus the average bid-ask spread over 90 days prior to
the announcement date (excluding the five days prior to the announcement), both scaled by
the standard deviation of bid-ask spread over the same period. Following prior literature (e.g.,
Christensen et al. 2013), we use the absolute value of ∆_Proved_Reserves to capture the
magnitude of the news about reserves. Specifically, ∆_Proved_Reserves_Abs is computed as
the fractional rank of the absolute value of ∆_Proved_Reserves. Finding that significant news 22 Amiram et al. (2016) explain that though a decrease in information asymmetry could be theoretically consistent with both an increase and a decrease in information, an increase in information is empirically related to a decrease in information asymmetry as soon as day two in the post-announcement window, regardless of the type of information disclosed (management and analysts forecasts and earnings announcements). As discussed below, we also find the same pattern using abnormal trading volume as the dependent variable, a proxy that prior literature generally interprets as a measure of the information content of a disclosure (Asthana et al. 2004; Leuz and Schrand 2009).
22
about proved reserves (i.e., higher values of ∆_Proved_Reserves_Abs) are associated with
decreases in bid-ask spreads suggests that O&G reserves information disclosed under NI 51-
101 and MOGR helps reduce information asymmetry.
Controls is a vector including the following variables that have been found by prior
literature to affect changes in bid-ask spreads around information events (e.g., Glosten and
Milgrom 1985, Huang and Stoll 1997). Return_Abs is the absolute value of the average
market-adjusted return over the (−5, +5) day window around the announcement. We include
this variable to control for the potential confounding effect of other simultaneous news about
the company. Oil_Return_Abs and Gas_Return_Abs are, respectively, the absolute value of
Oil_Return and Gas_Return (both as previously defined). We include these two last variables
to control for simultaneous industry news. ∆_Turnover is the average turnover over the (−5,
+5) day window around the announcement minus the average turnover over the previous
quarter. ∆_MktBidask is the average market bid-ask spread over the (−5, +5) day window
around the announcement minus the average market bid-ask spread over the previous quarter.
For Canada and the US, the market bid-ask spread is computed as the average bid-ask spread
of all public firms with available data in Datastream and CRSP, respectively. Finally,
equation (2) includes measures of firm characteristics found by prior literature to affect bid-
ask spreads. Past_Volatility is the natural logarithm of the return volatility, computed as the
standard deviation of daily returns over the quarter prior to the reserve announcement. Size is
the natural logarithm of the firm´s equity market value at the end of the prior fiscal year.
Past_Bidask is the natural logarithm of the firm’s average bid-ask spread measured over the
prior fiscal year.
Table 5 presents the results of estimating equation (2). Columns 1 and 2 in table 5
reveal that news on proved reserves have a positive association with changes in bid-ask
23
spreads in the pre-regulation periods. In contrast, columns 3 and 4 reveal that, after the
introductions of NI 51-101 and MOGR in each respective country, the coefficient on
∆_Proved_Reserves_Abs becomes negative and significant. Columns 5 and 6 show the results
of pooling the pre and post-regulation periods. The interaction between
∆_Proved_Reserves_Abs and Post suggests that the difference between the coefficients on
∆_Proved_Reserves_Abs across periods is statistically significant (t-stat=−2.19).23
In the spirit of Beaver (1968), we estimate equation (2) using abnormal trading
volume as the dependent variable. We define the change in trading volume as the average
trading volume over the (−5, +5) day window around the announcement of reserves minus
the average trading volume over 90 days prior to the announcement date (excluding the five
days prior to the announcement) and scaled by the standard deviation of trading volume over
the same period. Results using abnormal trading volume (untabulated) are similar to those
using bid-ask spreads. The interaction between ∆_Proved_Reserves_Abs and Post in a pooled
regression with all the controls is positive (0.48) and statistically significant (t-stat=1.97).
These findings suggest that proved reserve disclosures are associated with decreases
in information asymmetry and increases in abnormal trading volume in the periods after the
introduction of the new regulations. However, the effect of these disclosures on bid-ask
spreads and abnormal trading volumes in the periods before the regulatory changes are
statistically indistinguishable from zero. Overall, our evidence is consistent with NI 51-101
and MOGR substantially increasing the informativeness of reported O&G reserves.
23 Untabulated tests using a (−3, +3) day window around the O&G reserve disclosure announcement dates reveal a similar inference. Specifically, the coefficient (t-stats) on the interaction between ∆_Proved_Reserves and Post is −0.24 (−1.70). Untabulated results also reveal that our inferences relating to bid-ask spreads are unaffected by using the Corwin and Schultz (2012) measure of effective bid-ask spreads. Additionally, we two-way-clustered standard errors by firm and disclosure date. The resulting t-statistics are very similar to those we tabulate (t-stat= 2.47).
24
4.4.2. Comparing quarterly announcements with and without reserves information
One potential concern regarding our prior tests is that the market expectation about a
firm’s level of reserves is not observable. To the extent that the market expectation could differ
from the level of reserves disclosed in the prior year, our analyses might measure reserves news
with error. We thus conduct an alternative test of the informativeness of O&G reserves that
does not rely on measuring the market’s expectation of reserves. In particular, we exploit that
reserves information is included in the fourth fiscal quarter, but not in the preceding quarters. In
particular, we compute changes in bid-ask spread around quarterly announcements of financial
information and compare changes in bid-ask spread between the fourth quarter to the rest of the
quarters in the periods before and after the introduction of the regulatory changes in each country.
Finding that the difference between the fourth and other quarters is relatively smaller in the
periods after the introductions of NI 51-101 and MOGR (i.e., there is relatively less
information asymmetry) further supports the notion that these regulatory changes increased
the informativeness of O&G reserves.
We collect information on quarterly earnings announcement dates from Compustat.
This restricts our sample of Canadian firms since some of these firms are not covered by
Compustat. Based on this sample of quarterly announcements we estimate the following
model:
D_Bidask = d0 + d1*Reserves_Information + f*Controls + e (3)
where D_Bidask is computed as described earlier in equation 2, but around quarterly
announcements instead of only annual announcements. Our variable of interest,
Reserves_Information, is an indicator variable that equals one if the firm discloses O&G
reserves information in a given quarter, and zero otherwise. As firms only disclose O&G
reserves in the fourth quarter, Reserves_Information will equal 1 in the fourth quarter, and
25
zero in the rest. Controls represents the same vector of control variables defined in equation
2.
Table 6 presents the results of this test. Columns 1 and 2 reveal that the coefficient on
Reserves_Information is positive and significant in the period preceding the regulatory
changes. In contrast, columns 3 and 4 show that the coefficient on Reserves_Information is
negative and significant in the period after the regulatory changes.24 Columns 5 and 6 present
the results of pooling the pre and post-regulation periods. The estimated coefficient of the
interaction between Reserves_Information and Post suggests that the difference between the
coefficients on Reserves_Information across periods is statistically significant (t-stat=−4.42).
This evidence suggests that a substantial part of the relative decrease in bid-ask spreads in the
fourth quarter is driven by the disclosure of O&G reserves. An alternative explanation is that
the decrease in bid-ask spreads is associated with an increase in informativeness of fourth
quarter financial information unrelated to O&G reserves after the introduction of the O&G
disclosure regulations. While our results in Tables 5 and 6 are not conclusive in isolation,
they jointly provide complementary evidence consistent with the hypothesis that O&G
reserves are more informative after the introductions of NI 51-101 and MOGR.
4.5 Reserves levels and stock prices
Finally, we analyze the empirical association between O&G reserves levels and stock
prices in the periods prior and subsequent to the introductions of NI 51-101 and MOGR. Two
considerations motivate this additional test. First, this test provides consistency with prior
work, as levels specifications are common in the literature examining the informational
24 We also run (untabulated) tests using abnormal trading volume as the dependent variable. The tests result in qualitatively similar inferences. Shares turnover increases in the fourth fiscal quarter, and that increase is stronger after the Canadian and US O&G regulations.
26
effects of a disclosure, see Barth et al. (2001). Second, the market reaction to the information
about reserves could extend beyond the short window used in our prior analyses.
Table 7 presents the results of this test. As shown in the table, proved reserves are
positively associated with stock prices. This positive association is also present in the period
prior to the introductions of NI 51-101 and MOGR, suggesting that O&G reserve amounts
are value-relevant in this period as well. However, consistent with our prior tests, the
association becomes stronger under NI 51-101 and MOGR.
5. Additional robustness tests
In this section, we identify three potential alternative explanations for our results,
namely, the simultaneous disclosure of other financial information, the existence of financial
reporting incentives, and the effect of monitoring efforts. We rerun our main test introducing
all the additional variables that control for these alternative explanations. For the sake of
clarity, we explain each group of control variables separately. However, the final results are
reported in a separate table where we re-estimate equation (1) with all the controls included.
5.1 Other information disclosed simultaneously
As mentioned in the prior section, the increase in informativeness after the tightening
of the O&G disclosure regulations might be driven by other information unrelated to O&G
reserves released on the same date. In the US, firms disclose O&G reserves information in
their annual reports. In Canada, the filing of form 51-101F1 containing O&G reserves
information is not required to be reported in, or on the same date as, annual financial
statements. However, in our subsample of Canadian firms, 51% of reserve disclosures are
filed in the same day as financial statements.
27
That said, we believe that the informational effect of contemporaneous financial
statements is unlikely to confound our inferences. The reason is that earnings lack timeliness,
whereas the information on reserves is more forward-looking and thus, more likely to affect
stock prices. Indeed, O&G analysts usually consider reserve disclosures more informative
about firm value than accounting earnings.25 A 2007 user survey conducted by the IASB
reports that financial analysts relied on O&G reserves, rather than financial statements, as
their primary source of information to analyze extractive activities.26
Nevertheless, to explore whether contemporaneous earnings disclosures confound our
inferences, we re-estimate equation (1) using only the stand-alone disclosures of reserves
(i.e., reserves filed at least five days sooner or later than the financial statements) and obtain
similar results (untabulated). We also re-estimate equation (1) including a measure of
earnings news as a control variable. Following prior literature, we include in equation (1)
∆_Earnings, defined as the change in annual earnings before extraordinary items scaled by
total assets. Table 8 shows that the inclusion of ∆_Earnings in equation (1) does not alter our
inferences regarding ∆_Proved_Reserves.
As explained previously, in addition to the disclosure of proved reserves (i.e., the 10th
percentile of the distribution of O&G reserves), only NI 51-101 requires the disclosure of a
second probability threshold referred to as “proved plus probable reserves” (i.e., the median
of the distribution of O&G reserves). Accordingly, we include in equation (1) as an additional
control the difference between the two disclosed probability thresholds, namely, proved plus
probable reserves minus proved reserves scaled by proved reserves. We refer to this amount
25 For example, a JP Morgan Analyst Report (April 17, 2008) states: “EPS and CFPS growth do not tell the whole story as 1) they do not reflect long-term capital efficiency, 2) they are strongly dependent on commodity prices, which makes us reluctant to use it as a primary metric of success and 3) they do not take into account differences in timing of growth projects. In an industry with long lead times on projects, we think a focus on near-term EPS growth might be detrimental to investment decisions and thus to longer-term growth.” 26 Source: http://www.ifrs.org/Meetings/MeetingDocs/IASB/2008/September/19th%20-%20Board/Extract-0809-AP15A-obs.pdf
28
as Reserves_Dispersion. Badia et al. (2017) find that Reserves_Dispersion predicts future risk
in a sample of Canadian O&G firms for the same period. We include this variable to
investigate whether our results are driven by a fundamental shift in the firm risk after the new
regulation. We also use the breakdown information on the balance (i.e., the level) of proved
reserves and define Undeveloped, computed as the amount of undeveloped proved reserves in
barrels scaled by proved reserves.
Table 8 shows that the inclusion of these additional control variables in model (1)
does not alter our inferences regarding ∆_Proved_Reserves. The coefficients of some
variables are omitted for time periods when public disclosure of the information necessary to
construct the variables was not mandatory. In general, Table 8 reveals that these additional
variables are only weakly associated with changes in stock returns.
We also explore whether the associations between ∆_Proved_Reserves and changes in
stock prices around disclosure dates we document in Table 2 are affected by additional
breakdown information on the characteristics of proved reserves. This is especially important
in the US because, as previously explained, MOGR allows the disclosure of reserves obtained
through emerging technologies and non-traditional sources (Canadian regulation already
allowed for the inclusion of such reserves before NI 51-101). Consequently, our results for
US firms could be affected by a change in the nature of the disclosed reserves after MOGR
rather than the tightening of the reserves definition. However, unreported robustness tests do
not change our inferences.27, 28
27 We further extend equations (1) and (2) by including the following additional control variables measuring specific characteristics of disclosed reserves. We use the reconciliation amounts of the change in the balance of proved reserves and define the following variables. Discoveries is the amount of exploration discoveries and extensions. Acquisitions is the amount of O&G reserves acquisitions; Disposals is the amount of O&G reserves disposals. Improvements is the amount of improved recoveries and infill drillings. Production is the amount of production. Revisions is the amount of revisions of previously disclosed reserves. Each of these amounts is expressed as a percentage of the rest of reconciliation amounts (in absolute value). The inferences remain: the
29
5.2 Reporting incentives and monitoring
We also explore the possibility that our results in Table 2 are confounded by cross-
sectional variation in financial reporting incentives, monitoring effort, or both. Regarding
reporting incentives, we extend equation (1) by including a set of variables that prior
literature finds to be associated with corporate reporting behavior (e.g., Livnat and Tan 2004,
Armstrong et al. 2013). We include Leverage (defined as total liabilities scaled by total
assets) because more highly leveraged firms have stronger incentives to report off-balance-
sheet assets, such as proved reserves. We consider the possibility that firms that report Losses
(defined as one if the firm reports negative earnings in the prior period and zero otherwise)
may report more aggressively. Third, since stronger managerial incentives has been shown to
be associated with more aggressive financial reporting choices, we include
Equity_Compensation, computed as the natural logarithm of one plus the amount of annual
stock compensation expense in thousand dollars.
To measure monitoring intensity in our sample firms, we construct
Reserves_Committee as a categorical variable equal to one if the firm voluntarily adopted a
reserves committee and zero otherwise. Because prior literature in auditing suggests that the
identity of the third-party evaluator can affect the reporting quality, we include a variable
Big4, defined as one if the company is audited by a Big 4 accounting firm, and zero
otherwise. Similarly, we include Top_Evaluator, a categorical variable equal to one if the coefficients for ∆_Proved_Reserves in the Post period for Canada and the US are 6.60 (t-stat=3.29) and 9.96 (t-stat=2.59), respectively. 28 To assess the sensitivity of our inferences to the possibility of correlated omitted variables we also perform one additional analysis. Following Frank (2000), we estimate that, to invalidate our inferences, an omitted variable should have to be correlated positively at (at least) 14% with our dependent variable and also correlated positively at (at least) 7.5% with our experimental variable. To determine the plausibility that a correlated omitted variable would affect our inferences, we use the two control variables that exhibit the highest correlations with Abn_Ret and ∆_Proved_Reserves*Post. Untabulated statistics reveal that BM has the largest correlation with Abn_Ret, 5%. However, the correlation of BM with ∆_Proved_Reserves*Post is only 1%. Untabulated statistics reveal that Past_Return has the largest correlation with ∆_Proved_Reserves*Post, 8%. However, the correlation of Past_Return with Abn_Ret is negative and only –4%. Although this analysis does not rule out that correlated omitted variables confound our inferences, it suggests this is not likely.
30
evaluator of reserves is among the top evaluators in terms of market share and zero otherwise
(the lists of top evaluators in Canada and the US are defined by the ASC and SEC,
respectively).29 Finally, we include a proxy for the probability of litigation, Litigation_Risk,
as defined in Shu (2000).
Table 8 shows the results of estimating equation (1) with all the control variables
related to information disclosed simultaneously, reporting incentives, and monitoring efforts.
The inclusion of all these additional controls does not alter our inferences regarding
∆_Proved_Reserves.30 The coefficients of some variables are omitted for time periods when
public disclosure of the information necessary to construct the variables was not mandatory.
In general, Table 8 reveals that these additional variables are only weakly associated with
stock returns.
6. Conclusion
This paper investigates the informativeness of O&G reserve disclosures after the
introduction of NI 51-101 in Canada and MOGR in the US. Both regulatory changes were
remarkably similar but were introduced at different times. The focal change of these
regulations was the introduction of stricter, bright-line probability thresholds in the mandated
reserves estimations to replace less stringent, verbal definitions of reserves.
Using public O&G firms in Canada and the US, we first observe an abnormal amount
of negative reserve revisions in the year of approval of the new regulations, consistent with
29 The Canadian top evaluators list includes AJM Petroleum Consultants, Chapman Petroleum Engineering, Degolyer & MacNaughton, GLJ Petroleum Consultants & Associates, McDaniel & Associates Consultants, Paddock Lindstrom & Associates, and Sproule & Associates. The US top evaluators list includes Netherland Sewell & Associates, Ryder Scott Company, and Degolyer & MacNaughton. 30 Untabulated tests using a (−3, +3) day window around the O&G reserve disclosure dates reveal a similar inference. Specifically, the coefficient (t-stats) on the Post period for Canada is 3.73 (2.87), and for the US is 7.61 (3.16). Additionally, our inferences are unchanged if we do not rank and instead scale our experimental variable by market capitalization and also scale earnings by market capitalization, instead of total assets.
31
firms adjusting their prior over-optimistic estimations of proved reserves. We next analyze
the stock market reaction to the release of O&G reserves information and find that the
market’s sensitivity to reserve amounts has increased substantially after the introductions of
NI 51-101 and MOGR. A set of falsification tests, where we randomize the dates of the
introductions of NI 51-101 and MOGR and the home country of the disclosing firm, provide
evidence that our results are robust to time trends. Additionally, our findings hold when we
control for other information disclosed simultaneously, financial reporting incentives, and
monitoring efforts. Next, we examine the effect of these regulations on information
asymmetry. We find that, after the introduction of these regulations, changes in bid-ask
spreads around O&G reserve disclosure filing dates are more closely associated with the
magnitudes of the reserves being disclosed.
Overall, our findings suggest that tightening disclosure rules by introducing more
bright-line definitions results in more informative O&G reserve estimates in both Canada and
the US. While empirical identification is challenging, our findings do appear when similar
regulations are implemented at two different times in two different countries. This evidence is
consistent with the notion that more rules-based standards enhance comparability and, as a
consequence, produce more informative estimates despite the loss of discretion.
We acknowledge that the attribution of our results to stricter bright-line probability
thresholds for proved reserves could be confounded by other changes embedded in these
regulations. That said, we also emphasize that the introduction of stricter bright-line probability
thresholds for proved reserves was a focal change of the new regulations. Moreover, there are
substantial differences between NI 51-101 and MOGR regarding these other regulatory changes,
thus making it less likely that they have a consistent effect in the two countries. Indeed, our
robustness tests in section 5 are an attempt to control for these potential effects. In any case, at
32
minimum our results are informative with respect to the overall effect of the provisions embedded
in the new regulations.
Consistent with the intent of regulators to enhance the quality of O&G disclosures for
investors, we focus our study on the informational effects of the new regulation. However,
tighter disclosure rules might impose significant costs related to compliance and negative
externalities. For example, Badia et al. (2016) document that firms exhibit lower stock returns
when their peers announce more positive news about O&G reserves.
We also caution that our measurements of economic consequences only consider
shareholders. Bondholders may value O&G reserve disclosures differently and use off-
balance sheet disclosures in bond covenants. Further, unless cross listed in the US, Canadian
firms prepared financial statements using Canadian Generally Accepted Accounting
Standards (GAAP) during our sample period (except the most recent year 2011). However,
the Accounting Standards Board (AcSB) replaced Canadian GAAP with IFRS. Since IFRS is
generally viewed as a more principles-based accounting standard than both Canadian GAAP
and US GAAP, the quality and quantity of off-balance sheet disclosures may have changed
for Canadian firms that adopted IFRS. Consequently, our findings need not extend to the
current financial reporting regime in Canada. We leave these questions for future research.
33
References
Aharony, J., and A. Dotan. 2004. A comparative analysis of auditor, manager and financial analyst interpretations of SFAS 5 disclosure guidelines. Journal of Business Finance & Accounting 31 (3-4): 475-504. Alciatore, M. 1993. New evidence on SFAS No. 69 and the components of the change in reserve value. The Accounting Review 68 (3): 639-656. Amer, T., K. Hackenbrack, and M. Nelson. 1994. Between-auditor differences in the interpretation of probability phrases. Auditing: A Journal of Practice & Theory 13 (1): 126-136. Amer, T., K. Hackenbrack, and M. Nelson. 1995. Context-dependence of auditors’ interpretations of the SFAS No. 5 probability expressions. Contemporary Accounting Research 12 (1): 25-39. Amiram, D., E. Owens, and O. Rozenbaum. 2016. Do information releases increase or decrease information asymmetry? New evidence from analyst forecast announcements. Journal of Accounting and Economics 62 (1): 121-138 Armstrong, C. S., D. F. Larcker, G. Ormazabal, and D. J. Taylor. 2013. The relation between equity incentives and misreporting: The role of risk-taking incentives. Journal of Financial Economics 109 (2): 327-350. Asthana, S., S. Balsam, and S. Sankaraguruswamy. 2004. Differential response of small versus large investors to 10-K filings on EDGAR. The Accounting Review 79 (3): 571-589. Badia, M., M. E. Barth, M. Duro, and G. Ormazabal. 2017. Firm risk and disclosures about dispersion in asset values: Evidence from oil and gas reserves. Available at SSRN: https://ssrn.com/abstract=2725387. Badia, M., M. Duro, B. N. Jorgensen, and G. Ormazabal. 2016. Market-wide effects of off-balance sheet disclosures: Evidence from the oil and gas industry. Available at SSRN: https://ssrn.com/abstract=2877070. Barth, M. E., W. H. Beaver, and W. R. Landsman. 2001. The relevance of the value relevance literature for financial accounting standard setting: Another view. Journal of Accounting and Economics 31 (1): 77-104. Beaver, W. H. 1968. The information content of annual earnings announcements. Journal of Accounting Research 6 (Empirical Research in Accounting: Selected Studies): 67-92. Beyer, A., D. A. Cohen, T. Z. Lys, and B. R. Walther. 2010. The financial reporting environment: Review of the recent literature. Journal of Accounting and Economics 50 (2): 296-343.
34
Boone, J. F. 2002. Revisiting the reportedly weak value relevance of oil and gas asset present values: The roles of measurement error, model misspecification, and time-period idiosyncrasy. The Accounting Review 77 (1): 73-106. Budescu, D., and T. Wallsten. 1985. Consistency in interpretation of probabilistic phrases. Organizational Behavior and Human Decision Processes 36 (3): 391-405. Canadian Securities Administrators (CSA). 2003. National Instrument 51-101 Standards of Disclosure for Oil and Gas Activities and Companion Policy 51-101 Standards of Disclosure for Oil and Gas Activities. Minister of Finance Approval Under the Securities Act. http://www.osc.gov.on.ca/en/SecuritiesLaw_rule_20030926_51-101_fin-min-approv.jsp Christensen, H. B., L. Hail, and C. Leuz. 2013. Mandatory IFRS reporting and changes in enforcement. Journal of Accounting and Economics 56 (2): 147-177. Christensen, H. B., L. Hail, and C. Leuz. 2016. Capital-market effects of securities regulation: Prior conditions, implementation, and enforcement. Review of Financial Studies 29 (11): 2885-2924. Clinch, G., and J. Magliolo. 1992. Market perceptions of reserve disclosures under SFAS No. 69. The Accounting Review 67 (4): 843-861. Corwin, S. A., and P. Schultz. 2012. A simple way to estimate bid-ask spreads from daily high and low prices. The Journal of Finance 67 (2): 719-760. Cronquist, C. 2001. Estimation and classification of reserves of crude oil, natural gas and condensate. Richardson, TX: Society of Petroleum Engineers. Diamond, D. W., and R. E. Verrecchia. 1991. Disclosure, liquidity, and the cost of capital. The Journal of Finance 46 (4): 1325-1359. Doran, B. M., D. W. Collins, and D. S. Dhaliwal. 1988. The information of historical cost earnings relative to supplemental reserve-based accounting data in the extractive petroleum industry. The Accounting Review 63 (3): 389-413. Doupnik, T. S., and M. Richter. 2004. The impact of culture on the Interpretation of “in context” verbal probability expressions. Journal of International Accounting Research 3 (1): 1-20. Ewert, R., and A. Wagenhofer. 2005. Economic effects of tightening accounting standards to restrict earnings management. The Accounting Review 80 (4): 1101-1124. Frank, K. A. 2000. Impact of a confounding variable on a regression coefficient. Sociological Methods & Research 29 (2): 147-194. Glosten, L. R., and P. R. Milgrom. 1985. Bid, ask and transaction prices in a specialist market with heterogeneously informed traders. Journal of Financial Economics 14 (1): 71-100.
35
Harris, T. S., and J. A. Ohlson. 1987. Accounting disclosures and the market’s valuation of oil and gas properties. The Accounting Review 62 (4): 651-670. Harrison, K. E., and L. A. Tomassini. 1989. Judging the probability of a contingent loss: An empirical study. Contemporary Accounting Research 5 (2): 642-648. Healy, P. M., and K. G. Palepu. 2001. Information asymmetry, corporate disclosure, and the capital markets: A review of the empirical disclosure literature. Journal of Accounting and Economics 31 (1): 405-440. Huang, R. D., and H. R. Stoll. 1997. The components of the bid-ask spread: A general approach. Review of Financial Studies 10 (4): 995-1034. Jiambalvo, J., and N. Wilner. 1985. Auditor evaluation of contingent claims. Auditing: A Journal of Practice & Theory 5 (1): 1-11. Kahneman, D., and A. Tversky. 1979. Prospect theory: An analysis of decision under risk. Econometrica 47 (2): 263-292. La Porta, R., F. Lopez-de-Silane, and A. Shleifer. 2006. What works in securities laws? Journal of Finance 61 (1): 1-32. La Porta, R., F. Lopez-de-Silane, A. Shleifer, and R. W. Vishny. 1998. Law and finance. Journal of Political Economy 106 (6): 1133-1155. Leuz, C., and C. M. Schrand. 2009. Disclosure and the cost of capital: Evidence from firms' responses to the Enron shock. Working paper, University of Pennsylvania. Leuz, C., and P. D. Wysocki. 2016. The economics of disclosure and financial reporting regulation: Evidence and suggestions for future research. Journal of Accounting Research 54 (2): 525-622. Livnat, J., and C. E. L. Tan. 2004. Restatements of quarterly earnings: Evidence on earnings quality and market reactions to the originally reported earnings. Working paper, Stern School of Business Administration. Magliolo, J. 1986. Capital market analysis of reserve recognition accounting. Journal of Accounting Research 24 (Studies on Alternative Measures of Accounting Income): 69-108. McLane, M., J. Gouveia, G. P. Citron, J. MacKay, and P. R. Rose. 2008. Responsible reporting of uncertain petroleum reserves. AAPG Bulletin 92 (10): 1431-1452. Mittoo, U. R. 1992. Additional evidence on integration in the Canadian stock market. Journal of Finance 47 (5): 2035–2054. Patatoukas, P. N., R. G. Sloan, and J. Zha. 2015. On the pricing of mandatory DCF disclosures: Evidence from oil and gas royalty trusts. The Accounting Review 90 (6): 2449-2482.
36
Price, R. A., and W. A. Wallace. 2001. Shades of Materiality. Canadian Certified General Accountants' Research Foundation series. Monograph 24. Reimers, J. L. 1992. Additional evidence on the need for disclosure reform. Accounting Horizons 6 (1): 36-41. Robinson, J. G., and D. Elliott. 2005. National Instrument 51-101 (NI 51-101) reserves reconciliation-Part 2, A review of technical revisions in annual information form filings for end 2003. Journal of Canadian Petroleum Technology 44 (2): 6-12. Schultz, Jr., J. J., and P. M. J. Reckers. 1981. The impact of group processing on selected audit disclosure decisions. Journal of Accounting Research 19 (2): 482-501. Securities and Exchange Commission (SEC). 2009. Modernization of Oil and Gas Reporting; Final Rule. Release Nos. 33–8995; 34–59192; FR–78; File No. S7-15-08. (January 14, 2009). Washington D.C.: SEC. Federal Register 74 (9): 2158-2107. Shaw, W. H., and H. A. Wier. 1993. Organizational form choice and the valuation of oil and gas producers. The Accounting Review 68 (3): 657-667. Shu, S. Z. 2000. Auditor resignations: Clientele effects and legal liability. Journal of Accounting and Economics 29 (2): 173-205. Spear, N. A. 1994. The stock market reaction to the reserve quantity disclosures of U.S. oil and gas producers. Contemporary Accounting Research 11 (1): 381-404. Stone, D. N., and W. N. Dilla. 1994. When numbers are better than words: The joint effects of response representation and experience on inherent risk judgments. Auditing: A Journal of Practice & Theory 13 (Supplement): 1-19. Tversky, A., and D. Kahneman. 1974. Judgment under uncertainty: Heuristics and biases. Science 185: 1124-1131. Urbina, I. 2011. S.E.C. shift leads to worries of overestimation of reserves. The New York Times. June 27th. Verrecchia, R. E. 2001. Essays on disclosure. Journal of Accounting and Economics 32 (1): 97-180. Welker, M. 1995. Disclosure policy, information asymmetry, and liquidity in equity markets. Contemporary Accounting Research 11 (2): 801–827. Windschitl, P. D., and G. L. Wells. 1996. Measuring psychological uncertainty: Verbal versus numeric methods. Journal of Experimental Psychology: Applied 2 (4): 343-364.
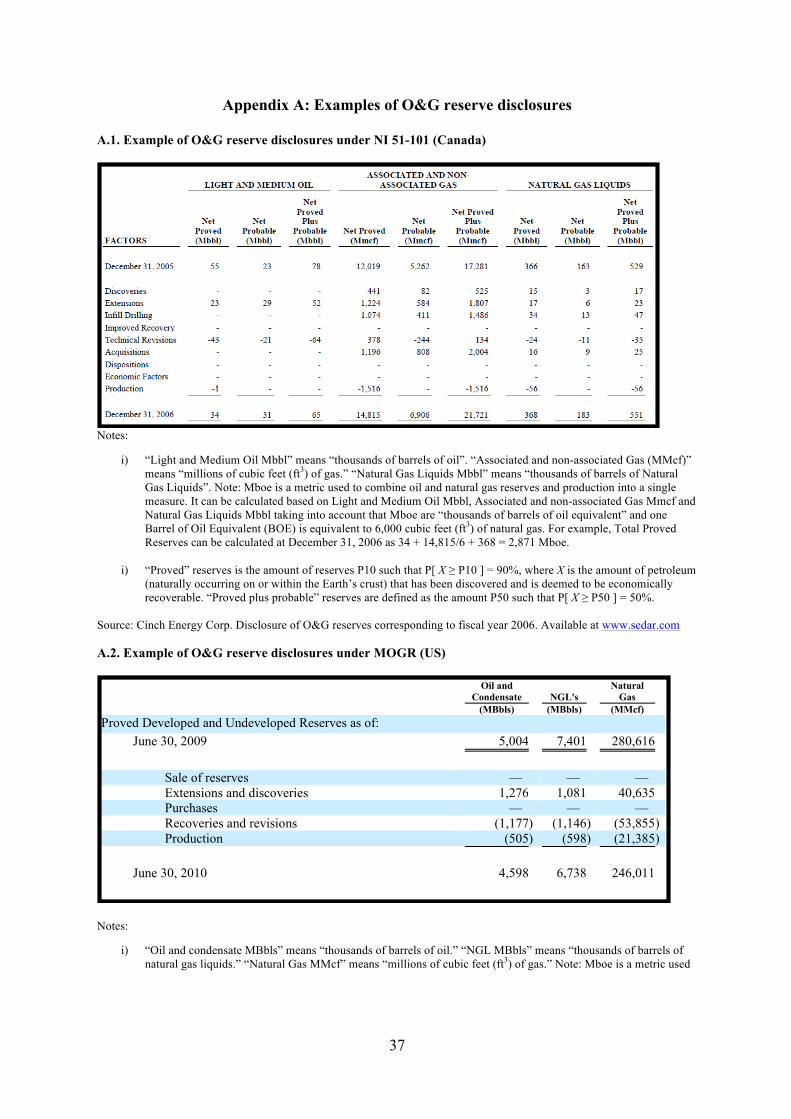
37
Appendix A: Examples of O&G reserve disclosures A.1. Example of O&G reserve disclosures under NI 51-101 (Canada)
Notes:
i) “Light and Medium Oil Mbbl” means “thousands of barrels of oil”. “Associated and non-associated Gas (MMcf)” means “millions of cubic feet (ft3) of gas.” “Natural Gas Liquids Mbbl” means “thousands of barrels of Natural Gas Liquids”. Note: Mboe is a metric used to combine oil and natural gas reserves and production into a single measure. It can be calculated based on Light and Medium Oil Mbbl, Associated and non-associated Gas Mmcf and Natural Gas Liquids Mbbl taking into account that Mboe are “thousands of barrels of oil equivalent” and one Barrel of Oil Equivalent (BOE) is equivalent to 6,000 cubic feet (ft3) of natural gas. For example, Total Proved Reserves can be calculated at December 31, 2006 as 34 + 14,815/6 + 368 = 2,871 Mboe.
i) “Proved” reserves is the amount of reserves P10 such that P[ X ≥ P10 ] = 90%, where X is the amount of petroleum
(naturally occurring on or within the Earth’s crust) that has been discovered and is deemed to be economically recoverable. “Proved plus probable” reserves are defined as the amount P50 such that P[ X ≥ P50 ] = 50%.
Source: Cinch Energy Corp. Disclosure of O&G reserves corresponding to fiscal year 2006. Available at www.sedar.com A.2. Example of O&G reserve disclosures under MOGR (US)
Notes:
i) “Oil and condensate MBbls” means “thousands of barrels of oil.” “NGL MBbls” means “thousands of barrels of natural gas liquids.” “Natural Gas MMcf” means “millions of cubic feet (ft3) of gas.” Note: Mboe is a metric used
Oil and
Condensate NGL's Natural
Gas (MBbls) (MBbls) (MMcf) Proved Developed and Undeveloped Reserves as of:
June 30, 2009 5,004 7,401 280,616
Sale of reserves — — — Extensions and discoveries 1,276 1,081 40,635 Purchases — — — Recoveries and revisions (1,177 ) (1,146 ) (53,855 ) Production (505 ) (598 ) (21,385 )
June 30, 2010 4,598 6,738 246,011

38
to combine oil and natural gas reserves and production into a single measure. It can be calculated based on Oil and Condensate MBbls, NGL MMcf and Natural Gas MMcf, taking into account that Mboe are “thousands of barrels of oil equivalent” and one Barrel of Oil Equivalent (BOE) is equivalent to 6,000 cubic feet (ft3) of natural gas. For example, Total Proved Reserves can be calculated at December 31, 2006 as 4,598 + 6,738 + 246,011/6 = 52,338 Mboe.
ii) “Proved” reserves is the amount of reserves P10 such that P[ X ≥ P10 ] = 90%, where X is the amount of petroleum (naturally occurring on or within the Earth’s crust) that has been discovered and is deemed to be economically recoverable. “Proved plus probable” reserves (defined as the amount P50 such that P[ X ≥ P50 ] = 50%) are not disclosed.
Source: Contango Oil & Gas Company. Disclosure of O&G reserves corresponding to fiscal year 2010. Available at http://www.sec.gov/edgar.shtml.

39
Appendix B: Summary of regulations on reserve disclosures introduced in Canada and the United States
The following table compares the National Instrument 51-101 (NI 51-101) introduced in Canada in 2003, with “Modernization of Oil and Gas Reporting” introduced in the US in 2009. For each point we indicate whether there has been a change with respect to the prior regulation in each particular country. Whenever there is no change with respect to the prior regulation, we indicate so with “[No change]”.
Canada (NI 51-101) United States (MOGR) Definitions
Definition of proved reserves Follows COGEHi and PRMSii: “those reserves that have a probability of being produced of at least 90%” [Before NI 51-101: “those reserves estimated as recoverable under existing economic conditions”]
Follows COGEHi and PRMSii: “there should be at least a 90% probability that the quantities actually recovered will equal or exceed the estimate” [Before MOGR: “the estimated quantities of crude oil, natural gas, and natural gas liquids, which geological and engineering data demonstrate with reasonable certainty to be recoverable from known reservoirs”]
New technologies and non-traditional sources Allows the inclusion of reserves extracted using new technologies and non-traditional sources [No change]
Recognizes emerging technologies for extraction of O&G reserves and non-traditional sources [Before MOGR: only conventional techniques allowed]
Disclosures
Proved reserves Mandatory [Before NI 51-101: Mandatory if headquartered in some Canadian states or carrying out primary capital market operations]
Mandatory [No change]
Proved plus probable reserves Mandatory [Before NI 51-101: Mandatory if headquartered in some
Canadian states or carrying out primary capital market operations] Voluntary [Before MOGR: this disclosure was not allowed. See: SEC Industry Guide 7 (IG-7)]
Proved plus probable plus possible reserves Voluntary [No change] Voluntary [Before MOGR: this disclosure was not allowed. See: SEC Industry Guide 7 (IG-7)]
Break-down of proved reserves Breakdown into developed/undeveloped reserves [No change] Reconciliation amounts in changes in reserves balance [No change] Breakdown by product group and geographic area [No change]
Breakdown into developed/undeveloped reserves [No change] Reconciliation amounts in changes in reserves balance [No change] Breakdown by product group and geographic area [No change, but more specific guidelines than SFAS 69]
Costs Requires disclosure of future capital necessary to convert reserves, as well as development, acquisition, and abandonment/reclamation costs [No change]
Not required [No change]
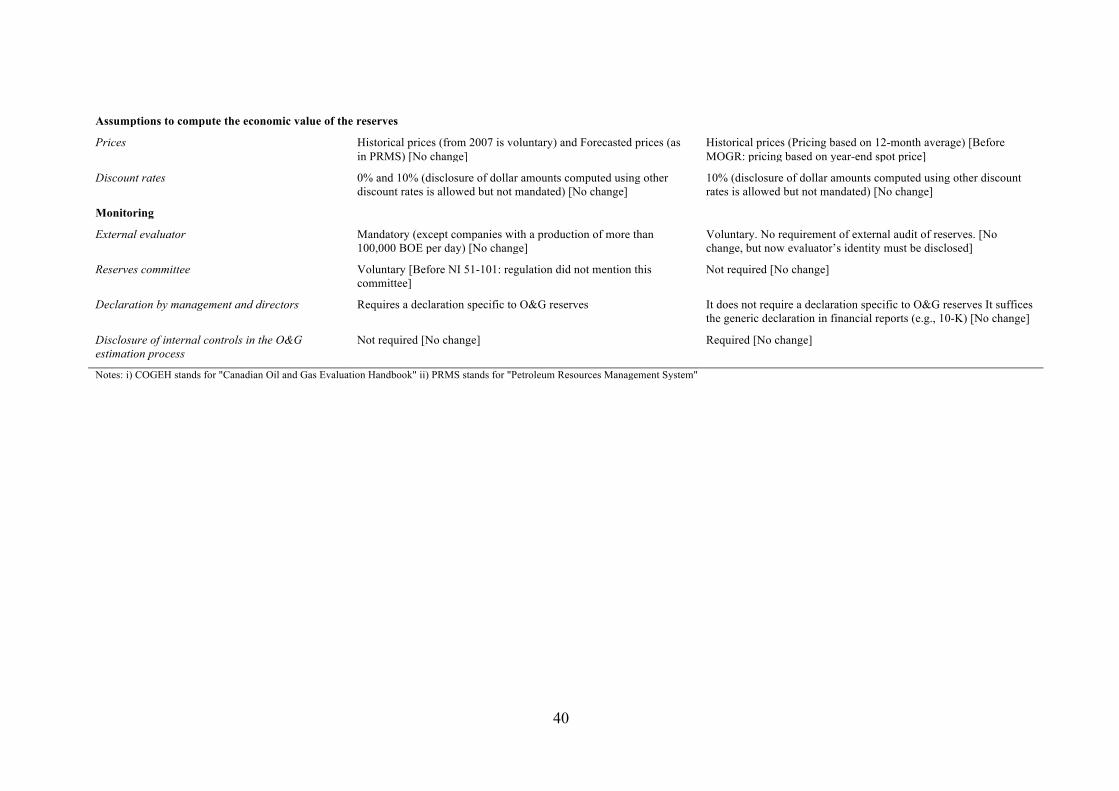
40
Assumptions to compute the economic value of the reserves
Prices Historical prices (from 2007 is voluntary) and Forecasted prices (as in PRMS) [No change]
Historical prices (Pricing based on 12-month average) [Before MOGR: pricing based on year-end spot price]
Discount rates 0% and 10% (disclosure of dollar amounts computed using other discount rates is allowed but not mandated) [No change]
10% (disclosure of dollar amounts computed using other discount rates is allowed but not mandated) [No change]
Monitoring
External evaluator Mandatory (except companies with a production of more than 100,000 BOE per day) [No change]
Voluntary. No requirement of external audit of reserves. [No change, but now evaluator’s identity must be disclosed]
Reserves committee Voluntary [Before NI 51-101: regulation did not mention this committee]
Not required [No change]
Declaration by management and directors Requires a declaration specific to O&G reserves It does not require a declaration specific to O&G reserves It suffices the generic declaration in financial reports (e.g., 10-K) [No change]
Disclosure of internal controls in the O&G estimation process
Not required [No change] Required [No change]
Notes: i) COGEH stands for "Canadian Oil and Gas Evaluation Handbook" ii) PRMS stands for "Petroleum Resources Management System"
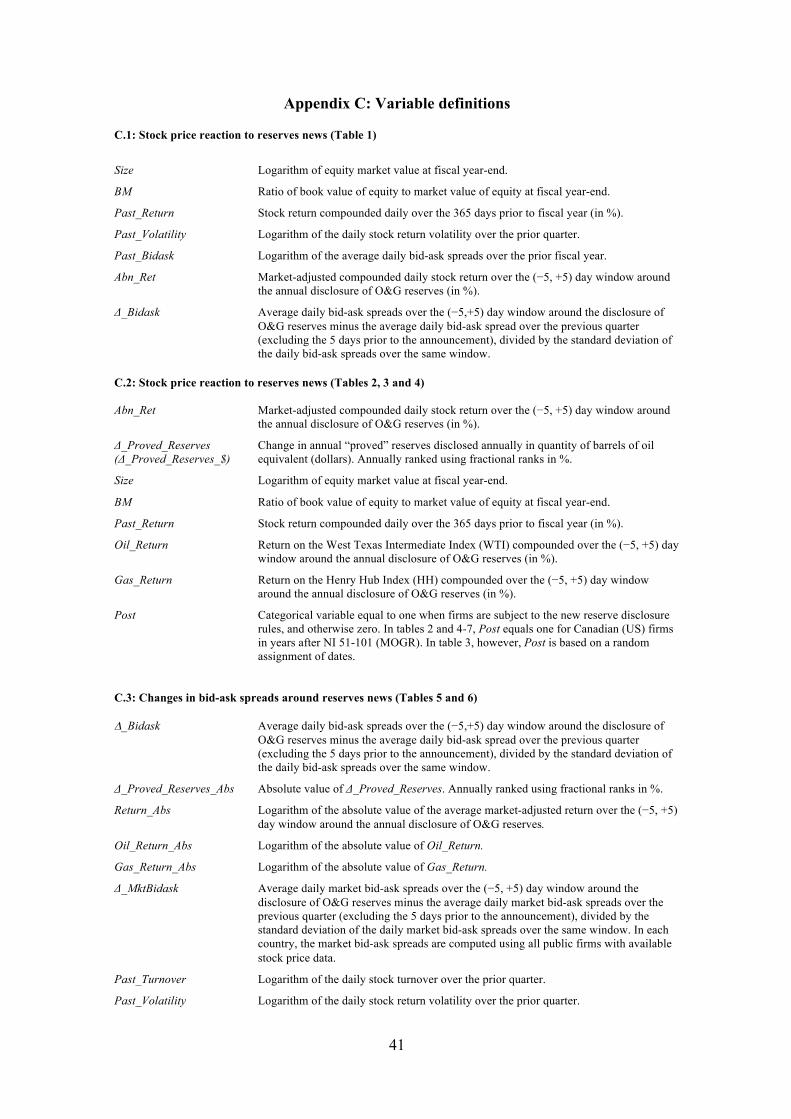
41
Appendix C: Variable definitions C.1: Stock price reaction to reserves news (Table 1)
Size Logarithm of equity market value at fiscal year-end.
BM Ratio of book value of equity to market value of equity at fiscal year-end.
Past_Return Stock return compounded daily over the 365 days prior to fiscal year (in %).
Past_Volatility Logarithm of the daily stock return volatility over the prior quarter.
Past_Bidask Logarithm of the average daily bid-ask spreads over the prior fiscal year.
Abn_Ret Market-adjusted compounded daily stock return over the (−5, +5) day window around the annual disclosure of O&G reserves (in %).
Δ_Bidask Average daily bid-ask spreads over the (−5,+5) day window around the disclosure of O&G reserves minus the average daily bid-ask spread over the previous quarter (excluding the 5 days prior to the announcement), divided by the standard deviation of the daily bid-ask spreads over the same window.
C.2: Stock price reaction to reserves news (Tables 2, 3 and 4) Abn_Ret Market-adjusted compounded daily stock return over the (−5, +5) day window around
the annual disclosure of O&G reserves (in %).
Δ_Proved_Reserves Change in annual “proved” reserves disclosed annually in quantity of barrels of oil (Δ_Proved_Reserves_$) equivalent (dollars). Annually ranked using fractional ranks in %.
Size Logarithm of equity market value at fiscal year-end.
BM Ratio of book value of equity to market value of equity at fiscal year-end.
Past_Return Stock return compounded daily over the 365 days prior to fiscal year (in %).
Oil_Return Return on the West Texas Intermediate Index (WTI) compounded over the (−5, +5) day window around the annual disclosure of O&G reserves (in %).
Gas_Return Return on the Henry Hub Index (HH) compounded over the (−5, +5) day window around the annual disclosure of O&G reserves (in %).
Post Categorical variable equal to one when firms are subject to the new reserve disclosure rules, and otherwise zero. In tables 2 and 4-7, Post equals one for Canadian (US) firms in years after NI 51-101 (MOGR). In table 3, however, Post is based on a random assignment of dates.
C.3: Changes in bid-ask spreads around reserves news (Tables 5 and 6) D_Bidask Average daily bid-ask spreads over the (−5,+5) day window around the disclosure of
O&G reserves minus the average daily bid-ask spread over the previous quarter (excluding the 5 days prior to the announcement), divided by the standard deviation of the daily bid-ask spreads over the same window.
Δ_Proved_Reserves_Abs Absolute value of Δ_Proved_Reserves. Annually ranked using fractional ranks in %.
Return_Abs Logarithm of the absolute value of the average market-adjusted return over the (−5, +5) day window around the annual disclosure of O&G reserves.
Oil_Return_Abs Logarithm of the absolute value of Oil_Return.
Gas_Return_Abs Logarithm of the absolute value of Gas_Return.
Δ_MktBidask Average daily market bid-ask spreads over the (−5, +5) day window around the disclosure of O&G reserves minus the average daily market bid-ask spreads over the previous quarter (excluding the 5 days prior to the announcement), divided by the standard deviation of the daily market bid-ask spreads over the same window. In each country, the market bid-ask spreads are computed using all public firms with available stock price data.
Past_Turnover Logarithm of the daily stock turnover over the prior quarter.
Past_Volatility Logarithm of the daily stock return volatility over the prior quarter.
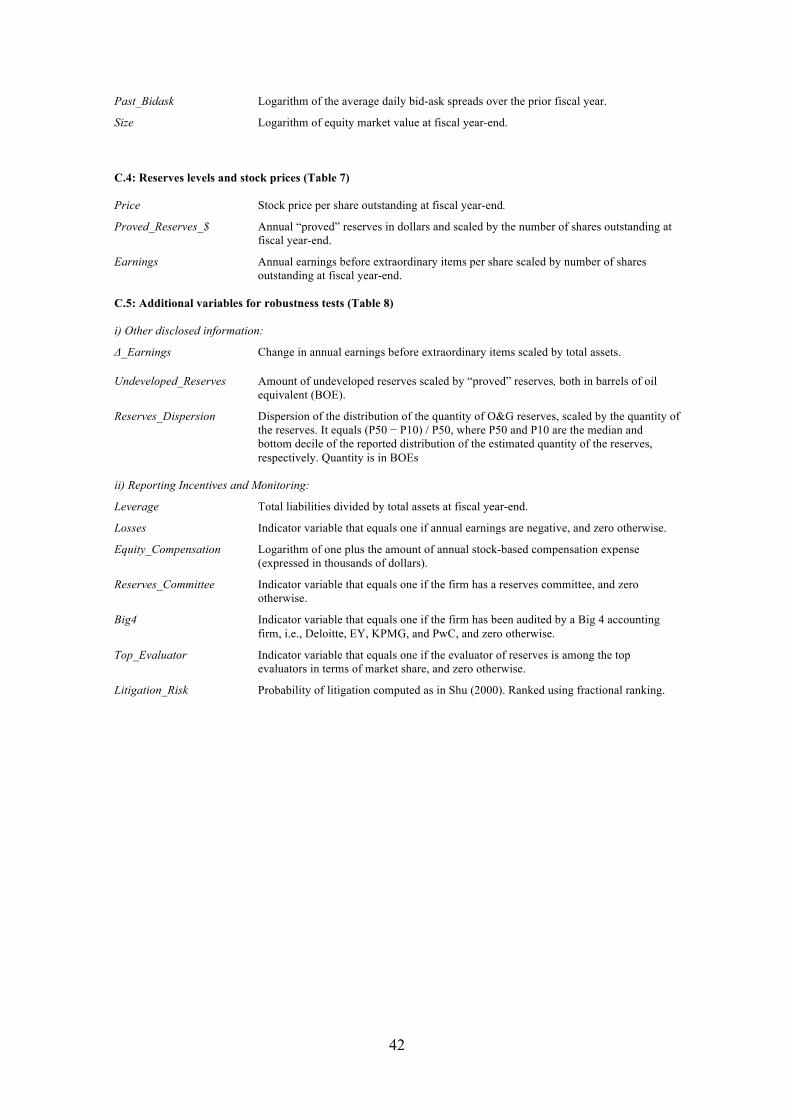
42
Past_Bidask Logarithm of the average daily bid-ask spreads over the prior fiscal year.
Size Logarithm of equity market value at fiscal year-end. C.4: Reserves levels and stock prices (Table 7) Price Stock price per share outstanding at fiscal year-end.
Proved_Reserves_$ Annual “proved” reserves in dollars and scaled by the number of shares outstanding at fiscal year-end.
Earnings Annual earnings before extraordinary items per share scaled by number of shares outstanding at fiscal year-end.
C.5: Additional variables for robustness tests (Table 8) i) Other disclosed information:
Δ_Earnings Change in annual earnings before extraordinary items scaled by total assets.
Undeveloped_Reserves Amount of undeveloped reserves scaled by “proved” reserves, both in barrels of oil equivalent (BOE).
Reserves_Dispersion Dispersion of the distribution of the quantity of O&G reserves, scaled by the quantity of the reserves. It equals (P50 − P10) / P50, where P50 and P10 are the median and bottom decile of the reported distribution of the estimated quantity of the reserves, respectively. Quantity is in BOEs
ii) Reporting Incentives and Monitoring:
Leverage Total liabilities divided by total assets at fiscal year-end.
Losses Indicator variable that equals one if annual earnings are negative, and zero otherwise.
Equity_Compensation Logarithm of one plus the amount of annual stock-based compensation expense (expressed in thousands of dollars).
Reserves_Committee Indicator variable that equals one if the firm has a reserves committee, and zero otherwise.
Big4 Indicator variable that equals one if the firm has been audited by a Big 4 accounting firm, i.e., Deloitte, EY, KPMG, and PwC, and zero otherwise.
Top_Evaluator Indicator variable that equals one if the evaluator of reserves is among the top evaluators in terms of market share, and zero otherwise.
Litigation_Risk Probability of litigation computed as in Shu (2000). Ranked using fractional ranking.
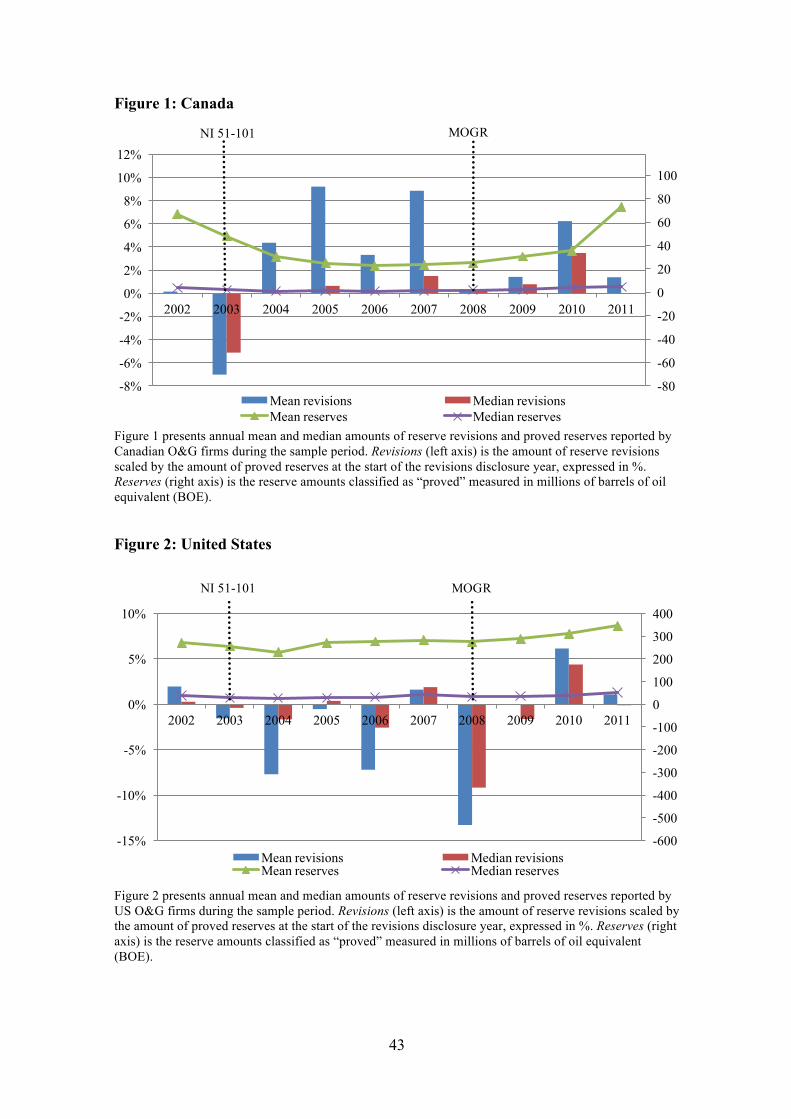
43
Figure 1: Canada
Figure 1 presents annual mean and median amounts of reserve revisions and proved reserves reported by Canadian O&G firms during the sample period. Revisions (left axis) is the amount of reserve revisions scaled by the amount of proved reserves at the start of the revisions disclosure year, expressed in %. Reserves (right axis) is the reserve amounts classified as “proved” measured in millions of barrels of oil equivalent (BOE). Figure 2: United States
Figure 2 presents annual mean and median amounts of reserve revisions and proved reserves reported by US O&G firms during the sample period. Revisions (left axis) is the amount of reserve revisions scaled by the amount of proved reserves at the start of the revisions disclosure year, expressed in %. Reserves (right axis) is the reserve amounts classified as “proved” measured in millions of barrels of oil equivalent (BOE).
-80
-60
-40
-20
0
20
40
60
80
100
-8%
-6%
-4%
-2%
0%
2%
4%
6%
8%
10%
12%
2002 2003 2004 2005 2006 2007 2008 2009 2010 2011
Mean revisions Median revisionsMean reserves Median reserves
-600
-500
-400
-300
-200
-100
0
100
200
300
400
-15%
-10%
-5%
0%
5%
10%
2002 2003 2004 2005 2006 2007 2008 2009 2010 2011
Hun
dred
s
Mean revisions Median revisionsMean reserves Median reserves
NI 51-101 MOGR
NI 51-101 MOGR
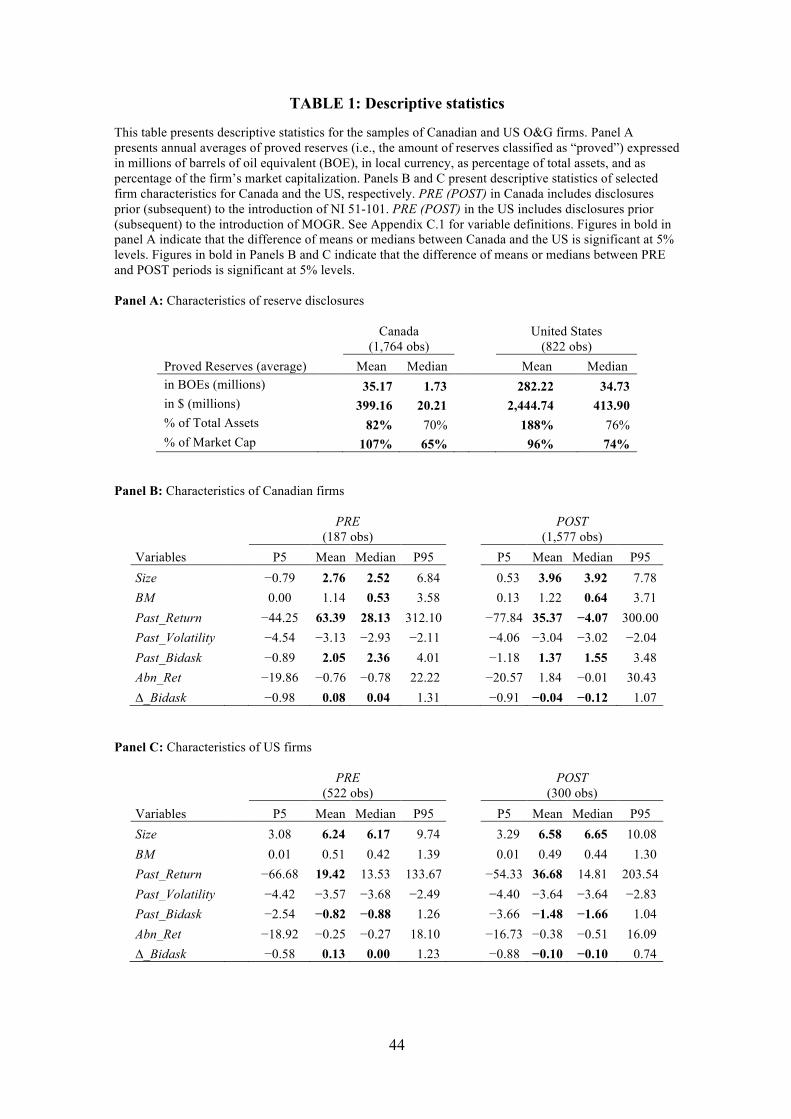
44
TABLE 1: Descriptive statistics
This table presents descriptive statistics for the samples of Canadian and US O&G firms. Panel A presents annual averages of proved reserves (i.e., the amount of reserves classified as “proved”) expressed in millions of barrels of oil equivalent (BOE), in local currency, as percentage of total assets, and as percentage of the firm’s market capitalization. Panels B and C present descriptive statistics of selected firm characteristics for Canada and the US, respectively. PRE (POST) in Canada includes disclosures prior (subsequent) to the introduction of NI 51-101. PRE (POST) in the US includes disclosures prior (subsequent) to the introduction of MOGR. See Appendix C.1 for variable definitions. Figures in bold in panel A indicate that the difference of means or medians between Canada and the US is significant at 5% levels. Figures in bold in Panels B and C indicate that the difference of means or medians between PRE and POST periods is significant at 5% levels. Panel A: Characteristics of reserve disclosures
Canada
(1,764 obs)
United States
(822 obs) Proved Reserves (average) Mean Median Mean Median in BOEs (millions) 35.17 1.73 282.22 34.73 in $ (millions) 399.16 20.21 2,444.74 413.90 % of Total Assets 82% 70% 188% 76% % of Market Cap 107% 65% 96% 74%
Panel B: Characteristics of Canadian firms
PRE
(187 obs) POST
(1,577 obs) Variables P5 Mean Median P95 P5 Mean Median P95 Size −0.79 2.76 2.52 6.84 0.53 3.96 3.92 7.78 BM 0.00 1.14 0.53 3.58 0.13 1.22 0.64 3.71 Past_Return −44.25 63.39 28.13 312.10 −77.84 35.37 −4.07 300.00 Past_Volatility −4.54 −3.13 −2.93 −2.11 −4.06 −3.04 −3.02 −2.04 Past_Bidask −0.89 2.05 2.36 4.01 −1.18 1.37 1.55 3.48 Abn_Ret −19.86 −0.76 −0.78 22.22 −20.57 1.84 −0.01 30.43 ∆_Bidask −0.98 0.08 0.04 1.31 −0.91 −0.04 −0.12 1.07
Panel C: Characteristics of US firms
PRE
(522 obs) POST
(300 obs) Variables P5 Mean Median P95 P5 Mean Median P95 Size 3.08 6.24 6.17 9.74 3.29 6.58 6.65 10.08 BM 0.01 0.51 0.42 1.39 0.01 0.49 0.44 1.30 Past_Return −66.68 19.42 13.53 133.67 −54.33 36.68 14.81 203.54 Past_Volatility −4.42 −3.57 −3.68 −2.49 −4.40 −3.64 −3.64 −2.83 Past_Bidask −2.54 −0.82 −0.88 1.26 −3.66 −1.48 −1.66 1.04 Abn_Ret −18.92 −0.25 −0.27 18.10 −16.73 −0.38 −0.51 16.09 ∆_Bidask −0.58 0.13 0.00 1.23 −0.88 −0.10 −0.10 0.74
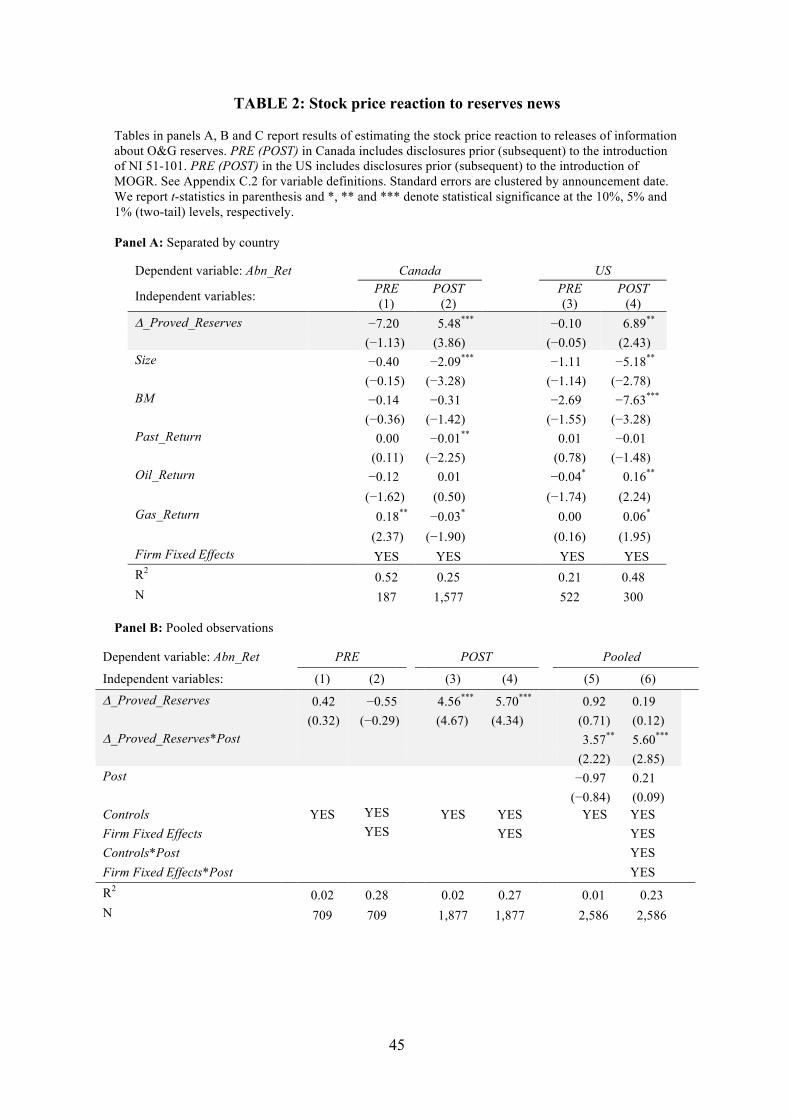
45
TABLE 2: Stock price reaction to reserves news Tables in panels A, B and C report results of estimating the stock price reaction to releases of information about O&G reserves. PRE (POST) in Canada includes disclosures prior (subsequent) to the introduction of NI 51-101. PRE (POST) in the US includes disclosures prior (subsequent) to the introduction of MOGR. See Appendix C.2 for variable definitions. Standard errors are clustered by announcement date. We report t-statistics in parenthesis and *, ** and *** denote statistical significance at the 10%, 5% and 1% (two-tail) levels, respectively. Panel A: Separated by country
Dependent variable: Abn_Ret Canada
US
Independent variables: PRE (1)
POST (2) PRE
(3) POST
(4) D_Proved_Reserves −7.20 5.48*** −0.10 6.89** (−1.13) (3.86) (−0.05) (2.43) Size −0.40 −2.09*** −1.11 −5.18** (−0.15) (−3.28) (−1.14) (−2.78) BM −0.14 −0.31 −2.69 −7.63*** (−0.36) (−1.42) (−1.55) (−3.28) Past_Return 0.00 −0.01** 0.01 −0.01 (0.11) (−2.25) (0.78) (−1.48) Oil_Return −0.12 0.01 −0.04* 0.16** (−1.62) (0.50) (−1.74) (2.24) Gas_Return 0.18** −0.03* 0.00 0.06* (2.37) (−1.90) (0.16) (1.95) Firm Fixed Effects YES YES YES YES R2 0.52 0.25 0.21 0.48 N 187 1,577 522 300
Panel B: Pooled observations
Dependent variable: Abn_Ret PRE POST Pooled
Independent variables: (1) (2) (3) (4) (5) (6) D_Proved_Reserves 0.42 −0.55 4.56*** 5.70*** 0.92 0.19 (0.32) (−0.29) (4.67) (4.34) (0.71) (0.12) D_Proved_Reserves*Post 3.57** 5.60*** (2.22) (2.85) Post −0.97 0.21 (−0.84) (0.09) Controls YES YES YES YES YES YES Firm Fixed Effects YES YES YES Controls*Post YES Firm Fixed Effects*Post YES R2 0.02 0.28 0.02 0.27 0.01 0.23 N 709 709 1,877 1,877 2,586 2,586
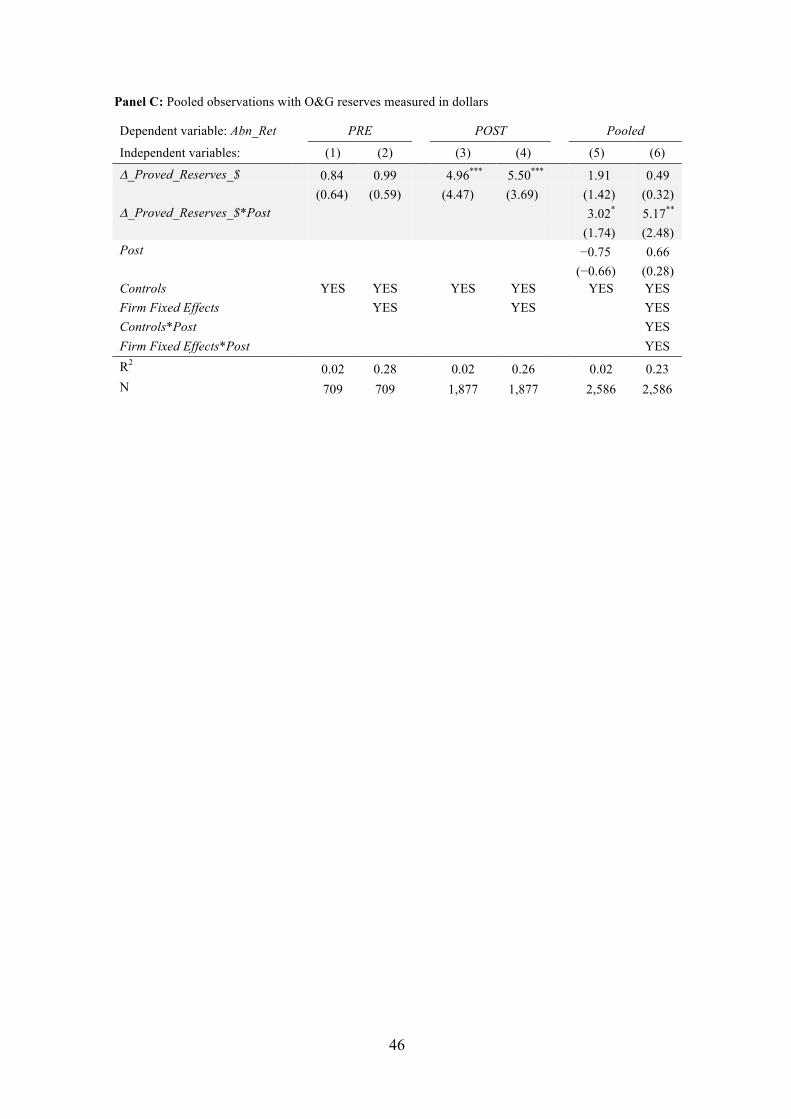
46
Panel C: Pooled observations with O&G reserves measured in dollars
Dependent variable: Abn_Ret PRE POST Pooled
Independent variables: (1) (2) (3) (4) (5) (6) D_Proved_Reserves_$ 0.84 0.99 4.96*** 5.50*** 1.91 0.49 (0.64) (0.59) (4.47) (3.69) (1.42) (0.32) D_Proved_Reserves_$*Post 3.02* 5.17** (1.74) (2.48) Post −0.75 0.66 (−0.66) (0.28) Controls YES YES YES YES YES YES Firm Fixed Effects YES YES YES Controls*Post YES Firm Fixed Effects*Post YES R2 0.02 0.28 0.02 0.26 0.02 0.23 N 709 709 1,877 1,877 2,586 2,586
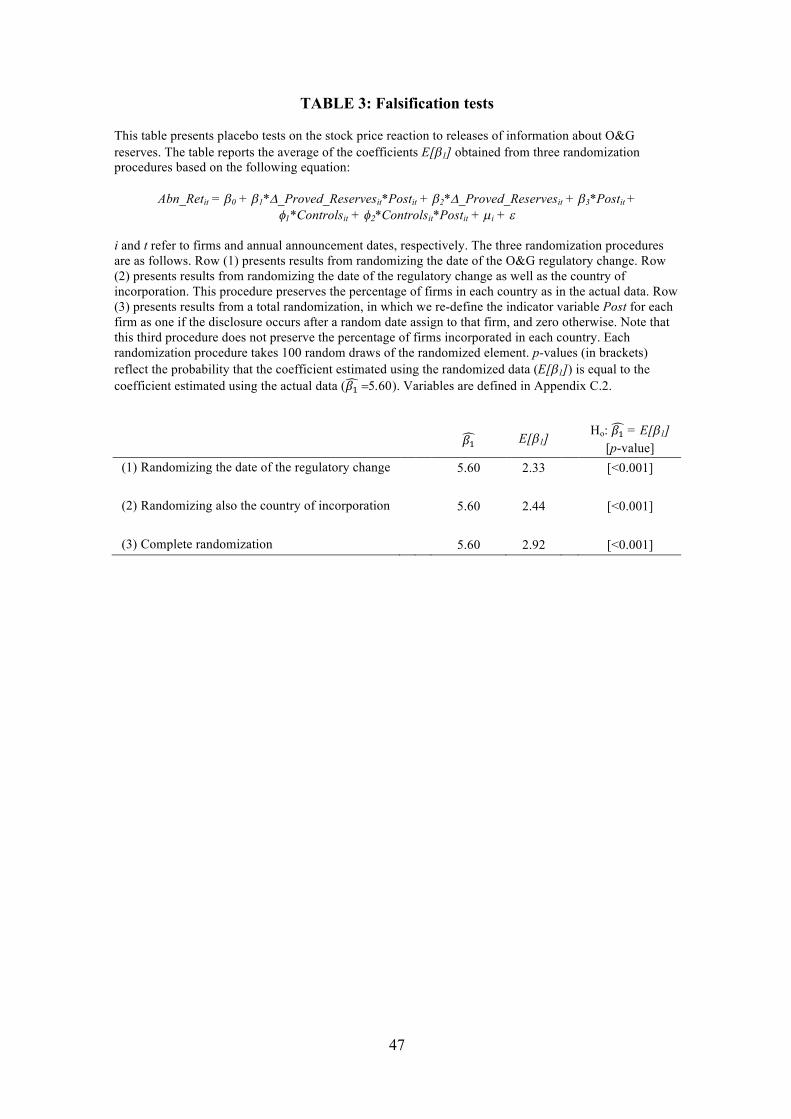
47
TABLE 3: Falsification tests
This table presents placebo tests on the stock price reaction to releases of information about O&G reserves. The table reports the average of the coefficients E[b1] obtained from three randomization procedures based on the following equation:
Abn_Retit = b0 + b1*D_Proved_Reservesit*Postit + b2*D_Proved_Reservesit + b3*Postit +
f1*Controlsit + f2*Controlsit*Postit + µi + e
i and t refer to firms and annual announcement dates, respectively. The three randomization procedures are as follows. Row (1) presents results from randomizing the date of the O&G regulatory change. Row (2) presents results from randomizing the date of the regulatory change as well as the country of incorporation. This procedure preserves the percentage of firms in each country as in the actual data. Row (3) presents results from a total randomization, in which we re-define the indicator variable Post for each firm as one if the disclosure occurs after a random date assign to that firm, and zero otherwise. Note that this third procedure does not preserve the percentage of firms incorporated in each country. Each randomization procedure takes 100 random draws of the randomized element. p-values (in brackets) reflect the probability that the coefficient estimated using the randomized data (E[b1]) is equal to the coefficient estimated using the actual data (!" =5.60). Variables are defined in Appendix C.2.
!" E[b1] Ho: !" = E[b1]
[p-value] (1) Randomizing the date of the regulatory change 5.60 2.33 [<0.001] (2) Randomizing also the country of incorporation 5.60 2.44 [<0.001] (3) Complete randomization 5.60 2.92 [<0.001]
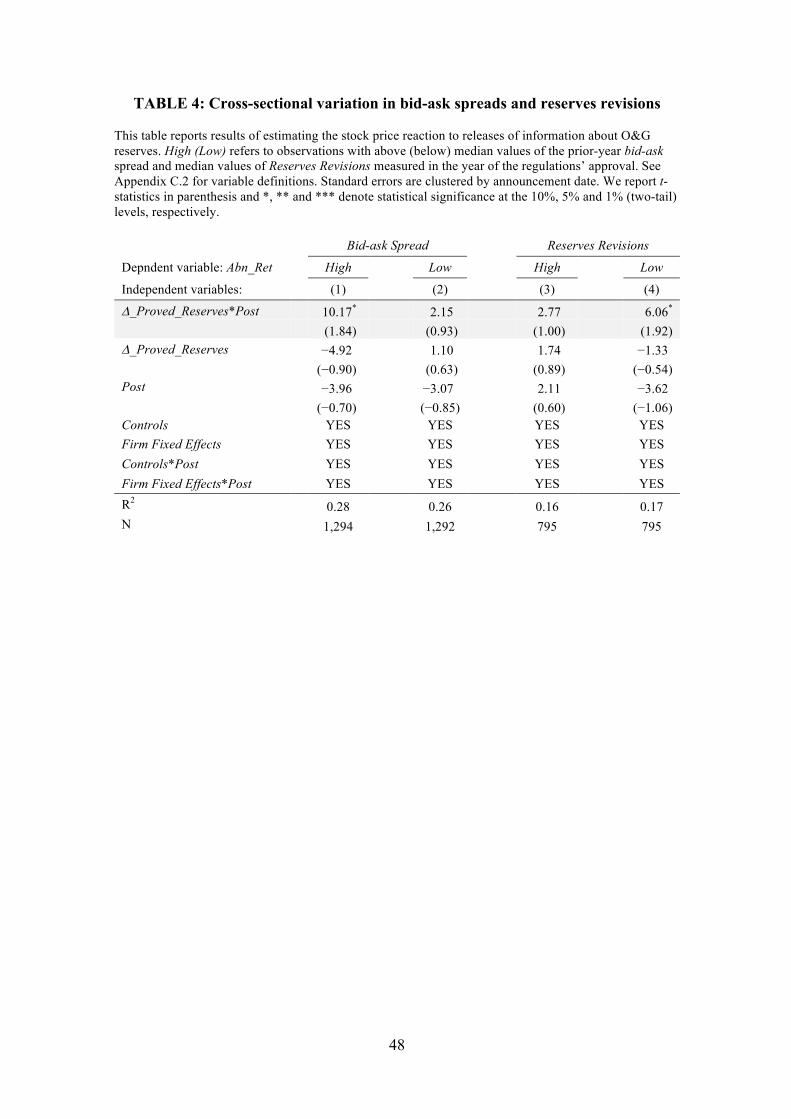
48
TABLE 4: Cross-sectional variation in bid-ask spreads and reserves revisions This table reports results of estimating the stock price reaction to releases of information about O&G reserves. High (Low) refers to observations with above (below) median values of the prior-year bid-ask spread and median values of Reserves Revisions measured in the year of the regulations’ approval. See Appendix C.2 for variable definitions. Standard errors are clustered by announcement date. We report t-statistics in parenthesis and *, ** and *** denote statistical significance at the 10%, 5% and 1% (two-tail) levels, respectively.
Bid-ask Spread Reserves Revisions
Depndent variable: Abn_Ret High Low High Low
Independent variables: (1) (2) (3) (4) D_Proved_Reserves*Post 10.17* 2.15 2.77 6.06* (1.84) (0.93) (1.00) (1.92) D_Proved_Reserves −4.92 1.10 1.74 −1.33 (−0.90) (0.63) (0.89) (−0.54) Post −3.96 −3.07 2.11 −3.62 (−0.70) (−0.85) (0.60) (−1.06) Controls YES YES YES YES Firm Fixed Effects YES YES YES YES Controls*Post YES YES YES YES Firm Fixed Effects*Post YES YES YES YES R2 0.28 0.26 0.16 0.17 N 1,294 1,292 795 795
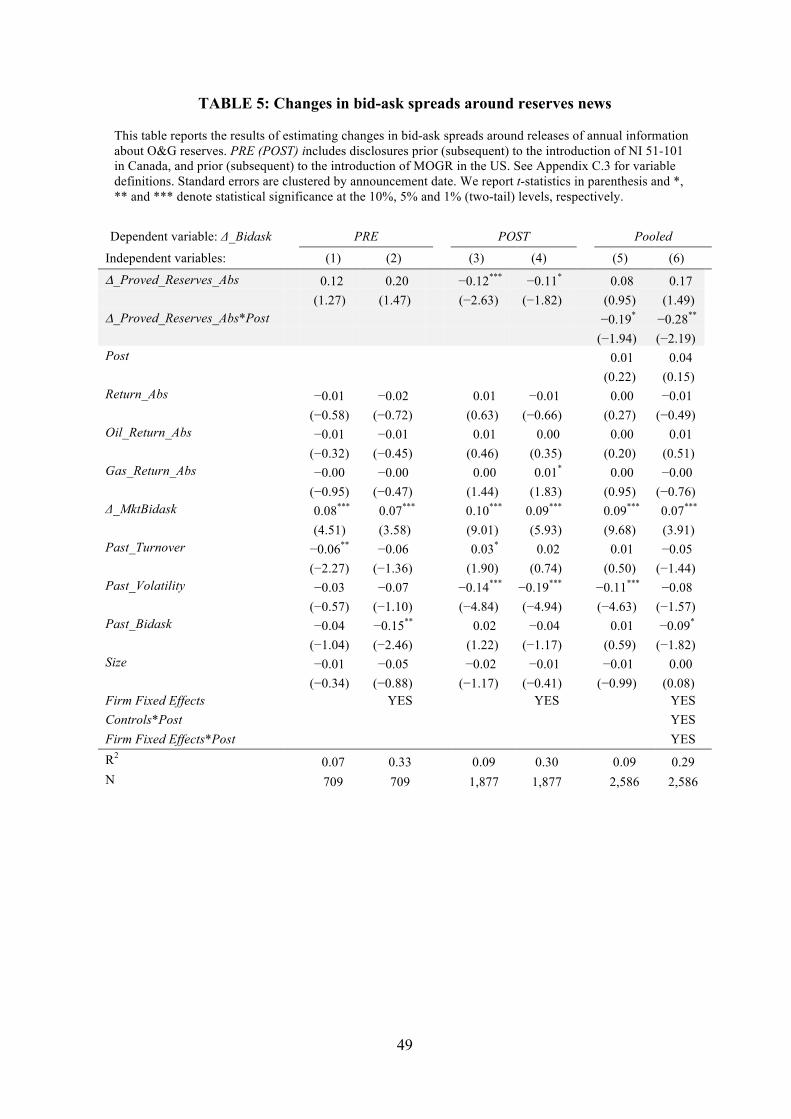
49
TABLE 5: Changes in bid-ask spreads around reserves news
This table reports the results of estimating changes in bid-ask spreads around releases of annual information about O&G reserves. PRE (POST) includes disclosures prior (subsequent) to the introduction of NI 51-101 in Canada, and prior (subsequent) to the introduction of MOGR in the US. See Appendix C.3 for variable definitions. Standard errors are clustered by announcement date. We report t-statistics in parenthesis and *, ** and *** denote statistical significance at the 10%, 5% and 1% (two-tail) levels, respectively.
Dependent variable: Δ_Bidask PRE POST Pooled Independent variables: (1) (2) (3) (4) (5) (6) D_Proved_Reserves_Abs 0.12 0.20 −0.12*** −0.11* 0.08 0.17 (1.27) (1.47) (−2.63) (−1.82) (0.95) (1.49) D_Proved_Reserves_Abs*Post −0.19* −0.28** (−1.94) (−2.19) Post 0.01 0.04 (0.22) (0.15) Return_Abs −0.01 −0.02 0.01 −0.01 0.00 −0.01 (−0.58) (−0.72) (0.63) (−0.66) (0.27) (−0.49) Oil_Return_Abs −0.01 −0.01 0.01 0.00 0.00 0.01 (−0.32) (−0.45) (0.46) (0.35) (0.20) (0.51) Gas_Return_Abs −0.00 −0.00 0.00 0.01* 0.00 −0.00 (−0.95) (−0.47) (1.44) (1.83) (0.95) (−0.76) Δ_MktBidask 0.08*** 0.07*** 0.10*** 0.09*** 0.09*** 0.07*** (4.51) (3.58) (9.01) (5.93) (9.68) (3.91) Past_Turnover −0.06** −0.06 0.03* 0.02 0.01 −0.05 (−2.27) (−1.36) (1.90) (0.74) (0.50) (−1.44) Past_Volatility −0.03 −0.07 −0.14*** −0.19*** −0.11*** −0.08 (−0.57) (−1.10) (−4.84) (−4.94) (−4.63) (−1.57) Past_Bidask −0.04 −0.15** 0.02 −0.04 0.01 −0.09* (−1.04) (−2.46) (1.22) (−1.17) (0.59) (−1.82) Size −0.01 −0.05 −0.02 −0.01 −0.01 0.00 (−0.34) (−0.88) (−1.17) (−0.41) (−0.99) (0.08) Firm Fixed Effects YES YES YES Controls*Post YES Firm Fixed Effects*Post YES R2 0.07 0.33 0.09 0.30 0.09 0.29 N 709 709 1,877 1,877 2,586 2,586
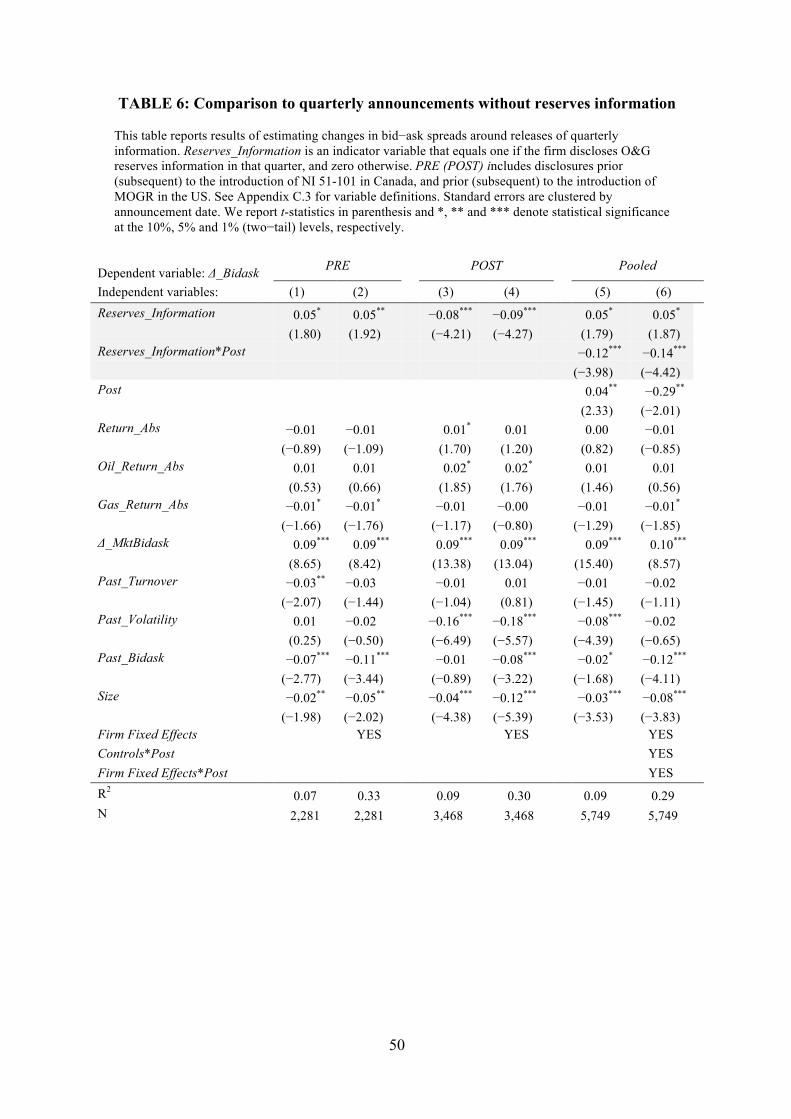
50
TABLE 6: Comparison to quarterly announcements without reserves information
This table reports results of estimating changes in bid−ask spreads around releases of quarterly information. Reserves_Information is an indicator variable that equals one if the firm discloses O&G reserves information in that quarter, and zero otherwise. PRE (POST) includes disclosures prior (subsequent) to the introduction of NI 51-101 in Canada, and prior (subsequent) to the introduction of MOGR in the US. See Appendix C.3 for variable definitions. Standard errors are clustered by announcement date. We report t-statistics in parenthesis and *, ** and *** denote statistical significance at the 10%, 5% and 1% (two−tail) levels, respectively.
Dependent variable: Δ_Bidask PRE POST Pooled
Independent variables: (1) (2) (3) (4) (5) (6) Reserves_Information 0.05* 0.05** −0.08*** −0.09*** 0.05* 0.05* (1.80) (1.92) (−4.21) (−4.27) (1.79) (1.87) Reserves_Information*Post −0.12*** −0.14*** (−3.98) (−4.42) Post 0.04** −0.29** (2.33) (−2.01) Return_Abs −0.01 −0.01 0.01* 0.01 0.00 −0.01 (−0.89) (−1.09) (1.70) (1.20) (0.82) (−0.85) Oil_Return_Abs 0.01 0.01 0.02* 0.02* 0.01 0.01 (0.53) (0.66) (1.85) (1.76) (1.46) (0.56) Gas_Return_Abs −0.01* −0.01* −0.01 −0.00 −0.01 −0.01* (−1.66) (−1.76) (−1.17) (−0.80) (−1.29) (−1.85) Δ_MktBidask 0.09*** 0.09*** 0.09*** 0.09*** 0.09*** 0.10*** (8.65) (8.42) (13.38) (13.04) (15.40) (8.57) Past_Turnover −0.03** −0.03 −0.01 0.01 −0.01 −0.02 (−2.07) (−1.44) (−1.04) (0.81) (−1.45) (−1.11) Past_Volatility 0.01 −0.02 −0.16*** −0.18*** −0.08*** −0.02 (0.25) (−0.50) (−6.49) (−5.57) (−4.39) (−0.65) Past_Bidask −0.07*** −0.11*** −0.01 −0.08*** −0.02* −0.12*** (−2.77) (−3.44) (−0.89) (−3.22) (−1.68) (−4.11) Size −0.02** −0.05** −0.04*** −0.12*** −0.03*** −0.08*** (−1.98) (−2.02) (−4.38) (−5.39) (−3.53) (−3.83) Firm Fixed Effects YES YES YES Controls*Post YES Firm Fixed Effects*Post YES R2 0.07 0.33 0.09 0.30 0.09 0.29 N 2,281 2,281 3,468 3,468 5,749 5,749
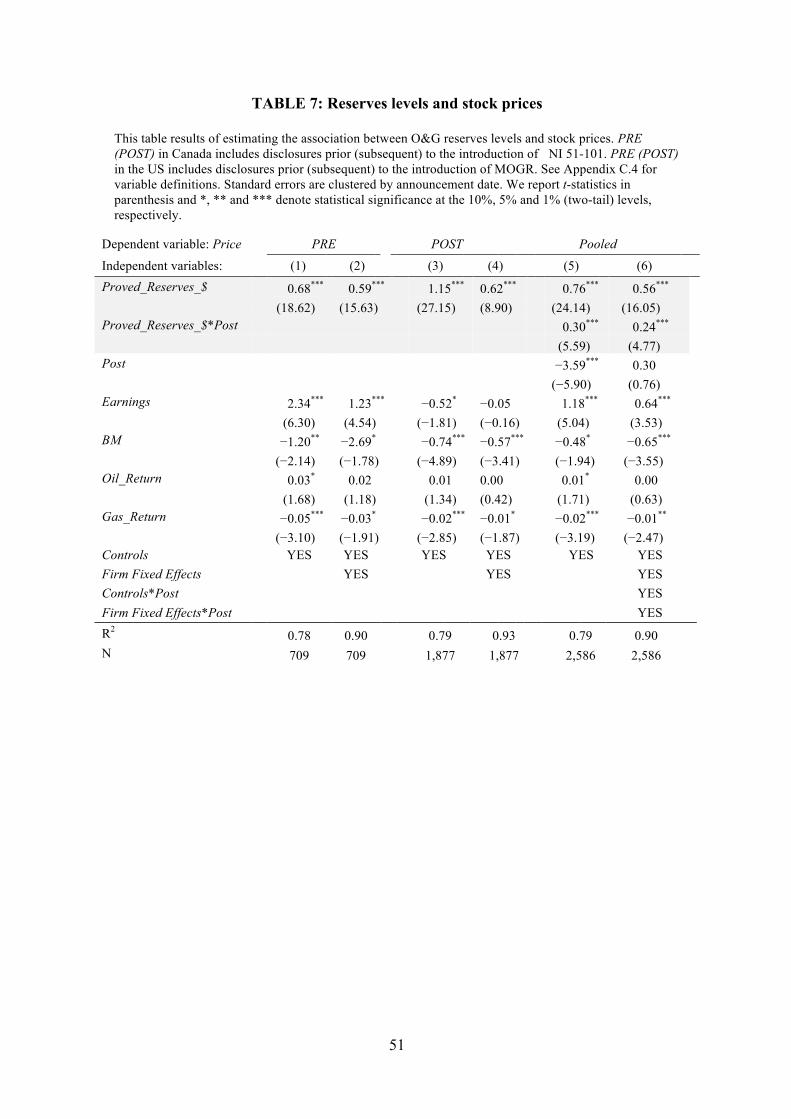
51
TABLE 7: Reserves levels and stock prices
This table results of estimating the association between O&G reserves levels and stock prices. PRE (POST) in Canada includes disclosures prior (subsequent) to the introduction of NI 51-101. PRE (POST) in the US includes disclosures prior (subsequent) to the introduction of MOGR. See Appendix C.4 for variable definitions. Standard errors are clustered by announcement date. We report t-statistics in parenthesis and *, ** and *** denote statistical significance at the 10%, 5% and 1% (two-tail) levels, respectively.
Dependent variable: Price PRE POST Pooled Independent variables: (1) (2) (3) (4) (5) (6) Proved_Reserves_$ 0.68*** 0.59*** 1.15*** 0.62*** 0.76*** 0.56*** (18.62) (15.63) (27.15) (8.90) (24.14) (16.05) Proved_Reserves_$*Post 0.30*** 0.24*** (5.59) (4.77) Post −3.59*** 0.30 (−5.90) (0.76) Earnings 2.34*** 1.23*** −0.52* −0.05 1.18*** 0.64*** (6.30) (4.54) (−1.81) (−0.16) (5.04) (3.53) BM −1.20** −2.69* −0.74*** −0.57*** −0.48* −0.65*** (−2.14) (−1.78) (−4.89) (−3.41) (−1.94) (−3.55) Oil_Return 0.03* 0.02 0.01 0.00 0.01* 0.00 (1.68) (1.18) (1.34) (0.42) (1.71) (0.63) Gas_Return −0.05*** −0.03* −0.02*** −0.01* −0.02*** −0.01** (−3.10) (−1.91) (−2.85) (−1.87) (−3.19) (−2.47) Controls YES YES YES YES YES YES Firm Fixed Effects YES YES YES Controls*Post YES Firm Fixed Effects*Post YES R2 0.78 0.90 0.79 0.93 0.79 0.90 N 709 709 1,877 1,877 2,586 2,586
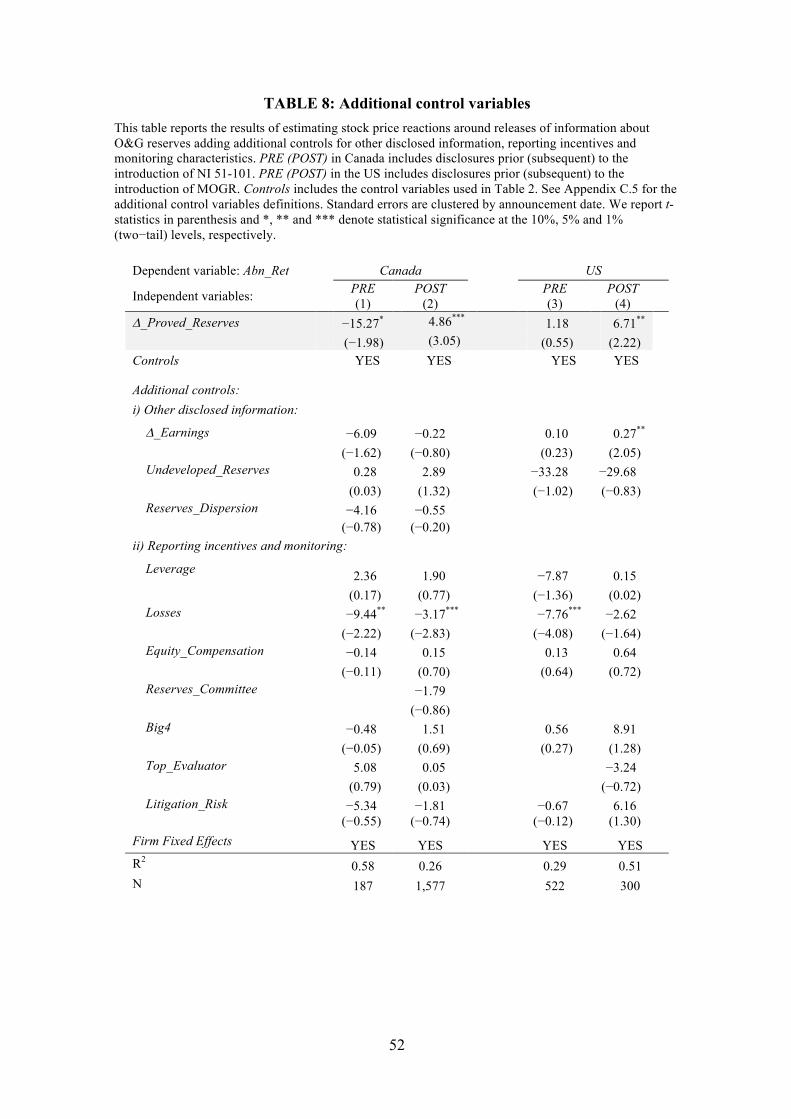
52
TABLE 8: Additional control variables
This table reports the results of estimating stock price reactions around releases of information about O&G reserves adding additional controls for other disclosed information, reporting incentives and monitoring characteristics. PRE (POST) in Canada includes disclosures prior (subsequent) to the introduction of NI 51-101. PRE (POST) in the US includes disclosures prior (subsequent) to the introduction of MOGR. Controls includes the control variables used in Table 2. See Appendix C.5 for the additional control variables definitions. Standard errors are clustered by announcement date. We report t-statistics in parenthesis and *, ** and *** denote statistical significance at the 10%, 5% and 1% (two−tail) levels, respectively.
Dependent variable: Abn_Ret Canada US
Independent variables: PRE (1)
POST (2) PRE
(3) POST
(4) D_Proved_Reserves −15.27* 4.86*** 1.18 6.71** (−1.98) (3.05) (0.55) (2.22) Controls YES YES YES YES
Additional controls: i) Other disclosed information: D_Earnings −6.09 −0.22 0.10 0.27** (−1.62) (−0.80) (0.23) (2.05) Undeveloped_Reserves 0.28 2.89 −33.28 −29.68 (0.03) (1.32) (−1.02) (−0.83) Reserves_Dispersion −4.16 −0.55 (−0.78) (−0.20) ii) Reporting incentives and monitoring:
Leverage 2.36 1.90 −7.87 0.15 (0.17) (0.77) (−1.36) (0.02) Losses −9.44** −3.17*** −7.76*** −2.62 (−2.22) (−2.83) (−4.08) (−1.64) Equity_Compensation −0.14 0.15 0.13 0.64 (−0.11) (0.70) (0.64) (0.72) Reserves_Committee −1.79 (−0.86) Big4 −0.48 1.51 0.56 8.91 (−0.05) (0.69) (0.27) (1.28) Top_Evaluator 5.08 0.05 −3.24 (0.79) (0.03) (−0.72) Litigation_Risk −5.34 −1.81 −0.67 6.16 (−0.55) (−0.74) (−0.12) (1.30) Firm Fixed Effects YES YES YES YES R2 0.58 0.26 0.29 0.51 N 187 1,577 522 300
Related Documents