DISCUSSION PAPER SERIES Forschungsinstitut zur Zukunft der Arbeit Institute for the Study of Labor The Informal Labour Market in India: Transitory or Permanent Employment for Migrants? IZA DP No. 7587 August 2013 P.N. (Raja) Junankar Abu Shonchoy

Welcome message from author
This document is posted to help you gain knowledge. Please leave a comment to let me know what you think about it! Share it to your friends and learn new things together.
Transcript

DI
SC
US
SI
ON
P
AP
ER
S
ER
IE
S
Forschungsinstitut zur Zukunft der ArbeitInstitute for the Study of Labor
The Informal Labour Market in India:Transitory or Permanent Employment for Migrants?
IZA DP No. 7587
August 2013
P.N. (Raja) JunankarAbu Shonchoy
The Informal Labour Market in India:
Transitory or Permanent Employment for Migrants?
P.N. (Raja) Junankar University of New South Wales,
University of Western Sydney and IZA
Abu Shonchoy IDE, JETRO and
University of Tokyo
Discussion Paper No. 7587 August 2013
IZA
P.O. Box 7240 53072 Bonn
Germany
Phone: +49-228-3894-0 Fax: +49-228-3894-180
E-mail: [email protected]
Any opinions expressed here are those of the author(s) and not those of IZA. Research published in this series may include views on policy, but the institute itself takes no institutional policy positions. The IZA research network is committed to the IZA Guiding Principles of Research Integrity. The Institute for the Study of Labor (IZA) in Bonn is a local and virtual international research center and a place of communication between science, politics and business. IZA is an independent nonprofit organization supported by Deutsche Post Foundation. The center is associated with the University of Bonn and offers a stimulating research environment through its international network, workshops and conferences, data service, project support, research visits and doctoral program. IZA engages in (i) original and internationally competitive research in all fields of labor economics, (ii) development of policy concepts, and (iii) dissemination of research results and concepts to the interested public. IZA Discussion Papers often represent preliminary work and are circulated to encourage discussion. Citation of such a paper should account for its provisional character. A revised version may be available directly from the author.

IZA Discussion Paper No. 7587 August 2013
ABSTRACT
The Informal Labour Market in India: Transitory or Permanent Employment for Migrants?
This paper studies the characteristics of the workers in the informal economy and whether migrants treat this sector as a temporary location before moving on to the organised or formal sector to improve their life time income and life style. We limit our study to the Indian urban (non-Agricultural) sector and study the characteristics of the household heads that belong to the Informal Sector (Self Employed and Informal Wage Workers) and the Formal Sector. We find that household heads that are less educated, come from the poorer households, lower social groups (castes and religions) are more likely to be in the informal sector. We distinguish between migrants who come from rural areas and urban areas to their present urban location. We find that the longer duration of a rural migrant in the urban area, the lower the probability that the household head would be in the informal wage labour sector. JEL Classification: 017, J15, J61, J42 Keywords: informal labour markets, migrant, caste, religion Corresponding author: P.N. (Raja) Junankar The Australian School of Business The University of New South Wales UNSW Sydney NSW 2052 Australia E-mail: [email protected]

3
The Informal Labour Market in India: Transitory or Permanent Employment for Migrants? 1 2
P.N. (Raja) Junankar and Abu Shonchoy
1. Introduction
In most developing countries there is a large sector of the economy that is called the
informal sector or the unorganised sector. Employment in the informal labour market plays
an important role in most developing economies. Very broadly, the informal labour market
consists of workers in the informal sector plus casual workers in the formal sector. The
informal labour market is a very large part of the agricultural sector, but is also a significant
part of the urban sector. There is a difference between employment in the formal sector and
the informal sector in terms of the conditions of work, whether workers are subject to
government taxes, have access to social security or insurance, casual or contract workers,
whether they receive minimum wages or not, etc.
The informal economy is a very important sector of the Indian economy: the National
Council of Applied Economic Research estimates that the informal sector -“unorganised
sector”- generates about 62 % of GDP, 50 % of national savings and 40 % of national
exports, (ILO 2002, p. 30). In terms of employment, the informal economy provides for about
55 % of total employment (ILO 2002, p. 14). Urban areas (especially large cities) attract
numerous migrants from both the rural areas and from smaller urban towns and cities in the
hope of a better life.
The Indian labour market can be conceived of as a segmented market: a formal sector
with workers who have salaried work, with good working conditions, and of course organised
business. The informal economy would consist of small self-employed traders and business
people, and casual workers in the informal or formal sectors. Some individuals are born into
wealthy families who own large businesses and hence are in the formal sector by right of
1 We are grateful for the provision of data by Desai, Sonalde, Reeve Vanneman, and National Council of Applied Economic Research, New Delhi, India. India Human Development Survey (IHDS), 2005 [Computer File]. ICSPSR22626-v7. Ann Arbor, MI: Inter-university Consortium for Political and Social Research [distributor], 2010-03-25. Doi: 10.3886/ICPSR22626.
2 An earlier version of this paper was presented to the Arndt-Corden School, ANU and we thank the participants (in particular, Raghav Jha, Peter Warr, and Robert Sparrow) for their helpful comments. A revised version was presented at the Workshop on Emerging Economies held at the University of New South Wales, 2012. We are grateful to our discussant Shiko Maruyama for constructive comments, and to the participants at the workshop for their helpful comments. The usual disclaimer applies.

4
birth. Others who are born with parents from the professional classes would almost certainly
have education from good schools and universities, and have a network of contacts that
would ensure that they would also join the ranks of employment in the formal sector. Some
individuals may have built up sufficient assets over time to set up small businesses and hence
enter the formal sector. However, most workers in the formal sector enter the formal sector
through their educational achievements, or by birth (children of rich people) and through
social networks. For someone who comes from a poor background (either in terms of income,
or belonging to a socially disadvantaged caste or religion) the only way to enter the formal
sector is via education in “good” schools3 or universities. Even with a good education, entry
into the formal sector is often based on family connections. The Indian government has for
some time had a policy of positive discrimination for the Dalits and as a result they may have
a higher probability of finding a job in the formal (Government) sector. Migrants (especially
from rural areas) who come into urban areas would likely have to spend time working in the
informal sector for some time before they build good networks to enable them to move into
the formal sector.
The literature on the role of the informal sector in developing countries has oscillated
between treating the informal sector as a backward sector that is holding back economic
development to a dynamic sector that is helping to develop the economy rapidly without
straining foreign currency balances and with relatively low demands for (real) capital goods,
see Mazumdar (1976), Weeks (1975), Bromley (1978), Gerxhani (2004). The informal sector
is considered as a pre-capitalist form of production compared to the formal sector that is a
profit maximising capitalist sector. There is a large literature on rural-urban migration (see,
Harris and Todaro, 1970) that considers migrants arriving in the city and initially finding
work in the informal sector and then moving on to better paid work in the formal sector.
Fields (1975) developed an early model of the informal sector as a “way station” for line up
for a formal job in urban areas (De Mel et al. 2010) which has been followed by others. This
view of the informal sector as a temporary abode for migrants has been disputed (amongst
others) by Mazumdar (1976). The debate has also ranged over whether informal sector
workers are living in poor conditions with low incomes, or whether some of the informal
sector workers are there out of choice and have a comfortable life, see Meng (2001). Some
3 A “good” school would almost certainly be an established private school.

5
individuals may have employment in the formal sector and work in the informal sector as
well.
Given the set-up of the urban labour market in India, some of the important issues to
investigate are whether (1) individuals who are informal sector workers are migrants; whether
migrants move out of the informal sector into the formal sector after a few years; (2) whether
they are from disadvantaged social and ethnic groups who do not have social networks to
enter the formal sector and finally, (3) whether those with low levels of education and skills
are unable to enter formal sector employment and have to find low paid work in the informal
sector.
This paper is interested in studying the characteristics of the workers in the informal
economy and whether migrants treat this sector as a permanent base or only as a temporary
location before moving on to the organised or formal sector to improve their life time income
and life style. We limit our study to the Indian urban (non-agricultural) sector and study the
characteristics of the household heads that belong to the Informal Sector (self-employed and
informal wage workers) and the Formal Sector. We find that members who come from the
lower social groups (castes and religions) are more likely to be in the informal sector. We
distinguish between migrants who come from rural areas and urban areas to their present
urban location. We find that the longer duration of a rural migrant in the urban area, the lower
the probability that the household head would be in the informal sector.
The following sections begin by clarifying the definition of informal labour markets
and briefly reviewing the literature in Section 2; Section 3 provides a detailed discussion of
the properties of the urban informal sector in India; Section 4 discusses the lexicographic
preferences of people over formal sector, self-employment, and informal wage labour;
Section 5 sets up an econometric model for estimating the probability of working in the
informal sector and provides some results while Section 6 provides results using a
multivariate logit model; Section 7 concludes with a summary of the results. In general, we
find that the longer the duration of a migrant in the urban sector the less likely s/he is to work
in the informal sector.
2. The Informal Labour Market: Definitions and a review of some earlier studies
In the developing country context, the informal sector is sometimes defined in terms
of the activities of the enterprises (ILO, 1972) and sometimes in terms of the kind of work
done by individuals as employees or as self-employed people (Hart, 1973).

6
In 1972 the ILO characterised the informal sector as:
(a) Ease of entry
(b) Reliance on indigenous resources
(c) Family ownership of enterprise
(d) Small scale of operation, often defined in terms of hired workers less than (say) ten
(e) Labour-intensive methods of production and adapted technology
(f) Skills acquired outside the formal school system
(g) Unregulated and competitive markets
Whereas the formal sector was characterised by:
(a) Difficult entry
(b) Frequent reliance on overseas resources
(c) Corporate ownership
(d) Large scale of operation
(e) Capital-intensive and often imported technology
(f) Formally acquired skills, often expatriate
(g) Protected markets (through tariffs, quotas, and licences)
Hart (1973) discussed the informal sector in terms of the conditions of work of the
individuals and whether they worked for wages with good conditions or informally as self-
employed workers. Informal activities included:
(a) Farming, market gardening, self employed artisans, shoe makers, tailors, etc.
(b) Working in construction, housing, road building
(c) Small scale distribution, e.g. petty traders, street hawkers, caterers in food and drink,
etc.
(d) Other services, e.g. barbers, shoe-shiners etc.
(e) Beggars
(f) Illegal activities like drug pushing
Formal sector income earning activities included:
(a) Public sector wage earners
(b) Private sector wage earners (on permanent contracts, not casual workers)
7
Sengupta (2009, p. 3) defines the informal economy thus:
Informal Sector: The unorganised sector consists of all
unincorporated private enterprises owned by individuals or
households engaged in the sale and production of goods and services
operated on a proprietary or partnership basis and with less than ten
total workers.
Informal worker/employment: Unorganised workers consist of those
working in the unorganised sector or households, excluding regular
workers with social security benefits provided by employers and the
workers in the formal sector without any employment and social
security benefits provided by employers.
Informal economy: The informal sector and its workers plus the
informal workers in the formal sector constitute the informal
economy.
3. The Indian Informal Labour Market: Some Background Information
A recent Report of the National Commission for Enterprises in the Unorganised Sector by the
Government of India (Sengupta 2009) finds that 86% of the total employment in 2004-2005
was in the informal sector. Further, the agricultural sector consists almost entirely of informal
workers. The non-agricultural workers in the informal sector were 36.5 % of the total, most
of whom were self-employed. From 1999-2000 to 2004-2005 most of the increase in
employment in the formal sector was of informal workers (Sengupta 2009, p.14). The NSSO
(2012, p ii) document finds that in 2009-2010 in the non-agriculture sector, nearly 71 % of
the workers in rural areas and 67 % in the urban areas worked in the informal sector. It finds
that the informal sector activities are concentrated mainly in the manufacturing, construction,
wholesale and retail trades, and transport, storage and communication industries.
In our study we are using data from the India Human Development Survey (IHDS)
2005, conducted by the Inter-university Consortium for Political and Social Research, Ann
Arbor, Michigan, USA. The survey is a nationally representative, multi-topic survey of
41,554 households in 1,503 villages and 971 urban neighbourhoods across India. The data set
has detailed information on household employment by industry and occupation, and detailed
8
information about household characteristics including age, education, ethnicity, religion, and
migration status. In this study we have limited our analysis to the informal labour markets in
the urban sector who are not engaged in any agricultural activities.
Our data set consists of 12,056 heads of households for whom we had data on their
age, education, marital status, gender, religion, caste, income source, migration status and
years since migration to urban sector, slum dwelling, and assets, etc.
We define the Urban Informal Sector as artisans, petty traders, small business (who
do not hire any labour), and non-agricultural casual workers in the Informal or Formal
Sectors. The Informal Sector consists of the self-employed and informal wage labour. We
define Self-Employment as petty traders who do not hire any workers and those in the
organised trade/business category who do not hire any workers. Note that this is a stricter
definition than that suggested by, for example, Sengupta (2009). The Informal Wage Labour
category covers those who are in the Informal Sector but are not self-employed, that is, the
artisans, and non-agricultural labour who are casually employed. The Formal Sector consists
of salaried employment, professionals, and organised trade/business who hire workers. In our
study we are limiting our analysis to only Heads of Household.
Figure 1: Distribution of Employment over Industries
0.230.06
0.72
0.080.04
0.89
0.340.05
0.62
0.270.370.37
0.830.01
0.16
0.090.01
0.89
0.400.06
0.55
0.170.02
0.81
0 .2 .4 .6 .8 1
Community, Social and Personal Services
Financing and Business Services
Transport and Communication Services
Wholesale, Retail, Restaurant and Hotels
Construction
Electricity, Gas and Water
Manufacturing
Minning and Quarrying
Formal Self Employment
Informal Wage Employment

9
It is interesting to notice the Industry and Occupational distribution of the Formal and
Informal Sectors of the economy for our sample data. Most of the Informal Wage Labour is
in Manufacturing, Construction, Wholesale, Retail trades, Restaurants, and Hotels, and in
Community, Social and Personal Services. Self-Employment is concentrated (not
surprisingly) in the Wholesale, Retail trades, Restaurants, and Hotels. Informal Wage Labour
is concentrated in occupations: Production and Related Workers, Transport Equipment
Operators and Labourers (presumably the unskilled workers).
Figure 2: Distribution of Households over Occupations
If we look at the distribution of migrants over these sectors we find that 38.88% of the
migrants work in the Formal sector, almost 21.58% are self-employed entrepreneurs and
17.30% are informal wage workers.
0.610.00
0.39
0.250.02
0.73
0.240.38
0.37
0.020.00
0.97
0.270.20
0.53
0.080.02
0.90
0 .2 .4 .6 .8 1
Labourer
Service
Sales
Clerk
Executive
Professional
Formal Self-employedInformal Wage Labour
10
Figure 3: Employment Category based on Migration Status
A high proportion of Migrants (28 %) are working primarily in the Community,
Personal and Social Services, 21 % in Wholesale & Retail Trades, Restaurants and Hotels,
and 17 % in Manufacturing.
0.27
0.12
0.61
0.29
0.15
0.57
0 .2 .4 .6
Rural-urban Migrant
Non-migrant
Formal Self-EmploymentInformal Wage Labour
11
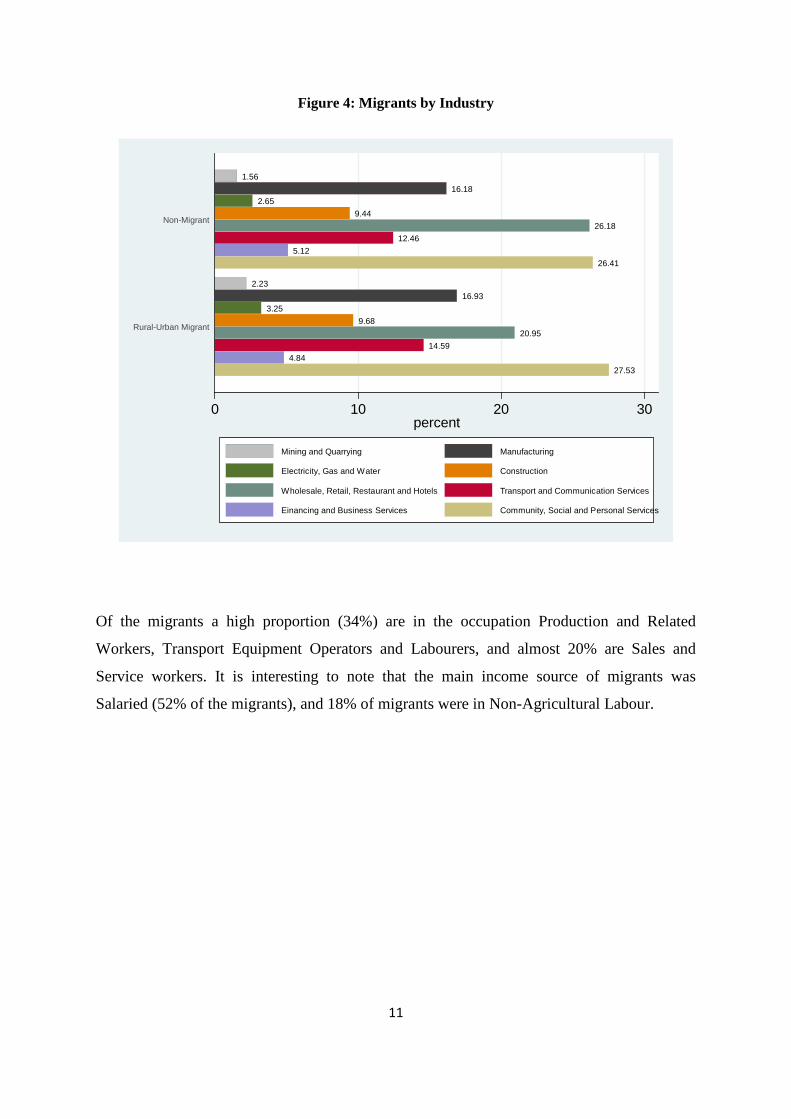
Figure 4: Migrants by Industry
Of the migrants a high proportion (34%) are in the occupation Production and Related
Workers, Transport Equipment Operators and Labourers, and almost 20% are Sales and
Service workers. It is interesting to note that the main income source of migrants was
Salaried (52% of the migrants), and 18% of migrants were in Non-Agricultural Labour.
27.534.84
14.5920.95
9.683.25
16.932.23
26.415.12
12.4626.18
9.442.65
16.181.56
0 10 20 30percent
Rural-Urban Migrant
Non-Migrant
Mining and Quarrying Manufacturing
Electricity, Gas and Water Construction
Wholesale, Retail, Restaurant and Hotels Transport and Communication Services
Einancing and Business Services Community, Social and Personal Services
12
Figure 5: Migrants by Occupation
Figure 6: Migrants and Income Source
It is interesting to see the caste and religion breakdown for the Formal and Informal Sectors
(Self Employed and Informal Wage Labour). As we would suspect, Brahmins and High Caste
38.40
8.48
18.93
12.25
12.08
9.87
32.48
7.65
24.92
11.13
15.01
8.81
0 10 20 30 40percent
Rural-Urban Migrant
Non-migrant
Professional ExecutiveClerk SalesService Labourer
1.74
50.14
10.23
7.66
9.15
21.09
1.88
42.15
14.36
9.14
10.66
21.82
0 10 20 30 40 50percent
Rural-Urban Migrant
Non-Migrant
Non-ag Labour ArtisanPretty Trade BusinessSalaried Profession

13
people are more likely to be in the Formal Sector, compared to the lower social castes and
Muslims. If we look at the distribution of people by caste and religion for the principal source
of the household incomes we see that Brahmins and High Caste people are more likely to be
Salaried or Professionals, whilst Dalits and Muslims are more likely to be Non-Agricultural
labourers or artisans (see Table 1).
Table 1: Caste and Religion by Source of Income
Non-Ag labour Artisan Petty
traders Business Salaried Professionals Total
Brahmin 56 67 68 136 705 43 1,075 High Caste 254 182 277 536 1,429 59 2,737
OBC 875 437 341 446 1,438 56 3,593 Dalit 664 205 105 108 803 18 1,903
Adivasi 97 11 16 35 238 6 403 Muslim 598 295 211 256 471 29 1,860
Sikh, Jain 9 20 32 61 129 5 256 Christian 54 19 4 20 126 6 229
Total 2,607 1,236 1,054 1,598 5,339 222 12,056 Source: India Human Development Survey
Table 2: Caste and Religion by Occupation
Brahmin High caste OBC Dalit Adivasi Muslim Sikh,
Jain Christian Total
Professions, Technical and
Related Workers
195 280 245 105 49 72 27 22 995
Administrative, Executive and
Managerial Workers
135 357 427 147 28 243 35 27 1,399
Clerical and Related Workers
188 329 361 191 50 84 23 24 1,250
Sale Workers 190 746 765 235 52 445 97 21 2,551 Service Workers 71 172 210 248 44 87 11 18 861
Production, Transport and
Labourers 159 551 1,236 799 141 732 41 67 3,726
Missing 137 302 349 178 39 197 22 50 1,274 Total 1,075 2,737 3,593 1,903 403 1,860 256 229 12,056
Source: India Human Development Survey

14
Figure 7: Caste and Religion by Sector
When we look at the distribution of occupations by caste and religion we note that Brahmins
and High Caste people are more likely to be in the higher level occupations, while Dalits and
Muslims are more likely to be in the lower level occupations. When we look at the
distribution of industries that the different castes and religions are located in, we see that
Manufacturing, Transport, and Finance etc. are important for most groups.
4. The Informal Economy: Some Analytical Features
We assume that individuals would prefer to be employed in the formal sector, either
as employees, or as owners/managers in the formal sector. This is based on the idea that the
formal sector provides a better life not only in terms of present and future income, but also in
terms of better conditions of work (security of tenure, social security benefits, access to
unions, safer working conditions, etc). If they are unable to enter the formal sector, we
assume that they would prefer to be self-employed (as long as their expected incomes are not
below that in the informal wage sector). Employees in the informal wage sector would prefer
to become self-employed if they had access to credit to set up a small business. Many of them
24.453.06
72.49
16.4114.45
69.14
46.4013.23
40.38
23.576.45
69.98
41.256.36
52.39
34.9312.47
52.60
19.1112.86
68.03
13.678.47
77.86
0 20 40 60 80percent
Christian
Sikh, Jain
Muslim
Adivasi
Dalit
OBC
High caste
Brahmin
Formal Self-EmploymentInformal Wage Labour

15
may simply be “waiting” for a job in the formal sector. In the Harris-Todaro model, rural
migrants come to the urban area as long as their expected wages (urban wage multiplied by
the probability of finding a job) are greater than their rural subsistence wage. Migrants who
do not find work in the urban formal sector then enter the urban informal sector which is
meant to be a form of “wait unemployment”. Essentially, we are arguing that individuals
have lexicographic preferences over these choices. However, what we observe is a reduced
form depending on the household head’s choice and the success in the formal labour market,
and the constraints in the credit market that determines whether they can become self-
employed. Informal wage labour then is a residual category.
In fact if we look at the actual incomes (based on our sample) we find that the
incomes of these three groups overlap to some extent, with the lowest incomes for informal
wage labour, followed by self-employment, followed by formal sector incomes. Figure 8
presents the kernel densities of the logs of Informal Wage Labour, Informal Self
Employment, and Formal Incomes respectively. As can be seen the Informal Wage Labour
Incomes are distributed to the left, the Informal Self Employment Incomes are in the middle,
and Formal Incomes are to the right of the other distributions. There is some overlap at the
lower tails of the distributions, but Self Employment and Formal Incomes have tails spread
out at the higher income levels.

16
Figure 8: Kernel Densities of Log Income by Employment
Table 3: Distribution of Log Incomes by Sector
Variable: Log of Income Obs. Mean Std. Dev. Min Max
Formal 6916 11.2313 0.81603 6.21461 15.6904
Self-Employment 1324 10.7466 0.76783 6.8024 13.7695
Informal Wage Labour 3744 10.4617 0.70924 6.44883 13.731
Source: India Human Development Survey
A Kolmogorov-Smirnov test reveals that there are significant differences in these kernel
densities. (All pairwise Kolmogorov-Smirnov tests are statistically significant with a p-value
of 0.000). Table 3 provides some summary statistics to illustrate the differences in the
distribution of incomes. As discussed above the mean (log) incomes of the formal sector is
greater than that of the self-employed and that is greater than the informal wage workers. The
only curious result seems to be that the minimum of the formal sector is lower than that of the
other two groups.

17
To be in the Formal sector, domestic capitalists need to have significant amounts of
capital and access to credit. Inheritance plays a large part in providing either the original
capital or access to credit. Multinationals come in with large amounts of capital with
technology that is labour saving (embodied technological change). Employment in the
Formal sector is then limited by the use of imported technology and limited amounts of
capital. Note there is limited amount of labour-capital substitution possible because of
embodied technology.
Wages in Formal Sector are fixed by government (minimum wages) or by unions or
by employers using efficiency wage ideas, or by Multinational Firms who feel constrained to
pay good wages. Employers in Formal Sector ration employment by using
education/experience as an index of productivity, and using religion/caste as a signal for
productivity (statistical discrimination). Given two people with the same education/skill
levels they would prefer a high caste Hindu to a low caste Hindu or to a Muslim. Note: being
in the formal economy is not a guarantee against poverty, (see ILO 2002, p.31).
Self-employment (in the Informal Sector) is constrained by limited amounts of credit
and access to capital. The higher the social class and the higher the level of education, the
easier people have access to credit. Note: ILO (2002, p. 31) provides evidence that many in
the informal economy, especially the self-employed, in fact earn more than unskilled or low-
skilled workers in the formal economy.
Informal Sector employment is a residual: the lower the employment in the Formal
Sector, the greater the number who look for work in the informal sector and hence, the lower
the wages (incomes) for this sector.
The Figure 9 below shows that 43 % of the self-employed have taken out loans for
business purposes, compared to only 14 % of the Formal Sector, and 16 percent of the
Informal Wage labour group. It is clear that the self-employed have to take out loans for
setting up and running a small enterprise. Presumably many of the informal wage workers
would be interested in setting up a small business but are unable to access credit.

18
Figure 9: Purpose of Loan by Sector
To summarise this section, we argue that households have a lexicographic preference
ordering over the different outcomes, formal, self-employment, or informal wage labour.
Migrants, especially rural migrants would have little access to credit or to the formal labour
market, at least until they have spent some years in the urban sector.
5. Probability of working in the Informal Sector
In this section we estimate the probability of a household head working in the
Informal Wage employment sector, to be Self-employed, or in the Formal Sector. As
discussed earlier our hypotheses are that those households who come from the lower social
classes/groups are more likely to be working in the Informal Sector. Some of these
households may have the entrepreneurial skills or have access to small amounts of capital to
set up as self-employed workers. We hypothesise that households who come from higher
social classes/groups, and/or who have higher levels of education are more likely to be
working in the Formal sector. Further we hypothesise that migrants who come into the urban
areas would initially find employment in the Informal sector and after some time when they
6.5019.43
3.831.16
19.1515.46
14.911.09
18.475.91
13.641.82
1.146.82
42.9512.50
0.6814.55
8.4011.36
5.394.47
9.8113.64
15.051.31
30.58
0 10 20 30 40Percent
Wage Labour Informal
Self-employment
Formal
House Land
Marriage Ag/Business
Consumption Car/appliance
Education Madical
Others

19
have accumulated sufficient funds or developed social networks or skills are more likely to
move into the Formal sector. In our analysis below we distinguish migrants are whose origin
is in a rural area, as a result, individuals who have come from other urban areas are
considered as "Urban Natives". We hypothesise that the duration of migration from a rural
origin influences the sector of employment.
5.1 Econometrics and Identification Strategy
The fundamental challenge of estimating the causal impact of migration duration on
the probability of working in the informal sector is the possibility of unobserved individual
characteristics that might influence the migration decision, survival at a migration
destination, and duration as well as the likelihood of working in the informal sector. For
example, it might be possible that individuals with high unobserved ability or entrepreneurial
skills might opt to move out of the rural area early in their life and remain in the urban area,
and such unobserved skills and ability will also influence their choice of sector in the
migration destination. Without controlling for this, estimation may be biased and
inconsistent.
If we had panel data we could have used methods to control for individual
heterogeneity. Another ideal method that could be used, to disentangle such unobserved
influences on migration duration and job status would be by using some natural experimental
framework or by randomly inducing people to migrate out of the rural areas to estimate the
causal impact of migration on job choice. Lacking the availability of such methods, we need
to opt for an instrumental variable approach (IV) where we would instrument migration
duration with a set of variables which do not have a direct influence on job placement or
current job status. One instrument that has been recently used to instrument for migration is
the historic migration rate as an instrument for current migration status (for example see,
Woodruff and Zenteno (2007), Hanson and Woodruff (2003); McKenzie and Rapoport
(2007, 2011); López-Córdoba (2005); and Hildebrandt and McKenzie (2005)).
Following these sets of influential work, we therefore used the historic state-level
migration rates as an instrument for current migration duration. In particular, we use the
Indian migration rates from data collected in 1991 census at the state level and use this
variable as an instrument in which the household is currently located.
These historic migration rates can be argued to be the result of the massive
development of railroad and other transportation system in India coupled with rapid
economic expansion of large cities which created extended job demand. These historic
20
migration rates can also be considered as signal of migration friendliness, strong migration
networks which can effectively lower the cost of migration and increase the survival for
future potential migrants, they become self-perpetuating, and as a result, continue to
influence the migration decisions of households today.
Our identifying assumption is that historic state-level migration rates do not affect the
current job placement of the individuals, apart from their influence through current migration.
Instrumental variables estimation relies on this exogeneity assumption, and so it is important
to consider and counteract potential threats to its validity.
One potential threat is that historic level of inequality and lower economic class
(lower caste and religious group) could induce the historic migration rate and is also
influencing the current one due to intergenerational transition. To tackle these potential
pitfalls we also used interaction terms of historic migration rate with the caste dummies as
additional instruments.4 We have also controlled for City and District level fixed effects to
control for spatial differences and location preferences and report our results based on
standard errors clustered at the state level to correct for arbitrary correlation in the error
structure of individuals within a state (McKenzie et al. 2012).
As our main outcome of interest is whether migrants use the informal sector as their
temporary base (like a stepping stone), we studied the impact of migration duration of
individuals on their placement in the informal sector. The reduced form IV approach consists
of estimating a two-stage model of the following form, where Ij is the outcome variable of
interest (individual j’s current employment sector), Mjk is individuals j’s migration duration
who is currently staying at State k (years of migration from the origin), and Zk is the set of
instrumental variables. Hence the reduced-form first stage equation for migration 𝑀𝑗𝑘 ,
following Amemiya (1978), would be:
𝑀𝑗𝑘∗ = 𝛽0 + 𝛽1𝑍𝑘 + 𝛽2𝑋𝑗𝑘 + 𝛾𝑘𝑚 + 𝜖𝑗𝑘𝑚, (1)
𝑀𝑗𝑘 = �𝑀𝑗𝑘, 𝑖𝑓 𝑀𝑗𝑘∗ > 𝑀0
0, 𝑖𝑓 𝑀𝑗𝑘∗ ≤ 𝑀0 ,
and the equation for employment at the informal sector 𝐼𝑗𝑘 is
𝐼𝑖𝑘∗ = 𝛼0 + 𝛼1𝑀𝑗𝑘 + 𝛽2𝑋𝑗𝑘 + 𝛾𝑘𝑖 + 𝜖𝑗𝑘𝑖 , (2)
4 For robustness check we have run regressions without land holding variables and our regression remained consistent.

21
𝐼𝑗𝑘 = �1, 𝑖𝑓 𝐼𝑗𝑘∗ < 𝐼00, 𝑖𝑓 𝐼𝑗𝑘∗ ≥ 𝐼0
.
Here 𝑀𝑗𝑘∗ is the latent variable for migration decision and 𝑀𝑗𝑘 is the observed years of
migration duration to the current state k from origin once individual j decides to migrate to
state k by comparing the costs and benefits using a net benefit function or latent index
expressed in equation (1). Similarly, 𝐼𝑖𝑘∗ is the latent job placement and 𝐼𝑗𝑘 is dummy of job
placement at the formal and informal sector for the same individual j living in state k which
can be seen arising comparing the job qualifications and job related network information (like
informal or formal referral system) required for the job placement expressed in equation (2).
In this set-up the first dependent variable, 𝑀𝑗𝑘 appears in the second equation as an
endogenous variable. Here, Xjk includes the following set of controls: personal and household
characteristics, family background information, family composition information, religion, and
a dummy variable indicating whether the person is an urban native or not (the dummy is
equal to one if the individual i who currently resides in state k is born in urban area and zero
if the person is a rural to urban migrant). Personal characteristics include age, age2, sex,
education and marital information whereas household characteristics include wealth status of
the household which has been constructed using the principal component analysis of the
household non-durable assets.5 Family background information contains variables on father’s
education and occupation history. 𝛾𝑘𝑀 and 𝛾𝑘𝐼 are unmeasured determinants of 𝑀𝑖𝑘 (for
example migrant's own community network) and 𝐼𝑖𝑘 that is fixed at the state level (for
example state's specialization in particular occupational sector). 𝑀0 and 𝐼0 are unknown
thresholds. Finally, 𝜖𝑖𝑘𝑀 and 𝜖𝑖𝑘𝐼 are non-systematic errors which follow 𝐸(𝜖𝑖𝑘𝑀|𝑋𝑖𝑘,𝑍𝑘, 𝛾𝑘𝑀) =
0 and (𝜖𝑖𝑘𝐼 �𝑋𝑖𝑘, 𝛾𝑘𝐼) = 0.
Given the setup of binary outcomes with a continuous endogenous variable, we use
maximum-likelihood to estimate a multivariate probit model, which we will refer by
following common practice to mention it as IV-Probit model.6
5 This variable ranks 1 to 6, where rank 1 being the lowest total asset value of household non-durables being less than 500 rupees whereas rank 6 being asset values more than 20,000 rupees. On 12th March 2013 exchange rates were:100 INR=1.84 USD.
6 Estimations were carried out by using the IVProbit command with MLE option in STATA version 11.2

22
5.2 Estimation
As discussed above we estimated limited information maximum likelihood model for the
probability of an individual being in the informal sector as a function of the duration of
migration (for rural to urban migrants), demographic characteristics, household
characteristics, religion and family background information in Table 4. In addition we include
district and city level fixed effects to capture unobserved geographical and regional impacts
on an individual's job placement in the informal sector. To show consistency and robustness
of our regressions, we have estimated the same specification with standard errors clustered at
the state level using the full sample (column 1) as well different subsamples like males with
age cut-offs between 15 to 65 years (column 3) and only with males (column 5). In all
regressions, using different sub-samples, our results are largely consistent and none of the
variables changed sign. We have also reported the marginal effects of all estimations in the
respective sub-sample estimations in columns 2, 4 and 6 respectively. To show consistency in
our estimation, we have also estimated a simple probit model without treating the duration of
migration as endogenous in column 7. The probit result shows a small and negative but
statistically weak significance of migration duration on probability of someone being in the
informal sector. Once we instrument for migration duration in columns 1 to 6, however, these
effects become larger and statistically more significant.
23
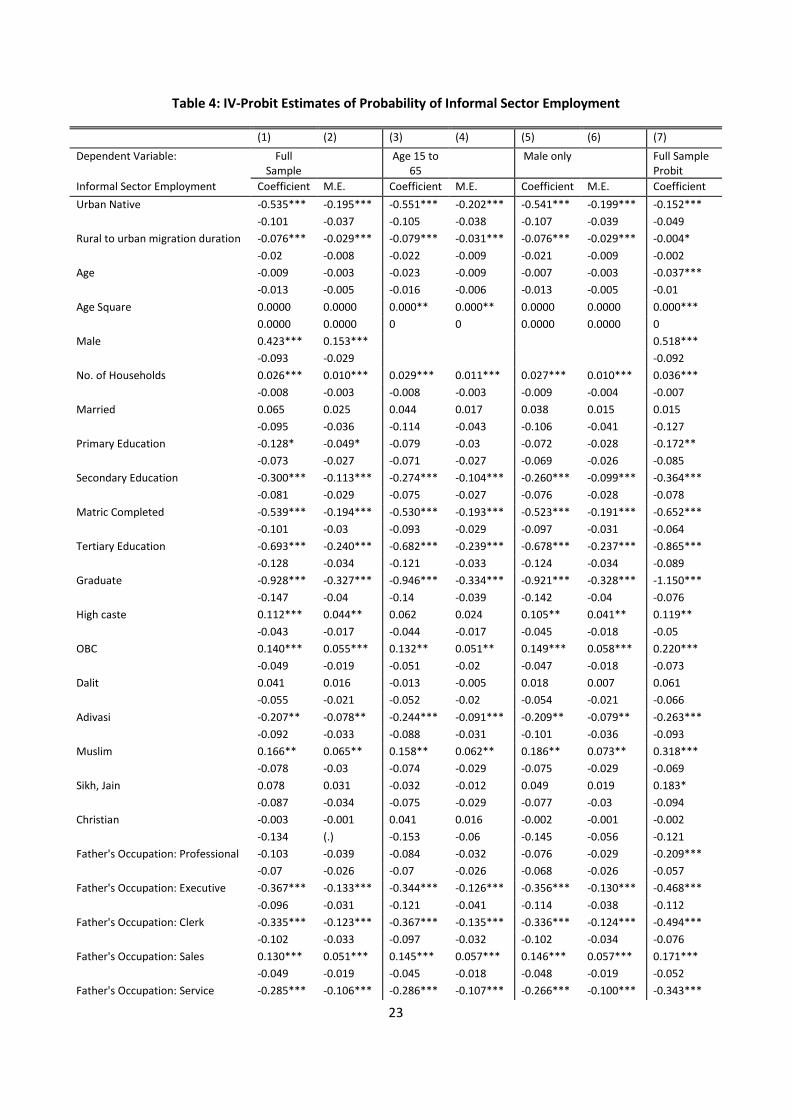
Table 4: IV-Probit Estimates of Probability of Informal Sector Employment
(1) (2) (3) (4) (5) (6) (7)
Dependent Variable: Full Sample
Age 15 to 65
Male only Full Sample Probit
Informal Sector Employment Coefficient M.E. Coefficient M.E. Coefficient M.E. Coefficient Urban Native -0.535*** -0.195*** -0.551*** -0.202*** -0.541*** -0.199*** -0.152***
-0.101 -0.037 -0.105 -0.038 -0.107 -0.039 -0.049 Rural to urban migration duration -0.076*** -0.029*** -0.079*** -0.031*** -0.076*** -0.029*** -0.004*
-0.02 -0.008 -0.022 -0.009 -0.021 -0.009 -0.002 Age -0.009 -0.003 -0.023 -0.009 -0.007 -0.003 -0.037***
-0.013 -0.005 -0.016 -0.006 -0.013 -0.005 -0.01 Age Square 0.0000 0.0000 0.000** 0.000** 0.0000 0.0000 0.000***
0.0000 0.0000 0 0 0.0000 0.0000 0 Male 0.423*** 0.153*** 0.518***
-0.093 -0.029 -0.092 No. of Households 0.026*** 0.010*** 0.029*** 0.011*** 0.027*** 0.010*** 0.036***
-0.008 -0.003 -0.008 -0.003 -0.009 -0.004 -0.007 Married 0.065 0.025 0.044 0.017 0.038 0.015 0.015
-0.095 -0.036 -0.114 -0.043 -0.106 -0.041 -0.127 Primary Education -0.128* -0.049* -0.079 -0.03 -0.072 -0.028 -0.172**
-0.073 -0.027 -0.071 -0.027 -0.069 -0.026 -0.085 Secondary Education -0.300*** -0.113*** -0.274*** -0.104*** -0.260*** -0.099*** -0.364***
-0.081 -0.029 -0.075 -0.027 -0.076 -0.028 -0.078 Matric Completed -0.539*** -0.194*** -0.530*** -0.193*** -0.523*** -0.191*** -0.652***
-0.101 -0.03 -0.093 -0.029 -0.097 -0.031 -0.064 Tertiary Education -0.693*** -0.240*** -0.682*** -0.239*** -0.678*** -0.237*** -0.865***
-0.128 -0.034 -0.121 -0.033 -0.124 -0.034 -0.089 Graduate -0.928*** -0.327*** -0.946*** -0.334*** -0.921*** -0.328*** -1.150***
-0.147 -0.04 -0.14 -0.039 -0.142 -0.04 -0.076 High caste 0.112*** 0.044** 0.062 0.024 0.105** 0.041** 0.119**
-0.043 -0.017 -0.044 -0.017 -0.045 -0.018 -0.05 OBC 0.140*** 0.055*** 0.132** 0.051** 0.149*** 0.058*** 0.220***
-0.049 -0.019 -0.051 -0.02 -0.047 -0.018 -0.073 Dalit 0.041 0.016 -0.013 -0.005 0.018 0.007 0.061
-0.055 -0.021 -0.052 -0.02 -0.054 -0.021 -0.066 Adivasi -0.207** -0.078** -0.244*** -0.091*** -0.209** -0.079** -0.263***
-0.092 -0.033 -0.088 -0.031 -0.101 -0.036 -0.093 Muslim 0.166** 0.065** 0.158** 0.062** 0.186** 0.073** 0.318***
-0.078 -0.03 -0.074 -0.029 -0.075 -0.029 -0.069 Sikh, Jain 0.078 0.031 -0.032 -0.012 0.049 0.019 0.183*
-0.087 -0.034 -0.075 -0.029 -0.077 -0.03 -0.094 Christian -0.003 -0.001 0.041 0.016 -0.002 -0.001 -0.002
-0.134 (.) -0.153 -0.06 -0.145 -0.056 -0.121 Father's Occupation: Professional -0.103 -0.039 -0.084 -0.032 -0.076 -0.029 -0.209***
-0.07 -0.026 -0.07 -0.026 -0.068 -0.026 -0.057 Father's Occupation: Executive -0.367*** -0.133*** -0.344*** -0.126*** -0.356*** -0.130*** -0.468***
-0.096 -0.031 -0.121 -0.041 -0.114 -0.038 -0.112 Father's Occupation: Clerk -0.335*** -0.123*** -0.367*** -0.135*** -0.336*** -0.124*** -0.494***
-0.102 -0.033 -0.097 -0.032 -0.102 -0.034 -0.076 Father's Occupation: Sales 0.130*** 0.051*** 0.145*** 0.057*** 0.146*** 0.057*** 0.171***
-0.049 -0.019 -0.045 -0.018 -0.048 -0.019 -0.052 Father's Occupation: Service -0.285*** -0.106*** -0.286*** -0.107*** -0.266*** -0.100*** -0.343***

24
-0.069 -0.023 -0.075 -0.026 -0.071 -0.025 -0.055 Father's Occupation: Agro 0.036 0.014 0.018 0.007 0.042 0.016 -0.241***
-0.11 -0.043 -0.107 -0.042 -0.111 -0.043 -0.044 Father's Education: Primary -0.117*** -0.045*** -0.120*** -0.046*** -0.119*** -0.046*** -0.131***
-0.034 -0.013 -0.039 -0.015 -0.036 -0.014 -0.037 Father's Education: Secondary -0.170*** -0.065*** -0.172*** -0.066*** -0.168*** -0.065*** -0.185***
-0.045 -0.016 -0.044 -0.016 -0.044 -0.016 -0.045 Father's Education: Tertiary -0.257*** -0.096*** -0.293*** -0.109*** -0.259*** -0.097*** -0.330***
-0.094 -0.032 -0.09 -0.031 -0.099 -0.034 -0.073 Father's Education: Graduation -0.311*** -0.115*** -0.314*** -0.116*** -0.319*** -0.118*** -0.334***
-0.095 -0.032 -0.095 -0.032 -0.093 -0.032 -0.101 Asset Status (1 to 6) -0.120*** -0.046*** -0.132*** -0.051*** -0.123*** -0.048*** -0.148***
-0.03 -0.011 -0.03 -0.011 -0.031 -0.012 -0.023 City Dummies Yes Yes Yes Yes District Dummies Yes Yes Yes Yes Observations 10,521 9,685 9,668 10,521 Log Pseudo-likelihood -42761 -38409 -39067 -5754 chi2 29420 672226 57984 Wald test of Exogeneity 6.579*** 5.506*** 6.38*** F-Statistics at First Stage 31.77*** 29.38*** 30.00 H0: Coefficient of IVs are zero 66.88*** 58.92*** 49.44*** Source: Indian Human Development Survey 2005: Authors own Calculations. Notes: Standard errors in parentheses, adjusted for clustering at the State Level. Significance code: * p<0.1, ** p<0.05, *** p<0.01. M.E. Stands for Marginal Effects which have been calculated at the mean. In all these specifications, we are considering only those as migrant who have migrated from rural to urban areas for jobs. Those who were born in urban setup and migrated to another urban area for job are not considered as migrants. Best specification is column (1). Estimations used in column 1-6 are based on Maximum Likelihood (MLE). The instruments used in the first stage of the regressions are historic state-level migration rate and interaction of the variable with Caste Dummies.
We would expect the higher the education of an individual, the lower the probability
of belonging to the informal sector. The evidence, see Table 4, shows clearly that the higher
the level of education of the household head the lower the probability of being in the informal
sector, and the coefficients get smaller (bigger in absolute value) respectively. The results for
father’s education are very similar to the household head’s education levels. Further, we
would expect that if the father of the individual was of a higher social class (in terms of
occupation), the probability of being in the informal sector would be lower. Again the
evidence supports the view that the parent’s occupation clearly influences an individual’s
employment placement: if the father’s occupation is formal in nature like Executive or Clerk,
the probability of being in the informal sector is lower, while if the father’s occupation is
Sales (which is mostly informal in nature in the Indian context), then there is a higher
probability of being in the informal sector. As discussed earlier we would expect a person
from a socially disadvantaged caste, or religion would be more likely be in the informal
sector: we find that OBC (Other Backward Classes) and Muslims are more likely to be in the
informal sector. We did not find any statistically significance for Dalits (the lower social

25
castes) in the informal sector compared with Brahmins which may be attributable to the
government’s positive discrimination in employment in the Government sector (reservation
system) for Dalits. As we would expect the wealthier the household head, the less likely s/he
would be in the informal sector. Our results suggest that urban natives are more likely to be in
the formal sector as they have more access to better schools, social networks and job
information and referrals compared with the rural to urban migrants. Our main variable of
interest is Rural Migration Duration: in all cases it is negative and significant at the 1 % level.
In other words, the longer a rural migrant has been in the urban area the less likely an
individual would be in the informal sector and would have moved to the formal sector. (Note
the rural migration duration variable has been instrumented).
The validity of IV estimations depends on the power of instruments in explaining the
predicted values at the first stage. As reported, all the first stage regressions have very high F-
statistics (for example for our preferred specification of column 1, the first stage F-statistic is
31.77). We have also tested for the joint significance of our IVs and the results are
overwhelmingly in rejection of the null of no joint significance. The Wald statistic of the
exogeneity test has rejected the null hypothesis of no endogeneity. We have also tested the
instruments using the typical 2SLS models to test for over-identification test (Anderson
canonical correlations test) and under-identification test (Sargan-Hansen test) which have
duly supported our instruments.
6.0 Multinomial Estimation (Formal, Self-Employed, and Informal Wage)
In this section we have separated the Informal sector into those who are self-employed and
those who work in the informal or formal sectors as wage labourers to check if whether
highly qualified individuals are employed in the formal sector or not and also to check if
migrants use the informal sector as their temporary base by employing a multinomial logit
job attainment model following the work of Xin Meng (2001).
6.1 Econometrics
Standard neo-classical economic rationality of individual’s job placement (labour
supply) is a function of individual endowments and human resources (for example level of
education and experience). However, other related factors that could also have an impact on
an individual’s labour supply, especially in the context of India, could be the family size
26
(Brown at el. 1980), family background, Caste and Religious affiliation (for example see
Banerjee and Knight (1985) or Ito (2009). Another less frequently studied factor that might
be critical is the job related network, for example, job-opening information, formal and
informal channels of job search and referral (for example see Holzer 1987 or Calvó-
Armengol, A., & Zenou, Y. (2005)). Since urban natives usually have a better endowment of
job-related networks and referrals, we could hypothesise that migrants will acquire access to
such networks as their migration duration increases and hence are less likely to be in informal
wage labour.
A multinomial logit model is specified below to capture how these variables will
influence an individual j’s probability of working in sector s. Formally the model is:
𝑃𝑗𝑠 = 𝑝𝑟𝑜𝑏�𝑦𝑗 = 𝑠𝑒𝑐𝑡𝑜𝑟𝑠� = 𝑒𝑥𝑗′ 𝛽𝑠
� 𝑒𝑥𝑗′𝛽𝑙
𝑆
𝑠=1
𝑗 = 1, … … ,𝑁; 𝑠 = 1, … … , 𝑆. (3)
Where N is the size of the sample, S is the number of sectors and xj is a vector of variables
affecting the labour placement outcome yj. The dependent variable yj for equation (3) is the
nature of an individual’s current job in either of the three sectors; Formal sector, Self-
employment or Informal wage labour sector. Our main variable of interest, years of migration
duration is endogenous in nature. Hence to allow for the endogeneity in estimating equation
(3), we first used the fitted value of migration duration using all the instruments (estimation
done through OLS). In the second step we used the fitted value of the migration duration in
equation 3. The standard errors of the estimates in the second step have been estimated
through a bootstrapping process with 100 replications.
6.2 Estimations
The results of marginal effects of endogenous multinomial probit estimations have
been reported in Table 5 (with full sample) and in Table 6 with male only sub-sample. The
dependent variable has been categorized into three groups; where Formal sector employment
has been used as a base category.
Tables 5 and 6 are broadly similar to those reported in the section 5 of IV-probit
model (Table 4). For both the Self-Employed and Informal Wage labour, education, father’s
characteristics, and caste and religion coefficients have essentially the same signs and
significance. The main point of difference is that the duration of a rural migrant does not
significantly influence the probability of being in the self-employed sector, but is negative
27
and significant for the informal wage labour sector. In other words, we find that the longer a
rural migrant has been in the urban sector the less likely he would be in informal wage
employment. For instance, an individual with one additional year’s of migration duration
from the rural area reduces his/her probability to be in the informal wage employment by
2.52%, however this variable has no statistically discernible effect on him/her being in the
self-employed or formal sector. Results on education are consistent with the other findings
that with more years of education, individuals will be less likely to be in the informal sector.
In case of self employment, the education level up to tertiary level does not have any
statistically significant impact, however, for tertiary level education and higher, the
probability of someone being in the self-employment reduces significantly.

28
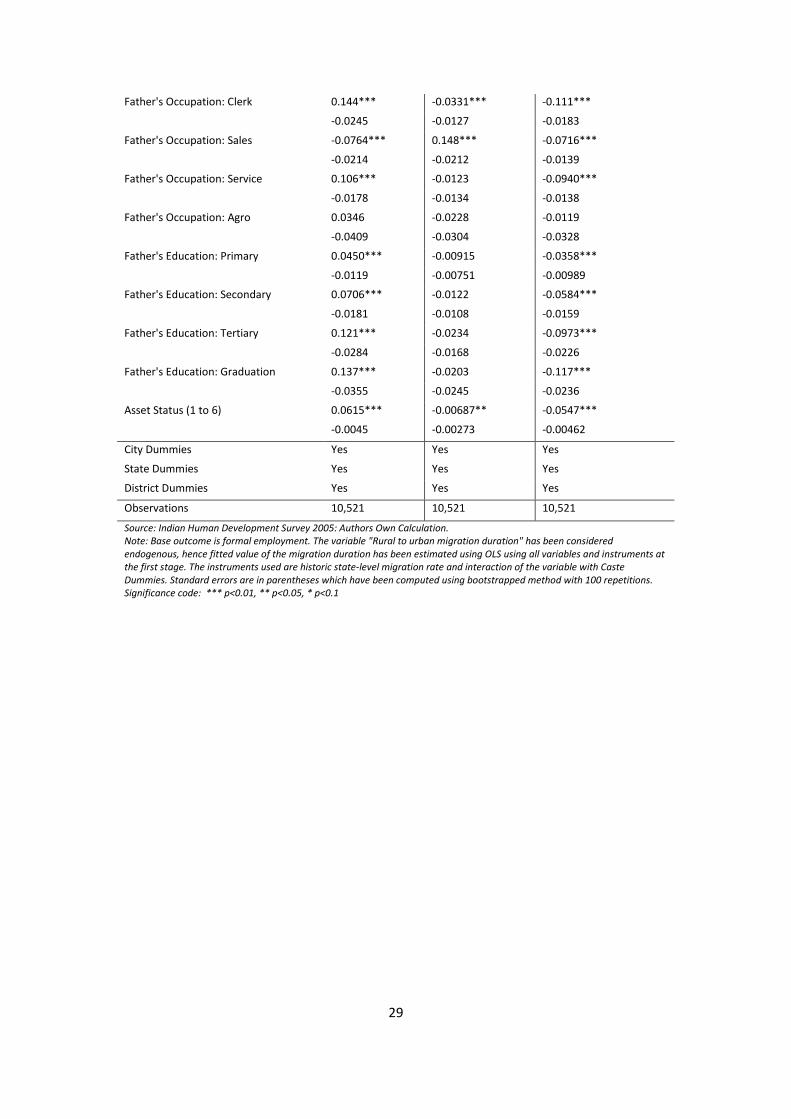
Table 5: Marginal effects of Multinomial Logit regression (Full sample)
(1) (2) (3)
VARIABLES Formal Self-employment Informal Wage Labour
Urban Native 0.0466*** -0.00768 -0.0389***
-0.0134 -0.00815 -0.0119
Rural to urban migration duration 0.0169 0.00723 -0.0241**
-0.013 -0.0104 -0.0104
Age 0.00770** -0.00319 -0.00451
-0.00384 -0.00324 -0.00347
Age Square -8.11e-05*** 3.34E-05 4.77e-05*
-2.80E-05 -2.14E-05 -2.74E-05
Male -0.171*** 0.0614*** 0.110***
-0.0156 -0.00812 -0.0137
No. of Households -0.0152*** 0.0018 0.0134***
-0.00271 -0.00172 -0.00219
Married 0.00122 -0.0383 0.037
-0.0493 -0.0377 -0.0294
Primary Education 0.0319 0.0308* -0.0627***
-0.0253 -0.0183 -0.0159
Secondary Education 0.0935*** 0.0252* -0.119***
-0.0211 -0.0141 -0.0128
Matric Completed 0.179*** 0.00299 -0.182***
-0.0187 -0.0127 -0.0112
Tertiary Education 0.218*** -0.0103 -0.208***
-0.0178 -0.0133 -0.0106
Graduate 0.339*** -0.0396*** -0.300***
-0.0172 -0.0117 -0.0136
High caste -0.0474* 0.0238 0.0235
-0.0249 -0.0159 -0.0219
OBC -0.0743*** 0.0322** 0.0421*
-0.0248 -0.0147 -0.0232
Dalit -0.0177 -0.0372*** 0.0549**
-0.0275 -0.0111 -0.0262
Adivasi 0.0571* -0.0288 -0.0283
-0.0347 -0.0208 -0.0289
Muslim -0.115*** 0.0415* 0.0737***
-0.0289 -0.023 -0.026
Sikh, Jain -0.0473 0.0457 0.00166
-0.0443 -0.0318 -0.0446
Christian 0.0358 -0.0655 0.0297
-0.065 -0.0661 -0.0441
Father's Occupation: Professional 0.0505** 0.00458 -0.0551***
-0.0243 -0.0173 -0.0178
Father's Occupation: Executive 0.144*** -0.0153 -0.129***
-0.0333 -0.0252 -0.0243
29
Father's Occupation: Clerk 0.144*** -0.0331*** -0.111***
-0.0245 -0.0127 -0.0183
Father's Occupation: Sales -0.0764*** 0.148*** -0.0716***
-0.0214 -0.0212 -0.0139
Father's Occupation: Service 0.106*** -0.0123 -0.0940***
-0.0178 -0.0134 -0.0138
Father's Occupation: Agro 0.0346 -0.0228 -0.0119
-0.0409 -0.0304 -0.0328
Father's Education: Primary 0.0450*** -0.00915 -0.0358***
-0.0119 -0.00751 -0.00989
Father's Education: Secondary 0.0706*** -0.0122 -0.0584***
-0.0181 -0.0108 -0.0159
Father's Education: Tertiary 0.121*** -0.0234 -0.0973***
-0.0284 -0.0168 -0.0226
Father's Education: Graduation 0.137*** -0.0203 -0.117***
-0.0355 -0.0245 -0.0236
Asset Status (1 to 6) 0.0615*** -0.00687** -0.0547***
-0.0045 -0.00273 -0.00462
City Dummies Yes Yes Yes
State Dummies Yes Yes Yes
District Dummies Yes Yes Yes
Observations 10,521 10,521 10,521
Source: Indian Human Development Survey 2005: Authors Own Calculation. Note: Base outcome is formal employment. The variable "Rural to urban migration duration" has been considered endogenous, hence fitted value of the migration duration has been estimated using OLS using all variables and instruments at the first stage. The instruments used are historic state-level migration rate and interaction of the variable with Caste Dummies. Standard errors are in parentheses which have been computed using bootstrapped method with 100 repetitions. Significance code: *** p<0.01, ** p<0.05, * p<0.1
30
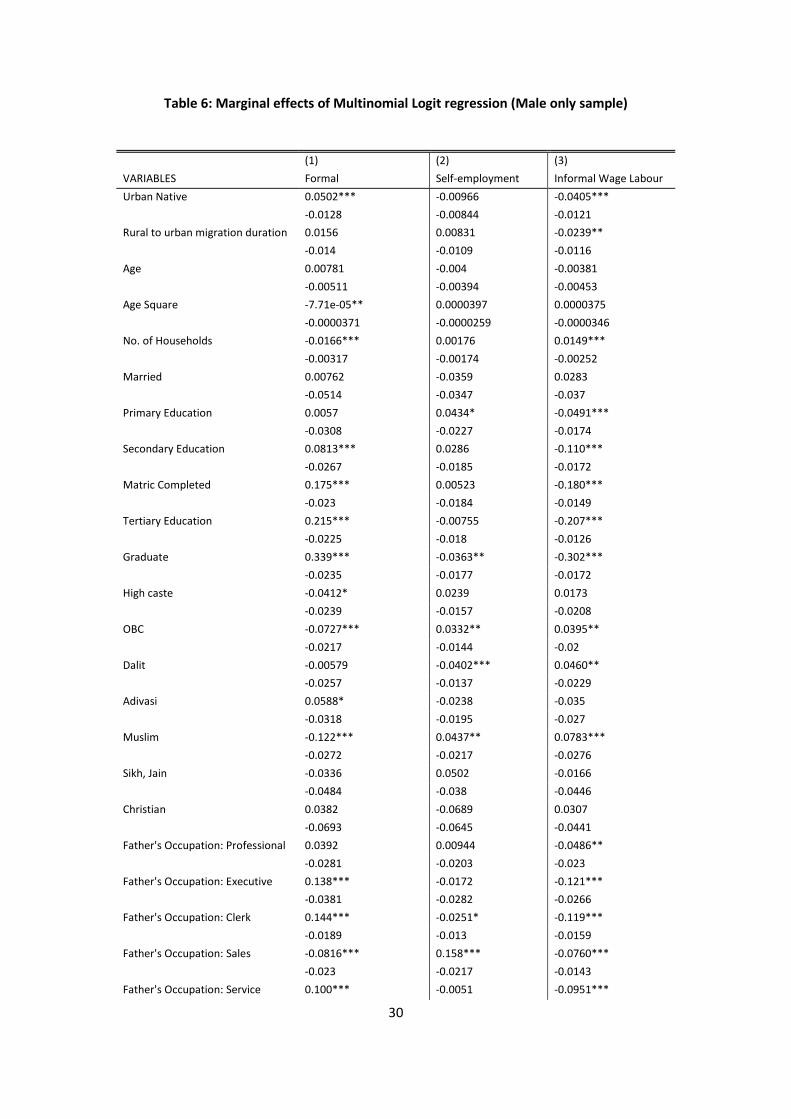
Table 6: Marginal effects of Multinomial Logit regression (Male only sample)
(1) (2) (3) VARIABLES Formal Self-employment Informal Wage Labour Urban Native 0.0502*** -0.00966 -0.0405*** -0.0128 -0.00844 -0.0121 Rural to urban migration duration 0.0156 0.00831 -0.0239** -0.014 -0.0109 -0.0116 Age 0.00781 -0.004 -0.00381 -0.00511 -0.00394 -0.00453 Age Square -7.71e-05** 0.0000397 0.0000375 -0.0000371 -0.0000259 -0.0000346 No. of Households -0.0166*** 0.00176 0.0149*** -0.00317 -0.00174 -0.00252 Married 0.00762 -0.0359 0.0283 -0.0514 -0.0347 -0.037 Primary Education 0.0057 0.0434* -0.0491*** -0.0308 -0.0227 -0.0174 Secondary Education 0.0813*** 0.0286 -0.110*** -0.0267 -0.0185 -0.0172 Matric Completed 0.175*** 0.00523 -0.180*** -0.023 -0.0184 -0.0149 Tertiary Education 0.215*** -0.00755 -0.207*** -0.0225 -0.018 -0.0126 Graduate 0.339*** -0.0363** -0.302*** -0.0235 -0.0177 -0.0172 High caste -0.0412* 0.0239 0.0173 -0.0239 -0.0157 -0.0208 OBC -0.0727*** 0.0332** 0.0395** -0.0217 -0.0144 -0.02 Dalit -0.00579 -0.0402*** 0.0460** -0.0257 -0.0137 -0.0229 Adivasi 0.0588* -0.0238 -0.035 -0.0318 -0.0195 -0.027 Muslim -0.122*** 0.0437** 0.0783*** -0.0272 -0.0217 -0.0276 Sikh, Jain -0.0336 0.0502 -0.0166 -0.0484 -0.038 -0.0446 Christian 0.0382 -0.0689 0.0307 -0.0693 -0.0645 -0.0441 Father's Occupation: Professional 0.0392 0.00944 -0.0486** -0.0281 -0.0203 -0.023 Father's Occupation: Executive 0.138*** -0.0172 -0.121*** -0.0381 -0.0282 -0.0266 Father's Occupation: Clerk 0.144*** -0.0251* -0.119*** -0.0189 -0.013 -0.0159 Father's Occupation: Sales -0.0816*** 0.158*** -0.0760*** -0.023 -0.0217 -0.0143 Father's Occupation: Service 0.100*** -0.0051 -0.0951***

31
-0.0214 -0.0122 -0.0156 Father's Occupation: Agro 0.0377 -0.0239 -0.0138 -0.0442 -0.0322 -0.0351 Father's Education: Primary 0.0455*** -0.0101 -0.0354*** -0.0134 -0.00814 -0.0116 Father's Education: Secondary 0.0700*** -0.0131 -0.0570*** -0.017 -0.0128 -0.0136 Father's Education: Tertiary 0.123*** -0.025 -0.0983*** -0.0282 -0.0171 -0.0231 Father's Education: Graduation 0.141*** -0.0205 -0.121*** -0.0319 -0.0223 -0.0273 Asset Status (1 to 6) 0.0632*** -0.00656** -0.0567*** -0.00527 -0.00297 -0.0047
City Dummies Yes Yes Yes State Dummies Yes Yes Yes District Dummies Yes Yes Yes Observations 9668 9668 9668 Source: Indian Human Development Survey 2005: Authors Own Calculation. Note: Base outcome is formal employment. The variable "Rural to urban migration duration" has been considered endogenous, hence fitted value of the migration duration has been estimated using OLS using all variables and instruments at the first stage. The instruments used are historic state-level migration rate and interaction of the variable with Caste Dummies. Standard errors are in parentheses which have been computed using bootstrapped method with 100 repetitions. Significance code: *** p<0.01, ** p<0.05, * p<0.1
The validity of multinomial regression lies on the strong assumption of Independence
of Irrelevant Alternatives (IIA) assumption, which means that adding or deleting alternative
outcome categories does not affect the odds among the remaining outcomes. To check
whether this assumption holds in our case, we have performed the test for the IIA assumption
and we find no evidence of violating the assumption (using full sample specification of Table
5).
6. Conclusions
In our paper we have used the definition of migrants as those individuals who have
migrated from rural to urban areas. Those who were born in urban areas and migrated to
another urban area are not considered as migrants.7 Also note that in our multinomial logit
regressions, for the sake of simplicity of estimation, we used only the rural to urban migration
duration as endogenous and properly took care of such endogenous regression by using
Instruments to predict the fitted value of the variable and plugged in the fitted value in the
7 Those who were born in other countries are not part of the sample in our estimations.
32
final Multinomial regression. One could, however, argue that urban to urban migration could
also be endogenous. We have also used urban to urban migration as endogenous in separate
regression estimations in the multinomial logit framework (not reported) and in linear
probability model and in both cases the variable was insignificant and does not appear to be
influential in explaining the likelihood of the placement in the informal labour market.
In this paper we have argued that there are segmented labour markets in the urban
sector: people who are from the lower social classes (castes or religions) are more likely to
work in the informal sector. We found that getting more education is one way of getting a job
in the formal sector, but perhaps more importantly family networks provide an entry into the
formal labour market. We argued that when rural migrants move to the urban sector they
initially find themselves working in the informal sector where they have lower incomes and
work in industries like Construction, Manufacturing, Wholesale, Retail trades, Restaurants
and Hotels, Transport, and Social and Personal services. Their occupations are mainly in the
lower social grades: production and related workers, transport etc., and labourers; and Sales
and Service workers. We noted that caste and religion was important: the principal source of
incomes of Dalits and Muslims was Non-Agricultural labour or Artisans. Brahmins and High
caste people are more likely to be in higher level occupations.
We argued that there was a hierarchy of preferences: people would prefer to work in
the formal sector, the self-employed sector, or if not in the informal wage labour market.
However, entry into the formal sector was constrained by education, social class, and family
ties. Self-employment was constrained by access to the credit market.
We estimated a model of the probability of working in the informal sector as a
function of demographic characteristics, education, father’s education and occupation, caste
and religion, and duration of a migrant in the present occupation. We distinguished between
migrants who had come from rural areas from those who had moved from other urban areas.
We treated the duration of the migrant as an endogenous variable and estimated a two stage
least squares model. We found that most of the explanatory variables were significant and of
the expected signs. In particular, we found that education and father’s education and
occupational status were important. Muslims and Other Backward Classes were more likely
to be working in the informal sector.
The most interesting finding of our research is that the longer a rural migrant has been
working in the urban sector, the less likely s/he is to be working in the informal wage sector.
33
The results support the view that, for migrants informal wage labour market may be is a
stepping stone to a better life in the formal sector.
However, using cross-sectional data set to analyse migration and urban employment is
a challenging task. Migrants have a higher attrition probability due to the mobility of the
population. Hence, when a researcher is confronted with a migrant population, it is difficult
to define the population at hand, as there are constant inflows and outflows of individuals
with different traits. Moreover duration raises the possibility of right censoring which could
not be addressed with the data at hand. These results need to be researched further using
panel data, which unfortunately are not available as yet.
34
References
Amemiya, T. 1978. The estimation of a simultaneous equation generalized probit model.
Econometrica 46: 1193–1205.
Banerjee, B., & Knight, J. B. (1985). Caste discrimination in the Indian urban labour
market. Journal of Development Economics, 17(3), 277-307.
Bennett, John and Matthew D. Rablen (2012) “Self-Employment, Wage Employment and
Informality in a Developing Economy”, IZA Discussion Paper No. 6406.
Bromley, Ray (1978) “Introduction-The Urban Informal Sector: Why Is It Worth
Discussing?” World Development, 6 (9/10), 1033-1039.
Brown, R. S., M. Moon and B. S. Zoloth, (1980), Incorporating occupational attainment in
studies of male/female earnings differentials. Journal of Human Resources, 15, pp. 3–28.
Calvó-Armengol, A., & Zenou, Y. (2005). Job matching, social network and word-of-mouth
communication. Journal of Urban Economics, 57(3), 500-522.
De Mel, S., McKenzie, D., & Woodruff, C. (2010). Who are the Microenterprise Owners?
Evidence from Sri Lanka on Tokman versus De Soto. In International Differences in
Entrepreneurship (pp. 63-87). University of Chicago Press.
Fields, G. S. (2009). "Segmented Labor Market Models in Developing Countries." The
Oxford handbook of philosophy of economics: 476-510.
Funkhouser, Edward (1996) “The Urban Informal Sector in Central America: Household
Survey Evidence”, World Development, 24 (11), 1737-1751.
Gerxhani, Klarita (2004) “The informal sector in developed and less developed countries: A
literature survey”, Public Choice, 120, 267-300.
Hanson GH, Woodruff C (2003) Emigration and educational attainment in Mexico. Mimeo,
University of California at San Diego
Hart, Keith (1973) “Informal Income Opportunities and Urban Employment in Ghana’,
Journal of Modern African Studies, 11 (1), 61-89.
35
Hildebrandt N, McKenzie DJ (2005) The effects of migration on child health in Mexico.
Economia 6(1):257–289
Hnatkovska, Viktoria, Amartya Lahiri and Sourabh Paul (2012) “Castes and Mobility”,
American Economic Journal: Applied Economics, 4 (2), 274-307.
Holzer, H. J. (1987). Informal job search and black youth unemployment. The American
Economic Review, 446-452.
International Labour Organisation (1972) Employment, Incomes and Equality: A Strategy for
Increasing Productive Employment in Kenya, ILO, Geneva.
International Labour Organisation (2002) Decent Work and the Informal Economy,
International Labour Conference, Report VI, ILO, Geneva.
Inter-university Consortium for Political and Social Research (2005) India Human
Development Survey (IHDS) 2005, Ann Arbor, Michigan, USA.
Ito, T. (2009). Caste discrimination and transaction costs in the labor market: Evidence from
rural North India. Journal of development Economics, 88(2), 292-300.
López-Córdoba E (2005) Globalization, migration, and development: the role of Mexican
migrant remittances. Economia 6(1):217–256
Madheswaran, S. and Paul Attwell (2007) “Caste Discrimination in the Indian Urban Labour
Market: Evidence from the National Sample Survey”, Economic and Political Weekly, 42
(41), Oct. 13-19, 4146-4153.
Mazumdar, Dipak (1976) “The Urban Informal Sector”, World Development, 4 (8), 655-679.
McKenzie DJ, Rapoport H (2007) Network effects and the dynamics of migration and
inequality: theory and evidence from Mexico. Journal of Development Economics, 84(1):1–
24
McKenzie, D., & Rapoport, H. (2011). Can migration reduce educational attainment?
Evidence from Mexico. Journal of Population Economics, 24(4), 1331-1358.
Meng, Xin (2001) “The Informal Sector and Rural-Urban Migration – A Chinese Case
Study”, Asian Economic Journal, 15 (1), 71-89.

36
Mitra, Arup (2004) “Informal Sector, Networks and Intra-City Variations in Activities:
Findings from Delhi Slums”, The Applied Regional Science Conference, RURDS, 16 (2),
154-169.
Mitra, Arup (2008) The Indian Labour Market: An Overview, ILO Asia-Pacific Working
Paper Series, New Delhi.
National Sample Survey Office (2012) Informal Sector and Conditions of Employment in
India, NSS 66th Round, July 2009-June 2010, National Statistical Organisation, Ministry of
Statistics and Programme Implementation, Government of India.
Rauch, James E. (1991) “Modelling the informal sector formally”, Journal of Development
Economics, 35, 33-47.
Sengupta, Arjun K. (2009) The Challenge of Employment in India: An Informal Economy
Perspective, Report of the National Commission for Enterprises in the Unorganised Sector,
Government of India, Volumes 1 and 2, Academic Foundation, New Delhi.
Thomas, J.J. (1992) Informal Economic Activity, LSE Handbooks in Economics, Harvester
Wheatsheaf, Hemel Hempstead, Herts., UK.
Weeks, John (1975) “Policies for Expanding Employment in the Informal Urban Sector of
Developing Economies”, International Labour Review, 111, 1-13.
Woodruff C, Zenteno RM (2007) Remittances and micro-enterprises in Mexico. Journal of
Development Economics, 82(2):509–528
37
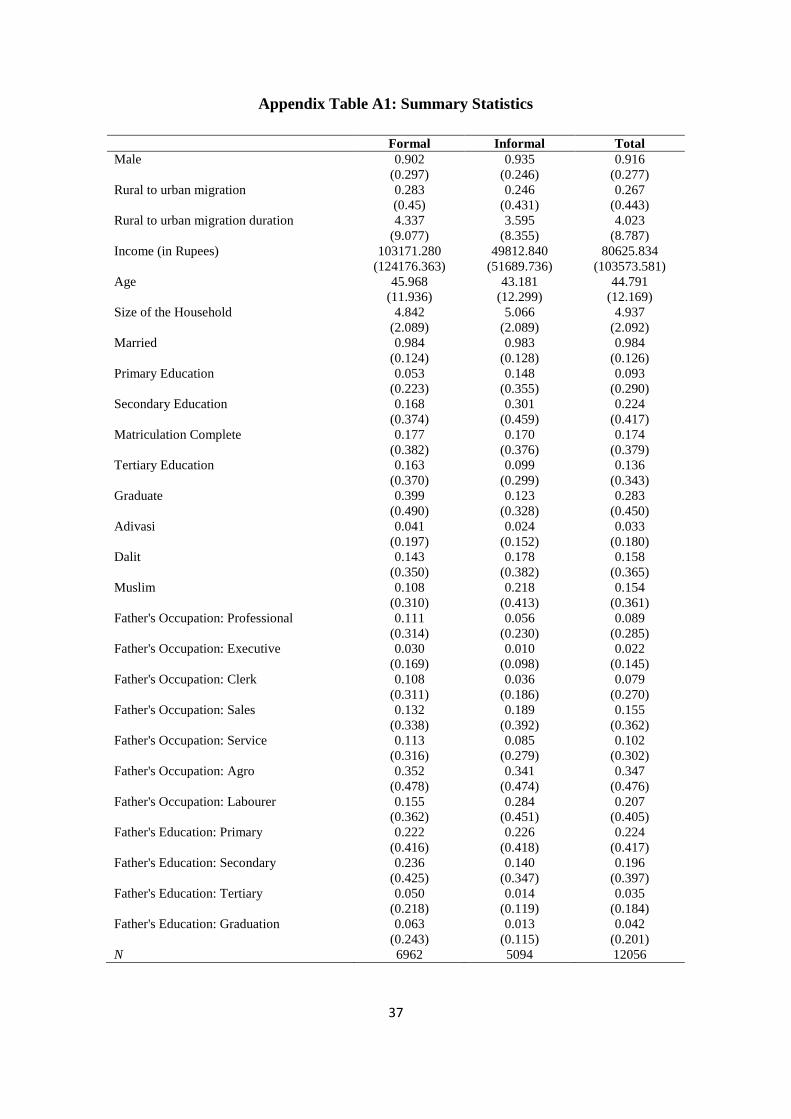
Appendix Table A1: Summary Statistics
Formal Informal Total Male 0.902 0.935 0.916 (0.297) (0.246) (0.277) Rural to urban migration 0.283 0.246 0.267 (0.45) (0.431) (0.443) Rural to urban migration duration 4.337 3.595 4.023 (9.077) (8.355) (8.787) Income (in Rupees) 103171.280 49812.840 80625.834 (124176.363) (51689.736) (103573.581) Age 45.968 43.181 44.791 (11.936) (12.299) (12.169) Size of the Household 4.842 5.066 4.937 (2.089) (2.089) (2.092) Married 0.984 0.983 0.984 (0.124) (0.128) (0.126) Primary Education 0.053 0.148 0.093 (0.223) (0.355) (0.290) Secondary Education 0.168 0.301 0.224 (0.374) (0.459) (0.417) Matriculation Complete 0.177 0.170 0.174 (0.382) (0.376) (0.379) Tertiary Education 0.163 0.099 0.136 (0.370) (0.299) (0.343) Graduate 0.399 0.123 0.283 (0.490) (0.328) (0.450) Adivasi 0.041 0.024 0.033 (0.197) (0.152) (0.180) Dalit 0.143 0.178 0.158 (0.350) (0.382) (0.365) Muslim 0.108 0.218 0.154 (0.310) (0.413) (0.361) Father's Occupation: Professional 0.111 0.056 0.089 (0.314) (0.230) (0.285) Father's Occupation: Executive 0.030 0.010 0.022 (0.169) (0.098) (0.145) Father's Occupation: Clerk 0.108 0.036 0.079 (0.311) (0.186) (0.270) Father's Occupation: Sales 0.132 0.189 0.155 (0.338) (0.392) (0.362) Father's Occupation: Service 0.113 0.085 0.102 (0.316) (0.279) (0.302) Father's Occupation: Agro 0.352 0.341 0.347 (0.478) (0.474) (0.476) Father's Occupation: Labourer 0.155 0.284 0.207 (0.362) (0.451) (0.405) Father's Education: Primary 0.222 0.226 0.224 (0.416) (0.418) (0.417) Father's Education: Secondary 0.236 0.140 0.196 (0.425) (0.347) (0.397) Father's Education: Tertiary 0.050 0.014 0.035 (0.218) (0.119) (0.184) Father's Education: Graduation 0.063 0.013 0.042 (0.243) (0.115) (0.201) N 6962 5094 12056
Related Documents


