Faculty of Business The Influence of Total Quality Management on Project Performance: The Case of Construction Organizations in Malaysia Jong Cherng Yee This thesis is presented for the Degree of Master of Philosophy (Management) of Curtin University June 2018

Welcome message from author
This document is posted to help you gain knowledge. Please leave a comment to let me know what you think about it! Share it to your friends and learn new things together.
Transcript

Faculty of Business
The Influence of Total Quality Management on Project Performance:
The Case of Construction Organizations in Malaysia
Jong Cherng Yee
This thesis is presented for the Degree of
Master of Philosophy (Management)
of Curtin University
June 2018

I
CherngYee
DECLARATION
To the best of my knowledge and belief this thesis contains no material previously
published by any other person except where due acknowledgment has been made.
This thesis contains no material, which has been accepted for the award of any other
degree or diploma in any university.
The research presented and reported in this thesis was conducted in accordance with
the National Health and Medical Research Council National Statement on Ethical
Conduct in Human Research (2007) – updated March 2014. The proposed research
study received human research ethics approval from the Curtin University Human
Research Ethics Committee (EC00262), Approval Number #RDBS-60-15.
Signature:…………………………………
Date:………30 June 2018………………...
II
ABSTRACT
Many studies have suggested the adaptation and implementation of Total Quality
Management (TQM) is likely to improve an organization’s performance. Hence, a
considerable amount of literature has examined the relationship between TQM and
other elements like business performance, organizational performance, and
marketing performance in different industries. However, little is known of the
influence of TQM in project performance in the context of Malaysian construction
organizations. The objective of this study is to examine the relationship between
TQM and project performance in Malaysian construction organizations. A TQM
model was based on the Malcolm Baldridge National Quality Awards (MBNQA) and
the project performance dimensions were developed through a literature review of
previous studies. Data was collected using questionnaires from 161 valid responses
having Grade 7 (G7) in the Construction Industry Development Board (CIDB) list.
The relationships were tested using the Statistical Package for Social Science (SPSS
21.0). Pearson’s correlations and a multiple regression analysis were performed to
investigate the association of TQM practices with project performance. The findings
revealed that TQM practices were partially correlated with project performance of
Malaysian construction organizations. The analysis also found operation focus and
workforce focus were perceived as dominant TQM practices in quality performance.
Academically, this study contributes to the knowledge on TQM and project
performance by providing empirical evidence on TQMs ability to improve the
performance of the Malaysian construction industry. Practically, this study provides
an impetus for industrial practitioners to understand the roles of TQM and its ability
in enhancing project performance.

III
TABLE OF CONTENTS
DECLARATION I
ABSTRACT II
LISTOFTABLES VI
LISTOFFIGURES VIII
LISTOFABBREVIATIONS IX
CHAPTER1 1
INTRODUCTION 11.0 INTRODUCTION 11.1 BACKGROUNDOFTHESTUDY 21.2 NEEDOFRESEARCH 41.3 PROBLEMSTATEMENT 81.4 RESEARCHQUESTIONS 101.5 RESEARCHOBJECTIVES 101.6 GENERALCONCEPTUALFRAMEWORK 111.7 SCOPEOFTHESTUDY 121.8 RESEARCHCONTRIBUTIONS 131.9 ORGANIZATIONOFCHAPTERS 141.10 DEFINITIONOFKEYTERMS 151.11 SUMMARY 16
CHAPTER2 17
MALAYSIANCONSTRUCTIONINDUSTRY 172.0 INTRODUCTION 172.1 OVERVIEWOFTHEMALAYSIANCONSTRUCTIONINDUSTRY(MCI) 172.2 MALAYSIANPROPERTYDEVELOPMENT 222.3 CONSTRUCTIONINDUSTRYDEVELOPMENTBOARD(CIDB) 28
IV
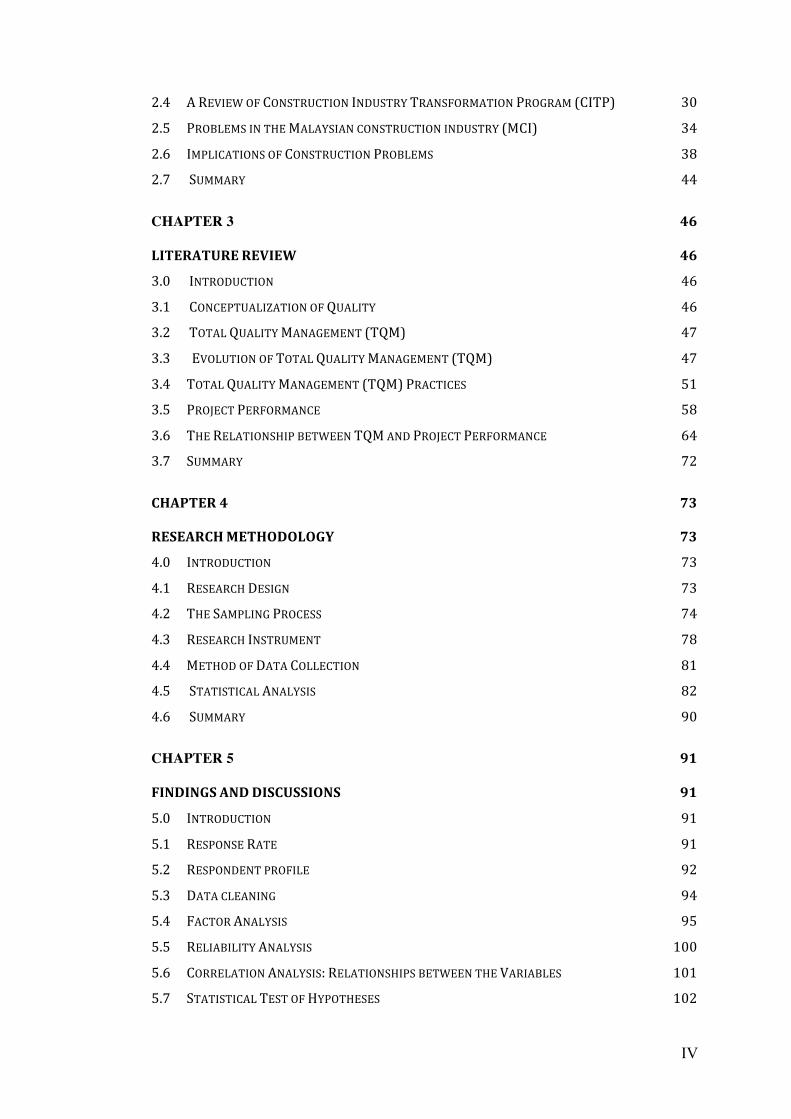
2.4 AREVIEWOFCONSTRUCTIONINDUSTRYTRANSFORMATIONPROGRAM(CITP) 302.5 PROBLEMSINTHEMALAYSIANCONSTRUCTIONINDUSTRY(MCI) 342.6 IMPLICATIONSOFCONSTRUCTIONPROBLEMS 382.7 SUMMARY 44
CHAPTER 3 46
LITERATUREREVIEW 463.0 INTRODUCTION 463.1 CONCEPTUALIZATIONOFQUALITY 463.2 TOTALQUALITYMANAGEMENT(TQM) 473.3 EVOLUTIONOFTOTALQUALITYMANAGEMENT(TQM) 473.4 TOTALQUALITYMANAGEMENT(TQM)PRACTICES 513.5 PROJECTPERFORMANCE 583.6 THERELATIONSHIPBETWEENTQMANDPROJECTPERFORMANCE 643.7 SUMMARY 72
CHAPTER4 73
RESEARCHMETHODOLOGY 734.0 INTRODUCTION 734.1 RESEARCHDESIGN 734.2 THESAMPLINGPROCESS 744.3 RESEARCHINSTRUMENT 784.4 METHODOFDATACOLLECTION 814.5 STATISTICALANALYSIS 824.6 SUMMARY 90
CHAPTER 5 91
FINDINGSANDDISCUSSIONS 915.0 INTRODUCTION 915.1 RESPONSERATE 915.2 RESPONDENTPROFILE 925.3 DATACLEANING 945.4 FACTORANALYSIS 955.5 RELIABILITYANALYSIS 1005.6 CORRELATIONANALYSIS:RELATIONSHIPSBETWEENTHEVARIABLES 1015.7 STATISTICALTESTOFHYPOTHESES 102
V
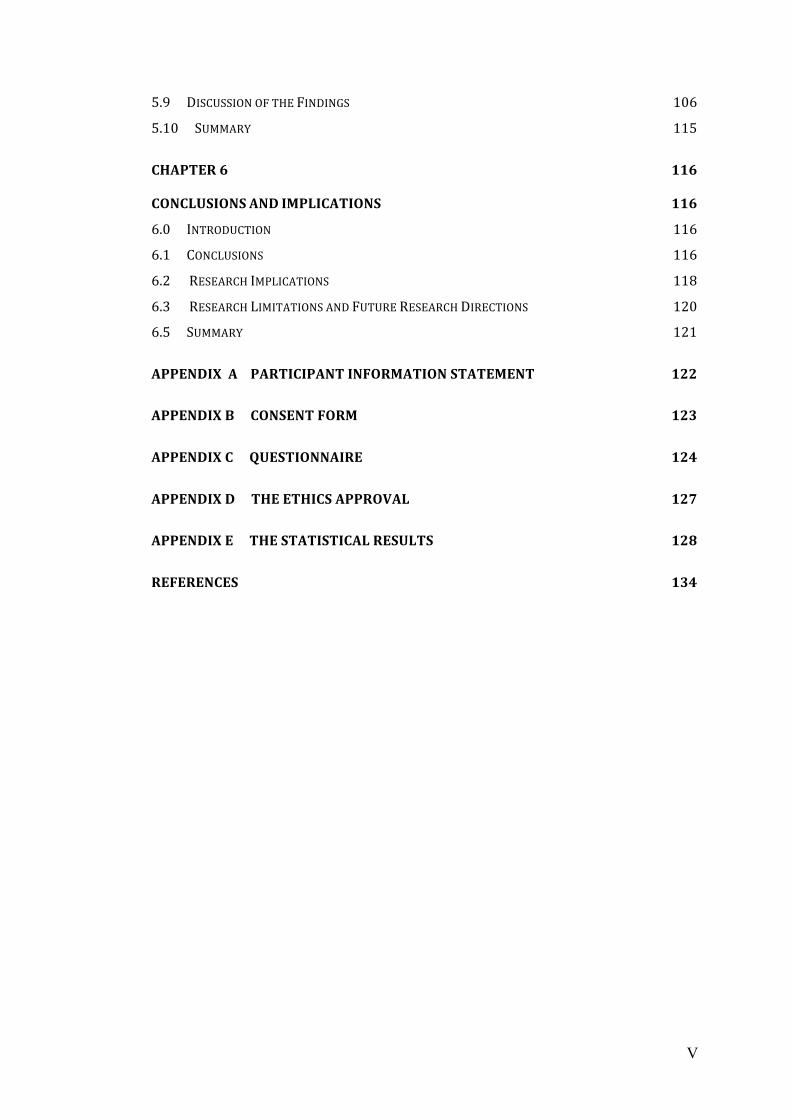
5.9 DISCUSSIONOFTHEFINDINGS 1065.10 SUMMARY 115
CHAPTER6 116
CONCLUSIONSANDIMPLICATIONS 1166.0 INTRODUCTION 1166.1 CONCLUSIONS 1166.2 RESEARCHIMPLICATIONS 1186.3 RESEARCHLIMITATIONSANDFUTURERESEARCHDIRECTIONS 1206.5 SUMMARY 121
APPENDIXA PARTICIPANTINFORMATIONSTATEMENT 122
APPENDIXB CONSENTFORM 123
APPENDIXC QUESTIONNAIRE 124
APPENDIXD THEETHICSAPPROVAL 127
APPENDIXE THESTATISTICALRESULTS 128
REFERENCES 134
VI
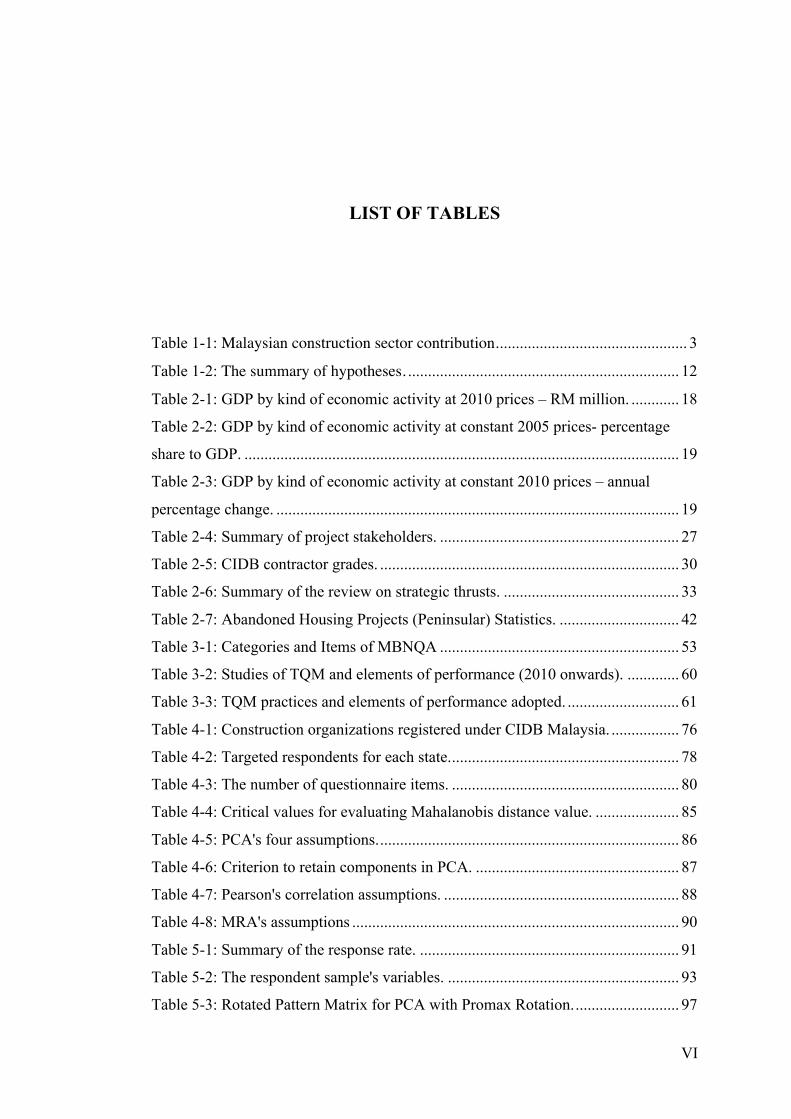
LIST OF TABLES
Table 1-1: Malaysian construction sector contribution. ............................................... 3
Table 1-2: The summary of hypotheses. .................................................................... 12
Table 2-1: GDP by kind of economic activity at 2010 prices – RM million. ............ 18
Table 2-2: GDP by kind of economic activity at constant 2005 prices- percentage
share to GDP. ............................................................................................................. 19
Table 2-3: GDP by kind of economic activity at constant 2010 prices – annual
percentage change. ..................................................................................................... 19
Table 2-4: Summary of project stakeholders. ............................................................ 27
Table 2-5: CIDB contractor grades. ........................................................................... 30
Table 2-6: Summary of the review on strategic thrusts. ............................................ 33
Table 2-7: Abandoned Housing Projects (Peninsular) Statistics. .............................. 42
Table 3-1: Categories and Items of MBNQA ............................................................ 53
Table 3-2: Studies of TQM and elements of performance (2010 onwards). ............. 60
Table 3-3: TQM practices and elements of performance adopted. ............................ 61
Table 4-1: Construction organizations registered under CIDB Malaysia. ................. 76
Table 4-2: Targeted respondents for each state. ......................................................... 78
Table 4-3: The number of questionnaire items. ......................................................... 80
Table 4-4: Critical values for evaluating Mahalanobis distance value. ..................... 85
Table 4-5: PCA's four assumptions. ........................................................................... 86
Table 4-6: Criterion to retain components in PCA. ................................................... 87
Table 4-7: Pearson's correlation assumptions. ........................................................... 88
Table 4-8: MRA's assumptions .................................................................................. 90
Table 5-1: Summary of the response rate. ................................................................. 91
Table 5-2: The respondent sample's variables. .......................................................... 93
Table 5-3: Rotated Pattern Matrix for PCA with Promax Rotation. .......................... 97
VII
Table 5-4: Structure matrix. ....................................................................................... 98
Table 5-5: Factor loadings for project performance. ............................................... 100
Table 5-6: Descriptive statistics of composite variables. ......................................... 100
Table 5-7: Cronbach’s alpha of the various constructs. ........................................... 101
Table 5-8: Pearson's correlation analysis of the main variables. ............................. 102
Table 5-9: Summary of hypotheses. ......................................................................... 102
Table 5-10: Regressions predicting project performance. ....................................... 104
Table 5-11: Summary of the hypotheses and test results. ........................................ 106
Table 5-12: Descriptive analysis of the various TQM constructs. ........................... 107

VIII
LIST OF FIGURES
Figure 1-1: Conceptual framework of the study. ....................................................... 11
Figure 2-1: Number of firms in construction by employee count. ............................. 20
Figure 2-2: Composition of workforce by industry (2013). ....................................... 21
Figure 2-3: Types of Malaysia’s development. .......................................................... 22
Figure 2-4: Forms of land development. .................................................................... 22
Figure 2-5: Diagram of a development process. ........................................................ 24
Figure 2-6: CITP's strategic thrusts. ........................................................................... 31
Figure 2-7: Summary of MCI problems. .................................................................... 36
Figure 2-8: Summary of implications of construction problems. .............................. 43
IX
LIST OF ABBREVIATIONS
BHP Bakun Hydroelectric Project
CIDB Construction Industry Development Board
CIMP Construction Industry Master Plan
CITP Construction Industry Transformation Programme
CSF Critical success factor
EM Expected Maximization
ETP Economic Transformation Program
FA Factor analysis
FTA Free Trade Agreement
GDP Gross Domestic Product
GHC Greenhouse gases
JPA Jabatan Perumahan Negara
KLIA2 Kuala Lumpur International Airport 2
KMO Keiser-Meyer-Olkin
KPI Key Performance Indicator
MBNQA Malcolm Baldridge National Awards
MCI Malaysian construction industry
MHLG Ministry of Housing and Local Government
MOV Ministry of Work
MRA Multiple regression analysis
MVA Missing value analysis
NLC National Land Code
PCA Principal component analysis
PDSA Plan-Do-Study-Act
X
PLC Project life cycle
PMBOK Project Management Body of Knowledge
PMI Project Management Institute
RMK11 The Eleventh Malaysia Plan (2016 - 2020)
PMPA Project management performance assessment
SCORE Sarawak Corridor of Renewable Energy
SEM Structural equation modelling
SME Small and medium enterprises
SPSS Statistical Package of Social Science
SQC Statistical quality control
SQMS Self-assessment quality management system
TPPA Trans-Pacific Partnership Agreement
TQM Total Quality Management

1
CHAPTER 1
INTRODUCTION
1.0 Introduction
Total Quality Management (TQM) has proven to be a particularly successful
approach in improving quality performance (Talib, Rahman and Qureshi 2013; Zehir
et al. 2012), business performance (Miyagawa and Yoshida 2010), organizational
performance (Mehralian et al. 2017; Shafiq, Lasrado and Hafeez 2017;
Valmohammadi and Roshanzamir 2015), innovation performance (Zeng, Phan and
Matsui 2015; Zehir et al. 2012), and firm performance (Sadikoglu and Olcay 2014) .
TQM originated from the manufacturing industry and has received widespread praise
for its noteworthy performance, such as increased productivity, decreased product
cost, and improved reliability. As a result of the successful TQM implementation of
in the manufacturing industry, it has become a source of innovation for other
industries to adopt and implement this concept, including the construction industry.
A construction industry is vital for the development and growth of any nation.
However, attainment of acceptable levels of quality in the construction industry has
long been a problem. In fact, the construction industry is commonly regarded as the
industry with the poorest quality compared to other sectors such as manufacturing
and service (Wanderi, Mberia and Oduor 2015). Delays, cost overruns, reworks,
variations, claims, and disputes have become common problems in the construction
industry (Ali and Rahmat 2010). Many construction clients have expressed
dissatisfaction with the quality of work achieved in their construction projects (Femi
2015; Shehu et al. 2014). A significant amount of time, money and resources, both
human and material, are wasted each year in the construction industry because of
inefficient or non-existent quality management procedures (Polat, Damci and Tatar
2011). The construction industry has been under tremendous pressure to improve
construction quality (Razak Bin Ibrahim et al. 2010; Harrington, Voehl and Wiggin
2012).
2
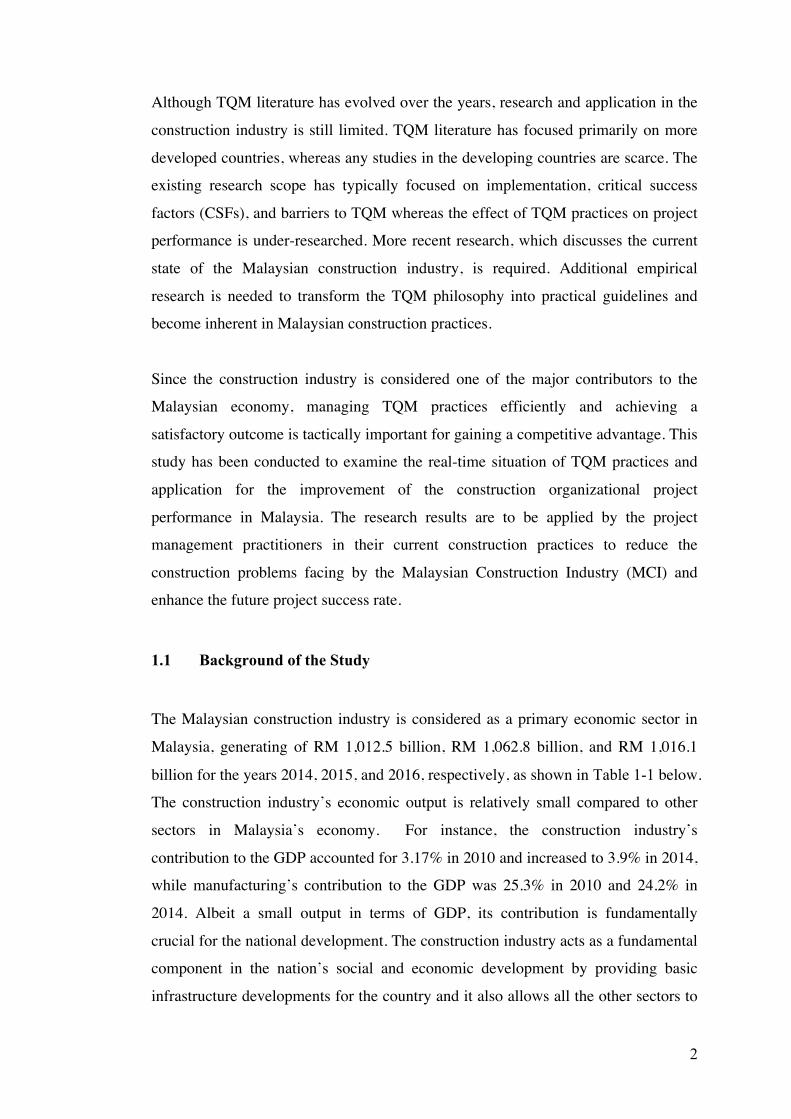
Although TQM literature has evolved over the years, research and application in the
construction industry is still limited. TQM literature has focused primarily on more
developed countries, whereas any studies in the developing countries are scarce. The
existing research scope has typically focused on implementation, critical success
factors (CSFs), and barriers to TQM whereas the effect of TQM practices on project
performance is under-researched. More recent research, which discusses the current
state of the Malaysian construction industry, is required. Additional empirical
research is needed to transform the TQM philosophy into practical guidelines and
become inherent in Malaysian construction practices.
Since the construction industry is considered one of the major contributors to the
Malaysian economy, managing TQM practices efficiently and achieving a
satisfactory outcome is tactically important for gaining a competitive advantage. This
study has been conducted to examine the real-time situation of TQM practices and
application for the improvement of the construction organizational project
performance in Malaysia. The research results are to be applied by the project
management practitioners in their current construction practices to reduce the
construction problems facing by the Malaysian Construction Industry (MCI) and
enhance the future project success rate.
1.1 Background of the Study
The Malaysian construction industry is considered as a primary economic sector in
Malaysia, generating of RM 1,012.5 billion, RM 1,062.8 billion, and RM 1,016.1
billion for the years 2014, 2015, and 2016, respectively, as shown in Table 1-1 below.
The construction industry’s economic output is relatively small compared to other
sectors in Malaysia’s economy. For instance, the construction industry’s
contribution to the GDP accounted for 3.17% in 2010 and increased to 3.9% in 2014,
while manufacturing’s contribution to the GDP was 25.3% in 2010 and 24.2% in
2014. Albeit a small output in terms of GDP, its contribution is fundamentally
crucial for the national development. The construction industry acts as a fundamental
component in the nation’s social and economic development by providing basic
infrastructure developments for the country and it also allows all the other sectors to
3
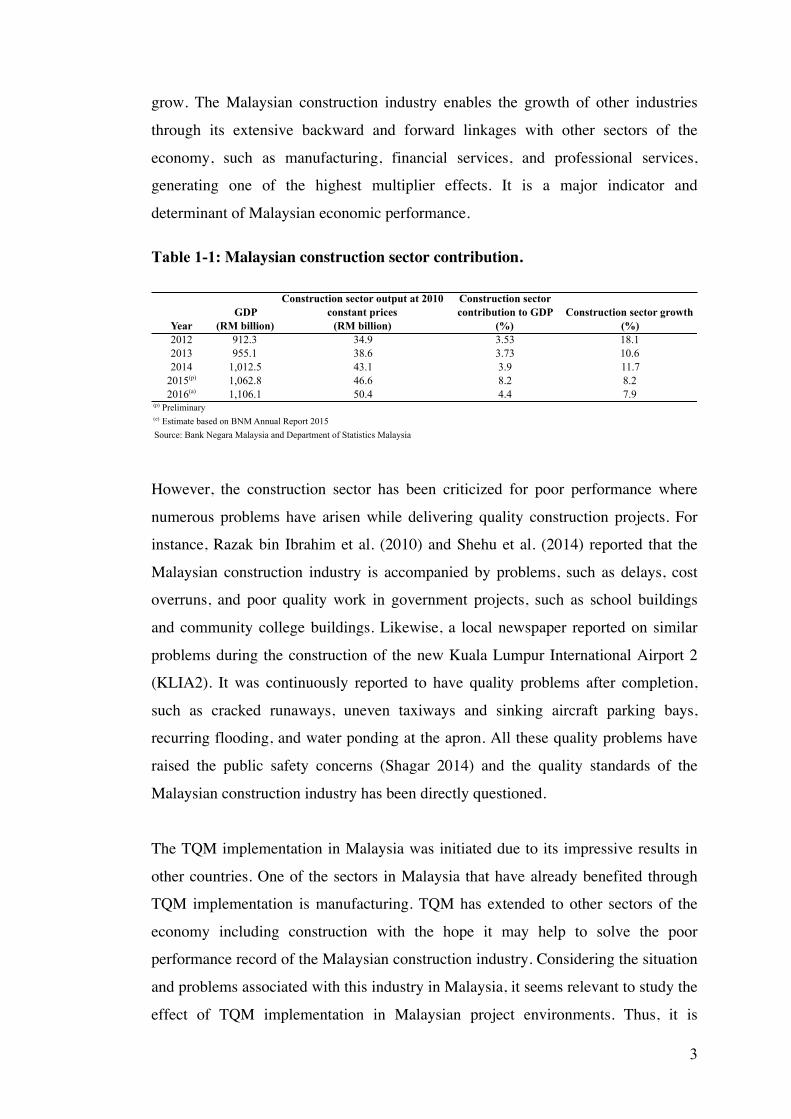
grow. The Malaysian construction industry enables the growth of other industries
through its extensive backward and forward linkages with other sectors of the
economy, such as manufacturing, financial services, and professional services,
generating one of the highest multiplier effects. It is a major indicator and
determinant of Malaysian economic performance.
Table 1-1: Malaysian construction sector contribution.
However, the construction sector has been criticized for poor performance where
numerous problems have arisen while delivering quality construction projects. For
instance, Razak bin Ibrahim et al. (2010) and Shehu et al. (2014) reported that the
Malaysian construction industry is accompanied by problems, such as delays, cost
overruns, and poor quality work in government projects, such as school buildings
and community college buildings. Likewise, a local newspaper reported on similar
problems during the construction of the new Kuala Lumpur International Airport 2
(KLIA2). It was continuously reported to have quality problems after completion,
such as cracked runaways, uneven taxiways and sinking aircraft parking bays,
recurring flooding, and water ponding at the apron. All these quality problems have
raised the public safety concerns (Shagar 2014) and the quality standards of the
Malaysian construction industry has been directly questioned.
The TQM implementation in Malaysia was initiated due to its impressive results in
other countries. One of the sectors in Malaysia that have already benefited through
TQM implementation is manufacturing. TQM has extended to other sectors of the
economy including construction with the hope it may help to solve the poor
performance record of the Malaysian construction industry. Considering the situation
and problems associated with this industry in Malaysia, it seems relevant to study the
effect of TQM implementation in Malaysian project environments. Thus, it is
YearGDP
(RM billion)
Construction sector output at 2010 constant prices
(RM billion)
Construction sector contribution to GDP
(%)Construction sector growth
(%)2012 912.3 34.9 3.53 18.12013 955.1 38.6 3.73 10.62014 1,012.5 43.1 3.9 11.7
2015(p) 1,062.8 46.6 8.2 8.22016(a) 1,106.1 50.4 4.4 7.9
(p) Preliminary(e) Estimate based on BNM Annual Report 2015Source: Bank Negara Malaysia and Department of Statistics Malaysia
4
important to gain some insights on the role of TQM in enhancing the performance of
the Malaysian construction industry.
1.2 Need of Research
Based on the issues discussed above, the following are research gaps that need to be
addressed:
1.2.1 Lack of TQM - Performance Study in the Construction Industry
The contributions of numerous researchers and practitioners have made the current
TQM literature abundantly rich. Some of the studies conducted in the construction
industry are related to TQM implementation (Burati and Oswald 1993; Pheng and
Teo 2004; Harrington, Voehl and Wiggin 2012; Altayeb and Alhasanat 2014;
Kakkad and Ahuja 2014), barriers and benefits of TQM implementation (Hoonakker,
Carayon and Loushine 2010; Polat, Damci and Tatar 2011), investigations on the
TQM revolution (Lau and Tang 2009), and TQM critical success factors (CFSs)
(Metri 2005). Another study had proposed a TQM oriented self-assessment quality
management system (SQMS) by adopting TQM constructs for the construction
industry (Lam, Lam and Wang 2008). There is a lack of studies on the link between
TQM and the performances of project environments as mentioned by Leong et al.
(2014) in his review of the quality management systems in the construction industry.
The researchers also stated one of the areas of quality management system in the
construction industry that is under researched is project performance.
A literature review led by Ebrahimi and Sadeghi (2013) have shown numerous
studies have been conducted on the impact of quality management and firm
performance. Moreover, among the possible metrics discussed in the literature
operational performance, quality performance, financial and market performance,
innovation performance, and customer satisfaction were the most cited, or in other
words, gained more interest from the researchers. However, studies examining the
effect on project performance in the construction trade are scarce. TQM practices
5
and performance relationships need a far more extensive investigation (Ebrahimi and
Sadeghi 2013), especially in the construction industry.
The studies which examined the effect of TQM in the construction industry were
from Bryde and Robinson (2007), Kuo and Kuo (2010), and Alotaibi, Rushmani, and
Rabiul (2013). However, none of these studies has exclusively examined project
performance. One study examined the relationship between TQM and project
performance (Shieh and Wu 2002). However, the study was conducted on the
building-planning phase (pre-construction phase). As a possible extension to this
study, an empirical study on the link between TQM and project performance at the
post-construction phase will be a significant contribution to the construction industry.
A further study on how quality management practices, such as TQM affect project
performance and to determine the effectiveness of TQM practices, are worthwhile
(Leong et al. 2014). This study fills this gap by emphasizing the link between TQM
practices and project performance to determine the effectiveness of TQM practices in
the construction phase.
1.2.2 Lack of Empirical Studies
Thiagaragan, Zairi, and Dale (2001) stated that the possible reasons for the lack of
TQM empirical research were because it is a new discipline outside Japan, its origin
lies mainly outside of the academic world, and there is no single and universal
theoretical framework of TQM. Many of the TQM studies are based on personal
perception and experience, which is not empirical and may lead to the loss of
creditability of TQM as an effective management philosophy. In fact, criticism has
been directed at TQM claiming it is just a ‘fad’ theory and lacks any normative
standards. One of the articles questioned the quality management by arguing that:
“...it remains unclear in the literature whether quality management is a management
of philosophy, a management method, a strategy, a theory for managing the entire
enterprise - or all of the above?”
6
As cited in Fotopoulos and Psomas (2010), one of the crucial ways to transform
TQM into a consistent management discipline is by testing a large number of
empirical studies using analytical models as stated by Rahman and Sohal (2002).
Therefore, to strengthen the fact that TQM is not just a ‘fad’, empirical evidence
must be applied, which is lacking in the current literature.
1.2.3 Lack of Empirical Research Outside Developed Country
There is no single, universal, normative approach to TQM implementation (Burati
and Oswald 1993) in the construction industry. The effectiveness of each TQM
implementation guideline differs across regions, from one industry to another and
from one organization to another. TQM practices in one industry may not be directly
transferable to another without some adaptations, as the context may vary among
industries. Each organization must develop its own framework and take into account
the willingness of managers to implement quality management, as the solutions
cannot be directly transferred (Harrington et al. 2012).
Some studies suggest successful TQM implementation can bring many benefits to an
organization. Greater customer satisfaction, improved product quality, and a higher
market share can be achieved by meeting the quality requirements of TQM
implementation in the construction industry (Love, Edwards and Sohal 2004; Pheng
and Teo 2004; Islam and Mustapha 2008; Rumane 2010; Polat, Damci and Tatar
2011). Among the construction organizations that have witnessed the successfulness
of TQM implementation are the Morrison Construction Group, Takanaka
Corporation, and Shui On Construction Co. (Wong 1999).
Although a majority of the articles claimed the benefits of adopting TQM
management philosophy in various types of organizations, others argued that TQM
does not work (Harari 1993; Sila and Ebrahimpour 2002). Some studies found that
TQM firms do not outperform non-TQM firms (Ebrahimi and Sadeghi 2013) or have
either no effect or negative effects on the firm performance (Kober, Subraamanniam
and Watson 2012; Mehmet and Emre 2012; Curkovic, Vickery and Dröge 2000).

7
Despite the mixed results of TQM implementation presented in the literature, a better
verification is through an empirical examination. However, although there are
numerous studies on TQM in the more developed world, few empirical studies have
been done in developing nations, especially in the ASEAN region (Thiagaragan,
Zairi and Dale 2001; Lam et al. 2011; Lam et al. 2012). As reported by Zakuan et al.
(2010), the adoption of a quality management system has not occurred at a similar
rate in all parts of the world. For this reason, it is empirically significant to study the
adoption of TQM practices and its effect on project performance in the context of a
developing country, like Malaysia.
1.2.4 Malaysian Construction Industry (MCI) as A Focus of Research
Malaysia is one of the fastest growing developing countries. Furthermore, its
construction industry plays a crucial role in enhancing the nation’s social and
economic development by providing essential developments for many other sectors
to develop. The Malaysian construction industry generates one of the highest
multiplier effects through its extensive backward and forward linkages with other
sectors of the economy (Ibrahim et al. 2010). It stimulates raw, semi-processed, and
processed materials manufacturing, such as steel and cement, in backward linkages
and encourages the financial and professional services in forward-type linkages. The
Malaysian government understands the importance of an efficient construction
industry to the national economy and has created policies to support this industry.
With the launching of Vision 2020, the Malaysian government has proposed a fully
industrialized country by the year 2020. However, with the current condition of the
Malaysian construction industry, traditional ways of performing and managing
construction processes will only exacerbate the existing problems. The construction
organizations have to reconsider their construction practices. One strategy is to adopt
Total Quality Management (TQM) more widely.
However, with the present research gap, clear guidelines for showing managers how
to implement TQM is impossible and may result confusion. Managers, researchers,
and quality management practitioners continuously show interest in TQM and its
8
performance relationship and know which TQM practices to adopt to achieve
successful implementations. The main reason to conduct this study is to determine
which TQM practices are essentially to a successful project performance in the
Malaysian construction industry.
1.3 Problem Statement
Total Quality Management is regarded as the management philosophy and company
practices that aim to harness the human and material resources of an organization in
the most effective way to achieve the objectives of the organization (BIS 1992). The
philosophy and guiding principles implemented by TQM form the foundation of a
continually improvement and sustainability to any organizations that implemented it
(Tingey 1997). The final objective of TQM is to meet the needs and satisfaction of
internal and external customers plus improving the performance of companies (Ooi
et al. 2013). This quality-conscious management is regarded as the most effective
methods for improving the holistic competitiveness of any firm by bringing higher
customer satisfaction, better quality products and higher market share (Pheng and
Teo 2004).
The complexity of the construction industry and its customer has grown both in
intensity and diversity resulting in many construction companies facing difficulty in
maintaining the project performance especially the expected satisfaction required by
its customers (Oakland and Marosszeky 2006). The quality of construction services
and facilities is still the root cause of many problems such as high fragmentation, low
productivity, poor quality and etc. (Lam, Chan and Chan 2008). The ineffective
management of the construction project performance not only arose from the
technical issues but also managerial issues (Lam, Chan and Chan 2008). Hence,
sustainable improvement in project performance is extremely difficult to achieve in
the construction and the construction industry is still struggling to achieve quality
objectives in totality in many years (Low and Peh 1996).
TQM originated in the manufacturing industry and there is a considerable body of
TQM literature that has examined TQM implementation in this industry all over the

9
world. Studies were conducted to investigate TQM in various performance
dimensions, including firm performance, operational performance, quality
performance, financial and market performance, innovation performance, and
customer satisfaction (Ebrahimi and Sadeghi 2013). In Malaysia, there has been a
number of research studies conducted on TQM in manufacturing (Rahman and
Tannock 2005; Arumugam, Ooi and Fong 2008; Talib, Rahman and Qureshi 2013)
and services industries (Samat, Ramayah and Mat Saad 2006; Ooi et al. 2011).
However, research that specifically focuses on TQM and project environments is still
lacking (Bryde and Robinson 2007), especially in Malaysia. Leong et al. (2014) has
indicated that limited studies have been conducted in the construction industry but
one of the areas worth further exploration include, what types of quality practices (i.e.
TQM) are recommended for improved project performance.
There have been a few TQM studies conducted in the construction industry. Altayeb
and Alhasanat (2014) studied the TQM implementation in the Palestinian
construction industry. Meanwhile, Harrington et al. (2012) examined the TQM
implementation of in the construction industry in general. Bakar, Ali, and Onyeizu
(2011) examined the TQM practices in Oman construction companies, while Mir and
Pinnington (2014) determined the relationship between project management
performance and project success in UAE project-based organizations. Kuo and Kuo
(2010) investigated the relationship of corporate culture, TQM, and project
performance in Taiwan. However, all these studies are limited to different regions in
which the characteristics and practices in these developed countries are very different
from Malaysia, which is a developing country. Notably, none of the studies focused
exclusively on the link between TQM and project performance of the construction
organizations.
A few Malaysian studies have been conducted on the construction industry. Abdul
Rashid (2002) completed a study on the realities of applying TQM in the
construction industry. Din et al., (2010) studied the elements of performance between
certified and non-certified construction organizations. Leong et al., (2014) reviewed
on the quality management system research in the construction industry. There is no
evidence to suggest there has been any empirical and statistical research examining
the relationship between project performance and TQM in Malaysia. There is also a

10
lack of studies, which have examined the association of quality management and
project management in Malaysia. As mentioned by Thiagaragan, Zairi, and Dale
(2001), the development of empirical research on TQM still lags far behind,
especially in the construction industry (Leong et al., 2014).
Hence, there is a gap detected in the existing TQM literature in the context of the
Malaysian construction industry. Therefore, this study focuses on explaining the
empirical evidence for the relationship between TQM and project performance in the
Malaysian project environment. Coupled with the current pressure to improve the
level of quality in the construction industry in Malaysia, there is indeed a need and
urgency for research to determine if TQM implementation can improve project
performance. This research not only focuses on investigating if a link exists, but also
providing a more refined and detailed examination on how any links may provide a
possible contribution to the construction organizations in terms of improving their
project performance through TQM implementation.
1.4 Research Questions
In the context of the Malaysian construction industry, this study established the
following pertinent research questions to investigate:
1. Is there a relationship between TQM and project performance?
2. Which TQM practices have a greater association with project performance?
3. What is level of TQM and project performance in Malaysian’s construction
organizations?
1.5 Research Objectives
The key objective of this research is to analyze the association between TQM
practices and project performance in the Malaysian construction industry:
1. To determine the dimensions of TQM and project performance applicable to
the Malaysian construction industry.

11
2. To determine the relationship between TQM and project performance in
Malaysia’s organizations.
3. To identify which TQM practices have a greater impact in Malaysia’s
construction organizations.
Figure 1-1: Conceptual framework of the study.
1.6 General Conceptual Framework
Based on the research objectives, the following general conceptual framework was
developed to guide the study. An overview of the hypotheses that concern the
relationships between the constructs in this study is illustrated in Figure 1-1. TQM
practices of leadership, strategic planning, customer focus, workforce focus,
operation focus, measurement, analysis, and knowledge management were
developed as independent variables, and project performance as the dependent
variable. This model was constructed to measure the influence of the independent
variables on the dependent variable. Given the above discussion, the following
hypotheses were therefore proposed in Table 1-2.

12
Table 1-2: The summary of hypotheses.
Hypotheses
H1 There is a significant positive relationship between leadership and project
performance.
H2 There is a significant positive relationship between strategic planning and
project performance.
H3 There is a significant positive relationship between customer focus and
project performance.
H4 There is a significant positive relationship between workforce focus and
project performance.
H5 There is a significant positive relationship between operation focus and
project performance.
H6 There is a significant positive relationship between measurement, analysis
and knowledge management and project performance.
1.7 Scope of the Study
The present study aims to examine the relationship between TQM practices and
project performance in the environments of the Malaysian construction organizations.
The scope of the study covered the Malaysian construction organizations registered
under the Construction Industry Development Board (CIDB), Malaysia. CIDB is one
of the semi-government entities established in 1984 to act on behalf of the Malaysian
government to register all construction companies operating in Malaysia. CIDB
regulates and registers the construction companies under relevant grade (ranking
from G1 to G7) according to the company’s experience, financial status, and
personnel capability. By 1 January 2009, CIDB had implemented a new regulation in
which all Grade 7 contractors are required to obtain the ISO 9001 certification.
In this study, all Grade 7 contractors registered under CIDB were selected as
population. The Grade 7 contractors were chosen because they are qualified based on
their status (i.e. experience, financial status, and personnel capability). Most
importantly, the G7 contractors’ commitment to quality standards (i.e. ISO 9001
13
certified) is the primary attribute for this study, because this population is an accurate
representation of the Malaysian construction industry as adopted in the study of Din
et al., (2011).
Surveys conducted among the selected population regarding TQM practices and its
influence on their projects’ performance have yielded useful and practical insights
into this particular industry, which is trying to improve its performance and poor
image (Ibrahim et al. 2010). These surveys add to the limited empirical evidence
concerning TQM in the context of the Malaysian construction industry.
1.8 Research Contributions
This research contributes findings and outcomes that are useful and practical in
several areas.
1.8.1 Academic Research
This study will positively contribute to the applied knowledge for academicians as it
sheds light on how the implementation of TQM results in a better project
performance in the Malaysian construction industry. While the majority of TQM
initiatives and practices are carried out in Western countries, this study evaluates the
concept of TQM and its relationship with project performance in Malaysian
construction organizations, which is a non-western, multi-racial developing country.
The findings of this study could substantially and significantly benefit academicians
in assessing the current state of TQM within the context of the Malaysian
construction industry and how it application differs from other countries.
1.8.2 Construction Organizations
This study was designed to investigate the management system, which has been
adopted, by the construction organization and their relation to enhancing the project
performance. The findings of this study provided empirical evidence and contributed
to the methods to improve the construction organizations’ project performance.
14
1.8.3 Malaysian Construction Industry
As mentioned in the study of Razak Bin Ibrahim et al. (2010), the Malaysian
construction industry has been continuously plagued with problems of delays, cost
overruns, low productivity, and low quality of work. The empirical results of the
association between TQM practices and project performance from this research can
be used as guidelines for the practitioners in the construction industry to enhance the
project performance. Through this research, the Malaysian construction industry will
be exposed to TQM knowledge and its benefits to the industry regarding project
performance. In addition, the findings of this research may act as an incentive to
increase the adoption and implementation of TQM as a quality management system
in managing construction projects. This research will increase the level of awareness
of and the implementation of TQM in the construction industry and consequently
improve Malaysia’s current overall construction image.
1.9 Organization of Chapters
This thesis consists of six chapters. Chapter 1 introduces this research. Chapter 2
provides a brief introduction to the Malaysian construction industry. Chapter 3 is a
review of the literature on this topic: TQM and project performance. Chapter 4
discusses the research methodology. Chapter 5 reports on the findings from the data
analyses. Finally, Chapter 6 discusses the conclusions, implications, limitations and
future study possibilities for this topic.
The content of each chapter is briefly outlined in the sections below:
Chapter 1 gives an introduction to this research starting with some background
information regarding the study and the research needs. The problem statement is
then discussed together with the research questions and research objectives. A
general conceptual framework and the scope of the study are subsequently presented
ad lastly ending with some research outcomes and the organization of the chapters,
which outline the flow of the thesis.

15
Chapter 2 gives an overview of the Malaysian construction industry by examining
the nature of the industry including a discussion on the latest CITP (Construction
Industry Transformation Programme): Four Strategic Thrusts and the Bakun
Hydroelectric Project (BHP). The discussion analyses the industry’s problems, which
have led to the low quality issues in the Malaysian Construction Industry (MCI).
Chapter 3 presents a concise review of the quality concepts and standards in the
construction industry. An analysis of these standards and practices is relevant in
order to establish sufficient understanding of TQM and project performance.
Chapter 4 justifies the quantitative research method adopted in this study as well as
discusses the sampling, data collection, and data analyses.
Chapter 5 presents the findings and outcomes of the data analyses on research
objectives and hypotheses. This is followed by a detailed discussion of the findings
discovered.
Chapter 6 draws conclusions and implications from the study regarding managerial
and theoretical aspects and finally a discussion on the limitations and future study
recommendations for this topic.
1.10 Definition of Key Terms
Total Quality Management: “A management approach of an organization, centred
on quality, based on the participation of all its members, aiming at long-term success
through customer satisfaction, by bringing benefits to all members of the
organization and to the society.” – International Organization for Standardization
(ISO)
Project: “A temporary endeavour undertaken to create a unique product or service.”
– The Project Management Institute (1996)
16
Performance: “ A task or operation seen in terms of how successfully it is
performed.” – Oxford English Dictionary
Construction: “ New construction, alteration, repair and demolition. Installation of
any machinery or equipment which is built-in at the time of the original construction
is included, as well as installation of machinery or equipment after the original
construction but which requires structural alteration in order to install.” – Statistics
Department Malaysia
Industry is defined as “ a group of economic establishments all of which are
primarily engaged in the same kind of activity or in producing the same kind of
product.” – Statistics Department Malaysia
1.11 Summary
This chapter discusses the overall orientation of the study. The study began by
addressing the background of the study and the problem statement. The research
questions and research objectives of the study followed. The study was conducted by
following the guidelines of the research framework. Meanwhile, the scope of this
study focused on the Malaysian construction organizations. This chapter ends by
mentioning some of the practical and theoretical contributions of the study and a
brief summary of the rest of the chapters in this thesis.
17
CHAPTER 2
MALAYSIAN CONSTRUCTION INDUSTRY
2.0 Introduction
In this chapter, an overview of the construction industry is introduced by describing
its performance and role for the nation. The types of development process conducted
in Malaysia are described next. There are two kinds of development process, namely
land development and property development. They are two distinct processes but
have merged in creating the nation’s construction industry. The diagram, Figure 2-5
illustrated below explains the process of development from the initial land purchase
to the finished product, and outlines the complicated construction process. In
addition to comprehending the nature of the construction practices, there are multiple
stakeholders involved in each development process. The Construction Industry
Transformation Programme (CITP), established by the Construction Industry
Development Board of Malaysia, establishes four strategic thrusts: Quality, Safety
and Professionalism, Productivity, Environmental Sustainability, and Internalisation.
A review of the current Malaysian construction industry (MCI)'s status, problems,
and future direction, in the context of the four strategic thrusts provides a clear
picture of the construction industry today. A discussion of the MCI problems, based
on the literature and substantiated with a recent case study of the Bakun
Hydroelectric Project (BHP), represents the real-life obstacles faced by the MCI. The
associated construction problems, which inevitably came with serious consequences,
are discussed in the last section of this chapter. Last but not least this chapter ends
with a summary of this chapter’s discussions.
2.1 Overview of the Malaysian Construction Industry (MCI)
Malaysia’s Vision 2020 was created to express the government’s objective to
achieve a high-income status and encourage the nation towards a robust and dynamic
economy. This vision involves an intensive transformation of the nation’s economic

18
structure, in conjunction with the Eleventh Malaysia Plan (RMK11) and the
Economic Transformation Program (ETP). A healthy construction industry is vital to
execute the nation’s strategic plans through critical physical infrastructure
developments. The Construction Industry Transformation Programme (CITP) is a
five-year plan, following the Construction Industry Master Plan (CIMP) with the
intention of leading the construction industry to become more advanced, more
productive, and a major economic sector contributing to Malaysian’s aim of
becoming a high-income nation by 2020. One of the key features of CITP is to equip
Malaysia’s construction industry to become a global competitor at the international
level.
Table 2-1 shows the contribution of different economic sectors to the Gross
Domestic Product (GDP). The table confirms the service industry is the largest
contributor to the GDP, while the construction industry is the smallest. However, the
contribution by the construction industry is showing signs of improving. As shown in
Table 2-3, the construction industry had been in decline until 2008 when it
contributed only 2.7% to GDP. It then began to increase in 2009 and currently
contributes 4.4% to the GDP. In fact, while the other major industries have recently
show signs of stagnating, the construction industry continues increasing. It is
targeted to contribute 5.5% to the GDP by 2020 (RMK11). In 2014, Malaysia’s
economy grew at 6.0% with all sectors recording a positive growth. The construction
industry continued double-digit growth by registering 11.8% and became the fastest
growing industry among all others.
Table 2-1: GDP by kind of economic activity at 2010 prices – RM million.
2011 2012 2013 2014 2015* 2016**Agriculture 88,555 89,406 91,097 92,979 93,904 93,576Miningandquarrying 85,373 86,751 87,789 90,645 94,917 98,211Manufacturing 202,960 211,921 219,216 232,868 244,247 254,215Construction 29,524 34,880 38,646 43,190 46,728 50,398Services 449,854 479,300 507,935 541,185 569,046 594,025(+)importduties 8,654 10,004 10,577 11,639 13,805 15,675GDPatpurchasers'prices 864,920 912,261 955,260 1,012,506 1,062,647 1,106,100*preliminary**forecastSource:DepartmentofStatistics,MalaysiaandBankNegaraMalaysia
19
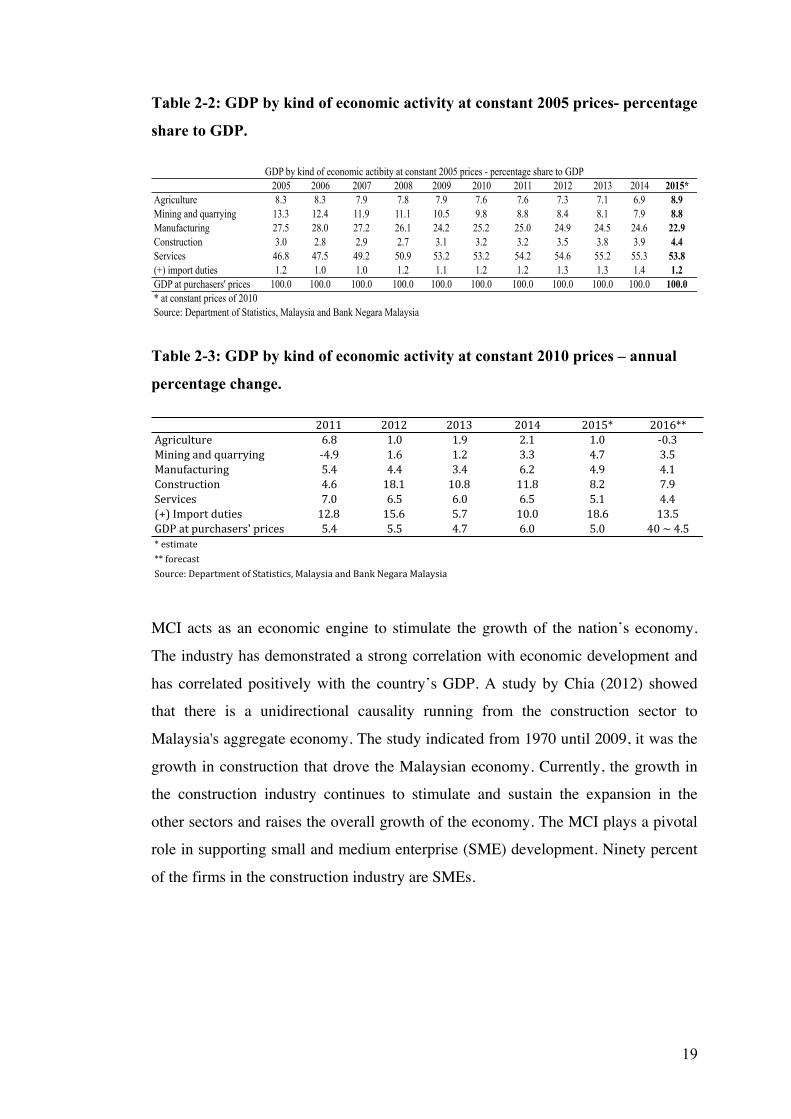
Table 2-2: GDP by kind of economic activity at constant 2005 prices- percentage
share to GDP.
Table 2-3: GDP by kind of economic activity at constant 2010 prices – annual
percentage change.
MCI acts as an economic engine to stimulate the growth of the nation’s economy.
The industry has demonstrated a strong correlation with economic development and
has correlated positively with the country’s GDP. A study by Chia (2012) showed
that there is a unidirectional causality running from the construction sector to
Malaysia's aggregate economy. The study indicated from 1970 until 2009, it was the
growth in construction that drove the Malaysian economy. Currently, the growth in
the construction industry continues to stimulate and sustain the expansion in the
other sectors and raises the overall growth of the economy. The MCI plays a pivotal
role in supporting small and medium enterprise (SME) development. Ninety percent
of the firms in the construction industry are SMEs.
GDP by kind of economic actibity at constant 2005 prices - percentage share to GDP2005 2006 2007 2008 2009 2010 2011 2012 2013 2014 2015*
Agriculture 8.3 8.3 7.9 7.8 7.9 7.6 7.6 7.3 7.1 6.9 8.9Mining and quarrying 13.3 12.4 11.9 11.1 10.5 9.8 8.8 8.4 8.1 7.9 8.8Manufacturing 27.5 28.0 27.2 26.1 24.2 25.2 25.0 24.9 24.5 24.6 22.9Construction 3.0 2.8 2.9 2.7 3.1 3.2 3.2 3.5 3.8 3.9 4.4Services 46.8 47.5 49.2 50.9 53.2 53.2 54.2 54.6 55.2 55.3 53.8(+) import duties 1.2 1.0 1.0 1.2 1.1 1.2 1.2 1.3 1.3 1.4 1.2GDP at purchasers' prices 100.0 100.0 100.0 100.0 100.0 100.0 100.0 100.0 100.0 100.0 100.0* at constant prices of 2010Source: Department of Statistics, Malaysia and Bank Negara Malaysia
2011 2012 2013 2014 2015* 2016**
Agriculture 6.8 1.0 1.9 2.1 1.0 -0.3
Miningandquarrying -4.9 1.6 1.2 3.3 4.7 3.5
Manufacturing 5.4 4.4 3.4 6.2 4.9 4.1
Construction 4.6 18.1 10.8 11.8 8.2 7.9
Services 7.0 6.5 6.0 6.5 5.1 4.4
(+)Importduties 12.8 15.6 5.7 10.0 18.6 13.5
GDPatpurchasers'prices 5.4 5.5 4.7 6.0 5.0 40~4.5
*estimate
**forecast
Source:DepartmentofStatistics,MalaysiaandBankNegaraMalaysia

20
Figure 2-1: Number of firms in construction by employee count.
The construction industry has generated one of the highest economic multiplier
effects (Ibrahim et al. 2010). It has extensive backward and forward linkages with
other sectors of the economy. 120 other industries depends on the construction
sector for their growth and sustainability (CIDB 2016). The construction industry is
one of the biggest consumers of Malaysia’s manufacturing sector for ceramic,
cement, metals, and other building materials. In fact, 15% of the total manufacturing
output is consumed by the construction industry (CIDB 2016). Furthermore, the
construction industry’s potential forward linkages, consuming a range of services
such consultancy, engineering, and a wide range of financial-related services,
accounts for 5% of total output from the Malaysian services sector (Department of
Statistics).
The MCI contributes significantly to the national employment rate. It is Malaysia’s
fourth largest employer. The construction industry consumed 9.5% of Malaysia’s
total workforce, accounted for 1.2 million registered workers. Seventy-five percent
of the workforce in the construction industry is Malaysian nationals. A multitude of
professionals are involved in the industry such as architects, engineers, planners,
surveyors, skilled and non-skilled construction workers. Every year Malaysia
institutions produce thousands of young graduates to enter construction related fields.
0
5
10
15
20
25
30
<5 5-9 10-19 20-49 50-99 100-499500-999 >1000
%oftotalGirm
s
SizeGirmbynumberofemployeecount
SMEs
Large firms
Source: Construction Industry Transformation Programme 2016-2020
21
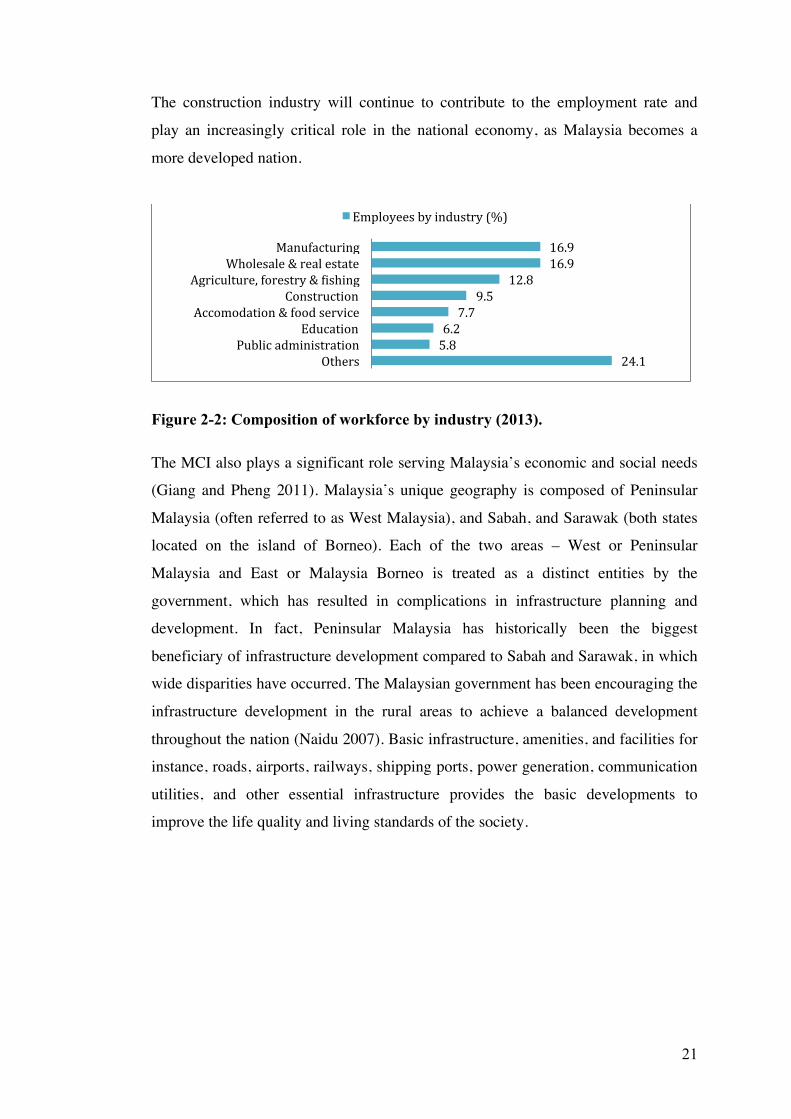
The construction industry will continue to contribute to the employment rate and
play an increasingly critical role in the national economy, as Malaysia becomes a
more developed nation.
Figure 2-2: Composition of workforce by industry (2013).
The MCI also plays a significant role serving Malaysia’s economic and social needs
(Giang and Pheng 2011). Malaysia’s unique geography is composed of Peninsular
Malaysia (often referred to as West Malaysia), and Sabah, and Sarawak (both states
located on the island of Borneo). Each of the two areas – West or Peninsular
Malaysia and East or Malaysia Borneo is treated as a distinct entities by the
government, which has resulted in complications in infrastructure planning and
development. In fact, Peninsular Malaysia has historically been the biggest
beneficiary of infrastructure development compared to Sabah and Sarawak, in which
wide disparities have occurred. The Malaysian government has been encouraging the
infrastructure development in the rural areas to achieve a balanced development
throughout the nation (Naidu 2007). Basic infrastructure, amenities, and facilities for
instance, roads, airports, railways, shipping ports, power generation, communication
utilities, and other essential infrastructure provides the basic developments to
improve the life quality and living standards of the society.
16.916.9
12.89.5
7.76.25.8
24.1
ManufacturingWholesale&realestate
Agriculture,forestry&]ishingConstruction
Accomodation&foodserviceEducation
PublicadministrationOthers
Employeesbyindustry(%)

22
2.2 Malaysian Property Development
There are two types of developments in Malaysia, which are the land development
and property development. Land development in Malaysia refers to the conversion of
original use of any alienated land approved by the State Authority includes. The
conversion includes the change of the land’s conditions, interest, restriction and
category of land use. Under the National Land Code (NLC), land development takes
place in certain forms.
Figure 2-3: Types of Malaysia’s development.
Figure 2-4: Forms of land development.
According to the Town and Country Planning Act 1976 (Act 172) Malaysia defines
property development as “the carrying out of any building, engineering, mining,
industrial or other similar operations in, on, over or under land, or the making of
any material change in the use of any buildings or other land, or the subdivision or
amalgamation of lands.”
Development Land Development
Property Development
Land
Development
Partition (Sections 140 -145)
Variations of conditions, restrictions and categories (Section 124) Sub-divisions (Sections 135 – 139)
Simultaneous applications for sub-division and variation of conditions, restrictions and categories (Section 204A – 204H)
Amalgamation (Sections 146-150)
Surrender and re-alienation – special provisions (Sections 204A – 204H)

23
Although land development and property development have different definitions,
they are interrelated in the process of developing land into a more valuable property.
Land development happens in the initial stage or the ‘pre-construction stage’ when
the land requires conversion into another value-added form. This is then followed by
the property development activities such as preparation of architectural plans,
statutory approval, and construction. The details of the project development process
will be explained in the following section.

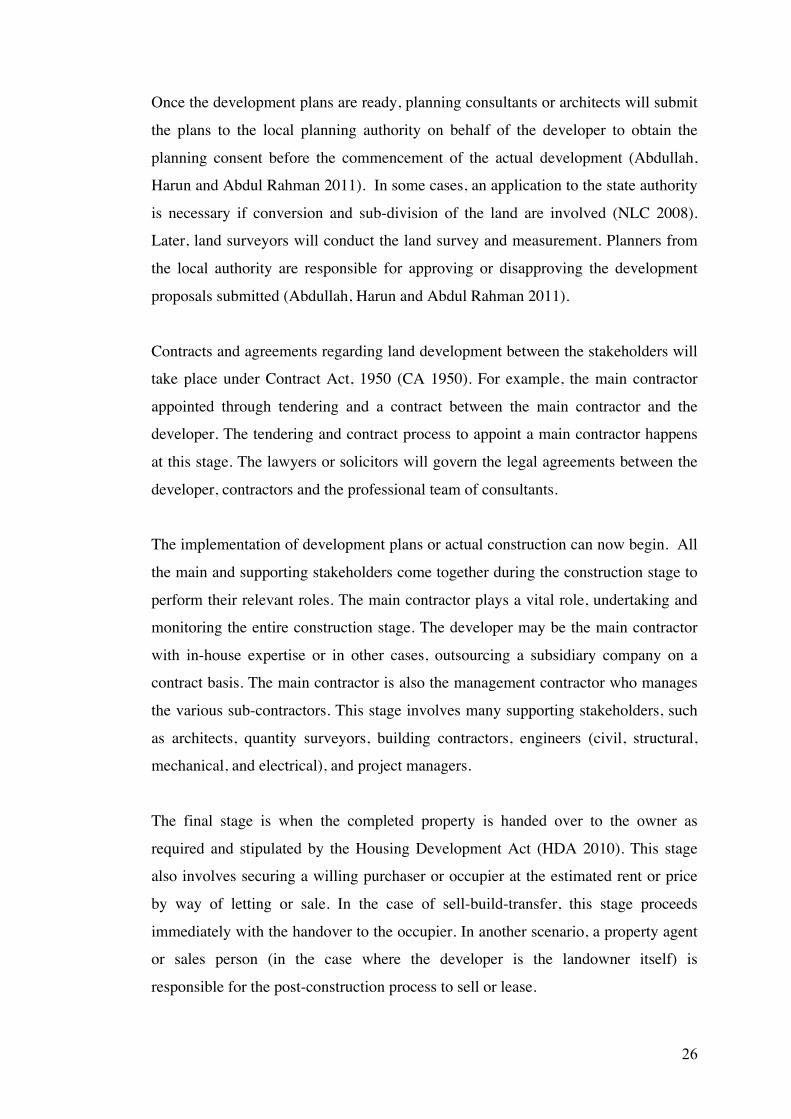
24
Figure 2-5: Diagram of a development process.
Stak
ehol
der(
s)
Client/Owner è
Architects,Consultants &
Project Managerè
ProjectManager è
MainContractor è è
IndirectSuppliers è
EmployementAgencies/Mini
triesè
Municipality/Agencies:
Licenses/Permits
Utilities &Transportation
ê
ManufacturersInformation,
Communication& Technology
ê é
Manufacture/Assembles
Finance &Insurance
é
Materials Legal Services
Use HandoverConstructionon site andcompletion
Source: Personal collection.
Stag
e(s)
ê
Stag
e(s)
Proc
ess/
Proc
edur
e
Parts manufacturers
Materials production
é
Importers
Customs
Pre-Construction Phase
Post-Construction Phase
Construction Phase
Sub-contractors &Direct Suppliers
Regulatory Environment
Workers/Labours
Skilled/Unskilled
Training
é
é
Regulatory Environment
Initiative/Inception
ê
Evaluation
Acquisition Commitments
Permissions
Design & Costing Tendering Procurement Material suppliers/Machineries suppliers
é
é
Import countries
Construction Phase

25
2.2.1 Project Development Process
Every project development inclusive in Malaysia will undergo the project life cycle
(PLC) i.e. predevelopment stage, construction stage and post development stage
(Kerzner and Kerzner 2017; Abdullah, Harun and Abdul Rahman 2011). The
development process commences when a piece of land is potentially considered to
have the best value for another purpose by the developer (Nik Jaafar). The decision
to develop the land can be initiated by the landowner or developer, who is the main
stakeholder in the development process. In other cases, the public sector and
government agencies play the role as the developer.
The evaluation process of the proposed development involves activities such as
market research and financial appraisals to guide the developer(s) throughout the
process (Nik Jaafar). Professional registered property appraisers are appointed to
assist in the developer’s decision-making process (VAEA 1981). Upon instruction,
the appraiser(s) will conduct a market or feasibility study and analyze the current
market demand and supply.
Next procedure is the acquisition to possess the land. Before the land acquisition,
legal matters such as land ownership, planning permission, compensation, ground
investigation, and financing need to be investigated (NLC 2008). The legal
investigation can either be carried out by the developer or through engagement of a
lawyer (solicitor). In some cases, the public sector is involved when it comes to a
large site with many occupiers and landowners (Abdullah, Harun and Abdul Rahman
2011). The Malaysian government procure the compulsory legal powers to acquire
the site for any development purpose for the nation (NLC 2008).
The estimation of plans and cost estimations for the proposed development would be
undertaken at the next stage of the development process (Nik Jaafar). Qualified
professionals such as architects, quantity surveyors, and building surveyors develop
the building plans according to the client’s budget and requirements (Abdullah,
Harun and Abdul Rahman 2011). The appointed, qualified professionals are either
in-house or outsourced depending on the client’s company profile.
26
Once the development plans are ready, planning consultants or architects will submit
the plans to the local planning authority on behalf of the developer to obtain the
planning consent before the commencement of the actual development (Abdullah,
Harun and Abdul Rahman 2011). In some cases, an application to the state authority
is necessary if conversion and sub-division of the land are involved (NLC 2008).
Later, land surveyors will conduct the land survey and measurement. Planners from
the local authority are responsible for approving or disapproving the development
proposals submitted (Abdullah, Harun and Abdul Rahman 2011).
Contracts and agreements regarding land development between the stakeholders will
take place under Contract Act, 1950 (CA 1950). For example, the main contractor
appointed through tendering and a contract between the main contractor and the
developer. The tendering and contract process to appoint a main contractor happens
at this stage. The lawyers or solicitors will govern the legal agreements between the
developer, contractors and the professional team of consultants.
The implementation of development plans or actual construction can now begin. All
the main and supporting stakeholders come together during the construction stage to
perform their relevant roles. The main contractor plays a vital role, undertaking and
monitoring the entire construction stage. The developer may be the main contractor
with in-house expertise or in other cases, outsourcing a subsidiary company on a
contract basis. The main contractor is also the management contractor who manages
the various sub-contractors. This stage involves many supporting stakeholders, such
as architects, quantity surveyors, building contractors, engineers (civil, structural,
mechanical, and electrical), and project managers.
The final stage is when the completed property is handed over to the owner as
required and stipulated by the Housing Development Act (HDA 2010). This stage
also involves securing a willing purchaser or occupier at the estimated rent or price
by way of letting or sale. In the case of sell-build-transfer, this stage proceeds
immediately with the handover to the occupier. In another scenario, a property agent
or sales person (in the case where the developer is the landowner itself) is
responsible for the post-construction process to sell or lease.
27
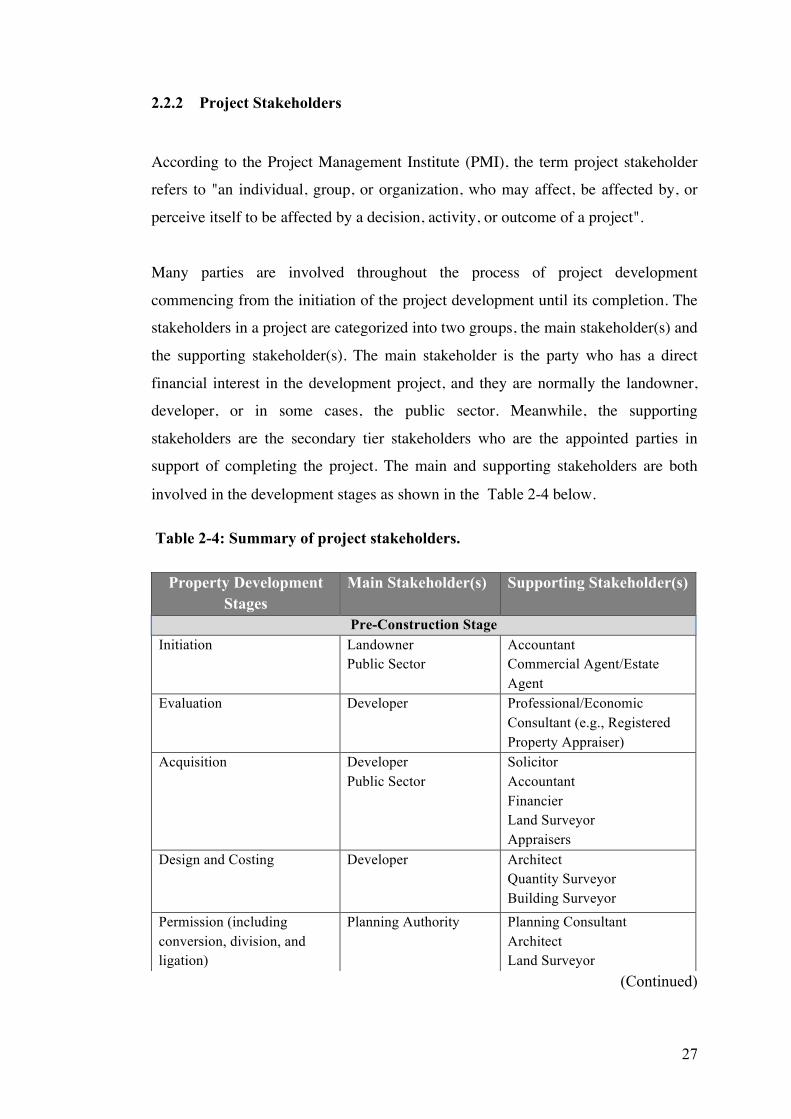
2.2.2 Project Stakeholders
According to the Project Management Institute (PMI), the term project stakeholder
refers to "an individual, group, or organization, who may affect, be affected by, or
perceive itself to be affected by a decision, activity, or outcome of a project".
Many parties are involved throughout the process of project development
commencing from the initiation of the project development until its completion. The
stakeholders in a project are categorized into two groups, the main stakeholder(s) and
the supporting stakeholder(s). The main stakeholder is the party who has a direct
financial interest in the development project, and they are normally the landowner,
developer, or in some cases, the public sector. Meanwhile, the supporting
stakeholders are the secondary tier stakeholders who are the appointed parties in
support of completing the project. The main and supporting stakeholders are both
involved in the development stages as shown in the Table 2-4 below.
Table 2-4: Summary of project stakeholders.
(Continued)
Property Development Stages
Main Stakeholder(s) Supporting Stakeholder(s)
Pre-Construction Stage Initiation Landowner
Public Sector Accountant Commercial Agent/Estate Agent
Evaluation Developer Professional/Economic Consultant (e.g., Registered Property Appraiser)
Acquisition Developer Public Sector
Solicitor Accountant Financier Land Surveyor Appraisers
Design and Costing Developer Architect Quantity Surveyor Building Surveyor
Permission (including conversion, division, and ligation)
Planning Authority Planning Consultant Architect Land Surveyor

28
2.3 Construction Industry Development Board (CIDB)
The CIDB, which was established in December 1994, has become the main
regulatory agency for the construction industry in Malaysia. The main functions of
CIDB in the construction industry under subsection 4(1) of Act 520 can be classified
into three (3) main categories: Development and Facilitative, Advisory, and
Regulatory. The functions laid out in the Act are:
• To promote and stimulate the development, improvement, and expansion of
the construction industry
• To advise and make recommendations to the Federal and State Governments
on matters affecting or connected with the construction industry
• To promote, stimulate, and undertake research into any matter related to the
construction industry
• To promote, stimulate, and assist in the export of services related to the
construction industry
• To provide consultancy and advisory services to the construction industry
• To promote quality assurance in the construction industry
Property Development Stages
Main Stakeholder(s) Supporting Stakeholder(s)
Commitment Land Owner Public Sector Developer
Solicitor Building Contractor Architect Quantity Surveyor Engineer Supplier
Construction Stage Implementation
Developer Building Contractor Project Manager
Sub-contractor Architect Quantity Surveyor Engineer Supplier
Post Construction Stage Let/Manage/Dispose Land Owner
Developer Occupier
End Financier Lawyer Estate Agent Appraisers

29
• To initiate and maintain the construction industry information system
• To encourage the standardization and improvement of construction techniques
and materials
• To provide, promote, review, and coordinate training programs organized by
public and/or private construction training centers for up-skilling construction
workers and construction site supervisors
• To certify and register contractors and to cancel, suspend, or reinstate the
registration of any registered contractors
• To recognize and certify skilled construction workers and construction site
supervisors
2.3.1 Registration of Contractors
CIDB main function is to regulate and register construction firms. Malaysia
construction companies are compulsory to be registered with CIDB before
performing any construction work. There are seven grades from G1 to G7. The
categorisation of these grades depends on the company's experience, financial status,
and personal capability. The relevant grades will define the value of work allowed
for the company. The registration is on a one to three years basis. According to
CIDB, a construction company can be registered under more than one categories and
subspecialty under certain registration requirements. There are three specialist
categories in CIDB, which are building construction (B), civil engineering
construction (CE), and mechanical and electrical construction (ME). The specialist
categories are further subdivided into subspecialties. There 19 subspecialties from
B01 to B19 for building construction. Civil engineering construction has 20
subspecialties from CE01 to CE22. Meanwhile, construction mechanical has 15
subspecialties (M01 to M15), and finally electrical has 10 subspecialties (E01 to
E10). Table 2-5 shows the value of work for which approved construction companies
can tender.
There are three specialist categories in CIDB, which are building construction (B),
civil engineering construction (CE), and mechanical and electrical construction (ME).
The specialist categories are further subdivided into subspecialties. There 19

30
subspecialties from B01 to B19 for building construction. Civil engineering
construction has 20 subspecialties from CE01 to CE22. Meanwhile, construction
mechanical has 15 subspecialties (M01 to M15), and finally electrical has 10
subspecialties (E01 to E10).
Table 2-5: CIDB contractor grades.
Grade Paid-up capital (RM) Tender capacity (RM)
G1 5,000 < 200,000 G2 25,000 < 500,000 G3 50,000 < 1,000,000 G4 150,000 < 3,000,000 G5 250,000 < 5,000,000 G6 500,000 < 10,000,000 G7 750,000 No limit G8 Recommended by CIDB Source: CIDB Directory (2004)
2.3.2 Grade 8
In the latest Construction Industry Transformation Program (CITP), CIDB suggests a
new classification of contractor, which is the G8. It is an initiative to recognize the
leaders in the construction industry who demonstrate the specifically stated criteria.
The contractor has to be in the category of G7 with minimum standards and
certifications before can be classified for G8. Other than that, internationally
recognised quality certification such as the Total Quality Management and ISO 9000
are strongly encouraged for the contractors in the pursuit of G8 qualification. It is the
milestone of the CITP to achieve 50 Malaysian companies to earn the G8 status.
2.4 A Review of Construction Industry Transformation Program (CITP)
The transition of Malaysia into a developed nation under the Eleventh Malaysia Plan
(RMK11) and the Economic Transformation Program (ETP) will require the
construction industry to continuously improve and become increasingly critical to the
national economy. Hence, the CITP -the construction industry transformation
program - was developed to serve the increasing demand for modern and efficient

31
infrastructure projects with the aim of becoming an advanced nation. The CITP was
established in collaboration with the Ministry of Works (MOV), the CIDB, key
stakeholders, and the industry as a whole, with important strategic goals to bring
Malaysia’s construction industry to the next level, encompassing four strategic
objectives: Quality, Safety, and Professionalism, Environmental Sustainability,
Productivity and Internationalisation. The MCI issues were identified under each
strategic objective and the outcomes projected for 2020 will be discussed in the
following paragraph.
2.4.1 Four Strategic Thrusts
The CITP reviewed the current MCI practices and concluded there were some major
issues and problems with the MCI achieving the four strategic objectives. The
initiatives recommended and the targeted goals to be achieved under each strategic
objective are discussed below. This discussion is an attempt to clarify the current
issues encountered by the MCI today. These initiatives can be implemented in
response to the issues examined under each strategic objective and hence, improve
the performance of the MCI and raise it to a higher recognized status in the world.
Figure 2-6: CITP's strategic thrusts.
2.4.1.1 Quality, Safety, and Professionalism
The Malaysian construction industry is yet facing the major issues of poor quality
work, delays, high accident and fatality rate, lack of safety awareness and culture.
Internationalisation
Environmental Sustainability
Quality, Safety & Professionalism
Productivity Four Strategic
Thrusts

32
These problems affect the construction industry cycle from the general public to the
consumers. Most importantly, these issues impede the nation towards achieving the
target to be a developed nation by 2020.
The aim of the first strategic thrust is to embed professionalism, quality, and safety
culture in the construction industry. The quality standards are strongly emphasized
by the CITP to ensure the best quality in the construction environment, reduce
accidents and remove the barrier of regulatory constraints. A quality-conscious
industry certainly contributes to the transition of Malaysia to a developed nation.
2.4.1.2 Environmental Sustainability
Malaysia is in the effort of becoming a sustainable, low-carbon and resource-
efficient nation. In accordance to that, Malaysia has set a voluntary target to reduce
the greenhouse gases (GHG) emission intensity of its Gross Domestic Product (GDP)
up to 40% by the year of 2020.
The aim of the second strategic thrust is to accomplish the goal of Malaysia
becoming model of sustainable infrastructure country in the world. Develop a more
resilient and sustainable infrastructure through reducing the emissions of carbon in
the construction industry. Some initiatives to achieve the second strategic thrust have
been suggested by CITP. Establishment of recycling centres in high levels
construction activity areas for the construction waste, tighten the rules and
regulations against illegal dumping and enforcement of taxation on excessive waste.
2.4.1.3 Productivity
The construction is considered as one of the lowest productivity sector in the nation’s
economy. The construction industry is facing the phenomena of largely low-skilled
workers and high dependence on low-skilled foreign workers. It relatively reflects on
the slow uptake of modern technologies and practices in the industry.

33
The aim of the third strategic thrust is to improve the construction industry
productivity more than double, matched by higher wages. More specifically, CITP
targeted to increase productivity by 2.5 times, the average value contributed by each
worker per worker to US$ 16,500. It is to increase the construction industry
productivity and to become one of the major contributors the nation’s high-income
by the year of 2020.
2.4.1.4 Internationalisation
The nation participation in Malaysia’s Free Trade Agreements (FTAs) and the
upcoming Trans-Pacific Partnership Agreement (TPPA) has given MCI the
opportunity to be exposed to a larger consumer market as well as to encourage the
intrusion of the foreign companies in local market. The exposure to the international
market means increased competition and scrutiny for the MCI players to survive.
Higher performance and standards are to be fulfilled by the MCI players in order to
sustain in the relatively competitive market.
The aim of the fourth strategic thrust is to establish Malaysian champions that can
lead and take charge locally and globally. It is targeted to achieve the goals of fifty
companies with G8 status, ten companies with 5-star SCORE rating, and ten more
companies to export construction services in the global market. The Malaysian leader
companies will contribute to the high-income goal by winning back domestic market
share and be able to survive the competitions in overseas market.
Table 2-6: Summary of the review on strategic thrusts.
Strategic Thrusts Current situation Aims
Quality, Safety & Professionalism
Limited emphasis on quality and assessment, limited safety awareness as well as added regulatory constraints within the industry.
Quality, safety, and professionalism to be ingrained in industry culture.
Environmental Sustainability
Prevalence of construction practices that are inefficient and risk harming the environment.
Malaysia’s environmentally sustainable construction to be a model for the emerging world.
(Continued)

34
Productivity
Largely low-skilled construction workforce, with the industry highly dependent on low-skilled foreign workers. Industry productivity levels are one the lowest in the economy and as compared with developed economies, with slow uptake of technology and modern practices.
Productivity of the industry is more than doubled, match by higher wages.
Internationalisation
Malaysian construction players yet to emerge as real contenders on the global stages and facing decline in local market share.
Malaysian champions to lead the charge locally and globally.
2.5 Problems in the Malaysian Construction Industry (MCI)
Problems faced by the construction industry have been discussed globally in a wealth
of literature. Over the years, CIDB has continuously outlined the problems faced by
the MCI. For example in the Construction Industry Master Plan 2006 -2015 (CIMP),
it emphasised the weaknesses in the construction, which include low productivity,
low quality, highly dependence on foreign workers followed by various ensuing
health and social problems.
Master Plan for the Occupational Safety and Health in Construction Industry (2005-
2010) also highlighted serious MCI problems such as shortage of manpower, delays,
low quality, poor image, delays, shortage of manpower, lack of data and information,
and low productivity. In the latest Construction Industry Transformation Programme
(CITP), CIDB once again reviewed the construction problems enclosed the real and
substantial issues, which still persist in the construction industry. These include
largely low-skilled workforce, over-dependence on foreign labours, low productivity,
low quality awareness, risk harming environment, inefficient construction practices,
low adaption on modern technologies and practices, decline in local market share,
low competency as global contenders.

35
Some of the local writers have also reported the problems in the MCI such as Abdul-
Rahman and Alidrisyi (1994), Razak Bin Ibrahim et al. (2010); Sambasivan and
Soon (2007), and Hamid and Kamar (2010) have showed their concerns for the MCI
to modernise and reform the issues being raised by the clients and stakeholders. The
issues being mentioned include low quality on building finishes and infrastructures,
lack of partnering initiatives, contractors’ poor performance, lack of procurement
strategy, and lack of building systems and green construction knowledge.
Ibrahim et al. (2010) found that low usage technology is the main cause of low
productivity in the industry. Although the Government has set out policy to use and
implement modern technology to boost the industry's performance and productivity,
however, Ibrahim et al. (2010) commented that efforts by CIDB to realise this policy
were insufficient. He further commented that the major issues faced by the
contractors, such as the absorption, usage, and benefits of the new technology were
not fully considered. Very often, the guidelines and recommendations made failed at
the implementation stage and did not succeed to go through the construction phase.
Kamal et al. (2012) identified that the characteristics of the construction industry and
current construction practice have led to serious problems in the industry. The MCI
is highly fragmented, non-standardised, and constitute a multitude of professions,
occupations, and organisations. There is a major separation between client,
consultants, main contractors, sub-contractors, and workforce at site. The long-chain
subcontracting culture: outsourcing various jobs to sub-contractors and project
tendering system based on competitive price, has resulted in variations of design,
cost, and other claims that led to dispute.
Pratt (2000) mentioned in his report that the Malaysian construction projects
particularly in the magnificent projects were not function and cost effective. The
construction projects exceeded the budget, never complete on time, and did not meet
the quality standard. The problems and issues in MCI have been long discussed
along the construction development. It is noticeable some of the construction
problems remain persistent in the industry despite the efforts being made by the
Government. These construction problems would definitely bring some negative

36
effects to MCI itself as well as the nation’s economy. The effects of the MCI
problems will be discussed in the following paragraph.
Figure 2-7: Summary of MCI problems.
2.5.1 The Case of Bakun Hydroelectric Project (BHP)
The Bakun Hydroelectric Project (BHP) in East Malaysia will be used as a case
study to investigate the current status of the MCI. The BHP is one of the Sarawak
Corridor of Renewable Energy (SCORE) projects intended along with dozens of
other dams, to attract energy-intensive industries, create jobs, and grow the economy.
However, it has been reported there were many problems and challenges involved in
the project.
One of the challenges faced by BHP was cost overrun. Sovacool and Bulan (2012)
reported the initial project cost was quoted at RM 6 billion and it later increased to
MCI problems Low safety awareness
Poor quality finishes
Low quality
Poor performance of contractors
Low productivity
Over dependency on foreign labour
Low skilled workers
Shortage of manpower
Poor image
Regulatory constraints Slow uptake on technology & modern practices
Lack of knowledge on building systems
Procurement strategy
Lack of partnering initiatives

37
RM 8 billion resulting in 33% over the initial budget. Rani (2010) argued that the
true cost of construction swelled to RM 15 billion, which would be a 60% cost
overrun. Most of the time, the consequences of project cost over runs is the
responsibility of the companies involved, whereas in this case, Sime Darby one of
the contractors of the dam building, suffered a RM1.7 billion cost overrun for the
BHP. They regarded this as “a very expensive lesson to learn”. Cost overrun
becomes an evitable occurrence regardless of what construction project type is
planned in the MCI.
Moreover, the study revealed some additional obstacles: lack of associated
infrastructure, excavation and construction difficulties, and coordination of
contractors and skilled manpower. Furthermore, lack of Malaysian technical capacity
and skilled manpower were the other issues for the BHP. Five to seven thousand
workers were imported from other countries for the project. Contracting with
foreign partners for their expertise such as, Alstom (France) and IMPSA (Argentina)
for the electrical and mechanical engineering work, MCH-JV (a joint venture
between Sino Hydro and Sime Darby) for the civil engineering work, Dong-ah
(South Korea) for diversion work, Global Upline for building the auxiliary coffer
dam, SESCO for constructing the transmission line and hundreds of other
subcontractors and bureaus (Sovacool and Bulan 2011). The project required a
diversity of job specifications and involved numerous professionals resulting in a
major project management challenge that required experienced and skilled project
managers. However, based on current published assessments, we can conclude the
MCI is still in an immature state in terms of handling construction projects such as a
large dam.
There were some comments from the hired partners. The report by Sovacool and
Bulan (2011) revealed that most of the partners did not have the necessary
experience in dam-building. For example, IMPSA (Argentina) who was chosen to
build half of the turbines required for the project and Sime Darby hired for the civil
engineering work, were brought in with no prior experience in damn construction.
Delays inevitably occurred, and the authors blamed these inexperienced partners.
This evoked loud criticism regarding the contractors’ selection, where the selection
38
of the contractors and partners was believed to have resulted from rather suspect
political “negotiations”. In the end, the criticism aimed at this practice involving
billions of RM put the construction practices of the MCI in a rather unimpressive
light.
From the case study above, we can conclude that the MCI is still facing some major
challenges in handling construction projects. The long discussed problems of delays,
and cost overruns are still occurring today. In spite of advanced technology and
management systems being adopted, the status of the MCI does not seem to have
improved accordingly. An investigation into MCI’s challenges in finding an all-
encompassing solution is a field worth looking into.
2.6 Implications of Construction Problems
2.6.1 Delays
A delay can be defined as the late completion of project work compared to the
planned schedule completion in the contract. In 2005, about 17.3% of government
contract projects in Malaysia were considered ‘problematic’ with delays of more
than three months (Sambasivan and Soon 2007). Abdul-Rahman et al. (2006) found
45.9% of projects had delays in the completion dates during the construction stage. A
study conducted by Abdullah, Rahman and Azis (2010) showed that 90% of the
Mara management procurement projects ended up being delayed with the main
causes of the delays all due to contractors’ actions such as financial difficulties, poor
site management, and ineffective planning and scheduling.
Delays can result in disruption of work and loss of productivity, late completion of
the project, increased time-related costs, third party claims, and abandonment or
termination of the contract. Delays are costly and often result in disputes and claims.
Six effects of construction delays were identified in a few different studies (Aibinu
and Jagboro 2002; Abedi, Fathi and Mohammad 2011): time overrun, cost overrun,
dispute, arbitration, litigation, and total abandonment. The most frequent
39
consequences of project delays are the extension of the project duration and cost
overrun.
Sambasivan and Soon (2007) interviewed clients, consultants, and contractors on the
causes of delays in construction projects and the 10 most common causes identified
were; (1) contractor’s improper planning, (2) contractor’s poor site management, (3)
inadequate contractor experience, (4) client’s inadequate financing and payment for
completed work, (5) problems with subcontractors, (6) shortage of material, (7)
labour supply, (8) equipment availability and failure, (9) lack of communication
between parties, and (10) mistakes during the construction stage.
2.6.2 Time Overrun
Another study conducted by Memon, Rahman, and Azis (2011) revealed that 30
large construction projects in Malaysia were identified as encountering time overrun
during construction, with the average time overrun of 34.74%. Among the 30
construction projects, 56.67% had encountered between 1- 100 days of time overrun,
16.67% faced between 101 – 200 days, 16.67% had between 201 – 300 days, and 3%
encountered overruns of more than 300 days. The findings from the perspective of
project management consultants (PMC) again, showed the contractors were
responsible for the time-overrun issues and should be required to manage their cash
flow and financial resources, improve site management, and conduct efficient
planning and scheduling.
One of the major consequences of time overrun in construction projects is the cost
overrun. Cost overruns have proven to demonstrate a positive and strong linear
relationship with time overrun in a study conducted by (Sambasivan and Soon 2007).
The results indicated the higher the percentage of time overrun, the higher the project
costs and overestimated costs will likely be unacceptable to the client at the project
feasibility stage as it will result in financial losses for the contractor and/or client.

40
2.6.3 Cost Overrun
Cost overrun is one of the major problems in the construction industry today,
including in Malaysia. A study by Shehu et al. (2014) found more than half of
Malaysian construction projects (55%) did not complete within the budget originally
agreed. The most common factors causing cost overruns in the Malaysian
construction industry were; poor design and delays in design, unrealistic contract
duration and requirement imposed, lack of experience, late delivery of materials and
equipment, relationship between management and labour, delay in preparation and
approval of architecture drawings, inadequate planning and scheduling, poor site
management and supervision, and mistakes during construction (Memon, Rahman
and Azis 2011). As mentioned before, most of the causes were related to project
management matters. Lack of management system expertise and lack of the ability to
control construction costs could cause the construction companies to fail
(Charoenngam and Sriprasert 2001).
Notably, Shehu et al. (2014) showed some interesting contradictions from the
majority of the literature. The Malaysian public sector has been long criticized for its
low performance, and usually, private projects perform better than public schemes
(Sweis et al. 2013). However, (Shehu et al. 2014) indicated the Malaysian public
sector projects seemed to perform better than private sector development projects
and this is an uncommon phenomenon. Surprisingly, traditional procurement was
found to be more likely associated with reduced costs compared with other
procurement methods of project management, design and construction. This is in
contrast to most project management literature where project management claims to
have a better project performance (Bryde 2003; Cooke-Davies 2004; Gita, Kam and
Tak 2014). This is a compelling finding worth investigating to determine the current
MCI phenomena and the future direction of project management methods.
2.6.4 Dispute
A dispute exists when a claim or assertion made by one party is rejected by the other
party, and that rejection is not accepted (Kumaraswamy and Yogeswaran 1998).
41
When disputes occur in project management, three aspects will be questioned; who,
how much, and what. Who caused the overrun, how much of a delay occurred, and in
what terms should the monetary awards be made. Disputes can be a result of many
reasons but are mainly due to financial losses incurred.
Many researchers have studied construction industry disputes (Sambasivan and Yau
2007; Aibinu and Jagboro 2002; Carmichael 2002; Odeh and Battaineh 2002). They
have concluded there are a large number of variables that contribute to construction
disputes, which are difficult to summarize. However, it is evident construction
disputes inevitably arise from a delay in completion schedule, budget overrun, and
the quality of work and these are all contractor-related problems. Carmichael (2002)
identified the contractor-related causes of disputes, which include the contractor’s
inadequate management, supervision and coordination of the work, delay or
suspension of work, and failure to plan and execute any necessary changes to the
work. Contractors play a prominent role in managing a construction project in terms
of time, cost and quality; if all of these were managed well, disputes would be less
likely to occur.
2.6.5 Arbitration
Arbitration is a process of settling disputes between parties without litigation in the
courts. There is no statutory definition of arbitration. The Concise Oxford Dictionary
simply states it is “the settlement of a dispute by an arbitrator”.
In construction disputes, arbitration is preferred compared to litigation, the main
advantage being the speed with which hearings can commence unlike the delays and
uncertainties in the court system, which can take months. The date of a hearing can
be set for the convenience of all parties and heard in private, and their peers, who are
conversant with their work, will act as surrogate judges for the dispute.

42
2.6.6 Litigation
Litigation is the use of the court system to resolve disputes. In litigation, the process
begins with the issue of a writ for a hearing and then on to judgment. One of the
failures of the legal process has been the speed with which solicitors have been
prepared to issue writs. After the writ has been issued, the plaintiff cannot simply
withdraw his writ, as a counterclaim would be found against him along with any
associated costs.
Disputes meeting certain conditions are required to be resolved through litigation.
These include disputes involving a substantial legal issue, multiple-parties,
allegations of dishonesty, difficulty, and a party who refuses to compromise and
requests a court ruling.
2.6.7 Total Abandonment
Table 2-7: Abandoned Housing Projects (Peninsular) Statistics.
Year Abandoned projects
Affected house units No. of affected families
2011 235 2012 177 2013 204 27,177 19,016 2014 165 32,582 24,018 2015 151 26,934 17,862
The latest report by Ministry of Housing and Local Government (MHLG) indicated
that the total number of abandoned projects for 2015 reached 151. These abandoned
projects comprise 26,934 units of houses involving 17,862 families. As of July 2016,
20 projects were under the revival process, involving 6,154 units and 4,610 house
buyers. Meanwhile, 24 projects were still under review process for revival, involving
5,880 units and 3,615 house buyers. The abandoned projects can be traced back 31
years to 1985. Moreover, 414 developers have been blacklisted by the MHLG due to
their incompetence in completing their housing developments.
The abandoned housing projects have resulted in multiple adverse consequences to
the economy, society, and environment, especially the house buyers (Razak,

43
Mohammed and Tarique 2015). The homebuyers have to endure the inability to
occupy the property, and instead, must continue servicing the bank loan and continue
paying rent for other property to live. They also bear the loss of any rental value and
property value appreciation. The worst situation is when the buyers are blacklisted
due to the inability to repay the bank loan and lose the opportunity to purchase
another new house.
One of the initiatives by the government to overcome the abandoned projects is
through rehabilitating. In 2008, a new division under the Jabatan Perumahan Negara
(JPN), which is the Division of Rehabilitation of Abandoned Projects, was
established. From 2009 to 2012, 104 out of 177 abandoned projects have been
revived under this program (MHLG 2012). However, there have been nine projects
classified as having no chance for revival by the MHLG (2005). These nine projects
comprise 2,866 units of houses involving 1,364 house buyers. The total value was
estimated to at RM452.29 million.
Figure 2-8: Summary of implications of construction problems.
Delay
Cost overrun
Time overrun
Delay
Dispute
Arbitration
Litigation
Total abandonment
Implications of
construction
problems

44
2.7 Summary
This chapter explains how the construction industry is vital to the economy and
development of the nation. The construction industry is a complex process
characterized by a multitude of stakeholders and professionals. Effectively managing
a construction project is a significant challenge for the Malaysian construction
industry. The CIDB, a government organization governing the construction industry,
requires all building contractors in Malaysia to be registered by grades (G1 to G7).
The categorization of grades is determined by the company's experience, capability,
and financial status, which mean the higher the grade, the greater the company
profile is. Most importantly, the requirement that G7 contractors to be ISO 9001
certified ensures a higher quality of the contractors in the country. A new G8
category was proposed by the CIDB in the CITP (Construction Industry
Transformation Program), which would supersede the G7 rating as the highest grade.
Earning the G8 status comes with even more stringent rules than the G7 grade. The
adoption of quality management and an internationally recognized quality
certification will aid the G8 applicants. The CITP has targeted 50 Malaysian
companies to obtain G8 status within the five years allowed for this programme.
These government programs are a result of the importance of high quality work in
the construction industry and the role the MCI plays in developing the nation. The
G7 contractors with their certified qualifications fit the profile of this study, and they
have been selected as the sample for this study.
The CITP, a programme launched by the Malaysian government, concludes the MCI
still subject to low quality work and low productivity due to an over dependence on
low-skilled foreign workers, and a little interest in technology and modern practices.
The construction industry is declining in the local market share and yet to become a
real competitor in the global market. A summary from the literature review of the
construction problems and the consequences was discussed, followed by an
explanation of the current situation faced by the MCI. Doubts have been raised
regarding the current performance quality, and whether the construction industry is
able to achieve the strategic objectives set by the CITP, to do high quality work, to
meet safety and professionalism standards, achieve high productivity, maintain

45
environmentally sustainable practices, and an internalized industry. Focusing on the
construction industry’s problems and the remedies to overcome the problems is
encouraged in developing a modernized construction industry in Malaysia.
46
CHAPTER 3
LITERATURE REVIEW
3.0 Introduction
This chapter discusses the concept of quality in the perspective of the construction
industry. The literature of TQM follows, including the definition of and evolution of
TQM. The TQM practices, adopted originally from the Malcolm Baldridge National
Awards (MBNQA) and the Baldridge criteria are discussed in detail. Next, this
section discusses the dimensions of project performance. The relationship between
each of the TQM practices and project performance are reviewed. This chapter ends
with a brief summary.
3.1 Conceptualization of Quality
Quality is defined as the “degree to which a set of inherent characteristics fulfils
requirements” according to the ISO 9000: 2008. However, the term is used broadly
in various contexts, and different people view quality differently based on their
expectations of the product. There is no common definition of quality (Almusharraf
2015). Some of the agreed definitions of quality are; fitness for use, conformance to
specifications, paid value, support services, and psychological criteria (Reid and
Sanders 2011).
According to the ASCE study in Günaydın (1995), the construction industry defined
quality as fulfilling the requirements of the multiple stakeholders namely the owner,
design professionals, contractor, and the regulatory agencies. For instance, meeting
of customers’ requirements of functional adequacy, completed on time and within
budget, minimum operation and maintenance costs; fulfilling design requirements of
time and budget allowance; meeting contractors’ requirements such as provision of
detailed contract plans, writing specifications and other related documents related to
the construction process; last but not least meeting the regulatory agencies’
47
requirements including conformance with building laws, regulations, codes, and
policies.
In the construction industry, there are two types of quality; product quality and
process quality (Günaydın 1995). Product quality is directed to the physical product
itself such as equipment, technology, and building materials quality that are applied
to the building construction. Meanwhile, process quality means the standard of the
production process that produce acceptable or faulty product. It refers to the
organization and management of a project during the phase in construction where
planning and design, construction, and operation and maintenance occur. Both types
of quality are equally important in the construction industry; product and process
quality will eventually determine the product’s performance.
3.2 Total Quality Management (TQM)
Total Quality Management (TQM) is designed to improve quality performance at
every level of the organization through an integrated effort. TQM is about meeting
quality expectations of customers, sometimes referred to as ‘customer-defined
quality.’ However, a clear definition of quality is difficult as different people have
different opinions on the definitions of high quality.
Oakland (2014) has defined TQM as follows:
Total Quality Management (TQM) is an approach to improving the effectiveness and
flexibility of business as a whole. It is essentially a way of organizing and involving
the whole organization; every department, every activity, every single person at
every level.
3.3 Evolution of Total Quality Management (TQM)
The concept of quality has been long existed and has evolved over time. The notion
originated in the early twentieth century, where inspections were used to assure
conformity to specific requirements in producing products (Dale, Van der Wiele and
48
Van Iwaarden 1999). However, during the Industrial Revolution, the growing
organizations and production require more than just inspection for the quality
conformance (Taylor 1911). Therefore, the quality control through more effective
operations is needed.
In 1911, Fredrick W. Taylor introduced statistical theory framework in his book of
‘The Principles of Scientific Management’. This framework was used to improve
productivity of workers in industrial sector. Some of the important concepts
introduced by Taylor are control of quality, process analysis, and functional
specialization. These concepts are recognized and still in practice until today.
During the 1920s, Dr. Walter Shewhart introduced quality control in a more
proactive way. He applied statistical theory to the quality management and
developed the first modern control (Shewhart 1926). Shewhart’s work is the starting
of statistical quality control (SQC) and was published in 1931 as Economic Control
of Quality of Manufactured Product. He proved that improved quality of the final
product can be achieved through elimination of variation in the process. He is the
founder of the statistical process control systems, and he is often regarded as “the
father of modern quality control” (Shewhart 1931).
During World War II in the 1940’s, statistical quality became evident. The quality of
weapons production process was monitored using Shewhart’s statistical control
techniques – the quality control charts. Gen. MacArthur then sought for Shewhart’s
assistance in rebuilding the Japanese industries after the war. Instead, Shewhart
recommended his Western Electric protégés, W. Edwards Deming and Joseph Juran
for this task.
Dr. W. Edwards Deming stressed individuals and the company’s management are
important in delivering quality. According to Deming (1982), 85% of quality
problems are due to processes, systems, and poor management, where only worker
error only accounted for 15%. He further emphasized that an organization’s culture
changes with management’s commitment to quality as the path to achieving high
quality. Deming popularized Shewhart’s ‘Learning and Improvement Cycle’ as the
Plan-Do-Study-Act (PDSA) Cycle (Moen and Norman 2006). In addition to
49
Deming’s philosophy of management, Deming’s Fourteen Points of Quality was
developed to help guide organizations, regardless of size and type, in achieving
quality improvement.
Deming’s Fourteen Points of Quality (Deming 1982) consists of (1) creating
constancy of purpose towards improvement of product and service, (2) adopting the
new philosophy, (3) ceasing dependence on mass inspection, (4) ending the practice
of awarding business on the basis of price, (5) finding errors, (6) instituting modern
methods of training on the job, (7) instituting modern methods of supervision of
production workers, (8) driving out fear, (9) breaking down barriers between
departments, (10) eliminating numerical goals, (11) eliminating work standards that
prescribe numerical quotas, (12) removing barriers that stand between the hourly
worker and their right to pride of workmanship, (13) instituting a vigorous
programme of education and retraining, and (14) creating a structure in upper
management. Deming’s principles have been successfully proven in global
companies such as Toyota, Gamble, Ritz-Carlton, Harley-Davidson, as well as other
well-known organizations (Daft 2010).
Meanwhile, Dr. Joseph Juran went to Japan in 1951 to work with manufacturers and
conducting classes on quality. Juran’s notion of quality as ‘fitness for use’ concerns
about customer needs and requirement of the products use instead of emphasizing
technical specification conformance. He developed the concept of ‘cost of quality’,
which enables justification of quality regarding money value. He is well known for
his quality set: quality planning, quality control, and quality improvement (Juran
1986).
Quality planning is to determine customer, product requirements, and business goals.
Then, set up the processes needed to meet the standardized requirements. The second
part focuses on the application of statistical control methods to monitor the quality
standards through identification of variations. The last part is quality improvement
through continuous innovation. Both Deming and Juran stressed workers’ continuous
improvement through a regular process of skills training.

50
In the 1960’s, the quality concept took on a broader meaning. Quality was seen as a
total concept that affected not only the production processes but also the entire
organization. All the company functions were responsible for product quality, and all
shared the costs of poor quality. The Japanese embraced the teachings of these
Western quality “gurus”, and adopted, and developed their own quality concepts i.e.
Kaizen. Kaizen adopted the quality management principles of TQM and ‘lean’
manufacturing and embedded them in the organization’s values.
During the 1970’s and 1980’s, foreign companies offered the concept of higher
quality product with lower price. Japanese products began to overtake American
market share especially in the automobile and electronics industry as Toyota, Honda,
Sony, and Toshiba led the way. This was when American industries started to
become aware of the importance of quality, by observing Japanese successes. U.S
corporations started to expand the theories and methods as quality improvement.
Armand V. Feigenbaum (1956) introduced the conceptual foundations and practical
applications of quality management through his ‘40 steps of quality’ principles. He
stressed a total quality system approach is the commitment of the entire
organizations in improving quality. Feigenbaum is therefore considered the founder
of Total Quality Management.
Later, Philip B. Crosby developed with the “Do it right the first time” concept. In
1979, Crosby was famously coined the phrase “quality is free” and other seminal
concepts such as “Zero Defects”. He pointed out that many of the quality costs are
inclusive of organizational costs and are hard to quantify.
Crosby’s four absolutes of quality consists of (1) quality is conformance to
requirements, (2) the quality system of prevention, (3) zero defect as the performance
standard, and (4) price non-conformance as the quality measurement.
The Yong and Wilkinson (2002) study, marked a touchstone in the TQM
evolutionary journey over four phases i.e. inspection, quality control, quality
assurance, and finally becoming TQM. The evolution of TQM grew from inspection,
identification and correction of errors, quality manuals and controlling process
51
performance. Next, it developed into more comprehensive manuals and systems by
third-party certification, expanded to all areas of the organization instead of
production process. Finally, it evolved through the use of standardized techniques
such SPC with continuous improvement.
The concept of quality has developed over the years. It evolved from a reactive
approach where quality problems are only corrected after they occur, into a proactive
approach, where quality is built into the product or process design. The initial
concept of quality where quality was regarding inspection and variations correcting
evolved into statistical control techniques using charts. Total commitment involving
the entire organization from management to all levels of staff delivering quality was
then introduced. Quality started to have a strategic meaning.
Today, improving quality has become a survival factor for all companies. Successful
companies understand quality provides a competitive advantage and maintaining
customers is important. The customer-driven quality approach arose when meeting
or exceeding customer expectations became the total quality objective.
3.4 Total Quality Management (TQM) Practices
Many researchers have defined TQM in various ways although they are generally
complementary to each other. The number and significance of TQM elements vary
from one author to another. This leads to dis-agreement regarding the design of TQM
from the literature (Dahlgaard-Park 2011). Problems appeared when a diversity of
TQM dimensions occurred. Many researchers have preferred to develop their own
model instead of using a proven constructed model, which has been tested by
preceding authors. As a result, agreement on a set of common TQM practices
defining the wide range of TQM frameworks is problematic (Prajogo and
McDermott 2005; Psomas, Vouzas and Kafetzopoulos 2014).
Quality awards have been adopted as the TQM framework in many studies
conducted in other countries. There are more than a hundred quality awards existing
in various countries. All these quality awards have been derived from earlier

52
prestigious awards: the Malcolm Baldridge National Quality Award (MBNQA), the
European Quality Award, and the Deming Prize (Jaeger, Adair and Al-Qudah 2013).
Taking into consideration the widespread acceptance of the MBNQA quality criteria,
these criteria best represent TQM and were chosen for the analysis of construction
organizations in Malaysia. The rationale for adopting MBNQA in this study is that it
is widely recognized as one of the benchmarks of TQM and many scholars have
validated this system of TQM practices (Prajogo and McDermott 2005; Terziovski
2006; Ooi et al. 2011; Sabella, Kashou and Omran 2014). This framework is also
relevant and appropriate to both manufacturing (Ooi et al. 2013) and non-
manufacturing sectors (Bouranta, Psomas and Pantouvakis 2017). In this study,
TQM practices based on the MBNQA model were adopted for the following reasons:
1. It contains both soft and hard elements of TQM (Talib, Rahman and Qureshi
2013; Lee, Ooi and Choong 2013; Lee and Ooi 2015);
2. It has been adopted by many researchers in their empirical research (Talib,
Rahman and Qureshi 2013; Lee, Ooi and Choong 2013; Lee and Ooi 2015);
3. It has been implemented in both developing and developed countries (Lee,
Ooi and Choong 2013; Lee and Ooi 2015);
4. It has been applied in construction projects (Lam, Lam and Wang 2008;
Jaeger, Adair and Al-Qudah 2013).
MBNQA’s framework incorporates seven independent quality criteria: leadership,
strategic planning, customer/market focus, process management, human resource
focus, measurement/analysis, and results. Each of the criteria will be discussed in
detail in the following section.
3.4.1 Quality Awards: Malcolm Baldridge National Awards (MBNQA)
The Malcolm Baldridge National Quality Award (MBNQA) was developed by the
U.S. Congress in 1987 to raise the quality awareness and stimulate quality initiatives
to increase competitiveness in the business community. It is also an award and
recognition given annually to companies that demonstrate quality excellence and
establish best-practice standards in the industry.

53
The award is given to no more than two companies in each category. There are three
categories namely manufacturing, services, and small business. The companies are
selected based on the Baldridge Criteria for Performance Excellence as illustrated in
in Table 3-1.
Table 3-1: Categories and Items of MBNQA
Categories and Items 1 Leadership 1.1 Senior Leadership 1.2 Governance and Societal Responsibilities 2 Strategic Planning 2.1 Strategic Development 2.2 Strategy Implementation 3 Customer Focus 3.1 Voice of Customer 3.2 Customer Engagement 4 Workforce Focus 4.1 Workforce Environment 4.2 Workforce Engagement 5 Operation Focus 5.1 Work Processes 5.2 Operational Effectiveness 6 Measurement, Analysis, and Knowledge Management 6.1 Measurement, Analysis and Improvement of Organizational Performance 6.2 Knowledge Management, Information, and Information Technology 7 Results 7.1 Product and Process Results 7.2 Customer-Focused Results 7.3 Workforce-Focused Results 7.4 Leadership and Governance Results 7.5 Financial, and Market Results
3.4.2 Baldridge Criteria
This model comprises seven criteria for performance excellence categories namely:
(1) leadership, (2) strategic planning, (3) customer focus, (4) measurement, analysis,
and knowledge management, (5) workforce focus, (6) operation focus, and (7) results.
However, this research will exclude the last criteria i.e. results, as the criteria of
results for project performance will be developed by the author and be discussed
54
later in this chapter. The following sections will look into each of the categories and
the issues raised.
3.4.2.1 Leadership
According to the National Institute of Standards and Technology (NIST), leadership
is subdivided into two types: senior leadership, and governance and societal
responsibilities (Lee and Ooi 2015). This section focuses on senior leader’s guidance
in leading and sustaining an organization, the organization’s governance system and
its legal, ethical, and societal responsibilities in supporting the key stakeholders
(Lam, Lam and Wang 2008; Lam et al. 2012; Ooi 2014).
Senior leadership examines an organization’s upper management leadership. The
focus is on the actions of senior managers in creating and sustaining a high-
performance organization, such as setting an organization’s vision, values, and
mission, promoting legal and ethical behaviour, and creating a sustainable
organization. It also includes the communication between a leader and the entire
workforce and key customers in order to improve organizational performance and
focus on actions to achieve the organization’s objectives.
Governance and societal responsibilities review an organization’s approach to
achieve the key aspects of the organization’s governance system, including the senior
leaders’ performance evaluation. It also includes following appropriate legal and
ethical behaviour, societal responsibilities, and supporting the key stakeholders.
3.4.2.2 Strategic Planning
Strategic planning is sub-divided into two sub-sections: strategy development and
strategy deployment (Lam, Lam and Wang 2008; Jaeger, Adair and Al-Qudah 2013;
Lee and Ooi 2015). The primary focus here is on an organization’s development and
deployment of strategic objectives and action plans, any changes of circumstances
required, and measuring progress (National Institute of Standards and Technology
2013).

55
Strategy development examines an organization’s strategy development process in
setting strategic goals and develops strategic objectives, leading and enhancing the
organizations overall performance. Activities include the strategic planning process
to address strategic challenges and leverage its strategic advantages and strategic
opportunities, key work system decision-making, key strategic objectives, and goals.
Strategy implementation will be evaluated regarding the allocation of resources and
the workforce to support and deploy the strategic objectives into action plans. In
addition, the indicators and key measurements would be developed by the
organization to track the effectiveness of the action plans and include benchmarking
with other comparable organizations and finally a modified action plan if
circumstances suddenly challenged the organization.
3.4.2.3 Customer Focus
This category is subdivided into two sections: (1) voice of the customer and (2)
customer engagement (Lam, Lam and Wang 2008; Jaeger, Adair and Al-Qudah 2013;
Lee and Ooi 2015). This section addresses an organization's engagement with its
customers for long-term marketplace success. By determining requirements,
expectations, and preferences of customers through active listening to customers this
will established an improved relationship with customers. This criteria also focuses
on how an organization determines key concerns using information from customers
to improve and identify opportunities for innovation that leads to customer
satisfaction and loyalty (National Institute of Standards and Technology 2013).
Understanding customers’ needs and requirements are one of an organization’s key
processes for obtaining information about current and potential customers and
markets and leads to greater understanding of emerging customer requirements and
expectations. This criteria also allows for tracking markets changes to provide
opportunities to offer more relevant products and services. This practice includes
listening actively to customers and collecting information on their satisfaction,
dissatisfaction, and engagement.

56
Customer engagement includes an organization’s processes in serving customers'
needs and building a relationship with them. The activities include determining
customer and market requirements for product offerings, developing key
communication mechanisms to support customers, and identifying current and future
customer groups and market segments for business growth. Moreover, building
customer relationships is also a major aspect of customer engagement. It includes
activities involved in relationship management and complaint management to
acquire new customers and build new markets, retain customers, and enhance
customer engagement and develop a relationship with the organization.
3.4.2.4 Workforce Focus
This category is sub-divided into two sections: (a) workforce environment and (b)
workforce engagement (Sabella, Kashou and Omran 2014; Lee and Ooi 2015).
According to the National Institute of Standards and Technology (2013), workforce
focus emphasizes an organization's efforts in building a conducive working
environment, through engagement, management, and development of the workforce
to maximize its full potential driving the organization’s overall mission, strategy, and
action plans.
Workforce environment focuses on workforce ability and capacity management such
as competencies, skills, certifications, and staffing levels in accomplishing an
organization’s work, new workforce recruitment requirements, work
accomplishment management, and workforce change management. It also examines
the development of a supportive and secure work climate of an organization such as
a healthy and secure workplace, staff benefits, and policies.
Workforce engagement focuses on an organization's development of workforce
members, managers, and leaders to achieve a high performance through
improvement and innovation. This criterion involves workforce performance
management such as determining key elements that affect workforce engagement,
assessment of workforce engagement, and workforce and leader development.
57
3.4.2.5 Operation Focus
This category is sub-divided into two sections: (a) work processes and (b)
operational effectiveness (Jaeger, Adair and Al-Qudah 2013; Lee and Ooi 2015). The
first section focuses on an organization’s design, management, and the improvement
of its product and work processes, while operational effectiveness attempts to
improve customer value and achieve organizational success and sustainability
(National Institute of Standards and Technology 2013).
Work processes examine an organization's key work processes such as product and
process design based on key product and process requirements, process management
such as implementation, measurement, and improvement of key products and lastly,
processes to deliver products that achieve customer value and organizational success
and sustainability.
Operational effectiveness analyzes the effectiveness of an organization's operation on
an ongoing basis and into the future. The activities include overall operations costs
control, innovation management, safety and emergency preparedness, and supply
chain management.
3.4.2.6 Measurement, Analysis and Knowledge Management
This category is subdivided into two sub-sections: (a) measurement, analysis, and
improvement of organizational performance, and (b) knowledge management,
information, and information technology (Lam, Lam and Wang 2008; Lee and Ooi
2015). This section focuses on an organization’s selection, management, and use of
data and information for performance measurement and analysis in support of
organizational planning and performance improvement (National Institute of
Standards and Technology 2013).
Measurement, analysis, and improvement of organizational performance in this
category focuses on an organization’s process of measuring, analysing, reviewing,
and improving organizational performance by using data and information at all levels
58
and in all parts of the organization. It also examines the organization’s decision-
making process using comparative and customer data.
Knowledge management, information, and information technology evaluates an
organization’s process of managing and building its knowledge assets. It examines
how an organization ensures the availability of high-quality data and information,
and the software and hardware needed by the workforce, suppliers, partners,
collaborations, and customers.
3.5 Project Performance
The Project Management Institute (1996) defines a project as “a temporary
endeavour undertaken to create a unique product or service”. Projects are unique,
novel, specifically aimed at a certain goal, and have a clear finishing date. The nature
of projects, which are complex and unpredictable, causes serious challenges to
project-based organizations. Moreover, project-based organizations are
fundamentally different from standard organizations. Therefore, defining project
success is a difficult task (Alzahrani and Emsley 2013).
Within the context of a construction project, the success of a project may be judged
differently by the construction organizations depending on their objectives
(Neyestani 2016). What is viewed as a measure of success for one project may be
perceived as an indication of abject failure for another. In fact, it is hardly to
determine whether a project is a success or a failure because the concept of success
remains imprecise among project participants (Alzahrani and Emsley 2013).
Also, there is no commonly agreed framework for performance measurements
regarding projects (Toor and Ogunlana 2010). It is impossible to develop a universal
checklist for project success criteria due to the unique characteristics of the project
where each of the project is differ in terms of size, location, complexity, and
uniqueness(Westerveld 2003). Time, cost, and quality referred to as the ‘iron triangle’
are the commonly accepted performance indicators to measure the success of
construction projects (Meredith and Mantel Jr 2011; Mane and Patil 2015). Over the

59
years, the “iron triangle” criteria (time, cost, and quality) have been criticized
because they seemed to be inadequate measurements. Toor and Ogunlana (2010)
have reported the earlier performance criteria are no longer the determinant of
project success due to the evolution of project environments. Customer satisfaction
and the overall satisfaction of stakeholders should also be taken into consideration in
project performance evaluation criteria (Proust 2011; Neyestani 2016)
The conventional dimensions of the iron triangle, albeit often criticized, are still
considered vital in measuring the project success (Papke-Shields, Beise and Quan
2010; Neyestani 2016). This research uses the basic criteria, project efficiency as
discussed by Shenhar et al. (2001). Project performance was evaluated according to
the estimated budget, timeline, technical specifications (product/service
requirements), and the ability to fulfil customer service needs and requirements.
Therefore, in this research, the project performance was measured by applying
project efficiency standards (time, cost, and quality).

60
Table 3-2: Studies of TQM and elements of performance (2010 onwards).
Author Elements of performance Analysis procedure TQM framework
adopted
Sample Size Region Industry
specific
Kuo and Kuo (2010) Project performance Structural equation modelling TQM N=371 Taiwan Construction
Ali and Rahmat (2010) Project performance Mean TQM N=30 Malaysia Construction
Din, Abd-Hamid, and Bryde
(2011) Project management practices
Financial management
practices
Project success
MANOVA ISO 9000
N=336
Malaysia Construction
Agus (2011) Product performance &
customer-related performance
Pearson’s correlation & Structural
equation modelling
TQM Not mentioned Malaysia Manufacturing
Teh, Tritos, and Dotun
(2012)
Technology management Structural equation modelling TQM N=115 ASEAN (Thailand,
Malaysia, Philippines,
Indonesia, and
Vietnam)
Automotive
manufacturing
Talib, Rahman, and Qureshi
(2013) Quality performance Pearson’s correlation & Multiple
regression
TQM N= 172 India Service
Irfan and Kee (2013) Service quality Structural equation modelling TQM N-255 Pakistan Service
Ooi et al. (2013) Innovation performance Multiple regression MBNQA N=206 Malaysia Manufacturing
Mir and Pinnington (2014) Project success Bi-variate correlation &
Multiple Regression
PMPA N=154
United Arab Emirates Construction
Sadikoglu and Olcay (2014) Firm performance Multiple regression TQM N= 242 Turkey Not mentioned
Leong et al. (2014) Project performance Correlation & regression analysis TQM N=1030 Malaysia Construction
Banna, Ahmad, and Koh
(2016) Bank loan quality FAMA-MacBeth regression TQM N=581 United State Bank
Shafiq, Lasrado, and Hafeez
(2017)
Organizational performance Structural equation modelling EFQM N=210 Pakistan Textile
Mehralian et al. (2017) Organizational performance Structural equation modelling TQM N=933 Iran Pharmaceutical
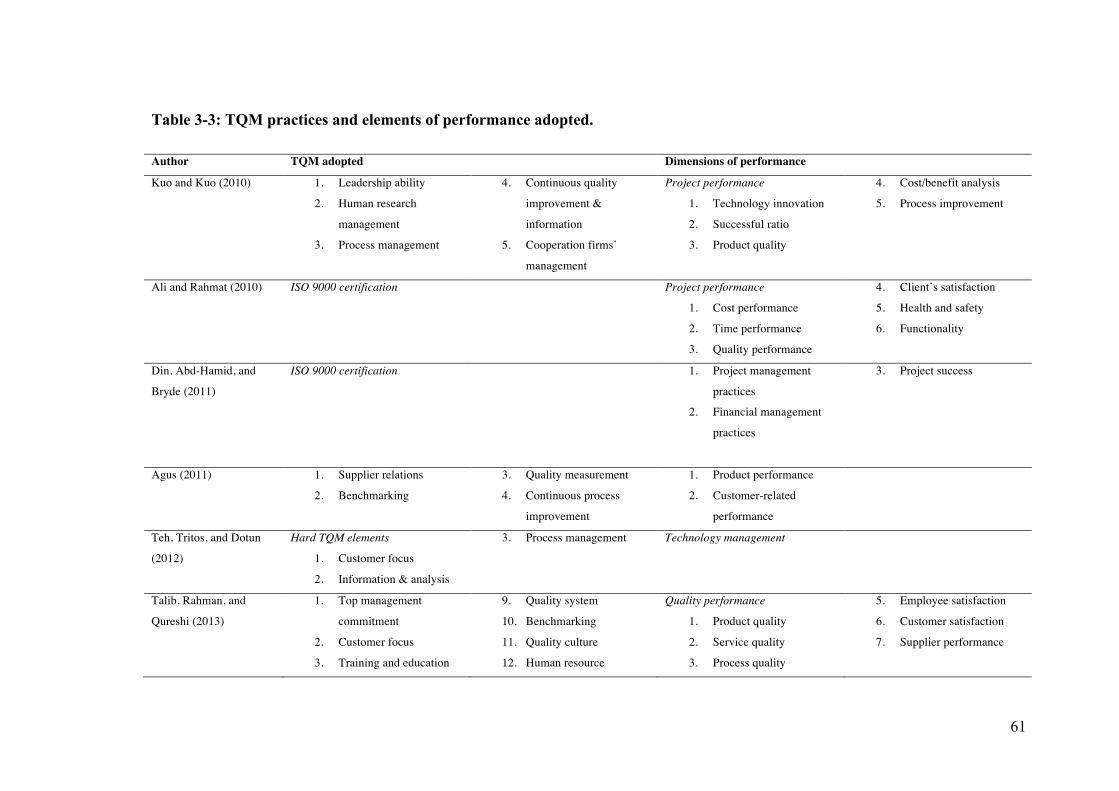
61
Table 3-3: TQM practices and elements of performance adopted.
Author TQM adopted Dimensions of performance
Kuo and Kuo (2010) 1. Leadership ability
2. Human research
management
3. Process management
4. Continuous quality
improvement &
information
5. Cooperation firms’
management
Project performance
1. Technology innovation
2. Successful ratio
3. Product quality
4. Cost/benefit analysis
5. Process improvement
Ali and Rahmat (2010) ISO 9000 certification Project performance
1. Cost performance
2. Time performance
3. Quality performance
4. Client’s satisfaction
5. Health and safety
6. Functionality
Din, Abd-Hamid, and
Bryde (2011)
ISO 9000 certification 1. Project management
practices
2. Financial management
practices
3. Project success
Agus (2011) 1. Supplier relations
2. Benchmarking
3. Quality measurement
4. Continuous process
improvement
1. Product performance
2. Customer-related
performance
Teh, Tritos, and Dotun
(2012)
Hard TQM elements
1. Customer focus
2. Information & analysis
3. Process management Technology management
Talib, Rahman, and
Qureshi (2013)
1. Top management
commitment
2. Customer focus
3. Training and education
9. Quality system
10. Benchmarking
11. Quality culture
12. Human resource
Quality performance
1. Product quality
2. Service quality
3. Process quality
5. Employee satisfaction
6. Customer satisfaction
7. Supplier performance

62
4. Continuous improvement
and innovation
5. Supplier management
6. Employee involvement
7. Information & analysis
8. Process management
management
13. Strategic planning
14. Employee encouragement
15. Teamwork
16. Communication
17. Product & service design
4. Employee service quality
Irfan and Kee (2013) 1. Top management
commitment & visionary
leadership
2. Customer focused
3. Information, analysis &
system
4. Service culture
5. Human resource
management
6. Social responsibility
Service quality
1. Customer satisfaction
2. Employee satisfaction
Ooi et al. (2012) 1. Leadership
2. Strategic planning
3. Customer focus
4. Information analysis
5. People management
6. Process management
Innovation performance
Mir and Pinnington
(2014)
PMPA (Bryde 2003)
1. PM leadership
2. PM staff
3. PM policy & strategy
4. PM partnership &
resources
5. PM KPI’s
Project success
1. Project efficiency
2. Impact on customer
3. Impact on the team
4. Business success
5. Preparing for the future
Sadikoglu and Olcay
(2014)
1. Leadership
2. Knowledge and process
management
3. Training
4. Supplier quality
management
5. Customer focus
6. Strategic quality planning
Firm performance
1. Operational performance
2. Inventory management
performance
3. Employee performance
4. Innovation performance
5. Social responsibility
6. Customer results
7. Market and financial
performance
Leong et al. (2014) ISO 9000 certification Project performance
1. Cost performance
2. Time performance
3. Time performance
4. Quality performance
5. Safety and health
6. Clients’ satisfaction
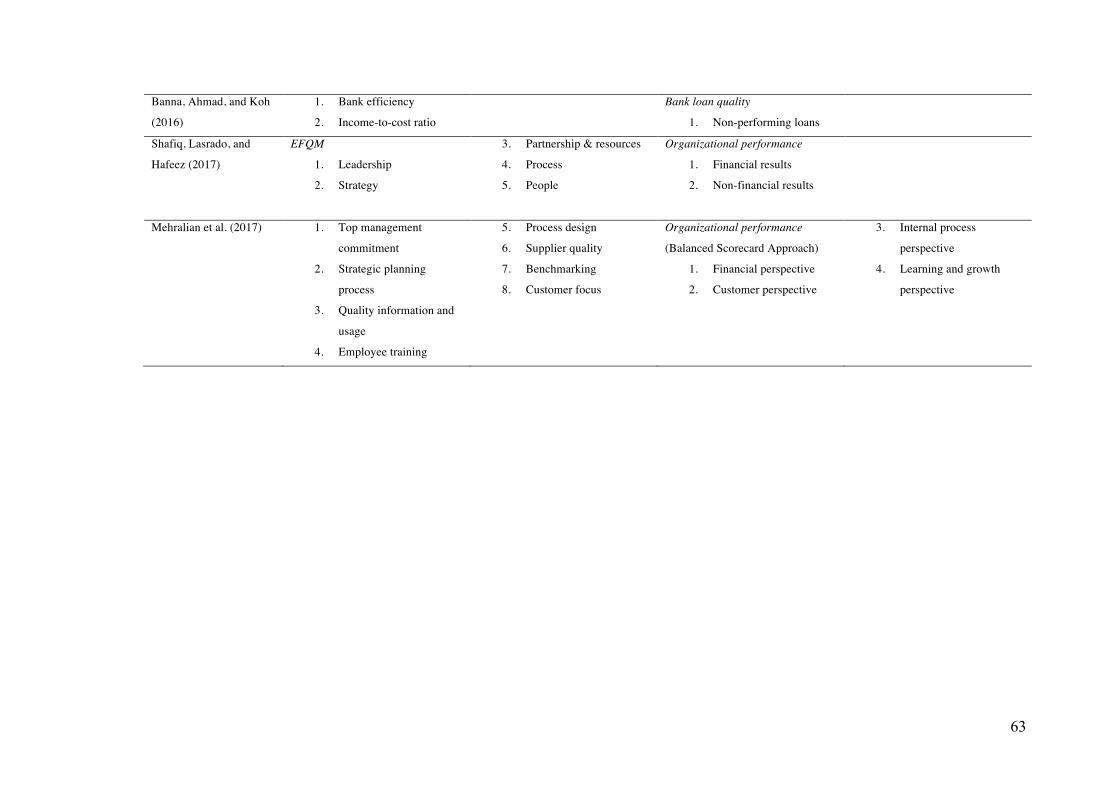
63
Banna, Ahmad, and Koh
(2016)
1. Bank efficiency
2. Income-to-cost ratio
Bank loan quality
1. Non-performing loans
Shafiq, Lasrado, and
Hafeez (2017)
EFQM
1. Leadership
2. Strategy
3. Partnership & resources
4. Process
5. People
Organizational performance
1. Financial results
2. Non-financial results
Mehralian et al. (2017) 1. Top management
commitment
2. Strategic planning
process
3. Quality information and
usage
4. Employee training
5. Process design
6. Supplier quality
7. Benchmarking
8. Customer focus
Organizational performance
(Balanced Scorecard Approach)
1. Financial perspective
2. Customer perspective
3. Internal process
perspective
4. Learning and growth
perspective
64
3.6 The Relationship between TQM and Project Performance
Table 3-2 illustrates a summary of studies on the link between TQM and the
elements of performance. These studies were identified through the Scopus search
engine from 2010 onwards with the main key words of TQM and performance. From
the table, it is clear the TQM studies from the literature were not from one single
area but were conducted all across the world, from Taiwan, Malaysia, India, and
Pakistan, to the United Arab Emirates, Turkey, the United States, and Iran. The
industries involved also varied, such as construction, manufacturing, and services.
The TQM framework adopted in each study was diverse as well as the measurements
of performance being investigated. TQM framework and dimensions of performance
in each study are summarized Table 3-3.
A few studies have conducted TQM research in the construction industry, such as
Kuo and Kuo (2010); Ali and Rahmat (2010), Din, Abd-Hamid, and Bryde (2011),
Mir and Pinnington (2014) and Leong et al. (2014). Kuo and Kuo (2010) considered
the link between TQM and project performance in Taiwan using structural equation
modelling (SEM). The study confirmed that TQM had a positive and direct influence
on project performance. A study conducted by Ali and Rahmat (2010) investigated
the performance measurements of construction projects managed by ISO-certified
contractors in Malaysia. The study concluded that functionality and clients’
satisfaction are the most important criteria for measuring construction project
performance whereas time and cost were the least important. In this study, mean
statistics were used to rank the importance of project performance measurements as
perceived by the contractors in the ISO-certified companies. There was no analysis
conducted of an association between TQM and project performance.
Din, Abd-Hamid, and Bryde (2011) measured the difference between Malaysian ISO
9000 certified companies and non-certified companies in project management
practices, financial management practices, and project success. The study indicated
that certified companies outperformed non-certified companies in project
management practices and financial management practices and ISO 9000
65
certification showed a positive moderating effect on the casual relationship between
TQM practices and project success. The casual relationship between project
management practices and project success were explained by comparing the project
management practices between certified and non-certified companies. Furthermore,
any links between project management practices and project success were not
identified.
Mir and Pinnington (2014) investigated the relationship between TQM and project
success in the United Arab Emirates. A Project Management Performance
Assessment (PMPA) framework of TQM was adopted and tested against project
success. The outcome of this study showed that PMPA and its contributing variables
were found to have positively influenced project success. The association between
each of the individual PMPA variables was tested and cross-checked using two
methods, linear regression and Pearson’s correlation. Both analyses come to the
same conclusion KPIs, staff, leadership, and lifecycle management processes were
the most contributing variables to project success. Partnership and resources, and PM
policy and strategy were ranked the lowest in association with project success. A
multiple regression analysis concluded the best-fit model which would explain the
greatest variance in project success were life-cycle management processes, policy,
and strategy.
Lastly, Leong et al. (2014) measured the effectiveness of ISO 9000 certification in
Malaysia companies using project performance indicators. The results showed
customer satisfaction and time variance were positively significant with ISO 9000
certification. However, in this study, there were no standards of ISO 9000
certification investigated as project performance indicators. The study merely
investigated which project performance indicators had an impact on ISO 9000
certification. All the TQM studies conducted for the construction industry discussed
above differed in the region, analysis procedure, TQM framework adopted, and in
performance measurements. The TQM framework adopted in each of the studies is
illustrated in Table 3-3 with their performance measurements. The MBNQA
framework of TQM has not been explored in the construction industry and its
relationship with project performance.
66
From the literature review conducted it becomes evident that no research studies
have exclusively focused on the relationship between project performance and TQM
in Malaysia. Therefore, this study focuses on analyzing empirical evidence for any
relationship between TQM and project performance in the Malaysian construction
industry. Coupled with the current pressure to improve the level of quality in the
construction industry in Malaysia, there is indeed a need and urgency for a research
study on whether the implementation of TQM can improve project performance.
This research will not only focus on investigating whether a link exists, but also
examine whether there may be any practical contributions for the construction
organizations in improving their project performance through the implementation of
TQM.
3.6.1 The Relationship between Leadership and Project Performance
Leadership is about guiding others toward the attainment of project objectives,
“motivating and guiding others to realize their potential and together achieving
challenging organizational goals”. Successful leadership is able to convince people
of the need for change, stimulates new ways of thinking and problem solving, and
then encourages them to work together to accomplish project objectives in difficult
work environments. Meanwhile, leadership in total quality management is regarded
as a commitment by top management, to create an organization devoted to quality,
The importance of leadership has been noted throughout the project management
literature, as a requirement of project excellence (Kerzner 2013), a determinant of
overall project culture (Shore 2008), and as a vehicle for mobilizing people for
change (Patterson 2010). Today, there are many leadership style theories that have
emerged such as emotional intelligence, contingency, competency, traits, and
behaviour (Dulewicz and Higgs 2004) and all of them claim that an appropriate
leadership style can benefit project success and enhance project performance.
A study by Turner (2014) revealed that effective leadership is viewed as a critical
factor for success in the management of organizations and it has also been shown an
appropriate leadership style can lead to better performance. However, there is some
67
contradiction in the literature where the leadership of a project manager is not
regarded as a success factor of projects. In agreement with Anantatmula (2010) and
Fung and Ramasamy (2015), this current study argues that though leadership style
and competence are not directly related to project success, the leadership role is
crucial to facilitate various project success factors that contribute to project
performance. A project manager’s leadership roles and responsibilities towards the
project team and stakeholders influence the project outcomes (Fung and Ramasamy
(2015).
Jiang (2014), also made similar claims as he suggested leadership could directly
benefit project success with corresponding competencies or indirectly through
improving teamwork to help achieve a successful project. A model was developed
where Jiang (2014) proposed an appropriate leadership style can reduce the negative
effect of the project type on teamwork and project success. However, this is just a
conceptual model with further empirical testing needed. The findings of the above
literature review provide an opportunity to explore further project manager
leadership in promoting project performance.
H1: There is a positive and significant relationship between leadership and project
performance.
3.6.2 The Relationship between Strategic Planning and Project Performance
Planning has been considered one of the critical factors for project success in the
strategic management literature (Meredith and Mantel Jr 2011) and project
management literature (Turner 2014). Zwikael and Globerson (2004) recognized the
importance of project planning and in their opinion, high quality planning increases
the chances the project will be properly executed and completed. Adding to their
previous study, Zwikael and Globerson (2006) asserted high-quality project
planning in construction and engineering organizations has resulted in projects
completed at half the cost and schedule overruns, compared to organizations in other
industries such as information technology and communications, services, and
manufacturing.
68
In another recent study (Zwikael et al. 2014), found increasing the quality of
planning improves project efficiency in high-risk projects and improves project
effectiveness in low-risk projects. However, one of their hypotheses results showed
that project planning was not significantly correlated with project efficiency or
effectiveness. Evidence was found showing the results of Zwikael and Globerson
(2006) contradicted the findings of Zwikael et al. (2014) . The earlier study indicated
high-quality project planning would reduce cost and schedule overruns, however, in
the study by Zwikael et al. (2014) they mentioned project planning was found not to
be correlated with either project efficiency or effectiveness.
Some results from the literature have challenged the importance of planning. For
example, one of the very first milestones of Mintzberg (1994) book The Rise and
Fall of Strategic Planning. Additional doubts are expressed in project management
literature by Bart (1993) regarding the importance of formal planning. He indicated
the traditional planning approach contains excessive formal control restrictions,
which curtails opportunities for creativity and thus may eventually lead to project
failure.
Although some claim that too much planning curtails the creativity of the project
team, there is no argument stating at least a minimum level of planning is required.
The rationale behind project planning is planning reduces uncertainty and increases
the likelihood of project success. Planning does not guarantee project success, but a
lack of planning will probably lead to failure according to the Project Management
Body of Knowledge (PMBOK). Based on the assumptions presented above, there
appears to be a relationship between strategic planning and project performance.
H2: There is a positive and significant relationship between strategic planning and
project performance.
3.6.3 The Relationship between Customer Focus and Project Performance
A customer-centred approach has long been recognized as an important strategy for
improving business performance. The concepts of knowing customer requirements
69
and being responsive to customer demands, and measuring customer satisfaction
have led to an increase in cash flow, revenue growth, profitability, market share, and
stock price (Anderson, Fornell and Mazvancheryl 2004; Gruca and Rego 2005;
Homburg, Koschate and Hoyer 2005; Williams and Naumann 2011).
This customer focus concept is also supported in a study by Zou et al. (2014) where
they found an active customer relationship management strategy leads to better
project performance as the relationship changed across project phases. Psomas,
Vouzas, and Kafetzopoulos (2014) in their study revealed customer focus policy was
the key TQM factor, which positively affected Spain’s service sector. This suggests a
customer focus approach leads to a better understanding of customers’ needs, which
in turn translates into internal actions being taken and eventually results in satisfied
customers and thus an organization’s performance improves. However, some
previous studies have showed contrasting results. Talib, Rahman, and Qureshi (2013)
investigating quality performance observed customer – oriented activities did not
contribute positively to the Indian service sector.
It has often been suggested “ it is from two to twenty times as expensive to get a
new customer as to retain an existing one” (Goodman, O’Brien and Segal 2000).
Developing customer loyalty through customer satisfaction seems to generate a
steady stream of sales in the long-term. Having reviewed the logic of a customer
focus strategy, there is strong support for the statement increasing customer focus,
will enhance the organization’s performance in the project environment.
H3: There is a positive and significant relationship between customer focus and
project performance.
3.6.4 The Relationship between Workforce Focus and Project Performance
The workforce is the most dynamic resource in an organization. It dominates the
operation process to ensure that an organization performs its daily operations
effectively and efficiently (Sabella, Kashou and Omran 2014) to maintaining a high
level of quality can be achieved by bringing out the best talents and capabilities of a
70
workforce (Lee and Ooi 2014). These capacities can be further enhanced through a
variety of organizational development practices such as employee training,
involvement, empowerment, recognition, teamwork, etc. Where an organization has
a high level of workforce focus, the requirements of employees are noticed (i.e.
comfortable working environment, self-improvement opportunities, etc.), which in
turn will generate greater work performance and increase morale and satisfaction. In
the long run, this approach will enhance the organization’s productivity and
ultimately its performance (Valmohammadi and Roshanzamir 2015).
Most of the studies reviewed indicate workforce focus has a significant relationship
with performance. A study conducted in Spain showed an emphasis on workforce
was one of the elements significantly affecting the service industry (Psomas, Vouzas
and Kafetzopoulos 2014). This has been supported by Valmohammadi and
Roshanzamir (2015), where implementation of workforce-oriented activities
increased organizational performance. However, the workforce-related activities did
not show significance in the quality and innovation in performance at ASEAN
manufacturing plants (Zeng, Phan and Matsui 2015). One of the ASEAN countries in
the study was Malaysia.
This present study based on the literature reviewed, strongly suggests encouragement
of workforce focus practices such as empowerment, involvement, training, and
information sharing are the key factors of quality programmes. An organization
needs to focus in this area if they want to succeed in improving performance. Hence,
it is hypothesized that:
H4: There is a positive and significant relationship between workforce focus and
project performance.
3.6.5 The Relationship between Operation Focus and Project Performance
Operation management is a systematic approach in which all the resources of an
organization are used in the most efficient and effective manner to achieve the
desired performance (Ooi 2014). Operation focus emphasizes activities which

71
includes preventive and proactive approaches to quality management (Lee and Ooi
2014). The activities include designing fool-proof and stable production schedules
and work distribution to reduce variation and improve the quality of the product
during the production stage (Bouranta, Psomas and Pantouvakis 2017).
Empirical studies such as Mehralian et al. (2017), have investigated the relationship
between process management and performance which have showed a positive
correlation between them. Valmohammadi and Roshanzamir (2015), Zeng, Phan,
and Matsui (2015); Irfan and Kee (2013) and Zehir et al. (2012) also showed similar
results where all of the studies claimed that a positive significant relationship does
exist between process management and performance.
However, there are some studies that showed contradictory findings. Shieh and Wu
(2002) demonstrated process management did not have an association with project
performance. A recent study (Talib, Rahman and Qureshi 2013) conducted on
Indian service companies revealed similar findings. The results collected from 172
service companies showed process management had no significant effect on quality
performance.
Following Deming's belief, where improving the process can improve productivity
and quality (Shieh and Wu 2002), this current study suggests that to achieve better
performance, the key processes must be identified, evaluated, and continually
improved. Based on the concept above, it is hypothesized that:
H5: There is a positive and significant positive relationship between operation focus
and project performance.
3.6.6 The Relationship between Measurement, Analysis, and Knowledge
Management and Project Performance
It is important for managers to make quality decisions for an organization based on
the analysis of real and relevant data as emphasized by (Lee and Ooi 2015). It is the
duty of an organization to ensure the availability of reliable, adequate, high quality,

72
and timely data and information for all key users to improve performance (Ooi 2014).
This concern about the reliability and validity of data and information using
appropriate tools of measurement and/or analysis to support quality-based decision-
making is necessary for the organization to improve its performance (Bouranta,
Psomas and Pantouvakis 2017).
Mehralian et al. (2017) and Valmohammadi and Roshanzamir (2015) suggest the
implementation of data collection and an analysis system will increase the
performances of a firm. Zeng, Phan, and Matsui (2015) in their study investigating
283 manufacturing plants observed quality information had a direct impact on
quality performance in ASEAN countries. Other studies also showed quality
information and analysis have had significant effects on performance such as Irfan
and Kee (2013) and Agus (2011).
Based on the previous literature discussed, the process of obtaining adequate data
and information to support quality-based decision-making seems to be an important
part of every organization regardless of type of industry. Key decisions are then
made by organizations on the information and analysis resulting from this process.
Thus, the following hypothesis is proposed:
H6: There is a positive and significant relationship between measurement, analysis
and knowledge management, and project performance.
3.7 Summary
This chapter has explained the dimensions and relationships between TQM practices
and project performance. From the literature review, it is hypothesized TQM
practices result in improved project performance in construction organizations.
However, there were also some contradictory findings as well, some that may affect
TQM practices towards project performance. To test these hypotheses, a research
methodology was used to confirm the predictions and is presented in the next chapter.
73
CHAPTER 4
RESEARCH METHODOLOGY
4.0 Introduction
This chapter describes the methodology used to ensure that this study conforms to
the objectives that have been outlined. The topics covered in this chapter are research
design, sample and population, descriptions of research instruments and data
collection procedures, and the techniques employed for statistical analysis in this
study.
4.1 Research Design
The research design is defined as how the study is designed to achieve its objectives.
Research design starts with a topic selection and is then followed by data collection
methods, measurement procedures, questionnaire design, sampling, and data analysis
hair (Hair Jr et al. 2013). This study adopted questionnaire, the most common
qualitative data collection method, to measure the adoption of TQM practices and the
correlation to project performance in the Malaysian construction organizations.
4.1.1 Cross-sectional Study
The cross-sectional study is suitable to demonstrate an association or prevalence
(Sedgwick 2014), with the information derived from the sample of the population at
one point in a time (Hair Jr et al. 2013). The longitudinal study, in contrast, associate
with the same sample units a number of time over certain period (Babin and
Zikmund 2015). For this research, a cross-sectional study seems to suit the aim of
this study, firstly, as this study does not require examining trends. Secondly, this
study requires data collection from large number organizations to have a
representative sampling (Malhotra and Birks 2007) and lastly, due to time and
resources constraints. In this study, cross sectional study is used to observe and find
an association between TQM practices and project performance.

74
4.1.2 Limitations of Cross-sectional Study
A cross-sectional study may be prone to non-response bias resulting in a non-
representative sample of the population (Sedgwick 2014). The distribution of
questionnaire survey forms was carried out using three different methods, e-mail, fax,
and postal to reduce the possibility of the non-response bias. No causal relationship
is determined between the variables as the data is recorded only once for each
participant. A further study is suggested for greater in-depth research. Lastly, there is
the presence of common method variance. Common method variance is a
measurement error (Podsakoff, MacKenzie and Podsakoff 2012) that happens when
“ responses systematically vary with a common scaling approach on measures from a
single data source” (Fuller et al. 2016). Harman’s single factor test was used as the
statistical test against the common method variance because it is the simplest
measure and widely used in the literature for this type of survey (Podsakoff,
MacKenzie and Podsakoff 2012).
4.2 The Sampling Process
The sampling process for this study involves a number of elements. The sampling
process involved steps of (1) defining the population, (2) developing sampling frame,
(3) selecting the appropriate sampling method, (4) determining the sample size, and
(5) selecting the sample (Malhotra and Birks 2007).
4.2.1 Defining the Population
The population is defined as the entire group of subjects under study as specified by
the objectives of the research (Burns and Bush 2003). The target population of this
study was all the construction organizations in Malaysia. The sample size was
derived from the listed members of the CIDB (Construction Industry Development
Board), a statutory body representing the construction companies in Malaysia. The
CIDB was established in 1994 and currently represents 73,069 construction
companies from every range of the CIDB categories (CIDB, 2016), which is the
actual population size (N) for this study.
75
4.2.2 Establishment of the Sample Frame
The sample frame is a list of the targeted population members from which the sample
will be drawn (Saunders 2011). This study used the sample frame as the sample of
the population. The sampling frame for this study included all of the construction
organizations that have adopted the ISO 9001 quality management system. Since
2000, all members in Category Grade 7 are required to follow ISO 9001 certification,
and therefore, this group were selected as the sample frame for this study. The total
number of CIDB members qualified as Category Grade 7 is 6,331 organizations.
4.2.3 Sampling Method
There are two major sampling approaches, probability and non-probability. Non-
probability sampling does not involve random selection, whereas probability does
(Tochrim 2002). In probability sampling, every individual has an equal opportunity
to be selected, however, in non-probability sampling, a respondent is carefully
selected based on stipulated criteria (Hair Jr et al. 2013).
In this research, a generalize results are ought to obtain as much as possible, a simple
random sampling was used. 20% of the total population was deemed sufficient for
the study purpose (Salkind 2014).. The organizations in the sampling frame were
first entered into a spreadsheet with serial numbers and randomly selected using the
RAND function.
The rationale for adopting the simple random sampling process was it gave each unit
an equal chance of being selected (Malhotra and Birks 2007) and it is best used when
an accurate and easily accessible sampling frame that lists the entire population is
available (Saunders 2009). Simple random sampling was chosen because it is
inexpensive and efficient and able to produce a more representative sample (Hayes
1998; Luck and Rubin 1987; Wong 1999).

76
Table 4-1: Construction organizations registered under CIDB Malaysia.
4.2.4 Sample Size
An adequate sample size is essential in order to provide a scientifically sound
contribution to the research. It is one of the criteria for multiple regression analysis.
Stevens (2012) has recommended, "For social science research, about 15 participants
per predictor are needed for a reliable equation". While Tabachnick and Fidell (2013)
gave a formula for calculating sample size requirements by taking into account the
number of independent variables: N ≥ 50 + 8m (where m is the number of
independent variables). As a general rule of thumb, at least 300 respondents are
deemed comfortable, 500 will be very good, and 1000 as excellent (Tabachnick and
Fidell 2013). The Krejcie and Morgan’s (1970) formula was adopted to calculate
the minimum required sample size from the population of 6,331 construction
organizations.
𝑆 =𝑋! 𝑁𝑃 (1− 𝑃)
𝑑! 𝑁 − 1 + 𝑋! 𝑃(1− 𝑃)
Where
s = required sample size.
X2 = the table value of chi-square for 1 degree of freedom at the desired confidence
level (3.841).
GradeState(Johor 2,897 1,566 1,210 358 426 131 450Kedah 2,077 691 339 122 133 55 201Kelantan 2,047 826 231 98 110 57 142Labuan 138 30 17 4 1 0 1Melaka 1,053 444 328 129 120 47 147Negeri(Sembilan 1,827 741 358 125 151 47 110Pahang 2,258 846 410 211 168 65 145Perak 2,580 873 547 204 245 85 189Perlis 887 173 56 16 29 5 32Pulau(Pinang 1,326 577 714 215 257 110 410Sabah( 7,132 1,751 779 183 216 89 510Sarawak( 2,358 1,005 479 176 206 98 514Selangor 3,889 1,851 2,219 819 1,293 366 1,567Terengganu 2,331 822 321 177 202 93 206Wilayah(Persekutuam 1,509 767 1,533 660 1,271 352 1,707TOTAL
G7
73,069
G1 G2 G3 G4 G5 G6
77
N = the population size.
P = the population proportion (assumed to be 0.50 since this would provide the
maximum sample size).
d = the degree of accuracy expressed as a proportion (0.05).
𝑆 =3.841 (6331)(0.5)(1− 0.5)
0.05! 6330 + 3.841 (0.5)(1− 0.5)
= 362
Based on the Krejcie and Morgan’s formula, the minimum sample size for a
population of 6,331 is 362 respondents.
4.2.5 Sample Selection
For this study, the ISO 9001 certified construction organizations were randomly
selected from the CIDB (Category Grade 7) listed companies. The CIDB directory is
frequently used to represent Malaysian construction organizations such as Din, Abd-
Hamid, and Bryde (2011), Mir and Pinnington (2014), and Ali and Rahmat (2010).
The organizations selected as the sample were all in the construction industry.
Organizations listed in the CIDB directory with ISO 9001 certification were targeted.
This sample group was chosen as there is no certification for TQM in Malaysia (Sila
2007) and no database available listing Malaysian organizations that had adopted
TQM practices. Given that the ISO 9001 standard is based on quality management
principles, which are in line with TQM philosophy, the criterion for selecting which
organizations would participate in the study was their certification to ISO 9001. It
was assumed that the ISO certified companies are TQM-oriented and compatible
with the total quality philosophy (Goetsch and Davis 2006; Wu and Liu 2010).
A total of 1,810 questionnaires were sent out to achieve the targeted sample size with
the assumed response rate of 20%. To ensure distribution equality in representing the
whole of Malaysia, the 1,810 questionnaires were distributed among the 13

78
Malaysian states according to the ratio calculated in Table 4-2 below. Based on the
density of the population, 488 questionnaires were sent to Wilayah Persekutuan, 448
to Selangor, 147 to Sarawak, 146 to Sabah, 129 to Johor, 117 to Pulau Pinang, 59 to
Terengganu, 57 to Kedah, 54 to Perak, 42 to Melaka, 41 to Pahang and Kelantan, 31
to Pahang, 9 to Perlis and 1 to Labuan.
Table 4-2: Targeted respondents for each state.
States G7 organizations
Percentage Number of targeted respondents
Johor 450 7.11 129 Kedah 201 3.17 57 Kelantan 142 2.24 41 Labuan 1 0.02 1 Melaka 147 2.32 42 Negeri Sembilan 110 1.74 31 Pahang 145 2.29 41 Perak 189 2.99 54 Perlis 32 0.51 9 Pulau Pinang 410 6.48 117 Sabah 510 8.06 146 Sarawak 514 8.12 147 Selangor 1,567 24.75 448 Terengganu 206 3.25 59 Wilayah Persekutuan 1,707 26.96 488 Total 6,331 100% 1,810
4.3 Research Instrument
A structured survey questionnaire was employed to measure the perceptions of
quality, practitioners in the construction organizations had, on six variables
associated with project performance. The variables consisted of leadership, strategic
planning, customer focus, and measurement, analysis, and knowledge management,
workforce focus, operation focus, and project performance. The survey was
considered the most efficient means of collecting data compared to other methods,
such as conducting interviews or a case study.

79
Based on an extensive literature review of TQM practices that influence the
performance of projects conducted by the construction organizations, a questionnaire
was developed. All of the variables identified were ensured to be ambiguous and
captured the major theoretical construct of interests (Fischer 2010). The
questionnaire consisted of 42 items, measuring six theoretical constructs: (1)
leadership, (2) strategic planning, (3) customer focus, (4) measurement, analysis, and
knowledge management, (5) workforce focus, (6) operation focus, and (7) project
performance.
Likert scales were adopted because it highly represents the likelihood and the
accuracy of the respondents’ responses (Burns, Bush and Sinha 2014; Babin and
Zikmund 2015) and it yields higher reliability coefficients with fewer items (Hayes
1998). Likert scales are also widely used in social science (Garland 1991). In the
study of Likert (1932), the reliability of the entire scale is maximized when the
respondent answer by the means of a 5-point scale. Hence, this study adopted the 5-
point Likert rating scale. Each of the questionnaire items was assessed on a 5-point
Likert rating scale. Responses to TQM practices were assessed with a level of
frequency value of (1) very low, (2) low, (3) medium, (4) high, and (5) very high.
Responses for scales measuring the project performance of construction
organizations that had adopted TQM practices were also recorded using the 5-point
Likert rating scale with a level of agreement of, (1) strongly disagree, (2) agree, (3)
neutral, (4) agree, and (5) strongly agree.
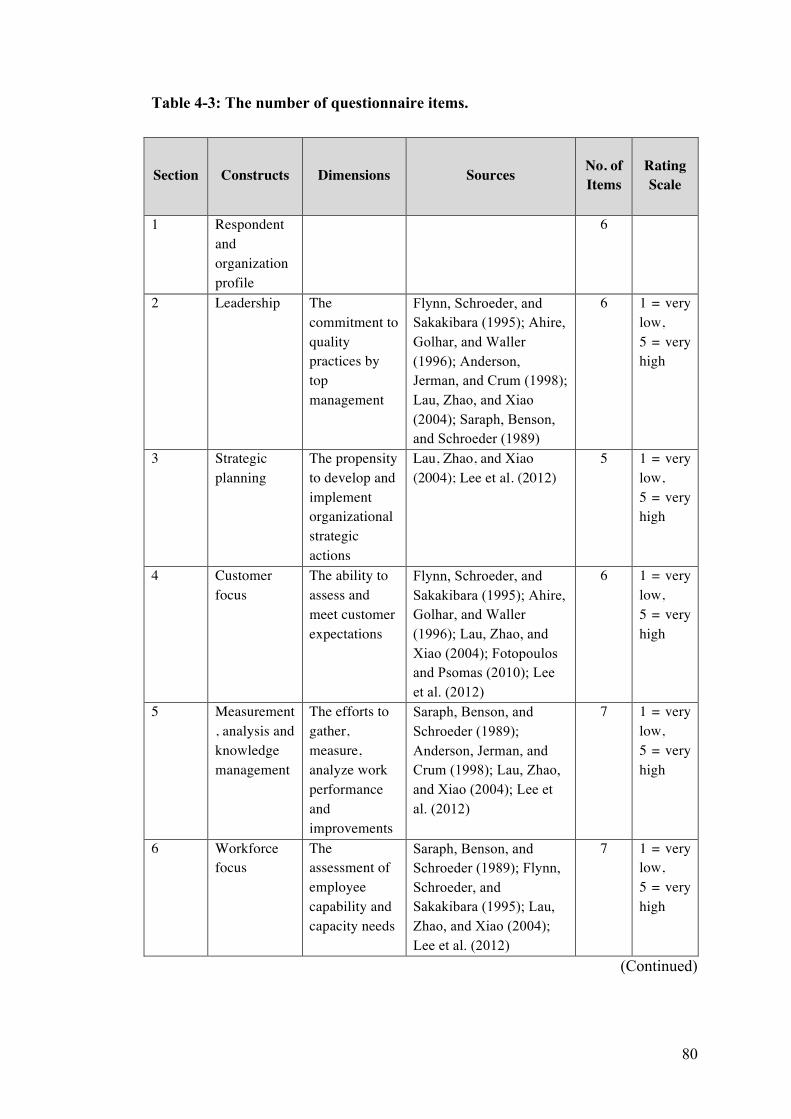
80
Table 4-3: The number of questionnaire items.
Section Constructs Dimensions Sources
No. of Items
Rating Scale
1 Respondent and organization profile
6
2 Leadership The commitment to quality practices by top management
Flynn, Schroeder, and Sakakibara (1995); Ahire, Golhar, and Waller (1996); Anderson, Jerman, and Crum (1998); Lau, Zhao, and Xiao (2004); Saraph, Benson, and Schroeder (1989)
6 1 = very low, 5 = very high
3 Strategic planning
The propensity to develop and implement organizational strategic actions
Lau, Zhao, and Xiao (2004); Lee et al. (2012)
5 1 = very low, 5 = very high
4 Customer focus
The ability to assess and meet customer expectations
Flynn, Schroeder, and Sakakibara (1995); Ahire, Golhar, and Waller (1996); Lau, Zhao, and Xiao (2004); Fotopoulos and Psomas (2010); Lee et al. (2012)
6 1 = very low, 5 = very high
5 Measurement, analysis and knowledge management
The efforts to gather, measure, analyze work performance and improvements
Saraph, Benson, and Schroeder (1989); Anderson, Jerman, and Crum (1998); Lau, Zhao, and Xiao (2004); Lee et al. (2012)
7 1 = very low, 5 = very high
6 Workforce focus
The assessment of employee capability and capacity needs
Saraph, Benson, and Schroeder (1989); Flynn, Schroeder, and Sakakibara (1995); Lau, Zhao, and Xiao (2004); Lee et al. (2012)
7 1 = very low, 5 = very high
(Continued)

81
Section Constructs Dimensions Sources
No. of Items
Rating Scale
7 Operation focus
The efforts to improve product and work processes and achieve organizational success
Saraph, Benson, and Schroeder (1989); Flynn, Schroeder, and Sakakibara (1995); Lau, Zhao, and Xiao (2004); Lee et al. (2012)
7 1 = very low, 5 = very high
8 Project performance
The objectives of a construction project
Shenhar et al. (2001); Ling et al. (2008); Yeung, Chan, and Chan (2009)
4 1 = strongly disagree, 5 = strongly agree
Total number of measurement scale items 48
4.4 Method of Data Collection
The survey questionnaire was sent to the top management of the organisation such as
managers, project managers, and quality managers, as they would have been
involved in the strategic decision-making and management of the organizations.
Emails, postal mail, and faxes were the tools applied in this study to distribute the
research instrument. Emails have been shown to achieve a higher response rate
compared to postal mail (Griffis, Goldsby and Cooper 2003; Wright and Ogbuehi
2014). Postal mail and fax were used as secondary options to cover those
organizations that had no email address to ensure a high response rate. A cover letter
explaining the objectives, significance, and details of the study, attached with a
consent form and survey questionnaire were sent to the respondents. The consent
form was to seek participation approval, and at the same time, the confidentiality of
every individual response was assured.
The reasons for the email distribution include cost and time saving, and ease of
distribution and responding. However, due to the other challenges such as no Internet

82
access and undelivered postal address, secondary options using postal mail and fax
were adopted to ensure a higher response rate.
4.5 Statistical Analysis
This section describes the data analysis employed in this study. The collected dataset
went through a data screening process for accuracy of data, missing data, and outliers.
Next, factor analysis and a reliability test were conducted. Finally, the Pearson’s
correlation and multiple regression analysis were applied to examine the
hypothesized relationships among the variables. All the statistical analyses were
conducted using the Statistical Package for Social Science (SPSS) 21.0 software.
4.5.1 Data Screening
170 questionnaires were returned, and were checked for completeness. 9 sets showed
incompleteness and were subsequently discarded, leaving 161 useable surveys. The
data were then entered for data screening.
Data screening is essential to make sure that the data sets are accurate with zero-error
before the main analysis is run as it may affect the precision of the analysis. The
purpose of data screening is to ensure data accuracy, check for missing data, the
fitness of the data set and assumptions, the transformation of variables, identified
outliers, and linearity.
4.5.1.1 Accuracy of Data File
One of the best ways to ensure the accuracy of the data file is to proofread the
original data against the computed data file. However, this process may not be
efficient or possible when involving a large set of data. In this case, examination of
the descriptive statistics of the variables can be used to check for data accuracy. For
continuous variables, it is important to make sure all of the values are within range,
where means and standard deviations are plausible. If there is an out-of –range value,
this will distort the mean value. For categorical variables in this study by age: (1) 20

83
-30, (2) 30 -40, (3) 40 -50, and (4) ≥ 50, there should be no out-of-range values
besides 1, 2, 3, and 4. Continuous variables can be checked using Descriptives while
categorical variables can be checked using Frequencies, both of the statistics use the
SPSS 21.0 software.
4.5.1.2 Missing Data
Missing data is the bane of every researcher and one of the inevitable problems in
analysis. The missing data case(s) can be identified through case labelling.
Researchers may, based on their own discretion, decide what solution is necessary
for the missing data. The missing data can either be deleted or estimated. There are
other options available on SPSS statistical procedures such as, (1) Exclude cases
listwise, (2) Exclude cases pairwise and (3) Replace with mean. It is important to
choose the solution carefully as it can cause serious effects on the results.
In this study, the missing values were replaced with mean values using Missing
Values Analysis (MVA). The Expected Maximization (EM) technique was employed.
EM is an iterative procedure of producing variances, co-variances, and means in an
initial step, and then repeating the process until the changes in the parameters are so
small the final solution is said to have converged (Graham, 2012). After the missing
values have been treated, the dataset was checked for outliers.
4.5.1.3 Outliers
Outliers are cases with extreme values that are unusually high or low, making the
cases distinctly different from the norm (Hair Jr et al. 2013). Extreme cases impact
the regression solution and affect the precision of the regression weights (Fox, 1991).
Therefore, it is important to check the data sets for outliers. There are two types of
outliers: univariate outliers and multivariate outliers. Univariate outliers are cases
with an extreme value of one variable while multivariate outliers are cases with an
unusual combination of scores on two or more variables (Tabachnick and Fidell
2013).
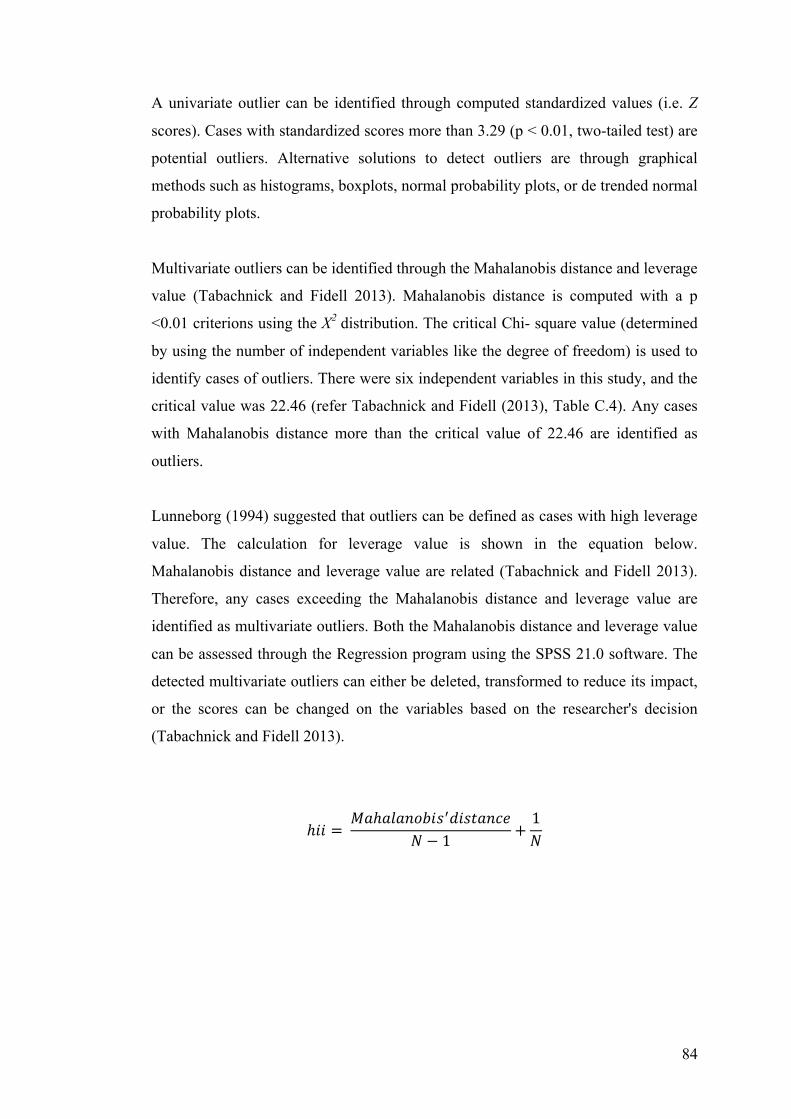
84
A univariate outlier can be identified through computed standardized values (i.e. Z
scores). Cases with standardized scores more than 3.29 (p < 0.01, two-tailed test) are
potential outliers. Alternative solutions to detect outliers are through graphical
methods such as histograms, boxplots, normal probability plots, or de trended normal
probability plots.
Multivariate outliers can be identified through the Mahalanobis distance and leverage
value (Tabachnick and Fidell 2013). Mahalanobis distance is computed with a p
<0.01 criterions using the X2 distribution. The critical Chi- square value (determined
by using the number of independent variables like the degree of freedom) is used to
identify cases of outliers. There were six independent variables in this study, and the
critical value was 22.46 (refer Tabachnick and Fidell (2013), Table C.4). Any cases
with Mahalanobis distance more than the critical value of 22.46 are identified as
outliers.
Lunneborg (1994) suggested that outliers can be defined as cases with high leverage
value. The calculation for leverage value is shown in the equation below.
Mahalanobis distance and leverage value are related (Tabachnick and Fidell 2013).
Therefore, any cases exceeding the Mahalanobis distance and leverage value are
identified as multivariate outliers. Both the Mahalanobis distance and leverage value
can be assessed through the Regression program using the SPSS 21.0 software. The
detected multivariate outliers can either be deleted, transformed to reduce its impact,
or the scores can be changed on the variables based on the researcher's decision
(Tabachnick and Fidell 2013).
ℎ𝑖𝑖 = 𝑀𝑎ℎ𝑎𝑙𝑎𝑛𝑜𝑏𝑖𝑠!𝑑𝑖𝑠𝑡𝑎𝑛𝑐𝑒
𝑁 − 1 +1𝑁
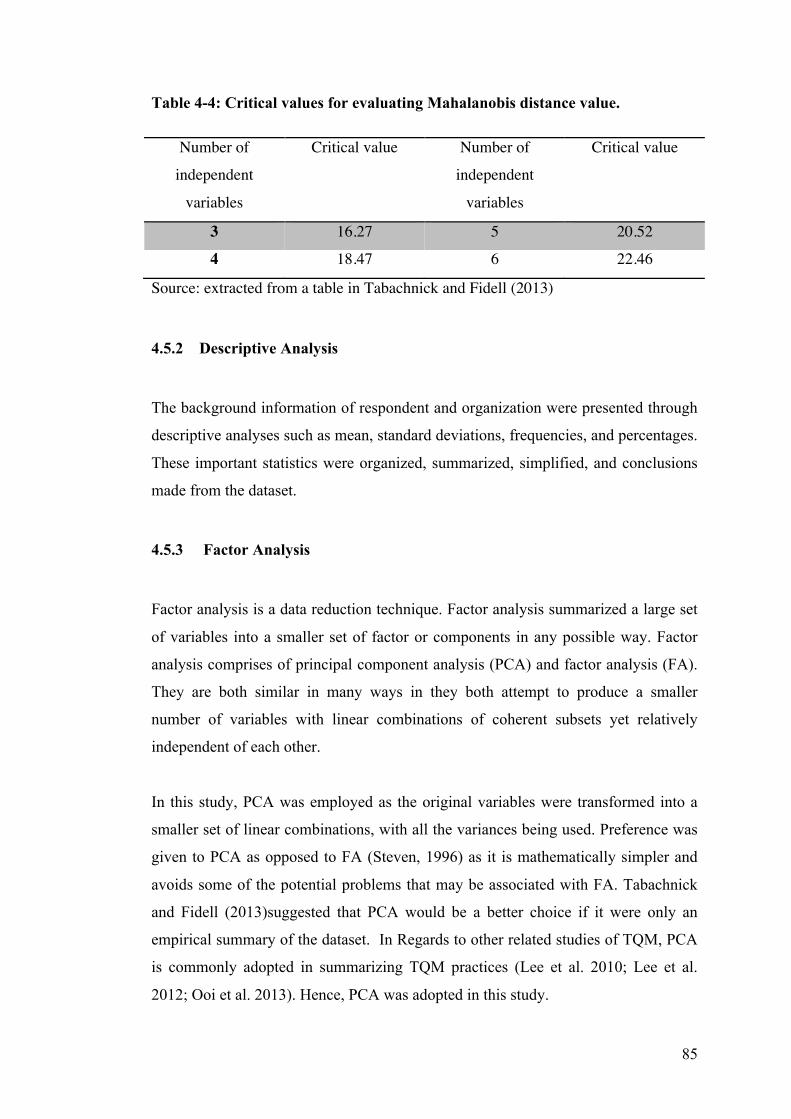
85
Table 4-4: Critical values for evaluating Mahalanobis distance value.
Number of
independent
variables
Critical value Number of
independent
variables
Critical value
3 16.27 5 20.52
4 18.47 6 22.46
Source: extracted from a table in Tabachnick and Fidell (2013)
4.5.2 Descriptive Analysis
The background information of respondent and organization were presented through
descriptive analyses such as mean, standard deviations, frequencies, and percentages.
These important statistics were organized, summarized, simplified, and conclusions
made from the dataset.
4.5.3 Factor Analysis
Factor analysis is a data reduction technique. Factor analysis summarized a large set
of variables into a smaller set of factor or components in any possible way. Factor
analysis comprises of principal component analysis (PCA) and factor analysis (FA).
They are both similar in many ways in they both attempt to produce a smaller
number of variables with linear combinations of coherent subsets yet relatively
independent of each other.
In this study, PCA was employed as the original variables were transformed into a
smaller set of linear combinations, with all the variances being used. Preference was
given to PCA as opposed to FA (Steven, 1996) as it is mathematically simpler and
avoids some of the potential problems that may be associated with FA. Tabachnick
and Fidell (2013)suggested that PCA would be a better choice if it were only an
empirical summary of the dataset. In Regards to other related studies of TQM, PCA
is commonly adopted in summarizing TQM practices (Lee et al. 2010; Lee et al.
2012; Ooi et al. 2013). Hence, PCA was adopted in this study.

86
There are a few assumptions in PCA that need to be considered. The first assumption
is, (a) there are multiple variables that are measured at the continuous level. The
second assumption is, (b) there must be linearity between all variables. All variables
must have at least one correlation above r = 0.3 with other variables. This can be
checked through the Correlation Matrix. The third assumption, (3) there must be an
adequate sampling. There are a few methods to detect sampling adequacy, (1) the
Kaiser-Meyer-Olkin (KMO) measures the overall data set, (2) KMO measures for
each individual variable, and (3) Bartlett’s test of sphericity. The KMO measures
need to be as close to 1 as possible, with a value above 0.6 an absolute minimum.
The Bartlett’s test of sphericity has to be statistically significant (i.e. p < 0.5) to be
suitable for PCA. The fourth assumption is, (4) there should be no outliers. The
assumptions are summarized in the Table 4-5 below.
Table 4-5: PCA's four assumptions.
Assumptions Details Criteria 1 Multiple variables that are
measured at the continuous level
2 Linearity between all variables
At least one correlation r > 0.3
3 Sampling adequacy KMO > 0.6 Bartlett’s test (p < 0.5)
4 No outliers Z scores, Casewise diagnostic, Mahalanobis distance & leverage value
The dataset is suitable for PCA when all of the four assumptions have passed. When
running a PCA, there are steps that need to be highlighted. They are, (1) initial
extraction of the components, (2) determining the number of components to retain, (3)
rotation to a final solution, (4) interpreting the rotated solution, (5) computing
component scores, and lastly (6) reporting the results.
The major decision in a PCA is the number of components to retain. There are four
major criteria to consider in the decision of retaining the number of components.
They are the eigen-value-one criterion, the proportion of total variance accounted for,
the scree plot test, and the interpretability criterion. The details of the criterion for

87
determining how many components should be retained are summarized in Table 4-6
below. Lastly, the decision on the number of components to retain is very subjective
and based on the researcher's interpretation of the data (Tabachnick and Fidell 2013).
All of the procedures in a PCA used the SPSS 21.0 software.
Table 4-6: Criterion to retain components in PCA.
Criteria Details Eigen-value-one Retain components with eigenvalue more than 1 Proportion of total variance explained
Retain components that explain at least 5% to 10% and/or Retain all components that can explain at least 60% - 70% of the total variance
Scree plot test Retain all those components before the inflection point Interpretability “Simple structure “ – explainable division of variables
onto separate components
4.5.4 Reliability Analysis
Reliability measures how well the indicator variables serve as a measurement
instrument for latent variables. Reliability can be assessed through internal
consistency, which is the degree to which the items that make up the scale are all
measuring the same underlying attribute. The most common way to measure internal
consistency is by using the Cronbach’s coefficient alpha. This statistics tool provides
an indication of the average correlation among all the items that make up the scale.
The values range from 0 to 1, where higher values indicate a greater reliability.
Nunnally (1978) suggested a cut-off point of 0.7 as a reasonable indicator of “fit”.
4.5.5 Pearson’s Correlation
Pearson’s correlation is used to describe the strength and direction of the relationship
between two variables. The relationship is measured by the Pearson correlation
coefficient, denoted as r. Its value can range from -1 for a perfect negative linear
relationship to +1 for a perfect positive linear relationship. A value of zero (0)
indicates no relationship between two variables.

88
There are a few assumptions to be considered in Pearson’s correlation. The first
assumption is, (a) there needs to be a linear relationship between the two variables.
The second assumption is, (b) there should be no significant outliers. The third
assumption is, (c) there should be bivariate normality.
Table 4-7: Pearson's correlation assumptions.
Assumptions Details Criteria
1 Linearity between two
variables
A straight line in scatterplot
2 Outliers Outskirt data points in scatterplot
3 Bivariate normality Shapiro-Wilk’s test (p>0.5)
4.5.6 Multiple Regression Analysis (MRA)
Multiple regression analysis (MRA) is used to explore the relationship between one
continuous dependent variable and other independent variables. MRA is an extension
of a bivariate regression, a more sophisticated tool to assess the interrelationship
among a set of variables (Tabachnick and Fidell 2013).
During a MRA all the independent variables are entered into the equation
simultaneously. Then, each of the independent variables is evaluated regarding its
predictive power to explain how much variance the independent variables
contributed to the dependent variable. MRA provides information on the model as a
whole (all subscales) and the relative contribution of each variable that makes up the
model (individual subscales) (Pallant 2011).
Regression techniques are applied to a data set to test the correlation between the
independent variables and the dependent variables in varying degree. For instance in
this study, regression techniques were used to assess the relationship between a set of
independent variables (i.e. TQM practices) leadership, strategic planning, customer
and market focus, workforce focus, process management, and measurement, analysis,
and knowledge management with a dependent variable project performance. As a

89
result, the MRA will explain how well TQM practices predict project performance
and which TQM practice is the best predictor of project performance.
There are six assumptions that need to be considered in MRA. The first assumption
is, (a) there should be independence of observations. A Durbin-Watson statistic with
a value of approximately 2 indicates that there is no correlation between residuals.
The second assumption is, (b) there needs to be a linear relationship between the
dependent variables and each of the independent variables, and between the
dependent variable and the independent variables collectively. This can be checked
through scatterplot and partial regression plots with residuals forming a horizontal
band to prove linearity. The third assumption is, (c) there should be homoscedasticity
of residuals (equal error variances). Homoscedasticity can be confirmed with a
consistent spread of data points in the scatterplot. The fourth assumption is, (d) there
should not be multicollinearity. Multicollinearity can be checked through the
inspection of Tolerance and/or VIF values. The fifth assumption is, (e) there should
be no significant outliers, high leverage points, or highly influential points. Outliers
can be identified through Casewise Diagnostic with a value of greater than ± as cut-
off criteria. Meanwhile, leverage values should be less than 0.2 to be considered safe,
any high leverage values of more than 0.2 are of concern. Influential points can be
measured by Cook’s distance, any values greater than (>1) should be investigated.
The sixth assumption is, (f) there should be a normal distribution of residuals. The
normality can be checked through the inspection of the histogram, P-Plot, and Q-Q
Plot. Points aligned along the diagonal line represent normality. The MRA’s
assumptions and their criteria are summarized Table 4-8 below. All of the MRA
procedures are adopting the SPSS 21.0 software.
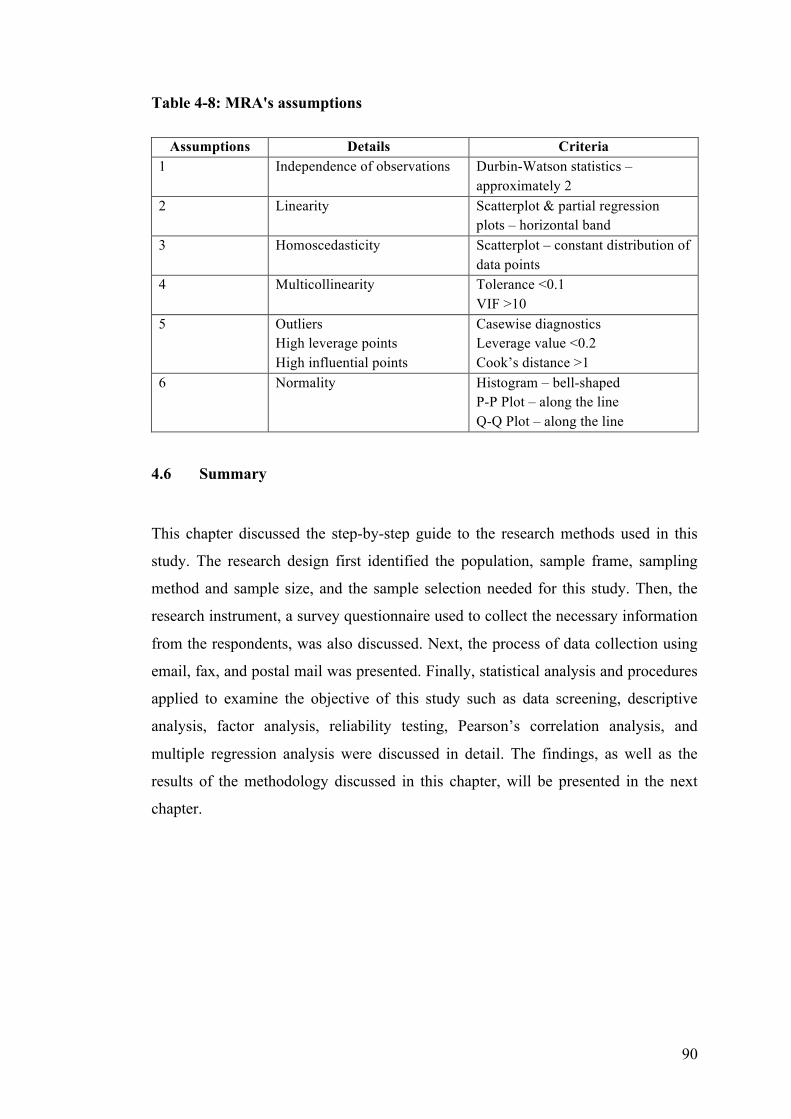
90
Table 4-8: MRA's assumptions
Assumptions Details Criteria 1 Independence of observations Durbin-Watson statistics –
approximately 2 2 Linearity Scatterplot & partial regression
plots – horizontal band 3 Homoscedasticity Scatterplot – constant distribution of
data points 4 Multicollinearity Tolerance <0.1
VIF >10 5 Outliers
High leverage points High influential points
Casewise diagnostics Leverage value <0.2 Cook’s distance >1
6 Normality Histogram – bell-shaped P-P Plot – along the line Q-Q Plot – along the line
4.6 Summary
This chapter discussed the step-by-step guide to the research methods used in this
study. The research design first identified the population, sample frame, sampling
method and sample size, and the sample selection needed for this study. Then, the
research instrument, a survey questionnaire used to collect the necessary information
from the respondents, was also discussed. Next, the process of data collection using
email, fax, and postal mail was presented. Finally, statistical analysis and procedures
applied to examine the objective of this study such as data screening, descriptive
analysis, factor analysis, reliability testing, Pearson’s correlation analysis, and
multiple regression analysis were discussed in detail. The findings, as well as the
results of the methodology discussed in this chapter, will be presented in the next
chapter.

91
CHAPTER 5
FINDINGS AND DISCUSSIONS
5.0 Introduction
This chapter presents an interpretation of the quantitative results with the purpose of
highlighting the relationship between each of the TQM practices and project
performance by Malaysian construction organizations. The section commences with a
discussion on the response rate, the respondents, and organization profiles. There is
then a discussion of the data cleaning to remove univariate and multivariate outliers,
exploratory factor analysis, and reliability analysis. A Pearson’s correlation analysis
to determine the bivariate relationship between the variables is subsequently
presented. A discussion of the statistical tests and their results, used to examine the
relationship and variables between leadership, strategic planning, workforce focus,
customer focus, analysis, management and knowledge management, operation focus,
and project performance in the construction industry, followed. Also presented in this
section is a discussion on the results achieved. An interpretation of the quantitative
results obtained in the last chapter, with the purpose of highlighting TQM practices, is
supported in the project performance of the Malaysian construction organizations.
More importantly, this chapter will relate these TQM practices with project
performance to illustrate the relationship between these two concepts.
5.1 Response Rate
Table 5-1: Summary of the response rate.
Description Number / percentage
Number of questionnaire sent 1,801
Number of questionnaire returned 170
Number of discarded questionnaires 9
Rate of response 8.94%
92
1,801 questionnaires were sent to the construction organizations in Malaysia through
emails, post, and fax. Overall, 170 returned questionnaires were received; 9
questionnaires were subsequently discarded due to the incompleteness of the
questionnaires. There were 161 useable questionnaires and the response rate for this
study was 8.94%. The summary of the response rate is presented in Table 5-1 above.
The data collection did not meet the minimum required response rate of 200
questionnaires due to various factors. One of the major obstacles when dealing with
data collection is the unwillingness of the respondents to collaborate. With the
financial and time constraints of this study, 170 questionnaires were collected.
Out of the 1,801 questionnaires sent, 170 organizations responded yielding a 9.4%
response rate. During the data collection phase of this study, a number of reasons for
non-responding were discovered. The main reason was the lack of willingness to
participate from the respondents. Furthermore, some of the mailing and postal
addresses, fax numbers, and contact numbers in the directories were incorrect, so the
questionnaires were not delivered to the targeted respondents. In addition, most of the
survey questionnaires were sent to a main office, while the intended respondents i.e.
project managers were often located at the project site. Hence, they were unable to
respond.
The response rate has met the requirements of Tabachnick and Fidell (2013) for
multiple regression analysis. Many of the other studies which looked at the
construction industry analysed approximately 100-200 respondents, such as Shieh and
Wu (2002): 157 responses, Mir and Pinnington (2014): 154 responses, Din, Abd-
Hamid, and Bryde (2011): 151 responses, Shrivastava, Mohanty, and Lakhe (2006):
147 responses, and Ali and Rahmat (2010): 112 responses. Compared to these studies
the final response of 145 in this study is considered sufficient.
5.2 Respondent profile
The 170 questionnaires returned came from construction organizations listed in the
CIDB Grade 7 category. Table 5-2 illustrates the number and percentage of the
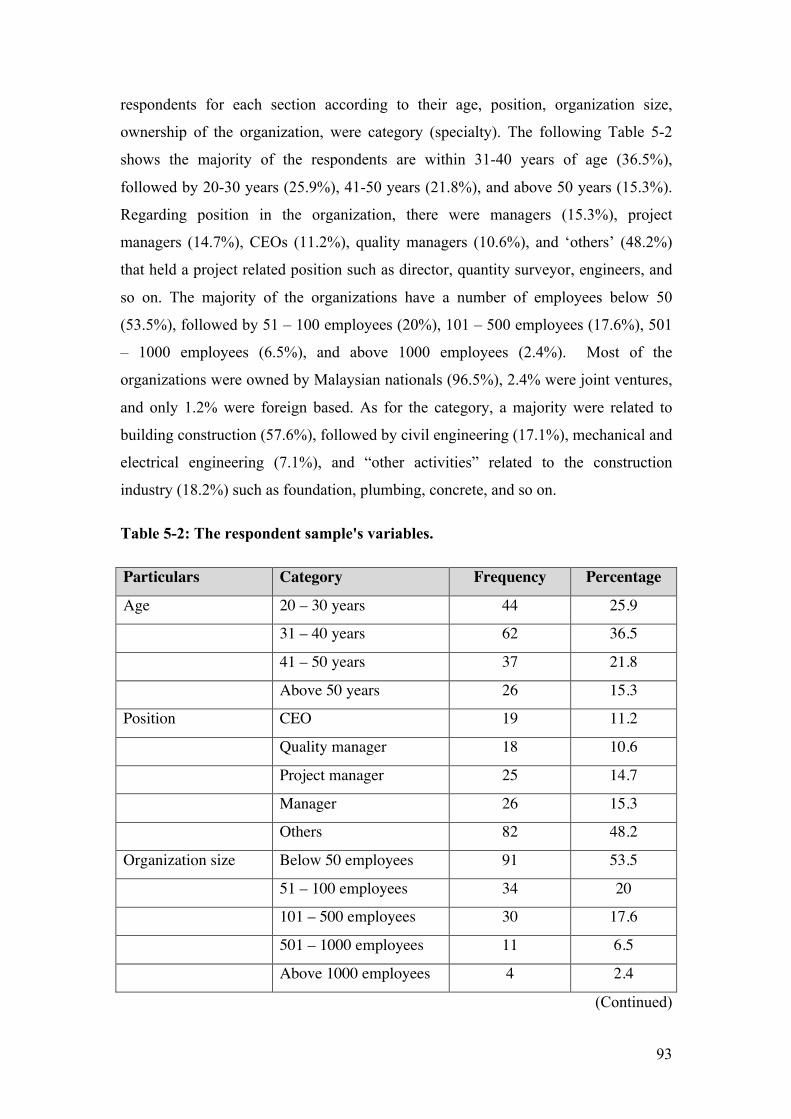
93
respondents for each section according to their age, position, organization size,
ownership of the organization, were category (specialty). The following Table 5-2
shows the majority of the respondents are within 31-40 years of age (36.5%),
followed by 20-30 years (25.9%), 41-50 years (21.8%), and above 50 years (15.3%).
Regarding position in the organization, there were managers (15.3%), project
managers (14.7%), CEOs (11.2%), quality managers (10.6%), and ‘others’ (48.2%)
that held a project related position such as director, quantity surveyor, engineers, and
so on. The majority of the organizations have a number of employees below 50
(53.5%), followed by 51 – 100 employees (20%), 101 – 500 employees (17.6%), 501
– 1000 employees (6.5%), and above 1000 employees (2.4%). Most of the
organizations were owned by Malaysian nationals (96.5%), 2.4% were joint ventures,
and only 1.2% were foreign based. As for the category, a majority were related to
building construction (57.6%), followed by civil engineering (17.1%), mechanical and
electrical engineering (7.1%), and “other activities” related to the construction
industry (18.2%) such as foundation, plumbing, concrete, and so on.
Table 5-2: The respondent sample's variables.
Particulars Category Frequency Percentage
Age 20 – 30 years 44 25.9
31 – 40 years 62 36.5
41 – 50 years 37 21.8
Above 50 years 26 15.3
Position CEO 19 11.2
Quality manager 18 10.6
Project manager 25 14.7
Manager 26 15.3
Others 82 48.2
Organization size Below 50 employees 91 53.5
51 – 100 employees 34 20
101 – 500 employees 30 17.6
501 – 1000 employees 11 6.5
Above 1000 employees 4 2.4
(Continued)
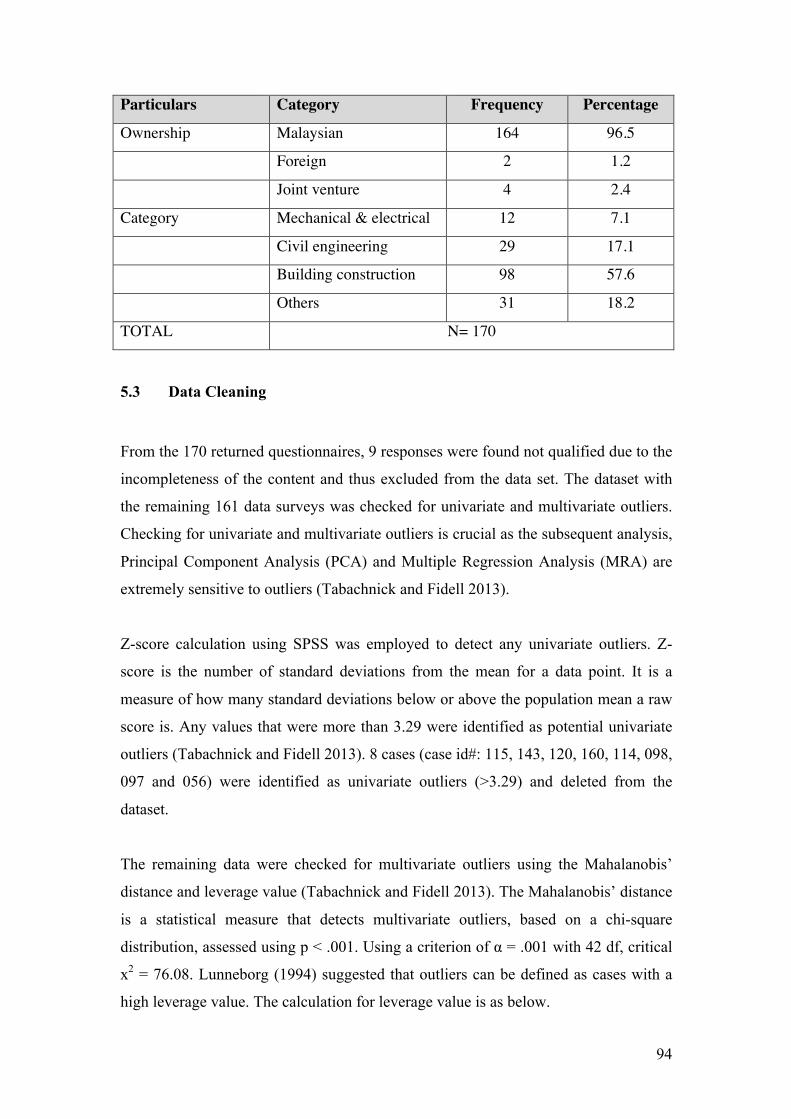
94
Particulars Category Frequency Percentage
Ownership Malaysian 164 96.5
Foreign 2 1.2
Joint venture 4 2.4
Category Mechanical & electrical 12 7.1
Civil engineering 29 17.1
Building construction 98 57.6
Others 31 18.2
TOTAL N= 170
5.3 Data Cleaning
From the 170 returned questionnaires, 9 responses were found not qualified due to the
incompleteness of the content and thus excluded from the data set. The dataset with
the remaining 161 data surveys was checked for univariate and multivariate outliers.
Checking for univariate and multivariate outliers is crucial as the subsequent analysis,
Principal Component Analysis (PCA) and Multiple Regression Analysis (MRA) are
extremely sensitive to outliers (Tabachnick and Fidell 2013).
Z-score calculation using SPSS was employed to detect any univariate outliers. Z-
score is the number of standard deviations from the mean for a data point. It is a
measure of how many standard deviations below or above the population mean a raw
score is. Any values that were more than 3.29 were identified as potential univariate
outliers (Tabachnick and Fidell 2013). 8 cases (case id#: 115, 143, 120, 160, 114, 098,
097 and 056) were identified as univariate outliers (>3.29) and deleted from the
dataset.
The remaining data were checked for multivariate outliers using the Mahalanobis’
distance and leverage value (Tabachnick and Fidell 2013). The Mahalanobis’ distance
is a statistical measure that detects multivariate outliers, based on a chi-square
distribution, assessed using p < .001. Using a criterion of α = .001 with 42 df, critical
x2 = 76.08. Lunneborg (1994) suggested that outliers can be defined as cases with a
high leverage value. The calculation for leverage value is as below.
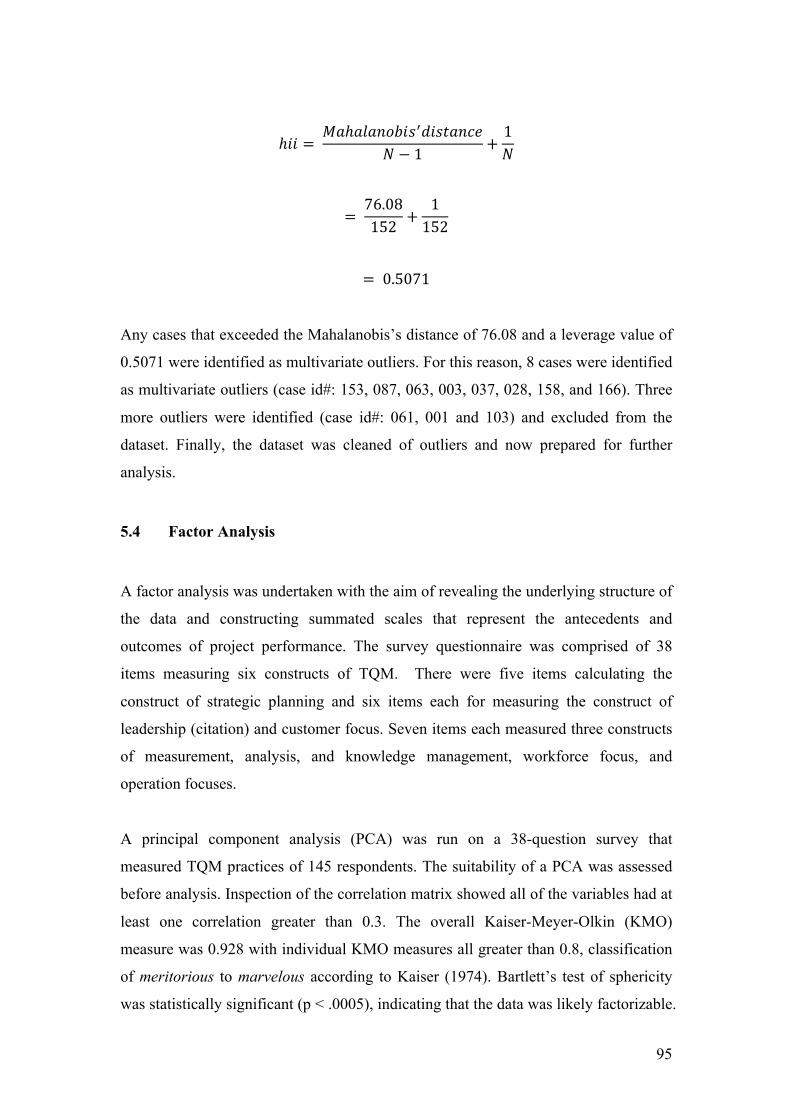
95
ℎ𝑖𝑖 = 𝑀𝑎ℎ𝑎𝑙𝑎𝑛𝑜𝑏𝑖𝑠!𝑑𝑖𝑠𝑡𝑎𝑛𝑐𝑒
𝑁 − 1 +1𝑁
= 76.08152 +
1152
= 0.5071
Any cases that exceeded the Mahalanobis’s distance of 76.08 and a leverage value of
0.5071 were identified as multivariate outliers. For this reason, 8 cases were identified
as multivariate outliers (case id#: 153, 087, 063, 003, 037, 028, 158, and 166). Three
more outliers were identified (case id#: 061, 001 and 103) and excluded from the
dataset. Finally, the dataset was cleaned of outliers and now prepared for further
analysis.
5.4 Factor Analysis
A factor analysis was undertaken with the aim of revealing the underlying structure of
the data and constructing summated scales that represent the antecedents and
outcomes of project performance. The survey questionnaire was comprised of 38
items measuring six constructs of TQM. There were five items calculating the
construct of strategic planning and six items each for measuring the construct of
leadership (citation) and customer focus. Seven items each measured three constructs
of measurement, analysis, and knowledge management, workforce focus, and
operation focuses.
A principal component analysis (PCA) was run on a 38-question survey that
measured TQM practices of 145 respondents. The suitability of a PCA was assessed
before analysis. Inspection of the correlation matrix showed all of the variables had at
least one correlation greater than 0.3. The overall Kaiser-Meyer-Olkin (KMO)
measure was 0.928 with individual KMO measures all greater than 0.8, classification
of meritorious to marvelous according to Kaiser (1974). Bartlett’s test of sphericity
was statistically significant (p < .0005), indicating that the data was likely factorizable.

96
The KMO results and Bartlett’s test results for TQM practices can be found in
Appendix E.
A PCA with forced factor 6 was applied with the rationale to retain as many of the
components established as TQM factors. Five components had eigen-values greater
than 1, and the 6th component had an eigen-value (0.98) of close to one as well. Thus,
the decision was made to retain the six components. The 6-component solution
explained 72.67% of the total variance. The PCA of the effect of TQM practices can
be found in Total Variance Explained in Appendix E.
The results of the PCA revealed all of the items loadings were above 0.4. A Promax
oblique rotation was employed to aid interpretability. The rotated solution exhibited
simple structure (Thurstone 1947). The interpretation of the data was consistent with
the TQM attributes, which the questionnaire was designed to measure. Measurement,
analysis and knowledge management items were loaded on component 1, workforce
focus items on component 2, leadership items on component 3, customer focus items
on component 4, strategic planning items on component 5, and finally, operation
focus items on component 6. The rotation output retained all six constructs of TQM
according to the literature with one slight difference, which will be discussed later in
the chapter. Component loadings and communalities of the rotated solution are
presented in Table 5-3 and structure matrix showing the correlations between
variables and factors are shown in Table 5-4.
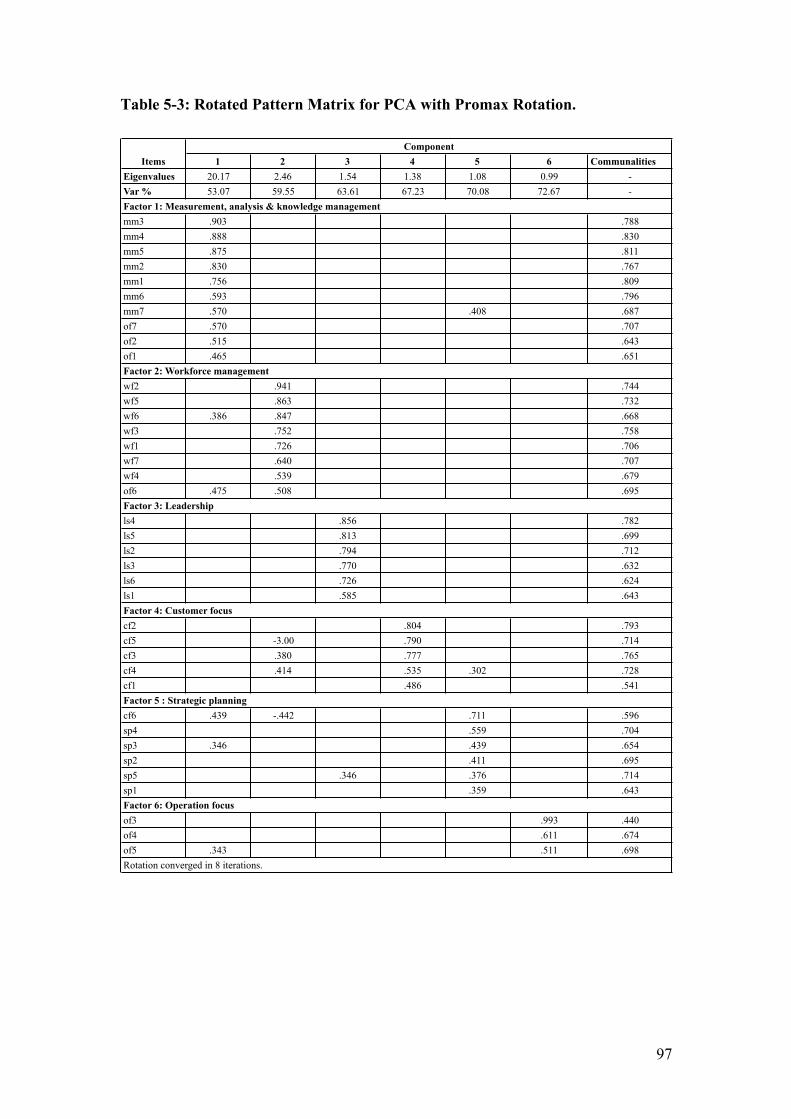
97
Table 5-3: Rotated Pattern Matrix for PCA with Promax Rotation.
1 2 3 4 5 6 CommunalitiesEigenvalues 20.17 2.46 1.54 1.38 1.08 0.99 -Var % 53.07 59.55 63.61 67.23 70.08 72.67 -
mm3 .903 .788mm4 .888 .830mm5 .875 .811mm2 .830 .767mm1 .756 .809mm6 .593 .796mm7 .570 .408 .687of7 .570 .707of2 .515 .643of1 .465 .651
wf2 .941 .744wf5 .863 .732wf6 .386 .847 .668wf3 .752 .758wf1 .726 .706wf7 .640 .707wf4 .539 .679of6 .475 .508 .695
ls4 .856 .782ls5 .813 .699ls2 .794 .712ls3 .770 .632ls6 .726 .624ls1 .585 .643
cf2 .804 .793cf5 -3.00 .790 .714cf3 .380 .777 .765cf4 .414 .535 .302 .728cf1 .486 .541
cf6 .439 -.442 .711 .596sp4 .559 .704sp3 .346 .439 .654sp2 .411 .695sp5 .346 .376 .714sp1 .359 .643
of3 .993 .440of4 .611 .674of5 .343 .511 .698
Factor 6: Operation focus
Rotation converged in 8 iterations.
Factor 2: Workforce management
Items
Factor 3: Leadership
Factor 4: Customer focus
Factor 5 : Strategic planning
Component
Factor 1: Measurement, analysis & knowledge management

98
Table 5-4: Structure matrix.
There were ten items loaded on Factor 1, all seven items from measurement, analysis,
and knowledge management (mm1, mm2, mm3, mm4, mm5, mm6, and mm7) and
three items from operation focus were added (of1, of2, and of7) with factor loadings
ranging from 0.465 to 0.903. The factor was deemed as valid as all items were loaded
on a single factor as expected. A composite score for the factor was created using the
sum scores of all of the ten items and the factor remained as measurement, analysis
and knowledge management.
Component 1 Component 2 Component 3 Component 4 Component 5 Component 6mm3 .898 .576 .524 .438 .486 .521mm4 .900 .620 .466 .438 .550 .534mm5 .892 .564 .502 .467 .541 .537mm2 .879 .597 .495 .584 .485 .494mm1 .878 .620 .550 .627 .550 .531mm6 .829 .701 .556 .607 .643 .556mm7 .740 .594 .383 .398 .631 .566of7 .798 .662 .471 .468 .418 .655of2 .723 .510 .407 .520 .219 .634of1 .741 .640 .496 .538 .323 .618wf2 .497 .853 .542 .501 .426 .491wf5 .527 .854 .608 .484 .485 .463wf6 .645 .802 .525 .370 .416 .412wf3 .558 .865 .604 .530 .592 .525wf1 .626 .804 .613 .539 .357 .521wf7 .538 .823 .583 .526 .638 .508wf4 .635 .751 .472 .333 .604 .558of6 .751 .754 .506 .471 .484 .572ls4 .362 .565 .860 .443 .544 .338ls5 .559 .526 .840 .480 .395 .343ls2 .442 .568 .830 .460 .381 .486ls3 .459 .490 .783 .402 .400 .466ls6 .358 .564 .768 .378 .478 .275ls1 .473 .658 .773 .506 .488 .403cf2 .520 .496 .568 .875 .450 .328cf5 .553 .358 .426 .800 .306 .407cf3 .402 .625 .428 .835 .472 .354cf4 .430 .714 .432 .743 .657 .498cf1 .451 .551 .490 .681 .557 .380cf6 .538 .323 .361 .396 .682 .330sp4 .529 .692 .640 .441 .790 .506sp3 .667 .618 .577 .523 .698 .508sp2 .631 .693 .622 .594 .728 .505sp5 .506 .707 .717 .603 .720 .499sp1 .616 .683 .580 .563 .685 .442of3 .485 .425 .315 .333 .359 .883of4 .654 .668 .587 .398 .490 .829of5 .722 .604 .566 .413 .374 .783Rotation converged in 8 iterations
Rotated Component CoefficientsItems
99
Factor 2 was comprised of eight items with seven items from workforce focus (wf1,
wf2, wf3, wf4, wf5, wf6, and wf7) and 1 item from operation focus (of7). The factor
loadings of the items ranged from 0.508 to 0.941. Consistent with the theoretical
foundations of the items, a composite score for the factor was created and
operationalized as workforce focus.
Six items were loaded on Factor 3 with strong factor loadings ranging from 0.585 to
0.856. All of the items loaded on this factor came from the same construct, which was
leadership (ls1, ls2, ls3, ls4, ls5, and ls6). Therefore, a composite score was calculated
and operationalized as the original construct, leadership.
Factor 4 was comprised of five items measuring customer satisfaction. All of the five
items came from the customer focus (cf1, cf2, cf3, cf4, and cf5), with factor loadings
ranging from 0.486 to 0.804. A composite score for the factor was determined and
named against the original construct, which was customer focus.
Factor 5 was a composition of six items, which mainly measured the strategic
planning of the company. Five items were derived from the construct of strategic
planning (sp1, sp2, sp3, sp4, and sp5) and one item from operation focus (cf6). All of
the items were loaded on the factor with factor loadings ranging from 0.359 to 0.711.
In accordance with the content of the loadings, which were mainly comprised of
strategic planning, a composite score was created and operationalized as strategic
planning.
The last component consisted of three items, which measured the operation practices
of a company. All of the items were derived from the same construct of operation
focus (of3, of4, and of5). The factor loadings ranged from 0.511 to 0.993. Hence, a
total score was calculated based on these three items and transformed into a new
variable, operation focus.
Similarly, an additional factor analysis was undertaken to assess the dimensionality of
the dependent variable, project performance. A single factor solution emerged with an
eigen value of 3.08 explaining 77.03% of the variance in the data. The KMO measure
of sampling adequacy was 0.82 indicating sufficient intercorrelations, while Bartlett’s

100
Test of Sphericity was statistically significant (p < .0005). The result of the factor
analysis for project performance is summarized in Table 5-5. A composite score was
generated based on the four items and operationalized as project performance.
Table 5-5: Factor loadings for project performance.
Based on the components or factors from the factor analysis, composite scores were
created. Each of the composite scores was based on the mean scores of the items that
were loaded onto the factor. The mean method was chosen because it gives
researchers more control over the calculations (Hair Jr et al. 2013) and facilitates the
interpretation of descriptive analysis results. Descriptive statistics of the composite
variables are presented in Table 5-6.
Table 5-6: Descriptive statistics of composite variables.
5.5 Reliability Analysis
The Cronbach’s coefficient alpha was tested on both independent and dependent
variables after factor analysis. Values range from 0 to 1, with higher values indicating
greater reliability. The minimum acceptable level for the reliability coefficient is 0.7
(Nunnally 1978) , Table 5-7 shows that each of the variable constructs exceeded the
minimum alpha value of 0.7, which indicates good internal consistency and reliability,
Items Component 1Meet project time objectives .85Good at delivering project within budget .90Project specifications are usually met by the time of handover .91Key stakeholders and users are usually happy with the results from the project .861Eigenvalue 3.08Percentage of variance 77.03Significance p < .0005
Variable Mean Std. Dev VarianceLeadership 4.110 0.580 0.337Strategic planning 3.920 0.624 0.390Customer focus 4.070 0.635 0.403Workforce focus 4.040 0.641 0.411Operation focus 3.770 0.677 0.459Measurment, analysis & knowledge management 3.780 0.748 5.560

101
which is necessary for further analysis. The reliability statistics for all of the variables
can be found in Appendix E.
Table 5-7: Cronbach’s alpha of the various constructs.
Variables Number of
items Number of deleted
items Cronbach’s
alpha Leadership 6 - .901 Strategic planning 6 - .897
Customer focus 5 - .869 Workforce focus 8 - .935 Operation focus 3 - .845 Measurement, analysis & knowledge management 10 - .957 Project performance 4 - .900
5.6 Correlation Analysis: Relationships between the Variables
The Pearson’s correlation analysis was carried out to examine the bivariate
relationships among the main variables. The results of the correlation analysis are
presented in Table 5-8. As depicted in the table, the correlation coefficients for the
variables were relatively high, ranging from 0.458 to 0.798. Workforce focus was
highly related to project performance (r = 0.619, p < 0.01). This was followed by the
variables of strategic planning (r = 0.558, p < 0.01), leadership (r = 0.533, p < 0.01),
operation focus (r = 0.513, p < 0.01), and analysis, management, and knowledge
management (r = 0.458, p < 0.01).
All of the TQM practices had significant positive correlations (p < 0.01) with project
performance. All 21 correlations were larger than 0.15. The highest coefficient
correlation in this research was 0.798, which is below the cut-off point of 0.90 for the
collinearity problem. Hence, collinearity and multicollinearity do not present
problems in this research (Hair Jr et al. 2013).

102
Table 5-8: Pearson's correlation analysis of the main variables.
5.7 Statistical Test of Hypotheses
This study seeks to describe the association between TQM practices and project
performance in Malaysian construction organizations by analyzing the 6 TQM
constructs, specifically leadership, strategic planning, customer focus, measurement,
analysis and knowledge management, workforce focus and operation focus.
The research hypotheses were structured according to the two specific research
questions from this study, which were to identify the relationship between TQM and
project performance and to determine which TQM practices have a greater association
with project performance. This study used the regression analysis technique to test the
regression model. Table 5-9 summarizes the hypotheses of the study.
Table 5-9: Summary of hypotheses.
Hypotheses
H1 There is a significant positive relationship between leadership and project
performance.
H2 There is a significant positive relationship between strategic planning and
project performance.
H3 There is a significant positive relationship between customer focus and
project performance.
H4 There is a significant positive relationship between workforce focus and
project performance.
(Continued)
Variables 1 2 3 4 5 6 7Project Performance 1.000Measurement, analysis & knowledge management 0.458** 1.000Workforce focus 0.619** 0.785** 1.000Leadership 0.533** 0.594** 0.706** 1.000Customer focus 0.452** 0.673** 0.669** 0.611** 1.000Strategic planning 0.558** 0.798** 0.775** 0.728** 0.730** 1.000Operation focus 0.513** 0.738** 0.681** 0.560** 0.527** 0.648** 1.000Notes: Correlation is significant at the **0.01 level (two-tailed)
103
Hypotheses
H5 There is a significant positive relationship between operation focus and
project performance.
H6 There is a significant positive relationship between measurement, analysis
and knowledge management and project performance.
A multiple regression analysis was run to test the hypotheses. MRA is a useful
technique that can be used to analyze the relationship between a dependent variable
and several independent variables (Hair Jr et al. 2013). Five independents variables
(total quality management constructs) and one dependent variable (project
performance) were entered in the multiple regression models using the Enter method.
The SPSS statistics showed that there was independence of residuals, as assessed by
the Durbin-Watson statistic of 1.853 (Appendix E). The inspection of (i) scatterplot
(Appendix E) of the studentized residuals against the (unstandardized) predicted
values and (ii) partial regression plots (Appendix E) showed that the independent
variables were collectively and individually in a linear relationship with the dependent
variable. Assessed by visual inspection of a plot of studentized residuals versus
unstandardized predicted values (Appendix E), the residuals were randomly scattered
indicating that there was homoscedasticity (i.e. the variances along the line of best fit
remain similar along the line). There was no evidence of multicollinearity, as assessed
by tolerance values (all greater than 0.1). Casewise diagnostics showed that there
were no studentized deleted residuals (outliers) greater than ±3 standard deviations.
The ordered leverage values showed no leverage values greater than 0.2. There was
no Cook’s distance value above 1 indicating no influential points available. The bell-
shaped histogram (Appendix E) and residuals aligned along the diagonal line as
shown in both P-P Plot (Appendix E) and Q-Q Plot (Appendix E) indicate the
assumption of normality was met. From these analyses, it can be concluded that
multiple regression models of this study meets the assumptions required to ensure the
validity of its significance test (Ooi et al. 2013).
The multiple regression model was statistically significant, F(6, 135) = 17.702, p
< .0005. Table 5-10, the coefficient of determination (R2) for the overall model was

104
44% with an adjusted R2 of 41.5%, a large size effect according to (Cohen et al. 2013).
The individual model variables revealed that workforce focus (β = 0.463, p < 0.01)
and operation focus (β = 0.225, p < 0.05) were found to have a significant and
positive effect on project performance. While, measurement, analysis, and knowledge
management (β = -0.321, p < 0.05) was found to have a significant negative effect on
project performance. Therefore, hypotheses H4 and H5 were supported. Meanwhile,
leadership, customer focus, and strategic planning had no significant effect on project
performance. Hence, H1, H2, H3, and H6 were not supported.
Table 5-10: Regressions predicting project performance.
B S.E. β p
(Constant) 1.016 0.326 0.002 Leadership 0.104 0.113 0.094 0.357 Strategic planning 0.238 0.138 0.231 0.085 Customer focus 0.013 0.100 0.013 0.894 Workforce focus 0.465 0.124 0.463 0.000 Operation focus 0.214 0.094 0.225 0.025 Measurement, analysis & knowledge management
-0.276 0.113 -0.321 0.016
R2 0.440
R2 Change 0.440
F Change 17.702 p < 0.001
Adj. R2 0.415
N 142
This chapter has so far presented the results of multiple regression analysis conducted
to test the direct relationship between TQM constructs and project performance. The
results of the hypotheses testing are presented and discussed below.
H1 There is a significant positive relationship between leadership and project
performance.
Hypothesis H1 argues that leadership is positively related to project performance in
the construction industry. However, the results of multiple regression analysis

105
revealed that its relationship with project performance (β = .094, p = .357) is not
significant. Therefore, hypothesis H1 is rejected.
H2 There is a significant positive relationship between strategic planning and
project performance.
Hypothesis H2 proposes that strategic planning is significantly related to project
performance in the construction industry. However, the results of the multiple
regression analysis showed the opposite. Strategic planning (β = .231, p = .085) had
no significant relationship with project performance. Hence, hypothesis H2 is rejected.
H3 There is a significant positive relationship between customer focus and
project performance.
Hypothesis H3 contends customer focus is significantly related to project performance
in the construction industry. The multiple regression analysis showed that customer
focus (β = .013, p = .894) had no significant relationship with project performance.
Hence, hypothesis H3 is rejected.
H4 There is a significant positive relationship between workforce focus and
project performance.
Hypothesis H4 maintains workforce focus is significantly related to project
performance. The results of multiple regression analysis showed that workforce focus
(β = .463, p = .000) had a significant and positive relationship with project
performance. Therefore, hypothesis H4 is supported.
H5 There is a significant positive relationship between operation focus and
project performance.
Hypothesis H5 argues that operation focus is significantly related to project
performance in the construction industry. The results of multiple regression analysis
indicated that operation focus (β = .225, p = .025) had a significant and positive
relationship with project performance. Therefore, hypothesis H5 is supported.
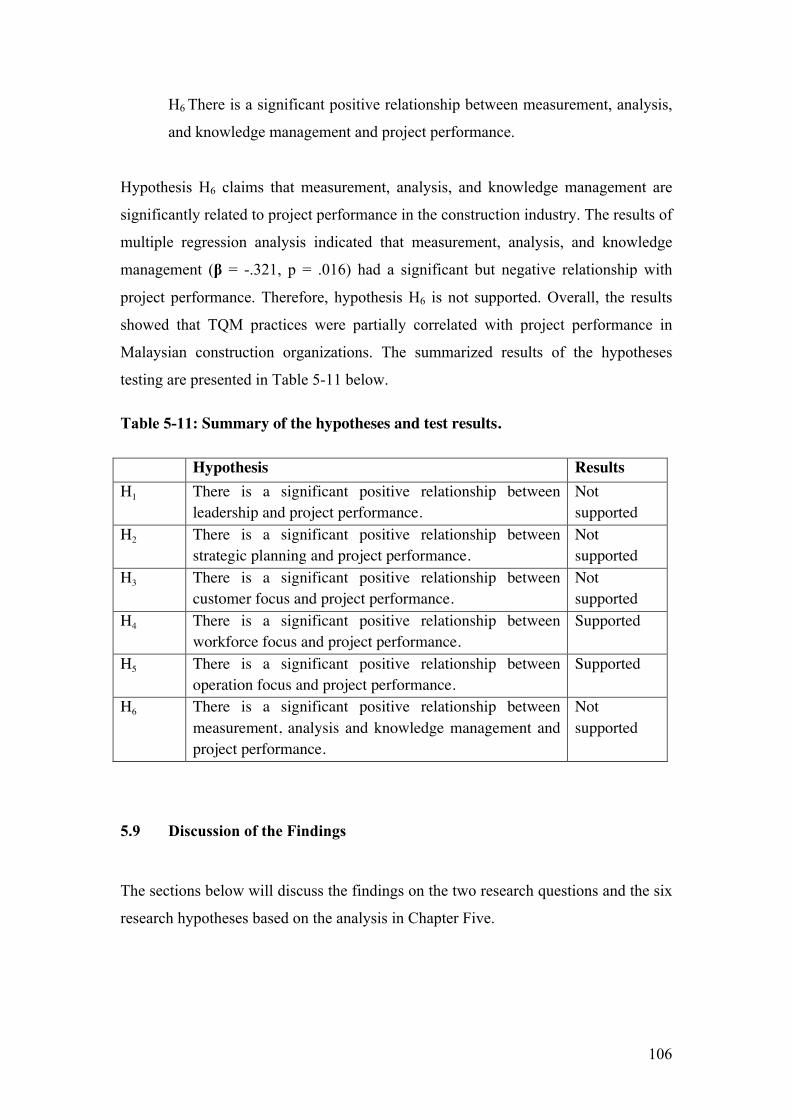
106
H6 There is a significant positive relationship between measurement, analysis,
and knowledge management and project performance.
Hypothesis H6 claims that measurement, analysis, and knowledge management are
significantly related to project performance in the construction industry. The results of
multiple regression analysis indicated that measurement, analysis, and knowledge
management (β = -.321, p = .016) had a significant but negative relationship with
project performance. Therefore, hypothesis H6 is not supported. Overall, the results
showed that TQM practices were partially correlated with project performance in
Malaysian construction organizations. The summarized results of the hypotheses
testing are presented in Table 5-11 below.
Table 5-11: Summary of the hypotheses and test results.
Hypothesis Results H1 There is a significant positive relationship between
leadership and project performance. Not supported
H2 There is a significant positive relationship between strategic planning and project performance.
Not supported
H3 There is a significant positive relationship between customer focus and project performance.
Not supported
H4 There is a significant positive relationship between workforce focus and project performance.
Supported
H5 There is a significant positive relationship between operation focus and project performance.
Supported
H6 There is a significant positive relationship between measurement, analysis and knowledge management and project performance.
Not supported
5.9 Discussion of the Findings
The sections below will discuss the findings on the two research questions and the six
research hypotheses based on the analysis in Chapter Five.

107
5.9.1 Discussions of Findings – Research Question One
To highlight the relationship between TQM practices and project performance, a
correlational analysis was presented in Chapter Five. The six TQM practices included
leadership, strategic planning, customer focus, workforce focus, operation focus, and
measurement, analysis, and knowledge management. Table 5-12 presents the analysis
of the responses given by the respondents on the TQM practices for their respective
construction organizations.
Table 5-12: Descriptive analysis of the various TQM constructs.
Variables Mean Std. Dev Variance Leadership 4.110 0.580 0.337 Strategic planning 3.920 0.624 0.390 Customer focus 4.070 0.635 0.403 Workforce focus 4.040 0.641 0.411 Operation focus 3.770 0.677 0.459 Measurement, analysis & knowledge management 3.780 0.748 0.560
Although there were different levels of responses given by the respondents, it was
determined that every construction organization, which participated in this study, had
applied all six practices of TQM.
The overall objective of this study was to investigate the nature of TQM practices and
their relationship towards project performance. Based on the analytical results in the
previous sections, TQM does have a significant relationship with project performance.
The results confirm the findings from previous studies (Mir and Pinnington 2014; Din,
Abd-Hamid and Bryde 2011; Arumugam, Ooi and Fong 2008). In summary, the TQM
practices based on the MBNQA framework have displayed a positive association with
project performance. Each of the TQM practices and their links to project
performance will be discussed in the following section.

108
5.9.2 Discussions of Findings – Research Question Two
Six hypotheses were developed to examine whether the dimensions of TQM, i.e.
leadership, strategic planning, customer focus, measurement, analysis, and knowledge
management, workforce focus, and operation focus were significantly related to
project performance within the construction organizations in Malaysia. The overall
hypotheses testing results obtained from a multiple regression analysis have shown
that 2 of the 6 dimensions, workforce focus and operation focus, have a significant
and positive impact on project performance. The others do not have a significant
impact on project performance. The findings of each hypothesis are discussed in the
following subsections.
5.9.2.1 Hypothesis 1 – Relationship of Leadership and Project
Performance
The initial conclusion that can be derived from this research is that leadership, one of
the TQM practices, has demonstrated an insignificant impact on project performance.
This indicates that the level of management leadership in the construction industry is
still not intensive enough to influence project performance. The outcome of this study
is consistent with but also contradicts other recent studies. A recent study by Shafiq,
Lasrado, and Hafeez (2017) found leadership had a significant relationship with
organizational performance both in financial and non-financial measurements. The
study was conducted in the textile sector in Pakistan using a structural equation model
(SEM), which is different in context of region, industry and analysis method from this
study. This may explain the contradictory results derived from the study. A study by
Talib, Rahman, and Qureshi (2013) found top management commitment had no
significant effect on quality performance. In their study, Sadikoglu and Olcay (2014)
also concluded, leadership was not significant to all of the firm’s performance
measurements which included operational performance, inventory performance,
employee performance, innovation performance, social responsibility, customer
satisfaction, and market and financial performance. The insignificant relationship of
leadership in project performance is explained in some of the literature. In project
success literature, leadership is not regarded as one of the success factors in project

109
management (Turner 2014). In Yang, Huang, and Wu (2011) the researchers
explained leadership is indirectly related to project performance through the
relationship between team members. This is a similar conclusion to one of the studies
conducted in Malaysia (Fung and Ramasamy 2015), who also claimed, while the
execution of leadership does not directly influence project performance, the team
effectiveness resulting from leadership enhancement is likely to lead to better
performance. This theory explains why leadership is not significant to project
performance as the relationship is amplified by the factor of teamwork. One of the
findings in Yang, Huang, and Wu (2011), stated that the higher the complexity level
of the projects the more likely the projects are to be successful compared to those
with lower complexity. The complexity of the project plays a moderating role in
enhancing project performance and if applied to this study, project complexity could
be an influencing factor that explains the relationship between leadership and project
performance. In other words, the project conducted by the contractors in this study
may consist of residential or shop lots with a lower level of complexity and where the
role of leadership has not improved project performance. Fung and Ramasamy (2015)
explained that project performance is not directly dependent on leadership but on
other factors. There are other factors that a play a mediating role in the relationship
between leadership and project performance (Lo, Ramayah and De Run 2010). It is
understandable not all TQM practices have a significant relationship with project
performance. It may be the case some TQM practices affect performance rather
indirectly through the application of other, additional TQM practices or factors. In
this study, it can be concluded leadership does not have a direct significant effect on
project performance. There is a possibility the role of leadership on project
performance is mediating through other factors and this may explain why leadership
does not play a significant role in enhancing project performance as claimed in the
general management literature.
5.9.2 .2 Hypothesis 2 – Relationship of Strategic Planning and Project
Performance
The results from this study demonstrate strategic planning does not have a significant
relationship in improving project performance in the Malaysian companies. The
110
assertion that planning is one of the critical success factors for project success, found
in almost all strategic management and project management literature (Johnson et al.
2001; Meredith and Mantel Jr 2011; Pinto and Slevin 1988; Turner 2014) does not
apply in this study. Talib, Rahman, and Qureshi (2013) in their study investigating
TQM in Indian service companies found strategic planning was not significant to
quality performance. A study conducted by Zwikael et al. (2014) in Fiji tried to
determine the moderating effect of risk on the relationship between planning and
success in project environment. The results of their regression analysis revealed
project planning was not significantly correlated with project efficiency and
effectiveness. Another study by Sadikoglu and Olcay (2014) also discovered that
strategic planning was only partially correlated with organizational performance in
Turkish firms. Out of seven measurements of organizational performance, strategic
planning only positively related to employee performance and social responsibility.
Despite the different regions, the results of these three studies show the same
outcomes, where strategic planning is not significantly or only partially correlated
with performances. This means that efforts in enhancing planning do not improve
project performance. Zwikael et al. (2014) discovered risk factors play a moderating
role in correlating project planning with success. They found the existence of a high-
risk increases the quality of planning and improves project efficiency while a low-risk
improves project effectiveness. This explains why strategic planning is found to have
no significant association with project performance in this study, where the presence
of risk factors plays a mediating role. In addition, construction practices such as
engagement of multiple professionals, reliance on subcontractors, and constant
changes to project descriptions and goals make planning even more challenging.
Laird (2016) observed the increasing size and complexity of the project enhanced the
correlation between project planning and project success. When size and complexity
increases, more effective planning is necessary to coordinate the interrelated efforts of
team members to success. This finding is parallel to the finding for leadership (see
5.9.2.1) where the factor of size, complexity, and risk of a project impacts the
performance indirectly. The outcome of this hypothesis implies strategic planning is
still not intensive enough to improve project performance. The implication of
strategic planning may exist through the existence of other factors, which need to be
further explored.

111
5.9.2.3 Hypothesis 3 – Relationship of Customer Focus and Project
Performance
The findings of this study show customer focus is not a vital determinant of project
performance. This signifies understanding customer needs and the efforts of fulfilling
customer satisfaction are not a priority in the construction industry and they do not
affect project performance. Talib, Rahman, and Qureshi (2013) discovered customer
focus was one of the TQM factors not significant to quality performance for Indian
service companies. In their study, customer focus had an indirect relationship with
quality performance through continuous improvement. Another study by Sadikoglu
and Olcay (2014) also revealed customer focus was partially correlated with
organizational performance in Turkish manufacturing and service industries. In their
study, customer focus only significantly related to two out of seven organizational
measurements (i.e. operational performance and social responsibility). Although both
Talib, Rahman, and Qureshi (2013) and Sadikoglu and Olcay (2014) conducted
studies in different countries and industries, they both showed similar outcomes to
this study. According to Talib, Rahman, and Qureshi (2013) customer focus related
indirectly to quality performance through other factors. This is supported by a
previous study by Tari, Molina, and Castejon (2007) which demonstrated customer
focus did not show a significant relationship with performance. However, the
relationship is indirectly linked to performance through process management. Nair
(2006) once again showed the impact of customer focus on performance
measurements is influenced by moderating factors. The customer-oriented activities
are designed to improve products and services with the goal of satisfying customers.
The outcomes of customer-focused activities will then be transferred to process
management to be implemented and eventually be reflected in the overall project
performance. The relationship between customer focus and performance with the
moderating effect of process management is applicable in the construction industry.
As in this current study, customer focus is not being prioritised in the construction
industry. The effect of customer focus on project performance could be a presence
through process management, which requires further study.
112
5.9.2.4 Hypothesis 4 – Relationship of Workforce Focus and Project
Performance
The outcome of this research illustrates workforce focus is significantly linked to
project performance in the Malaysian construction organizations. Workforce related
practices include employee involvement, human resource management, and employee
encouragement. In the studies of Naqvi, Bokhari, and Aziz (2011) and Zwikael and
Unger-Aviram (2010), human resource management has been regarded as one of the
core elements of project management. Other than that, one of the elements of
workforce focus, which is the performance management of employees, also has
gained significance in project performance (Naqvi, Bokhari and Aziz 2011). In
Sadikoglu and Olcay (2014) study, employee training was the only significant effect
on operational management. Other organization measurements such as inventory
performance, innovation performance, social responsibility, and market and financial
performance were not related to employee training in the Turkish manufacturing and
service industry (Sadikoglu and Olcay 2014). Furthermore, a study in the automotive
industry of Thailand by Popaitoon and Siengthai (2014) demonstrated human
resource management practices had a positive association with project-related
performance in the long term. However, Talib, Rahman, and Qureshi (2013) in their
study investigating TQM practices at Indian service companies showed workforce
related practices have no significant effect on quality performance. This can be
explained in which the repetitive work process in manufacturing and service
industries disregards the needs of workforce focus, as shown in both Talib, Rahman,
and Qureshi (2013) and Sadikoglu and Olcay (2014) . However, the construction
industry, which depends greatly on its workforce in the building process, says that
workforce focus is related to project performance. Overall, providing more intensive
workforce focus practices could trigger a greater contribution by employees to
achieving the desired project performance.
113
5.9.2.5 Hypothesis 5 – Relationship of Operation Focus and Project
Performance
Clear objectives and goals set by the organization with well-defined processes will
lead workers towards a better performance. The finding in this study has confirmed
this statement. ISO status certifies that Malaysian construction organizations under
G7 have a standardized process management system for their business. Similarly, in
other studies, process management has been confirmed as having a statistically
significant relationship with performance (Sadikoglu and Zehir 2010; Zehir et al.
2012). Mir and Pinnington (2014) studied United Arab Emirates (UAE) project based
organizations and observed one of the process management practices, KPIs (Key
performance indicators) was significantly correlated with project success. Similarly,
in Sadikoglu and Olcay (2014), their study revealed that process management
partially contributed to firm performance in the Turkish manufacturing and service
industry, through inventory performance, innovation performance, and customer
service. Zeng, Phan, and Matsui (2015), looked at management practices and their
impact on manufacturing performance in eight countries and discovered that process
management was as one of the quality management practices that had a direct effect
on quality performance. Process management has been shown to have a significant
correlation in enhancing project performance not only in Malaysia but in other
countries as well (Mir and Pinnington 2014). Process performance has also shown
significant contributions in the manufacturing and service industry (Sadikoglu and
Olcay 2014; Zeng, Phan and Matsui 2015). Regardless of country or industry, process
management has proven its importance in improving performance. The results of
these findings have highlighted the importance of implementing the appropriate
procedure throughout the project life cycle. A study by Tari, Molina, and Castejon
(2007) asserted quality outcomes are achieved through the continuous improvement
from process management activities. Process management activities such as
developing key work processes at every project level, establishing Key Performance
Indicators (KPIs), monitoring performance, approaches and tools to improve process
performance, reducing variability, and preparing emergency plans will lead the
organization to continuous improvement and ultimately have a positive impact on
project performance. Their findings have also indicated process management
114
activities must derive from suppliers and customers. Appropriate and effective work
process activities can only be defined and implemented through the understanding of
customer needs and a good relationship with suppliers. Particularly in a construction
project, the uncertain nature of the industry requires work processes to be defined,
managed, monitored, and controlled properly.
5.9.2.6 Relationship of Measurement, Analysis and Knowledge
Management and Project Performance
The current study’s results show measurement, analysis, and knowledge management
has a negative influence in improving the performance of the Malaysian construction
organizations. This result is surprising as the more time and effort focused on
measurement, analysis, and knowledge management, the less it will be in resulting the
project performance. This result is also contradictory to the findings of other studies.
In Mehralian et al. (2017) , quality information availability and usage were found to
be one of the TQM practices significantly affecting the performance of the
pharmaceutical industry in Iran. Valmohammadi and Roshanzamir (2015) in their
study investigating pharmaceutical manufacturing in Tehran showed measurement,
analysis and knowledge management was one of the TQM practices associated with
organizational performance. Zeng, Phan, and Matsui (2015) in their study discovered
quality information had a direct effect on the manufacturing industry’s quality
performance. In those studies, the importance of decision-making by managers based
on real data analysis had been emphasized. Reliable and timely data information
through appropriate tools or measurements is vital for upper management to decide
the organization’s direction and to drive excellence. On the other hand, some of the
studies revealed contradictory outcomes. Ooi et al. (2012) in their study investigating
Malaysian manufacturing revealed information analysis had a negative association
with innovation performance. Likewise in Teh, Tritos, and Dotun (2012), information
analysis had a negative relationship with the ASEAN (Thailand, Malaysia,
Philippines, Indonesia and Vietnam) automotive industry. It is not surprising that
measurement, analysis and knowledge management is not significant in improving
project performance as there are other studies showing a similar relationship in their
respective sector and country. The result of this hypothesis indicates the Malaysian

115
construction industry still does not recognize the importance of using quality
measurements and data in decision-making. Project managers in Malaysian
construction organizations should look into reallocating their resources wisely to take
advantage of adopting measurement, analysis, and knowledge management practices
to improve their project performance. To accomplish this, the management of the
organizations, especially the upper management decision-makers should rely more on
statistical measurements, and reliable analyzed data and encourage an information
sharing culture in the organization to gain competitive advantage and maintain a
leadership position in the industry.
5.10 Summary
This chapter presents the results of the various statistical analyses carried out to test
the hypotheses. Principle component analysis, the Pearson’s correlation analysis, and
multiple regression analysis were conducted according to formally recognized
procedures, and the results were presented in table format. The major findings with
regards to the hypotheses have been highlighted in this chapter together with
discussions. The next chapter focuses on the conclusions, implications, limitations,
and possible future studies.
116
CHAPTER 6
CONCLUSIONS AND IMPLICATIONS
6.0 Introduction
This chapter aims to draw some conclusions based on the discussion of the data
presented in Chapter 5 regarding the links between TQM and project performance.
This section also presents the implications of this research from the managerial and
theoretical perspectives. Finally, the limitations of this study and some suggestions
for further research in the future are provided.
6.1 Conclusions
The Malaysian construction industry has recognized the importance of continuous
quality improvement of TQM in its practices. One TQM recommendation in the
construction industry is the application for ISO 9000 certification. The ISO 9000
certification is only compulsory for those in the construction industry in Grade 7,
according to the CIDB. Other smaller scale construction organizations are still
lacking in TQM awareness and implementation. The continuous effort of promoting
and implementing quality management practices in Malaysia, especially in the
construction sector, need to be encouraged.
The current management practices show the recognition of the importance of the
workforce is essential to the Malaysian construction industry. The workforce is the
core factor that sustains the overall operation of a construction project, where every
stage of the project depends greatly on the workforce. This study suggests that by
providing training, a good working environment, by encouraging teamwork, problem
solving, a culture of ‘quality’, recognition, a rewards system, and fair compensation
will increase workforce satisfaction. In addition, continuous monitoring and
measuring of employee performance and job satisfaction are also essential to keep
the workforce motivated and hence perform their jobs to their ability. They are the
valuable assets that need great attention to improve the performance outcomes in the
construction industry.

117
Operation related functions are important in this unique, dynamic, and unpredictable
industry. Developing key work processes, Key Performance Indicators (KPIs), a
report system, new approaches and tools, improved communication with suppliers,
and emergency plans are important to develop the operation process of the Malaysian
construction organizations. Well-prepared operation functions enhance productivity.
Project performance in the Malaysian construction industry depends directly on
process management.
Another significance of this study is measurement, analysis and knowledge
management has a negative influence in improving the performance of the Malaysian
construction organizations. Similar implications are found in other sectors such as
the manufacturing sector in Malaysia (Ooi et al. 2012) and the automotive industry
of ASEAN (Teh, Tritos and Dotun 2012). Measurements of performance, data
collection and analysis, and knowledge management are the process of minimizing
and reducing variability and changes; hence, a negative relationship exists between
measurement, analysis and knowledge management and project performance. One
other significance arising from this finding, there is a lack of knowledge in the use of
measurement and analysis tools and a lack of support from management to instil a
culture of information sharing in the construction organizations. The organizations
have to reallocate their resources in this respect, as this is how reliable decision-
making should be based.
Other TQM practices such as leadership, strategic planning and customer focus do
not have a direct impact on project performance. However, other studies showed the
possibility of other mediating factors influencing these features and ultimately
performance (Lo, Ramayah and De Run 2010; Yang, Huang and Wu 2011; Zwikael
et al. 2014; Fung and Ramasamy 2015; Laird 2016). Overall TQM has a significant
impact on Malaysian construction project performance. The implication is that TQM
is a holistic approach, which should be implemented collectively because each
practice is interdependent with the other practices (Zwain, Lim and Othman 2017).

118
6.2 Research Implications
This research further enriches the TQM literature and brought some implications
from both theoretical and managerial perspectives, which will be discussed as
follows:
6.2.1 Managerial Implications
TQM is a recent development towards organizational success, which has been
followed by organizations around the world. It has been widely recognized as one of
the key elements for improving the performance of companies (Ooi et al. 2011).
Companies have started to adopt the quality-conscious management features of TQM
as it is one the most effective methods to improve the competitiveness of their firm
holistically. Moreover, the practices of TQM have been found to be useful
mechanisms to improve the management and performance either as a complete
package or individually. The findings and discussions in the previous sections
revealed valuable insights for practitioners and researchers in both quality and
project performance fields. The understanding of the significance of TQM practices
in the construction industry will indeed improve project performance.
This study has established some practical approaches for organizations, especially
Malaysian construction companies on how TQM practices can enhance project
performance. It is essential that a TQM framework be developed, tested, and studied
in the relevant context so that it can contribute effectively to the firms in the industry.
This research clearly demonstrates that 2 out of the 6 TQM practices, specifically
workforce focus and operation focus, have positive impacts on project performance
in the construction organizations of Malaysia. More explicitly, workforce focus and
operation focus stand out as two of the most effective TQM practices linked to
project performance. Hence, management should focus on these two constructs in
their organization.
This study provides a useful tool for practitioners in construction management.
Increasing the awareness of managers of all levels in the construction sector on the

119
multidimensionality of TQM and drawing their attention to how these 6 TQM
practices are devoted to project performance are the practical contributions of this
research. This research acknowledges the importance of TQM practices by
contributing to a successful project performance culture in the industry. The
continuous implementation, monitoring, and assessment of TQM practices in these
organizations should be emphasized to produce the best results within the
construction industry in Malaysia.
The findings of this study provide observations and insights to enable policy makers
and regulators, such as the CIDB, to assess and consider any relevant revisions and
amendments to current policies in Malaysia to improve quality performance in the
Malaysian construction industry. For instance, one suggestion is for workforce focus
and operation focus which have shown significant impact on project performance, be
incorporated into current Malaysian construction industry policy. The workforce and
operation focus related activities can be included as a source of reference to improve
project performance and upgrade the status of the Malaysian construction industry
globally. It is also suggested to expand the mandatory requirement of adopting ISO
9001 certification to the other groups of contractors, not just the G7 in Malaysia.
6.2.2 Theoretical Implications
In the project management literature, many studies have attempted to find a more
efficient way to achieve project success or improve project performance. However,
there is still insufficient research conducted in the area of TQM and project
performance relationships, especially in the context of the Malaysian construction
industry. In this research, a TQM model based on the MBNQA framework that
incorporated six measurements was developed to investigate whether such practices
would influence project performance in the construction organizations. This study is
believed to contribute knowledge of TQM to the literature, particularly in the context
of Malaysia. This research offers a foundation for future research to be carried out, to
examine the link between TQM and project performance, so additional insights can
be discovered and transformed into new concepts. Moreover, this study also
contributes to the literature by highlighting the effects of individual TQM practices

120
on project performance. The management team, through the findings of this research,
can develop a more encouraging TQM culture by modifying TQM practices so they
can be adapted for a specific organization.
6.3 Research Limitations and Future Research Directions
The results of this research had to address some data weaknesses due to resource and
time constraints. The first limitation was the study only focused on Malaysian
organizations. It is suggested this study could be broadened to other countries
including developed, developing, and underdeveloped countries. A comparison study
between Malaysia, a developing country, and another group of countries in the world
is encouraged. This may further investigate the differences in the relationship
between TQM and project performance across various nations. These investigations
are believed to bring significant contributions and valuable insights to the industry.
Secondly, due to time constraints, a cross-sectional study was conducted in this
research. In the future, a longitudinal study studying the link between TQM and
project performance in the industry based on time sequence is suggested. The
causality between variables can be tested through different points of time data for a
clearer and more significant contribution.
The questionnaire survey was targeted at middle to upper level project-related
personnel such as directors, CEOs, managers, project managers, quality managers,
and quantity surveyors. A different perspective covering the entire workforce will
provide greater insights on TQM applications in the organizations with a more
holistic outcome. The perspective on the adoption and application of TQM practices
from ordinary workers may differ from management and should be taken into
consideration as well. Therefore, it is suggested to conduct a study that covers the
different levels of the workforce.
The TQM practices discussed in this research are based on the MBNQA criteria and
consist of 6 constructs. The quality practices are limited in this study whereas in the
literature other factors may influence the performance outcome in the context of
121
construction. Other national quality award frameworks such as the Deming Prize and
the European Quality Award can also be adopted as the predictors in the future.
Furthermore, other external factors should be taken into consideration in the future
such as organizational culture, continuous improvement, corporate governance, and
corporate strategy. These factors may play essential roles in defining or moderating
quality practices and project performance.
It is suggested that this study could be expanded where the role of a mediating
influence would be investigated. The findings of this study showed many of the
TQM practices were not directly linked to project performance but the literature has
shown there is a history of mediating factors effecting variables and outcomes.
Another topic for research, which takes into consideration the mediating factor, is
using other alternative methodologies than the types used in this study.
Finally, the sample size of this study does not meet the minimum requirement to
represent the population of G7 contractors in Malaysia. A comparison of sample
sizes in the construction industry studies such as Shieh and Wu (2002); Shrivastava,
Mohanty, and Lakhe (2006), Ali and Rahmat (2010), Din, Abd-Hamid, and Bryde
(2011) and Mir and Pinnington (2014) suggest the sample size in this study is
acceptable. However, a future study is suggested to increase the sample size for a
better representation of the population and a better understanding of their
organizations practices affecting Malaysian project performance. A comparison
between a study with a larger sample size and the current study would be interesting
in validating these results.
6.5 Summary
This chapter summarized the discussion of all the findings in the previous chapter.
Each of the six hypotheses was examined and explained based on the empirical
results. Next, there was a discussion on the managerial and theoretical implications
of this research. There were some limitations to this research as well as suggestions
to expand on this research even further. The conclusion in this chapter completes this
research.
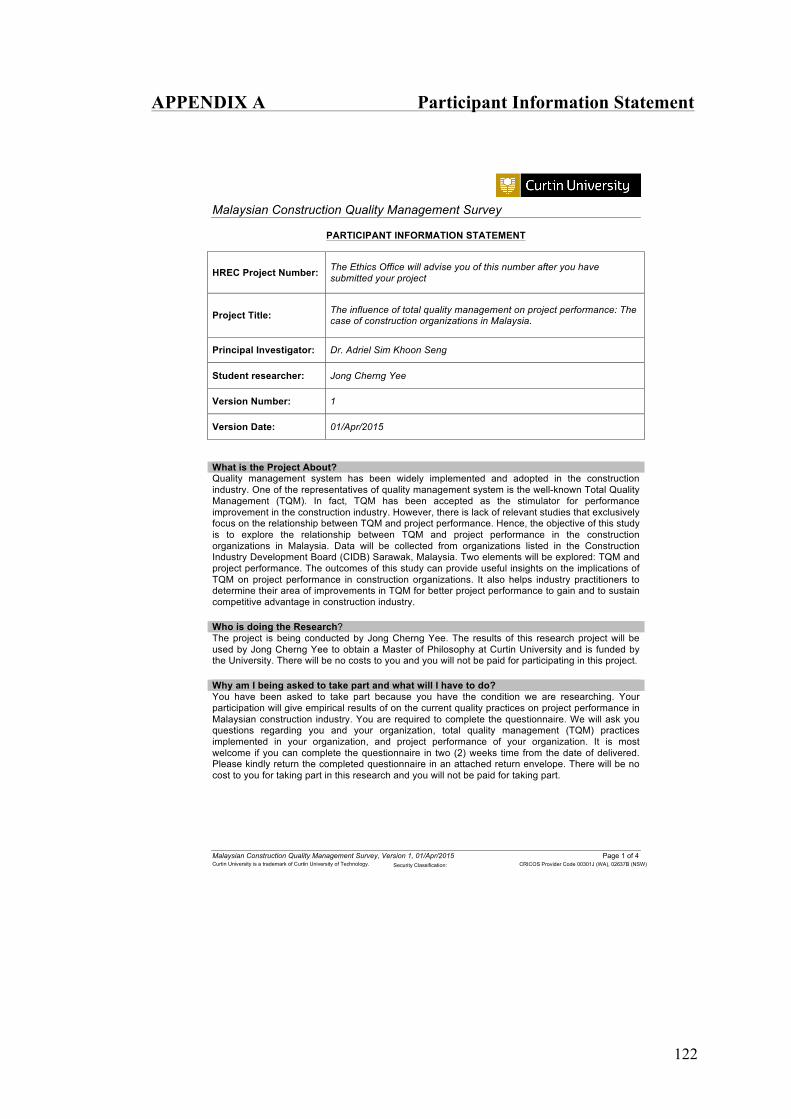
122
APPENDIX A Participant Information Statement
Malaysian Construction Quality Management Survey !
Malaysian Construction Quality Management Survey, Version 1, 01/Apr/2015 Page 1 of 4 CRICOS Provider Code 00301J (WA), 02637B (NSW)!Curtin University is a trademark of Curtin University of Technology.! Security Classification:
PARTICIPANT INFORMATION STATEMENT
HREC Project Number: The Ethics Office will advise you of this number after you have submitted your project
Project Title: The influence of total quality management on project performance: The case of construction organizations in Malaysia.
Principal Investigator: Dr. Adriel Sim Khoon Seng
Student researcher: Jong Cherng Yee
Version Number: 1
Version Date: 01/Apr/2015
What is the Project About? Quality management system has been widely implemented and adopted in the construction industry. One of the representatives of quality management system is the well-known Total Quality Management (TQM). In fact, TQM has been accepted as the stimulator for performance improvement in the construction industry. However, there is lack of relevant studies that exclusively focus on the relationship between TQM and project performance. Hence, the objective of this study is to explore the relationship between TQM and project performance in the construction organizations in Malaysia. Data will be collected from organizations listed in the Construction Industry Development Board (CIDB) Sarawak, Malaysia. Two elements will be explored: TQM and project performance. The outcomes of this study can provide useful insights on the implications of TQM on project performance in construction organizations. It also helps industry practitioners to determine their area of improvements in TQM for better project performance to gain and to sustain competitive advantage in construction industry. !Who is doing the Research? The project is being conducted by Jong Cherng Yee. The results of this research project will be used by Jong Cherng Yee to obtain a Master of Philosophy at Curtin University and is funded by the University. There will be no costs to you and you will not be paid for participating in this project. !Why am I being asked to take part and what will I have to do? You have been asked to take part because you have the condition we are researching. Your participation will give empirical results of on the current quality practices on project performance in Malaysian construction industry. You are required to complete the questionnaire. We will ask you questions regarding you and your organization, total quality management (TQM) practices implemented in your organization, and project performance of your organization. It is most welcome if you can complete the questionnaire in two (2) weeks time from the date of delivered. Please kindly return the completed questionnaire in an attached return envelope. There will be no cost to you for taking part in this research and you will not be paid for taking part.
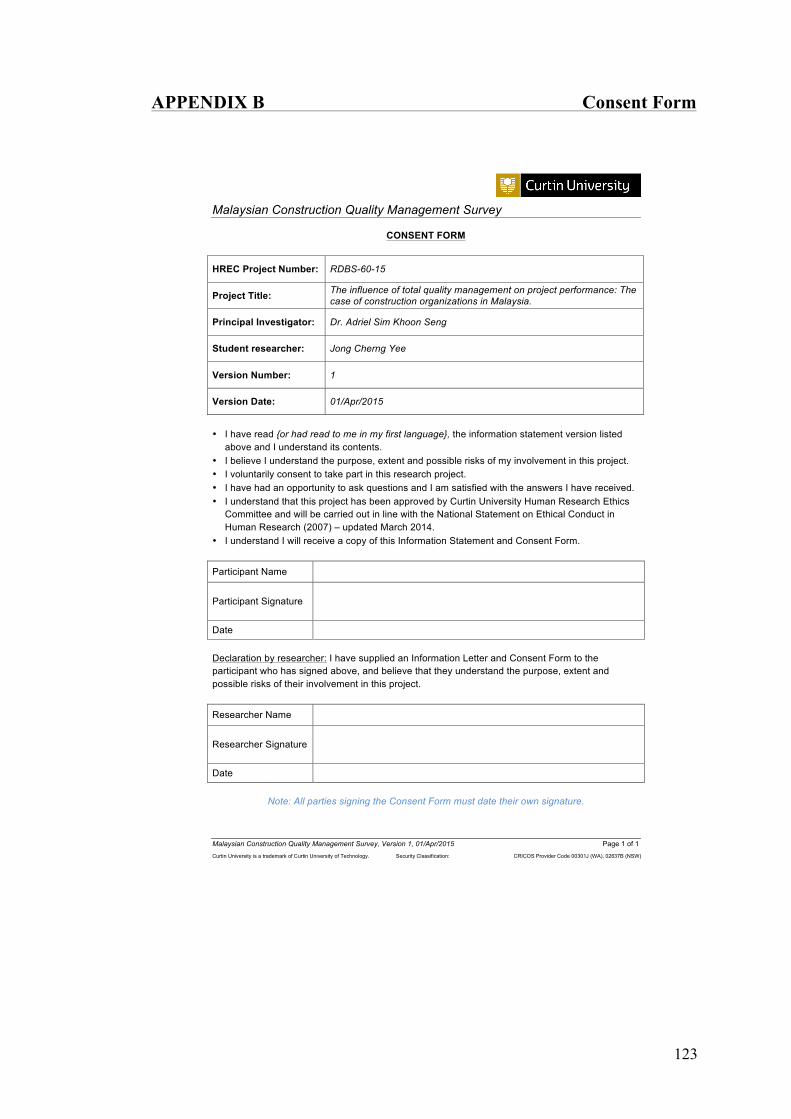
123
APPENDIX B Consent Form
Malaysian Construction Quality Management Survey !
Malaysian Construction Quality Management Survey, Version 1, 01/Apr/2015 Page 1 of 1 !
CRICOS Provider Code 00301J (WA), 02637B (NSW)!Curtin University is a trademark of Curtin University of Technology.! Security Classification:
CONSENT FORM
HREC Project Number: RDBS-60-15
Project Title: The influence of total quality management on project performance: The case of construction organizations in Malaysia.
Principal Investigator: Dr. Adriel Sim Khoon Seng
Student researcher: Jong Cherng Yee
Version Number: 1
Version Date: 01/Apr/2015
• I have read {or had read to me in my first language}, the information statement version listed
above and I understand its contents. • I believe I understand the purpose, extent and possible risks of my involvement in this project. • I voluntarily consent to take part in this research project. • I have had an opportunity to ask questions and I am satisfied with the answers I have received. • I understand that this project has been approved by Curtin University Human Research Ethics
Committee and will be carried out in line with the National Statement on Ethical Conduct in Human Research (2007) – updated March 2014.
• I understand I will receive a copy of this Information Statement and Consent Form.
Participant Name
Participant Signature
Date
Declaration by researcher: I have supplied an Information Letter and Consent Form to the participant who has signed above, and believe that they understand the purpose, extent and possible risks of their involvement in this project.
Researcher Name
Researcher Signature
Date
Note: All parties signing the Consent Form must date their own signature.

124
APPENDIX C Questionnaire
MALAYSIAN CONSTRUCTION QUALITY MANAGEMENT SURVEY 1
CherngYee Jong +6016 892 5123
QUESTIONNAIRE
Please tick at the box below.
I have received information regarding this research and had an opportunity to ask questions. I believe I understand the purpose, extent and possible risks of my involvement in this project and I voluntarily consent to take part.
Section A: Respondent & organization profile
Please tick at the relevant box for the questions below.
Age
20 – 30 30 – 40 40 – 50 ≥ 50
Position
CEO Quality Manager
Project Manager Manager
Other Please specify: _________________
Organization Size (No. of employees)
≤ 50 51 – 100 101 – 500 501 – 1000 ≥ 1000
Ownership
Malaysian Foreign Joint Venture
Category
Mechanical & Electrical Civil Engineering Building Construction Other
Please specify: _________________
What type of quality management do your organization practice? (You may tick more than one answer)
None Total Quality Management (TQM) ISO 9001 Lean Six Sigma Other Please specify: _________________

125
MALAYSIAN CONSTRUCTION QUALITY MANAGEMENT SURVEY 2
CherngYee Jong +6016 892 5123
Section B: Total Quality Management (TQM) practices
Please circle one number per line to indicate the extent to which the frequency of practice in your organization based on your assessment, perception or opinion, where (1) = very low, (2) = low, (3) = medium, (4) = high; and (5) = very high.
Leadership LS1 Top management establishes and sustains clear and visible
customer-focused quality vision, values and mission. 1 2 3 4 5
LS2 Top management participates in quality management and improvement process
1 2 3 4 5
LS3 Top management hold meetings discusses and reviews quality-related issues
1 2 3 4 5
LS4 Top management encourages quality-related concepts and skills 1 2 3 4 5 LS5 Top management allocates adequate resources for quality
improvement 1 2 3 4 5
LS6 Top management pursues long-term quality improvement process
1 2 3 4 5
Strategic Planning SP1 A mission statement which has been communicated throughout
the company and is supported by employees 1 2 3 4 5
SP2 A comprehensive structured planning process which regularly sets and reviews short and long-term goals
1 2 3 4 5
SP3 Incorporate supplier capabilities and needs of other stakeholders including the community when develops organization’s plans, policies, and objectives
1 2 3 4 5
SP4 Organization’s strategic plans and tactical plan are linked to quality values
1 2 3 4 5
SP5 Integrate continuous quality improvements into planning process
1 2 3 4 5
Customer Focus CF1 Customer focused practice and culture 1 2 3 4 5 CF2 Provide mechanism for customer feedback 1 2 3 4 5 CF3 Take customer complaints as continuous improvement process 1 2 3 4 5 CF4 Review customer complaints and take into consideration for
product innovation 1 2 3 4 5
CF5 Conduct a customer satisfaction survey 1 2 3 4 5 CF6 Conduct market study to collect suggestions for improving
product 1 2 3 4 5
Measurement, Analysis and Knowledge Management MM1 Implement organizational performance measurement system 1 2 3 4 5 MM2 Conduct organizational performance measure at a constant time
interval period 1 2 3 4 5
MM3 Data and information collection at all levels and in all parts of organization
1 2 3 4 5
MM4 Analyse and review the data and information collected 1 2 3 4 5 MM5 Availability of key performance figures for analysis and
decision making 1 2 3 4 5
MM6 Performance review findings for continuous improvement and innovation
1 2 3 4 5
MM7 Benchmarking of other firms’ product quality and procedures 1 2 3 4 5

126
MALAYSIAN CONSTRUCTION QUALITY MANAGEMENT SURVEY 3
CherngYee Jong +6016 892 5123
Workforce Focus WF1 Provide training and development process for all
employees 1 2 3 4 5
WF2 Encourage teamwork and problem solving among employees
1 2 3 4 5
WF3 Employee performance are monitored and measured 1 2 3 4 5 WF4 Measure employee satisfaction 1 2 3 4 5 WF5 Maintain a working environment that contributes to the
health, safety and well-being of all employees 1 2 3 4 5
WF6 Promote compensation, recognition, and reward system among employees
1 2 3 4 5
WF7 Instil quality culture on continuous improvement among employees
1 2 3 4 5
Operation Focus OF1 Develop a set of key work processes 1 2 3 4 5 OF2 Establish Key Performance Indicators (KPIs) for
monitoring purpose 1 2 3 4 5
OF3 Practice daily operation work processes report system 1 2 3 4 5 OF4 Monitor and reviews on work processes performance 1 2 3 4 5 OF5 Use of approaches or tools to improve process
performance and reduce variability 1 2 3 4 5
OF6 Exercise two-way communication with suppliers 1 2 3 4 5 OF7 A well-prepared disaster and emergency preparedness
system to ensure the continuity organization’s operations 1 2 3 4 5
Section 3: Project performance Please circle one number per line to indicate the extent to which you agree or disagree with the following statement, where (1) = strongly disagree, (2) = disagree, (3) = neutral, (4) = agree; and (5) = strongly agree. PP1 Meet project time objectives 1 2 3 4 5 PP2 Good at delivering project within budget 1 2 3 4 5 PP3 Project specifications are usually met by the time of
handover 1 2 3 4 5
PP4 Key stakeholders and end users are usually happy with the results from the project
1 2 3 4 5

127
APPENDIX D The Ethics Approval

128
APPENDIX E The Statistical Results Appendix E-1 - Principal component analysis (PCA) assumptions KMO & Bartlett’s test and Total Variance Explained
Appendix E-2 - Multiple regression analysis (MRA) assumptions Durtbin-Watson, Tolerance and VIF value Durbin-Watson 1.853 Collinearity Statistcis Model Tolerance VIF Measurement, analysis & knowledge management 0.238 4.200 Workforce focus 0.273 3.659 Leadership 0.401 2.494 Customer focus 0.426 2.348 Strategic planning 0.233 4.300 Operation focus 0.420 2.380
Scatterplot
0.9285129.448
7030.000
ComponentRotation Sums of Squared Loadings
Total % of variance Cumulative % Total % of variance Cumulative % Total1 20.168 53.073 53.073 20.168 53.073 53.073 15.3572 2.463 6.481 59.554 2.463 6.481 59.554 15.9243 1.541 4.055 63.609 1.541 4.055 63.609 12.8024 1.375 3.618 67.227 1.375 3.618 67.227 10.8595 1.083 2.849 70.076 1.083 2.849 70.076 10.6696 0.987 2.598 72.674 0.987 2.598 72.674 10.4017 0.818 2.153 74.8268 0.786 2.068 76.8949 0.712 1.874 78.768
10 0.593 1.56 82.034
Initial Eigenvalues Extraction Sum of Squared Loadings
Kaiser-Meyer-Olkin (KMO) of Sampling AdequacyBartlett's Test of Sphericity Approx. Chi Square
dfSig.

129
Partial egression plots Project performance and measurement, analysis and knowledge management
Project performance and workforce focus
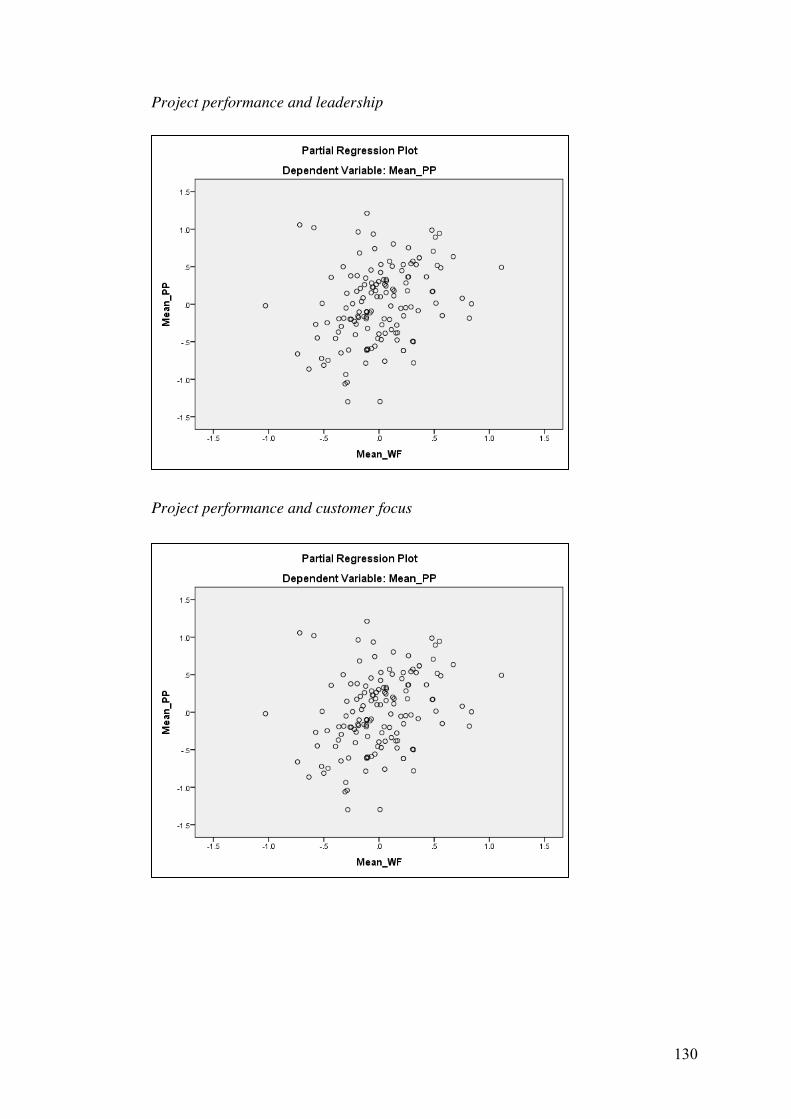
130
Project performance and leadership
Project performance and customer focus
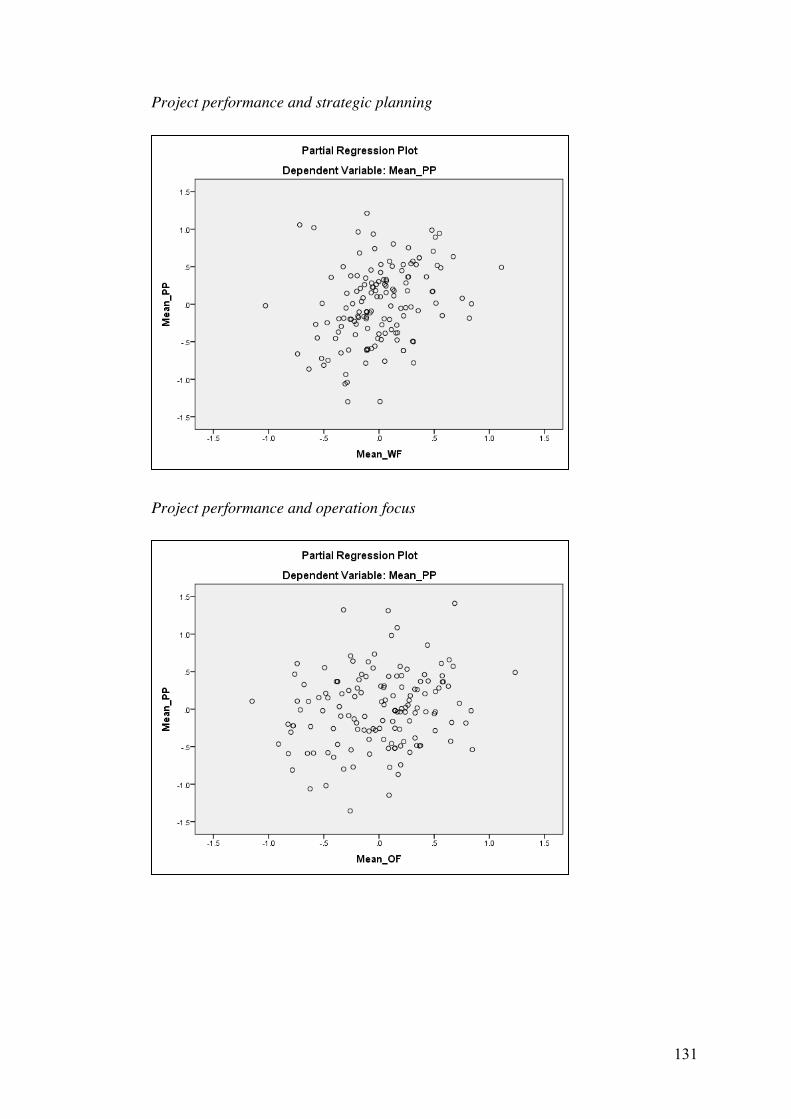
131
Project performance and strategic planning
Project performance and operation focus
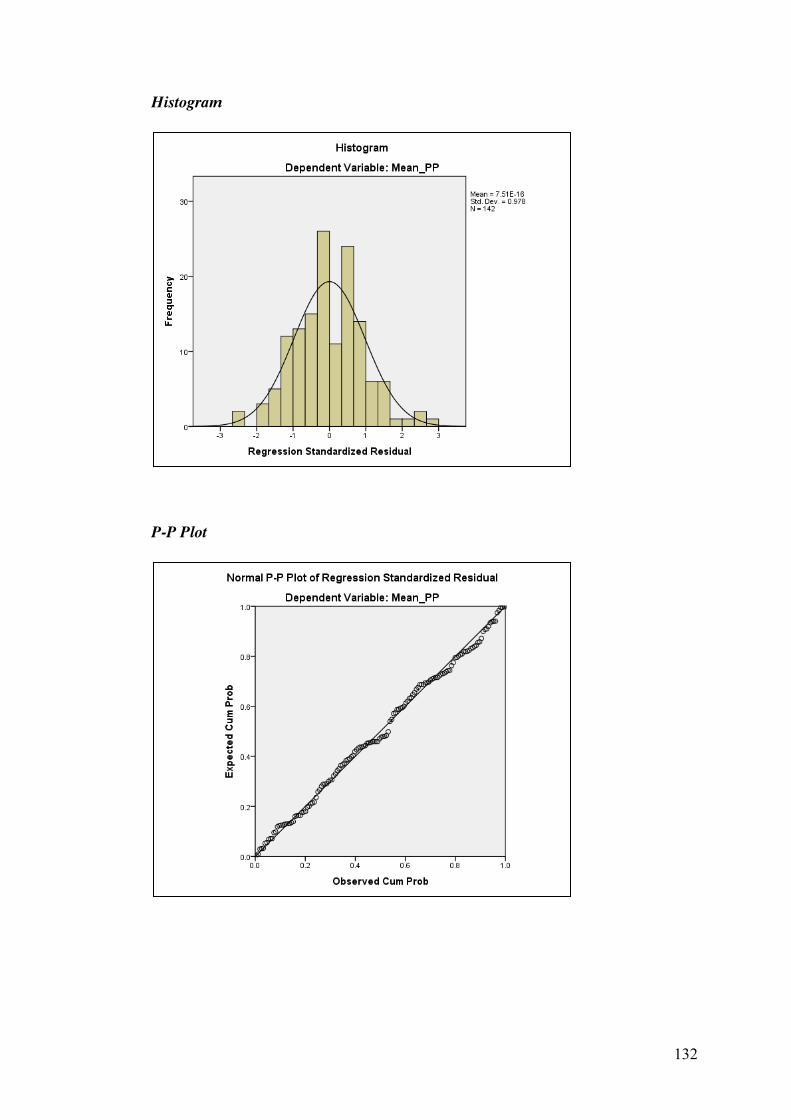
132
Histogram
P-P Plot

133
Q-Q Plot
134
References
Abdul-Rahman, H, and MN Alidrisyi. 1994. "A Perspective of Material
Management Practices in a Fast Developing Economy: The Case ofMalaysia."ConstructionManagementandEconomics12(5):413-422.doi:10.1080/01446199400000051.
Abdul-Rahman,H,MABerawi,ARBerawi,OMohamed,MOthman,andIAYahya.2006."DelayMitigationintheMalaysianConstructionIndustry."Journalofconstructionengineeringandmanagement132(2):125-133.
Abdullah, A A, Z Harun, and H Abdul Rahman. 2011. "Planning Process ofDevelopment Project in the Malaysian Context: A Crucial BriefOverview."InternationalJournalofAppliedScienceandTechnology1(2).
Abedi,M,MSFathi, andMFMohammad.2011. "EffectsofConstructionDelaysonConstructionProjectObjectives"TheFirst IranianStudentsScientificConferenceinMalaysia,
Agus,A.2011."EnhancingProductionPerformanceandCustomerPerformancethrough Total Quality Management (Tqm): Strategies for CompetitiveAdvantage."Procedia-SocialandBehavioralSciences24:1650-1662.
Ahire,SL,DYGolhar,andMAWaller.1996."DevelopmentandValidationofTqmImplementationConstructs."Decisionsciences27(1):23-56.
Aibinu,AA,andGOJagboro.2002."TheEffectsofConstructionDelaysonProjectDelivery in Nigerian Construction Industry." International journal ofprojectmanagement20(8):593-599.
Ali, AS, and I Rahmat. 2010. "The PerformanceMeasurement of ConstructionProjects Managed by Iso-Certified Contractors in Malaysia." Journal ofRetail and Leisure Property 9 (1): 25-35.http://www.scopus.com/inward/record.url?eid=2-s2.0-76849099276&partnerID=40&md5=4ff1363e3695ac9bec45ff8c38add748.
Almusharraf, AM. 2015. "Quality Deviation Requirements in ResidentialBuildings:PredictiveModelingoftheInteractionbetweenDeviationandCause."
Alotaibi, F, ZY Rushmani, and I Rabiul. 2013. "Assessing the Impact of TotalQualityManagementPracticesandQualityCulturewithCompetitvenessofSaudiContractors."AmericanJournalofAppliedSciences10 (6):638-645.

135
Alotaibi,F,RZYusoff,andRIslam.2013."AssessingtheImpactofTotalQualityManagement Practices and Quality Culture with Competitiveness ofSaudiContractors."Am.J.AppliedSci10:638-645.
Altayeb, M. M., and M. B. Alhasanat. 2014. "Implementing Total QualityManagement (Tqm) in the Palestinian Construction Industry."InternationalJournalofQualityandReliabilityManagement31(8):878-887.doi:10.1108/IJQRM-05-2013-0085.
Alzahrani, JI,andMWEmsley.2013."TheImpactofContractors’AttributesonConstruction Project Success: A Post Construction Evaluation."International Journal of Project Management 31 (2): 313-322. doi:http://dx.doi.org/10.1016/j.ijproman.2012.06.006.
Anantatmula,VS.2010."ProjectManagerLeadershipRoleinImprovingProjectPerformance."EngineeringManagementJournal22(1):13-22.
Anderson, EW, C Fornell, and SKMazvancheryl. 2004. "Customer SatisfactionandShareholderValue."Journalofmarketing68(4):172-185.
Anderson,RD,REJerman,andMRCrum.1998."QualityManagementInfluencesonLogisticsPerformance."TransportationResearchPartE:LogisticsandTransportation Review 34 (2): 137-148.http://www.scopus.com/inward/record.url?eid=2-s2.0-0242297033&partnerID=40&md5=ff3e0b4dec83d09897099b05fd089b83.
Arumugam, V, KB Ooi, and TC Fong. 2008. "Tqm Practices and QualityManagementPerformance:AnInvestigationofTheirRelationshipUsingData from Iso9001:2000Firms inMalaysia."TQMJournal 20 (6):636-650. http://www.scopus.com/inward/record.url?eid=2-s2.0-54849423658&partnerID=40&md5=0e66a2b89dec2390a9b0f7c83b572848.
Babin, BJ, and WG Zikmund. 2015. Exploring Marketing Research: CengageLearning.
Bakar,AHBA,KBAli,andEOnyeizu.2011."TotalQualityManagementPracticesin Large Construction Companies: A Case of Oman." World AppliedSciencesJournal15(2):285-296.
Banna,H,RAhmad,andEHYKoh.2016."HowDoesTotalQualityManagementInfluence the Loan Quality of the Bank?" Total QualityManagement &BusinessExcellence:1-14.
Bart,CK.1993. "ControllingNewProductR&DProjects."R&DManagement23(3):187-197.
BIS. 1992. Bs 7850 Total Quality Management British Standards PublishngLimited,London.
Bouranta, N, EL Psomas, and A Pantouvakis. 2017. "Identifying the CriticalDeterminants of Tqm and Their Impact on Company Performance:Evidence from the Hotel Industry of Greece."TheTQM Journal 29 (1):147-166.
Bryde, DJ. 2003. "Modelling Project Management Performance." InternationalJournalofQuality&ReliabilityManagement20(2):229-254.
Bryde, DJ, and L Robinson. 2007. "The Relationship between Total QualityManagement and the Focus of Project Management Practices." TQMMagazine 19 (1): 50-61. http://www.scopus.com/inward/record.url?eid=2-s2.0-33846051112&partnerID=40&md5=896c36464ea0d274314b9cb3019db7d5.

136
Burati, JL, and TH Oswald. 1993. "Implementing Tqm in Engineering andConstruction."JournalofManagementinEngineering9(4):456-470.doi:10.1061/(ASCE)9742-597X(1993)9:4(456).
Burns,AC,andRFBush.2003.MarketingResearch:OnlineResearchApplications:PrenticeHall.
Burns, AC, RF Bush, and N Sinha. 2014.Marketing Research. Vol. 7: PearsonBoston,MA,USA.
CA.1950."ContractAct,1950(Act136)."TheCommissionerofLawRevision,Malaysia:PercetakanNasionalMalaysiaBhd,2006.
Carmichael,DG.2002.DisputesandInternationalProjects:CRCPress.Chan, APC, D Scott, and EWMLam. 2002. "Framework of Success Criteria for
Design/Build Projects." Journal of Management in Engineering 18 (3):120-128.
Charoenngam,C,andESriprasert.2001."AssessmentofCostControlSystems:ACaseStudyofThaiConstructionOrganizations."EngineeringConstructionandArchitecturalManagement8(5‐6):368-380.
Chia, FC. 2012. "Construction and Economic Development: The Case ofMalaysia." InternationalJournalofConstructionManagement12(1):23-35.
CIDB, Malaysia. 2016. "Construction Industry Transformation Programme2016-2020DrivingConstructionExcellenceTogether".
Cohen, J, P Cohen, SG West, and LS Aiken. 2013. Applied MultipleRegression/CorrelationAnalysisfortheBehavioralSciences:Routledge.
Cooke-Davies,TJ.2004."ConsistentlyDoingtheRightProjectsandDoingThemRight–WhatMetricsDoYouNeed."Themeasured4(2):44-52.
Curkovic,S,SVickery,andCDröge.2000. "Quality‐RelatedActionPrograms:Their Impact onQuality Performance and FirmPerformance."DecisionSciences31(4):885-902.
Daft, RL. 2010.Management,Ninth Edition: South-Western, Cengage LearningindiaPvt.Limited.
Dahlgaard-Park, SM. 2011. "The Quality Movement: Where Are You Going?"TotalQualityManagement&BusinessExcellence22(5):493-516.
Dale, BG, A Van derWiele, and JD Van Iwaarden. 1999. "Tqm: An Overview."Managingquality:3-33.
Deming, WE. 1982. Quality, Productivity, and Competitive Position:MassachusettsInstituteofTechnologyCenterforAdvancedEn.
Department of Statistics, Malaysia. "Input - Output Tables Malaysia, 2005."https://www.statistics.gov.my/images/stories/files/LatestReleases/io/io2005_bi.pdf.
Din, S, Z Abd-Hamid, and DJ Bryde. 2011. "Iso 9000 Certification andConstruction Project Performance: The Malaysian Experience."International Journal of Project Management 29 (8): 1044-1056.http://www.scopus.com/inward/record.url?eid=2-s2.0-80053052972&partnerID=40&md5=fc21f22c2811111879ff5ab2f648a7f6.
Dulewicz, SV, and MJ Higgs. 2004. "Design of a New Instrument to AssessLeadershipDimensionsandStyles."Selectionanddevelopmentreview20(2):7-12.

137
Ebrahimi,M,andMSadeghi.2013."QualityManagementandPerformance:AnAnnotatedReview."InternationalJournalofProductionResearch51(18):5625-5643.
Feigenbaum,AV.1956."TotalQuality-Control."Harvardbusinessreview34(6):93-101.
Femi, OT. 2015. "Barriers and Benefits of Total Quality Management in theNigerian Construction Industry: A Review." International Journal ofEngineeringWorks2(1):7-13.
Flynn, BB, RG Schroeder, and S Sakakibara. 1995. "The Impact of QualityManagement Practices on Performance and Competitive Advantage."DecisionSciences26(5):659-691.
Fotopoulos, CV, and EL Psomas. 2010. "The Structural Relationships betweenTqmFactorsandOrganizationalPerformance."TheTQMJournal22(5):539-552.
Fuller, CM, MJ Simmering, G Atinc, Y Atinc, and BJ Babin. 2016. "CommonMethods Variance Detection in Business Research." Journal of BusinessResearch 69 (8): 3192-3198. doi:http://doi.org/10.1016/j.jbusres.2015.12.008.
Fung, HP, and S Ramasamy. 2015. "The Impact of Leadership Roles on TeamSatisfaction, Team Effectiveness and Project Performance–a Study ofProjectManagersinMalaysia."
Garland,R.1991."TheMid-PointonaRatingScale: Is ItDesirable."Marketingbulletin2(1):66-70.
Giang, DTH, and LS Pheng. 2011. "Role of Construction in EconomicDevelopment: Review of Key Concepts in the Past 40 Years." HabitatInternational35(1):118-125.
Gita, M, J Kam, and SF Tak. 2014. "The Relationship between ProjectManagement Process Characteristics and Performance Outcomes."ManagementResearchReview37(11):990-1015.doi:doi:10.1108/MRR-05-2013-0112.
Goetsch, DL, and SB Davis. 2006. Quality Management: Introduction to TotalQuality Management for Production, Processing, and Services: PearsonPrenticeHallUpperSaddleRiver,NJ.
Goodman, J, P O’Brien, and E Segal. 2000. "SellingQuality to the Cfo."QualityProgress56.
Griffis,SE,TJGoldsby,andMCooper.2003."Web‐BasedandMailSurveys:AComparisonofResponse,Data,andCost."JournalofBusinessLogistics24(2):237-258.
Gruca, TS, and LL Rego. 2005. "Customer Satisfaction, Cash Flow, andShareholderValue."JournalofMarketing69(3):1-130.
Günaydın,HM.1995."TotalQualityManagementintheConstructionIndustry."IllinoisInstituteofTechnology.
Hair Jr , JF, WC Black, BJ Babin, and RE Anderson. 2013. Multivariate DataAnalysis:PearsonEducationLimited.
Hamid, Z. A., and K. A. M. Kamar. 2010. "Modernising the MalaysianConstruction Industry" W089-Special Track 18th CIB World BuildingCongressMay2010Salford,UnitedKingdom,
Harari,O.1993."TenReasonsWhyTqmDoesn'tWork."Managementreview82(1):33.

138
Harrington,HJ,FVoehl,andHWiggin.2012."ApplyingTqmtotheConstructionIndustry." TQM Journal 24 (4): 352-362.http://www.scopus.com/inward/record.url?eid=2-s2.0-84864865592&partnerID=40&md5=0d7986cdfa8098af917ec94c0b7eebaa.
Hayes, BE. 1998. Measuring Customer Satisfaction: Survey Design, Use, andStatisticalAnalysisMethods:ASQQualityPress.
HDA. 2010. "Housing Development (Control and Licensing) Act, 1966 (Act188)."CommissionerofLawRevision,Malaysia.
Homburg,C,NKoschate,andWDHoyer.2005."DoSatisfiedCustomersReallyPayMore? A Study of the Relationship between Customer SatisfactionandWillingnesstoPay."JournalofMarketing69(2):84-96.
Hoonakker, P, P Carayon, and T Loushine. 2010. "Barriers and Benefits ofQualityManagement intheConstructionIndustry:AnEmpiricalStudy."TotalQualityManagementandBusinessExcellence 21 (9):953-969.doi:10.1080/14783363.2010.487673.
Ibrahim,ARB,MHRoy,ZAhmed, andG Imtiaz.2010. "An Investigationof theStatus of the Malaysian Construction Industry." Benchmarking: AnInternationalJournal17(2):294-308.
Irfan,SM,andDMHKee.2013."CriticalSuccessFactorsofTqmandItsImpacton Increased Service Quality: A Case from Service Sector of Pakistan."MiddleEastJournalofScientificResearch15(1):61-74.
Islam, R, andMRMustapha. 2008. "Organizational Approach to Total QualityManagement:ACaseStudy."AsianJournalofBusinessandAccounting 1(2): 19-38. http://www.scopus.com/inward/record.url?eid=2-s2.0-84858179734&partnerID=40&md5=c3558cb28a4667e9b060c85690932c02.
Jaeger, M, D Adair, and S Al-Qudah. 2013. "Mbnqa Criteria Used in the GccCountries."TheTQMJournal25(2):110-123.
Jiang, J. 2014. "The Study of the Relationship between Leadership Style andProjectSuccess."AmericanJournalofTradeandPolicy1(1):51-55.
Johnson, J, KD Boucher, K Connors, and J Robinson. 2001. "Collaborating onProjectSuccess."SoftwareMagazine7(2):15.
Juran,JM.1986."TheQualityTrilogy."Qualityprogress19(8):19-24.Kaiser,HF.1974."AnIndexofFactorialSimplicity."Psychometrika39(1):31-36.Kakkad,S,andPAhuja.2014."ImplementationofTotalQualityManagementin
aConstructionFirm."Kerzner,H,andHRKerzner.2017.ProjectManagement:ASystemsApproachto
Planning,Scheduling,andControlling:JohnWiley&Sons.Kerzner, HR. 2013. Project Management: A Systems Approach to Planning,
Scheduling,andControlling:JohnWiley&Sons.Kober,R,TSubraamanniam,andJWatson.2012."TheImpactofTotalQuality
Management Adoption on Small and Medium Enterprises’ FinancialPerformance."Accounting&Finance52(2):421-438.
Krejcie, RV, and DW Morgan. 1970. "Determining Sample Size for ResearchActivities."Educpsycholmeas.
Kumaraswamy, MM, and K Yogeswaran. 1998. "Significant Sources ofConstructionClaims."Internationalconstructionlawreview.
Kuo,TH,andYLKuo.2010."TheEffectofCorporateCultureandTotalQualityManagement on Construction Project Performance in Taiwan." TotalQuality Management and Business Excellence 21 (6): 617-632.

139
http://www.scopus.com/inward/record.url?eid=2-s2.0-77953657279&partnerID=40&md5=66d9afabf1dda794a3d3a4f0cd5591bd.
L, SP, and JA Teo. 2004. "Implementing Total Quality Management inConstructionFirms."JournalofManagementinEngineering20(1):8-15.http://www.scopus.com/inward/record.url?eid=2-s2.0-14744304029&partnerID=40&md5=4815a0c53f0a9f579c9fd13312243048.
Laird,DJ.2016."TheImpactofPanningandOtherOrganizationalFactorsontheSuccessofSmallInformationTechnologyProjects."
Lam, EWM, APC Chan, and DWM Chan. 2008. "Determinants of SuccessfulDesign-Build Projects." Journal of Construction Engineering andManagement 134 (5): 333-341. doi: 10.1061/(ASCE)0733-9364(2008)134:5(333).
Lam, KC, MCK Lam, and DWang. 2008. "Mbnqa‐Oriented Self‐AssessmentQuality Management System for Contractors: Fuzzy Ahp Approach."ConstructionManagementandEconomics26(5):447-461.
Lam,SY,VHLee,KBOoi,andPKongkiti.2012."AStructuralEquationModelofTqm, Market Orientation and Service Quality: Evidence from aDeveloping Nation."Managing Service Quality: An International Journal22(3):281-309.doi:doi:10.1108/09604521211230996.
Lam, SY, VH Lee, KB Ooi, and B Lin. 2011. "The Relationship between Tqm,LearningOrientationandMarketPerformanceinServiceOrganisations:AnEmpiricalAnalysis."TotalQualityManagement&BusinessExcellence22(12):1277-1297.
Lau, AWT, and SL Tang. 2009. "A Survey on the Advancement of Qa (QualityAssurance) to Tqm (Total Quality Management) for ConstructionContractors inHongKong." InternationalJournalofQuality&ReliabilityManagement26(5):410-425.
Lau,RSM,XZhao, andMXiao.2004. "AssessingQualityManagement inChinawith Mbnqa Criteria." International Journal of Quality & ReliabilityManagement21(7):699-713.
Lee, VH, and KB Ooi. 2014. "Applying the Malcolm Baldrige National QualityAwardCriteria:AnApproachtoStrengthenOrganisationalMemoryandProcess Innovation." Total Quality Management & Business Excellence(ahead-of-print):1-14.
Lee, VH, KB Ooi, and CK Choong. 2013. "Integrating Tqm, OrganisationalLearning and Technological Innovation." International Journal ofInnovationandLearning13(1):78-95.
Lee, VH, KB Ooi, AS Sohal, and AYL Chong. 2012. "Structural Relationshipbetween Tqm Practices and Learning Organisation in Malaysia'sManufacturingIndustry."Productionplanning&control23(10-11):885-902.
Lee, VH, KB Ooi, BI Tan, and AYL Chong. 2010. "A Structural Analysis of theRelationship between Tqm Practices and Product Innovation." AsianJournalofTechnologyInnovation18(1):73-96.
Lee, VS, and KB Ooi. 2015. "Applying the Malcolm Baldrige National QualityAwardCriteria:AnApproachtoStrengthenOrganisationalMemoryandProcessInnovation."TotalQualityManagement&BusinessExcellence26(11-12):1373-1386.
140
Leong, T. K., N. Zakuan, and M. Z. M. Saman. 2014. "Review of QualityManagement System Research in Construction Industry." InternationalJournal of Productivity and Quality Management 13 (1): 105-123.http://www.scopus.com/inward/record.url?eid=2-s2.0-84897899608&partnerID=40&md5=546db6397fcfb96b6ee27f5452d83945.
Leong, TK, N Zakuan, MZ Mat Saman, MSM Ariff, and CS Tan. 2014. "UsingProject Performance to Measure Effectiveness of Quality ManagementSystem Maintenance and Practices in Construction Industry." TheScientific World Journal 2014.http://www.scopus.com/inward/record.url?eid=2-s2.0-84896340239&partnerID=40&md5=617a632237390602bb51a1394e1fda5f.
Likert, R. 1932. "A Technique for the Measurement of Attitudes." Archives ofpsychology.
Ling, FY, SP Low, SQ Wang, and T Egbelakin. 2008. "Models for PredictingProject Performance in China Using Project Management PracticesAdoptedbyForeignAecFirms." JournalofConstructionEngineeringandManagement134(12):983-990.
Lo,MC,TRamayah, andECDeRun. 2010. "TestingMulti-DimensionalNatureof"NewLeadership" in aNon-WesternContext:TheCaseofMalaysia."JournalofOrganizationalCulture,CommunicationandConflict14(2):61.
Love, PED, DJ Edwards, and A Sohal. 2004. "Total Quality Management inAustralian Contracting Organisations: Pre-Conditions for SuccessfulImplementation." Engineering, Construction and ArchitecturalManagement 11 (3): 189-198.http://www.scopus.com/inward/record.url?eid=2-s2.0-2542439744&partnerID=40&md5=6c8850c4efb16c8cfcd65791a63fe0fb.
Low, SP, and KW Peh. 1996. "A Framework for Implementing Tqm inConstruction."TheTQMMagazine8(5):39-46.
Lunneborg, CE. 1994.ModelingExperimentalandObservationalData:DuxburyPress.
Malhotra, NK, and DF Birks. 2007.Marketing Research: An Applied Approach:PearsonEducation.
Mane, PP, and JR Patil. 2015. "Quality Management System at ConstructionProject: A Questionnaire Survey." Int. Journal of Engineering ResearchandApplications5(3):126-130.
Mehmet,Sİ,andAEmre.2012."TheEffectoftheIso9001QualityManagementSystemon thePerformanceof Smes." International JournalofQuality&Reliability Management 29 (7): 753-778. doi:doi:10.1108/02656711211258517.
Mehralian, G, JA Nazari, G Nooriparto, and HR Rasekh. 2017. "Tqm andOrganizational Performance Using the Balanced Scorecard Approach."InternationalJournalofProductivityandPerformanceManagement66(1):111-125.
Memon,AH, IARahman,andAAAAzis.2011. "PreliminaryStudyonCausativeFactors Leading toConstructionCostOverrun." International JournalofSustainableConstructionEngineeringandTechnology2(1).
Meredith, JR, and SJ Mantel Jr. 2011. Project Management: A ManagerialApproach:JohnWiley&Sons.
141
Metri, BA. 2005. "Tqm Critical Success Factors for Construction Firms."Management:JournalofContemporaryManagementIssues10(2):61-72.
Mintzberg, H. 1994. "The Rise and Fall of Strategic Planning: PreconceivingRolesforPlanning,Plans,Planners."NewYork:221-321.
Mir,FA,andAHPinnington.2014."ExploringtheValueofProjectManagement:Linking Project Management Performance and Project Success."International Journal of Project Management 32 (2): 202-217.http://www.scopus.com/inward/record.url?eid=2-s2.0-84890198091&partnerID=40&md5=008ee3c41710e5eb01a5feeb7a3e3071.
Miyagawa, M, and K Yoshida. 2010. "Tqm Practices of Japanese-OwnedManufacturers in theUSAandChina." InternationalJournalofQuality&ReliabilityManagement27(7):736-755.
Moen,R,andCNorman.2006."EvolutionofthePdcaCycle."Naidu,G.2007."InfrastructureDevelopmentinMalaysia."NageshKumar,ed.Nair,A.2006."Meta-AnalysisoftheRelationshipbetweenQualityManagement
PracticesandFirmPerformance—Implications forQualityManagementTheory Development." Journal of operations management 24 (6): 948-975.
Naqvi,IH,SHABokhari,andSAziz.2011."TheImpactofHumanResource(Hr)Performance Management on Project Outcome." African Journal ofBusinessManagement5(21):8491.
National Institute of Standards and Technology, NIST. 2013. "2013-2014CriteriaforPerformanceExcellence."
Neyestani,B.2016."ImpactofIso9001CertificationontheProjects'SuccessofLarge-Scale (Aaa) Construction Firms in the Philippines." InternationalResearchJournalofManagement,ITandSocialSciences3(11).
Nik Jaafar, NN. Land Development Process and Property Development.Accessed 9 April 2018, http://www.nilaiharta.com.my/view/land-development-process-and-property-development.
NLC.2008."NationalLandCode(Act56of1965)&Regulations."InternationalLawBooksServices,PetalingJaya,Selangor,Malaysia.
Nunnally,J.C.1978.PsychometricTheory:.Originaledition,NewYork:McGraw-Hill.Oakland, JS. 2014. Total QualityManagement andOperational Excellence: Text
withCases:Routledge.Oakland, JS, andMMarosszeky. 2006.TotalQuality in theConstructionSupply
Chain:Routledge.Odeh,AM,andHTBattaineh.2002. "CausesofConstructionDelay:Traditional
Contracts."Internationaljournalofprojectmanagement20(1):67-73.Ooi, KB. 2014. "Tqm: A Facilitator to Enhance Knowledge Management? A
Structural Analysis." Expert Systems with Applications 41 (11): 5167-5179.
Ooi,KB,VHLee,AYLChong,andBLin.2013. "DoesTqmImproveEmployees’QualityofWorkLife?EmpiricalEvidencefromMalaysia'sManufacturingFirms."ProductionPlanning&Control24(1):72-89.
Ooi, KB, B Lin, BI Tan, and AYL Chong. 2011. "Are Tqm Practices SupportingCustomerSatisfactionandServiceQuality?"JournalofServicesMarketing25(6):410-419.
142
Ooi, KB, B Lin, PL Teh, andAYL Chong. 2012. "Does Tqm Support InnovationPerformance inMalaysia'sManufacturing Industry?" JournalofBusinessEconomicsandManagement13(2):366-393.
Pallant,J.2011."MultivariateAnalysisofVariance."SPSSsurvivalmanual.CrowsNest:Allen&Unwin20(11):283-96.
Papke-Shields, KE, C Beise, and J Quan. 2010. "Do Project Managers PracticeWhatTheyPreach,andDoesItMattertoProjectSuccess?"InternationalJournalofProjectManagement28(7):650-662.
Patterson, JH. 2010. "Leadership: The Project Management Essential."ProductionandInventoryManagementJournal46(2):73-89.
Pheng, LS, and JA Teo. 2004. "Implementing Total Quality Management inConstructionFirms."JournalofmanagementinEngineering20(1):8-15.
Pinto, JK,andDPSlevin.1988."CriticalSuccessFactorsacross theProjectLifeCycle":ProjectManagementInstitute.
Podsakoff,PM,SBMacKenzie,andNPPodsakoff.2012."SourcesofMethodBiasinSocialScienceResearchandRecommendationsonHowtoControlIt."Annualreviewofpsychology63:539-569.
Polat, G, A Damci, and Y Tatar. 2011. "Barriers and Benefits of Total QualityManagement in the Construction Industry: Evidence from TurkishContractors":Citeseer.
Popaitoon,S,andSSiengthai.2014."TheModeratingEffectofHumanResourceManagement Practices on the Relationship between KnowledgeAbsorptive Capacity and Project Performance in Project-OrientedCompanies." International Journal of Project Management 32 (6): 908-920.
Prajogo,DI,andCMMcDermott.2005."TheRelationshipbetweenTotalQualityManagementPracticesandOrganizationalCulture."InternationalJournalofOperations&ProductionManagement25(11):1101-1122.
Pratt,R.2000."ProjectManagementinMalaysia,SomeIdeasontheWayAhead"Asia pacificDiligence SdnBhd Seminar, projectmanagement: Strategies,techniques,OperationandControl,KualaLumpur,Malaysia,
Proust,E.2011. "How toAchieveSuccess in IconicConstructionProjects:TheIron Triangle Hegemony Challenged (a Master's Thesis)." Chalmers,Göteborg,Sweden.
Psomas, EL, F Vouzas, and D Kafetzopoulos. 2014. "Quality ManagementBenefits through the “Soft” and “Hard” Aspect of Tqm in FoodCompanies."TheTQM Journal 26 (5): 431-444. doi: doi:10.1108/TQM-02-2013-0017.
Rahman, MNA, and JDT Tannock. 2005. "Tqm Best Practices: Experiences ofMalaysianSmes."TotalQualityManagement&BusinessExcellence16(4):491-503.
Rahman, Shams-ur, and Amrik S Sohal. 2002. "A Review and Classification ofTotal Quality Management Research in Australia and an Agenda forFuture Research." International Journal of Quality & ReliabilityManagement19(1):46-66.
RazakBinIbrahim,A,MHRoy,ZAhmed,andGImtiaz.2010."AnInvestigationoftheStatusoftheMalaysianConstructionIndustry."Benchmarking:AnInternationalJournal17(2):294-308.
143
Razak, DA, MO Mohammed, and KM Tarique. 2015. "Abandoned HousingProjects in Malaysia and the Prospect of Dp: An Overview." ProcediaEconomicsandFinance31:813-822.
Reid, RD, and NR Sanders. 2011. "Operation Management: An IntegratedApproach(FouthEdition).Versailles(Us)."JohnWiley&Sons,Inc.
Rumane,AbdulRazzak.2010.QualityManagementinConstructionProjects:CRCPress.
Sabella,A,RKashou, andOOmran.2014. "QualityManagementPractices andTheirRelationshiptoOrganizationalPerformance."InternationalJournalofOperations&ProductionManagement34(12):1487-1505.
Sadikoglu, E, and H Olcay. 2014. "The Effects of Total Quality ManagementPractices on Performance and theReasons of and the Barriers to TqmPracticesinTurkey."AdvancesinDecisionSciences2014.
Sadikoglu, E, and C Zehir. 2010. "Investigating the Effects of Innovation andEmployee Performance on the Relationship between Total QualityManagement Practices and Firm Performance: An Empirical Study ofTurkish Firms." International Journal of Production Economics 127 (1):13-26.
Salkind,NJ.2014.ExploringResearch.eighthed:PearsonEducation,Inc.,N.J.,US.Samat,N, TRamayah, andNMat Saad. 2006. "TqmPractices, ServiceQuality,
and Market Orientation: Some Empirical Evidence from a DevelopingCountry."ManagementResearchNews29(11):713-728.
Sambasivan,M,andYWSoon.2007."CausesandEffectsofDelaysinMalaysianConstruction Industry." International Journalofprojectmanagement 25(5):517-526.
Sambasivan,M,andWSYau.2007. "CausesandEffectsofDelays inMalaysianConstruction Industry." International Journalofprojectmanagement 25(5):517-526.
Saraph,JV,PGBenson,andRGSchroeder.1989."AnInstrumentforMeasuringthe Critical Factors of Quality Management." Decision sciences 20 (4):810-829.
Saunders, MNK. 2011. Research Methods for Business Students, 5/E: PearsonEducationIndia.
Sedgwick, P. 2014. "Cross Sectional Studies: Advantages and Disadvantages."BMJ:BritishMedicalJournal348.
Shafiq,M,FLasrado,andKHafeez.2017."TheEffectofTqmonOrganisationalPerformance:EmpiricalEvidencefromtheTextileSectorofaDevelopingCountryUsingSem."TotalQualityManagement&BusinessExcellence:1-22.
Shagar, KL. 2014. "Liow: Klia2 Safety of Utmost Concern." The Star Onlinehttp://www.thestar.com.my/news/nation/2014/12/12/liow-promises-action-on-klia2-probe-report-on-problems-at-airport-expected-soon/.
Shehu, Z, IR Endut, A Akintoye, and GD Holt. 2014. "Cost Overrun in theMalaysian Construction Industry Projects: A Deeper Insight."InternationalJournalofProjectManagement32(8):1471-1480.
Shenhar, AJ, D Dvir, O Levy, and AC Maltz. 2001. "Project Success: AMultidimensional StrategicConcept."LongRangePlanning 34 (6): 699-725. http://www.scopus.com/inward/record.url?eid=2-s2.0-0035735411&partnerID=40&md5=16bfdd56c1668b48f4ed25a1f0c204d7.

144
Shewhart,WA.1926."QualityControlCharts1."BellSystemTechnicalJournal5(4):593-603.
———.1931.EconomicControlofQualityofManufacturedProduct:ASQQualityPress.
Shieh, HM, and KY Wu. 2002. "The Relationship between Total QualityManagement and Project Performance in Building Planning Phase: AnEmpirical Study of Real Estate Industries in Taiwan." Total QualityManagement 13 (1): 133-151.http://www.scopus.com/inward/record.url?eid=2-s2.0-0036397491&partnerID=40&md5=f6a739c69e01fcf7f6af2d710b12e06f.
Shore, B. 2008. "Systematic Biases and Culture in Project Failures." ProjectManagementJournal39(4):5-16.
Shrivastava, RL, RP Mohanty, and RR Lakhe. 2006. "Linkages between TotalQuality Management and Organisational Performance: An EmpiricalStudyforIndianIndustry."Productionplanning&control17(1):13-30.
Sila, I. 2007. "Examining the Effects of Contextual Factors on Tqm andPerformancethroughtheLensofOrganizationalTheories:AnEmpiricalStudy."JournalofOperationsmanagement25(1):83-109.
Sila, I, and M Ebrahimpour. 2002. "An Investigation of the Total QualityManagementSurveyBasedResearchPublishedbetween1989and2000:A Literature Review." International Journal of Quality & ReliabilityManagement19(7):902-970.
Sovacool,BK, andLCBulan. 2011. "Behind anAmbitiousMegaproject inAsia:The History and Implications of the Bakun Hydroelectric Dam inBorneo."EnergyPolicy39(9):4842-4859.
———.2012."EnergySecurityandHydropowerDevelopmentinMalaysia:TheDrivers and Challenges Facing the Sarawak Corridor of RenewableEnergy(Score)."RenewableEnergy40(1):113-129.
Sweis, GJ, R Sweis, MA Rumman, RA Hussein, and SE Dahiyat. 2013. "CostOverrunsinPublicConstructionProjects:TheCaseofJordan."JournalofAmericanScience9(7s):134-141.
Tabachnick, BG, and LS Fidell. 2013.UsingMultivariate Statistics, 6th Edition:PearsonEducationLimited.
Talib, F, Z Rahman, and MN Qureshi. 2013. "An Empirical Investigation ofRelationship between Total QualityManagement Practices and QualityPerformance in Indian Service Companies." International Journal ofQuality&ReliabilityManagement30(3):280-318.
Tari, JJ, JF Molina, and JL Castejon. 2007. "The Relationship between QualityManagementPracticesandTheirEffectsonQualityOutcomes."Europeanjournalofoperationalresearch183(2):483-501.
Taylor, F.W. 1911. "The Principles of Scientific Management." New York &London:HarperBrothers.
Teh, PL, L Tritos, and A Dotun. 2012. "The Complementary of Tqm onTechnologyManagementStrategy:AMultinationalPerspectivefromtheAsean Automotive Industry" Industrial Engineering and EngineeringManagement(IEEM),2012IEEEInternationalConferenceon:IEEE.
Terziovski, M. 2006. "Quality Management Practices and Their Relationshipwith Customer Satisfaction and Productivity Improvement."ManagementResearchNews29(7):414-424.
145
Thiagaragan, T, M Zairi, and BG Dale. 2001. "A Proposed Model of TqmImplementation Based on an Empirical Study of Malaysian Industry."InternationalJournalofQuality&ReliabilityManagement18(3):289-306.
Thurstone,LL.1947."MultipleFactorAnalysis."Tingey,MO.1997."ComparingIso9000,MalcolmBaldrigeandtheSeiCmmfor
Software."PrenticeHallPTR.Tochrim,WM.2002.ResearchMethodsKnowledgeBase:CornelUniversiti,New
York.Toor, SR, and SO Ogunlana. 2010. "Beyond the ‘Iron Triangle’: Stakeholder
PerceptionofKeyPerformance Indicators (Kpis) forLarge-ScalePublicSector Development Projects." International Journal of ProjectManagement 28 (3): 228-236. doi:http://dx.doi.org/10.1016/j.ijproman.2009.05.005.
Turner,JR.2014.TheHandbookofProject-BasedManagement.Vol.92:McGraw-hill.
VAEA.1981."Valuers,AppraisersandEstateAgents (Amendment)Act2017."InternationalLawBooksServices,PetalingJaya,Selangor,Malaysia.
Valmohammadi,C.,andSRoshanzamir.2015."TheGuidelinesofImprovement:Relations among Organizational Culture, Tqm and Performance."International Journal of Production Economics 164: 167-178. doi:10.1016/j.ijpe.2014.12.028.
Wanderi,EEN,HMberia,andJOduor.2015."EvaluationofFactorsInfluencingTotal Quality Management Implementation in Rwadan ConstructionCompanies: Case of Fair Construction Company." European Journal ofBusinessandSocialSciences4(03):14-28.
Westerveld,E.2003."TheProjectExcellenceModel®:LinkingSuccessCriteriaand Critical Success Factors." International Journal of ProjectManagement21(6):411-418.
Williams, P, and E Naumann. 2011. "Customer Satisfaction and BusinessPerformance:AFirm-LevelAnalysis."Journalofservicesmarketing25(1):20-32.
Wong,A.1999."TotalQualityManagementintheConstructionIndustryinHongKong: A Supply Chain Management Perspective." Total QualityManagement10(2):199-208.
Wright,B,andAOOgbuehi.2014. "SurveyingAdolescents:The ImpactofDataCollection Methodology on Response Quality." Electronic Journal ofBusinessResearchMethods12(1):41-53.
Wu, SI, and SY Liu. 2010. "The Performance Measurement Perspectives andCausal Relationship for Iso-Certified Companies: A Case of Opto-Electronic Industry." International Journal of Quality & ReliabilityManagement27(1):27-47.
Yang, LR, CF Huang, and KS Wu. 2011. "The Association among ProjectManager's Leadership Style, Teamwork and Project Success."Internationaljournalofprojectmanagement29(3):258-267.
Yeung, JFY, APC Chan, and DWM Chan. 2009. "A Computerized Model forMeasuring and Benchmarking the Partnering Performance ofConstruction Projects." Automation in Construction 18 (8): 1099-1113.doi:10.1016/j.autcon.2009.07.003.

146
Yong,J,andAWilkinson.2002."TheLongandWindingRoad:TheEvolutionofQualityManagement."TotalQualityManagement13(1):101-121.
Zakuan, N, SM Yusof, MZM Saman, and AM Shaharoun. 2010. "ConfirmatoryFactorAnalysis of TqmPractices inMalaysia andThailandAutomotiveIndustries."InternationalJournalofBusinessandManagement5(1):160.
Zehir,C,ÖGErtosun,SZehir,andBMüceldilli.2012."TotalQualityManagementPractices’EffectsonQualityPerformanceandInnovativePerformance."Procedia - Social and Behavioral Sciences 41: 273-280. doi:http://dx.doi.org/10.1016/j.sbspro.2012.04.031.
Zeng, J, CA Phan, and Y Matsui. 2015. "The Impact of Hard and Soft QualityManagement on Quality and Innovation Performance: An EmpiricalStudy."InternationalJournalofProductionEconomics162:216-226.
Zou,W,MKumaraswamy, JChung,and JWong.2014. "Identifying theCriticalSuccess Factors for Relationship Management in Ppp Projects."InternationalJournalofProjectManagement32(2):265-274.
Zwain,AAA,KTLim,andSNOthman.2017."TqmandAcademicPerformanceinIraqiHeis:AssociationsandMediatingEffectofKm."TheTQMJournal29(2):357-368.
Zwikael,O,andSGloberson.2004."EvaluatingtheQualityofProjectPlanning:AModelandFieldResults."InternationalJournalofProductionResearch42(8):1545-1556.
———. 2006. "Benchmarking of Project Planning and Success in SelectedIndustries."Benchmarking:AnInternationalJournal13(6):688-700.
Zwikael,O,RDPathak,GuSingh,andSAhmed.2014."TheModeratingEffectofRisk on the Relationship between Planning and Success." InternationalJournalofProjectManagement32(3):435-441.
Zwikael, O, and E Unger-Aviram. 2010. "Hrm in Project Groups: The Effect ofProject Duration on Team Development Effectiveness." InternationalJournalofProjectManagement28(5):413-421.
“Every reasonable effort has been made to acknowledge the owners of copyright material. I would please to hear from any copyright owner who has been omitted or incorrectly acknowledged.”
Related Documents