THE INFLUENCE OF STRATEGIC LEADERSHIP ON FIRM INVENTIVE AND INNOVATIVE PERFORMANCE by Franky Supriyadi Bachelor of Engineering, Bandung Institute of Technology, Indonesia Master of Business Administration, University of Pittsburgh Submitted to the Graduate Faculty of The Joseph M. Katz Graduate School of Business in partial fulfillment of the requirements for the degree of Doctor of Philosophy University of Pittsburgh 2012

Welcome message from author
This document is posted to help you gain knowledge. Please leave a comment to let me know what you think about it! Share it to your friends and learn new things together.
Transcript

THE INFLUENCE OF STRATEGIC LEADERSHIP ON FIRM INVENTIVE AND INNOVATIVE PERFORMANCE
by
Franky Supriyadi
Bachelor of Engineering, Bandung Institute of Technology, Indonesia
Master of Business Administration, University of Pittsburgh
Submitted to the Graduate Faculty of
The Joseph M. Katz Graduate School of Business in partial fulfillment
of the requirements for the degree of
Doctor of Philosophy
University of Pittsburgh
2012

UNIVERSITY OF PITTSBURGH
JOSEPH M. KATZ GRADUATE SCHOOL OF BUSINESS
This dissertation was presented
by
Franky Supriyadi
It was defended on
September 18, 2012
and approved by
John C. Camillus, DBA, University of Pittsburgh
John E. Prescott, Ph.D., University of Pittsburgh
Ravindranath Madhavan, Ph.D., University of Pittsburgh
Kevin H. Kim, Ph.D., University of Pittsburgh
Dissertation Advisor: Susan K. Cohen, Ph.D., University of Pittsburgh
ii

Copyright © by Franky Supriyadi
2012
iii

THE INFLUENCE OF STRATEGIC LEADERSHIP ON FIRM INVENTIVE AND
INNOVATIVE PERFORMANCE
Franky Supriyadi, Ph.D.
University of Pittsburgh, 2012
Strategic leaders hold different beliefs regarding how much to invest in technological innovation,
and how to manage it. While certain visionary leaders have created extraordinarily innovative
organizations, little evidence exists regarding the degree to which strategic leaders generally
influence the production of valuable inventions and new products. We examine how much of the
variation in firms’ inventive (patent) and innovative (new product) performance strategic leaders
explain. Based on a sample of Chief Executive Officers (CEOs) and Chief Scientific Officers
(CSOs) who managed 27 large biopharmaceutical companies, from 1984 through 2004, we find
that strategic leaders explain between 38% and 43% of the variation in inventive performance
across firms, and that CEOs explain more of this variation than do CSOs. Stable firm
characteristics are responsible for 27% of the variation in firms’ inventive performance. By
contrast, 51% of the variation in innovative performance is attributable to firm differences, and
CEOs and CSOs explain less than 4% of this. Finally, we show that CEOs and CSOs strongly
influence the degree to which a firm derives inventive advantage from internal and external
knowledge diversity.
iv

TABLE OF CONTENTS
ACKNOWLEDGEMENTS …………………………………………………………………. ix
1.0 INTRODUCTION ………………………………………………………………………. 1
1.1. Motivation and Contribution ……………………………………………………. 1
2.0 THEORY AND HYPOTHESES …………………………………………………………. 4
2.1 When Do Strategic Leaders Matter Most? ……………………………………….. 4
2.2 Do CEOs or CSOs Have the Greater Influence on Invention and Innovation? …… 8
2.3 How Do Strategic Leaders Affect Invention? Extracting Value from
Knowledge Diversity …………………………………………………………… 12
3.0 METHODS …………………………………………………………………………….. 15
3.1 Research Setting ……………………………………………………………….. 15
3.2 Sample …………………………………………………………………………. 16
3.3 Data ……………………………………………………………………………. 16
3.4 Variables ………………………………………………………………………. 18
3.4.1 Dependent Variables ………………………………………………… 18
3.4.2 Independent Variables ……………………………………………….. 19
3.4.3 Control Variables …………………………………………………….. 21
4.0 ANALYSIS AND RESULTS …………………………………………………………. 25
v

5.0 DISCUSSION …………………………………………………………………………. 33
APPENDIX A ……………………………………………………………………………… 49
APPENDIX B ……………………………………………………………………………… 53
APPENDIX C ……………………………………………………………………………… 55
BIBLIOGRAPHY ………………………………………………………………………….. 60
vi

LIST OF TABLES
Table 1a. Descriptive Statistics and Correlations for Inventive Performance ……………….. 40
Table 1b. Descriptive Statistics and Correlations for Innovative Performance………………. 41
Table 2a. Mixed Effect Poisson Regression - The influence of Chief Executive Officer (CEO)
on the relationship between knowledge diversity and inventive performance……… 42
Table 2b. Mixed Effect Poisson Regression - The influence of Chief Scientific Officer (CSO)
on the relationship between knowledge diversity and inventive performance……… 43
Table 3a. Cohort CEO &CSO Random Effects Parameters for Inventive Performance……… 44
Table 3b. Cohort CEO &CSO Random Effects Parameters for Innovative Performance……… 44
Table 4a. Mixed Effect Poisson Regression – The influence of Chief Executive Officer
(CEO) on the relationship between knowledge diversity and
innovative performance (NDA) …………………………………………………. 45
Table 4b. Mixed Effect Poisson Regression - The influence of Chief Scientific Officer
(CSO) on the relationship between knowledge diversity and
innovative performance (NDA) …………………………………………………. 46
vii

LIST OF FIGURES
Figure 1. The range of CEO’s influence on the relationship between Knowledge Diversity
and Inventive Performance …………………………………………......................... 47
Figure 2. The range of CSO’s influence on the relationship between Knowledge Diversity
and Inventive Performance………………………………………………………....... 48
Figure 3. Drug Development Cycle…………………………………………………………….. 52
viii

ACKNOWLEDGEMENTS
I would like to express my sincere thanks and deep appreciation to my advisor, Susan K.
Cohen for her guidance, encouragement, and patience during the process of writing my
dissertation. I would also like to thank my dissertation committee members, John C. Camillus,
John E. Prescott, Ravindranath Madhavan and Kevin H. Kim for their insights, suggestions and
support. Their help and inspiring advice have expanded my knowledge horizon and have
improved the quality of my work significantly.
I acknowledge and appreciate the support of my sponsor, Prasetiya Mulya Business
School, during the course of my studies. Also, I appreciate the support of the Doctoral Office at
Katz for their administrative assistance.
Finally, my deep gratitude extends to my dear wife, Marta Putri Palupi, and our
wonderful children, Marsha, and Theo for their unconditional love, sacrifices, understanding, and
encouragement. Without their prayers and endless support, my studies would never have been
successfully completed.
ix

1.0 INTRODUCTION
1.1 Motivation and Contribution
A firm’s ability to continually produce relevant inventions, and convert them into
marketable products, has a profound effect on its competitiveness and the pathways toward
future success that are open to it (Geroski, Van Reenan, & Machin, 1993; Teece, Pisano, &
Shuen, 1997). Accordingly, strategy scholars have sought to explain why some firms are better
inventors or innovators than others (Ahuja & Lampert, 2001; Katila & Ahuja, 2002; Katila &
Shane, 2005; Taylor & Greve, 2006). Empirical research has identified resource differences,
particularly the diversity of a firm’s and its partners’ knowledge (Miller, Fern, & Cardinal, 2007;
Phelps, 2010; Sampson, 2007; Srivastava & Gnyawali, 2011; Taylor & Greve, 2006), and the
structure of intra- and inter-firm networks (Ahuja, 2000; Tortoriello & Krackhardt, 2010; Tsai,
2001; Tsai & Ghoshal, 1998) as among the critical drivers of a firm’s inventive and innovative
capabilities.
Management scholars also recognize executive commitment to innovation as essential to
a firm’s ability to sustain it (Berger, Dutta, Raffel, & Samuel, 2009; Ireland & Hitt, 2005;
O’Connor, 2008). Strategic leaders who shape their companies to become extraordinary
innovators are lauded in the popular press and practitioner journals (Ernst & Chfobot-Mason,
2011; Skarzynski & Gibson, 2008). Moreover, some studies find that executive pay is tied to
inventive and innovative success (Balkin, Markman, & Gomez-Mejia, 2000; Makri, Lane, &
Gomez-Mejia, 2006). Empirical studies, however, rarely link strategic leaders to fine-grained
measures of inventive or innovative performance (Yadav, Prabhu, & Chandy, 2007). Instead,
scholarly work tends to focus on leadership in teams, and on project outcomes rather than firm
1

level innovative performance (Elkins & Keller, 2003; Hoffman & Hegarty, 1993; Wu, Levitas, &
Priem, 2005).
Hence, it is not clear how much the average strategic leader (C-level executive) affects
her firm’s inventive or innovative success. The lack of evidence is troubling, given a
predominant view that strategic leaders are the ultimate shepherds of firms’ capacities to invent
and to innovate. In this study, we investigate how much variation in inventive and innovative
performance is attributable to a firm’s Chief Executive Officer (CEO) and Chief Scientific
Officer1 (CSO), as compared to enduring firm differences. We also determine whether strategic
leaders significantly influence the inventive benefit firms derive from internal and external
knowledge diversity.
We chose the biopharmaceutical industry to study these issues, as both invention and
product innovation are central to the financial well being of these firms (Gambardella, 1992,
1995). In this context, we limit our attention to large firms, where the role and challenges of
executives are more comparable. We use hierarchical linear modeling (HLM) to assess their
influence, which, in contrast to ANOVA or dummy variables, allows us to use all available data
without aggregating, while adjusting for the lack of independence that arises in clustered data.
Since our mixed model accounts for randomness effect, it avoids inappropriately incorporating
the influence of chance on measured effect variances, which has been a challenge with variance
decomposition analysis (Brush & Bromiley, 1997; Mackey, 2008). By treating strategic leaders
as a random factor, we increase the generalizability of our findings, and by estimating mixed
models, we are able to separate the average effect of strategic leaders on inventive and
innovative outcomes from the influence they have in individual firms.
1 CSO refers to the highest executive level position related to technology and R&D. In addition to CSO, firms use other titles for this position, such as Chief Technology Officer, Vice President of R&D, Executive Director of R&D, President of Research Lab, Senior Executive of Research, or Vice President of Science & Technology.
2

We make several contributions to research on innovation. First, we find that strategic
leaders matter tremendously to a firm’s inventive success. CEOs and CSOs explain almost twice
as much of the variation in inventive success as do stable firm attributes, implying that the vision
and strategic direction provided by these executives influences inventive performance more than
what resources or routines a firm has accumulated. This finding ought to motivate greater
attention to strategic leaders in research on invention. Second, CEOs have a larger effect than
CSOs on invention success. We believe this reflects greater variation in how firms define the
CSO’s role, and the tendency for CSO discretion to be constrained by the CEO. This finding
highlights the CEO-CSO relationship as an area in which firms might seek inventive advantage.
Third, we find that CEOs and CSOs significantly, and to roughly equal degrees, influence
how much inventive benefit firms derive from knowledge diversity. Whereas the average leader
has a relatively modest effect on the relationship between knowledge diversity and inventive
success, leaders at the upper bound harness the creative forces of diversity for tremendous
inventive advantage. Determining what sets them apart is an important avenue for future
research. Fourth, we find that strategic leaders influence innovation performance much less than
do stable firm effects, suggesting that differences amongst leaders matter less when formal
processes and routines affect outcomes, or when problems can be managed through well-defined
structures. Overall, our results suggest that research on invention (e.g. patent outcomes) ought to
account for the influence of strategic leaders more than it has, but that the focus on firm
characteristics to understand differences in innovative (new product) performance is well placed.
3

2.0 THEORY AND HYPOTHESES
Following Hambrick (1981), we refer to strategic leaders as the upper-level executives
whose decisions and actions significantly impact their organization. Their role, function, and the
types of decisions they make differ significantly from those of team leaders and middle managers
(Hart & Quinn, 1993). While most middle management leadership effectiveness is measured on
the basis of group productivity or group satisfaction (Elkins & Keller, 2003), effectiveness of the
upper-level executives must be related to overall corporate performance, or the achievement of
major strategic priorities. In high technology and science driven industries, sustaining superior
inventive and innovative performance, by generating a continuous stream of valuable ideas and
patentable knowledge and converting them into novel products, are important strategic priorities
(Ahuja & Lampert, 2001; Katila & Shane, 2005). Yet, there is little systematic evidence on
whether strategic leaders are in fact responsible for differences in firms’ inventive or innovative
performance.
We propose strategic leaders, specifically the CEO and CSO, should explain much of the
variation in firms’ inventive performance, but less of the innovative differential. For similar
reasons, we also hypothesize that strategic leaders will exert a greater influence on inventive
performance than will stable firm factors, but that the reverse will hold for innovation
performance. We also expect strategic leaders to have a significant effect on the inventive
benefit firms derive from internal and external knowledge diversity.
2.1 When Do Strategic Leaders Matter Most?
The terms invention and innovation are sometimes used interchangeably, but they involve
distinctive processes (Ahuja & Lampert, 2001; Katila & Shane, 2005). Whereas invention
4

produces novel ideas, innovation converts them into commercially viable products (Amabile &
Khaire, 2008; Hansen & Birkinshaw, 2007; Schumpeter, 1934). The creative insights and
serendipitous discoveries – the happy accidents researchers stumble upon while in pursuit of
solutions to known problems, are a central feature of invention (Meyers, 2007), leading some to
describe it as a process that cannot be controlled. Amabile and Khaire (2008; p. 102) put it this
way, “One doesn’t manage creativity. Creativity is something one manages for.” For example,
to create the preconditions for invention, Skarzynski and Gibson (2008) urge leaders to create
time for reflection and experimentation, maximize diversity of thinking, and foster connection
and conversation.
By contrast, innovation, the process of converting ideas into viable new products, is
managed and structured so as to eliminate anomalies and unplanned variation (Nelson & Winter,
1982). Most companies use some type of stage gate process to break development into a pre-
specified series of activities and assessment criteria, in an effort to de-risk and reliably execute
innovation (Cooper, 2001). Tasks are usually well structured, and milestones provide clear
objectives (Macher & Boerner, 2012; Sosa, 2009). While strategic leaders may have an
important role to play in developing gates and metrics, once these processes are established, their
purpose is to eliminate idiosyncratic influences on how decisions are made, and on the way the
process unfolds (March, 1991; March & Simon, 1958; Winter, 1986). Thus, innovation largely
occurs through standard operating routines, a central component of organizational memory,
designed to produce the same decisions regardless of who is managing the process (Eisenhardt &
Tabrizi, 1995; Huber, 1991; Pentland & Reuter, 1994; Walsh & Ungson, 1991).
These fundamental differences between invention and innovation suggest strategic
leaders may affect them to varying degrees and by distinctive means. We expect strategic
5

leaders to have greater influence during invention, when problems are ill structured and formal
procedures are inadequate to guide decision making and coordination.
For instance, as a firm’s chief strategist, the CEO is responsible for crafting a vision2 that
is robust to innumerable uncertainties and future events that may undermine the firm’s current
competitive strategy. A clear vision allows for consistency in direction without dictating the
path a firm takes to get there; it provides common focal points to guide firm-wide decisions,
enabling greater internal and external consistency amongst them (Hart & Quinn, 1993; Ireland &
Hitt, 2005). With respect to invention, Mumford, Bedell-Avers, & Hunter (2008) maintain that a
firm’s vision or mission serves several critical functions, including helping to define the goal of
creative efforts, providing direction without being too restrictive, establishing guidelines for the
selection and allocation of resources, and defining the scope of potential solution paths. Thus, by
articulating objectives that guide discovery, strategic leaders can have an important influence on
invention.
Leaders’ actions also convey the kinds of behaviors they value and wish to encourage.
Those who display transformational behaviors encourage others to engage in creative processes,
heightening their alertness to inventive opportunities (Jung, Wu, & Chow, 2008; Scott & Bruce,
1994; Waldman & Bass, 1991). However, most firms hire strategic leaders for their execution
abilities, not for their discovery skills and CEOs with the insight and commitment to cultivate
organizational capabilities for invention are rare (Dyer, Gregersen, & Christensen, 2011;
O’Connor, Leifer, Paulson, & Peters, 2008). The analytical and execution skills so central to
resource allocation decisions and reliable product development activities are taught in MBA
2 We use the term vision to refer broadly to high level strategic objective or intent or articulation of what a firm is and strives to become. In some firms, this meaning is captured in a codified vision or mission statement. In others, certain aspects of the strategic leaders’ vision may be communicated through particular mandates – such as an emphasis on specific mega-trends (water scarcity, security, etc.)
6
programs and more widely held amongst strategic leaders (Dyer et al., 2011). Moreover,
strategic leaders often find it difficult to commit to activities with the degree of uncertainty,
failure rates, and ill defined time frames which characterize invention (Martin, 2009; O’Connor,
et. al. 2008). Quarterly financial performance, for which strategic leaders are rewarded, is more
securely augmented by investing in established businesses and managing incremental product
extensions. The vision and strategic direction provided by strategic leaders are less crucial
guides during the relatively predictable and controlled stage gate development process (Cooper,
2001; Nagji & Tuff, 2012; O’Connor et al., 2008). Indeed, because routines are rooted in shared
tacit knowledge, they are difficult to modify directly and generally slow to change (Cohen &
Bacdayan, 1994; Nelson & Winter, 1982; Pentland & Rueter, 1994). In firms with well
established product development processes, leadership is primarily invoked to circumvent
routine processes, such as to support a disruptive or breakthrough invention (Burgelman, 1994;
O’Connor, et al., 2008). Collectively, these arguments suggest the following hypotheses:
Hypothesis 1a: More of the variation in firms’ inventive performance is attributable to
differences in strategic leaders than is the variation in firms’ innovative performance.
Hypothesis 1b: More of the variation in firms’ inventive performance is attributable to
strategic leaders than is attributable to stable firm characteristics.
Hypothesis 1c: More of the variation in firms’ innovative performance is attributable to
stable firm characteristics than is attributable to strategic leaders.
7

These hypotheses are based on differences in how individuals in a leadership role affect
invention and innovation. Next, we investigate whether there is a categorical difference between
the CEO and the CSO role, which may limit their influence on invention and innovation.
2.2 Do CEOs or CSOs Have the Greater Influence on Invention and Innovation?
The specific role and the power base that strategic leaders possess delimit their abilities to
shape organizational activities and outcomes in distinctive ways (Finkelstein, 1992; Medcof,
2008). For example, leaders with higher power bases will be more influential in determining the
organizational direction and hence its future. Further, the higher power base such as technical
expertise for CSO will allow her to gain credibility to better deal with strategic innovation
choices and may significantly influence the organizational performance in this area (Finkelstein,
1992). Thus, in order to anticipate their relative influence on inventive and innovative
performance, we examine how the formal roles of CEOs and CSOs are typically defined, and
discuss the differences in their power bases.
Glick (2011) identifies six kinds of roles that CEOs fulfill: strategic, operational,
informational, interpersonal, decisional, and diplomatic. CEOs spend most of their time in the
strategic role, which includes acting as vision setter and strategist, as well as innovator,
transformer, planner, coordinator, and creator and maintainer of culture (Glick, 2011). As a
vision setter, CEOs create and articulate a compelling sense of identity and core mission for the
organization, and provide ways to effectively realize long-term goals (Hart & Quinn, 1993). In
most firms, the CEO has sole or primary responsibility for crafting and communicating a vision
and strategic intent (Hambrick & Mason, 1984; Nadler & Heilpern, 1998). Montgomery (2008;
p. 54) argues that the central role of a CEO is to be the ‘steward of a living strategy that defines
8

what the firm is and what the firm will become’. Related to this role, Glick (2011) documented
that CEOs also establish and maintain relevant culture, coordinate plans and actions to achieve
strategic long-term goals, initiate and conduct necessary change according to the external
environment changes, and provide directions for the next innovation efforts.
Unlike the CEO’s responsibilities that encompass the overall strategy of the organization,
the CSO’s responsibilities include more specifically overseeing the development of existing
technologies and facilitating the assimilation and development of new technologies to enable the
firm’s strategic intent. The formal role description for a CSO ranges from merely managing the
R&D function, to devising a technology strategy that enables the firm’s competitive and
corporate strategies, to contributing to the development of a firm’s overarching competitive
strategy and charting a technology direction in order to sustain the firm’s advantage (Uttal,
Kantrow, Linden, & Stock, 1992). Usually though, the CSO focuses less on the daily
management of the R&D organization, and more on the development of future technologies that
are aligned with the CEO’s vision and the firm’s strategic intent. CEOs also tend to be highly
involved in these activities, but their focus is generally limited to activities that shape the
strategic direction of the firm, such as technology strategy development, high level project
prioritization, and overall R&D budgeting (Roberts, 2001).
Whereas a CEO’s power base stems from his position at the apex of the organizational
hierarchy, CSOs often derive power from their scientific or technological expertise (Medcof,
2008). This expertise may be used to inform strategic decision making and become the source of
the CSO’s credibility amongst other C-level leaders. However, given their hierarchical power
relationship, the decision making style of the CEO may constrain a CSO’s discretion to use her
power. According to Arendt, Priem, & Ndofor (2005), CEOs who tend to make decisions in
9

isolation may ask CSOs for information but limit their input to strategic decision making. Even
less influence will be expected if the CEO happens to have sufficient expertise in related
technical matters (Medcof, 2008). Uttal et al. (1992) argue that CSOs often have less influence
in practice than their power base affords because they employ a leadership style that is
incompatible with the CEO’s style. On the other hand, some CEOs actively involve their top
management team in decision-making and will tend to involve CSOs and to consider R&D issues
alongside other strategic decisions. CSOs in this context have greater influence on invention.
Thus, relative to the CEO role, there appears to be more variance in how the CSO role is defined
across firms and greater constraints on CSOs’ abilities to execute the strategic aspects of their
roles – which are especially central to invention.
We expect that, more than any other role-based mandate, it is the creation and
dissemination of a widely understood vision and strategic intent vision which unleashes
inventive energies. A CEO’s vision creates clear, though broad, boundaries around the classes of
problems and opportunities she considers to be strategically relevant3 (Montgomery, 2008),
which in turn act as a filter, directing employees’ attention to certain problems and opportunities
and away from others (Ocasio, 1997; Yadav et al., 2007). By consistently demonstrating that
discoveries in a particular domain are valued, a clearly articulated and consistently enacted
vision reduces the personal risk researchers incur by following up fortuitous discoveries with
relatively uncertain outcomes (Dyer et al., 2011; Meyers, 2007; Nagji & Tuff, 2012). Having a
good sense of these boundaries encourages researchers to actively attend to ‘happy accidents’
3 For example, Bhardwaj, Camillus, & Hounshell (2006) describe how leaders at DuPont fostered invention by providing broad parameters to guide entrepreneurial search in new technology domains. In particular, researchers were given a value-based reason for their discovery efforts, such as to address an anticipated market shortage or perceived inferiority in existing materials, or to use idle plant capacity. These acted as high level criteria for selecting some paths and discarding others, without which the researcher would have little basis for navigating the fuzzy front end (Bhardwaj, Camillus, & Hounshell, 2006).
10

and can suggest strategically relevant problems that might be solved by serendipitously discerned
solutions (Berger et al., 2009; Meyers, 2007; Bhardwaj, Camillus, & Hounshell, 2006). In turn,
this increases the likelihood that inventive activity throughout the firm yields a critical mass of
novel ideas in the prescribed domains. Firms with more inventive ideas to choose from in a
particular domain have a better chance of producing truly valuable inventions.
As CEOs hold greater decision making power and exert more influence over the
corporate vision and strategic direction, and these roles are especially central to invention, where
problems are ill-structured and serendipitous discoveries more likely. We expect:
Hypothesis 2a: CEOs explain more of the variation in firms’ inventive performance than
do CSOs.
On the other hand, CSOs may have a greater role to play in shaping the procedures used
to guide product development, and their expertise ought to weigh heavily on decisions regarding
which inventions are selected for further development. Accordingly, we expect:
Hypothesis 2b: CSOs explain more of the variation in firms’ innovative performance than
do CEOs.
11

2.3 How Do Strategic Leaders Affect Invention? Extracting Value from Knowledge
Diversity
We proposed that strategic leaders influence inventive performance more than they affect
innovative performance. Next, we examine whether CEOs and CSOs significantly influence the
degree to which firms derive inventive benefit from knowledge diversity.
Benefits of Knowledge Diversity. Diversity is a predominant explanation for the
creativity that fuels invention (Amabile, 1997; Amabile & Khaire, 2008), and technological
knowledge diversity, in particular, has been linked to firms’ inventive capabilities (Lahiri, 2010;
Miller et al., 2007; Phelps, 2010; Sampson, 2007; Srivastava & Gnyawali, 2011; Zhou & Li,
2012). This diversity enables firms to transfer solutions across domains, enhances their capacity
to solve tough problems, and improves solutions by surmounting local search (Fleming, 2001;
Hargadon & Sutton, 1997; Jeppesen & Lakhani, 2010). Also, knowledge diversity enables firms
to identify, evaluate, and exploit discoveries from a greater variety of external sources (Cohen &
Levinthal, 1990; Fabrizio, 2009; Gambardella, 1992).
It has been argued that a moderate level of knowledge diversity produces the best
inventive performance (Henderson & Cockburn, 1996; Lahiri, 2010; Sampson, 2007; Vasudeva
& Anand, 2011). Firms that invent in more domains tend to encompass greater technological
distance, and while this expands latent recombinative opportunities, it can also negatively affect
a firm’s ability to integrate knowledge (Gilsing, Nooteboom, Vanhaverbeke, Duysters, & van
den Oord, 2008; Phelps, 2010; Zhou & Li, 2012). Nevertheless, individual firms might derive
very different inventive benefits from a given level of diversity, according to differences in their
strategic leadership.
12

As the diversity of technological knowledge increases, its management becomes complex
and informal means of coordination are necessary (Leiponen & Helfat, 2010). In particular, we
argue that by cultivating a common language with which to understand a firm’s direction, and
instilling shared values to minimize cultural distances amongst organizational units, CEOs and
CSOs can build bridges across disparate domains and enable firms to derive greater benefit from
internal and external knowledge diversity.
CEO Influence: As a vision setter, the CEO cultivates a sense of identity and
commitment to the firm’s objectives (Hart & Quinn, 1993). By articulating a clear and
consistent vision, CEOs can reduce conflict and facilitate communication, enabling a firm to
extract greater benefit from its knowledge diversity. Shared goals mitigate social categorization
processes that discourage information sharing (Bunderson & Sutcliffe, 2002), and encourage
commitment, facilitating the integration of diverse perspectives (Pinto, Pinto & Prescott, 1993).
A shared corporate vision provides clear direction regarding what to work on, is essential for
quickly resolving conflicts (Holland, Gaston, & Gomes, 2000), and helps to cultivate common
understanding of complex problems amongst diverse constituencies (Mumford, Scott, Gaddis, &
Strange, 2002; Shalley & Gilson, 2004). Firms that develop collaborative orientations internally
are better placed to see similar opportunities in their external partnerships (Berger et al., 2009;
Linden, 2010).
CSO Influence: One of the key roles of the CSO is to provide a technical vision that is
tightly coupled to the company’s vision, or strategic intent (O’Connor et al., 2008; Smith, 2007).
As a leader, the CSO is expected to set a direction for scientists’ and engineers’ efforts to
discover the technologies that will fuel the firm’s future growth. As part of the top management
team, the CSO works with middle management, such as the R&D manager, to establish
13
commitment and motivate the implementation of key decisions (Raes, Heijltjes, Glunk, & Roe,
2011). In this capacity, the CSO conveys and reinforces the CEO’s vision for the firm, and
therefore is directly responsible for cultivating a base of common knowledge and shared values
that facilitate collaboration across diverse domains (Medcof, 2008).
A CSO is usually a leading scientist or researcher who has management talent and is
willing to create a more effective environment for other researchers to flourish. In this capacity,
the CSO can create a culture that encourages networking and fosters open collaborations among
scientists (Smith, 2007). Their technical background provides CSOs with expert power, a basis
for influencing strategic decisions, and legitimacy with the firm’s scientists (Finkelstein, 1992).
CSOs are often expected to foster knowledge flows amongst organizational units and the
assimilation of knowledge from strategic partners (Hartley, 2011).
Hence, we expect CSOs and CEOs to influence the relationship between internal and
external knowledge diversity and inventive performance, i.e. to explain a substantial amount of
the variation in how much inventive benefit firms derive from internal and external knowledge
diversity:
Hypothesis 3: Strategic leaders significantly influence the inventive benefit firms derive
from internal and external knowledge diversity.
14
3.0 METHODS
3.1 Research Setting
We examine the influence of strategic leaders on firms’ inventive and innovative
performance in 27 large biopharmaceutical manufacturers, over 20 years. We felt it was
important to limit our attention to firms of comparable size, since leadership challenges, and the
relevant tools for resolving them, vary with the span of control. As leaders have less direct
control over many activities in large firms, this context provides a more conservative test of our
arguments. The biopharmaceutical industry is ideal. Product innovation drives profits and
requires the engagement of researchers with a highly diverse set of skills (Arora & Gambardella,
1994; Brusoni, Criscuolo, & Geuna, 2005; Henderson, 1994). Patents are widely used to protect
inventions and bilateral R&D alliances are extensively formed (Bierly & Chakrabarti, 1996;
Mansfield, 1961; Roijakkers & Hagedoorn, 2006).
Invention (drug discovery) is quite different from innovation (drug development), and
success in each stage is demarcated by externally validated outcomes (Arora, Gambardella,
Magazzini, & Pammolli, 2009). Drug discovery consists of target selection and validation, lead
finding and optimization, and animal testing (Sosa, 2009). Inventive success produces patents;
we focus on those awarded by the U.S. Patent and Trademark Office (USPTO). Drug
development is comprised of phase I, II, III human clinical trials, in which firms assess the
efficacy and safety of their candidate compounds. Innovative success follows closely regulated
human clinical trials and produces new drug approvals (NDAs); we focus on those awarded by
the Food and Drug Administration (FDA).
15

3.2 Sample
The data for our analysis consists of a panel of 591 firm year observations, for 27 of the
largest public biopharmaceutical firms (SICs 2833 through 2836) operating in the US. We
obtained consolidated financial data for 32 large biopharmaceutical firms from the 2007
Compustat database, but were unable to find complete information on CEOs and CSOs for 5 of
them. We followed the 27 firms for which we had complete data, from 1984 to 2004. In total,
these firms employed 87 CEOs and 88 CSOs during this time, with a range of 2 to 7 executives
per firm. The average tenure of CEOs and CSO was 7 and 7.2 years, respectively. CEO and
CSO eras are largely distinctive, meaning turnover in one usually did not coincide with turnover
at the other level. When, during a focal CEO or CSO era, there was turnover at the other level, it
was generally at least two years after the focal CEO or CSO era began.
Our sample of firms represents 67% of total biopharmaceutical product sales and 58% of
total R&D expenditures in this industry during our analysis period. Also during this time, the
FDA approved 1,058 new drugs of which 643 approvals belong to these firms. The U.S. Patent
and Trademark Office (USPTO) granted a total of 54,998 patents in 64 of the patent classes in
which biopharmaceutical firms receive patents; of these 33,831 were granted to these firms. All
patents granted in 64 classes received 349,487 citations; our sample firms’ patents received
180,388 citations. The alliances formed by our sample represent 39% of the total 41,057
alliances in this industry.
3.3 Data
CEO and CSO data were obtained from news articles published in the LexisNexis
Business database and complemented with data from Corporate Yellow Book, Mergent Online,
16

Compact Disclosure, Annual Reports and 10Ks. These sources provided full coverage of
leadership changes during the study period. Financial data were pulled from Compustat. We
obtained patent data from the U.S. Patent and Trademark Office (USPTO) database, Cassis.
According to the concordance between the U.S. Patent Classification (USPC) System and the
Standard Industrial Code (SIC) System4, 64 three digit classes correspond most closely to
biopharmaceutical inventions. Defining a finite but broad universe of possible patent classes in
which our focal firms can invent in increases the degree to which our patent-based measures of
knowledge comparable differences across firms (Benner & Waldfogel, 2008).
To identify each firm’s external partners, we drew on alliance data from Recombination
Capital (Recap) Inc., a comprehensive source of biopharmaceutical alliances. This data focuses
specifically on R&D alliances. In assembling the data on new drug approvals (NDAs), we
followed an approach used by Cardinal (2001) and Yeoh and Roth (1999), counting a
biopharmaceutical product as being a new drug approval (NDA) if it constitutes a novel chemical
composition, according to the U.S. FDA classification scheme5.
Alliances, patenting, and drug approvals can occur at the subsidiary level. We
aggregated alliance and patent data to the parent level in three steps: First, we constructed
family trees of the 27 firms using the Corporate Affiliations database compiled by the
LexisNexis Business Data Group. Second, using these family trees, we assigned subsidiary
alliances to the corporate parent. Third, we aggregated patent data to the parent level. With this
4 The concordance links US patent classes with 55 unique Standard Industrial Codes (SICs) System and is available on the website: http://www.uspto.gov/web/offices/ac/ido/oeip/taf/brochure.htm#Patent_Data. 5 Category 1 is for a new molecular entity (NME), which has not previously been offered to the U.S. market. The other categories are: 2) New derivative: a chemical that has been derived from an active ingredient that is already been marketed. 3) New formulation: a new dosage form or new formulation of active ingredient already in the market. 4) New combination: a drug that contains two or more compounds, the combination of which has not been marketed together. 5) Already marketed drug product but a new manufacturer: a product that duplicates another firm's already marketed drug. 6) Already marketed drug product, but a new use: a new use for a drug product already marketed by a different firm. 7) Drug already legally marketed without an approved NDA. 8) OTC switch: approval for the over the counter sale.
17

firm level patent and alliance data, we set up 20 annual matrices for each firm. These included a
row for each of the 64 patent classes, and columns to indicate how many patents in each class the
focal firm, and each alliance partner, was granted in that year. We used these matrices to
compute the internal and external knowledge diversity measures.
3.4 Variables
3.4.1 Dependent Variables
Inventive performance: New chemical entities (NCEs) that have pharmacological
potential are patented and this concludes invention (Sosa, 2009). The number of citations a
patent receives is a widely used measure of a patented technology’s impact on subsequent
inventions (Fleming, 2001; Fleming, Mingo, & Chen, 2007; Yayavaram & Ahuja, 2008). Once a
patent is granted, it will be cited if it is relevant to subsequent patents, as firms’ lawyers and
patent examiners seek to demonstrate that their inventions constitute novel, useful, non-obvious
departures from prior inventions and from knowledge already in the public domain (Alcacer,
Gittelman, & Sampat, 2009). Through this process, patents that are viewed as relevant prior art
for a greater number of subsequent inventions will receive more citations. Patent citations has
been widely used an indication of inventions’ techno-economic usefulness (Fleming et al., 2007;
Yayavaram & Ahuja, 2008) and their economic value (e.g. Hall, Jaffe, & Trajtenberg, 2005;
Harhoff, Scherer, & Vopel, 2003; Trajtenberg, 1990; van Zeebroeck, 2011).
We constructed annual measures of inventive performance by summing all citations
(excluding self-citations) to the patents granted in a particular year, in the subsequent 3 years, so
that each patent has the same opportunity to be cited6. We use a 3 year window because patent
6 We ran our analyses including self-citations and the results are consistent with those reported in this paper.
18

citations peak one year after the patent grant date, and 3 years allows us to account for any short
term fluctuations in total citations received (Mehta, Rysman, & Simcoe, 2010). Mehta and
colleagues (2010), show empirically that a patent’s “citation clock” does not start until it is
issued, and we therefore use the granting date rather than application date in determining
citations.
Innovative performance : Innovation begins once a company submits and receives
approval on an Investigational New Drug application. If a drug candidate successfully completes
all three clinical testing phases, including having its manufacturing processes comply with
industry Good Manufacturing Practice, a company can submit a New Drug Application (NDA)
to formally request the FDA consider it for marketing approval. Receipt of an NDA approval
means a firm can market its product. We measured a firm’s innovative output as the count of
new drug approvals (NDAs) a firm received in a year. The innovative NDA counts exclude
generic drug approvals, as they are not considered novel and do not proceed through the same
development stages.
3.4.2 Independent Variables
We created knowledge diversity measures using patent classes to indicate technology
domains, and track a firm’s distribution of patents into classes according to their application date
(Sampson, 2007; Phelps, 2010; Strumsky, Lobo, & van der Leeuw, 2012). Firms manage
research programs in therapeutic or anatomical areas rather than patent classes (Henderson &
Cockburn, 1996). However, to sustain these programs, they invest in scientists, laboratory
facilities and partnerships in order to develop certain kinds of knowledge, such as peptide
chemistry. Such a firm would likely generate more patents in the corresponding class, 930 –
19

Peptide or Protein Sequence. While 3 digit patent classes are coarse and aggregate a lot of
variation amongst technology domains, they capture important differences in knowledge
(Sampson, 2007; Strumsky et al., 2012).
All independent variables are lagged by one year. The lags inherent in the patent
approval process make it unlikely that our dependent variable reflects the patents used to
construct the IKD and EKD measures. Both IKD and EKD are based on patents applied for in
time t, whereas citations are to patents granted in time t. The average patent approval time for
biopharma is between 3 and 4 years
http://www.uspto.gov/web/offices/com/annual/2009/oai_05_wlt_04.html).
Internal Knowledge Diversity (IKD): IKD represents the distribution of patents a firm
has across all 64 biopharmaceutical classes. Following Hall (2002), it was measured using a
nonbiased inverse Herfindahl Index (HHI) as:𝐼𝐾𝐷𝑖 = 1 − �𝑁𝑖∗𝐻𝐻𝐼𝑖−1𝑁𝑖−1
� where𝐻𝐻𝐼𝑖 = ∑ �𝑁𝑖𝑘𝑁𝑖�2
𝑘𝑘=1
i = focal firm; k=patent classes; Nik = number of patents in class k by the
focal firm i; and Ni = total number of patents in all classes by the focal firm i. As with the
traditional Herfindahl, the index rises with the number of patent classes a firm invents in and the
equality of its efforts across classes, and ranges from 0 to 1. However, Hall’s measure adjusts
for the size of the patent portfolio to eliminate scale effects.
External Knowledge Diversity (EKD): We measured EKD by estimating the angular
separation between a firm and each of its partners’ patent portfolios (Jaffe, 1986). We adjust for
the fact that partners with larger portfolios will affect the EKD measure more, by dividing each
firm’s number of patents, in a class k, by the highest number of patents held by the firm or its
partners in class k. This provides us with a proportion which reflects the degree to which each
partner contributes knowledge of a particular domain, relative to the focal firm and relative to the
20

other partners. We then used this formula to calculate external knowledge diversity (as distance,
or the amount of non-overlapping knowledge) between a firm and each of its partners’ patent
portfolios: 𝐄𝐊𝐃𝐢𝐣 = 1 − 𝑆𝑖′𝑆𝑗�𝑆𝑖′𝑆𝑖�𝑆𝑗′𝑆𝑗
where 𝑖 ≠ 𝑗; 𝑖 = focal firm; 𝑗 = partner firms;
𝑆𝑖 = vector of adjusted number of patents granted to focal firm; and
𝑆𝑗 = vector of adjusted number of patents granted to focal firm′s partners
The vectors represent portfolios, 𝑆𝑖 = (𝑆𝑖1 … 𝑆𝑖𝑘), where 𝑆𝑖𝑘 is the adjusted number of
patents granted to firm, i, in class k. Most firms have more than one partner, and we calculate
this measure for each partner paired with the focal firm and then take the simple average. If
firms do not patent, then the vectors contain all 0 values and the EKD measure is equal to 1
(Sampson, 2007). To avoid an undefined result, where the denominator is equal to 0, we set the
value of the fractional term to 0. This 0 is then subtracted from 1, leading to a value of 1 for
EKD. EKD values range from 0 to 1, with 1 being the maximum.
CEO and CSO Eras: CEO and CSO eras refer to the years during which a particular
individual occupied this role. To create these eras, each CEO and CSO in each firm was given a
unique number for the years they were in office. For example, the CEO of Merck was coded 1
from 1984 onward until he was replaced. The next CEO was then coded 2 from the year he/she
replaced the previous CEO onward. Once he/she was replaced, the following CEO was coded as
3, and so on. This coding allows us to capture the reign of each CEO and CSO, and to compare
their effects across the entire pool of executives in our sample firms.
3.4.3 Control Variables
We controlled for firm characteristics that might influence inventive and innovative
performance. Firm age: Firms tend to emphasize relatively incremental invention and
21

innovation as they age and acquire more rigid structures that mediate their engagement with the
environment (Sorensen & Stuart, 2000). We measured age as the number of years since
founding. Firm size: Larger firms can often attract the best talent and invest in superior
facilities. However, they also tend to be risk averse and slow to act. We measured size as the
logarithm of annual sales revenue in US dollars. Firm Patent Stock: Firms that have received
many patents might have superior R&D capabilities, and they also have greater opportunity to be
cited. We alternately included a count of all patents a firm was issued in time t, and in the
previous three years to control for this. The results were invariant to which count we included.
Partner Patent Stock: Partners that have been granted more patents might have superior
inventive capabilities, so we also included a patent count for all of the focal firm’s partners in the
last three years.
Network Knowledge Diversity: Firms that work with partners who are themselves very
different from each other might find this increases both the opportunities and challenges
associated with exploiting external knowledge diversity for invention and innovation. We
controlled for differences amongst a firm’s partners’ knowledge (excluding the firm):
𝑵𝑲𝑫𝒊 =�∑ �∑ 𝒅𝒉𝒋𝒋 �𝒉 �𝑚𝑖 ∗ (𝑚𝑖 − 1)
2
Equation (1)
𝐝𝐡𝐣 = 1 − 𝑆ℎ′𝑆𝑗
�𝑆ℎ′𝑆ℎ�𝑆𝑗′𝑆𝑗
where 𝑖 = focal firm; ℎ = partner firms; 𝑗 = partner firms; 𝑚 = number of partner𝑠
𝑆ℎ = vector of number of patents granted to focal firm′s partners;
𝑆𝑗 = vector of number of patents granted to focal firm′s partners
22

The index h in Equation (1) is over particular partners and j indexes over all partners excluding
the focal firm. The second summation (over h) corrects for double counting because when a
particular firm sums over all potential partners we need to exclude that particular firm from all
other summations. When calculating the average NKD for firm i, we use the term𝑚𝑖∗(𝑚𝑖−1)2
. This
captures the number of potential relationships among the firm’s partners. To illustrate, when a
focal firm has 1 partner, there can be no NKD measure. When a firm has 2 partners, there is only
the distance between the two. When a firm has 3 partners, there can be a distance between (1)
(2), (1)(3), and (2)(3). Thus, this relationship can be described as: ∑ 𝑚 = 𝑚(𝑚−1)2
𝑚𝑖=1
where m represents the number of partners.
Network size or degree centrality is the number of active alliances a firm has in each year
(Freeman, 1979). Firms with more alliance partners have access to a larger volume of
knowledge and receive more news about developments in the industry, which could positively
influence their inventive and innovative abilities (Ahuja, 2000). At the same time, a meta-
analysis of knowledge transfer found evidence that large numbers of partners can make it more
difficult to manage the associated diversity (Van Wijk, Jansen, & Lyles, 2008). Network
efficiency: Is the degree to which a firm’s partners connect it to different actors in the network
(Burt, 1992). A firm that is positioned in an efficient ego network receives more unique
information from each partner, which might augment its ability to create useful inventions. We
used UCINET to calculate a cohesion-based measure of network efficiency for each firm
(Borgatti, Everett, & Freeman, 2002).
R&D expenditure: Investment in R&D reflects a firm’s efforts to invent and innovate.
We measured this as the logarithm of annual R&D expenditures in US dollars. Slack Resources:
Firms with more slack have the leeway to explore and thus might avoid the obsolescence or
23

senescence phenomenon (Sorensen & Stuart 2000). We used current assets divided by current
liabilities as our control for slack resources (Singh, 1986). Partner Experience: Prior experience
with a partner improves collaboration (Reuer, Zollo, & Singh, 2002). We determined whether a
partner had allied with the focal firm at any time in the preceding years and if it had designated
these as established partners. We then calculated partner experience as the ratio of established
partners in year t to the total partners in year t. Time effect: were introduced into the model as
year dummy variables to control for industry time specific effects. The year of 1984 was taken as
the base year.
24

4.0 ANALYSIS AND RESULTS
We tested the hypotheses using a 3-level mixed effect Poisson regression with inventive
and innovative performance as dependent variables. This hierarchical linear model does not
require balanced data and is suitable for discrete dependent variables. In our data, observations
at each year are nested within CEO and CSO eras, and those eras are nested within firms. In the
mixed effect model, we specify time as the level-1 variable, leader’s era as the level-2 variable,
and firm as the level-3 variable. This accommodates the clustered characteristic of longitudinal
data, the positively skewed nature of count data, and the nested aspect of annual inventive and
innovative performance, within leaders’ eras.
To test Hypotheses 1a, 1b, and 1c, we examine how much of the variation in observed
inventive and innovative performance is explained by CEOs and CSOs, as compared to stable
firm characteristics. This requires models that represent how variation in inventive and
innovative performance is allocated across the three different levels. To investigate this variance
allocation in hierarchical linear models, we estimate the following set of equations:
At level-1, we modeled inventive / innovative performance as a function of the intercept
estimate, a leader’s mean performance:
ln𝑌ijk = 𝛽0𝑗𝑘
where 𝑌ijk is the inventive / innovative performance of year i during the era of leader j in firm k;
𝛽0𝑗𝑘 is the intercept, and [exp(𝛽0𝑗𝑘)] is the mean inventive / innovative performance during the
era of leader j in firm k.
At level 2, the leader’s era model, we defined each mean performance for leader j in firm
k, 𝛽0𝑗𝑘 , as an outcome varying randomly around the firm’s mean performance:
25

𝛽0𝑗𝑘 = 𝛾00𝑘 + 𝑟0𝑗𝑘
where 𝛾00𝑘 is the mean inventive / innovative performance in firm k; 𝑟0𝑗𝑘 is a random “leader
effect”, i.e. the deviation of mean performance for leader j in firm k from the firm k’s mean
performance.
Lastly, the level-3 model represents the variability of inventive / innovative performance
among firms. The firm’s mean performance, 𝛾00𝑘, vary randomly around a grand mean:
𝛾00𝑘 = 𝜋000 + 𝑢00𝑘
where 𝜋000 is the grand mean; 𝑢00𝑘 is a random ”firm effect”, i.e. the deviation of firm k’s mean
performance from the grand mean performance.
This three-level set of equations separates the total variance in the inventive / innovative
performance, Yijk, into variance at each level: among year within leader era (level 1); among
leaders within firm (level 2); and among firms (level 3). This partition allows estimation of
variance associated with each level of analysis. We obtained the variance of leader and firm
from the base model regressions, and calculate the variance of year (level -1) as π2/3. We then
added up all variances for each level and calculated the proportion of variance of each level
(level effect) as a percentage of the total variance (Snijders & Bosker, 1999).
This also provides the basis for testing Hypothesis 2, in conjunction with an additional
model estimated using CEO – CSO cohorts (described below), to separate their individual
contributions to inventive / innovative performance from any combined effect they may have.
To test Hypothesis 3, that leaders affect inventive performance by influencing the benefit
firms derive from knowledge diversity, we expanded the base model to include predictor
variables that may explain the variability in each level. Specifically, we included internal and
external knowledge diversity in the model, and estimated fixed and random effects to capture
26

their influence on inventive performance. Whereas the fixed effects capture the average
influence of IKD and EKD on inventive success, the random effects captures variation in the
degree to which firms derived inventive benefits from their knowledge diversity. The random
effects are allowed to vary over the reign of different leaders. This allows us to test whether
there is significant variance in the utility firms get from their knowledge diversity, across
CEO/CSO eras. A general model for a three level mixed effects Poisson model takes the
following form.
The level 1 (time) model is:
ln𝑌ijk = 𝛽0𝑗𝑘 + �𝛽𝑝𝑗𝑘𝑋𝑝𝑖𝑗𝑘
𝑃
𝑝=1
where Yijk is the dependent variable in year i during leader’s era j, of firm k; 𝛽0𝑗𝑘 is the intercept
of leader era j in firm k; 𝑋1𝑖𝑗𝑘 is the level of knowledge diversity that predicts Yijk and 𝛽1𝑗𝑘 is
the regression coefficient, which captures the inventive utility a firm derives from knowledge
diversity, for era j in firm k; 𝑋2𝑖𝑗𝑘, refers to the control variables and 𝛽2𝑖𝑗𝑘 are the corresponding
regression coefficients. The coefficients 𝛽0𝑗𝑘 and 𝛽1𝑗𝑘 are allowed to vary randomly over leaders
and firms, but are not predicted by leader- or firm-level variables.
The level 2 (leaders’ era) model is
𝛽0𝑗𝑘 = 𝛾00𝑘 + 𝑟0𝑗𝑘
𝛽1𝑗𝑘 = 𝛾10𝑘 + 𝑟1𝑗𝑘
𝛽𝑝𝑗𝑘 = 𝛾𝑝0𝑘 for p = 2, …, P
where 𝛾00𝑘 is the intercept of firm k; 𝛾10𝑘 is the mean inventive utility firm k derives from its
knowledge diversity; 𝑟0𝑗𝑘 and 𝑟1𝑗𝑘 are level 2 random effects that represent the deviation of
27

leader jk’s mean from the firm mean. It is assumed that the variability among leaders within
each of the K firms is the same.
The model of level 3 or firm level is
𝛾00𝑘 = 𝜋000 + 𝑢00𝑘
𝛾10𝑘 = 𝜋100
𝛾𝑝0𝑘 = 𝜋𝑝00 for p = 2, …, P
where 𝜋000 is the grand mean; 𝜋000 is the overall mean of knowledge diversity utility rate; 𝑢00𝑘
is the deviation of firm k’s mean from the grand mean.
Tables 1a and 1b provide the summary statistics of the standardized variables and the
correlations among the variables. Tables 2a and 2b present the results of the mixed effect
regression with inventive performance as the dependent variable for CEO and CSO eras,
respectively. Models 1 and 6 are the base models that include only a random intercept of level-2
leader id and level-3 firm id. In Models 2 and 7, we added control variables along with random
intercepts for leaders and firms. Models 3 and 8 are the models that include control variables,
IKD, and generate a random coefficient for IKD. Models 4 and 9 are similar to Models 3 and 8
but include EKD. We then include both diversity variables in Model 5 for CEOs and in Model
10 for CSOs. Tables 3a and 3b report the random effects of CEO-CSO cohort analysis for both
inventive and innovative performance. Tables 4a and 4b present the results of the mixed effect
regression for innovative performance during both CEO and CSO eras. We started with Models
1 and 5 as the base models and progressively added control variables and independent variables.
-------------------------------------------
Insert Tables 1a, 1b, 2a, 2b, 3a, 3b, 4a, 4b about here
-------------------------------------------
28

Hypothesis 1a predicts that strategic leaders will have a lesser impact on innovative
performance than on inventive performance. We investigated this by comparing the random
parameters generated for invention (Tables 2a and 2b) with those generated by comparable
models that take innovation output as the dependent variable (Tables 4a and 4b). Using the base
Models 1 and 6 in Tables 2a and 2b, we examined the 95% confidence interval for the variance
of the random-effect parameters. If the intervals do not include zero, we can conclude that the
value represents the amount of variance that resides within a level. The intervals around the
CEO and the CSO intercepts exclude 0, and indicate CEOs and CSOs explain significant
variance in inventive performance. Using the base Models 1 and 5 in Tables 4a and 4b, we
found similar results for the variance in innovative performance, but with much smaller
magnitude.
We then calculated firm and leader effects by taking the percentage of each variable’s
variance over total variance. We calculate leader effects on the variability of inventive and
innovation performance by taking the percentage of CEO or CSO variance over total variance.
We find that stable firm factors account for around 27% of the proportion of variance in firms’
inventive performance; CEO and CSO effects account for 38.4% and 42.9%, respectively.
(Note, these percentages add up to more than 100% because there is some overlap amongst the
CEO and CSO eras.) We found that the firm effects accounted for around 51% in innovative
performance, while CEOs and CSOs accounted for 3.3% and 3.6% of the variance in innovation,
respectively, significantly less than the results of leader effects on inventive performance.
In support of Hypothesis 1a, these comparisons suggest that CEOs and CSOs account for
a substantial influence on inventive performance (between 38 and 43%), but far less for
influencing innovative performance (less than 4%). Our calculations also show that leaders
29

account for more of the variation in inventive performance (between 38 and 43%), than do stable
firm effects (27%), in support of Hypothesis 1b. Conversely, and in support of Hypothesis 1c,
stable firm effects account for 51% of the variation in innovative performance, where strategic
leaders account for less than 4%.
To test Hypotheses 2a and 2b, whether CEOs or CSOs explain more of the variation in
inventive and innovative performance across firms, we developed a three-level model similar to
the previous approach, but with level-2 variable as the combined CEO and CSO era. Each CEO
and CSO pair, in each firm, was coded uniquely to represent the period of reign of both leaders
in their current position. Changes in either of the paired leaders will change the code.
We reported the random effect parameters of CEO-CSO cohort analysis in Tables 3a and
3b. The base models included only the random effects of the level 2 combined CEO-CSO id and
the level 3 firm id. We then added categorical predictor variables CEO and CSO to the base
model to estimate the proportion reduction in variance. We calculated the proportion of variance
explained by each of the leaders using the following formula:
𝑉CEOCSO (base) − 𝑉CEOCSO (CEO or CSO predictor)
VCEOCSO (base)
The estimated proportion of variance in inventive performance explained by CEO was 0.208
(4.27-3.38 / 4.27). The estimated proportion of variance in inventive performance explained by
CSO was 0.164 (4.27-3.57 / 4.27). That is, 20.8% of the variance in inventive performance was
accounted for by CEO, and 16.4% of variance in inventive performance was accounted for by
CSO. These percentages underestimate to some degree the total influence of a level because
variation that is jointly explained by a CEO-CSO pair is excluded. We did the same analysis for
innovative performance and found the estimated portion of variance in innovative performance
accounted for by CEO and CSO were 3.6% and 21.4% respectively.
30

The analysis used to test Hypotheses 1b and 1c provided a comparison based on variation
among individuals within a C-level leader group, whereas the CEO-CSO cohort analysis showed
a comparison across the two leadership roles. Hence, this second analysis suggests that CEOs as
a class of leader ultimately have a stronger influence on inventive performance, even though
more of the variation being explained in inventive performance corresponds to differences
among CSOs. This suggests that individual differences mattered more at the CSO level, while a
greater proportion of CEOs’ influence was prescribed by their role.
On the contrary, the CEO-CSO cohort analysis for innovative performance showed quite
the reverse results from the inventive performance cohort analysis. This analysis indicates that
the CSOs have the stronger influence on innovative performance than that of the CEOs.
Together, these results provide support for Hypotheses 2a and 2b.
Hypothesis 3 specifically predicts that both CEO and CSO positively affect the utility a
firm can derive from knowledge diversity for inventive performance. To test this hypothesis we
ran Models 3 and 4 (for CEOs) as well as Models 8 and 9 (for CSOs), which include random
effects for internal and external knowledge diversity. If CEOs and CSOs influence the utility of
these diversities, the random-effects diversity parameters should show a range of variation that
does not include 0. As reported in Tables 2a and 2b, neither the intervals for IKD nor EKD
included zero, confirming Hypothesis 3.
Consistent with Hypothesis 3, strategic leaders influence inventive success by affecting
how much benefit firms derive from IKD and EKD. However, this did not tell us how large their
influence is; we get a sense of this graphically. Specifically, we plot the average effect of IKD
and EKD on inventive success, and then the upper and lower bounds on that relationship, as
determined by the CEO or the CSO. The range of CEO and CSO effects on the relationship
31

between IKD, EKD, and inventive performance are illustrated in Figures 1 and 2. They show
that the most effective leaders deviate substantially from the least effective leaders. CEOs and
CSOs at the upper bound guide their firms to derive much greater benefit from internal
knowledge diversity, and to a lesser degree external knowledge diversity, than the average
strategic leader. Note that the figures truncate the predicted maximum value of inventive
performance for IKD.
--------------------------------------------------------
Insert figure 1 and 2 about here
---------------------------------------------------------
32
5.0 DISCUSSION
This study offers several contributions to the literature on innovation and leadership. We
go beyond prior work by considering both invention and innovation, including the CSO as well
as the CEO, and investigating the degree to which strategic leaders explain variation in how
much benefit firms derive from diverse internal and external knowledge. While our analytical
method prevents us from offering causal explanations for what we found, prior work offers a
great deal of insight regarding the likely mechanisms underlying this pattern of results. What has
not been made clear by previous research is the degree to which strategic leaders explain
differences in firms’ innovative performance.
How Much Do Strategic Leaders Matter, for Invention and Innovation? Not only are
firm level studies of strategic leaders’ influence on invention rare, the literature offers mixed
views of whether and how much we should expect them to affect firms’ inventive and innovative
performance (Amabile & Khaire, 2008; Yadav et al., 2007). Given the central role that
innovation plays in sustaining firm vitally, we might expect a firm’s top executives to care
deeply that it excels in this activity. In fact, strategic leaders appear to recognize the mandate to
cultivate their firms’ innovation capabilities, but find it difficult to execute (Amabile & Kramer,
2012; Criswell & Martin, 2007; Martin, 2009).
One barrier is cognitive. The tendency to filter information and appraise opportunities in
conformance with extant beliefs constrains leaders’ capacity to embrace new ways of competing
and innovating (Benner & Tripsas, 2012; Leonard-Barton,1992; Tripsas & Gavetti, 2000).
Another is situational. Leaders face numerous demands on their time and attention, leaving little
room for reflection and fresh perspective (Hambrick, Finkelstein, & Mooney, 2005).
33

The literature also presents conflicting views on the role of top executives versus mid-
level managers. CEOs are charged with establishing a direction for the firm and possess more
power than other managers (Nadler & Heilpern, 1998; Hambrick & Mason, 1984). Through
their communications and symbolic and substantive actions, strategic leaders affect what
information other members of the firm pay attention to, and how they interpret it (Yadav et al.,
2007). However, some authors contend that mid-level managers, who champion ideas
(Burgelman, 1986, 1994) and directly confront early signals of environmental shifts
(Christensen, 1997; Grove, 1996), are the driving force behind innovation. CEOs are often
portrayed as affecting innovation indirectly, such as by supporting individuals and project teams
(Montoya-Weiss & Calantone 1994). In light of these mixed perspectives, it seems important to
ascertain how much strategic leaders actually affect key outcomes of invention and innovation.
We find that strategic leaders, specifically CEOs and CSOs, each contribute importantly
to inventive success. Between 20.8% and 38.4% of the variation in inventive performance
(patent citations) across firms is attributable to the CEO, and between 16.4% and 42.9% reflects
the CSO. Surprisingly, strategic leadership explains only about 3% of the variation amongst
firms’ innovative performance (new drug approvals).
Further research is needed to isolate the reasons for this difference, but two possibilities
seem likely. First, whereas all pharmaceutical firms compete to produce NDAs, there are
notable differences in their leaders’ visions for how to get to there, particularly in what kinds of
research to support. Whereas some pharmaceutical CEOs and CSOs have sought to foster a
science-driven approach to research and target fundamental breakthroughs, others have pursued
more incremental and focused research (Galambos &Vagelos, 2004; Fagan & Beer, 1999;
Rodengen, 1999). This variation might correspond to distinctive patenting outcomes.
34

Second, invention and innovation differ in important ways, and invention may offer more
room for strategic leaders to matter. Case studies of pharmaceutical firms reveal vast differences
in how individual leaders have managed drug discovery within and across firms (Henderson,
1994; Henderson & Cockburn, 1994; Pisano, 2006; Thomke & Nimgade, 2008). Drug
development, on the other hand, is highly regulated and, once a firm has selected which drug
candidates to push forward into clinical trials, affords less room for managers to affect outcomes.
Beyond the idiosyncratic features of drug discovery and development, we think invention is
precisely the kind of activity for which strategic leaders’ influence matters most.
While academic research fails to consistently distinguish the two, invention and
innovation comprise distinct processes and benefit from different management approaches
(Cooper, 2001; Roberts, 2007; Schumpeter, 1943). Invention refers to idea generation and early
stage discovery, which is characterized by ill structured problems and unpredictable choices.
Firms strive to increase variation during this stage, to raise the likelihood of discovering
something truly novel and useful. Innovation, by contrast, is managed in well defined stages, to
increase the reliability with which firms achieve specific goals. Key tasks tend to be analytical,
and leaders influence outcomes by selecting which projects to fund.
Mark Fishman, president of Novartis Institutes for BioMedical Research puts it this way:
“The leader’s job is to map out the stages of innovation and recognize the different processes,
skill sets, and technology support that each requires. For instance, efficiency-minded
management has no place in the discovery phase… you must accept that the discovery phase in
pharmaceutical innovation is inherently muddleheaded. Efficient models make good sense for
the middle and end stages of the innovation process, when the game has moved from discovery
to control and reliability” (Amabile & Khaire, 2008, p. 104).
35

Formal processes offer less guidance to invention, few clear or measurable outcomes can
be specified, and many paths are indistinguishable ex ante. These qualities make it particularly
ripe for leadership influence. It is here where softer skills, intuition and experience, and
especially a CEO’s ability to craft a compelling vision ought to matter most (Bhardwaj et al.,
2006). By defining the direction in which a firm will move, a strategic leader’s vision provides
some of the structure missing in early stage discovery (Berger et al., 2009). Authors speculate
that the capacity to articulate a compelling vision is the primary reason transformational
leadership behaviors correlate positively with exploration and creativity (Friedrich, Vessey,
Schuelke, Ruark, & Mumford, 2010; Mumford et al., 2002). Reiter-Palmon and Ilies (2004)
argue that, although leaders may not devise the solutions, they must engage in the generative
process by offering meaning and direction, which helps to define problems and conceptualize
solutions.
Leader versus Firm Effects. We also found that strategic leaders have a stronger
influence on firms’ inventive performance than stable firm factors, where they accounted for
over 38% of the variation in firms’ success and firm effects explain 27%. By contrast, 51% of
the variation in innovation outcomes was attributable to the firm and less than 4% to the firm’s
leaders. This suggests firm resources matter less for invention than how strategic leaders
manage the resources at their disposal; the reverse holds for innovation. To affect invention,
strategic leaders must shape the process of discovery; to influence innovation, strategic leaders
must manage the accumulation of key resources, such as technology, talent, facilities,
procedures, and culture.
Strategic Leader Influence on Benefits from Knowledge Diversity. We also find that
some of CEOs’ and CSOs’ influence on invention is attributable to their ability to leverage
36

internal and external knowledge diversity. Research has generated relatively consistent findings
on how leaders can affect creativity and their firms’ inventive success, and much of it seems
relevant to managing and benefitting from diversity. Key insights include the need to manage
intrinsic motivation by creating a work environment that appreciates novelty and risk, challenges
employees and supports collaboration, is open to diverse perspectives, and manages conflict
constructively (Amabile & Khaire, 2008; Amabile & Kramer, 2012). Leaders that communicate
a clear and consistent vision for their organization, and convey their expectations regarding goals
and missions for innovation are more likely to succeed in this regard (Berger et al., 2009;
Mumford et al., 2002; Friedrich et al., 2010; Shalley & Gilson, 2004).
Empirical Contribution. We measured annually the firms’ inventive and innovative
success across different leaders’ eras within firm and across firms over 20 years of observations,
thus our data exhibit hierarchical, or nested, data structures. These data structures present several
issues for analysis including the interdependence of observations and the cross-level nature of
the data. Because repeated observation within leader’s era tend to be more homogeneous than if
observations were randomly sampled from a larger population, observations based on these
environments are not fully independent. Thus in our hierarchical data, the assumption of
independence for OLS regression and most analytic techniques is certainly violated and may
produce unreasonably small standard errors (Raudenbush & Bryk, 2002). To deal with the cross-
level nature of the data, we can aggregate or disaggregate data and analyze them at the higher- or
the lower-level units. However, disaggregating the data may increase interdependency of the
variables, while the aggregating approach may disregard potentially meaningful lower-level
variations in outcome measure (Raudenbush & Bryk, 2002). Further, ordinary regressions and
analysis of variance prevent us from disentangling level effects on the outcome of interest.
37

Adopting a multi-level analytical perspective overcomes these problems. Our 3-level
mixed effect Poisson regression explicitly models each year observation-, leader’s era- and firm-
level residuals, therefore recognizing the partial interdependence of each year observation within
the same era and firm. The total variance in our dependent variable is decomposed into within-
era variance, between-era within-firm variance and between-firm variance, and those sources of
variation are studied simultaneously. Therefore, unlike traditional ANOVA for the
decomposition of variance, the analysis accurately models the true relationship between the
independent variables and the dependent variables. Our approach essentially examined lower-
level and higher-level variance in the outcome measures, while maintaining the appropriate level
of analysis, thus the analysis accurately model the true relationship between the independent
variables and the dependent variables.
Limitations and Future Directions. It will be important to examine whether our results
hold in other science-based industries, which face less regulated development processes and
complex products. It would also be fruitful to examine whether strategic leaders have the same
influence on the benefit firms derive from other types of diversity, such as functional
background, demographic, and tenure differences, for innovation. It would also be useful to
investigate further whether stability or changes in leadership affects this utility, as there are
conflicting arguments in the literature. On the one hand, leadership stability may provide
researchers with the confidence to explore and take risks. On the other hand, it may lead to
inertial patterns of search and collaboration which would undermine inventive capacity.
Previous studies have shown that intensive internal research helps a firm to effectively
absorb external knowledge (Cohen & Levinthal, 1990; Gambardella, 1992; Henderson &
Cockburn, 1996; Lane & Lubatkin, 1998). However, openness to discoveries and innovation
38

opportunities outside the firm is also essential to benefitting from absorptive capacity (Volberda,
1996). It may be instructive to examine whether executives’ orientation to open innovation
explains firm’s competence in utilizing diverse knowledge. Finally, top executives can affect the
influence of knowledge diversity on invention in two different ways that complement to each
other. Strategic leaders may influence how much diversity a firm accumulates, and they also
shape how productively their firms utilize it. Further research could delve more deeply into how
leaders affect both outcomes.
39

TABLES AND FIGURES
Table 1a. Descriptive Statistics and Correlations for Inventive Performancea
1 2 3 4 5 6 7 8 9 10 11 12 13 1.Inventive Performance 1.000 2. Firm Knowledge Stock 0.624 1.000 3. Partner Knowledge Stock 0.183 0.250 1.000 4. Network Knowledge Diversity -0.154 -0.261 -0.479 1.000 5. Network Size 0.263 0.650 0.253 -0.307 1.000 6. Network Efficiency 0.223 0.301 0.156 -0.143 0.337 1.000 7. Firm Age 0.447 0.556 0.272 -0.281 0.427 0.121 1.000 8. Firm Size 0.473 0.620 0.206 -0.265 0.582 0.238 0.678 1.000 9. R&D Expenses 0.474 0.674 0.230 -0.287 0.675 0.385 0.631 0.911 1.000 10. Slack Resources -0.253 -0.271 -0.109 0.150 -0.228 -0.001 -0.368 -0.426 -0.328 1.000 11. Firm’s Partner Experience 0.222 0.346 0.108 -0.182 0.335 0.357 0.233 0.416 0.470 -0.220 1.000 12. Internal Knowledge Diversity 0.076 0.028 -0.050 0.023 0.051 -0.023 0.137 0.066 0.036 -0.075 0.001 1.000 13. External Knowledge Diversity -0.235 -0.373 -0.578 0.468 -0.380 -0.178 -0.306 -0.328 -0.371 0.152 -0.204 0.020 1.000 Mean 345.13 75.15 30.36 0.95 32.94 0.59 50.21 6.85 5.14 3.37 0.52 0.62 0.92 Std. Dev. 428.93 91.34 92.64 0.14 40.75 0.12 37.56 2.99 2.30 3.93 0.32 0.28 0.16 Min 0.00 0.00 0.00 0.00 0.00 0.00 2.00 -3.82 -1.67 0.49 0.00 0.00 0.00 Max 2167.00 403.00 804.00 1.00 204.00 0.79 154.00 10.87 9.41 43.76 0.95 1.00 1.00
aCorrelations greater than 0.08 and less than -0.15 are statistically significant at p < .05
40

Table 1b. Descriptive Statistics and Correlations for Innovative Performancea
1 2 3 4 5 6 7 8 9 10 11 12 13 1.Innovative Performance 1.000 2. Firm Knowledge Stock 0.319 1.000 3. Partner Knowledge Stock 0.145 0.250 1.000 4. Network Knowledge Diversity -0.124 -0.261 -0.479 1.000 5. Network Size 0.424 0.650 0.253 -0.307 1.000 6. Network Efficiency 0.148 0.301 0.156 -0.143 0.337 1.000 7. Firm Age 0.282 0.556 0.272 -0.281 0.427 0.121 1.000 8. Firm Size 0.454 0.620 0.206 -0.265 0.582 0.238 0.678 1.000 9. R&D Expenses 0.445 0.674 0.230 -0.287 0.675 0.385 0.631 0.911 1.000 10. Slack Resources -0.242 -0.271 -0.109 0.150 -0.228 -0.001 -0.368 -0.426 -0.328 1.000 11. Firm’s Partner Experience 0.190 0.346 0.108 -0.182 0.335 0.357 0.233 0.416 0.470 -0.220 1.000 12. Internal Knowledge Diversity 0.089 0.028 -0.050 0.023 0.051 -0.023 0.137 0.066 0.036 -0.075 0.001 1.000 13. External Knowledge Diversity -0.194 -0.373 -0.578 0.468 -0.380 -0.178 -0.306 -0.328 -0.371 0.152 -0.204 0.020 1.000 Mean 1.663 75.15 30.36 0.95 32.94 0.59 50.21 6.85 5.14 3.37 0.52 0.62 0.92 Std. Dev. 2.713 91.34 92.64 0.14 40.75 0.12 37.56 2.99 2.30 3.93 0.32 0.28 0.16 Min 0 0.00 0.00 0.00 0.00 0.00 2.00 -3.82 -1.67 0.49 0.00 0.00 0.00 Max 24 403.00 804.00 1.00 204.00 0.79 154.00 10.87 9.41 43.76 0.95 1.00 1.00 aCorrelations greater than 0.08 and less than -0.15 are statistically significant at p < .05
41

Table 2a. Mixed Effect Poisson Regression - The influence of Chief Executive Officer (CEO) on the relationship between knowledge diversity and inventive performance
Variables Model 1 Model 2 Model 3 Model 4 Model 5 Fixed effects Year -0.771*** -0.546*** -0.666*** -0.431*** Firm Knowledge Stock 0.633*** 0.589*** 0.636*** 0.580*** Partner Knowledge Stock -0.019*** -0.017*** -0.012*** -0.020*** Network Knowledge Diversity 0.014*** -0.001 0.014***
0.014***
Network Size -0.283*** -0.396*** -0.371*** -0.515*** Network Efficiency 0.212*** 0.182*** 0.229*** 0.182*** Firm Age 0.470*** 0.729*** 0.450* 0.802*** Firm size (log sales) -0.793*** -0.914*** -0.811*** -0.985*** R&D Expenditure (log R&D) 1.159*** 0.749*** 1.224***
0.754***
Slack Resources -0.074*** -0.105*** -0.059*** -0.112*** Partner Experience 0.032*** -0.006 0.020*** 0.002 Internal Knowledge Diversity 1.678***
1.701***
Internal Knowledge Diversity Squared -2.006***
-1.994***
External Knowledge Diversity -0.244**
0.055
External Knowledge Diversity Squared 0.122***
-0.075*
Intercept 3.893 *** 4.599*** 4.462*** 4.586***
4.431***
Random effects (var) Intercept : Firm 2.57
(1.16-5.69) 0.487 (0.167-1.420)
0.580 (0.252-1.339)
0.481 (0.171-1.353)
0.626 (0.279-1.405)
Intercept : CEO 3.65 (2.44-5.47)
1.257 (0.812-1.944)
0.774 (0.482-1.242)
1.146 (0.727-1.807)
0.715 (0.057-0.184)
Internal Knowledge Diversity
3.919 (2.559-6.003)
4.187 (2.724-6.437)
External Knowledge Diversity
0.181 (0.098-0.335)
0.102 (0.057-0.184)
Wald χ2 15026.64*** 10967.41*** 12680.16*** 9638.98*** Significance levels: † p<0.1, * p<0.05, ** p<0.01, *** p<0.001; The 95% Confidence Intervals are in parentheses
42

Table 2b. Mixed Effect Poisson Regression - The influence of Chief Scientific Officer (CSO) on the relationship between knowledge diversity and inventive performance
Variables Model 6 Model 7 Model 8 Model 9 Model 10 Fixed effects Year -0.829*** -0.826*** -0.885*** -0.896*** Firm Knowledge Stock 0.575*** 0.497*** 0.580 0.495*** Partner Knowledge Stock -0.010*** -0.009*** -0.001*** -0.016*** Network Knowledge Diversity 0.001 0.003 -0.029**
-0.019***
Network Size -0.156*** -0.045*** -0.185*** -0.075*** Network Efficiency 0.130*** 0.084*** 0.180*** 0.104*** Firm Age 0.600** 0.477** 0.447*** 0.352* Firm size (log sales) -0.639*** -0.398*** -0.554*** -0.441*** R&D Expenditure (log R&D) 0.878*** 0.537*** 1.021***
0.804***
Slack Resources -0.318*** -0.307*** -0.291*** -0.293*** Partner Experience 0.063*** 0.040*** 0.060*** 0.050*** Internal Knowledge Diversity 1.485***
1.870***
Internal Knowledge Diversity Squared -1.735***
-2.005***
External Knowledge Diversity -0.194*
-0.144
External Knowledge Diversity Squared 0.125***
0.219***
Intercept 3.72 6** 4.493*** 4.598*** 4.483*** 4.455*** Random effects (var) Intercept: Firm 2.84
(1.22-6.57) 0.409 (0.081-2.060)
0.423 (0.160-1.117)
0.369 (0.108-1.256)
0.285 (0.091-0.891)
Intercept: CSO 4.62 (3.07-6.96)
2.043 (1.322-3.158)
1.089 (0.708-1.676)
1.640 (1.065-2.527)
1.093 (0.700-1.704)
Internal Knowledge Diversity
3.672 (2.443-5.520)
4.718 (3.151-7.052)
External Knowledge Diversity
0.330 (0.162-0.672)
0.684 (0.321-1.458)
Wald χ2 9973.49*** 8393.35*** 9455.91*** 8082.35*** Significance levels: † p<0.1, * p<0.05, ** p<0.01, *** p<0.001; The 95% Confidence Intervals are in parentheses
43

Table 3a. Cohort CEO &CSO Random Effects Parameters for Inventive Performance Random Effects
Parameters (variance) Base Model CEO as predictor CSO as predictor
Estimate S.E. Estimate S.E. Estimate S.E. Firm: intercept 2.85 1.04 3.02 1.06 3.01 1.14 Cohort CEOCSO : intercept
4.27 0.67 3.38 0.55 3.57 0.58
Table 3b. Cohort CEO &CSO Random Effects Parameters for Innovative Performance
Random Effects Parameters (variance)
Base Model CEO as predictor CSO as predictor Estimate S.E. Estimate S.E. Estimate S.E.
Firm: intercept 3.78 1.41 4.18 1.60 3.86 1.40 Cohort CEO-CSO : intercept
0.28 0.08 0.27 0.08 0.22 0.07
44
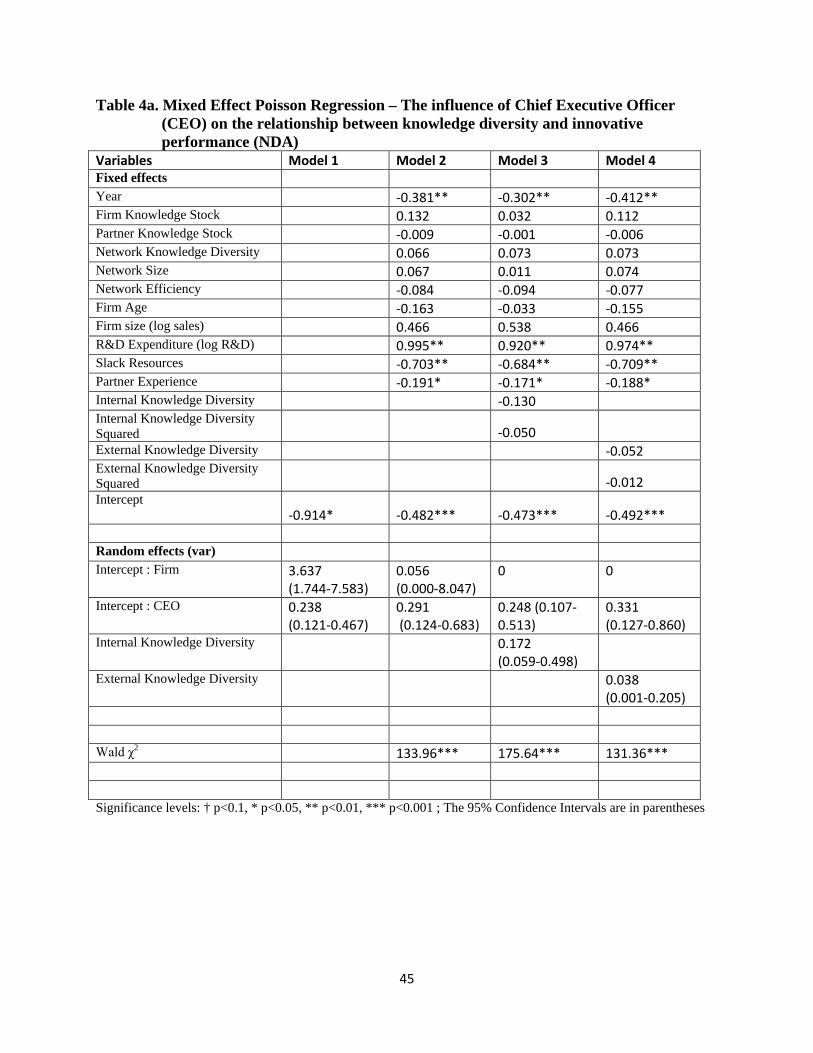
Table 4a. Mixed Effect Poisson Regression – The influence of Chief Executive Officer (CEO) on the relationship between knowledge diversity and innovative performance (NDA)
Variables Model 1 Model 2 Model 3 Model 4 Fixed effects Year -0.381** -0.302** -0.412** Firm Knowledge Stock 0.132 0.032 0.112 Partner Knowledge Stock -0.009 -0.001 -0.006 Network Knowledge Diversity 0.066 0.073 0.073 Network Size 0.067 0.011 0.074 Network Efficiency -0.084 -0.094 -0.077 Firm Age -0.163 -0.033 -0.155 Firm size (log sales) 0.466 0.538 0.466 R&D Expenditure (log R&D) 0.995** 0.920** 0.974** Slack Resources -0.703** -0.684** -0.709** Partner Experience -0.191* -0.171* -0.188* Internal Knowledge Diversity -0.130 Internal Knowledge Diversity Squared -0.050 External Knowledge Diversity -0.052 External Knowledge Diversity Squared -0.012 Intercept
-0.914* -0.482*** -0.473*** -0.492*** Random effects (var) Intercept : Firm 3.637
(1.744-7.583) 0.056 (0.000-8.047)
0 0
Intercept : CEO 0.238 (0.121-0.467)
0.291 (0.124-0.683)
0.248 (0.107-0.513)
0.331 (0.127-0.860)
Internal Knowledge Diversity 0.172 (0.059-0.498)
External Knowledge Diversity 0.038 (0.001-0.205)
Wald χ2 133.96*** 175.64*** 131.36*** Significance levels: † p<0.1, * p<0.05, ** p<0.01, *** p<0.001 ; The 95% Confidence Intervals are in parentheses
45

Table 4b. Mixed Effect Poisson Regression - The influence of Chief Scientific Officer (CSO)
on the relationship between knowledge diversity and innovative performance (NDA)
Variables Model 5 Model 6 Model 7 Model 8 Fixed effects Year -0.522*** -0.486*** -0.527*** Firm Knowledge Stock 0.005 -0.005 0.000 Partner Knowledge Stock 0.013 0.016 0.009 Network Knowledge Diversity 0.067 0.066 0.071 Network Size 0.278† 0.249† 0.255† Network Efficiency -0.062 -0.056 -0.070 Firm Age -0.094 -0.017 -0.101 Firm size (log sales) 0.736† 0.810† 0.784† R&D Expenditure (log R&D) 0.835** 0.788* 0.789* Slack Resources -0.426† -0.349 -0.480* Partner Experience -0.161** -0.156* -0.132† Internal Knowledge Diversity -0.257 Internal Knowledge Diversity Squared 0.155 External Knowledge Diversity -0.080 External Knowledge Diversity Squared 0.057 Intercept -0.895* -0.499*** -0.475** -0.505** Random effects (var) Intercept: Firm 3.838
(1.847-7.975) 0.149 (0.021-1.080)
0.204 (0.043-0.967)
0.113 (0.009-1.506)
Intercept: CSO 0.270 (0.133-0.548)
0.241 (0.096-0.606)
0.155 (0.057-0.425)
0.248 (0.089-0.681)
Internal Knowledge Diversity 0.102 (0.021-0.506)
External Knowledge Diversity 0.049 (0.012-0.198)
Wald χ2 126.84*** 127.56*** 126.93*** Significance levels: † p<0.1, * p<0.05, ** p<0.01, *** p<0.001; The 95% Confidence Intervals are in parentheses
46

Figure 1. The range of CEO’s influence on the relationship between Knowledge Diversity and Inventive Performance
0
50
100
150
200
250
300
0.0 0.1 0.2 0.3 0.4 0.5 0.6 0.7 0.8 0.9 1.0
Inve
ntiv
e Pe
rfor
man
ce
Knowledge Diversity
The influence of Chief Executive Officer (CEO) on the relationship between Knowledge Diversity and Inventive Performance
average - IKD lowerbound - IKD upperbound - IKDaverage - EKD lowerbound - EKD upperbound - EKD
47
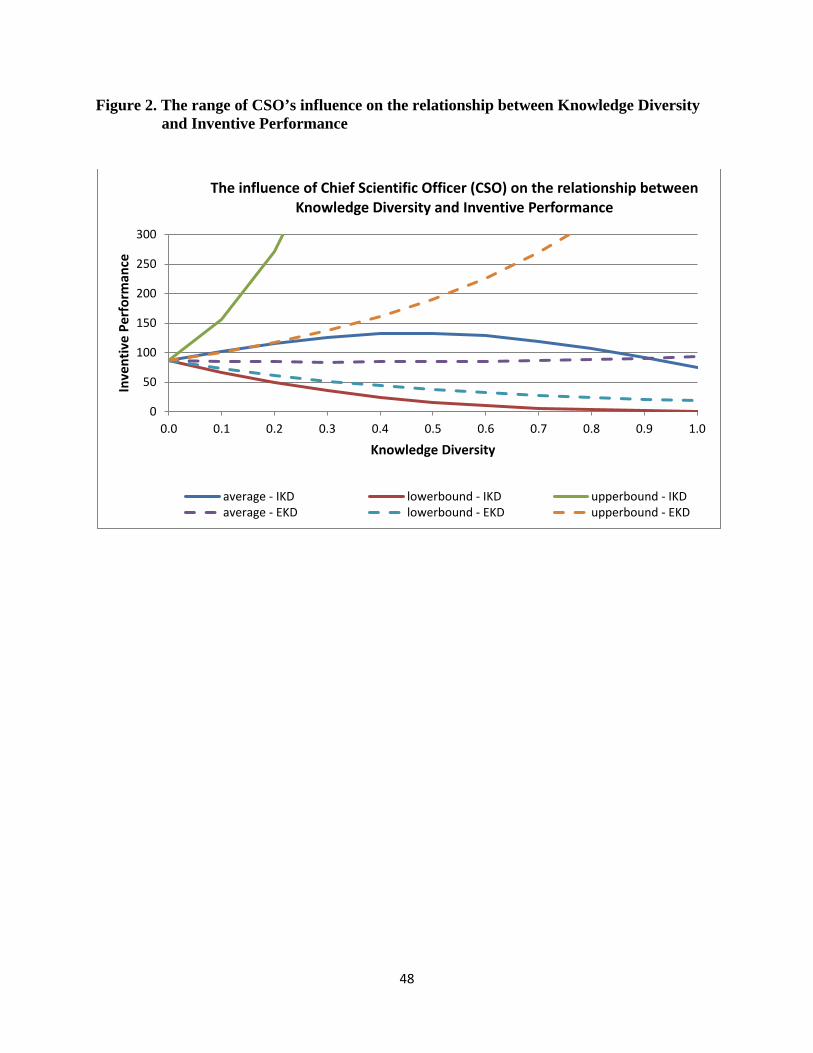
Figure 2. The range of CSO’s influence on the relationship between Knowledge Diversity and Inventive Performance
0
50
100
150
200
250
300
0.0 0.1 0.2 0.3 0.4 0.5 0.6 0.7 0.8 0.9 1.0
Inve
ntiv
e Pe
rfor
man
ce
Knowledge Diversity
The influence of Chief Scientific Officer (CSO) on the relationship between Knowledge Diversity and Inventive Performance
average - IKD lowerbound - IKD upperbound - IKDaverage - EKD lowerbound - EKD upperbound - EKD
48

APPENDIX A
The Innovation Value Chain in Pharmaceutical Industry
Besides merger and acquisition, growth in the pharmaceutical market comes from
innovation (Gassmann, Reepmeyer, & von Zedtwitz, 2008). Leading pharmaceutical companies
usually rely heavily on producing blockbuster drugs – a drug with at least $ 1 billion in annual
revenues- as their growth strategy. Strong first-mover advantages on launching blockbusters
seem to be the driver behind this strategy. However, this strategy faces some problems recently,
as they confront patent expiration and maturing drug portfolios, and the increasing power of
generic drug producers. For example firm that focuses alone on these blockbusters may
experience significant drops in sales once the patent of this drug expires (Gassmann et al., 2008).
Within one quarter after expiration, this block buster can lose up to 80% market share (Pammolli
& Riccaboni, 2007). Therefore, pharmaceutical companies have to innovate to increase the
number of new product in order to sustain growth. They depend significantly on their ability to
develop new drugs, and to overcome regulatory and market barriers (Agrawal, 1999).
Drug development is a complex process and high risks. Over time R&D costs increases,
and any failure of a newly developed substance can cause significant losses. The high attrition
rates during drug development refer to a high risks in this process. During the pre-clinical and
clinical phase the probability to abandon any substance that prove to be unsafe and has no effect
are high. The later the attrition, the higher the costs will be (Gassmann et al., 2008). Those
aspects have tremendous impact on the level of invention and alter the competitive dynamics in
this industry.
49

The figure below shows a typical innovation value chain of pharmaceutical firms. A team
of scientists start the discovery process by finding out the primary sequence of biochemical
process that leads to a disease in question. They expect that this knowledge would help them
identifying an effective drug that might inhibit the process. They do thousands of experiments to
discover a set of molecule targets that have promising pharmaceutical properties. Further, they
do some more works to refine these targets by finding their derivatives that might show better
properties. This optimization process leads to a selection of the most attractive molecule
candidate. At this point, the team knows that this molecule candidate has only about a 1-in-5000
chance to be developed as a commercially effective drug.
The next phase is to conduct a series of in vitro and in vivo experiment to gather more
data and determine its viability for further human clinical trials. This preclinical testing provides
information on the safety and potential efficacy of the candidate on inhibiting the development of
a disease in question. The information will be used later to decide whether or not the candidate is
good enough for further trials involving humans. There is always a chance that this molecule will
never be tested in humans because the experiments may show an alarming level of toxicity or no
effect in laboratory animals. However, if the results seem promising in term of its effectiveness
with no toxicity concerns, the firm then submits an investigational new drug (IND) application.
Once it is approved, the scientists can proceed to conduct clinical human trials.
Now, the purpose of the clinical trials is to assess the efficacy and safety of the drug
candidate in human sample. Phase 1 study evaluates the safety in small sample of healthy
persons, typically around 10 to 100, and may take about one year. The next, phase 2 study, assess
further the safety and the efficacy of the drug at different doses in the certain patient population.
The study may involve 50 to 500 patients, and the completion could take up to two years. If no
50

other concerns come up, the trial continues to the phase 3 to confirm further the safety and
efficacy issues of the drug in the larger patient population. The phase takes longer, 2 to 4 years,
to complete as it may be done in multiple trial sites, and the patients will be monitored over time
for assessing the long-term safety and efficacy levels.
The firm then submits the results of the trials to a regulatory body (FDA in USA) for
review. It takes about a year or even longer if the regulatory body needs clarification and further
information on certain issues. If it is approved for commercialization, the regulatory body will
also determine what performance and profile can be claimed for the drug.
51

Figure 3. Drug Development Cycle
Source: Adapted from Hansen & Birkinshaw (2007); Sosa (2009)
Discovery of new compounds
Clinical Trials Phase 1 Phase 2 Phase 3
Market Introduction
New Drug Application process
Investigational New Drug process
Invention Process Development Process Commercialization Regulatory Review
Pre-clinical Testing
52

APPENDIX B
Case Study
CEO influence on invention at Pfizer
Edmund T. Pratt: CEO 1972- 1991
When he took charge as CEO, Mr. Pratt together with Mr. Laubach the president of
Pfizer decided to pull together company’s disparate research organizations to be coordinated
under one centralized organization. This decision marked the company’s increased focus on
innovation and realized in form of Pfizer Central Research. Mr. Pratt emphasized the
commitment of Pfizer to focus on R&D and realized that this commitment to pharmaceutical
research will involve a long term strategy. Central Research became the centralized body for
pharmaceutical, chemical, and animal health research and development.
Central Research fundamentally restructured its research organization. As a result of this
effort, the company was able to focus more on new ways of drug discovery, to use extensively
interdisciplinary teams and to encourage cross-pollination of ideas.
In the 1980s Pfizer was driving toward a goal to become the world’s leading
pharmaceutical company. Mr. Pratt continued to invest more resources in Central Research. He
believed that new ideas are precious and investing on it was necessary to be innovative in this
industry. He asked board approval for a long-term strategy driven by innovative research. He
proposed a 20% annual increase in Central Research’s budget, and expanded the central research
facility to facilitate the recruitment of several hundred new scientists.
In the mid 80s Pfizer started to close the gap between R&D operations and the need for
the sales and marketing group. The company moved its Central Research closer to marketing and
53

also streamlined its global efforts that foster close work and more effective integration among
various labs in England, Japan, and France.
William C. Steere, Jr.: CEO 1991- 2000
In his tenure, William C. Steere, Jr. focused on core competencies, streamlined
operations and invested more in R&D. In his quote 1997, the CEO emphasized that innovation
strategy is the soul of the company not only specifically of research. He believed that Pfizer
should continue built its ability to discover, and develop innovative pharmaceuticals. When
many M&A occurred in the industry, the company stayed independent. When other companies
cut their R&D expenses, Pfizer kept expanding its investment in R&D. This extraordinary
commitment to R&D has lead investment of $757 million in 1999 to $2.8 billion in 1999. Further
the company expanded its major research centers in the US, England and Japan to double their
current capacity.
The company realized that no single company has all the good ideas. To complement its
strength in R&D, Pfizer actively seeks out alliances, and also commit to become the partner of
choice. During this decade Pfizer continually seeks partners that are committed to innovation. It
seeks partners that enable both of them to discover and develop innovative drugs more quickly.
Through these strategic networks, it has gained access to most advanced technologies available
to help strengthen its scientists’ works in discovery and development.
In the late 1990s and early 21st century, Pfizer reaffirmed its vision to be the number one
pharmaceutical company in the world by doing its best in discovering, developing and
commercializing innovative drugs through commitment to its eight core values: integrity, respect
to people, consumer focus, performance, innovation, leadership, teamwork, and community.
54

APPENDIX C
Case study
What CEOs did to increase inventions at Merck
P. Roy Vagelos: CEO 1985-1994
In the 1980s and 1990s, Merck was one of the most research-intensive pharmaceutical
firms. Over the years, Merck had introduced a number of important breakthrough drugs, and
developed a great reputation for scientific excellence. To maintain this superior performance, the
company continued to improve its in-house research skills and invest in its R&D activities.
Merck Research Laboratories is the centerpiece of Merck’s strategic plan to provide new
discoveries that enable the company to keep growing organically. Dr. Roy Vagelos lead Merck
Research Laboratory from 1976 to 1984, and then lead the company as CEO from 1985 to 1994.
During his tenure as the chief scientist, he revamped the research operation, modernized the labs,
and increased R&D budget. He brought his experiences as an academician to develop research
organization in Merck that resembles academic departments or other scientific institutions.
During his tenure as the company CEO, Dr. Vagelos had tightened Merck’s focus to
strengthen its leadership in developing and selling pharmaceuticals. He divested noncore
businesses such as water coolers, activated carbon, alginates and bio-gums, and wound dressings
divisions. He was convinced that Merck could be the best in pharmaceuticals. As the
management concentrated more on pharmaceuticals, he put more pressure on the Merck
Research Laboratories, the R&D engine of the company. He made certain to provide all
resources the lab needs to be successful. Merck continued to pump more resources into its
55

research and development to stay on the cutting edge of science. By 1989, Merck spent over
$750 million a year on research and development. This spending allowed Merck to expand its
R&D programs in Canada, to complete upgrading R&D facilities at Rahway, and to open the
Neuroscience Research Center in England.
Dr. Vagelos emphasized that the fundamentals of Merck’s R&D strategy will continue to
focus on breakthrough products, especially for unmet medical needs in big market. This means
that Merck will continue to rely heavily on producing blockbuster drugs – a drug with at least $ 1
billion in annual revenues- as its growth strategy. Merck might not develop niche product, as
developing this type of product is considered to be unfit with its business model.
Dr. Vagelos described his strategy for Merck for the years 1985 through 1994 were as
follow:
• Focusing on the core business, i.e. developing and selling pharmaceuticals.
• Increasing innovative R&D and marketing capabilities through strategic alliances.
• Improving personnel throughout the organization. Especially in R&D area, Dr. Vagelos
believes that the key to making research organization more effective and innovative is to
recruit and encourage talented risk takers. Therefore he recruited more not only top grade
scientists, but the ones who have entrepreneurial spirit.
• Enhancing research and development by continuously adding more resources and
developing new capabilities in molecular biology and genetics.
• Improving the development of each of new discoveries for both in-house and licensed
products from other firms.
• Upgrading quality in manufacturing and marketing operations.
56

However, insiders believed that functional excellence had increased functional barriers
that made efficient cross-functional collaboration costly. Many at the company described this
situation as too bureaucratic, people work in silos and tend to avoid conflict. Even though Merck
try to focus, employees felt that the strategy was too generic and was not operational. At that
time, the vision was unclear, and there was some confusion on the future role of research.
Raymond V. Gilmartin: CEO 1994 – 2005
As an outsider of Merck, formerly the CEO of a medical technology developer, Ray
Gilmartin assumed leadership of Merck in June 1994. He was chosen for his experience in
managing firm in industry characterized by intensive competition and high threat of buyers, and
was viewed as a strong facilitator for integrating different functions within the company. He
believed that as competition would continue to increase, therefore it is crucial for Merck to
maintain a robust discovery based on excellence in research and development. He made sure that
he addressed the lack of specificity and clarity around the company’s strategy. Management
Committee advised him to strengthen Merck’s focus and to become a top-tier growth company
by remaining as a research-based pharmaceutical company.
In early 1995, Gilmartin started to make some changes to create a less hierarchical
organization and to foster cross-functional teams for improving product development process.
Later in the middle of the year he launched the Worldwide Business Strategy Teams for the
purpose of coordinating the worldwide franchise strategies for Merck products. He hoped that
the teams would lead the organization in a better learning process by leveraging existing
functional knowledge and developing long-term business strategies.
57

In line with the commitment to remain as a research-based company, Gilmartin continued
to increase investment in R&D. The company spent about $2.4 billion in 2000 and $2.8 billion in
2001 for R&D. Although the company continued to increase the absolute size of its R&D
budget, Gilmartin believed that it takes more than simply dollar amount of investment to stay on
the cutting edge of science. He emphasized that research strategy, talent, and insight are the
important drivers for the company’s success in breakthrough research. Therefore, while rivals
boosted up their R&D investment to a very high level through mergers, Merck had not followed
the trend. Merck’s senior management had questioned whether a vast amount of research budged
was necessary to take advantage of the new potential of biotechnology.
Instead, Merck was pursuing 3 strategies to maintain its lead position in drug discovery:
hiring the best scientists, decentralizing research, and fostering external collaboration. Hiring the
top scientific talent and retaining them are crucial for Merck to keep up with the acceleration of
scientific advancement. Merck developed a stock options program for its researchers in response
to the intensive competition for talent.
Merck decentralized its research by investing in smaller new facilities in US, Canada, and
England. The smaller labs in more places were intended to aid recruitments and improve
productivity. However, this also creates the challenge of effective integration among the
geographically dispersed labs.
In the past, Merck’s involvement in obtaining expertise from external knowledge had
been low. The structure and budgeting process were not designed to foster collaboration between
internal scientists and outsiders. In order to exploit the benefits of external collaboration,
Gilmartin made two internal changes in 2000. He increased the amount of dedicated budget for
58

external collaborations and changed the process to eliminate competition between internal and
external projects. He also created special team to deal with all aspects of external collaboration.
These changes helped Merck’s scientists to expand their collaborative works with more potential
researchers from outside, and to leverage their capabilities more effectively. While expanding
external collaboration efforts, Gilmartin and Merck’s senior management believed that Merck
should maintain internal research programs that complement any external collaboration,
collaborate on early stage research activity, and look for partners who have very specific
technologies with clear scientific qualities.
59

BIBLIOGRAPHY
Agrawal. M. 1999. Global Competitiveness in the Pharmaceutical Industry. New York: Pharmaceutical Products Press
Ahuja, G. 2000. Collaboration networks, structural holes, and innovation: A longitudinal study. Administrative Science Quarterly, 45: 425-455.
Ahuja, G., & Lampert, C.M. 2001. Entrepreneurship in the large corporation: A longitudinal study of how established firms create breakthrough inventions. Strategic Management Journal, 22: 521-543.
Alcacer, J., Gittelman, M., & Sampat, B. 2009. Applicant and examiner citations in US patents: An overview and analysis. Research Policy, 38: 415-427.
Amabile, T.M. 1997. Motivating creativity in organizations: On doing what you love and loving what you do. California Management Review, 40(1): 39-58.
Amabile, T.M., & Khaire, M. 2008. Creativity and the role of the leader. Harvard Business Review, 86(10): 101- 109.
Amabile, T.M., & Kramer, S. 2012. How leaders kill meaning at work. The McKinsey Quarterly, January.
Arendt, L.A., Priem, R.L., & Ndofor, H.A. 2005. A CEO-adviser model of strategic decision making. Journal of Management, 31: 680-699.
Arora, A., & Gambardella, A. 1994. The changing technology of technological change: general and abstract knowledge and the division of innovative labour. Research Policy, 23: 523-532.
Arora, A., Gambardella, A., Magazzini, L., & Pammolli, F. 2009. A breath of fresh air? Firm type, scale, scope, and selection effects in drug development. Management Science, 55: 1638-1653.
Balkin, D., Markman, G., & Gomez-Mejia, L. 2000. Is CEO pay in high technology firms related to innovation? Academy of Management Journal, 43: 1118-1129.
Benner, M., & Waldfogel, J. 2008. Close to you? Bias and precision in patent-based measures of technological position. Research Policy, 37: 1556-1567.
Benner, M., & Tripsas, M. 2012. The influence of prior industry affiliation on framing in nascent industries: The evolution of digital cameras. Strategic Management Journal, 33: 277-302.
Berger, R., Dutta, S., Raffel, T., & Samuels, G. 2009. Innovating at the Top: How Global CEOs Drive Innovation for Growth and Profit. Houndsmills, UK: Palgrave Macmillan.
Bhardwaj, G., Camillus, J., & Hounshell, D. 2006. Continual corporate entrepreneurial search for long-term growth. Management Science, 52: 248-261.
Bierly, P., & Chakrabarti, A. 1996. Generic knowledge strategies in the US pharmaceutical industry. Strategic Management Journal, 17 (Winter Special): 123–135.
Borgatti, S.P., Everett, M.G., & Freeman, L.C., 2002. UCINET for Windows: Software for Social Network Analysis. Analytic Technologies, Harvard.
60

Brush, T.H., & Bromiley, P. 1997. What does a small corporate effect mean? A variance components simulation of corporate and business effects. Strategic Management Journal, 18: 825-835.
Brusoni, S., Criscuolo, P., & Geuna, P. 2005. The knowledge bases of the world's largest pharmaceutical groups: what do patent citations to non-patent literature reveal? Economics of Innovation and New Technology, 14: 395-415.
Bunderson, J. S., & Sutcliffe, K. M. 2002. Comparing alternative conceptualizations of functional diversity in management teams: Process and performance effects. Academy of Management Journal, 45: 875–893.
Burgelman, R. 1986. Managing corporate entrepreneurship: New structures for implementing technological innovation. In M. Horwitch (Ed.), Technology and the modern corporation: 112-153. New York: Pergamon Press.
Burgelman, R.A.1994. Fading memories: a process theory of strategic business exit in dynamic environment. Administrative Science Quarterly, 39: 24-36.
Burt, R.S. 1992. Structural Holes: The Social Structure of Competition. Cambridge, MA: Harvard University Press.
Cardinal, L.B. 2001. Technological innovation in the pharmaceutical industry: The use of organizational control in managing research and development. Organization Science, 12: 19-36.
Christensen, C. 1997. The Innovator’s Dilemma: When New Technologies Cause Great Firms to Fail. Boston, MA: Harvard Business School Press.
Cohen, M.D., & Bacdayan, P. 1994. Organizational routines are stored as procedural memory: Evidence from a laboratory study. Organization Science, 5: 554-568.
Cohen, W. M., & Levinthal, D. A. 1990. Absorptive capacity: A new perspective on learning and innovation. Administrative Science Quarterly, 35: 128-152.
Cooper, R.G. 2001. Winning at new products: Accelerating the process from idea to launch. Cambridge, MA: Perseus Publishing.
Criswell, C., & Martin, A. 2007. 10 Trends: A study of senior executives’ views on the future. Greensboro, NC: Center for Creative Leadership.
Dyer, J., Gregersen, H., & Christensen, C. 2011. The Innovator's DNA: Mastering the five skills of disruptive innovators. Boston, MA: Harvard Business Review Press.
Eisenhardt, K.M., & Tabrizi, B.N. 1995. Accelerating adaptive processes: Product innovation in the global computer industry. Administrative Science Quarterly, 40: 84-110.
Elkins, T., & Keller, R.T. 2003. Leadership in research and development organizations: A literature review and conceptual framework. Leadership Quarterly, 14: 587-606.
Ernst, C., & Chrobot-Mason, D. 2011. Flat world, hard boundaries: How to lead across them MIT Sloan Management Review, Spring 52(3): 81-88.
Fabrizio, K.R. 2009. Absorptive capacity and the search for innovation. Research Policy, 38: 255-267.
61

Fagan, P. L., & Beer, M. 1999. Merck & Co., Inc.: Corporate Strategy, Organization and Cluture (A), HBS No. 9-499-054. Boston, MA: Harvard Business School Publishing.
Finkelstein, S. 1992. Power in top management teams: Dimensions, measurement, and validation. Academy of Management Journal, 35: 505-538.
Fleming, L. 2001. Recombinant uncertainty in technological search. Management Science, 47: 117-132.
Fleming, L., Mingo, S., & Chen, D. 2007. Collaborative brokerage, generative creativity, and creative success. Administrative Quarterly, 52: 443 – 475.
Friedrich, T.L., Vessey, W.B., Schuelke, M.J., Ruark, G.A., & Mumford, M.D. 2009. A framework for understanding collective leadership: The selective utilization of leader and team expertise within networks. The Leadership Quarterly, 20: 933-958.
Gambardella, A. 1992. Competitive advantages from in-house scientific research: the US pharmaceutical industry in the 1980s. Research Policy, 21: 391–407.
Gambardella, A. 1995. Science and innovation: The US pharmaceutical industry during the 1980s. Cambridge: Cambridge University Press.
Gassmann, O., Reepmeyer,G., & von Zedtwitz, M. 2008. Leading pharmaceutical innovation: trends and drivers for growth in the pharmaceutical industry, 2nd ed. Berlin: Springer.
Geroski, P, Machin, S, and van Reenen, J. 1993. The profitability of innovating firms. The RAND Journal of Economics, 24(2): 198-211.
Gilsing, V., Nooteboom, B., Vanhaverbeke, W., Duysters, G., & van den Oord, A. 2008. Network embeddedness and the exploration of novel technologies: Technological distance, betweenness centrality and density. Research Policy, 37: 1717–1731.
Glick, M.B. 2011. The role of chief executive officer. Advances in Developing Human Resources, 13: 171-207.
Grove, A. 1996. Only the Paranoid Survive. New York: Currency Doubleday. Hall, B. 2002. A note on the bias in Herfindahl-type measures based on count data. Available at:
http://elsa.berkeley.edu/~bhhall/papers/BHH05_hhibias.pdf Hall, B.H., Jaffe, A.B., & Trajtenberg, M. 2005. Market value and patent citations. The RAND
Journal of Economics, 36: 16-38.
Hambrick, D. C. 1981. Specialization of environmental scanning activities among upper level managers. Journal of Management Studies, 18: 299−320.
Hambrick, D. C., & Mason, P. A. 1984. Upper echelons: the organization as a reflection of its top managers. Academy of Management Review, 9: 193−206.
Hambrick, D.C., Finkelstein, S., & Mooney, A.C. 2005. Executive job demands: New insights for explaining strategic decisions and leader behaviors. Academy of Management Review, 30: 472-491.
62

Hansen, M. T., & Birkinshaw, J. 2007. The innovation value chain. Harvard Business Review, 85(6): 121-130.
Hargadon, A., & Sutton, R.I. 1997. Technology brokering and innovation in a product development firm. Administrative Science Quarterly, 42: 716-749.
Harhoff, D., Scherer, F. M. & Vopel, K. 2003. Citations, family size, opposition, and the value of patent rights. Research Policy, 32: 1343-1364.
Hart, S.L., & Quinn, R.E. 1993. Roles executives play: CEOs, behavioral complexity, and firm performance. Human Relations, 46: 543-574.
Hartley, S. 2011. The effectiveness of the chief technology officer. Research Technology Management. 54(3): 28-35.
Henderson, R.M. 1994. The evolution of integrative competence: Innovation in cardiovascular drug discovery. Industrial and Corporate Change, 3: 607-630.
Henderson, R., & Cockburn, I. 1994. Measuring competence? Exploring firm effects in pharmaceutical research. Strategic Management Journal, 15(SI): 63–84.
Henderson, R., & Cockburn, I. 1996. Scale, scope, and spillovers: the determinants of research productivity in drug discovery. The RAND Journal of Economics, 27: 32-59.
Hoffman, R., & Hegarty, H. 1993. Top management influence on innovations: Effects of executive characteristics and social culture. Journal of Management, 19: 549-574.
Holland, S., Gaston, K., & Gomes, J. 2000. Critical success factors for cross-functional teamwork in new product development. International Journal of Management Reviews, 2: 231-259.
Huber, G.P. 1991. Organizational learning: The contributing processes and the literatures. Organization Science, 2: 88-115.
Ireland, D., & Hitt, M. 2005. Achieving and maintaining strategic competitiveness in the 21st century: The role of strategic leadership. Academy of Management Executive, 19 (4): 63-77.
Jaffe, A. B. 1986. Technological opportunity and spillovers of R&D: evidence from firms’ patents, profits, and market value. American Economic Review, 76: 984–1001.
Jeppesen, L.B., & Lakhani, K.R. 2010. Marginality and problem-solving effectiveness in broadcast search. Organization Science, 21: 1016-1033.
Jung, D., Wu, A., & Chow, C.W. 2008. Towards understanding the direct and indirect effects of CEOs' transformational leadership on firm innovation. The Leadership Quarterly, 19: 582-594.
Katila, R., & Ahuja, G. 2002. Something old, something new: A longitudinal study of search behavior and new product introduction. Academy of Management Journal, 45: 1183-1194.
Katila, R., & Shane, S. 2005. When does lack of resources make new firms innovative? Academy of Management Journal, 48: 814-829.
63

Lahiri, N. 2010. Geographic distribution of R&D activity: How does it affect innovation quality? Academy of Management Journal, 53: 1194-1209.
Lane, P., & Lubatkin, M. 1998. Relative absorptive capacity and inter-organizational learning. Strategic Management Journal, 19:461-477.
Leiponen, A., & Helfat, C.C. 2010. Innovation objectives, knowledge sources, and the benefits of breadth. Strategic Management Journal, 31: 224–236.
Leonard‐Barton, D. 1992. Core capabilities and core rigidities: A paradox in managing new product development. Strategic Management Journal, 13(S1): 111-125.
Linden, R. 2010. Developing a collaborative mindset. Leader to Leader, 58(Fall): 57-62.
Macher, J.T., & Boerner, C. 2012. Technological development at the boundaries of the firm: A knowledge‐based examination in drug development. Strategic Management Journal, 33: 1016-1036.
Mackey, A. 2008. The effect of CEOs on firm performance. Strategic Management Journal, 29: 1357-1367.
Makri, M., Lane, P.J., & Gomez-Mejia, L. 2006. CEO Incentives, innovation, and performance in technology-intensive firms. Strategic Management Journal, 27 : 1057-1080.
Mansfield, E. 1961. Technical change and the rate of imitation. Econometrica, 29: 741-766.
March, J.G. 1991. Exploration and exploitation in organizational learning. Organization Science, 2(1): 71-87.
March, J.G., & Simon, H.A. 1958. Organizations. Oxford, England: Wiley.
Martin, R. 2009. The design of business. Boston, MA: Harvard Business School Press.
Medcof, J.W. 2008. The organizational influence of the Chief Technology Officer. R&D Management, 38: 406-420.
Mehta, A., Rysman, M., & Simcoe, T. 2010. Identifying the age profile of patent citations: New estimates of knowledge diffusion. Journal of Applied Econometrics, 25: 1179-1204.
Meyers, M.A. 2007. Happy accidents: Serendipity in modern medical breakthroughs. New York: Arcade Publishing.
Miller, D. J., Fern, M., & Cardinal, L. 2007. The use of knowledge for technological innovation within diversified firms. Academy of Management Journal, 50: 307-326.
Montgomery, C.A. 2008. Putting leadership back into strategy. Harvard Business Review, 86(1): 54-60.
Montoya-Weiss, M., & Calantone, R. 1994. Determinants of new product performance: A review and meta-analysis. Journal of Product Innovation Management, 11: 397-417.
Mumford, M. D., Scott, G. M., Gaddis, B., & Strange, J. M. 2002. Leading creative people: orchestrating expertise and relationships. The Leadership Quarterly, 13: 705−750.
Mumford, M.D., Bedell-Avers, K.E., & Hunter, S.T. 2008. Planning for innovation: A multi-level perspective, in Michael D. Mumford, Samuel T. Hunter, Katrina E. Bedell-Avers
64

(Eds.) Multi-Level Issues in Creativity and Innovation (Research in Multi Level Issues, Volume 7, Emerald Group Publishing Limited: 107-154.
Nadler, D.A., & Heilpern, J.D. 1998. The CEO in the context of discontinuous change. In D.C. Hambrick, D.A. Nadler, and M.L. Tushman, (Eds.), Navigating Change: How CEOs, Top Teams, and Boards Steer Transformation, Boston: Harvard Business School Press, 3-27.
Nagji, B., & Tuff , G. 2012. Managing your innovation portfolio. Harvard Business Review, 90(5): 66-74.
Nelson, R., & Winter, S. 1982. An evolutionary theory of economic change. Cambridge: Harvard University Press.
Ocasio, W. 1997. Towards an attention‐based view of the firm. Strategic Management Journal, 18: 187-206.
O’Connor, G.C. 2008. Major innovation as a dynamic capability: A systems approach. Journal of Product Innovation Management, 25: 313-330.
O’Connor, G.C., Leifer, R., Paulson, A.S., & Peters, L.S. 2008. Grabbing lightning: Building a capability for breakthrough innovation. San Francisco, CA: Jossey-Bass.
Pentland, B. T., & Reuter, H. H. 1994. Organizational routines as grammars of action. Administrative Science Quarterly, 39: 484-510.
Phelps, C.C. 2010. A longitudinal study of the influence of alliance network structure and composition on firm exploratory innovation. Academy of Management Journal, 53: 890-913.
Pinto, M.B., Pinto, J.K., & Prescott, J.E. 1993. Antecedents and consequences of project team cross-functional cooperation. Management Science, 39: 1281-1297.
Pisano, G. 2006. Discovering the future: R&D strategy at Merck. HBS No. 9-601-086. Boston: Harvard Business School Publishing.
Raes, A.M., Heijltjes, M. G., Glunk, U., & Roe, R.A. 2011. The interface of the top management team and middle managers: A process model. Academy of Management Review, 36: 102-126.
Raudenbush, S.W., & Bryk, A.S. 2002. Hierarchical Linear Models: Applications and data analysis methods, 2nd ed. Thousand Oaks, CA: Sage Publications, Inc.
Reiter-Palmon, R., & Illies, J.J. 2004. Leadership and creativity: Understanding leadership from a creative problem-solving perspective. The Leadership Quarterly, 15:55-77.
Reuer, J., Zollo, M., & Singh, H. 2002. Post-formation dynamics in strategic alliances. Strategic Management Journal. 23: 135-151.
Roberts, E.B. 2007. Managing invention and innovation, Research Technology Management, 50(1): 35-54.
Roberts, E.B. 2001. Benchmarking global strategic management of technology. Research Technology Management, 44(2): 25-36.
Rodengen, J.L. 1999. The Legend of Pfizer. Fort Lauderdale: Write Stuff Syndicate, Inc.
65

Roijakkers, N., & Hagedoorn, J. 2006. Inter-firm R&D partnering in pharmaceutical biotechnology since 1975: Trends, patterns, and networks. Research Policy, 35: 431-446.
Sampson, R.C. 2007. R&D alliances and firm performance: The impact of technological diversity and alliance organization on innovation. Academy of Management Journal, 50: 364-386.
Santoro, M. A., & Paine, L. 1995. Pfizer: Global Protection of Intellectual Property. HBS No. 9-392-073. Boston, MA: Harvard Business School Publishing.
Schumpeter, J. 1934. The theory of economic development. Oxford: Oxford University Press.
Scott, S. G., & Bruce, R.A. 1994. Determinants of innovative behavior: A path model of individual innovation in the workplace. Academy of Management Journal, 37: 580-607.
Shalley, C.E., & Gilson, L.L. 2004. What leaders need to know: A review of social and contextual factors that can foster or hinder creativity. Leadership Quarterly, 15: 33–53.
Singh, J. V. 1986. Performance, slack, and risk taking in organizational decision making.
Academy of Management Journal, 29: 562-585. Skarzynski, P., & Gibson, R. 2008. Innovation to the core: A blueprint for transforming the way
your company innovates. Boston, MA: Harvard Business School Press. Smith, R. 2007. What CTOs do. Research Technology Management, 50(4): 18-22.
Snijders, T.A.B., & Bosker, R. 1999. Multilevel analysis: An introduction to basic and advanced multilevel modeling. London: Sage.
Sorensen, J. B., and Stuart, T.E. 2000. Aging, obsolescence and organizational innovation. Administrative Science Quarterly, 45: 81-112.
Sosa, M. L. 2009. Application-specific R&D capabilities and the advantage of incumbents: Evidence from the anticancer drug market. Management Science, 55: 1409-1422.
Srivastava, M. K., & Gnyawali, D. 2011. When do relational resources matter? Leveraging portfolio of technological resources for breakthrough innovation. Academy of Management Journal, 54: 797-810.
Strumsky, D., Lobo, J., & Van Der Leeuw, S. 2012. Using patent technology codes to study technological change. Economics of Innovation and New Technology, 21: 267-286.
Teece, D.J., Pisano, G., & Shuen, A. 1997. Dynamic capabilities and strategic management. Strategic Management Journal, 18: 509-533.
Taylor, A., & Greve, H.R. 2006. Superman or the fantastic four? Knowledge combination and experience in innovative teams. Academy of Management Journal, 40: 723-740.
Thomke, S., & Nimgade, A. 2008. Pfizer Inc.: Building an Innovation Center. HBS No. 9-609-037. Boston, MA: Harvard Business School Publishing.
Tortoriello, M., & Krackhardt, D. 2010. Activating cross-boundary knowledge: the role of Simmelian ties in the generation of innovations. Academy of Management Journal. 53: 161-181.
66

Trajtenberg, M. 1990. A penny for your quotes: Patent citations and the value of innovations. The RAND Journal of Economics, 21: 172-187
Tripsas, M., & Gavetti. G. 2000. Capabilities, cognition, and inertia: Evidence from digital imaging. Strategic Management Journal, 21: 1147-1161.
Tsai, W. 2001. Knowledge transfer in intraorganizational networks: Effects of network position and absorptive capacity on business unit innovation and performance. Academy of Management Journal, 44: 996-1004.
Tsai, W., & Ghoshal, S. 1998. Social Capital and Value Creation: The Role of Intrafirm Networks. Academy of Management Journal, 41: 464-476.
Uttal, B., Kantrow, A., Linden, L.H., & Stock, S. 1992. Building R&D leadership and credibility. Research Technology Management, 35(3): 15-24.
Vagelos, P. R., & Galambos, L., 2004. Medicine, Science, and Merck. Cambridge, UK: Cambridge University Press.
Van Wijk, R., Jansen, J.J.P., & Lyles, M.A. 2008. Inter- and Intra-organizational knowledge transfer: A meta-analytic review and assessment of its antecedents and consequences. Journal of Management Studies, 45: 830-853.
van Zeebroeck, N. 2011. The puzzle of patent value indicators. Economics of Innovation and New Technology, 20: 33-62.
Vasudeva, G., & Anand, J. 2011. Unpacking absorptive capacity: a study of knowledge utilization from alliance portfolios. Academy of Management Journal, 54: 611-623.
Volberda, H. 1996. Toward the flexible form: How to remain vital in hypercompetitive environments. Organization Science, 7: 359-374.
Waldman, D.A., & Bass, B.M. 1991. Transformational leadership at different phases of the innovation process. The Journal of High Technology Management Research, 2: 169-180.
Walsh, J.P., & Ungson, G. R. 1991. Organizational memory. Academy of Management Review, 16: 57-91.
Winter, S. 1986. The Research program of the behavioral theory of the firm. In B. Glad & S. Kaish (Eds.), Handbook of Behavioral Economics. Vol. A: 151-188, London: JAI Press.
Wu, S., Levitas, E., & Priem, R. L. 2005. CEO tenure and company invention under differing levels of technological dynamism. Academy of Management Journal, 48: 859-873.
Yadav, M.S., Prabhu, J.C., & Chandy, R.K. 2007. Managing the future: CEO attention and innovation outcomes. Journal of Marketing, 71: 84-101.
Yayavaram, S & Ahuja, G. 2008. Decomposability in knowledge structures and its impact on the usefulness of inventions and knowledge-base malleability. Administrative Science Quarterly, 53: 333-362.
Yeoh, P.L., & Roth, K. 1999. An empirical analysis of sustained advantage in the US pharmaceutical industry: Impact of firm resources and capabilities. Strategic Management Journal, 20: 637-653.
67

Zhou, K.Z., & Li, C.B. 2012. How knowledge affects radical innovation: Knowledge base, market knowledge acquisition, and internal knowledge sharing. Strategic Management Journal, 33: 1090-1102.
68
Related Documents