THE INFLUENCE OF SILANE COUPLING AGENT COMPOSITION ON THE SURFACE CHARACTERIZATION OF FIBER AND ON FIBER-MATRIX INTERFACIAL SHEAR STRENGTH E. Feresenbet D. Raghavan Howard University, Chemistry Department, Washington, D.C., USA G. A. Holmes National Institute of Standards & Technology, Gaithersburg, Maryland, USA It is well known that the fiber-matrix interface in many composites has a profound influence on composite performance. The objective of this study is to understand the influence of composition and concentration of coupling agent on interface strength by coating E-glass fibers with solutions containing a mixture of hydro- lyzed propyl trimethoxysilane (PTMS) and g-aminopropyl trimethoxysilane (APS). The failure behavior and strength of the fiber-matrix interface were assessed by the single-fiber fragmentation test (SFFT), while the structure of silane coupling agent was studied in terms of its thickness by ellipsometry, its morphology by atomic force microscopy, its chemical composition by diffuse reflectance infrared Fourier transform (DRIFT), and its wettability by contact angle measurement. Deposition of 4.5 10 73 mol=L solution of coupling agent in water resulted in a heterogeneous surface with irregular morphology. The SFFT results suggest that the amount of adhesion between the glass fiber and epoxy is dependent not only on the type of coupling agent but also on the composition of the coupling agent mixture. As the concentration of APS in the mixture increased, the extent of interfacial bonding between the fiber and matrix increased and the mode of failure changed. For the APS coated glass epoxy system, matrix cracks were formed perpendicular to the fiber axis in addition to a sheath of debonded interface region along the fiber axis. Keywords: Interfacial shear strength; Glass fiber epoxy composite; Bonding and nonbonding coupling agents; Single fiber fragmentation test; Contact angle; DRIFT spectroscopy Received 20 June 2002; in final form 12 December 2002. The authors thank the Polymer Division of NIST and the Department of Chemistry at Howard University for providing financial support to E. Feresenbet. Address correspondence to D. Raghavan, Howard University, Chemistry Department, 525 College Street, NW, Washington, DC 20059, USA. E-mail: [email protected] The Journal of Adhesion, 79: 643–665, 2003 Copyright # Taylor and Francis Inc. ISSN: 0021-8464 DOI: 10.1080/00218460390219537 643

Welcome message from author
This document is posted to help you gain knowledge. Please leave a comment to let me know what you think about it! Share it to your friends and learn new things together.
Transcript

THE INFLUENCE OF SILANE COUPLING AGENTCOMPOSITION ON THE SURFACE CHARACTERIZATIONOF FIBER AND ON FIBER-MATRIX INTERFACIALSHEAR STRENGTH
E. FeresenbetD. RaghavanHoward University, Chemistry Department, Washington, D.C., USA
G. A. HolmesNational Institute of Standards & Technology, Gaithersburg,Maryland, USA
It is well known that the fiber-matrix interface in many composites has a profoundinfluence on composite performance. The objective of this study is to understandthe influence of composition and concentration of coupling agent on interfacestrength by coating E-glass fibers with solutions containing a mixture of hydro-lyzed propyl trimethoxysilane (PTMS) and g-aminopropyl trimethoxysilane (APS).The failure behavior and strength of the fiber-matrix interface were assessed by thesingle-fiber fragmentation test (SFFT), while the structure of silane coupling agentwas studied in terms of its thickness by ellipsometry, its morphology by atomicforce microscopy, its chemical composition by diffuse reflectance infrared Fouriertransform (DRIFT), and its wettability by contact angle measurement. Depositionof 4.5�1073mol=L solution of coupling agent in water resulted in a heterogeneoussurface with irregular morphology. The SFFT results suggest that the amount ofadhesion between the glass fiber and epoxy is dependent not only on the type ofcoupling agent but also on the composition of the coupling agent mixture. As theconcentration of APS in the mixture increased, the extent of interfacial bondingbetween the fiber and matrix increased and the mode of failure changed. For theAPS coated glass epoxy system, matrix cracks were formed perpendicular to thefiber axis in addition to a sheath of debonded interface region along the fiber axis.
Keywords: Interfacial shear strength; Glass fiber epoxy composite; Bonding andnonbonding coupling agents; Single fiber fragmentation test; Contact angle; DRIFTspectroscopy
Received 20 June 2002; in final form 12 December 2002.The authors thank the Polymer Division of NIST and the Department of Chemistry
at Howard University for providing financial support to E. Feresenbet.Address correspondence to D. Raghavan, Howard University, Chemistry Department,
525 College Street, NW, Washington, DC 20059, USA. E-mail: [email protected]
The Journal of Adhesion, 79: 643–665, 2003
Copyright # Taylor and Francis Inc.
ISSN: 0021-8464
DOI: 10.1080/00218460390219537
643

INTRODUCTION
The demand for fiber-reinforced polymeric composites in aircraft,automobiles, ships, and housing is increasing. Approximately 95% ofcomposites used today are fabricated from glass fibers, with epoxy resinbeing the preferred polymeric matrix because of the relatively goodprice-to-performance ratio, high availability, ease of processing, anddimensional stability. One of themajor technical challenges to the use ofcomposites in structural applications is the reliable prediction of long-term performance (e.g., failure behavior, fatigue behavior, durability,stiffness). When composites are manufactured, a small region (< 1mm)known as the fiber-matrix interphase forms between the fiber and thematrix [1]. This region exhibits properties distinguishably differentfrom the properties of the bulk matrix [2]. Since the fiber-matrixinterphase transfers stress between the fiber and matrix, the efficiencyof this stress-transfer process and a composite’s strength and durabilityare controlled by this region’s properties. The interphase stiffness, fibertopography, and fiber-matrix chemical bonding are critically importantto the stress-transfer process and composite performance. The efficiencyof this process is determined indirectly by micromechanics tests andquantified by a value termed the fiber-matrix interfacial shear strength(IFSS). In addition, micro-mechanics tests are used to probe a compo-site’s strength, durability, and failure behavior.
A composite’s interfacial performance is often improved by pre-treating the fiber with adhesion promoters prior to manufacture [3]. Inaddition to protecting the fiber, these promoters are inexpensive, easy toapply, and have been observed to increase the bond strength at theinterphase. Hence, the cost-to-performance ratio for using thismaterialis very low. The strength and durability of the interface depends on thesilane coupling agent’s organo-functionality, concentration on the fiber,and the manner in which the silane-coated surface perturbs the curingreactions in the interphase region. Other factors that can affect inter-face strength and durability are the hydrolysis conditions during asilane coupling agent’s deposition, the deposited silane layer morphol-ogy, and matrix-coupling agent compatibility (i.e., wettability) [4, 5].
In 1975, Ahagon and Gent [6] explored the effect of covalentbonding on interface adhesion. This was accomplished by measuringthe change in peel strength between a polybutadiene elastomer andglass plate coated with mixtures of bonding (vinyl trimethoxysilane)and nonbonding (ethyl trimethoxysilane) silane coupling agents. In1996, Hunston et al. [7] used a similar approach to vary the degree ofinterfacial bonding between glass fibers and an epoxy matrix. In thisresearch, mixtures of nonbonding (n-octadecyl trichlorosilane, OTS)
644 E. Feresenbet et al.

and bonding (g-aminopropyl trimethoxysilane, APS) were coated onthe fiber surface. Interfacial shear strength (IFSS) was determined bysingle fiber fragmentation tests (SFFTs) before and after water expo-sure. In both cases the interface strength increased as the con-centration of reactive coupling agent increased. Since the chain lengthof the coupling agents were dissimilar, shielding of the APS group bythe OTS could have reduced the accessibility of bonding sites. In thispaper, bonding (APS) and nonbonding (PTMS) silane coupling agentsof similar chain lengths were mixed in varying proportion to changesystematically the degree of bonding (as measured by interfacial shearstrength tests) between the glass fiber and epoxy matrix. Therefore,this research extends the research direction of Hunston et al. [7] byinvestigating, as in the Ahagon and Gent [6] research, the influence ofequal chain length bonding and nonbonding coupling agents on fiber-matrix IFSS.
The properties of the deposited silane layer were investigatedby ellipsometry (thickness), atomic force microscopy (morphology),Fourier transform infrared spectroscopy (chemical composition), andcontact angle measurements (wettability). In this work, the fiber-matrix interfacial shear strengths of these model composites aremeasured by the SFFT. The SFFT is also used to draw inferences aboutthe relationship between failure behavior and interface strength.
In the SFFT, a tensile load is applied to a dogbone specimen havinga single fiber placed along the central axis. Since the fiber has a lowerstrain-to-failure than the resin, the fiber breaks at its weakest flaw asthe strain increases. The fragmentation process continues until theremaining fiber fragments are all less than a critical transfer length(lc). At this point, the fragmentation process has reached saturation.The critical transfer length is the length below which the fragmentsare too short for sufficient loads to transfer into them to cause failure.Once saturation has been reached, the specimen is allowed to relaxback to the unstressed state, the fragment lengths are measured, anda micromechanics model is used to estimate the interfacial shearstrength. Holmes et al. [8] have shown that when the E-glass fiberfragments during the test, the matrix exhibits nonlinear viscoelasticbehavior. To account for this nonlinear viscoelastic matrix behavior indetermining the fiber-matrix interfacial shear strength, a nonlinearviscoelastic shear-lag model was developed by Holmes et al. [8]. Theequations for this model are as follows:
tinterface ¼dfb e; tf g
4
sinh b e; tf glc=2ð Þcosh b e; tf glc=2ð Þ � 1
� �sf lcf g;
Influence of Silane Coupling Agent 645

where
bfe; tg ¼ 2
df
Em e; tf g1þ nmð Þ Ef � Em e; tf g
� �ln 2rm=df
� �" #1=2
;
Em, Ef are the matrix and fiber moduli, respectively; nm is the matrixPoisson’s ratio; e is the global applied strain; t is the time; df is the fiberdiameter; rm is the radius of matrix parameter; lc is the critical transferlength at saturation; and sf flcg is the strength of the fiber at lc.
EXPERIMENTAL1
Materials
g-aminopropyl trimethoxysilane (APS, NH2-CH2-CH2-CH2-Si(OCH3)3)and propyl trimethoxysilane (PTMS, CH3-CH2-CH2-Si(OCH3)3)were purchased from GELEST, INC. (Morrisville, PA, USA) and2.0mol=L hydrochloric acid (HCl) was purchased from FisherScientific (Suwanee, GA, USA). E-glass fibers, 15� 3 mm diameter,(from Owens Corning, Toledo, OH, USA), Epon 828 (Shell Chemical,Houston, TX, USA), and meta-phenylenediamine (m-PDA) (Fluka Che-mical, Ronkonkama, NY, USA) were also used. All reagents were usedwithout further purification.
Sample Preparation and Testing
Deposition of Coupling Agent on Glass FiberA 30 cm long tow was cut from a spool of E-glass fibers (specially
prepared by Owens-Corning) previously shown to be free of processingaids by X-ray photoelectron spectroscopy (XPS) [9]. The tow waswashed with spectrophotometeric grade acetone, vacuum dried at110�C for 2 h, and cooled prior to use. Master batch solutions of4.5� 1073mol=L total silane were prepared for APS, PTMS, andAPS=PTMS mixtures. 2.0mol=L HCl was added using micropipette toeach master batch solution to attain pH 4. A digital pH meter (PHH320 Omega Engineering Inc., Stanford, CT, USA) with a standardglass electrode was used to determine the pH values. The silanesolution was stirred for 1h at room temperature. The coupling agent
1 Certain commercial instruments and supplies are identified in this paper to ade-quately describe the experimental procedure. In no case does such identification implyrecommendation or endorsement by the National Institute of Standards and Technologyand Howard University, nor does it imply that instruments and supplies are the bestavailable for this purpose.
646 E. Feresenbet et al.

was then coated on clean E-glass fibers by dipping the fiber tow in thesilane mixture for 2min. The tow was removed and allowed to air dryovernight at room temperature, followed by drying for 1 h at 110�C at720kPa in the vacuum oven. The coated fiber was cooled prior to use.Cleaning procedures, as well as coupling agent deposition process onthe glass plate (Fisher Scientific, premium cover glass) and siliconwafers (h111i,Wacker Silitronic Corp., Portland, OR, USA) were con-ducted similar to the glass fibers.
Preparation of SFFT SpecimensThe molds for preparing SFFT specimens were made with silicone
rubber (RTV-664, General Electric, Waterford, NY, USA) following theprocedure described by Drzal and Herrera-Franco [10]. All molds werepostcured at 150�C and rinsed with acetone prior to use. Single fila-ments of coated E-glass fiber were carefully separated from the 30 cmtow. The individual fibers were aligned in the mold cavity via thesprue slots in the center of each cavity. The fibers were temporarilyfixed in place by pressing them onto double-stick tape. Small strips ofdouble-stick tape were placed over each fiber end to hold them in placeuntil each fiber was permanently mounted with 5-min epoxy.
The SFFT specimens were prepared with a diglycidyl ether ofbisphenol-A (DGEBA) epoxy, Epon 828 (Shell), cured using meta-phenylenediamine (m-PDA) (Fluka Chemical). One hundred grams ofDGEBA and 14.5 grams of m-PDA were weighed out in separatebeakers. To lower the viscosity of the resin and melt the m-PDAcrystals, both beakers were placed in a vacuum oven set at 65�C. Afterthe m-PDA crystals were completely melted, the silicone molds con-taining the fibers were placed into another vacuum oven that waspreheated to 75�C at 720kPa for 20min. This last procedure dries themold and minimizes the formation of air bubbles during the curingprocess. At approximately 9min before the preheated molds wereremoved from the oven, the m-PDA is poured into the DGEBA andmixed thoroughly. The mixture was placed into the vacuum oven anddegassed for approximately 7min. After 20min, the preheated moldswere removed from the oven and filled with the DGEBA=m-PDA resinmixture using 10ml disposable syringes. The filled molds were thenplaced into a programmable oven. A cure cycle of 2 h at 75�C followedby 2h at 125�C was used.
Fragmentation TestThe fiber fragmentation tests were conducted in a manner similar
to that described by Holmes et al. [8]. All specimens were tested with a10min delay between strain increments.
Influence of Silane Coupling Agent 647
Characterization of Deposited Silane Layers
Tapping Mode Atomic Force Microscopy (TMAFM)TMAFM was performed with a Dimension 3100 (Digital Instru-
ments, West Grove, PA, USA) scanning probe microscope. Topographicimages of coupling agents deposited on silicon wafers were recorded atambient conditions. Commercial silicon cantilever probes, each with anominal tip radius of 5 nm to 10nm and spring constant in the range of20N=m (values provided by manufacturer) were oscillated at theirfundamental resonance frequencies, which ranged between 250kHzand 350kHz. All TMAFM images were recorded using a free-oscillationamplitude of (60� 2) nm. Sequential scans gave reproducible images.
Contact Angle MeasurementTo characterize the coating, contact angles in deionized water were
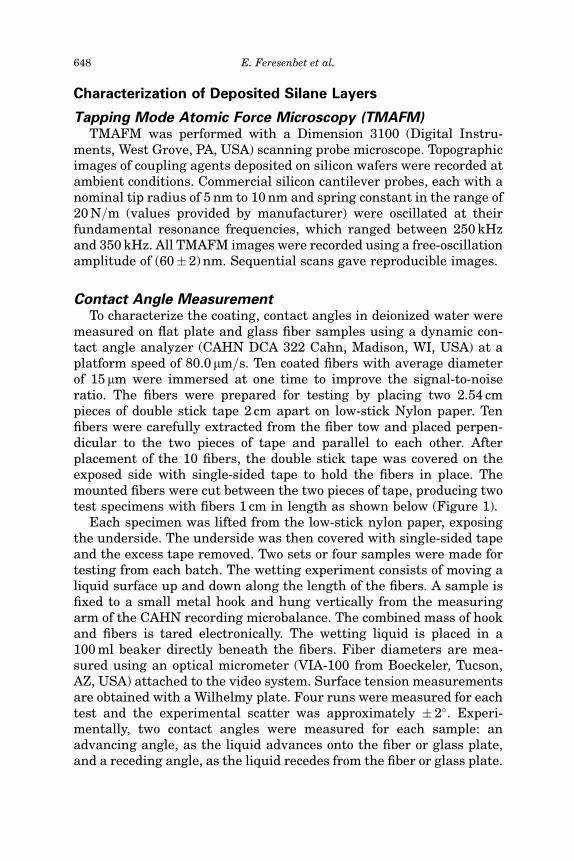
measured on flat plate and glass fiber samples using a dynamic con-tact angle analyzer (CAHN DCA 322 Cahn, Madison, WI, USA) at aplatform speed of 80.0 mm=s. Ten coated fibers with average diameterof 15 mm were immersed at one time to improve the signal-to-noiseratio. The fibers were prepared for testing by placing two 2.54 cmpieces of double stick tape 2 cm apart on low-stick Nylon paper. Tenfibers were carefully extracted from the fiber tow and placed perpen-dicular to the two pieces of tape and parallel to each other. Afterplacement of the 10 fibers, the double stick tape was covered on theexposed side with single-sided tape to hold the fibers in place. Themounted fibers were cut between the two pieces of tape, producing twotest specimens with fibers 1 cm in length as shown below (Figure 1).
Each specimen was lifted from the low-stick nylon paper, exposingthe underside. The underside was then covered with single-sided tapeand the excess tape removed. Two sets or four samples were made fortesting from each batch. The wetting experiment consists of moving aliquid surface up and down along the length of the fibers. A sample isfixed to a small metal hook and hung vertically from the measuringarm of the CAHN recording microbalance. The combined mass of hookand fibers is tared electronically. The wetting liquid is placed in a100ml beaker directly beneath the fibers. Fiber diameters are mea-sured using an optical micrometer (VIA-100 from Boeckeler, Tucson,AZ, USA) attached to the video system. Surface tension measurementsare obtained with a Wilhelmy plate. Four runs were measured for eachtest and the experimental scatter was approximately � 2�. Experi-mentally, two contact angles were measured for each sample: anadvancing angle, as the liquid advances onto the fiber or glass plate,and a receding angle, as the liquid recedes from the fiber or glass plate.
648 E. Feresenbet et al.

Fourier Transform Infrared Spectroscopy (FTIR) AnalysisDiffuse reflectance infraredFourier transform (DRIFT) spectra of the
coated and bare E-glass fibers were collected using a Magna-IR 550(Magna, Madison, WI, USA) Fourier transform spectrometer equippedwith a mercury-cadmium-telluride (MCT) detector (the standardinstrument uncertainty in measuring wave number is� 0.01 cm71, thecm71 were rounded off to the nearest 1 cm71). Nitrogenwas used as thepurge gas. A Praying Mantis diffuse reflectance cell (DRA-100, HarrickScientific Corporation, Ossining, NY, USA) having two hemisphericalmirrors collected the diffuse reflectance spectra. Enough coated E-glassfibers and acetone-cleaned bare E-glass fibers were manually ground tofill the sample dish completely. The filled sample dish was covered by asmoothed-over layer of potassium bromide (KBr) powder (purchasedfrom Aldrich Chemical Co. (Milwaukee, WI, USA) at purity of greaterthan 99%). Single beam reflectance data were ratioed against KBr, andthe Kubelka-Munk function was plotted to obtain diffuse reflectancespectra at a resolution of 4 cm71. The reported spectra are signal aver-aged from 2000 scans between 4000 cm71 to 1200 cm71.
EllipsometryEllipsometry provided a means of determining the film thickness on
the substrate. All measurements were taken on a Discrete Polarization
FIGURE 1 A specimen showing fiber arrangement for contact angle mea-surement.
Influence of Silane Coupling Agent 649
Modulation Automatic Ellipsometer (INOMTECH, Inc., West Hartford,CT, USA) equipped with a He-Ne laser (632.8 nm) operated at an inci-dent angle of 70�. All calculationswere donewith a two-layer step profilemodel assuming fixed refractive indices of 1.42 for the coupling agentson top of the native SiO2 layer. According to Wassermann et al. [11],altering this value by 0.05 resulted in less than a 1 A change in thecalculated thickness of the coating. This refractive index (n) isapproximately that of both liquid and solid straight-chain hydrocarbons(n¼ 1.42 to 1.44) [12]. The oxide thickness on the silicon wafer wasmeasured for each sample and then subtracted from the total thicknessof the oxide plus coupling agent layer to yield the deposited layerthickness. A three-phase model was used for thickness calculationsalong with a software program (COMPEL) developed by Inomtech Inc[13]. Five different spots on each sample were recorded.
Scanning Electron MicroscopyScanning electron microscopy (SEM) was used to study the fracture
surface of glass-fiber-reinforced epoxy composites. The fracture sur-face of the composite was gold-coated by a SEM coating sys-tem (Polaron, Agawam, MA, USA). A total gold film thickness of 200 Awas deposited on the fracture surfaces to avoid accumulation of elec-trical charge on the surface while performing SEM examination. AJEOL JSM-5300 SEM scanning microscope (Jeol, Peabody, MA, USA)was used to examine the fracture surfaces at 50�magnification.
RESULTS AND DISCUSSION
EllipsometryIt is well known that hydrolysis of alkoxysilanes in an aqueous
environment results in the formation of hydroxysilane compounds. Toverify layer thickness, ellipsometry measurements were carried out,giving values of (19� 3) A for all samples (where uncertainty is takenas one standard deviation). Table 1 summarizes the thickness data ofpure and mixed coupling agents deposited on silicon wafer. It is notcertain at this point why the aqueous deposition process producesmultilayer films. Nucleophilic substitution of alkoxy groups by theamine group, which will connect the layers to form the multilayer,cannot be a plausible mechanism, because alkoxysilanes are resistantto nucleophilic attack of the primary amines [14]. It has been proposedthat alkoxysilane and chlorosilane reagents hydrolyze first to formhydroxysilane compounds and then dehydrate to form siloxane bridgesnot only between the hydroxysilanes and the hydroxyl groups onthe substrate [15, 16], but with each other. In this mechanism, the
650 E. Feresenbet et al.

trialkoxysilane compound naturally has a higher chance of forming athree-dimensional network leading to the formation of thick films. Theellipsometry results indicate that the thickness of these pure andmixed deposited films, correspond to multilayer. The measured valuessupport multilayer coverage. The ellipsometric data taken on themixed films vary significantly from site to site, resulting in the largescatter observed in the thickness data. This suggests that the varia-tion could result from uneven coverage or island formation of couplingagent on the substrate.
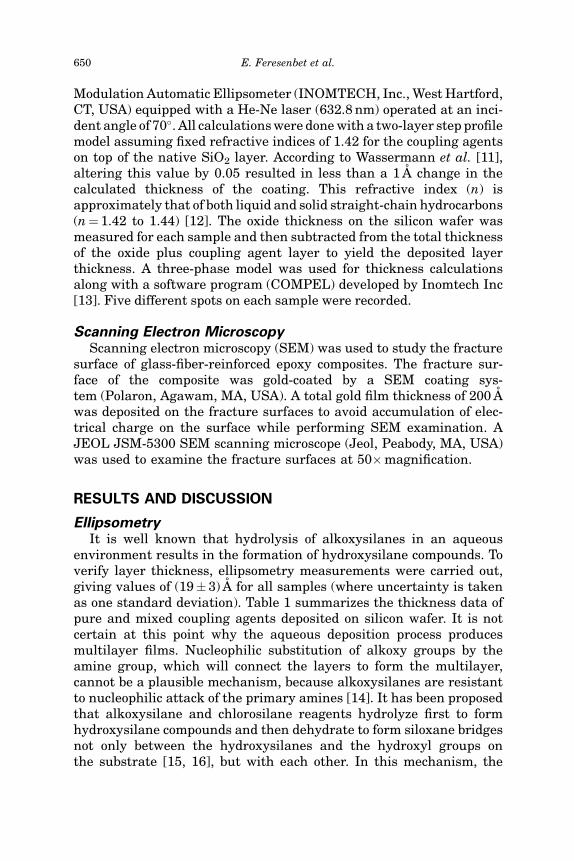
Microscopic MethodsTapping mode atomic force microscopy (TMAFM) under ambient
conditions was used to examine the morphology of a 50=50 mixture ofAPS=PTMS on silicon wafer. Figure 2a shows a three-dimensionaltopographic TMAFM image for a 50=50 mixture of APS and PTMS filmon silicon wafer. There are islands of elevated regions surrounded bydepressed regions. The formation of noncontinuous structures may bethe result of phase separation of PTMS from APS in aqueous solution,caused by the difference in hydrophilicity of the molecules. Figure 2bshows a three-dimensional topographic TMAFM image for bare siliconwafer as a control specimen.
FTIR CharacterizationIR spectroscopy has been commonly employed to characterize the
silane coupling agent coating on inorganic oxides. Since it is difficult toanalyze inorganic oxides on glass surfaces using transmission orattenuated total reflectance, a number of studies have relied on DRIFT(diffused reflectance infrared Fourier transform spectroscopy) toanalyze E-glass surface coatings. The DRIFT spectra of the neat APS,E-glass fiber coated with 4.5� 1072mol=L APS and bare glass fiber inthe region 4000�1200 cm71 are shown in Figure 3. Untreated E-glass
TABLE 1 Thickness of Coupling Agent Layer on Silicon Wafers
Coupling agent concentration(4.5�1073mol=L)
Thickness of coupling agents coated onsilicon wafers, A*
PTMS (0mol% amine) 20� 4APS=PTMS (50mol% amine ) 18� 5APS (100mol% amine) 19� 4
*Number after � is one standard deviation from the mean and is taken as the stan-dard uncertainty.
Influence of Silane Coupling Agent 651
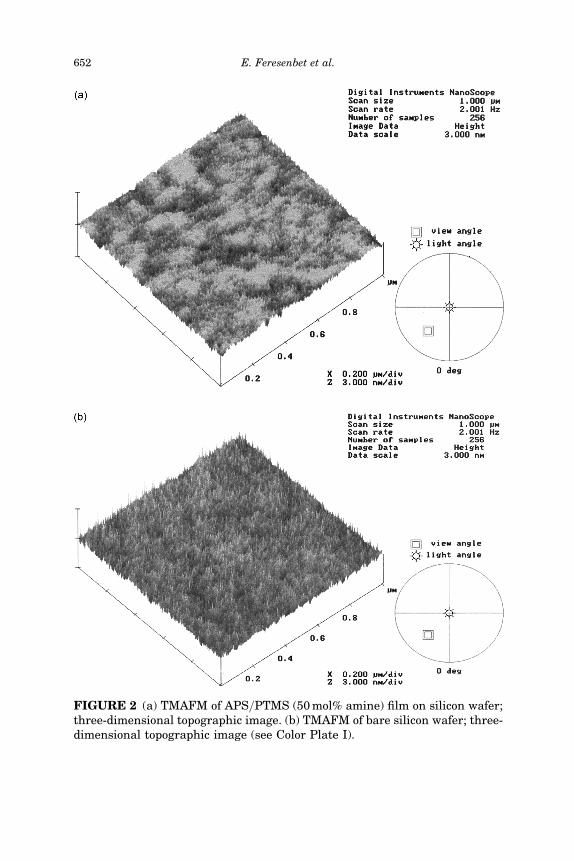
FIGURE 2 (a) TMAFM of APS=PTMS (50mol% amine) film on silicon wafer;three-dimensional topographic image. (b) TMAFM of bare silicon wafer; three-dimensional topographic image (see Color Plate I).
652 E. Feresenbet et al.

fiber shows a broad Si-OH peak at 3590 cm71 and the first overtone ofthe boron-oxygen stretching vibrations at 2680 cm71. The neat APSdisplays methylene stretching modes of the propyl chain at 2926 cm71
and 2858 cm71. This spectrum also shows a distinct peak at 1595 cm71
which can be assigned to the NH2 deformation mode. In contrast,the condensed APS on E-glass fiber contains broad bands at (3500 to2800) cm71and (1600 to 1300) cm71. The broad band between3500 cm71and 2800 cm71 is due to CH2 (stretching), NH2 (stretching),and intermolecularly hydrogen-bonded Si-OH groups [17].
Figure 4 shows the DRIFT spectra with increasing concentration ofsilane solutions from 4.5� 1073mol=L to 4.5� 1072mol=L APS coatedon glass fiber. The treated E-glass fiber DRIFT spectra are subtractedfrom the bare E-glass fiber spectrum to relate the intensity of the NH2
peak at 1600 cm71 to the solution concentration sorbed on the glasssurface. The DRIFT spectrum of 4.5� 1073mol=L APS shows a minorband at 3550 cm71 indicating the presence of free Si-OH peak(Figure 5) [17]. However, the absence of the peak at higher concentra-tions suggests complete coverage of the glass fiber surface at thesehigher concentrations.
FIGURE 3 (a) DRIFT spectrum of neat APS; (b) DRIFT spectrum of APS(4.5� 1073mol=L) treated E-glass fiber with a KBr overlayer; (c) DRIFTspectrum of acetone-cleaned glass fiber with KBr overlayer.
Influence of Silane Coupling Agent 653

FIGURE 4 DRIFT spectrum of APS after subtraction of E-glass fiber, withincreasing concentration APS (a) 4.5� 1073mol=L, (b) 1.1�1072mol=L, (c)2.2� 1072mol=L, and (D) 4.5� 1072mol=L.
FIGURE 5 Expanded view of APS-treated E-glass fiber from 3750�3400 cm71, (a) bare glass fiber, (b) 4.5� 1073mol=L, and (c) 4.5� 1072mol=L.
654 E. Feresenbet et al.

Contact Angle MeasurementsDepending on the selection of coupling agent, the coupling agent
coated glass fiber can be involved in chemical bond formation with thepolymer matrix. During deposition of coupling agent, the polar groupson the coupling agent can react with the hydroxyl groups present onthe glass surface, as indicated by Ishida [5, 15]. Figure 6 shows thewater contact angle of coupling agent coated on glass slides and glassfibers. As would be expected, the surface of PTMS coated fiber is veryhydrophobic, while that of the APS coated fiber is less hydrophobic.For the mixed APS and PTMS coupling agents coated on glass sur-faces, the contact angle measurements in water are intermediatebetween pure APS and pure PTMS. These data are in good agreementwith the literature [18]. It appears from the results that increasing theportion of functional groups in solution increases the portion of func-tional (polar) groups on the surface. In fact, for pure APS deposited onglass fiber, a water contact angle of 73� indicates that the surface ismore hydrophilic than pure PTMS deposited on glass surface. Toaddress the question of bonding of coupling agent with the epoxy andthe dependence of bonding on the concentration of amine groups in themixture of the coupling agent mixture, SFFTs were performed.
FIGURE 6 Contact angles for coatings of APS, and PTMS mixtures on glassfiber and glass plate (error bar represents one standard deviation from themean and is taken as the standard uncertainty).
Influence of Silane Coupling Agent 655

SFFTs Data AnalysisThe bonding between the fiber and matrix for different coupling
agent compositions has been quantitatively compared by measuringthe average fragment length and determining the interfacial shearstrength from SFFT data. The average fragment length is plotted as afunction of coupling agent composition in the solution mixture inFigure 7. In this figure, the average fragment length decreases withincreasing APS concentration. Since APS bonds covalently to theepoxy resin matrix during curing [19], this data indicates that cova-lent bonding increases fiber-matrix interfacial adhesion. This trendparallels the trend in the contact angle measurements performed inthe previous section (see Figure 6), where the hydrophobic character ofthe deposited silane decreases with increasing APS concentration.
Figure 8 shows the E-glass fiber fragment length distribution(frequency) for APS and PTMS sized fiber composites at saturation. Thefragment lengths were measured after relaxing the saturated SFFTspecimen to the unstressed state. For the aggregated histogram ofPTMS-coated specimens, the fragment length distribution at saturationexhibited a positive skewness (skewness=std. error¼ 0.667=0.178¼3.74). In contrast, the skewness ratio for the aggregated histogram of
FIGURE 7 Average fragment length for E-glass fibers coated with APS andPTMS mixture by aqueous deposition process (error bar represents onestandard deviation from the mean and is taken as the standard uncertainty).
656 E. Feresenbet et al.
APS-coated specimens was less (skewness=std. error¼ 0.360=0.185¼1.94). Skewness characterizes the extent of asymmetry in a distributionaround its mean by quantifying the degree to which the asymmetric tailextends toward more positive values.
The kurtosis ratio in the aggregated histogram of PTMS and APSspecimens are 70.27 and 71.98, respectively. Kurtosis characterizesthe relative peakedness or flatness of a distribution compared with thenormal distribution. Negative kurtosis indicates a relatively flat dis-tribution. Normality of the distribution is typically rejected if the ratioof either statistic to its standard error is less than 72 or greater thanþ 2 [20]. Therefore, 100mol% APS-treated specimens yield fragmentdistributions within the limits of normality, whereas the fragmentdistributions from 100mol% PTMS-treated specimens exhibit positiveskewness. These results show an effect similar to Holmes et al. [8] intheir previous work on the effect of strain rate on interfacial shearstrength measurements.
Figure 9 shows the result for IFSS as a function of coupling agentcomposition in the mixture. The IFSS between the epoxy matrix andE-glass fibers treated with mixed APS and PTMS appears to increasesharply as the composition of APS component in the mixture increasesfrom (25 to 50)mol% APS.
FIGURE 8 Average fragment length distribution at saturation for E-glassfibers deposited with APS and PTMS by aqueous deposition process.
Influence of Silane Coupling Agent 657
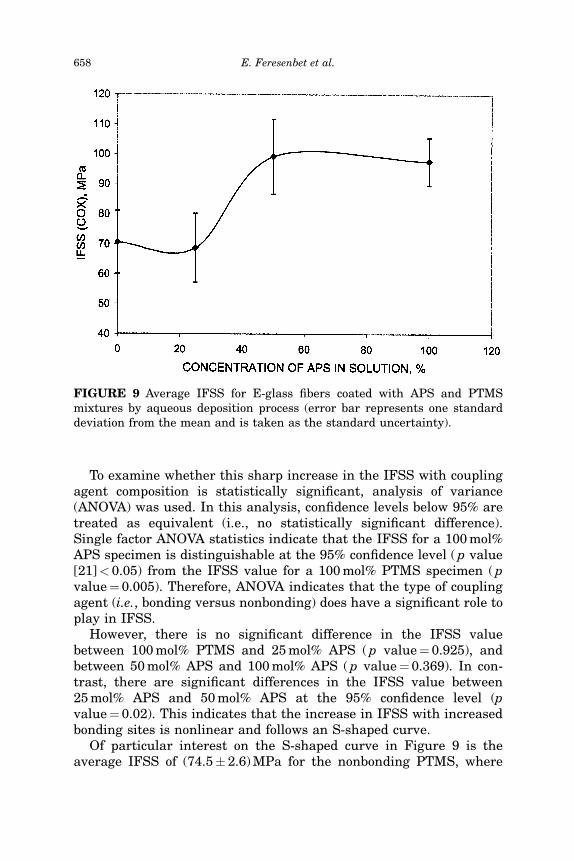
To examine whether this sharp increase in the IFSS with couplingagent composition is statistically significant, analysis of variance(ANOVA) was used. In this analysis, confidence levels below 95% aretreated as equivalent (i.e., no statistically significant difference).Single factor ANOVA statistics indicate that the IFSS for a 100mol%APS specimen is distinguishable at the 95% confidence level (p value[21]< 0.05) from the IFSS value for a 100mol% PTMS specimen (pvalue¼ 0.005). Therefore, ANOVA indicates that the type of couplingagent (i.e., bonding versus nonbonding) does have a significant role toplay in IFSS.
However, there is no significant difference in the IFSS valuebetween 100mol% PTMS and 25mol% APS (p value¼ 0.925), andbetween 50mol% APS and 100mol% APS (p value¼ 0.369). In con-trast, there are significant differences in the IFSS value between25mol% APS and 50mol% APS at the 95% confidence level (pvalue¼ 0.02). This indicates that the increase in IFSS with increasedbonding sites is nonlinear and follows an S-shaped curve.
Of particular interest on the S-shaped curve in Figure 9 is theaverage IFSS of (74.5� 2.6)MPa for the nonbonding PTMS, where
FIGURE 9 Average IFSS for E-glass fibers coated with APS and PTMSmixtures by aqueous deposition process (error bar represents one standarddeviation from the mean and is taken as the standard uncertainty).
658 E. Feresenbet et al.
the coupling agent is not covalently bonded to the epoxy matrix.These results parallel previously reported data by Hunston et al. [7],where n-octadecyl trichlorosilane was used for the nonbonding silanecoupling agent. Interestingly, dynamic contact angle measurementsof the fiber surfaces coated with 100% nonbonding silane couplingagent indicated complete hydrophobic character. Despite the absenceof covalent bonding, the IFSS value of (74.5� 2.6) MPa indicates thatthere is actually a significant interaction between the matrix andfiber.
Sharpe [22] and Drzal [23] have ascribed adhesion at the fiber-matrix interface of composites to the following factors: (1) mechanicalinterlocking, (2) physicochemical interactions, (3) chemical interac-tion, and (4) mechanical deformation of the fiber-matrix interphaseregion. The magnitude of fiber-matrix adhesion was quantifiedmathematically as the sum of the first three factors by Nardin andWard [24]. Since the deformation rate is the same for all samples andcovalent bonding is ‘‘formally’’ eliminated because of the absence offunctional groups on the 100mol% PTMS silane coupling agent layers,fiber-matrix adhesion in the 100mol% PTMS interface is attributed tomechanical interlocking and physicochemical interactions.
Parallel research by the authors of this paper [25] showed that thelevel of adhesion observed with the solvent-deposited nonbondingpropyltrichloro silane (PTCS) interface is due primarily to mechanicalinterlocking, with a small contribution arising from physicochemicalinteractions. For the 100% bonding aminopropyltrichloro silane(APTCS) (IFSS¼ (98� 10)MPa) silane deposited on E-glass fibersunder solvent conditions the IFSS increased by an additional 31%relative to the nonbonding solvent interface. This research indicatesthat the level of adhesion observed with the 100% APS silane couplingagent interface is enhanced by the amine group on E-glass fibersurface.
This improved adhesion was observed by Ahagon and Gent [6], whoshowed that when glass plates are treated with vinyl and ethyl silanecoupling agent, the strength of adhesion between glass plates andpolybutadiene elastomer increased as the composition of the vinylcoupling agent in the coupling agent mixture increased. The non-bonding component is ethyl silane and the bonding component is vinylsilane. The bonding component reacts with the unsaturated poly-butadiene, to form a covalent link.
The failure mode of a composite at the fiber-matrix interface can becharacterized by studying the debond region of fibrous composite afterfiber fracture. A plot of debond length as a function of increasingconcentration of APS is shown in Figure 10. The justification for
Influence of Silane Coupling Agent 659

FIGURE 10 Average debond length for E-glass fibers coated with APSand PTMS mixture by aqueous deposition process (error bar representsone standard deviation from the mean and is taken as the standard un-certainty).
FIGURE 11 The darkened regions associated with the fiber breaks in APS-coated glass fiber epoxy composite.
660 E. Feresenbet et al.
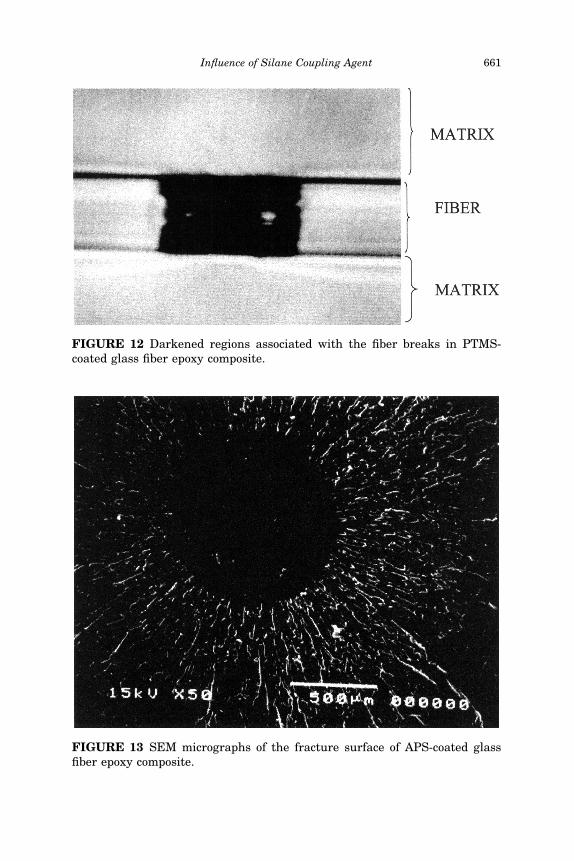
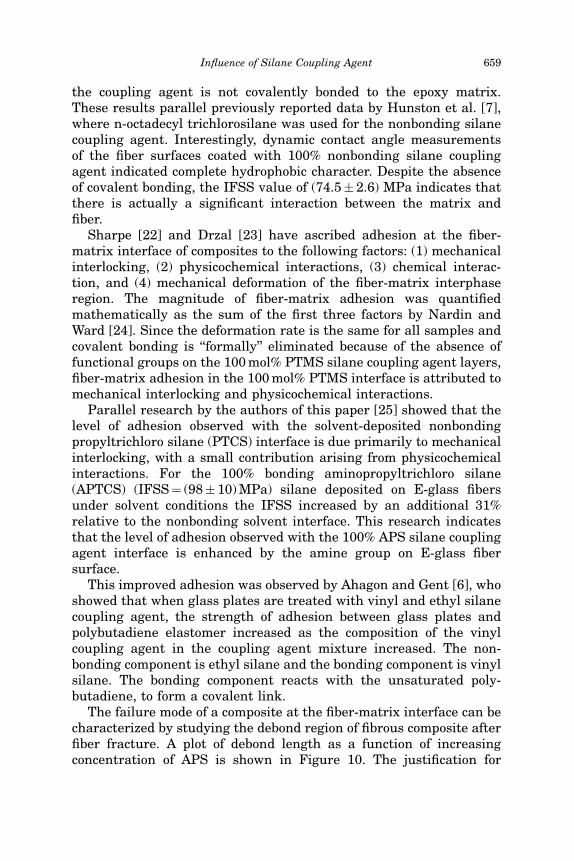
FIGURE 12 Darkened regions associated with the fiber breaks in PTMS-coated glass fiber epoxy composite.
FIGURE 13 SEM micrographs of the fracture surface of APS-coated glassfiber epoxy composite.
Influence of Silane Coupling Agent 661

delineating these darkened regions as consisting of matrix materialdebonded from the fiber is reported elsewhere [26]. The debond lengthwas found to decrease as a function of increasing concentration of APSin the coupling agent mixture. To understand the debonding failuremechanism in the composite, the regions associated with the fiberbreaks in coupling agent-coated E-glass fiber=epoxy composite werecarefully analyzed. Figures 11 and 12 show the darkened regionsassociated with the fiber breaks in APS and PTMS coated system,respectively. In Figure 11, a matrix crack is formed perpendicular tothe fiber axis, in addition to fiber-matrix debond region when the fiberfractures. In Figure 12, the energy generated by the fracture of theglass fiber is absorbed by fiber-matrix debonding (i.e., no matrix crackformation).
In this study, the bonding between fiber and matrix for differentcoupling agent compositions has been qualitatively compared bycharacterizing the mirror zone of the fractured surface of the glassfiber epoxy composite. The work of Drzal et al. [27] has shown that the
FIGURE 14 SEM micrographs of the fracture surface of APS=PTMS-coatedglass fiber epoxy composite.
662 E. Feresenbet et al.

size of the mirror zone depends on the brittleness=ductility of thematerial. Consistent with Drzal’s results the 100mol% APS interfaceyields a larger mirror zone than the 50mol% APS interface (seeFigures 13 and 14). For nonbonding coupling agent PTMS, the mirrorzone is the smallest at the interface region, and it is noticed at the edgeof the composite (Figure 15). These results qualitatively indicate thatthe degree of bonding may have a profound influence on the failuremode of fiber-matrix interface during fiber fracture.
CONCLUSIONS
The following conclusions can be drawn from our work:
1. TMAFM and Ellipsometry were used to characterize the mor-phology and thickness of coupling agent mixtures deposited on thesilicon wafers, respectively, and we found that the thickness of thedeposited films correspond to multilayers.
FIGURE 15 SEM micrographs of the fracture surface of PTMS-coated glassfiber epoxy composite.
Influence of Silane Coupling Agent 663

2. Using DRIFT analysis we found that E-glass fibers are partiallycovered at coupling agent concentrations lower than 4.5�1072mol=L.
3. Contact angle measurements show an increase in the polarity ofglass surface as the APS component in the mixture is increased.
4. SFFT results indicate that the IFSS increases as the compositionof the bonding coupling agent increases in the solution mixture.For 100% APS-coated glass fiber epoxy composite, matrix crackswere found to be formed in addition to fiber-matrix debonding.
5. The type of coupling agent and the composition of coupling agentmixture have been shown to influence the adhesion between glassfiber and epoxy matrix.
REFERENCES
[1] Moussawi, H. A., Drown, E. K., and Drzal, L. T., Polym. Composites, 14, 195�200(1993).
[2] Koenig, J. L., ‘‘FTIR Studies of Interfaces.’’ In: Silanes, Surfaces and Interfaces,Leyden, D. E., Ed. (Gordon & Breach Science Publishers, New York, 1986), pp.43�57.
[3] Wu, H. F., Dwight, D. W., and Huff, N. T., Composite Sci., 57, 975�983 (1997).[4] Nishioka, G. M., J. Non-Cryst. Solids, 120, 102�107 (1990).[5] Ishida, H., and Suzuki, Y., Composite Interfaces, 14, 317�327 (1986).[6] Ahagon, A., and Gent, A., J. Polym. Sci., 13, 1285�1300 (1975).[7] Hunston, D. L., Macturk, K., Schultheisz, C., Holmes, G., McDonough, W., and
Schutte, C., Proc. EURAD ’96, European Adhesion Conf., Cambridge, England,Sept. (1996), pp. 1�5.
[8] Holmes, G. A., Peterson, R. C., Hunston, D. L., McDonough, W. G., and Schutte,C. L., ‘‘The Effect of Nonlinear Viscoelasticity on Interfacial Shear Strength Mea-surements.’’ In: Time Dependent and Nonlinear Effects in Polymers and Compo-sites, R. A. Schapery, Ed. (ASTM,STP1357, 2000)WestConshocken, PA, pp. 98�117.
[9] Based on report provided by Evans East, (Gaithersburg, MD, 1996) and contractedby NIST.
[10] Drzal, L. T., and Herrera-Franco, L. P. J., ‘‘Composite Fiber-Matrix Bond Test.’’ In:Engineered Materials Handbook: Adhesives and Sealants (ASM International,Metals Park, OH, 1990), pp. 392�405.
[11] Wassermann, S. R., Tao, Y. T., and Whitesides, G. M., Langmuir, 5, 1074�1087(1989).
[12] Weast, R. C., CRC Handbook of Chemistry and Physics (CRC Press, Inc., Cleveland,OH, 1975).
[13] (Inomtech Inc., West Hartford, CT).[14] Corriu, R. J. P., and Guerin, C., Adv. Organmet. Chem., 20, 265�268 (1982).[15] Plueddemann, E. P., Silane Coupling Agents (Plenum Press, New York, 1991).[16] Ulman, A., Chem. Rev., 96, 1533�1554 (1996).[17] Culler, S. R., Ishida, H., and Koenig, J. L., Appl. Spectroscopy, 38(1), 1�7 (1984).[18] Holmes, G. A., Cheng, J. F., Wu, B., Mao, G., and Peterson, R. C., Proc. 13th Annual
Technical Conference on Composite Materials (Baltimore, Maryland, 1998),pp. 400�415.
664 E. Feresenbet et al.

[19] Wang, D., and Jones, F. R., Composite Science and Technology, 50, 215�228 (1994).[20] SPSS Base 8.0 Applications Guide (SPSS Inc., Chicago, 1998), pp. 27�28.[21] Ott, R. L., An Introduction to Statistical Methods and Data Analysis (Duxibury
Press, Belmont, CA, 1993), pp. 230�237.[22] Sharpe, L. H., J. Adhesion, 4, 51�64 (1972).[23] Drzal, L. T., ‘‘Fiber-Matrix Interphase Structure and Its Effect on Adhesion and
Composite Mechanical Properties.’’ In: Controlled Interphases in Composite Mate-rials, H. Ishida, Ed. (Elsevier Press, New York, 1990), pp. 309�320.
[24] Nardin, M., and Ward, I. M., Materials Science and Technology, 3, 814�819 (1987).[25] Holmes, G. A., Feresenbet, E., and Raghavan, D., Composite Interfaces, accepted.[26] Holmes, G., Peterson, R. C., Hunston, D. L., and McDonough, W. G., Polym.
Composites, 21(3), 450�465 (2000).[27] Al-Moussawi, H., Drown, E. K., and Drzal, L. T., Polym. Composites, 14(3), 195�200
(1993).
Influence of Silane Coupling Agent 665
Related Documents


![S. · The surface treatment of glass fibers with silane coupling agents has enhanced the performance of the fiber reinforced plastics [1,2]. The interaction of the silane coupling](https://static.cupdf.com/doc/110x72/5e7390642abe4c5a556812e5/s-the-surface-treatment-of-glass-fibers-with-silane-coupling-agents-has-enhanced.jpg)