The Influence of Services cape, Discount, Brand Image and Service Quality on Purchase Decisions in Starbucks Tangerang, Indonesia Enrico and John Tampil Purba Department of Management Faculty of Economics and Business Universitas Pelita Harapan, Tangerang-15811, Indonesia Corresponding author: [email protected] Sidik Budiono Department of Management Faculty of Economics and Business Universitas Pelita Harapan, Tangerang-15811, Indonesia [email protected] Wilson Rajagukguk Department of Management Faculty of Economics and Business Universitas Kristen Indonesia, Jakarta, Indonesia [email protected] Abstract The dynamics of generational consumer behavior in this millennium are very diverse, so this study aims to see the impact of a well-designed servicescape on purchasing decisions at Starbucks Benton. This impact is assessed from discounts, brand image, service quality, purchases made by Starbucks Benton on the intended product decision. Data collection will be carried out by distributing questionnaires to Starbucks customers, both by online using the Google application technology. Determination of the sample according to the theoretical criteria suggested. Data processing and analysis techniques in this paper used the SEM-AMOS statistical applications. As a conclusion, this study proves that the discount provided by Starbucks Benton influences purchasing decisions. On the other hand, the Starbucks brand image has a consumer appeal for purchasing decisions, that cape service is considered by consumers as another thing that influences purchasing decisions and the quality of service when visiting a place of purchase at Starbucks Benton Tangerang influences the purchasing decisions because of the advantages of different services and the convenience environment of the places with greening area. Keywords Servicescape, Discount, Brand Image, ServQual, Purchase Decisions 1. Introduction Competition in the business world around the world is getting higher and tighter, every company is always trying to get market share which will always grow every day (Primahendra et al., 2021) (Hikaru et al., 2021). Consumer purchases are unique because everyone's preferences for a product are different (Juliana et al., 2021). This is influenced by many factors including Discounts, Brand Image, and Servicescape (physical environment) (Adirinekso et al., 2020) (Indra et al., 2019) . The retail business in Indonesia has developed quite rapidly in recent years with various forms and types. Along with the rapid development of this retail business, including the family business (Tan et al., 2019) do the competition in the retail or retail marketing sector is increasing (Indramawan et al., 2018). The development of the times that have become modern, something new has been present in human life. Advanced technology makes people experience convenience in various fields (Budiono, Purba, Adirinekso, et al., n.d.). An example is the interaction that can be done through social media, but not only that, because social media has even become a place to share stories with friends or other users. This culture has even made a new habit when eating or drinking in a place by uploading photos of food and drinks to social media pages (Alfirahmi, 2019). Proceedings of the International Conference on Industrial Engineering and Operations Management Bangalore, India, August 16-18, 2021 © IEOM Society International 85

Welcome message from author
This document is posted to help you gain knowledge. Please leave a comment to let me know what you think about it! Share it to your friends and learn new things together.
Transcript
The Influence of Services cape, Discount, Brand Image and Service Quality on Purchase Decisions in Starbucks
Tangerang, Indonesia
Enrico and John Tampil Purba Department of Management Faculty of Economics and Business
Universitas Pelita Harapan, Tangerang-15811, Indonesia Corresponding author: [email protected]
Sidik Budiono
Department of Management Faculty of Economics and Business Universitas Pelita Harapan, Tangerang-15811, Indonesia
Wilson Rajagukguk Department of Management Faculty of Economics and Business
Universitas Kristen Indonesia, Jakarta, Indonesia [email protected]
Abstract
The dynamics of generational consumer behavior in this millennium are very diverse, so this study aims to see the impact of a well-designed servicescape on purchasing decisions at Starbucks Benton. This impact is assessed from discounts, brand image, service quality, purchases made by Starbucks Benton on the intended product decision. Data collection will be carried out by distributing questionnaires to Starbucks customers, both by online using the Google application technology. Determination of the sample according to the theoretical criteria suggested. Data processing and analysis techniques in this paper used the SEM-AMOS statistical applications. As a conclusion, this study proves that the discount provided by Starbucks Benton influences purchasing decisions. On the other hand, the Starbucks brand image has a consumer appeal for purchasing decisions, that cape service is considered by consumers as another thing that influences purchasing decisions and the quality of service when visiting a place of purchase at Starbucks Benton Tangerang influences the purchasing decisions because of the advantages of different services and the convenience environment of the places with greening area. Keywords Servicescape, Discount, Brand Image, ServQual, Purchase Decisions 1. Introduction Competition in the business world around the world is getting higher and tighter, every company is always trying to get market share which will always grow every day (Primahendra et al., 2021) (Hikaru et al., 2021). Consumer purchases are unique because everyone's preferences for a product are different (Juliana et al., 2021). This is influenced by many factors including Discounts, Brand Image, and Servicescape (physical environment) (Adirinekso et al., 2020) (Indra et al., 2019) . The retail business in Indonesia has developed quite rapidly in recent years with various forms and types. Along with the rapid development of this retail business, including the family business (Tan et al., 2019) do the competition in the retail or retail marketing sector is increasing (Indramawan et al., 2018). The development of the times that have become modern, something new has been present in human life. Advanced technology makes people experience convenience in various fields (Budiono, Purba, Adirinekso, et al., n.d.). An example is the interaction that can be done through social media, but not only that, because social media has even become a place to share stories with friends or other users. This culture has even made a new habit when eating or drinking in a place by uploading photos of food and drinks to social media pages (Alfirahmi, 2019).
Proceedings of the International Conference on Industrial Engineering and Operations Management Bangalore, India, August 16-18, 2021
© IEOM Society International 85
The company has carried out various kinds of marketing strategies to win market competition, one of which is a promotion strategy. Sales promotion is used as a differentiator for new products and pre-existing brands. For new products, marketers provide samples, coupons, and refinances. As for products that have long been using discounts. According to Tjiptono, discounted prices can also be an indicator of quality where a high quality product will dare to be priced at a high price too. Prices can influence consumers in making decisions to purchase a product (Harahap, 2015). Another definition of discount is a direct price reduction for a purchase within a certain period of time, giving discounts to consumers for the purpose of appreciating customer response (Adirinekso et al., n.d.). The demand for a product that is increasingly quality makes companies engaged in their fields to improve the quality of their products in order to maintain the Brand Image of their products (Surjana et al., n.d.). Here the brand has distinctive characteristics, and these distinctive characteristics are what differentiate one product from another, even though the product is the same (Budiono, Purba, & Adirinekso, n.d.). Various efforts have been made by the company in maintaining their brand image, including technological innovation, superiority of the product, competitive pricing and targeted promotion (Prahiawan et al., 2021) (Noviantoro et al., 2020)(Budiono, Purba, Adirinekso, et al., n.d.). The better the brand image of the products the company sells, the better it will have an impact on consumer purchasing decisions. Purchasing decisions by consumers are decisions that involve perceptions of quality, value and price and also their digital marketing capability for the society (Radnan & Purba, 2018) (Purba et al., 2020). Consumers not only use price as an indicator of quality but also as an indicator of the costs sacrificed in exchange for the product or the benefits of the product (Djakasaputra et al., 2020). This is where we see the extent to which brands can influence consumer judgment with the Brand Image of the product. Many things have to do with price which is why consumers choose a product to have. This product is because they really want to feel the value and benefits of the product, because they see the opportunity to have the product at a lower price than usual so that it is more economical, because there is an opportunity to get a gift from purchasing the product, or because the consumer wants to be considered that he knows a lot about the product and want to be considered loyal (Purba et al., 2020). Consumers choose prices have two main roles in the buyer's decision-making process, namely the role of allocation and the role of information (Purba et al., 2018) (Purba & Tan, 2018). The allocation role of price is a function of price in helping buyers decide how to obtain the highest expected benefit or utility (Kim et al., 2018) (Purba, 2014) based on their purchasing power (Sutia et al., 2020). Thus the price can help buyers decide how to allocate their purchasing power to various types of goods or services. The buyer compares the prices of the various alternatives available, then decides on the desired allocation of funds (Suk et al., 2019). One of the most common uploads is uploading photos featuring coffee drinks, but there are other things that can be seen from this culture (Widjaja et al., 2019). By doing this, it means that both the interior and exterior designs of the business premises are beautiful and consumers trust the brand of the coffee beverage company (Budiono, Purba, Adirinekso, et al., n.d.). Because social media users will instead upload something that is considered valuable and what is liked (Ayun, 2015). Not only young people who often gather at places to eat and drink, it turns out that this culture has entered the elderly as well (Alfirahmi, 2019). Because of this, the food & beverage business has become the spotlight of entrepreneurs to become activities that can generate more money because it is booming in society (Prahiawan et al., 2021) (Steven et al., 2021). This situation can be used by entrepreneurs if they use the right strategy to build the food & beverage business shall be maintain effectively (Adirinekso et al., n.d.) (Budiono, Evanson, & Purba, n.d.). Because the behavior of consumers who want to gather in a cozy place and can be used as a place to take pictures can be an indicator of the success of opening a food and beverage business. One company that has successfully seen this opportunity is Starbucks, which is busy with buyers every day, located in Cikarang in 2015. Even up to 2020, it has more than 100 branches in various regions (Ayu, 2017). By paying attention to the aspects of the servicescape or physical environment that is able to make consumers feel comfortable and safe both from outside or from within so that buyers can be interested and confident to make purchases (Budiono, Purba, & Adirinekso, n.d.). The right combination can be done by discounting or discounting the price given by the company (Baskara, 2016) so that other menu menus can be better known and attract buyers' attention because they are given a price reduction so that prices will be cheaper than usual, this can attract consumers to make purchases (Adirinekso et al., n.d.). Purchasing decisions are also influenced by brand image which is the impression of consumers who have bought the product (Tjiptono, 2015). So that the products offered must have a good image so that consumers can without
Proceedings of the International Conference on Industrial Engineering and Operations Management Bangalore, India, August 16-18, 2021
© IEOM Society International 86
hesitation buy their products so that people will have a sense of confidence and this will form the image of the food & beverage company brand 2. Literature Review 2.1 Servicescape The physical environment of a place, as well as other supporting buildings, will be an experience for consumers who have visited or want to visit. If you want to visit, look at the servicescape from the outside of the service environment, such as the design you have, whether it uses architecture and aesthetics in order to create a cozy atmosphere even though it has only been seen from the outside (Siswanto and Setiawan, 2015). When it looks beautiful from the outside, the inside must also be combined so that it has a harmonious relationship with the design from the outside so that consumers can like it and feel comfortable when entering the service environment. By creating a sense of interest only with the design and design elements used so that consumers want to visit (Purba & Panday, 2012) (Purba, 2014). It can be said that servicescape is the perception of quality that is owned by consumers, because the physical environment that is owned by a service forms a memory that will be used in the consumer's experience which will cause a response (Purba, 2015) (Nadeak & Tampil, 2014). Such as the response to the physical environment that is felt to have been fulfilled because the expectations of consumers have been fulfilled and the response is to buy back or even subscribe because they feel confident and comfortable (Purba & Tan, 2016) (Rizky Y.S Emor, 2015). By using servicescape, as an owner or management you will be able to see the quality of service and the results of the quality of services provided, there are 4 roles of servicescape, namely (Ayunisa, 2016):
1. As a packaging or as a physical indicator so that service packaging can be illustrated in the minds of consumers so that it is easy to understand.
2. Become a facilitator to facilitate the services provided in a service environment such as a floor plan designed to facilitate consumers and also servants in order to create activities and movement of efficient services.
3. Helping the explanation process to employees and consumers so that communication can be about habits and services can be communicated properly
4. Being a differentiator from other companies in order to compete so that it has its own characteristics 2.2 Discount This is a price cut made by the seller to the buyer, by cutting the price, the buyer will be happy and interested in purchasing the product offered (Budiono, Purba, & Adirinekso, n.d.) (Baskara, 2018). Even though it is only the total payment that is reduced, there are several things that need to be considered, because consumers may think that a low price means poor quality and vice versa (Rizky Y.S Emor, 2015) (Budiono, Purba, Adirinekso, et al., n.d.). The use of this discount must be used wisely so that there is no misunderstanding between the seller and the buyer. There are 4 types of discount (Kotler, 2016) (Purba et al., 2018) (Purba et al., 2019):
1. Direct discount, which is a discount given directly without a minimum purchase 2. Quantity discount, namely cutting the price when making purchases in large quantities 3. Functional discount, obtained when there are certain functions that are mutually correlated 4. Seasonal discounts, occur when entering a certain season for products produced, such as the season for
bananas and others. Then the exact price will be discounted because there is an increase in production. 2.3 Brand Image Brand image or brand image is an important part of the company because it is a reflection of the company's products (Diputra & Yasa, 2021) (Qomariah & Prabawani, 2020). Become a description of the products it produces to consumer confidence so that it is stored in memory of the customers, and become the good preference of them (Tjiptono, 2016) (HASHIM et al., 2018). In addition to being a consumer trust in choosing products, brand image is also a hallmark of other companies' brands (Steven et al., 2021) (Adirinekso et al., n.d.). Brand image consists of 3 supporting components, namely (Venessa and Arifin, 2017):
1. Image of the company that produces the product. 2. Image of consumers who use the product. 3. Product image produced by the company.
Proceedings of the International Conference on Industrial Engineering and Operations Management Bangalore, India, August 16-18, 2021
© IEOM Society International 87
2.4 Purchase Decisions Before making a transaction, it will go through a product quality and price value then the next going to purchase decision phase (Budiono, Purba, & Adirinekso, n.d.) (Surjana et al., n.d.) . In the era of digital world they check product and compare them to other similar through web (Purba & Panday, 2015) (Kumar et al., 2020) (Purba et al., 2020). In order to get to the purchasing decision process, you must go through the selection of a product that has other options so that you can decide whether to buy it or not. This is related to consumer behavior, which in the process of making decisions will go through 5 stages, namely (Armstrong, 2015):
1. The need arises when you have a problem because there is a difference between expectations and reality, so you have to decide something to buy.
2. Information obtained through other people or the internet will help in making purchase decisions because this information is in the minds of consumers.
3. Comparing one product with a competing product to get a better and more effective product. 4. The purchase decision is obtained when it has gone through these stages. The results obtained after buying the product can be seen from consumers who have bought it and the services
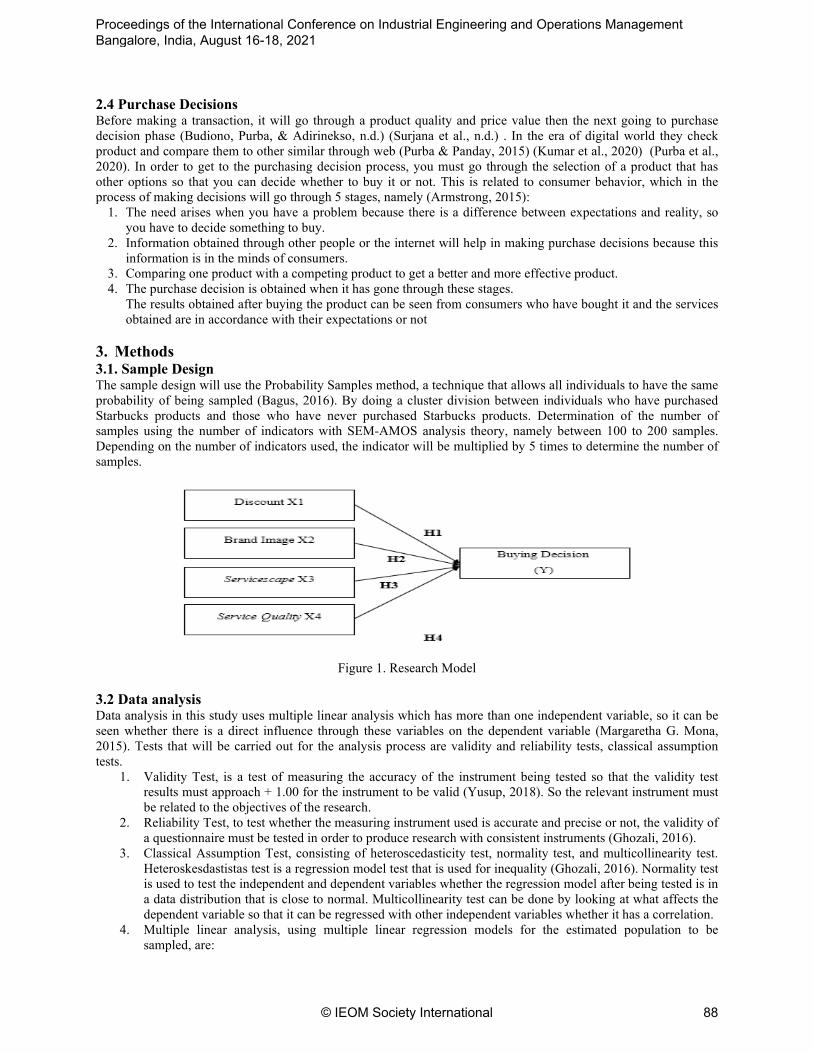
obtained are in accordance with their expectations or not 3. Methods 3.1. Sample Design The sample design will use the Probability Samples method, a technique that allows all individuals to have the same probability of being sampled (Bagus, 2016). By doing a cluster division between individuals who have purchased Starbucks products and those who have never purchased Starbucks products. Determination of the number of samples using the number of indicators with SEM-AMOS analysis theory, namely between 100 to 200 samples. Depending on the number of indicators used, the indicator will be multiplied by 5 times to determine the number of samples.
Figure 1. Research Model
3.2 Data analysis Data analysis in this study uses multiple linear analysis which has more than one independent variable, so it can be seen whether there is a direct influence through these variables on the dependent variable (Margaretha G. Mona, 2015). Tests that will be carried out for the analysis process are validity and reliability tests, classical assumption tests.
1. Validity Test, is a test of measuring the accuracy of the instrument being tested so that the validity test results must approach + 1.00 for the instrument to be valid (Yusup, 2018). So the relevant instrument must be related to the objectives of the research.
2. Reliability Test, to test whether the measuring instrument used is accurate and precise or not, the validity of a questionnaire must be tested in order to produce research with consistent instruments (Ghozali, 2016).
3. Classical Assumption Test, consisting of heteroscedasticity test, normality test, and multicollinearity test. Heteroskesdastistas test is a regression model test that is used for inequality (Ghozali, 2016). Normality test is used to test the independent and dependent variables whether the regression model after being tested is in a data distribution that is close to normal. Multicollinearity test can be done by looking at what affects the dependent variable so that it can be regressed with other independent variables whether it has a correlation.
4. Multiple linear analysis, using multiple linear regression models for the estimated population to be sampled, are:
Proceedings of the International Conference on Industrial Engineering and Operations Management Bangalore, India, August 16-18, 2021
© IEOM Society International 88
The formula of the Regression Y= b0 + b1X1 + b2X2 + ... + e Y= estimate value for variable Y b0= estimate for the constant parameter X= independent variable
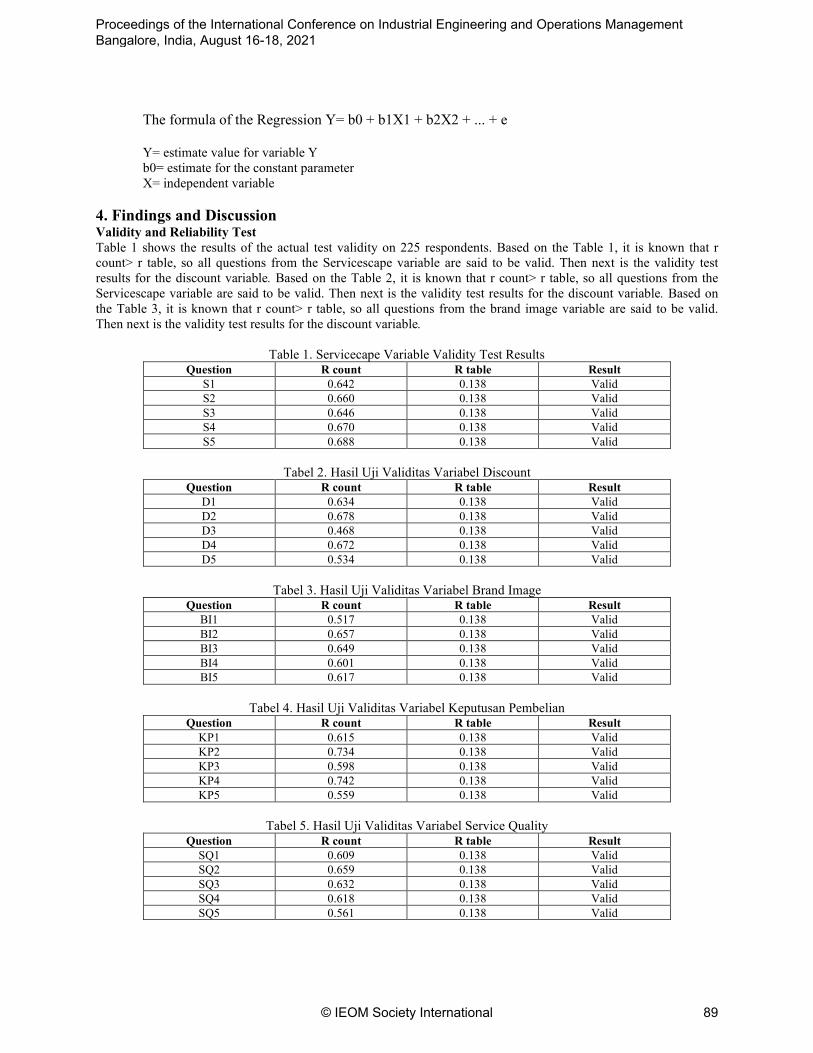
4. Findings and Discussion Validity and Reliability Test Table 1 shows the results of the actual test validity on 225 respondents. Based on the Table 1, it is known that r count> r table, so all questions from the Servicescape variable are said to be valid. Then next is the validity test results for the discount variable. Based on the Table 2, it is known that r count> r table, so all questions from the Servicescape variable are said to be valid. Then next is the validity test results for the discount variable. Based on the Table 3, it is known that r count> r table, so all questions from the brand image variable are said to be valid. Then next is the validity test results for the discount variable.
Table 1. Servicecape Variable Validity Test Results Question R count R table Result
S1 0.642 0.138 Valid S2 0.660 0.138 Valid S3 0.646 0.138 Valid S4 0.670 0.138 Valid S5 0.688 0.138 Valid
Tabel 2. Hasil Uji Validitas Variabel Discount
Question R count R table Result D1 0.634 0.138 Valid D2 0.678 0.138 Valid D3 0.468 0.138 Valid D4 0.672 0.138 Valid D5 0.534 0.138 Valid
Tabel 3. Hasil Uji Validitas Variabel Brand Image
Question R count R table Result BI1 0.517 0.138 Valid BI2 0.657 0.138 Valid BI3 0.649 0.138 Valid BI4 0.601 0.138 Valid BI5 0.617 0.138 Valid
Tabel 4. Hasil Uji Validitas Variabel Keputusan Pembelian
Question R count R table Result KP1 0.615 0.138 Valid KP2 0.734 0.138 Valid KP3 0.598 0.138 Valid KP4 0.742 0.138 Valid KP5 0.559 0.138 Valid
Tabel 5. Hasil Uji Validitas Variabel Service Quality
Question R count R table Result SQ1 0.609 0.138 Valid SQ2 0.659 0.138 Valid SQ3 0.632 0.138 Valid SQ4 0.618 0.138 Valid SQ5 0.561 0.138 Valid
Proceedings of the International Conference on Industrial Engineering and Operations Management Bangalore, India, August 16-18, 2021
© IEOM Society International 89
Based on the Table 4, it is known that r count> r table, so all questions from the Purchasing Decision variable are said to be valid. Then next is the validity test results for the service quality variable. Based on the Table 5, it is known that r count> r table, so all questions from the service quality variable are said to be valid. Then next are the results of reliability testing in Table 6. It is known that the reliability test for all variables with a Cronbach Alpha value> 0.6 is declared reliable.
Table 6. Reliability Test Results Variable Cronbach Alpha Result Servicescape 0.848 Reliable Discount 0.809 Reliable Brand Image 0.817 Reliable Buying Decision 0.837 Reliable Service Quality 0.821 Reliable
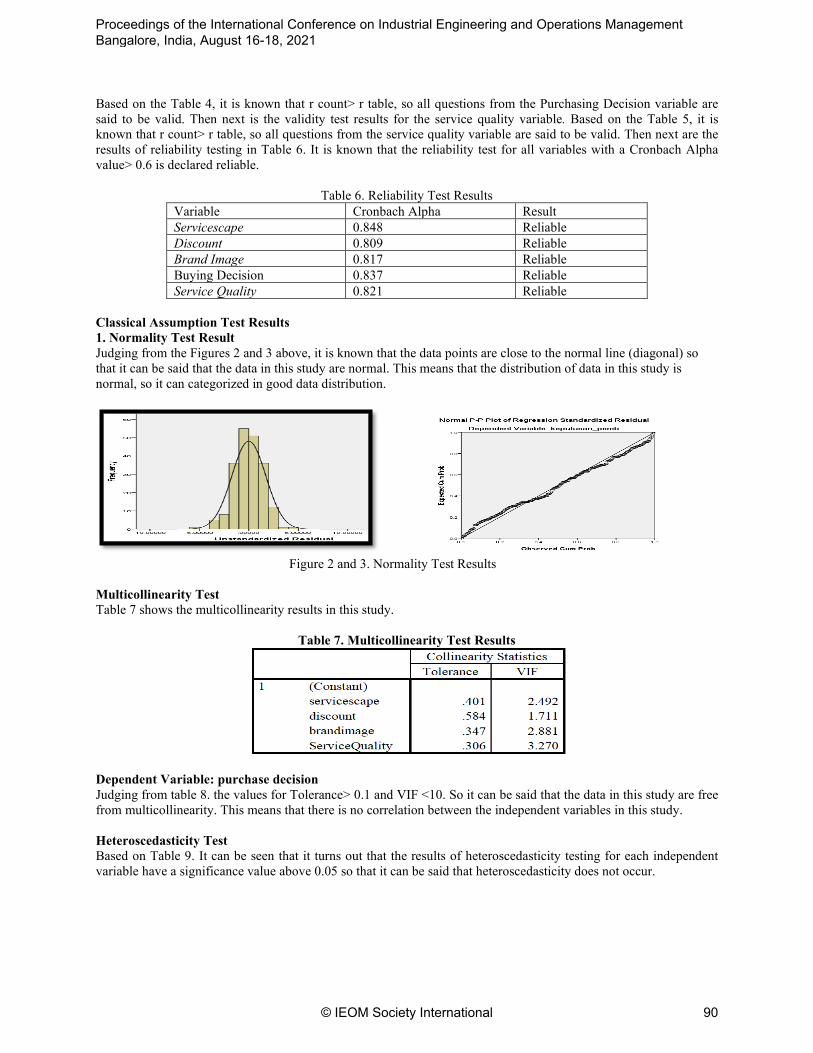
Classical Assumption Test Results 1. Normality Test Result Judging from the Figures 2 and 3 above, it is known that the data points are close to the normal line (diagonal) so that it can be said that the data in this study are normal. This means that the distribution of data in this study is normal, so it can categorized in good data distribution.
Figure 2 and 3. Normality Test Results
Multicollinearity Test Table 7 shows the multicollinearity results in this study.
Table 7. Multicollinearity Test Results
Dependent Variable: purchase decision Judging from table 8. the values for Tolerance> 0.1 and VIF <10. So it can be said that the data in this study are free from multicollinearity. This means that there is no correlation between the independent variables in this study. Heteroscedasticity Test Based on Table 9. It can be seen that it turns out that the results of heteroscedasticity testing for each independent variable have a significance value above 0.05 so that it can be said that heteroscedasticity does not occur.
Proceedings of the International Conference on Industrial Engineering and Operations Management Bangalore, India, August 16-18, 2021
© IEOM Society International 90
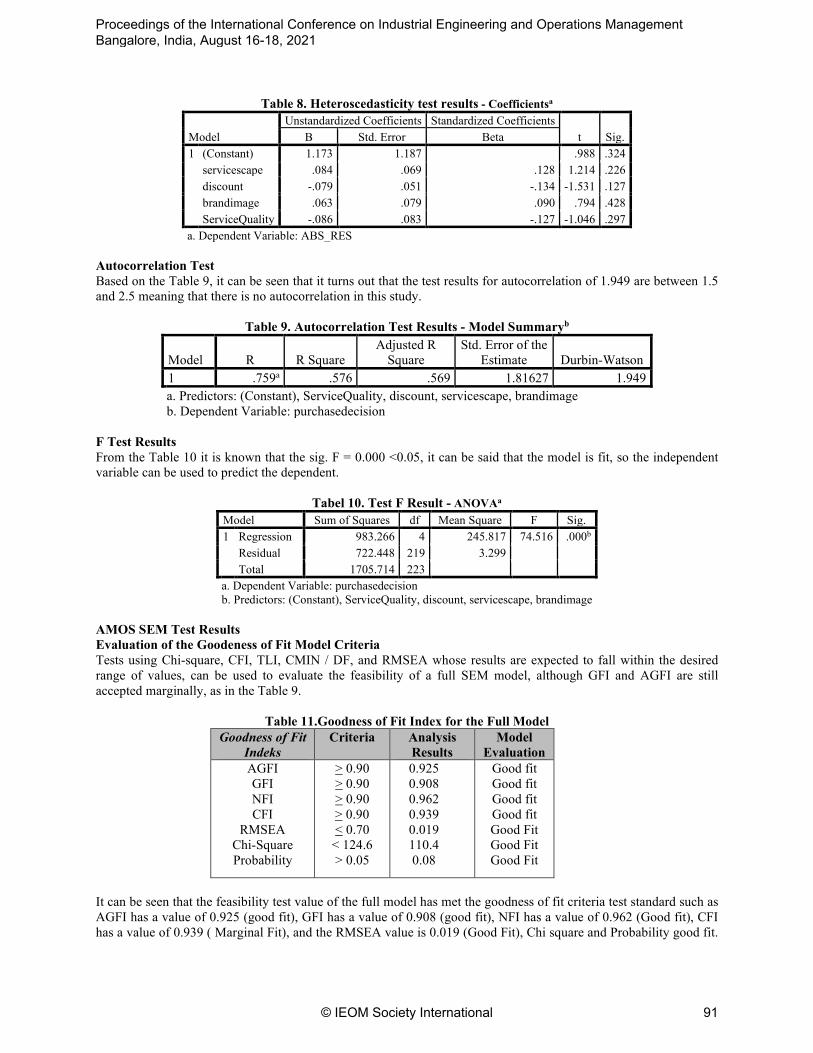
Table 8. Heteroscedasticity test results - Coefficientsa
Model Unstandardized Coefficients Standardized Coefficients
t Sig. B Std. Error Beta 1 (Constant) 1.173 1.187 .988 .324
servicescape .084 .069 .128 1.214 .226 discount -.079 .051 -.134 -1.531 .127 brandimage .063 .079 .090 .794 .428 ServiceQuality -.086 .083 -.127 -1.046 .297
a. Dependent Variable: ABS_RES Autocorrelation Test Based on the Table 9, it can be seen that it turns out that the test results for autocorrelation of 1.949 are between 1.5 and 2.5 meaning that there is no autocorrelation in this study.
Table 9. Autocorrelation Test Results - Model Summaryb
Model R R Square Adjusted R
Square Std. Error of the
Estimate Durbin-Watson 1 .759a .576 .569 1.81627 1.949 a. Predictors: (Constant), ServiceQuality, discount, servicescape, brandimage b. Dependent Variable: purchasedecision
F Test Results From the Table 10 it is known that the sig. F = 0.000 <0.05, it can be said that the model is fit, so the independent variable can be used to predict the dependent.
Tabel 10. Test F Result - ANOVAa
Model Sum of Squares df Mean Square F Sig. 1 Regression 983.266 4 245.817 74.516 .000b
Residual 722.448 219 3.299 Total 1705.714 223
a. Dependent Variable: purchasedecision b. Predictors: (Constant), ServiceQuality, discount, servicescape, brandimage
AMOS SEM Test Results Evaluation of the Goodeness of Fit Model Criteria Tests using Chi-square, CFI, TLI, CMIN / DF, and RMSEA whose results are expected to fall within the desired range of values, can be used to evaluate the feasibility of a full SEM model, although GFI and AGFI are still accepted marginally, as in the Table 9.
Table 11.Goodness of Fit Index for the Full Model
Goodness of Fit Indeks
Criteria Analysis Results
Model Evaluation
AGFI GFI NFI CFI
RMSEA Chi-Square Probability
> 0.90 > 0.90 > 0.90 > 0.90 < 0.70
< 124.6 > 0.05
0.925 0.908 0.962 0.939 0.019 110.4 0.08
Good fit Good fit Good fit Good fit Good Fit Good Fit Good Fit
It can be seen that the feasibility test value of the full model has met the goodness of fit criteria test standard such as AGFI has a value of 0.925 (good fit), GFI has a value of 0.908 (good fit), NFI has a value of 0.962 (Good fit), CFI has a value of 0.939 ( Marginal Fit), and the RMSEA value is 0.019 (Good Fit), Chi square and Probability good fit.
Proceedings of the International Conference on Industrial Engineering and Operations Management Bangalore, India, August 16-18, 2021
© IEOM Society International 91
Of all the tests carried out have met the criteria. So it is concluded that all tests are stated to have a good or fit model.
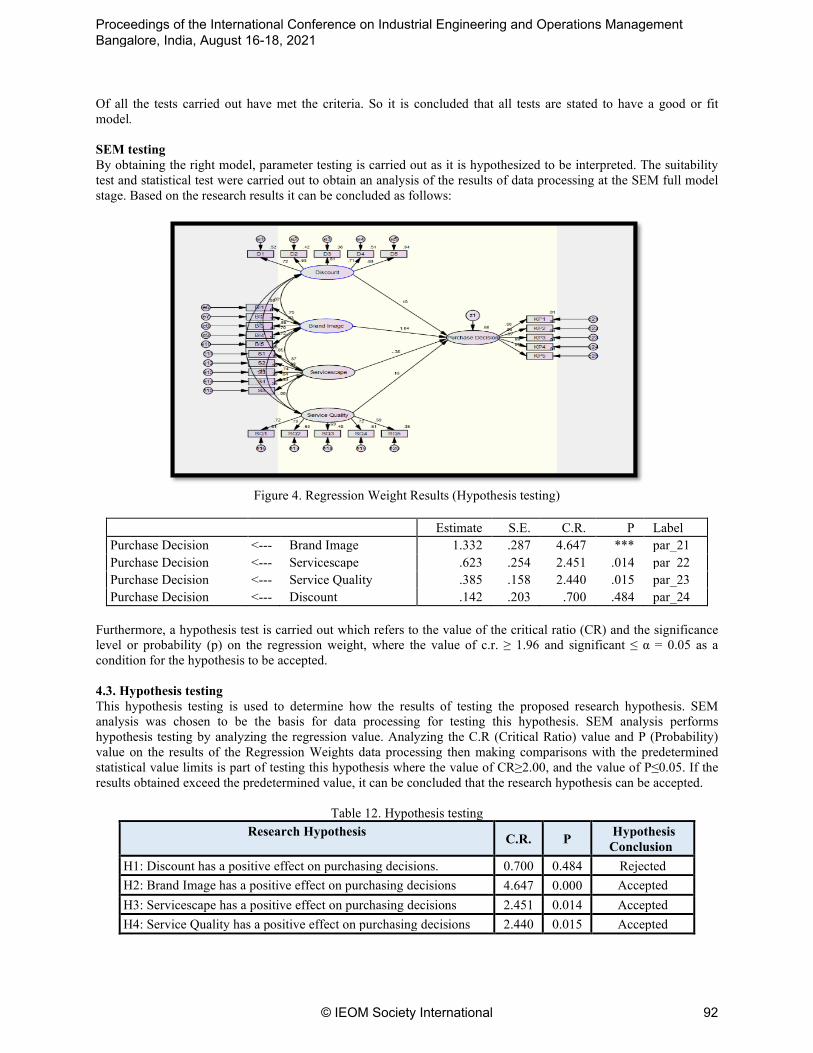
SEM testing By obtaining the right model, parameter testing is carried out as it is hypothesized to be interpreted. The suitability test and statistical test were carried out to obtain an analysis of the results of data processing at the SEM full model stage. Based on the research results it can be concluded as follows:
Figure 4. Regression Weight Results (Hypothesis testing)
Estimate S.E. C.R. P Label
Purchase Decision <--- Brand Image 1.332 .287 4.647 *** par_21 Purchase Decision <--- Servicescape .623 .254 2.451 .014 par_22 Purchase Decision <--- Service Quality .385 .158 2.440 .015 par_23 Purchase Decision <--- Discount .142 .203 .700 .484 par_24
Furthermore, a hypothesis test is carried out which refers to the value of the critical ratio (CR) and the significance level or probability (p) on the regression weight, where the value of c.r. ≥ 1.96 and significant ≤ α = 0.05 as a condition for the hypothesis to be accepted. 4.3. Hypothesis testing This hypothesis testing is used to determine how the results of testing the proposed research hypothesis. SEM analysis was chosen to be the basis for data processing for testing this hypothesis. SEM analysis performs hypothesis testing by analyzing the regression value. Analyzing the C.R (Critical Ratio) value and P (Probability) value on the results of the Regression Weights data processing then making comparisons with the predetermined statistical value limits is part of testing this hypothesis where the value of CR≥2.00, and the value of P≤0.05. If the results obtained exceed the predetermined value, it can be concluded that the research hypothesis can be accepted.
Table 12. Hypothesis testing
Research Hypothesis C.R. P Hypothesis Conclusion
H1: Discount has a positive effect on purchasing decisions. 0.700 0.484 Rejected H2: Brand Image has a positive effect on purchasing decisions 4.647 0.000 Accepted H3: Servicescape has a positive effect on purchasing decisions 2.451 0.014 Accepted H4: Service Quality has a positive effect on purchasing decisions 2.440 0.015 Accepted
Proceedings of the International Conference on Industrial Engineering and Operations Management Bangalore, India, August 16-18, 2021
© IEOM Society International 92
Discounts have a positive effect on purchasing decisions. The hypothesis is that discounts have no effect on purchasing decisions. The value of C.R is obtained from data processing for the effect of the discount variable on the decision to obtain a value of P> 0.05. So, it can be rejected once accepted. The discount given is not a technique to attract buyers because it is cheaper than usual to attract consumers to buy the product. The reason for the rejection of this hypothesis is that consumers may be smarter because JD.ID is likely to provide discounted prices or fare prices. free service where consumers are now more observant where there is the right T&C so that it makes discounts unattractive and has no effect on purchasing decisions. This research is not in line with the research conducted by Dewi and Kusumawati (2018) which shows that variables have the most significant effect on Purchasing Decisions.
Brand Image has a positive effect on purchasing decisions. Hypothesis 2 says that brand image affects purchasing decisions. The C.R value obtained from data processing for the influence of brand image variables on purchasing decisions and the acquisition of P value <0.05. So, it can be concluded that hypothesis 2 is accepted. Information obtained through social media or other media is very influential on the brand image of the product because it will affect the memory possessed by potential consumers. When there are good things that are embedded in the memory of consumers for these products, purchasing decisions will be easier because the prospective customer has at least heard good news about the product he wants to buy. So the brand image has an important effect on purchasing decisions that will be made by potential customers (Rizky Y.S Emor, 2015). This research is in line with research conducted by Soim et al (2016) which shows that brand image together has a significant effect on purchasing decisions.
Servicescape has a positive effect on purchasing decisions. Hypothesis 3 states that servicescape has an effect on purchasing decisions. The C.R value obtained from data processing for the effect of the servicescape variable on purchasing decisions with the acquisition value of P <0.05. So, it can be concluded that hypothesis 3 is accepted. The elements arising from a comfortable design and layout have an effect on purchasing decisions made by consumers, because with this, consumers can comfortably work or just do assignments and even gather with friends when they feel comfortable in a place. In addition to the interest in making purchases, consumers can also feel comfortable in the place provided by the service provider. Like a dine-in place that has been arranged in such a way as to make it easier for consumers in various ways. Because it provides convenience, it will help consumers solve the minor problems they have (Rizky Y.S Emor, 2015). This research is in line with research conducted by Nurochani and Mulayana (2017) showing that the Servicescape variable has an effect on purchasing decisions. Service Quality has a positive effect on purchasing decisions. Hypothesis 4 states that service quality affects purchasing decisions. The C.R value obtained from data processing for the influence of service quality variables on purchasing decisions with the acquisition value of P <0.05. So, it can be concluded that hypothesis 4 is accepted. If the service received or felt is as expected, then the service quality is perceived as good and satisfying. If the service received or perceived exceeds customer expectations, then service quality is perceived as ideal quality. Conversely, if the service received is lower than expected, the service quality is perceived as poor quality. Quality must start with customer needs and end with customer perception. This means that a good quality image is not based on the point of view or perception of the service provider, but based on the customer's point of view or perception. It is the customer who determines the quality or not of a service. Thus, whether the quality of service is good or not depends on the ability of service providers to consistently meet customer expectations. This research is in line with research conducted by Soenawan and Malonda (2015) which shows that service quality has a significant positive effect both partially and simultaneously on consumer purchasing decisions of D'Stupid Baker Surabaya. 5. Conclusion And Sugestion 5.1 Conclusion Hypothesis 1 says that discount has an effect on purchasing decisions. The p-value is> 0.05 so that H1 is rejected. Hypothesis 2 states that brand image has an effect on purchasing decisions. The p-value is <0.05 so that H2 is accepted. Hypothesis 3 states that servicescape has an effect on purchasing decisions. The p-value is <0.05 so that H3 is accepted. Hypothesis 4 states that service quality affects purchasing decisions. The p-value is <0.05, so H4 is accepted.
Proceedings of the International Conference on Industrial Engineering and Operations Management Bangalore, India, August 16-18, 2021
© IEOM Society International 93
5.2 Limitations and Suggestions Based on the research that has been done, it has limitations in this study. First the research was only done at the Starbucks Supermall. Both of these studies only use variables that influence purchasing decisions, namely discount, brand image servicescape and serve quality. Based on the limitations that have been described suggestions for future research. For research, research can be carried out not only in the Karawaci area but can increase the population more so that it can be generalized. For this research variable, other factors that influence purchasing decisions can be added. References Adirinekso, G. P., Purba, J. T., Budiono, S., & Rajaguguk, W. (n.d.). How Brand Image Mediated Sales Promotion
and Price to Impact Shopee Consumer’s Decision? The Case of Urban Worker in Jakarta. In ieomsociety.org. http://www.ieomsociety.org/brazil2020/papers/558.pdf
Adirinekso, G. P., Purba, J. T., Budiono, S., & Rajagukguk, W. (2020). The role of price and service convenience on Jakarta’s consumer purchase decisions in top 5 marketplace mediated by consumer’s perceived value. repository.uki.ac.id. http://repository.uki.ac.id/id/eprint/3232
Alfirahmi. (2019). The Current Coffee Phenomenon in the Era 4.0 in terms of Marketing 4.0 and Uses and Effect Theory. Journal of Lugas Vol. 3, 24-32.
Ayu, K. (2017). The Influence of Brand Image and Service Quality on Customer Satisfaction at Starbucks Istana Plaza (Ip) Bandung. Essay.
Ayun, P. Q. (2015). The Phenomenon of Adolescents Using Social Media in Forming Identities. Channel, Vol. 3, No. 2, 1-16.
Baskara, I. B. (2016). Effect of Discounts on Unplanned Purchases. Malang: University of Muhammadiyah Malang. Budiono, S., Evanson, J., & Purba, J. T. (n.d.). Global Brand Commitment in International Market: The Factors
Affecting Global Brand Commitment. In ieomsociety.org. http://www.ieomsociety.org/brazil2020/ papers/557.pdf
Budiono, S., Purba, J. T., & Adirinekso, G. P. (n.d.). Strategic Business Analysis by Using Determinants of Buying Decision on Products: Lessons from an International Company in Indonesia. In ieomsociety.org. http://www.ieomsociety.org/brazil2020/papers/555.pdf
Budiono, S., Purba, J. T., Adirinekso, G. P., & Rajagukguk, W. (n.d.). Market Growth Strategy through Consumers’ Satisfaction, Product Quality and Brand Image: Evidence from Jakarta Indonesia. In ieomsociety.org. http://www.ieomsociety.org/brazil2020/papers/553.pdf
Dewi Indri Kartika Dewi and Kusumawati Andriani. (2018). The Effect of Discounts on Purchasing Decisions and Online Business Customer Satisfaction (Survey on Students of the Faculty of Administrative Sciences Universitas Brawijaya 2013/2014 Traveloka Consumers). Journal of Business Administration (Jab) | Vol. 56 No. 1.
Diputra, I., & Yasa, N. N. (2021). The Influence Of Product Quality, Brand Image, Brand Trust On Customer Satisfaction And Loyalty. In American International Journal of Business …. aijbm.com. https://www.aijbm.com/wp-content/uploads/2021/01/E412534.pdf
Djakasaputra, A., Juliana, R. P., Goeltom, V. A. H., & ... (2020). The Role of Emotion in Tourism Ethical Decision Making. European Journal of …. https://ejmcm.com/article_4022.html
Ghozali, I. (2016). Multivariate Analysis Application with IBM SPSS19 Program. Semarang: Diponegoro University Publishing Agency.
Good Fadia. (2016). The Role of Servicescape in Improving Hotel Image and Revisiting Intention in 5 Star Hotels. Journal of Service Management and Marketing Vol. 9 No. 2.
Good, R. U. (2016). Samp; ing Technique and Determination of the Number of Samples. Bali: Bali's Dhayana Pura University.
Harahap, Dedy Ansari. (2015). Analysis Of Factors Affecting Consumer's Purchase Decision On Usu Taxes (PAJUS) Medan. Journal of Finance and Business. Vol. 7, No. 3, November 2015
Hashim, N. N. I. K., Shah, N. U., & ... (2018). Does Counterfeit Product Quality Lead to Involvement and Purchase Intentions? The Moderating Effects of Brand Image and Social Interaction. In International Journal of…researchgate.net. https://www.researchgate.net/profile/Najeeb-Shah/publication/330010567_
Hikaru, D., Purba, J. T., Budiono, S., Rajagukguk, W., & ... (2021). Measurement of Brand Image, Price, Promotion, Ease of Use and Satisfaction to Customer Loyalty of on line Transportation in Urban Area. In ieomsociety.org. IEOM Society International. http://www.ieomsociety.org/brazil2020/papers/556.pdf
Indra, D., Regita, R., & Purba, J. T. (2019). Pengukuran kualitas pelayanan, harga dan customer value terhadap kepuasan pelanggan transportasi online bagi kaum millenial. Journal of Accounting and ….
Proceedings of the International Conference on Industrial Engineering and Operations Management Bangalore, India, August 16-18, 2021
© IEOM Society International 94
https://122.200.2.179/index.php/jam/article/view/224 Indramawan, A., Tan, J. D., & Purba, J. T. (2018). Probing into e-commerce logistics: a strategic growth option of
Serbada Company. In Jurnal Ilmu Manajemen & …. academia.edu. https://www.academia.edu/download/67602891/pdf.pdf
Juliana, J., Pramezwary, A., Yuliantoro, N., & ... (2021). Perceptions, Attitudes, and Interests of Halal Tourism: An Empirical Study in Indonesia. … , John Tampil PURBA …. https://papers.ssrn.com/sol3/papers.cfm?abstract_id=3881537
Kim, S. S., Tan, J. D., Juliana, R., & ... (2018). Financial management of tires retail and restaurant business in Greater Jakarta. ICONIET …. https://proceedings.sgu.ac.id/iconiet/index.php/iconiet/article/view/45
Kotler, P. a. (2016). Principles of Marketing. New Jersey: Perason Education. Kumar, R., Sachan, A., & Kumar, R. (2020). The impact of service delivery system process and moderating effect of
perceived value in internet banking adoption. Australasian Journal of …. http://journal.acs. org.au/index.php/ajis/article/view/1923
Kotler, P. a. (2016). Principles of Marketing. New Jersey: Perason Education. Margaretha G. Mona, J. S. (2015). Using Multiple Linear Regression to Analyze Income of Coconut Farmers. Case
Study: Coconut Farmers in Beo Village, Beo District, Talaud Regency. JdC, Vol. 4, No. 2,, 196-203. Muslim. (2016). Paradigm Variants, Approaches, Methods, and Types of Research in Communication Sciences.
Wahana, Vol. 1, No. 10, Odd, Academic Year 2015/2016. Muslim. (2016). Paradigm Variants, Approaches, Methods, and Types of Research in Communication Sciences.
Wahana, Vol. 1, No. 10, Odd, Academic Year 2015/2016. Nadeak, B., & Tampil, J. (2014). Applied Management Strategy on Human Capital in Higher Education for Faculty
Development in the Dynamic Service Industry : A case study. Scbtii. Noviantoro, R., Maskuroh, N., Santoso, B., Abdi, M. N., Fahlevi, M., Pramono, R., Purwanto, A., Purba, J. T.,
Munthe, A. P., & Juliana. (2020). Did quality management system ISO 9001 version 2015 influence business performance? Evidence from Indonesian hospitals. Systematic Reviews in Pharmacy, 11(8). https://doi.org/10.31838/srp.2020.8.71
Prahiawan, W., Juliana, J., & Purba, J. T. (2021). The role of e-satisfaction, e-word of mouth and e-trust on repurchase intention of online shop. Anser, MK, Tabash, MI …. https://papers.ssrn.com/sol3/papers.cfm?abstract_id=3979285
Primahendra, R., Purba, J. T., Ugut, G. S. S., & ... (2021). Do Digital Literacy and Digital Entrepreneurship among University Students Contribute to Digital Economy? In … Research and Critics …. researchgate.net. https://www.researchgate.net/profile/Riza-Primahendra/publication/355424438_
Purba, J. T. (2014). Service performanceict train new technologies towards organizations: case study Asindo Informatika. Universitas Sebelas Maret.
Purba, J. T. (2015). Strategic Innovation through Technology Readiness and Acceptance in Implementing ICT for Corporate Sustainability. researchgate.net. https://www.researchgate.net/profile/John-Purba/publication/ 323239558_
Purba, J. T., Budiono, S., Rajagukguk, W., Samosir, P., & ... (2020). E-business services strategy with financial technology: Evidence from Indonesia. repository.uki.ac.id. http://repository.uki.ac.id/id/eprint/3230
Purba, J. T., Hery, H., & Lestari, V. N. S. (2019). Financial TechnologyReadiness: Strategic Innovation Management in the Service Industry 4.0…of the 1st Asian Conference on… https://books.google. com/ books?hl=en&lr=&id=Rj8IEAAAQBAJ&oi=fnd&pg=PA108&dq=%22john+tampil+purba%22&ots=oNoJ5WSVvt&sig=Z-M8vTcm24sXtbNrj953FkLzzbo
Purba, J. T., Hery, H., & Purba, P. C. (2018). Usage ICT application for bundling products: strategic digital marketing in facing the 4.0 technology. researchgate.net. https://www.researchgate.net/profile/John-Purba/publication/330783065_
Purba, J. T., & Panday, R. (2012). Evaluation of service quality over customers’ satisfaction of Hotel ABC Puncak Bogor as a tool for competitive strategy. In Jurnal …. STIE Pengembangan Bisnis dan ….
Purba, J. T., & Panday, R. (2015). Innovation strategy services delivery: An empirical case study of academic information systems in higher education institution. In Communications in Computer and Information Science (Vol. 516). https://doi.org/10.1007/978-3-662-46742-8_47
Purba, J. T., & Tan, J. D. (2016). Strategic service management in hospitality industry: case study of Grand Tasty Restaurants. In Prosiding. Seminar Nasional Conference…researchgate.net. https://www.researchgate.net/ profile/Jacob-Tan/publication/316738164_Conference_on_Management_and_Behavioral_Studies.
Purba, J. T., & Tan, J. D. (2018). Owners’ integrity, customers’ relation, and focused attitude as strategiies of family business sustainability and growth: an empirical study. Journal of Economics, Business, & ….
Proceedings of the International Conference on Industrial Engineering and Operations Management Bangalore, India, August 16-18, 2021
© IEOM Society International 95
https://journal.perbanas.ac.id/index.php/jebav/article/view/1433 Qomariah, A., & Prabawani, B. (2020). The effects of environmental knowledge, environmental concern, and green
brand image on green purchase intention with perceived product price and quality as the …. IOP Conference Series: Earth and …. https://doi.org/10.1088/1755-1315/448/1/012115
Radnan, P. Y., & Purba, J. T. (2018). The use of Information Communication Technology (ICT) as the technology acceptance model (TAM) of mobile banking. Jurnal Manajemen Dan …. https://trijurnal. lemlit.trisakti.ac.id/jasa/article/view/2057
Rizky Y.S Emor, A. S. (2015). Effect of Discounts, Brand Image, and Servicescape on Purchasing Decisions of Indomaret Tanjung Batu Consumers. EMBA Journal Vol. 3 No.2, 738-748.
Siswanto Cynthia and Setiawan Andereas Pandu. (2015). Visual Perceptions Of Visitors To The Interior Elements Of Stilrod Café In Surabaya. Journal of Intra Vol. 3, No. 2, (2015) 143-150.
Steven, W., Purba, J. T., Budiono, S., & ... (2021). How Product Quality, Brand Image and Price Perception Impact on Purchase Decision of Running Shoes? In Proceedings of the …. ieomsociety.org. http://www.ieomsociety.org/brazil2020/papers/562.pdf
Suk, K. S., Haryanto, M., & Purba, J. T. (2019). Cash holdings of business group-affiliated firms in Indonesia. In DLSU Business & Economics Review. dlsu.edu.ph. https://www.dlsu.edu.ph/wp-content/uploads/pdf/research/publishing-house/journals/BER/vol-29-july2019/5suk-0719-revised2.pdf
Surjana, F., Purba, J. T., & Budiono, S. (n.d.). Evaluation of Brand Communication and Service Performance toward Brand Loyalty through Brand Trust as the Mediation Variables of Bank’s Customers. In ieomsociety.org. http://www.ieomsociety.org/brazil2020/papers/567.pdf
Sutia, S., Riadi, R., Fahlevi, M., Istan, M., Juhara, S., Pramono, R., Purwanto, A., Purba, J. T., Munthe, A. P., & Juliana. (2020). Benefit of benchmarking methods in several industries: A systematic literature review. Systematic Reviews in Pharmacy, 11(8). https://doi.org/10.31838/srp.2020.8.72
Tan, J. D., Supratikno, H., Pramono, R., Purba, J. T., & Bernarto, I. (2019). Nurturing transgenerational entrepreneurship in ethnic Chinese family SMEs: exploring Indonesia. Journal of Asia Business Studies, 13(2). https://doi.org/10.1108/JABS-04-2018-0132
Yusup, F. (2018). Test the Validity and Reliability of Quantitative Research Instruments. Tarbiyah Scientific Education Journal, 17-23.
Venessa Ike and Arifin Zainul. (2017). The Influence of Brand Image and Price on Consumer Purchase Decisions (Survey on Students of Business Administration Study Program, Faculty of Administrative Sciences, Brawijaya University Malang, 2013/2014 and 2014/2015 Generation of Sympathy Prepaid Card Users). Faculty of Administrative Sciences, Brawijaya University Malang. Journal of Business Administration (Jab) | Vol. 51 No. 1
Widjaja, A. E., Purba, J. T., & ... (2019). Recording application with managerial prediction features for skenoo business. IOP Conference Series …. https://doi.org/10.1088/1757-899X/508/1/012133
Biographies John Tampil Purba obtained a degree Doctor (S3) majoring Management from De La Salle University Systems Manila, Philippines in 2002. Dr. Purba also has several certifications international Standards in management information systems and technology, among others: MCP, MCSA, MCSE, MCSES, MCSAS, MCDL and MCT from Microsoft Technologies, USA and CSE from Cisco System USA. He is also Professional Membership of IEOM Society since last year. He has several managerial experiences in the Service Industries group for more than 25 years. He is currently served as an Associate Professor at the Faculty of Economics and Business Pelita Harapan University, Karawaci Banten, Indonesia. Enrico, has just complete his Bachelor Degree in Management from Faculty of Business and Economics in the early year 2021, Universitas Pelita Harapan, Karawaci Banten, Indonesia. Sidik Budiono is currently serves as an Associate Professor in Economics at Department of Management at Faculty of Economics and Business Pelita Harapan University, Lippo Karawaci Tangerang Banten-Indonesia. Dr. Budiono graduated Bachelor of Economics from Department of Economics, Universitas Kristen Satya Wacana, Salatiga Central Java, Masteral and Doctoral degree in Economics from Department of Economics at Faculty of Business and Economics Universitas Indonesia, Depok Indonesia. He interests in research around national, regional development and international economics.
Proceedings of the International Conference on Industrial Engineering and Operations Management Bangalore, India, August 16-18, 2021
© IEOM Society International 96
Wilson Rajagukguk currently serves as Associate Professor in Economics Faculty of Economics Vice Rector for Academic Affairs at the Universitas Kristen Indonesia, Jakarta, Indonesia. Dr. Wilson Rajagukguk holds two Masteral Degree, in Demographic and Labor Economics, and also in Theology. His Doctoral degree in Economics from Departement of Economics Faculty of Business and Economics Universitas Indonesia, Jakarta. His research interests in the field of demographic economic growth, religion economic, statistics, econometrics, and mathematics.
Proceedings of the International Conference on Industrial Engineering and Operations Management Bangalore, India, August 16-18, 2021
© IEOM Society International 97
Related Documents


![IEOM2011 IEOM Challenges[1]](https://static.cupdf.com/doc/110x72/577d200f1a28ab4e1e91e549/ieom2011-ieom-challenges1.jpg)


