The influence of photosynthetic acclimation to rising CO 2 and warmer temperatures on leaf and canopy photosynthesis models Justin Bagley 1,2 , David M. Rosenthal 3 , Ursula M. Ruiz-Vera 4 , Matthew H. Siebers 4 , Praveen Kumar 5 , Donald R. Ort 1,4,6 , and Carl J. Bernacchi 1,4,6 1 Genomic Ecology of Global Change and Energy Biosciences Institute, Institute for Genomic Biology, University of Illinois at Urbana-Champaign, Urbana, Illinois, USA, 2 Now at Sustainable Energy Systems Group, Lawrence Berkeley National Laboratory, Berkeley, California, USA, 3 Department of Environmental and Plant Biology, Ohio University, Athens, Ohio, USA, 4 Department of Plant Biology, University of Illinois at Urbana-Champaign, Urbana, Illinois, USA, 5 Department of Civil and Environmental Engineering, University of Illinois at Urbana-Champaign, Urbana, Illinois, USA, 6 Global Change and Photosynthesis Research Unit, USDA Agricultural Research Service, Urbana, Illinois, USA Abstract There is an increasing necessity to understand how climate change factors, particularly increasing atmospheric concentrations of CO 2 ([CO 2 ]) and rising temperature, will influence photosynthetic carbon assimilation (A). Based on theory, an increased [CO 2 ] concomitant with a rise in temperature will increase A in C3 plants beyond that of an increase in [CO 2 ] alone. However, uncertainty surrounding the acclimation response of key photosynthetic parameters to these changes can influence this response. In this work, the acclimation responses of C3 photosynthesis for soybean measured at the SoyFACE Temperature by Free-Air CO 2 Enrichment experiment are incorporated in a leaf biochemical and canopy photosynthesis model. The two key parameters used as model inputs, the maximum velocity for carboxylation (V c,max ) and maximum rate of electron transport (J max ), were measured in a full factorial [CO 2 ] by temperature experiment over two growing seasons and applied in leaf- and canopy-scale models to (1) reassess the theory of combined increases in [CO 2 ] and temperature on A, (2) determine the role of photosynthetic acclimation to increased growth [CO 2 ] and/or temperature in leaf and canopy predictions of A for these treatments, and (3) assess the diurnal and seasonal differences in leaf- and canopy-scale A associated with the imposed treatments. The results demonstrate that the theory behind combined increases in [CO 2 ] and temperature is sound; however, incorporating more recent parameterizations into the photosynthesis model predicts greater increases in A when [CO 2 ] and temperature are increased together. Photosynthetic acclimation is shown to decrease leaf-level A for all treatments; however, in elevated [CO 2 ] the impact of acclimation does not result in any appreciable loss in photosynthetic potential at the canopy scale. In this analysis, neglecting photosynthetic acclimation in heated treatments, with or without concomitant rise in [CO 2 ], leads to modeled overestimates of carbon gain for soybean under future predicted conditions. 1. Introduction Future agricultural production will encounter multifaceted challenges from global climate change. Atmospheric concentrations of carbon dioxide ([CO 2 ]) and several other radiatively active gases are increasing, and Earth system models predict further global warming above the temperature increases already observed [Collins et al., 2013]. Mean land surface temperatures have already increased by over 1°C over the last century [Hartmann et al., 2013] and are expected to increase further [Collins et al., 2013]. Temperatures over the terrestrial areas of the planet are expected to increase faster than the global mean with specific regions experiencing increases of between 3 and 4°C by midcentury [Collins et al., 2013]. Since 2000, the accumulation of greenhouse gases has accelerated to unprecedented rates, exceeding the most aggressive emission scenario [Peters et al., 2013] and potentially leading to warming at or above the highest end of the predicted range. The role of C3 crops in global food production is considerable, accounting for approximately 80% of human daily caloric intake derived directly from plants [Lobell and Gourdji, 2012]. Assessing the impact of future climate change on crop yields and net ecosystem production requires accurate assessments of climate change impacts on photosynthesis. As the entry point for carbon assimilation, the impact of global changes on C3 photosynthesis is a major determinant of overall crop productivity. The generally beneficial impact of rising [CO 2 ] on C3 plants has been well documented over many years through a combination of chamber and BAGLEY ET AL. ©2015. American Geophysical Union. All Rights Reserved. 1 PUBLICATION S Global Biogeochemical Cycles RESEARCH ARTICLE 10.1002/2014GB004848 Key Points: • Neglecting photosynthetic acclimation can impose model errors • Errors at the leaf scale are similar or greater at the canopy scale • Errors from neglecting acclimation cause productivity overestimation Supporting Information: • Readme • Figure S1 Correspondence to: C. J. Bernacchi, [email protected] Citation: Bagley, J., D. M. Rosenthal, U. M. Ruiz-Vera, M. H. Siebers, P. Kumar, D. R. Ort, and C. J. Bernacchi (2015), The influence of photosynthetic acclimation to rising CO 2 and warmer temperatures on leaf and canopy photosynthesis models, Global Biogeochem. Cycles, 29, doi:10.1002/2014GB004848. Received 12 MAR 2014 Accepted 9 JAN 2015 Accepted article online 14 JAN 2015

Welcome message from author
This document is posted to help you gain knowledge. Please leave a comment to let me know what you think about it! Share it to your friends and learn new things together.
Transcript
The influence of photosynthetic acclimation to risingCO2 and warmer temperatures on leaf and canopyphotosynthesis modelsJustin Bagley1,2, David M. Rosenthal3, Ursula M. Ruiz-Vera4, Matthew H. Siebers4, Praveen Kumar5,Donald R. Ort1,4,6, and Carl J. Bernacchi1,4,6
1Genomic Ecology of Global Change and Energy Biosciences Institute, Institute for Genomic Biology, University of Illinoisat Urbana-Champaign, Urbana, Illinois, USA, 2Now at Sustainable Energy Systems Group, Lawrence Berkeley NationalLaboratory, Berkeley, California, USA, 3Department of Environmental and Plant Biology, Ohio University, Athens, Ohio, USA,4Department of Plant Biology, University of Illinois at Urbana-Champaign, Urbana, Illinois, USA, 5Department of Civil andEnvironmental Engineering, University of Illinois at Urbana-Champaign, Urbana, Illinois, USA, 6Global Change andPhotosynthesis Research Unit, USDA Agricultural Research Service, Urbana, Illinois, USA
Abstract There is an increasing necessity to understand how climate change factors, particularly increasingatmospheric concentrations of CO2 ([CO2]) and rising temperature, will influence photosynthetic carbonassimilation (A). Based on theory, an increased [CO2] concomitant with a rise in temperature will increase A in C3plants beyond that of an increase in [CO2] alone. However, uncertainty surrounding the acclimation response ofkey photosynthetic parameters to these changes can influence this response. In this work, the acclimationresponses of C3 photosynthesis for soybean measured at the SoyFACE Temperature by Free-Air CO2 Enrichmentexperiment are incorporated in a leaf biochemical and canopy photosynthesis model. The two key parametersused as model inputs, the maximum velocity for carboxylation (Vc,max) and maximum rate of electron transport(Jmax), were measured in a full factorial [CO2] by temperature experiment over two growing seasons and appliedin leaf- and canopy-scale models to (1) reassess the theory of combined increases in [CO2] and temperatureon A, (2) determine the role of photosynthetic acclimation to increased growth [CO2] and/or temperature in leafand canopy predictions of A for these treatments, and (3) assess the diurnal and seasonal differences in leaf- andcanopy-scale A associated with the imposed treatments. The results demonstrate that the theory behindcombined increases in [CO2] and temperature is sound; however, incorporatingmore recent parameterizationsinto the photosynthesis model predicts greater increases in A when [CO2] and temperature are increasedtogether. Photosynthetic acclimation is shown to decrease leaf-level A for all treatments; however, in elevated[CO2] the impact of acclimation does not result in any appreciable loss in photosynthetic potential at the canopyscale. In this analysis, neglecting photosynthetic acclimation in heated treatments, with or without concomitantrise in [CO2], leads to modeled overestimates of carbon gain for soybean under future predicted conditions.
1. Introduction
Future agricultural productionwill encounter multifaceted challenges fromglobal climate change. Atmosphericconcentrations of carbon dioxide ([CO2]) and several other radiatively active gases are increasing, and Earthsystemmodels predict further global warming above the temperature increases already observed [Collins et al.,2013]. Mean land surface temperatures have already increased by over 1°C over the last century [Hartmannet al., 2013] and are expected to increase further [Collins et al., 2013]. Temperatures over the terrestrial areas ofthe planet are expected to increase faster than the global mean with specific regions experiencing increases ofbetween 3 and 4°C by midcentury [Collins et al., 2013]. Since 2000, the accumulation of greenhouse gaseshas accelerated to unprecedented rates, exceeding the most aggressive emission scenario [Peters et al., 2013]and potentially leading to warming at or above the highest end of the predicted range.
The role of C3 crops in global food production is considerable, accounting for approximately 80% of humandaily caloric intake derived directly from plants [Lobell and Gourdji, 2012]. Assessing the impact of futureclimate change on crop yields and net ecosystem production requires accurate assessments of climatechange impacts on photosynthesis. As the entry point for carbon assimilation, the impact of global changeson C3 photosynthesis is a major determinant of overall crop productivity. The generally beneficial impact ofrising [CO2] on C3 plants has been well documented over many years through a combination of chamber and
BAGLEY ET AL. ©2015. American Geophysical Union. All Rights Reserved. 1
PUBLICATIONSGlobal Biogeochemical Cycles
RESEARCH ARTICLE10.1002/2014GB004848
Key Points:• Neglecting photosynthetic acclimationcan impose model errors
• Errors at the leaf scale are similar orgreater at the canopy scale
• Errors from neglecting acclimationcause productivity overestimation
Supporting Information:• Readme• Figure S1
Correspondence to:C. J. Bernacchi,[email protected]
Citation:Bagley, J., D. M. Rosenthal, U. M. Ruiz-Vera,M. H. Siebers, P. Kumar, D. R. Ort, andC. J. Bernacchi (2015), The influenceof photosynthetic acclimation torising CO2 and warmer temperatureson leaf and canopy photosynthesismodels, Global Biogeochem. Cycles,29, doi:10.1002/2014GB004848.
Received 12 MAR 2014Accepted 9 JAN 2015Accepted article online 14 JAN 2015

open-air experiments. While environmental and growth conditions can cause variable plant responses, theoverall effect of rising [CO2] generally results in higher rates of C3 photosynthesis [Lawlor and Mitchell, 1991;Curtis andWang, 1998; Ainsworth et al., 2002; Karnosky et al., 2003; Long et al., 2004;Nowak et al., 2004; Ainsworthand Long, 2005; Bernacchi et al., 2006; Ainsworth and Rogers, 2007; Leakey et al., 2009]. Photosynthetic ratesincrease despite acclimation responses that drive down the expression and activity of key photosyntheticenzymes [e.g., Sage, 1994; Bernacchi et al., 2005; Leakey et al., 2009; Ge et al., 2012]. Two biochemical processesthat limit photosynthesis, the maximum rate of in vivo Rubisco carboxylation capacity of RuBP (Vc,max) and therate of regeneration of RuBPassociated with themaximumpotential linear electron flux through photosystem II(Jmax), have been shown to acclimate to long-term growth at elevated [CO2] [Wong, 1979; Sage et al., 1989;Tissue et al., 1993; Woodrow, 1994; Ghannoum et al., 1997; Vu et al., 1997; Sims et al., 1998], although the downregulation of Vc,max may have negligible impact on leaf photosynthesis for some plants grown in elevated [CO2][Bernacchi et al., 2005]. Elevated [CO2], however, is shown to have a much more variable impact on Jmax;while early studies show a range of responses based on species [e.g., Sage, 1994], Jmax of herbaceous crops,such as soybean, shows little responses to elevated [CO2] [e.g., Bernacchi et al., 2005].
As temperatures rise, the kinetics for the main carboxylating enzyme, Rubisco, increasingly favors oxygenationrelative to carboxylation of RuBP [Jordan and Ogren, 1984; Long, 1991]. In C3 crops this results in increasedphotorespiration, an energetically wasteful process in which already fixed carbon is released as CO2 [Ogren,1984]. Increases in temperature have also been shown to reduce the amount of CO2 that diffuses into the leafdue to decreased stomatal conductance (gs), although this is likely a direct consequence of an increase in vaporpressure deficit that usually occurs as temperature rises [Farquhar and Sharkey, 1982]. While rising [CO2] almostuniversally increases rates of C3 photosynthesis, higher temperatures have been reported to result in anincrease, decrease, or no change in photosynthesis depending on whether photosynthesis is operating below,at, or above the thermal optimum [Bernacchi et al., 2001, 2003; Cen and Sage, 2005; Sage and Kubien, 2007].Diurnal variation in temperature (e.g., hourly and daily) will lead to conditions where photosynthesis operatesfrom below to above the thermal optimum. Longer-term changes in temperature (weekly, monthly, andseasonally) are anticipated to cause the temperature optimum of photosynthesis to approach the temperatureto which the leaf is acclimated [Sage et al., 1995; Sage and Kubien, 2007].
Increases in [CO2] and temperature were first hypothesized to increase C3 photosynthesis in a coupledmannerover 20 years ago using in vitro-derived temperature functions [Long, 1991]. The combined effects of thesevariables on plants have been studied in various types of laboratory chambers and greenhouses [e.g., Ainsworthet al., 2002], but similar experiments using open-air field-based experiments have been lacking. Photosyntheticmeasurements made on soybean over a wide range of meteorological conditions across growing seasons atthe Soybean Free-Air CO2 Enrichment (SoyFACE) research facility demonstrate that a positive correlation existsbetween temperature and photosynthesis [Bernacchi et al., 2006] such that higher temperatures drive higher[CO2]-induced increases in photosynthesis. That analysis, however, was extracted from diurnal measurementsof photosynthesis collected over three growing seasons and relied on natural climatic variability which isunavoidably confounded by variables other than just temperature. More recently with the advancement ofin-field heating techniques [Kimball, 2005; Kimball et al., 2008], experiments have been established to assess theresponses of various ecosystems to combined increases in temperature and [CO2] [e.g., Ruiz-Vera et al., 2013;Rosenthal et al., 2014]. These experiments, in which full factorial treatments of [CO2] and temperature areapplied under open-air growth conditions, provide a unique opportunity to assess whether physiologicaladjustments to growth in elevated [CO2] and temperature result in photosynthesis rates that conform tothe theory-based expectations in Long [1991].
A major goal of in-field experimentation is to provide mechanistic understanding of plant physiologicalresponses to changing environments that can better equip ecosystem-scale models with refined croppredictions [Twine et al., 2013]. The biochemical and biophysical models of leaf photosynthesis [Farquhar et al.,1980] are used extensively in leaf- to ecosystem-scale models and rely on input parameters of Vc,max and Jmax
derived from in-field measurements while assuming standardized temperature responses of each modelcomponent. This study addresses the influence of growth in elevated [CO2] and/or higher temperature onacclimation of Vc,max and Jmax for one of the most widely grown food crops, soybean. The first objective is toreassess the theoretical impact of rising [CO2] and temperature onmodeled leaf photosynthesis, accounting forphysiological adjustments of Vc,max and Jmax to growth conditions. The second objective predicts how the
Global Biogeochemical Cycles 10.1002/2014GB004848
BAGLEY ET AL. ©2015. American Geophysical Union. All Rights Reserved. 2
leaf-scale photosynthetic responses of soybean will manifest carbon uptake at the canopy scale. This objectivebuilds upon recent measurements of photosynthetic physiology of soybean from a [CO2] by temperaturefactorial experiment at the Soybean Temperature by Free-Air CO2 Enrichment (T-FACE) experiment [Ruiz-Veraet al., 2013; Rosenthal et al., 2014] and advances in canopy-scale photosynthesis modeling [Drewry et al., 2010a].The second objective uses a highly mechanistic multilayer canopy photosynthesis model, MLCan [Drewry et al.,2010a], coupled with a parameterization of the leaf photosynthesis model [Farquhar et al., 1980] over a widerange of temperatures [Bernacchi et al., 2001, 2003]. This coupled measurement-modeling approach will usephysiological and meteorological data from two growing seasons representing relatively typical conditions(2009) and much warmer and drier conditions (2011).
2. Methods2.1. Modeling Leaf Photosynthesis
The response of A to the intercellular [CO2] (Ci) was modeled using the leaf biochemical photosynthesismodel [Farquhar et al., 1980; von Caemmerer, 2000], which assumes A to be limited by the slower of twoprocesses, Rubisco (Wc) and maximum rate of RuBP regeneration (Wj).
A ¼ Wc ¼ 1� Γ�=Cið Þ Vc;max�Ci
Ci þ Kc� 1þ OKo
� �8<:
9=;� Rd (1)
A ¼ Wj ¼ 1� Γ�=Cið Þ J�Ci
4:5Ci þ 10:5Γ�
� �� Rd (2)
In these two equations, (1- Γ*/Ci) accounts for the proportion of CO2 assimilated that is lost throughphotorespiration where Γ* is the photosynthetic CO2 compensation point in the absence of mitochondrialrespiration (Rd). The terms Kc and Ko represent theMichaelis-Menten constants for CO2 and O2, respectively,Ois the chloroplastic oxygen concentration, and Rd is mitochondrial respiration in the light. In equation (2),the constants 4.5 and 10.5 reflect the electron transport requirements for the production of ATP from ADPand NADPH from NADP+ to meet the demands for RuBP regeneration [von Caemmerer, 2000]. The valuesfor Γ*, Kc, and Ko are generally considered to be conserved among C3 plants for modeling purposes, althoughrecent work suggests that variations may be important [von Caemmerer, 2013; Galmés et al., 2014]. Thus, thevalues and temperature responses integrated into the MLCan model were based on those publishedpreviously for tobacco [Bernacchi et al., 2001, 2003] unless otherwise noted.
The term J is defined as the linear electron flux through photosystem II:
J ¼Q2 þ Jmax �
ffiffiffiffiffiffiffiffiffiffiffiffiffiffiffiffiffiffiffiffiffiffiffiffiffiffiffiffiffiffiffiffiffiffiffiffiffiffiffiffiffiffiffiffiffiffiffiffiffiffiffiffiffiQ2 þ Jmaxð Þ2 � 4�ΘPSII�Jmax
q2�ΘPSII
(3)
Q2 ¼ Q�α�ΘPSII�β (4)
where Jmax is the maximum potential electron flux through photosystem II, Q is photosynthetically activeradiation, α is the leaf absorptance,ΦPSII is the quantum yield of photosystem II, and β is the ratio of photosystemII to photosystem I. The temperature response for the functions specific to Rubisco-limited photosynthesisparameters is that reported by Bernacchi et al. [2001], and the temperature response for the parameters unique tothe RuBP-limited photosynthesis model was used from Bernacchi et al. [2003] for tobacco plants grown at 25°C.
The parameters that are known to be highly variable among leaves, Vc,max and Jmax, were determined fromA versus Ci response curves measured at 25°C (for detailed description see section 2.2 of Rosenthal et al. [2014]).The method of calculating Vc,max, Jmax, and Rd from the A versus Ci responses curves was based on linearizationof the two limiting processes (Rubisco and RuBP regeneration) from the leaf photosynthesis model [Farquharet al., 1980] following the method described previously [Long and Bernacchi, 2003]. The parameters Vc,max
and Jmax were measured over two growing seasons (2009 and 2011) on regular intervals at 25°C as part of theSoyFACE T-FACE experiment, and each varied throughout the growing season [Rosenthal et al., 2014].
Application of the leaf photosynthesismodel generally assumes that the parameters, other than Vc,max and Jmax,are conserved for all higher C3 species [Farquhar et al., 1980; Harley and Tenhunen, 1991; von Caemmerer, 2000;
Global Biogeochemical Cycles 10.1002/2014GB004848
BAGLEY ET AL. ©2015. American Geophysical Union. All Rights Reserved. 3

Bernacchi et al., 2001; Long and Bernacchi, 2003]. Because of this, models are parameterized with Vc,max and Jmax
measured at a standard temperature, generally 25°C, and the temperature functions associated with the modelaccount for deviations at higher and lower temperatures. It is also assumed that growth conditions do notinfluence the temperature response of the parameters. Variation, however, does exist both between species[e.g., Galmés et al., 2005] and, at least for Jmax, within a species based on growth environment [Bernacchi et al.,2003]. It is possible that growth conditions could influence the temperature responses of Γ*, Kc, and Ko throughdifferent expression of genes coding for the Rubisco small subunit; however, at present this is highly speculative[Carmo-Silva et al., 2014]. Thus, any means to account for these changes in models are nonexistent. Whilethe influence of growth conditions on temperature functions for Jmax are potentially relevant for modelinggrowth at different temperatures, only slight difference in the instantaneous temperature response of Jmax hasbeen observed for large changes in growth temperature [e.g., Bernacchi et al., 2003]; thus, a “standard”temperature function based on growth at 25°C was incorporated in the modeling in this study.
The canopy modeling analysis presented here linearly interpolated measurements of Vc,max and Jmax to dailyvalues over the two growing seasons (2009 and 2011). While Rd is known to vary as a result of leaf growthenvironment, values estimated from photosynthetic measurements are prone to significant variation resulting inno discernible differences among treatments. Thus, acclimation responses of Rd were not included in thisanalysis. The parameterization of the model is based on in vivo measurements of enzyme kinetics that are basedon CO2 concentrations in the intercellular airspaces (Ci) and not in the chloroplast. As a result, the instantaneousinfluence of temperature onmesophyll conductance (gm) is built into themodels. As gm for soybean is not shownto change based on growth [CO2] [Bernacchi et al., 2005], its influence on model predictions for the elevatedCO2 scenarios are expected to be negligible. Soybeans were grown in a fully replicated (n=4) complete blockfactorial experiment over two growing seasons under control (385μmolmol�1 [CO2] and background canopytemperatures; 385-CON), elevated temperature (385μmolmol�1 [CO2] and canopy temperatures warmed by3.5°C; 385-HOT), elevated [CO2] (585μmolmol�1 [CO2] and background canopy temperatures; 585-CON), andelevated [CO2] and temperature (585μmolmol�1 [CO2] and canopy temperatures warmed by 3.5°C; 585-HOT).Photosynthetic CO2 response curves were measured at 2 week intervals using the method described previously[Bernacchi et al., 2005]. A complete description of the Soybean T-FACE experiment, measurements collected,and climatic conditions have been provided previously [Ruiz-Vera et al., 2013; Rosenthal et al., 2014].
2.2. Modeling Canopy Photosynthesis
Canopy photosynthesis was modeled using the MLCan model [Drewry et al., 2010a] that divides the canopyinto 15 horizontal layers, each composed of sunlit and shaded portions. The canopy model uses the leafphotosynthesis model [Farquhar et al., 1980] as the basis for net carbon uptake and resolves radiation, airtemperature, wind speed, [CO2], water vapor, precipitation, and dew formation throughout the vertical canopyprofile. Additionally, the model couples energy balance with physiological functioning at each canopy layerand has been evaluated using both canopy-scale flux data [Drewry et al., 2010a] and physiologicalmeasurements [Drewry et al., 2010b].
The canopy photosynthesis model was parameterized using the sunlit-shaded scaling approach [Norman, 1982;De Pury and Farquhar, 1997; Dai et al., 2004] to scale leaf photosynthetic rates to the canopy. This scalingapproach has been shown to properly account for the largest differentiator of intracanopy photosynthesis,radiative flux, and to be accurate at the diurnal and subdiurnal timescales used here [Medlyn et al., 2003]. Toaccommodate this scaling approach, MLCan divides the incoming shortwave radiation into photosyntheticallyactive (PAR) and near-infrared (NIR) radiation bands to allow for increased leaf absorptivity to PAR. Theseshortwave bands are further resolved into direct and diffuse radiation components, which are attenuatedthrough the canopy layers according to Beer-Lambert law [Goudriaan, 1977]. Separating the shortwave bandsinto direct and diffuse components allows for the division of sunlit and shaded leaves, where sunlit portions ofthe canopy receive both direct and diffuse radiation and shaded portions receive only diffuse radiation. Thefraction of leaves that is shaded and sunlit varies throughout the canopy and depends on the relative positionof the Sun, canopy density, leaf orientation, and total radiative flux.
At each canopy layer photosynthesis is simulated using the leaf biochemical model described in theprevious section. It is applied separately for shaded and sunlit leaves and is dependent on canopy structurein several ways. First, canopy structure modulates the microenvironment and radiative fluxes experienced
Global Biogeochemical Cycles 10.1002/2014GB004848
BAGLEY ET AL. ©2015. American Geophysical Union. All Rights Reserved. 4

by a leaf at a given canopy layer. Also, leaf photosynthetic capacity for sunlit and shaded portions of thecanopy is assumed to decline from the top to bottom of the canopy as
Vc;max Lcumð Þ ¼ Vc;max 0ð Þ �exp �kn � Lcum½ � (5)
where Lcum is the cumulative leaf area index (LAI) from the top of the canopy, Vc,max(0) is Vc,max at the top ofthe canopy, and kn is an assumed exponential decay factor of canopy nitrogen equal to 0.5 [Drewry et al.,2010a; Leuning et al., 1995]. Analogous expressions for Rd and Jmax are used to account for their relatedreductions throughout the canopy. Similarly, fluxes of energy and water are modeled separately for theshaded and sunlit portions of a canopy layer. This generally results in differing values of leaf state variablesincluding gs, leaf temperature, and Ci, which can feed back on the canopy microenvironment of [CO2], airtemperature, and vapor pressure resulting in a tightly coupled system that requires the simultaneoussolutions of energy, moisture, and carbon balances throughout the canopy. Once a solution is found,aggregating the shaded and sunlit photosynthesis at each layer and summing over the canopy determinecanopy-scale photosynthesis:
A′c ¼
XNi¼1
Ai;sunLi;sun þ Ai;shadeLi;shade (6)
where “i” represents a canopy layer, N is the number of canopy layers, Ai,sun(shade) is sunlit(shaded) leafphotosynthesis (μmolm�2 s�1), and Li,sun(shade) is the sunlit(shaded) LAI (m2m�2) of canopy layer i.
In MLCan net leaf carbon assimilation (An) and stomatal conductance (gs) were linked with the Ball-Berryequation [Ball and Berry, 1987]:
gs ¼ f sv�mAn�hsCS
þ b (7)
where the slope (m) and intercept (b) are parameters specific to soybean, fsv is the stomatal sensitivity to leafwater potential (ψl), hs is the leaf surface relative humidity, and Cs is leaf surface [CO2]. Despite the Ball-Berrymodel’s empirical origin, it has been shown to accurately represent the response of gs to environmentalconditions. In the 385-HOT and 585-HOT treatment scenarios in this study gs at the top of the canopydecreased on average by 18% and 36%, respectively, which was similar in magnitude to experimental resultsfrom Ruiz-Vera et al. [2013] and indicates that gs was responding to environmental conditions in a mannerconsistent with observations. With zero representing total loss of stomatal conductance when ψl reachescritical water potential [Tuzet et al., 2003], fsv can range from 0 to 1. The formulation for fsv in MLCan dependson soy-specific reference potential (ψf ) and sensitivity parameter (sf ):
f sv ¼ 1þ exp sf �Ψf½ �1þ exp sf Ψf � Ψlð Þ½ � (8)
Table 1. Seasonal Mean (± SE) Values for the Maximum Velocity of Carboxylation (Vc,max; μmol m�2 s�1) andMaximumRate of Photosynthetic Electron Transport (Jmax; mmol m�2 s�1) Used in the Photosynthesis Modelinga
Treatment Vc,max Jmax
2009385-CON 131.8 ± 3.0 214.6 ± 5.2385-HOT 135.5 ± 3.0 198.8 ± 5.2585-CON 115.7 ± 3.1 208.3 ± 5.3585-HOT 118.0 ± 3.1 195.5 ± 5.3
2011385-CON 133.4 ± 3.2 192.7 ± 5.5385-HOT 133.4 ± 3.2 176.8 ± 5.5585-CON 113.3 ± 3.2 183.6 ± 5.5585-HOT 115.9 ± 3.2 168.6 ± 5.5
aThese values are derived from A versus Ci response curves measured at 25°C [Rosenthal et al., 2014] in soybean leavesand exposed to control CO2 and temperature (385-CON), control CO2 and a temperature increase of 3.5°C (385-HOT),[CO2] increased by 200μmolmol�1 above background and control temperature (585-CON), and both elevated temperatureand [CO2] (585-HOT) at the Soybean Free-Air CO2 Enrichment (SoyFACE) Temperature by Free-Air CO2 Enrichment (T-FACE)experiment. SE values were calculated usingmixed model analysis of variance onmeasurements taken across 6 days in 2009and 5 days in 2011 using a fully factorial design with four plots for each treatment.
Global Biogeochemical Cycles 10.1002/2014GB004848
BAGLEY ET AL. ©2015. American Geophysical Union. All Rights Reserved. 5

MLCan simulated canopy photosynthesisin 30min steps using meteorologicaldata from the Bondville, Illinois, Amerifluxsite for 2009 and 2011. These data included2m air temperature, vapor pressure,downwelling shortwave radiation, windspeed, and precipitation. The LAI wasspecified from observations taken atSoyFACE interpolated to daily values forboth the 2009 and 2011 growing seasonsusing methods described previously[Dermody et al., 2006]. The simulationperiod for each year was defined as thedays when the observed LAI was greaterthan 3.5m2m�2 for the 385-CON plots.The canopy height was assumed to be1m during these simulation periods.Further details of the parameters used inMLCan can be found in Drewry et al.[2010a, 2010b]. Finally, as described belowwe simulated several scenarios withcombinations of increased atmospheric
[CO2] and temperature (Table 1). In the increased [CO2] simulations, the atmospheric [CO2] concentrationwas constant, with a value of 585μmolmol�1, and for standard atmospheric [CO2] simulations the ambient[CO2] was 385 μmolmol�1. These values did not change with season or time of day. For the increasedtemperature simulations (HOT scenarios in Table 1), the observed ambient 2m air temperature was uniformlyincreased by 3.5°C during the growing season. This occurred every hour of the day. Specific humidity wasassumed to remain constant during all simulations.
3. Results and Discussion3.1. Temperature Responses of Model Parameters
The leaf photosynthesis model [Farquhar et al., 1980] utilizes a biochemical approach based on Michaelis-Menton enzyme kinetics to represent Rubisco-limited photosynthesis. The temperature functions integratedinto the model represent changes in key biochemical parameters based on in vitro measurements collectedfrom a range of different studies [Long, 1991]. Many of the parameters used in Long [1991] appear relativelysimilar in their temperature sensitivity to the temperature functions derived from in vivo measurements(Figure S1 in the supporting information). Notable differences include the lack of a significant temperaturefunction of Ko and a more rapid increase in Rd for the previous parameters [Long, 1991] relative to theparameters used here (supporting information Figure S1). The temperature response of Jmax is relativelysimilar between Long [1991] and Bernacchi et al. [2003], with approximately 10% differences between thesetemperature functions at the higher and lower temperature extremes.
3.2. Temperature Response of Leaf-Level Photosynthesis
Leaf photosynthesis was modeled at [CO2] of 400, 600, and 800μmolmol�1 using the current [Bernacchiet al., 2001, 2003] and previous [Long, 1991] temperature functions (Figure 1). As expected, the kinetics ofRubisco increasingly favored oxygenation over carboxylation as temperature rose, as indicated by the morerapid increase in Kc relative to Ko (supporting information Figure S1). This, coupled with a rapid increase in Rdwith temperature (supporting information Figure S1), resulted in temperature optimum for current [CO2](approximately 400μmolmol�1) lower than leaf temperatures that often occur under natural settings (Figure 1).With increases in [CO2] beyond current levels, the model predicted a higher photosynthetic temperatureoptimum. Thismodel analysis showed that under current [CO2] the thermal optimumof photosynthesis is ~23°Cincreasing to 27°C at 600μmolmol�1 [CO2] and 32°C at 800μmolmol�1 [CO2] (Figure 1).
Figure 1. Modeled temperature response of photosynthesis for leavessimulated at 400 (solid line), 600 (dotted line), and 800 (dashed line) μmolmol�1 CO2 using the model parameters derived from Bernacchiet al. [2001, 2003] (black lines) and from Long [1991] (grey lines). Shownalso are photosynthesis temperature optimums based on modelparameters from Bernacchi et al. [2001, 2003] (closed circles) and Long[1991] (open triangles).
Global Biogeochemical Cycles 10.1002/2014GB004848
BAGLEY ET AL. ©2015. American Geophysical Union. All Rights Reserved. 6
Coupled with the increase in the thermal optimum was a significant interacting effect of temperature and[CO2] on photosynthetic rates. The modeled photosynthetic rates at 400μmolmol�1 [CO2] are quite similarbetween the parameterization used in Long [1991] and the one used here (Figure 1). At [CO2] above at400μmolmol�1, the outcomes of the alternative parameterizations begin to diverge both in absolute rate ofA as well as thermal optimum. Despite these differences, the theory behind the interacting effects oftemperature and [CO2] originally presented by Long [1991] is shown with both parameterizations.
3.3. Photosynthetic Acclimation Results in Lower Leaf Photosynthesis
The above modeling exercises were conducted using the same photosynthetic parameterization for allthree [CO2] levels. Different acclimation scenarios were originally conducted based on percentage decreasesin Vc,max, but at the time there was a lack of data focusing on acclimation to both [CO2] and temperature[Long, 1991]. More recent research has provided a wide range of acclimation information for a number of C3species grown in a variety of growth conditions [Medlyn et al., 2002; Bernacchi et al., 2005; Ainsworth andRogers, 2007; Wang et al., 2012]. A characterization of photosynthetic acclimation responses for Vc,max andJmax (μmolm�2 s�1) of soybean grown in the SoyFACE T-FACE facility was performed in 2009 and 2011(Table 1) (also see Rosenthal et al. [2014, Figure 2]) and used in the modeling exercise here.
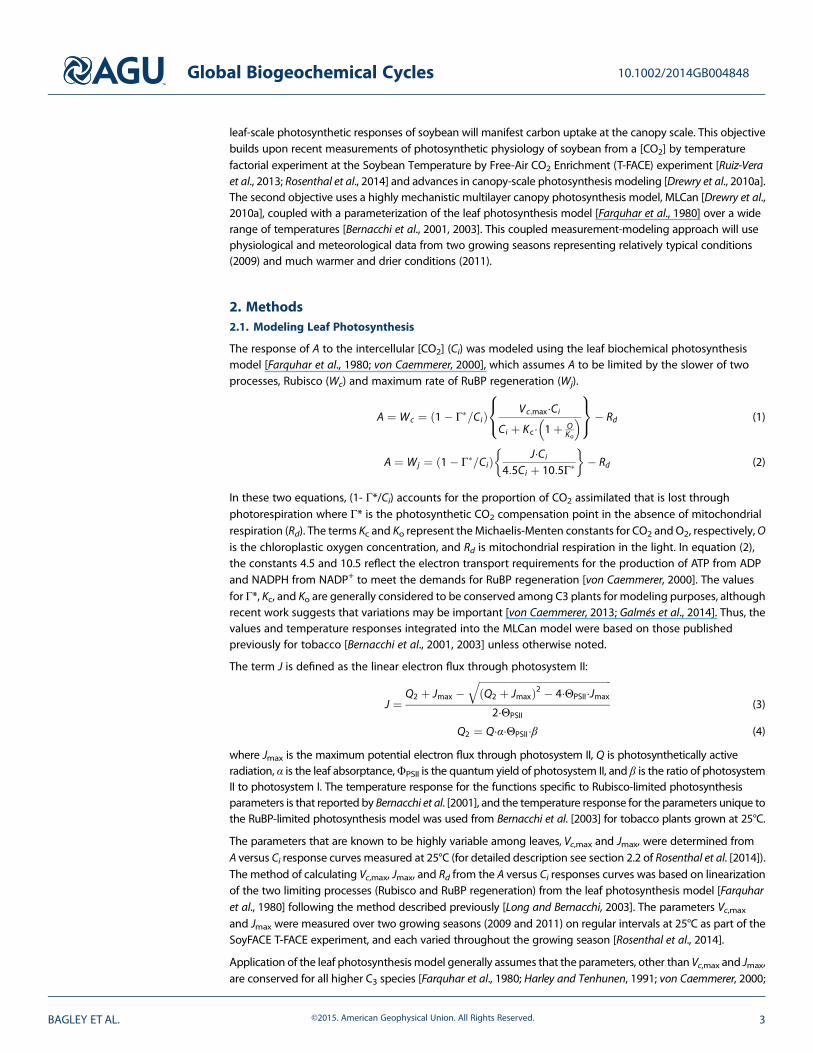
Accounting for the measured acclimation responses of Vc,max and Jmax to [CO2] and temperature individuallydid not remove the cooperative influence of temperature and [CO2] on photosynthesis (Figure 2). Elevated
Figure 2. The effect of acclimation to elevated [CO2] and/or elevated temperature on the response of photosynthesis totemperature. Parameters used to model A versus T relationship are season means for 2009 and 2011 as given in Table 1and reflect acclimation to season long growth at elevated temperature and/or elevated [CO2] [Rosenthal et al., 2014,Table 1]. Circles represent thermal optima.
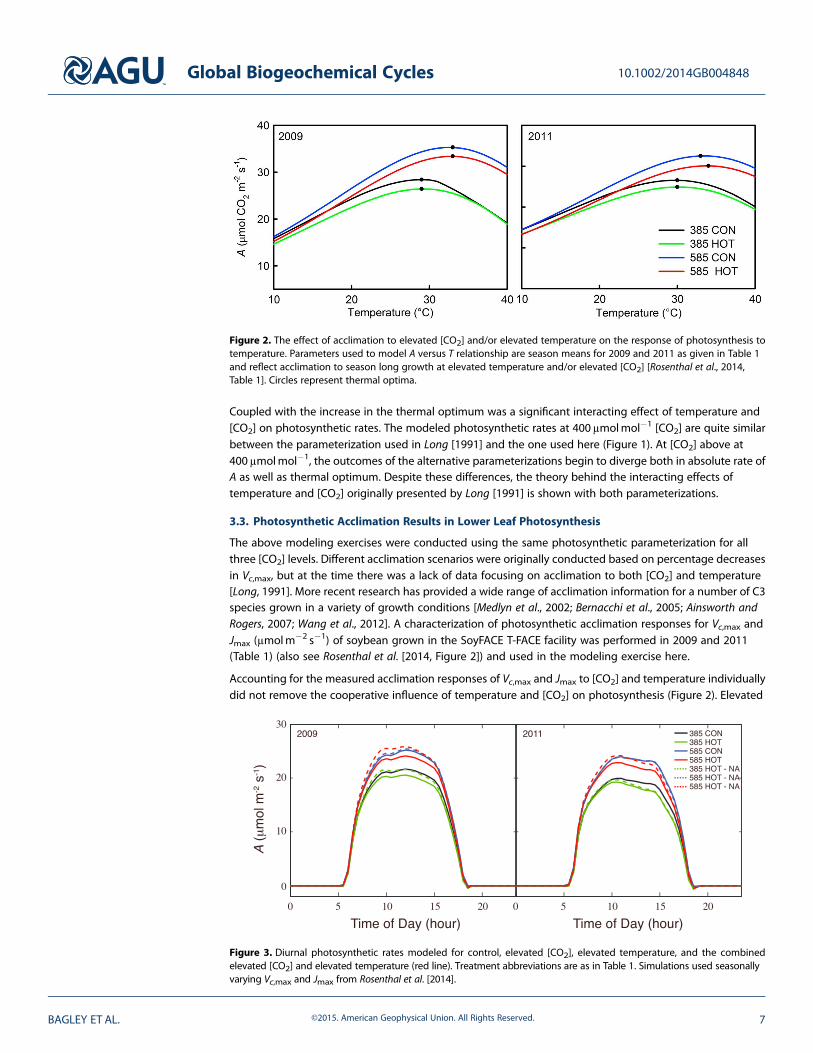
Figure 3. Diurnal photosynthetic rates modeled for control, elevated [CO2], elevated temperature, and the combinedelevated [CO2] and elevated temperature (red line). Treatment abbreviations are as in Table 1. Simulations used seasonallyvarying Vc,max and Jmax from Rosenthal et al. [2014].
Global Biogeochemical Cycles 10.1002/2014GB004848
BAGLEY ET AL. ©2015. American Geophysical Union. All Rights Reserved. 7

[CO2], even with the acclimation responses incorporated into the model, showed a substantial increase inA to a thermal optimum approaching 35°C for both years, while the control [CO2] scenarios reached theoptimum around or slightly below 30°C (Figure 2). However, experimentally higher temperatures within a[CO2] treatment (e.g., 385-CON versus 385-HOT and 585-CON versus 585-HOT) resulted in lower A at mosttemperatures, including the thermal optimum, but little to no change in the temperature at which thethermal optimum was reached (Figure 2). These observations are consistent with measured responses fromthe same experiment [Rosenthal et al., 2014] but contrary to previous studies showing an increase in thethermal optimum with growth at higher temperatures [Kattge and Knorr, 2007]. Our results indicate thatacclimation of Vc,max and Jmax to higher temperatures will not increase the thermal optimum beyond that
Table 2. Calculated Daily Integrated Carbon Assimilation (A′; mol m�2 s�1) and Season-Integrated Canopy Assimilation(Ac′; mol m�2 d�1) for Two Growing Seasons Using Seasonally Varying Vc,max and Jmax
a
A′ % Ac′ %
2009385-CON 0.744 0.0% 59.28 0.0%385-HOT 0.705 �5.2% 55.24 �6.8%585-CON 0.860 15.6% 70.15 18.3%585-HOT 0.828 11.3% 66.95 12.9%385-HOT = NA 0.739 �0.6% 57.74 �2.6%585-CON =NA 0.867 16.5% 69.43 17.1%585-HOT = NA 0.877 17.9% 69.99 18.1%
2011385-CON 0.695 0.0% 59.59 0.0%385-HOT 0.656 �5.6% 54.20 �9.1%585-CON 0.837 20.4% 72.68 22.0%585-HOT 0.791 13.8% 67.28 12.9%385-HOT = NA 0.668 �3.9% 56.50 �5.20%585-CON =NA 0.831 19.6% 71.50 20.0%585-HOT = NA 0.824 18.5% 70.42 18.2%
aThe percentages reflect the change in the treatments relative to the control (385-CON). The treatment abbreviationare as in Table 1; the NA (no acclimation) specifies the model results without considering acclimation of Vc,max or Jmax.
Figure 4. (top row) Meteorological conditions and (bottom row) observed leaf area index measured in (left column) 2009and (right column) 2011. In Figure 4 (top row) the red lines represent the daily maximum and blue lines daily minimumtemperatures, the black line represents the mean daily solar radiation, and the bars represent daily total precipitation.
Global Biogeochemical Cycles 10.1002/2014GB004848
BAGLEY ET AL. ©2015. American Geophysical Union. All Rights Reserved. 8
of [CO2] alone, and photosyntheticacclimation to increasing temperaturessuppresses A across the range oftemperatures likely to be encounteredduring a growing season.
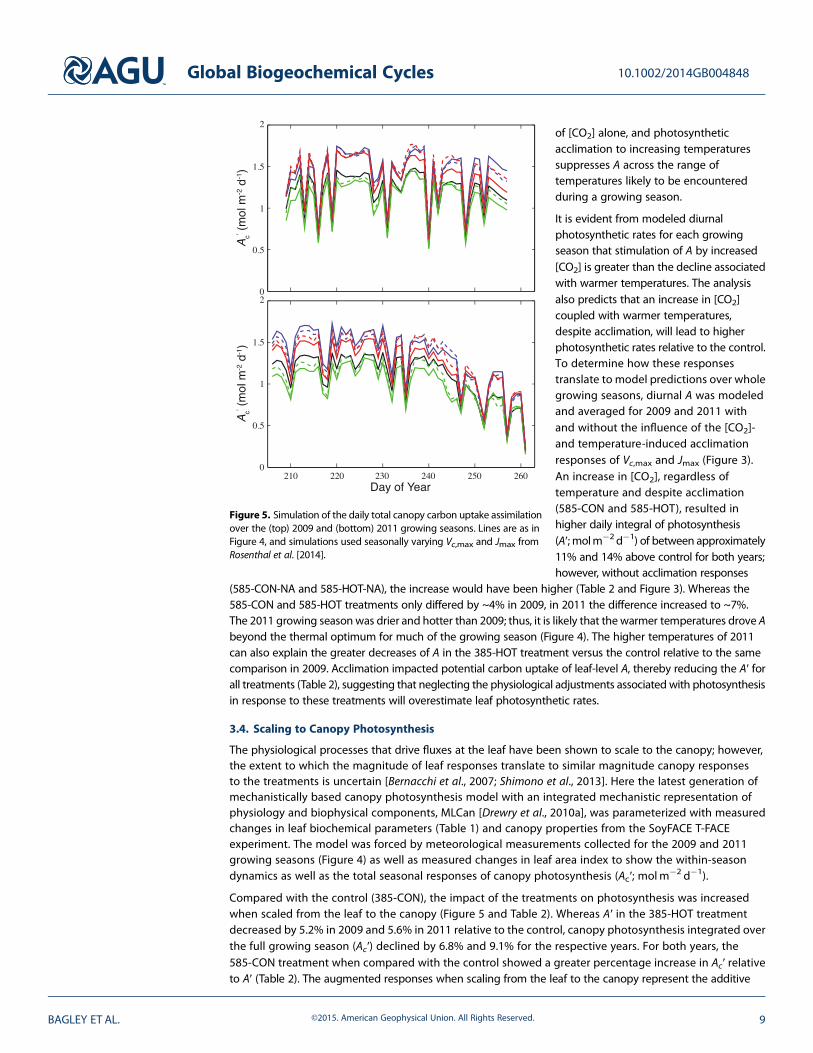
It is evident from modeled diurnalphotosynthetic rates for each growingseason that stimulation of A by increased[CO2] is greater than the decline associatedwith warmer temperatures. The analysisalso predicts that an increase in [CO2]coupled with warmer temperatures,despite acclimation, will lead to higherphotosynthetic rates relative to the control.To determine how these responsestranslate to model predictions over wholegrowing seasons, diurnal A was modeledand averaged for 2009 and 2011 withand without the influence of the [CO2]-and temperature-induced acclimationresponses of Vc,max and Jmax (Figure 3).An increase in [CO2], regardless oftemperature and despite acclimation(585-CON and 585-HOT), resulted inhigher daily integral of photosynthesis(A′; molm�2 d�1) of between approximately11% and 14% above control for both years;however, without acclimation responses
(585-CON-NA and 585-HOT-NA), the increase would have been higher (Table 2 and Figure 3). Whereas the585-CON and 585-HOT treatments only differed by ~4% in 2009, in 2011 the difference increased to ~7%.The 2011 growing seasonwas drier and hotter than 2009; thus, it is likely that the warmer temperatures drove Abeyond the thermal optimum for much of the growing season (Figure 4). The higher temperatures of 2011can also explain the greater decreases of A in the 385-HOT treatment versus the control relative to the samecomparison in 2009. Acclimation impacted potential carbon uptake of leaf-level A, thereby reducing the A′ forall treatments (Table 2), suggesting that neglecting the physiological adjustments associated with photosynthesisin response to these treatments will overestimate leaf photosynthetic rates.
3.4. Scaling to Canopy Photosynthesis
The physiological processes that drive fluxes at the leaf have been shown to scale to the canopy; however,the extent to which the magnitude of leaf responses translate to similar magnitude canopy responsesto the treatments is uncertain [Bernacchi et al., 2007; Shimono et al., 2013]. Here the latest generation ofmechanistically based canopy photosynthesis model with an integrated mechanistic representation ofphysiology and biophysical components, MLCan [Drewry et al., 2010a], was parameterized with measuredchanges in leaf biochemical parameters (Table 1) and canopy properties from the SoyFACE T-FACEexperiment. The model was forced by meteorological measurements collected for the 2009 and 2011growing seasons (Figure 4) as well as measured changes in leaf area index to show the within-seasondynamics as well as the total seasonal responses of canopy photosynthesis (Ac′; molm�2 d�1).
Compared with the control (385-CON), the impact of the treatments on photosynthesis was increasedwhen scaled from the leaf to the canopy (Figure 5 and Table 2). Whereas A′ in the 385-HOT treatmentdecreased by 5.2% in 2009 and 5.6% in 2011 relative to the control, canopy photosynthesis integrated overthe full growing season (Ac′) declined by 6.8% and 9.1% for the respective years. For both years, the585-CON treatment when compared with the control showed a greater percentage increase in Ac′ relativeto A′ (Table 2). The augmented responses when scaling from the leaf to the canopy represent the additive
Figure 5. Simulation of the daily total canopy carbon uptake assimilationover the (top) 2009 and (bottom) 2011 growing seasons. Lines are as inFigure 4, and simulations used seasonally varying Vc,max and Jmax fromRosenthal et al. [2014].
Global Biogeochemical Cycles 10.1002/2014GB004848
BAGLEY ET AL. ©2015. American Geophysical Union. All Rights Reserved. 9

effect of leaves at each level in thecanopy responding to theirmicroenvironment. Both years showedconsistent decreases in Ac′ for the585-HOT relative to the 585-CONtreatment. These results indicated thathigher temperatures partially offsetthe benefit of elevated [CO2] forphotosynthesis at the canopy scale andthat leaf-level responses of A to thesetreatments do not scale perfectly tothe canopy.
The model was used to determine therole of biochemical (Vc,max and Jmax)and canopy (measured as leaf areaindex; LAI) acclimation in influencingthe rates of Ac. This was done byrunning the model with and withoutthe measured acclimation responses.In addition to the direct acclimationassociated with Vc,max, Jmax, and LAI,the model incorporates indirectfeedbacks associated with biophysics[Drewry et al., 2010a]. Consistent withprevious analysis [Drewry et al., 2010a,2010b], changes in LAI betweentreatments had only a small influenceon canopy photosynthetic rates (datanot shown), and treatment effectson Ac′ were dominated by differences inthe acclimated versus nonacclimatedbiochemical parameters. For the385-HOT and 585-HOT treatments, Ac′was lower in the acclimated scenariocompared with the nonacclimatedscenario for both years, similar to thatobserved for A′ (Table 2). The decreasein Ac′ between the acclimated andnonacclimated circumstances in the585-CON treatment was negligible;both years showed lower Ac′ in theacclimated circumstance which waslikely driven by the slightly lower Jmax
similar to that observed using thesame model parameterized with
different growing season data [Drewry et al., 2010b]. Consistent with measurements over multiple years atthe SoyFACE facility was the decrease in Vc,max for plants grown in elevated compared with ambient [CO2][e.g., Bernacchi et al., 2005]; this response was also observed for the measurements collected in 2009and 2011 where Vc,max was much lower for the 585-CON relative to the 385-CON treatments (Table 1).Despite the lower Vc,max in the 585-CON treatments relative to control, previous work shows that soybeanplants are seldom limited by Vc,max when grown in elevated [CO2] [Bernacchi et al., 2005]. Thus, thesedecreases in Vc,max are not predicted, nor are they shown, to influence photosynthesis in elevated [CO2](e.g., Figure 5 and Table 2).
Figure 6. Visual representation of (first row) photosynthesis through thesoybean canopy for 2009, (second row) difference plots of the treatmentminus control, and (third row) difference plots of acclimated minusnonacclimated for the 2009 growing season. (fourth to sixth rows)Similar plots for the 2011 growing season. Each plot represents A ordifferences in A (color and intensity) through the vertical canopy profile(Y axis) over the diurnal time course (X axis). Simulations used seasonallyvarying Vc,max and Jmax from Rosenthal et al. [2014].
Global Biogeochemical Cycles 10.1002/2014GB004848
BAGLEY ET AL. ©2015. American Geophysical Union. All Rights Reserved. 10
The amplification of the leaf-scale responses to the canopy is illustrated using contour plots of photosynthesisthrough the vertical plant canopy throughout the diel time course (Figure 6). In soybean, the top approximately20 cm of the plant canopy dominated Ac; this is where the greatest density of foliage is located and themajorityof PAR is absorbed. The influence of higher temperatures in the 385-HOT treatment appears to dominatephotosynthetic rates exclusively in this area of high leaf density (Figure 6). While the elevated [CO2] treatments(585-CON and 585-HOT) appear to have some attenuation of CO2 responses even in the less dense subcanopy,the majority of the canopy responses occurred near the top of the canopy (Figure 6).
The role of acclimation in reducing photosynthetic potential is also depicted over the diel time course (Figure 6).It is clear that the role of acclimation was negligible through the canopy for the 585-CON scenario but thatthe warmed plots saw a large influence at the top of the plant canopy (Figure 6). Consistent with previousreports, this analysis suggests that neglecting biochemical acclimation to elevated [CO2] is not likely to have asignificant impact on ecosystem-scale models [Drewry et al., 2010b] but neglecting the impact of biochemicalacclimation to higher temperature environments, with or without concomitant increases in [CO2], are likelyto substantially overestimate leaf (Figure 3) and canopy (Figure 5) photosynthesis.
4. Conclusion
The results of this analysis are driven bymodel output using theMLCanmodel, which has been validated againsta wide range of measurementsmade at various spatial and temporal scales, including leaf gas exchange, canopyarchitecture measurements, eddy covariance, and other micrometeorological measurements, for soybean[Drewry et al., 2010a, 2010b]. The parameterization in this study is based on the most intensive measurementsmade to date on field-grown soybean exposed to elevated [CO2] and temperature [Ruiz-Vera et al., 2013;Rosenthal et al., 2014] and the modeled leaf responses of A to temperature match with the measured responsesreported previously [Rosenthal et al., 2014]. Thus, these results represent for soybean the most complete modelanalysis of leaf and canopy photosynthesis to two major components of future climate change. However,important uncertainties remain in this analysis. For example, the measurements of Vc,max and Jmax were takenat the top of the canopy, and photosynthetic capacity was assumed to decrease through the canopy in amanner identical in all scenarios (equation (5)). Further, the influence of growth temperature effects on gm isuncertain as is the possibility that the temperature response of Jmax varies with growth conditions, which maypotentially influence the results of this analysis, although previous evidence suggests that adjustment of theJmax temperature response to growth temperature is likely to be small with only a 3.5°C difference in growthconditions. Nevertheless, these are potential oversimplifications that additional measurements may clarify.Additionally, to focus on impacts of photosynthetic acclimation by the simulation period in this study is restrictedto the time when the canopy is closed. This limits the capability of this study to relate the observed changes incanopy photosynthesis to overall crop yield and total biomass, which would be an important extension. Finally,although the weather conditions in the years represented in this study are distinctly different, they are by nomeans representative of the full range of potential environmental conditions. As such, significant uncertaintyremains of how varying seasonal conditions may influence soybean’s physiological response to rising [CO2] andtemperature. Finally, although the equations underpinning theMLCanmodel are state of the art, uncertainties andapproximations exist and continual advancements are being made to improve the physics of mechanistic cropmodels. This is particularly relevant when modeling responses to currently atypical environmental conditions.
The theory behind the interactions of [CO2] and temperature on photosynthesis is well established. This hascontributed to the photosynthesis model developed by Farquhar and colleagues becoming ubiquitous instate-of-the-art ecosystem, agricultural, and global land surface models. However, photosynthetic parameterssuch as Vc,max and Jmax are generally derived for broad classes of vegetation and assumed to be invariant instudies of ecosystem productivity under changing global conditions. While this study was focused on soybean,we have shown that photosynthetic acclimation results in a less than predicted increase in productivity withconcomitant increases in [CO2] and temperature or with rises in temperature alone. Therefore, any ecosystemmodeling effort for soybean that neglects biochemical acclimation is, unlike with elevated [CO2] alone, likely tooverestimate ecosystem productivity. Further, while not all species show similar responses to increases in [CO2]and/or temperature, the responses of legumes and crops, particularly related towhether Vc,max or Jmax are limitingat elevated [CO2], may be relatively similar [Ainsworth and Rogers, 2007]. This suggests that the importance ofaccounting for acclimation of photosynthesis may extend beyond soybean to other major crop species.
Global Biogeochemical Cycles 10.1002/2014GB004848
BAGLEY ET AL. ©2015. American Geophysical Union. All Rights Reserved. 11

ReferencesAinsworth, E. A., and S. P. Long (2005), What have we learned from 15 years of free-air CO2 enrichment (FACE)? A meta-analytic review of the
responses of photosynthesis, canopy properties and plant production to rising CO2, New Phytol., 165, 351–371.Ainsworth, E. A., and A. Rogers (2007), The response of photosynthesis and stomatal conductance to rising [CO2]: Mechanisms and environmental
interactions, Plant Cell Environ., 30, 258–270.Ainsworth, E. A., et al. (2002), A meta-analysis of elevated [CO2] effects on soybean (Glycine max) physiology, growth and yield, Global Change
Biol., 8, 695–709.Ball, J., and J. Berry (1987), A model predicting stomatal conductance and its contribution to the control of photosynthesis under different
environmental conditions, in Progress in Photosynthesis Research, vol. 4, edited by J. Biggins, pp. 221–224, Marinus Nijhoff, Dordrecht, Netherlands.Bernacchi, C. J., E. L. Singsaas, C. Pimentel, A. R. Portis, and S. P. Long (2001), Improved temperature response functions formodels of Rubisco-limited
photosynthesis, Plant Cell Environ., 24, 253–259.Bernacchi, C. J., C. Pimentel, and S. P. Long (2003), In vivo temperature response functions of parameters required to model RuBP-limited
photosynthesis, Plant Cell Environ., 26, 1419–1430.Bernacchi, C. J., P. B. Morgan, D. R. Ort, and S. P. Long (2005), The growth of soybean under free air [CO2] enrichment (FACE) stimulates
photosynthesis while decreasing in vivo rubisco capacity, Planta, 220, 424–446.Bernacchi, C. J., et al. (2006), Hourly and seasonal variation in photosynthesis and stomatal conductance of soybean grown at future CO2 and
ozone concentrations for 3 years under fully open-air field conditions, Plant Cell Environ., 29, 2077–2090.Bernacchi, C. J., B. A. Kimball, D. R. Quarles, S. P. Long, and D. R. Ort (2007), Decreases in stomatal conductance of soybean under open air
elevation of [CO2] are closely coupled with decreases in ecosystem evapotranspiration, Plant Physiol., 143, 134–144.Carmo-Silva, E., J. C. Scales, P. J. Madgwick, and M. A. Parry (2014), Optimizing Rubisco and its regulation for greater resource use efficiency,
Plant Cell Environ., doi:10.1111/pce.12425.Cen, Y.-P., and R. F. Sage (2005), The regulation of Rubisco activity in response to variation in temperature and atmospheric CO2 partial
pressure in sweet potato, Plant Physiol., 139, 979–990.Collins, M., et al. (2013), Long-term climate change: Projections, commitments and irreversibility, in Climate Change 2013: The Physical Science
Basis. Contribution of Working Group I to the Fifth Assessment Report of the Intergovernmental Panel on Climate Change, edited by T. F. Stockeret al., pp. 1029–1136, Cambridge Univ. Press, Cambridge, U. K., and New York.
Curtis, P. S., and X. Wang (1998), A meta-analysis of elevated CO2 effects on woody plant mass, form, and physiology, Oecologia, 113, 299–313.Dai, Y., R. E. Dickinson, and Y.-P. Wang (2004), A two-big-leaf model for canopy temperature, photosynthesis, and stomatal conductance,
J. Clim., 17, 2281–2299.De Pury, D. G. G., and G. D. Farquhar (1997), Simple scaling of photosynthesis from leaves to canopy without the errors of big-leaf models,
Plant Cell Environ., 20, 537–557.Dermody, O., S. P. Long, and E. H. DeLucia (2006), How does elevated CO2 or ozone affect the leaf-area index of soybean when applied
independently?, New Phytol., 169, 145–155.Drewry, D. T., P. Kumar, S. P. Long, C. J. Bernacchi, X.-Z. Liang, and M. Sivapalan (2010a), Ecohydrological responses of dense canopies
to environmental variability: 1. Interplay between vertical structure and photosynthetic pathway, J. Geophys. Res., 115, G04022,doi:10.1029/2010JG001340.
Drewry, D. T., P. Kumar, S. P. Long, C. J. Bernacchi, X.-Z. Liang, and M. Sivapalan (2010b), Ecohydrological responses of dense canopies toenvironmental variability: 2. Role of acclimation under elevated CO2, J. Geophys. Res., 115, G04023, doi:10.1029/2010JG001341.
Farquhar, G. D., and T. D. Sharkey (1982), Stomatal conductance and photosynthesis, Annu. Rev. Plant Physiol., 33, 317–345.Farquhar, G. D., S. von Caemmerer, and J. A. Berry (1980), A biochemical model of photosynthetic CO2 assimilation in leaves of C3 species,
Planta, 149, 78–90.Galmés, J., J. Flexas, A. J. Keys, J. Cifre, R. A. C. Mitchell, P. J. Madgwick, R. P. Haslam, H. Medrano, and M. A. J. Parry (2005), Rubisco specificity
factor tends to be larger in plant species from drier habitats and in species with persistent leaves, Plant Cell Environ., 28, 571–579.Galmés, J., M. V. Kapralov, P. J. Andralojc, M. Á. Conesa, A. J. Keys, M. A. J. Parry, and J. Flexas (2014), Expanding knowledge of the Rubisco
kinetics variability in plant species: Environmental and evolutionary trends, Plant Cell Environ., 37(9), 1989–2001, doi:10.1111/pce.12335.Ge, Z. M., X. Zhou, S. Kellomaki, C. Zhang, H. Peltola, P. J. Martikainen, and K. Y. Wang (2012), Acclimation of photosynthesis in a boreal grass
(Phalaris arundinacea L.) under different temperature, CO2, and soil water regimes, Photosynthetica, 50, 141–151.Ghannoum, O., S. von Caemmerer, E. W. R. Barlow, and J. P. Control (1997), The effect of CO2 enrichment and irradiance on the growth,
morphology, and gas exchange of a C3 (Panicum laxum) and a C4 (Panicum antidotale) grass, Aust. J. Plant Physiol., 24, 227–237.Goudriaan, J. (1977), Crop micrometeorology: A simulation study, PhD thesis, Wageningen Univ., Netherlands.Harley, P. C., and J. D. Tenhunen (1991), Modeling the photosynthetic response of C3 leaves to environmental factors, in Modeling Crop
Photosynthesis: From Biochemistry to Canopy, Spec. Publ., vol. 19, edited by K. J. Boote and R. S. Loomis, pp. 17–39, Crop Science Society ofAmerica, Madison, Wis.
Hartmann, D. L., et al. (2013), Observations: Atmosphere and surface, in Climate Change 2013: The Physical Science Basis. Contribution ofWorking Group I to the Fifth Assessment Report of the Intergovernmental Panel on Climate Change, edited by T. F. Stocker et al., pp. 159–254,Cambridge Univ. Press, Cambridge, U. K., and New York.
Jordan, D. B., and W. L. Ogren (1984), The CO2/O2 specificity of ribulose 1,5-bisphosphate carboxylase/oxygenase, Planta, 161, 308–313.Karnosky, D. F., et al. (2003), Tropospheric O3 moderates responses of temperate hardwood forests to elevated CO2: A synthesis of molecular
to ecosystem results from the Aspen FACE project, Funct. Ecol., 17, 289–304.Kattge, J., and W. Knorr (2007), Temperature acclimation in a biochemical model of photosynthesis: A reanalysis of data from 36 species,
Plant Cell Environ., 30, 1176–1190.Kimball, B. A. (2005), Theory and performance of an infrared heater for ecosystem warming, Global Change Biol., 11, 2041–2056.Kimball, B. A., M. Conley, S. Wang, X. Lin, C. Luo, J. Morgan, and D. Smith (2008), Infrared heater arrays for warming ecosystem field plots,
Global Change Biol., 14, 309–320.Lawlor, D. W., and R. A. C. Mitchell (1991), The effects of increasing CO2 on crop photosynthesis and productivity: A review of field studies,
Plant Cell Environ., 14, 807–818.Leakey, A. D. B., F. Xu, K. M. Gillespie, J. M. McGrath, E. A. Ainsworth, and D. R. Ort (2009), Genomic basis for stimulated respiration by plants
growing under elevated carbon dioxide, Proc. Natl. Acad. Sci. U.S.A., 106, 3597–3602.Leuning, R., F. Kelliher, D. Pury, and E. Schulze (1995), Leaf nitrogen, photosynthesis, conductance and transpiration: Scaling from leaves to
canopies, Plant Cell Environ., 18, 1183–1200.Lobell, D. B., and S. M. Gourdji (2012), The influence of climate change on global crop productivity, Plant Physiol., 160, 1686–1697.
Global Biogeochemical Cycles 10.1002/2014GB004848
BAGLEY ET AL. ©2015. American Geophysical Union. All Rights Reserved. 12
AcknowledgmentsThe MLCan model is openly available athttps://github.com/HydroComplexity/MLCan, and all data provided in the figurescan be acquired via communication withthe corresponding author (C.J.B.).
Long, S. P. (1991), Modification of the response of photosynthetic productivity to rising temperature by atmospheric CO2 concentrations:Has its importance been underestimated?, Plant Cell Environ., 14, 729–739.
Long, S. P., and C. J. Bernacchi (2003), Gas exchange measurements, what can they tell us about the underlying limitations to photosynthesis?Procedures and sources of error, J. Exp. Bot., 54, 2393–2401.
Long, S. P., E. A. Ainsworth, A. Rogers, and D. R. Ort (2004), Rising atmospheric carbon dioxide: Plants face the future, Annu. Rev. Plant Biol., 55,591–628.
Medlyn, B. E., et al. (2002), Effects of elevated CO2 on photosynthesis in European forest species: A meta-analysis of model parameters, PlantCell Environ., 22, 1475–1495.
Medlyn, B. E., D. Barrett, J. Landsberg, P. Sands, and R. Clement (2003), Conversion of canopy intercepted radiation to photosynthate: Reviewof modelling approaches for regional scales, Funct. Plant Biol., 30, 153–169.
Norman, J. M. (1982), Simulation of microclimates, in Predicting Photosynthesis for Ecosystem Models, edited by J. L. Hatfield and I. J. Thompson,pp. 65–99, Academic, San Diego, Calif.
Nowak, R. S., D. S. Ellsworth, and S. D. Smith (2004), Functional responses of plants to elevated atmospheric CO2—Do photosynthetic andproductivity data from FACE experiments support early predictions?, New Phytol., 162, 253–280.
Ogren, W. L. (1984), Photorespiration: Pathways, regulation and modification, Annu. Rev. Plant Physiol., 35, 415–442.Peters, G. P., R. M. Andrew, T. Boden, J. G. Canadell, P. Ciais, C. Le Quéré, G. Marland, M. R. Raupach, and C. Wilson (2013), The challenge to
keep global warming below 2 C, Nat. Clim. Change, 3, 4–6.Rosenthal, D. M., U. M. Ruiz-Vera, M. H. Siebers, S. B. Gray, C. J. Bernacchi, and D. R. Ort (2014), Biochemical acclimation, stomatal limitation
and precipitation patterns underlie decreases in photosynthetic stimulation of soybean (Glycine max) at elevated [CO2] and temperaturesunder fully open air field conditions, Plant Sci., 226, 136–146, doi:10.1016/j.plantsci.2014.06.013.
Ruiz-Vera, U. M., M. Siebers, S. B. Gray, D. W. Drag, D. M. Rosenthal, B. A. Kimball, D. R. Ort, and C. J. Bernacchi (2013), Global warming cannegate the expected CO2 stimulation in photosynthesis and productivity for soybean grown in the Midwestern United States, PlantPhysiol., 162, 410–423.
Sage, R. F. (1994), Acclimation of photosynthesis to increasing atmospheric CO2: The gas-exchange perspective, Photosynth. Res., 39, 351–368.Sage, R. F., and D. S. Kubien (2007), The temperature response of C3 and C4 photosynthesis, Plant Cell Environ., 30, 1086–1106.Sage, R. F., T. Sharkey, and J. Seemann (1989), Acclimation of photosynthesis to elevated carbon dioxide in five C3 species, Plant Physiol., 89,
590–596.Sage, R. F., J. Santrucek, and D. Grise (1995), Temperature effects on the photosynthetic response of C-3 plants to long-term CO2 enrichment,
Vegetatio, 121, 67–77.Shimono, H., H. Nakamura, T. Hasegawa, and M. Okada (2013), Lower responsiveness of canopy evapotranspiration rate than of leaf stomatal
conductance to open-air CO2 elevation in rice, Global Change Biol., 19, 2444–2453.Sims, D. A., Y. Luo, and J. R. Seemann (1998), Comparison of photosynthetic acclimation to elevated CO2 and limited nitrogen supply in
soybean, Plant Cell Environ., 21, 945–952.Tissue, D. T., R. B. Thomas, and B. R. Strain (1993), Long-term effects of elevated CO2 and nutrients on photosynthesis and Rubisco in loblolly
pine seedlings, Plant Cell Environ., 16, 859–865.Tuzet, A., A. Perrier, and R. Leuning (2003), A coupled model of stomatal conductance, photosynthesis and transpiration, Plant Cell Environ.,
26, 1097–1116.Twine, T. E., J. J. Bryant, K. T. Richter, C. J. Bernacchi, K. D. M. McConnaughay, S. J. Morris, and A. D. B. Leakey (2013), Impacts of elevated CO2
concentration on the productivity and surface energy budget of the soybean and maize agroecosystem in the Midwest USA, GlobalChange Biol., 19, 2838–2852.
von Caemmerer, S. (2000), Biochemical Models of Leaf Photosynthesis, CSIRO, Collingwood, Victoria.von Caemmerer, S. (2013), Steady-state models of photosynthesis, Plant Cell Environ., 36, 1617–1630.Vu, J. C. V., L. H. Allen, K. J. Boote, and G. Bowes (1997), Effects of elevated CO2 and temperature on photosynthesis and Rubisco in rice and
soybean, Plant Cell Environ., 20, 68–76.Wang, D., S. A. Heckathorn, X. Z. Wang, and S. M. Philpott (2012), Ameta-analysis of plant physiological and growth responses to temperature
and elevated CO2, Oecologia, 169, 1–13.Wong, S. C. (1979), Elevated atmospheric partial pressure of CO2 and plant growth: I. Interactions of nitrogen nutrition and photosynthetic
capacity in C3 and C4 plants, Oecologia, 44, 68–74.Woodrow, I. E. (1994), Optimal acclimation of the C3 photosynthetic system under enhanced CO2, Photosynth. Res., 39, 401–412.
Global Biogeochemical Cycles 10.1002/2014GB004848
BAGLEY ET AL. ©2015. American Geophysical Union. All Rights Reserved. 13
Related Documents


