This article was originally published in a journal published by Elsevier, and the attached copy is provided by Elsevier for the author’s benefit and for the benefit of the author’s institution, for non-commercial research and educational use including without limitation use in instruction at your institution, sending it to specific colleagues that you know, and providing a copy to your institution’s administrator. All other uses, reproduction and distribution, including without limitation commercial reprints, selling or licensing copies or access, or posting on open internet sites, your personal or institution’s website or repository, are prohibited. For exceptions, permission may be sought for such use through Elsevier’s permissions site at: http://www.elsevier.com/locate/permissionusematerial

Welcome message from author
This document is posted to help you gain knowledge. Please leave a comment to let me know what you think about it! Share it to your friends and learn new things together.
Transcript
This article was originally published in a journal published byElsevier, and the attached copy is provided by Elsevier for the
author’s benefit and for the benefit of the author’s institution, fornon-commercial research and educational use including without
limitation use in instruction at your institution, sending it to specificcolleagues that you know, and providing a copy to your institution’s
administrator.
All other uses, reproduction and distribution, including withoutlimitation commercial reprints, selling or licensing copies or access,
or posting on open internet sites, your personal or institution’swebsite or repository, are prohibited. For exceptions, permission
may be sought for such use through Elsevier’s permissions site at:
http://www.elsevier.com/locate/permissionusematerial
Autho
r's
pers
onal
co
py
The influence of open space on ground-dwelling spider
assemblages within plantation forests
Anne G. Oxbrough *, Tom Gittings, John O’Halloran, Paul S. Giller, Tom C. Kelly
Department of Zoology, Ecology and Plant Science, Cooperage Building, University College Cork, Distillery Fields, North Mall, Cork, Ireland
Received 15 November 2005; received in revised form 17 July 2006; accepted 28 September 2006
Abstract
Sustainable forest management advocates the retention or creation of open space within plantation forests to enhance biodiversity. However, the
biodiversity value of these open spaces will depend on the habitat type chosen, as well as open-space size and shape. The present study investigated
ground-dwelling spider assemblages in glades, rides and forest roads of various sizes in 12 mature Sitka spruce (Picea sitchensis) plantations across
Ireland. Spiders were sampled along a transect from the open space into the forest using pitfall traps. Species richness and abundance declined
along the open-forest transect with the open-space supporting a unique spider fauna, absent within the forest. Total species richness and richness of
species associated with open habitats was significantly greater in the glades. There were few significant linear relationships between species
variables and open-space width or area, however roads and rides <15 m wide did not support an open spider fauna due to the influence of the
canopy. No such ‘threshold’ area was found for glades, probably because the glades investigated did not cover a low range of areas. Open-space
habitat type is an important determinant of spider assemblage structure, although open spaces’ with high shrub cover or unplanted broadleaves did
not differ in assemblage structure from those within the plantation. At a large scale the total amount of open space within 200 m of sampling plots
was positively correlated with species richness and abundance. Forest management plans should encourage the retention of a range of habitat types
in non-linear open space (glades), whereas the biodiversity value of linear open space (rides and roads) will be enhanced if wider than 15 m.
# 2006 Elsevier B.V. All rights reserved.
Keywords: Spider assemblages; Open-space size; Plantation; Forest management; Ride; Forest road; Glade
1. Introduction
One of the goals of sustainable forest management is the
enhancement of biodiversity within plantation forests (Coillte,
2005). This can include measures to promote plantations as
woodland habitats to the benefit of forest specialist species. Such
strategies include the promotion of deadwood (Ferris and
Humphrey, 1999), longer rotation lengths (Jukes et al., 2001),
and the enhancement of field layer vegetation (Oxbrough et al.,
2005). However, measures to promote biodiversity must also
examine the effect of afforestation on landscapes, which can lead
to the loss of habitats supporting rare or specialised species. More
specifically, sustainable forest management must address how
species that are typical of pre-planting habitats, and cannot
survive in a forest environment, can be retained within forests.
This is especially important in an Irish context where around
10,000 ha of land is afforested annually (Forest Service, 2004). In
addition to this the Irish government ultimately aims to increase
the national forest cover from 10 to 17% (COFORD, 2000).
The Irish Forest Biodiversity Guidelines (Forest Service,
2000) state that 15% of the forest area should incorporated into
Areas for Biodiversity Enhancement (ABE), recommending
that these areas should comprise approximately 5–10% retained
habitats and 5–10% open space in plantations greater than
10 ha. In order for the maximum biodiversity value to be
derived from these ABEs, forest managers need to know which
areas to target for open space. More specifically, what habitats
should be retained to maximise biodiversity value? And, what
size and shape should the open space be in order to facilitate the
retention of open-space species?
For plants and invertebrates the level of shade in open space
within forests is a key factor affecting the species present
(Warren, 1989; Sparks and Greatorex-Davies, 1992; Sparks et al.,
1996). Shade levels are primarily determined by open-space
width, height of surrounding trees and orientation (Warren and
Fuller, 1993). Current guidelines vary in the minimum width
necessary to promote species associated with open habitats.
Often quoted as a ‘rule of thumb’ is the 1:1 ratio of tree height to
www.elsevier.com/locate/foreco
Forest Ecology and Management 237 (2006) 404–417
* Corresponding author. Tel.: +353 214904677; fax: +353 214904664.
E-mail address: [email protected] (A.G. Oxbrough).
0378-1127/$ – see front matter # 2006 Elsevier B.V. All rights reserved.
doi:10.1016/j.foreco.2006.09.063
Autho
r's
pers
onal
co
py
ride width (Carter, 1989; Warren and Fuller, 1993). However
Irish guidelines recommend that forest rides should be 6 m wide,
and forest road corridors should be 15 m wide, in order to qualify
for inclusion as an Area for Biodiversity Enhancement (Forest
Service, 2003). Furthermore, Warren and Fuller (1993)
recommend that some forest glades should be at least 0.25 ha
in size to encourage biodiversity.
Previous research has examined the influence of orientation
and width on diversity of invertebrates within rides and forest
roads, with particular interest in the affects on butterflies
(Warren, 1989; Greatorex-Davies et al., 1992, 1993; Sparks
et al., 1996). Other invertebrate groups examined include
Coleoptera and Hemiptera (Greatorex-Davies and Sparks,
1994); and mixed groups of arthropods (Carter, 1989; Mullen
et al., 2003). Fewer studies have focused on the biodiversity
value of different types of open space (such as forest roads,
rides and glades) and of varying open-space size. There is also a
need to investigate the influence of open space within forests on
different invertebrate taxa, enabling forest management plans
to try to reach a consensus on the best way to manage open
habitats for a range of invertebrate groups. Spiders are useful as
indicators of habitat change as they are primarily affected by
changes in habitat structure (Uetz, 1991). Spiders also occupy
an important position in terrestrial food webs as both predators
and prey and hence have the potential to be used as surrogate
indicators of invertebrate diversity (Marc et al., 1999).
The aim of this study was to assess the influence of open
space in plantation forests on ground-dwelling spider assem-
blages by addressing the following questions: firstly, how does
open space enhance spider diversity within plantation forests;
and secondly, how does the type of open space and its size
influence spider diversity within plantation forests?
2. Methodology
2.1. Study areas
Twelve commercially mature Sitka spruce (Picea sitchensis)
stands of at least 80 ha were sampled within Ireland. The stands
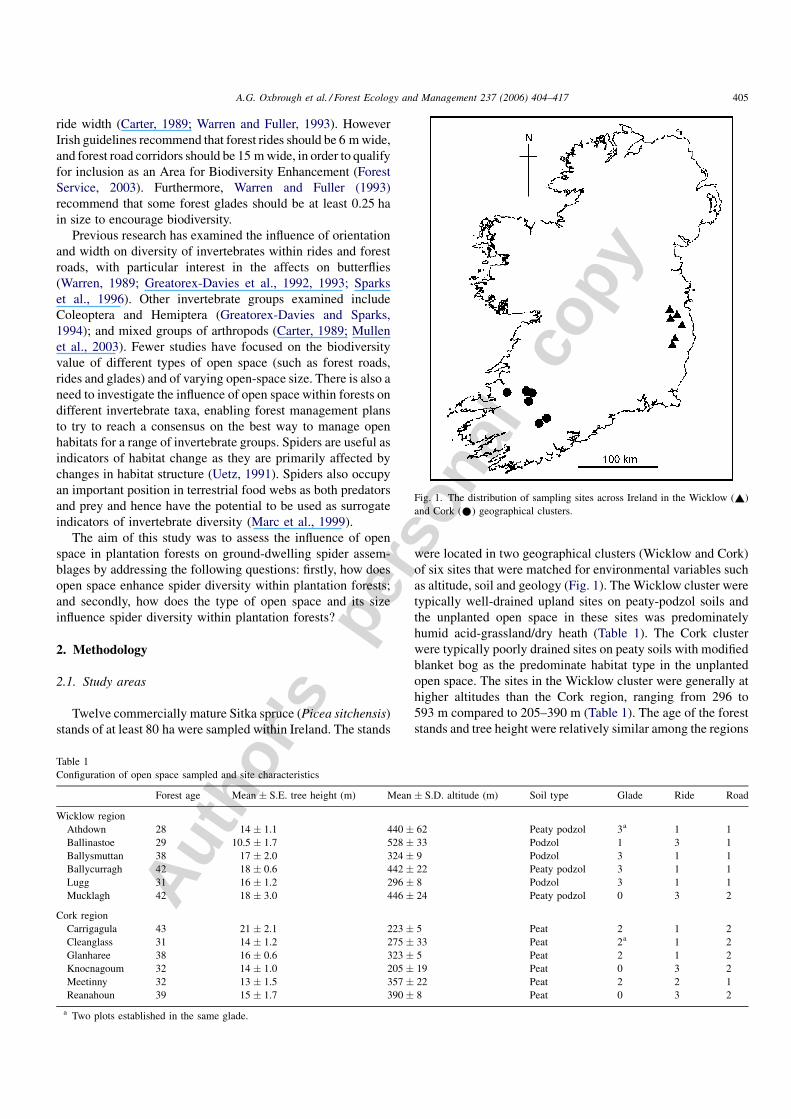
were located in two geographical clusters (Wicklow and Cork)
of six sites that were matched for environmental variables such
as altitude, soil and geology (Fig. 1). The Wicklow cluster were
typically well-drained upland sites on peaty-podzol soils and
the unplanted open space in these sites was predominately
humid acid-grassland/dry heath (Table 1). The Cork cluster
were typically poorly drained sites on peaty soils with modified
blanket bog as the predominate habitat type in the unplanted
open space. The sites in the Wicklow cluster were generally at
higher altitudes than the Cork region, ranging from 296 to
593 m compared to 205–390 m (Table 1). The age of the forest
stands and tree height were relatively similar among the regions
Fig. 1. The distribution of sampling sites across Ireland in the Wicklow (~)
and Cork (*) geographical clusters.
Table 1
Configuration of open space sampled and site characteristics
Forest age Mean � S.E. tree height (m) Mean � S.D. altitude (m) Soil type Glade Ride Road
Wicklow region
Athdown 28 14 � 1.1 440 � 62 Peaty podzol 3a 1 1
Ballinastoe 29 10.5 � 1.7 528 � 33 Podzol 1 3 1
Ballysmuttan 38 17 � 2.0 324 � 9 Podzol 3 1 1
Ballycurragh 42 18 � 0.6 442 � 22 Peaty podzol 3 1 1
Lugg 31 16 � 1.2 296 � 8 Podzol 3 1 1
Mucklagh 42 18 � 3.0 446 � 24 Peaty podzol 0 3 2
Cork region
Carrigagula 43 21 � 2.1 223 � 5 Peat 2 1 2
Cleanglass 31 14 � 1.2 275 � 33 Peat 2a 1 2
Glanharee 38 16 � 0.6 323 � 5 Peat 2 1 2
Knocnagoum 32 14 � 1.0 205 � 19 Peat 0 3 2
Meetinny 32 13 � 1.5 357 � 22 Peat 2 2 1
Reanahoun 39 15 � 1.7 390 � 8 Peat 0 3 2
a Two plots established in the same glade.
A.G. Oxbrough et al. / Forest Ecology and Management 237 (2006) 404–417 405
Autho
r's
pers
onal
co
py
ranging from 28 to 42 years in the Wicklow region and 31 to 43
years in the Cork region whereas tree height ranged from 14 to
18 and 14 to 21 m, respectively.
2.2. Open-space configurations
The open space (unplanted areas) was categorised into three
types: forest road edges; rides (areas of linear open space
separating stands of even aged trees of the same canopy species);
and glades (non-linear open space). Digitised aerial photographs
were used to identify the open space within each site and to select
suitable areas for sampling. Five areas of open space were
sampled per site, with at least one from each open-space type
where possible (Table 1). However, three sites did not contain any
glades and two sites had only one large glade (>6 ha), so in this
case, two sampling plots were established within the open space,
with plots always separated by a minimum of 100 m (Table 1). A
total of 60 plots of open space were sampled comprising 21
glades, 21 rides and 18 roads. The plots were all located on the
south facing side (or southwest/west where south facing was not
possible) of the open space in a homogenous area of vegetation
which was typical of the open space being sampled.
2.3. Spider sampling
Pitfall traps were used to sample the ground-dwelling spider
fauna. Pitfalls consisted of a plastic cup, 7 cm in diameter by
9 cm depth. Each trap had several drainage slits pierced
approximately 2 cm from the top of the cup and was filled with
antifreeze (ethylene glycol) to a depth of 1 cm to act as a killing
and preserving agent. The traps were placed in holes dug with a
bulb corer so that the rim was flush with the surface of the
ground.
Sampling plots consisted of pitfall traps arranged in a transect
from the open space into the forest. Each sample point on the
transect consisted of three pitfall traps, each set 2 m apart which
were arranged perpendicular to the forest edge. Two of these
traps were used in the analysis with the third to be used only if
traps were lost due to flooding or animal damage. Five sampling
points were established on the transect in the following locations:
open (centre of the open space); open-boundary (2 m into the
open space from tree trunks); boundary (tree trunk); forest-
boundary (2 m into the forest from the tree trunk); forest (5 m
into the forest interior). The traps were set in May 2004 and were
active for nine consecutive weeks, being emptied every 3 weeks.
Sampling duration was considered adequate as most spider
species are abundant as adults in May and June (Niemela et al.,
1994; Harvey et al., 2002) and ground-dwelling spiders have
been successfully compared in forested habitats over a similar
duration in previous studies (e.g. Pajunen et al., 1995).
2.4. Environmental variables
The percentage cover of vegetation was recorded in a 1 m2
quadrat surrounding two of the pitfall traps in each sample point
on the transect in the following structural layers: ground
vegetation (0–10 cm); lower-field layer (>10–50 cm) and
upper field layer (>50–200 cm). Cover of other features such as
deadwood and litter were also recorded using this scale and
litter depth was measured within each quadrat. All cover values
were estimated using the Braun–Blanquet scale (Mueller-
Dombois and Ellenberg, 1974), which involves giving
numerical rankings to a range of percentages (+ = <1% cover;
1 = 1–5%; 2 = 6–25%; 3 = 26–50%; 4 = 51–75%; 5 = 76–
100%).
Soil samples were taken from the Open, Boundary and
Forest sampling points on the transect using a bulb corer which
extracted the top layer of substrate to a depth of 15 cm. Organic
content of the soil was obtained by firing dried soil samples in a
furnace for 3 h at 550 8C and calculating weight loss on ignition
(Grimshaw, 1989). Hemispherical photographs were used to
measure canopy openness in the centre of each open space with
the percentage of open space calculated from the scanned
images using Gap Light Analyser 2.0 software (Frazer et al.,
1999).
Within each ride and road open-space plot the distance
between tree trunks was measured. Digitised aerial photographs
were used to estimate glade area and also estimate the area of
open space within 200 m of each plot in the following
categories: unplanted, rides (>10 m wide), clearfell, young
forestry (pre-canopy closure), broadleaved, undeveloped (areas
of crop failure), windthrow, outside (open space outside the
plantation), forest road.
2.5. Species identification
Spiders were sorted from the pitfall trap debris and stored in
70% alcohol. The species were identified using a 50�magnification microscope and nomenclature follows Roberts
(1993). Difficult species were sent Robert Johnston and Dr.
Peter Merrett for verification with voucher specimens retained
by the corresponding author at University College Cork. Only
adult specimens were identified due to the difficulty in
assigning juveniles to species.
3. Data analysis
3.1. Trends along the open-forest transect
Global non-metric multi-dimensional scaling analysis
(NMS) was used to examine differences in assemblage
structure across the open-forest transect. This ordination
method has been successfully used in several studies of
invertebrates within forests (Siira-Pietikainen et al., 2001,
2003; Huhta, 2002; Oxbrough et al., 2005). The NMS used
mean relative abundance of each species per site, for each
location on the open-forest transect. Relative abundance was
used rather than absolute abundance data as variation in
vegetation structure (as may be present across the open-forest
transect) can affect the efficiency of pitfall traps (Melbourne,
1999). The NMS ordination diagram was presented as a joint
biplot which uses correlation analyses to relate habitat variables
(measured at each transect location) with the NMS ordination
axes. The NMS used the Bray–Curtis distance measure and the
A.G. Oxbrough et al. / Forest Ecology and Management 237 (2006) 404–417406
Autho
r's
pers
onal
co
py
following parameter set-up was used: 6 axes; 20 runs with real
data; stability criterion = 0.001; 10 iterations to evaluate
stability; 250 maximum iterations; step down in dimensionality
used; initial step length = 0.20; random starting coordinates; 50
runs of the Monte Carlo test.
Indicator Species Analysis was used to determine habitat
associations (open-, forest-associated or generalists) of each
spider species by their position on the open-forest transect. For
a given species this analysis combines the relative abundance
and relative frequency within predetermined groups (in this
case positions on the transect) to give an indicator value which
is tested for significance using a Monte Carlo test. Species with
less than five individuals overall were not classified and those
with between 5 and 10 individuals were classified using both
Indicator Species Analysis and the available literature (Roberts,
1993; McFerran, 1997; van Helsdingen, 1996, 1997; Cawley,
1997; Harvey et al., 2002; Nolan, 2002). Spider families can be
classified into guilds determined by their hunting strategy
which adds a further dimension to the interpretation of
ecological data. Two of the spider families occurred in
sufficient numbers to allow such comparisons, the Linyphiidae,
which build small sheet webs on or close to the ground and the
Lycosidae which are active hunters on the ground. Two-way
ANOVA and Tukey post hoc tests with region and transect
position as fixed factors were used to assess trends in species
variables (total species richness, abundance and richness and
relative abundance of habitat specialists, Linyphiids and
Lycosids) with plot used as the replicate.
3.2. The influence of open-space type and size
The aforementioned NMS analyses indicated that traps in the
centre of the open space supported an open spider fauna so data
from these traps were used in following analyses. One-way
ANOVA with Tukey post hoc tests was used to examine
differences in species richness and abundance among the open-
space types (with plot as the replicate). Pearson’s correlation
analyses were used to examine any linear relationships between
species richness and abundance and the following open-space
dimensions: glade area; ride/road width (trunk to trunk); ride/
road verge width (trunk to road edge). Rides and roads were
combined as the above analyses indicated that their species
richness, abundance and assemblage structure were similar.
Flexible-beta cluster analysis (with b = �0.25) was used to
explore the relationship between spider assemblage structure and
open-space types. This analysis allowed the determination of
assemblage groups that better describe the similarity between the
sampling plots irrespective of a priori groupings such as open-
space type or region. Differences in the open space size as well as
species and habitat variables among these assemblage groups
were then tested using one-way ANOVA. In addition to this the
open-space plots were further classified by broad habitat type
based on the predominant vegetation cover present (high cover of
lower-field layer vegetation or high cover of shrub/deciduous
vegetation). Differences in the spider assemblages among these
two habitat groupings were examined using NMS and Indicator
Species Analysis.
3.3. Large scale influence of open space
Pearson’s correlation analyses were used to examine the
relationship between species variables and the total amount of
open space within 200 m of each plot using the open-space
categories described above. The open-space categories were
also combined into total unforested open space (road, ride,
outside and unplanted) and total open space (all categories). In
addition to this one-way ANOVA and Tukey post hoc tests were
used to examine the effect of open-space amount in the
following groups: <5, 5–10 and >10 on species richness and
abundance.
Where the assumptions of normality and homogeneity of
variance were not met, data were square root transformed,
however if the data still did not conform to the assumptions of
ANOVA the Kruskal–Wallis (H) test with a Tukey-type post
hoc comparison (Zar, 1996) was used. Proportional data
(relative abundance and cover of environmental variables) were
arcsin transformed prior to the use of parametric statistics.
ANOVA and correlation analyses were carried out in SPSS
(SPSS, 2002). Multivariate analyses (NMS and cluster
analysis) as well as Indicator Species Analysis were carried
out using PC-ORD (McCune and Mefford, 1997).
4. Results
Two of the plots (a glade in Ballysmuttan and a ride in
Mucklagh) had a substantial number of traps (33%) disturbed
and so were excluded from the analyses. This gave a total of 58
plots used in the analyses: 20 rides, 20 glades and 18 roads.
There were a total of 11,872 individual spiders captured in 13
families and 122 species. Of these 2435 were juveniles and so
were excluded from the analyses. Twenty-eight species were
classified as being associated with open habitats and seven with
forested habitats. There were 48 species represented by less
than 5 individuals so these were not classified into a habitat
association. A full list of species and their habitat association is
given in Appendix A. Eighty-seven of the species were from the
Linyphiidae family, whereas nine species were from the
Lycosidae family. Monocephalus fuscipes (Blackwall, 1836),
Lepthyphantes zimmermanni (Bertkau, 1890) and Diplocepha-
lus latifrons (O.P.-Cambridge, 1863) were the most abundant
species accounting for 32% of the total adult catch and
occurring in 97% of the traps.
4.1. Trends along the open-forest transect
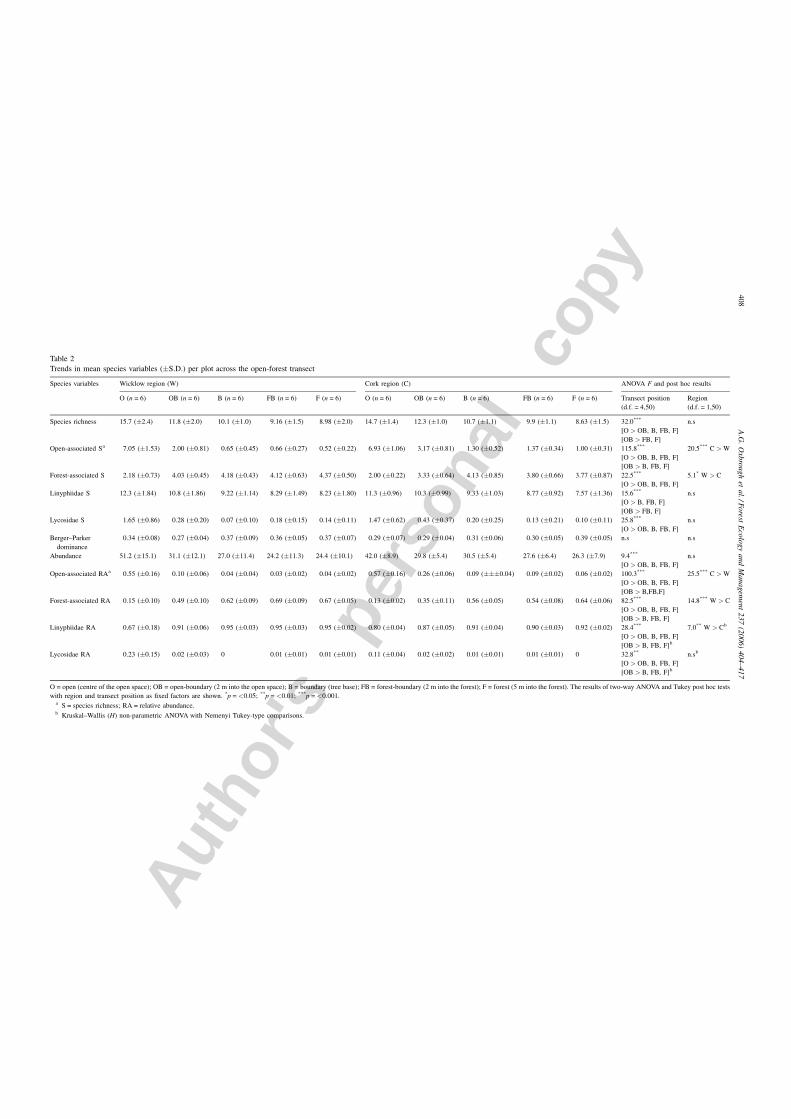
The majority of the species variables declined across open-
forest transect (Table 2), with the open traps supporting
significantly more species and individuals and also greater
richness and abundance of open-associated species, Linyphiid
and Lycosid species. Similarly the open-boundary transect
position supported a greater number of species and individuals
than the traps at the boundary, forest-boundary and forest
positions on the transect for the above-mentioned species
variables. Richness and abundance of forest-associated species
however exhibited the opposite trend being significantly lower
A.G. Oxbrough et al. / Forest Ecology and Management 237 (2006) 404–417 407
Autho
r's
pers
onal
co
py
Table 2
Trends in mean species variables (�S.D.) per plot across the open-forest transect
Species variables Wicklow region (W) Cork region (C) ANOVA F and post hoc results
O (n = 6) OB (n = 6) B (n = 6) FB (n = 6) F (n = 6) O (n = 6) OB (n = 6) B (n = 6) FB (n = 6) F (n = 6) Transect position
(d.f. = 4,50)
Region
(d.f. = 1,50)
Species richness 15.7 (�2.4) 11.8 (�2.0) 10.1 (�1.0) 9.16 (�1.5) 8.98 (�2.0) 14.7 (�1.4) 12.3 (�1.0) 10.7 (�1.1) 9.9 (�1.1) 8.63 (�1.5) 32.0***
[O > OB, B, FB, F]
[OB > FB, F]
n.s
Open-associated Sa 7.05 (�1.53) 2.00 (�0.81) 0.65 (�0.45) 0.66 (�0.27) 0.52 (�0.22) 6.93 (�1.06) 3.17 (�0.81) 1.30 (�0.52) 1.37 (�0.34) 1.00 (�0.31) 115.8***
[O > OB, B, FB, F]
[OB > B, FB, F]
20.5*** C > W
Forest-associated S 2.18 (�0.73) 4.03 (�0.45) 4.18 (�0.43) 4.12 (�0.63) 4.37 (�0.50) 2.00 (�0.22) 3.33 (�0.64) 4.13 (�0.85) 3.80 (�0.66) 3.77 (�0.87) 22.5***
[O > OB, B, FB, F]
5.1* W > C
Linyphiidae S 12.3 (�1.84) 10.8 (�1.86) 9.22 (�1.14) 8.29 (�1.49) 8.23 (�1.80) 11.3 (�0.96) 10.3 (�0.99) 9.33 (�1.03) 8.77 (�0.92) 7.57 (�1.36) 15.6***
[O > B, FB, F]
[OB > FB, F]
n.s
Lycosidae S 1.65 (�0.86) 0.28 (�0.20) 0.07 (�0.10) 0.18 (�0.15) 0.14 (�0.11) 1.47 (�0.62) 0.43 (�0.37) 0.20 (�0.25) 0.13 (�0.21) 0.10 (�0.11) 25.8***
[O > OB, B, FB, F]
n.s
Berger–Parker
dominance
0.34 (�0.08) 0.27 (�0.04) 0.37 (�0.09) 0.36 (�0.05) 0.37 (�0.07) 0.29 (�0.07) 0.29 (�0.04) 0.31 (�0.06) 0.30 (�0.05) 0.39 (�0.05) n.s n.s
Abundance 51.2 (�15.1) 31.1 (�12.1) 27.0 (�11.4) 24.2 (�11.3) 24.4 (�10.1) 42.0 (�8.9) 29.8 (�5.4) 30.5 (�5.4) 27.6 (�6.4) 26.3 (�7.9) 9.4***
[O > OB, B, FB, F]
n.s
Open-associated RAa 0.55 (�0.16) 0.10 (�0.06) 0.04 (�0.04) 0.03 (�0.02) 0.04 (�0.02) 0.57 (�0.16) 0.26 (�0.06) 0.09 (���0.04) 0.09 (�0.02) 0.06 (�0.02) 100.3***
[O > OB, B, FB, F]
[OB > B,FB,F]
25.5*** C > W
Forest-associated RA 0.15 (�0.10) 0.49 (�0.10) 0.62 (�0.09) 0.69 (�0.09) 0.67 (�0.05) 0.13 (�0.02) 0.35 (�0.11) 0.56 (�0.05) 0.54 (�0.08) 0.64 (�0.06) 82.5***
[O > OB, B, FB, F]
[OB > B, FB, F]
14.8*** W > C
Linyphiidae RA 0.67 (�0.18) 0.91 (�0.06) 0.95 (�0.03) 0.95 (�0.03) 0.95 (�0.02) 0.80 (�0.04) 0.87 (�0.05) 0.91 (�0.04) 0.90 (�0.03) 0.92 (�0.02) 28.4***
[O > OB, B, FB, F]
[OB > B, FB, F]b
7.0** W > Cb
Lycosidae RA 0.23 (�0.15) 0.02 (�0.03) 0 0.01 (�0.01) 0.01 (�0.01) 0.11 (�0.04) 0.02 (�0.02) 0.01 (�0.01) 0.01 (�0.01) 0 32.8**
[O > OB, B, FB, F]
[OB > B, FB, F]b
n.sb
O = open (centre of the open space); OB = open-boundary (2 m into the open space); B = boundary (tree base); FB = forest-boundary (2 m into the forest); F = forest (5 m into the forest). The results of two-way ANOVA and Tukey post hoc tests
with region and transect position as fixed factors are shown. *p = <0.05; **p = <0.01; ***p = <0.001.a S = species richness; RA = relative abundance.b Kruskal–Wallis (H) non-parametric ANOVA with Nemenyi Tukey-type comparisons.
A.G
.O
xbro
ug
het
al./F
orest
Eco
log
ya
nd
Ma
na
gem
ent
23
7(2
00
6)
40
4–
41
74
08
Autho
r's
pers
onal
co
py
in the centre of the open space than at any of the other transect
positions. Between the regions, the Cork region supported more
open-associated species and individuals, whereas the Wicklow
region supported more forest-associated species and indivi-
duals. The Berger–Parker dominance index did not differ
significantly among either the transect positions or the regions
and there were no significant interactions between region and
transect position for any of the species variables.
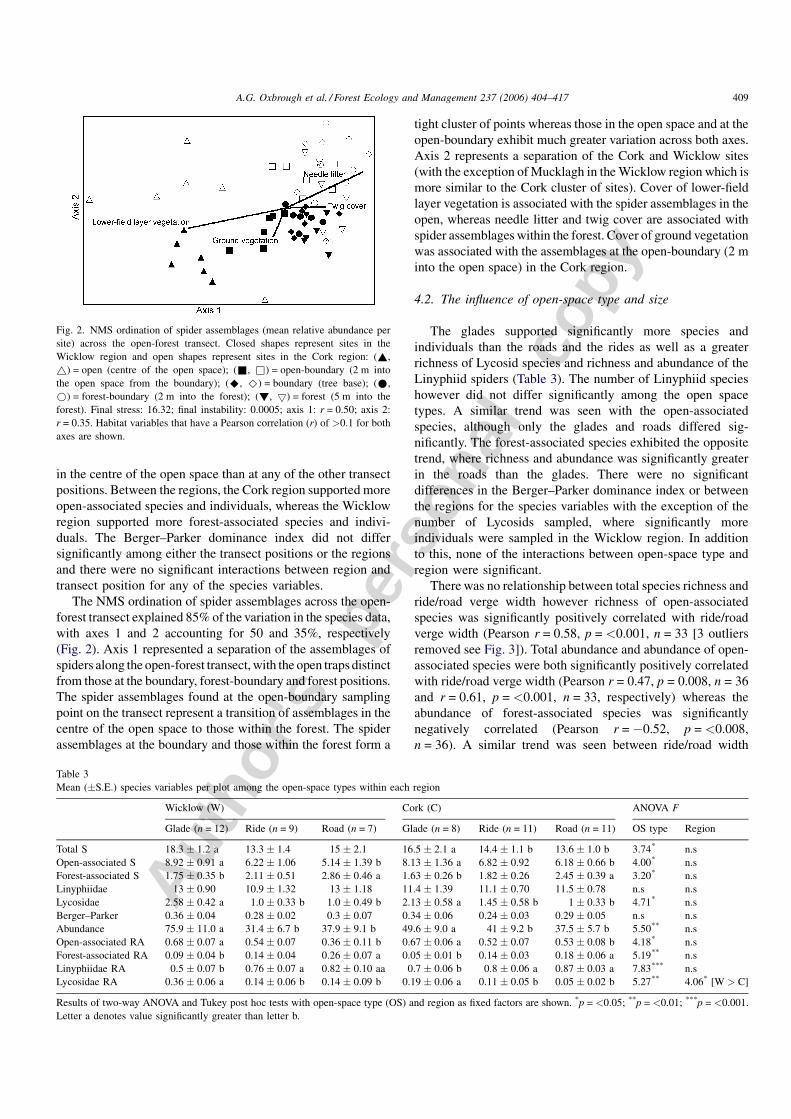
The NMS ordination of spider assemblages across the open-
forest transect explained 85% of the variation in the species data,
with axes 1 and 2 accounting for 50 and 35%, respectively
(Fig. 2). Axis 1 represented a separation of the assemblages of
spiders along the open-forest transect, with the open traps distinct
from those at the boundary, forest-boundary and forest positions.
The spider assemblages found at the open-boundary sampling
point on the transect represent a transition of assemblages in the
centre of the open space to those within the forest. The spider
assemblages at the boundary and those within the forest form a
tight cluster of points whereas those in the open space and at the
open-boundary exhibit much greater variation across both axes.
Axis 2 represents a separation of the Cork and Wicklow sites
(with the exception of Mucklagh in the Wicklow region which is
more similar to the Cork cluster of sites). Cover of lower-field
layer vegetation is associated with the spider assemblages in the
open, whereas needle litter and twig cover are associated with
spider assemblages within the forest. Cover of ground vegetation
was associated with the assemblages at the open-boundary (2 m
into the open space) in the Cork region.
4.2. The influence of open-space type and size
The glades supported significantly more species and
individuals than the roads and the rides as well as a greater
richness of Lycosid species and richness and abundance of the
Linyphiid spiders (Table 3). The number of Linyphiid species
however did not differ significantly among the open space
types. A similar trend was seen with the open-associated
species, although only the glades and roads differed sig-
nificantly. The forest-associated species exhibited the opposite
trend, where richness and abundance was significantly greater
in the roads than the glades. There were no significant
differences in the Berger–Parker dominance index or between
the regions for the species variables with the exception of the
number of Lycosids sampled, where significantly more
individuals were sampled in the Wicklow region. In addition
to this, none of the interactions between open-space type and
region were significant.
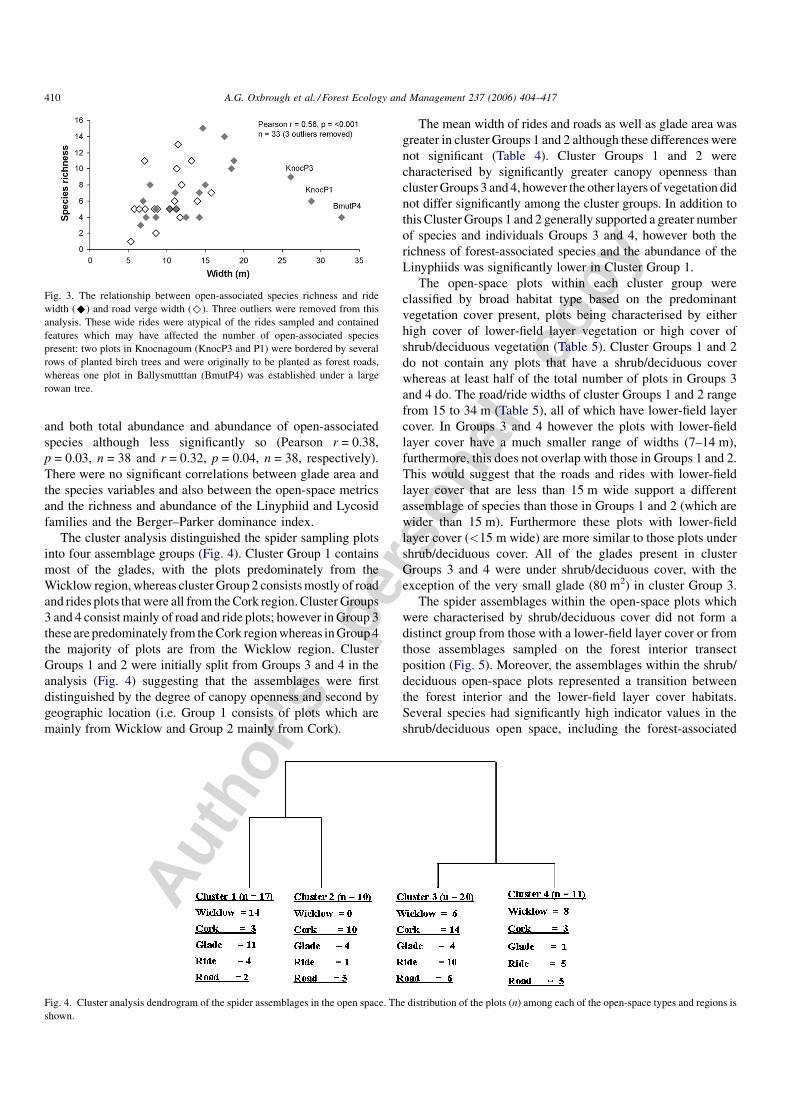
There was no relationship between total species richness and
ride/road verge width however richness of open-associated
species was significantly positively correlated with ride/road
verge width (Pearson r = 0.58, p = <0.001, n = 33 [3 outliers
removed see Fig. 3]). Total abundance and abundance of open-
associated species were both significantly positively correlated
with ride/road verge width (Pearson r = 0.47, p = 0.008, n = 36
and r = 0.61, p = <0.001, n = 33, respectively) whereas the
abundance of forest-associated species was significantly
negatively correlated (Pearson r = �0.52, p = <0.008,
n = 36). A similar trend was seen between ride/road width
Fig. 2. NMS ordination of spider assemblages (mean relative abundance per
site) across the open-forest transect. Closed shapes represent sites in the
Wicklow region and open shapes represent sites in the Cork region: (~,
~) = open (centre of the open space); (&, &) = open-boundary (2 m into
the open space from the boundary); (^, ^) = boundary (tree base); (*,
*) = forest-boundary (2 m into the forest); (!, 5) = forest (5 m into the
forest). Final stress: 16.32; final instability: 0.0005; axis 1: r = 0.50; axis 2:
r = 0.35. Habitat variables that have a Pearson correlation (r) of >0.1 for both
axes are shown.
Table 3
Mean (�S.E.) species variables per plot among the open-space types within each region
Wicklow (W) Cork (C) ANOVA F
Glade (n = 12) Ride (n = 9) Road (n = 7) Glade (n = 8) Ride (n = 11) Road (n = 11) OS type Region
Total S 18.3 � 1.2 a 13.3 � 1.4 15 � 2.1 16.5 � 2.1 a 14.4 � 1.1 b 13.6 � 1.0 b 3.74* n.s
Open-associated S 8.92 � 0.91 a 6.22 � 1.06 5.14 � 1.39 b 8.13 � 1.36 a 6.82 � 0.92 6.18 � 0.66 b 4.00* n.s
Forest-associated S 1.75 � 0.35 b 2.11 � 0.51 2.86 � 0.46 a 1.63 � 0.26 b 1.82 � 0.26 2.45 � 0.39 a 3.20* n.s
Linyphiidae 13 � 0.90 10.9 � 1.32 13 � 1.18 11.4 � 1.39 11.1 � 0.70 11.5 � 0.78 n.s n.s
Lycosidae 2.58 � 0.42 a 1.0 � 0.33 b 1.0 � 0.49 b 2.13 � 0.58 a 1.45 � 0.58 b 1 � 0.33 b 4.71* n.s
Berger–Parker 0.36 � 0.04 0.28 � 0.02 0.3 � 0.07 0.34 � 0.06 0.24 � 0.03 0.29 � 0.05 n.s n.s
Abundance 75.9 � 11.0 a 31.4 � 6.7 b 37.9 � 9.1 b 49.6 � 9.0 a 41 � 9.2 b 37.5 � 5.7 b 5.50** n.s
Open-associated RA 0.68 � 0.07 a 0.54 � 0.07 0.36 � 0.11 b 0.67 � 0.06 a 0.52 � 0.07 0.53 � 0.08 b 4.18* n.s
Forest-associated RA 0.09 � 0.04 b 0.14 � 0.04 0.26 � 0.07 a 0.05 � 0.01 b 0.14 � 0.03 0.18 � 0.06 a 5.19** n.s
Linyphiidae RA 0.5 � 0.07 b 0.76 � 0.07 a 0.82 � 0.10 aa 0.7 � 0.06 b 0.8 � 0.06 a 0.87 � 0.03 a 7.83*** n.s
Lycosidae RA 0.36 � 0.06 a 0.14 � 0.06 b 0.14 � 0.09 b 0.19 � 0.06 a 0.11 � 0.05 b 0.05 � 0.02 b 5.27** 4.06* [W > C]
Results of two-way ANOVA and Tukey post hoc tests with open-space type (OS) and region as fixed factors are shown. *p = <0.05; **p = <0.01; ***p = <0.001.
Letter a denotes value significantly greater than letter b.
A.G. Oxbrough et al. / Forest Ecology and Management 237 (2006) 404–417 409
Autho
r's
pers
onal
co
py
and both total abundance and abundance of open-associated
species although less significantly so (Pearson r = 0.38,
p = 0.03, n = 38 and r = 0.32, p = 0.04, n = 38, respectively).
There were no significant correlations between glade area and
the species variables and also between the open-space metrics
and the richness and abundance of the Linyphiid and Lycosid
families and the Berger–Parker dominance index.
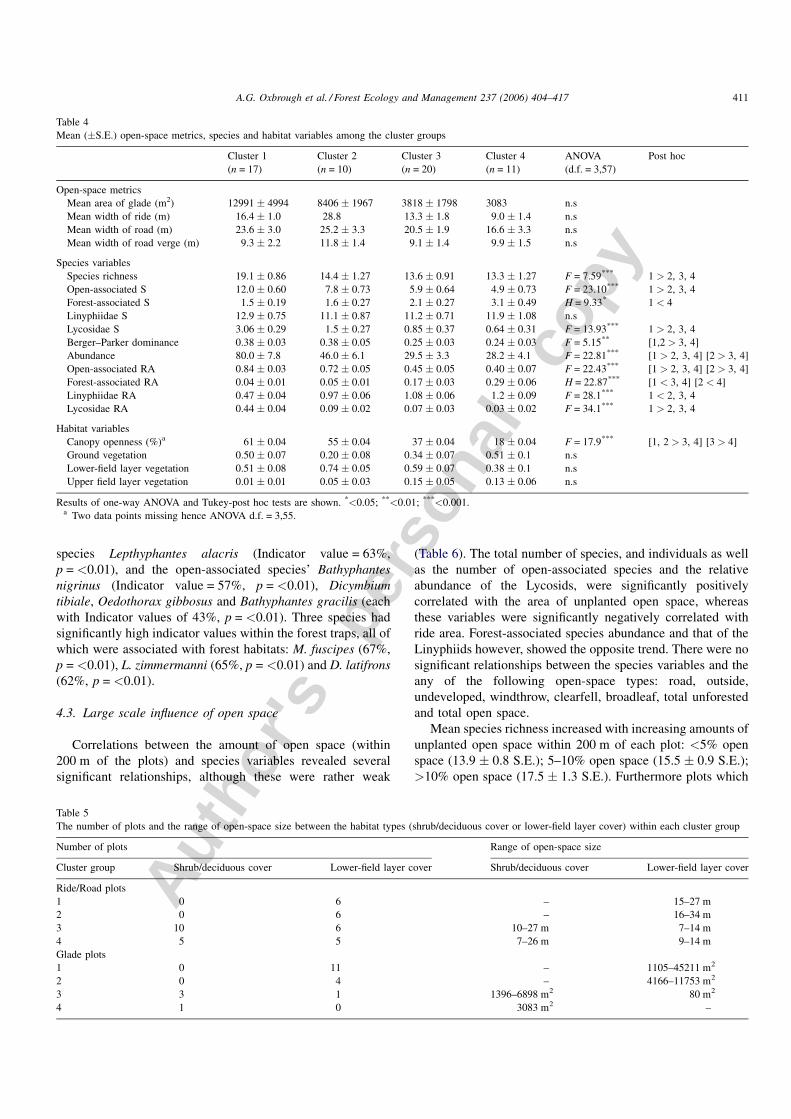
The cluster analysis distinguished the spider sampling plots
into four assemblage groups (Fig. 4). Cluster Group 1 contains
most of the glades, with the plots predominately from the
Wicklow region, whereas cluster Group 2 consists mostly of road
and rides plots that were all from the Cork region. Cluster Groups
3 and 4 consist mainly of road and ride plots; however in Group 3
these are predominately from the Cork region whereas in Group 4
the majority of plots are from the Wicklow region. Cluster
Groups 1 and 2 were initially split from Groups 3 and 4 in the
analysis (Fig. 4) suggesting that the assemblages were first
distinguished by the degree of canopy openness and second by
geographic location (i.e. Group 1 consists of plots which are
mainly from Wicklow and Group 2 mainly from Cork).
The mean width of rides and roads as well as glade area was
greater in cluster Groups 1 and 2 although these differences were
not significant (Table 4). Cluster Groups 1 and 2 were
characterised by significantly greater canopy openness than
cluster Groups 3 and 4, however the other layers of vegetation did
not differ significantly among the cluster groups. In addition to
this Cluster Groups 1 and 2 generally supported a greater number
of species and individuals Groups 3 and 4, however both the
richness of forest-associated species and the abundance of the
Linyphiids was significantly lower in Cluster Group 1.
The open-space plots within each cluster group were
classified by broad habitat type based on the predominant
vegetation cover present, plots being characterised by either
high cover of lower-field layer vegetation or high cover of
shrub/deciduous vegetation (Table 5). Cluster Groups 1 and 2
do not contain any plots that have a shrub/deciduous cover
whereas at least half of the total number of plots in Groups 3
and 4 do. The road/ride widths of cluster Groups 1 and 2 range
from 15 to 34 m (Table 5), all of which have lower-field layer
cover. In Groups 3 and 4 however the plots with lower-field
layer cover have a much smaller range of widths (7–14 m),
furthermore, this does not overlap with those in Groups 1 and 2.
This would suggest that the roads and rides with lower-field
layer cover that are less than 15 m wide support a different
assemblage of species than those in Groups 1 and 2 (which are
wider than 15 m). Furthermore these plots with lower-field
layer cover (<15 m wide) are more similar to those plots under
shrub/deciduous cover. All of the glades present in cluster
Groups 3 and 4 were under shrub/deciduous cover, with the
exception of the very small glade (80 m2) in cluster Group 3.
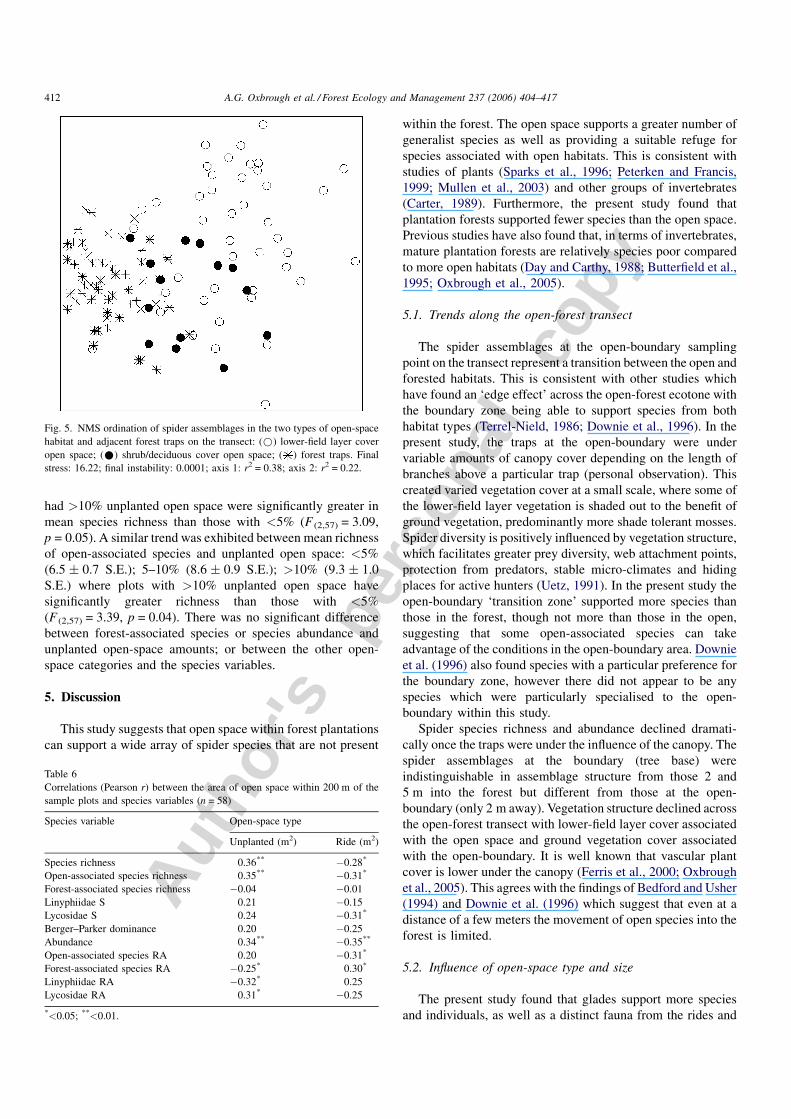
The spider assemblages within the open-space plots which
were characterised by shrub/deciduous cover did not form a
distinct group from those with a lower-field layer cover or from
those assemblages sampled on the forest interior transect
position (Fig. 5). Moreover, the assemblages within the shrub/
deciduous open-space plots represented a transition between
the forest interior and the lower-field layer cover habitats.
Several species had significantly high indicator values in the
shrub/deciduous open space, including the forest-associated
Fig. 4. Cluster analysis dendrogram of the spider assemblages in the open space. The distribution of the plots (n) among each of the open-space types and regions is
shown.
Fig. 3. The relationship between open-associated species richness and ride
width (^) and road verge width (^). Three outliers were removed from this
analysis. These wide rides were atypical of the rides sampled and contained
features which may have affected the number of open-associated species
present: two plots in Knocnagoum (KnocP3 and P1) were bordered by several
rows of planted birch trees and were originally to be planted as forest roads,
whereas one plot in Ballysmutttan (BmutP4) was established under a large
rowan tree.
A.G. Oxbrough et al. / Forest Ecology and Management 237 (2006) 404–417410
Autho
r's
pers
onal
co
pyspecies Lepthyphantes alacris (Indicator value = 63%,
p = <0.01), and the open-associated species’ Bathyphantes
nigrinus (Indicator value = 57%, p = <0.01), Dicymbium
tibiale, Oedothorax gibbosus and Bathyphantes gracilis (each
with Indicator values of 43%, p = <0.01). Three species had
significantly high indicator values within the forest traps, all of
which were associated with forest habitats: M. fuscipes (67%,
p = <0.01), L. zimmermanni (65%, p = <0.01) and D. latifrons
(62%, p = <0.01).
4.3. Large scale influence of open space
Correlations between the amount of open space (within
200 m of the plots) and species variables revealed several
significant relationships, although these were rather weak
(Table 6). The total number of species, and individuals as well
as the number of open-associated species and the relative
abundance of the Lycosids, were significantly positively
correlated with the area of unplanted open space, whereas
these variables were significantly negatively correlated with
ride area. Forest-associated species abundance and that of the
Linyphiids however, showed the opposite trend. There were no
significant relationships between the species variables and the
any of the following open-space types: road, outside,
undeveloped, windthrow, clearfell, broadleaf, total unforested
and total open space.
Mean species richness increased with increasing amounts of
unplanted open space within 200 m of each plot: <5% open
space (13.9 � 0.8 S.E.); 5–10% open space (15.5 � 0.9 S.E.);
>10% open space (17.5 � 1.3 S.E.). Furthermore plots which
Table 5
The number of plots and the range of open-space size between the habitat types (shrub/deciduous cover or lower-field layer cover) within each cluster group
Number of plots Range of open-space size
Cluster group Shrub/deciduous cover Lower-field layer cover Shrub/deciduous cover Lower-field layer cover
Ride/Road plots
1 0 6 – 15–27 m
2 0 6 – 16–34 m
3 10 6 10–27 m 7–14 m
4 5 5 7–26 m 9–14 m
Glade plots
1 0 11 – 1105–45211 m2
2 0 4 – 4166–11753 m2
3 3 1 1396–6898 m2 80 m2
4 1 0 3083 m2 –
Table 4
Mean (�S.E.) open-space metrics, species and habitat variables among the cluster groups
Cluster 1
(n = 17)
Cluster 2
(n = 10)
Cluster 3
(n = 20)
Cluster 4
(n = 11)
ANOVA
(d.f. = 3,57)
Post hoc
Open-space metrics
Mean area of glade (m2) 12991 � 4994 8406 � 1967 3818 � 1798 3083 n.s
Mean width of ride (m) 16.4 � 1.0 28.8 13.3 � 1.8 9.0 � 1.4 n.s
Mean width of road (m) 23.6 � 3.0 25.2 � 3.3 20.5 � 1.9 16.6 � 3.3 n.s
Mean width of road verge (m) 9.3 � 2.2 11.8 � 1.4 9.1 � 1.4 9.9 � 1.5 n.s
Species variables
Species richness 19.1 � 0.86 14.4 � 1.27 13.6 � 0.91 13.3 � 1.27 F = 7.59*** 1 > 2, 3, 4
Open-associated S 12.0 � 0.60 7.8 � 0.73 5.9 � 0.64 4.9 � 0.73 F = 23.10*** 1 > 2, 3, 4
Forest-associated S 1.5 � 0.19 1.6 � 0.27 2.1 � 0.27 3.1 � 0.49 H = 9.33* 1 < 4
Linyphiidae S 12.9 � 0.75 11.1 � 0.87 11.2 � 0.71 11.9 � 1.08 n.s
Lycosidae S 3.06 � 0.29 1.5 � 0.27 0.85 � 0.37 0.64 � 0.31 F = 13.93*** 1 > 2, 3, 4
Berger–Parker dominance 0.38 � 0.03 0.38 � 0.05 0.25 � 0.03 0.24 � 0.03 F = 5.15** [1,2 > 3, 4]
Abundance 80.0 � 7.8 46.0 � 6.1 29.5 � 3.3 28.2 � 4.1 F = 22.81*** [1 > 2, 3, 4] [2 > 3, 4]
Open-associated RA 0.84 � 0.03 0.72 � 0.05 0.45 � 0.05 0.40 � 0.07 F = 22.43*** [1 > 2, 3, 4] [2 > 3, 4]
Forest-associated RA 0.04 � 0.01 0.05 � 0.01 0.17 � 0.03 0.29 � 0.06 H = 22.87*** [1 < 3, 4] [2 < 4]
Linyphiidae RA 0.47 � 0.04 0.97 � 0.06 1.08 � 0.06 1.2 � 0.09 F = 28.1*** 1 < 2, 3, 4
Lycosidae RA 0.44 � 0.04 0.09 � 0.02 0.07 � 0.03 0.03 � 0.02 F = 34.1*** 1 > 2, 3, 4
Habitat variables
Canopy openness (%)a 61 � 0.04 55 � 0.04 37 � 0.04 18 � 0.04 F = 17.9*** [1, 2 > 3, 4] [3 > 4]
Ground vegetation 0.50 � 0.07 0.20 � 0.08 0.34 � 0.07 0.51 � 0.1 n.s
Lower-field layer vegetation 0.51 � 0.08 0.74 � 0.05 0.59 � 0.07 0.38 � 0.1 n.s
Upper field layer vegetation 0.01 � 0.01 0.05 � 0.03 0.15 � 0.05 0.13 � 0.06 n.s
Results of one-way ANOVA and Tukey-post hoc tests are shown. *<0.05; **<0.01; ***<0.001.a Two data points missing hence ANOVA d.f. = 3,55.
A.G. Oxbrough et al. / Forest Ecology and Management 237 (2006) 404–417 411
Autho
r's
pers
onal
co
py
had >10% unplanted open space were significantly greater in
mean species richness than those with <5% (F (2,57) = 3.09,
p = 0.05). A similar trend was exhibited between mean richness
of open-associated species and unplanted open space: <5%
(6.5 � 0.7 S.E.); 5–10% (8.6 � 0.9 S.E.); >10% (9.3 � 1.0
S.E.) where plots with >10% unplanted open space have
significantly greater richness than those with <5%
(F (2,57) = 3.39, p = 0.04). There was no significant difference
between forest-associated species or species abundance and
unplanted open-space amounts; or between the other open-
space categories and the species variables.
5. Discussion
This study suggests that open space within forest plantations
can support a wide array of spider species that are not present
within the forest. The open space supports a greater number of
generalist species as well as providing a suitable refuge for
species associated with open habitats. This is consistent with
studies of plants (Sparks et al., 1996; Peterken and Francis,
1999; Mullen et al., 2003) and other groups of invertebrates
(Carter, 1989). Furthermore, the present study found that
plantation forests supported fewer species than the open space.
Previous studies have also found that, in terms of invertebrates,
mature plantation forests are relatively species poor compared
to more open habitats (Day and Carthy, 1988; Butterfield et al.,
1995; Oxbrough et al., 2005).
5.1. Trends along the open-forest transect
The spider assemblages at the open-boundary sampling
point on the transect represent a transition between the open and
forested habitats. This is consistent with other studies which
have found an ‘edge effect’ across the open-forest ecotone with
the boundary zone being able to support species from both
habitat types (Terrel-Nield, 1986; Downie et al., 1996). In the
present study, the traps at the open-boundary were under
variable amounts of canopy cover depending on the length of
branches above a particular trap (personal observation). This
created varied vegetation cover at a small scale, where some of
the lower-field layer vegetation is shaded out to the benefit of
ground vegetation, predominantly more shade tolerant mosses.
Spider diversity is positively influenced by vegetation structure,
which facilitates greater prey diversity, web attachment points,
protection from predators, stable micro-climates and hiding
places for active hunters (Uetz, 1991). In the present study the
open-boundary ‘transition zone’ supported more species than
those in the forest, though not more than those in the open,
suggesting that some open-associated species can take
advantage of the conditions in the open-boundary area. Downie
et al. (1996) also found species with a particular preference for
the boundary zone, however there did not appear to be any
species which were particularly specialised to the open-
boundary within this study.
Spider species richness and abundance declined dramati-
cally once the traps were under the influence of the canopy. The
spider assemblages at the boundary (tree base) were
indistinguishable in assemblage structure from those 2 and
5 m into the forest but different from those at the open-
boundary (only 2 m away). Vegetation structure declined across
the open-forest transect with lower-field layer cover associated
with the open space and ground vegetation cover associated
with the open-boundary. It is well known that vascular plant
cover is lower under the canopy (Ferris et al., 2000; Oxbrough
et al., 2005). This agrees with the findings of Bedford and Usher
(1994) and Downie et al. (1996) which suggest that even at a
distance of a few meters the movement of open species into the
forest is limited.
5.2. Influence of open-space type and size
The present study found that glades support more species
and individuals, as well as a distinct fauna from the rides and
Table 6
Correlations (Pearson r) between the area of open space within 200 m of the
sample plots and species variables (n = 58)
Species variable Open-space type
Unplanted (m2) Ride (m2)
Species richness 0.36** �0.28*
Open-associated species richness 0.35** �0.31*
Forest-associated species richness �0.04 �0.01
Linyphiidae S 0.21 �0.15
Lycosidae S 0.24 �0.31*
Berger–Parker dominance 0.20 �0.25
Abundance 0.34** �0.35**
Open-associated species RA 0.20 �0.31*
Forest-associated species RA �0.25* 0.30*
Linyphiidae RA �0.32* 0.25
Lycosidae RA 0.31* �0.25
*<0.05; **<0.01.
Fig. 5. NMS ordination of spider assemblages in the two types of open-space
habitat and adjacent forest traps on the transect: (*) lower-field layer cover
open space; (*) shrub/deciduous cover open space; ( ) forest traps. Final
stress: 16.22; final instability: 0.0001; axis 1: r2 = 0.38; axis 2: r2 = 0.22.
A.G. Oxbrough et al. / Forest Ecology and Management 237 (2006) 404–417412
Autho
r's
pers
onal
co
py
road edges. The non-linear shape of glades means that they
have a larger area away from the influence of the forest canopy,
probably allowing them to support a greater number of species
associated with open habitats. The relationship between area
and species richness is well-studied, with larger areas having a
greater potential for habitat heterogeneity, less chance of
random extinctions and greater likelihood of random immigra-
tion affecting the spider population (MacArthur and
MacArthur, 1961; Pianka, 1966). This suggests that the glades
have a greater potential than roads or rides to retain open
species associated with the pre-planting habitat.
Although the number of Linyphiid species did not differ
among open-space types, the number of Lycosid species and
individuals sampled was greater in the glades. In contrast relative
abundance of Linyphiids was greater in the roads and rides. The
Lycosids sampled in the present study (i.e. Pardosa pullata and
Alopecosa pulverulenta) are well-known open-associated spe-
cies (Harvey et al., 2002). These relatively large active hunters
may benefit from the greater availability of prey in the
structurally diverse open areas especially in terms of larger
prey items that may be available. In addition to this the greater
vegetation structure may offer greater protection from predators
and places to conceal themselves from prey (Uetz, 1991). The
smaller Linyphiids, which are known to inhabit both open and
forested habitats (e.g. Pajunen et al., 1995; Downie et al., 1996)
may be less specific in their habitat requirements: they construct
small sheet webs amongst litter and ground vegetation which can
capture a range of prey types. This may mean that Linyphiids are
able to take advantage of conditions across a range of habitat
types whereas Lycosids are somewhat more restricted.
The spider assemblages were also distinct among the
geographical clusters in the open space (though not in the traps
in the forest interior). The differing environmental character-
istics between the Cork and Wicklow sites (poorly drained
modified blanket bog and well-drained humid acid-grassland/
dry heath, respectively) indicate that habitat type is an
important factor in determining the spider fauna of the open
space. Furthermore, this suggests that the species present are
not just generalist species, but maybe retained from the pre-
planting habitat.
The relationship between open-space size and spider
diversity was confounded by the influence of the plantation
canopy and the habitat type of the open space. Several of the
open-space plots were characterised by a heavy shrub layer or
deciduous woodland cover, with more forest-associated species
and fewer open species. These plots were similar in assemblage
structure to the rides and roads which were less than 15 m wide.
This suggests that open spaces with a width of less than 15 m
wide are not able to support a fauna of spiders associated with
typical open habitats. Rides and roads <15 m wide are affected
more shaded, which probably leads to vegetation and micro-
climatic conditions similar to those of a mature open forest.
It has been recommended that ride width should be between
1 and 1.5 times tree height to provide adequate light conditions
for open-associated species (Carter, 1989; Greatorex-Davies,
1989; Warren and Fuller, 1993). In the present study, mean
height of mature spruce was 15.3 m (�4.3 S.D.), giving a ride
width of 15–23 m to support open species. Therefore our results
would appear to support the recommended ratio of tree height
to width if it is taken as the minimum needed to support an open
spider fauna. This also suggests that the inclusion of rides with a
width of 6 m as Areas for Biodiversity Enhancement in Irish
plantations may be too low for spiders (Forest Service, 2003),
whereas the 15 m width recommendation for roads should be
taken as a lower limit. Furthermore, as species richness showed
no indication of levelling off when compared with road verge
width, this would suggest that widening roads above the 15 m
standard width will further enhance biodiversity.
One of the goals of sustainable forest management is to
emulate natural forest dynamics, and a logical step might be to
select areas of retained habitat which contain ‘pockets’ of
deciduous trees or shrubs which may act as a source for forest
species. This is important in an Irish context where there is very
little natural forest cover: forested land accounts for 10% of the
total land area (Forest Service, 2004) in Ireland but natural
woodlands constitute <1% (Teagasc, 2005). Hence plantation
forests could potentially play an important role in sustaining
forest species in Ireland. In the present study these deciduous/
shrub open-space areas represented an intermediate habitat
between the plantation forest and the lower-field layer-type open
space. Furthermore, the lack of specialist species (for instance,
forest specialists which are not supported within the plantation),
indicates that their potential for adding to plantation biodiversity
may be negligible. It should be noted however that in the present
study it was unclear whether these areas of ‘open space’ were
retained from the pre-planting habitat or developed as the
plantation matured and further research may be required to
determine the biodiversity value of such areas.
The glades sampled in this study did not exhibit a similar
‘threshold’ size as was found for the roads and rides. However,
one glade was similar in assemblage structure to the glades that
were characterised by deciduous woodland and shrubs,
although it was characterised by lower-field layer vegetation.
This glade was only 80 m2 in area, whereas the next smallest
glade in area was 1000 m2. This might suggest that this very
small glade was under the influence of the forest plantation
canopy and so was not large enough to support an open spider
fauna. However to identify a threshold area (over which open
species can be supported), areas between 80 and 1000 m2 will
need to be studied, although the 15 m threshold for ride/road
width might suggest 225 m2 as a minimum area for glades.
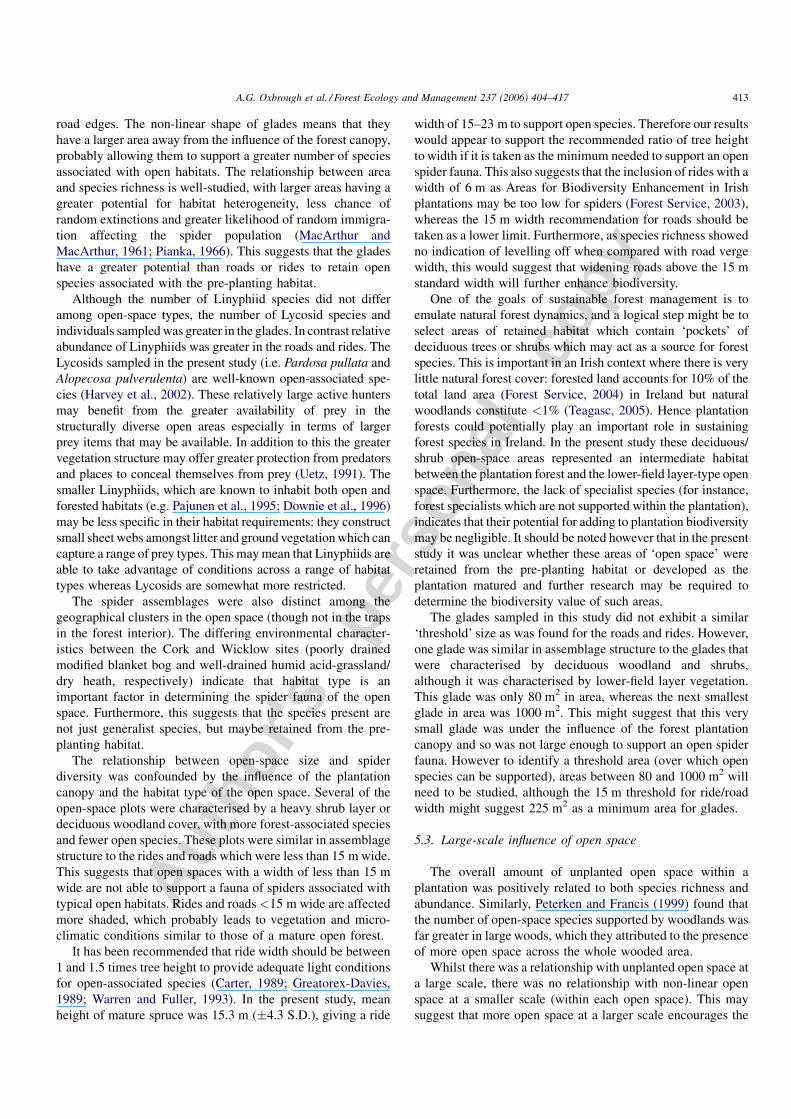
5.3. Large-scale influence of open space
The overall amount of unplanted open space within a
plantation was positively related to both species richness and
abundance. Similarly, Peterken and Francis (1999) found that
the number of open-space species supported by woodlands was
far greater in large woods, which they attributed to the presence
of more open space across the whole wooded area.
Whilst there was a relationship with unplanted open space at
a large scale, there was no relationship with non-linear open
space at a smaller scale (within each open space). This may
suggest that more open space at a larger scale encourages the
A.G. Oxbrough et al. / Forest Ecology and Management 237 (2006) 404–417 413
Autho
r's
pers
onal
co
py
movement of individuals among open space. Spiders utilise
both aerial (Duffey, 1956) and ground dispersal (Thomas et al.,
1990) as a means to colonise habitats, so the amount of open
space surrounding the sampling plots will directly affect the
ability of open-associated species to disperse within the
forested landscape. There was a negative relationship between
ride area and spider assemblages. However it is likely that ride
area indirectly represents the amount of forested area within
200 m of the sampling points, i.e. the greater the amount of
planted forest, the greater potential for more rides.
The Irish Forest Biodiversity Guidelines (Forest Service,
2000) recommend that 5–10% of forest plantations larger than
10 ha should be kept as retained open space. However as spider
species richness increased with the amount of unplanted open
space in the three categories of <5, 5–10 and >10%, this
suggests that the number of species which can be supported in
areas with 5–10% has not reached a maximum and hence the 5–
10% area may not be adequate to support a full suite of species
associated with open habitats.
6. Conclusions
Open space within plantation forests supports spider
species associated with open habitats and enhances overall
plantation diversity. Furthermore, the response of the ground-
dwelling spider fauna to open space was similar across both of
the regions indicating the generality of these findings. In
terms of forest management it is suggested that an absolute
minimum width of 15 m is needed for forest roads and rides to
support an open spider fauna. For non-linear open space, a
stratified sampling approach that varies glade area may reveal
a similar ‘threshold’ size, over which open species are
supported. The present study also highlights the need to
examine the biodiversity value of a range of habitat types that
could potentially be selected as retained habitat but with
consideration given to the purpose of the open space. For
instance, if the goal is to enhance open species, then
management should focus on how the unique and rare species
associated with the pre-planting habitat can persist in the
plantation. However if the goal is to enhance species
associated with natural forests, then management should
investigate how best to incorporate or create non-plantation
wooded areas in managed forests.
Acknowledgements
The authors would like to thank Blathnaid O’Loughlin,
Eleanor O’Brien, Linda Coote, Dr. Mark Wilson and Dr.
George Smith for their help with fieldwork and sample sorting.
We also thank Robert Johnston and Dr. Peter Merrett for
verification of doubtful species. We are grateful to Dr. Mark
Wilson for help with GIS. This work was carried out as part of
the BIOFOREST project (http://www.bioforest.ucc.ie/), which
is jointly funded by the Environmental Protection Agency and
the National Council for Forest Research and Development
(COFORD) through the National Development Plan.
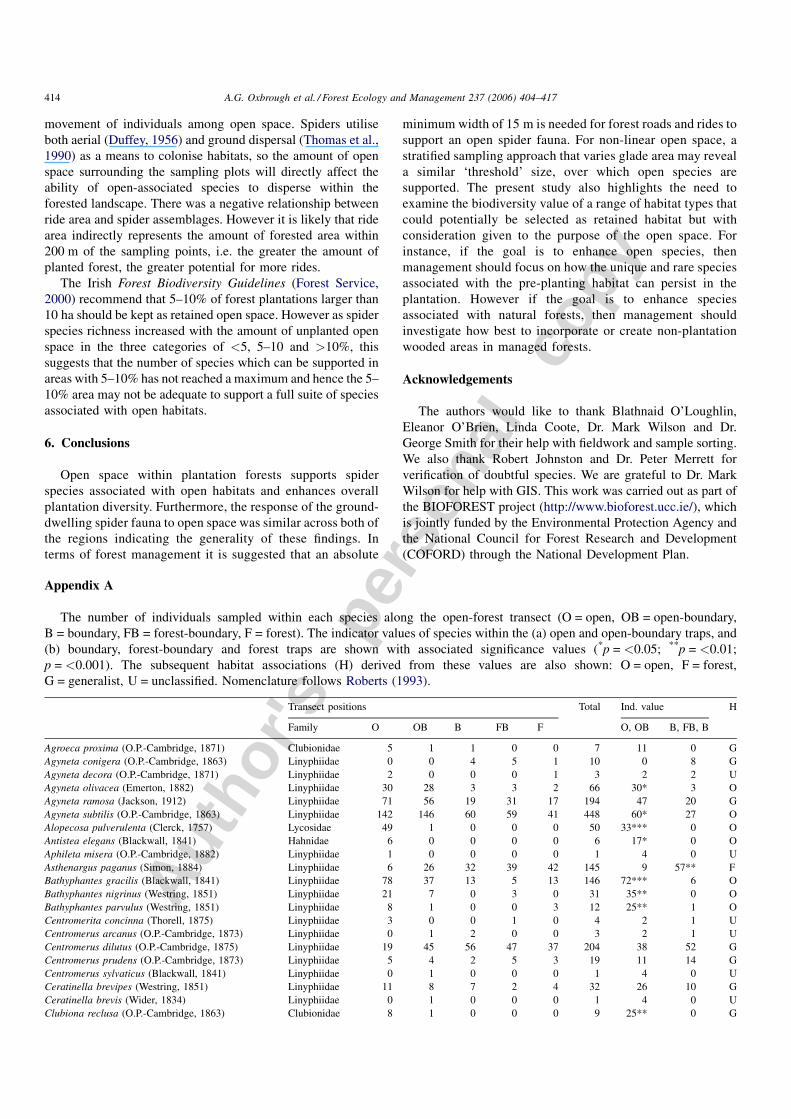
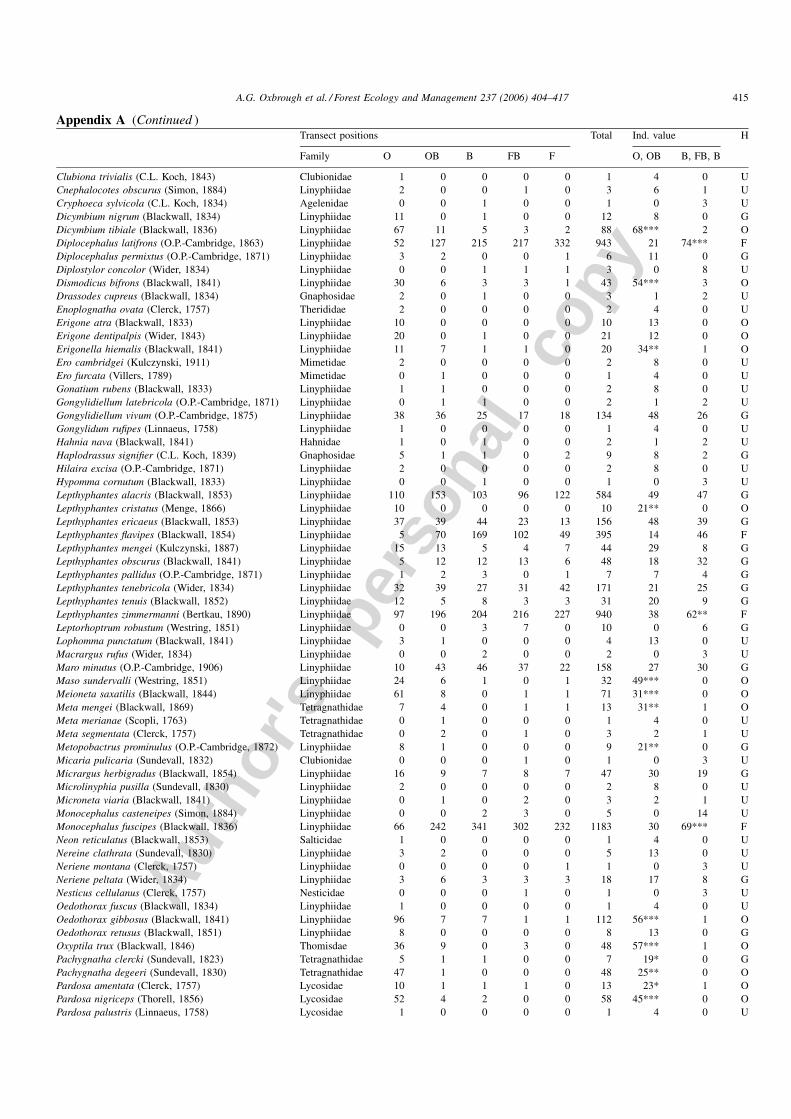
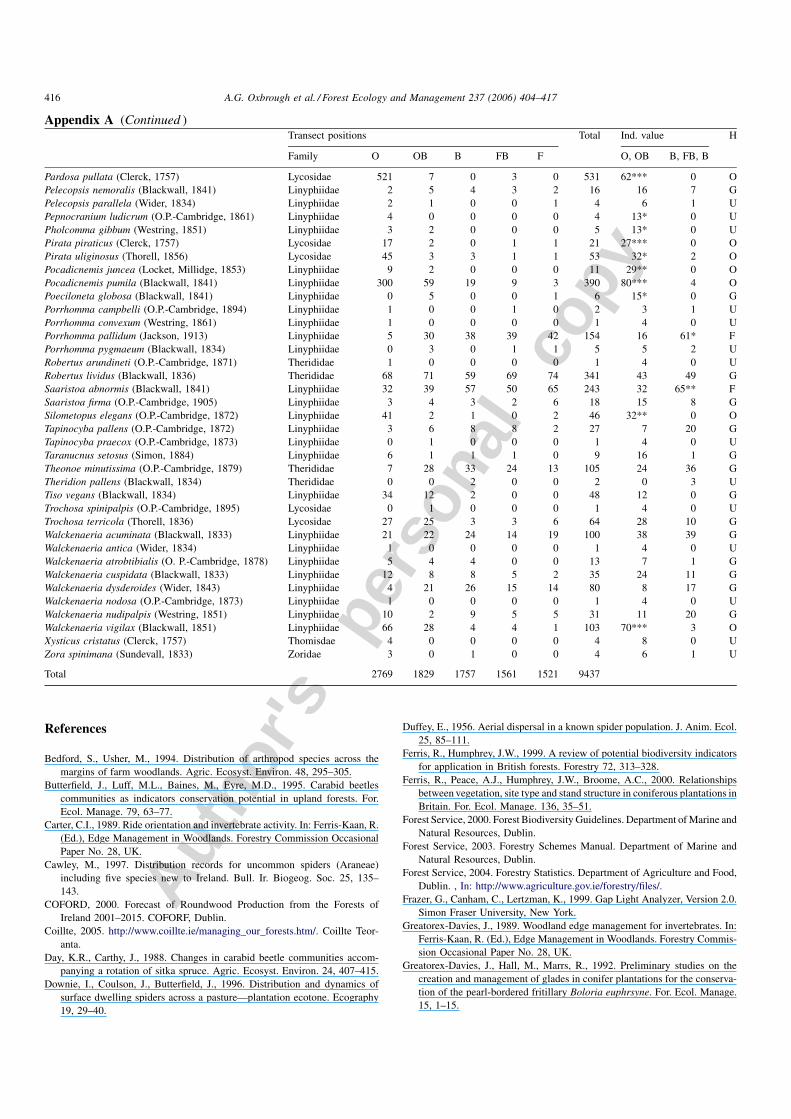
Appendix A
The number of individuals sampled within each species along the open-forest transect (O = open, OB = open-boundary,
B = boundary, FB = forest-boundary, F = forest). The indicator values of species within the (a) open and open-boundary traps, and
(b) boundary, forest-boundary and forest traps are shown with associated significance values (*p = <0.05; **p = <0.01;
p = <0.001). The subsequent habitat associations (H) derived from these values are also shown: O = open, F = forest,
G = generalist, U = unclassified. Nomenclature follows Roberts (1993).
Transect positions Total Ind. value H
Family O OB B FB F O, OB B, FB, B
Agroeca proxima (O.P.-Cambridge, 1871) Clubionidae 5 1 1 0 0 7 11 0 G
Agyneta conigera (O.P.-Cambridge, 1863) Linyphiidae 0 0 4 5 1 10 0 8 G
Agyneta decora (O.P.-Cambridge, 1871) Linyphiidae 2 0 0 0 1 3 2 2 U
Agyneta olivacea (Emerton, 1882) Linyphiidae 30 28 3 3 2 66 30* 3 O
Agyneta ramosa (Jackson, 1912) Linyphiidae 71 56 19 31 17 194 47 20 G
Agyneta subtilis (O.P.-Cambridge, 1863) Linyphiidae 142 146 60 59 41 448 60* 27 O
Alopecosa pulverulenta (Clerck, 1757) Lycosidae 49 1 0 0 0 50 33*** 0 O
Antistea elegans (Blackwall, 1841) Hahnidae 6 0 0 0 0 6 17* 0 O
Aphileta misera (O.P.-Cambridge, 1882) Linyphiidae 1 0 0 0 0 1 4 0 U
Asthenargus paganus (Simon, 1884) Linyphiidae 6 26 32 39 42 145 9 57** F
Bathyphantes gracilis (Blackwall, 1841) Linyphiidae 78 37 13 5 13 146 72*** 6 O
Bathyphantes nigrinus (Westring, 1851) Linyphiidae 21 7 0 3 0 31 35** 0 O
Bathyphantes parvulus (Westring, 1851) Linyphiidae 8 1 0 0 3 12 25** 1 O
Centromerita concinna (Thorell, 1875) Linyphiidae 3 0 0 1 0 4 2 1 U
Centromerus arcanus (O.P.-Cambridge, 1873) Linyphiidae 0 1 2 0 0 3 2 1 U
Centromerus dilutus (O.P.-Cambridge, 1875) Linyphiidae 19 45 56 47 37 204 38 52 G
Centromerus prudens (O.P.-Cambridge, 1873) Linyphiidae 5 4 2 5 3 19 11 14 G
Centromerus sylvaticus (Blackwall, 1841) Linyphiidae 0 1 0 0 0 1 4 0 U
Ceratinella brevipes (Westring, 1851) Linyphiidae 11 8 7 2 4 32 26 10 G
Ceratinella brevis (Wider, 1834) Linyphiidae 0 1 0 0 0 1 4 0 U
Clubiona reclusa (O.P.-Cambridge, 1863) Clubionidae 8 1 0 0 0 9 25** 0 G
A.G. Oxbrough et al. / Forest Ecology and Management 237 (2006) 404–417414
Autho
r's
pers
onal
co
py
Appendix A (Continued )Transect positions Total Ind. value H
Family O OB B FB F O, OB B, FB, B
Clubiona trivialis (C.L. Koch, 1843) Clubionidae 1 0 0 0 0 1 4 0 U
Cnephalocotes obscurus (Simon, 1884) Linyphiidae 2 0 0 1 0 3 6 1 U
Cryphoeca sylvicola (C.L. Koch, 1834) Agelenidae 0 0 1 0 0 1 0 3 U
Dicymbium nigrum (Blackwall, 1834) Linyphiidae 11 0 1 0 0 12 8 0 G
Dicymbium tibiale (Blackwall, 1836) Linyphiidae 67 11 5 3 2 88 68*** 2 O
Diplocephalus latifrons (O.P.-Cambridge, 1863) Linyphiidae 52 127 215 217 332 943 21 74*** F
Diplocephalus permixtus (O.P.-Cambridge, 1871) Linyphiidae 3 2 0 0 1 6 11 0 G
Diplostylor concolor (Wider, 1834) Linyphiidae 0 0 1 1 1 3 0 8 U
Dismodicus bifrons (Blackwall, 1841) Linyphiidae 30 6 3 3 1 43 54*** 3 O
Drassodes cupreus (Blackwall, 1834) Gnaphosidae 2 0 1 0 0 3 1 2 U
Enoplognatha ovata (Clerck, 1757) Therididae 2 0 0 0 0 2 4 0 U
Erigone atra (Blackwall, 1833) Linyphiidae 10 0 0 0 0 10 13 0 O
Erigone dentipalpis (Wider, 1843) Linyphiidae 20 0 1 0 0 21 12 0 O
Erigonella hiemalis (Blackwall, 1841) Linyphiidae 11 7 1 1 0 20 34** 1 O
Ero cambridgei (Kulczynski, 1911) Mimetidae 2 0 0 0 0 2 8 0 U
Ero furcata (Villers, 1789) Mimetidae 0 1 0 0 0 1 4 0 U
Gonatium rubens (Blackwall, 1833) Linyphiidae 1 1 0 0 0 2 8 0 U
Gongylidiellum latebricola (O.P.-Cambridge, 1871) Linyphiidae 0 1 1 0 0 2 1 2 U
Gongylidiellum vivum (O.P.-Cambridge, 1875) Linyphiidae 38 36 25 17 18 134 48 26 G
Gongylidum rufipes (Linnaeus, 1758) Linyphiidae 1 0 0 0 0 1 4 0 U
Hahnia nava (Blackwall, 1841) Hahnidae 1 0 1 0 0 2 1 2 U
Haplodrassus signifier (C.L. Koch, 1839) Gnaphosidae 5 1 1 0 2 9 8 2 G
Hilaira excisa (O.P.-Cambridge, 1871) Linyphiidae 2 0 0 0 0 2 8 0 U
Hypomma cornutum (Blackwall, 1833) Linyphiidae 0 0 1 0 0 1 0 3 U
Lepthyphantes alacris (Blackwall, 1853) Linyphiidae 110 153 103 96 122 584 49 47 G
Lepthyphantes cristatus (Menge, 1866) Linyphiidae 10 0 0 0 0 10 21** 0 O
Lepthyphantes ericaeus (Blackwall, 1853) Linyphiidae 37 39 44 23 13 156 48 39 G
Lepthyphantes flavipes (Blackwall, 1854) Linyphiidae 5 70 169 102 49 395 14 46 F
Lepthyphantes mengei (Kulczynski, 1887) Linyphiidae 15 13 5 4 7 44 29 8 G
Lepthyphantes obscurus (Blackwall, 1841) Linyphiidae 5 12 12 13 6 48 18 32 G
Lepthyphantes pallidus (O.P.-Cambridge, 1871) Linyphiidae 1 2 3 0 1 7 7 4 G
Lepthyphantes tenebricola (Wider, 1834) Linyphiidae 32 39 27 31 42 171 21 25 G
Lepthyphantes tenuis (Blackwall, 1852) Linyphiidae 12 5 8 3 3 31 20 9 G
Lepthyphantes zimmermanni (Bertkau, 1890) Linyphiidae 97 196 204 216 227 940 38 62** F
Leptorhoptrum robustum (Westring, 1851) Linyphiidae 0 0 3 7 0 10 0 6 G
Lophomma punctatum (Blackwall, 1841) Linyphiidae 3 1 0 0 0 4 13 0 U
Macrargus rufus (Wider, 1834) Linyphiidae 0 0 2 0 0 2 0 3 U
Maro minutus (O.P.-Cambridge, 1906) Linyphiidae 10 43 46 37 22 158 27 30 G
Maso sundervalli (Westring, 1851) Linyphiidae 24 6 1 0 1 32 49*** 0 O
Meioneta saxatilis (Blackwall, 1844) Linyphiidae 61 8 0 1 1 71 31*** 0 O
Meta mengei (Blackwall, 1869) Tetragnathidae 7 4 0 1 1 13 31** 1 O
Meta merianae (Scopli, 1763) Tetragnathidae 0 1 0 0 0 1 4 0 U
Meta segmentata (Clerck, 1757) Tetragnathidae 0 2 0 1 0 3 2 1 U
Metopobactrus prominulus (O.P.-Cambridge, 1872) Linyphiidae 8 1 0 0 0 9 21** 0 G
Micaria pulicaria (Sundevall, 1832) Clubionidae 0 0 0 1 0 1 0 3 U
Micrargus herbigradus (Blackwall, 1854) Linyphiidae 16 9 7 8 7 47 30 19 G
Microlinyphia pusilla (Sundevall, 1830) Linyphiidae 2 0 0 0 0 2 8 0 U
Microneta viaria (Blackwall, 1841) Linyphiidae 0 1 0 2 0 3 2 1 U
Monocephalus casteneipes (Simon, 1884) Linyphiidae 0 0 2 3 0 5 0 14 U
Monocephalus fuscipes (Blackwall, 1836) Linyphiidae 66 242 341 302 232 1183 30 69*** F
Neon reticulatus (Blackwall, 1853) Salticidae 1 0 0 0 0 1 4 0 U
Nereine clathrata (Sundevall, 1830) Linyphiidae 3 2 0 0 0 5 13 0 U
Neriene montana (Clerck, 1757) Linyphiidae 0 0 0 0 1 1 0 3 U
Neriene peltata (Wider, 1834) Linyphiidae 3 6 3 3 3 18 17 8 G
Nesticus cellulanus (Clerck, 1757) Nesticidae 0 0 0 1 0 1 0 3 U
Oedothorax fuscus (Blackwall, 1834) Linyphiidae 1 0 0 0 0 1 4 0 U
Oedothorax gibbosus (Blackwall, 1841) Linyphiidae 96 7 7 1 1 112 56*** 1 O
Oedothorax retusus (Blackwall, 1851) Linyphiidae 8 0 0 0 0 8 13 0 G
Oxyptila trux (Blackwall, 1846) Thomisdae 36 9 0 3 0 48 57*** 1 O
Pachygnatha clercki (Sundevall, 1823) Tetragnathidae 5 1 1 0 0 7 19* 0 G
Pachygnatha degeeri (Sundevall, 1830) Tetragnathidae 47 1 0 0 0 48 25** 0 O
Pardosa amentata (Clerck, 1757) Lycosidae 10 1 1 1 0 13 23* 1 O
Pardosa nigriceps (Thorell, 1856) Lycosidae 52 4 2 0 0 58 45*** 0 O
Pardosa palustris (Linnaeus, 1758) Lycosidae 1 0 0 0 0 1 4 0 U
A.G. Oxbrough et al. / Forest Ecology and Management 237 (2006) 404–417 415
Autho
r's
pers
onal
co
py
References
Bedford, S., Usher, M., 1994. Distribution of arthropod species across the
margins of farm woodlands. Agric. Ecosyst. Environ. 48, 295–305.
Butterfield, J., Luff, M.L., Baines, M., Eyre, M.D., 1995. Carabid beetles
communities as indicators conservation potential in upland forests. For.
Ecol. Manage. 79, 63–77.
Carter, C.I., 1989. Ride orientation and invertebrate activity. In: Ferris-Kaan, R.
(Ed.), Edge Management in Woodlands. Forestry Commission Occasional
Paper No. 28, UK.
Cawley, M., 1997. Distribution records for uncommon spiders (Araneae)
including five species new to Ireland. Bull. Ir. Biogeog. Soc. 25, 135–
143.
COFORD, 2000. Forecast of Roundwood Production from the Forests of
Ireland 2001–2015. COFORF, Dublin.
Coillte, 2005. http://www.coillte.ie/managing_our_forests.htm/. Coillte Teor-
anta.
Day, K.R., Carthy, J., 1988. Changes in carabid beetle communities accom-
panying a rotation of sitka spruce. Agric. Ecosyst. Environ. 24, 407–415.
Downie, I., Coulson, J., Butterfield, J., 1996. Distribution and dynamics of
surface dwelling spiders across a pasture—plantation ecotone. Ecography
19, 29–40.
Duffey, E., 1956. Aerial dispersal in a known spider population. J. Anim. Ecol.
25, 85–111.
Ferris, R., Humphrey, J.W., 1999. A review of potential biodiversity indicators
for application in British forests. Forestry 72, 313–328.
Ferris, R., Peace, A.J., Humphrey, J.W., Broome, A.C., 2000. Relationships
between vegetation, site type and stand structure in coniferous plantations in
Britain. For. Ecol. Manage. 136, 35–51.
Forest Service, 2000. Forest Biodiversity Guidelines. Department of Marine and
Natural Resources, Dublin.
Forest Service, 2003. Forestry Schemes Manual. Department of Marine and
Natural Resources, Dublin.
Forest Service, 2004. Forestry Statistics. Department of Agriculture and Food,
Dublin. , In: http://www.agriculture.gov.ie/forestry/files/.
Frazer, G., Canham, C., Lertzman, K., 1999. Gap Light Analyzer, Version 2.0.
Simon Fraser University, New York.
Greatorex-Davies, J., 1989. Woodland edge management for invertebrates. In:
Ferris-Kaan, R. (Ed.), Edge Management in Woodlands. Forestry Commis-
sion Occasional Paper No. 28, UK.
Greatorex-Davies, J., Hall, M., Marrs, R., 1992. Preliminary studies on the
creation and management of glades in conifer plantations for the conserva-
tion of the pearl-bordered fritillary Boloria euphrsyne. For. Ecol. Manage.
15, 1–15.
Appendix A (Continued )Transect positions Total Ind. value H
Family O OB B FB F O, OB B, FB, B
Pardosa pullata (Clerck, 1757) Lycosidae 521 7 0 3 0 531 62*** 0 O
Pelecopsis nemoralis (Blackwall, 1841) Linyphiidae 2 5 4 3 2 16 16 7 G
Pelecopsis parallela (Wider, 1834) Linyphiidae 2 1 0 0 1 4 6 1 U
Pepnocranium ludicrum (O.P.-Cambridge, 1861) Linyphiidae 4 0 0 0 0 4 13* 0 U
Pholcomma gibbum (Westring, 1851) Linyphiidae 3 2 0 0 0 5 13* 0 U
Pirata piraticus (Clerck, 1757) Lycosidae 17 2 0 1 1 21 27*** 0 O
Pirata uliginosus (Thorell, 1856) Lycosidae 45 3 3 1 1 53 32* 2 O
Pocadicnemis juncea (Locket, Millidge, 1853) Linyphiidae 9 2 0 0 0 11 29** 0 O
Pocadicnemis pumila (Blackwall, 1841) Linyphiidae 300 59 19 9 3 390 80*** 4 O
Poeciloneta globosa (Blackwall, 1841) Linyphiidae 0 5 0 0 1 6 15* 0 G
Porrhomma campbelli (O.P.-Cambridge, 1894) Linyphiidae 1 0 0 1 0 2 3 1 U
Porrhomma convexum (Westring, 1861) Linyphiidae 1 0 0 0 0 1 4 0 U
Porrhomma pallidum (Jackson, 1913) Linyphiidae 5 30 38 39 42 154 16 61* F
Porrhomma pygmaeum (Blackwall, 1834) Linyphiidae 0 3 0 1 1 5 5 2 U
Robertus arundineti (O.P.-Cambridge, 1871) Therididae 1 0 0 0 0 1 4 0 U
Robertus lividus (Blackwall, 1836) Therididae 68 71 59 69 74 341 43 49 G
Saaristoa abnormis (Blackwall, 1841) Linyphiidae 32 39 57 50 65 243 32 65** F
Saaristoa firma (O.P.-Cambridge, 1905) Linyphiidae 3 4 3 2 6 18 15 8 G
Silometopus elegans (O.P.-Cambridge, 1872) Linyphiidae 41 2 1 0 2 46 32** 0 O
Tapinocyba pallens (O.P.-Cambridge, 1872) Linyphiidae 3 6 8 8 2 27 7 20 G
Tapinocyba praecox (O.P.-Cambridge, 1873) Linyphiidae 0 1 0 0 0 1 4 0 U
Taranucnus setosus (Simon, 1884) Linyphiidae 6 1 1 1 0 9 16 1 G
Theonoe minutissima (O.P.-Cambridge, 1879) Therididae 7 28 33 24 13 105 24 36 G
Theridion pallens (Blackwall, 1834) Therididae 0 0 2 0 0 2 0 3 U
Tiso vegans (Blackwall, 1834) Linyphiidae 34 12 2 0 0 48 12 0 G
Trochosa spinipalpis (O.P.-Cambridge, 1895) Lycosidae 0 1 0 0 0 1 4 0 U
Trochosa terricola (Thorell, 1836) Lycosidae 27 25 3 3 6 64 28 10 G
Walckenaeria acuminata (Blackwall, 1833) Linyphiidae 21 22 24 14 19 100 38 39 G
Walckenaeria antica (Wider, 1834) Linyphiidae 1 0 0 0 0 1 4 0 U
Walckenaeria atrobtibialis (O. P.-Cambridge, 1878) Linyphiidae 5 4 4 0 0 13 7 1 G
Walckenaeria cuspidata (Blackwall, 1833) Linyphiidae 12 8 8 5 2 35 24 11 G
Walckenaeria dysderoides (Wider, 1843) Linyphiidae 4 21 26 15 14 80 8 17 G
Walckenaeria nodosa (O.P.-Cambridge, 1873) Linyphiidae 1 0 0 0 0 1 4 0 U
Walckenaeria nudipalpis (Westring, 1851) Linyphiidae 10 2 9 5 5 31 11 20 G
Walckenaeria vigilax (Blackwall, 1851) Linyphiidae 66 28 4 4 1 103 70*** 3 O
Xysticus cristatus (Clerck, 1757) Thomisdae 4 0 0 0 0 4 8 0 U
Zora spinimana (Sundevall, 1833) Zoridae 3 0 1 0 0 4 6 1 U
Total 2769 1829 1757 1561 1521 9437
A.G. Oxbrough et al. / Forest Ecology and Management 237 (2006) 404–417416
Autho
r's
pers
onal
co
py
Greatorex-Davies, J., Sparks, T., 1994. The response of heteoptera and coleop-
tera species to shade and aspect in rides of coniferised lowland woods in
Southern England. Biol. Conserv. 67, 255–273.
Greatorex-Davies, J., Sparks, T., Hall, M., Marrs, R., 1993. The influence of
shade on butterflies in rides of coniferised lowland woods in southern
England and implications for conservation management. Biol. Conserv. 63,
31–41.
Grimshaw, H.M., 1989. Analysis of soils. In: Grimshaw, H.M. (Ed.), Chemical
Analysis of Ecological Materials. Blackwell Scientific Publications,
Oxford, pp. 14–16.
Harvey, P., Nellist, D., Telfer, M., 2002. Provisional Atlas of British spiders
(Arachnida, Araneae), vols. 1 & 2. Biological Records Centre, Huntingdon.
Huhta, V., 2002. Soil macroarthropod communities in planted birch stands in
comparison with natural forests in central Finland. Appl. Soil Ecol. 20, 199–
209.
Jukes, M.R., Peace, A.J., Ferris, R., 2001. Carabid beetle communities asso-
ciated with coniferous plantations in Britain: the influence of site, ground
vegetation and stand structure. For. Ecol. Manage. 148, 271–286.
MacArthur, R.H., MacArthur, J.W., 1961. On bird species diversity. Ecology 42,
594–598.
Marc, P., Canard, A., Ysnel, F., 1999. Spiders (araneae) useful for pest limitation
and bioindication. Agric. Ecosyst. Environ. 74, 229–273.
McCune, B., Mefford, M., 1997. PC-ORD for Windows, Version 3.17. MJM
Software, Oregon.
McFerran, D., 1997. Northern Ireland Species Inventory Spiders (Arachnida).
Queens University Belfast, Belfast.
Melbourne, B., 1999. Bias in the effect of habitat structure on pitfall traps: an
experimental evaluation. Aust. J. Ecol. 24, 228–239.
Mueller-Dombois, D., Ellenberg, H., 1974. Aims and Methods of Vegetation
Ecology. Wiley and Sons, New York.
Mullen, K., Fahy, O., Gormally, M., 2003. Ground flora and associated athropod
communities of forest road edges in Connemara, Ireland. Biodivers. Con-
serv. 12, 87–101.
Niemela, J., Pajunen, T., Haila, Y., Punttila, P., Halme, E., 1994. Seasonal
activity of boreal forest-floor spiders (Araneae). J. Arachnol. 22, 23–31.
Nolan, M., 2002. Spiders (Araneae) of montane blanket bog in county Wicklow,
Ireland. Bull. Ir. Biogeog. Soc. 26, 39–59.
Oxbrough, A., Gittings, T., Giller, P.S., O’Halloran, J., 2005. Structural
indicators of spider communities across the forest plantation cycle. For.
Ecol. Manage. 212, 171–183.
Pajunen, T., Haila, Y., Halme, E., Niemela, J., Punttila, P., 1995. Ground-
dwelling spiders (Arachnida, Araneae) in fragmented old forests
and surrounding managed forests in Southern Finland. Ecography 18,
62–72.
Peterken, G., Francis, J., 1999. Open spaces as habitats for vascular ground flora
species in the woods of central Lincolnshire, UK. Biol. Conserv. 91, 55–72.
Pianka, E.R., 1966. Altitudinal gradients in species diversity: a review of
concepts. Am. Nat. 100, 33–46.
Roberts, M., 1993. The Spiders of Great Britain and Ireland, part 1. Harley
Books, Colchester.
Siira-Pietikainen, A., Haimi, J., Siitonen, J., 2003. Short-term responses of soil
macroarthropod community to clear felling and alternative forest regenera-
tion methods. For. Ecol. Manage. 172, 339–353.
Siira-Pietikainen, A., Pietikainen, J., Fritze, H., Haimi, J., 2001. Short-term
responses of soil decomposer communities to forest management: clear
felling versus alternative forests harvesting methods. Can. J. For. Res. 31,
88–99.
Sparks, T., Greatorex-Davies, J., Mountford, J., Hall, M., Marrs, R., 1996. The
effects of shade on the plant communities of rides in plantation woodland
and implications for butterfly conservation. For. Ecol. Manage. 80, 197–
207.
Sparks, T., Greatorex-Davies, J.N., 1992. The effect of shade in plantation
woodland on invertebrate abundance and biodiversity. Asp. Appl. Biol. 29,
89–96.
SPSS, 2002. SPSS for Windows, Version 11.0. SPSS, Chicago.
Teagasc: Irish Agriculture and Food Development Authority 2005. http://
www.teagasc.ie/. Teagasc, Carlow.
Terrel-Nield, C., 1986. Ecotones and community boundaries: analysis by pitfall
trapping. Field Stud. 6, 407–428.
Thomas, C.F.G., Hol, E.H.A., Everts, J.W., 1990. Modelling the diffusion
component of dispersal during recovery of a population of Linyphiid spiders
from exposure to an insecticide. Funct. Ecol. 4, 357–368.
Uetz, G., 1991. Habitat structure and spider foraging. In: Bell, S., McCoy, E.,
Mushinsky, H. (Eds.), Habitat Structure. The Physical Arrangement of
Objects in Space. Chapman and Hall, London.
van Helsdingen, P.J., 1996. The spider fauna of some Irish floodplains. Ir. Nat.
Jn. 25, 285–293.
van Helsdingen, P.J., 1997. The spiders (Araneidae) of Pollardstown Fen. Co.
Kildare, Ireland. Ir. Nat. Jn. 25, 396–404.
Warren, M., 1989. Woodland edge management for butterflies. In: Ferris-Kaan,
R. (Ed.), Edge Management in Woodlands. Forestry Commission, UK.
Warren, M., Fuller, R., 1993. Woodland Rides and Glades: Their Management
for Wildlife. Joint Nature Conservation Committee, UK.
Zar, J., 1996. Biostatistical Analysis. Prentice-Hall, New Jersey.
A.G. Oxbrough et al. / Forest Ecology and Management 237 (2006) 404–417 417
Related Documents